Embed Size (px)
Citation preview
- 1 -
Georgia Occupational Health Surveillance Data Series
2 Peachtree Street, Atlanta, Ga 30303 | Sep 2015
The Council of State and Territorial Epidemiologists (CSTE), in association with the National Institute of Occupational Safety
and Health (NIOSH), has recommended that states conduct surveillance for a set of 22 occupational health indicators (OHIs)
across five main categories: health effects, exposures, hazards, interventions and socioeconomic impact.
Detailed data and examination of key annual trends among some of the OHIs of special interest in Georgia are reported
below. These detailed analyses examine not only data from 2012, but allow for assessment of ongoing health trends in the
state. Demographic, as well as basic information for all 22 recommended indicators are available in Part 1 of this data
summary series, while additional state-specific indicators are available in Part 3.
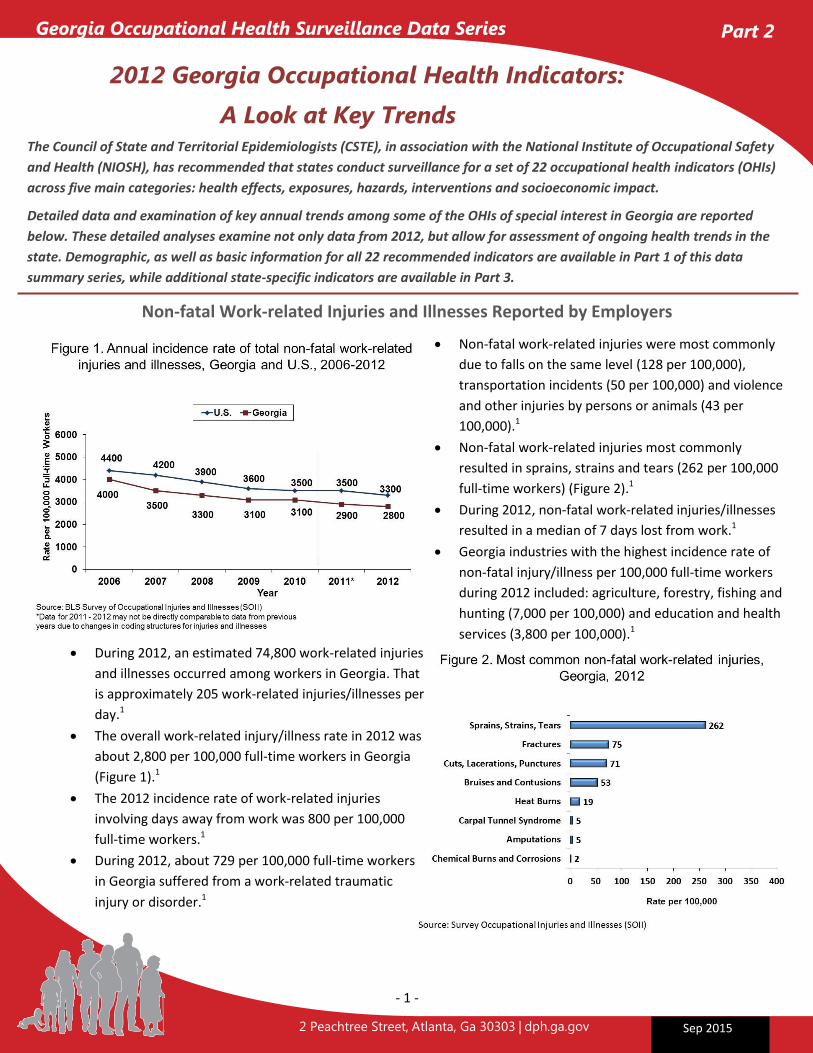
During 2012, an estimated 74,800 work-related injuries
and illnesses occurred among workers in Georgia. That
is approximately 205 work-related injuries/illnesses per
day.1
The overall work-related injury/illness rate in 2012 was
about 2,800 per 100,000 full-time workers in Georgia
(Figure 1).1
The 2012 incidence rate of work-related injuries
involving days away from work was 800 per 100,000
full-time workers.1
During 2012, about 729 per 100,000 full-time workers
in Georgia suffered from a work-related traumatic
injury or disorder.1
Non-fatal work-related injuries were most commonly
due to falls on the same level (128 per 100,000),
transportation incidents (50 per 100,000) and violence
and other injuries by persons or animals (43 per
100,000).1
Non-fatal work-related injuries most commonly
resulted in sprains, strains and tears (262 per 100,000
full-time workers) (Figure 2).1
During 2012, non-fatal work-related injuries/illnesses
resulted in a median of 7 days lost from work.1
Georgia industries with the highest incidence rate of
non-fatal injury/illness per 100,000 full-time workers
during 2012 included: agriculture, forestry, fishing and
hunting (7,000 per 100,000) and education and health
services (3,800 per 100,000).1
Non-fatal Work-related Injuries and Illnesses Reported by Employers
2012 Georgia Occupational Health Indicators:
A Look at Key Trends
Part 2
- 2 -
There were 2,717 work-related hospitalizations in Georgia in 2012, along with 101 fatal work-related injuries, or 2.4 per 100,000 full-time workers.
2012 Georgia Occupational Health Indicators
Work-related Hospitalizations Work-related hospitalizations represent some of the most severe and costly work-related injuries and illnesses.2
Georgia had 2,717 work-related hospitalizations in 2012, corresponding to a hospitalization rate of 62.0 per 100,000
employed persons.3
The majority of work-related hospitalizations in Georgia during 2012 were due to injuries and poisonings (41 percent),
musculoskeletal disorders (36 percent), and infections of skin and subcutaneous tissue (5 percent).3
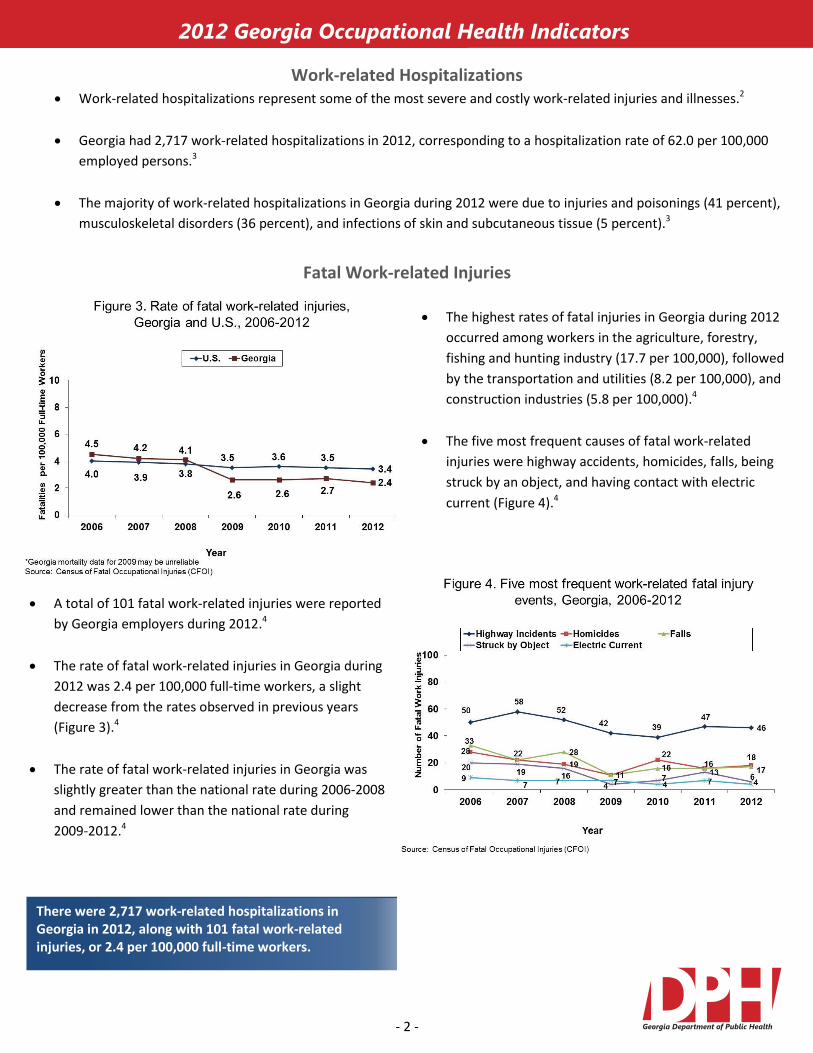
Fatal Work-related Injuries
A total of 101 fatal work-related injuries were reported
by Georgia employers during 2012.4
The rate of fatal work-related injuries in Georgia during
2012 was 2.4 per 100,000 full-time workers, a slight
decrease from the rates observed in previous years
(Figure 3).4
The rate of fatal work-related injuries in Georgia was
slightly greater than the national rate during 2006-2008
and remained lower than the national rate during
2009-2012.4
The highest rates of fatal injuries in Georgia during 2012
occurred among workers in the agriculture, forestry,
fishing and hunting industry (17.7 per 100,000), followed
by the transportation and utilities (8.2 per 100,000), and
construction industries (5.8 per 100,000).4
The five most frequent causes of fatal work-related
injuries were highway accidents, homicides, falls, being
struck by an object, and having contact with electric
current (Figure 4).4
- 3 -
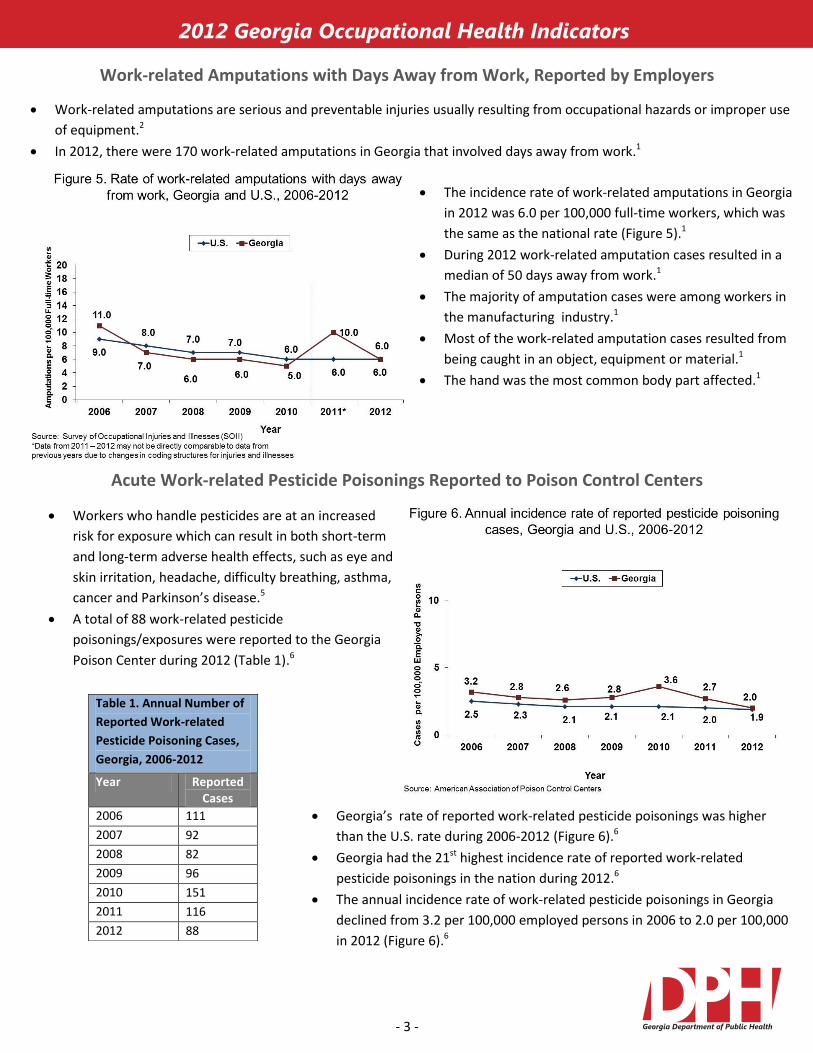
Table 1. Annual Number of
Reported Work-related
Pesticide Poisoning Cases,
Georgia, 2006-2012
Year Reported Cases
2006 111
2007 92
2008 82
2009 96
2010 151
2011 116
2012 88
2012 Georgia Occupational Health Indicators
Work-related Amputations with Days Away from Work, Reported by Employers
Acute Work-related Pesticide Poisonings Reported to Poison Control Centers
Work-related amputations are serious and preventable injuries usually resulting from occupational hazards or improper use
of equipment.2
In 2012, there were 170 work-related amputations in Georgia that involved days away from work.1
The incidence rate of work-related amputations in Georgia
in 2012 was 6.0 per 100,000 full-time workers, which was
the same as the national rate (Figure 5).1
During 2012 work-related amputation cases resulted in a
median of 50 days away from work.1
The majority of amputation cases were among workers in
the manufacturing industry.1
Most of the work-related amputation cases resulted from
being caught in an object, equipment or material.1
The hand was the most common body part affected.1
Workers who handle pesticides are at an increased
risk for exposure which can result in both short-term
and long-term adverse health effects, such as eye and
skin irritation, headache, difficulty breathing, asthma,
cancer and Parkinson’s disease.5
A total of 88 work-related pesticide
poisonings/exposures were reported to the Georgia
Poison Center during 2012 (Table 1).6
Georgia’s rate of reported work-related pesticide poisonings was higher
than the U.S. rate during 2006-2012 (Figure 6).6
Georgia had the 21st highest incidence rate of reported work-related
pesticide poisonings in the nation during 2012.6
The annual incidence rate of work-related pesticide poisonings in Georgia
declined from 3.2 per 100,000 employed persons in 2006 to 2.0 per 100,000
in 2012 (Figure 6).6
- 4 -
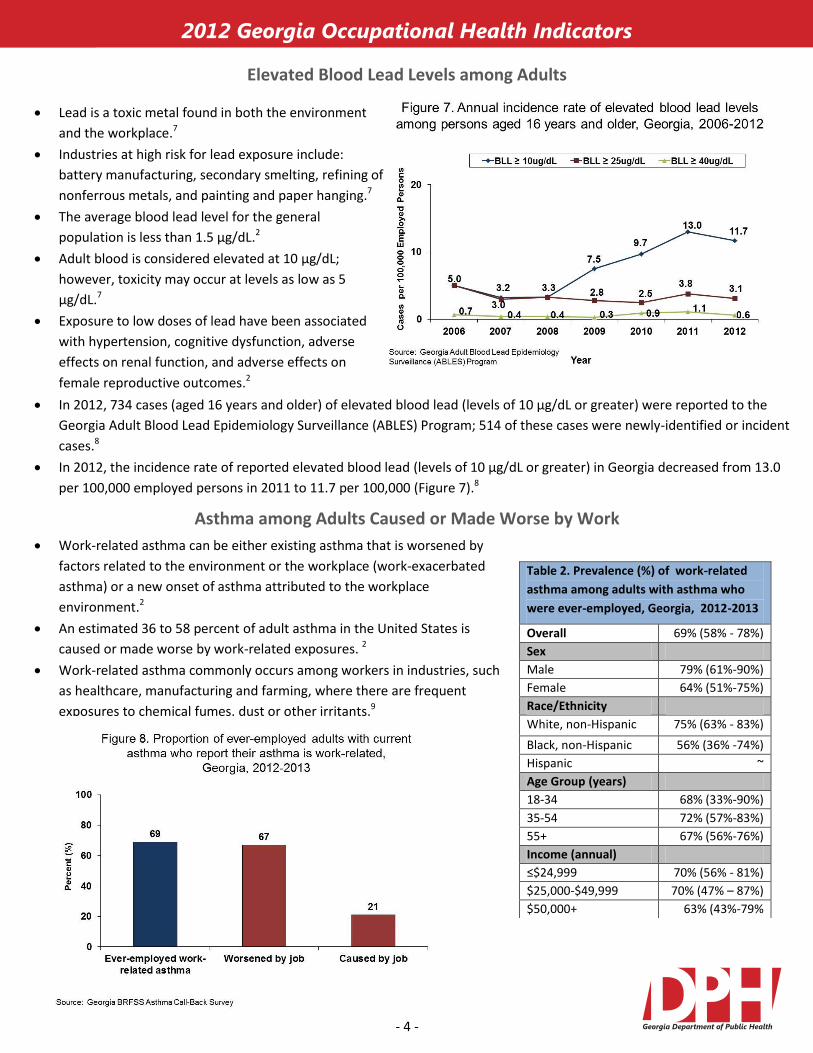
Table 2. Prevalence (%) of work-related
asthma among adults with asthma who
were ever-employed, Georgia, 2012-2013
Overall 69% (58% - 78%)
Sex
Male 79% (61%-90%)
Female 64% (51%-75%)
Race/Ethnicity
White, non-Hispanic 75% (63% - 83%)
Black, non-Hispanic 56% (36% -74%)
Hispanic ~
Age Group (years)
0
18-34 68% (33%-90%)
35-54 72% (57%-83%)
55+ 67% (56%-76%)
Income (annual)
≤$24,999 70% (56% - 81%)
$25,000-$49,999 70% (47% – 87%)
$50,000+ 63% (43%-79%
2012 Georgia Occupational Health Indicators
Elevated Blood Lead Levels among Adults
Lead is a toxic metal found in both the environment
and the workplace.7
Industries at high risk for lead exposure include:
battery manufacturing, secondary smelting, refining of
nonferrous metals, and painting and paper hanging.7
The average blood lead level for the general
population is less than 1.5 µg/dL.2
Adult blood is considered elevated at 10 µg/dL;
however, toxicity may occur at levels as low as 5
µg/dL.7
Exposure to low doses of lead have been associated
with hypertension, cognitive dysfunction, adverse
effects on renal function, and adverse effects on
female reproductive outcomes.2
In 2012, 734 cases (aged 16 years and older) of elevated blood lead (levels of 10 µg/dL or greater) were reported to the
Georgia Adult Blood Lead Epidemiology Surveillance (ABLES) Program; 514 of these cases were newly-identified or incident
cases.8
In 2012, the incidence rate of reported elevated blood lead (levels of 10 µg/dL or greater) in Georgia decreased from 13.0
per 100,000 employed persons in 2011 to 11.7 per 100,000 (Figure 7).8
Asthma among Adults Caused or Made Worse by Work
Work-related asthma can be either existing asthma that is worsened by
factors related to the environment or the workplace (work-exacerbated
asthma) or a new onset of asthma attributed to the workplace
environment.2
An estimated 36 to 58 percent of adult asthma in the United States is
caused or made worse by work-related exposures. 2
Work-related asthma commonly occurs among workers in industries, such
as healthcare, manufacturing and farming, where there are frequent
exposures to chemical fumes, dust or other irritants.9
- 5 -
To access the full Georgia Occupational Health Indicators Surveillance Report visit:
http://dph.georgia.gov/georgia-occupational-health-and-safety-surveillance-program
References:
1. BLS Survey of Occupational Injuries and Illnesses (SOII).
2. Council of State and Territorial Epidemiologists. Occupational Health Indicators: A
Guide for Tracking Occupational Health Conditions and Their Determinants. June
2015.
3. Georgia Hospital Association.
4. BLS Census of Fatal Occupational Injuries (CFOI).
5. National Institutes of Health Agricultural Health Study (AHS).
6. American Association of Poison Control Centers (AAPCC).
7. Centers for Disease Control and Prevention. Adult Blood Lead Epidemiology and
Surveillance-United States, 2008-2009. MMWR 2011; 26 (25), 841-845.
8. Georgia Adult Blood Lead Epidemiology and Surveillance (ABLES) Program.
9. Mayo Clinic. Occupational Asthma, June 2014.
10. Georgia Behavioral Risk Factor Surveillance System (BRFSS), 2011-2013.
11. Georgia BRFSS Asthma Call-Back Survey (ACBS), 2012-2013.
2012 Georgia Occupational Health Indicators
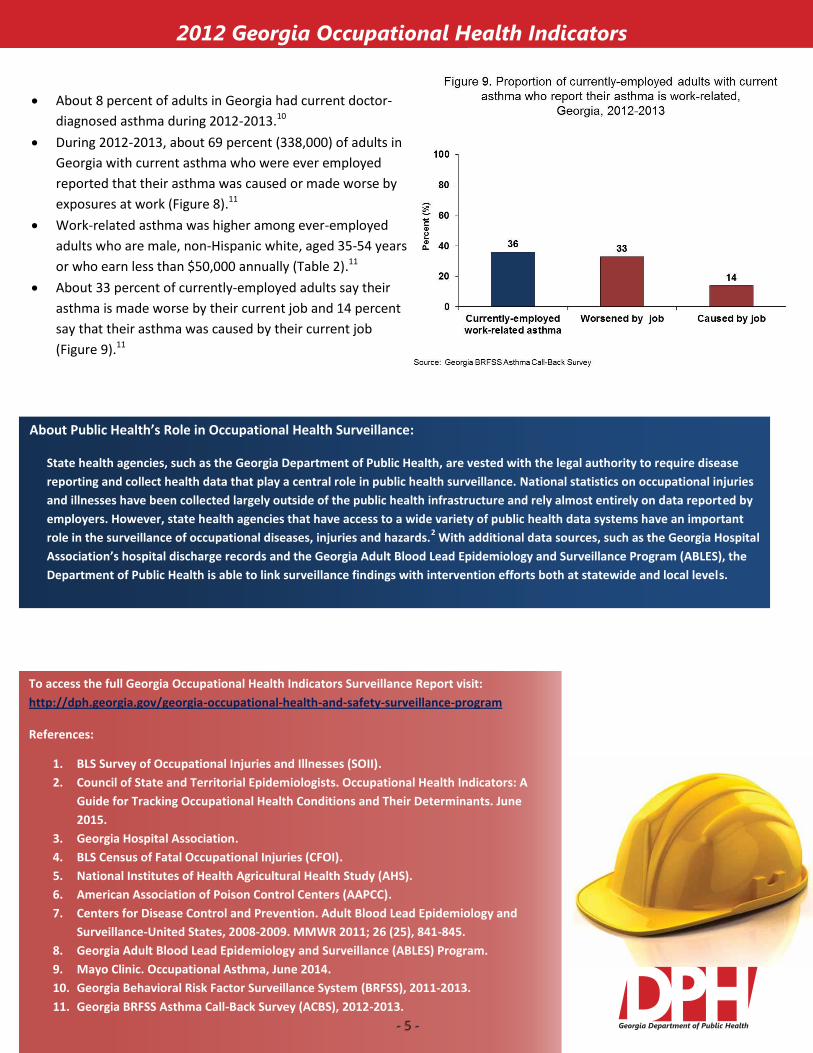
About 8 percent of adults in Georgia had current doctor-
diagnosed asthma during 2012-2013.10
During 2012-2013, about 69 percent (338,000) of adults in
Georgia with current asthma who were ever employed
reported that their asthma was caused or made worse by
exposures at work (Figure 8).11
Work-related asthma was higher among ever-employed
adults who are male, non-Hispanic white, aged 35-54 years
or who earn less than $50,000 annually (Table 2).11
About 33 percent of currently-employed adults say their
asthma is made worse by their current job and 14 percent
say that their asthma was caused by their current job
(Figure 9).11
About Public Health’s Role in Occupational Health Surveillance:
State health agencies, such as the Georgia Department of Public Health, are vested with the legal authority to require disease
reporting and collect health data that play a central role in public health surveillance. National statistics on occupational injuries
and illnesses have been collected largely outside of the public health infrastructure and rely almost entirely on data reported by
employers. However, state health agencies that have access to a wide variety of public health data systems have an important
role in the surveillance of occupational diseases, injuries and hazards.2 With additional data sources, such as the Georgia Hospital
Association’s hospital discharge records and the Georgia Adult Blood Lead Epidemiology and Surveillance Program (ABLES), the
Department of Public Health is able to link surveillance findings with intervention efforts both at statewide and local levels.
- 5 -