Embed Size (px)
Citation preview

2012 Election Results Doug Sosnik
11.8.12 @ 12:00 pm
2012 ELECTION OVERVIEW
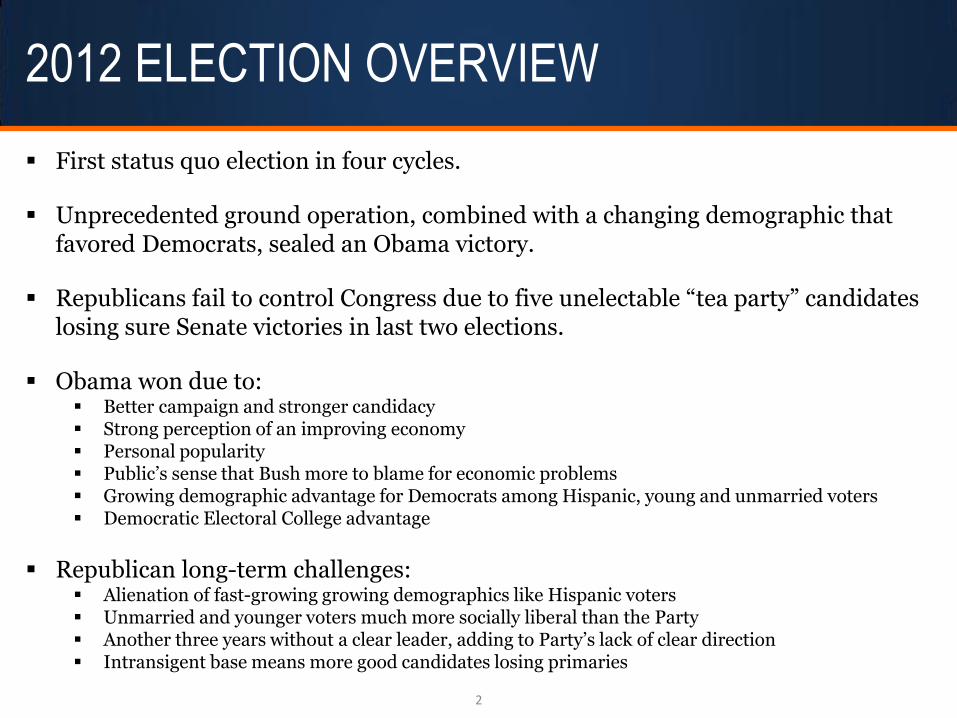
First status quo election in four cycles.
Unprecedented ground operation, combined with a changing demographic that favored Democrats, sealed an Obama victory.
Republicans fail to control Congress due to five unelectable “tea party” candidates losing sure Senate victories in last two elections.
Obama won due to: Better campaign and stronger candidacy Strong perception of an improving economy Personal popularity Public’s sense that Bush more to blame for economic problems Growing demographic advantage for Democrats among Hispanic, young and unmarried voters Democratic Electoral College advantage
Republican long-term challenges: Alienation of fast-growing growing demographics like Hispanic voters Unmarried and younger voters much more socially liberal than the Party Another three years without a clear leader, adding to Party’s lack of clear direction Intransigent base means more good candidates losing primaries
2
2012 Elections: HISTORICAL CONTECT
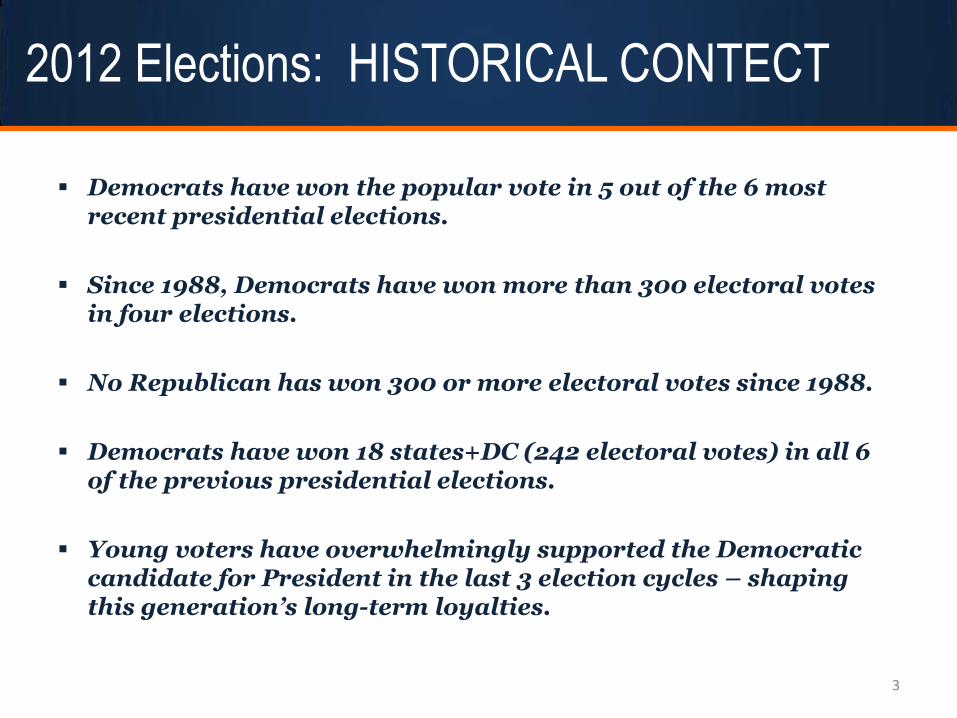
Democrats have won the popular vote in 5 out of the 6 most recent presidential elections.
Since 1988, Democrats have won more than 300 electoral votes in four elections.
No Republican has won 300 or more electoral votes since 1988.
Democrats have won 18 states+DC (242 electoral votes) in all 6 of the previous presidential elections.
Young voters have overwhelmingly supported the Democratic candidate for President in the last 3 election cycles – shaping this generation’s long-term loyalties.
3
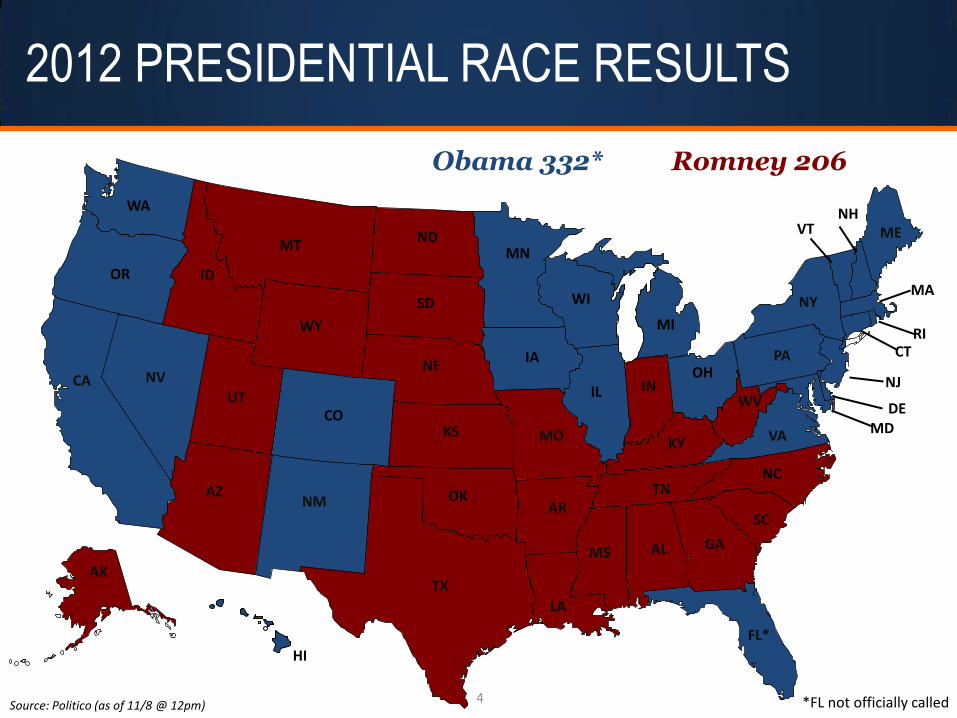
2012 PRESIDENTIAL RACE RESULTS
Obama 332* Romney 206
Source: Politico (as of 11/8 @ 12pm)
LA
FL*
WA
OR
NV
UT
AZ
WY
NM
MT
CO
ND
SD
NE
KS
OK
TX
IA
MO
AR
WI
IL
OH
NY
IN
PA
KY
WV
ME
TN
MS
AL
SC
NC
VA
GA
CT RI
MA
VT NH
DE MD
CA
AK
ID
MN
HI
MI
NJ
4 *FL not officially called
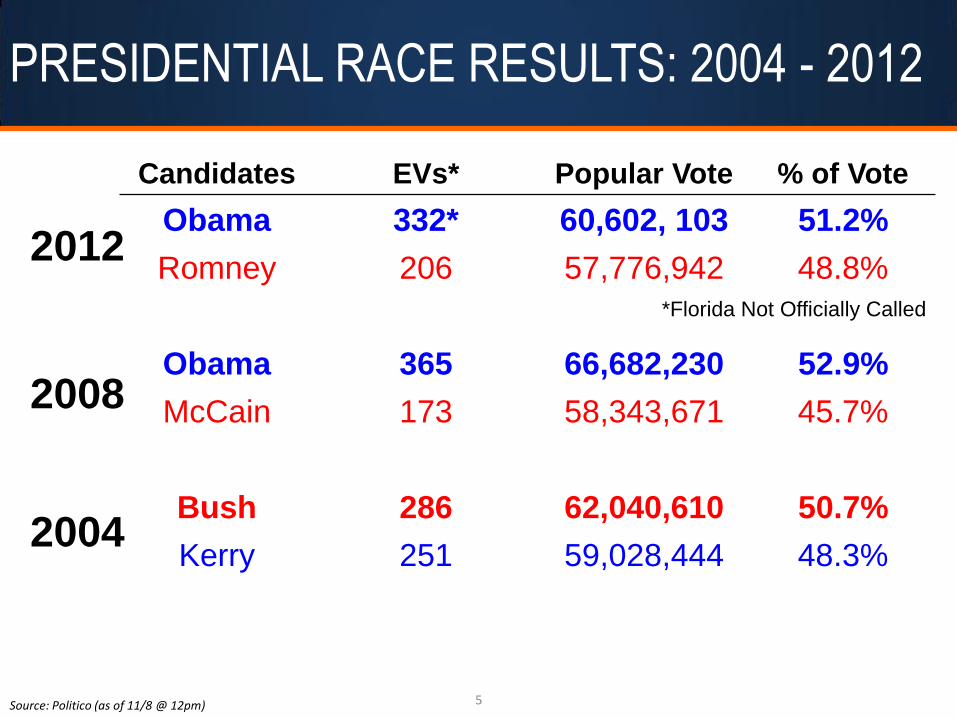
PRESIDENTIAL RACE RESULTS: 2004 - 2012
Candidates EVs* Popular Vote % of Vote
Obama 332* 60,602, 103 51.2%
Romney 206 57,776,942 48.8%
*Florida Not Officially Called
Obama 365 66,682,230 52.9%
McCain 173 58,343,671 45.7%
Bush 286 62,040,610 50.7%
Kerry 251 59,028,444 48.3%
2012
2008
2004
5 Source: Politico (as of 11/8 @ 12pm)

2012 CONGRESSIONAL & GOV RESULTS
Race Democrats Republicans Independent Undecided Gain/Loss
U.S. Senate 53 45 2 0 D +2
U.S. House 193 233 0 9 D +7
Governors 18 30 1 1
(WA) R +1
6 Source: Politico (as of 11/8 @ 12pm)

AFTER 3 CHANGE ELECTIONS…
A VOTE FOR STATUS QUO
7
US Senate
US House
113th Congress
112th Congress
111th Congress
110th Congress
109th Congress
Democrats 53 51 57 49 44
Republicans 45 47 41 49 55
Independents 2 2 2 2 1
113th Congress
112th Congress
111th Congress
110th Congress
109th Congress
Democrats 193 191 255 235 202
Republicans 233 241 178 199 232
Ind/Vacancies 9 Undecided 5 (Vacancies) 2 (Vacancies) 1 (Vacancy) 1
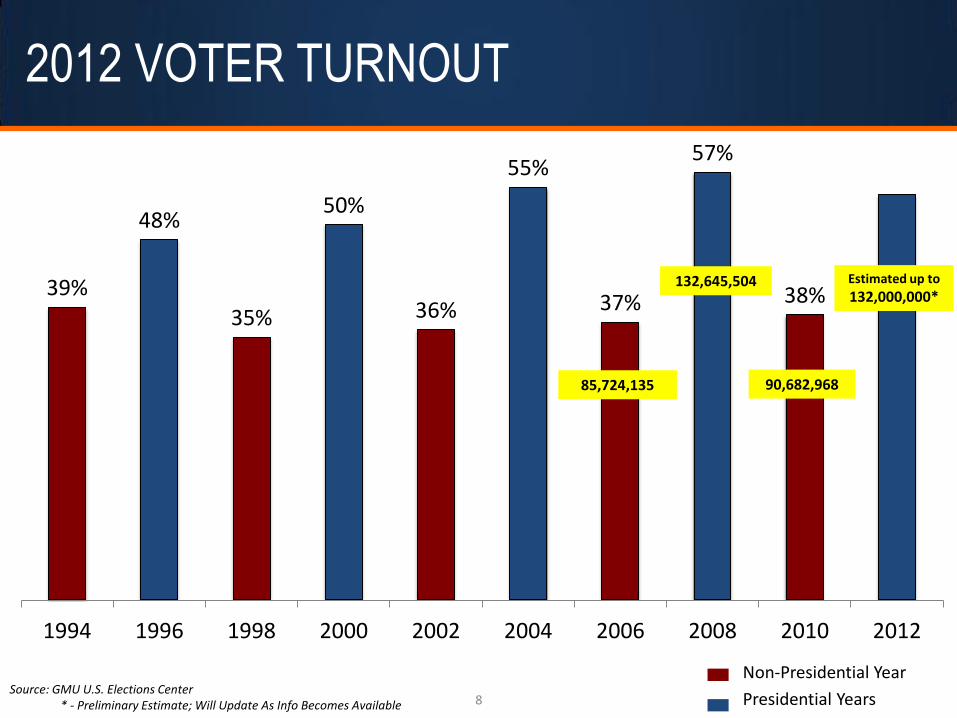
2012 VOTER TURNOUT
Source: GMU U.S. Elections Center * - Preliminary Estimate; Will Update As Info Becomes Available
Non-Presidential Year
Presidential Years 8
39%
48%
35%
50%
36%
55%
37%
57%
38%
1994 1996 1998 2000 2002 2004 2006 2008 2010 2012
85,724,135
132,645,504
90,682,968
Estimated up to
132,000,000*
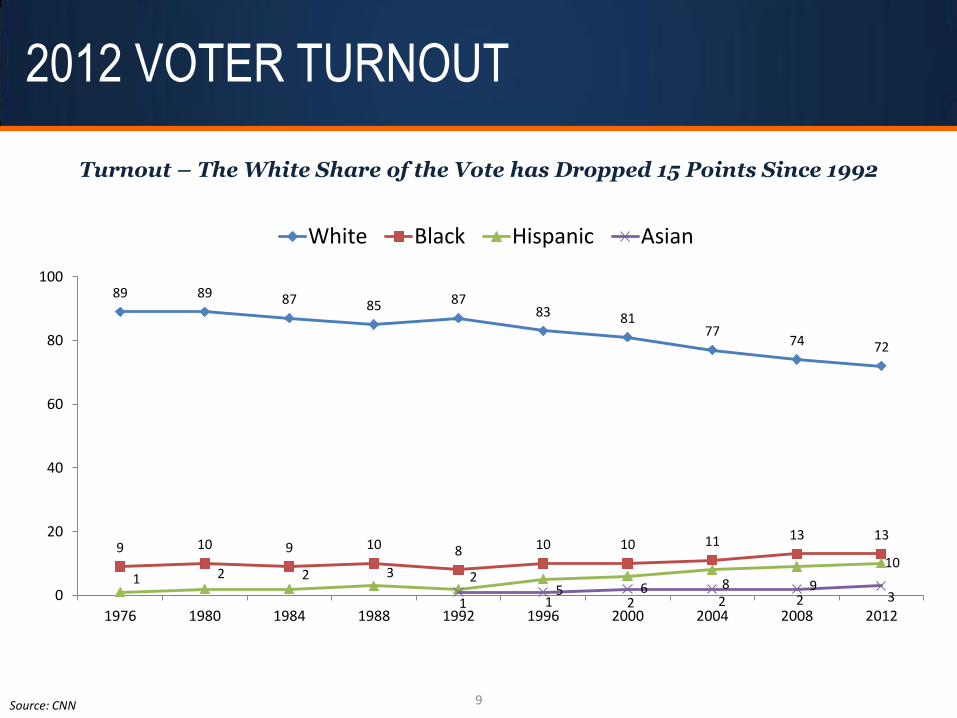
2012 VOTER TURNOUT
Source: CNN 9
89 89 87 85 87 83 81
77 74 72
9 10 9 10 8 10 10 11 13 13
1 2 2 3 2 5 6 8 9
10
1 1 2 2 2 3 0
20
40
60
80
100
1976 1980 1984 1988 1992 1996 2000 2004 2008 2012
White Black Hispanic Asian
Turnout – The White Share of the Vote has Dropped 15 Points Since 1992
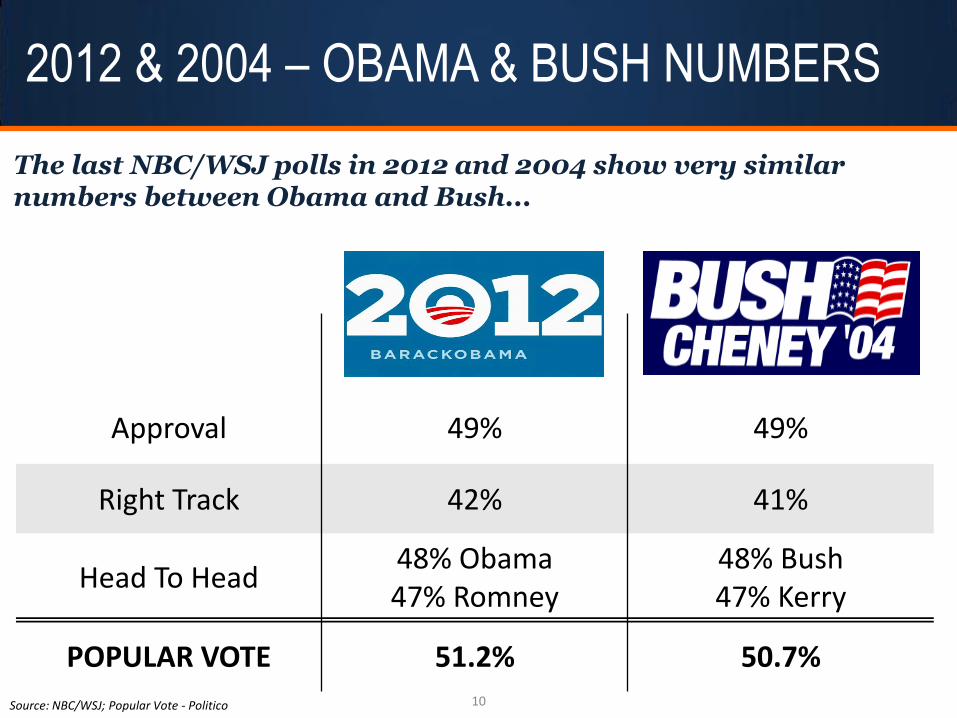
2012 & 2004 – OBAMA & BUSH NUMBERS
10
Approval 49% 49%
Right Track 42% 41%
Head To Head 48% Obama 47% Romney
48% Bush 47% Kerry
POPULAR VOTE 51.2% 50.7%
The last NBC/WSJ polls in 2012 and 2004 show very similar numbers between Obama and Bush...
Source: NBC/WSJ; Popular Vote - Politico
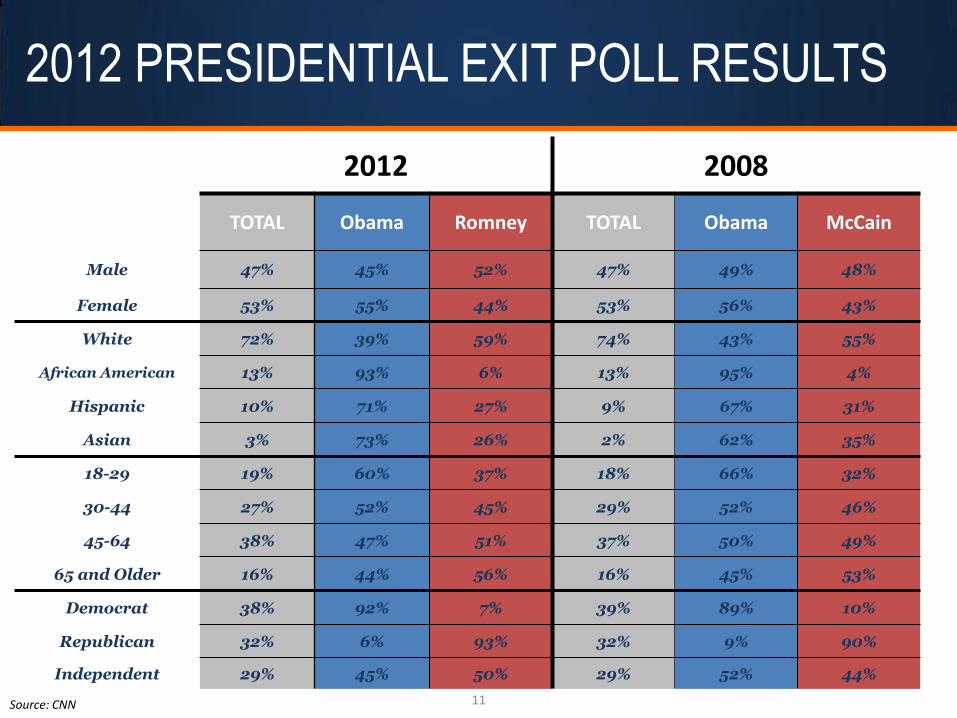
2012 PRESIDENTIAL EXIT POLL RESULTS
2012 2008
TOTAL Obama Romney TOTAL Obama McCain
Male 47% 45% 52% 47% 49% 48%
Female 53% 55% 44% 53% 56% 43%
White 72% 39% 59% 74% 43% 55%
African American 13% 93% 6% 13% 95% 4%
Hispanic 10% 71% 27% 9% 67% 31%
Asian 3% 73% 26% 2% 62% 35%
18-29 19% 60% 37% 18% 66% 32%
30-44 27% 52% 45% 29% 52% 46%
45-64 38% 47% 51% 37% 50% 49%
65 and Older 16% 44% 56% 16% 45% 53%
Democrat 38% 92% 7% 39% 89% 10%
Republican 32% 6% 93% 32% 9% 90%
Independent 29% 45% 50% 29% 52% 44%
Source: CNN 11
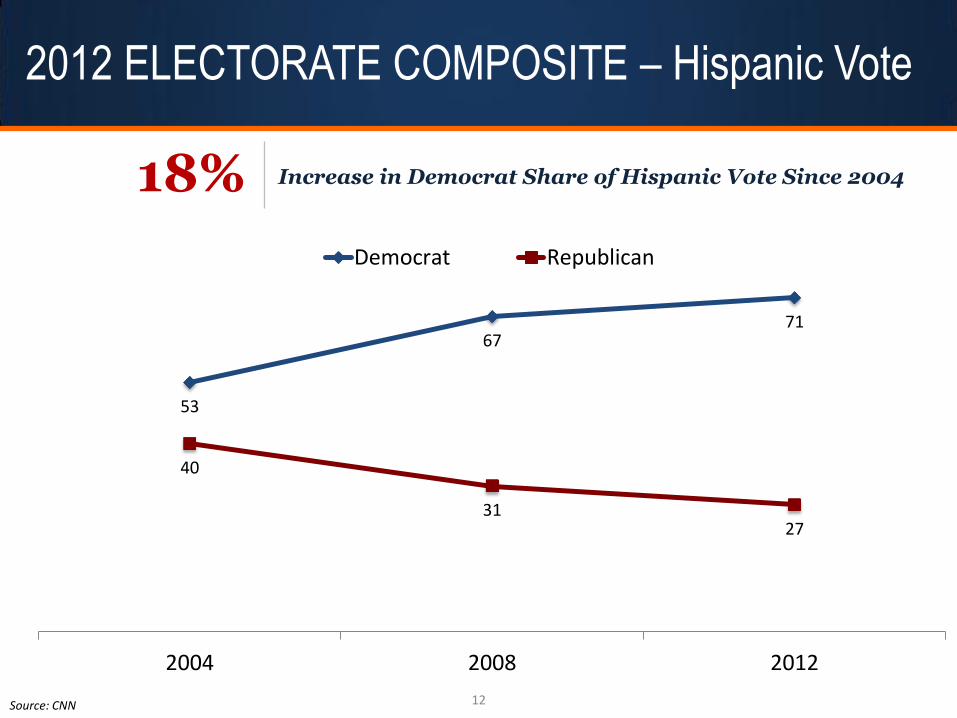
2012 ELECTORATE COMPOSITE – Hispanic Vote
Source: CNN 12
71 67
53
27 31
40
201220082004
Democrat Republican
18% Increase in Democrat Share of Hispanic Vote Since 2004
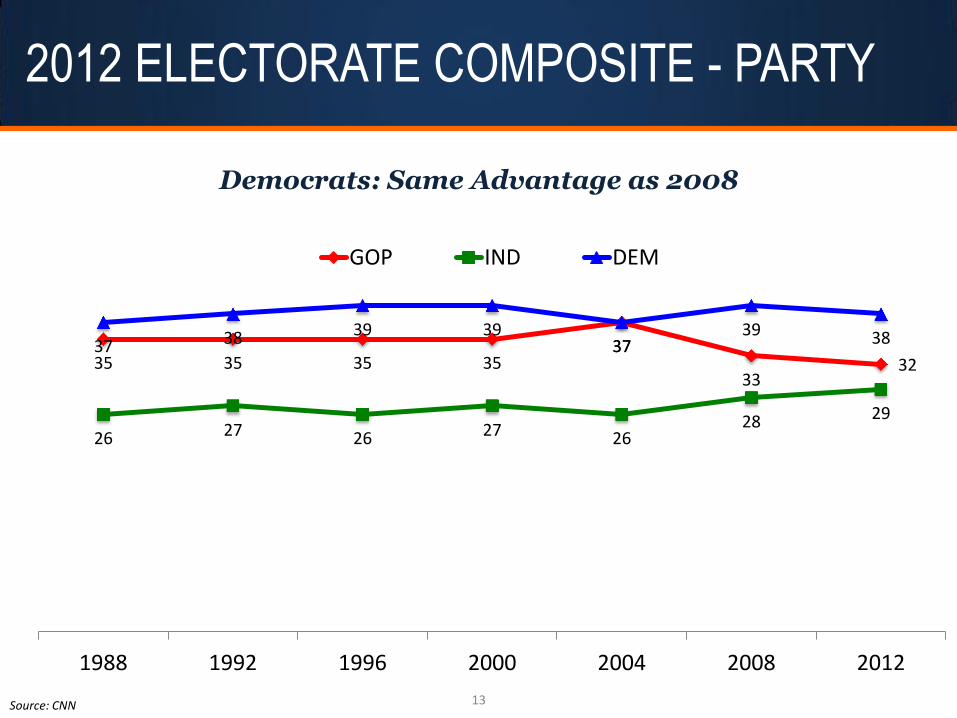
2012 ELECTORATE COMPOSITE - PARTY
Source: CNN 13
35 35 35 35 37
33 32
26 27 26 27 26 28 29
37 38 39 39 37
39 38
1988 1992 1996 2000 2004 2008 2012
GOP IND DEM
Democrats: Same Advantage as 2008
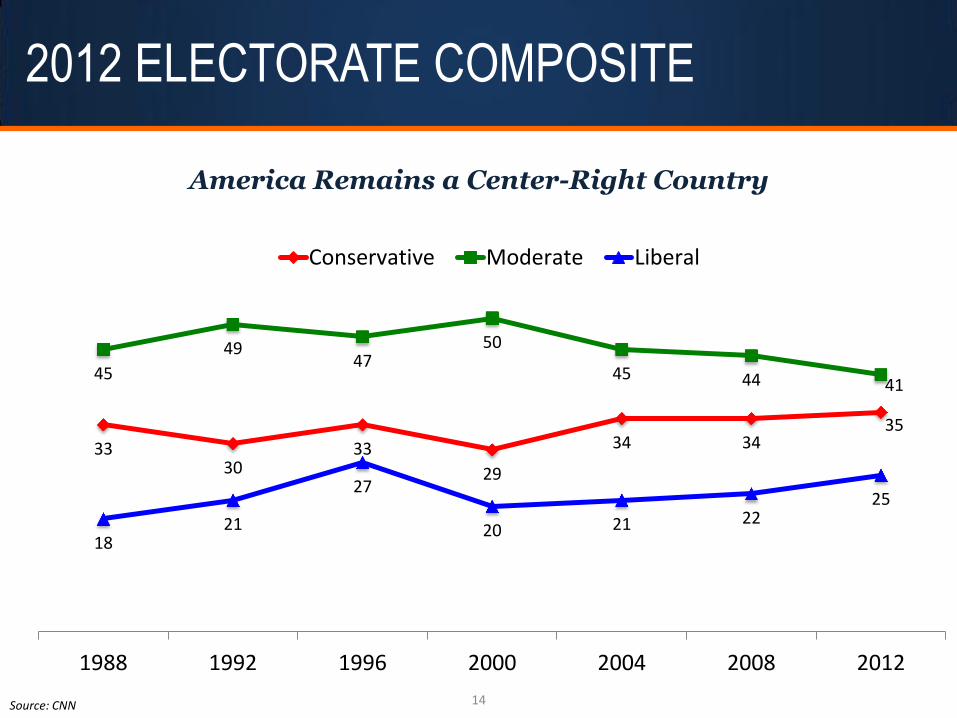
2012 ELECTORATE COMPOSITE
Source: CNN 14
America Remains a Center-Right Country
33 30
33
29
34 34 35
45
49 47
50
45 44 41
18 21
27
20 21 22 25
1988 1992 1996 2000 2004 2008 2012
Conservative Moderate Liberal

Congressional Elections

2012 U.S. SENATE RESULTS
LA
FL
WA
OR
NV
UT
AZ
WY
NM
MT
CO
ND
SD
NE
KS
OK
TX
IA
MO
AR
WI
IL
OH
NY
IN
PA
KY
WV
ME
TN
MS
AL
SC
NC
VA
GA
CT RI
MA
VT NH
DE MD
CA
AK
ID
MN
HI
MI
NJ
Dem Won (23):
GOP Won (8):
Ind Won (2):
The 113th Congress: Democrats: 53 (+2)
Republicans: 45 (-2)
Independents: 2 (+1)
16
GOP: Lost IN, MA, ME; Pickup NE
Source: Politico (as of 11/8 @ 12pm)

2012 U.S. HOUSE RESULTS
LA
FL
WA
OR
NV
UT
AZ
WY
NM
MT
CO
ND
SD
NE
KS
OK
TX
IA
MO
AR
WI
IL
OH
NY
IN
PA
KY
WV
ME
TN
MS
AL
SC
NC
VA
GA
CT RI
MA
VT NH
DE MD
CA
AK
ID
MN
HI
MI
NJ
Dem Takeover (13):
GOP Takeover (11):
17
The 113th Congress:
Democrats: 193 (+7)
Republicans: 233 (+0)
Undecided: 9
Takeover: Seat changed parties – defeated incumbent or open seat. Source: Politico (as of 11/8 @ 12pm)

2012 U.S. HOUSE RESULTS
18
Republicans (12)
• FL-26: Rivera • IL-08: Walsh • IL-10: Dold • IL-11: Biggert • IL-17: Schilling • MD-06: Bartlett • MN-08: Cravaack • NH-01: Guinta • NH-02: Bass • NY-18: Hayworth • NY-24: Buerkle • TX-23: Canseco
Defeated House Incumbents
Democrats (10)
• CA-15: Stark • CA-30: Berman • CA-35: Baca • CA-44: Richardson • IA-03: Boswell • KY-06: Chandler • NY-27: Hochul • NC-08: Kissel • OH-16: Sutton • PA-12: Critz
Source: Politico (as of 11/8 @ 12pm)
The 113th Congress:
Democrats: 192 (+5)
Republicans: 233 (+0)
Undecided: 10
State Elections

2012 GOVERNORS ELECTIONS
20
LA
FL
WA
OR
NV
UT
AZ
WY
NM
MT
CO
ND
SD
NE
KS
OK
TX
IA
MO
AR
WI
IL
OH
NY
IN
PA
KY
WV
ME
TN
MS
AL
SC
NC
VA
GA
CT RI
MA
VT NH
DE MD
CA
AK
ID
MN
HI
MI
NJ
Dem Won (6):
GOP Won (4):
Undecided (1):
GOP: Pickup NC
Gov Control: Democrats: 18 (-1)
Republicans: 30 (+1)
Independents: 1 (+0) 1 Undecided
Source: Politico (as of 11/8 @ 12pm)

2012 STATE LEGISLATIVE ELECTIONS
Source: NCSL (as of 11/8 @ 12pm) 21
Democrat To Republican (4)
• Alaska Senate
• Arkansas Senate
• Arkansas House
• Wisconsin Senate
Legislatures Changing Control
Republican To Democrat (7) • Colorado House
• Maine Senate
• Maine House
• Minnesota Senate
• Minnesota House
• New Hampshire House
• New York Senate
• Oregon House

2013 STATE GOVERNMENT CONTROL
LA
FL
WA
OR
NV
UT
AZ
WY
NM
MT
CO
ND
SD
NE
KS
OK
TX
IA
MO
AR
WI
IL
OH
NY
IN
PA
KY
WV
ME
TN
MS
AL
SC
NC
VA
GA
CT RI
MA
VT NH
DE MD
CA
AK
ID
MN
HI
MI
NJ
R Control (22):
Split Control (12):
D Control (14):
Non-Partisan Leg (1):
Undecided (1):
22 Source: NCSL (as of 11/8 @ 12pm)
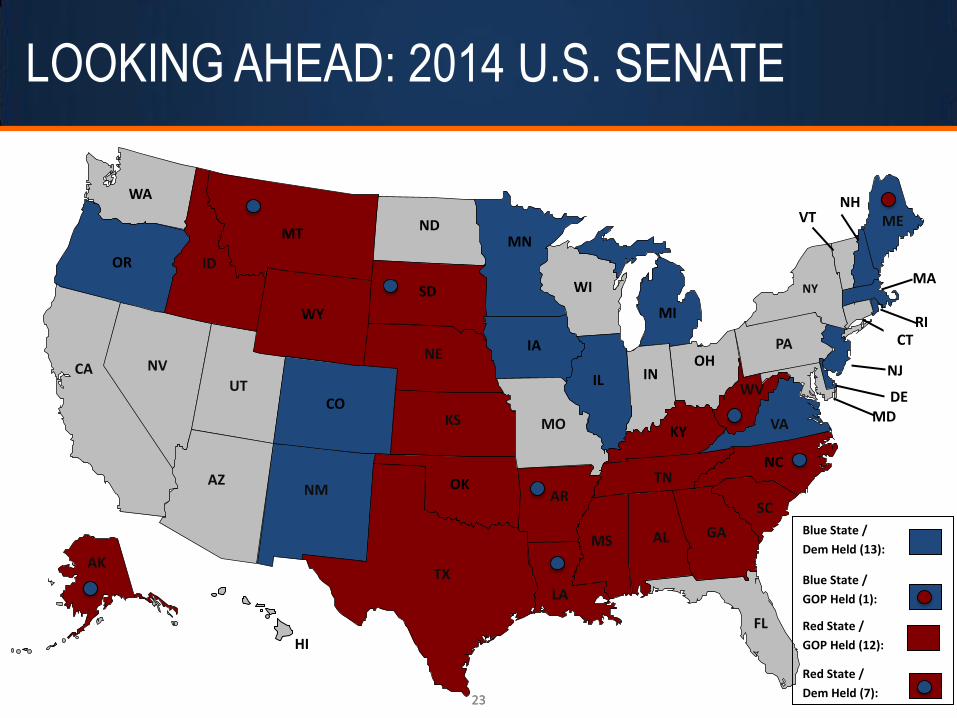
LOOKING AHEAD: 2014 U.S. SENATE
23 23
LA
FL
WA
OR
NV
UT
AZ
WY
NM
MT
CO
ND
SD
NE
KS
OK
TX
IA
MO
AR
WI
IL
OH
NY
IN
PA
KY
WV
ME
TN
MS
AL
SC
NC
VA
GA
CT RI
MA
VT NH
DE MD
CA
AK
ID
MN
HI
MI
NJ
Blue State /
Dem Held (13):
Blue State /
GOP Held (1):
Red State /
GOP Held (12):
Red State /
Dem Held (7):

LOOKING AHEAD: 2013/14 GOVERNORS
LA
FL
WA
OR
NV
UT
AZ
WY
NM
MT
CO
ND
SD
NE
KS
OK
TX
IA
MO
AR
WI
IL
OH
NY
IN
PA
KY
WV
ME
TN
MS
AL
SC
NC
VA*
GA
CT RI
MA
VT NH
DE MD
CA
AK
ID
MN
HI
MI
NJ*
24
Blue State /
Dem Held (12):
Blue State /
GOP Held (11):
Red State /
GOP Held (13):
Red State /
Dem Held (1):
Ind Held (1):
* - 2013 Race (NJ, VA)

Thank You