Embed Size (px)
Citation preview

Submitted to:
The City of Pickering,
1 The Esplanade Pickering, Ontario
L1V 6K7
submitted by:
Aquafor Beech Limited
11 February, 2013
Aquafor Beech Reference: 65273
2600 Skymark Avenue
Bldg 6, Suite 202
Mississauga, ON L4W 5B2
2012 DUFFINS CREEK HYDROLOGY UPDATE
FINAL REPORT
City Of Pickering / TRCA 11 February 2013 2012 Duffins Creek Hydrology Update
Aquafor Beech Limited
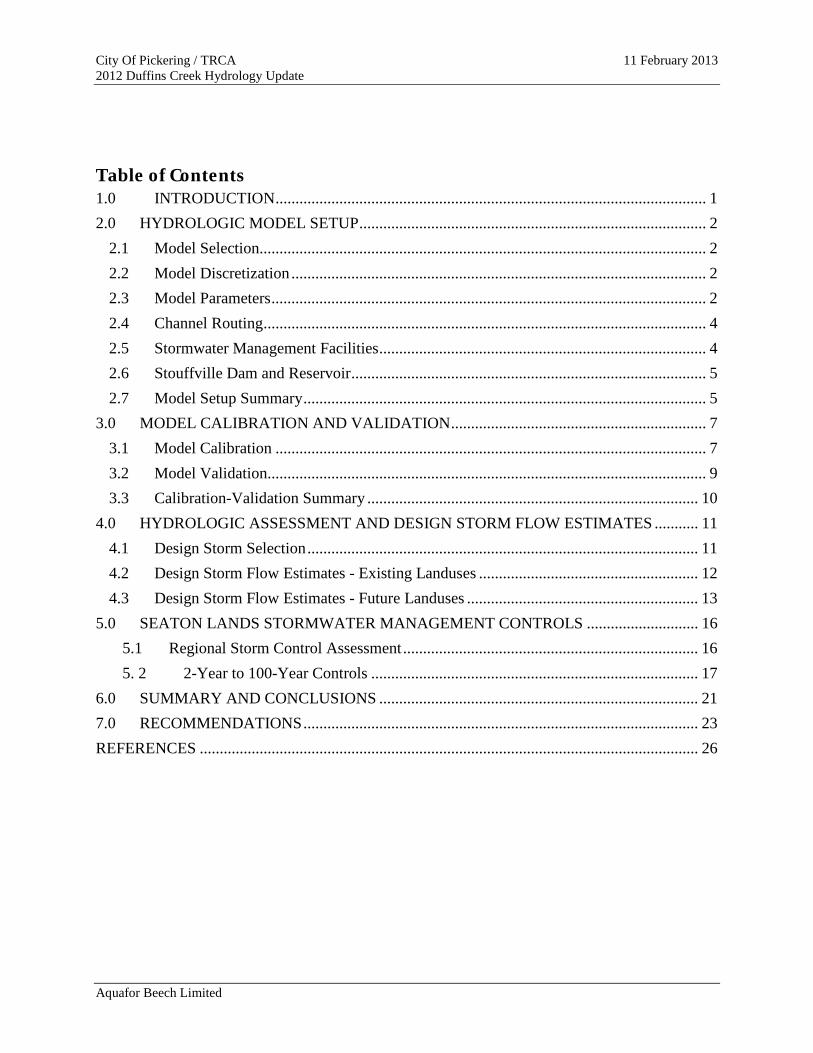
Table of Contents 1.0 INTRODUCTION ............................................................................................................ 1 2.0 HYDROLOGIC MODEL SETUP ....................................................................................... 2
2.1 Model Selection................................................................................................................ 2 2.2 Model Discretization ........................................................................................................ 2 2.3 Model Parameters ............................................................................................................. 2 2.4 Channel Routing ............................................................................................................... 4 2.5 Stormwater Management Facilities .................................................................................. 4 2.6 Stouffville Dam and Reservoir ......................................................................................... 5 2.7 Model Setup Summary ..................................................................................................... 5
3.0 MODEL CALIBRATION AND VALIDATION ................................................................ 7 3.1 Model Calibration ............................................................................................................ 7 3.2 Model Validation.............................................................................................................. 9 3.3 Calibration-Validation Summary ................................................................................... 10
4.0 HYDROLOGIC ASSESSMENT AND DESIGN STORM FLOW ESTIMATES ........... 11 4.1 Design Storm Selection .................................................................................................. 11 4.2 Design Storm Flow Estimates - Existing Landuses ....................................................... 12 4.3 Design Storm Flow Estimates - Future Landuses .......................................................... 13
5.0 SEATON LANDS STORMWATER MANAGEMENT CONTROLS ............................ 16 5.1 Regional Storm Control Assessment .......................................................................... 16 5. 2 2-Year to 100-Year Controls .................................................................................. 17
6.0 SUMMARY AND CONCLUSIONS ................................................................................ 21 7.0 RECOMMENDATIONS ................................................................................................... 23 REFERENCES ............................................................................................................................. 26

City Of Pickering / TRCA 11 February 2013 2012 Duffins Creek Hydrology Update
Aquafor Beech Limited
APPENDICES: APPENDIX A: Hydrologic Model Setup: Model Parameters, Channel Routing, Soils and
Landuse Mapping APPENDIX B: Model Calibration: Hydrograph Separation APPENDIX C: Model Calibration: Rainfall Data Application APPENDIX D: Model Calibration: Observed vs. Simulated Calibration Event Results APPENDIX E: Model Calibration: Antecedent Rainfall Relationships APPENDIX F: Model Calibration: Observed vs. Simulated Validation Event Results APPENDIX G: Model Calibration: Review of Radar Data APPENDIX H: Design Storm Hyetographs

City Of Pickering / TRCA 11 February 2013 2012 Duffins Creek Hydrology Update
Aquafor Beech Limited 1
1.0 INTRODUCTION
Aquafor Beech Limited was retained by the City of Pickering and Toronto and Region
Conservation Authority (TRCA) to undertake a Hydrology Update Study for Duffins Creek. The
watershed is approximately 280 square kilometres and is situated within parts of Pickering, Ajax,
Uxbridge, Whitchurch-Stouffville, and Markham, as illustrated in Figure 1.1.
A hydrologic model based on HYMO was initially developed for Duffins Creek in 1979 (James
F. MacLaren Limited, 1979). The 1979 model was subsequently updated by Aquafor Beech Ltd
using the INTERHYMO/OTTHYMO model in 1991, and again in 2002 using the VISUAL
OTTHYMO model. Since that time, urban development within the watershed has increased,
including the construction of new stormwater management facilities. Planning has also
continued to progress in support of further urban development and associated stormwater
management within an area referred to as the Seaton Lands (Figure 1.1).
The current Duffins Creek Hydrology Update Study is being undertaken with the following key
objectives:
• Update the hydrologic modelling to reflect the landuse changes since the 2002 study;
• Calibrate the updated model using rainfall-runoff data from recent storm events;
• Test and update the stormwater management criteria developed as part of the previous
2002 study;
• Assess impacts to Regional Storm flows associated with proposed future urban
development; and
• Develop flood (quantity) control criteria to be implemented within proposed future
development lands.

HWY 47
HWY 7
Regional Road 5
Bro ck Rd
York-Dur ham Line
Kingston Rd
HWY 401
HWY 407
HWY 48
B ro ck Rd
Taunton Rd
Rossland Rd
FD u f f i n s C r e e k W a t e r s h e dD u f f i n s C r e e k W a t e r s h e d
Whitchurch-Stouffville
Uxbridge
Ajax
Pickering
D U R H A MY O R K
Markham
Stouffville
Whitevale
Brougham
Claremont
Goodwood
Ajax
Pickering
Duf f ins Creek Watershed
Figure 1.1: Duffins Creek Watershed
0 2 4 6 81kms
River / Stream
Roads
Municipal Boundary
Duffins Creek Watershed
Federal Airport Lands
Seaton Lands
Legend:
Jan 2013
Whitby

City Of Pickering / TRCA 11 February 2013 2012 Duffins Creek Hydrology Update
Aquafor Beech Limited 2
2.0 HYDROLOGIC MODEL SETUP
2.1 Model Selection
The hydrologic model selected for application in the study was VISUAL OTTHYMO, version
2.4. The model simulates watershed runoff response to individual storm events, and is an
updated version of the same model applied as part of the previous 2002 Hydrology Update
Study.
The main advantage of version 2.4 from the previous versions of the VISUAL OTTHYMO is
that version 2.4 allows the use of unlimited rain gauges, a function which allows users to more
accurately reflect rainfall distribution across a watershed (previous versions limited the user to 4
rain gauges).
2.2 Model Discretization
As illustrated in Figure 2.1, the Duffins Creek Watershed was divided into 56 subcatchments in
order to provide peak flow estimates at key locations throughout the watershed. The
subcatchment boundaries are based on a detailed delineation of drainage boundaries from
Toronto and Region Conservation Authority’s (TRCA) GIS database, using updated topographic
information and a digital elevation model (DEM).
2.3 Model Parameters
The following techniques and model parameters were applied with the VISUAL OTTHYMO
model to simulate rural and urban rainfall-runoff responses:
• the CN* approach was used to determine direct runoff from pervious areas;
• the Nash unit hydrograph was applied to simulate runoff response from rural areas;

HWY 47
HWY 7
Regional Road 5
Bro ck Rd
York-Durham Line
Kingston Rd
HWY 401
HWY 407
HWY 48
B ro ck Rd
29
52
28
22
27
17
51
26
48
21
20
19
4750
24
18
14
13
46
45
25
44
1211
39
7
34
10
5631
35
43
40
54
42
6 32
41
5
4
2
1
23
49
53
55
3
9
8
30
38
37
36
33
16
15
FD u f f i n s C r e e k W a t e r s h e dD u f f i n s C r e e k W a t e r s h e d
Whitchurch-Stouffville
Uxbridge
Ajax
Pickering
D U R H A M
Y O R K
Markham
Stouffville
Whitevale
Brougham
Claremont
Goodwood
Ajax
Pickering
Subcatchment Boundaries
Figure 2.1 : Duffins Creek Hydrologic Model - Subcatchment Boundaries
0 2 4 6 81kms
River / Stream
Roads
Municipal Boundary
Subcatchment Boundary
Duffins Creek Watershed
Legend:
Nov 2012

City Of Pickering / TRCA 11 February 2013 2012 Duffins Creek Hydrology Update
Aquafor Beech Limited 3
• the Standard unit hydrograph was applied to simulated runoff response from urban areas;
and
• subcatchment time-to-peak was determined using an equation for basin lag time
described by Watt and Chow (1985).
The soils and landuse mapping in the TRCA geographical information system (GIS) database
was used to derive the model parameters, including drainage areas, CN* values, percent
imperviousness, basin slopes, and channel slopes. Table 2.1 summarizes the assumed CN values
based on soil types and land cover. These were used to derive an initial estimate of the CN*
values for each catchment in the hydrologic model. Table 2.1 also summarizes the assumed
percent impervious values based on landuse. A summary of subcatchment parameters is
provided in Appendix A. Soils mapping, landuse maps and land cover maps used to derive the
model parameters are also provided in Appendix A.
Table 2.1
Summary of Applied CN* Values and Impervious Percentage by Soils Type and Landuse
Land Cover Percent
Impervious
CN*
A
Soils
B
Soils
C
Soils
D
Soils
Rural – natural / undisturbed 0% 36 60 73 79
Rural - Agriculture 0% 66 74 82 86
Existing Urban (lawn) – very low impervious 15% 56 71 81 85
Existing Urban (lawn) – average impervious 40% 56 71 81 85
Existing Urban (lawn) – high impervious 55% 56 71 81 85
Existing Urban (lawn) – very low impervious 75% 56 71 81 85
Existing Urban (lawn) – 50% impervious 50% 56 71 81 85
City Of Pickering / TRCA 11 February 2013 2012 Duffins Creek Hydrology Update
Aquafor Beech Limited 4
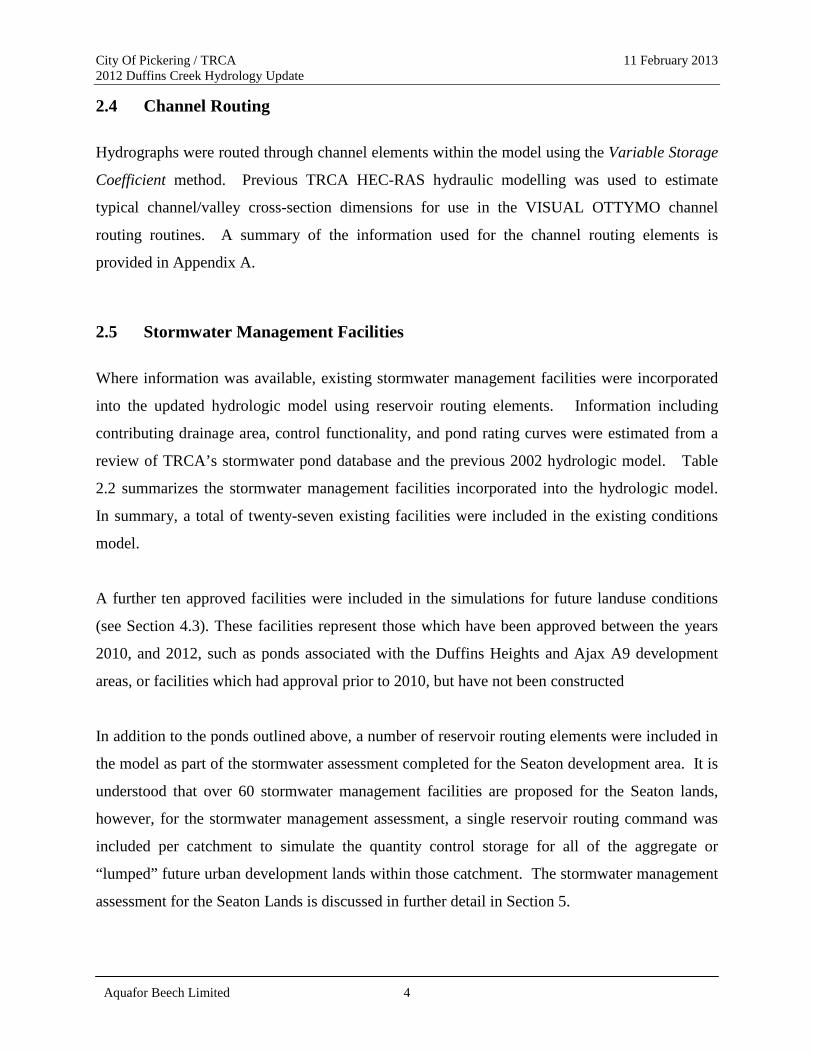
2.4 Channel Routing
Hydrographs were routed through channel elements within the model using the Variable Storage
Coefficient method. Previous TRCA HEC-RAS hydraulic modelling was used to estimate
typical channel/valley cross-section dimensions for use in the VISUAL OTTYMO channel
routing routines. A summary of the information used for the channel routing elements is
provided in Appendix A.
2.5 Stormwater Management Facilities
Where information was available, existing stormwater management facilities were incorporated
into the updated hydrologic model using reservoir routing elements. Information including
contributing drainage area, control functionality, and pond rating curves were estimated from a
review of TRCA’s stormwater pond database and the previous 2002 hydrologic model. Table
2.2 summarizes the stormwater management facilities incorporated into the hydrologic model.
In summary, a total of twenty-seven existing facilities were included in the existing conditions
model.
A further ten approved facilities were included in the simulations for future landuse conditions
(see Section 4.3). These facilities represent those which have been approved between the years
2010, and 2012, such as ponds associated with the Duffins Heights and Ajax A9 development
areas, or facilities which had approval prior to 2010, but have not been constructed
In addition to the ponds outlined above, a number of reservoir routing elements were included in
the model as part of the stormwater assessment completed for the Seaton development area. It is
understood that over 60 stormwater management facilities are proposed for the Seaton lands,
however, for the stormwater management assessment, a single reservoir routing command was
included per catchment to simulate the quantity control storage for all of the aggregate or
“lumped” future urban development lands within those catchment. The stormwater management
assessment for the Seaton Lands is discussed in further detail in Section 5.

City of Pickering / TRCA 11 February 20132012 Duffins Creek Hydrology Update
Pond ID Pond Name Municipality Catchment Facility Type Drainage Area Source of Rating Curve Info. Model ScenarioNo. (Wet/Dry) Quality Erosion Flood (ha) (existing/future)
93.2 Pond 3 - Forest Ridge Subdivision Town of Ajax 8015 3 Wetland Yes No Yes 43.3 2002 hydrologic model Existing, Future103 Voss Water Quality Pond City of Pickering 8009 4 Wet Pond Yes No Yes 5.3 2002 hydrologic model Existing, Future
263.1 Rougecrest Pond (Pond 2 of Liverpool Community) City of Pickering 8008 4 Dry Pond No Yes No 53.8 2002 hydrologic model Existing, Future263 J.D.S. Investments Detention Pond: (Pond 1 Of Liverpool Community) City of Pickering 8007 5 Dry Pond No Yes No 35.2 2002 hydrologic model Existing, Future
228.3 Stouffville SC1 Town of Whitchurch Stouffville 8031 15 n/a n/a Yes Yes 65 TRCA Existing, Future228.4 Stouffville SC2 Town of Whitchurch Stouffville 8032 15 n/a n/a Yes Yes 43 2002 hydrologic model Existing, Future166 West Hill Developments Pond Town of Whitchurch Stouffville 8003 16 Wet Pond Single Celled Yes Yes Yes 52 2002 hydrologic model Existing, Future185 Dulverton Holdings Swm Pond - Lehman's Pond Town of Whitchurch Stouffville 8001 16 Wet Pond Yes Yes Yes 5.8 2002 hydrologic model Existing, Future
228.2 Hillmount Properties Town of Whitchurch Stouffville 8002 17 Wet Pond Yes Yes Yes 44.5 TRCA Existing, Future228 Tresstown Pond Town of Whitchurch Stouffville 8030 18 n/a n/a Yes Yes 54.92* TRCA Existing, Future
228.1 Countryview Estates Pond Town of Whitchurch Stouffville 8043 20 Wet Pond Yes Yes Yes 33.1 2002 hydrologic model Future295 Uxville Properties - West Pond Township of Uxbridge 8004 22 Dry Pond No Yes No 36 2002 hydrologic model Existing, Future
295.1 Uxville Properties - East Pond Township of Uxbridge 8005 22 Dry Pond No Yes No 133.6 2002 hydrologic model Existing, Future1287 Goodwood SWM Facility n/a 8042 29 n/a n/a n/a n/a 24.5 TRCA Future1288 Duffin Heights SWM Facility 1 City of Pickering 8039 33 Wet Pond Yes Yes Yes 28.15 TRCA Future1289 Duffin Heights SWM Facility 2 City of Pickering 8040 33 Wet Pond Yes Yes Yes 17.5 TRCA FutureA9A A9 - Pond A n/a 8035 36 n/a n/a n/a n/a 11.9 TRCA Future133 Barrett Meadows Pond City of Pickering 8010 36 Wet Pond Yes Yes Yes 21.2 2002 hydrologic model Existing, Future320 Duffin Meadow Cemetery n/a 8011 36 Wet Pond Yes Yes Yes 12 2002 hydrologic model Existing, Future
1291 Duffin Heights SWM Facility 4 City of Pickering 8037 36 Wet Pond n/a n/a n/a 38.5 TRCA Future1290 Duffin Heights SWM Facility 3 City of Pickering 8041 37 Wet Pond n/a n/a n/a 38.6 TRCA Future
93 Pond 1 - Forest Ridge Subdivision Town of Ajax 8013 41 Wet Pond Yes Yes Yes 91.6 2002 hydrologic model Existing, Future93.1 Pond 2 - Forest Ridge Subdivision Town of Ajax 8014 41 Wet Pond Yes No Yes 9.7 2002 hydrologic model Existing, Future92 Devonside Estates Pond Town of Ajax 8012 42 Wet Pond Yes Yes Yes 21.81 2002 hydrologic model Existing, Future
A9B A9 - Pond B Town of Ajax 8036 42 n/a Yes Yes n/a 15.6 TRCA FutureA9C A9 - Pond C Town of Ajax 8038 42 n/a Yes Yes n/a 12.2 TRCA Future167 A7 Development Area Extended Detention Pond Town of Ajax 8019 54 Wet Pond Yes No Yes 39.6 2002 hydrologic model Existing, Future
207.2 Pond 3 - Neighbourhood 2 Area A6 Town of Ajax 8020 54 Wet Pond Yes No Yes 49.2 2002 hydrologic model Existing, Future207.3 Pond 4 - A6N2 South SWM Facility Town of Ajax 8021 54 Hybrid Yes No Yes 64.9 2002 hydrologic model Existing, Future279 A6 Community Nbh 1 - Pond 1 Town of Ajax 8018 55 Wet Pond Yes Yes Yes 16.3 TRCA Existing, Future
279.1 A6 Community Nbh 1 - Pond 2 Town of Ajax 8022 54 Wet Pond Yes Yes Yes 69 TRCA Existing, Future279.2 Landwin Swm Pond Town of Ajax 8023 54 Wet Pond Yes Yes Yes 24.3 2002 hydrologic model Existing, Future279.3 A6 Community Nbh 1 - Pond 4 (Schmigelsky) Town of Ajax 8024 54 Wet Pond Yes Yes Yes 10 2002 hydrologic model Existing, Future184 Miller's Creek Pond - Area 8 Town of Ajax 8033 55 n/a Yes Yes Yes 70.11 TRCA Existing, Future
207.1 Pond 2 - Neighbourhood 2 Area A6 Town of Ajax 8017 55 Wet Pond Yes No Yes 70.5 2002 hydrologic model Existing, Future1271 Stokegrove Town of Ajax 8016 55 Dry Pond No Yes No 6.1 TRCA Existing, Future1273 Tauton-Westney Commercial Town of Ajax 8034 55 Wet Pond Yes Yes Yes 6.6 TRCA Future
* Note - Drainage area for Existing Landuse Scenario = 34.1 ha. Drainage area for Future Landuse Scenario = 54.9 ha
Aquafor Beech Limited.
Table 2.2 Summary of Stormwater Management Facilities
Control TypeModel HYD Ref No.

City Of Pickering / TRCA 11 February 2013 2012 Duffins Creek Hydrology Update
Aquafor Beech Limited 5
2.6 Stouffville Dam and Reservoir
The updated Duffins Creek hydrologic model included a reservoir routing element to simulate
the Stouffville dam and reservoir, located on Stouffville Creek, in the upper west portion of the
watershed above Reesor Creek. Table 2.3 summarizes the stage-storage-discharge rating curve
that was applied.
Table 2.3: Stouffville Dam and Reservoir Rating Curve
Elevation (m)
Storage (ha.m)
Discharge (m3/s)
0.00 0.00
272.87 0.01 0.32 273.17 0.74 0.33 273.25 1.39 0.80 273.32 2.04 1.64 273.40 2.68 2.74 273.48 3.33 4.02 273.55 4.04 5.48 273.63 4.75 7.09 273.70 5.46 8.83 273.86 7.09 12.67 274.16 10.80 21.58 274.66 16.94 41.20 275.03 21.40 70.32 275.61 28.47 132.86
2.7 Model Setup Summary
In summary, the “base” Duffins Creek VISUAL OTTHYMO model for existing landuse
conditions was setup using a total of 56 subcatchments. Within each of the modelled
subcatchments, any rural areas were simulated using a single “lumped” Nashyd command, any
existing uncontrolled urban areas were simulated using a single “lumped” Standhyd command,
while the drainage areas to any existing or approved stormwater management ponds were

City Of Pickering / TRCA 11 February 2013 2012 Duffins Creek Hydrology Update
Aquafor Beech Limited 6
simulated using separate Standhyd commands. The “base” existing landuse model included a
total of 56 subcatchments which were simulated using the following:
• 58 Nashyd command elements to simulate runoff from rural areas;
• 33 Standhyd command elements to simulate runoff from uncontrolled urban areas;
• a further 27 Standhyd command elements to simulate runoff from urban areas controlled
by stormwater management facilities;
• 27 Route Reservoir command elements to simulate the existing stormwater management
facilities;
• an additional Route Reservoir command to simulate the Stouffville dam and reservoir;
and
• 31 Route Channel elements.

City Of Pickering / TRCA 11 February 2013 2012 Duffins Creek Hydrology Update
Aquafor Beech Limited 7
3.0 MODEL CALIBRATION AND VALIDATION
The hydrologic model was adjusted and checked through calibration and verification to ensure
that the model was representative of the study area.
3.1 Model Calibration
Outlined below are the main steps which were undertaken to calibrate the Duffins Creek
hydrologic model:
1. Streamflow data from ten different streamflow gauges within the Duffins Creek watershed,
as well as rainfall data from nine rainfall gauges, either within or adjacent to the watershed,
were collected and used in the model calibration. The locations of the streamflow and
rainfall gauges are illustrated in Figure 3.1.
2. Several candidate rainfall-runoff events from 2003 to 2010 were screened and seven were
selected for model calibration based on availability of gauge data and consistency of the
rainfall distribution throughout the watershed. A further three rainfall-runoff events from the
year 2000 were selected for model verification (Section 3.2). These three events were also
used in the previous 2002 hydrology study for Duffins Creek (Aquafor, 2002). A summary
of the various streamflow gauges that were in operation for each of the calibration-validation
events is provided in Table 3.1. Table 3.2 summarizes the rainfall depths for each of the
rainfall gauges that were in operation for the calibration-validation events.
3. Observed runoff hydrographs were derived from streamflow gauge data by separating
baseflows using a procedure provided in Linsley et al (1982). Baseflow separation
hydrographs are provided in Appendix B.
4. For each storm event modelled, rainfall hyetographs were applied to the various
subcatchments within the model using the observed rainfall data from the nearest adjacent

!.
!.
!.
!.
!.
!.
!.
!.
!.
!.
$+
$+
$+
$+
$+
$+
$+
$+
$+
HWY 47
HWY 7
Regional Road 5
Bro ck Rd
York-Du rham Line
Kingston Rd
HWY 401
HWY 407
HWY 48
Bro ck Rd
Taunton Rd
Rossland Rd
York02
HY001
HY009
HY015
HY031
HY043
Gauge5
02HC055
02HC018
HY999
HC019
HC038
HC049
HY010
HY023
HY028
HY047
HY065
HY066
29
52
28
22
27
17
51
26
48
21
20
19
4750
24
18
14
13
46
45
25
44
1211
39
7
34
10
5631
35
43
40
54
42
6 32
41
5
4
2
1
23
49
53
55
3
9
8
30
38
37
36
33
16
15
FD u f f i n s C r e e k W a t e r s h e dD u f f i n s C r e e k W a t e r s h e d
Whitchurch-Stouffville
Uxbridge
Ajax
Pickering
D U R H A M
Y O R K
Markham
Stouffville
Whitevale
Brougham
Claremont
Goodwood
Ajax
Pickering
Gauging Network
Figure 3.1: Streamflow and Rain Gauge Locations
0 2 4 6 81kms
River / Stream
Subcatchment Boundary
Roads
Municipal Boundary
$+ Precipitation Station
!. Stream Gauge
Legend:
Jan 2013
Whitby

City of Pickering / TRCA 11 February 20132012 Duffins Creek Hydrology Update
15-17 May 2003
23-24 May 2003
29-30 July 2006
22-23 July 2008
24 June 2010
27-28 June 2010
23 July 2010
11 May 2000
13 June 2000
24 June 2000
Reesor Creek HY999 3,541 a a a a a a
West Duffins Above Green River HC038 6,066 a a a a
West Duffins at Hwy 7 HY066 10,833 a a a
Michell Creek HY047 2,368 a a a a a a a
East Duffins Creek HY023 6,190 a a a a a a a
Brougham Creek HY010 1,479 a a a a a a a a a a
Duffiins Creek Above Pickering HC019 8,629 a a a a a a a
Urfe Creek HY065 1,496 a a a a a a a a a
Ganatsekiagon Creek HY028 1,304 a a aDuffins Creek at Ajax HC049 25,789 a a a a a a a a a a
15-17 May 2003
23-24 May 2003
29-30 July 2006
22-23 July 2008
24 June 2010
27-28 June 2010
23 July 2010
11 May 2000
13 June 2000
24 June 2000
Ajax Works Yard 54 30 16.4 26.4 31 55.8Claremont Shop 63 32.6 41 29.2 18 47.6
Greenwood Mushroom Farm 30.98 53.09 8.09 23.6 18.6 39Goodwood Pumping Station 57.8 11.8 27.2 19.2 41.6
Lynde Creek Near Whitby 37.25Lynde Creek Kinsale 103.25
Stouffville Works 17.6 61.8 45.4 41Little Rouge at 16th 19.8 19.8 31.2 19.6 57.2Brock West Landfill 35.2 29
Aquafor Beech Limited.
02HC01802HC055York02HY043HY009
HY031
Calibration Events and Recorded Rainfall Depths (mm) Validation Events
Table 3.2: Summary of Available Rainfall Gauge and Recorded Rain Depths
Rainfall Gauge Name Gauge Number
HY001HY015
CLOCA5
Calibration Events
Table 3.1: Summary of Available Streamflow Gauges
Validation EventsDrainage Area (ha)
Gauge NumberStreamflow Guage Name

City Of Pickering / TRCA 11 February 2013 2012 Duffins Creek Hydrology Update
Aquafor Beech Limited 8
rain gauges in operation during that event. A summary of the application of the rainfall
gauge data throughout the watershed for the various events is provided in Appendix C.
5. In the calibration process, emphasis was placed first on minimizing the differences between
observed and simulated runoff volumes. This involved adjustment of the CN* parameter to
match the observed runoff volumes on an event-by-event basis at each of the functioning
streamflow gauges. In doing so, the calibration process was accounting for the varying
antecedent moisture conditions present at the time of each calibration storm event. A
summary of the adjustments to the CN* parameters is provided in Table 3.3.
6. Following calibration of runoff volumes, emphasis was placed on minimizing the differences
between observed and simulated peak flow rates, and matching the general hydrograph
timing and shape. This involved adjustment of the subcatchment time-to-peak (Tp) and unit
hydrograph shape parameter (n). It is important to note that, unlike the CN* parameter (step
5), the “Tp” and “n” parameters were held constant for each subcatchment across all
calibration events. A summary of the “base” values versus calibrated values for these two
model parameters are provided in Appendix A for each catchment. In general, a factor of 1.5
to 2.0 times the “base” value assumed in the initial model setup was often required to achieve
a reasonable calibration over the range of events. Similar adjustments were also applied in
the previous 2002 study.
7. Moderate adjustment to the Manning’s roughness coefficients within the channel routing
elements were also applied to further improve hydrograph timing. Values of 0.050 and 0.080
were applied for the main channel and overbank components of the cross-sections.
Results from the model calibration process are tabulated and illustrated in Table 3.4, 3.5 and 3.6
which provides a summary of the observed versus simulated runoff depths, peak flow rates and
times-to-peak for each event. Corresponding observed versus simulated runoff hydrograph plots
for each event are also provided in Appendix D. As illustrated, good results were achieved, on
average, for the various storm events and gauge sites.

City of Pickering / TRCA 11 February 20132012 Duffins Creek Hydrology Update
15-17 May 2003
23-24 May 2003
29-30 July 2006
22-23 July 2008
24 June 2010
27-28 June 2010
23 July 2010
Reesor Creek HY999 -20% 20% -50%West Duffins Above Green River HC038 -30%
West Duffins at Hwy 7 HY066 -25% 5% -60%Michell Creek HY047 15% 10% -20% -5% -15% 15% -45%
East Duffins Creek HY023 0% 0% -25% 10% -15% 15% -50%Brougham Creek HY010 20% 10% -40% 25% 10% 20% -40%
Duffiins Creek Above Pickering HC019 10% 20% -15% 35%Urfe Creek HY065 30% -15% 25% 25% 35% -30%
Ganatsekiagon Creek HY028 30% 35% -35%Duffins Creek at Ajax HC049 10% 15% -40% 40% 20% 35% -30%
Aquafor Beech Limited.
Streamflow Guage Name Gauge Number
Calibration Events
Table 3.3: Summary of CN* adjustments by Calibration Event

Storm:Rainfall Depth (mm)
Observed Simulated Difference Observed Simulated Difference Observed Simulated Difference Observed Simulated Difference Observed Simulated Difference Observed Simulated Difference Observed Simulated DifferenceVolume Volume Volume Volume Volume Volume Volume Volume Volume Volume Volume Volume Volume Volume
(mm) (mm) (mm) (mm) (mm) (mm) (mm) (mm) (mm) (mm) (mm) (mm) (mm) (mm)Runoff Volume (mm)Reesor Creek (HY999) 3.80 2.46 -35.4% 4.24 2.85 -32.9% 5.56 5.39 -3.0%West Duffins Above Green River (HC038) 5.77 5.94 3.0%West Duffins at Hwy 7 (HY066) 2.59 2.35 -9.4% 2.71 2.90 6.9% 3.51 3.53 0.7%Michell Creek (HY047) 24.03 28.64 19.2% 7.93 7.75 -2.4% 9.12 8.45 -7.3% 2.55 2.66 4.0% 2.78 2.87 3.2% 2.81 2.85 1.5% 3.98 4.07 2.3%East Duffins Creek (HY023) 16.57 21.75 31.2% 6.34 5.66 -10.7% 9.30 9.67 4.0% 1.93 2.02 4.7% 2.14 2.23 4.0% 2.15 2.27 5.5% 2.97 2.98 0.1%Brougham Creek (HY010) 25.78 30.75 19.3% 6.96 7.19 3.4% 8.18 8.63 5.5% 10.13 9.49 -6.3% 5.50 5.72 4.1% 2.57 2.67 3.7% 4.97 4.68 -5.9%Duffiins Creek Above Pickering (HC019) 21.82 23.28 6.7% 7.40 6.36 -14.0% 13.33 12.01 -9.9% 5.20 5.16 -0.7%Urfe Creek (HY065) 10.94 12.56 14.8% 1.58 1.28 -19.5% 11.81 12.82 8.6% 10.89 10.72 -1.5% 8.04 8.54 6.1% 6.53 6.21 -4.8%Ganatsekiagon Creek (HY028) 17.02 15.70 -7.7% 14.59 14.01 -4.0% 5.53 5.51 -0.5%Duffins Creek at Ajax (HC049) 19.94 25.11 25.9% 8.21 8.49 3.4% 6.12 5.93 -3.1% 7.90 7.59 -4.0% 5.61 5.28 -5.9% 5.01 5.31 6.0% 4.75 4.72 -0.6%
Table 3.4 - Comparison of Observed vs. Simulated Runoff Volumes
May 15-17, 2003 May 23-24, 2003 July 29-30, 2006 July 22-23, 2008 June 24, 2010 June 27-28, 2010 July 23, 201029.0 mm 55.8 mm54.0 mm 30.0 mm 19.8 mm 16.4 mm 35.2 mm
Duffins Creek Calibration: May 15‐17, 2003Ob d Si l t d R ff V l
Duffins Creek Calibration: May 23‐24, 2003Ob d Si l d R ff V l
Duffins Creek Calibration: July 29‐30, 2006 Duffins Creek Calibration: July 22‐23, 2008
5
10
15
20
25
30
35
40
Simulated Runoff (mm)
Duffins Creek Calibration: May 15‐17, 2003Observed vs. Simulated Runoff Volumes
5
10
15
20
25
30
35
40
Simulated Runoff (mm)
Duffins Creek Calibration: May 23‐24, 2003Observed vs. Simulated Runoff Volumes
5
10
15
20
25
30
35
40
Simulated Runoff (mm)
Duffins Creek Calibration: July 29‐30, 2006Observed vs. Simulated Runoff Volumes
5
10
15
20
25
30
35
40
Simulated Runoff (mm)
Duffins Creek Calibration: July 22‐23, 2008Observed vs. Simulated Runoff Volumes
0
5
0 5 10 15 20 25 30 35 40
Observed Runoff (mm)
0
5
0 5 10 15 20 25 30 35 40
Observed Runoff (mm)
0
5
0 5 10 15 20 25 30 35 40
Observed Runoff (mm)
0
5
0 5 10 15 20 25 30 35 40
Observed Runoff (mm)
20
25
30
35
40
ated Runoff (mm)
Duffins Creek Calibration: May23‐24, 2003Observed vs. Simulated Runoff Volumes
20
25
30
35
40
ated Runoff (mm)
Duffins Creek Calibration: July 29‐30, 2006Observed vs. Simulated Runoff Volumes
20
25
30
35
40
ated Runoff (mm)
Duffins Creek Calibration: July 22‐23, 2008Observed vs. Simulated Runoff Volumes
0
5
10
15
20
0 5 10 15 20 25 30 35 40
Simulated Ru
Observed Runof (mm)
0
5
10
15
20
0 5 10 15 20 25 30 35 40
Simulated R
Observed Runoff (mm)
0
5
10
15
20
0 5 10 15 20 25 30 35 40
Simulated Ru
Observed Runoff (mm)

Storm:Rainfall Depth (mm)
Observed Simulated Difference Observed Simulated Difference Observed Simulated Difference Observed Simulated Difference Observed Simulated Difference Observed Simulated Difference Observed Simulated DifferenceFlow (m3/s) Flow (m3/s) Flow (m3/s) Flow (m3/s) Flow (m3/s) Flow (m3/s) Flow (m3/s) Flow (m3/s) Flow (m3/s) Flow (m3/s) Flow (m3/s) Flow (m3/s) Flow (m3/s) Flow (m3/s)
Peak Flow (m3/s)Reesor Creek (HY999) 3.10 2.07 -33.1% 3.50 4.03 15.2% 5.30 4.39 -17.2%West Duffins Above Green River (HC038) 6.90 5.77 -16.4%West Duffins at Hwy 7 (HY066) 6.50 3.99 -38.6% 6.50 5.76 -11.3% 9.30 6.51 -30.0%Michell Creek (HY047) 14.90 15.59 4.6% 4.10 5.16 25.8% 6.60 6.31 -4.4% 1.80 2.82 56.7% 1.40 2.11 50.5% 1.50 2.20 46.6% 2.20 2.95 34.0%East Duffins Creek (HY023) 24.00 28.01 16.7% 8.00 8.49 6.1% 17.20 18.28 6.3% 2.90 6.16 112.3% 3.10 4.02 29.7% 3.10 4.12 33.0% 4.90 5.28 7.7%Brougham Creek (HY010) 9.10 10.95 20.3% 2.50 3.09 23.5% 3.80 3.87 1.9% 3.70 5.32 43.7% 3.10 2.93 -5.5% 1.10 1.40 26.9% 3.50 2.39 -31.6%Duffiins Creek Above Pickering (HC019) 49.40 40.35 -18.3% 11.90 12.33 3.6% 40.20 26.24 -34.7% 13.90 15.78 13.5%Urfe Creek (HY065) 3.20 4.07 27.1% 0.40 0.39 -1.8% 8.70 4.24 -51.3% 3.90 4.01 2.8% 2.30 2.97 29.3% 2.70 2.29 -15.3%Ganatsekiagon Creek (HY028) 9.40 5.84 -37.9% 7.60 5.06 -33.4% 3.50 1.90 -45.7%Duffins Creek at Ajax (HC049) 75.20 100.88 34.1% 33.60 36.10 7.4% 27.40 28.46 3.9% 47.30 38.79 -18.0% 29.50 25.70 -12.9% 21.50 23.25 8.1% 27.50 19.76 -28.2%
Table 3.5 - Comparison of Observed vs. Simulated Peak Flow Rates
June 24, 2010 June 27-28, 2010 July 23, 2010May 15-17, 2003 May 23-24, 2003 July 29-30, 2006 July 22-23, 200829.0 mm 55.8 mm54.0 mm 30.0 mm 19.8 mm 16.4 mm 35.2 mm
Duffins Creek Calibration: May 15‐17, 2003Observed vs. Simulated Peak Flows
Duffins Creek Calibration: May 23‐24, 2003Observed vs. Simulated Peak Flows
Duffins Creek Calibration: July 29‐30, 2006Observed vs. Simulated Peak Flows
Duffins Creek Calibration: July 22‐23, 2008Observed vs. Simulated Peak Flows
10
20
30
40
50
60
70
80
Simulated Peak Flow (m3/s)
Duffins Creek Calibration: May 15‐17, 2003Observed vs. Simulated Peak Flows
10
20
30
40
50
60
70
80
Simulated Peak Flow (m3/s)
Duffins Creek Calibration: May 23‐24, 2003Observed vs. Simulated Peak Flows
10
20
30
40
50
60
70
80
Simulated Peak Flow (m3/s)
Duffins Creek Calibration: July 29‐30, 2006Observed vs. Simulated Peak Flows
10
20
30
40
50
60
70
80
Simulated Peak Flow (m3/s)
Duffins Creek Calibration: July 22‐23, 2008Observed vs. Simulated Peak Flows
0
10
0 10 20 30 40 50 60 70 80
Observed Peak Flow (m3/s)
0
10
0 10 20 30 40 50 60 70 80
Observed Peak Flow (m3/s)
0
10
0 10 20 30 40 50 60 70 80
Observed Peak Flow (m3/s)
0
10
0 10 20 30 40 50 60 70 80
Observed Peak Flow (m3/s)
40
50
60
70
80
Peak Flow (m3/s)
Duffins Creek Calibration: May 23‐24, 2003Observed vs. Simulated Peak Flows
40
50
60
70
80
Peak Flow (m3/s)
Duffins Creek Calibration: July 29‐30, 2006Observed vs. Simulated Peak Flows
20
25
30
35
40
Peak Flow (m3/s)
Duffins Creek Calibration: July 22‐23, 2008Observed vs. Simulated Peak Flows
0
10
20
30
40
0 10 20 30 40 50 60 70 80
Simulated Peak Fl
Observed Peak Flow (m3/s))
0
10
20
30
40
0 10 20 30 40 50 60 70 80
Simuluated Peak Fl
Observed Peak Flow (m3/s)
0
5
10
15
20
0 5 10 15 20 25 30 35 40
Simulated Peak Flo
Observed Peak Flow (m3/s)

Storm:Rainfall Depth (mm)
Observed Simulated Difference Observed Simulated Difference Observed Simulated Difference Observed Simulated Difference Observed Simulated Difference Observed Simulated Difference Observed Simulated DifferenceTime to Time to Time to Time to Time to Time to Time to Time to Time to Time to Time to Time to Time to Time toPeak (h) Peak (h) Peak (h) Peak (h) Peak (h) Peak (h) Peak (h) Peak (h) Peak (h) Peak (h) Peak (h) Peak (h) Peak (h) Peak (h)
Time to Peak (h)Reesor Creek (HY999) 9.00 8.50 0.50 25.00 25.25 -0.25 9.00 10.00 -1.00West Duffins Above Green River (HC038) 23.75 23.50 0.25West Duffins at Hwy 7 (HY066) 10.00 12.00 -2.00 26.00 26.75 -0.75 10.00 12.50 -2.50Michell Creek (HY047) 41.00 41.25 -0.25 33.00 32.00 1.00 17.00 19.00 -2.00 39.00 37.25 1.75 9.00 9.00 0.00 24.00 25.50 -1.50 8.00 10.00 -2.00East Duffins Creek (HY023) 40.00 41.50 -1.50 33.00 32.50 0.50 16.00 18.00 -2.00 39.00 38.75 0.25 8.00 9.25 -1.25 25.00 25.75 -0.75 8.00 10.00 -2.00Brougham Creek (HY010) 43.00 41.00 2.00 31.00 31.75 -0.75 21.00 18.25 2.75 37.00 39.75 -2.75 6.00 9.00 -3.00 23.00 25.25 -2.25 7.00 9.75 -2.75Duffiins Creek Above Pickering (HC019) 43.25 43.50 -0.25 33.75 33.25 0.50 20.00 21.00 -1.00 40.00 40.50 -0.50Urfe Creek (HY065) 0 35.00 32.50 2.50 22.00 23.25 -1.25 42.00 41.50 0.50 8.00 9.25 -1.25 23.00 25.25 -2.25 7.00 10.00 -3.00Ganatsekiagon Creek (HY028) 0 8.00 10.25 -2.25 26.00 25.25 0.75 10.00 10.50 -0.50Duffins Creek at Ajax (HC049) 47.75 47.00 0.75 35.25 35.75 -0.50 24.00 24.50 -0.50 42.00 43.50 -1.50 9.50 12.00 -2.50 28.75 28.25 0.50 14.00 14.25 -0.25
Table 3.6 - Comparison of Observed vs. Simulated Time-to-Peak
June 27-28, 2010 July 23, 2010May 15-17, 2003 May 23-24, 2003 July 29-30, 2006 July 22-23, 2008 June 24, 201029.0 mm 55.8 mm54.0 mm 30.0 mm 19.8 mm 16.4 mm 35.2 mm
Duffins Creek Calibration: May 15‐17, 2003Observed vs. Simulated Time‐to‐Peak
Duffins Creek Calibration: May 23‐24, 2003Observed vs. Simulated Time‐to‐Peak
Duffins Creek Calibration: July 29‐30, 2006Observed vs. Simulated Time‐to‐Peak
Duffins Creek Calibration: July 22‐23, 2008Observed vs. Simulated Time‐to‐Peak
10
20
30
40
50
60
Simulated Tim
e to Peak (h)
Duffins Creek Calibration: May 15‐17, 2003Observed vs. Simulated Time‐to‐Peak
10
20
30
40
50
60
Simulated Tim
e to Peak (h)
Duffins Creek Calibration: May 23‐24, 2003Observed vs. Simulated Time‐to‐Peak
10
20
30
40
50
60
Simulated Tim
e to Peak (h)
Duffins Creek Calibration: July 29‐30, 2006Observed vs. Simulated Time‐to‐Peak
10
20
30
40
50
60
Simulated Tim
e to Peak (h)
Duffins Creek Calibration: July 22‐23, 2008Observed vs. Simulated Time‐to‐Peak
0
0 10 20 30 40 50 60
Observed Time to Peak (h)
0
0 10 20 30 40 50 60
Observed Time to Peak (h)
0
0 10 20 30 40 50 60
Observed Time to Peak (h)
0
0 10 20 30 40 50 60
Observed Time to Peak (h)
30
40
50
60
lated Tim
e to Peak (h)
Duffins Creek Calibration: June 24, 2010Observed vs. Simulated Time‐to‐Peak
30
40
50
60
ulated Tim
e to Peak (h)
Duffins Creek Calibration: June 27‐28, 2010Observed vs. Simulated Time‐to‐Peak
30
40
50
60
ated
Tim
e to Peak (h)
Duffins Creek Calibration: June 23, 2010Observed vs. Simulated Time‐to‐Peak
0
10
20
0 10 20 30 40 50 60
Simulated T
Observed Time to Peak (h)
0
10
20
0 10 20 30 40 50 60
Simulated T
Observed Time to Peak (h)
0
10
20
0 10 20 30 40 50 60
Simulated Ti
Observed Time to Peak (h)

City Of Pickering / TRCA 11 February 2013 2012 Duffins Creek Hydrology Update
Aquafor Beech Limited 9
3.2 Model Validation
Upon completion of the calibration process, the model was verified using three additional
rainfall-runoff events from 2000. Data from six streamflow gauges are available for the
validation events (Table 3.1), however, only one rainfall gauge was operational at the time
(Table 3.2).
As noted in Section 3.1 above, the runoff volume for each event was calibrated by adjusting the
CN* parameter (Table 3.3). In doing so, the calibration process was accounting for the varying
antecedent moisture conditions present at the time of each calibration storm event. All other
model parameters were held constant through the calibration process.
Therefore, before the verification could be undertaken, a set of CN* adjustments had to be
selected which would reflect the antecedent moisture conditions for each of the verification
storm events. In order to estimate appropriate CN* adjustments for these events, relationships
were developed from the calibration results. Specifically, relationships were developed between
the CN* adjustments and the amount of precipitation recorded at the rain gauges in the days
preceding the calibration storm events. A 10-day antecedent precipitation index (API) was used
for each storm (Bruce et al). Plots of these relationships are provided in Appendix E. Results
from the corresponding calibration exercise from the 2002 Duffins Creek Hydrology Update
Study (Aquafor Beech Ltd.) were also added to the plots to provide a greater range in values.
The CN* adjustment values selected for the three 2000 validation storm events are also
illustrated in the plots.
Results from the model verification process are tabulated and illustrated in Table 3.7, 3.8 and 3.9
which provides a summary of the observed versus simulated runoff depths, peak flow rates and
times-to-peak for each event. Corresponding observed versus simulated runoff hydrograph plots
for each verification event are also provided in Appendix F. As shown, although the model
tended to marginally underestimate peak flows and volumes at some gauge sites for the
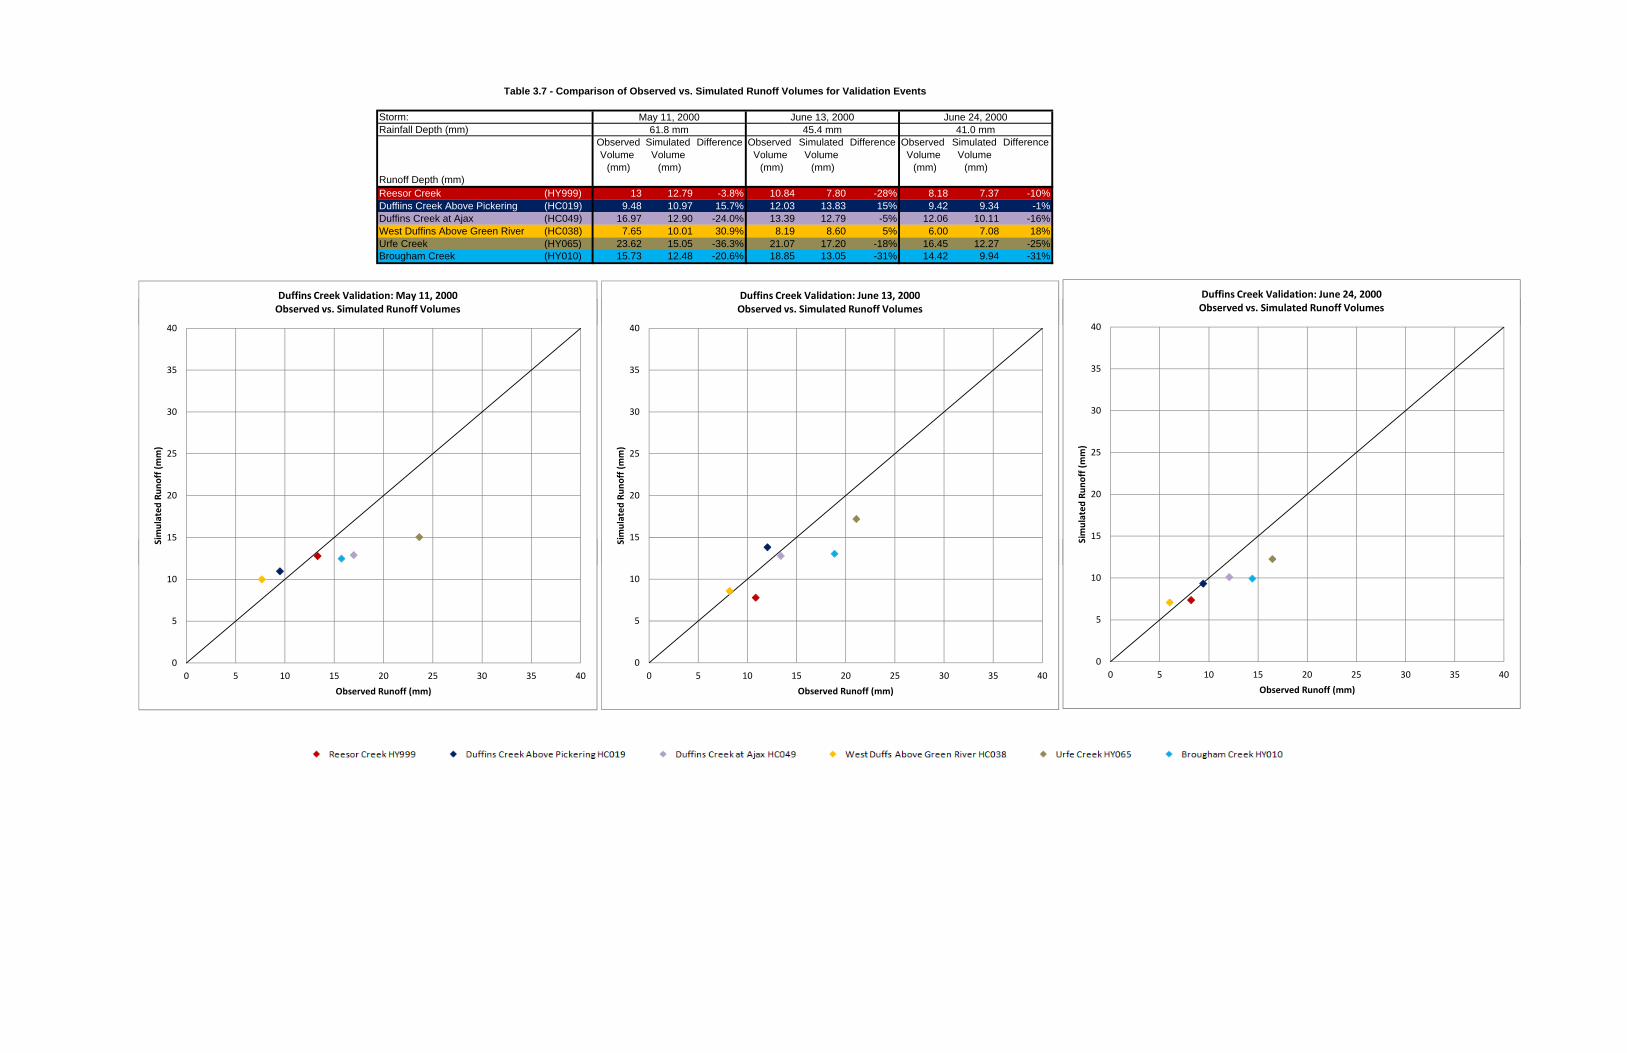
Storm:Rainfall Depth (mm)
Observed Simulated Difference Observed Simulated Difference Observed Simulated DifferenceVolume Volume Volume Volume Volume Volume
(mm) (mm) (mm) (mm) (mm) (mm)Runoff Depth (mm)Reesor Creek (HY999) 13 12.79 -3.8% 10.84 7.80 -28% 8.18 7.37 -10%Duffiins Creek Above Pickering (HC019) 9.48 10.97 15.7% 12.03 13.83 15% 9.42 9.34 -1%Duffins Creek at Ajax (HC049) 16.97 12.90 -24.0% 13.39 12.79 -5% 12.06 10.11 -16%West Duffins Above Green River (HC038) 7.65 10.01 30.9% 8.19 8.60 5% 6.00 7.08 18%Urfe Creek (HY065) 23.62 15.05 -36.3% 21.07 17.20 -18% 16.45 12.27 -25%Brougham Creek (HY010) 15.73 12.48 -20.6% 18.85 13.05 -31% 14.42 9.94 -31%
61.8 mm 45.4 mm 41.0 mmMay 11, 2000 June 13, 2000 June 24, 2000
Table 3.7 - Comparison of Observed vs. Simulated Runoff Volumes for Validation Events
40
Duffins Creek Validation: May 11, 2000Observed vs. Simulated Runoff Volumes
40
Duffins Creek Validation: June 13, 2000Observed vs. Simulated Runoff Volumes
40
Duffins Creek Validation: June 24, 2000Observed vs. Simulated Runoff Volumes
15
20
25
30
35
40
Simulated Runoff (mm)
y ,Observed vs. Simulated Runoff Volumes
15
20
25
30
35
40
Simulated Runoff (mm)
,Observed vs. Simulated Runoff Volumes
15
20
25
30
35
40
Simulated Runoff (mm)
Observed vs. Simulated Runoff Volumes
0 025 25
0
5
10
15
0 5 10 15 20 25 30 35 40
Si
Observed Runoff (mm)
0
5
10
15
0 5 10 15 20 25 30 35 40
Si
Observed Runoff (mm)
0
5
10
0 5 10 15 20 25 30 35 40
S
Observed Runoff (mm)
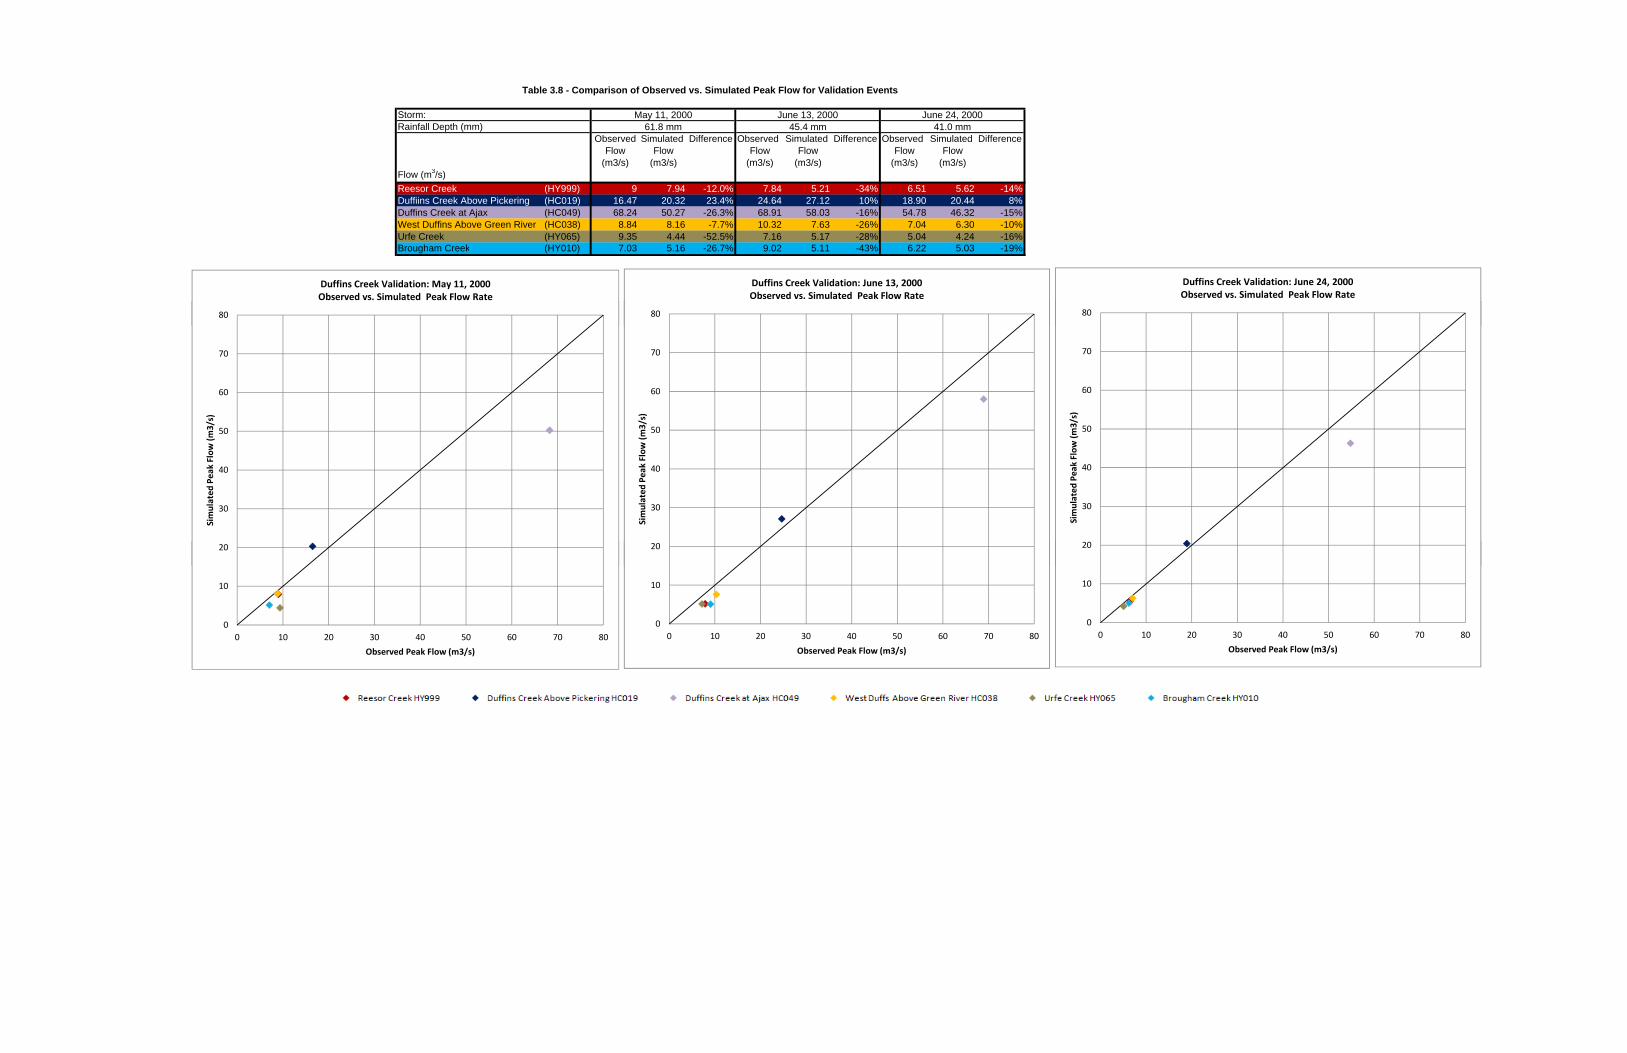
Storm:Rainfall Depth (mm)
Observed Simulated Difference Observed Simulated Difference Observed Simulated DifferenceFlow Flow Flow Flow Flow Flow
(m3/s) (m3/s) (m3/s) (m3/s) (m3/s) (m3/s)Flow (m3/s)
Reesor Creek (HY999) 9 7.94 -12.0% 7.84 5.21 -34% 6.51 5.62 -14%Duffiins Creek Above Pickering (HC019) 16.47 20.32 23.4% 24.64 27.12 10% 18.90 20.44 8%Duffins Creek at Ajax (HC049) 68.24 50.27 -26.3% 68.91 58.03 -16% 54.78 46.32 -15%West Duffins Above Green River (HC038) 8.84 8.16 -7.7% 10.32 7.63 -26% 7.04 6.30 -10%Urfe Creek (HY065) 9.35 4.44 -52.5% 7.16 5.17 -28% 5.04 4.24 -16%Brougham Creek (HY010) 7.03 5.16 -26.7% 9.02 5.11 -43% 6.22 5.03 -19%
Table 3.8 - Comparison of Observed vs. Simulated Peak Flow for Validation Events
May 11, 2000 June 13, 2000 June 24, 200061.8 mm 45.4 mm 41.0 mm
80
Duffins Creek Validation: May 11, 2000Observed vs. Simulated Peak Flow Rate
80
Duffins Creek Validation: June 13, 2000Observed vs. Simulated Peak Flow Rate
80
Duffins Creek Validation: June 24, 2000Observed vs. Simulated Peak Flow Rate
20
30
40
50
60
70
80
Simulated Peak Flow (m3/s)
20
30
40
50
60
70
80
Simulated Peak Flow (m3/s)
20
30
40
50
60
70
80
Simulated Peak Flow (m3/s)
0 080 80
0
10
20
0 10 20 30 40 50 60 70 80
Observed Peak Flow (m3/s)
0
10
20
0 10 20 30 40 50 60 70 80
Observed Peak Flow (m3/s)
0
10
20
0 10 20 30 40 50 60 70 80
Observed Peak Flow (m3/s)

Storm:Rainfall Depth (mm)
Observed Simulated Difference Observed Simulated Difference Observed Simulated DifferenceTime to Time to Time to Time to Time to Time toPeak (h) Peak (h) Peak (h) Peak (h) Peak (h) Peak (h)
Time: HoursReesor Creek (HY999) 51 51.50 0.50 11.00 13.75 2.75 36.00 34.25 -1.75Duffiins Creek Above Pickering (HC019) 53.00 52.25 -0.75 13.00 14.00 1.00 35.00 35.25 0.25Duffins Creek at Ajax (HC049) 56.25 54.75 -1.50 17.25 16.50 -0.75 37.25 37.75 0.50West Duffins Above Green River (HC038) 49.00 54.50 5.50 10.00 16.25 6.25 34.00 38.00 4.00Urfe Creek (HY065) 54.00 51.00 -3.00 16.00 13.25 -2.75 35.00 34.00 -1.00Brougham Creek (HY010) 51.00 50.25 -0.75 14.00 12.75 -1.25 34.00 33.25 -0.75
May 11, 2000 June 13, 2000 June 24, 2000
Table 3.9 - Comparison of Observed vs. Simulated Time to Peak for Validation Events
61.8 mm 45.4 mm 41.0 mm
60
Duffins Creek Validation: May 11, 2000Observed vs. Simulated Time to Peak
60
Duffins Creek Validation: June 13, 2000Observed vs. Simulated Time to Peak
60
Duffins Creek Validation: June 24, 2000Observed vs. Simulated Time to Peak
20
30
40
50
60
Simulated Tim
e to Peak (h)
Observed vs. Simulated Time to Peak
20
30
40
50
60
Simulated Tim
e to Peak (h)
Observed vs. Simulated Time to Peak
20
30
40
50
60
Simulated Tim
e to Peak (h)
Observed vs. Simulated Time to Peak
45 45 0 0 25 2560 60 25 25 45 45
0
10
0 10 20 30 40 50 60
Observed Time to Peak (h)
0
10
0 10 20 30 40 50 60
Observed Time to Peak (h)
0
10
0
0 10 20 30 40 50 60
Simulated Time to Peak (h)

City Of Pickering / TRCA 11 February 2013 2012 Duffins Creek Hydrology Update
Aquafor Beech Limited 10
validation events, it does provide a good representation of the rainfall-runoff response for the
events.
3.3 Calibration-Validation Summary
As demonstrated through the calibration and validation process, good model results were
achieved, on average, for the various storm events and gauge sites.
Differences between the observed and simulated streamflow results were investigated further by
the City of Pickering through a review of available radar data for each of the calibration and
validation storm events. This was important for the validation events, in particular, where data
from only a single rainfall gauge was available to simulate the storm events over the whole
watershed. The results of this review are provided in Appendix G, and include a description of
how each storm moved through the Duffins Creek watershed and a comparison of the rainfall
amounts recorded with the radar data versus the rainfall gauges used in the modelling. In many
cases, the storm direction, rainfall patterns, and differences between rainfall amounts can help to
explain some of the differences between the observed streamflows and the model results.
In general, the simulated hydrograph characteristics (i.e. volume, peak flow, shape) were found
to be reasonable given the variability and uncertainty associated with rainfall data and
streamflow measurements. In summary, the calibrated hydrologic model can be considered
representative of the watershed.
City Of Pickering / TRCA 11 February 2013 2012 Duffins Creek Hydrology Update
Aquafor Beech Limited 11
4.0 HYDROLOGIC ASSESSMENT AND DESIGN STORM FLOW ESTIMATES
Peak flows were established at key locations in the study area for the existing and projected
future landuse scenarios. A design storm approach was used to estimate the 2, 5, 10, 25, 50, and
100-year peak flows, and the Regulatory Storm. The Regulatory Storm in the study area for
floodplain management purposes is based on Hurricane Hazel.
With a design storm approach, a rainfall input (i.e. duration, return period depth, and temporal
distribution) is selected and design flows are determined using specified antecedent moisture
conditions and a computational technique such as a hydrologic model. It is assumed with this
approach that peak flows which are generated are of approximately the same return period as the
applied design storm.
While the antecedent conditions present at the time of the storm events used in the calibration-
validation process were measurable from recorded data, the antecedent conditions prior to a
future storm event or a synthetic design storm event are unknown and therefore assumptions
must be made. For the purposes of this study, average antecedent moisture conditions were
assumed for the 2-year through 100-year design storms, while saturated antecedent moisture
conditions were assumed for the Regional Storm event. The CN parameters within the model
were set accordingly for these combinations of design storms and antecedent conditions.
4.1 Design Storm Selection
The 12-hour AES design storm was selected for application to the Duffins Creek watershed. The
AES distribution was selected over both the U.S. Soil Conservation Service (SCS) and Chicago
distributions, as it is more suitable for a Southern Ontario study area. The 12-hour duration was
selected as it is representative of the predominant type of storm which will cause flooding on a
primarily rural watershed of this size. Further, the 12-hour storm was typically found to be the
critical duration in previous hydrologic studies of Duffins Creek (Aquafor, 1991). Hyetographs
for the 2-year through 100-year and Regulatory Storm events are provided in Appendix H.

City Of Pickering / TRCA 11 February 2013 2012 Duffins Creek Hydrology Update
Aquafor Beech Limited 12
4.2 Design Storm Flow Estimates - Existing Landuses
The calibrated hydrologic model for Duffins Creek was used as the basis for estimating design
storm flow rates. The following assumptions and techniques were used to apply the design
storms over the watershed hydrologic model:
• for the 2-year through 100-year design storm events, average antecedent moisture
conditions (AMC2) were assumed, and the CN values were set accordingly;;
• for the Regional Storm event, saturated antecedent moisture conditions (AMC3) were
assumed, and the CN values were set accordingly;;
• areal reduction factors were applied to the Regional Storm rainfall depth using the
“equivalent circular area method”; and
• as per the Ontario Ministry of Natural Resources’ “Technical Guide – River and Stream
Systems: Flooding Hazard Limit”, the routing effects associated with existing stormwater
management facilities and the Stouffville dam were not considered for the Regional
Storm model simulations.
Peak flow estimates for the existing landuse scenario were obtained at key locations throughout
the Duffins Creek Watershed. Summarized in Table 4.1 are the estimated design flows at the
“flow node” locations illustrated in Figure 4.1. Peak flow estimates from the previous 2002
Duffins Creek Hydrology Update Study are also included in Table 4.1 for comparison. As
shown, the peak flow estimates from the current 2012 study are lower at most locations than the
estimates from the 2002 study. Small increases over the 2002 estimates were noted for some
design storms at locations within Stouffville Creek and Reesor Creek. These differences are
attributed to the improved calibration achieved in this study using more detailed streamflow and
rainfall gauge coverage over the watershed.
For comparison, the predicted design storm flow estimates were plotted against the observed
flood frequency curves at the 02HC049 (Duffins Creek at Ajax) and 02HC019 (Duffins Creek
above Pickering) streamflow gauges. As shown in Figure 4.2 and 4.3, the hydrologic model

HWY 47
HWY 7
Regional Road 5
Bro ck Rd
York-Durham Line
Kingston Rd
HWY 401
HWY 407
HWY 48
B ro ck Rd
2.4
2.13
10.1
11.5
13.1
14.1
27
27.3
20
28
26.4
11.111.6
25.3
28.1
12.112.2
23.125.2
21.2
4.2
3.3
3.2
3.1
6.17
26.5
11.3
11.4
4.111.2
8.1
5
13
27.1
27.2
25.4
23.223.3
20.1
19.1
21.1
2.5
FD u f f i n s C r e e k W a t e r s h e dD u f f i n s C r e e k W a t e r s h e d
Whitchurch-Stouffville
Uxbridge
Ajax
Pickering
D U R H A MY O R KMarkham
Stouffville
Whitevale
Brougham
Claremont
Goodwood
Ajax
Pickering
Flow Node Locat ion
Figure 4.1 :Flow Node Locations
0 2 4 6 81kms
River / Stream
Roads
Municipal Boundary
!( Flow Node
Subcatchment Boundary
Duffins Creek Watershed
Legend:
Nov 2012

Model Areal
Flow Node Location Landuse Scenario Catchment HYD Drainage Area Reduction
Ref. No. (km2) Factor* 2 Yr 5 Yr 10 Yr 25 Yr 50 Yr 100 Yr Regional Storm
2.5 Stouffville Creek north of Bethesda Road Existing Landuses (2002 model) 1 2.8 1.5 2.5 3.1 4.1 4.8 5.6 22.3
Existing Landuses (2012) 17 9916 5.5 1.2 2.1 2.8 3.7 4.4 5.2 27.8
Future (Official Plan) Landuses 5.5 1.2 2.1 2.8 3.7 4.5 5.2 28.0
Future Landuses with Airport 5.5 1.2 2.1 2.8 3.7 4.5 5.2 28.0
2.4 Stouffville Creek south of Main Street
Existing Landuses (2012) 16 1608 8.4 4.1 5.8 7.1 8.9 10.2 12.5 52.8Future (Official Plan) Landuses 8.4 4.4 6.2 7.6 9.4 10.9 13.2 53.7Future Landuses with Airport 8.4 4.4 6.2 7.6 9.4 10.9 13.2 53.7
2.1 Stouffville Creek at Townline Road Existing Landuses (2002 model) 2 13.7 4.8 7.4 9.3 12.0 13.9 16.2 66.4
Existing Landuses (2012) 14 1402 13.9 3.6 5.4 6.8 8.6 10.0 11.5 75.2
Future (Official Plan) Landuses 13.9 3.7 5.6 6.9 8.8 10.2 11.8 76.2
Future Landuses with Airport 13.9 6.1 8.3 9.7 11.5 12.9 14.5 79.1
3.3 Reesor Creek at Bethesda Road
Existing Landuses (2012) 22 2207 10.0 2.1 3.4 4.3 5.5 6.5 7.5 38.0
Future (Official Plan) Landuses 10.0 2.1 3.4 4.3 5.5 6.5 7.5 38.0
Future Landuses with Airport 10.0 2.1 3.4 4.3 5.5 6.5 7.5 38.0
3.2 Trib of Reesor Creek conflunce with Ressor Creek at Main Street
Existing Landuses (2012) 21 2101 2.5 0.8 1.4 1.7 2.2 2.6 3.0 13.1
Future (Official Plan) Landuses 2.5 0.8 1.4 1.7 2.2 2.6 3.0 13.1
Future Landuses with Airport 2.5 0.8 1.4 1.7 2.2 2.6 3.0 13.1
3.1 Ressor Creek at Main Street
Existing Landuses (2012) 20 2006 12.1 2.8 4.3 5.3 6.6 7.7 8.8 46.5
Future (Official Plan) Landuses 12.1 2.7 4.2 5.3 6.6 7.7 8.8 48.1
Future Landuses with Airport 12.1 2.7 4.2 5.3 6.6 7.7 8.8 48.1
3 Reesor Creek at Townline road Existing Landuses (2002 model) 3 19.0 3.9 6.2 7.7 9.8 11.4 13.1 59.2
Existing Landuses (2012) 19 1902 18.6 4.5 6.8 8.4 10.5 12.3 14.2 65.4
Future (Official Plan) Landuses 18.6 4.4 6.8 8.4 10.5 12.3 14.2 65.5
Future Landuses with Airport 18.6 4.3 6.6 8.2 10.2 12.0 13.8 65.1
4.2 Reesor Creek at 8th Conc. (Gauge HY999) Existing Landuses (2002 model) 9.6 15.5 19.7 25.6 30.2 35.1 170.6
Existing Landuses (2012) 13 1302 35.4 8.7 13.2 16.4 20.7 24.2 27.9 146.1
Future (Official Plan) Landuses 35.4 8.8 13.3 16.5 20.8 24.3 28.0 146.8
Future Landuses with Airport 35.4 11.8 15.6 18.1 21.5 24.0 26.6 143.7
4.1 Reesor Creek at Townline road/north of Green River Existing Landuses (2002 model) 4 39.5 9.2 14.4 18.0 23.0 26.8 30.9 134.8
Existing Landuses (2012) 12 1202 39.9 9.5 14.6 18.3 23.0 26.8 30.9 151.7
Future (Official Plan) Landuses 39.9 9.6 14.8 18.4 23.1 26.9 31.1 152.4
Future Landuses with Airport 39.9 24.8 32.9 39.0 45.9 51.1 56.3 149.8
5 West Duffins Creek north of Webb Road at Glasgow
Existing Landuses (2012) 28 2804 25.5 3.6 5.8 7.4 9.7 11.6 13.6 77.5
Future (Official Plan) Landuses 25.5 3.5 5.8 7.3 9.6 11.5 13.5 77.6
Future Landuses with Airport 25.5 3.5 5.8 7.3 9.6 11.5 13.5 77.6
6.1 West Duffins Creek south of Ninth Concession Road Existing Landuses (2002 model) 6 32.5 5.0 8.4 10.8 14.3 17.1 20.0 107.6
Existing Landuses (2012) 26 2604 31.2 4.4 7.2 9.2 12.0 14.3 16.8 87.6
Future (Official Plan) Landuses 31.2 4.4 7.2 9.1 12.0 14.2 16.7 88.0
Future Landuses with Airport 31.2 4.2 6.9 8.8 11.5 13.8 16.2 86.8
97.1%
99.2%
97.1%
95.4%
98.2%
97.1%
98.2%
100%
100.0%
100.0%
Table 4.1:
Peak Flow Rate (m3/s)
100.0%
Summary of Estimated Design Flows for Various Landuse Scenarios

Model Areal
Flow Node Location Landuse Scenario Catchment HYD Drainage Area Reduction
Ref. No. (km2) Factor* 2 Yr 5 Yr 10 Yr 25 Yr 50 Yr 100 Yr Regional Storm
Table 4.1:
Peak Flow Rate (m3/s)
Summary of Estimated Design Flows for Various Landuse Scenarios
7 Wixon Creek south of Ninth Concession Road Existing Landuses (2002 model) 7 10.8 2.1 3.3 4.2 5.4 6.4 7.4 34.6
Existing Landuses (2012) 27 2701 11.4 1.6 2.5 3.1 4.0 4.8 5.5 25.9
Future (Official Plan) Landuses 11.4 1.6 2.5 3.1 4.0 4.8 5.5 25.9
Future Landuses with Airport 2703 11.4 1.4 2.3 2.9 3.8 4.5 5.2 24.9
8.1 West Duffins Creek south of Seventh Concession Road Existing Landuses (2002 model) 8 48.5 8.1 13.3 17.0 22.3 26.4 30.8 150.4
Existing Landuses (2012) 25 2502 46.8 6.6 10.6 13.6 17.9 21.1 24.6 116.2
Future (Official Plan) Landuses 46.8 6.6 10.6 13.5 17.8 21.0 24.5 116.8
Future Landuses with Airport 46.8 16.4 22.0 25.5 30.0 33.4 36.7 106.4
10.1 West Duffins Creek above confluence with Reesor Creek (Gauge HC038) Existing Landuses (2002 model) 10 61.8 10.9 17.7 22.6 29.4 34.7 40.3 186.2
Existing Landuses (2012) 23 2302 60.7 9.1 14.6 18.5 24.2 28.3 33.0 145.8
Future (Official Plan) Landuses 60.7 9.1 14.5 18.4 24.1 28.2 32.9 146.4
Future Landuses with Airport 60.7 53.8 71.0 82.0 96.3 107.2 118.1 195.9
11.2 Tributary of West Duffins Creek Existing Landuses (2002 model) 1.0 1.6 2.0 2.6 3.0 3.5 15.0
Existing Landuses (2012) 11 1101 4.3 0.9 1.5 1.8 2.4 2.8 3.2 13.7
Future (Official Plan) Landuses 4.3 0.9 1.5 1.8 2.4 2.8 3.2 13.7
Future Landuses with Airport 1103 4.3 15.5 20.7 23.9 27.9 30.9 33.8 47.8
11.5 Whitevale Creek at Hwy 7
Existing Landuses (2012) 10 1004 108.3 19.2 30.5 38.4 49.8 58.3 67.5 302.6
Future (Official Plan) Landuses 108.3 19.2 30.6 38.4 49.7 58.3 67.5 303.1
Future Landuses with Airport 108.3 67.8 87.7 102.5 121.8 136.7 151.7 370.3
11.4 West Duffins Creek at Whitevale Road
Existing Landuses (2012) 7 704 115.5 20.3 32.4 40.7 52.6 61.6 71.2 316.9
Future (Official Plan) Landuses 115.5 20.1 32.1 40.1 51.7 60.6 70.1 311.4
Future Landuses with Airport 115.5 68.5 88.5 101.9 120.4 134.0 147.9 385.6
11.3 Whitevale Creek above confluence with West Duffins Creek Existing Landuses (2002 model) 11‐2 5.6 1.3 2.0 2.6 3.3 3.9 4.5 21.1
Existing Landuses (2012) 30 3004 5.5 1.3 2.0 2.6 3.3 3.9 4.5 21.2
Future (Official Plan) Landuses 5.5 10.0 13.1 15.2 18.2 20.3 22.4 39.2
Future Landuses with Airport 5.5 15.1 19.6 22.7 26.7 30.0 33.0 51.3
11.1 West Duffins Creek at Taunton Road/ at Clarkes Hollow Existing Landuses (2002 model) 11 126.1 23.9 38.3 48.5 63.0 73.9 85.0 354.4
Existing Landuses (2012) 6 604 119.8 20.9 33.6 41.9 54.2 63.6 73.6 311.6
Future (Official Plan) Landuses 119.8 20.6 33.1 41.3 53.3 62.5 72.3 305.5
Future Landuses with Airport 119.8 66.5 87.0 100.5 119.1 133.1 147.2 369.1
11.6 Small Trib confluence with West Duffins Creek at Taunton Road West
Existing Landuses (2012) 32 3201 1.4 0.8 1.2 1.6 2.0 2.3 2.7 9.6
Future (Official Plan) Landuses 3203 1.4 3.4 4.5 5.3 6.2 7.0 7.7 13.6
Future Landuses with Airport 1.4 3.4 4.5 5.3 6.2 7.0 7.7 13.6
12.2 West Duffins Creek at Valley Farm Road
Existing Landuses (2012) 5 508 132.8 22.2 36.4 44.8 57.5 67.3 77.6 325.9
Future (Official Plan) Landuses 132.8 21.4 35.2 43.0 55.0 64.4 74.3 312.0
Future Landuses with Airport 132.8 62.1 80.2 93.0 109.6 121.8 134.5 358.6
12.1 West Duffins Creek at Pickering Existing Landuses (2002 model) 12 135.1 24.8 39.9 50.5 65.5 76.9 88.6 368.2
Existing Landuses (2012) 4 414 134.6 22.3 36.5 45.0 57.7 67.4 77.7 326.2
Future (Official Plan) Landuses 134.6 21.4 35.3 43.1 55.1 64.4 74.3 312.1
Future Landuses with Airport 134.6 62.4 80.7 93.1 109.8 121.9 134.4 358.8
13.1 East Trib of Michell Creek at Brock Road
Existing Landuses (2012) 49 4903 8.1 1.8 2.8 3.6 4.6 5.5 6.4 34.0
Future (Official Plan) Landuses 8.1 3.2 4.8 6.1 8.1 9.4 10.7 38.0
Future Landuses with Airport 8.1 3.8 5.5 6.9 9.0 10.4 11.9 38.8
13 Michell Creek at Brock Road Existing Landuses (2002 model) 13 17.4 7.9 12.3 15.3 19.5 22.7 26.1 97.4
Existing Landuses (2012) 48 111 16.9 5.2 8.2 10.4 13.3 15.7 18.1 78.6
Future (Official Plan) Landuses 16.9 5.3 8.3 10.5 13.4 15.7 18.2 78.4
Future Landuses with Airport 16.9 13.2 18.0 21.4 26.1 29.7 33.1 86.9
97.1%
93.5%
89.4%
100.0%
89.4%
89.4%
99.2%
94.2%
100.0%
94.8%
99.2%
100.0%
94.8%

Model Areal
Flow Node Location Landuse Scenario Catchment HYD Drainage Area Reduction
Ref. No. (km2) Factor* 2 Yr 5 Yr 10 Yr 25 Yr 50 Yr 100 Yr Regional Storm
Table 4.1:
Peak Flow Rate (m3/s)
Summary of Estimated Design Flows for Various Landuse Scenarios
14.1 Michell Creek above confluence with East Duffins Creek (Gauge HY047) Existing Landuses (2002 model) 14 23.6 10.5 16.6 20.8 26.8 31.4 35.8 129.5
Existing Landuses (2012) 47 4704 23.7 7.2 11.5 14.5 18.8 22.1 25.6 109.1
Future (Official Plan) Landuses 23.7 7.8 12.3 15.4 19.8 23.2 26.8 111.0
Future Landuses with Airport 23.7 18.3 24.8 29.5 35.7 40.4 45.5 123.3
19.2 East Duffins Creek at Claremont (Gauge HY023)
Existing Landuses (2012) 50 113 61.9 15.1 24.2 30.7 40.0 47.3 54.5 254.0
Future (Official Plan) Landuses 61.9 15.7 24.9 31.5 40.9 48.3 55.5 254.5
Future Landuses with Airport 61.9 20.2 28.1 33.9 41.6 47.7 54.9 248.7
19.1 East Duffins Creek at Whitevale Road/above Brougham Creek Existing Landuses (2002 model) 19 68.2 24.0 39.0 49.5 64.3 75.8 87.8 346.4
Existing Landuses (2012) 46 4604 67.9 15.0 24.6 31.1 40.6 48.0 55.7 249.1
Future (Official Plan) Landuses 67.9 15.6 25.3 31.9 41.5 48.9 56.8 247.8
Future Landuses with Airport 67.9 17.5 27.0 33.5 42.8 50.1 57.6 242.4
20.1 Brougham Creek north of Whitevale Road
Existing Landuses (2012) 45 4501 5.6 1.9 3.0 3.8 4.9 5.8 6.7 30.0
Future (Official Plan) Landuses 5.4 1.8 2.9 3.7 4.8 5.7 6.6 29.3
Future Landuses with Airport 4503 5.6 4.1 5.5 6.4 7.6 8.6 9.5 29.8
20 Brougham Creek south of Whitevale Road (Gauge HY010) Existing Landuses (2002 model) 20 15.5 6.8 10.7 13.3 17.0 19.8 22.8 88.3
Existing Landuses (2012) 44 4404 14.8 4.6 7.4 9.4 12.1 14.3 16.6 77.0
Future (Official Plan) Landuses 14.8 6.7 9.4 11.3 13.9 15.9 17.9 75.4
Future Landuses with Airport 14.8 26.4 35.1 41.0 48.5 55.3 61.1 111.2
21.2 East Duffins Creek at Taunton Road (Gauge HC019) Existing Landuses (2002 model) 21‐1 86.9 31.5 51.3 65.2 83.9 99.0 114.6 421.7
Existing Landuses (2012) 43 4304 86.3 19.3 31.5 39.8 52.0 61.5 71.6 303.2
Future (Official Plan) Landuses 86.3 19.9 32.2 40.6 52.8 62.4 72.5 299.4
Future Landuses with Airport 86.3 28.8 40.1 48.1 58.8 66.0 75.6 292.5
21.1 East Duffins Creek south of Rossland Road/above East Duffins Creek Existing Landuses (2002 model) 21 92.0 32.6 53.7 68.2 87.5 103.4 120.0 437.5
Existing Landuses (2012) 42 4208 89.3 19.1 30.7 38.9 50.8 60.2 70.1 307.5
Future (Official Plan) Landuses 89.3 19.7 31.4 39.7 51.5 60.9 70.7 301.4
Future Landuses with Airport 89.3 26.3 37.8 45.9 57.3 65.8 75.2 293.3
23.3 West Trib conflunce with Urfe Creek / South of Whitevale Road
Existing Landuses (2012) 38 3803 3.4 0.8 1.3 1.7 2.1 2.5 2.9 13.9
Future (Official Plan) Landuses 3.4 4.7 6.2 7.2 8.5 9.5 10.5 20.0
Future Landuses with Airport 3.4 10.0 12.9 14.9 17.4 19.4 21.3 32.2
23.2 East Trib conflunce with Urfe Creek / South of Whitevale Road
Existing Landuses (2012) 39 3903 3.5 0.7 1.0 1.3 1.7 2.0 2.3 11.3
Future (Official Plan) Landuses 3.5 2.3 3.1 3.6 4.3 4.8 5.4 13.4
Future Landuses with Airport 3.5 13.7 18.2 21.0 24.5 27.2 29.8 42.1
23.1 Urfe Creek south of Rossland Road/above East Duffins Creek (Gauge HY065) Existing Landuses (2002 model) 23 14.4 5.1 8.1 10.2 13.2 15.3 17.5 68.0
Existing Landuses (2012) 36 3608 15.0 3.1 4.9 6.2 8.1 9.5 11.0 52.6
Future (Official Plan) Landuses 14.9 8.6 11.5 13.4 16.0 18.0 20.1 72.1
Future Landuses with Airport 14.9 17.2 23.4 27.6 33.4 37.8 42.4 102.8
25.3 West Trib of Ganatsekiagon / South of Whitevale Road
Existing Landuses (2012) 34 3403 3.6 1.0 1.6 2.1 2.7 3.1 3.6 16.2
Future (Official Plan) Landuses 3.6 6.7 8.8 10.3 12.1 13.8 15.2 27.0
Future Landuses with Airport 3.6 10.4 13.6 15.8 18.6 20.7 23.1 35.9
25.4 East Trib of Ganatsekiagon / South of Whitevale Road
Existing Landuses (2012) 35 3503 3.4 1.0 1.5 1.9 2.5 3.0 3.4 15.7
Future (Official Plan) Landuses 3.4 6.9 9.1 10.5 12.6 14.1 15.6 27.0
Future Landuses with Airport 3.4 9.6 12.6 14.6 17.2 19.1 21.3 33.5
25.2 Ganatsekiagon Creek east of Brock Road / above East Duffins Creek Existing Landuses (2002 model) 25 12.9 4.4 6.9 8.7 11.1 13.0 14.9 59.4
Existing Landuses (2012) 33 3304 13.0 3.4 5.5 6.9 8.8 10.4 12.0 54.4
Future (Official Plan) Landuses 13.1 12.1 16.2 19.0 22.8 25.6 28.5 74.9
Future Landuses with Airport 13.1 14.9 19.8 23.1 27.9 31.6 35.7 85.3
100.0%
97.1%
89.4%
89.4%
100.0%
97.1%
100.0%
94.8%
97.1%
94.2%
100.0%
100.0%
100.0%

Model Areal
Flow Node Location Landuse Scenario Catchment HYD Drainage Area Reduction
Ref. No. (km2) Factor* 2 Yr 5 Yr 10 Yr 25 Yr 50 Yr 100 Yr Regional Storm
Table 4.1:
Peak Flow Rate (m3/s)
Summary of Estimated Design Flows for Various Landuse Scenarios
26.5 East Duffins Creek at Pickering Existing Landuses (2002 model) 21 119.3 42.1 68.7 86.9 111.8 131.5 152.2 553.4
Existing Landuses (2012) 41 4112 119.5 24.7 39.3 49.8 64.9 76.8 89.4 398.5
Future (Official Plan) Landuses 119.5 24.7 38.7 48.7 63.2 74.6 86.7 371.3
Future Landuses with Airport 119.5 47.8 64.0 74.7 89.1 100.9 112.5 411.4
26.4 Duffins Creek at Kingston Road Existing Landuses (2002 model) 26 254.4 65.5 104.1 131.9 171.6 201.8 232.3 895.7
Existing Landuses (2012) 3 308 255.6 45.6 75.3 93.2 119.5 139.7 161.3 696.8
Future (Official Plan) Landuses 255.6 44.7 73.5 90.1 114.6 134.1 154.5 653.3
Future Landuses with Airport 255.6 107.7 141.5 164.9 196.0 219.1 243.2 759.2
27.3 Miller Creek at Taunton Road East
Existing Landuses (2012) 56 5603 4.6 1.5 2.5 3.1 4.0 4.7 5.5 27.8
Future (Official Plan) Landuses 4.6 1.8 2.8 3.7 4.7 5.6 6.4 28.8
Future Landuses with Airport 4.6 1.8 2.8 3.7 4.7 5.6 6.4 28.8
27.2 Millers Creek at Rossland Road East
Existing Landuses (2012) 55 5512 7.8 4.0 6.4 8.3 10.9 12.7 14.6 52.2
Future (Official Plan) Landuses 7.8 4.9 8.1 10.6 13.9 16.3 18.6 56.8
Future Landuses with Airport 7.8 4.9 8.1 10.6 13.9 16.3 18.6 56.8
27.1 Millers Creek at Kingston Road
Existing Landuses (2012) 54 5420 12.7 7.1 12.5 16.0 21.6 26.9 31.7 96.7
Future (Official Plan) Landuses 12.7 8.9 15.0 19.5 26.1 32.1 37.6 105.8
Future Landuses with Airport 12.7 8.9 15.0 19.5 26.1 32.1 37.6 105.8
27 Millers Creek south of Hwy 401/ above Duffins Creek Existing Landuses (2002 model) 27 17.0
Existing Landuses (2012) 53 5304 16.1 12.5 19.4 25.4 33.4 40.0 46.1 131.8
Future (Official Plan) Landuses 16.1 14.2 22.1 28.8 37.7 44.8 51.7 140.9
Future Landuses with Airport 16.1 14.2 22.1 28.8 37.7 44.8 51.7 140.9
28.1 Duffins Creek at Ajax (Gauge HC049)
Existing Landuses (2012) 2 204 258.0 45.4 74.3 92.6 118.6 138.9 160.5 666.1
Future (Official Plan) Landuses 258.0 44.6 72.1 89.5 113.8 133.0 153.6 625.0
Future Landuses with Airport 258.0 104.9 138.8 162.4 193.5 216.6 240.6 719.6
28 Duffins Creek at Lake Ontario Existing Landuses (2002 model) 28 283.1 69.5 110.2 139.1 180.7 212.7 244.8 900.8
Existing Landuses (2012) 1 14 280.2 34.9 58.5 73.8 97.9 115.6 135.0 581.5
Future (Official Plan) Landuses 280.2 37.8 61.9 76.7 99.5 117.0 135.6 560.1
Future Landuses with Airport 280.2 68.1 98.6 117.9 145.7 166.2 188.3 616.3
* Areal Reduction Factor applied to Regional Storm
98.2%
86.7%
86.7%
89.4%
100.0%
99.2%
98.2%
89.4%

1
10
100
1000
1 10 100
Flow
(m3/
s)
Return Period (Years)
FIGURE 4.2: Observed vs. Predicted Flood Frequency
Streamflow Gauge 02HC049 (Duffins Creek at Ajax)
Observed Annual Peak Flows Log Pearson - Weighted SKEW 95% Upper 95% Lower Simulated 12 hour AES storm

1
10
100
1000
1 10 100
Flow
(m3/
s)
Return Period (Years)
FIGURE 4.3: Observed vs. Predicted Flood Frequency
Streamflow Gauge 02HC019 (Duffins Creek above Pickering)
Observed Annual Peak Flows Log Pearson - Station SKEW 95% Upper 95% Lower Simulated 12 hour AES storm

City Of Pickering / TRCA 11 February 2013 2012 Duffins Creek Hydrology Update
Aquafor Beech Limited 13
results for the design storm events can be considered representative of the observed flood
frequencies at these locations.
4.3 Design Storm Flow Estimates - Future Landuses
The hydrologic model was then setup in order to simulate two additional landuse scenarios
associated with future urban development:
• Future (Official Plan) Landuses - includes future urban development committed on
Municipal Official Plans. The majority of the future urban development is located within
Seaton Lands, immediately north of the existing Pickering-Ajax urban boundary, together
with other smaller pockets of future urban development in and around Pickering-Ajax
and Whichurch-Stoufville; and
• Future Landuses with Airport – This represents a “what if” scenario and includes
additional potential future urban development, beyond the Official Plan, in the “airport
lands”, The assessment is intended to look at the impact of the development of the
airport lands, located in the middle of the watershed, on the hydrology. The land use for
the airport lands that have been incorporated are based on the Pickering Airport Draft
Plan Report (November 2004). The report contains a number of runway sitings and
configurations, and presents a preferred runway siting concept. Given the number of
configurations, incorporating significant detail into the delineation of the land cover for
the airport is not worth while at this time. The two common components of the plan were
a green space area, located along the western and northern portions of the airport lands,
and a future development area contained within the remainder of the lands. The land
cover was estimated with reference to Pearson Airport which has very dense commercial
development in the surrounding areas. As such, a 30m green space corridor was assumed
for each of the existing headwater creeks within the development area, and the remainder
was assumed to be developed with Industrial/Commercial uses (90% imperviousness).
The existing, future (Official Plan) and future airport urban development lands are illustrated in
Figure 4.4.

HWY 47
HWY 7
Regional Road 5
Bro ck Rd
York-Dur ham Line
Kingston Rd
HWY 401
HWY 407
HWY 48
B ro ck Rd
Taunton Rd
Rossland Rd
FD u f f i n s C r e e k W a t e r s h e dD u f f i n s C r e e k W a t e r s h e d
Whitchurch-Stouffville
Uxbridge
Ajax
Pickering
D U R H A MY O R K
Markham
Stouffville
Whitevale
Brougham
Claremont
Goodwood
AjaxPickering
Future and Airport Landuse
Figure 4.4 :Future and Airport Landuse
0 2 4 6 81kms
River / Stream
Roads
Municipal Boundary
Watershed Boundary
Federal Airport Lands
Seaton Lands
Legend:
Jan 2013
Whitby
Landuse
Natural Areas
Agricultual
Existing Urban Development
Future (Official Plan) Urban Development
Airport Lands Development

City Of Pickering / TRCA 11 February 2013 2012 Duffins Creek Hydrology Update
Aquafor Beech Limited 14
The TRCA GIS database was again used to derive the hydrologic model parameters associated
with the future landuse scenarios listed above (i.e. CN values, percent impervious, etc.). It should
be noted that the City’s Neighborhood Plans were used for model parameterization within the
Seaton Lands. Model parameters associated with future landuses are provided in Appendix A.
Table 4.2 summarizes the percent imperviousness values assumed for future urban development.
Table 4.2
Summary of Parameters Applied to Future Urban Development Areas
Land Cover Percent
Impervious
CN*
A
Soils
B
Soils
C
Soils
D
Soils
Future Low Density Residential 60% 56 71 81 85
Future Medium Density Residential 70% 56 71 81 85
Future High Density Residential 80% 56 71 81 85
Future Employment/Industrial/Commercial 95% 56 71 81 85
With the exception of the twenty seven existing and ten approved stormwater management ponds
(Table 2.2), the future (Official Plan) and “future with airport” landuse scenarios were modelled
without any stormwater facilities in place to control increased runoff associated with the future
development areas. Table 4.1 compares the peak flows associated with these uncontrolled future
landuses scenarios to the baseline existing conditions. As shown, the largest peak flow increases
are expected where significant development is planned (Figure 4.4) within small tributaries. A
summary of the predicted impacts from uncontrolled development under the Future (Official
Plan) landuse scenario is provided below:
• Stouffville Creek (node 2.1) - minor peak flow increases of approximately 2% or less for
the 100-year flow and Regional Storm flow;
• Reesor Creek (node 4.1) - minor peak flow increases of approximately 1% or less for the
100-year flow and Regional Storm flow;

City Of Pickering / TRCA 11 February 2013 2012 Duffins Creek Hydrology Update
Aquafor Beech Limited 15
• West Duffins Creek south of Seventh Concession Road (node 8.1) – negligible changes
for both the 100-year flow and Regional Storm flow;
• Whitevale Creek above West Duffins Creek (node 11.3) – large increases of
approximately 400% for the 100-year flow and over 80% for Regional Storm flow;
• West Duffins Creek at Pickering (node 12.1) – minor decreases in both the 100-year
flow and Regional Storm flow;
• Mitchell Creek above East Duffins Creek (node 14.1) – minor increases of less than 5%
in both the 100-year flow and Regional Storm flow;
• Brougham Creek (node 20.0) - minor peak flow increase of less than 10% for the 100-
year flow and a minor decrease in the Regional Storm flow;
• East Duffins Creek south of Rossland Road (node 21.1) – negligible increase of less
than 1% for the 100-year flow and a minor decrease in the Regional Storm flow;
• Urfe Creek above East Duffins Creek south of Rossland Road (node 23.1) – significant
increases of approximately 80% for the 100-year flow and over 40% for Regional Storm
flow;
• Ganatsekiagon Creek above East Duffins Creek east of Brock Road (node 25.21) –
large increases of approximately 140% for the 100-year flow and almost 40% for
Regional Storm flow;
• Duffins Creek at Kingston Road (node 26.4) - minor decrease in both the 100-year flow
and the Regional Storm flow;
• Millers Creek above Duffins Creek, south of Hwy. 401 (node 27.0) - minor increase of
over 10% for the 100-year flow and over 5% for the Regional Storm flow;
• Duffins Creek at Ajax (node 28.1) - minor decrease in both the 100-year flow and the
Regional Storm flow;

City Of Pickering / TRCA 11 February 2013 2012 Duffins Creek Hydrology Update
Aquafor Beech Limited 16
5.0 SEATON LANDS STORMWATER MANAGEMENT CONTROLS
Following the assessment of the impacts of future urban development on Duffins Creek flood
flows, further modelling work was undertaken to develop a stormwater management mitigation
strategy. It is understood that stormwater controls will be necessary within many future urban
development areas to mitigate potential water quality, erosion and flooding impacts. In terms of
flood (quantity) control, it is assumed that stormwater ponds and/or other techniques will be used
to control runoff from future development such that the flood frequencies on the local and
downstream tributary reaches do not increase beyond acceptable levels.
This study focused on the establishment of flood control criteria for the Seaton Lands, where the
majority of the future urban development will take place (Figure 4.4). Development of
additional stormwater criteria for other proposed urban development (i.e. outside of the Seaton
Lands), will be investigated further by TRCA, under separate cover.
5.1 Regional Storm Control Assessment
Traditional flood control facilities are typically sized to prevent flow increases for the 2-year
through 100-year events. However, the impacts of the future landuse changes on the Regional
Storm flows were also investigated in order to determine whether a Regional Storm control
strategy or a downstream Flood Remediation Environmental Assessment was warranted to
address the downstream impacted associated with the development of the Seaton Lands.
As noted in Section 4.3, for the future landuse scenario, the only significant increases to the
Regional Storm flows were found on the smaller tributaries within the Seaton Lands, such as
Whitevale Creek, Urfe Creek, Ganatsekiagon Creek, as well as some of the small unnamed
tributaries of the West Branch. However, due to hydrograph timing, no significant increases are
predicted on the East or West Branches of Duffins Creek, or downstream of the Seaton Lands,
including the Main Branch reach through the Pickering and Ajax Special Policy Area (SPA),
which are known flood-susceptible areas. In, fact, minor decreases in Regional Storm flows are

City Of Pickering / TRCA 11 February 2013 2012 Duffins Creek Hydrology Update
Aquafor Beech Limited 17
predicted over this reach. From a hydrograph timing perspective the existing conditions model
represents the “worst case” scenario, as peak flows from tributary areas converge at the same
time as peak flows from main branch areas (i.e. East and West Duffins Creek). The convergence
of flows noted above dictates flows through the Pickering Ajax SPA.
The slight decrease in Regional Flows through the Pickering Ajax SPA was also observed as part
of the 2002 Hydrology Update, where a 4% decrease in Regional flows was observed.
From a Regional Storm perspective, it is understood that increases to Regional flows, though
local tributary areas, like the Whitevale, Ganatsekiagon, Urfe, and Brougham Creek represent a
benefit from a watershed perspective, as peak flows through the Pickering Ajax SPA are
reduced. It should be noted that the benefit of hydrograph timing through the SPA would not be
realized if stormwater management controls, for the Regional storm, were applied for the
purposes of addressing local increases for the sub-watersheds within the Seaton lands
(Whitevale, Ganatsekiagon, Urfe, and Brougham Creek).
The Regional Storm model results were reviewed with City and TRCA staff. Given that the
Regional Storm increases on the smaller local tributaries were expected to be contained within
the valley corridors of the natural heritage systems, and given that no increases in flows were
expected in the larger East, West, or Main Branches, it was concluded that a downstream Flood
Remediation Environmental Assessment, or additional stormwater management controls for the
Regional Storm are not required within the Seaton Lands.
5. 2 2-Year to 100-Year Controls
Further modelling was undertaken to estimate the necessary 2-year to 100-year flood control
requirements for the Seaton Lands. Reservoir routing was added to the 2012 hydrologic model
to simulate stormwater management controls in the proposed future urban development areas
within the Seaton Lands. This included development lands in the following tributary
catchments:
• Unnamed Tributaries No. 1, 2 and 3 to West Duffins Creek (catchments 32, 8 and 9);

City Of Pickering / TRCA 11 February 2013 2012 Duffins Creek Hydrology Update
Aquafor Beech Limited 18
• Whitevale Creek Main and East Branches (catchments 30 and 31);
• Ganatsekiagon Creek Main, West and East Branches (catchments 33, 34 and 35);
• Urfe Creek Upper Main, Upper West, Upper East, and Lower East Branches (catchments
37, 38, 39 and 40); and
• Brougham Creek (catchment 44).
With respect to those portions of the Seaton Lands which drain directly to the East or West
Branches of Duffins Creek, it was assumed that flood control facilities would not be required.
Review of the model results in Section 4.3 indicates that, even without any stormwater controls
in the future (Official Plan) scenario, the changes to the flood flows within these reaches are
negligible.
The updated hydrologic model was used to assess two alternative quantity control strategies over
the Seaton Lands:
• using the unit flow strategy defined previously in the 2002 study; and
• using updated unit flow criteria based on the pre-development unit flows from the current
2012 model results.
2002 Unit flow Strategy:
The 2002 Duffins Creek Hydrology Update Study developed a set of unit flow equations to
define pre-development release rate targets for stormwater facilities within future urban
development lands. The 2002 unit flow equations were developed for select catchments and
applied over other hydrologically-similar adjacent catchments.
This strategy was tested using the updated 2012 hydrologic model. Within each of the
catchments in the Seaton Lands, a single Standhyd command was used to simulate drainage from
the aggregate or “lumped” future urban development area. The applicable 2002 unit flow
equations were then used to define 2-year to 100-year target release rates for the model’s
reservoir routines, and sufficient storage was included in the routines to match these targets.

City Of Pickering / TRCA 11 February 2013 2012 Duffins Creek Hydrology Update
Aquafor Beech Limited 19
The model results using the 2002 unit flow strategy over the Seaton Lands are summarized in
Table 5.1. As shown, the large increases predicted for the 2-year through 100-year flood flows
due to uncontrolled development on Whitevale Creek, Urfe Creek, and Ganetsekiagon Creek are
significantly reduced using this strategy. However many of these flows still exceed the pre-
development flood flows associated with existing landuses by up to approximately 30%.
2012 Unit flow Strategy
This strategy developed new unit flow stormwater target criteria based on pre-development unit
flows from the updated 2012 model results.
The pre-development unit flow rates were determined from the rural components of the existing
landuse model for the catchments within the future Seaton Lands development. These unit flows
were used to set the 2-year through 100-year target release rates for the future landuse model’s
reservoir routines, and sufficient storage was included in the routines to match the targets.
Again, it was assumed that flood control facilities were not required for those lands draining
directly to the East or West Branch of Duffins Creek.
The model results using the 2012 unit flow strategy over the Seaton Lands are summarized in
Table 5.1. As shown, this strategy successfully mitigates the large flow increases that would
otherwise occur on Whitevale Creek, Urfe Creek, and Ganetsekiagon Creek. Further, the 2012
strategy is marginally better than the 2002 unit flow strategy at matching existing flow rates on
the West, East and downstream Main Branches.
A summary of the target criteria for stormwater facilities within the Seaton Lands is provided in
Table 5.2, including applicable catchments, target release rates and storage requirements.
It is understood that some small drainage diversion may be permitted to take place between
catchments, as development proceeds, in order to facilitate future road patterns and development
layouts. The following guidance is suggested for application of the stormwater management
strategy in the cases of such diversions:

Model Areal
Flow Node Location Catchment HYD Drainage Area Reduction Landuse Scenario Flood Control within Flood Control within other
Ref. No. (km2) Factor* Seaton Lands Future Development Lands 2 Yr 5 Yr 10 Yr 25 Yr 50 Yr 100 Yr
2.5 Stouffville Creek south of Bethesda Road 17 9916 Existing Landuses ‐ ‐ 1.2 2.1 2.8 3.7 4.4 5.2
Future (Official Plan) Landuses none none 1.2 2.1 2.8 3.7 4.5 5.2
Future (Official Plan) Landuses 2002 Unit Flows over Seaton Lands none 1.2 2.1 2.8 3.7 4.5 5.2
Future (Official Plan) Landuses 2012 Unit Flows over Seaton Lands none 1.2 2.1 2.8 3.7 4.5 5.2
2.4 Stouffville Creek south of Main Street 16 1608 Existing Landuses ‐ ‐ 4.1 5.8 7.1 8.9 10.2 12.5
Future (Official Plan) Landuses none none 4.4 6.2 7.6 9.4 10.9 13.2
Future (Official Plan) Landuses 2002 Unit Flows over Seaton Lands none 4.4 6.2 7.6 9.4 10.9 13.2Future (Official Plan) Landuses 2012 Unit Flows over Seaton Lands none 4.4 6.2 7.6 9.4 10.9 13.2
2.1 Stouffville Creek at Townline Road 14 1402 Existing Landuses ‐ ‐ 3.6 5.4 6.8 8.6 10.0 11.5
Future (Official Plan) Landuses none none 3.7 5.6 6.9 8.8 10.2 11.8
Future (Official Plan) Landuses 2002 Unit Flows over Seaton Lands none 3.7 5.6 6.9 8.8 10.2 11.8
Future (Official Plan) Landuses 2012 Unit Flows over Seaton Lands none 3.7 5.6 6.9 8.8 10.2 11.8
3.3 Reesor Creek at Bethesda Road 22 2207 Existing Landuses ‐ ‐ 2.1 3.4 4.3 5.5 6.5 7.5
Future (Official Plan) Landuses none none 2.1 3.4 4.3 5.5 6.5 7.5
Future (Official Plan) Landuses 2002 Unit Flows over Seaton Lands none 2.1 3.4 4.3 5.5 6.5 7.5
Future (Official Plan) Landuses 2012 Unit Flows over Seaton Lands none 2.1 3.4 4.3 5.5 6.5 7.5
3.2 Trib of Reesor Creek conflunce with Ressor Creek at Main Street 21 2101 Existing Landuses ‐ ‐ 0.8 1.4 1.7 2.2 2.6 3.0
Future (Official Plan) Landuses none none 0.8 1.4 1.7 2.2 2.6 3.0
Future (Official Plan) Landuses 2002 Unit Flows over Seaton Lands none 0.8 1.4 1.7 2.2 2.6 3.0
Future (Official Plan) Landuses 2012 Unit Flows over Seaton Lands none 0.8 1.4 1.7 2.2 2.6 3.0
3.1 Ressor Creek at Main Street 20 2006 Existing Landuses ‐ ‐ 2.8 4.3 5.3 6.6 7.7 8.8
Future (Official Plan) Landuses none none 2.7 4.2 5.3 6.6 7.7 8.8
Future (Official Plan) Landuses 2002 Unit Flows over Seaton Lands none 2.7 4.2 5.3 6.6 7.7 8.8
Future (Official Plan) Landuses 2012 Unit Flows over Seaton Lands none 2.7 4.2 5.3 6.6 7.7 8.8
3 Reesor Creek at Townline road 19 1902 Existing Landuses ‐ ‐ 4.5 6.8 8.4 10.5 12.3 14.2
Future (Official Plan) Landuses none none 4.4 6.8 8.4 10.5 12.3 14.2
Future (Official Plan) Landuses 2002 Unit Flows over Seaton Lands none 4.4 6.8 8.4 10.5 12.3 14.2
Future (Official Plan) Landuses 2012 Unit Flows over Seaton Lands none 4.4 6.8 8.4 10.5 12.3 14.2
4.2 Reesor Creek at 8th Conc. (Gauge HY999) 13 1302 Existing Landuses ‐ ‐ 8.7 13.2 16.4 20.7 24.2 27.9
Future (Official Plan) Landuses none none 8.8 13.3 16.5 20.8 24.3 28.0
Future (Official Plan) Landuses 2002 Unit Flows over Seaton Lands none 8.8 13.3 16.5 20.8 24.3 28.0
Future (Official Plan) Landuses 2012 Unit Flows over Seaton Lands none 8.8 13.3 16.5 20.8 24.3 28.0
4.1 Reesor Creek at Townline road/north of Green River 12 1202 Existing Landuses ‐ ‐ 9.5 14.6 18.3 23.0 26.8 30.9
Future (Official Plan) Landuses none none 9.6 14.8 18.4 23.1 26.9 31.1
Future (Official Plan) Landuses 2002 Unit Flows over Seaton Lands none 9.6 14.8 18.4 23.1 26.9 31.1
Future (Official Plan) Landuses 2012 Unit Flows over Seaton Lands none 9.6 14.8 18.4 23.1 26.9 31.1
5 West Duffins Creek north of Webb Road at Glasgow 28 2804 Existing Landuses ‐ ‐ 3.6 5.8 7.4 9.7 11.6 13.6
Future (Official Plan) Landuses none none 3.5 5.8 7.3 9.6 11.5 13.5
Future (Official Plan) Landuses 2002 Unit Flows over Seaton Lands none 3.5 5.8 7.3 9.6 11.5 13.5
Future (Official Plan) Landuses 2012 Unit Flows over Seaton Lands none 3.5 5.8 7.3 9.6 11.5 13.5
6.1 West Duffins Creek south of Ninth Concession Road 26 2604 Existing Landuses ‐ ‐ 4.4 7.2 9.2 12.0 14.3 16.8
Future (Official Plan) Landuses none none 4.4 7.2 9.1 12.0 14.2 16.7
Future (Official Plan) Landuses 2002 Unit Flows over Seaton Lands none 4.4 7.2 9.1 12.0 14.2 16.7
Future (Official Plan) Landuses 2012 Unit Flows over Seaton Lands none 4.4 7.2 9.1 12.0 14.2 16.7
7 Wixon Creek south of Ninth Concession Road 27 2701 Existing Landuses ‐ ‐ 1.6 2.5 3.1 4.0 4.8 5.5
Future (Official Plan) Landuses none none 1.6 2.5 3.1 4.0 4.8 5.5
Future (Official Plan) Landuses 2002 Unit Flows over Seaton Lands none 1.6 2.5 3.1 4.0 4.8 5.5
Future (Official Plan) Landuses 2012 Unit Flows over Seaton Lands none 1.6 2.5 3.1 4.0 4.8 5.5
8.1 West Duffins Creek South of Seventh Concession Road 25 2502 Existing Landuses ‐ ‐ 6.6 10.6 13.6 17.9 21.1 24.6
Future (Official Plan) Landuses none none 6.6 10.6 13.5 17.8 21.0 24.5
Future (Official Plan) Landuses 2002 Unit Flows over Seaton Lands none 6.6 10.6 13.5 17.8 21.0 24.5
Future (Official Plan) Landuses 2012 Unit Flows over Seaton Lands none 6.6 10.6 13.5 17.8 21.0 24.5
10.1 West Duffins Creek above confluence with Reesor Creek (Gauge HC038) 23 2302 Existing Landuses ‐ ‐ 9.1 14.6 18.5 24.2 28.3 33.0
Future (Official Plan) Landuses none none 9.1 14.5 18.4 24.1 28.2 32.9
Future (Official Plan) Landuses 2002 Unit Flows over Seaton Lands none 9.1 14.5 18.4 24.1 28.2 32.9
Future (Official Plan) Landuses 2012 Unit Flows over Seaton Lands none 9.1 14.5 18.4 24.1 28.2 32.9
11.2 Tributary of West Duffins Creek 11 1101 Existing Landuses ‐ ‐ 0.9 1.5 1.8 2.4 2.8 3.2
Future (Official Plan) Landuses none none 0.9 1.5 1.8 2.4 2.8 3.2
Future (Official Plan) Landuses 2002 Unit Flows over Seaton Lands none 0.9 1.5 1.8 2.4 2.8 3.2
Future (Official Plan) Landuses 2012 Unit Flows over Seaton Lands none 0.9 1.5 1.8 2.4 2.8 3.2
11.5 Whitevale Creek at Hwy 7 10 1004 Existing Landuses ‐ ‐ 19.2 30.5 38.4 49.8 58.3 67.5
Future (Official Plan) Landuses none none 19.2 30.6 38.4 49.7 58.3 67.5
Future (Official Plan) Landuses 2002 Unit Flows over Seaton Lands none 19.2 30.6 38.4 49.7 58.3 67.5
Future (Official Plan) Landuses 2012 Unit Flows over Seaton Lands none 19.2 30.6 38.4 49.7 58.3 67.5
Table 5.1:
Sumary of Estimated Design Flows for Various Stormwater Control Scenarios
Stormwater Management ScenarioPeak Flow Rate (m3/s)
5.5 100.0%
8.4 99.2%
13.9 98.2%
10.0 100.0%
2.5 100.0%
12.1 100.0%
18.6 97.1%
35.4 97.1%
39.9 95.4%
25.5 98.2%
31.2 97.1%
11.4 99.2%
46.8 94.8%
60.7 94.2%
4.3 100.0%
108.3 94.8%

Model Areal
Flow Node Location Catchment HYD Drainage Area Reduction Landuse Scenario Flood Control within Flood Control within other
Ref. No. (km2) Factor* Seaton Lands Future Development Lands 2 Yr 5 Yr 10 Yr 25 Yr 50 Yr 100 Yr
Table 5.1:
Sumary of Estimated Design Flows for Various Stormwater Control Scenarios
Stormwater Management ScenarioPeak Flow Rate (m3/s)
11.4 West Duffins Creek at Whitevale Road 7 704 Existing Landuses ‐ ‐ 20.3 32.4 40.7 52.6 61.6 71.2
Future (Official Plan) Landuses none none 20.1 32.1 40.1 51.7 60.6 70.1
Future (Official Plan) Landuses 2002 Unit Flows over Seaton Lands none 20.5 32.6 40.8 52.7 61.7 71.4
Future (Official Plan) Landuses 2012 Unit Flows over Seaton Lands none 20.5 32.6 40.8 52.7 61.7 71.4
11.3 Whitevale Creek above confluence with West Duffins Creek 30 3004 Existing Landuses ‐ ‐ 1.3 2.0 2.6 3.3 3.9 4.5
Future (Official Plan) Landuses none none 10.0 13.1 15.2 18.2 20.3 22.4
Future (Official Plan) Landuses 2002 Unit Flows over Seaton Lands none 1.3 2.3 3.0 3.9 4.5 5.2
Future (Official Plan) Landuses 2012 Unit Flows over Seaton Lands none 1.2 1.9 2.4 3.1 3.7 4.2
11.1 West Duffins Creek at Taunton Road/at Clarkes Hollow 6 604 Existing Landuses ‐ ‐ 20.9 33.6 41.9 54.2 63.6 73.6
Future (Official Plan) Landuses none none 20.6 33.1 41.3 53.3 62.5 72.3
Future (Official Plan) Landuses 2002 Unit Flows over Seaton Lands none 21.0 33.7 42.0 54.2 63.6 73.6
Future (Official Plan) Landuses 2012 Unit Flows over Seaton Lands none 21.0 33.7 42.0 54.2 63.6 73.6
11.6 Small Trib confluence with West Duffins Creek at Taunton Road West 32 3201 1.4 Existing Landuses ‐ ‐ 0.8 1.2 1.6 2.0 2.3 2.7
3203 1.4 Future (Official Plan) Landuses none none 3.4 4.5 5.3 6.2 7.0 7.7
0.7 Future (Official Plan) Landuses 2002 Unit Flows over Seaton Lands none 0.5 0.9 1.1 1.5 1.7 2.0
0.7 Future (Official Plan) Landuses 2012 Unit Flows over Seaton Lands none 0.7 1.1 1.4 1.8 2.1 2.4
12.2 West Duffins Creek at Valley Farm Road 5 508 Existing Landuses ‐ ‐ 22.2 36.4 44.8 57.5 67.3 77.6
Future (Official Plan) Landuses none none 21.4 35.2 43.0 55.0 64.4 74.3
Future (Official Plan) Landuses 2002 Unit Flows over Seaton Lands none 22.4 36.4 44.8 57.4 67.1 77.5
Future (Official Plan) Landuses 2012 Unit Flows over Seaton Lands none 22.4 36.3 44.7 57.3 67.0 77.1
12.1 West Duffins Creek at Pickering 4 414 Existing Landuses ‐ ‐ 22.3 36.5 45.0 57.7 67.4 77.7
Future (Official Plan) Landuses none none 21.4 35.3 43.1 55.1 64.4 74.3
Future (Official Plan) Landuses 2002 Unit Flows over Seaton Lands none 22.4 36.5 44.9 57.5 67.2 77.5
Future (Official Plan) Landuses 2012 Unit Flows over Seaton Lands none 22.4 36.5 44.8 57.4 67.0 77.1
13.1 East Trib of Michell Creek at Brock Road 49 4903 Existing Landuses ‐ ‐ 1.8 2.8 3.6 4.6 5.5 6.4
Future (Official Plan) Landuses none none 3.2 4.8 6.1 8.1 9.4 10.7
Future (Official Plan) Landuses 2002 Unit Flows over Seaton Lands none 3.2 4.8 6.1 8.1 9.4 10.7
Future (Official Plan) Landuses 2012 Unit Flows over Seaton Lands none 3.2 4.8 6.1 8.1 9.4 10.7
13 Michell Creek at Brock Road 48 111 Existing Landuses ‐ ‐ 5.2 8.2 10.4 13.3 15.7 18.1
Future (Official Plan) Landuses none none 5.3 8.3 10.5 13.4 15.7 18.2
Future (Official Plan) Landuses 2002 Unit Flows over Seaton Lands none 5.3 8.3 10.5 13.4 15.7 18.2
Future (Official Plan) Landuses 2012 Unit Flows over Seaton Lands none 5.3 8.3 10.5 13.4 15.7 18.2
14.1 Michell Creek above confluence with East Duffins Creek (Gauge HY047) 47 4704 Existing Landuses ‐ ‐ 7.2 11.5 14.5 18.8 22.1 25.6
Future (Official Plan) Landuses none none 7.8 12.3 15.4 19.8 23.2 26.8
Future (Official Plan) Landuses 2002 Unit Flows over Seaton Lands none 7.8 12.3 15.4 19.8 23.2 26.8
Future (Official Plan) Landuses 2012 Unit Flows over Seaton Lands none 7.8 12.3 15.4 19.8 23.2 26.8
19.2 East Duffins Creek at Claremont (Gauge HY023) 50 113 Existing Landuses ‐ ‐ 15.1 24.2 30.7 40.0 47.3 54.5
Future (Official Plan) Landuses none none 15.7 24.9 31.5 40.9 48.3 55.5
Future (Official Plan) Landuses 2002 Unit Flows over Seaton Lands none 15.7 24.9 31.5 40.9 48.3 55.5
Future (Official Plan) Landuses 2012 Unit Flows over Seaton Lands none 15.7 24.9 31.5 40.9 48.3 55.5
19.1 East Duffins Creek at Whitevale Road/above Brougham Creek 46 4604 Existing Landuses ‐ ‐ 15.0 24.6 31.1 40.6 48.0 55.7
Future (Official Plan) Landuses none none 15.6 25.3 31.9 41.5 48.9 56.8
Future (Official Plan) Landuses 2002 Unit Flows over Seaton Lands none 15.6 25.3 31.9 41.5 48.9 56.8
Future (Official Plan) Landuses 2012 Unit Flows over Seaton Lands none 15.6 25.3 31.9 41.5 48.9 56.8
20.1 Brougham Creek north of Whitevale Road 45 4501 5.6 Existing Landuses ‐ ‐ 1.9 3.0 3.8 4.9 5.8 6.7
5.4 Future (Official Plan) Landuses none none 1.8 2.9 3.7 4.8 5.7 6.6
5.4 Future (Official Plan) Landuses 2002 Unit Flows over Seaton Lands none 1.8 2.9 3.7 4.8 5.7 6.6
5.4 Future (Official Plan) Landuses 2012 Unit Flows over Seaton Lands none 1.8 2.9 3.7 4.8 5.7 6.6
20 Brougham Creek south of Whitevale Road (Gauge HY010) 44 4404 Existing Landuses ‐ ‐ 4.6 7.4 9.4 12.1 14.3 16.6
Future (Official Plan) Landuses none none 6.7 9.4 11.3 13.9 15.9 17.9
Future (Official Plan) Landuses 2002 Unit Flows over Seaton Lands none 4.8 7.8 9.9 12.9 15.1 17.5
Future (Official Plan) Landuses 2012 Unit Flows over Seaton Lands none 4.6 7.4 9.4 12.1 14.3 16.6
21.2 East Duffins Creek at Taunton Road (Gauge HC019) 43 4304 Existing Landuses ‐ ‐ 19.3 31.5 39.8 52.0 61.5 71.6
Future (Official Plan) Landuses none none 19.9 32.2 40.6 52.8 62.4 72.5
Future (Official Plan) Landuses 2002 Unit Flows over Seaton Lands none 20.2 32.7 41.2 53.6 63.4 73.6
Future (Official Plan) Landuses 2012 Unit Flows over Seaton Lands none 20.0 32.4 40.9 53.2 62.9 73.1
21.1 East Duffins Creek south of Rossland Road/above East Duffins Creek 42 4208 Existing Landuses ‐ ‐ 19.1 30.7 38.9 50.8 60.2 70.1
Future (Official Plan) Landuses none none 19.7 31.4 39.7 51.5 60.9 70.7
Future (Official Plan) Landuses 2002 Unit Flows over Seaton Lands none 19.8 31.7 40.1 52.1 61.6 71.6
Future (Official Plan) Landuses 2012 Unit Flows over Seaton Lands none 19.7 31.5 39.8 51.8 61.2 71.1
23.3 West Trib conflunce with Urfe Creek / South of Whitevale Road 38 3803 Existing Landuses ‐ ‐ 0.8 1.3 1.7 2.1 2.5 2.9
Future (Official Plan) Landuses none none 4.7 6.2 7.2 8.5 9.5 10.5
Future (Official Plan) Landuses 2002 Unit Flows over Seaton Lands none 1.0 1.7 2.2 2.9 3.4 3.9
Future (Official Plan) Landuses 2012 Unit Flows over Seaton Lands none 0.8 1.2 1.6 2.0 2.4 2.7
115.5 93.5%
5.5 100.0%
119.8 89.4%
100.0%
132.8 89.4%
134.6 89.4%
8.1 99.2%
16.9 97.1%
23.7 94.8%
61.9 97.1%
67.9 94.2%
100.0%
14.8 100.0%
86.3 89.4%
89.3 89.4%
3.4 100.0%

Model Areal
Flow Node Location Catchment HYD Drainage Area Reduction Landuse Scenario Flood Control within Flood Control within other
Ref. No. (km2) Factor* Seaton Lands Future Development Lands 2 Yr 5 Yr 10 Yr 25 Yr 50 Yr 100 Yr
Table 5.1:
Sumary of Estimated Design Flows for Various Stormwater Control Scenarios
Stormwater Management ScenarioPeak Flow Rate (m3/s)
23.2 East Trib conflunce with Urfe Creek / South of Whitevale Road 39 3903 Existing Landuses ‐ ‐ 0.7 1.0 1.3 1.7 2.0 2.3
Future (Official Plan) Landuses none none 2.3 3.1 3.6 4.3 4.8 5.4
Future (Official Plan) Landuses 2002 Unit Flows over Seaton Lands none 0.8 1.4 1.7 2.2 2.6 3.0
Future (Official Plan) Landuses 2012 Unit Flows over Seaton Lands none 0.7 1.1 1.4 1.8 2.1 2.4
23.1 Urfe Creek south of Rossland Road/above East Duffins Creek (Gauge HY065) 36 3608 15.0 Existing Landuses ‐ ‐ 3.1 4.9 6.2 8.1 9.5 11.0
14.9 Future (Official Plan) Landuses none none 8.6 11.5 13.4 16.0 18.0 20.1
14.9 Future (Official Plan) Landuses 2002 Unit Flows over Seaton Lands none 3.6 6.1 7.8 10.1 11.8 13.6
14.9 Future (Official Plan) Landuses 2012 Unit Flows over Seaton Lands none 2.9 4.6 5.9 7.6 9.0 10.3
25.3 West Trib of Ganatsekiagon / South of Whitevale Road 34 3403 Existing Landuses ‐ ‐ 1.0 1.6 2.1 2.7 3.1 3.6
Future (Official Plan) Landuses none none 6.7 8.8 10.3 12.1 13.8 15.2
Future (Official Plan) Landuses 2002 Unit Flows over Seaton Lands none 1.1 2.1 2.8 3.6 4.3 4.9
Future (Official Plan) Landuses 2012 Unit Flows over Seaton Lands none 0.9 1.5 1.9 2.5 2.9 3.3
25.4 East Trib of Ganatsekiagon / South of Whitevale Road 35 3503 Existing Landuses ‐ ‐ 1.0 1.5 1.9 2.5 3.0 3.4
Future (Official Plan) Landuses none none 6.9 9.1 10.5 12.6 14.1 15.6
Future (Official Plan) Landuses 2002 Unit Flows over Seaton Lands none 1.1 2.1 2.7 3.6 4.2 4.9
Future (Official Plan) Landuses 2012 Unit Flows over Seaton Lands none 0.9 1.5 1.9 2.4 2.8 3.2
25.2 Ganatsekiagon Creek east of Brock Road/above East Duffins Creek 33 3304 13.0 Existing Landuses ‐ ‐ 3.4 5.5 6.9 8.8 10.4 12.0
13.1 Future (Official Plan) Landuses none none 12.1 16.2 19.0 22.8 25.6 28.5
13.1 Future (Official Plan) Landuses 2002 Unit Flows over Seaton Lands none 3.7 6.6 8.4 10.9 12.8 14.7
13.1 Future (Official Plan) Landuses 2012 Unit Flows over Seaton Lands none 3.1 5.2 6.5 8.3 9.7 11.2
26.5 East Duffins Creek at Pickering 41 4112 Existing Landuses ‐ ‐ 24.7 39.3 49.8 64.9 76.8 89.4
Future (Official Plan) Landuses none none 24.7 38.7 48.7 63.2 74.6 86.7
Future (Official Plan) Landuses 2002 Unit Flows over Seaton Lands none 26.4 41.2 52.2 67.7 79.9 92.8
Future (Official Plan) Landuses 2012 Unit Flows over Seaton Lands none 25.1 39.9 50.4 65.3 77.1 89.5
26.4 Duffins Creek at Kingston Road 3 308 Existing Landuses ‐ ‐ 45.6 75.3 93.2 119.5 139.7 161.3
Future (Official Plan) Landuses none none 44.7 73.5 90.1 114.6 134.1 154.5
Future (Official Plan) Landuses 2002 Unit Flows over Seaton Lands none 47.4 76.9 94.9 121.1 141.3 162.9
Future (Official Plan) Landuses 2012 Unit Flows over Seaton Lands none 46.2 75.7 93.4 119.3 139.2 160.5
27.3 Miller Creek at Taunton Road East 56 5603 Existing Landuses ‐ ‐ 1.5 2.5 3.1 4.0 4.7 5.5
Future (Official Plan) Landuses none none 1.8 2.8 3.7 4.7 5.6 6.4
Future (Official Plan) Landuses 2002 Unit Flows over Seaton Lands none 1.8 2.8 3.7 4.7 5.6 6.4
Future (Official Plan) Landuses 2012 Unit Flows over Seaton Lands none 1.8 2.8 3.7 4.7 5.6 6.4
27.2 Millers Creek at Rossland Road East 55 5512 Existing Landuses ‐ ‐ 4.0 6.4 8.3 10.9 12.7 14.6
Future (Official Plan) Landuses none none 4.9 8.1 10.6 13.9 16.3 18.6
Future (Official Plan) Landuses 2002 Unit Flows over Seaton Lands none 4.9 8.1 10.6 13.9 16.3 18.6
Future (Official Plan) Landuses 2012 Unit Flows over Seaton Lands none 4.9 8.1 10.6 13.9 16.3 18.6
27.1 Millers Creek at Kingston Road 54 5420 Existing Landuses ‐ ‐ 7.1 12.5 16.0 21.6 26.9 31.7
Future (Official Plan) Landuses none none 8.9 15.0 19.5 26.1 32.1 37.6
Future (Official Plan) Landuses 2002 Unit Flows over Seaton Lands none 8.9 15.0 19.5 26.1 32.1 37.6
Future (Official Plan) Landuses 2012 Unit Flows over Seaton Lands none 8.9 15.0 19.5 26.1 32.1 37.6
27 Millers Creek south of Hwy 401/above Duffins Creek 53 5304 Existing Landuses ‐ ‐ 12.5 19.4 25.4 33.4 40.0 46.1
Future (Official Plan) Landuses none none 14.2 22.1 28.8 37.7 44.8 51.7
Future (Official Plan) Landuses 2002 Unit Flows over Seaton Lands none 14.2 22.1 28.8 37.7 44.8 51.7
Future (Official Plan) Landuses 2012 Unit Flows over Seaton Lands none 14.2 22.1 28.8 37.7 44.8 51.7
28.1 Duffins Creek at Ajax (Gauge HC049) 2 204 Existing Landuses ‐ ‐ 45.4 74.3 92.6 118.6 138.9 160.5
Future (Official Plan) Landuses none none 44.6 72.1 89.5 113.8 133.0 153.6
Future (Official Plan) Landuses 2002 Unit Flows over Seaton Lands none 47.2 76.1 94.2 120.2 140.4 161.9
Future (Official Plan) Landuses 2012 Unit Flows over Seaton Lands none 46.0 74.8 92.8 118.5 138.4 159.7
28 Duffins Creek at Lake Ontraio 1 14 Existing Landuses ‐ ‐ 34.9 58.5 73.8 97.9 115.6 135.0
Future (Official Plan) Landuses none none 37.8 61.9 76.7 99.5 117.0 135.6
Future (Official Plan) Landuses 2002 Unit Flows over Seaton Lands none 36.9 61.1 76.6 100.5 118.2 137.5
Future (Official Plan) Landuses 2012 Unit Flows over Seaton Lands none 36.0 60.0 75.3 98.8 116.4 135.5
* Areal Reduction Factor applied to Regional Storm
3.5 100.0%
97.1%
3.6 100.0%
3.4 100.0%
97.1%
119.5 89.4%
255.6 89.4%
4.6 100.0%
7.8 99.2%
12.7 98.2%
16.1 98.2%
258.0 86.7%
280.2 86.7%

* Note:
1. For proposed small drainage diversions between adjacent catchments which both require quantity control, the 2-year through 100-year release rates and storage targets for the receiving catchment should be applied.
2. For proposed small drainage diversions directly to the Duffins Creek West Branch, quantity control is not required.
3. For proposed small drainage diversions to small tributaries of the Duffins Creek West Branch, quantity control is required, and the 2-year through 100-year release rates and storage targets for the originating catchment should be applied.
Existing Pre-developmentRural Urban (rural) Area (ha) Area (ha) % Impervious (L/s/ha) (L/s/imp-ha) (m3/ha) (m3/imp-ha)
2-year 3.67 3.83 328 3425-year 5.89 6.16 417 435
10-year 7.45 7.78 470 49225-year 9.65 10.09 540 56450-year 11.37 11.88 589 616
100-year 13.19 13.79 639 6682-year 3.02 3.38 313 3515-year 4.80 5.39 404 453
10-year 6.05 6.78 456 51125-year 7.80 8.74 525 58850-year 9.16 10.26 575 645
100-year 10.59 11.87 626 7012-year 2.31 2.76 305 3635-year 3.70 4.41 392 467
10-year 4.68 5.57 447 53325-year 6.04 7.20 518 61850-year 7.11 8.47 571 680
100-year 8.24 9.82 623 7432-year 2.38 2.83 302 3595-year 3.80 4.51 391 464
10-year 4.80 5.70 445 52925-year 6.19 7.36 517 61550-year 7.27 8.64 569 676
100-year 8.42 10.00 620 7382-year 5.62 6.44 272 3115-year 8.84 10.13 349 400
10-year 11.10 12.72 393 45025-year 14.23 16.31 451 51750-year 16.63 19.07 494 566
100-year 19.17 21.97 536 6142-year 2.86 3.59 279 3495-year 4.64 5.82 362 453
10-year 5.91 7.40 412 51725-year 7.70 9.66 478 60050-year 9.12 11.43 526 660
100-year 10.62 13.32 573 7192-year 2.86 3.53 282 3495-year 4.56 5.63 367 454
10-year 5.76 7.11 419 51825-year 7.44 9.18 486 60050-year 8.74 10.79 535 660
100-year 10.11 12.49 584 7222-year 2.81 3.41 290 3515-year 4.51 5.46 375 454
10-year 5.71 6.91 428 51825-year 7.40 8.96 496 60050-year 8.72 10.55 545 660
100-year 10.12 12.24 593 718
TABLE 5.2:
Future Development AreaModel Catchment ID
Catchment No. Tributary Name
Seaton Lands - Stormwater Management Target Criteria*
8 West Duffins Creek Unnamed Tribuary No.2
801 804 156
305 311
91.0 96
9 West Duffins Creek Unnamed Tribuary No.3
901 904 237 65.5 89
106.7 8430 Whitevale Creek Main Branch
301
230
34
35
Ganatsekiagon Creek Main Branch
Ganatsekiagon Creek West Branch
Ganatsekiagon Creek East Branch
102.7 84
West Duffins Creek Unnamed Tribuary No.1
32
33 3301
3201 3202 141 68.5 87
3302 572 106.2 80
31 Whitevale Creek East Branch 3101 3104
3501 3505 335 149.3
Storm Event Unit Flow Release Rate Target Storage Requirements2012 Unit Flow Stormwater Management*
83
3301 3304 359 153.0 81

* Note:
1. For proposed small drainage diversions between adjacent catchments which both require quantity control, the 2-year through 100-year release rates and storage targets for the receiving catchment should be applied.
2. For proposed small drainage diversions directly to the Duffins Creek West Branch, quantity control is not required.
3. For proposed small drainage diversions to small tributaries of the Duffins Creek West Branch, quantity control is required, and the 2-year through 100-year release rates and storage targets for the originating catchment should be applied.
Existing Pre-developmentRural Urban (rural) Area (ha) Area (ha) % Impervious (L/s/ha) (L/s/imp-ha) (m3/ha) (m3/imp-ha)
TABLE 5.2:
Future Development AreaModel Catchment ID
Catchment No. Tributary Name
Seaton Lands - Stormwater Management Target Criteria*
Storm Event Unit Flow Release Rate Target Storage Requirements2012 Unit Flow Stormwater Management*
2-year 1.77 2.08 312 3675-year 2.87 3.38 404 475
10-year 3.66 4.30 461 54125-year 4.77 5.60 535 62850-year 5.64 6.62 588 691
100-year 6.56 7.71 642 7542-year 2.36 2.60 327 3615-year 3.79 4.18 421 464
10-year 4.80 5.29 479 52825-year 6.22 6.86 553 60950-year 7.33 8.08 606 668
100-year 8.50 9.37 660 7282-year 1.86 2.22 307 3675-year 2.99 3.56 399 476
10-year 3.78 4.51 457 54625-year 4.89 5.84 531 63450-year 5.76 6.88 585 698
100-year 6.68 7.97 639 7622-year 2.68 3.38 303 3835-year 4.37 5.51 372 470
10-year 5.58 7.03 425 53625-year 7.30 9.21 491 62050-year 8.66 10.92 541 682
100-year 10.12 12.76 590 7452-year 2.96 3.63 282 3455-year 4.78 5.86 364 446
10-year 6.07 7.44 415 50825-year 7.89 9.67 480 58850-year 9.32 11.43 528 646
100-year 10.84 13.29 575 705
Urfe Creek Upper East Branch
Urfe Creek Lower East Branch
38
39
40
37 Urfe Creek Upper Main Branch
Urfe Creek Upper West Branch
3701 3703 385 109.8 85
4001 4002 215 36.2 79
3901 3904 349 44.6 84
3801 3804 338 86.5 91
44 Brougham Creek 4401 4405 898 104.6 82

City Of Pickering / TRCA 11 February 2013 2012 Duffins Creek Hydrology Update
Aquafor Beech Limited 20
• for small drainage diversions between adjacent catchments which both require flood
control (i.e. those listed in Table 5.2), the 2-year through 100-year release rates and
storage targets for the receiving catchment should be applied, and should be based on the
existing conditions drainage area to that catchment.
• for small drainage diversions directly to the Duffins Creek West Branch, flood control is
not required.
• for small drainage diversions which discharge indirectly to the Duffins Creek West
Branch (i.e. via small tributaries or gullies), flood control is required, and the 2-year
through 100-year release rates and storage targets for the originating catchment should
be applied. The rates should be based on the existing conditions drainage area of the
receiving catchment.

City Of Pickering / TRCA 11 February 2013 2012 Duffins Creek Hydrology Update
Aquafor Beech Limited 21
6.0 SUMMARY AND CONCLUSIONS
1. A hydrologic model was setup for the Duffins Creek Watershed using the Visual
Otthymo model, version 2.4, with model parameters derived from TRCA’s GIS database.
The model was calibrated and verified based on a series of rainfall events which occurred
between 2000 and 2010.
2. Design flows for the 2-year to 100-year return periods and the Regional Storm were
estimated for three scenarios using landuse information from TRCA’s GIS database:
• Existing landuses;
• Future landuses as defined in municipal Official Plans; and
• Future Landuses with Airport which include a conservative assessment of the
development of the Airport Lands.
3. Based on the Future (Official Plan) landuse scenario, without stormwater management
controls, large increases in peak flows are anticipated where significant future
development is planned within smaller tributaries, including Whitevale, Urfe, and
Ganatsekiagon Creeks. Smaller increases are also anticipated within Stouffville, Reesor,
and Millers Creeks. Negligible changes are predicted for the major tributary reaches.
4. Based on the “Future Landuses with Airport” scenario, without stormwater management
controls, peak flow increases are expected at most locations throughout the watershed for
both the 100-year event and Regional Storm.
5. A stormwater control strategy using the unit flow relationships derived as part of the
2002 Hydrology Update Study for Duffins Creek was tested over the future development
areas within the Seaton Lands. This strategy was found to only partially mitigate the
increases in peak flows that would occur due to the urban development, with many flood

City Of Pickering / TRCA 11 February 2013 2012 Duffins Creek Hydrology Update
Aquafor Beech Limited 22
flows on Whitevale, Urfe, and Ganetsekiagon Creeks still exceeding the pre-development
rates by up to approximately 30%.
6. A second stormwater control strategy based on pre-development unit flow rates from the
updated 2012 model results was also tested over the future development areas within the
Seaton Lands. This strategy was found to successfully mitigate the large flow increases
that would otherwise occur on Whitevale, Urfe, and Ganetsekiagon Creeks. Further, the
2012 strategy is marginally better at matching existing flow rates on the West, East and
downstream Main Branches.

City Of Pickering / TRCA 11 February 2013 2012 Duffins Creek Hydrology Update
Aquafor Beech Limited 23
7.0 RECOMMENDATIONS
1. The hydrologic model should be further verified when rainfall and streamflow data
becomes available for future storm events which are larger than those used for the
calibration. In addition, TRCA should consider the placement of additional precipitation
and stream gauges, located at key locations within the watershed. Specifically, locations
such as Millers Creek, and sub watersheds within the Airport Lands should be
considered.
2. On a routine basis, the model should be updated by development proponents as future
development proceeds and future stormwater management facilities are constructed. The
Seaton development lands are expected to contain a significant number of ponds,
including multiple ponds in each catchment. In order to simplify the modelling
procedures, and maintain the same approach used to generate unit flow rates, the model is
to be updated by pond designers using a “lumped” approach to modelling for this
development area. These catchments generally contain three commands in VISUAL
OTTHYMO to model the hydrology: one Nashyd and two Standhyd commands. Of the
two Standhyd commands, one represents all drainage directed to ponds, and one
represents uncontrolled drainage.
As part of each development application, the three commands for each catchment are to
be updated based on the information collected as part of the detailed design for each pond
- no additional commands are required. In the event that a given catchment does not
currently have three commands assigned, the model may be updated to maintain the
format described above (1 for developed areas with ponds, 1 for developed areas without
ponds, 1 for undeveloped areas). The proponent must reassess the watershed hydrology
to ensure that no increases (both locally and/or globally) have occurred due to the
development.
At the functional servicing and draft plan stage, the proponent should complete the

City Of Pickering / TRCA 11 February 2013 2012 Duffins Creek Hydrology Update
Aquafor Beech Limited 24
modelling as described above based on the preliminary information available. The report
should outline the criteria for the pond and provide volumes to establish appropriate
block sizing at a conceptual level. The hydrology model is not to be formally updated
until the detailed design stage.
3. As part of the Future Official Plan landuse scenario, the following stormwater
management recommendations should be applied to future urban development within the
Seaton Lands:
• Post-to-pre flood control for the 2-year through 100-year events should be
implemented for drainage to the following tributaries:
o Unnamed Tributaries No. 1, 2 and 3 to West Duffins Creek (catchments 32, 8
and 9);
o Whitevale Creek Main and East Branches (catchments 30 and 31);
o Ganatsekiagon Creek Main, West and East Branches (catchments 33, 34 and
35);
o Urfe Creek Upper Main, Upper West, Upper East, and Lower East Branches
(catchments 37, 38, 39 and 40); and
o Brougham Creek (catchment 44).
• Future stormwater management facilities within the above catchments should be
designed using the unit release rates and storage targets summarized in Table 5.2.
• In the case of proposed future drainage diversions within the Seaton Lands:
o small diversions between adjacent catchments should be controlled using the
target criteria for the receiving catchment;
o for small diversions directly to the Duffins Creek West Branch, flood control
is not required;
o small diversions which drain indirectly to the Duffins Creek West Branch via
smaller tributaries or gullies will require flood control, and the targets for the
originating catchment should be applied.
• Flood control for the Regional Storm is not required within the Seaton Lands.

City Of Pickering / TRCA 11 February 2013 2012 Duffins Creek Hydrology Update
Aquafor Beech Limited 25
4. A further hydrology update should be considered, if and when the Airport Lands are
brought forward for development.
5. The 2012 Duffins Creek Hydrology Update Report has included reasonable assumptions
based on the best information available from current land use plans to delineate future
land use conditions. Any material deviations from the future land use conditions that
have been outlined in this report may be subject to a Flood Remediation Environmental
Assessment or Regional Control Analysis to be prepared to the satisfaction of the
affected Municipality and TRCA. Pre-consultation to determine the need for these
studies should be arranged with TRCA.
Respectfully submitted,
AQUAFOR BEECH LIMITED
Greg R. Frew, P.Eng.

City Of Pickering / TRCA 11 February 2013 2012 Duffins Creek Hydrology Update
Aquafor Beech Limited 26
REFERENCES Annable, W.K., 1996. Morphologic Relationships of Rural Watercourses in Southern Ontario and Selected Field Methods in Fluvial Geomorphology. Aquafor Engineering Limited. July, 1991. Duffins Creek Watershed Study, Phase 1: Hydrology. Final Report for Metropolitan Toronto and Region Conservation Authority. Aquafor Beech Limited. May, 2002. Duffins Creek Hydrology Update. Final Report for Toronto and Region Conservation Authority. Aquafor Beech Limited. November, 1997. Humber River Watershed Hydrology/Hydraulics and Stormwater Management Study. Final Report prepared for the Toronto and Region Conservation Authority. Bruce, J.P. and Clark, R.H., Introduction to Hydrometeorology. The Commonwealth and International Library of Science Technology Engineering and Liberal Studies. Cole Engineering Group September 27, 2011 Visual Otthymo Version 2.4 Users Guide.
Hogg, W.D. 1980. Time Distribution of Short Duration Rainfall in Canada. Proceedings of the Canadian Hydrology Symposium: 80, NRCC, Ottawa, Ontario. James F. MacLaren Limited. 1979. Hydrologic Model Study for the Humber, Don and Rouge Rivers, Highland, Duffin, Petticoat and Carruthers Creeks. Report prepared for the MTRCA. Linsley, R.K., and Kohler, M., and Paulhus, J.L. Hydrology for Engineers. 1982. Ontario Ministry of the Natural Resources. 1987. Flood Plain Management in Ontario: Technical Guidelines. Conservation Authorities and Water management Branch. Paul Wisner and Associates Inc. 1989. Interhymo/Otthymo 89 Users Manual. Ottawa, Ontario. Pugsley, W.I. (Ed.). 1981. Flood Hydrology Guide for Canada: Hydrometeorological Design Techniques. CL 13-81, AES, Environment Canada, Downsview, Ontario. Watt, W.E. and K.C.A. Chow. 1985. A General Expression for Basin Lag Time. Canadian Journal of Civil Engineering, 12(2): 294-300. Greater Toronto Airport Authority. November 2004. Pickering Airport Draft Plan Report. www.gtaa.com.
City Of Pickering / TRCA 11 February 2013 2012 Duffins Creek Hydrology Update
Aquafor Beech Limited
APPENDIX A:
Hydrologic Model Setup: Model Parameters, Channel Routing, Soils and Landuse Mapping

HWY 47
HWY 7
Regional Road 5
Bro ck Rd
York-Durham Line
Kingston Rd
HWY 401
HWY 407
HWY 48
B ro ck Rd
FD u f f i n s C r e e k W a t e r s h e dD u f f i n s C r e e k W a t e r s h e d
Whitchurch-Stouffville
Uxbridge
Ajax
Pickering
D U R H A M
Y O R K
Markham
Stouffville
Whitevale
Brougham
Claremont
Goodwood
Ajax
Pickering
Soi ls Mapping
Figure A.1 :Soils Mapping
0 2 4 6 81kms
River / Stream
Roads
Municipal Boundary
Watershed Boundary
SOILS (HSG)
A
B
C
D
Legend:
Nov 2012

HWY 47
HWY 7
Regional Road 5
Bro ck Rd
York-Durham Line
Kingston Rd
HWY 401
HWY 407
HWY 48
B ro ck Rd
FD u f f i n s C r e e k W a t e r s h e dD u f f i n s C r e e k W a t e r s h e d
Whitchurch-Stouffville
Uxbridge
Ajax
Pickering
D U R H A M
Y O R K
Markham
Stouffville
Whitevale
Brougham
Claremont
Goodwood
Ajax
Pickering
Exist ing Landuse
Figure A.2 :Existing Landuse
0 2 4 6 81kms
River / Stream
Roads
Municipal Boundary
Watershed Boundary
Legend:
Nov 2012
Landuse (Indicating Impervious Percentage)
1 (Natural Areas)
2 (Agricultural)
3 (Urban - Very Low)
4 (Urban - Average)
5 (Urban - High)
6 (Urban - Very High)

HWY 47
HWY 7
Regional Road 5
Bro ck Rd
York-Durham Line
Kingston Rd
HWY 401
HWY 407
HWY 48
B ro ck Rd
FD u f f i n s C r e e k W a t e r s h e dD u f f i n s C r e e k W a t e r s h e d
Whitchurch-Stouffville
Uxbridge
Ajax
Pickering
D U R H A M
Y O R KMarkham
Stouffville
Whitevale
Brougham
Claremont
Goodwood
Ajax
Pickering
Exist ing Land Cover
Figure A.3 :Existing Land Cover
0 2 4 6 81kms
River / Stream
Roads
Municipal Boundary
Watershed Boundary
Land Cover
Natural Areas
Agricultural
Urban
Legend:
Nov 2012

HWY 47
HWY 7
Regional Road 5
Bro ck Rd
York-Durham Line
Kingston Rd
HWY 401
HWY 407
HWY 48
B ro ck Rd
FD u f f i n s C r e e k W a t e r s h e dD u f f i n s C r e e k W a t e r s h e d
Whitchurch-Stouffville
Uxbridge
Ajax
Pickering
D U R H A M
Y O R K
Markham
Stouffville
Whitevale
Brougham
Claremont
Goodwood
Ajax
Pickering
Future Landuse
Figure A.4 :Future (Official Plan) Landuses
0 2 4 6 81kms
River / Stream
Roads
Municipal Boundary
Watershed Boundary
Legend:
Nov 2012
Landuse (Official Plan)
Natural Areas
Agricultual
Urban (Very Low)
Urban (Average)
Urban (High)
Urban (Very High)
Future - Low Density Residential
Future - Med Density Residential
Future - High Density Residential
Future - Institutional
Future - Employment/Industrial
Future - Commercial
Roads

HWY 47
HWY 7
Regional Road 5
Bro ck Rd
York-Durham Line
Kingston Rd
HWY 401
HWY 407
HWY 48
B ro ck Rd
FD u f f i n s C r e e k W a t e r s h e dD u f f i n s C r e e k W a t e r s h e d
Whitchurch-Stouffville
Uxbridge
Ajax
Pickering
D U R H A M
Y O R K
Markham
Stouffville
Whitevale
Brougham
Claremont
Goodwood
Ajax
Pickering
Future Land Cover
Figure A.5 :Future (Official Plans) Land Cover
0 2 4 6 81kms
River / Stream
Roads
Municipal Boundary
Watershed Boundary
Land Cover
Natural Areas
Agricultual
Urban
Legend:
Nov 2012

HWY 47
HWY 7
Regional Road 5
Bro ck Rd
York-Dur ham Line
Kingston Rd
HWY 401
HWY 407
HWY 48
B ro ck Rd
Taunton Rd
Rossland Rd
FD u f f i n s C r e e k W a t e r s h e dD u f f i n s C r e e k W a t e r s h e d
Whitchurch-Stouffville
Uxbridge
Ajax
Pickering
D U R H A MY O R K
Markham
Stouffville
Whitevale
Brougham
Claremont
Goodwood
Ajax
Pickering
Future Landuse(wi th Ai rport )
Figure A.6: Future Landuse with Airport
0 2 4 6 81kms
River / Stream
Roads
Municipal Boundary
Watershed Boundary
Legend:
Jan 2013
Whitby
Landuse
Natural Areas
Agricultual
Urban (Very Low)
Urban (Average)
Urban (High)
Urban (Very High)
New- Low Density Residential
New- Med Density Residential
New- High Density Residential
New- Institutional
New- Employment/Industrial
New- Commercial
Roads
Airport

HWY 47
HWY 7
Regional Road 5
Bro ck Rd
York-Dur ham Line
Kingston Rd
HWY 401
HWY 407
HWY 48
B ro ck Rd
Taunton Rd
Rossland Rd
FD u f f i n s C r e e k W a t e r s h e dD u f f i n s C r e e k W a t e r s h e d
Whitchurch-Stouffville
Uxbridge
Ajax
Pickering
D U R H A MY O R K
Markham
Stouffville
Whitevale
Brougham
Claremont
Goodwood
AjaxPickering
Future Land Cover(wi th Ai rport )
Figure A.7 :Future Land Cover with Airport
0 2 4 6 81kms
River / Stream
Roads
Municipal Boundary
Watershed Boundary
Legend:
Jan 2013
Whitby
Natural Areas
Agricultual
Urban
Airport Development
Land Cover

Landuse Scenario Subcatchment SWM Pond # Total Area Rural Area Area Slope IA Urban IA DPI % imp % Direct Manning's "n"Length Slope Unadjusted AMC II AMC III Rural base calibrated base calibrated Area Unadjusted AMC II AMC III pervious (IA imp) Connected Impervious Pervious Impervious Pervious
Catchment 1Existing 1 617.2 393.5 4.1% 3744.4 0.34% 71 71 86 5.0 3 1.5 2.04 2.04 223.7 80 80 91 5 2 75% 64% 1221 40 0.013 0.25
Future (Official Plan) 1 617.2 208.7 4.1% 3744.4 0.34% 73 73 87 5.0 3 1.5 2.04 2.04 223.7 80 80 91 5 2 75% 64% 1221 40 0.013 0.25184.7 81 92 5 2 81% 74% 1110 40 0.013 0.25
Ultimate (Airport) 1 617.2 208.7 4.1% 3744.4 0.34% 73 73 87 5.0 3 1.5 2.04 2.04 223.7 80 80 91 5 2 75% 64% 1221 40 0.013 0.25184.7 81 92 5 2 81% 74% 1110 40 0.013 0.25
Catchment 2Existing 2 236.1 59.1 3.8% 2364.5 0.61% 72 72 86 5.0 3 1.5 1.13 2.27 177.1 77 77 89 5 2 59% 45% 1087 40 0.013 0.25
Future (Official Plan) 2 236.1 33.1 3.8% 2364.5 0.61% 72 72 86 5.0 3 1.5 1.13 2.27 177.1 77 77 89 5 2 59% 45% 1087 40 0.013 0.2525.9 80 91 5 2 90% 86% 415 40 0.013 0.25
Ultimate (Airport) 2 236.1 33.1 3.8% 2364.5 0.61% 72 72 86 5.0 3 1.5 1.13 2.27 177.1 77 77 89 5 2 59% 45% 1087 40 0.013 0.2525.9 80 91 5 2 90% 86% 415 40 0.013 0.25
Catchment 3Existing 3 113.4 36.2 3.7% 1502.7 1.93% 69 69 84 5.0 3 1.5 0.50 1.00 77.0 79 79 91 5 2 44% 29% 717 40 0.013 0.25
93 43.3 43.3 79 79 91 5 2 40% 25% 537 40 0.013 0.25Future (Official Plan) 3 113.4 23.3 3.7% 1502.7 1.93% 66 66 82 5.0 3 1.5 0.50 1.00 77.0 79 79 91 5 2 44% 29% 717 40 0.013 0.25
93 43.3 43.3 79 91 5 2 40% 25% 537 40 0.013 0.2513.0 82 92 5 2 49% 34% 294 40 0.013 0.25
Ultimate (Airport) 3 113.4 23.3 3.7% 1502.7 1.93% 66 66 82 5.0 3 1.5 0.50 1.00 77.0 79 79 91 5 2 44% 29% 717 40 0.013 0.2593 43.3 43.3 79 91 5 2 40% 25% 537 40 0.013 0.25
13.0 82 92 5 2 49% 34% 294 40 0.013 0.25Catchment 4
Existing 4 118.8 62.3 4.9% 2281.4 1.78% 63 63 80 5.0 3 1.5 0.72 1.44 56.5 71 71 86 5 2 42% 27% 613 40 0.013 0.25103 5.3 5.3 71 71 86 5 2 40% 25% 188 40 0.013 0.25263 53.1 53.1 71 71 86 5 2 40% 25% 595 40 0.013 0.25
Future (Official Plan) 4 118.8 40.6 4.9% 2281.4 1.78% 64 64 81 5.0 3 1.5 0.72 1.44 56.5 71 71 86 5 2 42% 27% 613 40 0.013 0.25103 5.3 5.3 71 86 5 2 40% 25% 188 40 0.013 0.25263 53.1 53.1 71 86 5 2 40% 25% 595 40 0.013 0.25
21.8 71 86 5 2 66% 53% 381 40 0.013 0.25Ultimate (Airport) 4 118.8 40.6 4.9% 2281.4 1.78% 64 64 81 5.0 3 1.5 0.72 1.44 56.5 71 71 86 5 2 42% 27% 613 40 0.013 0.25
103 5.3 5.3 71 86 5 2 40% 25% 188 40 0.013 0.25263 53.1 53.1 71 86 5 2 40% 25% 595 40 0.013 0.25
21.8 71 86 5 2 66% 53% 381 40 0.013 0.25Catchment 5
Existing 5 573.1 573.3 8.9% 5636.2 1.45% 65 65 82 5.0 3 1.5 1.59 3.19263 35.2 35.2 71 71 86 5 2 40% 25% 484 40 0.013 0.25
Future (Official Plan) 5 573.1 484.9 8.9% 5636.2 1.45% 63 63 80 5.0 3 1.5 1.59 3.19 71263 35.2 35.2 71 86 5 2 40% 25% 484 40 0.013 0.25
88.2 71 86 5 2 79% 70% 767 40 0.013 0.25Ultimate (Airport) 5 573.1 484.9 8.9% 5636.2 1.45% 63 63 80 5.0 3 1.5 1.59 3.19 71
263 35.2 35.2 71 86 5 2 40% 25% 484 40 0.013 0.2588.2 71 86 5 2 79% 70% 767 40 0.013 0.25
Catchment 6Existing 6 431.9 424.8 6.1% 3549.6 1.76% 71 71 86 5.0 3 1.5 1.02 2.05 7.3 71 71 86 5 2 15% 6% 220 40 0.013 0.25
Future (Official Plan) 6 431.9 399.5 6.1% 3549.6 1.76% 70 70 85 5.0 3 1.5 1.02 2.05 7.3 72 71 86 5 2 15% 6% 220 40 0.013 0.2525.2 72 86 5 2 61% 47% 410 40 0.013 0.25
Ultimate (Airport) 6 431.9 399.5 6.1% 3549.6 1.76% 70 70 85 5.0 3 1.5 1.02 2.05 7.3 72 71 86 5 2 15% 6% 220 40 0.013 0.2525.2 72 86 5 2 61% 47% 410 40 0.013 0.25
Catchment 7Existing 7 314.1 291.4 6.2% 3386.9 1.28% 70 70 85 5.0 3 1.5 1.12 2.24 23.1 76 76 89 5 2 39% 24% 393 40 0.013 0.25
Future (Official Plan) 7 314.1 247.7 6.2% 3386.9 1.28% 72 72 86 5.0 3 1.5 1.12 2.24 23.1 75 76 89 5 2 39% 24% 393 40 0.013 0.2543.3 75 88 5 2 61% 48% 537 40 0.013 0.25
Ultimate (Airport) 7 314.1 247.7 6.2% 3386.9 1.28% 72 72 86 5.0 3 1.5 1.12 2.24 23.1 75 76 89 5 2 39% 24% 393 40 0.013 0.2543.9 75 88 5 2 60% 47% 541 40 0.013 0.25
Catchment 8Existing 8 162.8 156.2 4.6% 2482.3 2.16% 71 71 86 5.0 3 1.5 0.71 1.43 6.5 72 72 86 5 2 75% 65% 208 40 0.013 0.25
Future (Official Plan) 8 162.8 65.3 4.6% 2482.3 2.16% 69 69 84 5.0 3 1.5 0.71 1.43 6.5 71 72 86 5 2 75% 65% 208 40 0.013 0.2591.0 71 86 5 2 96% 94% 779 40 0.013 0.25
Ultimate (Airport) 8 162.8 34.0 4.6% 2482.3 2.16% 64 64 81 5.0 3 1.5 0.71 1.43 6.5 71 72 86 5 2 75% 65% 208 40 0.013 0.25122.3 71 86 5 2 96% 94% 903 40 0.013 0.25
Catchment 9Existing 9 239.0 237.3 3.9% 3183.4 1.40% 73 73 87 5.0 3 1.5 1.03 2.06 1.6 77 77 89 5 2 75% 65% 103 40 0.013 0.25
Future (Official Plan) 9 239.0 171.8 3.9% 3183.4 1.40% 70 70 85 5.0 3 1.5 1.03 2.06 1.6 72 77 89 5 2 75% 65% 103 40 0.013 0.2565.5 72 86 5 2 89% 84% 661 40 0.013 0.25
Ultimate (Airport) 9 239.0 66.1 3.9% 3183.4 1.40% 64 64 81 5.0 3 1.5 1.03 2.06 1.6 80 77 89 5 2 75% 65% 103 40 0.013 0.25171.3 72 86 5 2 93% 89% 1069 40 0.013 0.25
Catchment 10Existing 10 348.9 344.2 4.0% 3271.4 1.40% 75 75 88 5.0 3 1.5 1.05 2.10 4.8 85 85 94 5 2 15% 6% 179 40 0.013 0.25
Future (Official Plan) 10 348.9 342.6 4.0% 3271.4 1.40% 75 75 88 5.0 3 1.5 1.05 2.10 4.8 85 85 94 5 2 15% 6% 179 40 0.013 0.25
Table A.1 Model Setup
Rural Parameters Urban ParametersFlow Path Rural CN Nashyd "n" Time to Peak Urban CN Length

Landuse Scenario Subcatchment SWM Pond # Total Area Rural Area Area Slope IA Urban IA DPI % imp % Direct Manning's "n"Length Slope Unadjusted AMC II AMC III Rural base calibrated base calibrated Area Unadjusted AMC II AMC III pervious (IA imp) Connected Impervious Pervious Impervious Pervious
Table A.1 Model Setup
Rural Parameters Urban ParametersFlow Path Rural CN Nashyd "n" Time to Peak Urban CN Length
1.5 85 94 5 2 15% 6% 100 40 0.013 0.25Ultimate (Airport) 10 348.9 227.4 4.0% 3271.4 1.40% 75 72 86 5.0 3 1.5 1.05 2.10 4.8 80 85 94 5 2 15% 6% 179 40 0.013 0.25
116.7 79 91 5 2 91% 87% 882 40 0.013 0.25Catchment 11
Existing 11 431.0 431.0 3.2% 5281.2 1.00% 76 76 89 5.0 3 1.5 1.76 3.51Future (Official Plan) 11 431.0 431.0 3.2% 5281.2 1.00% 76 76 89 5.0 3 1.5 1.76 3.51Ultimate (Airport) 11 431.0 111.7 3.2% 5281.2 1.00% 70 70 85 5.0 3 1.5 1.76 3.51 77
319.4 77 89 5 2 95% 93% 1459 40 0.013 0.25Catchment 12
Existing 12 447.3 447.3 4.4% 4303.6 1.28% 72 72 86 5.0 3 1.5 1.35 2.71Future (Official Plan) 12 447.3 447.3 4.4% 4303.6 1.28% 73 73 87 5.0 3 1.5 1.35 2.71Ultimate (Airport) 12 447.3 79.3 4.4% 4303.6 1.28% 67 67 83 5.0 3 1.5 1.35 2.71 72
368.0 72 89 5 2 95% 93% 1566 40 0.013 0.25Catchment 13
Existing 13 289.3 289.3 2.8% 3405.5 1.20% 76 76 89 5.0 3 1.5 1.16 2.31Future (Official Plan) 13 289.3 289.3 2.8% 3405.5 1.20% 75 75 88 5.0 3 1.5 1.16 2.31Ultimate (Airport) 13 289.3 161.2 2.8% 3405.5 1.20% 69 69 84 5.0 3 1.5 1.16 2.31 77
128.1 77 89 5 2 95% 93% 924 40 0.013 0.25Catchment 14
Existing 14 269.4 269.7 3.6% 3430.0 1.13% 76 76 89 5.0 3 1.5 1.19 1.78Future (Official Plan) 14 269.4 269.7 3.6% 3430.0 1.13% 76 76 89 5.0 3 1.5 1.19 1.78Ultimate (Airport) 14 269.4 197.2 3.6% 3430.0 1.13% 69 69 84 5.0 3 1.5 1.19 1.78 82
72.2 82 92 5 2 95% 93% 694 40 0.013 0.25Catchment 15
Existing 15 55.5 55.5 4.0% 1563.9 2.07% 70 70 85 5.0 3 1.5 0.50 0.75228 36.3 36.3 71 71 86 5 2 40% 25% 492 40 0.013 0.25228 43.0 43.0 71 71 86 5 2 40% 25% 535 40 0.013 0.25
Future (Official Plan) 15 55.5 55.5 4.0% 1563.9 2.07% 70 70 85 5.0 3 1.5 0.50 0.75 71228 36.3 36.3 71 86 5 2 40% 25% 492 40 0.013 0.25228 43.0 43.0 71 86 5 2 40% 25% 535 40 0.013 0.25
Ultimate (Airport) 15 55.5 55.5 4.0% 1563.9 2.07% 70 70 85 5.0 3 1.5 0.50 0.75 71228 36.3 36.3 71 86 5 2 40% 25% 492 40 0.013 0.25228 43.0 43.0 71 86 5 2 40% 25% 535 40 0.013 0.25
Catchment 16Existing 16 222.5 53.9 2.8% 3256.4 1.19% 67 67 83 5.0 3 1.5 1.12 1.68 168.6 72 72 86 5 2 41% 27% 1060 40 0.013 0.25
185 5.8 5.8 72 72 86 5 2 35% 21% 197 40 0.013 0.25166 52.0 52.0 72 72 86 5 2 40% 25% 589 40 0.013 0.25
Future (Official Plan) 16 222.5 45.4 2.8% 3256.4 1.19% 65 65 82 5.0 3 1.5 1.12 1.68 168.6 72 72 86 5 2 41% 27% 1060 40 0.013 0.25185 5.8 5.8 72 86 5 2 35% 21% 197 40 0.013 0.25166 52.0 52.0 72 86 5 2 40% 25% 589 40 0.013 0.25
8.4 73 87 5 2 59% 46% 237 40 0.013 0.25Ultimate (Airport) 16 222.5 45.4 2.8% 3256.4 1.19% 65 65 82 5.0 3 1.5 1.12 1.68 168.6 72 72 86 5 2 41% 27% 1060 40 0.013 0.25
185 5.8 5.8 72 86 5 2 35% 21% 197 40 0.013 0.25166 52.0 52.0 72 86 5 2 40% 25% 589 40 0.013 0.25
8.4 73 87 5 2 59% 46% 237 40 0.013 0.25Catchment 17
Existing 17 510.3 505.6 4.3% 4600.8 1.99% 70 70 85 5.0 3 1.5 1.20 1.80 4.6 71 71 86 5 2 24% 12% 175 40 0.013 0.25228 44.5 44.5 71 71 86 5 2 40% 25% 545 40 0.013 0.25
Future (Official Plan) 17 510.3 499.1 4.3% 4600.8 1.99% 70 70 85 5.0 3 1.5 1.20 1.80 4.6 71 71 86 5 2 24% 12% 175 40 0.013 0.25228 44.5 44.5 71 86 5 2 40% 25% 545 40 0.013 0.25
6.6 71 86 5 2 75% 65% 209 40 0.013 0.25Ultimate (Airport) 17 510.3 499.1 4.3% 4600.8 1.99% 70 70 85 5.0 3 1.5 1.20 1.80 4.6 71 71 86 5 2 24% 12% 175 40 0.013 0.25
228 44.5 44.5 71 86 5 2 40% 25% 545 40 0.013 0.256.6 71 86 5 2 75% 65% 209 40 0.013 0.25
Catchment 18Existing 18 114.2 93.4 3.2% 1950.0 1.54% 73 73 87 5.0 3 1.5 0.67 1.34
0.0 20.8 3.4% 450.0 1.54% 73 73 87 5.0 3 1.5 0.21 0.42228 34.1 34.1 71 71 86 5 2 35% 21% 477 40 0.013 0.25
Future (Official Plan) 18 114.2 68.4 3.2% 1950.0 1.54% 74 74 88 5.0 3 1.5 0.67 1.34 7124.9 71 86 5 2 74% 63% 408 40 0.013 0.25
228 54.9 54.9 71 86 5 2 74% 63% 605 40 0.013 0.25Ultimate (Airport) 18 114.2 67.8 3.2% 1950.0 1.54% 68 68 84 5.0 3 1.5 0.67 1.34 71
25.6 71 86 5 2 75% 65% 408 40 0.013 0.25228 54.9 54.9 71 86 5 2 74% 63% 605 40 0.013 0.25
Catchment 19Existing 19 407.4 407.4 3.4% 5720.3 1.21% 75 75 88 5.0 3 1.5 1.73 2.60
Future (Official Plan) 19 407.4 407.4 3.4% 5720.3 1.21% 75 75 88 5.0 3 1.5 1.73 2.60Ultimate (Airport) 19 407.4 406.7 3.4% 5720.3 1.21% 71 71 86 5.0 3 1.5 1.73 2.60 71
0.7 71 86 5 2 95% 93% 69 40 0.013 0.25

Landuse Scenario Subcatchment SWM Pond # Total Area Rural Area Area Slope IA Urban IA DPI % imp % Direct Manning's "n"Length Slope Unadjusted AMC II AMC III Rural base calibrated base calibrated Area Unadjusted AMC II AMC III pervious (IA imp) Connected Impervious Pervious Impervious Pervious
Table A.1 Model Setup
Rural Parameters Urban ParametersFlow Path Rural CN Nashyd "n" Time to Peak Urban CN Length
Catchment 20Existing 20 213.2 148.9 3.5% 3039.4 1.27% 73 73 87 5.0 3 1.5 1.03 1.55 64.4 75 75 88 5 2 28% 15% 655 40 0.013 0.25
Future (Official Plan) 20 180.1 115.7 3.5% 3039.4 1.27% 73 73 87 5.0 3 1.5 1.03 1.55 64.4 76 75 88 5 2 28% 15% 655 40 0.013 0.25228 33.1 33.1 79 91 5 2 51% 36% 470 40 0.013 0.25
Ultimate (Airport) 20 180.1 115.7 3.5% 3039.4 1.27% 73 73 87 5.0 3 1.5 1.03 1.55 64.4 76 75 88 5 2 28% 15% 655 40 0.013 0.25228 33.1 33.1 79 91 5 2 51% 36% 470 40 0.013 0.25
Catchment 21Existing 21 245.8 245.7 4.0% 3512.4 1.31% 73 73 87 5.0 3 1.5 1.14 1.72
Future (Official Plan) 21 245.8 245.7 4.0% 3512.4 1.31% 73 73 87 5.0 3 1.5 1.14 1.72Ultimate (Airport) 21 245.8 245.7 4.0% 3512.4 1.31% 73 73 87 5.0 3 1.5 1.14 1.72
Catchment 22Existing 22 827.8 827.8 7.7% 5879.3 0.99% 69 69 84 5.0 3 1.5 1.92 2.88 71
295.0 36.0 36.0 71 71 86 5 2 50% 35% 490 40 0.013 0.25295.1 133.6 73.3 7.7% 5879.3 0.99% 69 69 84 5.0 3 1.5 1.92 2.88 60.3 71 71 86 5 2 50% 35% 634 40 0.013 0.25
Future (Official Plan) 22 827.8 827.8 7.7% 5879.3 0.99% 69 69 84 5.0 3 1.5 1.92 2.88 71295.0 36.0 36.0 71 86 5 2 50% 35% 490 40 0.013 0.25295.1 133.6 73.3 7.7% 5879.3 0.99% 69 69 84 5.0 3 1.5 1.92 2.88 60.3 71 86 5 2 50% 35% 634 40 0.013 0.25
Ultimate (Airport) 22 827.8 827.8 7.7% 5879.3 0.99% 69 69 84 5.0 3 1.5 1.92 2.88 71295.0 36.0 36.0 71 86 5 2 50% 35% 490 40 0.013 0.25295.1 133.6 73.3 7.7% 5879.3 0.99% 69 69 84 5.0 3 1.5 1.92 2.88 60.3 71 86 5 2 50% 35% 634 40 0.013 0.25
Catchment 23Existing 23 259.9 259.6 3.6% 4800.5 1.31% 74 74 88 5.0 3 1.5 1.46 2.92
Future (Official Plan) 23 259.9 259.8 3.6% 4800.5 1.31% 72 72 86 5.0 3 1.5 1.46 2.92Ultimate (Airport) 23 259.9 56.2 3.6% 4800.5 1.31% 67 67 83 5.0 3 1.5 1.46 2.92
203.7 71 86 5 2 95% 93% 1165 40 0.013 0.25Catchment 24
Existing 24 1122.2 1122.2 2.6% 7544.2 0.83% 80 80 91 5.0 3 1.5 2.50 5.01Future (Official Plan) 24 1122.2 1122.2 2.6% 7544.2 0.83% 80 80 91 5.0 3 1.5 2.50 5.01Ultimate (Airport) 24 1122.2 380.6 2.6% 7544.2 0.83% 76 76 89 5.0 3 1.5 2.50 5.01
741.6 79 91 5 2 95% 93% 2224 40 0.013 0.25Catchment 25
Existing 25 419.3 419.3 4.0% 4355.7 0.91% 73 73 87 5.0 3 1.5 1.56 3.12Future (Official Plan) 25 419.3 419.3 4.0% 4355.7 0.91% 74 74 88 5.0 3 1.5 1.56 3.12Ultimate (Airport) 25 419.3 100.4 4.0% 4355.7 0.91% 67 67 83 5.0 3 1.5 1.56 3.12
319.0 74 88 5 2 95% 93% 1458 40 0.013 0.25Catchment 26
Existing 26 572.4 566.2 4.9% 6612.1 1.36% 79 79 91 5.0 3 1.5 1.86 3.71 6.1 83 83 93 5 2 15% 6% 202 40 0.013 0.25Future (Official Plan) 26 572.4 566.3 4.9% 6612.1 1.36% 79 79 91 5.0 3 1.5 1.86 3.71 6.1 83 83 93 5 2 15% 6% 202 40 0.013 0.25Ultimate (Airport) 26 572.4 544.1 4.9% 6612.1 1.36% 75 75 88 5.0 3 1.5 1.86 3.71 6.1 83 83 93 5 2 15% 6% 202 40 0.013 0.25
22.1 76 89 5 2 95% 93% 384 40 0.013 0.25Catchment 27
Existing 27 1140.4 1140.4 6.6% 8325.8 1.10% 71 71 86 5.0 3 1.5 2.42 4.84Future (Official Plan) 27 1140.4 1140.4 6.6% 8325.8 1.10% 71 71 86 5.0 3 1.5 2.42 4.84Ultimate (Airport) 27 1140.4 1126.5 6.6% 8325.8 1.10% 69 69 84 5.0 3 1.5 2.42 4.84
13.9 75 88 5 2 95% 93% 305 40 0.013 0.25Catchment 28
Existing 28 965.5 957.5 9.1% 5282.1 1.46% 57 57 75 5.0 3 1.5 1.51 2.26 8.0 71 71 86 5 2 15% 6% 231 40 0.013 0.25Future (Official Plan) 28 965.5 957.5 9.1% 5282.1 1.46% 58 58 76 5.0 3 1.5 1.51 2.26 8.0 71 71 86 5 2 15% 6% 231 40 0.013 0.25Ultimate (Airport) 28 965.5 957.5 9.1% 5282.1 1.46% 58 58 76 5.0 3 1.5 1.51 2.26 8.0 71 71 86 5 2 15% 6% 231 40 0.013 0.25
Catchment 29Existing 29 1586.4 1576.1 7.5% 6619.2 0.79% 62 62 79 5.0 3 2 2.30 4.59 10.3 64 64 81 5 2 40% 25% 261 40 0.013 0.25
Future (Official Plan) 29 1561.9 1551.6 7.5% 6619.2 0.79% 62 62 79 5.0 3 2 2.30 4.59 10.3 60 64 81 0 0 40% 25% 261 40 0.013 0.251287 24.5 24.5 56 75 5 2 50% 35% 404 40 0.013 0.25
Ultimate (Airport) 29 1561.9 1551.6 7.5% 6619.2 0.79% 62 62 79 5.0 3 2 2.30 4.59 10.3 60 64 81 0 0 40% 25% 261 40 0.013 0.251287 24.5 24.5 56 75 5 2 50% 35% 404 40 0.013 0.25
Catchment 30Existing 30 315.5 311.2 4.8% 4928.6 1.83% 71 71 86 5.0 3 1.5 1.31 2.62 4.5 71 71 86 5 2 73% 62% 173 40 0.013 0.25
Future (Official Plan) 30 315.5 204.3 4.8% 4928.6 1.83% 64 64 81 5.0 3 1.5 1.31 2.62 4.5 71 71 86 5 2 73% 62% 173 40 0.013 0.25106.7 71 86 5 2 84% 77% 843 40 0.013 0.25
Ultimate (Airport) 30 315.5 157.6 4.8% 4928.6 1.83% 61 61 78 5.0 3 1.5 1.31 2.62 4.5 71 71 86 5 2 73% 62% 173 40 0.013 0.25153.4 71 86 5 2 87% 82% 1011 40 0.013 0.25
Catchment 31Existing 31 234.3 230.4 4.5% 4484.7 1.48% 72 72 86 5.0 3 1.5 1.32 2.64 3.6 72 72 86 5 2 75% 65% 156 40 0.013 0.25
Future (Official Plan) 31 234.3 128.0 4.5% 4484.7 1.48% 68 68 84 5.0 3 1.5 1.32 2.64 3.6 72 72 86 5 2 75% 65% 156 40 0.013 0.25102.7 71 86 5 2 84% 77% 827 40 0.013 0.25
Ultimate (Airport) 31 234.3 70.3 4.5% 4484.7 1.48% 64 64 81 5.0 3 1.5 1.32 2.64 3.6 72 72 86 5 2 75% 65% 156 40 0.013 0.25160.4 71 86 5 2 88% 83% 1034 40 0.013 0.25
Catchment 32Existing 32 140.8 140.8 4.2% 2058.7 3.17% 70 70 85 5.0 3 1.5 0.53 1.06

Landuse Scenario Subcatchment SWM Pond # Total Area Rural Area Area Slope IA Urban IA DPI % imp % Direct Manning's "n"Length Slope Unadjusted AMC II AMC III Rural base calibrated base calibrated Area Unadjusted AMC II AMC III pervious (IA imp) Connected Impervious Pervious Impervious Pervious
Table A.1 Model Setup
Rural Parameters Urban ParametersFlow Path Rural CN Nashyd "n" Time to Peak Urban CN Length
Future (Official Plan) 32 140.8 72.4 4.2% 2058.7 3.17% 68 68 79 5.0 3 1.5 0.53 1.06 7268.5 72 86 5 2 87% 81% 676 40 0.013 0.25
Ultimate (Airport) 32 140.8 72.4 4.2% 2058.7 3.17% 68 68 79 5.0 3 1.5 0.53 1.06 7268.5 72 86 5 2 87% 81% 676 40 0.013 0.25
Catchment 33Existing 33 602.0 542.2 7.3% 5180.5 2.18% 66 66 82 5.0 3 2 1.27 2.54
Future (Official Plan) 33 556.4 421.8 7.3% 5180.5 2.18% 62 62 79 5.0 3 2 1.27 2.54 29.9 71 68 84 5 2 40% 0% 0 0 0 0106.2 71 86 5 2 80% 71% 841 40 0.013 0.25
1288 28.2 28.2 71 86 5 2 80% 71% 841 40 0.013 0.251289 17.5 17.5 71 86 5 2 80% 71% 841 40 0.013 0.25
Ultimate (Airport) 33 556.4 421.8 7.3% 5180.5 2.18% 62 62 79 5.0 3 2 1.27 2.54 29.9 71 68 84 5 2 40% 0% 0 0 0 0106.2 71 86 5 2 80% 71% 841 40 0.013 0.25
1288 28.2 28.2 71 86 5 2 80% 71% 841 40 0.013 0.251289 17.5 17.5 71 86 5 2 80% 71% 841 40 0.013 0.25
Catchment 34Existing 34 360.2 358.8 3.8% 6234.7 1.59% 72 72 86 5.0 3 2 1.67 3.33 1.4 71 71 86 5 2 75% 65% 95 40 0.013 0.25
Future (Official Plan) 34 360.2 205.9 3.8% 6234.7 1.59% 67 67 83 5.0 3 2 1.67 3.33 1.4 71 71 86 5 2 75% 65% 95 40 0.013 0.25153.0 71 86 5 2 81% 73% 1010 40 0.013 0.25
Ultimate (Airport) 34 360.2 127.8 3.8% 6234.7 1.59% 62 62 79 5.0 3 2 1.67 3.33 1.4 71 71 86 5 2 75% 65% 95 40 0.013 0.25231.1 71 86 5 2 86% 79% 1241 40 0.013 0.25
Catchment 35Existing 35 341.8 335.4 5.0% 5940.8 1.72% 70 70 85 5.0 3 2 1.56 3.11 6.4 71 71 86 5 2 75% 65% 207 40 0.013 0.25
Future (Official Plan) 35 341.8 186.1 5.0% 5940.8 1.72% 66 66 82 5.0 3 2 1.56 3.11 6.4 71 71 86 5 2 75% 65% 207 40 0.013 0.25149.3 71 86 5 2 83% 75% 998 40 0.013 0.25
Ultimate (Airport) 35 341.8 129.0 5.0% 5940.8 1.72% 63 63 80 5.0 3 2 1.56 3.11 6.4 71 71 86 5 2 75% 65% 207 40 0.013 0.25206.3 71 86 5 2 86% 80% 1173 40 0.013 0.25
Catchment 36Existing 36 168.5 168.5 4.7% 2854.0 1.86% 68 68 84 5.0 3 1.5 0.85 1.69
320 12.0 12.0 60 60 78 5 2 19% 8% 283 40 0.013 0.25133 21.2 21.2 60 60 78 5 2 30% 16% 376 40 0.013 0.25
Future (Official Plan) 36 118.1 96.6 4.7% 2854.0 1.86% 62 62 79 5.0 3 1.5 0.85 1.69 69320 12.0 12.0 60 78 5 2 19% 8% 283 40 0.013 0.25133 21.2 21.2 60 78 5 2 30% 16% 376 40 0.013 0.25A9A 11.9 11.9 73 87 5 2 74% 63% 282 40 0.013 0.251291 38.5 38.5 73 87 5 2 74% 63% 507 40 0.013 0.25
Ultimate (Airport) 36 118.1 96.6 4.7% 2854.0 1.86% 62 62 79 5.0 3 1.5 0.85 1.69 69320 12.0 12.0 60 78 5 2 19% 8% 283 40 0.013 0.25133 21.2 21.2 60 78 5 2 30% 16% 376 40 0.013 0.25A9A 11.9 11.9 73 87 5 2 74% 63% 282 40 0.013 0.251291 38.5 38.5 73 87 5 2 74% 63% 507 40 0.013 0.25
Catchment 37Existing 37 385.0 385.0 5.9% 5521.3 1.74% 66 66 82 5.0 3 1.5 1.46 2.92
Future (Official Plan) 37 346.4 256.7 5.9% 5521.3 1.74% 62 62 79 5.0 3 1.5 1.46 2.92 67109.8 67 83 5 2 85% 79% 856 40 0.013 0.25
1290 38.6 38.6 67 83 5 2 85% 79% 282 40 0.013 0.25Ultimate (Airport) 37 346.4 256.7 5.9% 5521.3 1.74% 62 62 79 5.0 3 1.5 1.46 2.92 67
109.8 67 83 5 2 85% 79% 856 40 0.013 0.251290 38.6 38.6 67 83 5 2 85% 79% 282 40 0.013 0.25
Catchment 38Existing 38 343.9 337.7 5.0% 4827.4 2.09% 70 70 85 5.0 3 1.5 1.22 2.44 6.2 75 75 88 5 2 75% 65% 204 40 0.013 0.25
Future (Official Plan) 38 343.9 251.2 5.0% 4827.4 2.09% 67 67 83 5.0 3 1.5 1.22 2.44 6.2 72 75 88 5 2 75% 65% 204 40 0.013 0.25Ultimate (Airport) 38 343.9 145.3 5.0% 4827.4 2.09% 62 62 79 5.0 3 1.5 1.22 2.44 6.2 72 75 88 5 2 75% 65% 204 40 0.013 0.25
192.4 71 86 5 2 94% 91% 1133 40 0.013 0.25Catchment 39
Existing 39 350.5 349.4 4.8% 6458.0 1.82% 70 70 85 5.0 3 1.5 1.62 3.25 1.1 71 71 86 5 2 75% 65% 84 40 0.013 0.25Future (Official Plan) 39 350.5 304.8 4.8% 6458.0 1.82% 72 72 86 5.0 3 1.5 1.62 3.25 1.1 69 71 86 5 2 75% 65% 84 40 0.013 0.25
44.6 69 84 5 2 84% 77% 545 40 0.013 0.25Ultimate (Airport) 39 350.5 64.7 4.8% 6458.0 1.82% 63 63 80 5.0 3 1.5 1.62 3.25 1.1 69 71 86 5 2 75% 65% 84 40 0.013 0.25
284.7 71 86 5 2 94% 91% 1378 40 0.013 0.25Catchment 40
Existing 40 215.0 214.7 5.9% 2905.4 2.33% 64 64 81 5.0 3 1.5 0.78 1.57Future (Official Plan) 40 215.0 178.7 5.9% 2905.4 2.33% 65 65 82 5.0 3 1.5 0.78 1.57 75
36.2 75 88 5 2 79% 71% 492 40 0.013 0.25Ultimate (Airport) 40 215.0 178.7 5.9% 2905.4 2.33% 65 65 82 5.0 3 1.5 0.78 1.57 75
36.2 75 88 5 2 79% 71% 492 40 0.013 0.25Catchment 41
Existing 41 120.2 95.5 4.0% 2867.7 0.99% 64 64 81 5.0 3 2 1.09 2.18 24.7 80 80 91 5 2 41% 26% 406 40 0.013 0.2593 91.6 91.6 80 80 91 5 2 40% 25% 781 40 0.013 0.2593 9.7 9.7 80 80 91 5 2 40% 25% 254 40 0.013 0.25

Landuse Scenario Subcatchment SWM Pond # Total Area Rural Area Area Slope IA Urban IA DPI % imp % Direct Manning's "n"Length Slope Unadjusted AMC II AMC III Rural base calibrated base calibrated Area Unadjusted AMC II AMC III pervious (IA imp) Connected Impervious Pervious Impervious Pervious
Table A.1 Model Setup
Rural Parameters Urban ParametersFlow Path Rural CN Nashyd "n" Time to Peak Urban CN Length
Future (Official Plan) 41 120.2 68.9 4.0% 2867.7 0.99% 63 63 80 5.0 3 2 1.09 2.18 24.7 79 80 91 5 2 41% 26% 406 40 0.013 0.2593 91.6 91.6 80 91 5 2 40% 25% 781 40 0.013 0.2593 9.7 9.7 80 91 5 2 40% 25% 254 40 0.013 0.25
26.6 76 89 5 2 68% 55% 421 40 0.013 0.25Ultimate (Airport) 41 120.2 68.9 4.0% 2867.7 0.99% 63 63 80 5.0 3 2 1.09 2.18 24.7 79 80 91 5 2 41% 26% 406 40 0.013 0.25
93 91.6 91.6 80 91 5 2 40% 25% 781 40 0.013 0.2593 9.7 9.7 80 91 5 2 40% 25% 254 40 0.013 0.25
26.6 76 89 5 2 68% 55% 421 40 0.013 0.25Catchment 42
Existing 42 279.7 279.7 5.9% 3749.6 1.31% 72 72 86 5.0 3 2 1.20 2.4192 21.8 21.8 78 78 95 5 2 49% 34% 381 40 0.013 0.25
Future (Official Plan) 42 279.7 194.0 5.9% 3749.6 1.31% 69 69 84 5.0 3 2 1.20 2.41 7792 21.8 21.8 78 95 5 2 49% 34% 381 40 0.013 0.25
57.9 77 89 5 2 70% 59% 621 40 0.013 0.25A9B 15.6 15.6 77 89 5 2 70% 59% 322 40 0.013 0.25A9C 12.2 12.2 77 89 5 2 70% 59% 285 40 0.013 0.25
Ultimate (Airport) 42 279.7 194.0 5.9% 3749.6 1.31% 69 69 84 5.0 3 2 1.20 2.41 7792 21.8 21.8 78 95 5 2 49% 34% 381 40 0.013 0.25
57.9 77 89 5 2 70% 59% 621 40 0.013 0.25A9B 15.6 15.6 77 89 5 2 70% 59% 322 40 0.013 0.25A9C 12.2 12.2 77 89 5 2 70% 59% 285 40 0.013 0.25
Catchment 43Existing 43 355.4 344.7 8.2% 3256.7 1.76% 64 64 81 5.0 3 2 0.96 1.44 10.6 65 65 82 5 2 15% 6% 265 40 0.013 0.25
Future (Official Plan) 43 355.4 344.7 8.2% 3256.7 1.76% 67 67 83 5.0 3 2 0.96 1.44 10.6 69 69 82 5 2 15% 6% 265 40 0.013 0.25Ultimate (Airport) 43 355.4 344.7 8.2% 3256.7 1.76% 67 67 83 5.0 3 2 0.96 1.44 10.6 69 69 82 5 2 15% 6% 265 40 0.013 0.25
Catchment 44Existing 44 923.2 898.2 5.3% 7430.1 1.93% 68 68 84 5.0 3 2 1.77 2.66 25.0 71 71 86 5 2 29% 16% 408 40 0.013 0.25
Future (Official Plan) 44 923.2 793.6 5.3% 7430.1 1.93% 68 68 84 5.0 3 2 1.77 2.66 25.0 69 71 86 5 2 29% 16% 408 40 0.013 0.25104.6 68 84 5 2 82% 74% 835 40 0.013 0.25
Ultimate (Airport) 44 923.2 398.0 5.3% 7430.1 1.93% 62 62 79 5.0 3 2 1.77 2.66 25.0 69 71 86 5 2 29% 16% 408 40 0.013 0.25500.2 71 86 5 2 89% 84% 1826 40 0.013 0.25
Catchment 45Existing 45 555.6 555.6 6.1% 6901.0 1.79% 71 71 86 5.0 3 2 1.72 2.58
Future (Official Plan) 45 555.6 543.8 6.1% 6901.0 1.79% 71 71 86 5.0 3 2 1.72 2.58 7211.8 72 86 5 2 95% 93% 280 40 0.013 0.25
Ultimate (Airport) 45 555.6 484.7 6.1% 6901.0 1.79% 70 70 85 5.0 3 2 1.72 2.58 7270.9 71 86 5 2 95% 93% 687 40 0.013 0.25
Catchment 46Existing 46 603.8 569.8 7.0% 5600.0 1.32% 66 66 82 5.0 3 2 1.65 2.47 34.1 70 70 85 5 2 15% 6% 477 40 0.013 0.25
Future (Official Plan) 46 603.8 506.5 7.0% 5600.0 1.32% 67 67 83 5.0 3 2 1.65 2.47 34.1 72 70 85 5 2 15% 6% 477 40 0.013 0.2563.3 73 87 5 2 34% 20% 649 40 0.013 0.25
Ultimate (Airport) 46 603.8 506.5 7.0% 5600.0 1.32% 67 67 83 5.0 3 2 1.65 2.47 34.1 72 70 85 5 2 15% 6% 477 40 0.013 0.2563.3 73 87 5 2 34% 20% 649 40 0.013 0.25
Catchment 47Existing 47 680.3 641.3 6.7% 5849.9 2.15% 69 69 84 5.0 3 2 1.41 2.12 39.0 72 72 86 5 2 40% 25% 510 40 0.013 0.25
Future (Official Plan) 47 680.3 629.0 6.7% 5849.9 2.15% 73 73 87 5.0 3 2 1.41 2.12 39.0 73 72 86 5 2 40% 25% 510 40 0.013 0.2512.3 74 88 5 2 12% 4% 286 40 0.013 0.25
Ultimate (Airport) 47 680.3 434.2 6.7% 5849.9 2.15% 72 72 86 5.0 3 2 1.41 2.12 39.0 73 72 86 5 2 40% 25% 510 40 0.013 0.25207.1 71 86 5 2 82% 74% 1175 40 0.013 0.25
Catchment 48Existing 48 878.1 877.6 4.3% 6579.9 1.46% 76 76 89 5.0 3 2 1.80 2.70 0.5 85 0 0 5 2 15% 6% 60 40 0.013 0.25
Future (Official Plan) 48 878.1 877.6 4.3% 6579.9 1.46% 76 76 89 5.0 3 2 1.80 2.70Ultimate (Airport) 48 878.1 706.1 4.3% 6579.9 1.46% 74 74 88 5.0 3 2 1.80 2.70
171.5 74 88 5 2 95% 92% 1069 40 0.013 0.25Catchment 49
Existing 49 810.1 734.6 7.3% 7831.5 1.54% 61 61 78 5.0 3 2 2.02 3.03 75.4 72 72 86 5 2 27% 14% 709 40 0.013 0.25Future (Official Plan) 49 810.1 673.1 7.3% 7831.5 1.54% 61 61 78 5.0 3 2 2.02 3.03 75.4 73 72 86 5 2 27% 14% 709 40 0.013 0.25
61.5 74 88 5 2 48% 33% 640 40 0.013 0.25Ultimate (Airport) 49 810.1 663.2 7.3% 7831.5 1.54% 61 61 78 5.0 3 2 2.02 3.03 75.4 73 72 86 5 2 27% 14% 709 40 0.013 0.25
71.5 74 88 5 2 57% 43% 690 40 0.013 0.25Catchment 50
Existing 50 511.3 511.3 7.7% 4399.3 2.60% 69 69 84 5.0 3 2 1.04 1.56Future (Official Plan) 50 511.3 511.3 7.7% 4399.3 2.60% 70 70 85 5.0 3 2 1.04 1.56Ultimate (Airport) 50 511.3 511.3 7.7% 4399.3 2.60% 70 70 85 5.0 3 2 1.04 1.56
Catchment 51Existing 51 719.5 716.0 8.8% 6549.3 2.53% 64 64 81 5.0 3 2 1.44 2.88 3.5 71 71 86 5 2 15% 6% 153 40 0.013 0.25
Future (Official Plan) 51 719.5 697.3 8.8% 6549.3 2.53% 64 64 81 5.0 3 2 1.44 2.88 3.5 72 71 86 5 2 15% 6% 153 40 0.013 0.2518.7 72 86 5 2 39% 24% 353 40 0.013 0.25
Ultimate (Airport) 51 719.5 697.3 8.8% 6549.3 2.53% 64 64 81 5.0 3 2 1.44 2.88 3.5 72 71 86 5 2 15% 6% 153 40 0.013 0.25

Landuse Scenario Subcatchment SWM Pond # Total Area Rural Area Area Slope IA Urban IA DPI % imp % Direct Manning's "n"Length Slope Unadjusted AMC II AMC III Rural base calibrated base calibrated Area Unadjusted AMC II AMC III pervious (IA imp) Connected Impervious Pervious Impervious Pervious
Table A.1 Model Setup
Rural Parameters Urban ParametersFlow Path Rural CN Nashyd "n" Time to Peak Urban CN Length
18.7 72 86 5 2 39% 24% 353 40 0.013 0.25Catchment 52
Existing 52 2589.2 2589.2 11.7% 9529.7 1.96% 65 65 82 5.0 3 2 2.14 4.29Future (Official Plan) 52 2589.2 2572.8 11.7% 9529.7 1.96% 65 65 82 5.0 3 2 2.14 4.29
16.3 75 88 5 2 15% 6% 330 40 0.013 0.25Ultimate (Airport) 52 2589.2 2572.8 11.7% 9529.7 1.96% 65 65 82 5.0 3 2 2.14 4.29
16.3 75 88 5 2 15% 6% 330 40 0.013 0.25Catchment 53
Existing 53 334.0 28.4 4.0% 2869.6 1.24% 70 70 85 5.0 3 1.5 1.00 1.00 306.1 79 79 89 5 2 51% 36% 1429 40 0.013 0.25Future (Official Plan) 53 334.0 18.3 4.0% 2869.6 1.24% 70 70 85 5.0 3 1.5 1.00 1.00 306.1 79 79 89 5 2 51% 36% 1429 40 0.013 0.25
9.6 80 91 5 2 92% 88% 253 40 0.013 0.25Ultimate (Airport) 53 334.0 18.3 4.0% 2869.6 1.24% 70 70 85 5.0 3 1.5 1.00 1.00 306.1 79 79 89 5 2 51% 36% 1429 40 0.013 0.25
9.6 80 91 5 2 92% 88% 253 40 0.013 0.25Catchment 54
Existing 54 234.0 87.8 3.8% 3873.9 0.68% 69 69 84 5.0 3 1.5 1.60 1.60 146.3 77 77 89 5 2 42% 27% 987 40 0.013 0.25167 39.6 39.6 77 77 89 5 2 40% 25% 514 40 0.013 0.25207 49.2 49.2 77 77 89 5 2 60% 46% 573 40 0.013 0.25207 64.9 64.9 77 77 89 5 2 53% 39% 658 40 0.013 0.25279 69.0 69.0 77 77 89 5 2 42% 27% 678 40 0.013 0.25279 24.3 24.3 77 77 89 5 2 44% 29% 402 40 0.013 0.25279 10.0 10.0 77 77 89 5 2 65% 52% 258 40 0.013 0.25
Future (Official Plan) 54 234.0 39.3 3.8% 3873.9 0.68% 68 68 84 5.0 3 1.5 1.60 1.60 146.3 77 77 89 5 2 42% 27% 987 40 0.013 0.25167 39.6 39.6 77 89 5 2 40% 25% 514 40 0.013 0.25207 49.2 49.2 77 89 5 2 60% 46% 573 40 0.013 0.25207 64.9 64.9 77 89 5 2 53% 39% 658 40 0.013 0.25279 69.0 69.0 77 89 5 2 42% 27% 678 40 0.013 0.25279 24.3 24.3 77 89 5 2 44% 29% 402 40 0.013 0.25279 10.0 10.0 77 89 5 2 65% 52% 258 40 0.013 0.25
48.4 74 88 5 2 2248% 1066% 568 40 0.013 0.25Ultimate (Airport) 54 234.0 39.3 3.8% 3873.9 0.68% 68 68 84 5.0 3 1.5 1.60 1.60 146.3 77 77 89 5 2 42% 27% 987 40 0.013 0.25
167 39.6 39.6 77 89 5 2 40% 25% 514 40 0.013 0.25207 49.2 49.2 77 89 5 2 60% 46% 573 40 0.013 0.25207 64.9 64.9 77 89 5 2 53% 39% 658 40 0.013 0.25279 69.0 69.0 77 89 5 2 42% 27% 678 40 0.013 0.25279 24.3 24.3 77 89 5 2 44% 29% 402 40 0.013 0.25279 10.0 10.0 77 89 5 2 65% 52% 258 40 0.013 0.25
48.4 74 88 5 2 22% 11% 568 40 0.013 0.25Catchment 55
Existing 55 163.0 107.4 3.9% 2583.9 1.01% 67 67 83 5.0 3 1.5 0.99 0.99 55.1 72 72 86 5 2 41% 26% 606 40 0.013 0.25184 70.1 70.1 72 72 86 5 2 41% 26% 684 40 0.013 0.25
1271 6.1 6.1 72 72 86 5 2 76% 66% 201 40 0.013 0.25207 64.4 64.4 72 72 86 5 2 64% 51% 655 40 0.013 0.25279 16.3 16.3 72 72 86 5 2 41% 26% 330 40 0.013 0.25
Future (Official Plan) 55 156.4 45.8 3.9% 2583.9 1.01% 67 67 83 5.0 3 1.5 0.99 0.99 55.1 72 72 86 5 2 41% 26% 606 40 0.013 0.25184 70.1 70.1 72 86 5 2 41% 26% 684 40 0.013 0.25
1271 6.1 6.1 72 86 5 2 76% 66% 201 40 0.013 0.25207 64.4 64.4 72 86 5 2 64% 51% 655 40 0.013 0.25279 16.3 16.3 72 86 5 2 41% 26% 330 40 0.013 0.25
55.6 72 86 5 2 45% 30% 609 40 0.013 0.251273 6.6 6.6 72 86 5 2 45% 30% 210 40 0.013 0.25
Ultimate (Airport) 55 156.4 45.8 3.9% 2583.9 1.01% 67 67 83 5.0 3 1.5 0.99 0.99 55.1 72 72 86 5 2 41% 26% 606 40 0.013 0.25184 70.1 70.1 72 86 5 2 41% 26% 684 40 0.013 0.25
1271 6.1 6.1 72 86 5 2 76% 66% 201 40 0.013 0.25207 64.4 64.4 72 86 5 2 64% 51% 655 40 0.013 0.25279 16.3 16.3 72 86 5 2 41% 26% 330 40 0.013 0.25
55.6 72 86 5 2 45% 30% 609 40 0.013 0.251273 6.6 6.6 72 86 5 2 45% 30% 210 40 0.013 0.25
Catchment 56Existing 56 460.5 421.1 3.8% 4539.5 1.47% 64 64 81 5.0 3 1.5 1.34 1.34 39.4 71.3 71 86 5 2 29% 15% 513 40 0.013 0.25
Future (Official Plan) 56 460.475 413.06625 3.8% 4539.5 1.47% 67 67 83 5 3 1.5 1.34 1.34 39.4 71.4 71 86 5 2 41% 26% 513 40 0.013 0.258.0 72 86 5 2 41% 26% 231 40 0.013 0.25
Ultimate (Airport) 56 460.475 413.06625 3.8% 4539.5 1.47% 67 67 83 5 3 1.5 1.34 1.34 39.4 71.4 71 86 5 2 41% 26% 513 40 0.013 0.258.0 72 86 5 2 41% 26% 231 40 0.013 0.25

Stream Stream
Catchment Length Slope
(m) (%) channel overbank channel overbank Catchment River/Reach Cross‐section
1 5,892 0.02% 0.035 0.080 0.050 0.080 28 River 1/Reach 1 28.13
2 1,329 0.14% 0.035 0.080 0.050 0.080 26 Duffins Ck/Reach 2 26.19
3 1,007 0.20% 0.035 0.080 0.050 0.080 26 Duffins Ck/Reach 2 26.27
4 1,672 0.42% 0.035 0.080 0.050 0.080 12 River 1/Reach 1 12.09
5 7,918 0.64% 0.035 0.080 0.050 0.080 12 River 1/Reach 1 12.27
6 4,198 0.60% 0.035 0.080 0.050 0.080 11 River 1/Reach 1 11.12
7 3,362 0.45% 0.035 0.080 0.050 0.080 11 River 1/Reach 1 11.39
10 3,294 0.34% 0.035 0.080 0.050 0.080 11 River 1/Reach 1 11.54
12 4,549 0.72% 0.035 0.080 0.050 0.080 4 Reesor Creek/Reach 1 4.18
13 1,832 0.49% 0.035 0.080 0.050 0.080 4 Reesor Creek/Reach 1 4.4
14 4,079 0.35% 0.035 0.080 0.050 0.080 2 Stouffiville Creek/Reach 1 2.09
15 1,351 0.67% 0.035 0.080 0.050 0.080 2 Stouffiville Creek/Reach 1 2.3
16 1,828 0.84% 0.035 0.080 0.050 0.080 2 Stouffiville Creek/Reach 1 2.441
19 5,015 0.74% 0.035 0.080 0.050 0.080 3 Reesor Creek/Reach 1 3.04
20 2,916 0.79% 0.035 0.080 0.050 0.080 3 Reesor Creek/Reach 1 3.04
23 1,653 0.73% 0.035 0.080 0.050 0.080 10 West Duffins Creek/Reach 1 10.09
25 5,592 0.42% 0.035 0.080 0.050 0.080 8 West Duffins Creek/Reach 1 8.11
26 6,859 0.81% 0.035 0.080 0.050 0.080 6 West Duffins Creek/Reach 1 6.52
28 3,981 0.49% 0.035 0.080 0.050 0.080 5 West Duffins Creek/Reach 1 5.03
33 6,203 1.03% 0.035 0.080 0.050 0.080 25 River 1/Reach 1 25.29
36 2,409 0.69% 0.035 0.080 0.050 0.080 23 River 1/Reach 1 23.11
37 3,844 1.12% 0.035 0.080 0.050 0.080 23 River 1/Reach 1 23.26
41 2,838 0.29% 0.035 0.080 0.050 0.080 21 River 1/Reach 1 21.11
42 4,329 0.35% 0.035 0.080 0.050 0.080 21 River 1/Reach 1 21.2
43 3,526 0.38% 0.035 0.080 0.050 0.080 21‐1 River 1/Reach 1 21.58
46 7,078 0.49% 0.035 0.080 0.050 0.080 19 River 1/Reach 1 19.11
47 5,183 1.30% 0.035 0.080 0.050 0.080 14 East Duffins Creek/Mitchell Creek 14.35
50 2,650 0.95% 0.035 0.080 0.050 0.080 18 East Duffins Creek/Reach 2 18.06
53 2,590 0.67% 0.035 0.080 0.050 0.080 27 Millers Creek/Reach 1 27.18
54 2,588 0.22% 0.035 0.080 0.050 0.080 27 Millers Creek/Reach 1 27.39
55 2,469 0.37% 0.035 0.080 0.050 0.080 27 Miller Creek/Reach 1 27.65
HEC‐RAS model reference used for typical X‐Section
Table A.2 ‐ Model Setup: Channel Routing
Channel Routing
"base" Calibrated
Manning's n Manning's n
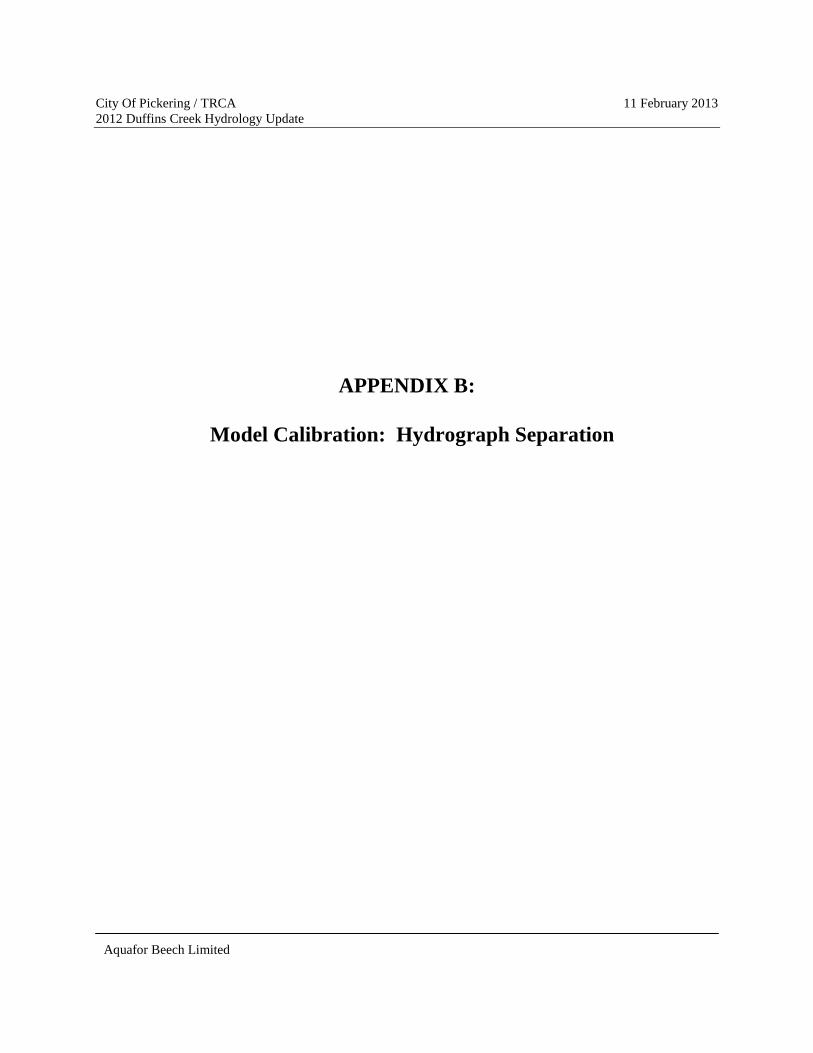
City Of Pickering / TRCA 11 February 2013 2012 Duffins Creek Hydrology Update
Aquafor Beech Limited
APPENDIX B:
Model Calibration: Hydrograph Separation

0
2
4
6
8
10
12
14
16
14/05/2003 0:00
15/05/2003 0:00
16/05/2003 0:00
17/05/2003 0:00
18/05/2003 0:00
19/05/2003 0:00
20/05/2003 0:00
21/05/2003 0:00
22/05/2003 0:00
Axis
Titl
e
Title
TRCA HY047 Michell CreekMay 15-17, 2003
TRCA HY047 Michell Creek
Baseflow
Runoff
0
1
2
3
4
5
6
7
8
9
10
14/05/2003 0:00
15/05/2003 0:00
16/05/2003 0:00
17/05/2003 0:00
18/05/2003 0:00
19/05/2003 0:00
20/05/2003 0:00
21/05/2003 0:00
22/05/2003 0:00
Axis
Title
Title
TRCA HY010 Brougham CreekMay 15-17, 2003
TRCA HY010 Brougham Creek
Baseflow
Runoff
0
5
10
15
20
25
30
14/05/2003 0:00
15/05/2003 0:00
16/05/2003 0:00
17/05/2003 0:00
18/05/2003 0:00
19/05/2003 0:00
20/05/2003 0:00
21/05/2003 0:00
22/05/2003 0:00
Axis
Title
Title
TRCA HY023 East Duffins CreekMay 15-17, 2003
TRCA HY023 East Duffins Creek
Baseflow
Runoff
0
10
20
30
40
50
60
14/05/2003 0:00
15/05/2003 0:00
16/05/2003 0:00
17/05/2003 0:00
18/05/2003 0:00
19/05/2003 0:00
20/05/2003 0:00
21/05/2003 0:00
22/05/2003 0:00
Axis
Title
Title
WSC 02HC019 Duffins Creek Above PickeringMay 15-17, 2003
WSC 02HC019 Duffins Creek Above PickeringBaseflow
Runoff
0
10
20
30
40
50
60
70
80
90
14/05/2003 0:00
15/05/2003 0:00
16/05/2003 0:00
17/05/2003 0:00
18/05/2003 0:00
19/05/2003 0:00
20/05/2003 0:00
21/05/2003 0:00
22/05/2003 0:00
Axis
Title
Title
WSC 02HC049 Duffins Creek at AjaxMay 15-17, 2003
WSC 02HC049 Duffins Creek at Ajax
Baseflow
Runoff
Baseflow Separation - Storm Event - May 15-17, 2003
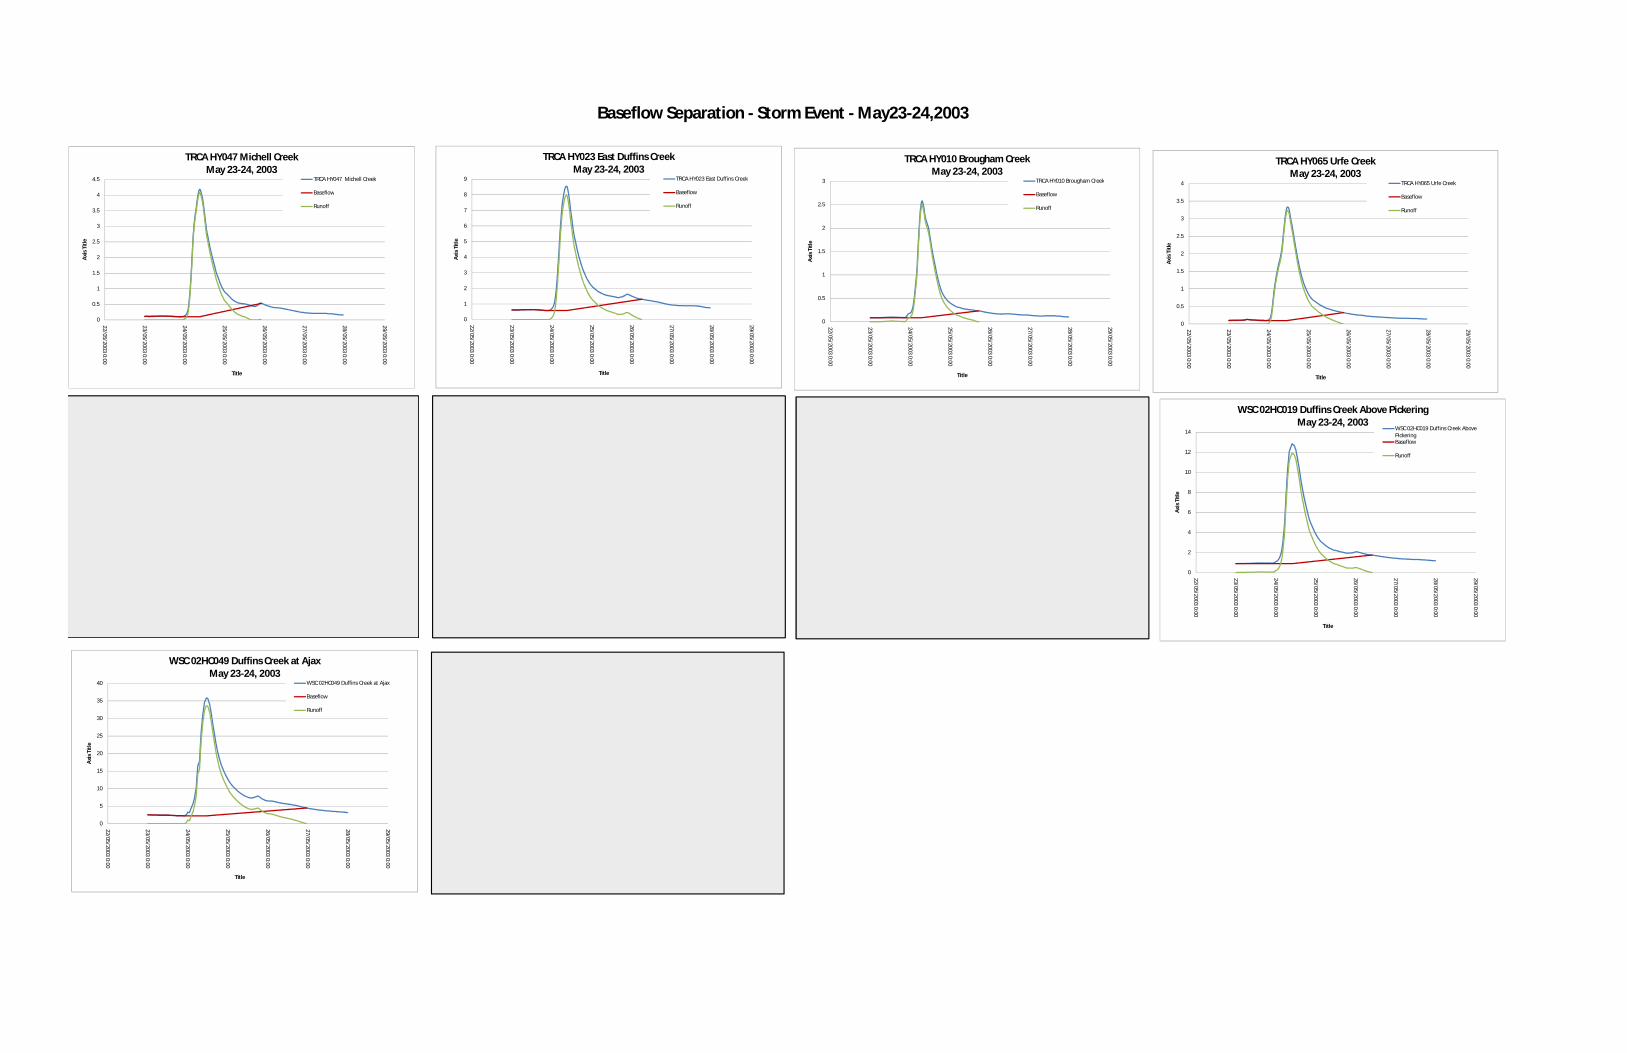
0
0.5
1
1.5
2
2.5
3
3.5
4
4.5
22/05/2003 0:00
23/05/2003 0:00
24/05/2003 0:00
25/05/2003 0:00
26/05/2003 0:00
27/05/2003 0:00
28/05/2003 0:00
29/05/2003 0:00
Axis
Title
Title
TRCA HY047 Michell CreekMay 23-24, 2003
TRCA HY047 Michell Creek
Baseflow
Runoff
0
0.5
1
1.5
2
2.5
3
22/05/2003 0:00
23/05/2003 0:00
24/05/2003 0:00
25/05/2003 0:00
26/05/2003 0:00
27/05/2003 0:00
28/05/2003 0:00
29/05/2003 0:00
Axis
Title
Title
TRCA HY010 Brougham CreekMay 23-24, 2003
TRCA HY010 Brougham Creek
Baseflow
Runoff
0
1
2
3
4
5
6
7
8
9
22/05/2003 0:00
23/05/2003 0:00
24/05/2003 0:00
25/05/2003 0:00
26/05/2003 0:00
27/05/2003 0:00
28/05/2003 0:00
29/05/2003 0:00
Axis
Titl
e
Title
TRCA HY023 East Duffins Creek May 23-24, 2003
TRCA HY023 East Duffins Creek
Baseflow
Runoff
0
2
4
6
8
10
12
1422/05/2003 0:00
23/05/2003 0:00
24/05/2003 0:00
25/05/2003 0:00
26/05/2003 0:00
27/05/2003 0:00
28/05/2003 0:00
29/05/2003 0:00
Axis
Titl
e
Title
WSC 02HC019 Duffins Creek Above PickeringMay 23-24, 2003
WSC 02HC019 Duffins Creek Above PickeringBaseflow
Runoff
0
0.5
1
1.5
2
2.5
3
3.5
4
22/05/2003 0:00
23/05/2003 0:00
24/05/2003 0:00
25/05/2003 0:00
26/05/2003 0:00
27/05/2003 0:00
28/05/2003 0:00
29/05/2003 0:00
Axis
Title
Title
TRCA HY065 Urfe CreekMay 23-24, 2003
TRCA HY065 Urfe Creek
Baseflow
Runoff
0
5
10
15
20
25
30
35
40
22/05/2003 0:00
23/05/2003 0:00
24/05/2003 0:00
25/05/2003 0:00
26/05/2003 0:00
27/05/2003 0:00
28/05/2003 0:00
29/05/2003 0:00
Axis
Title
Title
WSC 02HC049 Duffins Creek at AjaxMay 23-24, 2003
WSC 02HC049 Duffins Creek at Ajax
Baseflow
Runoff
Baseflow Separation - Storm Event - May23-24,2003

0
1
2
3
4
5
6
7
8
28/07/2006 12:00
29/07/2006 0:00
29/07/2006 12:00
30/07/2006 0:00
30/07/2006 12:00
31/07/2006 0:00
31/07/2006 12:00
01/08/2006 0:00
01/08/2006 12:00
02/08/2006 0:00
02/08/2006 12:00
Axis
Titl
e
Title
WSC 02HC038 West Duffins Above Green RiverJuly 29-30, 2006
WSC 02HC038 West Duffins Above Green River Baseflow
Runoff
0
1
2
3
4
5
6
7
28/07/2006 12:00
29/07/2006 0:00
29/07/2006 12:00
30/07/2006 0:00
30/07/2006 12:00
31/07/2006 0:00
31/07/2006 12:00
01/08/2006 0:00
01/08/2006 12:00
02/08/2006 0:00
02/08/2006 12:00
Axis
Title
Title
TRCA HY407 Michell CreekJuly 29-30, 2006
TRCA HY047 Michell Creek
Baseflow
Runoff
0
0.5
1
1.5
2
2.5
3
3.5
4
4.5
28/07/2006 12:00
29/07/2006 0:00
29/07/2006 12:00
30/07/2006 0:00
30/07/2006 12:00
31/07/2006 0:00
31/07/2006 12:00
01/08/2006 0:00
01/08/2006 12:00
02/08/2006 0:00
02/08/2006 12:00
Axis
Title
Title
TRCA HY010 Brougham CreekJuly 29-30, 2006
TRCA HY010 Brougham Creek
Baseflow
Runoff
0
2
4
6
8
10
12
14
16
18
20
28/07/2006 12:00
29/07/2006 0:00
29/07/2006 12:00
30/07/2006 0:00
30/07/2006 12:00
31/07/2006 0:00
31/07/2006 12:00
01/08/2006 0:00
01/08/2006 12:00
02/08/2006 0:00
02/08/2006 12:00
Axis
Titl
e
Title
TRCA HY023 East Duffins CreekJuly 29-30, 2006
TRCA HY023 East Duffins Creek
Baseflow
Runoff
0
5
10
15
20
25
30
35
40
4528/07/2006 12:00
29/07/2006 0:00
29/07/2006 12:00
30/07/2006 0:00
30/07/2006 12:00
31/07/2006 0:00
31/07/2006 12:00
01/08/2006 0:00
01/08/2006 12:00
02/08/2006 0:00
02/08/2006 12:00
Axis
Title
Title
WSC 02H019 Duffins Creek above PickeringJuly 29-30, 2006
WSC 02HC019 Duffins Creek Above PickeringBaseflow
Runoff
0
0.05
0.1
0.15
0.2
0.25
0.3
0.35
0.4
0.45
0.5
28/07/2006 12:00
29/07/2006 0:00
29/07/2006 12:00
30/07/2006 0:00
30/07/2006 12:00
31/07/2006 0:00
31/07/2006 12:00
01/08/2006 0:00
01/08/2006 12:00
02/08/2006 0:00
02/08/2006 12:00
Axis
Title
Title
TRCA HY065 Urfe CreekJuly 29-30, 2006
TRCA HY065 Urfe Creek
Baseflow
Runoff
0
5
10
15
20
25
30
28/07/2006 12:00
29/07/2006 0:00
29/07/2006 12:00
30/07/2006 0:00
30/07/2006 12:00
31/07/2006 0:00
31/07/2006 12:00
01/08/2006 0:00
01/08/2006 12:00
02/08/2006 0:00
02/08/2006 12:00
Axis
Title
Title
WSC 02HC049 Duffins Creek at AjaxJuly 29-30, 2006
WSC 02HC049 Duffins Creek at Ajax
Baseflow
Runoff
Baseflow Separation - Storm Event -July 29-30,2006

0
0.5
1
1.5
2
2.5
21/07/2008 12:00
22/07/2008 0:00
22/07/2008 12:00
23/07/2008 0:00
23/07/2008 12:00
24/07/2008 0:00
24/07/2008 12:00
25/07/2008 0:00
25/07/2008 12:00
26/07/2008 0:00
26/07/2008 12:00
Flow
(cm
s)
Date
TRCA HY047 Michell CreekJuly 22-23, 2008
TRCA HY047 Michell Creek
Baseflow
Runoff
0
0.5
1
1.5
2
2.5
3
3.5
4
4.5
21/07/2008 12:00
22/07/2008 0:00
22/07/2008 12:00
23/07/2008 0:00
23/07/2008 12:00
24/07/2008 0:00
24/07/2008 12:00
25/07/2008 0:00
25/07/2008 12:00
26/07/2008 0:00
26/07/2008 12:00
Axis
Titl
e
Title
TRCA HY010 Brougham CreekJuly 22-23, 2008
TRCA HY010 Brougham Creek
Baseflow
Runoff
0
0.5
1
1.5
2
2.5
3
3.5
4
21/07/2008 12:00
22/07/2008 0:00
22/07/2008 12:00
23/07/2008 0:00
23/07/2008 12:00
24/07/2008 0:00
24/07/2008 12:00
25/07/2008 0:00
25/07/2008 12:00
26/07/2008 0:00
26/07/2008 12:00
Axis
Titl
e
Title
TRCA HY023 East Duffins CreekJuly 22-23, 2008
TRCA HY023 East Duffins Creek
Baseflow
Runoff
0
2
4
6
8
10
12
14
16
21/07/2008 12:00
22/07/2008 0:00
22/07/2008 12:00
23/07/2008 0:00
23/07/2008 12:00
24/07/2008 0:00
24/07/2008 12:00
25/07/2008 0:00
25/07/2008 12:00
26/07/2008 0:00
26/07/2008 12:00
Axis
Titl
e
Title
WSC 02HC019 Duffins Creek Above PickeringJuly 22-23, 2008
WSC 02HC019 Duffins Creek Above PickeringBaseflow
Runoff
0
1
2
3
4
5
6
7
8
9
10
21/07/2008 12:00
22/07/2008 0:00
22/07/2008 12:00
23/07/2008 0:00
23/07/2008 12:00
24/07/2008 0:00
24/07/2008 12:00
25/07/2008 0:00
25/07/2008 12:00
26/07/2008 0:00
26/07/2008 12:00
Axis
Title
Title
TRCA HY065 Urfe CreekJuly 22-23, 2008
TRCA HY065 Urfe Creek
Baseflow
Runoff
0
10
20
30
40
50
60
21/07/2008 12:00
22/07/2008 0:00
22/07/2008 12:00
23/07/2008 0:00
23/07/2008 12:00
24/07/2008 0:00
24/07/2008 12:00
25/07/2008 0:00
25/07/2008 12:00
26/07/2008 0:00
26/07/2008 12:00
27/07/2008 0:00
Axis
Titl
e
Title
WSC 02HC049 Duffins Creek at AjaxJuly 22-23, 2008
WSC 02HC049 Duffins Creek at Ajax
Baseflow
Runoff
Baseflow Separation - Storm Event -July 22-23,2008
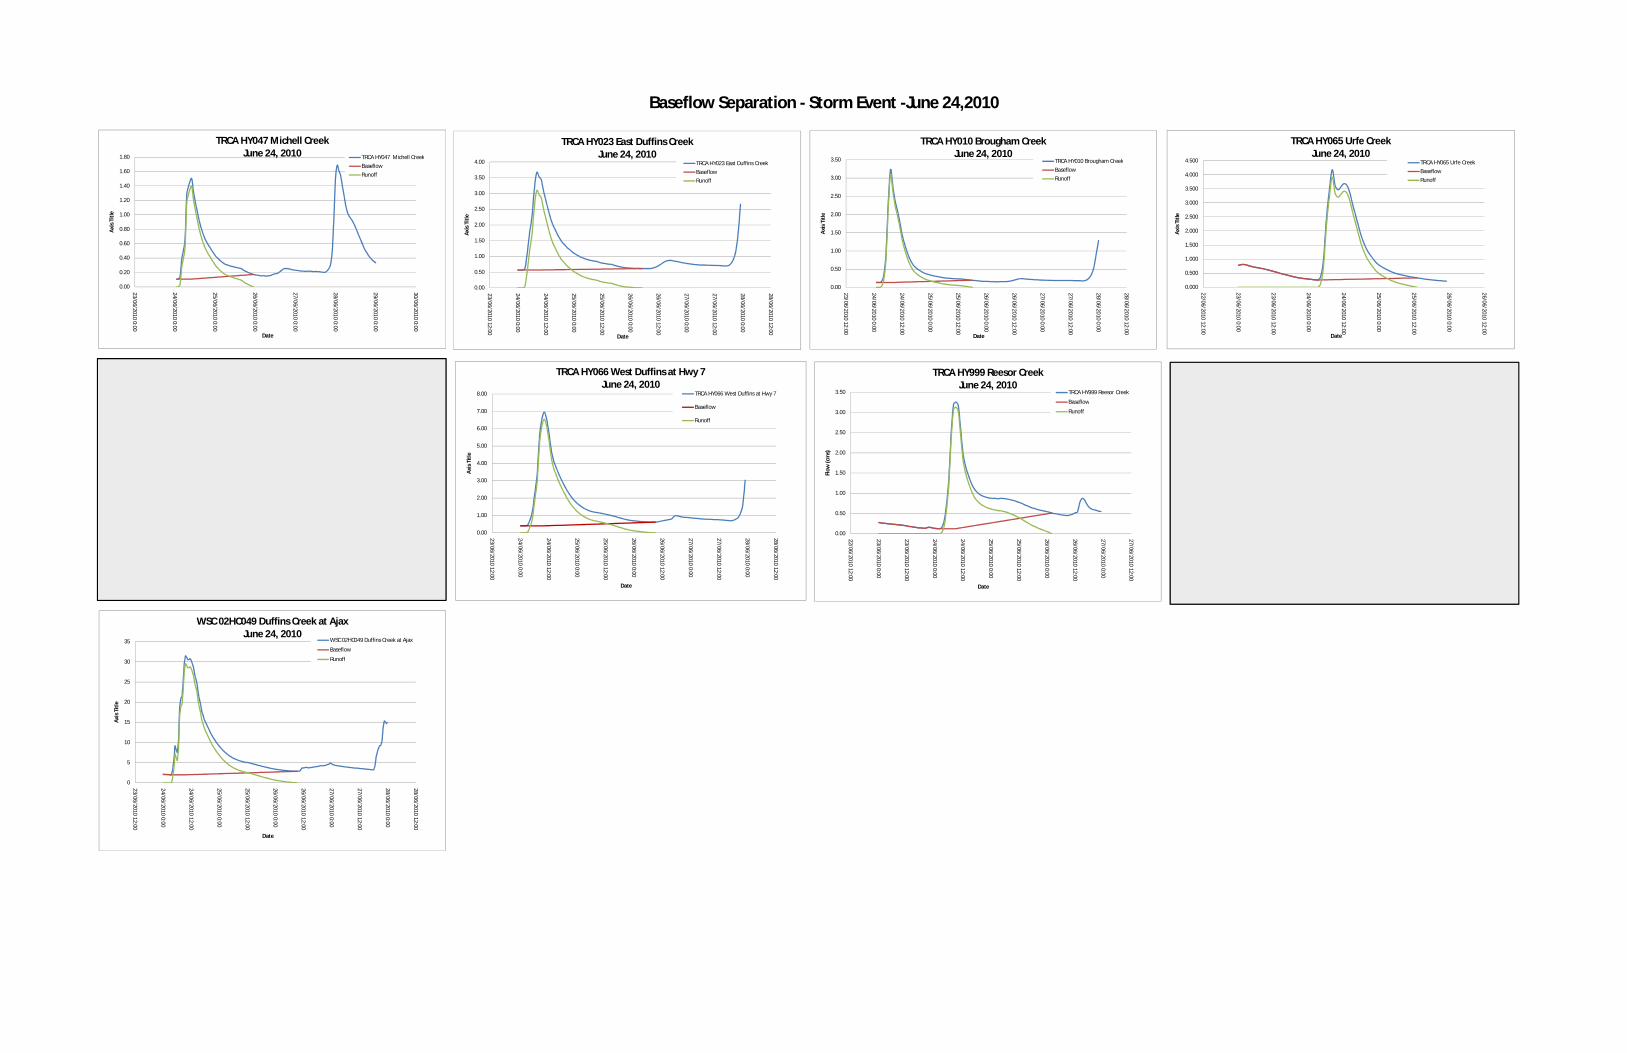
0.00
0.50
1.00
1.50
2.00
2.50
3.00
3.50
22/06/2010 12:00
23/06/2010 0:00
23/06/2010 12:00
24/06/2010 0:00
24/06/2010 12:00
25/06/2010 0:00
25/06/2010 12:00
26/06/2010 0:00
26/06/2010 12:00
27/06/2010 0:00
27/06/2010 12:00
Flow
(cm
s)
Date
TRCA HY999 Reesor CreekJune 24, 2010
TRCA HY999 Reesor Creek
Baseflow
Runoff
0.00
1.00
2.00
3.00
4.00
5.00
6.00
7.00
8.00
23/06/2010 12:00
24/06/2010 0:00
24/06/2010 12:00
25/06/2010 0:00
25/06/2010 12:00
26/06/2010 0:00
26/06/2010 12:00
27/06/2010 0:00
27/06/2010 12:00
28/06/2010 0:00
28/06/2010 12:00
Axis
Title
Date
TRCA HY066 West Duffins at Hwy 7June 24, 2010
TRCA HY066 West Duffins at Hwy 7
Baseflow
Runoff
0.00
0.20
0.40
0.60
0.80
1.00
1.20
1.40
1.60
1.80
23/06/2010 0:00
24/06/2010 0:00
25/06/2010 0:00
26/06/2010 0:00
27/06/2010 0:00
28/06/2010 0:00
29/06/2010 0:00
30/06/2010 0:00
Axis
Title
Date
TRCA HY047 Michell CreekJune 24, 2010 TRCA HY047 Michell Creek
BaseflowRunoff
0.00
0.50
1.00
1.50
2.00
2.50
3.00
3.50
23/06/2010 12:00
24/06/2010 0:00
24/06/2010 12:00
25/06/2010 0:00
25/06/2010 12:00
26/06/2010 0:00
26/06/2010 12:00
27/06/2010 0:00
27/06/2010 12:00
28/06/2010 0:00
28/06/2010 12:00
Axis
Title
Date
TRCA HY010 Brougham CreekJune 24, 2010
TRCA HY010 Brougham CreekBaseflowRunoff
0.00
0.50
1.00
1.50
2.00
2.50
3.00
3.50
4.00
23/06/2010 12:00
24/06/2010 0:00
24/06/2010 12:00
25/06/2010 0:00
25/06/2010 12:00
26/06/2010 0:00
26/06/2010 12:00
27/06/2010 0:00
27/06/2010 12:00
28/06/2010 0:00
28/06/2010 12:00
Axis
Title
Date
TRCA HY023 East Duffins CreekJune 24, 2010
TRCA HY023 East Duffins CreekBaseflowRunoff
0.000
0.500
1.000
1.500
2.000
2.500
3.000
3.500
4.000
4.500
22/06/2010 12:00
23/06/2010 0:00
23/06/2010 12:00
24/06/2010 0:00
24/06/2010 12:00
25/06/2010 0:00
25/06/2010 12:00
26/06/2010 0:00
26/06/2010 12:00
Axis
Title
Date
TRCA HY065 Urfe CreekJune 24, 2010
TRCA HY065 Urfe CreekBaseflowRunoff
0
5
10
15
20
25
30
35
23/06/2010 12:00
24/06/2010 0:00
24/06/2010 12:00
25/06/2010 0:00
25/06/2010 12:00
26/06/2010 0:00
26/06/2010 12:00
27/06/2010 0:00
27/06/2010 12:00
28/06/2010 0:00
28/06/2010 12:00
Axis
Title
Date
WSC 02HC049 Duffins Creek at AjaxJune 24, 2010
WSC 02HC049 Duffins Creek at Ajax
Baseflow
Runoff
Baseflow Separation - Storm Event -June 24,2010

Baseflow Separation - Storm Event -July 27-28,2010
0.00
0.50
1.00
1.50
2.00
2.50
3.00
3.50
4.00
4.50
26/06/2010 0:00
27/06/2010 0:00
28/06/2010 0:00
29/06/2010 0:00
30/06/2010 0:00
01/07/2010 0:00
02/07/2010 0:00
03/07/2010 0:00
04/07/2010 0:00
Flow
(cm
s)
Date
TRCA HY999 Ressor CreekJune 27-28, 2010 TRCA HY999 Reesor
CreekBaseflow
0.00
1.00
2.00
3.00
4.00
5.00
6.00
7.00
8.00
26/06/2010 0:00
27/06/2010 0:00
28/06/2010 0:00
29/06/2010 0:00
30/06/2010 0:00
01/07/2010 0:00
02/07/2010 0:00
03/07/2010 0:00
04/07/2010 0:00
Flow
(cm
s)
Date
TRCA HY066 West Duffins at Hwy 7June 27-28, 2010
TRCA HY066 West Duffins at Hwy 7Baseflow
0.00
0.20
0.40
0.60
0.80
1.00
1.20
1.40
1.60
1.80
26/06/2010 0:00
27/06/2010 0:00
28/06/2010 0:00
29/06/2010 0:00
30/06/2010 0:00
01/07/2010 0:00
02/07/2010 0:00
03/07/2010 0:00
04/07/2010 0:00
Flow
(cm
s)
Date
TRCA HY047 MichellJune 27-28, 2010 TRCA HY047 Michell Creek
BaseflowRunoff
0.00
0.20
0.40
0.60
0.80
1.00
1.20
1.40
26/06/2010 0:00
27/06/2010 0:00
28/06/2010 0:00
29/06/2010 0:00
30/06/2010 0:00
01/07/2010 0:00
02/07/2010 0:00
03/07/2010 0:00
04/07/2010 0:00
Flow
(cm
s)
Date
TRCA HY010 Brougham CreekJune 27-28, 2010
TRCA HY010 Brougham Creek
Baseflow
Runoff
0.000
0.500
1.000
1.500
2.000
2.500
3.000
3.500
4.000
26/06/2010 0:00
27/06/2010 0:00
28/06/2010 0:00
29/06/2010 0:00
30/06/2010 0:00
01/07/2010 0:00
02/07/2010 0:00
03/07/2010 0:00
04/07/2010 0:00
Flow
(cm
s)
Date
TRCA HY023 East Duffins CreekJune 27-28, 2010
TRCA HY023 East Duffins Creek
Baseflow
Runoff
0.00
1.00
2.00
3.00
4.00
5.00
6.00
7.00
8.00
9.00
26/06/2010 0:00
27/06/2010 0:00
28/06/2010 0:00
29/06/2010 0:00
30/06/2010 0:00
01/07/2010 0:00
02/07/2010 0:00
03/07/2010 0:00
04/07/2010 0:00
Flow
(cm
s)
Date
TRCA HY028 Ganatsekiagon CreekJune 27-28, 2010
TRCA HY028 Ganatsekiagon Creek
BaseflowRunoff
0.00
0.50
1.00
1.50
2.00
2.50
3.00
26/06/2010 0:00
27/06/2010 0:00
28/06/2010 0:00
29/06/2010 0:00
30/06/2010 0:00
01/07/2010 0:00
02/07/2010 0:00
03/07/2010 0:00
04/07/2010 0:00
Flow
(cm
s)
Date
TRCA HY065 Urfe CreekJune 27-28, 2010
TRCA HY065 Urfe Creek
Baseflow
Runoff
0
5
10
15
20
25
30
26/06/2010 0:00
27/06/2010 0:00
28/06/2010 0:00
29/06/2010 0:00
30/06/2010 0:00
01/07/2010 0:00
02/07/2010 0:00
03/07/2010 0:00
04/07/2010 0:00
Flow
(cm
s)
Date
WSC 02HC049 Duffins Creek at AjaxJune 27-28, 2010
WSC 02HC049 Duffins Creek at Ajax
Baseflow
Runoff

0.00
1.00
2.00
3.00
4.00
5.00
6.00
22/07/2010 0:00
23/07/2010 0:00
24/07/2010 0:00
25/07/2010 0:00
26/07/2010 0:00
27/07/2010 0:00
28/07/2010 0:00
29/07/2010 0:00
30/07/2010 0:00
Flow
(cm
s)
Date
TRCA HY999 Reesor CreekJuly 23, 2010
TRCA HY999 Reesor CreekBaseflow
Runoff
0.00
1.00
2.00
3.00
4.00
5.00
6.00
7.00
8.00
9.00
10.00
22/07/2010 0:00
23/07/2010 0:00
24/07/2010 0:00
25/07/2010 0:00
26/07/2010 0:00
27/07/2010 0:00
28/07/2010 0:00
29/07/2010 0:00
30/07/2010 0:00
Flow
(cm
s)
Date
TRCA HY066 West Duffins at Hwy 7July 23, 2010
TRCA HY066 West Duffins at Hwy 7
Baseflow
Runoff
0.00
0.50
1.00
1.50
2.00
2.50
22/07/2010 0:00
23/07/2010 0:00
24/07/2010 0:00
25/07/2010 0:00
26/07/2010 0:00
27/07/2010 0:00
28/07/2010 0:00
29/07/2010 0:00
30/07/2010 0:00
Flow
(cm
s)
Date
TRCA HY047 Michell CreekJuly 23, 2010
TRCA HY047 Michell CreekBaseflowRunoff
0.00
0.50
1.00
1.50
2.00
2.50
3.00
3.50
4.00
22/07/2010 0:00
23/07/2010 0:00
24/07/2010 0:00
25/07/2010 0:00
26/07/2010 0:00
27/07/2010 0:00
28/07/2010 0:00
29/07/2010 0:00
30/07/2010 0:00
Flow
(cm
s)
Date
TRCA HY010 Brougham CreekJuly 23, 2010
TRCA HY010 Brougham CreekBaseflowRunoff
0.000
1.000
2.000
3.000
4.000
5.000
6.000
22/07/2010 0:00
23/07/2010 0:00
24/07/2010 0:00
25/07/2010 0:00
26/07/2010 0:00
27/07/2010 0:00
28/07/2010 0:00
29/07/2010 0:00
30/07/2010 0:00
Flow
(cm
s)
Date
TRCA HY023 East Duffins CreekJuly 23, 2010
TRCA HY023 East Duffins CreekBaseflowRunoff
0.00
0.50
1.00
1.50
2.00
2.50
3.00
3.50
4.00
22/07/2010 0:00
23/07/2010 0:00
24/07/2010 0:00
25/07/2010 0:00
26/07/2010 0:00
27/07/2010 0:00
28/07/2010 0:00
29/07/2010 0:00
30/07/2010 0:00
Flow
(cm
s)
Date
TRCA HY028 Ganatsekiagon CreekJuly 23, 2010
TRCA HY028 Ganatsekiagon CreekBaseflowRunoff
0.00
0.50
1.00
1.50
2.00
2.50
3.00
22/07/2010 0:00
23/07/2010 0:00
24/07/2010 0:00
25/07/2010 0:00
26/07/2010 0:00
27/07/2010 0:00
28/07/2010 0:00
29/07/2010 0:00
30/07/2010 0:00
Flow
(cm
s)
Date
TRCA HY065 Urfe CreekJuly 23, 2010
TRCA HY065 Urfe CreekBaseflowRunoff
0
5
10
15
20
25
30
35
22/07/2010 0:00
23/07/2010 0:00
24/07/2010 0:00
25/07/2010 0:00
26/07/2010 0:00
27/07/2010 0:00
28/07/2010 0:00
29/07/2010 0:00
30/07/2010 0:00
Flow
(cm
s)
Date
WSC 02HC049 Duffins Creek at AjaxJuly 23, 2010
WSC 02HC049 Duffins Creek at Ajax
Baseflow
Runoff
Baseflow Separation - Storm Event July 23, 2010

Baseflow Seperation - Storm Event - May 11, 2000
0
1
2
3
4
5
6
7
8
9
10
0 20 40 60 80 100
120
140
160
180
Flow
(cm
s)
Time (hours)
Reesor Creek (02HC039)May 11-12, 2000
Gauged Runoff
Reesor Creek (02HC039)
Baseflow
0
2
4
6
8
10
12
14
16
18
20
0 20 40 60 80 100
120
140
160
180
Flow
(cm
s)
Time (hours)
East Duffins Creek (02HC019)May 11-12, 2000
Gauged Runoff
East Duffins Creek (02HC019)
Baseflow
0
10
20
30
40
50
60
70
80
0 20 40 60 80 100
120
140
160
180
Flow
(cm
s)
Time (hours)
Duffins Creek at Ajax (02HC049)May 11-12, 2000
Gauged Runoff
Duffins Creek at Ajax (02HC049)
Baseflow
0
1
2
3
4
5
6
7
8
9
10
0 20 40 60 80 100
120
140
160
180
Flow
(cm
s)
Time (hours)
W.Duffins Creek @Green River (02HC038)May 11-12, 2000
Gauged Runoff
W.Duffins Creek@Green River (02HC038)
Baseflow
0
1
2
3
4
5
6
7
8
9
10
0 20 40 60 80 100
120
140
160
180
Flow
(cm
s)
Time (hours)
Urfe Creek (gauge #37)May 11-12, 2000
Gauged Runoff
Urfe Creek (gauge #37)
Baseflow
0
1
2
3
4
5
6
7
8
0 20 40 60 80 100
120
140
160
180
Flow
(cm
s)
Time (hours)
Brougham Creek (gauge #36)May 11-12, 2000
Gauged Runoff
Brougham Creek (gauge#36)
Baseflow

Baseflow Seperation - Storm Event - June 13, 2000
0
1
2
3
4
5
6
7
8
9
0 20 40 60 80 100
120
140
Flow
(cm
s)
Time (hours)
June 13'00 StormReesor Creek (02HC039)
Gauged Runoff
Reesor Creek (02HC039)
Baseflow
0
5
10
15
20
25
30
0 20 40 60 80 100
120
140
Title
Title
June 13'00 StormEast Duffins Creek (02HC019)
Gauged Runoff
East Duffins Creek (02HC019)
Baseflow
0
10
20
30
40
50
60
70
80
0 20 40 60 80 100
120
140
Title
Title
June 13'00 StormDuffins Creek at Ajax (02HC049)
Gauged Runoff
Duffins Creek at Ajax (02HC049)
Baseflow
0
2
4
6
8
10
12
0 20 40 60 80 100
120
140
Flow
(cm
s)
Time (hours)
June 13'00 StormW.Duffins Creek @Green River (02HC038)
Gauged Runoff
W.Duffins Creek @ Green River (02HC038)
Baseflow
0
1
2
3
4
5
6
7
8
0 20 40 60 80 100
120
140
Flow
(cm
s)
Time (hours)
June 13'00 StormUrfe Creek (guage #37)
Gauged Runoff
Urfe Creek (guage #37)
Baseflow
0
1
2
3
4
5
6
7
8
9
10
0 20 40 60 80 100
120
140
Flow
(cm
s)
Time (hours)
June 13'00 StormBrougham Creek (guage #36)
Gauged Runoff
Brougham Creek (guage #36)
Baseflow

Baseflow Seperation - Storm Event - June 24, 2000
0
1
2
3
4
5
6
7
8
0 20 40 60 80 100
120
140
160
180
Title
Title
Reesor Creek (02HC039)June 24, 2000
Gauged Runoff
Reesor Creek (02HC039)
Baseflow
0
5
10
15
20
25
0 20 40 60 80 100
120
140
160
180
Title
Title
East Duffins Creek (02HC019)June 24, 2000
Gauged Runoff
East Duffins Creek (02HC019)
Baseflow
0
10
20
30
40
50
60
0 20 40 60 80 100
120
140
160
180
Title
Title
Duffins Creek at Ajax (02HC049)June 24, 2000
Gauged Runoff
Duffins Creek at Ajax (02HC049)
Baseflow
0
1
2
3
4
5
6
7
8
0 20 40 60 80 100
120
140
160
180
Title
Title
W.Duffins Creek @Green River (02HC038)June 24, 2000
Gauged Runoff
W.Duffins Creek@ Green River (02HC038)Baseflow
0
1
2
3
4
5
6
0 20 40 60 80 100
120
140
160
180
Title
Title
Urfe Creek (gauge #37)June 24, 2000
Gauged Runoff
Urfe Creek (gauage #37)
Baseflow
0
1
2
3
4
5
6
7
0 20 40 60 80 100
120
140
160
180
Title
Title
Brougham Creek (gauge #36)June 24, 2000
Gauged Runoff
Brougham Creek (gauage #36)
Baseflow

City Of Pickering / TRCA 11 February 2013 2012 Duffins Creek Hydrology Update
Aquafor Beech Limited
APPENDIX C:
Model Calibration: Rainfall Data Application

Catchment # May15-17, 2003 May 23-24, 2003 July 29-30,2006 July 22-23, 2008 July 23,2010 June 24, 2010 June 27-28, 20101 Ajax Works Yard HY001 Ajax Works Yard HY001 02HC018 Ajax Works Yard HY001 Ajax Works Yard HY001 Ajax Works Yard HY001 Ajax Works Yard HY0012 Ajax Works Yard HY001 Ajax Works Yard HY001 Little Rouge at 16th HY043 Ajax Works Yard HY001 Ajax Works Yard HY001 Ajax Works Yard HY001 Ajax Works Yard HY0013 Ajax Works Yard HY001 Ajax Works Yard HY001 Little Rouge at 16th HY043 Ajax Works Yard HY001 Ajax Works Yard HY001 Brock West Landfill HY009 Brock West Landfill HY0094 Ajax Works Yard HY001 Ajax Works Yard HY001 Little Rouge at 16th HY043 Ajax Works Yard HY001 Ajax Works Yard HY001 Brock West Landfill HY009 Brock West Landfill HY0095 Ajax Works Yard HY001 Ajax Works Yard HY001 Little Rouge at 16th HY043 Little Rouge at 16th HY043 Little Rouge at 16th HY043 Brock West Landfill HY009 Brock West Landfill HY0096 Claremont Shop HY015 Claremont Shop HY015 Little Rouge at 16th HY043 Little Rouge at 16th HY043 Little Rouge at 16th HY043 Brock West Landfill HY009 Brock West Landfill HY0097 Claremont Shop HY015 Claremont Shop HY015 Little Rouge at 16th HY043 Little Rouge at 16th HY043 Little Rouge at 16th HY043 Little Rouge at 16th HY043 Little Rouge at 16th HY0438 Claremont Shop HY015 Claremont Shop HY015 Little Rouge at 16th HY043 Little Rouge at 16th HY043 Little Rouge at 16th HY043 Little Rouge at 16th HY043 Little Rouge at 16th HY0439 Claremont Shop HY015 Claremont Shop HY015 Little Rouge at 16th HY043 Little Rouge at 16th HY043 Little Rouge at 16th HY043 Little Rouge at 16th HY043 Little Rouge at 16th HY043
10 Claremont Shop HY015 Claremont Shop HY015 Little Rouge at 16th HY043 Little Rouge at 16th HY043 Little Rouge at 16th HY043 Little Rouge at 16th HY043 Little Rouge at 16th HY04311 Claremont Shop HY015 Claremont Shop HY015 Little Rouge at 16th HY043 Little Rouge at 16th HY043 Little Rouge at 16th HY043 Little Rouge at 16th HY043 Little Rouge at 16th HY04312 Claremont Shop HY015 Claremont Shop HY015 Little Rouge at 16th HY043 Little Rouge at 16th HY043 Little Rouge at 16th HY043 Little Rouge at 16th HY043 Little Rouge at 16th HY04313 Claremont Shop HY015 Claremont Shop HY015 Stouffville Works York02 Little Rouge at 16th HY043 Little Rouge at 16th HY043 Little Rouge at 16th HY043 Little Rouge at 16th HY04314 Claremont Shop HY015 Claremont Shop HY015 Stouffville Works York02 Little Rouge at 16th HY043 Little Rouge at 16th HY043 Little Rouge at 16th HY043 Little Rouge at 16th HY04315 Claremont Shop HY015 Claremont Shop HY015 Stouffville Works York02 Little Rouge at 16th HY043 Little Rouge at 16th HY043 Little Rouge at 16th HY043 Little Rouge at 16th HY04316 Claremont Shop HY015 Claremont Shop HY015 Stouffville Works York02 Goodwood Pumping Station HY031 Goodwood Pumping Station HY031 Goodwood Pumping Station HY031 Goodwood Pumping Station HY03117 Claremont Shop HY015 Claremont Shop HY015 Stouffville Works York02 Goodwood Pumping Station HY031 Goodwood Pumping Station HY031 Goodwood Pumping Station HY031 Goodwood Pumping Station HY03118 Claremont Shop HY015 Claremont Shop HY015 Stouffville Works York02 Little Rouge at 16th HY043 Little Rouge at 16th HY043 Little Rouge at 16th HY043 Little Rouge at 16th HY04319 Claremont Shop HY015 Claremont Shop HY015 Stouffville Works York02 Little Rouge at 16th HY043 Little Rouge at 16th HY043 Little Rouge at 16th HY043 Little Rouge at 16th HY04320 Claremont Shop HY015 Claremont Shop HY015 Stouffville Works York02 Goodwood Pumping Station HY031 Goodwood Pumping Station HY031 Goodwood Pumping Station HY031 Goodwood Pumping Station HY03121 Claremont Shop HY015 Claremont Shop HY015 Stouffville Works York02 Goodwood Pumping Station HY031 Goodwood Pumping Station HY031 Goodwood Pumping Station HY031 Goodwood Pumping Station HY03122 Claremont Shop HY015 Claremont Shop HY015 Stouffville Works York02 Goodwood Pumping Station HY031 Goodwood Pumping Station HY031 Goodwood Pumping Station HY031 Goodwood Pumping Station HY03123 Claremont Shop HY015 Claremont Shop HY015 Little Rouge at 16th HY043 Little Rouge at 16th HY043 Little Rouge at 16th HY043 Little Rouge at 16th HY043 Little Rouge at 16th HY04324 Claremont Shop HY015 Claremont Shop HY015 Little Rouge at 16th HY043 Little Rouge at 16th HY043 Claremont Shop HY015 Claremont Shop HY015 Claremont Shop HY01525 Claremont Shop HY015 Claremont Shop HY015 Little Rouge at 16th HY043 Little Rouge at 16th HY043 Little Rouge at 16th HY043 Little Rouge at 16th HY043 Little Rouge at 16th HY04326 Claremont Shop HY015 Claremont Shop HY015 Goodwood Pumping Station HY031 Goodwood Pumping Station HY031 Goodwood Pumping Station HY031 Goodwood Pumping Station HY031 Goodwood Pumping Station HY03127 Claremont Shop HY015 Claremont Shop HY015 Goodwood Pumping Station HY031 Goodwood Pumping Station HY031 Goodwood Pumping Station HY031 Goodwood Pumping Station HY031 Goodwood Pumping Station HY03128 Claremont Shop HY015 Claremont Shop HY015 Goodwood Pumping Station HY031 Goodwood Pumping Station HY031 Goodwood Pumping Station HY031 Goodwood Pumping Station HY031 Goodwood Pumping Station HY03129 Claremont Shop HY015 Claremont Shop HY015 Goodwood Pumping Station HY031 Goodwood Pumping Station HY031 Goodwood Pumping Station HY031 Goodwood Pumping Station HY031 Goodwood Pumping Station HY03130 Claremont Shop HY015 Claremont Shop HY015 Little Rouge at 16th HY043 Little Rouge at 16th HY043 Little Rouge at 16th HY043 Little Rouge at 16th HY043 Little Rouge at 16th HY04331 Claremont Shop HY015 Claremont Shop HY015 Little Rouge at 16th HY043 Little Rouge at 16th HY043 Little Rouge at 16th HY043 Brock West Landfill HY009 Brock West Landfill HY00932 Claremont Shop HY015 Claremont Shop HY015 Little Rouge at 16th HY043 Little Rouge at 16th HY043 Little Rouge at 16th HY043 Brock West Landfill HY009 Brock West Landfill HY00933 Ajax Works Yard HY001 Ajax Works Yard HY001 Little Rouge at 16th HY043 Little Rouge at 16th HY043 Claremont Shop HY015 Brock West Landfill HY009 Brock West Landfill HY00934 Claremont Shop HY015 Claremont Shop HY015 Little Rouge at 16th HY043 Little Rouge at 16th HY043 Claremont Shop HY015 Brock West Landfill HY009 Brock West Landfill HY00935 Claremont Shop HY015 Claremont Shop HY015 Little Rouge at 16th HY043 Claremont Shop HY015 Claremont Shop HY015 Brock West Landfill HY009 Brock West Landfill HY00936 Ajax Works Yard HY001 Ajax Works Yard HY001 Little Rouge at 16th HY043 Ajax Works Yard HY001 Ajax Works Yard HY001 Brock West Landfill HY009 Brock West Landfill HY00937 Claremont Shop HY015 Claremont Shop HY015 Little Rouge at 16th HY043 Claremont Shop HY015 Claremont Shop HY015 Brock West Landfill HY009 Brock West Landfill HY00938 Claremont Shop HY015 Claremont Shop HY015 Little Rouge at 16th HY043 Claremont Shop HY015 Claremont Shop HY015 Claremont Shop HY015 Claremont Shop HY01539 Claremont Shop HY015 Claremont Shop HY015 Little Rouge at 16th HY043 Claremont Shop HY015 Claremont Shop HY015 Claremont Shop HY015 Claremont Shop HY01540 Claremont Shop HY015 Claremont Shop HY015 Little Rouge at 16th HY043 Ajax Works Yard HY001 Claremont Shop HY015 Brock West Landfill HY009 Brock West Landfill HY00941 Ajax Works Yard HY001 Ajax Works Yard HY001 Little Rouge at 16th HY043 Ajax Works Yard HY001 Ajax Works Yard HY001 Brock West Landfill HY009 Brock West Landfill HY00942 Ajax Works Yard HY001 Ajax Works Yard HY001 Little Rouge at 16th HY043 Ajax Works Yard HY001 Ajax Works Yard HY001 Brock West Landfill HY009 Brock West Landfill HY00943 Claremont Shop HY015 Claremont Shop HY015 02HC055 Claremont Shop HY015 Claremont Shop HY015 Brock West Landfill HY009 Brock West Landfill HY00944 Claremont Shop HY015 Claremont Shop HY015 Little Rouge at 16th HY043 Little Rouge at 16th HY043 Claremont Shop HY015 Claremont Shop HY015 Claremont Shop HY01545 Claremont Shop HY015 Claremont Shop HY015 02HC055 Claremont Shop HY015 Claremont Shop HY015 Claremont Shop HY015 Claremont Shop HY01546 Claremont Shop HY015 Claremont Shop HY015 02HC055 Claremont Shop HY015 Claremont Shop HY015 Claremont Shop HY015 Claremont Shop HY01547 Claremont Shop HY015 Claremont Shop HY015 Little Rouge at 16th HY043 Claremont Shop HY015 Claremont Shop HY015 Claremont Shop HY015 Claremont Shop HY01548 Claremont Shop HY015 Claremont Shop HY015 Goodwood Pumping Station HY031 Goodwood Pumping Station HY031 Claremont Shop HY015 Goodwood Pumping Station HY031 Goodwood Pumping Station HY03149 Claremont Shop HY015 Claremont Shop HY015 Goodwood Pumping Station HY031 Goodwood Pumping Station HY031 Goodwood Pumping Station HY031 Goodwood Pumping Station HY031 Goodwood Pumping Station HY03150 Claremont Shop HY015 Claremont Shop HY015 02HC055 Claremont Shop HY015 Claremont Shop HY015 Claremont Shop HY015 Claremont Shop HY01551 Claremont Shop HY015 Claremont Shop HY015 Goodwood Pumping Station HY031 Goodwood Pumping Station HY031 Goodwood Pumping Station HY031 Goodwood Pumping Station HY031 Goodwood Pumping Station HY03152 CLOCA5 CLOCA5 CLOCA5 CLOCA5 CLOCA5 CLOCA5 CLOCA553 Ajax Works Yard HY001 Ajax Works Yard HY001 02HC018 Ajax Works Yard HY001 Ajax Works Yard HY001 Ajax Works Yard HY001 Ajax Works Yard HY00154 Ajax Works Yard HY001 Ajax Works Yard HY001 02HC018 Ajax Works Yard HY001 Ajax Works Yard HY001 Ajax Works Yard HY001 Ajax Works Yard HY00155 Ajax Works Yard HY001 Ajax Works Yard HY001 02HC055 Ajax Works Yard HY001 Ajax Works Yard HY001 Ajax Works Yard HY001 Ajax Works Yard HY00156 Claremont Shop HY015 Claremont Shop HY015 02HC055 Claremont Shop HY015 Claremont Shop HY015 Claremont Shop HY015 Claremont Shop HY015
Calibration Event
Appendix C - Rainfall Data Application for Calibration Events

$+
$+
$+
$+
$+
$+
$+
$+
$+
HWY 47
HWY 7
Regional Road 5
Bro ck Rd
York-Du rham Line
Kingston Rd
HWY 401
HWY 407
HWY 48
Bro ck Rd
Taunton Rd
Rossland Rd
York02
HY001
HY009
HY015
HY031
HY043
Gauge5
02HC055
02HC018
29
52
28
22
27
17
51
26
48
21
20
19
4750
24
18
14
13
46
45
25
44
1211
39
7
34
10
5631
35
43
40
54
42
6 32
41
5
4
2
1
23
49
53
55
3
9
8
30
38
37
36
33
16
15
FD u f f i n s C r e e k W a t e r s h e dD u f f i n s C r e e k W a t e r s h e d
Whitchurch-Stouffville
Uxbridge
Ajax
Pickering
D U R H A M
Y O R K
Markham
Stouffville
Whitevale
Brougham
Claremont
Goodwood
Ajax
Pickering
Gauging Network(Prec ipi ta t ion S tat ions)
Figure C.1: (May 15-17, 2003)
0 2 4 6 81kms
$+ Precipitation Station
River / Stream
Subcatchment Boundary
Roads
Municipal Boundary
Legend:
Jan 2013
WhitbyMAY 15-17, 2003
Event6
HY001
HY015
CLOCA5

$+
$+
$+
$+
$+
$+
$+
$+
$+
HWY 47
HWY 7
Regional Road 5
Bro ck Rd
York-Du rham Line
Kingston Rd
HWY 401
HWY 407
HWY 48
Bro ck Rd
Taunton Rd
Rossland Rd
York02
HY001
HY009
HY015
HY031
HY043
Gauge5
02HC055
02HC018
29
52
28
22
27
17
51
26
48
21
20
19
4750
24
18
14
13
46
45
25
44
1211
39
7
34
10
5631
35
43
40
54
42
6 32
41
5
4
2
1
23
49
53
55
3
9
8
30
38
37
36
33
16
15
FD u f f i n s C r e e k W a t e r s h e dD u f f i n s C r e e k W a t e r s h e d
Whitchurch-Stouffville
Uxbridge
Ajax
Pickering
D U R H A M
Y O R K
Markham
Stouffville
Whitevale
Brougham
Claremont
Goodwood
Ajax
Pickering
Gauging Network(Prec ipi ta t ion S tat ions)
Figure C.2: (May 23-24, 2003)
0 2 4 6 81kms
$+ Precipitation Station
River / Stream
Subcatchment Boundary
Roads
Municipal Boundary
Legend:
Jan 2013
WhitbyMAY 23-24, 2003
Event6
HY001
HY015
CLOCA5

$+
$+
$+
$+
$+
$+
$+
$+
$+
HWY 47
HWY 7
Regional Road 5
Bro ck Rd
York-Du rham Line
Kingston Rd
HWY 401
HWY 407
HWY 48
Bro ck Rd
Taunton Rd
Rossland Rd
York02
HY001
HY009
HY015
HY031
HY043
Gauge5
02HC055
02HC018
29
52
28
22
27
17
51
26
48
21
20
19
4750
24
18
14
13
46
45
25
44
1211
39
7
34
10
5631
35
43
40
54
42
6 32
41
5
4
2
1
23
49
53
55
3
9
8
30
38
37
36
33
16
15
FD u f f i n s C r e e k W a t e r s h e dD u f f i n s C r e e k W a t e r s h e d
Whitchurch-Stouffville
Uxbridge
Ajax
Pickering
D U R H A M
Y O R K
Markham
Stouffville
Whitevale
Brougham
Claremont
Goodwood
Ajax
Pickering
Gauging Network(Prec ipi ta t ion S tat ions)
Figure C.3: (July 29-30, 2006)
0 2 4 6 81kms
$+ Precipitation Station
River / Stream
Subcatchment Boundary
Roads
Municipal Boundary
Legend:
Jan 2013
Whitby
JULY 29-30, 2006
Event6
HY031
HY043
02HC018
02HC055
CLOCA5
YORK02

$+
$+
$+
$+
$+
$+
$+
$+
$+
HWY 47
HWY 7
Regional Road 5
Bro ck Rd
York-Du rham Line
Kingston Rd
HWY 401
HWY 407
HWY 48
Bro ck Rd
Taunton Rd
Rossland Rd
York02
HY001
HY009
HY015
HY031
HY043
Gauge5
02HC055
02HC018
29
52
28
22
27
17
51
26
48
21
20
19
4750
24
18
14
13
46
45
25
44
1211
39
7
34
10
5631
35
43
40
54
42
6 32
41
5
4
2
1
23
49
53
55
3
9
8
30
38
37
36
33
16
15
FD u f f i n s C r e e k W a t e r s h e dD u f f i n s C r e e k W a t e r s h e d
Whitchurch-Stouffville
Uxbridge
Ajax
Pickering
D U R H A M
Y O R K
Markham
Stouffville
Whitevale
Brougham
Claremont
Goodwood
Ajax
Pickering
Gauging Network(Prec ipi ta t ion S tat ions)
Figure C.4: (July 22-23, 2008)
0 2 4 6 81kms
$+ Precipitation Station
River / Stream
Subcatchment Boundary
Roads
Municipal Boundary
Legend:
Jan 2013
WhitbyJULY 22-23, 2008
Event6
HY001
HY015
HY031
HY043
CLOCA5

$+
$+
$+
$+
$+
$+
$+
$+
$+
HWY 47
HWY 7
Regional Road 5
Bro ck Rd
York-Du rham Line
Kingston Rd
HWY 401
HWY 407
HWY 48
Bro ck Rd
Taunton Rd
Rossland Rd
York02
HY001
HY009
HY015
HY031
HY043
Gauge5
02HC055
02HC018
29
52
28
22
27
17
51
26
48
21
20
19
4750
24
18
14
13
46
45
25
44
1211
39
7
34
10
5631
35
43
40
54
42
6 32
41
5
4
2
1
23
49
53
55
3
9
8
30
38
37
36
33
16
15
FD u f f i n s C r e e k W a t e r s h e dD u f f i n s C r e e k W a t e r s h e d
Whitchurch-Stouffville
Uxbridge
Ajax
Pickering
D U R H A M
Y O R K
Markham
Stouffville
Whitevale
Brougham
Claremont
Goodwood
Ajax
Pickering
Gauging Network(Prec ipi ta t ion S tat ions)
Figure C.5: (July 23, 2010)
0 2 4 6 81kms
$+ Precipitation Station
River / Stream
Subcatchment Boundary
Roads
Municipal Boundary
Legend:
Jan 2013
WhitbyJULY 23, 2010
Event6
HY001
HY015
HY031
HY043
CLOCA5

$+
$+
$+
$+
$+
$+
$+
$+
$+
HWY 47
HWY 7
Regional Road 5
Bro ck Rd
York-Du rham Line
Kingston Rd
HWY 401
HWY 407
HWY 48
Bro ck Rd
Taunton Rd
Rossland Rd
York02
HY001
HY009
HY015
HY031
HY043
Gauge5
02HC055
02HC018
29
52
28
22
27
17
51
26
48
21
20
19
4750
24
18
14
13
46
45
25
44
1211
39
7
34
10
5631
35
43
40
54
42
6 32
41
5
4
2
1
23
49
53
55
3
9
8
30
38
37
36
33
16
15
FD u f f i n s C r e e k W a t e r s h e dD u f f i n s C r e e k W a t e r s h e d
Whitchurch-Stouffville
Uxbridge
Ajax
Pickering
D U R H A M
Y O R K
Markham
Stouffville
Whitevale
Brougham
Claremont
Goodwood
Ajax
Pickering
Gauging Network(Prec ipi ta t ion S tat ions)
Figure C.6: (June 24, 2010)
0 2 4 6 81kms
$+ Precipitation Station
River / Stream
Subcatchment Boundary
Roads
Municipal Boundary
Legend:
Jan 2013
Whitby
JUNE 24, 2010
Event6
HY001
HY009
HY015
HY031
HY043
CLOCA5

$+
$+
$+
$+
$+
$+
$+
$+
$+
HWY 47
HWY 7
Regional Road 5
Bro ck Rd
York-Du rham Line
Kingston Rd
HWY 401
HWY 407
HWY 48
Bro ck Rd
Taunton Rd
Rossland Rd
York02
HY001
HY009
HY015
HY031
HY043
Gauge5
02HC055
02HC018
29
52
28
22
27
17
51
26
48
21
20
19
4750
24
18
14
13
46
45
25
44
1211
39
7
34
10
5631
35
43
40
54
42
6 32
41
5
4
2
1
23
49
53
55
3
9
8
30
38
37
36
33
16
15
FD u f f i n s C r e e k W a t e r s h e dD u f f i n s C r e e k W a t e r s h e d
Whitchurch-Stouffville
Uxbridge
Ajax
Pickering
D U R H A M
Y O R K
Markham
Stouffville
Whitevale
Brougham
Claremont
Goodwood
Ajax
Pickering
Gauging Network(Prec ipi ta t ion S tat ions)
Figure C.7: (June 27-28, 2010)
0 2 4 6 81kms
$+ Precipitation Station
River / Stream
Subcatchment Boundary
Roads
Municipal Boundary
Legend:
Jan 2013
Whitby
JUNE 27-28, 2010
Event6
HY001
HY009
HY015
HY031
HY043
CLOCA5

City Of Pickering / TRCA 11 February 2013 2012 Duffins Creek Hydrology Update
Aquafor Beech Limited
APPENDIX D:
Model Calibration: Observed vs. Simulated Calibration Event Results

Calibration Results - Storm Event - May 15-17, 2003
0.00
10.00
20.00
30.00
40.00
50.00
60.00
0 40 80 120
160
Flow
(cm
s)
Time (Hours)
Model Calibration: May 15-17, 2003Mitchel Creek at Claremont (HY047)
Gauged Runoff Modelled Runoff
0.000
10.000
20.000
30.000
40.000
50.000
60.000
0 40 80 120
160
Flow
(cm
s)
Time (Hours)
Model Calibration: May 15-17, 2003E. Duffins at Claremont (HY023)
Gauged Runoff Modelled Runoff
0.00
10.00
20.00
30.00
40.00
50.00
60.00
0 40 80 120
160
Flow
(cm
s)
Time (Hours)
Model Calibration: May 15-17, 2003Brougham Creek (HY010)
Gauged Runoff Modelled Runoff
0.0
10.0
20.0
30.0
40.0
50.0
60.0
0 40 80 120
160
Flow
(cm
s)
Time (Hours)
Model Calibration: May 15-17, 2003Duffins above Pickering (HC019)
Gauged Runoff Modelled Runoff
0.0
20.0
40.0
60.0
80.0
100.0
0 40 80 120
160
Flow
(cm
s)
Time (Hours)
Model Calibration: May 15-17, 2003Duffins Creek at Ajax (HC049)
Gauged Runoff Modelled Runoff

0.0
10.0
20.0
30.0
40.0
50.0
0 12 24 36 48 60 72 84 96 108
120
Flow
(cm
s)
Time (Hours)
Model Calibration: May 23-24, 2003Duffins Creek at Ajax (HC049)
Gauged Runoff Modelled Runoff
0.0
10.0
20.0
30.0
0 12 24 36 48 60 72 84 96 108
120
Flow
(cm
s)
Time (Hours)
Model Calibration: May 23-24, 2003Urfe Creek (HC065)
Gauged Runoff Modelled Runoff
0.00
10.00
20.00
30.00
0 12 24 36 48 60 72 84 96 108
120
Flow
(cm
s)
Time (Hours)
Model Calibration: May 23-24, 2003Mitchel Creek at Claremont (HY047)
Gauged Runoff Modelled Runoff
0.0
10.0
20.0
30.0
0 12 24 36 48 60 72 84 96 108
120
Flow
(cm
s)
Time (Hours)
Model Calibration: May 23-24, 2003E. Duffins at Claremont (HY023)
Gauged Runoff Modelled Runoff
0.0
10.0
20.0
30.0
0 12 24 36 48 60 72 84 96 108
120
Flow
(cm
s)
Time (Hours)
Model Calibration: May 23-24, 2003Brougham Creek (HY010)
Gauged Runoff Modelled Runoff
0.0
10.0
20.0
30.00 12 24 36 48 60 72 84 96 108
120
Flow
(cm
s)
Time (Hours)
Model Calibration: May 23-24, 2003Duffins above Pickering (HC019)
Gauged Runoff Modelled Runoff
Calibration Results - Storm Event - May23-24,2003

0.0
10.0
20.0
30.0
40.0
50.0
0 12 24 36 48 60 72 84 96 108
120
Flow
(cm
s)
Time (Hours)
Model Calibration: July 29-30, 2006Duffins Creek at Ajax (HC049)
Gauged Runoff Modelled Runoff
0.0
10.0
20.0
30.0
0 12 24 36 48 60 72 84 96 108
120
Flow
(cm
s)
Time (Hours)
Model Calibration: July 29-30, 2006W. Duffins above Green River (HC038)
Gauged Runoff Modelled Runoff
0.0
10.0
20.0
30.0
0 12 24 36 48 60 72 84 96 108
120
Flow
(cm
s)
Time (Hours)
Model Calibration: July 29-30, 2006Urfe Creek (HC065)
Gauged Runoff Modelled Runoff
0.0
10.0
20.0
30.0
40.0
50.0
0 12 24 36 48 60 72 84 96 108
120
Flow
(cm
s)
Time (Hours)
Model Calibration: July 29-30, 2006Duffins above Pickering (HC019)
Gauged Runoff Modelled Runoff
0.0
10.0
20.0
30.0
0 12 24 36 48 60 72 84 96 108
120
Flow
(cm
s)
Time (Hours)
Model Calibration: July 29-30, 2006Brougham Creek (HY010)
Gauged Runoff Modelled Runoff
0.0
10.0
20.0
30.0
0 12 24 36 48 60 72 84 96 108
120
Flow
(cm
s)
Time (Hours)
Model Calibration: July 29-30, 2006E. Duffins at Claremont (HY023)
Gauged Runoff Modelled Runoff
0.0
10.0
20.0
30.0
0 12 24 36 48 60 72 84 96 108
120
Flow
(cm
s)
Time (Hours)
Model Calibration: July 29-30, 2006Mitchel Creek at Claremont (HY047)
Gauged Runoff Modelled Runoff
Calibration Results - Storm Event -July 29-30,2008

0.0
10.0
20.0
30.0
40.0
50.0
0 12 24 36 48 60 72 84 96 108
120
Flow
(cm
s)
Time (Hours)
Model Calibration: July 22-23, 2008Duffins Creek at Ajax (HC049)
Gauged Runoff Modelled Runoff
0.0
10.0
20.0
30.0
0 12 24 36 48 60 72 84 96 108
120
Flow
(cm
s)
Time (Hours)
Model Calibration: July 22-23, 2008Urfe Creek (HC065)
Gauged Runoff Modelled Runoff
0.0
10.0
20.0
30.00 12 24 36 48 60 72 84 96 108
120
Flow
(cm
s)
Time (Hours)
Model Calibration: July 22-23, 2008Duffins above Pickering (HC019)
Gauged Runoff Modelled Runoff
0.0
10.0
20.0
30.0
0 12 24 36 48 60 72 84 96 108
120
Flow
(cm
s)
Time (Hours)
Model Calibration: July 22-23, 2008Brougham Creek (HY010)
Gauged Runoff Modelled Runoff
0.0
10.0
20.0
30.0
0 12 24 36 48 60 72 84 96 108
120
Flow
(cm
s)
Time (Hours)
Model Calibration: July 22-23, 2008E. Duffins at Claremont (HY023)
Gauged Runoff Modelled Runoff
0.0
10.0
20.0
30.0
0 12 24 36 48 60 72 84 96 108
120
Flow
(cm
s)
Time (Hours)
Model Calibration: July 22-23, 2008Mitchel Creek at Claremont (HY047)
Gauged Runoff Modelled Runoff
Calibration Results - Storm Event -July 22 - 23, 2008

0.00
10.00
20.00
30.00
40.00
0 12 24 36 48 60 72 84 96
Flow
(cm
s)
Time (Hours)
Model Calibration: June 24, 2010Duffins Creek at Ajax (HC049)
Gauged Runoff Modelled Runoff
0.00
10.00
20.00
0.00
12.00
24.00
36.00
48.00
60.00
72.00
84.00
96.00
Flow
(cm
s)
Time (Hours)
Model Calibration: June 24, 2010W. Duffins at HWY 7 (HY066)
Gauged Runoff Modelled Runoff
0.00
10.00
20.00
0.00
12.00
24.00
36.00
48.00
60.00
72.00
84.00
96.00
Flow
(cm
s)
Time (Hours)
Model Calibration: June 24, 2010Reesor Creek at 8th Conc. (HY999)
Gauged Runoff Modelled Runoff
0.00
10.00
20.00
0.00
12.00
24.00
36.00
48.00
60.00
72.00
84.00
96.00
Flow
(cm
s)
Time (Hours)
Model Calibration: June 24, 2010Ganetsekiagon Creek (HC028)
Gauged Runoff Modelled Runoff
0.00
10.00
20.00
0.00
12.00
24.00
36.00
48.00
60.00
72.00
84.00
96.00
Flow
(cm
s)
Time (Hours)
Model Calibration: June 24, 2010Urfe Creek (HC065)
Gauged Runoff Modelled Runoff
0.00
10.00
20.00
0.00
12.00
24.00
36.00
48.00
60.00
72.00
84.00
96.00
Flow
(cm
s)
Time (Hours)
Model Calibration: June 24, 2010Brougham Creek (HY010)
Gauged Runoff Modelled Runoff
0.00
10.00
20.00
0 12 24 36 48 60 72 84 96
Flow
(cm
s)
Time (Hours)
Model Calibration: June 24, 2010E. Duffins at Claremont (HY023)
Gauged Runoff Modelled Runoff
0.00
10.00
20.00
0.00
12.00
24.00
36.00
48.00
60.00
72.00
84.00
96.00
Flow
(cm
s)
Time (Hours)
Model Calibration: June 24, 2010Mitchel Creek at Claremont (HY047)
Gauged Runoff Modelled Runoff
Calibration Results - Storm Event -June 24,2010

0.00
10.00
20.00
30.00
0 12 24 36 48 60 72 84 96
Flow
(cm
s)
Time (Hours)
Model Calibration: June 27-28, 2010Duffins Creek at Ajax (HC049)
Gauged Runoff Modelled Runoff
0.00
10.00
20.00
0.00
12.00
24.00
36.00
48.00
60.00
72.00
84.00
96.00
Flow
(cm
s)
Time (Hours)
Model Calibration: June 27-28, 2010W. Duffins at HWY 7 (HY066)
Gauged Runoff Modelled Runoff
0.000
10.000
20.000
0.00
12.00
24.00
36.00
48.00
60.00
72.00
84.00
96.00
Flow
(cm
s)
Time (Hours)
Model Calibration: June 27-28, 2010Reesor Creek at 8th Conc. (HY999)
Gauged Runoff Modelled Runoff
0.00
10.00
20.00
0.00
12.00
24.00
36.00
48.00
60.00
72.00
84.00
96.00
Flow
(cm
s)
Time (Hours)
Model Calibration: June 27-28, 2010Urfe Creek (HC065)
Gauged Runoff Modelled Runoff
0.00
10.00
20.00
0.00
12.00
24.00
36.00
48.00
60.00
72.00
84.00
96.00
Flow
(cm
s)
Time (Hours)
Model Calibration: June 27-28, 2010Ganetsekiagon Creek (HC028)
Gauged Runoff Modelled Runoff
0.00
10.00
20.00
0.00
12.00
24.00
36.00
48.00
60.00
72.00
84.00
96.00
Flow
(cm
s)
Time (Hours)
Model Calibration: June 27-28, 2010Brougham Creek (HY010)
Gauged Runoff Modelled Runoff
0.00
10.00
20.00
0 12 24 36 48 60 72 84 96
Flow
(cm
s)
Time (Hours)
Model Calibration: June 27-28, 2010E. Duffins at Claremont (HY023)
Gauged Runoff Modelled Runoff
0.00
10.00
20.00
0.00
12.00
24.00
36.00
48.00
60.00
72.00
84.00
96.00
Flow
(cm
s)
Time (Hours)
Model Calibration: June 27-28, 2010Mitchel Creek at Claremont (HY047)
Gauged Runoff Modelled Runoff
Calibration Results - Storm Event -June 27-28, 2010
0.00
10.00
20.00
30.00
0 12 24 36 48 60 72 84
Flow
(cm
s)
Time (Hours)
Model Calibration: July 23, 2010Duffins Creek at Ajax (HC049)
Gauged Runoff Modelled Runoff
0.00
10.00
20.00
0.00
12.00
24.00
36.00
48.00
60.00
72.00
84.00
Flow
(cm
s)
Time (Hours)
Model Calibration: July 23, 2010W. Duffins at HWY 7 (HY066)
Gauged Runoff Modelled Runoff
0.00
10.00
20.00
0.00
12.00
24.00
36.00
48.00
60.00
72.00
84.00
Flow
(cm
s)
Time (Hours)
Model Calibration: July 23, 2010Reesor Creek at 8th Conc. (HY999)
Gauged Runoff Modelled Runoff
0.00
10.00
20.00
30.00
0.00
12.00
24.00
36.00
48.00
60.00
72.00
84.00
Flow
(cm
s)
Time (Hours)
Model Calibration: July 23, 2010Ganetsekiagon Creek (HC028)
Gauged Runoff Modelled Runoff
0.00
10.00
20.00
0.00
12.00
24.00
36.00
48.00
60.00
72.00
84.00
Flow
(cm
s)
Time (Hours)
Model Calibration: July 23, 2010Urfe Creek (HC065)
Gauged Runoff Modelled Runoff
0.00
10.00
20.00
0.00
12.00
24.00
36.00
48.00
60.00
72.00
84.00
Flow
(cm
s)
Time (Hours)
Model Calibration: July 23, 2010Brougham Creek (HY010)
Gauged Runoff Modelled Runoff
0.00
10.00
20.00
0 12 24 36 48 60 72 84
Flow
(cm
s)
Time (Hours)
Model Calibration: July 23, 2010E. Duffins at Claremont (HY023)
Gauged Runoff Modelled Runoff
0.00
10.00
20.00
0.00
12.00
24.00
36.00
48.00
60.00
72.00
84.00
Flow
(cm
s)
Time (Hours)
Model Calibration: July 23, 2010Mitchel Creek Claremont (HY047)
Gauged Runoff Modelled Runoff
Calibration Results - Storm Event -July 23,2010

City Of Pickering / TRCA 11 February 2013 2012 Duffins Creek Hydrology Update
Aquafor Beech Limited
APPENDIX E:
Model Calibration: Antecedent Rainfall Relationships

-100%-80%-60%-40%-20%
0%20%40%
0 5 10 15 20 25 30 35
CN
adj
ustm
ent
API (mm)
Reesor Creek (HY999)
2002 model results ('99 storms) 2012 model results ('03-'10 storms) 2012 Verification ('00 storms)

-100%-80%-60%-40%-20%
0%20%40%
0 5 10 15 20 25 30 35
CN
adj
ustm
ent
API (mm)
West Duffins - Green River (HC038)
2002 model results ('99 storms) 2012 model results ('03-'10 storms) - HC038 2012 Verification ('00 storms)

-100%-80%-60%-40%-20%
0%20%40%
0 5 10 15 20 25 30 35
CN
adj
ustm
ent
API (mm)
East Duffins Creek (HY019)
2002 model results ('99 storms) 2012 model results ('03-'12 storms) - HY019 2012 Verification ('00 storms)

-100%-80%-60%-40%-20%
0%20%40%
0 5 10 15 20 25 30 35
CN
adj
ustm
ent
API (mm)
Urfe Creek (HY065)
2002 model results ('99 storms) 2012 model results ('03-'10 storms) - HY065 2012 Verification ('00 storms)

-100%-80%-60%-40%-20%
0%20%40%
0 5 10 15 20 25 30 35
CN
adj
ustm
ent
API (mm)
Brougham Creek (HY010)
2002 model results ('99 storms) 2012 model results ('03-'10 storms) 2012 Verification

-100%-80%-60%-40%-20%
0%20%40%
0 5 10 15 20 25 30 35
CN
adj
ustm
ent
API (mm)
Duffins Creek at Ajax (HY049)
2002 model results ('99 storms) 2012 model results ('03-'10 storms) 2012 Verification ('00 storms)

City Of Pickering / TRCA 11 February 2013 2012 Duffins Creek Hydrology Update
Aquafor Beech Limited
APPENDIX F:
Model Calibration: Observed vs. Simulated Validation Event Results

Validation Results - May 11, 2000
0
4
8
12
0 20 40 60 80 100
120
140
160
180
Flow
(m3/
s)
Time (Hours)
Model Calibration: May 11-12'00 StormReesor Creek (02HC039)
Gauged Runoff Modelled Runoff
0
10
20
30
0 20 40 60 80 100
120
140
160
180Fl
ow (m
3/s)
Time (Hours)
Model Calibration: May 11-12'00 StormEast Duffins Creek (02HC019)
Gauged Runoff Modelled Runoff
0
20
40
60
80
0 20 40 60 80 100
120
140
160
180
Flow
(m3/
s)
Time (Hours)
Model Calibration:May 11-12'00 StormDuffins Creek at Ajax (02HC049)
Gauged Runoff Modelled Runoff
0
4
8
12
0 20 40 60 80 100
120
140
160
180
Flow
(m3/
s)
Time (Hours)
Model Calibration:May 11-12'00 StormW.Duffins Creek @Green River (02HC038)
Gauged Runoff Modelled Runoff
0
4
8
12
0 20 40 60 80 100
120
140
160
180
Flow
(m3/
s)
Time (Hours)
Model Calibration:May 11-12'00 StormUrfe Creek (gauge #37)
Gauged Runoff Modelled Runoff
0
4
8
12
0 20 40 60 80 100
120
140
160
180Fl
ow (m
3/s)
Time (Hours)
Model Calibration:May 11-12'00 StormBrougham Creek (gauge #36)
Gauged Runoff Modelled Runoff

Validation Results - June 13, 2000
0
4
8
12
0 20 40 60
Flow
(m3/
s)
Time (Hours)
Model Calibration: June 13'00 StormReesor Creek (02HC039)
Gauged Runoff Modelled Runoff
0
10
20
30
0 20 40 60Fl
ow (m
3/s)
Time (Hours)
Model Calibration: June 13'00 StormEast Duffins Creek (02HC019)
Gauged Runoff Modelled Runoff
0
20
40
60
80
0 20 40 60
Flow
(m3/
s)
Time (Hours)
Model Calibration: June 13'00 StormDuffins Creek at Ajax (02HC049)
Gauged Runoff Modelled Runoff
0
4
8
12
0 20 40 60
Flow
(m3/
s)
Time (Hours)
Model Calibration: June 13'00 StormW.Duffins Creek @Green River (02HC038)
Gauged Runoff Modelled Runoff
0
4
8
12
0 20 40 60
Flow
(m3/
s)
Time (Hours)
Model Calibration: June 13'00 StormUrfe Creek (guage #37)
Gauged Runoff Modelled Runoff
0
4
8
12
0 20 40 60Fl
ow (m
3/s)
Time (Hours)
Model Calibration: June 13'00 StormBrougham Creek (guage #36)
Gauged Runoff Modelled Runoff

Validation Results - June 24, 2000
0
4
8
12
0 20 40 60 80 100
120
140
160
180
Flow
(m3/
s)
Time (Hours)
Model Calibration: June 24 '00 StormReesor Creek (02HC039)
Gauged Runoff Modelled Runoff
0
10
20
30
0 20 40 60 80 100
120
140
160
180Fl
ow (m
3/s)
Time (Hours)
Model Calibration: June 24 '00 StormEast Duffins Creek (02HC019)
Gauged Runoff Modelled Runoff
0
20
40
60
80
0 20 40 60 80 100
120
140
160
180
Flow
(m3/
s)
Time (Hours)
Model Calibration: June 24 '00 StormDuffins Creek at Ajax (02HC049)
Gauged Runoff Modelled Runoff
0
4
8
12
0 20 40 60 80 100
120
140
160
180
Flow
(m3/
s)
Time (Hours)
Model Calibration: June 24 '00 StormW.Duffins Creek @Green River (02HC038)
Gauged Runoff Modelled Runoff
0
4
8
12
0 20 40 60 80 100
120
140
160
180
Flow
(m3/
s)
Time (Hours)
Model Calibration: June 24 '00 StormUrfe Creek (gauge #37)
Gauged Runoff Modelled Runoff
0
4
8
12
0 20 40 60 80 100
120
140
160
180Fl
ow (m
3/s)
Time (Hours)
Model Calibration: June 24 '00 StormBrougham Creek (gauge #36)
Gauged Runoff Modelled Runoff
City Of Pickering / TRCA 11 February 2013 2012 Duffins Creek Hydrology Update
Aquafor Beech Limited
APPENDIX G:
Model Calibration: Review of Radar Data

To: Nick Lorrain
Water Resources Coordinator November 9, 2012
From: Tom Dole
Water Resources Engineer Copy: Senior Water Resources Engineer Subject: 2012 Duffins Creek Hydrology Update - Calibration/ Validation Event Summary The following is a brief description of the calibration and validation results. The intent of the analysis is to explain large discrepancies (greater than 25%) between simulated and observed flows. .
Memo
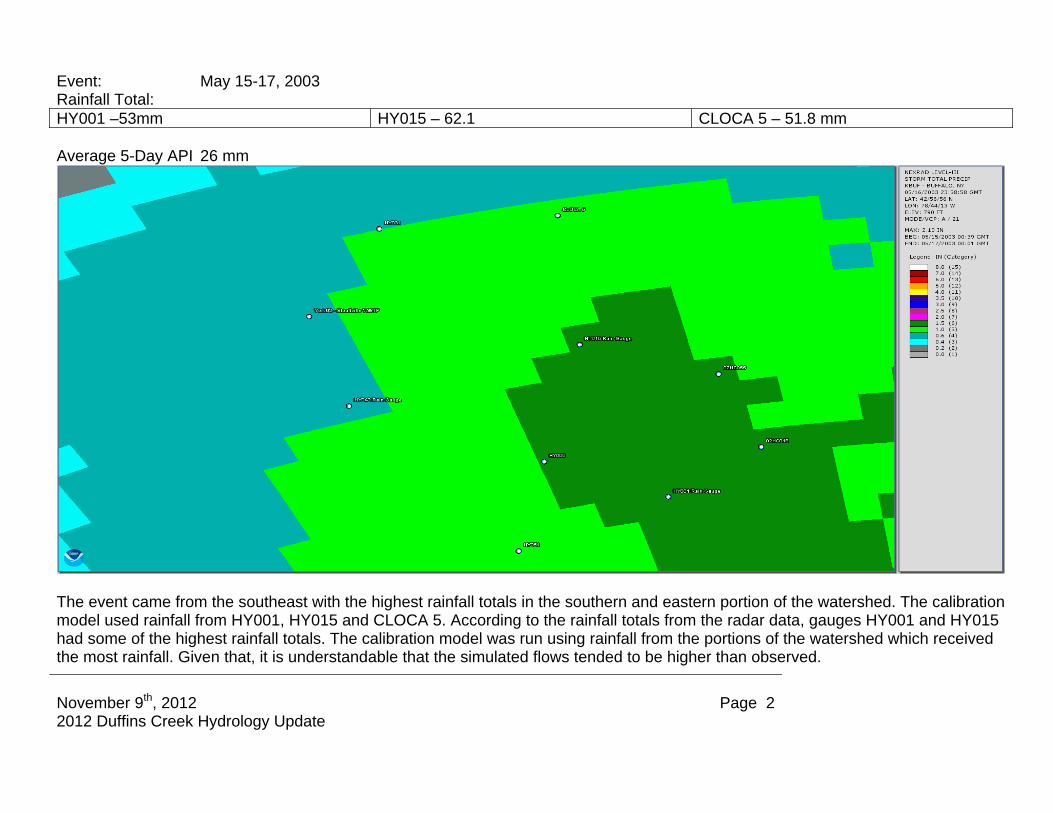
November 9th, 2012 2012 Duffins Creek Hydrology Update
Page 2
Event: May 15-17, 2003 Rainfall Total: HY001 –53mm HY015 – 62.1 CLOCA 5 – 51.8 mm Average 5-Day API 26 mm
The event came from the southeast with the highest rainfall totals in the southern and eastern portion of the watershed. The calibration model used rainfall from HY001, HY015 and CLOCA 5. According to the rainfall totals from the radar data, gauges HY001 and HY015 had some of the highest rainfall totals. The calibration model was run using rainfall from the portions of the watershed which received the most rainfall. Given that, it is understandable that the simulated flows tended to be higher than observed.

November 9th, 2012 2012 Duffins Creek Hydrology Update
Page 3
Event: May 23-24, 2003 Rainfall Total: HY001 –30 mm HY009 – 26.4 mm CLOCA 5 – 30.9 Average 5-Day API 10 mm
The event came from the southwest with the highest rainfall totals in the southwest part of the watershed according to the rainfall data. The calibration model used rainfall from HY001, HY015 and CLOCA 5. The recorded rainfall at these gauges was fairly uniform which is confirmed by the radar data. The simulated and observed flows were very close at the lake. However, the model did tend to overpredict flows at the subwatershed level.

November 9th, 2012 2012 Duffins Creek Hydrology Update
Page 4
Event: July 29-30, 2006 Rainfall Total: HY031 – 57.8mm 02HC018 – 98.5mm 02HC055 – 103.3mm CLOCA 5 – 53.1mm HY043 – 19.8mm Average 5-Day API 8
The event came in a narrow band from the northwest. The highest rainfall totals were throughout the centre of the watershed. The radar data and recorded rainfall differed rather significantly. Despite the non-uniform rainfall pattern, the use of multiple rain gauges led to good agreement between simulated and observed results.

November 9th, 2012 2012 Duffins Creek Hydrology Update
Page 5
Event: July 23, 2008 Rainfall Total: HY001 – 16.4mm HY015 – 41mm HY031 – 11.8mm CLOCA 5 – 8.1mm HY043 – 19.8mm Average 5-Day API 52 mm
Rainfall distribution in this event was very uneven. The radar showed characteristics of localized thunderstorm cells. The highest rainfall amounts were concentrated in a band through the centre of the watershed. From the radar data it is apparent that the available rain gauges missed the areas with the highest rainfall amounts. This is confirmed by the observed flows being significantly higher than simulated in the more central subwatersheds such as Urfe Creek.

November 9th, 2012 2012 Duffins Creek Hydrology Update
Page 6
Simulated flows were significantly higher than observed on the East Duffins Creek and Michell Creek. Rainfall data for these catchments was taken from HY015, HY031 and CLOCA 5. The radar data confirms that the use of data from HY015 for Catchments 4701, 4702 and 5001 is appropriate given that the rainfall was most intense in these catchments. However, the flows from the catchments using data from HY015 are driving up the flows which suggests that the rainfall totals within these catchments were lower.

November 9th, 2012 2012 Duffins Creek Hydrology Update
Page 7
Event: June 24, 2010 Rainfall Total: HY001 – 26.4mm HY009 – 35.2mm HY015 – 29.2mm HY031 – 27.2mm HY043 – 31.2mm CLOCA 5 – 23.6mm Average 5-Day API 18 mm
This system came from the west. The rainfall distribution for this event was relatively even with some more intense pockets through the centre of the watershed. Rainfall totals from the gauges were quite close. However, there are no gauges within the central areas which had the higher rainfall totals.

November 9th, 2012 2012 Duffins Creek Hydrology Update
Page 8
There was good agreement between simulated and observed peak flows. The simulated flows for Mitchell Creek were relatively higher than observed. This can be explained by the areal distribution of rainfall as the radar data indicates that there was a lot less rain within the Mitchell Creek subwatershed than what fell at the surrounding gauges.

November 9th, 2012 2012 Duffins Creek Hydrology Update
Page 9
Event: June 27, 28, 2010 Rainfall Total: HY001 –31.0 mm HY009 – 29.0 mm HY015 – 18.0 mm HY031 – 19.2 mm HY043 –19.6 mm CLOCA 5 –18.6 mm Average 5-Day API 57 mm
This system came from the west. The model showed good agreement with the observed data. The notable exception being Michell Creek where simulated flows were higher than observed. According to the radar data the rainfall totals within the catchment were slightly lower than the recorded data at the gauges. This may explain some of the difference between simulated and observed.

November 9th, 2012 2012 Duffins Creek Hydrology Update
Page 10
Event: July 23, 2010 Rainfall Total: HY001 –55.8 mm HY015 – 47.6 mm HY031 – 41.6 mm HY043 – 57.2 mm CLOCA 5 – 39.0mm Average 5-Day API 11 mm
This system came from the west. According to the radar data this was a fairly uniform event although the radar’s rainfall totals were lower than the recorded values. The simulated and observed flows were in good agreement. Event: May 11, 2000

November 9th, 2012 2012 Duffins Creek Hydrology Update
Page 11
Rainfall Total: York 02 – Stouffville WWTP – 61.2 mm Average 5-Day API 10 mm
This system came from the west. With the exception of the East Duffins HC019 gauge, observed flows were all higher than simulated. This is to be expected given that the rainfall data is taken from York 02-Stouffville WWTP which, according to the radar data, experienced lower rainfall totals than other parts of the watershed. Observed flows in Urfe Creek were much higher than simulated. This is to be expected as, according to the radar data, the Urfe Creek subwatershed experienced significantly higher rainfall totals than Stouffville.

November 9th, 2012 2012 Duffins Creek Hydrology Update
Page 12
Event: June 13, 2000 Rainfall Total: York 02-Stouffville WWTP – 45.4 mm Average 5-Day API 8 mm
This system came from the west. The rainfall was relatively evenly distributed. Simulated and observed flows were in good agreement.

November 9th, 2012 2012 Duffins Creek Hydrology Update
Page 13
Event: June 24, 2000 Rainfall Total York02-WWTP Stouffville – 41.0 mm Average 5-Day API 9 mm
The system came from the south. The rainfall distribution was relatively even although there were higher rainfall totals in the very southern portion of the watershed. There was good agreement between simulated and observed flows. Trends

City Of Pickering / TRCA 11 February 2013 2012 Duffins Creek Hydrology Update
Aquafor Beech Limited
APPENDIX H:
Design Storm Hyetographs
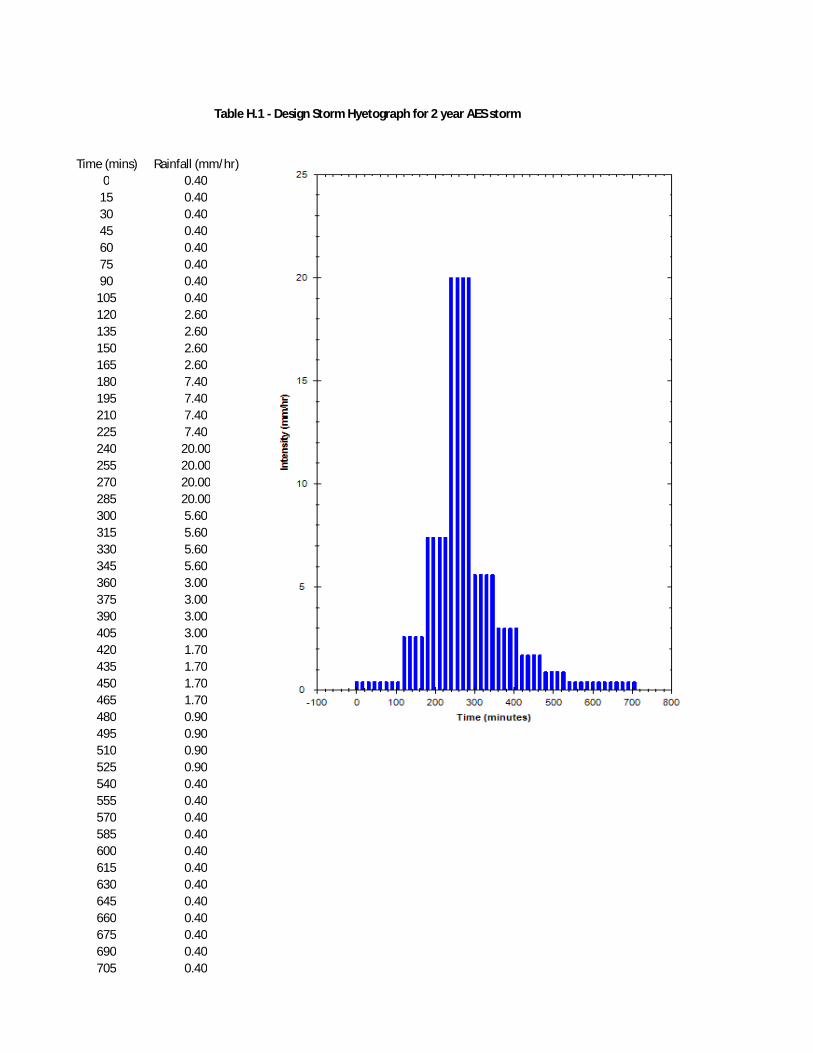
Time (mins) Rainfall (mm/hr)0 0.40
15 0.4030 0.4045 0.4060 0.4075 0.4090 0.40
105 0.40120 2.60135 2.60150 2.60165 2.60180 7.40195 7.40210 7.40225 7.40240 20.00255 20.00270 20.00285 20.00300 5.60315 5.60330 5.60345 5.60360 3.00375 3.00390 3.00405 3.00420 1.70435 1.70450 1.70465 1.70480 0.90495 0.90510 0.90525 0.90540 0.40555 0.40570 0.40585 0.40600 0.40615 0.40630 0.40645 0.40660 0.40675 0.40690 0.40705 0.40
Table H.1 - Design Storm Hyetograph for 2 year AES storm

Time (mins) Rainfall (mm/hr)0 0.60
15 0.6030 0.6045 0.6060 0.6075 0.6090 0.60
105 0.60120 3.30135 3.30150 3.30165 3.30180 9.40195 9.40210 9.40225 9.40240 25.40255 25.40270 25.40285 25.40300 7.20315 7.20330 7.20345 7.20360 3.90375 3.90390 3.90405 3.90420 2.20435 2.20450 2.20465 2.20480 1.10495 1.10510 1.10525 1.10540 0.60555 0.60570 0.60585 0.60600 0.60615 0.60630 0.60645 0.60660 0.60675 0.60690 0.60705 0.60
Table H.2 - Design Storm Hyetograph for 5 year AES storm

Time (mins) Rainfall (mm/hr)0 0.60
15 0.6030 0.6045 0.6060 0.6075 0.6090 0.60
105 0.60120 3.80135 3.80150 3.80165 3.80180 10.70195 10.70210 10.70225 10.70240 29.00255 29.00270 29.00285 29.00300 8.20315 8.20330 8.20345 8.20360 4.40375 4.40390 4.40405 4.40420 2.50435 2.50450 2.50465 2.50480 1.30495 1.30510 1.30525 1.30540 0.60555 0.60570 0.60585 0.60600 0.60615 0.60630 0.60645 0.60660 0.60675 0.60690 0.60705 0.60
Table H.3 - Design Storm Hyetograph for 10 year AES storm
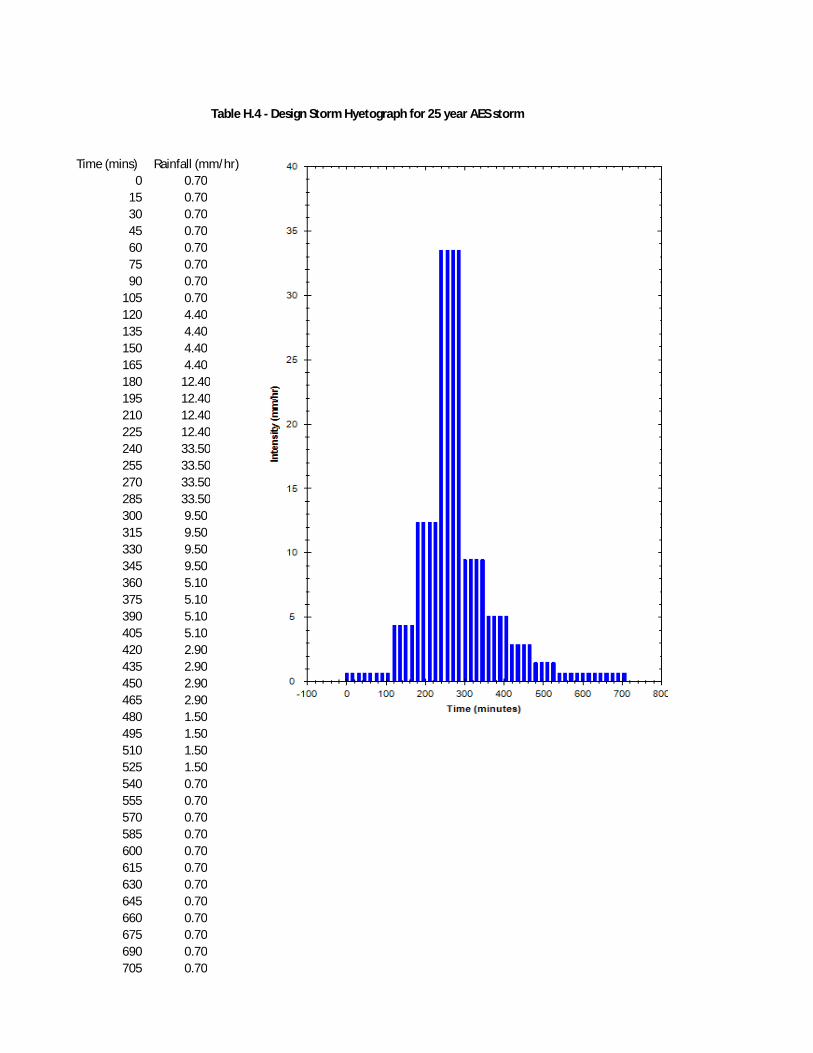
Time (mins) Rainfall (mm/hr)0 0.70
15 0.7030 0.7045 0.7060 0.7075 0.7090 0.70
105 0.70120 4.40135 4.40150 4.40165 4.40180 12.40195 12.40210 12.40225 12.40240 33.50255 33.50270 33.50285 33.50300 9.50315 9.50330 9.50345 9.50360 5.10375 5.10390 5.10405 5.10420 2.90435 2.90450 2.90465 2.90480 1.50495 1.50510 1.50525 1.50540 0.70555 0.70570 0.70585 0.70600 0.70615 0.70630 0.70645 0.70660 0.70675 0.70690 0.70705 0.70
Table H.4 - Design Storm Hyetograph for 25 year AES storm

Time (mins) Rainfall (mm/hr)0 0.80
15 0.8030 0.8045 0.8060 0.8075 0.8090 0.80
105 0.80120 4.80135 4.80150 4.80165 4.80180 13.60195 13.60210 13.60225 13.60240 36.90255 36.90270 36.90285 36.90300 10.40315 10.40330 10.40345 10.40360 5.60375 5.60390 5.60405 5.60420 3.20435 3.20450 3.20465 3.20480 1.60495 1.60510 1.60525 1.60540 0.80555 0.80570 0.80585 0.80600 0.80615 0.80630 0.80645 0.80660 0.80675 0.80690 0.80705 0.80
Table H.5 - Design Storm Hyetograph for 50 year AES storm

Time (mins) Rainfall (mm/hr)0 0.90
15 0.9030 0.9045 0.9060 0.9075 0.9090 0.90
105 0.90120 5.20135 5.20150 5.20165 5.20180 14.90195 14.90210 14.90225 14.90240 40.20255 40.20270 40.20285 40.20300 11.40315 11.40330 11.40345 11.40360 6.10375 6.10390 6.10405 6.10420 3.50435 3.50450 3.50465 3.50480 1.70495 1.70510 1.70525 1.70540 0.90555 0.90570 0.90585 0.90600 0.90615 0.90630 0.90645 0.90660 0.90675 0.90690 0.90705 0.90
Table H.6 - Design Storm Hyetograph for 100 year AES storm

Time (mins) Rainfall (mm/hr)0 6.0
15 6.030 6.045 6.060 4.075 4.090 4.0
105 4.0120 6.0135 6.0150 6.0165 6.0180 13.0195 13.0210 13.0225 13.0240 17.0255 17.0270 17.0285 17.0300 13.0315 13.0330 13.0345 13.0360 23.0375 23.0390 23.0405 23.0420 13.0435 13.0450 13.0465 13.0480 13.0495 13.0510 13.0525 13.0540 53.0555 53.0570 53.0585 53.0600 38.0615 38.0630 38.0645 38.0660 13.0675 13.0690 13.0705 13.0
Table H.7 - Design Storm Hyetograph for Hurrian Hazel


![[Hydrology] groundwater hydrology david k. todd (2005)](https://img.pdfslide.us/doc/110x75/55a8e6001a28ab6c2f8b4687/hydrology-groundwater-hydrology-david-k-todd-2005-55b0d9a792c06.jpg)