Embed Size (px)
Citation preview

Drainage Master Plan Update
City of Killeen
Bell County, Texas
Engineer: David Harris
P.E. License No. 94995
Date: November 2012
Texas Engineering Firm License # F-474
Prepared by:

Document No. 110099
Job No. 100018246
DRAINAGE MASTER PLAN UPDATE
CITY OF KILLEEN
BELL COUNTY, TEXAS
Prepared for:
City of Killeen Environmental Services Division
P.O. Box 1326 Killeen, Texas 76540
Prepared by:
Atkins 6504 Bridge Point Parkway
Suite 200 Austin, Texas 78730
November 2012

Contents
100018246/110099 ii
Contents
Page
List of Figures ................................................................................................................................................ iv
List of Tables ................................................................................................................................................. iv
Acronyms and Abbreviations ........................................................................................................................ v
Executive Summary ...................................................................................................................................... vi
1.0 INTRODUCTION .......................................................................................................................................... 1-1
2.0 DATA COLLECTION ................................................................................................................................... 2-1
2.1 CITY OF KILLEEN DATA ................................................................................................................. 2-1
2.1.1 Previous Drainage Master Plans ..................................................................................... 2-1
2.1.2 Preliminary Engineering Reports ..................................................................................... 2-1
2.2 FIELD DATA ...................................................................................................................................... 2-4
2.3 AERIAL PHOTOGRAPHY ................................................................................................................ 2-4
2.4 HYDROLOGIC/HYDRAULIC MODELING INFORMATION .......................................................... 2-4
3.0 RUNOFF FLOW ESTIMATION .................................................................................................................. 3-1
3.1 CITY OF KILLEEN WATERSHEDS ................................................................................................ 3-1
3.2 SOUTH NOLAN CREEK HEC-HMS MODEL ................................................................................. 3-1
3.2.1 Rainfall............................................................................................................................... 3-4
3.2.2 Loss Rate .......................................................................................................................... 3-4
3.2.3 Transform .......................................................................................................................... 3-5
3.3 HYDROLOGIC SUMMARY AND RECOMMENDATIONS ............................................................ 3-5
4.0 MAJOR CAPITAL IMPROVEMENT PROJECTS .................................................................................... 4-1
4.1 RANKING CRITERIA ........................................................................................................................ 4-1
4.2 COST ESTIMATES ........................................................................................................................... 4-2
4.3 REGIONAL DETENTION CIP .......................................................................................................... 4-2
4.3.1 Introduction to Regional Detention Considerations ........................................................ 4-3
4.3.2 Regional Detention CIP Evaluation ................................................................................. 4-3
4.3.3 Regional Detention Recommendations ........................................................................ 4-13
4.4 STORM DRAIN AND DITCH NEIGHBORHOOD DRAINAGE .................................................... 4-13
4.4.1 Storm Drain and Ditch Neighborhood Recommendations ........................................... 4-17
4.5 STREAM REPAIR AND FLOODPLAIN IMPROVEMENTS ......................................................... 4-17
4.5.1 Stream Repair and Floodplain Improvement Recommendations ............................... 4-24
4.6 TRANSPORTATION CROSS DRAINAGE (BRIDGES AND CULVERTS) ................................ 4-24
4.7 DRAINAGE EASEMENT CONSIDERATIONS ............................................................................. 4-26
5.0 FEMA MAP CHANGES ............................................................................................................................... 5-1
6.0 WATER QUALITY CONSIDERATIONS .................................................................................................... 6-1
6.1.1 Water Quality Improvement Goals .................................................................................. 6-1
6.1.2 Water Quality Improvement Strategies ........................................................................... 6-3
7.0 CIP RECOMMENDATIONS & CONCLUSIONS ....................................................................................... 7-1
8.0 REFERENCES ............................................................................................................................................. 8-1

Contents
Page
100018246/110099 iii
Appendixes:
A 2005 DMP Report Sections not Superseded by this 2012 DMP
A.1 General Provisions (Section 3 of 2005 DMP)
A.2 Drainage System Evaluation (Section 4 of 2005 DMP)
A.3 Regulatory Influences (Section 5 of 2005 DMP)
A.4 Storm Water Management Plan (Section 7 of 2005 DMP)
A.5 Non-Point Source Pollution Assessment (Section 8 of 2005 DMP)
A.6 Drainage Maintenance Plan (Section 10 of 2005 DMP)
A.7 Administrative Solutions (Section 11 of 2005 DMP)
A.8 Financial Analysis (Section 12 of 2005 DMP)
B Schematic Evaluation Synopsis
B.1 Regional Detention CIPs
B.2 Storm Drain and Ditch Neighborhood Drainage CIP
B.3 Stream Channel Repair and Floodplain Improvements
C Overview Map

Contents
100018246/110099 iv
Figures
Page
E-1 Study Location Overview ........................................................................................................... ix
3-1 Watersheds Overview ............................................................................................................ 3-2
3-2 Hydrologic Soil Group Overview............................................................................................. 3-3
4-1 Potential Regional Detention Location Overview ................................................................... 4-4
4-2a Schematic Offline Pond Hydrograph ...................................................................................... 4-6
4-2b Schematic Online Pond Hydrograph ...................................................................................... 4-6
4-3 Storm Drain and Ditch Neighborhood CIP Location Overview ............................................. 4-14
4-4 Stream Repair and Floodplain Improvements Location Overview ....................................... 4-18
4-5 Example of Concrete Channel Needing Repair ................................................................... 4-19
4-6 Example of Stream Needing Channel Restoration and Enhancement ................................ 4-19
4-7 Street Flooding September 2010 Event ............................................................................... 4-25
5-1 1984 vs. 2008 FEMA 100-Year Floodplain ............................................................................ 5-2
6-1 Overview of 303(d) Listed Streams Within City of Killeen ...................................................... 6-2
Tables
E-1 Summary of CIPs Recommended for Capital Improvement Bond Funding ............................. vii
E-2 Summary of Cost versus the Type of Project ........................................................................... xii
2-1 Summary Status of 2005 DMP Identified CIPs ...................................................................... 2-2
3-1 FFEMA HEC-HMS Model Rainfall .......................................................................................... 3-4
3-1 USGS Rainfall Frequency Distribution ................................................................................... 3-4
4-1 Conceptual Existing Conditions Flow Reduction using Regional Detention .......................... 4-8
4-2 Existing versus Ultimate Development Flow and Volume at Regional Detention CIP ........... 4-9
4-3 Regional Detention Pond Ranking Summary ....................................................................... 4-10
4-4 Storm Drain and Ditch Neighborhood Drainage CIP Ranking Summary ............................. 4-15
4-5 Stream Repair and Floodplain Improvements Ranking Summary ....................................... 4-20
4-6 Priority Stream Crossing for Suggested for Future Improvements Consideration ............... 4-26
6-1 FEMA 1984 vs. 2008 Houses in 100-year Floodplain Count ................................................. 5-1
7-1 Summary of CIPs Recommended for Capital Improvement Bond Funding ........................... 7-3

100018246/110099 v
Acronyms and Abbreviations
BMP Best Management Practice
cfs cubic feet per second
CIP capital improvement project
City City of Killeen
CN curve numbers
DMP drainage master plan
EPA Environmental Protection Agency
FEMA Federal Emergency Management Agency
FIRM Flood Insurance Rate Map
FIS Flood Insurance Study
ft feet/foot
GIS geographic information system
H/H hydrologic/hydraulic
HEC U.S. Army Corps of Engineers Hydrologic Engineering Center
HEC-HMS Hydrologic Engineering Center’s Hydrologic Modeling System
LID low impact development
LOS level of service
MS4 Municipal Separate Storm Drain System
NRCS Natural Resources Conservation Service
PER preliminary engineering report
RCB reinforced concrete box
RCP reinforced concrete pipe
SWMP Storm Water Management Plan
Tc time of concentration
TCEQ Texas Commission on Environmental Quality
TP-40 Technical Paper 40 (NRCS)
USGS U.S. Geological Survey
WQ/FC water quality/flood control

100018246/110099 vi
Executive Summary
This report is an update to the 2005 Drainage Master Plan (DMP) report. The focus of the work
performed for this 2012 DMP was to prioritize drainage capital improvement projects (CIP) so that
available capital improvement dollars may be directed toward the highest priority CIPs. In order to
maintain continuity between the 2005 and the 2012 DMPs, this 2012 DMP report includes all of the same
sections that were presented in the 2005 DMP. However, not all the sections were rewritten in this 2012
DMP report. The following sections from the 2005 DMP are not revised by this report: 3) General
Provisions, 4) Drainage System Evaluation, 5) Regulatory Influences, 7) Storm Water Management Plan,
8) Non-Point Source Pollution Assessment, 10) Drainage Maintenance Plan, 11) Administrative
Solutions, and 12) Financial Analysis. Therefore these sections are repeated verbatim in Appendix A of
this report. The body of this report is focused on drainage CIP prioritization.
Capital improvement projects are broken into two financial categories: major and minor. Major CIP
projects are estimated to cost more than $200,000 and minor CIP projects are estimated to cost less than
$200,000. This report generally only considers the major CIP projects in detail. The minor CIP projects
are addressed by City staff on an ongoing basis; however, minor CIPs are ranked and prioritized using the
same ranking criteria used for major CIPs (as discussed in Section 4.1). The major CIP projects were
organized into 3 categories: 1) regional detention, 2) storm drain and ditch neighborhood drainage, and 3)
stream repair and floodplain improvements. A fourth category of CIPs concerning transportation drainage
(bridges and culverts) are presented but are not ranked or evaluated. There are 29 CIP projects that have
been identified and ranked in this 2012 DMP, including 8 possible regional detention CIPs, 8 storm
drain/ditch neighborhood CIPs, and 13 stream repair and floodplain improvements CIPs. See Figure E-1
for an overview of the location of these CIPs, also see the overview map in Appendix C for more detailed
information. Each CIP was given a unique identification number such as 2005-18 or 2012-08. The CIP
identification numbers always start with 2005-, 2008- or 2012- indicating the year of the master plan that
the CIP was conceived in, and ending in an arbitrary two digit number.
The projects are discussed and ranked in detail in Section 4. The identified CIP projects were first ranked
against similar CIPs within one of the three categories. In other words, regional detention CIPs were not
ranked alongside storm drain and ditch CIPs; regional detention CIPs were only ranked against other
regional detention CIPs, and storm drain and ditch neighborhood drainage CIPs were only ranked against
other similar CIPs. This is because the objectives and cost differences are so dissimilar among the 3
categories that it is more useful to rank the CIPs amongst similar projects. However, in section 7, CIP
Recommendations and Conclusions, the CIP projects are prioritized for the top 15 overall (all categories)
priority drainage projects across the City of Killeen.
There were a total of 29 possible CIPs locations considered for this study. Of these, 15 have been
identified as having the highest priority. See the below Table E-1 for a summary of the top 15
recommended drainage projects identified for further study.

Executive Summary
100018246/110099 vii
Table E-1 Summary of CIPs Recommended for Capital Improvement Bond Funding
Overall Priority
Project Reference Number
Capital Improvement Project (CIP)
Type of Project
Description of Project Estimated Cost ($)*
1 N/A Regional Watershed Modeling and Floodplain Mapping
Study In light of the more recent information and rapid development a revised floodplain study is recommended. This study would allow for an organized and concise set of hydrologic/hydraulic models that could be used in watershed management and would serve as a starting point to build upon for the regional detention analysis.
250,000
2 N/A Regional Detention Pond Analysis
Study As the City continues to develop rapidly, it is recommended that a comprehensive watershed wide detention analysis be performed in order to assess the best locations for future regional detention ponds and to ensure that watershed timing is properly accounted for considering all detention ponds.
250,000
3 2005-27 Greenforest Circle
Storm Drain and Inlets
N Streets and neighborhoods experience flooding due to the lack of a conveyance system. Recommend adding storm drain and curb inlets. Drainage on Greenforest Circle and South Roy Reynolds will both see improvements.
208,000
4 2012-21 Trimmier/10th Street at Hallmark Storm Drain and Inlets
N Water flows down Trimmier Road to the intersection of E. Hallmark Avenue where it splits to the west down Hallmark Avenue, and north down South 10th Street causing road inundation and a traffic hazard. Additional storm drain inlets and pipe along Trimmier/10th Street that would tie into an existing system that outfalls at South Nolan Creek is recommended. There is also a high ground water table in this area that may exacerbate drainage issues. This project may also be combined with proposed road improvements.
227,000
5 2012-11 Stewart Ditch Channel Repair and Improvements
S This concrete channel has some of the most severe and numerous structural failures in the City. There are approximately 88 structures in the 100-year floodplain, and channel improvements should be considered as per the Walker Partners Study.
862,000
6 2012-02 Woodrow - Phase 2
Storm Drain Construction
N Phase 1 storm drain improvements have been completed. Add additional (Phase II) curb inlets and storm drain along Woodward Drive.
364,000
7 2005-20a Valley Road Ditch
Phase 2
Floodplain Mitigation
S The first priority is to repair the concrete channel and prevent the progression of existing failures. As funding is available, channel and culvert improvements should be considered as per the Walker Partners study. Improvements to the railroad culverts have recently been funded to add two 72-inch RCP.
373,000
8 2005-20b Valley Road Ditch
Phase 3
Floodplain Mitigation
S Avenue A to Avenue B improvements including demolish existing concrete channel lining, headwall and improve culvert at Avenue A should be considered as per the Walker Partners Study.
928,000
9 2012-20a
&
2012-20b
Edgefield/Rainforest Stream Restoration
S These two reaches are highly eroded and have little aesthetic value. Two existing concrete grade-control structures have been washed out and should be replaced with rock riprap (or concrete). Other grading and landscaping alternatives should be considered to enhance vegetation and aesthetics.
400,000

Executive Summary
100018246/110099 viii
Overall Priority
Project Reference Number
Capital Improvement Project (CIP)
Type of Project
Description of Project Estimated Cost ($)*
10 2008-05 Briarcroft Lane Culvert and Ditch/Channel Improvements
N Increase Briarcroft culvert outlet to 50-year level of service (LOS) and improve surrounding ditches; improve Tanglewood Estates Outlet Channel to 50-year LOS should be considered as per the 2005 DMP.
181,000
11 2012-16 Misty Lane Phase 2 Storm Drain Improvement
N Storm drain improvements to improve residential street drainage should be considered as per the Wallace Group Study.
275,000
12 2012-03 Woodrow Phase 3
Storm Drain Construction
N Phase 1 Storm Drain improvements have been completed. Add additional (Phase 3) curb Inlets and storm drain along Jake Spoon Drive should be considered as per the Walker Partners Study.
143,000
13 2005-24 Dickens Ditch
Stream Repair
S This reach is experiencing some erosion and has the potential to damage private property and erode outside of the drainage easement. Erosion is just now and will continue to progress outside of the drainage easement. Therefore, actions to stabilize the stream reach downstream of Westcliff Road should be considered.
351,000
14 2012-07 Skyline Ave
Storm Drain and Inlets
N Runoff from the apartment complex at the top of the drainage area should be better directed into existing storm drain inlet, or otherwise directed away from the three homes that reported flooding in the September 2010 event. Storm water runoff is also known to cause street and yard flooding. Therefore, storm drains and curb inlets should be considered on Swope Drive and Skyline Avenue.
650,000
15 2005-28 Long Branch
Environmental Enhancements
S This area was identified in the 2005 DMP for possible detention. Although there are some downstream flooding issues, this area is perceived to be better suited for environmental enhancements such as riffle pool and water quality environmental enhancements. Detention is not recommended here, but environmental and aesthetic improvements should be considered.
500,000
Approximate Total Cost ($) 6,000,000
N = Storm Drain & Ditch Neighborhood Drainage
S = Stream Repair and Floodplain Improvement
* Costs are approximate and are based on schematic assumptions; more detailed preliminary engineering
analysis is required to define cost with greater certainty.

Cap
rice D
itch
Aco
rn C
reek
Hay
s B
ran
ch
South Nolan Creek
Ste
wa
rt Ditc
h
Little
Nola
n Cre
ek
North
Reese C
reek Trib 1
Lib
erty
Dic
h
Lo
ng
Bra
nc
h D
itch
Old Florence Ditch
Valle
y R
oad
Ditc
h
Trimmier Creek
Trimmier Road Ditch
No
rth R
eese C
reek
Upper R
eese Creek
South Nolan Creek
South Nolan Creek
Littl
e Nol
an C
reek
2008-05
2012-11
2012-10
2012-09
2008-04
2012-02 &2012-03
2012-12
2012-19
2012-08
2012-18
2005-20A & 2005-20B
2005-182012-14
2005-03
2012-21
2005-28
2012-16
2012-07
2005-242005-25
2012-20b
2012-20a
2005-01
2005-15
2005-26
2005-27
2005-13
6504 Bridge Point Pkwy, Ste. 200
Austin, Texas 78730
Phone: (512) 327-6840
Figure E-1
City of Killeen Overview
Job No.: 100018246
Prepared by: D. Harris
File: Executive Summary Overview Map 8_5 X 11.mxd
Scale: 1 inch = 1.5 miles
Date: July, 2012
Legend
Approximate CIP Location
City Limits
Stream or Creek Flow Line
PRINCIPAL ARTERIAL
MARGINAL ACCESS
COLLECTOR
LOCAL STREET
0 1.5 3Miles
See Appendix C for a map size 18 X 22 inch Overview Figure
Stillhouse Hollow Lake
2005-28

Executive Summary
100018246/110099 x
See below discussion for more details on the priority projects identified for the 3 types of CIPs. In
addition, see Sections 4.3, 4.4 and 4.5 for more details and see Appendices B.1, B.2, and B.3 for detailed
schematic synopsis developed for each of the regional detention, storm drain and ditch neighborhood
drainage, and stream channel repair and floodplain improvements CIPs respectively.
Regional Detention
Regional detention ponds can lower the existing conditions peak flows to reduce downstream flooding
and/or mitigate for increased flows due to development in order to maintain existing conditions peak
flows. Regional detention in this report refers to detention areas that affect multiple properties within a
watershed. The analysis for regional detention is the most complex of the three types of CIPs. This is
because it is necessary to model several CIP detention ponds within the watershed in order to develop a
comprehensive strategy that takes into consideration the interconnected nature of regional ponds.
Although the scope of study does not include comprehensive regional hydrologic modeling and analysis,
details regarding the feasibility of the regional detention CIPs are provided in Section 4.3 of this report.
The cost for regional detention can vary greatly depending on the detention strategy used to construct the
facility. There are two approaches for creating floodwater storage in a detention pond: 1) create volume
through excavation, or 2) create storage volume by increasing the backwater elevation through an
impoundment. By far the most economical way to create floodplain storage is by increasing the
backwater elevation. However, for the detention CIP sites, it is not clear that impacts created by
increasing the backwater elevation are acceptable. Therefore, for cost estimating purposes, it is assumed
that earthen excavation would be required to create adequate storage volume. As a result, the costs
associated with the regional detention ponds are considerable. In certain instances it may be more cost
effective to mitigate for impacts due to an increase in backwater elevation than it would be to excavate
earth to add detention volume. Given these complexities, it is recommended that an additional regional
detention study be conducted to develop a comprehensive watershed management strategy. This could be
accomplished by using hydrologic modeling to establish existing, proposed, and ultimate flow conditions
using various pond modeling scenarios. These hydrologic models would have the added benefit that they
could be used to help manage increased runoff as the watersheds development. As part at this regional
detention study, it is further recommended that a floodplain study be conducted across the entire City.
This floodplain study would be useful in developing the baseline hydrologic and hydraulic (H/H) models
required for the regional detention study. Additionally, this floodplain study would yield an organized
concise set of H/H models that could also be used by both public and private stakeholders.
Storm Drain and Ditch Neighborhood
Storm drain, ditch, and outfall improvements tend to have a direct benefit on the citizens who live in the
neighborhood. Additionally, improvements can enhance transportation access benefiting citizens broadly
across the City. Eight storm drain, ditch, and/or neighborhood improvement areas were identified for
capital improvement. These types of drainage problems are the source of street flooding and/or shallow

Executive Summary
100018246/110099 xi
residential flooding. The seven highest priority projects (from Table E-1) for storm drain and ditch
neighborhood drainage include: Greenforest Circle (2005-27), Trimmier/10th Street (2012-21), Woodrow
Phase 2 (2012-02), Briarcroft Lane (2008-05), Misty Lane Phase 1 (2012-16), Woodrow Phase 3 (2012-
03) and Skyline Avenue (2012-07). Preliminary engineering study and design will be required to specify
costs and to evaluate alternative design strategies on a project by project basis. These types of projects
tend to have a high ranking, and it is recommended that nearly all of the storm drain and ditch
neighborhood CIP projects identified in this study be considered for more detailed study, design, and
construction.
Stream Repair and Floodplain Improvements
Thirteen areas have been identified for schematic evaluation for stream repair and floodplain
improvements. Generally, there are three types of CIPs that have been identified related to streams and
channels: 1) concrete channel repair, 2) earthen channel repair/stream restoration, 3) floodplain
improvement.
The highest priority stream repair and floodplain improvement projects (from Table E-1) are concrete
channels in need of repair and improvements, in particular at Stewart Ditch (2012-11) and Valley Road
Ditch (2005-20). These CIPs have numerous concrete sections that have been completely washed out, and
more severe and extensive damage will occur in future storm events if repairs are not made. Moreover,
Valley Road and Stewart Ditch have known floodplain issues with the potential for damage to residential
and commercial property. Therefore, channel improvements should be considered as funding allows.
In addition to the concrete channel repair needs, there are a number of earthen channels that are unstable
and experiencing a high rate of erosion. The earthen channels within the City considered to have some of
the highest priority stream restoration needs are Edgefield/Rainforest (2012-20), Dickens Ditch (2005-
24), and Long Branch (2005-28).
Roadway Cross Drainage Bridge and Culvert Stream Crossings
Of the 35 road closures during the September 2010 storm event, 19 crossings have been identified as
high-priority stream crossings that should be considered for future improvements (see Section 4, Table 4-
6). However, this report does not prioritize these 19 road closures, but only seeks to document these
locations for future considerations in conjunction with transportation projects.
Summary of Proposed Drainage Capital Improvement Projects
A total of 29 drainage project were identified in this report. These drainage projects fall under one of
three types of project including: 1) Floodplain and Regional Detention Study, 2) Storm Drain and Ditch
Neighborhood Drainage or 3) Stream Repair and Floodplain Improvements. See Table E-1 above for a
summary of the 15 highest priority projects that have been identified for drainage bond funding. See

Executive Summary
100018246/110099 xii
Table E-2 below for a summary of the total cost estimated for the three types of drainage projects from
the 15 highest priority drainage projects identified above in Table E-1.
Table E-2 Summary of Cost versus the Type of Project
Project Type Total Cost ($)
Floodplain and Regional Detention Study 500,000
Storm Drain and Ditch Neighborhood Drainage 2,088,000
Stream Repair and Floodplain Improvements 3,412,000
Total 6,000,000
100018246/110099 1-1
1.0 INTRODUCTION
The City of Killeen (City) is one of the nation’s fastest-growing cities and is expected to experience
continued future growth above the national average. As a result, the City is faced with the challenges of
managing future storm water runoff as well as improving known existing drainage needs. The City has a
limited budget available to address existing drainage problems, maintain existing infrastructure, and plan
for future drainage conditions. Therefore, the City contracted with Atkins North America, Inc. (Atkins),
formerly PBS&J, to prepare a drainage master plan (DMP) to identify locations for potential capital
improvement projects (CIPs), so that available funding may be directed to the highest priority drainage
needs.
This DMP provides a list of CIPs ranked according to priority. The priority ranking is based upon both
engineering analysis and engineering judgment. A schematic analysis was performed for each of the
potential CIP projects identified for consideration using best available information and educated
assumptions to develop approximate design solutions and estimates of cost from which the proposed CIP
projects could be prioritized.
The City has a variety of drainage issues associated with street flooding and neighborhood flooding due to
inadequate or nonexistent drainage infrastructure. Additionally, the City has a number of locations where
drainage infrastructure has failed, in particular within concrete-lined channels or where earthen channels
have experienced severe erosion The CIP projects identified for ranking were classified into one of three
categories: 1) regional detention, 2) storm drain and ditch neighborhood drainage, and 3) stream repair
and floodplain improvements. There are also numerous drainage issues associated with parallel and cross
street drainage, but these are not ranked or evaluated at this time. A summary description and ranking of
each CIP within an individual CIP category is discussed in Section 4, Major Capital Improvement
Projects.
Capital improvement locations were identified with the help of City staff using historic data documenting
infrastructure failures, property flooding, and road closures from past storm events. Of particular
importance was the September 7, 2010 storm event from which City staff documented spatial locations
for home and street flooding. Additionally, City staff provided spatial information for various drainage
infrastructure failure points across Killeen.
This DMP supersedes the previous DMP adopted by the City in 2005 (Jacobs Engineering, 2005). This
document is intended to cover the same issues that were addressed in the 2005 DMP. However, the focus
of this document is on drainage CIP prioritization. Therefore, in order to maintain continuity, the sections
of the 2005 DMP not superseded by this study are included in an appendix to this report. See Appendix
A.1 through A.8 for the sections of the 2005 DMP brought forward into this document. Otherwise, this
DMP should be considered a living document that can be updated as projects are completed or new
information arises.

100018246/110099 2-1
2.0 DATA COLLECTION
The majority of the data used in this DMP was obtained either from the City or were observed in the field
by Atkins staff. Atkins worked closely with City staff to obtain the information necessary to complete this
study. This section briefly documents the data that were obtained in the course of this study, and the data
on which the schematic analyses were based.
2.1 CITY OF KILLEEN DATA
The preliminary engineering reports (PERs) that have been completed for previously identified CIPs were
obtained from the City for review. Included were those projects that had not yet been funded; these are
considered for priority ranking in this report. Additionally, the City provided digital information for 2-
foot (ft) contour lines, aerial photography, property parcels, drainage easements, road locations, structure
footprints, public infrastructure failures locations, and the September 2010 flood event response points.
The City also provided Atkins with the Hydrologic Engineering Center’s Hydrologic Modeling System
(HEC-HMS) model for the South Nolan Creek watershed, considered as “effective” conditions by the
Federal Emergency Management Agency (FEMA).
2.1.1 Previous Drainage Master Plans
A DMP was adopted by the City in 2005 (Jacobs Engineering, 2005). This report identified 28 CIPs. Of
the original 28 CIPs, 11 were brought forward for priority ranking in this DMP. A summary of the status
of all 28 CIPs identified from the 2005 DMP is given in Table 2-1.
2.1.2 Preliminary Engineering Reports
PERs were incorporated into the CIP rankings to the extent practical. The PERs listed below were
considered in the course of ranking some of the CIPs that were brought forward from the 2005 DMP.
• Acorn Creek Drainage Study, May 2010 (2005-14)
• 2008 CIP #5 PER (Woodrow Drive Drainage Improvements), November, 2008
• Bermuda/Ronstan Ditch CIP, October 2010
• South Nolan Creek at Stallion Drive CIP, October 2010
• Valley Ditch Drainage Study, May 2010

100018246/110099 2-2
Table 2-1 Summary Status of 2005 DMP Identified CIPs
Project Reference Number Score* Capital Improvement Project (CIP) Status
Funded (Yes/No)
Consider for 2012 DMP Summary of Status
01 21 Bermuda/Ronstan Ditch Engr. Design-
Freese & Nichols
Partial Yes The City did not have enough funds to do everything recommended by the PER.
02 20 South Nolan Creek at Odom Drive Engr. Design-Jacobs Partial No Projects presented in four phases including: 1) bridge armoring project, 2) erosion protection using gabions, 3) repetitive loss structures with FEMA, and 4) detention.
Phase 1 - Bridge armoring is complete
Phase 2- will be funded within 2005 Bond
Phase 4 - is left unfunded pending detention modeling coordinated with Fort Hood.
08 18 South Nolan Creek at Dimple Street Engr. Design-Jacobs No
10 18 South Nolan Creek at 10th Street Engr. Design-Jacobs No
11 18 South Nolan Creek at 2nd Street Engr. Design-Jacobs No
03 20 Stewart Ditch Hold No Hold Not considered to have justifiable benefit cost
04 20 South Nolan Creek at Stallion Drive Engr. Design- Freese & Nichols
No Yes Water Sewer Drainage voted not to proceed with this project due to the low project benefit cost justification.
05 19 WS Young Drive Done Yes Done Done
06 19 Killeen Civic and Conference Center Drainage
Done Yes Done Done
07 18 Patriotic Ditch at Zephyr Road Engr. Design-
Mitchell & Assoc.
Yes No Only engineering designs were developed without a PER. This project is essentially ready to go pending easement acquisition. Extends from Jefferies Drive to FM 2410.
09 18 Dogwood Boulevard at Business 190
Hold – TXDOT No No This project is within TxDOT right-of-way. Therefore, no action is planned by the City.
12 18 Still Forest Engr. Design-Walker Partners Construction-Patin
Yes Done Done
13 18 Bending Trail Creek Engr. Design-
The Wallace Group
Partial Yes The first phase, improving Acorn Creek channel section and addressing the crossing under Acorn Creek Road storm drain improvements discussed in the PER but were not funded in the 2005 Bond. 14 16 Acorn Creek Headwaters Engr. Design-
The Wallace Group
Partial Yes
15 16 Little Nolan Creek Tributary 1 at Caprock Drive (Elms Road)
Engr. Design-
Mitchell & Assoc.
Yes No This CIP's PER was contracted out and is not completed as of this writing.
16 15 Lagrone Ditch Done Done Done

100018246/110099 2-3
Project Reference Number Score* Capital Improvement Project (CIP) Status
Funded (Yes/No)
Consider for 2012 DMP Summary of Status
17 15 El Dorado Drive Engr. Design-TWG Partial Done Done
18 15 Little Nolan Creek Tributary 1 at Cantabrian Drive (Phase 2 = $95,830)
Engr. Design-Chiang Patel and Yerby
Yes Yes This project recommends four ponds. The two ponds downstream of SH 195 are unfunded; the 2 upstream of US 190 are funded by (along with) Elms Road improvements.
End of 2005 Bond Package
18 15 Little Nolan Creek Tributary 1 at Cantabrian Drive (Phase 1 = $566,370)
Engr. Design-CPY Yes No This CIP has been studied preliminarily.
19 14 Industrial Ditch Done - City Crews Yes Done Done
20 14 Valley Ditch Engr. Design-WWA Partial Yes Preliminary engineering has been performed on this channel reach. Valley Ditch improvements include improvements to railroad, road, and homes susceptible to flooding. Railroad improvements have been funded.
21 13 Little Nolan Creek at WS Young Drive
Generally Complete No No This project for the most part was completed by the developer.
22 12 Little Nolan Creek at FM 2410 Hold No Yes The detention aspect of this project does not appear to be practical in light of the fact that there are already homes built in this area. This area is also considered in more detail in CIP 2012-14.
23 11 Long Branch Tributary Done - City Crews Yes Done Done
24 11 Dickens Ditch Hold No Yes This is primarily a maintenance issue
25 11 Caprice Ditch Hold No Yes No Action Taken to Date. There are some stream restoration issues.
26 11 Wolf Ditch Hold No Yes No Action Taken to Date
27 10 Greenforest Circle Hold No Yes No Action Taken to Date
28 8 Long Branch Hold No Yes No Action Taken to Date
*Based on 2005 Drainage Master Plan scoring system

100018246/110099 2-4
2.2 FIELD DATA
Site visits were performed February 24, 2011, March 2, 2011, March 8, 2011, March 9, 2011, April 7,
2011, and May 5, 2011, at locations where it was necessary to supplement existing paper and digital
information with on-site observations. Photographs were taken at these locations to document information
related to site conditions. However, no detailed field measurements were taken.
2.3 AERIAL PHOTOGRAPHY
The aerial photography used throughout this report is from the Central Texas Council of Governments
(CTCOG) and represents ground conditions during a 2010 flight.
2.4 HYDROLOGIC/HYDRAULIC MODELING INFORMATION
The only hydrologic/hydraulic (H/H) models used in this study were taken from the FEMA Flood
Insurance Study (FIS). The storm water runoff for South Nolan Creek was modeled using HEC-HMS
Version 2.2.2. No other watershed runoff models were found. However, South Nolan Creek covers the
majority of the City limits. Floodplain hydraulic models were found for the upper portion of South Nolan
Creek, Upstream of US 190, Bermuda/Ronstan Ditch, and Little Nolan Creek Tributary #1 (all of which
are in the South Nolan Creek Watershed).

100018246/110099 3-1
3.0 RUNOFF FLOW ESTIMATION
Storm water runoff flow was only estimated for selected locations where the flow was needed to complete
a schematic analysis for a CIP. The FEMA HEC-HMS model for the South Nolan Creek Watershed was
used whenever possible. For areas outside South Nolan Creek, or where flow estimates for small areas
were needed, the rational method was employed.
A detailed hydrologic study was not performed for this report. This section is only intended to summarize
the watersheds that are within the City and briefly reports on the hydrologic modeling information
available for these watersheds.
3.1 CITY OF KILLEEN WATERSHEDS
There are eight watersheds within the City as seen on Figure 3-1. Over half the area within the City drains
through the South Nolan Creek and Little Nolan Creek Watersheds where it discharges from the east side
of the City. The other major watersheds are Reese Creek, Trimmier Creek, Rock Creek, Onion Creek
Little Trimmier. Only a small area of the City drains west out of the Clear Creek Watershed.
South Nolan Creek is highly developed; the majority of the undeveloped land is in the headwaters of
Little Nolan Creek, a tributary of South Nolan Creek. The Reese Creek, Rock Creek, and Trimmier Creek
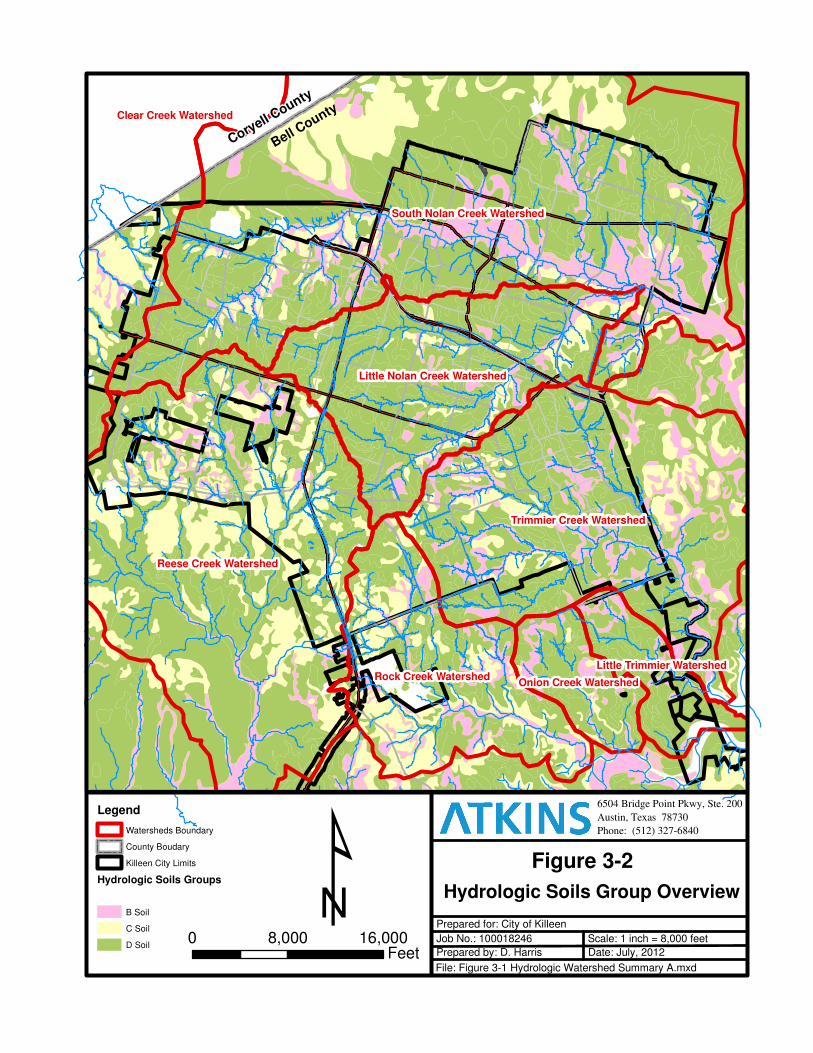
watersheds have a good deal of area that is expected to continue to develop into the future. These
watersheds are primarily composed of Hydrologic Soil Group (HSG) D soils, which have a relatively low
permeability and a high storm water runoff potential. See Figure 3-2 for an overview of the hydrologic
soils group overview across the City. Hydrologic soil groups B, C and D are found within the City; HSG
“B” are relatively permeable and tend to absorb rainfall, while HSG “D” are relatively impermeable and
tend to have a higher rainfall runoff characteristics.
The South Nolan Creek watershed is the most relevant watershed for this master plan because the
majority of the identified CIPs drain to South Nolan Creek. As mentioned above in Section 2.4,
Hydrologic/Hydraulic Modeling Information, South Nolan Creek has the only available HEC-HMS
model (version 2.2.2). This HEC-HMS model was used extensively in the schematic analysis for various
CIPs ranked in this study. In particular, this HMS model was used to assess regional detention feasibility
(see Section 4.3, Regional Detention CIP) and determine runoff volumes and existing/ultimate conditions
flows. See Section 3.2 below for a summary of the hydrologic modeling parameters.
3.2 SOUTH NOLAN CREEK HEC-HMS MODEL
The effective conditions FEMA HEC-HMS model was converted from version 2.2.2 to 3.4. All analyses
performed in this report were based on the converted HEC-HMS 3.4 model. The flow is modeled for the
10-, 50- 100-, and 500-year recurrence intervals. No significant difference in flow value was observed due
to this conversion from version 2.2.2 to 3.4.

HWY 190Stan Schluter Loop
Fo
rt H
oo
d S
t. (
SH
195)
Rancier Ave.
84 8
837
838
838
South Nolan Creek
Cap
rice D
itch
Aco
rn C
reek
Ha
ys
Bra
nc
h
Little
Nola
n Cre
ek
Ste
wart D
itch
North
Reese C
reek Trib 1
Lib
erty
Dic
h
Lo
ng
Bra
nc
h D
itch
Old Florence Ditch
Trimmier Creek
Trimmier Road Ditch
No
rth R
eese C
reek
Upper R
eese Creek
South Nolan Creek
South Nolan Creek
Little
Nola
n Cre
ek
South Nolan Creek Watershed
Reese Creek Watershed
Trimmier Creek Watershed
Rock Creek Watershed
Little Nolan Creek Watershed
Clear Creek Watershed
Onion Creek Watershed
Little Trimmier Watershed
Valle
y R
oad
Ditc
h
6504 Bridge Point Pkwy, Ste. 200
Austin, Texas 78730
Phone: (512) 327-6840
Figure 3-1Watersheds Overview
Prepared for: City of Killeen
Job No.: 100018246
Prepared by: D. Harris
Scale: 1 inch = 8,000 feet
Date: July, 2012
File: Figure 3-1 Hydrologic Watershed Summary A.mxd
Legend
Stream Centerline
Watersheds Boundary
County Boudary
Killeen City Limits ¹0 8,000 16,000
Feet
Bell County
Coryell County
848
837
838
838
South Nolan Creek Watershed
Reese Creek Watershed
Trimmier Creek Watershed
Rock Creek Watershed
Little Nolan Creek Watershed
Clear Creek Watershed
Onion Creek Watershed
Little Trimmier Watershed
6504 Bridge Point Pkwy, Ste. 200
Austin, Texas 78730
Phone: (512) 327-6840
Figure 3-2
Prepared for: City of Killeen
Job No.: 100018246
Prepared by: D. Harris
Scale: 1 inch = 8,000 feet
Date: July, 2012
File: Figure 3-1 Hydrologic Watershed Summary A.mxd
Legend
Watersheds Boundary
County Boudary
Killeen City Limits
Hydrologic Soils Groups
B Soil
C Soil
D Soil
¹0 8,000 16,000
Feet
Bell County
Coryell County
Hydrologic Soils Group Overview

100018246/110099 3-4
In order to run a hydrologic model, it is necessary to define the three components of the hydrologic cycle
that govern storm water runoff: (1) rainfall, (2) ground cover/infiltration loss rates, and (3) the transform
timing of rainfall to runoff flow at the point of consideration. These hydrologic modeling components are
discussed in more detail below. No changes were made to any of the parameters used in the original
HEC-HMS model; however, some modeling nodes were added only to generate more flow output
locations.
3.2.1 Rainfall
The FEMA effective model uses 24-hour total rainfall values taken from Technical Paper 40 (Natural
Resources Conservation Service [NRCS]). These values are shown in Table 3-1 below. Technical Paper
40 (TP-40) is a commonly used source to estimate 24-hour total rainfall values. As a point of comparison,
the U.S. Geological Survey (USGS) also published rainfall values in 2004 (Scientific Investigations
Report 2004-5041). The USGS estimates seen in Table 3-2 are somewhat less than the TP-40 values. As
mentioned above, the FEMA effective model was not significantly modified, and therefore the FEMA
effective conditions rainfall values were left unchanged, although lower flows and runoff volumes might
be predicted based on the USGS rainfall study.
Table 3-1 Rainfall used in FEMA HEC-HMS Model
Return Period 10 year 50 year 100 year 500 year
Rainfall Depth over 24 hours (inch) 6.6 8.8 9.9 12.1
Table 3-2 USGS Rainfall Frequency vs. Rainfall Depth Distribution
Return Period 2 year 10 year 25 year 50 year 100 year
Rainfall Depth over 24 hours (inch) 3.4 5.5 6.6 7.9 8.9
3.2.2 Loss Rate
The loss rate determines the volume of rainfall that becomes direct runoff, versus the amount of storm
water that infiltrates into the ground. The loss rate is modeled using the curve number method. Curve
numbers (CN) range from CN = 30 indicating low runoff potential to CN = 98 indicating nearly 100% of
rainfall becomes direct runoff. Curve number values are based on a combination of factors including
soils, vegetation, and land use. The more impervious cover associated with development in a given
drainage catchment, the higher the curve number. The minimum curve number used in the HEC-HMS is
59.4 and the maximum is 98, with an average curve number of 83 for the entire South Nolan Creek
watershed.

100018246/110099 3-5
3.2.3 Transform
The transform represents the translation and attenuation of excess rainfall to runoff as it flows to the point
of concern. The lag time is used to model transform and is defined as the time between the centroid of the
rainfall hyetograph and the peak flow. According to the NRCS, as a rule of thumb, lag time may be
estimated as 60% of the time of concentration (Tc). The Tc is the time taken for the excess rainfall to
travel from the hydrologically most distant location to the point of consideration.
3.3 HYDROLOGIC SUMMARY AND RECOMMENDATIONS
Only South Nolan Creek has a hydrologic model available. A complete set of hydrologic models for all of
the watersheds within the City is not available. It is highly recommended that the City develop hydrologic
models for all of the watersheds draining through the City limits. Such a set of models could be used to
evaluate regional characteristics of the watershed, manage growth, and allow for a comprehensive
regional detention drainage strategy to be developed.
100018246/110099 4-1
4.0 MAJOR CAPITAL IMPROVEMENT PROJECTS
Schematic evaluations for the CIPs are presented in this section. The schematic evaluations were based on
best available information and professional judgment and various assumptions. It should be understood
that the schematic analyses presented in this report were developed in order to support the relative priority
ranking of the CIPs. The schematic evaluations are not definitive and are based on simplifying
assumptions. For the projects with available PERs, that information was used in the cost estimates and
rankings presented here to the extent practical. Future PER reports will be required to more definitively
establish the ultimate feasibility and costs of the CIPs presented and prioritized in this DMP.
Schematic evaluations were performed for three types of drainage infrastructure CIPs: 1) Regional
Detention (Section 4.3), 2) Storm Drain and Ditch Neighborhood Drainage (Section 4.4), and 3) Stream
Repair and Floodplain Improvements (Section 4.5). CIP projects within these categories were ranked,
then all the CIP projects were pooled together to create a master list of projects with overall ranking as
discussed in the recommendations section of this report (Section 7). A fourth category of CIPs concerning
transportation cross drainage (bridges and culverts) are presented in Section 4.6 but are not explicitly
ranked or evaluated schematically.
Appendix B.1, B.2, and B.3 include one- to two-page synopses of the project descriptions, and estimated
benefits and costs for regional detention, storm drain and ditch neighborhood drainage, and stream repair
and floodplain improvements. The anticipated benefit (discussed in the synopsis) is only a qualitative
summary of improvements and does not allow for a truly quantitative benefit-cost comparison.
4.1 RANKING CRITERIA
For each CIP identified, project ranking was estimated by assigning a value between 0 and 5 within five
categories: public safety, transportation access, property damage, engineering economy, and
environmental considerations. A score between 0 and 5, with 5 indicating the highest priority, is assigned
for each category. The five categories are taken to have equal weights. The scores for the five ranking
factors were summed, and the highest score was considered to be the highest priority.
1. Public Safety – This ranking component assigns greater weight to flooding associated with
residential structures or stream crossings that have poor levels of service and cause flooding.
Based on engineering judgment, if the surcharge flow is sufficient to cause a safety concern
then the public safety component was ranked as a 4 or 5.
2. Transportation Access – Major cross drainage infrastructure such as culverts and bridges
were not evaluated in this report. Therefore, this ranking component deals mainly with
improvements to local streets and collector roads as they pertain to storm drain and ditch
improvements. However, in the case of regional detention, this factor may be ranked highly if
it is perceived to improve cross drainage at a major road. Typically, this factor is given a
ranking between 1 and 4 depending on the estimated amount of traffic and availability of
alternate routes.
100018246/110099 4-2
3. Property Damage – This component considers the potential for property damage related to
flooding associated with a particular piece of drainage infrastructure. The potential for
property damage was qualitatively estimated based on the proximity of property structures to
a CIP. If the CIP is perceived to lessen property damage due to inundation it was generally
ranked with a 3 or a 4.
4. Engineering Economy – This component qualitatively weighs the benefits of the proposed
improvements against a planning-level cost estimate of the associated improvements.
Improvements with the potential to provide significant benefits in the form of reduced
damages to property, increased safety at stream crossings, or significant reductions in
nuisance flooding relative to their cost were assigned a higher weight. Improvements with the
potential for significant benefits relative to the estimate costs were generally assigned a
ranking of 4 or 5. Improvements with lower benefits relative to the estimated cost were
assigned a rank of 1, 2, or 3.
5. Water Quality Considerations – As part of the Phase II Storm Water Management Plan
(SWMP), the City indicated its willingness to include environmental considerations for all
CIPs. No quantitative evaluation of environmental benefits was performed for this ranking
component. The environmental weighting factors were applied based on engineering
judgment from 0 to 5.
The proposed improvements were sorted in priority based on the sum total of the five ranking factors. The
highest score was considered to be the highest-priority project.
4.2 COST ESTIMATES
In order to establish an economic baseline for comparison, planning-level cost estimates were developed
for CIPs identified for future improvements. The cost estimates are not intended to be definitive, but are
considered to be sufficiently accurate to portray the relative cost of the various projects and to allow for a
sense of the engineering economy priority ranking.
A number of assumptions based on engineering judgment were made in the determination of certain
quantities, such as the amount of fill and roadway pavement that might be required to improve a roadway
culvert crossing. Other planning-level estimates were required for items such as the quantity of earthwork
and temporary erosion and sedimentation control. Given the approximate nature of the cost estimate, a
relatively high contingency of 25% was used. A PER specific to a given CIP would be required to
determine a more accurate representation of the project feasibility and cost.
4.3 REGIONAL DETENTION CIP
Generally, there are two strategies for lowering storm water discharge through the use of detention ponds:
(1) on-site detention pond, and (2) regional detention ponds. On-site detention is typically used for
smaller sites with a single drainage catchment, and it is a relatively straightforward assignment to
determine the required pond volume. However, regional detention typically involves more complex
analyses because it is necessary to consider the watershed as a whole; consideration of the timing of

100018246/110099 4-3
subwatersheds and the interactions of multiple ponds across the whole watershed is required to develop a
comprehensive watershed management strategy for reducing flood risks on a regional scale.
This section discusses some of the issues associated with developing a regional detention strategy within
the City. Schematic evaluations for regional detention ponds were only considered within the South
Nolan Creek watershed. The South Nolan Creek watershed is the most developed watershed;
approximately 57% of the City discharges through South Nolan Creek. Other possible regional detention
locations were proposed conceptually (but not evaluated schematically). These conceptual ponds were
generally placed where the stream leaves the City boundary. See Figure 4-1 for an overview of the
locations of the regional detention ponds considered schematically and the regional ponds sited
conceptually.
4.3.1 Introduction to Regional Detention Considerations
There are three basic regional watershed management strategies as discussed below. The City’s strategy
for employing one or a combination of these three strategies should be considered for additional study.
1. Do nothing. Depending on the location of the site within the watershed, it is sometimes better
not to detain water. For instance, drainage subareas in the lower portions of the watershed
generally should not be detained but rather allowed to discharge quickly so as not to combine
with peak flow from the middle and upper portions of the watershed.
2. On-site detention requires the developer to show no adverse impacts in terms of peak flow at
the outlet of the site being developed. The City already has land development criteria
requiring on-site detention ponds. However, this strategy does not consider the regional
implications of detaining a number of drainage areas in terms of the way the delayed peak
flows might combine downstream. This strategy, without a regional watershed impacts study,
can sometimes cause even more adverse impacts than the ”do nothing” strategy
3. Allow a fee in lieu system where a developer pays into a regional detention fund that the City
manages and uses to construct regional detention ponds. Also, occasionally a developer can
coordinate with the City to help plan, design, and construct regional facilities of which the
City would take ownership.
4.3.2 Regional Detention CIP Evaluation
Based on the detention ponds sited in the 2005 DMP and discussions with City staff and independent
evaluations, 8 potential locations for regional flood control detention ponds were identified and evaluated
schematically, and an additional 10 were identified conceptually but not evaluated otherwise (see Figure
4-1). A schematic analysis was performed for all 8 potential regional detention locations in order to
determine the approximate reduction in flow compared to the estimated cost. A summary synopsis and
overview figure for each of the 8 ponds, with a description of the pond, estimated flow reduction,
detention volume estimates, perceived benefit, and estimated cost, is presented in Appendix B.1.

W JASPER DR
CH
AN
TZ
DR
Fort Hood
Bell County
Coryell C
ounty
FO
RT
HO
OD
ST
(S
H 1
95)
MA
XD
ALE R
D
CHAPARRAL RD
STAGECOACH RD
E ELMS RD
WESTCLIFF RD
E RANCIER AVE (FM 439)
ON
ION
RD
CL
EA
R C
RE
EK
RD
(S
H 2
01)
ZEPHYR RD
S W
S Y
OU
NG
DR
REESE CREEK RD
SH
AW
N D
R
N 3
8T
H S
T
LU
CIL
LE
LN
FAWN DR
RO
CK
Y R
D
60
TH
ST
RO
BIN
ET
T R
D
ME
SA
DR
WATERCREST RD
W STAN SCHLUETER LP (FM 3470)
N 4
TH
ST
FM
3481
ELMS RD
TR
IMM
IER
RD
GUS DR
E T
RIM
MIE
R R
D
E CENTRAL TEXAS EXPY (US HWY 190)
E STAN SCHLUETER LP (FM 3470) CU
NN
ING
HA
M R
D
EA
ST
TR
IMM
IER
RD
N R
OY
RE
YN
OL
DS
DR
BU
NN
Y T
RL
JIM AVE
E VETERANS MEMORIAL BLVD (BUS HWY 190)
ASPEN DR
FL
OR
EN
CE
RD
ES
TE
LL
E A
VE
WATER ST
FE
ATH
ER
LIN
E R
D
SO
UK
UP
LN
S W
S Y
OU
NG
DR
SL
AW
SO
N L
NLOVE RD
CO
DY
PO
E R
DP
LA
TIN
UM
DR
BE
RM
UD
A D
R
EDGEFIELD ST
TA
LLW
OO
D D
R
TAFT ST
VIOLA DR
JA
SM
INE
LN
PRIVATE DR
SANTA FE DR
DIANA DR
SUNNY LN
GOLDEN GATE DR
N T
WIN
CR
EE
K D
R
BO
NN
IE D
R
S 1
0T
H S
T
HANK DR
LOOP RD
AUBURN DR
LA
VE
ND
ER
LN
DOFFY DR
N 4
6T
H S
T
MICHAEL DR
KE
LL
EY
LN
LANCE LP
WH
ITE
CA
ST
LE
LN
W ELMS RD
N 4
2N
D S
T
BR
IDL
E D
R
SALT FORK DR
LLEWELLYN DR
SERPENTINE DR
TIFFANY CIR
TATONKA DR
CH
EL
SE
A D
R
RIM DR
CURTIS DR
LEWIS ST
CO
KU
I DR
PRIVATE DR
TR
IMM
IER
RD
OA
KA
LL
A R
D
2012-10
2012-09
2012-12
2012-08
2005-18
2005-03
2005-01
2005-15
South Nolan Creek
Aco
rn C
reek
Hays B
ran
ch
No
rth R
eese C
reek
South Nolan Creek Cap
rice D
itch
Little
Nola
n Cre
ek
Littl
e Nola
n Cre
ek
Ste
wart D
itch
North
Reese C
reek Trib 1
Lib
erty
Dic
h
Lo
ng
Bra
nc
h D
itch
Old Florence Ditch
Valle
y R
oad D
itch
Trimmier Creek
Trimmier Road Ditch
Upper R
eese Creek
South Nolan Creek
6504 Bridge Point Pkwy, Ste. 200
Austin, Texas 78730
Phone: (512) 327-6840
Figure 4-1 Potential Regional Detention
Location OverviewPrepared for: City of Killeen
Job No.: 100018246
Prepared by: D. Harris Date: March, 2012
0 1.5 3Miles
Legend
County Boundary
Structures in the 100-yr FEMA Floodplain
Schematic Regional Detention Ponds
Conceptual Regional Detention Location
Killeen City Limits
100-Year FEMA Flood Zone
Zone A
Zone AE
Stream Centerline ¹ Scale: 1 inch = 1.5 mi
File: Figure 4- Possible Regional Detention Location Overview.mxd
Schematic detention pond (green symbol) estimates were performed only within the South Nolan Creek Watershed.Conceptual regional detention ponds (blue symbol) are only located conceptually and otherwise not evaluated in any way.
2012-08

100018246/110099 4-5
Two types of flood control ponds might be considered for detaining flood volume in order to reduce peak
flood flows: (1) online detention, and (2) offline detention.
Online detention ponds usually consist of an “online” embankment placed across the channel similar to a
dam. The stream flow can be reduced by metering the outlet of the pond using culverts and spillways.
Flow reduction is possible because storm water is stored or detained in a volume of space created either
through earthen excavation or by increasing the water surface elevation and creating a backwater effect.
Offline detention facilities route all of the low flows around the storage detention chamber, usually in the
original undisturbed natural channel, although sometimes channel improvements are required. Flows
above a critical flood stage are “shaved off” by diverting a volume of storm water out of the stream
system above the flood stage using a lateral weir running parallel to the stream.
The general shape of the online and offline hydrograph2 is shown in Figure 4-3a and 4-3b. The area under
the hydrograph represents the volume of storm water. The regional ponds peak flow reductions were
evaluated schematically by simply subtracting out the potential storm water storage volume from the top
of the hydrograph at the point of consideration.
The regional detention schematic analyses were performed using the following steps to evaluate and
determine priority ranking for major CIPs.
1. The regional detention ponds were schematically located in light of aerial photography and
parcel boundaries information.
2. The maximum available detention storage volume was estimated. Estimated detention storage
volumes are expected to be generally larger than what would likely be available under more-
detailed preliminary/final design considerations. Additionally, volume already occupied by
floodplain waters may sometimes be included as part of the detention volume, which would
make for a more optimistic assumption of available storm water storage volume.
3. The peak flow reduction for the 100-year event was estimated from the flow hydrograph
(taken directly from the FEMA HEC-HMS model), by determining the flow that would result
if a volume of storm water runoff equal to the available detention volume could be
completely “shaved” off (or taken out) of the stream system. This “shaved” volume of water
would be detained by the available detention pond volume.
2 A hydrograph is a graph of time (horizontal axes) versus runoff flow (vertical axis).

100018246/110099 4-6
cfs = cubic feet per second
Figure 4-2a: Schematic Offline Pond Hydrograph
Figure 4-2b: Schematic Online Pond Hydrograph

100018246/110099 4-7
As mentioned previously, some simplifying assumptions were made in estimating the available detention
volume. Ponds were not explicitly modeled in HEC-HMS using storage discharge relationships. It is
useful to first evaluate the regional detention ponds using these simplifying assumptions for estimating
storage volume and peak flow shaving because often a potential pond can be quickly eliminated from
further consideration if it does not provide a worthwhile flow reduction even under optimistic evaluation
assumptions. However, if a schematic pond is shown to provide a worthwhile flow reduction using
optimistic volumetric assumptions, then more-detailed evaluation techniques can be employed to
ascertain project feasibility.
The regional detention CIPs were evaluated individually and independent of one another. No
considerations were made for possible improvements that might result from two or more ponds in
sequence. Such considerations would need to be evaluated in a watershed management regional detention
study to fully appreciate the benefits and cost of regional detention.
Typically the construction of regional detention is justified by the need to either (1) lower peak flows so
as to lessen existing downstream flooding conditions, or (2) prevent an increase in the peak flow due to
future development. Naturally, these two points combined are also used to justify regional detention.
These two justifications for building regional detention in Killeen are discussed in more detail in the
following bulleted discussion points.
• Lower Peak Flows: See Table 4-1 for a summary of the conceivable peak flow reductions that
might be obtained for the schematically evaluated regional detention ponds. Because a full
accounting of the benefit cost is not made in this report, it is not clear whether the cost of regional
detention may be justified based on flow reductions alone. It seems more likely that the goal of
regional detention would be justified in order to prevent future flow increases so as not to
exacerbate future flooding conditions.
• Mitigate for Ultimate Development Flows: See Table 4-2 for an overview of the opportunities to
construct regional detention to help mitigate for ultimate development conditions. Table 4-2
summarizes drainage area, existing flow and volume, ultimate flow and volume, and increase in
flow and volume from existing to ultimate development conditions. Ultimate development flows
and volumes were estimated by simply increasing all of the curve numbers across the drainage
catchments to at least CN = 92. The estimated ultimate development flows are adequate for this
schematic level comparison but should not be considered definitive. More detailed hydrologic
modeling would be required, including land use trends, to fully ascertain the feasibility of using
regional detention to mitigate for ultimate conditions flows.
The ponds that were evaluated schematically have been ranked and summarized in Table 4-3. For more-
detailed information, see Appendix B.1 for a synopsis for each of the regional detention CIPs summarized
in Table 4-3.

100018246/110099 4-8
Table 4-1 Conceptual Existing Conditions Flow Reduction using Regional Detention
CIP ID Location
Severity of
Downstream
Flooding
Schematic
Storage
Volume (acre-
ft)
100-Year
Existing 100-
Yr Peak Flow
In (cfs)
Proposed 100-
Yr Peak Flow
Out (cfs)
Flow
Reduction (%)
2005-18
Trimmier Road
Ditch Low 40 2,949 2,700 -8
2012-08
Little Nolan Creek
at Old Florence
Ditch Significant 260 8,390 7,000 -17
2012-09
Little Nolan Creek
at Outlet Belton 413 18,691 17,500 -6
2012-10
South Nolan and
Little Nolan at
Confluence Belton 560 45,705 43,000 -6
2005-03
Upper Stewart
Ditch Significant 15 1,626 1,550 -5
2012-12
Upper South Nolan
Creek Significant Undefined 14,900 13,300 -11
2012-17 Bermuda/Ronstan Low
See Freese and Nichols PER (October 2010) for detailed
information. There is minimal flooding downstream of this
location, and it is not likely that the benefit would justify the cost
here. Therefore, it has not been considered further.

100018246/110099 4-9
Table 4-2 Existing versus Ultimate Development Flow and Volume at Regional Detention CIPs
Pond Count
Master Plan ID Location Name
Drainage Area (Mi
2)
Schematic Volume (acre-ft)*
100-year Peak Flow (cfs) 100-year Runoff Volume
(acre-ft)
Existing Ultimate Flow
Increase Existing Ultimate Volume Increase
1 2005-01 Bermuda/Ronstan 0.82 72 2,731 2,897 167 353 390 37
2 2012-12 Upper South Nolan Creek
12.50
Undefined**
15,280 16,233 953 3,673 3,987 314
14.19 18,195 19,415 1,219 4,420 4,789 369
14.83 18,495 19,709 1,214 4,698 5,093 394
15.15 18,462 19,638 1,176 4,841 5,243 402
3 2005-18 Trimmier Road Ditch 0.84
40 2,412 2,592 180 356 399 43
1.19 2,949 3,111 162 513 567 53
4 2005-15 Little Nolan Creek Tributary 1 at Caprock
0.31 Undefined+ 990 1,048 58 133 146 14
5 2005-03 Upper Stewart Ditch 0.63 15 1,838 1,838 0 302 302 0
6 2012-09 Little Nolan Creek at Outlet 11.07 413 18,692 20,334 1,642 4,662 5,274 611
7 2012-10 South Nolan Creek and Little Nolan Creek at Confluence
37.66 560 45,706 49,441 3,736 13,758 15,505 1,746
8 2012-08
Little Nolan Upper Out 2.51 Undefined 5,277 6,157 880 960 1,196 236
Old Florence Ditch at Outlet 1.74 260 3,157 3,529 372 716 831 115
Little Nolan and Old Florence 4.25 Undefined 8,390 9,647 1,256 1,677 2,026 350
9 2005-28 Long Branch 4.48 Undefined++ 4,618 5,392 773 1,319 1,697 377
* Volume only estimated schematically to within ±30% considering assumptions
** Upper South Nolan Creek was evaluated preliminarily by Jacobs, and Upper South Nolan Creek detention in itself was not recommended
+ This project is being evaluated preliminarily as of the writing of this report
++ No preliminary engineering report has been prepared for this site, identified in the 2005 DMP

100018246/110099 4-10
Table 4-3 Regional Detention Pond Ranking Summary
Rank
Project Reference Number
Council District
Capital Improvement Project (CIP) Description of Project
Estimated Cost*
Public Safety
Trans Access
Property Damage
Engineering Economy
Water Quality Benefit
Ranking Sum
1 2005-18 B 4 Trimmier Road Ditch
There are two distinct tracts of land on this reach–one upstream and one downstream–that may be used for regional detention. Independently, these ponds probably would not offer enough storage volume to appreciably lower the flows. However, in conjunction with the proposed upstream ponds, the detention volume offered at these locations would offer a useful benefit. There also appears to be sufficient volume available to mitigate for ultimate conditions flows.
945,100 2 0 2 1 1 6
2 2012-08 3 Little Nolan Creek at Old Florence Ditch
This area is already largely within the 100-year floodplain. Therefore, in order to create volume, excavation would be required or a backwater impoundment using an embankment might be used to store floodwater. The schematic evaluation was performed assuming volume is added through excavation. This pond location appears to be one of the most feasible sites for regional detention. Enough additional storage volume might be created to mitigate for future conditions flows.
16,803,500 0 0 3 2 1 6
3 2005-01 4 Bermuda/Ronstan This project area has been studied in a preliminary engineering report by Freese and Nichols. The main benefit of the pond would be to lower flows on Wheeler Drive to prevent overtopping for the 25-year event. However, this project cannot be justified only based on Wheeler overtopping. On the other hand, this site does appear to have enough potential storage volume to mitigate for ultimate development conditions and might be considered in a regional detention strategy.
2,997,995 2 2 0 0 1 5

100018246/110099 4-11
Rank
Project Reference Number
Council District
Capital Improvement Project (CIP) Description of Project
Estimated Cost*
Public Safety
Trans Access
Property Damage
Engineering Economy
Water Quality Benefit
Ranking Sum
4 2012-09 1 Little Nolan Creek at Outlet
This majority of the site is within the 100-year floodplain. Therefore, in order to create detention volume without causing a backwater impact, it is necessary to excavate. However, obtaining additional storage volume through increasing the backwater elevation should also be considered. The cost presented here is assuming a significant amount of soil and rock excavation, and as such would likely make the project unfeasible. However, the cost of creating storage by constructing an embankment to back up water may be well less than the excavation cost, and might make the project affordable enough to consider feasible.
26,659,600 0 0 3 1 0 4
5 2012-10 1 South Nolan and Little Nolan at Confluence
The majority of the site area is within the 100-year floodplain. Therefore, in order to create detention volume without causing a backwater impact, it is necessary to excavate. However, obtaining additional storage volume through increasing the backwater elevation should also be considered. The cost presented here is assuming a significant amount of soil and rock excavation, and as such would likely make the project unfeasible. However, the cost of creating storage by constructing an embankment to back up water may be well less than the excavation cost, and might make the project affordable enough to consider feasible.
55,168,000 0 0 3 1 0 4
6 2005-03 2 Upper Stewart Ditch
Possible side overflow detention might be located here, just downstream of Fort Hood. Although there is significant flooding in this watershed, there is not enough storage detention volume available to appreciably lower the peak flows. The CIP cost would not be justified by the benefit.
1,716,800 2 1 0 0 0 3

100018246/110099 4-12
Rank
Project Reference Number
Council District
Capital Improvement Project (CIP) Description of Project
Estimated Cost*
Public Safety
Trans Access
Property Damage
Engineering Economy
Water Quality Benefit
Ranking Sum
7 2005-15 4 Little Nolan Creek Tributary 1 at Caprock Drive
As of the writing of this report, the PER for this project has been contracted out, but is not completed. Ranking judgments are being reserved pending the completion of the PER. This project is upstream of 2005-18.
Pending PER
Conclusion
Not Estimated Pending PER Conclusions (Ongoing) ?
8 2012-12 3 Upper South Nolan Creek
Dimple Street and Grey Street regional detention was considered by Jacobs. It was found that there is not enough storage volume available to appreciably lower the flows through detention (by excavation) and the cost justification is not there.
Not Estimated
0 0 0 0 0 0

100018246/110099 4-13
From Table 4-1, the regional detention ponds appear to have the potential to reduce the 100-year peak
flow by approximately 5% to 17%. From Table 4-2, it appears that the Bermuda/Ronstan (2005-01),
Trimmier Road Ditch (2005-18), and Old Florence Ditch at Outlet (2012-08) have approximately enough
potential storage volume to mitigate for future upstream development, which will tend to increase future
flows and storm water runoff volume. From Table 4-3, the highest priority ponds are 2005-18 and 2012-
08. The regional ponds considered at the outlet of Little Nolan Creek (2012-09) and South Nolan Creek
and Little Nolan Creek at Confluence (2012-10) are situated at attractive locations to mitigate for ultimate
development flows before water is discharged from the City limits, but it is not clear if enough storage
volume could be created to make these ponds feasible and cost effective.
4.3.3 Regional Detention Recommendations
It is recommended that the City adopt a comprehensive regional detention strategy, geared primarily
towards mitigating for ultimate development flows. This DMP report is not comprehensive enough to
make definitive recommendations on which pond locations should be utilized for regional detention given
the complexity of the issue. The first step in developing such a comprehensive watershed management
strategy would be to develop watershed-wide hydrologic models for all drainage basins within the City.
These hydrologic models should have well-documented assumptions for existing and future runoff
conditions. Comprehensive watershed models could then be used to determine the independent and
combined influence of the regional ponds discussed in this study and identify and evaluate further
alternative scenarios. From that, individual ponds can be identified for preliminary engineering study to
determine the preferred design strategy and cost.
4.4 STORM DRAIN AND DITCH NEIGHBORHOOD DRAINAGE
Eight areas were identified for possible improvements to storm drain and ditch neighborhood drainage
systems. These problem areas typically experience shallow flooding in streets, but water has been known
to overflow into residential homes on occasion due to inadequately sized ditches, storm drains, and
outfalls. See Figure 4-3 for an overview of the location of the proposed storm drain and ditch
neighborhood areas identified for improvements. See Appendix B.2 for a synopsis of the eight projects
considered for schematic evaluation.
A summary and priority ranking of the storm drain and ditch neighborhood drainage projects are
presented in Table 4-4. From this, a total of $2.6 million (approximately) of drainage improvements to
storm drain and ditch neighborhood drainage systems have been identified. The projects with the highest
priority were for Greenforest Circle (2005-27), Trimmier/10th Street at Hallmark (2012-21), Woodrow
Phase 2 (2012-02), Briarcroft Lane (2008-05), and Misty Land Strom Drain Phase 2 (2012-16) among
others. Preliminary engineering study and design will be required to specify cost and alternative design
strategies on a project by project basis.

W JASPER DR
CH
AN
TZ
DR
Fort Hood
Bell County
Coryell County
FO
RT
HO
OD
ST
(S
H 1
95
)
MA
XD
ALE
RD
STAGECOACH RD
E ELMS RD
WESTCLIFF RD
E RANCIER AVE (FM 439)
ON
ION
RD
CL
EA
R C
RE
EK
RD
(S
H 2
01)
ZEPHYR RD
S W
S Y
OU
NG
DR
REESE CREEK RD
SH
AW
N D
R
N 3
8T
H S
T
FAWN DR
60T
H S
T
RO
BIN
ET
T R
D
ME
SA
DR
WATERCREST RD
W STAN SCHLUETER LP (FM 3470)
N 4
TH
ST
ELMS RD
TR
IMM
IER
RD
GUS DR
E CENTRAL TEXAS EXPY (US HWY 190)
E STAN SCHLUETER LP (FM 3470) CU
NN
ING
HA
M R
D
EA
ST
TR
IMM
IER
RD
N R
OY
RE
YN
OL
DS
DR
BU
NN
Y T
RL
JIM AVE
E VETERANS MEMORIAL BLVD (BUS HWY 190)
ASPEN DR
FL
OR
EN
CE
RD
ES
TE
LL
E A
VE
WATER ST
FE
ATH
ER
LIN
E R
D
S W
S Y
OU
NG
DR
LOVE RD
CO
DY
PO
E R
D
PL
AT
INU
M D
R
BE
RM
UD
A D
R
EDGEFIELD ST
TA
LL
WO
OD
DR
TAFT ST
JA
SM
INE
LN
PRIVATE DR
SANTA FE DR
SUNNY LN
GOLDEN GATE DR
N T
WIN
CR
EE
K D
R
BO
NN
IE D
R
S 1
0T
H S
T
HANK DR
LOOP RD
AUBURN DR
LA
VE
ND
ER
LN
DOFFY DR
N 4
6T
H S
T
MICHAEL DR
KE
LL
EY
LN
LANCE LP
W ELMS RD
N 4
2N
D S
T
BR
IDL
E D
R
SALT FORK DR
LLEWELLYN DR
SERPENTINE DR
TIFFANY CIR
TATONKA DR
CH
EL
SE
A D
R
RIM DR
LEWIS ST
CO
KU
I DR
TR
IMM
IER
RD
OA
KA
LL
A R
D
South Nolan Creek
Aco
rn C
reek
Hays
Bra
nc
hSouth Nolan Creek C
ap
rice D
itch
Little
Nola
n Cre
ek
Little
Nol
an C
reek
Ste
wart D
itch
North
Reese C
reek Trib 1
Lib
erty
Dic
h
Lo
ng
Bra
nc
h D
itch
Old Florence Ditch
Valle
y R
oad D
itch
Trimmier Creek
Trimmier Road Ditch
No
rth R
eese C
reek
Upper R
eese Creek
South Nolan Creek
2008-05
2012-21
2012-16
2012-07
2005-26
2005-272012-02 &2010-3
6504 Bridge Point Pkwy, Ste. 200
Austin, Texas 78730
Phone: (512) 327-6840
Figure 4-3
Prepared for: City of Killeen
Job No.: 100018246
Prepared by: D. Harris Date: July, 20120 1.5 3
Miles
Legend
Storm Drain and Ditch Neighborhood Drainage
County Line
Killeen City Limits
100-Year FEMA Flood Zone
Zone A
Zone AE
Stream Centerline ¹ Scale: 1 inch = 1.5 mi
File: Figure 4- Neighborhood Drainage Storm Sewer and Ditch.mxd
2012-18
Storm Drain and Ditch Neighborhood
CIP Location Overview

100018246/110099 4-15
Table 4-4 Storm Drain and Ditch Neighborhood Drainage CIP Ranking Summary
Rank
Project Reference Number
Council District
Capital Improvement Project (CIP) Description of Project
Estimated Cost ($)*
Public Safety
Trans Access
Property Damage
Engineering Economy
Water Quality Benefit
Ranking Sum
1 2005-27 1 Greenforest Circle Storm Drain and Inlets
Street and neighborhood experiences flooding due to the lack of a conveyance system. Recommend adding storm drain and curb inlets. Drainage on Greenforest Circle and South Roy Reynolds will both see improvements.
208,000 2 4 5 4 0 15
2 2012-21 3 Trimmier/10th Street at Hallmark Storm Drain and Inlets
Water flows down Trimmier Road to the intersection of E. Hallmark Avenue where it splits to the west down Hallmark Avenue, and north down South 10th Street causing road inundation and a traffic hazard. Additional storm drain inlets and pipe along Trimmier/10th Street that would tie into an existing system that outfall at South Nolan Creek is recommended.
227,000 5 5 1 4 0 15
3 2012-02 4 Woodrow - Phase 2 Storm Drain Construction
Phase 1 storm drain improvements have been completed. Add additional (Phase II) curb inlets and storm drain along Woodward Drive.
364,000 3 4 3 3 0 13
4 2008-05 3 Briarcroft Lane Culvert and Ditch/Channel Improvements
Increase Briarcroft culvert outlet to 50-year level of service (LOS) and improve surrounding ditches; improve Tanglewood Estates Outlet Channel to 50-year LOS. At the split flow at Briarcroft and Mighty Oak Lane, water might be completely directed north, away from the three 30-inch reinforced concrete pipe (RCP) at the outlet along Briarcroft.
181,000 2 3 4 3 0 12
5 2012-16 2 Misty Lane Phase 2 Storm Drain
This project was identified in 2005 for storm drain improvements along Misty Lane. A PER was performed by the Wallace Group that also considered channel improvements to Acorn Creek and Bending Trail Ditch. Clogging at the Bending Trail Ditch and Acorn Creek Trail cross culvert has been known to occur and three 6-x-5-foot reinforced concrete box (RCB) up-sized culverts have been proposed by Wallace Group. One property reported flooding on Greenlee Drive in the September 2010 event in this area. Therefore, maintenance and drainage improvements to the flume behind this
275,000
2 3 3 3 0 11

100018246/110099 4-16
Rank
Project Reference Number
Council District
Capital Improvement Project (CIP) Description of Project
Estimated Cost ($)*
Public Safety
Trans Access
Property Damage
Engineering Economy
Water Quality Benefit
Ranking Sum
residence should be considered as well.
6 2012-03 4 Woodrow Phase 3 Storm Drain Construction
Phase 1 Storm Drain improvements have been completed. Add additional (Phase 3) curb Inlets and storm drain along Jake Spoon Drive.
143,000 3 3 2 3 0 11
7 2012-07 3 & 4 Skyline Ave Storm Drain and Inlets Construction
Runoff from the apartment complex at the top of the drainage area should be better directed into existing storm drain inlet, or otherwise directed away from the three homes that reported flooding in the September 2010 event. Storm water runoff is also known to cause street and yard flooding. Therefore, storm drains and curb inlets should be considered on Swope Drive and Skyline Avenue.
650,000 2 3 2 2 0 9
8 2005-26 3 Wolf Ditch Storm Drain
This project was identified in the 2005 DMP for a new storm drain pipe. The existing pipe evidentially runs under existing property and may be undersized. However, there are no major drainage issues known to occur in here.
596,000 1 0 2 1 0 4
SUM TOTAL 2,644,000

100018246/110099 4-17
4.4.1 Storm Drain and Ditch Neighborhood Recommendations
Storm drain, ditch, and outfall improvements tend to have a direct positive impact on the citizens who live
in the neighborhood, and improvements often can enhance transportation access benefiting citizens
broadly across the City. As such, these types of projects tend to have a high ranking, and it is
recommended that nearly all of the CIP projects presented in this section be considered for more detailed
study, design, and construction.
4.5 STREAM REPAIR AND FLOODPLAIN IMPROVEMENTS
A number of stream reaches have been identified with failures in their concrete-lined channel, or earthen
channels that have experienced severe erosion in both the bed and banks. Additionally, throughout the
City there are a number of streams that are the source of flooding for surrounding property and structures.
Ten areas have been identified for schematic evaluation for stream repair and floodplain improvements.
See Figure 4-4 for an overview of the location of stream reaches identified for capital improvement. See
Appendix B.3 for a synopsis of the projects considered for schematic evaluation.
Generally, there are three types of CIPs that have been identified related to streams and channels as
discussed below.
1. Concrete Channel Repair: There are numerous concrete channels throughout the City that are
at full capacity for just the 10-year flow, and the vast majority of concrete channels will
overflow for the 50-year flow. During the September 2010 event, several concrete channels
overflowed. Consequently, where the channel overflowed, the soil frequently was washed out
at the interface between the concrete and soil on the top of bank. Additionally, there were
several concrete panels that completely failed and were washed downstream, as shown for in
Figure 4-5. The most severe concrete channel failures, in order of priority, occurred in
Stewart, Valle Road, and Fowler Run Ditch.
2. Earthen Channel Repair/Stream Restoration and Enhancement: As land development occurs
in a watershed, it is common for the developer to widen and straighten existing natural
channels. Often, these earthen channels were constructed with side slopes as steep as 1:1
(horizontal:vertical). As the watershed develops, additional impervious cover increases storm
water runoff volumes and peak flows. As a result, there is an increased rate of erosion. Side
slopes of 1:1 oftentimes will erode to a vertical position and continue to erode back into the
bank. This is most likely to occur where the bed slope is 2% or greater. A number of
examples of stream erosion have occurred in Upper South Nolan Creek watershed where
earthen channels were constructed with inadequate capacity and side slopes that were too
steep and therefore have eroded as in Figure 4-6.

W JASPER DR
CH
AN
TZ
DR
Fort Hood
Bell County
Coryell County
2012-14
2012-24
FO
RT
HO
OD
ST
(S
H 1
95
)
MA
XD
ALE
RD
STAGECOACH RD
E ELMS RD
WESTCLIFF RD
E RANCIER AVE (FM 439)
ON
ION
RD
CL
EA
R C
RE
EK
RD
(S
H 2
01)
ZEPHYR RD
S W
S Y
OU
NG
DR
REESE CREEK RD
SH
AW
N D
R
N 3
8T
H S
T
FAWN DR
60T
H S
T
RO
BIN
ET
T R
D
ME
SA
DR
WATERCREST RD
W STAN SCHLUETER LP (FM 3470)
N 4
TH
ST
ELMS RD
TR
IMM
IER
RD
GUS DR
E CENTRAL TEXAS EXPY (US HWY 190)
E STAN SCHLUETER LP (FM 3470) CU
NN
ING
HA
M R
D
EA
ST
TR
IMM
IER
RD
N R
OY
RE
YN
OL
DS
DR
BU
NN
Y T
RL
JIM AVE
E VETERANS MEMORIAL BLVD (BUS HWY 190)
ASPEN DR
FL
OR
EN
CE
RD
ES
TE
LL
E A
VE
WATER ST
FE
ATH
ER
LIN
E R
D
S W
S Y
OU
NG
DR
LOVE RD
CO
DY
PO
E R
D
PL
AT
INU
M D
R
BE
RM
UD
A D
R
EDGEFIELD ST
TA
LL
WO
OD
DR
TAFT ST
JA
SM
INE
LN
PRIVATE DR
SANTA FE DR
SUNNY LN
GOLDEN GATE DR
N T
WIN
CR
EE
K D
R
BO
NN
IE D
R
S 1
0T
H S
T
HANK DR
LOOP RD
AUBURN DR
LA
VE
ND
ER
LN
DOFFY DR
N 4
6T
H S
T
MICHAEL DR
KE
LL
EY
LN
LANCE LP
W ELMS RD
N 4
2N
D S
T
BR
IDL
E D
R
SALT FORK DR
LLEWELLYN DR
SERPENTINE DR
TIFFANY CIR
TATONKA DR
CH
EL
SE
A D
R
RIM DR
LEWIS ST
CO
KU
I DR
TR
IMM
IER
RD
OA
KA
LL
A R
D
2012-11
2012-19
2012-18
2005-20a 2005-20b
2005-28
2005-24
2005-25
2012-20b
2012-20a
2005-13
South Nolan Creek
Hays
Bra
nc
h
No
rth R
eese C
reek
South Nolan Creek Cap
rice D
itch
Aco
rn C
reek
Little
Nola
n Cre
ek
Little
Nol
an C
reek
Ste
wart D
itch
North
Reese C
reek Trib 1
Lib
erty
Dic
h
Lo
ng
Bra
nc
h D
itch
Old Florence Ditch
Valle
y R
oad D
itch
Trimmier Creek
Trimmier Road Ditch
Upper R
eese Creek
South Nolan Creek
6504 Bridge Point Pkwy, Ste. 200
Austin, Texas 78730
Phone: (512) 327-6840
Figure 4-4 Stream Repair and Floodplain
Improvements Location OverviewPrepared for: City of Killeen
Job No.: 100018246
Prepared by: D. Harris Date: July, 20120 1.5 3
Miles
Legend
Stream Repair and Floodplain Improvements
County Line
Killeen City Limits
100-Year FEMA Flood Zone
Zone A
Zone AE
Stream Centerline ¹ Scale: 1 inch = 1.5 mi
File: Figure 4- Possible Regional Detention Location Overview.mxd
2012-18

100018246/110099 4-19
Figure 4-5: Example of Concrete Channel Needing Repair
Figure 4-6: Example of Stream Needing Channel Restoration and Enhancement
3) Floodplain Improvement: Killeen has almost 900 residential and business structures in the
100-yr FEMA floodplain. Studies have previously been performed that outline existing and
proposed alternative floodplain boundaries for areas such as South Nolan Creek (alternative
detention), Valley Road Ditch, Bermuda/Ronstan Ditch (alternative detention and channel
improvements), Acorn Creek (alternative channel Improvements), and South Nolan Creek at
Stallion Drive (alternative detention, stream enhancements).

100018246/110099 4-20
Table 4-5 Stream Repair and Floodplain Improvements Ranking Summary
Rank
Project Reference Number
Council District
Capital Improvement Project (CIP) Description of Project
Estimated Cost ($)*
Public Safety
Trans Access
Property Damage
Engineering Economy
Water Quality Benefit
Ranking Sum
1 2012-11 2 Stewart Ditch Channel Repair and Improvements
This concrete channel has some of the most severe and numerous structural failures in the City. There are about 88 structures in the 100-year floodplain, and channel improvements should be considered. Preliminary drainage engineering should be commissioned for this entire reach so that alternative drainage improvements and cost can be better understood. This project area is considered a high priority for channel repair, preliminary engineering study, and channel improvements.
862,000 4 4 5 2 0 15
2 2005-20b 2 & 3 Valley Road Ditch Phase 2 Floodplain Mitigation
The first priority is to repair the concrete channel and prevent the progression of existing failures. As funding is available, channel and culvert improvements should be considered as per the Walker Partners study. Improvements to the railroad culverts have recently been funded to add two 72-inch RCP.
373,000 4 4 4 2 0 14
3 2005-20c 2 & 3 Valley Road Ditch Phase 3 Floodplain Mitigation
Avenue A to Avenue B improvements including demolish existing concrete channel lining, headwall and improve culvert at Avenue A.
928,000 4 4 4 2 0 14
4 2012-20b 4 Edgefield
Stream Restoration
This reach is highly eroded and has little aesthetic value. Two existing concrete grade-control structures have been washed out and should be replaced with rock riprap (or concrete). Other grading and landscaping alternatives should be considered to enhance vegetation and aesthetics.
250,000 0 0 3 3 4 10
5 2012-20a 4 Rainforest Stream Restoration
The vertical banks should be laid back to a stable slope, and up to 5 rock grade-control structures should be considered to prevent channel-bed erosion.
150,000 0 0 3 3 4 10

100018246/110099 4-21
Rank
Project Reference Number
Council District
Capital Improvement Project (CIP) Description of Project
Estimated Cost ($)*
Public Safety
Trans Access
Property Damage
Engineering Economy
Water Quality Benefit
Ranking Sum
6 2005-24 1 Dickens Ditch Stream Repair
This reach is experiencing some erosion and has the potential to damage private property and erode outside of the drainage easement, erosion is just now or may in the future start to progress outside of the drainage easement. Therefore, actions to stabilize the stream reach downstream of Westcliff Road should be considered.
350,000 0 0 4 3 3 10
7 2012-18 3 Fowler Run Ditch Infrastructure Repair
This concrete ditch needs to be maintained by repairing structural concrete failures, filling in the overbanks, and armoring the overbank against future washouts. Finally, this reach should be studied to identify the extent of the 100-year floodplain and consider possible channel improvements. This project will likely be completed by City crews.
99,000 0 0 4 4 2 10
8 2005-28 1 Long Branch Environmental Enhancements
This area was identified in the 2005 DMP for possible detention. Although there are some downstream flooding issues, this area is perceived to be better suited for environmental enhancements such as riffle pool and water quality environmental enhancements. Detention is not recommended here, but environmental and aesthetic improvements should be considered.
500,000 0 0 0 2 5 7
9 2012-24 2 Garcia Ditch Stream Stabilization
This channel has some severely eroded “nick points” within the channel, and the banks are eroding toward residential land undermining fences and land. Better vegetative cover should be established, armoring should be added to protect nick points, and the side slopes should be laid back to perhaps 1.5:1. Some rock riprap armoring and or grade-control structures may be warranted. Cost not estimated in detail.
200,000 0 0 2 2 3 7
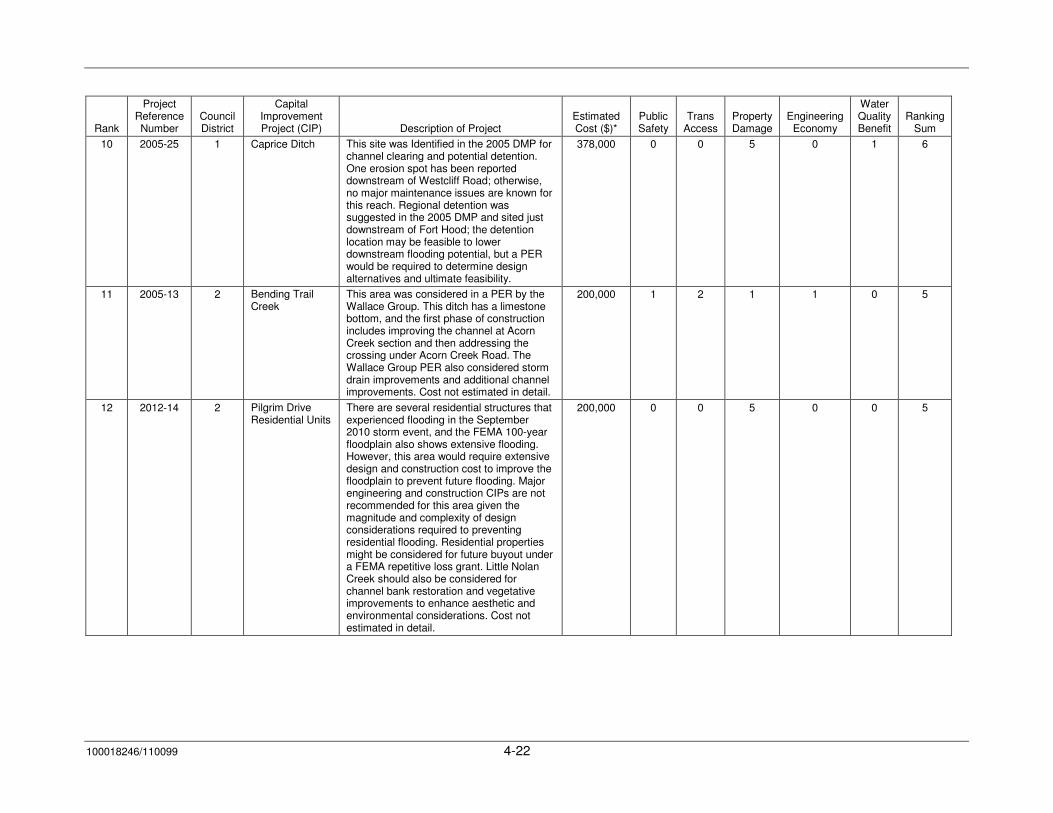
100018246/110099 4-22
Rank
Project Reference Number
Council District
Capital Improvement Project (CIP) Description of Project
Estimated Cost ($)*
Public Safety
Trans Access
Property Damage
Engineering Economy
Water Quality Benefit
Ranking Sum
10 2005-25 1 Caprice Ditch This site was Identified in the 2005 DMP for channel clearing and potential detention. One erosion spot has been reported downstream of Westcliff Road; otherwise, no major maintenance issues are known for this reach. Regional detention was suggested in the 2005 DMP and sited just downstream of Fort Hood; the detention location may be feasible to lower downstream flooding potential, but a PER would be required to determine design alternatives and ultimate feasibility.
378,000 0 0 5 0 1 6
11 2005-13 2 Bending Trail Creek
This area was considered in a PER by the Wallace Group. This ditch has a limestone bottom, and the first phase of construction includes improving the channel at Acorn Creek section and then addressing the crossing under Acorn Creek Road. The Wallace Group PER also considered storm drain improvements and additional channel improvements. Cost not estimated in detail.
200,000 1 2 1 1 0 5
12 2012-14 2 Pilgrim Drive Residential Units
There are several residential structures that experienced flooding in the September 2010 storm event, and the FEMA 100-year floodplain also shows extensive flooding. However, this area would require extensive design and construction cost to improve the floodplain to prevent future flooding. Major engineering and construction CIPs are not recommended for this area given the magnitude and complexity of design considerations required to preventing residential flooding. Residential properties might be considered for future buyout under a FEMA repetitive loss grant. Little Nolan Creek should also be considered for channel bank restoration and vegetative improvements to enhance aesthetic and environmental considerations. Cost not estimated in detail.
200,000 0 0 5 0 0 5

100018246/110099 4-23
Rank
Project Reference Number
Council District
Capital Improvement Project (CIP) Description of Project
Estimated Cost ($)*
Public Safety
Trans Access
Property Damage
Engineering Economy
Water Quality Benefit
Ranking Sum
13 2012-19 3 Little Nolan Creek Stream Restoration
Nine infrastructure failure points were documented after the September 2010 event. There are some minor bank erosion issues and moderately high erosion at some of the outfalls along this reach. This project is considered relatively low priority, but has the potential for future more-severe erosion and should be monitored in the future. Cost not estimated in detail.
200,000 0 0 0 2 2 4
SUM TOTAL $4,690,000

100018246/110099 4-24
4.5.1 Stream Repair and Floodplain Improvement Recommendations
The highest priority stream repair and floodplain improvement projects are the concrete channels in need
of repair, in particular at Valley Road Ditch (2005-20) and Stewart Ditch (2012-11). These CIPs have
numerous concrete sections that have been completely washed out, and more-severe and extensive costly
damage will occur in future storm events if repairs are not made. In addition to concrete channel repairs,
Valley Road and Stewart Ditch have known floodplain issues, with the potential for damage to residential
and commercial property. Therefore, channel improvements should be considered as funding allows.
In addition to the concrete channel repair needs, there are a number of earthen channels that are unstable
and experiencing a high rate of erosion. The earthen channels within the City considered to have some of
the highest priority stream restoration needs are Edgefield/Rainforest (2012-20), Dickens Ditch (2005-
24), and Garcia Ditch (2012-24).
4.6 TRANSPORTATION CROSS DRAINAGE (BRIDGES AND
CULVERTS)
According to the Centers for Disease Control, over half of all flood-related drownings occur when a
vehicle is driven into hazardous floodwaters2. Fast moving floodwater of just 6 inches deep is sufficient to
knock over an adult. Most cars and trucks may be washed away by 2 ft or less of rushing water. The
City’s 1992 Drainage Design Criteria specifies a 50-year level of service (LOS) for drainage areas
between 100 and 600 acres; for drainage areas greater than 600 acres, the road must pass the 100-year
flow without overtopping.
The September 2010 event caused one fatality when a car was swept off of Reese Creek Road. During the
September 2010 storm event, 35 road crossings were closed due to dangerous conditions with water
overtopping the road or threatening to do so. See Figure 4-7 for the locations of the roads closures due to
the September 2010 storm event.
A detailed analysis of road overtopping was outside the scope of this report. Therefore, road crossing
improvements have not been ranked explicitly using the CIP prioritization criteria identified for the CIPs
schematically evaluated above.
Of the 35 road closures during the September 2010 storm event, 19 crossings have been identified as
high-priority stream crossings that should be considered for future improvements. Identification of these
19 high-priority crossings was based on the following considerations: 1) the importance of the road to
stay open during a storm event; for instance, any principal arterial or marginal access road that
overtopped in the September 2010 event was included in the high-priority list, and 2) the proximity of
that road to fire and police stations and how future road closures might affect emergency response. See
Table 4-6 for a list of the 19 highest priority road/stream crossings that have the potential to hinder
emergency response during a major storm event.
2 http://www.nws.noaa.gov/os/water/tadd/tadd-intro.shtml

tt
t
t
t
!?!?
!?
!?
!?
!?
!?
!?
!?
!?
!?
!?
!?
!?
!?
!?!?!?
!?
!?!?
!?
!?
!?
!?
!?
!?
!?
!?
!?
!?
!?
!?
!?
!? !?
!?
!?
!?
!?
!?
!?
!?!?
!?
!?
!?
!?
!?
!?
!?
!?
84 8
837
838
838
South Nolan Creek
Cap
rice D
itch
Acorn
Creek
Ha
ys
Bra
nc
h
Little
Nola
n Cre
ek
Ste
wa
rt Ditc
h
North
Reese C
reek Trib 1
Lib
erty
Dic
h
Lo
ng
Bra
nc
h D
itch
Old Florence Ditch
Valle
y R
oad
Ditc
h
Trimmier Creek
Trimmier Road Ditch
No
rth R
eese C
reek
Upper R
eese Creek
South Nolan Creek
South Nolan Creek
Little
Nola
n Cre
ek
8
7
6
5
4
3
35
34
33
32
31
30
29
28
27
26
25
24
23
22
21
20
19
1817
15
14
13
12
11
10
33
9
2
1
16
9
4
3
232
30
28
27
24
23
22
21
20
15
12
11
6504 Bridge Point Pkwy, Ste. 200
Austin, Texas 78730
Phone: (512) 327-6840
Figure 4-7Street Flooding in
September 2010 EventPrepared for: City of Killeen
Job No.: 100018246
Prepared by: D. Harris
Scale: 1 inch = 800 feet
Date: July, 2012
File: Figure 4-X Street Overtoped in September 2010 Storm Event.mxd
Legend
!? Priority Road Closed in September 2010 Storm Event
!? Other Road Closed in September 2010 Storm Event
t Street Flooding
Fire Station
Police Station
Stream Centerline
County Boudary
Killeen City Limits
¹0 8,000 16,000
Feet
Bell County
Coryell County

100018246/110099 4-26
It is also expected that as roads are reconstructed or widened, cross drainage will be evaluated, and
opportunities to upsize bridges and culverts (to meet City Requirements) will be engaged as individual
roads are considered for improvement.
Table 4-6 Priority Stream Crossings Suggested for Future Improvements Consideration
Count ID Location
1 2 Twin Creek Road and the Railroad Tracks
2 3 WS Young and Rancier
3 4 38th Street below the Overhead Railroad Track
4 7 Greenwood and Alexander
5 9 Imperial Drive and Central Texas Expressway
6 11 Terrace and Redondo
7 12 Elms Road and Cunningham
8 15 Featherline between Chaparral and Stagecoach
9 16 28th Street between VMB and Greenwood
10 18 28th and Avenue G
11 20 28th and VMB
12 21 W.S. Young and VMB
13 22 Park and VMB
14 23 Chapparal Road and just east of Purple Martin Drive
15 24 Reese Creek Road near Maxdale Road
16 27 Chapparal Road and Hwy 195
17 28 Alpine and Highway 195
18 30 W.S. Young between Elms and Stan Schlueter
19 32 Clear Creek and Desert Willow
20 33 Upper Reese Creek at Reese Creek Road (Fatality during Tropical Storm Hermine Occurred Here)
4.7 DRAINAGE EASEMENT CONSIDERATIONS
Additional easements will likely be required for proposed culvert and outfall improvements, the
repair/improvement and stabilization of drainageways, and regional detention ponds. However, where it
can be shown that the property owner would benefit mutually from the proposed improvement, easement
acquisition should be attempted at no cost to the City. In other locations, the City may have a prescriptive
right to make drainage improvements without first acquiring drainage easement. For instance, for areas
within a concrete channel, the City is assumed to have a prescriptive right to maintain and repair that
channel irrespective of whether there is a drainage easement.
Drainage easement needs were estimated for this study using a drainage easement shapefile received from
the City. However, not all easements were identified in this shapefile, and it did not include drainage
easements granted to the City after 2005. Therefore, easements must be considered in more detail when
developing preliminary engineering studies for the individual CIPs. Where no easement was found based

100018246/110099 4-27
on the City’s easement shapefile, easement acquisition was assumed to be required in the schematic cost
estimate. In addition to drainage easements, the need for temporary construction and access easements
may also be required.

100018246/110099 5-1
5.0 FEMA MAP CHANGES
The current FEMA FIRMs for Bell County became effective on September 26, 2008. The previously
effective FIRM was dated February 1984. This section evaluates the differences between these two
floodplain boundaries in order to determine the number of properties in the recently updated floodplain as
compared to the previous effective 1984 boundary.
A GIS analysis was performed to identify the number of structures that were inside the 100-year
floodplain for the 1984 and 2008 boundaries within the study area. The structure footprints feature dataset
provided by the City was used in the comparison. See Table 5-1 below for a summary of the structure
count for the various creeks mapped in the 2008 and 1984 FEMA studies.
Table 5-1 FEMA 1984 vs. 2008 Structures in 100-year Floodplain Count
Stream Name
2008 1984
Structure
Count
Structure
Count
Acorn Creek 0 0
Caprice Ditch 20 132
Chaparral Creek 2 3
Embers Creek 0 0
Harker Heights Tributary 4 3 7
Hay Branch 0 0
Hilliard Creek 1 0
Liberty Ditch 17 20
Little Nolan Creek 128 187
Long Branch Ditch 44 42
North Reese Creek 1 0
North Reese Creek Trib 1 0 0
North Reese Creek Trib 3 0 0
Old Florence Ditch 6 34
Rock Creek 2 0
South Nolan Creek 496 341
Stewart Ditch 126 81
Trimmier Creek 6 13
Trimmier Road Ditch 27 146
Upper Reese Creek 2 0
Yowell Creek 0 0
Yowell Creek Trib 0 0
Total 881 1006
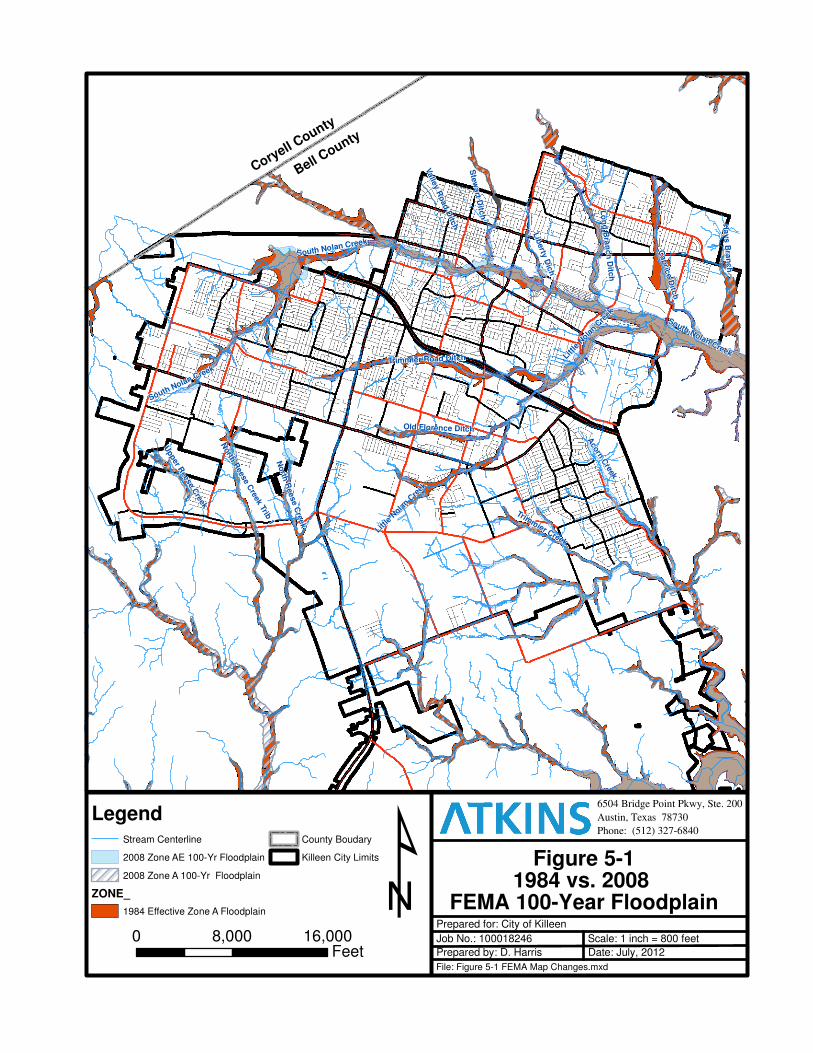
84 8
837
838
838
South Nolan Creek
Cap
rice D
itch
Acorn
Creek
Ha
ys
Bra
nc
h
Little
Nola
n Cre
ek
Ste
wa
rt Ditc
h
North
Reese C
reek Trib 1
Lib
erty
Dic
h
Lo
ng
Bra
nc
h D
itch
Old Florence Ditch
Valle
y R
oad
Ditc
h
Trimmier Creek
Trimmier Road Ditch
No
rth R
eese C
reek
Upper R
eese Creek
South Nolan Creek
South Nolan Creek
Little
Nola
n Cre
ek
6504 Bridge Point Pkwy, Ste. 200
Austin, Texas 78730
Phone: (512) 327-6840
Figure 5-11984 vs. 2008
FEMA 100-Year FloodplainPrepared for: City of Killeen
Job No.: 100018246
Prepared by: D. Harris
Scale: 1 inch = 800 feet
Date: July, 2012
File: Figure 5-1 FEMA Map Changes.mxd
LegendStream Centerline
2008 Zone AE 100-Yr Floodplain
2008 Zone A 100-Yr Floodplain
ZONE_
1984 Effective Zone A Floodplain
County Boudary
Killeen City Limits
¹0 8,000 16,000
Feet
Bell County
Coryell County

100018246/110099 6-1
6.0 WATER QUALITY CONSIDERATIONS
Water quality considerations were not a scoped objective of this drainage needs assessment study.
However, as part of a comprehensive DMP, some basic water quality considerations should be
considered. Ideally, this subject would be covered in more detail under a stand-alone report specific to
water quality strategies. Such a report would provide recommendations for water quality criteria and
water quality improvement strategies based on an assessment of alternative water quality control
techniques along with a corresponding ranking of advantages and disadvantages that could be used by
policy makers to adopt water quality criteria.
The City does not currently mandate permanent water quality Best Management Practices (BMPs)
measures for new developments, such as water quality ponds, vegetative buffer/filter strips, etc. However,
the City does maintain a Phase II Storm Water Management Program (SWMP), which seeks to reduce the
discharge of storm water pollutants to the maximum extent practical. The SWMP is mandated by the
Environmental Protection Agency (EPA) under the Clean Water Act and enforced by the Texas
Commission on Environmental Quality (TCEQ). The City maintains a Municipal Separate Storm Drain
System (MS4) that is subject to the requirement of the SWMP under a small MS4 general permit
approved by TCEQ.
Section 5 of the City’s SWMP discusses required minimum control measures such as public outreach and
illicit discharge detection. The SWMP also calls for the development of future ordinances requiring the
use of permanent storm water quality control measures in areas of new development and redevelopment
known as post construction ordinances. Post construction ordinances were in August of 2012.
The remainder of this section covers two primary topics related to water quality control:
1. Identification of water quality improvement goals.
2. Identification of the types of BMPs or construction techniques and strategies that might be
considered in developing any future post construction ordinances.
6.1.1 Water Quality Improvement Goals
Water quality improvement goals should be based on a desired reduction in sediment, phosphorus,
nitrogen, biochemical oxygen demand, and bacteria, which are among the most important types of
pollutants. As detailed below, there are three watersheds within the City that drain into streams listed on
the 2010 TCEQ 303(d) list of impaired water bodies. See Figure 6-1 for an overview figure of these three
water bodies.
1. Trimmier Creek: From confluence with Stillhouse Hollow Lake upstream to its headwaters
(Segment ID 1216A_01), listed for bacteria.
2. South Nolan Creek: From confluence with North Nolan Creek upstream to confluence with
Liberty Ditch (Segment ID 1218C_02), listed for bacteria.

HWY 190Stan Schluter Loop
Fo
rt H
oo
d S
t. (
SH
195)
Rancier Ave.
84 8
837
838
838
6504 Bridge Point Pkwy, Ste. 200
Austin, Texas 78730
Phone: (512) 327-6840
Figure 6-1
Prepared for: City of Killeen
Job No.: 100018246
Prepared by: D. Harris
Scale: 1 inch = 8,000 feet
Date: July, 2012
File: Figure 3-1 Hydrologic Watershed Summary A.mxd
Legend
303(d) Listed Stream
Stream Centerline
County Boudary
Killeen City Limits ¹0 8,000 16,000
Feet
Bell County
Coryell County
Overview of 303(d) Listed StreamsWithin City of Killeen
Trimmier Creek
Little Nolan Creek
South Nolan Creek

100018246/110099 6-3
3. Little Nolan Creek: From the confluence with South Nolan Creek upstream to headwaters
(Segment ID 1218C_01), listed for bacteria.
All of these streams are listed for bacteria, so post construction ordinances that can be shown to mitigate
for bacterial loading would provide a clear water quality benefit to a known impaired stream. Bacteria are
a common reason for listing a 303(d) stream and are associated with both agricultural and urban land
uses. Furthermore, bacteria counts can be mitigated using a number of different BMP strategies. Some of
these possible BMP strategies, which apply both to bacteria and the other contaminants listed above, are
discussed in the following subsection.
6.1.2 Water Quality Improvement Strategies
There are three basic strategies commonly employed in the development of post construction ordinances
designed to manage water quality concerns. The first and most common strategy is to require
“conventional” BMPs such as sedimentation/filtration ponds, wet ponds, and vegetative buffer strips. The
second strategy is to use low-impact development techniques. The third strategy is a combination of
traditional BMPs and low-impact development construction techniques.
Strategy #1 – Conventional Water Quality BMPs
Currently there are a number of municipalities in Texas (such as the cities of Austin and San Antonio,
among others) that have ordinances that mandate the use of what might be considered “conventional”
water quality controls. These controls are “conventional” in the sense that they have been employed for a
relatively long period, have a well-established history of use, and are associated with numerous studies
that document the effectiveness of such controls. Most of these “conventional” controls are structural in
nature with the exception of vegetative filter strips as discussed in more detail below. Regional detention
ponds should also be considered as a possible water quality pond.
• Sedimentation/Filtration Systems – These systems use a sedimentation chamber to capture the
first flush of rainwater, which then migrates into a filtration chamber that typically uses a sand
bed to filter the water before it is discharged. These systems are designed to capture only the first
flush of storm runoff, which is considered to have the highest concentration of pollutants.
Surcharge flows would typically be diverted to a flood control pond.
• Wet Ponds – These ponds are designed to always have some amount of water, and require aquatic
vegetation and wetland plantings that remove dissolved nutrients.
• Sedimentation Systems – Sedimentation systems capture a given volume of water and release the
water slowly enough to allow the sedimentation of suspended solids.
• Extended Detention Ponds – Extended detention simply creates extra volume in a detention pond
that allows for a long enough hydraulic residence time that sedimentation of suspended solids
may take place.
• Retention/Irrigation Systems – These systems retain all of the water captured in the pond without
releasing it to a receiving stream. Stored water is then used for irrigation or allowed to evaporate.

100018246/110099 6-4
Clay linings may be desired in these systems to prevent infiltration so that stored water may be
used for irrigation.
• Retention/Infiltration Systems – This system is similar to the above system; however, provisions
are made to ensure that the bottom of the pond is sufficiently permeable to allow the captured
water to infiltrate into the ground.
• Vegetative Filter Strips – Vegetative filter strips provide a vegetative buffer through which sheet
flow from an urban area may be directed to promote infiltration, filtration, and the absorption of
nutrients from the runoff. Vegetative filter strips are commonly used along roads, and have been
studied by the TCEQ and approved as a valid measure used in water pollution abatement plans
required for development over the Edwards Aquifer.
The controls described above each have their own advantages and disadvantages. In general, the
disadvantages of these structural controls are that they all require maintenance and in many instances are
not aesthetically pleasing to some. On the other hand, these controls offer the advantage that they are well
established and may be constructed using a clearly defined set of criteria. Such criteria should yield a
relatively well-defined water quality benefit.
Strategy #2 – Low Impact Development
Municipalities are becoming increasingly concerned about whether conventional BMPs are being
maintained properly, and developers are faced with regulations that require them to lose significant
amounts of developable property in order to build structural BMPs. As a result, Low Impact Development
(LID) techniques are gaining acceptance as viable strategies to meet water quality goals by reducing the
peak flow, runoff volume, and pollution loads of storm water in innovative ways. Examples of LID
techniques are given below.
• Minimize impervious cover using pervious pavers – When developing land, some amount of
impervious cover will always be required. However, there are useful ways to reduce impervious
cover such as using pervious pavers/pavement for residential and commercial driveways.
• Rain gardens are shallow depressions in the ground that act somewhat like a wetland area to
retain some amount of runoff and release the water to infiltration and evapotranspiration. Small
rain gardens are most effective when constructed on a lot-by-lot basis across an entire subdivision
as opposed to one large, regional rain garden.
• Green roofs are most practical for commercial structures, and entail planting vegetation on the
roof of a structure so as to create permeable area capable of capturing some amount of rainfall.
This volume of rainfall is retained and slowly released through evapotranspiration.
• Rain harvesting is useful for capturing the first flush of rainwater and storing the water in a rain
barrel collection system. This strategy offers the additional benefit that stored rainwater may then
be used to water landscaped areas and reduce demand on municipal water supplies.
• Open drainage conveyance in vegetated channels is always more preferable from a water quality
standpoint than the use of concrete storm drain systems. A storm drain tends to increase the peak
rate of runoff and prevents infiltration and nutrient uptake that may otherwise occur in a
vegetated open channel.

100018246/110099 6-5
LID techniques have the advantage that, if designed and constructed properly, these strategies do a better
job of matching the original hydrologic characteristics of an area in terms of runoff timing, peak flow, and
volumes. LID measures also tend to be more aesthetically pleasing. However, LID strategies are more
subjective, require participation/maintenance by the residents of the LID area, and make it more difficult
to quantify the resultant water quality benefit.
Strategy #3 – Combination of Conventional and Low Impact Development Techniques using City-
approved Development Plans
The City may consider post construction ordinances that require the developer to submit a water quality
control plan providing for both conventional structural and nonstructural BMPs as well as LID
techniques. Such a plan would need to be developed by a qualified, licensed professional engineer and
suitably show that the proposed development meets established criteria in terms of storm water flow,
volume, and pollutant removal. Such a plan would have the advantage of allowing the developer the
flexibility to use a variety of water quality control strategies, but would have the disadvantage that the
effectiveness of any given plan would be somewhat more subjective than if only conventional structural
controls were mandated.
It is recommended that the City engage in a study of the sort of water quality BMPs strategies presented
in this section. Such a study should identify the advantages and disadvantages of each BMP with
recommended measures that might be used to develop City policy regarding water quality criteria and/or
ordinances.

100018246/110099 7-1
7.0 CIP RECOMMENDATIONS & CONCLUSIONS
This report contains an extensive body of information related to the drainage issues throughout the City of
Killeen. The primary focus of this report was related to the identification of drainage capital improvement
projects. Three types of drainage projects were considered in detail: 1) regional detention, 2) storm drain
and ditch neighborhood drainage and 3) stream repair and floodplain improvements. See Section 4 for
detailed information on the drainage CIP projects studied and ranked, and see Appendix B.1, B.2 and B.3
for synopsis summary information for all CIP projects.
Due to the regulatory time constraints placed on expenditure of bond funds, it is recommended that the
City’s drainage utility utilize bonding limitations similar to the water & sewer utility. This would result in
updating the drainage master plan in three year cycles and limiting the drainage bond to an amount
between $5 million and $10 million dollars. The larger bond years are anticipated to include projects such
as regional detention and large scale stream restoration. The recommendation for 2012 is for a smaller
bond to construct projects that underwent preliminary design from the previous bond, to design and
construct new projects identified in this drainage master plan, and to develop H/H models to evaluate
future regional detention projects.
Eight possible regional detention CIP projects were identified. Trimmier Road Ditch (2005-18) and Little
Nolan Creek at Old Florence Ditch (2012-08) have the highest priority. However, it is foremost
recommended that before any more regional detention ponds are studied, designed or constructed, a
comprehensive regional detention pond analysis should be performed in order to better understand the
interaction between the existing regional ponds and the proposed ponds so that a comprehensive strategy
for regional detention can be developed. This comprehensive regional detention pond analysis is required
in order to identify the benefits and costs necessary to justify these relatively expensive CIPs. In addition,
the existence of a comprehensive hydrologic study would allow the City to better manage future
development on a watershed basis and mitigate for resulting impacts on downstream stakeholders. As part
of this comprehensive regional detention pond analysis, it is recommended that a regional watershed
modeling and floodplain mapping study be conducted across the entire City so that the latest and best
available land use information may be incorporated.
Eight storm drain ditch and neighborhood drainage improvement areas were identified for capital
improvement. These improvements were schematically estimated to cost approximately $2,644,0003.
These types of drainage improvements tend to have the highest perception of value to the citizens and
tend to result in the greatest benefit to the most people. It is recommended that the seven highest priority
projects (from Table 4-4) be considered for funding of preliminary engineering study. The highest
priority storm drain, ditch, and/or neighborhood CIPs are for Greenforest Circle storm drain and inlets
(2005-27), Trimmier/10th Street at Hallmark storm drain and inlets (2012-21), Woodrow Phase 2 strom
3 Costs were estimated schematically based on assumptions, and costs from previous studies were used when available. Therefore,
costs are considered highly approximate and additional preliminary engineering analysis on a case by case bases is required to better
estimate individual project cost.

100018246/110099 7-2
drain construction (2012-02), Briarcroft Lane ditch and channel improvements (2008-05), and Misty Lane
Phase 2 Storm Drain (2010-16), Woodrow Phase 3 storm drain construction (2012-03) and Skyline
Avenue storm drain and inlet construction (2012-07).
Thirteen areas have been identified for stream repair and floodplain improvements. These thirteen
drainage CIPs are estimated to cost at least $4,690,000. The highest priority areas will address both
inundation of residential structures by flood water and stream restoration and repair. It is recommended
that the following high priority projects be considered for funding preliminary engineering study: Stewart
Ditch channel repair and improvements (2012-11), Valley Road Ditch floodplain mitigation (2005-20),
Edgefield/Rainforest stream restoration (2012-20), Dickens Ditch stream restoration (2005-24) and Long
Branch environmental enhancements (2005-28). In particular, Stewart and Valley Ditch have several
concrete sections that have been completely washed out, and more severe and extensive damage will
occur in future storm events if repairs are not made. In addition to concrete channel repairs, Valley Road
and Stewart Ditch have known floodplain issues that impact residential and commercial properties.
Cross street drainage issues associated with bridges and culverts were not prioritized. However, 19
locations with documented historical flooding have been summarized in Table 4-6.
There are 29 CIP projects that have been identified and ranked, of these the 15 highest propriety projects
from the three categories of CIP projects are recommended for capital improvement bond funding. These
projects are summarized on the following page in Table 7-1.

100018246/110099 7-3
Table 7-1 Summary of CIPs Recommended for Capital Improvement Bond Funding
Overall Priority
Project Reference Number
Capital Improvement Project (CIP)
Type of Project
Description of Project Estimated Cost ($)*
1 N/A Regional Watershed Modeling and Floodplain Mapping
Study In light of the more recent information and rapid development a revised floodplain study is recommended. This study would allow for an organized and concise set of hydrologic/hydraulic models that could be used in watershed management and would serve as a starting point to build upon for the regional detention analysis.
250,000
2 N/A Regional Detention Pond Analysis
Study As the City continues to develop rapidly, it is recommended that a comprehensive watershed wide detention analysis be performed in order to assess the best locations for future regional detention ponds and to ensure that watershed timing is properly accounted for considering all detention ponds.
250,000
3 2005-27 Greenforest Circle
Storm Drain and Inlets
N Streets and neighborhoods experience flooding due to the lack of a conveyance system. Recommend adding storm drain and curb inlets. Drainage on Greenforest Circle and South Roy Reynolds will both see improvements.
208,000
4 2012-21 Trimmier/10th Street at Hallmark Storm Drain and Inlets
N Water flows down Trimmier Road to the intersection of E. Hallmark Avenue where it splits to the west down Hallmark Avenue, and north down South 10th Street causing road inundation and a traffic hazard. Additional storm drain inlets and pipe along Trimmier/10th Street that would tie into an existing system that outfalls at South Nolan Creek is recommended. There is also a high ground water table in this area that may exacerbate drainage issues. This project may also be combined with proposed road improvements.
227,000
5 2012-11 Stewart Ditch Channel Repair and Improvements
S This concrete channel has some of the most severe and numerous structural failures in the City. There are approximately 88 structures in the 100-year floodplain, and channel improvements should be considered as per the Walker Partners Study.
862,000
6 2012-02 Woodrow - Phase 2
Storm Drain Construction
N Phase 1 storm drain improvements have been completed. Add additional (Phase II) curb inlets and storm drain along Woodward Drive.
364,000
7 2005-20a Valley Road Ditch
Phase 2
Floodplain Mitigation
S The first priority is to repair the concrete channel and prevent the progression of existing failures. As funding is available, channel and culvert improvements should be considered as per the Walker Partners study. Improvements to the railroad culverts have recently been funded to add two 72-inch RCP.
373,000
8 2005-20b Valley Road Ditch
Phase 3
Floodplain Mitigation
S Avenue A to Avenue B improvements including demolish existing concrete channel lining, headwall and improve culvert at Avenue A should be considered as per the Walker Partners Study.
928,000
9 2012-20a
&
2012-20b
Edgefield/Rainforest Stream Restoration
S These two reaches are highly eroded and have little aesthetic value. Two existing concrete grade-control structures have been washed out and should be replaced with rock riprap (or concrete). Other grading and landscaping alternatives should be considered to enhance vegetation and aesthetics.
400,000
10 2008-05 Briarcroft Lane Culvert and Ditch/Channel Improvements
N Increase Briarcroft culvert outlet to 50-year level of service (LOS) and improve surrounding ditches; improve Tanglewood Estates Outlet Channel to 50-year LOS should be considered as per the 2005 DMP.
181,000

100018246/110099 7-4
Overall Priority
Project Reference Number
Capital Improvement Project (CIP)
Type of Project
Description of Project Estimated Cost ($)*
11 2012-16 Misty Lane Phase 2 Storm Drain Improvement
N Storm drain improvements to improve residential street drainage should be considered as per the Wallace Group Study.
275,000
12 2012-03 Woodrow Phase 3
Storm Drain Construction
N Phase 1 Storm Drain improvements have been completed. Add additional (Phase 3) curb Inlets and storm drain along Jake Spoon Drive should be considered as per the Walker Partners Study.
143,000
13 2005-24 Dickens Ditch
Stream Repair
S This reach is experiencing some erosion and has the potential to damage private property and erode outside of the drainage easement. Erosion is just now and will continue to progress outside of the drainage easement. Therefore, actions to stabilize the stream reach downstream of Westcliff Road should be considered.
351,000
14 2012-07 Skyline Ave
Storm Drain and Inlets
N Runoff from the apartment complex at the top of the drainage area should be better directed into existing storm drain inlet, or otherwise directed away from the three homes that reported flooding in the September 2010 event. Storm water runoff is also known to cause street and yard flooding. Therefore, storm drains and curb inlets should be considered on Swope Drive and Skyline Avenue.
650,000
15 2005-28 Long Branch
Environmental Enhancements
S This area was identified in the 2005 DMP for possible detention. Although there are some downstream flooding issues, this area is perceived to be better suited for environmental enhancements such as riffle pool and water quality environmental enhancements. Detention is not recommended here, but environmental and aesthetic improvements should be considered.
500,000
Approximate Total Cost ($) 6,000,000
N = Storm Drain & Ditch Neighborhood Drainage
S = Stream Repair and Floodplain Improvement
* Costs are approximate and are based on schematic assumptions; more detailed preliminary engineering
analysis is required to define cost with greater certainty.
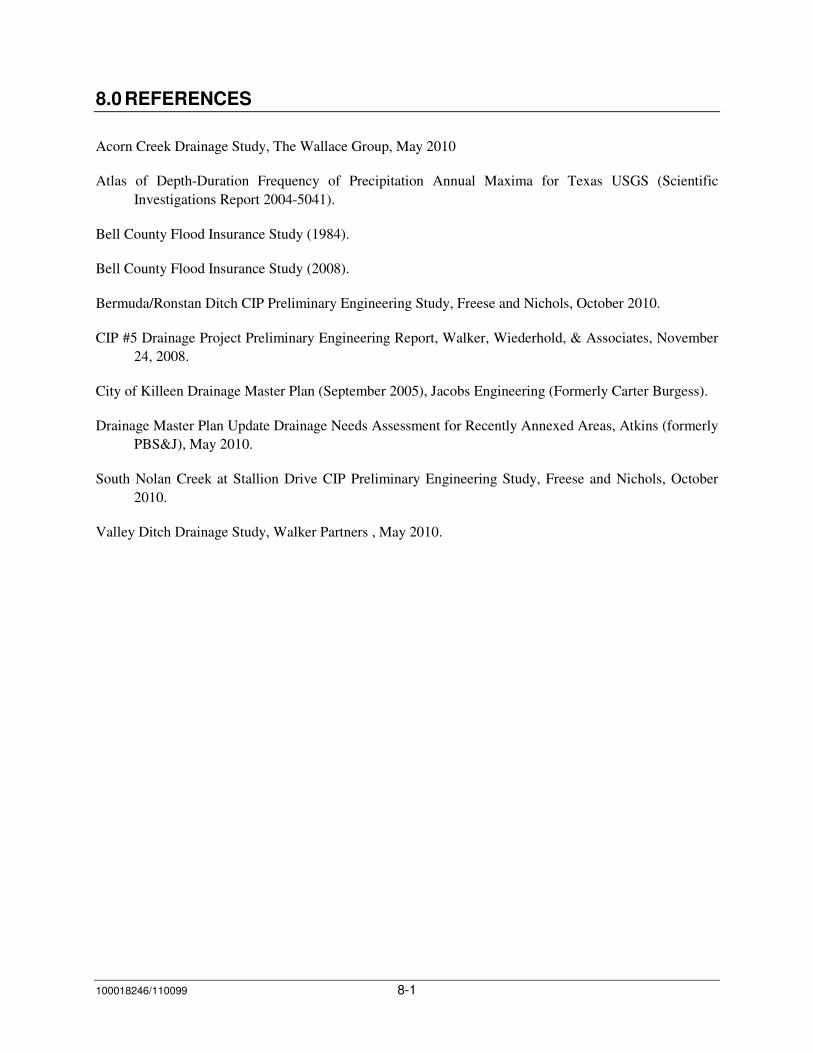
100018246/110099 8-1
8.0 REFERENCES
Acorn Creek Drainage Study, The Wallace Group, May 2010
Atlas of Depth-Duration Frequency of Precipitation Annual Maxima for Texas USGS (Scientific
Investigations Report 2004-5041).
Bell County Flood Insurance Study (1984).
Bell County Flood Insurance Study (2008).
Bermuda/Ronstan Ditch CIP Preliminary Engineering Study, Freese and Nichols, October 2010.
CIP #5 Drainage Project Preliminary Engineering Report, Walker, Wiederhold, & Associates, November
24, 2008.
City of Killeen Drainage Master Plan (September 2005), Jacobs Engineering (Formerly Carter Burgess).
Drainage Master Plan Update Drainage Needs Assessment for Recently Annexed Areas, Atkins (formerly
PBS&J), May 2010.
South Nolan Creek at Stallion Drive CIP Preliminary Engineering Study, Freese and Nichols, October
2010.
Valley Ditch Drainage Study, Walker Partners , May 2010.


![Killeen, Thomas B. TOCs/Killeen, Thomas B.toc.pdf · 2012-12-17 · 2 INTERVIEW [Note: This transcript was not edited by Mr. Killeen.] SUMMARY: This history of Thomas B. Killeen focuses](https://img.pdfslide.us/doc/110x75/5fba91d984c64d2537799e12/killeen-thomas-b-tocskilleen-thomas-btocpdf-2012-12-17-2-interview-note.jpg)