Embed Size (px)
Citation preview

DEPARTAMENTO DE CIÊNCIAS DA VIDA
FACULDADE DE CIÊNCIAS E TECNOLOGIA UNIVERSIDADE DE COIMBRA
Role of miRNAs and BDNF in the modulation of
hippocampal neurons morphology by antidepressants
Marta Costa Jordão
2012
Mart
a J
ord
ão
Role
of
miR
NA
s an
d B
DN
F i
n t
he
mo
du
lati
on
of
hip
poca
mp
al
neu
ron
s m
orp
holo
gy
by a
nti
dep
ress
an
ts
2012

DEPARTAMENTO DE CIÊNCIAS DA VIDA
FACULDADE DE CIÊNCIAS E TECNOLOGIA UNIVERSIDADE DE COIMBRA
Role of miRNAs and BDNF in the modulation of
hippocampal neurons morphology by antidepressants
Marta Jordão
2012
Dissertação apresentada à Universidade de Coimbra para cumprimento dos requisitos necessários à obtenção do grau de Mestre em Biologia Celular e Molecular realizada sob a orientação científica do Professor Doutor Enrico Tongiorgi (Universidade de Trieste) e do Professor Doutor Carlos Duarte Bandeira (Universidade de Coimbra)

i
ACKNOWLEDGEMENTS
The realization of this thesis would not be possible without the support and help
of many people. Is with love and pride that I thank to all of you.
First of all, I want to thanks to the Professor Enrico Tongiorgi for all the help and
guidance during this year and for having received me in your lab. Thanks for this year
in which I have learned a lot!
To Gabriele Baj, thank you very much for all the help that you gave me during my
thesis and congratulation for the patience that you had with me and with all in the lab.
Without you this thesis would not be possible!
To all the people in the lab, I want to thank the moments and the encouragement
in the last months. You will not be forgotten! Saranno sempre i miei “bastardi”!
Por não me esquecer das pessoas que me estão longe, e pela influência que
tiveram em mim durante o meu percurso académico, quero também agradecer à Joana
Santos, Joelma Pires, Telma Santos, Joana Branco e Andreia Correia por todas as
recordações e saudades que me deixam.
Ao Rui Maio, por tudo o que fez e continua a fazer por mim, por estar disposto a
ouvir-me durante horas para eu poder desabafar e por todo o ânimo e incentivo que
sempre me deu, Muito Obrigado! Obrigado pelo sentimento de orgulho que me fazes
sentir, não só em ti mas especialmente em nós!
Finalmente, quero agradecer à minha família e aos meus pais por significarem
sempre um “porto seguro” que sempre me confortou e que tanto me ajudou a ultrapassar
as minhas dificuldades. Obrigado por me terem possibilitado ter tido o percurso
académico que tive e por todo o amor que recebi durante estes anos..Aquilo em que me
tornei a vocês o devo! Muito obrigado a todos!

ii
ABSTRACT
Depression is a mood disorder, which represents one of the major causes of
disability of people worldwide. The major features of this disorder are the neuronal
plasticity impairment, abnormal neuronal network and in some case a cell loss but the
mechanism whereby they occur is still not fully understood. Antidepressant drugs, a
common choice for depression treatment, target monoamine neurotransmitters systems
decreasing serotonin and norepinephrine reuptake and consequently, promoting the
restoring of the monoamine neurotransmission. Although a fast increase in monoamine
levels with antidepressant administration, the therapeutic effects takes longer to be
visible. Recent studies found that antidepressant drugs can increase the neurotrophin
BDNF expression even before the rise of BDNF mRNA transcription, suggesting that
they can potentiate postregulation of BDNF. These results have raised the working
hypothesis of a role of miRNAs modulated by antidepressants in the BDNF gene
regulation. With this purpose, we have evaluated the effect of miRNAs modulated by
antidepressant treatment in the neuronal morphology and survival as well as their effect
on BDNF expression.
Our results suggest that mir-302b, mir-214 and mir-136 do not cause
morphological changes in neuronal morphology and survival since the up- or
downregulation do not represented a differential morphological behavior.
Measurements of BDNF expression levels modulating miRNAs were challenging;
however, as many miRNAs are putative or validated targets for BDNF gene, mostly in
the 3’UTR, it was evaluated the meaning of the 3’ UTR long for neuronal cells.
Truncation of the long 3’ UTR BDNF led to a decrease of the total dendritic length at 6
and 12 DIV although the number of primary and dendrites remained unaltered.

iii
Moreover, it was visible a lower number of mushroom spines at distal fields of matured
neurons and a lower percentage of colocalization with PDS-95 and Syn I at 6, 9 and 12
DIV.
Taken together, the results shows that the absence of BDNF transcripts with the
long 3’UTR (BDNFlox
mice) do not have major impact on neuronal shape but rather a
deficit in the total dendritic length and impairment of the synaptic maturation and
connectivity. These evidences may be important to understand the role of the miRNAs
on depression´s recovery. Since was not observed a neuronal morphological change
acting on single miRNAs it may be possible that the BDNF translational regulation
requires multiple miRNAs and translation factors acting in a cooperative but specific
manner on the two populations of BDNF (BDNF 3’UTR short, BDNF 3’UTR long).
This differential regulation can be underlined by detailed control of the synaptic
maturation and activity in physiological and pathological conditions.
Keywords: Depression, Antidepressant drugs, miRNA, BDNF

iv
RESUMO
A depressão é uma desordem psiquiátrica que representa uma das maiores causas
de incapacidade em todo o Mundo, sendo que é caracterizada pelo enfraquecimento da
plasticidade neuronal, anormal rede neuronal e, somente em alguns casos, perda celular.
No entanto, o mecanismo pelo qual surgem estas alterações neuronais é ainda
desconhecido. Os antidepressivos, largamente usados no tratamento de depressão têm
como alvo os sistemas de transmissão de monoaminas, inibindo o reuptake destes
neurotransmissores restabelecendo a transmissão monoamínica. Apesar de ser
verificado um rápido aumento dos níveis de monoaminas com a administração de
antidepressivos, o seu efeito terapêutico apenas se torna visível após um longo período.
Estudos recentes demonstraram que os antidepressivos podem aumentar os níveis da
neurotrofina BDNF antes de ser verificado um aumento do BDNF mRNA, o que sugere
um efeito modulador mediado pelos antideprressivos na tradução de BDNF. Tais
resultados originaram a hipótese de trabalho que se assenta na possibilidade de uma
acção reguladora dos miRNAs na tradução do BDNF. Posto isto, teve-se como
objectivo a avaliação do efeito de miRNAs modulados previamente por medicamentos
antidepressivos na morfologia e sobrevivência neuronal, e igualmente na tradução de
BDNF.
Os nossos resultados sugerem que os mir-302b, mir-214 e mir-136 não levam a
alterações da morfologia e sobrevivência de neurónios do hipocampo com a sobre- ou
subregulação destes miRNAs. A quantificação dos níveis de expressão de BDNF após
modulação com os miRNAs mostrou-se de difícil execução; porém, tendo em conta que
um número significativo de miRNAs é validado ou previsto para interagir com o gene

v
de BDNF, principalmente na 3’ UTR, foi avaliado o significado funcional do 3’ UTR
nas células neuronais.
O truncamento da porção longa da 3’ UTR (long 3’ UTR) resultou numa
diminuição do comprimento dendrítico total a 6 e 12 DIV embora nenhuma alteração
tenha sido verificada no número de dendrites primárias e secundárias. Para além disso,
foi visível uma diminuição do número de espículas “mushroom” em regiões distais de
neurónios maduros e uma menor percentagem de colocalização entre PSD-95 e SynI a
6, 9 e 12 DIV.
Finalmente, os resultados obtidos mostram que a ausência de transcriptos BDNF
com o “long 3’UTR” não têm um pronunciado efeito na forma dos neurónios mas são
sim os responsáveis por um défice no comprimento dendrítico total, assim como na
maturação sináptica e conectividade. Estas evidências podem ser importantes para
entender o papel dos miRNAs na recuperação da depressão. Tendo em conta que não
foram observadas alterações morfológicas com um único miRNA pode ser possível que
a regulação da tradução de BDNF requira a acção de múltiplos miRNAs na regulação
dos dois tipos de transcriptos de BDNF (short 3’ UTR e long 3’ UTR). Esta regulação
diferencial pode ser analisada por um controlo detalhado da maturação sináptica e sua
actividade em condições fisiológicas e patológicas.
Palavras-chave: Depressão, Antidepressivos, miRNAs, BDNF

vi
TABLE OF CONTENTS
ACKNOWLEDGEMENTS i
ABSTRACT ii
RESUMO iv
TABLE OF CONTENTS vi
ABBREVIATIONS ix
LIST OF FIGURES xi
LIST OF TABLES xii
1. INTRODUTION 1
Principles of neuronal plasticity 1
Neurotrophic factors as marker of plasticity 2
Brain-derived Neurotrophic Factor 3
BDNF implication in brain function 9
Dendritic spines as vital component of synaptic activity 10
Depression: a worldwide disorder 12
Antidepressant drugs 15
Effects of antidepressant treatment on BDNF level 16
Dysregulation of microRNAs in depression 17
Biogenesis of miRNAs 18
The role of miRNAs in brain function 19
Impact of miRNAs in neuronal cells 21
BDNF regulation mediated by miRNAs 23
2. AIMS 24

vii
3. METHODS 26
3.1. Cellular Biology 26
Culture of hippocampal neurons 26
Neuronal transfection with plasmids 28
Neuronal transfection with synthetic oligonucleotides 28
PC12 cell line experiments 30
MTT assay viability 31
3.2. Molecular Biology 31
GFP plasmids preparation 31
Genotyping of BDNFlox mice 32
Immunocytochemistry for MAP2, SynI and PSD-95 33
Immunocytochemistry for miRNAs experiments 34
3.3. Imaging and Analysis 36
Fluorescence microscopy 36
Confocal microscopy 36
Cellular viability through Höechst staining 37
Neuronal morphological analysis 38
Polarization analysis 39
Spine morphological analysis 40
Co-localization of Syn-I and PSD-95 41
Bioinformatic analysis of miRNAs targets 42
Densitometric analysis 43
Data representation and statistic analysis 44
4. RESULTS 45
4.1. Role of miRNAs up- or downregulated by antidepressant drugs in neuronal
morphology, survival and BDNF translation 45
Optimization of neuronal transfection with synthetic oligonucleotides 46

viii
Evaluation of miRNA activity 50
Effect of miRNAs on neuronal morphology 54
Effect of miRNAs in cellular viability 56
Effect of miRNAs on BDNF translation 57
Bioinformatic analysis for miRNAs binding sites into BDNF gene 59
4.2. Role of 3’UTR long of BDNF mRNA in neurons 61
5. DISCUSSION 68
6. CONCLUSIONS 77
7. FUTURE PERSPECTIVES 78
8. REFERENCES 79

ix
ABBREVIATIONS
Ago argonaute protein
AMPA α-amino-3-hydroxy-5-methyl-4-isoxazole propionic acid
ANOVA Analysis of variance
BDNF Brain-derived Neurotrophin Factor
BSA Bovine serum albumin
cAMP Cyclic adenosine 3‟,5‟-monophosphate
CNS Central Nervous System
CPE Carboxypeptidase
CREB cAMP response element-binding protein
DIV Days in vitro
FGF Fibroblast Growth Factor
FMRP Fragile X mental retardation protein
HPA Hypothalamus-pituitary-adrenal axis
LTD Long-term depression
LTP Long-term Potentiation
miR MicroRNA
MMPs Metalloproteases
MAPK Mitogen-activated Protein Kinase
MAP2 Microtubule-associated protein 2
NGF Nerve Growth factor
NMDA N-methyl-D-aspartate
NRI Norepinephrine reuptake inhibitor
NTFs Neurotrophic Factors

x
NT3 Neurotrophin 3
NT4 Neurotrophin 4
PCR Polymerase chain reaction
PBS Phosphate buffered saline
PLC-γ Phospholipase C-γ
PI3K Phosphatidylinositol 3-Kinase
PSD Postsynaptic density
P75NTR p75 Neurotrophin Receptor
RNA Ribonucleic acid
RISC RNA-induced Silencing Complex
SNRI Serotonin norepinephrine reuptake inhibitors
SSRI Selective serotonin reuptake inhibitor
TNF Tumour Necrosis Factor
Trk Tropomyosin Receptor Kinase
UTR Untranslated Region

xi
LIST OF FIGURES
Fig.1: Synthesis and sorting of BDNF to either constitutive or regulated secretory pathway.
Fig.2: Scheme of rat BDNF gene structure and its transcripts.
Fig.3: Cre-site-specific DNA recombinase system used to generate BDNFlox mice.
Fig.4: Three-dimension illustration of different types of spines of a neuronal dendritic segment.
Fig.5: Ilustration of the synthesis mechanism of miRNAs.
Fig.6: Measurement of cellular viability via Höechst staining.
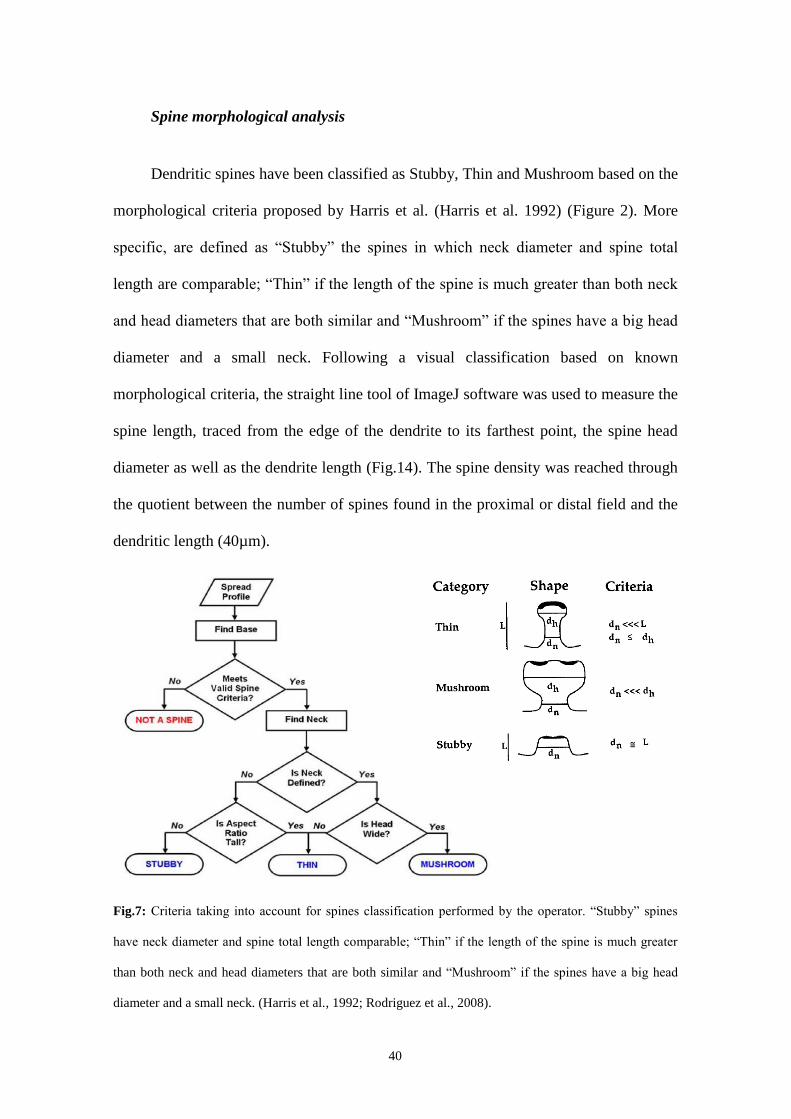
Fig.7: Criteria taking into account for spines classification performed by the operator.
Fig.8: Approach to measurement of spines.
Fig.9: Densitometric analysis to quantification of protein expression level.
Fig.10: Optimization of hippocampal neuronal transfection with BLOCK-iTTM
.
Fig.11: Protein expression quantification after transfection with miRNAs mimics and inhibitors.
Fig.12: Effects of miRNAs on BDNF expression
Fig.13: MTT assay performed to evaluate the effects of miRNAs on cellular viability.
Fig.14: Effect of miRNAs on BDNF expression levels.
Fig.15: miRNAs binding sites into the Human BDNF transcript variant 1.
Fig.16: Hippocampal neurons of BDNFlox mice have a lower dendritic length but a normal number of
branches.
Fig.17: Polarity of hippocampal neurons in vitro.
Fig.18: Spine maturation of hippocampal neurons from BDNFlox mice is impaired.
Fig.19: Colocalization of PSD-95 and Syn I.

xii
LIST OF TABLES
Table 1: Primary and secondary antibodies for immunocytochemistry for MAP2, SynI and PS95
Table 2: Primary and secondary antibodies for immunocytochemistry of miRNAs experiments
Table 3: Secondary antibodies for immunocytochemistry experiments
Table 4: Parameters defining proximal and distal fields of neurons
Table 5: MiRNAs compiled from microarray analysis from RNA of adult rats treated with different
antidepressant drugs.
Table 6: List of miRNAs and their validated gene targets provided by miRWalk Database.
Table 7: Number of miRNAs targeting a specific region of BDNF gene.

1
1. INTRODUTION
Principles of neuronal plasticity
Neuronal plasticity consists in the capacity of the Central Nervous System (CNS)
to adapt to a changing environment through structural and functional rearrangement of
neuronal connectivity. Neuronal plasticity is also a crucial element in injury recovery
and in learning and memory (Pearson-Fuhrhop et al., 2009). This mechanism undergoes
through generation of newborn neurons, degeneration of dispensable neurons and
reorganization of synaptic connections. At cellular level, plasticity is determined by
dendritic spines formation and their pruning and remodeling (Ethell et al., 2005),
calcium channel regulation, alterations in NMDA receptors or in AMPA trafficking
(Cull-Candy et al., 2004). Functionally, two well-known forms of plasticity are long-
term potentiation (LTP) and long-term depression (LTD), the long lasting strengthening
and weakening of synaptic connections between neurons.
Neuronal plasticity is initiated and maintained by synaptic activity, which in turn
is stimulated by excitatory neurotransmitters, which cause an action potential on
postsynaptic neurons and trigger transcription of genes involved in restructuring of
CNS. Defects in this process will impair adaptation of the CNS to new challenges
causing not only the disruption of homeostasis but increasing also the susceptibility of
neuronal circuits to environmental variations. In this way, a failure to adapt may lead to
structural and functional damages of specific brain regions, which in turn can cause
progressive neurodegeneration triggering diverse pathologies.

2
Neurotrophic factors as marker of plasticity
Neurotrophic factors are growth factors that participate in the processes that
guarantee neuronal survival. Neurons are dependent of these molecules for their
survival and to the establishment of neuronal network and neuronal plasticity, including
the modulation and remodeling of axonal and dendritic growth, membrane receptor
trafficking, neurotransmitter release and formation of synapses. The neurotrophin
family are constituted by four different proteins structurally related: nerve growth factor
(NGF) (Levi-Montalcini et al., 1966), brain-derived neurotrophic factor (BDNF) (Barde
et al., 1982), neurotrophin 3 (NT-3) and neurotrophin 4 (NT-4) (Hohn et al., 1990).
According to their affinity they can bind to two classes of membrane receptors: the
tropomyosin receptor kinase (trk) family (Barbacid et al., 1994) and the p75
neurotrophin receptor (p75NTR), a member of tumour necrosis factor (TNF) receptor
superfamily (Rodriguez-Tébar et al., 1990).
Neurotrophins are synthesized as precursor protein (pro-neurotrophins) that can
be processed intracellularly, originating the mature and biologically active form of this
protein, or instead be released as a pro-neurotrophin through regulated pattern (Mowla
et al., 1999), modulating the development and maturation of neuronal circuits.
Neurotrophins bind to trk receptors leading to their dimerization and
autophosphorylation, allowing the alteration of their conformation to an activated state
(Ullrich et al., 1990). Subsequently, trk receptors phosphorylate intracellular molecules
activating signaling cascades. The effects mediated by mature neurotrophins are due to
activation of high affinity full-length trk receptor, which activates pathways specifically
involved in neuronal survival and growth. The four neurotrophins have diverse affinity
to these receptors: NGF binds to trkA receptor, BDNF and NT-4 to trkB and NT-3

3
binds mostly to trkC but under some circumstances it may also bind to trkA or trkB
(Barbacid et al., 1994; Cohen-Cory et al., 2010). In the other hand, pro-neurotrophins
have high affinity to another type of receptors, the p75NTR receptor, which has low
affinity to mature form of neurotrophin but high affinity for pro-neurotrophin, activating
intracellular signaling pathways involved in cellular death (Lee et al., 2001; Dechant et
al., 2002). Thus, mature and precursor form of neurotrophins and their binding to
different receptors leads to divergent effects.
Brain-derived Neurotrophic Factor
BDNF is the best well characterized neurotrophin and is currently seen as a factor
with multiple and crucial functions. This neurotrophin was initially discovered through
its ability to promote and support the survival of chick sensory neurons during
development, being similar to fibroblast growth factor (FGF) (Barde et al., 1982).
BDNF plays a key role in neuronal survival and maturation during development and
neuronal plasticity in adulthood.
BDNF has specific mechanisms of transcription, translation and posttranslational
modifications. BDNF gene has a complex and a well-conserved organization among
mammals (Maisonpierre et al., 1991; Tettamanti et a., 2010), suggesting that regulation
of its expression has a strong functional significance. Like the other neurotrophins,
BDNF is synthesized as propeptide that may follow two different secretory pathways to
either the regulated (i.e. release in response to stimuli) or constitutive pathway (i.e.
spontaneous release). BDNF shows in majority of neurons a distal dendritic targeting of
secretory granules through regulated pathway whereas constitutive pathway occurs
mainly in the soma (Brigadski et al., 2005). Pro-BDNF is formed in the soma and can

4
be cleaved in the endoplasmic reticulum (Mowla et al., 2001) giving rise the mature
neurotrophin or remaine in the unprocessed form. Pro-BDNF can be processed
intracellularly by furin and proconvertases generating mature BDNF; otherwise, it can
be cleaved extracellularly by metalloproteases (MMPs) such as plasmin (Lee et al.,
2001; Teng et al., 2005). The targeting of BDNF for regulated or constitutive pathways
is determined in Golgi complex through its binding to intracellular sortilin which
promotes a correct folding of the mature domain (Teng et al., 2005; Lu et al., 2005).
Subsequently, there is an interaction between sorting motif within mature domain and
carboxypeptidase (CPE), which targets mature BDNF to regulated pathway (Lou et al.,
2005). Mature BDNF can be packaged into synaptic vesicles present both in axon
terminals (presynaptic site) and dendrites (postsynaptic site) of glutamatergic neurons
and be released in activity-dependent manner through an influx of calcium (Wu et al.,
2004; Matsuda et al., 2009).

5
Fig.1: Synthesis and sorting of BDNF to either constitutive or regulated secretory pathway. Pro-BDNF is
synthesized in the endoplasmic reticulum (ER) and interacts with sortilin in the Golgi complex what
promotes the folding of the mature domain. Subsequently, mature domain can bind to carboxypeptidase E
(CPE) sorting mBDNF to secretory vesicles of the regulated pathway, which transport BDNF to
dendrites, or axon to its release; if this interaction doesn´t happens BDNF is sorted to constitutive
pathway. Instead of mature BDNF even proBDNF can be released by neurons if the proneurotrophin isn´t
cleaved by furin or protein convertases (as protein convertase 1- PC1). In these cases, proBDNF can be
cleaved extracellularly by metalloproteinases (MMP) and plasmin (Bai Lu; 2005).
As mature and precursor BDNF activate trkB receptor or p75NTR, respectively,
different effects can be achieved. Stimulation of the trkB receptor stimulation activates
patterns involved in cell survival (such as mitogen-activated protein kinase (MAPK),
phosphatidylinositol 3-kinase (PI3K) and phospholipase C-ƴ (PLC- ƴ) pathways) while
p75NTR stimulation leads to apoptosis (activating caspase cascades, jun kinase and also
p53 pathways) (Fišar et al., 2010).

6
The BDNF gene consists in multiple alternative 5´untranslated exons in different
number according to the species (ten in humans, eight in rodents and six or even less in
other vertebrates) each of them under individual promoter regions, and a single exon
coding for the entire BDNF pre-protein amino acid sequence. The transcription of
BDNF exons are achieved by individual promoters differentially regulated taking into
account the developmental stage, target tissue and neuronal activity (Aid et al., 2007).
The regulation of promoters by a wide range of stimuli and their activation by neuronal
activity and DNA methylation enables the expression and target of their transcripts to
different brain regions, different cell types and even different regions at the same cell
(soma vs. dendrites) ensuring the precise spatial and temporal BDNF expression
(Timmusk et al., 1993; Tongiorgi et al., 2006). Besides transcriptional regulation also
BDNF translation through regulatory elements serve as another control mechanism to
avoid translation of BDNF when is not needed (Croll et al., 1999; Cunha et al., 2009).
In addition to the possible BDNF isoforms obtained by transcription of different
5’UTR exons through differential activity of promoters, additional complexity is
provided due to the presence of alternative sites of polyadenilation in 3’UTR which give
rise to two populations of BDNF transcripts: with a short 3´untranslated region (UTR)
or with a long 3´untranslated region (Fig.2) (Timmusk et al., 1993).

7
Fig.2: Scheme of rat BDNF gene structure and its transcripts. The eight non-coding exons of rat are
spliced with the 3’ exon-coding for BDNF protein (exon IX), originating different BDNF isoforms.
Moreover, transcription can be initiated befor exon IX what leads to the IXA transcripts. In addition,
transcripts can be polyadenilated at two polyadenilation sites (represented as arrows), what creates three
transcripts variants for the exon II (IIA, IIB and IIC). Lines represent introns, boxes the exons and
protein-coding exons are represented as solid boxes. (Aid et al., 2007).
The existence of these two pools of transcripts gave rise to the debate of their
functional meaning in neuronal population. To study the role of these two types of
transcripts were generated a specific mice strain, truncated for long 3’UTR, namely
BDNFlox mice (Gorski et al., 2003). This mouse is created using a cre-site-specific
DNA recombinase system in which lox sites are inserted into exon 5 (the protein-coding
exon) of BDNF, upstream of lox sites a trimerized polyadenilation signal (Simian Virus
40 (SV40)) and downstream an Escherichia coli lac Z gene. Following the lac Z gene
there is an Flp recombinase target (FRT)-flanked phosphoglycerate kinase (PGK)

8
neomycin cassette. The Cre-mediated recombinase deletes the polyadenilation signals
abolishing the long portion of the 3’UTR of BDNF (Gorski et al, 2003).
Fig.3: Cre-site-specific DNA recombinase system used to generate BDNFlox mice. Exon V, the BDNF
coding exon, is shown schematically at the top of the figure in which the open bar identifies the 5’UTR;
the shaded bar the pro domain of the BDNF; the filled bar the mature hormone region, flanked by lox
sites (the filled triangles), and followed by lacZ, a SV40 intron-polyA (open bar) and a FRT-flanked PGK
neomycin cassete. Location of the splice acceptor (SA) is denoted by an arrow. After Cre-mediated
recombination BDNF-coding sequences in exon V are excised and lacZ is brought downstream of the
splice acceptor site and under control of BDNF promoters (Gorski et al, 2003).
So far, had been suggested that transcripts with short 3’UTR are restricted to the
soma while transcripts with long 3’UTR can be present in the soma or targeted to
dendrites (An et al., 2008). However, two another studies showed that the two
populations of transcripts are capable of being targeted to dendrites but in a differents
extent (Yoneda et al., 2010; Baj et al., 2011) since long 3’UTR BDNF transcripts can
reach more distal dendritic fields in comparison with short 3’UTR BDNF transcripts.
9
The knowledge of subcellular localization is important to understand the contribution of
each type of transcript to local changes in neuronal structure and function.
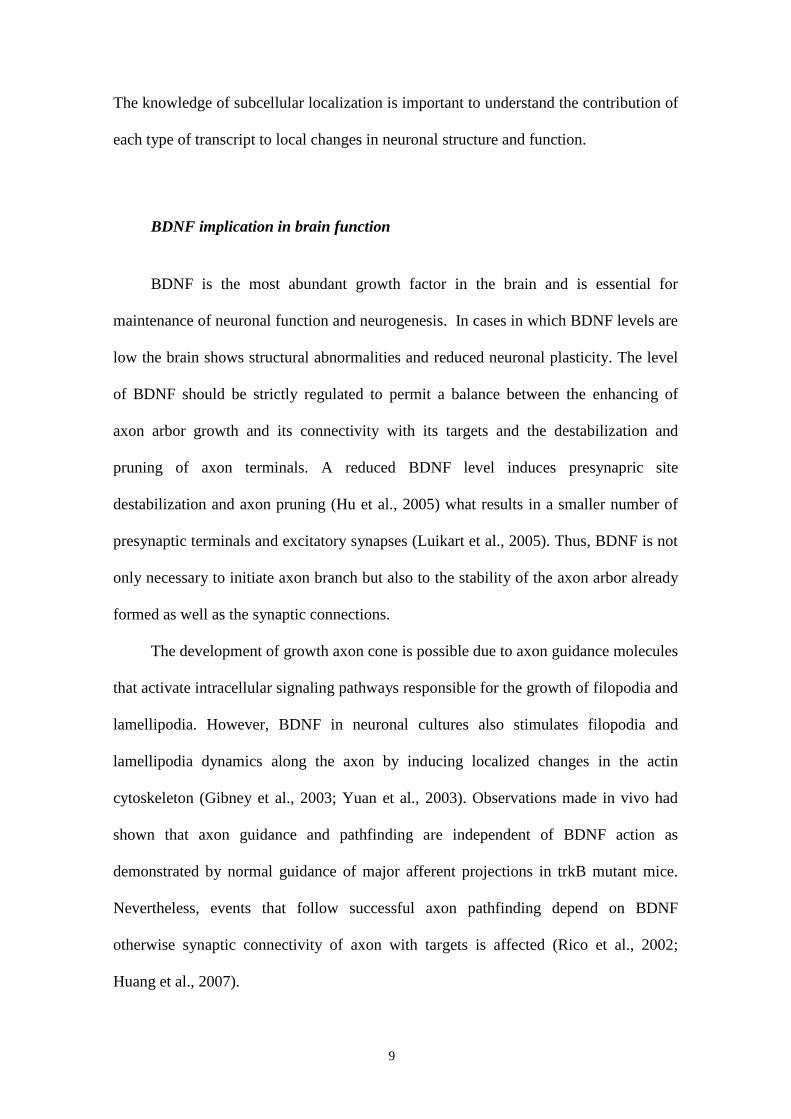
BDNF implication in brain function
BDNF is the most abundant growth factor in the brain and is essential for
maintenance of neuronal function and neurogenesis. In cases in which BDNF levels are
low the brain shows structural abnormalities and reduced neuronal plasticity. The level
of BDNF should be strictly regulated to permit a balance between the enhancing of
axon arbor growth and its connectivity with its targets and the destabilization and
pruning of axon terminals. A reduced BDNF level induces presynapric site
destabilization and axon pruning (Hu et al., 2005) what results in a smaller number of
presynaptic terminals and excitatory synapses (Luikart et al., 2005). Thus, BDNF is not
only necessary to initiate axon branch but also to the stability of the axon arbor already
formed as well as the synaptic connections.
The development of growth axon cone is possible due to axon guidance molecules
that activate intracellular signaling pathways responsible for the growth of filopodia and
lamellipodia. However, BDNF in neuronal cultures also stimulates filopodia and
lamellipodia dynamics along the axon by inducing localized changes in the actin
cytoskeleton (Gibney et al., 2003; Yuan et al., 2003). Observations made in vivo had
shown that axon guidance and pathfinding are independent of BDNF action as
demonstrated by normal guidance of major afferent projections in trkB mutant mice.
Nevertheless, events that follow successful axon pathfinding depend on BDNF
otherwise synaptic connectivity of axon with targets is affected (Rico et al., 2002;
Huang et al., 2007).

10
In addition, BDNF has a crucial role in the modulation of the number of synaptic
vesicles docked in the active zone of presynaptic terminals, which is probably
proportional to neurotransmitter release. The amount of docked vesicles can be altered
upon disturbance of BDNF signaling (Shen et al., 2006). Indeed, deficits in trk signaling
results in the decrease of the expression of synaptic proteins involved in synaptic vesicle
docking and fusion, decreasing the number of docked vesicles at active zones and,
consequently, downregulating neurotransmitter release (Lin et al., 2000). On the
contrary, exposure to BDNF increases the number of synaptic vesicles docked at active
zone in excitatory synapses in hippocampal neuronal cultures (Tyler et al., 2001).
Nevertheless, BDNF also acts under inhibitory synapses inducing glutamic acid
decarboxylase (GAD) expression, explaining the reason why alterations in trk signaling
and reduced levels of BDNF leads to a decrease in the number of GABAergic boutons
and synaptic specialization (Rico et al., 2002; Kohara et al., 2007). Thereby, BDNF has
a crucial role in balancing the number of excitatory and inhibitory synapses in adult
brain.
Dendritic spines as vital component of synaptic activity
Most of synaptic activity takes place in dendritic spines, a dendritic protusion that
contains a scaffold rich in elements of the biochemical signaling machinery. These
structures mediate the excitatory neurotransmission in the brain and are present as
thousands on pyramidal cells.
Spines are dynamic structures that can present a wide range of sizes and shapes
during their lifetime. Generally, spines are morphological characterized as structures
with a bulbous head connected to dendritic shaft by a narrow neck (Sorra and Harris,

11
2000). The spine head contains the postsynaptic density, constituted by ion channels
and cell surface receptors in scaffold with cytoplasmic scaffolding and signaling
proteins (Li and Sheng, 2003), which permit the link between the postsynaptic density
to actin filaments, the main cytoskeleton component of dendritic spines (Dent et al.,
2011). Dendritic spines are mostly represented by three types of spines: “mushroom-
like” spines which have a big round head and a tiny spine neck that makes the
connection between the spine and dendrite; “stubby” spines which are short and without
a defined spine neck and “thin” spines which length is bigger than the neck which in
turn is similar to spine head (Jen claude Béique 2012). The spine development and
maturation is regulated in a synapse-specific manner (Jen claude Béique 2012).
Development of dendritic spines will promote the morphological and biochemical
changes in a manner that allows the passage from stubby to thin spines and finally
mushroom spines, the most mature spine type (Grutzender et al., 2002). Spine formation
is regulated by different components. One of them is BDNF which contributes to spine
formation, promoting the reshuffle of early filopodia-mediated contacts (Matsutani et
al., 2004). The promotion of spine maturation can be evaluated through the amount of
postsynaptic specializations, which is higher or lower depending of the increase or
decrease of BDNF levels (Sanchez et al., 2006).

12
Fig.4: Three-dimension illustration of different types of spines of a neuronal dendritic segment.
Mushroom spines have a big spine head and a small neck; “stubby” spines are characterized by short and
without a defined spine neck; “thin” spines are long spines with a small head and branched spines are like
two thin spines (Harris et al., 2008).
Depression: a worldwide disorder
Depression is a common mood disorder affecting 121 million people worldwide
(Mouillet-Richard et al., 2012) among children, adolescents, adults and elderly and
according to World Health Organization it is predicted to be between of the top three of

13
causes of disability by 2030. The symptoms of this stress-related disorder manifest as
changes in cognitive functions, learning, memory and emotions (Lipsky et al, 2002)
which seem to be caused by neuronal plasticity impairment, abnormal neuronal network
and in some cases atrophy or even cell loss produced by stress events, characteristics of
low adaptation capacity of CNS to the environment (Fišar et al., 2009; Drzyzga et al.,
2009).
An interesting point that drew attention of many researchers was the higher
predisposition of certain individuals to develop depression which could indicate that, at
least in part, depression is genetically-determined (Levinson 2005). Stressful events,
defined as alterations of the homeostasis, are in fact a risk factor for depression. Despite
genetically-determined susceptibility-threshold specific for each individual to variations
in brain environment it is also accepted that stress events occurred in critical period of
brain development can increase the vulnerability to stress and favour the onset of
anxiety disorders (Muiños-Gimeno et al., 2011). However, it is important to notice that
depending on the type of stress event and the affected brain regions the consequences in
the brain function can be completely different. A soft stress in the hippocampus
increases learning and memory processes (Luine et al., 1996) whereas severe stress has
the opposite effects, impairing Long-Term Potentiation (LTP) (Kim and Diamond,
2002). Moreover, different brain areas have diverse pathways to respond to stimuli
explaining why continuous stress in the hippocampus and prefrontal cortex leads to
neuronal atrophy while in amygdale it causes neuronal hypertrophy (Sapolsky, 2003).
Nevertheless, independently of stress rate and its effect in neuronal network, seems to
be a common characteristic the long lasting effects on vulnerable individuals (Roth et
al., 2009).

14
Moreover, depressive patients present a reduction of the hippocampus volume in
about 4-5% when compared with healthy individuals, which is correlated with disease
duration and consequent dysfunction (Sheline et al., 2003).
Activation of different patterns by stressors can explain the duration of the effects
mentioned above. One of the possible mechanisms consists in the dysfunction of the
hypothalamus-pituitary-adrenal (HPA) axis. Disturbance of this axis and alteration of
glucocorticoids receptors expression and signaling leads to the lack on the recognition
of glucocorticoids levels, which decrease the negative feedback and consequently
increase the level of glucocorticoids in circulation and the response to stressors,
explaining the long-lasting effects of stress events (Min et al., 2012). Other possible
mechanism is related to the impairment of neuronal plasticity and lower monoamine
neurotransmission (Massart et al., 2012). Different studies performed with depressed
patients’ brains show brain structural alterations, decrease on the expression of neuronal
markers as well as alterations in neurotrophins expression (Fišar et al., 2009). In this
point, neurotrophic factors (NTFs) can play an important role and be a connection
between stress and psychiatric disorders.
The summary of results obtained until now allowed the stipulation of two
different but potentially complementary hypotheses that can be implicated in the origin
of this depression. The first one, the monoamine hypothesis, poses that depression is a
result of the deficit in serotonin and noradrenaline neurotransmission while the
neurotrophic hypothesis suggests that depression is caused by the diminished levels of
neurotrophins, more specifically, BDNF.
BDNF has been seen as a component that takes part in disease pathologies or
treatment of many psychiatric diseases. The mechanism whereby psychiatric disorders

15
occur is not fully understood so far, however BDNF seems to be involved in the
pathophysiology and therapeutic mechanisms of depression (Fuchikami et al 2010).
Antidepressant drugs
Antidepressant drugs have been used for the past 50 years but the exact
mechanism of their action is not fully understood. These drugs include the selective
serotonin reuptake inhibitors (SSRIs) (Cramer et al, 2009), norepinephrine reuptake
inhibitors (NRIs) or inhibitors of both as serotonin norepinephrine reuptake inhibitors
(SNRIs) (Kellermann et al., 2012) which target monoamine neurotransmitters systems
in order to increase signaling at the synapses. Their therapeutic effect passes through the
increase of monoamine neurotransmitter to restore the compromised neurotransmission
in noradrenergic and serotorinergic system. However, their effects are only visible when
administrated for long periods, taking about 6-8 weeks to produce therapeutic effects,
despite of the increased synaptic monoamine level hours after antidepressant treatment,
demonstrating that the recovery of this synaptic transmission cannot be the only
outcome produced by antidepressants to explain the extent of their clinical effects (Yu
et al., 2011). The delayed efficacy of antidepressants could be due to a requirement of
neuroadaptative mechanisms that may increase neuronal plasticity. Chronic
antidepressant administration of both 5-HT and norepinephrine selective inhibitors
increases cAMP-CREB signaling that will increase BDNF expression (Duman and
Monteggia et al., 2006; Nibuya et al., 1996), restoring its normal level and neuronal
plasticity. Furthermore, the stimulus caused by the antidepressants can also have an
impact in dendritic growth and arbor complexity (Magill et al., 2010).

16
Thus, antidepressants can stimulate through the mosulation of neurotrophic
factors the development of neuronal morphology and synaptic plasticity that is
important for the behavioral effects of the treatment.
Effects of antidepressant treatment on BDNF level
Antidepressants are capable of modulate BDNF expression provoking its increase
in situations in which its expression is abnormally low, restoring defective signaling
systems, enhancing the neuronal plasticity, supporting synaptic connectivity and
replacing neuronal cytoarchitecture (Calabrese et al., 2009, Castren et al., 2007, Russo-
Neudstadt and Chen, 2005). These drugs increase mature BDNF form level in synaptic
compartments and restore trkB signaling (Calabrese et al., 2007), suggesting that BDNF
can be a huge effector of their mechanism. This increase in mBDNF levels could be due
to an increase of local translation of BDNF transcripts or to the trafficking of BDNF
protein from other compartments (Molteni et al., 2009; Tongiorgi et al., 2008).
The consequences on BDNF expression will depend on the time of exposure to
antidepressant treatment. Chronic treatments increase BDNF expression (Xu et al.,
2004; Tsankova et al., 2006) while acute treatment have no effect or can even reduce
total BDNF mRNA (Drzyzga et al., 2009). Moreover, different classes of
antidepressants act differentially on BDNF transcription recruiting different BDNF
promoters and even reverting epigenetic modifications caused by stress events (Yu et
al., 2011).
For antidepressants-mediated behavioral effects TrkB signaling is essential
(Saarelainen et al., 2003). Antidepressants can cause a higher phosphorylation of trkB
receptor increasing its signaling and at the same time increasing the phosphorylation of

17
CREB (Castren et al., 2009), a mediator of BDNF gene transcription that will result in
the increase of BDNF expression and trkB activation. Therefore, neuronal plasticity and
cellular functions are restored.
It is thought that one of the main mechanisms through which BDNF contributes to
antidepressant effect is its ability to promote translation of BDNF.
Dysregulation of microRNAs in depression
The recent discovery that BDNF can exert its control on protein translation
through regulation of miRNAs has opened completely new perspectives for the role of
neurotrophic factors and miRNAs.
Gene transcription and translation is highly regulated by different mechanisms
being one of them the regulation mediated by miRNAs (miRs). MiRNAs are a class of
small non-coding RNAs with a length of about 22 nucleotides that participate in
fundamental intracellular mechanism involved in gene expression regulation (Yiing et
al., 2006). More than 400 miRNAs have already been identified in human and
chimpanzee brains (Bushati et al., 2008) but is estimated that more than 1000 miRNAs
could be expressed in human brain. Despite of many miRNAs being conserved between
species, some miRNAs seem to be specific to human, suggesting a recent origin
(Bushati 2008). In the genome, miRs can be located in introns of protein-coding and
non-coding genes, exons of non-coding genes or in intragenic regions (Kim et al.,
2005).
Alterations in miRNAs system have been associated to generation of several
diseases such Alzheimer (Satoh et al., 2010), Parkinson (Mena et al., 2010),
18
schizophrenia (Lai et al., 2011) and depression (Saus et al., 2010) indicating that
miRNAs play a critical role in the enhanced susceptibility for many disorders.
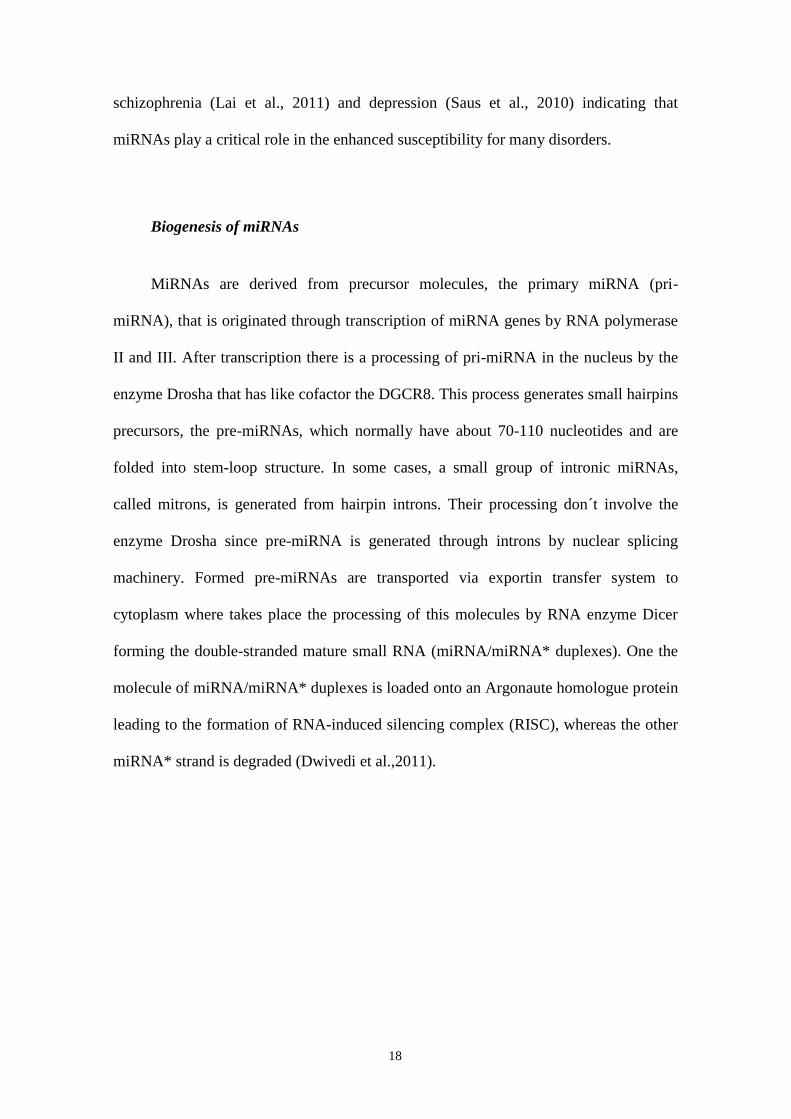
Biogenesis of miRNAs
MiRNAs are derived from precursor molecules, the primary miRNA (pri-
miRNA), that is originated through transcription of miRNA genes by RNA polymerase
II and III. After transcription there is a processing of pri-miRNA in the nucleus by the
enzyme Drosha that has like cofactor the DGCR8. This process generates small hairpins
precursors, the pre-miRNAs, which normally have about 70-110 nucleotides and are
folded into stem-loop structure. In some cases, a small group of intronic miRNAs,
called mitrons, is generated from hairpin introns. Their processing don´t involve the
enzyme Drosha since pre-miRNA is generated through introns by nuclear splicing
machinery. Formed pre-miRNAs are transported via exportin transfer system to
cytoplasm where takes place the processing of this molecules by RNA enzyme Dicer
forming the double-stranded mature small RNA (miRNA/miRNA* duplexes). One the
molecule of miRNA/miRNA* duplexes is loaded onto an Argonaute homologue protein
leading to the formation of RNA-induced silencing complex (RISC), whereas the other
miRNA* strand is degraded (Dwivedi et al.,2011).

19
Fig.5: Ilustration of the synthesis mechanism of miRNAs. miRNA genes are transcribed by RNA
polymerase II and III originating pri-miRNAs molecules that is processed in the nucleus through the
enzyme Drosha, generating the pre-miRNAs. Occasionally, intronic miRNAs (mitrons) can be generated
from hairpin introns. Pre-miRNAs are transported to cytoplasm via exportin where are processed by RNA
enzyme Dicer forming the double-stranded mature small RNA that posteriorly forms the RISC complex
(Faller et al., 2008).
The role of miRNAs in brain function
MiRNAs have the capacity of binding to a target site, generally within 3’
untranslated region (3’UTR) of an mRNA via base-pairing interactions, inducing their
degradation or inhibition of translation (Mellios et al., 2008). The inhibitory action of
miRNAs doesn´t requires a perfect complementary between miRNA-mRNA (Le et al.,
2009); what determines miRNA target specificity seems to be the “seed sequence” of
the miRNA that is constituted by 6-7 nucleotides (Bushati et al., 2008). Nevertheless,

20
miRNA-mediated regulation is not only due to translation inhibition but may in some
circumstances act as activators of translation (Krol et al, 2010) or even impair
transcription through their binding to gene promoters (Younger and Corey, 2011).
MiRNAs act as a control of protein synthesis and are considered as mediators of
mRNA turnover and even as a mechanism by which can be determined the amount of
expressed protein (Calissano et al., 2010). These molecules can effectively regulate the
amount and timing of the protein expressed and determines the localization of protein
synthesis. This feature is extremely important to the correct function of the neuronal
network taking into account that mRNAs are synthesized in the nucleus while gene
products are often required at the distal ends of dendrites and axons, far away from the
local of synthesis (Abdelmohsen et al., 2010). The translation of mRNAs stays inhibited
until neurons stimulation. The regulation of local translation of mRNAs seems to have a
crucial role in synaptic development and plasticity (Schratt et al., 2006).
In higher eukaryotes, miRNAs are involved in diverse mechanism of cellular and
organ physiology such as development, differentiation and diseases (Calissano et al.,
2010), being important genomic regulators. Their expression is temporally and/or
spatially-dependent during development (Bushati et al., 2008) becoming vital for
development of nervous system and brain morphology and more specific in neuronal
differentiation, integrity and plasticity (such as mir-124a and mir-133b), formation of
synapses in postmitotic neurons (mir-134 and mir-9a) and also circadian rythms (mir-
132 and mir-219) (Bushati et al., 2008; Abdelmohsen et al., 2010; Mellios et al., 2008).
Indeed, during development the differential expression and activity of miRNAs
influence the differentiation of different cells in the organism.
Although the ablations of certain miRNAs doesn´t cause, necessarily, the total
loss of proper development, it can however lead to significant abnormalities (Andersson

21
et al., 2010; Abdelmohsen et al., 2010). In fact, the level of expression of miRNAs, their
tissue distribution and the developmental stage in which they are expressed influence
severally the expression of the target gene products (Abdelmohsen et al., 2010). Defects
on miRNA system result in a decrease of dendritic complexity, altered spine
morphology and cognitive defects showing that miRNAs are essential for normal brain
development and establishment of functional brain connectivity (Magill et al., 2010).
The consequence of the interaction miRNA-mRNA is determined by a member of
the argonaute (Ago) protein family, a catalytic component of the RISC complex.
Depending of the type of argonaute protein and the degree of complementary between
miRNA and its target sequence, the targeted mRNA may be endonucleolytical cleaved
and degraded or translational repressed. The repression of the translation might be done
by deccaping and subsequent exonucleotic degradation (Bushati et al., 2008). One
single miRNA can target hundreds of mRNAs regulating the expression of several
transcripts. Therefore, if one miRNA is present at abnormal levels the expression of
several genes could be severely disturbed (Bushati et al., 2008). This disruption is
correlated to many diseases since regulation of gene expression is an important aspect
influencing neuronal plasticity. Moreover, the expression of miRNAs is a critical point
for the survival of specific types of mature neurons being neuroprotector, preventing or
slowing the neuronal loss (Bushati et al., 2008).
Impact of miRNAs in neuronal cells
External signals have a significant impact in morphology and function of neurons.
Such impact can be mediated by posttranscriptional modifications, a vital mechanism
that controls locally the plasticity of dendrites, axons and synapses. It is likely that some

22
miRNAs can bind to mRNAs coding for neuron-specific proteins, regulating
mechanisms as synaptic plasticity, neurogenesis, neurite outgrowth and stress responses
(Abdelmohsen et al., 2010, Dwivedi et al., 2011). Interestingly, turnover of miRNA
seems to be faster in comparison with other cells what can be a sign of the rapid
adaptation to neuronal activity mediated by miRNAs (Krol et al., 2010)
MiRNAs play an important role in synaptic plasticity regulation. They are
expressed within dendrites regulating the expression of a variety of synaptic mRNAs
that mediate dendritic growth and keep mRNAs in a dormant state while are transported
within dendrites to synaptic sites. In the absence of an external stimulus, miRNAs
inhibit the expression of synaptic proteins controlling the spine development. When trk
receptor is activated through BDNF the signaling pathway can inactivate the miRNAs
leading to an enhanced expression of synaptic proteins and, consequently, spine growth
(Schratt et al., 2006).
The way by which miRNAS are dendritically localized is not yet understood. A
possible explanation is that miRNAs in its mature form can arrive in dendrites by
passive diffusion or can be even possible that pre-miRs are not completely processed in
cell body but rather appear to be transported to dendrites where are targeted into
dendritic spines through an interaction with postsynaptic proteins. At this point, DICER
and RISC components are responsible for processing pre-miRs originating mature
miRNAs in an activity-dependent manner. MiRNAs are then responsible for local
regulation of protein translation (Smalheiser et al., 2009).
Studies in animal models of depression and in human postmortem brain provided
evidences for the role of miRNAs in psychiatric disorders since their expression appear
altered in depressive and bipolar patients. Instead, psychoactive drugs are capable of

23
revert the miRNAs expression to normal levels even in brain and blood suggesting that
their action could be mediated by miRNAs.
BDNF regulation mediated by miRNAs
Pyramidal neurons, the primary source of BDNF in cerebral cortex, show a high
expression of DICER, a needful enzyme for miRNA biogenesis, as well as RISC
components. As BDNF exhibits multiple target sites for miRNAs, especially in 3´UTR,
they can target this neurotrophin reducing its expression (Mellios et al., 2008). This
feature points to a potential role for miRNAs to differentially regulate BDNF expression
during development. As previously demonstrated overexpression of a specific miRNA
can target BDNF and nullify its capacity to stimulate neurite growth. MiRNAs can
interact at posttranscriptional level of BDNF and interfere with the control of neuronal
morphology and function (Abdelmohsen et al., 2010).
The expression regulation of BDNF in dendrites mediated by miRNAs may serve
as a mechanism to regulate BDNF function in space and time controlling the
maintenance of dendritic arbor structure or acting as modifying factor to the shape and
number of dendritic spines. For this reason is important to know exactly how and which
miRNAs act under BDNF to understand the mechanism of mood disorders and the
mechanism of action of antidepressant drugs achieving a better therapeutic for these
disorders.

24
2. AIMS
Depression is a mood disorder affecting a crescent number of people worldwide.
The study of its mechanisms is mandatorily for the therapy of this disorder, representing
a field of large interest. Recent studies found that different antidepressant drugs can
activate translation of BDNF protein before the actual rise in the expression of its
coding mRNA in hippocampus, suggesting that antidepressants may rapidly affect
posttranscriptional regulation of BDNF (Musazzi et al, 2009). This lack of
correspondence between BDNF mRNA and protein following antidepressant treatments
(Jacobsen and Mork, 2004) suggests that antidepressants may have a particularly fast
effect on posttranscriptional regulation of BDNF. These preliminary results suggest the
working hypothesis of a role for miRNAs regulation of BDNF in the action of
antidepressants. For these reasons, this study has the following objectives:
1) To evaluate the role of miRNAs up- or downregulated by antidepressant
drugs in neuronal morphology, cellular survival and BDNF translation:
Treatment of adult rats during 2 weeks with antidepressant drugs manufacture by
Servier (experiments performed by Prof. Maurizio Popoli’s lab at the University of
Milan) have resulted in the up- or down-regulation of a list of miRNAs. From these
miRNAs was chosen a group of miRNAs from which was assessed their role in
neuronal survival and development in vitro of primary cultures of rat hippocampal
neurons through a morphological assay. Moreover, another goal is the evaluation of
miRNAs effects on BDNF translation. In this way, we pretend to support the potential
role of miRNAs in the mechanism of action of the antidepressant drugs.

25
2) To evaluate the functional meaning of 3’UTR long of BDNF mRNA in the
developmental neuronal morphology:
As miRNAs target preferentially the 3’UTR of mRNAs it may be possible the
differential regulation of the two populations of BDNF transcripts, either with long or
short 3’UTR, by miRNAs. A previous study in our lab showed that the two populations
of transcripts are present in the soma and also capable of being targeted to dendrites but
in different extents, being possible to detect long 3’UTR BDNF transcripts in more
distal dendritic fields in comparison with 3’UTR short BDNF transcripts (Baj et al.,
2011). For this reason, it is expected that transcripts and consequently its proteins,
depending of the 3’UTR, play different roles in neurons. According to these
observations we had as an objective of this project the evaluation of the role of 3’UTR
long BDNF transcripts in neuronal and spine morphology through neuronal
hippocampal neurons from BDNFlox
mice, mice truncated for 3’UTR long of BDNF.

26
3. METHODS
3.1. Cellular Biology
Culture of hippocampal neurons
Cultures of hippocampal neurons were prepared from postnatal day 1-2 (P1-2) of
Wistar rat or BDNFlox mice pups. The preparation of the 24-multiwell plates (Sarstedt),
containing 12mm² coverslips (Sacco) especially for immunofluorescence experiments
were coated with poly-L-ornithine 100 μg/mL for 20 min, washed once with PBS
(phosphate buffer solution containing 137mM NaCl, 2.7mM KCl, 10mM Na2HPO4,
1.76mM KH2PO4, pH 7.4) and treated with 0,2% Matrigel ™ (BD Bioscience).
To extraction of hippocampi from Wistar rat hippocampi were dissected and kept
in 3mL of cold Hank’s balanced salts solution (NaHCO3 4.2 mM, Hank’s salt powder
0.952%, HEPES 12mM (4-(2-hydroxyethyl)-1-piperazineethane-sulphonic acid), D-
Glucose 33mM, kinurenic acid 100mM, penicillin 1 mg/mL (Euroclone), and
streptomycin 1 mg/mL (Euroclone); pH 7.4). The dissected tissue was then digested
with 500 μL of 0.25% trypsin in native MEM (Minimum Essential Medium + Earle’s
salts + GlutaMAX™; Euroclone), for 8 min at 37° C. Digestion was blocked with 5.5
mL of Dulbecco´s modified eagle´s medium (D-MEM- Euroclone) supplemented with
10% heat inactivated Fetal Bovine Serum (H.I. FBS, Gibco) and 1%
penicillin/streptomycin (Euroclone EC B3001D 100x) of penicillin-streptomycin
(Euroclone) and centrifuged at 900 rpm for 5 min at room temperature. The supernatant
was discarded and the pellet was resuspended in supplemented D-MEM. In order to
dissociate in single cells, the resuspended pellet was mechanically dissociated and

27
slowly filtered with a sterile 40 µm pore diameter strainer (Sarstedt), removing
impurities and cellular debris. Finally, cell resuspension was plated onto 24-well plates
at a cell density of 150-200.000 cells/well.
To extract hippocampi from BDNFlox mice, was used the procedure previously
described. The BDNFlox transgenic mice model was kindly provided from Kevin R.
Jones laboratory and knockout mice for the long 3’UTR (BDNFlox) were obtained by
crossing heterozygous mice. In this case the hippocampi coming from each mouse were
dissected and plated separately in order to isolate knockout, wild type and heterozygous
mice neurons. Both hippocampi of each animal were dissected and kept in 0.5mL of
cold (4ºC) Halk’s balanced salts solution and digested with 175 μL of 0.25% trypsin in
native MEM for 8 min at 37° C. Digestion was blocked with 2 mL of D-MEM
supplemented with 10% heat inactivated Fetal Bovine Serum (H.I. FBS, Gibco) and 1%
penicillin/streptomycin (Euroclone EC B3001D 100x) and the dissected tissue was then
centrifuged at 900 rpm for 5 min at room temperature. The pellet was resuspended with
supplemented D-MEM and filtered through a sterile 40µm pore diameter strainer
(Sarstedt). Finally, cell resuspension was plated onto 24-well plates achieving a cell
density of 90.000-130.000 cells/well.
Cells were maintained in vitro at 37 °C in a 5% CO2-humified incubator. Cell
number was assessed by a dye exclusion method using Trypan Blue (Fluka). After 1h of
incubation to permit a proper adhesion, medium was replaced by fresh Neurobasal™
Medium (Gibco) supplemented with 2% B-27 supplement (Invitrogen), 0.5% of 1mM
L-glutamine and 10% penicillin 100U/mL and Streptomycin 100U/mL allowing long
term growth and viability of postnatal hippocampal neurons and at the same time
avoiding glia proliferation. Non-neuronal cells on rat hippocampal cultures were further

28
prevented by adding 5.0µM cytosine b-D-arabinofuranoside (ARA-C) from the second
day in culture.
Neuronal transfection with plasmids
Neurons were transfected with GFP plasmids at 5, 8 and 10 DIV using
Lipofectamine™ 2000 (Invitrogen) and OptiMEM (Gibco). The transfection mix was
first prepared separately: one part containing 2µg of GFP and OptiMEM and the other
with 2µl of Lipofectamine and OptiMEM, in both cases performing a total volume of
50µl. Each component was gently mixed and incubated at room temperature for 5 min.
After that they were mixed and incubated for further 20min at RT and in the meanwhile
the culture medium was replaced for 500 μl new fresh supplemented Neurobasal
medium. Cells were incubated with the transfection mix (100µl for each coverslip) for 1
hour at 37° C in a 5% CO2-humified incubator. After 1h of incubation the medium was
once again replaced for new fresh supplemented Neurobasal and the cells were
incubated at 37°C until immunofluorescence experiments were performed.
After 24h (6 and 9 DIV) or 48h (12 DIV) of transfection with GFP, hippocampal
neurons were blocked. The culture medium was removed and was done a PBS wash,
followed by fixation with 4% paraformaldehyde (dissolved in PBS pH 7.2) for 20 min
and a final wash in PBS.
Neuronal transfection with synthetic oligonucleotides
To transfect neurons with BLOCK-iTTM Alexa Fluor® Red Fluorescent Control
(Invitrogen) the transfection was performed at 5 DIV using Lipofectamine™ 2000

29
(Invitrogen) and OptiMEM (Gibco). The transfection mix was first prepared separately:
one part containing the required concentration of Block-it and OptiMEM and the other
with 2µl of transfection reagent (either Lipofectamine™ 2000 or HiPerFect (Qiagen)),
2µg of GFP and OptiMEM, in both cases performing a total volume of 50µl. In other
hand, to transfect neurons with miRNAs mimics or inhibitors, both synthesized by
Qiagen, the transfection was performed at 9 DIV using Lipofectamine™ 2000
(Invitrogen) and OptiMEM (Gibco). The transfection mix was first prepared separately:
one part containing 50nM of miRNA mimics or 100nm of miRNA inhibitors and
OptiMEM and the other with 2µl of Lipofectamine, 2µg of GFP and OptiMEM, in both
cases performing a total volume of 50µl.
Each component was gently mixed and incubated at room temperature for 5 min.
After that they were mixed and incubated for further 20min at RT and in the meanwhile
the culture medium was replaced for 500 μl new fresh supplemented Neurobasal. Cells
were incubated with the transfection mix (100µl for each coverslip) for 1 hour at 37° C
in a 5% CO2-humified incubator. After 1h of incubation the medium was once again
replaced for new fresh supplemented Neurobasal and the cells were incubated at 37°C
until immunofluorescence experiments were performed.
After 24h of neurons transfection with Block-it hippocampal and 72h after
miRNAs mimics/inhibitors transfection neurons were blocked. The culture medium was
removed and was done a PBS wash, followed by fixation with 4% paraformaldehyde
(dissolved in PBS) for 20 min and a final wash in PBS.

30
PC12 cell line experiments
Rat PC12 pheochromocytoma cells (ATCC, Manassas, VA, USA) were seeded in
25cm2 flasks (Sarstedt) in Roswell Park Memorial Institute (RPMI) 1640 medium (Life
Technologies) supplemented with 10% of heat-inactivated horse serum (HS) and 5% of
fetal bovine serum (FBS). The culture was incubated at 37° C in a 5% CO2-humified
incubator and the medium was renovated every 2-3 days with fresh RPMI supplemented
medium. When confluence was achieved cells were passage 1:3.
For cell viability purpose, cells were replaced into a 15mL falcon and centrifuged
at 900 rpm for 5min at RT and the pellet was resuspended in low-serum RPMI medium
constituted by 5% of HS and 2% of FBS in order to promote cell attachment. Cells were
then seeded in 96-well plate previously covered with poly-L-ornithine 100 μg/mL for
20 min and 0,2% Matrigel ™ (BD Bioscience) in a cell density of 1x10⁶ cells/well
(Han et al., 2012). Cell number was assessed by a dye exclusion method using Trypan
Blue (Fluka). Transfection was performed 1 day after plating. The 96-well plate was
divided in two groups, one transfected at 72h and the other at 48h before doing MTT
cell viability experiments. Each group contains cells transfected with the miRNAs
mimics, miRNAs inhibitors, cells treated only with Lipofectamine ™ 2000 (Invitrogen)
and untreated cells, all conditions in quadruplicate. The transfection mix was first
prepared separately: one part containing 50nM of miRNA mimics or 100nm of miRNA
inhibitors and serum-free RPMI medium and the other with 0,4µl of Lipofectamine,
2µg of GFP and serum-free RPMI medium, in both cases performing a total volume of
20µl. Each component was gently mixed and incubated at room temperature for 5 min.
After that they were mixed and incubated for further 20min at RT. Cells were incubated

31
with the transfection mix (20µl for each coverslip) for 72 and 48 hours at 37° C in a 5%
CO2-humified incubator.
MTT assay viability
After incubation of PC12 with miRNAs mimics or inhibitors the cell viability was
measured by 3-(4,5-dimethylthiazol-2-yl)-2,5-diphenyl-2H-tetrazolium bromide (MTT)
assay. Briefly, MTT (Sigma) was dissolved in PBS 1X to make a 5mg/mL solution and
10 µl of this solution was added to each well of the 96-well flat bottom plate (Sarstedt)
and incubated at 37 ◦C in a 5% CO2-humified incubator for 4h. Finished the incubation
time with MTT the supernatant was carefully removed and the formed formazan
crystals were dissolved in 100 µl of isopropanol-0,1HCl solution. The plates were then
analyzed using a Microplate Reader at 560 nm and 600nm. Data was collected from two
independent experiments.
3.2. Molecular Biology
GFP plasmids preparation
In order to prepare GFP plasmids to further cellular transfection, was performed a
MiniPrep with pGFP-N1 plasmids (Clonetech). Firstly the bacterias were placed into an
Agar plus ampicilin petri-dish and were incubated at 37ºC O/N. On the day after, were
picked two of the existing ampicilin-resistent colonies placing them into 5mL of LB
medium and incubating O/N at 37°C with shaker 200 rpm. The LB medium was then

32
divided in two 50mL falcons that are subject to miniprep purification. For plasmid
purification were used the kit of Promega. Cells were centrifuged at 5000g for 10min at
RT, supernatant were discarded and the pellet resuspended in 3mL of cell resuspension
solution. Cell lysis solution was added and mixed gently being incubated for 3min. To
the lisate cells were added neutralization solution that was centrifuge at 15000g for
15min which originates a pellet of cellular debris that can be discarded. The
supernatant, with remaining debris, were cleaned through PureYieldTM Clearing
Columns and a vacuum manifold. PureYieldTM Binding Column was used in order to
promote the binding of DNA to its membrane. The membrane was washed several times
and DNA was eluted in 500µl of miliQ water.
Genotyping of BDNFlox
mice
The genotypes of BDNFlox mice were identified by PCR. For the extraction of
genomic DNA from tails each mouse tail was incubated with 300 μL of Extraction
Buffer (Tris-HCl 10mM pH 8.0, SDS 0.5%, EDTA 0.1M pH 8.0, RNAse 0.2%) at 37
°C for 1 hour, followed by incubation with 2 μL of Proteinase K (15 mg/mL) at 50 °C
O/N. On the second day was added 300 μl of Phenol-Chloroform:Isoamyl alcohol (pH
8.0) to each sample to remove the proteins from the nucleic acids, the samples were
homogenized in the shaker for 20 minutes. The samples were centrifuged at 12.000 rpm
for 10 minutes in order to separate the nucleic acids (upper phase) from the denaturated
proteins (interphase) and the lipids (lower phase). The aqueous phase, containing the
genomic DNA, was removed to another eppendorf, diluted with 2 volumes of Ethanol
100%, thoroughly mixed and stored at -80°C for 30 minutes to enable DNA
precipitation. Finally, all samples were centrifuged at 4°C for 10 minutes at 12.000 rpm

33
and the DNA pellet was resuspended in 100 μl of DNAse - free water. To confirm the
extraction of genomic DNA was ran in 10% agarose gel at 80V.
The genotypes were assessed by PCR with specific primers to amplify either the
long and short 3´UTR of BDNF (reverse primer 5’- ATT ACA AGC AGA TGG GCC
AC-3’; forward primer 5’- ACC TGG GTA GGA CAA GTT G-3’ (Eurofins MWG
Operon)). The PCR reactions were performed in a final volume of 20 μl containing
0,1μL Go Taq Polymerase (Promega Corporation), 4 μl 5X Green Go Taq Buffer , 0,4
μl dNTPs, 0,8μl MgCl2, 1 μl of each primer, 11,7 μl of DNAse - free water and 1 μl of
cDNA added as PCR template. The PCR conditions were set as follow: 5 minutes at
95°C; 30 cycles of 30 seconds at 95°C, 30 seconds at 58°C, and 30 seconds at 72°C; 10
min at 72°C. The PCR generates a 250bp product for short 3´UTR and 230bp products
for long 3´UTR BDNF observed in 15% agarose gel.
Immunocytochemistry for MAP2, SynI and PSD-95
Immunocytochemistry was done in the coverslips previously used for cultures of
hippocampal neurons at 6, 9 and 12 DIV. The cells were permeabilized with PBS-
Tryton 0,1% for 15 minutes at RT. After permeabilization the coverslips were incubated
with mix of primary antibody (table 1) containing either 10% of NGS and PBS-Tryton
0,1% to perform the total volume (70µl for each coverslip) for 1,5 hour at room
temperature. Cells were then washed several times in PBS in order to remove the
unbound antibody and were posteriorly incubated for 1h at RT with the secondary
antibody (table 3). After the incubation the coverslips were once again washed in PBS
and underwent to a final incubation with Höechst dye solution (0,001%) in order to
stain all cellular nuclei. Finally, the coverslips were washed with PBS and Milli-Q

34
water and mounted on a glass slide using anti-fade mountant containing Mowiol® 40-
88 (Sigma) to be further analyzed at the fluorescence microscope.
Table 1: Primary and secondary antibodies for immunocytochemistry for MAP2, SynI and PS95
Primary antibody Dilution Host Supplier
MAP2 1:200 Rabbit polyclonal Santa Cruz Biotechnology
PSD95 1:250 Mouse monoclonal Millipore
Syn I 1:200 Rabbit polyclonal Millipore
Immunocytochemistry for miRNAs experiments
Immunocytochemistry was done in the coverslips used for cultures of
hippocampal neuron previously transfected with miRNAs mimics and inhibitors at 12
DIV. The permeabilization and blocking of the cells was done with 10% NGS, 1% BSA
and 0,3M glycine- PBS-Tween 0,1% for 45 minutes at RT. After permeabilization was
done a sequential immunocytochemistry in which coverslips were immuno-stained with
the primary antibody for BDNF (Sigma) O/N at RT followed by the incubation with the
primary antibody for the miRNA targets (diluted in PBS-Tryton 0,1%) (Table 2) for 2
hours at RT (for FMRP, PTEN, MeCP2) or O/N at 4ºC (for LIMK1). Cells were then
washed several times in PBS in order to remove the unbound antibody and were
posteriorly incubated for 1h at RT with the secondary antibody (table 3). After the
incubation the coverslips were washed with PBS, and underwent to a final incubation
with Höechst dye solution (0,001%) in order to stain all cellular nuclei. Finally,
coverslips were washed with PBS and Milli-Q water and mounted on a glass slide using

35
anti-fade mountant containing Mowiol® 40-88 (Sigma) to be further analyzed at the
fluorescence microscope.
Table 2: Primary and secondary antibodies for immunocytochemistry of miRNAs experiments
miRNA Primary antibody
(αmiRNAs target) Dilution Host Supplier
mir-134 LIMK1 1,5µg/ml Rabbit polyclonal Abcam
mir-302b FMRP 1:400 Rabbit polyclonal Abcam
mir-214
PTEN 1:100 Rabbit polyclonal Abcam
mir-136
mir-132 MeCP2 1:150 Mouse monoclonal Genescript
Table 3: Secondary antibodies for immunocytochemistry experiments
Secondary antibody Dilution Fluorophores Supplier
Anti-Rabbit 1:200 Alexa 568 Invitrogen
Anti-Mouse 1:200 Alexa 568 Invitrogen
Anti-mouse 1:200 Alexa 647 Invitrogen

36
3.3. Imaging and Analysis
Fluorescence microscopy
Digital images of GFP-positive neurons either with MAP2 staining or
immunoreactive for miRNAs targets and at the same time with a nuclear Höechst
staining were acquired using a Nikon Eclipse E800 epifluorescence microscopy with a
20X objective and a Nikon DXM1200 camera, paired with ACT-1 software. The
Höechst staining was visualized with a 488nm fluororophe while MAP2 and miRNAs
targets were observed with 568nm fluorophore. The pictures were taken in blind.
Confocal microscopy
Images to spines measurements and densytometric analysis were acquired through
Nikon C1si confocal microscope, containing 457, 477, 488, 514 argon lasers lines and
561 or 640 nm diode laser. Light was delivered to the sample with an 80/20 reflector.
The system was operated with a pinhole size of Airy disk (30 nm) (for spines images
the pinhole was set 60 nm). Electronic zoom was kept at minimum values for
measurements to reduce potential bleaching. A 60X Oil Apo objective (with
corresponding NA of 1.4) was used to collect series of optical images at 0.15 μm (for
spine images) or 0.20 μm (for densitometry) z resolution step size with a corresponding
voxel size of 75x75x150 nm (X x Y x Z). Images were then processed for z-projection
by using ImageJ 1.45 (NIH, Bethesda, USA).
Spines images were collected as 40µm of both proximal and distal fields from the
neuronal apical dendrite, classification based in well defined parameters (table 4).

37
Table 4: Parameters defining proximal and distal fields of neurons
Proximal field Distal Field
Diameter (µm) ≥ 2 ≤ 2
Distance from the soma (µm) ≤ 60 ≥ 70
The set of parameters to acquire the confocal pictures for densytometric analysis
were maintained exactly the same between pictures from either hippocampal neurons
under miRNAs mimics and inhibitors action and control.
Cellular viability through Höechst staining
To determine cell density all 12mm2 glass coverslips (Sacco) used to neuronal
culture had been visually divided in four squared fields being collected one picture on
each one and one more in the periphery of the cross between two fields (Fig.6). With
this approach the count was done in a reproducible and reliable way. Using the
multipoint tool of Imagej was possible to count the number of glia cells and neurons
present in each field taking into account that neurons nuclei have a smaller dimension
and a stronger and brighter intensity on Höechst staining when compared with glia cells.
To determine the effect of the treatment with miRNAs mimics/inhibitors in cell
viability was done the average of the cell density of 3 independent experiments
comparing each treatment condition with control.

38
Fig.6: Approach to collect pictures from the coverslips used for cultures of hippocampal neurons in order
to measure cellular viability via Höechst staining. A picture of nuclei demonstrates the differences in the
size and immunoreactive intensity between neurons and glia cells.
Neuronal morphological analysis
The morphological analysis of hippocampal neurons was focused on four
different parameters: average of total dendritic length, number of primary dendrites,
number of secondary dendrites and number of branching points. To reach this aim, the
morphologic parameters of GFP-positive neurons were measured and quantified by
tracing all neuronal projections using ImageJ software (NIH, Bethesda, USA).
In our analysis was measured the length of every dendritic arbors in separately. A
dendritic arbor was consider as a protrusion emerging from the cell soma with all its
branches and, so, primary and secondary dendrites. The sum of the dendritic arbors
length gave us the total dendritic length of the measured neuron. The branching points
were counted using the Multi-point tool of Imagej. Filopodia protrusions (considered as
>5 microns-long) were excluded from the total branching point measurements.
In order to achieve a stronger statistic analysis were measured 44-65 neurons for each
genotype and time point in the case of BDNFlox mice experiments and about 30
neurons for each miRNA mimic/ inhibitor. The measurements were done in blind.

39
Polarization analysis
To define the degree of polarization of the neuronal culture we have used the
method previously described by Horton and Ehlers (Horton and Ehlers, 2006). Briefly,
was evaluated the contribution of the length of the individual dendrites (Lm) of each
neuron, considered as the primary dendrite with all its branches, for the total dendritic
length. In this way, was done the average of the length of the individual dendrites
(Lsym) and posteriorly was performed the calculations in the following manner:
Lm / Lsym = Length of dendrite / Total dendritic length
If dendrites were symmetric, the value of the proportion above would be equal:
Lm =Lsym =1/number of dendrites (Lm/Lsym = 1).
If dendrites were not symmetric the ratio Lm/Lsym would reflect the degree to
which dendrites diverge from perfect symmetry (Lm/Lsym = 1). All dendrites that
presented an Lm/Lsym value above the threshold fixed at 2 have been considered as
“polarized” dendrites. Finally we have calculated the percentage of neurons that have a
polarized dendrite, meaning that are polarized neurons. As an alternate measure of
dendritic polarity we determined the fractional contribution of the primary dendrite (1°),
of the next longest dendrite (2◦) as well as of the 3° longest and so on until the smallest
(7°).
40
Spine morphological analysis
Dendritic spines have been classified as Stubby, Thin and Mushroom based on the
morphological criteria proposed by Harris et al. (Harris et al. 1992) (Figure 2). More
specific, are defined as “Stubby” the spines in which neck diameter and spine total
length are comparable; “Thin” if the length of the spine is much greater than both neck
and head diameters that are both similar and “Mushroom” if the spines have a big head
diameter and a small neck. Following a visual classification based on known
morphological criteria, the straight line tool of ImageJ software was used to measure the
spine length, traced from the edge of the dendrite to its farthest point, the spine head
diameter as well as the dendrite length (Fig.14). The spine density was reached through
the quotient between the number of spines found in the proximal or distal field and the
dendritic length (40µm).
Fig.7: Criteria taking into account for spines classification performed by the operator. “Stubby” spines
have neck diameter and spine total length comparable; “Thin” if the length of the spine is much greater
than both neck and head diameters that are both similar and “Mushroom” if the spines have a big head
diameter and a small neck. (Harris et al., 1992; Rodriguez et al., 2008).

41
Fig.8: Approach to measurement of spines in order to do a good analysis of spine morphology between
different conditions of development of the culture of hippocampal neurons (Smith et al. 2009).
Co-localization of Syn-I and PSD-95
The degree of Synapsin-1 and PSD-95 co-localization had been evaluated starting
from confocal images of both proximal and distal fields of the apical dendrites. In
particular Alexa-586-labeled secondary antibody (bound to Synapsin-1 primary
antibody) was visualized using a 561 nm diode laser while PDS-95 signal was detected
by excitation of the Alexa-647 secondary antibody through a 640 nm diode laser.
Moreover, to avoid any possible cross-talk phenomena among fluorophores, all images
were collected using the method of sequential line scanning. The final quantification of
colocalized pixel was performed using the software Imaris (Bitplane) and its
colocalization module. The software was used with default setting with the addition of
an automatic threshold for pixel intensity calculated on real point spread function for
our microscopy and optics. The colocalization was quantified as amount of fluorescence
collected from each pixel stained (over the threshold) for both protein targets.

42
Bioinformatic analysis of miRNAs targets
The search of targets for miRNAs was performed with miRWalk database that
provides information on the predicted and validated targets and their binding sites in
human, rat and mouse organisms. The predicted targets are achieved through the study
of the possible interactions between miRNAs and target genes whereas the validated
targets module provide information about experimentally verified miRNA interaction,
both of them presenting the interaction sites in complete sequence (promoter, 5' UTR,
CDS and 3' UTR) of all known genes. These two modules have their last update on
March 2011, crucial for reliable results. The information of the possible interactions is
gave by 9 different algorithms (miRWalk, Diana-microT, miRanda, miRDB, PICTAR,
PITA, RNA22, RNAhybrid and Targetscan) which present for each miRNA or gene
target a range information such as: number of algorithms that recognize a specific
complementary between miRNA-target, P-value, number of nucleotides of miRNA seed
sequence, position of the binding site, between others.
Finished the analysis of the validated targets for the miRNAs (mir-132, mir-134,
mir-302b, mir-214), among the total number of gene targets they were subject to a
selection taking into account important aspects such as the presence of the target protein
in neurons and implication in crucial pathways of neuron development. For the analysis
of the predicted miRNAs that have as target BDNF, among the wide range of miRs,
were selected only the miRs that make part of the group that are in agreement with the
following parameters: recognition of the interaction miRNA-BDNF for at least 2
algorithms, miRNA seed sequence constituted for 8 nucleotides minimum, binding-site
in the 3´UTR of BDNF transcript and a validated target expressed in neurons.

43
Densitometric analysis
Evaluation of the effect of miRNAs mimic or inhibitors on the expression level of
the targeted protein was performed on confocal pictures densitometric analysis. Within
experiments all conditions, including illumination intensity and photomultiplier gains
were kept constant. For proteins that are only expressed in the soma the densitometric
analysis focused precisely in this area while with proteins expressed in the total neurons
were also analyzed secondary branching points. The densitometry of the positive-signal
for the target protein was achieved through Measure Stack plugin of ImageJ Software
and the chosen neuron area to further analysis were every time the same between
neurons in the same picture. The densitometry of each neuron is reached through the
sum of the immunoreactivity of all neuron stacks. As densitometric value for each
treatment, to further comparison between miRNAs mimics and inhibitors effects on
neurons, was calculated the mean fluorescence intensity for each group. To quantify
experimental data obtained from separate days, data were normalized relative to mean
fluorescence intensity in control neurons. Moreover, were also normalized the collected
data with mean fluorescence intensity of backgroung in each picture. To achieve a
strong statistic meaning were analyzed 25 neurons for each miRNA mimics, inhibitors
and controls.

44
Fig.9: Densitometric analysis to quantification of protein expression level. Using ImageJ Software the
densitometry of a specific area of the neuron is measure and normalized with the background.
Data representation and statistic analysis
The results were represented as mean of all measurements with corresponding
standard errors (SE). All graphs and statistical analysis were performed with Sigma Plot
11 Software (Systat Software, Inc).
Statistical significance among groups was evaluated performing both t-test, and
One Way ANOVA followed by an all pairwise multiple comparison procedure with
Holm-Sidak’s method where ***, P ≤0.001, **, P≤0.01, and, *, P≤0.5.
45
4. RESULTS
4.1. Role of miRNAs up- or downregulated by antidepressant drugs in neuronal
morphology, survival and BDNF translation
Recently, a growing number of evidence point for the involvement of miRNAs
in the mechanism of antidepressant drugs (Zhou et al., 2009; Baudry et al., 2010;
Angelucci et al., 2011; He et al.; 2012; Smalheiser et al., 2012). To evaluate the effects
of antidepressant treatment on miRNAs expression, adult rats were treated with
different antidepressant drugs (agomelatine, fluoxetine and desipramine) during two
weeks. The RNA extraction from hippocampus of rats treated with antidepressants or
untreated was processed and analyzed using microarrays technology to evaluate the
miRNAs level expression. Further statistical analysis showed significant alteration of
the expression level of certain miRNAs upon treatment. Antidepressant treatment and
microarrays experiments were performed by our collaborators Prof. Maurizio Popoli´s
lab at the University of Milan (www.unimi.it). From the list of miRNAs that were
altered upon treatment we have chosen three that presented the higher or the lowest fold
change when compared with control levels obtained from untreated rats to further
screening in vitro (Table 5).
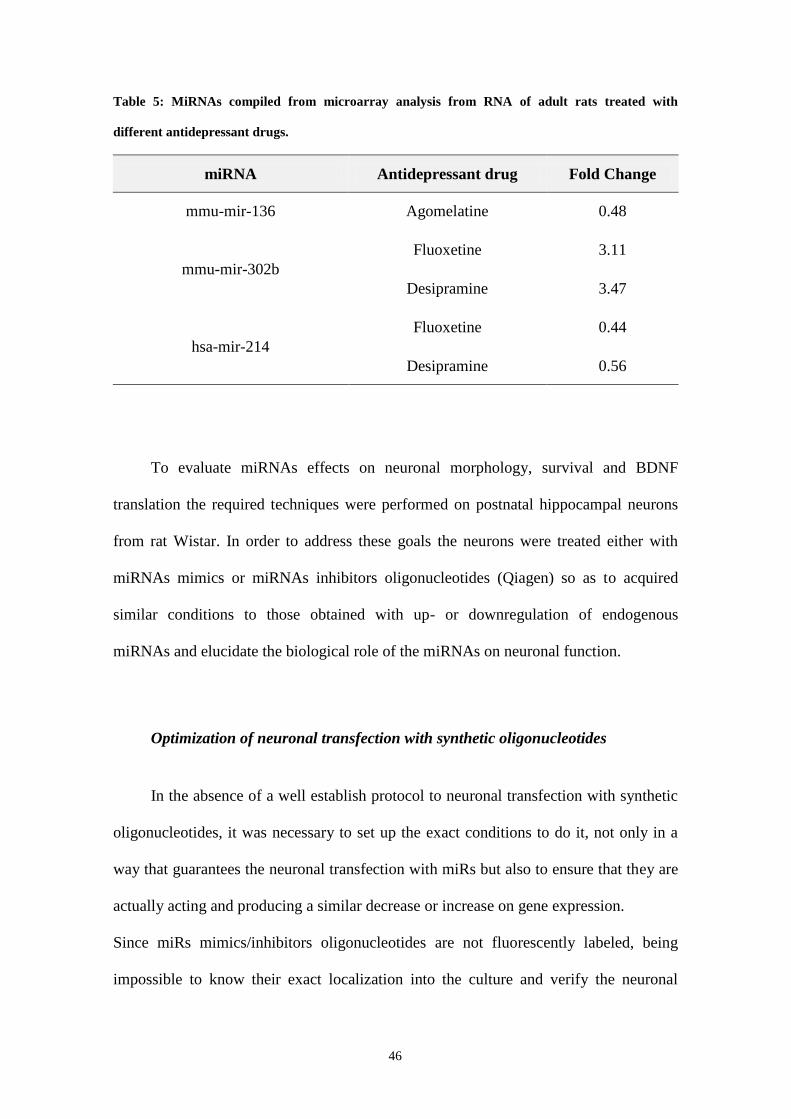
46
Table 5: MiRNAs compiled from microarray analysis from RNA of adult rats treated with
different antidepressant drugs.
miRNA Antidepressant drug Fold Change
mmu-mir-136 Agomelatine 0.48
mmu-mir-302b
Fluoxetine 3.11
Desipramine 3.47
hsa-mir-214
Fluoxetine 0.44
Desipramine 0.56
To evaluate miRNAs effects on neuronal morphology, survival and BDNF
translation the required techniques were performed on postnatal hippocampal neurons
from rat Wistar. In order to address these goals the neurons were treated either with
miRNAs mimics or miRNAs inhibitors oligonucleotides (Qiagen) so as to acquired
similar conditions to those obtained with up- or downregulation of endogenous
miRNAs and elucidate the biological role of the miRNAs on neuronal function.
Optimization of neuronal transfection with synthetic oligonucleotides
In the absence of a well establish protocol to neuronal transfection with synthetic
oligonucleotides, it was necessary to set up the exact conditions to do it, not only in a
way that guarantees the neuronal transfection with miRs but also to ensure that they are
actually acting and producing a similar decrease or increase on gene expression.
Since miRs mimics/inhibitors oligonucleotides are not fluorescently labeled, being
impossible to know their exact localization into the culture and verify the neuronal

47
transfection with these oligonucleotides, was used the BLOCK-iT (Invitrogen), a red-
labeled dsRNA oligomer with similar length, charge and configuration to miRs. The
sequence of BLOCK-iT is not homologous to any known gene avoiding the possibility
of BLOCK-iT-mediated effects by silencing neuronal proteins, serving as a control of
transfection efficiency facilitating assessment and optimization of oligonucleotides
delivery into cells. In this way, the transfection of hippocampal neurons at DIV 5 and
DIV 11 was done with different concentrations of BLOCK-iT (5nM, 25nM, 50nM and
100nM) using either Lipofectamine (Invitrogen) transfection reagent or Hiperfect
(Qiagen), a transfection reagent especially design to delivery siRNA or miRNA.
Additionally, hippocampal neurons were also co-transfected with GFP plasmids to
allow the visualization of the entire cell morphology in green to further morphological
analysis. The transfected coverslips were fixed 24h after transfection using PFA 4% and
were immuno-stained using antibody against MAP2 proteins and even with Hoechst
staining for cellular nuclei (see methods). All images were obtained by choosing 5
fields of the coverslips as described at methods (see Fig.6) using the 20X objective of
epifluorescence microscope. The transfection efficiency was obtained through the ratio
between BLOCK-iT-positive cells (nuclear red-labeled) and the total number of neurons
in culture. This measurement was performed using multipoint tool of Imagej Software
making the discrimination between neurons and glia cells (see methods, Fig.6).
BLOCK-iT-positive neurons were present in a really small number when
transfected with the lower concentration of BLOCK-iT, recommended by the supplier,
being reached less than 0,1% with Hiperfect transfectant and about 2% with
Lipofectamine2000 of tranfection efficiency. The transfection efficiency started to be
higher from 25nM of BLOCK-iT; nevertheless, this increase was merely observed with
Lipofectamine2000 reagent rather than Hiperfect, which seems not to work properly.

48
For this reason, transfection with the higher concentrations of BLOCK-iT (50nM and
100nM) was just performed with Lipofectamine reagent. Surprisingly, transfection
efficiency for these concentrations reached extremely high values: 88,9% and 96,7% of
neurons are positive for BLOCK-it when it´s used 50nM or 100nM of this
oligonucleotide, respectively. Simultaneously, the cell density upon transfection with
BLOCK-iT was measured in order to verify if transfection with such high concentration
of synthetic oligonucleotide is toxic to neuronal cells. To measure the cell density
images of 5 fields of the coverslips were taken as described at methods (see Fig.6) using
the 20X objective of the epifluorescence microscope followed by the count of the cell
density of two different cultures. Cell density of all experiments did not suffer
significant changes when compared with untreated neurons, which means that
transfection with BLOCK-iT doesn´t have a toxic effect (Fig,10).

49
Fig.10: Optimization of hippocampal neuronal transfection with BLOCK-iTTM. (A) Example of a
BLOCK-iT-positive neuron. A panel of a hippocampal neuron at 6 DIV co-transfected with pGFP and
50nM BLOCK-iT (nuclear red-stained) is presented using Lipofectamine transfection reagent and nuclear
stained with Hoëchst. (B) Cell density, measured for each condition, shows no toxic effect of BLOCK-iT
to any concentration. (C) Transfection efficiency obtained with transfection of rat hippocampal neurons
with different concentrations of BLOCK-iT (5nM, 25nM, 50nM and 100nM) using either Lipofectamine
or Hiperfect transfection reagents shows the elevated transfection efficiency for the highest
concentrations of BLOCK-iT (50 and 100nM) when transfected with Lipofectamine 2000. Results
represent quantification of two independent experiments and are expressed as percentage (mean ± St
Dev).
Taking into account that the concentration of BLOCK-iT should be extrapolated
to those for miRs mimics and inhibitors to posterior morphological measurements is
crucial that such concentration achieve real high transfection efficiency, in order to be
sure that our measurements represent reliable results. Since information provided by

50
supplier refers that concentration used to achieve an optimal activity for miRs inhibitors
should be higher to those used for miRs mimics we decided to use miRs mimics at
50nM and inhibitors at 100nM.
Evaluation of miRNA activity
After choosing the appropriate oligonucleotides concentration to guarantee
neuronal transfection was further evaluated their activity. Since miRNAs bind to mRNA
target mediating mRNA degradation or inhibition of translation (Lang et al., 2012), their
activity can be correlated with the expression level of the target protein. Thus, is
essential the quantification of their expression after transfection with miRNAs mimics
or inhibitors, comparing it with basal levels obtained from neurons control.
With this purpose, it was mandatory the search for validated mRNA targets of
mir-124, mir-302b and mir-136. In addition to the miRNAs modulated by
antidepressants, we have chosen two miRNAs previously described in literature as
positive (mir-132) (Vo et al., 2005; Magill et al., 2010) and negative (mir-134) (Shratt
et al., 2006) modulators of neuronal morphology. Search of miRNAs targets was
performed with miRWalk database that comprises information of experimentally
validated targets. This module had its last update on March 2011, crucial for reliable
results. An extensive list of validated targets was provided by miRWalk database being
chosen the target proteins involved in crucial pathways of neuronal development or
connectivity (Table 6).

51
Table 6: List of miRNAs and their validated gene targets provided by miRWalk Database.
miRNAs Target Biological processes References
mir-302b FMRP mRNA transport and translation
Synaptic plasticity
Kao et al., 2010
Huber et al., 2002
mir-214
PTEN Adult neurogenesis
Synaptic plasticity
Amiri et al., 2012
Blair et al., 2012
Sperow et al., 2012
Yang et al., 2008. mir-136
mir-132 MeCP2 Transcription regulation Su et al., 2012
mir-134 Limk1 Regulator of actin dynamics
Synaptic stability
Foletta et al., 2004
Eaton et al., 2005
Another important aspect to take into account was the optimal time of
incubation with miRNAs mimics/inhibitors in order to achieve the maximum activity of
these oligonucleotides. Since previous works carrying out experiments with miRNAs
with similar purposes to ours used 72h of incubation with miRNAs (Shratt et al., 2006)
and information provided by supplier indicate it as a time in which miRNAs are stable
and active, we have decided to do the experiments with 72h of incubation with miRs. In
this manner, rat hippocampal neurons at 3 and 9 DIV were transfected with 50nM miRs
mimics or 100nM miRs inhibitors using Lipofectamine2000 reagent and were fixed 72h
after transfection using PFA 4%. In this way, it is possible to evaluate the miRNAs
effect at 6 and 13 DIV, in young and mature neuronal stage (Dotti et al., 1988). After
fixation, the coverslips were immuno-stained with the antibody against the
corresponding protein target and also for cellular nuclei with Hoechst staining.
52
At this point, two kinds of measurements were made: one to evaluate the
miRNA-targeted protein expression and another to evaluate neuronal survival. To
measure the cell density, images of 5 fields of the coverslips were taken as described
before and was done the count of the cell density of two different cultures treated either
with miRs mimics or inhibitors. No significant changes were observed in the cell
density between the control, cells treated with miRs mimics or with miRs inhibitors and
cell density was between 130.000-150.000 cells/coverslip, what is important to show
that the transfection treatment is not promoting cell death. In regard to the expression of
the proteins targeted by miRNAs we have collected images with confocal microscope
for neuronal densitometric analysis (see methods). Densitometric analysis allow us to
determine the difference in the protein expression between control, miRs mimics and
miRs inhibitors groups by quantification of protein fluorescence intensity. As the
chosen miRNAs target proteins expressed at the soma was done the densitometric
analysis on this specific area (see methods, Fig.9). Fluorescence intensity was measured
through ROI Manager of ImageJ Software which analyzes the mean grey value of each
stack of the chosen area. The mean grey value for each neuron was everytime
normalized through the subtraction of the mean grey value of the background for each
field, giving the true protein signal. Densitometric analysis showed a general decrease
(between 17 and 36%) and increase (between 14 and 26%) on the protein expression
when it was done the transfection with miRNAs mimics and inhibitors, respectively
(Fig.11). Although there is not significant variances, such alterations on protein
expression is reproducible for all miRNAs.

53
Fig.11: Protein expression
quantification after transfection
with miRNAs mimics and
inhibitors. Protein expression
levels quantified by
densitometric analysis of the
nuclear soma of hippocampal
neurons incubated during 72h
with mir-132 (A), mir-134 (B),
mir-302b (C), mir-214 (D) and
mir-136 (E) shows a general
increase and a decrease on the
expression of the protein target
when it is used miRNAs mimics
and inhibitors, respectively. Data
was collected from 25 neurons.
(F) Cell density of hippocampal
neuronal cultures did not suffer
significant changes with the
miRNAs transfection implying
that there is not a toxic.
Finished the optimization of the neuronal transfection conditions with miRNAs
oligonucleotides we have started the functional screening in vitro of the miRNAs effects
on neuronal morphology, survival and BDNF translation.

54
Effect of miRNAs on neuronal morphology
As miRNAs can target many genes involved in the establishment of neuronal
morphology we had focus our attention on neuronal and spine morphology of
hippocampal neurons treated with miRNAs mimics or inhibitors. Therefore, was
measured the neuronal total dendritic length (µm) and the number of primary and
secondary dendrites (see methods). These analyzes were performed through co-
transfection of rat hippocampal neurons at 3 and 9 DIV with miRNAs mimics/inhibitors
and GFP, in which miRNAs were incubated for 72h. At 6 and 12 DIV the coverslips
were fixed with PFA 4% and images were collected with epifluorescence microscope
and further analyzed with NeuronJ plugin of ImageJ software. The neuronal
morphology was done in blind and in the most conservative manner possible. The
primary dendrite was measured from its inception (the point of intersection between the
primary dendrite and the soma) to its end, the farthest point of the dendrite. Secondary
dendrites were measured in the same way, from its beginning (the point of intersect
between the secondary and primary dendrites) and its end. To define the total dendritic
length (µm) of each neuron was done the sum of the length of all dendrites. Finally, the
total dendritic length for each miRNA mimic/inhibitor was presented as mean ± St
Error. Statistical analysis with t-test and one way ANOVA were performed to verify if
there were significant differences between miRNA treatments and control.
Neuronal morphology at 6 DIV did not change with the up or down-regulation of
miRNAs, instead, at 12 DIV we can observe a statistically significant variance in the
dendritic length of both mir-132 and -134. With miRs mimics was observed an increase
on the total dendritic length for the mir-132 and a decrease for the mir-134. However,
any significant changes were observed in the number of primary and secondary
dendrites.

55
Fig.12: Effect of miRNAs expression in the morphology of hippocampal neuronal cultures. Total
dendritic length (µm), primary and secondary dendrites are represented as mean ± St error. Quantification
of total dendritic length and branches was made from at least 20 neurons. The statistical significance
between mimics, inhibitors and controls neurons was evaluated using t-test where ***, P ≤0.001, **,
P≤0.01, and, *, P≤0.05.

56
Effect of miRNAs in cellular viability
Previous studies have demonstrated the role of miRNAs on cellular viability
either by causing cell death (Fang et al., 2012) or cell proliferation (Zhong et al., 2012).
In this way, we have tested the effects of the miRNAs on the viability of PC12 cells
(pheochromocytoma cells), proliferative cells that allow us to quantify both cell death
and cell proliferation ratios. PC12 cells grew in RPMI medium supplemented with 10%
of horse serum and 5% of FBS in 25cm2 flasks and medium was replaced every 2-3
days in order to provide new nutrients to cells. Reaching a high cell density, PC12 cells
were seeded into 96-well plate in RPMI medium low supplemented (5% HS and 2%
FBS) which induces cell attachment at a cell density of 1 x 10⁶. After one day, cells
were transfected with 50nM of miRs mimics and 100nM of miRs inhibitors as
previously described (see methods). Evaluation of miRNAs effect on cellular viability
was carried out at two different times of incubation with the oligonucleotides, 48 and
72h. After incubation was performed the MTT assay, a colorimetric assay that permits
to evaluate the activity of the reductase enzymes that convert MTT dye into formazan
crystals in living cells (Tim Mosmann, 1983). Absorbance of the samples was measured
using a plate reader at 560 and 600nm. Statistical analysis shows a significant decrease
on the cellular viability at 48h of incubation with the miRNAs mimics/inhibitors of
about 50% which demonstrates the cytotoxicity of the treatment for this cell line;
however, the cellular viability shows an increase at 72h in comparison with the previous
results and in some cases cellular viability is practically restored (Fig.13).
Unfortunately, MTT assay doesn´t show any specific effect for the miRs mimics and
inhibitors but instead a general cytotoxicity effect for the PC12 cells transfection with
miRNAs oligonuceotides.

57
Fig.13: MTT assay performed to evaluate the effects of miRNAs on cellular viability. Two times of
incubation with the miRNAs mimics and inhibitors were used (48 and 72h) and absorbance was read at
560 and 600nm. No specific effect on cellular viability is observed but rather the cytotoxicity of the
treatment. Data were collected from 2 independent experiments and are represented as mean ± St Error.
Effect of miRNAs on BDNF translation
Besides evaluation of miRNAs effects on neuronal morphology and cellular
viability, we have even evaluated their effects on BDNF translation. Many miRNAs
target BDNF inducing its expression decrease, which may explain the neuronal
plasticity impairment observed in depressed patients (Blugeot et al., 2011). Therefore, is
important to understand what kind of consequence the miRNAs modulated by
antidepressant drugs have on BDNF mRNA. In this way, rat hippocampal neurons
transfected at 3 and 9 DIV and incubated for 72h with miRs mimics/inhibitors were
immuno-stained with antibody against BDNF (Sigma). After that, images collected with
60X objective of confocal microscope were analyzed with Imagej Software to do
densitometric analysis to quantify fluorescence intensity of BDNF protein in control,
miRs mimics and miRs inhibitors groups. Quantification of BDNF protein was done in

58
neuronal soma of hippocampal neurons as described at methods. In general, BDNF
expression after incubation with miRNAs during 72h does not change significantly.
Nevertheless, changes verified in the BDNF expression tends to follow a similar
behavior both in soma and dendrites since it is observed that a decrease on the protein
level in the soma as a correspondence decrease on the protein level on the dendrites. An
important observation is that protein levels for miR-134, a modulator of the BDNF
expression, demonstrate an alteration in its expression level, being verified an increase
with the miRs mimics and a decrease with miRs inhibitors (Fig.13).
Fig.14: Effect of miRNAs on BDNF expression levels. Densitometric analysis represented as relative
intensity of the protein expression from the soma (A) and dendrites (B) of hippocampal neurons
transfected with miRNAs oligonucleotides does not show significant variances in the BDNF expression
levels; however, for miR-134 it is observed a tendence for the increase and decrease of BDNF expression
caused by miRNAs inhibitors and mimics, respectively.

59
Bioinformatic analysis for miRNAs binding sites into BDNF gene
MiRNAs can modulate the BDNF protein expression directly by targeting its gene
or indirectly by targeting other genes involved in its transcription or translation
mechanisms. The knowledge of miRNAs targets is essential to understand which
mediators are involved in the mechanism of many diseases. As mentioned above,
BDNF is decreased in depressed patients (Blugeot et al., 2011) being its expression
level restored when it´s administrated antidepressant drugs (Ubhi et al., 2012), thus, it is
important to know which miRNAs can target BDNF regulating its expression in the
brain. Bioinformatic analysis emerges in this field as an important tool to search for
miRNAs that have as target the BDNF mRNA. To obtain this information, the search
was done through miRWalk database, which provided not only the miRNAs
experimentally validated to target BDNF mRNA but also the miRNAs predicted to
target it. Predicted targets are achieved through the study of the possible interactions
between miRNAs and all known genes, being provided the interaction sites in the
complete sequence of the gene (promoter, 5' UTR, CDS and 3' UTR). The possible
miRNA-mRNA interactions are given by 9 different algorithms (miRWalk, Diana-
microT, miRanda, miRDB, PICTAR, PITA, RNA22, RNAhybrid and Targetscan),
which ensure a powerfull analysis. For each miRNA or gene target is provided a wide
range of information is provided, such as: number of algorithms that recognize a
specific complementary between miRNA-target, P-value of such match, number of
nucleotides of miRNA seed sequence, position of the binding site, between others.
From the extensive list of predicted miRNAs to target BDNF was done the selection of
the miRs in agreement with the following parameters: recognition of the interaction
miRNA-mRNA for at least 2 algorithms and miRNA seed sequence of at least 8
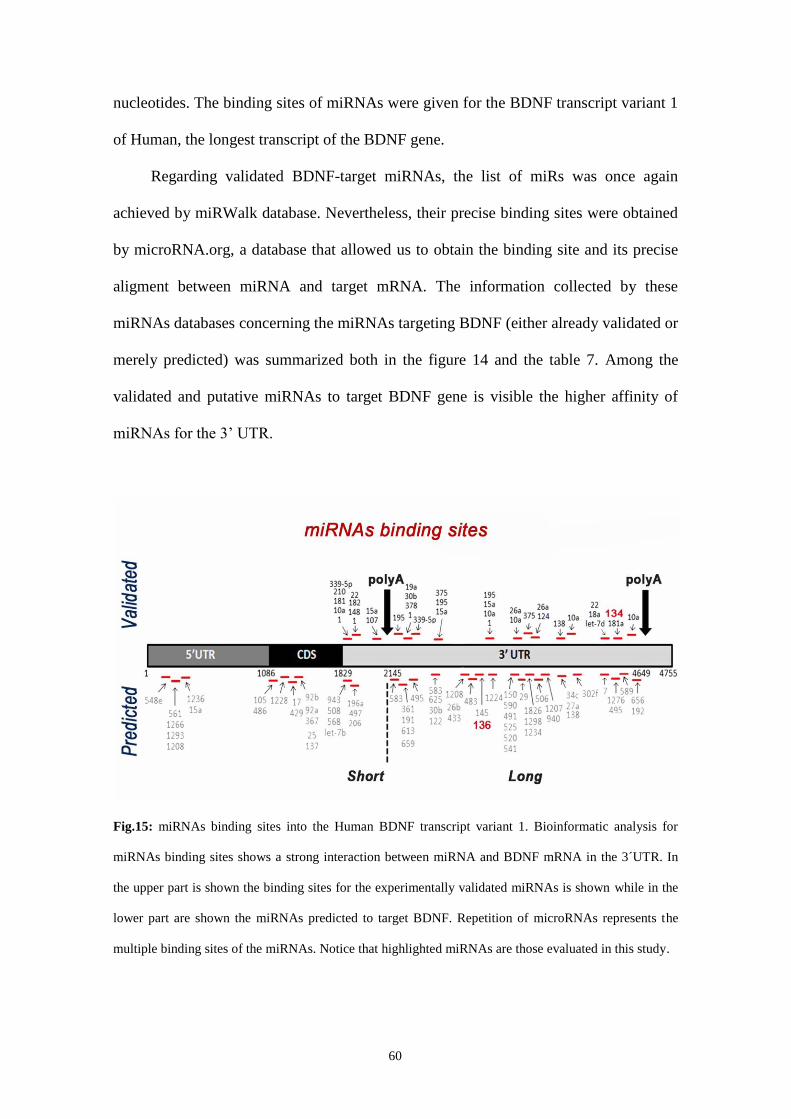
60
nucleotides. The binding sites of miRNAs were given for the BDNF transcript variant 1
of Human, the longest transcript of the BDNF gene.
Regarding validated BDNF-target miRNAs, the list of miRs was once again
achieved by miRWalk database. Nevertheless, their precise binding sites were obtained
by microRNA.org, a database that allowed us to obtain the binding site and its precise
aligment between miRNA and target mRNA. The information collected by these
miRNAs databases concerning the miRNAs targeting BDNF (either already validated or
merely predicted) was summarized both in the figure 14 and the table 7. Among the
validated and putative miRNAs to target BDNF gene is visible the higher affinity of
miRNAs for the 3’ UTR.
Fig.15: miRNAs binding sites into the Human BDNF transcript variant 1. Bioinformatic analysis for
miRNAs binding sites shows a strong interaction between miRNA and BDNF mRNA in the 3´UTR. In
the upper part is shown the binding sites for the experimentally validated miRNAs is shown while in the
lower part are shown the miRNAs predicted to target BDNF. Repetition of microRNAs represents the
multiple binding sites of the miRNAs. Notice that highlighted miRNAs are those evaluated in this study.

61
Table 7: Number of miRNAs targeting a specific region of BDNF gene.
5’UTR CDS 3’UTR
Short Long
Predicted 7 10 7 39
Validated 0 0 10 18
Total 7 10 17 57
The preferential capacity of miRNAs to bind to the BDNF mRNA 3’UTR,
especially its long portion, may have important consequences in the expression level of
the two populations of BDNF transcripts either with the short or long 3’UTR. For this
reason, it was important to understand the role of these two types of transcripts.
4.2. Role of 3’UTR long of BDNF mRNA in neurons
BDNF gene has a complex transcription mechanism, which can originate
different isoforms of BDNF through alternative splicing (Aid et al., 2007). Likewise,
alternative polyadenilation creates two populations of transcripts that carry either short
or long 3’UTR. The structural and functional meaning on neuronal population of such
transcripts is still a topic in debate. To determine their function, a mice strain
specifically originated to lack the long 3’UTR- BDNFlox mice was created. The
absence of the 3’UTR long has allowed us to evaluate its involvement in the neuronal
and spine morphology and plasticity.
62
The neuronal morphology and plasticity was assessed through neuronal
hippocampal neurons from BDNFlox/lox
(referred as LOX), BDNFlox/+
(referred as HET)
and BDNF+/+
(WT) mice, maintained in culture up to 6, 9 and 12 DIV. In this way it´s
possible to study three different neuronal stages: young, adult and matured neurons
(Baj, Patrizio and Tongiorgi, in Submission). Hippocampal neurons were transfected at
5, 8 and 10 DIV being fixated at 6, 9 and 12 DIV in PFA 4%. Subsequently, coverslips
were immuno-stained with antibody against MAP2 and stained with Höechst. Images
were collected in epifluorescence microscope and neuronal measurements were
performed with NeuronJ plugin of the Imagej Software. For neuronal morphology was
measured the length of the primary and secondary dendrites to achieve the total
dendritic length; moreover, also the number of primary and secondary dendrites as well
as branching points was count for each genotype and time point. Statistical analysis
showed a significant reduction on the total dendritic length (µm) of the BDNFlox mice
at 6 and 12 DIV in comparison to heterozygous or WT mice, that don´t have any
difference between them. Nevertheless, the number of primary and secondary dendrites
and also branching points do not suffer significant changes (Fig.14).

63
Fig.16: Hippocampal neurons of BDNFlox mice have a lower dendritic length but a normal number of
branches. Representative images of hippocampal GFP-positive neurons at 6 (A), 9 (B) and 12 (C) DIV.
The images were taken through epifluorescence microscope using a 20X objective and analyzed with
ImageJ Software to quantify neuronal morphology. Total dendritic length (D), primary dendrites (E),
secondary dendrites (F) and branching points (G) of hippocampal neurons from BDNFlox
(lox), BDNFlox/+
(het) and BDNF+/+
(wt) mice are represented as mean ± St error. Quantification of total dendritic length
and branches was made from 44-56 neurons and at least 3 cultures for each time point and genotype. The
statistical significance between the three genotypes was evaluated using t-test where ***, P ≤0.001, **,
P≤0.01, and, *, P≤0.05.
Measurements of neuronal and spine morphology were done in pyramidal
hippocampal neurons, neurons characterized by their asymmetric dendritic arbor
(Horton et al., 2006). For this reason, we have evaluated the polarization of the
hippocampal neurons of each genotype in order to see if there is any change in the

64
polarization process. Neurons are considered as polarized when the apical dendrite has
at least the double of the length of the other dendrites. Through this evaluation we have
determined the percentage of polarized neurons and the contribution of each dendritic
arbor to the total dendritic length using the Horton’s method (Horton and Ehlers 2006)
(see Methods). Any change is visible among the three genotypes, since the percentage
of polarization and dendritic rank maintain in the same range of values for all of them.
Fig.17: Polarity of hippocampal neurons in vitro. Percentage of polarized neurons (mean ± St error) do
not shows significant differences between the three genotypes (A). The contribution of each dendrite for
the total dendritic length (expressed as ratio Lm/Lsym) at both 6 (B) and 12 (C) DIV is comparable
among the three genotypes of mice. Dendrites are ranked longest to shortest. Data collected from 44 up to
65 neurons. The statistical significance among the three genotypes was evaluated using One Way
ANOVA.

65
Afterwards, the spine morphology of each genotype was evaluated. Pictures of
the spines were collected by GFP- positive neurons with 60X objective of confocal
microscope. From each neuron we took two fields of 40µm in proximal and distal fields
of the apical dendrite (see methods). Images were analyzed with ImageJ Software in
order to achieve the number of stubby, thin and mushroom as well as the spine density
(represented as number of spines per 10µm) present in each genotype. Concerning the
spine density, in both genotypes was verified an increase on the spine number of both
proximal and distal fields of the neurons as they grew up. BDNFlox
mice tend to have a
lower spine density, especially at later development stages. However, such difference is
not significant. The qualitative analysis of the spine types which discriminate stubby,
thin and mushroom spines observed in the apical dendrite points to morphological
changes in the spines. There is a decrease in the stubby and an increase in the thin and
mushroom spines number with the neuronal development. Among the three genotypes,
changes in the proximal fields were observed; nevertheless, truncation of the long
3’UTR had a negative impact on the final stages of the spine maturation since BDNFlox
mice have a decrease on the number of mushroom spines in the distal fields of matured
neurons.

66
Fig.18: Spine maturation of hippocampal neurons from BDNFlox mice is impaired. (A) Representative
confocal images of 40µm fields of distal fields of the apical dendrite of 12 DIV hippocampal neurons
from BDNFlox
, BDNFlox/+
(HET) and BDNF+/+
(WT). (B) No significant changes were observed in the
spine density, represented as the number of spines per 10µm, among the three genotypes. The percentage
of spine types (stubby, thin and mushroom) in proximal fields (C) and distal fields (D) show a difference
only in the percentage of mushrooms spines present in the distal fields of matured neurons. Measures are
presented as mean + St Errors and statistical analysis were obtained using One Way ANOVA where ***,
P ≤0.001, **, P≤0.01, and, *, P≤0.05.
To evaluate the maturation of spines present in hippocampal neurons during
neuronal development we have quantified the colocalization of Syn-I and PSD-95. With
this purpose, cells were immuno-stained both against PDS-95 and SYN-1 and images
were collected by confocal microscope. The quantification of the colocalization was
performed following a threshold setting (see methods). Data were analyzed as the
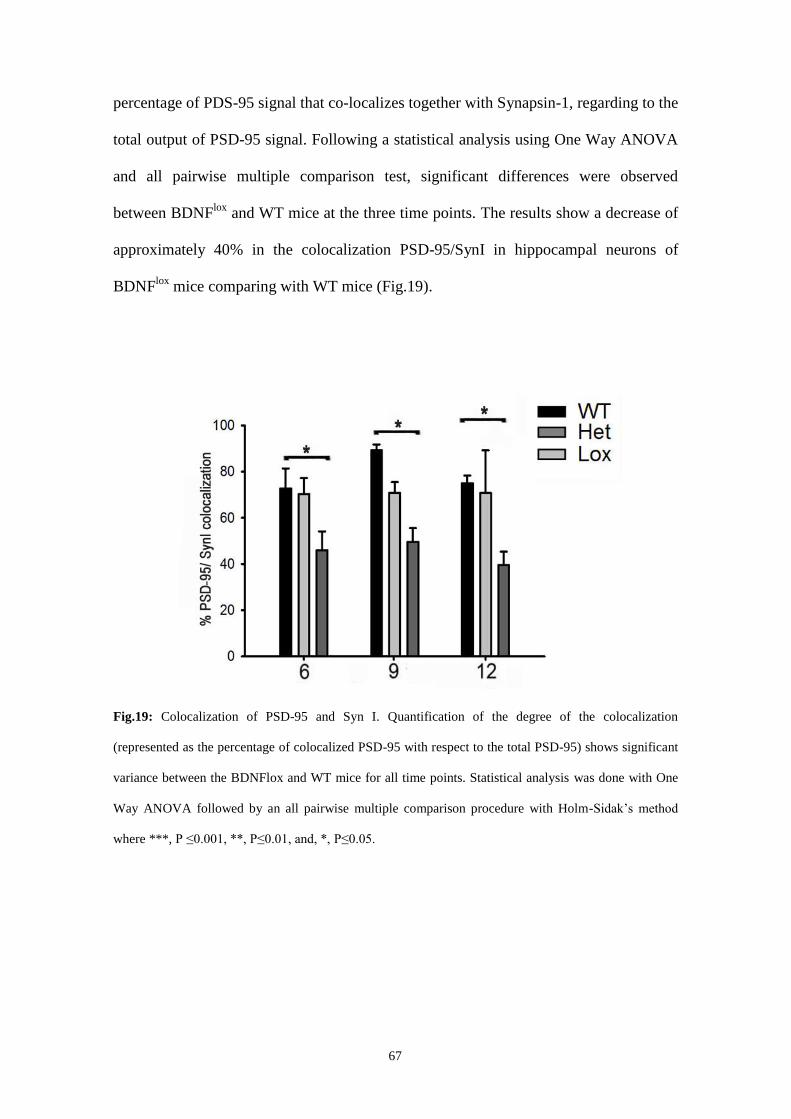
67
percentage of PDS-95 signal that co-localizes together with Synapsin-1, regarding to the
total output of PSD-95 signal. Following a statistical analysis using One Way ANOVA
and all pairwise multiple comparison test, significant differences were observed
between BDNFlox
and WT mice at the three time points. The results show a decrease of
approximately 40% in the colocalization PSD-95/SynI in hippocampal neurons of
BDNFlox
mice comparing with WT mice (Fig.19).
Fig.19: Colocalization of PSD-95 and Syn I. Quantification of the degree of the colocalization
(represented as the percentage of colocalized PSD-95 with respect to the total PSD-95) shows significant
variance between the BDNFlox and WT mice for all time points. Statistical analysis was done with One
Way ANOVA followed by an all pairwise multiple comparison procedure with Holm-Sidak’s method
where ***, P ≤0.001, **, P≤0.01, and, *, P≤0.05.

68
5. DISCUSSION
Depression is a mood disorder that affects proximately 121 milion people
worldwide and represents one of the most common disorders to disability (World
Health Organization). Many factors are involved in the onset of this disorder including
dysregulation of miRNAs signaling (Saus et al., 2010). Since miRNAs can target and
inhibit the expression of many genes, regulating a large spectrum of biologic processes,
defects on their activity may have undesirable effects on brain function. Diverse types
of antidepressants can in turn modulate miRNAs expression. Experiments performed by
our collaborators at the University of Milan have shown that antidepressant drugs
administrated in adult rats for two weeks modulate the expression of several miRNAs,
either by promoting their increase or decrease. Thus, the functional meaning of the
alterations in the miRNAs expression pattern caused by antidepressant drugs emerges as
an important field of research.
In order to understand the role of miRNAs modulated by antidepressants in the
neuronal cells and, consequently, in brain function, three miRNAs were selected from
the list of the miRNAs compiled by microarrays analysis carried out on brain RNA
extracted from adult rats treated with the drugs. The selection of these miRNAs was
done taking into account the following parameters:
-High fold change of its expression levels following the antidepressant
treatment;
-Have a validated gene target for the evaluation of their activity.
The selected miRNAs mir-136, mir-302b and mir-214 were further evaluated for
their effects on neuronal morphology and survival as well as BDNF translation in vitro.
69
Evaluation of miRNAs effects was performed using rat hippocampal neuronal
cultures, which were subject of transfection with miRNAs mimics and inhibitors. These
are synthetic oligonucleotides which mimic endogenous mature miRNAs: the mimics
produce a decrease of gene expression while the inhibitor lead to an inhibition of the
endogenous miRNA, allowing us to achieve conditions similar to the endogenous up- or
down-regulation of miRNAs to further gene expression and phenotypic analysis. In the
absence of an established protocol to neuronal transfection with miRNAs, it was
mandatorily to set-up the conditions to do these experiments.
To the establishment of the protocol we have followed a specific line of reasoning to
guarantee not only the neuronal transfection with the miRNAs but also their inhibitory
activity into the cells. According to this, we started to identify the best concentration of
miRNAs to transfect the largest number of neurons in culture. Since these
oligonucleotides are not fluorescently labeled and therefore it is impossible to track
them, it was necessary the use of the BLOCK-iT (Invitrogen), a red-labeled dsRNA
oligomer with similar length, charge and configuration to the miRs, without a homology
to any known gene avoiding the silencing of neuronal proteins. We experimentally
verified that the correct concentration of miRNAs oligos to reach the highest neuronal
transfection efficiency is either 50 or 100nM. Moreover, evaluation of the impact of the
used concentrations of BLOCK-iT on neuronal survival did not show any significant
effect on cell density. However, transfection with Lipofectamine2000 reagent showed a
slight toxic effect on neurons, since cell density in these cases is decreased, but not
significantly. These results show that such concentrations of synthetic oligonucleotides
are not letal for neuronal cells.
Since information provided by the supplier refers that concentration of miRNAs
inhibitors should be higher than the concentration of miRNAs mimics to obtain the

70
inhibition of the endogenous miRNA, we had to choose the concentration of 100nM for
miRNAs inhibitors and 50nM for mimics.
As miRNAs are small RNA molecules with affinity to mRNAs promoting their
degradation or translation inhibition (Lang et al., 2012) and consequent decrease on
protein expression, we focused our attention in the quantification of the target proteins
expression. With this purpose we searched for experimentally validated targets for the
three miRNAs to be evaluated. Through bioinformatic analysis using miRWalk
database we have chosen one target for each miRNA (see results, table 5) based on its
neuronal expression and involvement in crucial pathways of neuronal development and
connectivity. After neuronal transfection with both miRs mimics and inhibitors we have
quantified the protein expression by densitometric analysis. This approach allowed us to
quantify the expression levels of the protein target by miRNAs and correlate it with
miRNAs activity. As we achieved a decrease of 17-36 % and an increase of about 14-26
% upon miRs mimics or inhibitors transfection, respectively, we can assume that
miRNAs have activity in neurons. These small changes are similar to those mediated by
endogenous miRNAs and are in agreement with the characteristic of miRNAs to control
biological processes through slight variations in the levels of target proteins.
Furthermore, as miRNAs have many possible targets, miRs mimics/inhibitors may
affect other mRNAs having a general action on the total endogenous mRNAs targets,
explaining why we do not see strong changes in the selected protein target. In these
experiments we have also evaluated the effect of miRNAs transfection on neuronal
survival but we did not observe any significant change. This result is important to
demonstrate that transfection with miRNAs does not have a cytotoxic effect and that
protein decrease produced by miRNAs is not being prejudicial to neuronal survival.

71
The importance of miRNAs on the modulation of the neuronal morphology is
generally accepted (Shratt et al., 2006; Magill et al., 2010; Agostini et al., 2011; Zhang
et al., 2011; White et al., 2012). As antidepressant drugs altered the expression of some
miRNAs it was hypothesized that their therapeutic effects are achieved, at least in part,
by miRNAs-mediated gene regulation benefiting depression´s recovery. Morphological
measurements of hippocampal neurons at 6 and 12 DIV have shown a modulation effect
for the mimics-132 and -134. These miRNAs were previously described in literature as
positive (mir-132) (Vo et al., 2005; Magill et al., 2010) and negative (mir-134) (Schratt
et al., 2006) modulators of neuronal morphology, since they can increase or decrease,
respectively the neuronal arborization outgrowth. Taking this into account, our results in
which the mimic-132 and -134 produce an increase and decrease of the total dendritic
length, respectively, is in agreement with previous studies. However, inhibitors did not
show any impact on the neuronal morphology. Our data on miR-inhibitors can be
compared only with a previous study in which mir-132 was genetically ablated by gene
mutagenesis (Vo et al., 2005) showing significant impact on dendrites length. The
divergent results may be explained by different technical bases of these studies and/or
by a too low concentration of the miR-inhibitors used here.
Previous studies had present evidences for the role of miRNAs on cellular
viability either by enhancing cell proliferation (Zhong et al., 2012) or causing cell death
(Fang et al., 2012) through gene expression regulation. The evaluation of viability of
PC12 cells (pheochomocytoma cells) at 48 and 72h demonstrated the cytotoxic effect of
the miRNAs transfection for this cell line. In fact, at 48h was observed the decrease of
about half of the cell survival; nevertheless, there was a recovery of cell survival at 72h
which in some cases was similar to the control. The rescue of cell viability at 72h can be
72
explained by the higher capacity of proliferation of these cells after a first cytotoxic
effect occurring upon the initial transfection.
Many miRNAs can target BDNF inducing its decrease, which may explain the
neuronal plasticity impairment observed in depressed patients (Blugeot et al., 2011).
Therefore, it is important to understand what impact the miRNAs modulated by
antidepressant drugs may have on BDNF mRNA. The quantification of BDNF protein
after incubation with miRs mimics/inhibitors demonstrate that, except for mir-132, for
which is observed a tendency to modulate the BDNF expression (it is slightly increased
with the mir-132 inhibitor and slightly decreased with the mir-132mimic), there are no
changes in the BDNF expression for the others miRNAs. Results obtained with
preliminary densitometric quantification on soma or full dendrites with miRNAs
treatments did not show a strong variance in the BDNF expression. However, the miR-
132 and mir-134 were previously described as modulators of BDNF expression (Shratt
et al., 2006; Kawashima et al., 2010) and since miRNAs inhibitory action may modulate
protein translation in different ratios among the neuronal cells in culture, evaluation of
this parameter with another kind of approach or statistical analysis would be of great
importance. For that reason, a new analysis of stained coltures is currently in progress
and will give new insight at specific subcellular domains (Magill et al. 2010) involved
in BDNF translation miRNA regulated.
The modulation of the neuronal morphology by miRNAs raises the question of
the involvement of BDNF on it, since it is recognized the implication of this
neurotrophin in morphological features. Thus, it is important to know whether
morphological alterations mediated by miRNAs are due to BDNF expression
regulation. A significant number of miRNAs target BDNF gene and an even higher
number of these molecules are predicted to target it. Through bioinformatics analysis it

73
was possible to get the miRNAs that are already validated or only predicted to target
BDNF gene and regulate its expression. Generally, such regulation is mediated by the
interaction miRNA-mRNA that is done mostly in the 3’UTR. In fact, among the
miRNAs validated or merely predicted to target BDNF, 65 target the 3’UTR and the
majority of them in the long portion of the 3’UTR region. This observation may imply a
differential targeting and regulation of the two BDNF transcripts populations having
either a short or a long 3’UTR. Therefore, translational inhibition of BDNF proteins
originated by the two types of transcripts may have different implications in the
development or homeostasis of neuronal cells.
While initially, a previous studies have presented evidence for the differential
target of the BDNF transcripts according to the 3’ UTR in resting neurons (An et al.,
2008), two recent study showed that both short and long 3’UTR BDNF transcripts can
be targeted to dendrites (Baj et al., 2011; Yoneda et al., 2011). Dendritic targeting is
apparently due to cytoplasmic polyadenilation element (CPE)-like sequences present in
both the short and the long 3’ UTRs (Yoneda et al., 2011); however, it was observed
that only transcripts with the long 3’UTR can reach the distal part of neuronal cells (Baj
et al., 2011).
Experiments were performed in hippocampal neurons from BDNFlox
mice
(Gorski et al., 2003) in which the BDNF gene is truncated for the long 3’UTR and, thus,
merely expresses the short 3´UTR BDNF transcripts, allowing us to evaluate the role of
the BDNF proteins translated from the two populations of BDNF mRNA transcripts.
Truncation of the long 3’UTR of BDNF resulted in a smaller dendritic length of
neuronal cells in either young or already matured neurons, i.e. at 6 and 12 DIV.
However, it is important to notice that there were no differences between WT,
heterozygous and BDNFlox
mice at 9 DIV. Nevertheless, the number of primary and
74
secondary dendrites and branching points did not change in the absence of the long 3’
UTR at any time point. Taken together, these observations indicate that long 3’ UTR is
necessary for the growth of the final regions of the dendrites and that such role is more
important at dynamic stages of neuronal development.
Another parameter analyzed in our study was the polarization of neuronal cells
in culture. Pyramidal hippocampal neurons are characterized by their asymmetric
dendritic arbor (Horton et al., 2006). The dendritic dynamic is represented by the
extension and retraction of the dendrites and it is during this developmental stage that
one dendrite becomes larger and bigger than the surrounding dendrites. The evaluation
of this parameter demonstrat that truncation of long 3’UTR does not have implications
on neuronal polarization since the percentage of polarized neurons as well as the
dendrites rank, which evaluate the contribution of each dendrite to the final dendritic
length, were similar among the three genotypes. Afterwards, spine morphology of WT,
heterozygous and BDNFlox
mice was evaluated in order to see if the long 3’UTR has an
important role in the structure and function of dendritic spines. The categorization of the
spines present in the proximal and distal fields of the apical dendrite demonstrated that
there is a switch of spine types during neuronal development. At earlier stages, stubby
spines are present in a higher number and then they diminish with maturation giving
rise to thin and mushroom spines, what is in agreement with the process of spine
development (Papa et al. 1995). Although this development was observed in all
genotypes, we found at late developmental stages (12 DIV) a lower number of
mushroom spines in distal fields of BDNFlox
mice hippocampal neurons. Concerning
the spine density at both proximal and distal dendritic fields, we did not observe any
changes in the absence of the long 3´UTR.

75
Besides a qualitative and quantitative analysis of the spine types we also
quantified the colocalization between PSD-95 and SynI, to evaluate the presence of
synapses. This evaluation shows a decrease of about 25% and 35% in the colocalization
in BDNFlox
mice at 6 and 12 DIV, respectively, which means that truncation of long
3’UTR has severe consequences in the connectivity of hippocampal neurons.
Taken together, these results suggest that not only the spine maturation in terms
of the development of spines to mushroom spines, the most mature dendritic spines, but
also the neuronal connectivity is dramatically impaired. However, it is important to
notice that negative changes in spine function takes place only in distal fields, which
goes in agreement with the target of the BDNF proteins translated from the long 3’UTR
mRNA to the dendrites and its redundancy with the 3’UTR short in shaping the spine
morphology at proximal fields. As the short 3’UTR BDNF cannot reach the most distal
parts of the dendrites, it is in that area that the absence of the long 3’UTR is visible.
A very recent study performed by Kaneko et al. (2012) has presented evidences
in agreement with our results concerning the impairment of spine maturation. However,
a divergent but interesting observation regarding dendritic spines morphology was in
what concerns the impact of long 3’UTR in the spine density. In this study, cortical
neurons only with short 3’UTR BDNF transcripts presented an increase in the spine
density in the distal fields (Kaneko et al., 2012) which is explained by the authors as a
result of the deficient spine pruning in this situation. Dendritic spines are overproduced
at postnatal life especially in cortical neurons, but at a certain point there is an
elimination of up to 40% of the spines while the remaining spines become mature and
support the synaptic activity in the brain (Marin-Padilla, 1967; Huttenlocher, 1979).
Thus, it is suggested that the lack of the long 3’ UTR may prevent the spine pruning
(Kaneko et al., 2012). In this manner, comparing with neuronal cells with the two

76
populations of BDNF transcripts where there is a normal spine pruning, the spine
density of BDNFlox
mice is higher since there is not an elimination of the spines.
Although there is an established role for spine pruning in the cortex, there is a
remarkable lack of information regarding spine pruning in hippocampus. In fact,
although without significant variances, a slightly decrease in the BDNFlox
mice was
observed in our study. This result can be due to a different spine development in the
hippocampus. A previous study carried out in our lab in which we evaluated the spine
development, showed a growing number of spines during 15 days in vitro, at any time
point during development was observed spine pruning and consequent spine decrease
(Baj, Patrizio, Montalbano, Sciancalepore and Tongiorgi, in preparation). So far, spine
pruning in hippocampal neurons are only connected to synaptic plasticity after a
procedure of extinction (Garin-Aguilar et al., 2012) but not in a normal spine
development.
As both populations of BDNF transcripts are transcribed in the same manner,
only differing in the polyadenilation processing (Aid et al., 2007), truncation of the long
3’UTR does not affect the transcription of the BDNF gene but rather the targeting of
dendritic distal parts. However, it remains unclear how this long 3’UTR affect both
translation and active mRNA transport in dendrites.

77
6. CONCLUSIONS
The results obtained in this study have highlighted important aspects concerning
the role of the 3’UTR long in the function and development of hippocampal neurons.
BDNFlox
mice, truncated for the long 3’ UTR BDNF, showed deficiencies in total
dendritic length of hippocampal neurons and even structural and functional synaptic-
modifications. These results are important to many fields of research, including the
study of the depression´s mechanism. Since miRNAs are dysregulated in depressed
patients, it was important to evaluate their effects on neuronal cells. Our results suggest
that miRNAs modulated by antidepressant treatment during two weeks do not have any
effects on neuronal morphology and survival. Their effects on BDNF expression levels
are still unclear and new statistical analysis should be performed, however, it cannot be
discarded the possibility of a BDNF expression modulation, which could impact mostly
at synapses. Since many miRNAs are putative or validated targets of BDNF gene,
mainly in the 3´UTR, it can be possible that miRNAs upregulated in depression could
target the long 3’UTR of BDNF explaining, together with the dysregulation of other
proteins, the diminished synaptic plasticity observed in depressed patients.

78
7. FUTURE PERSPECTIVES
As evaluation of the miRNAs effects on the modulation of the BDNF translation
in hippocampal neurons through densitometric analysis did not present conclusive
results, it is already ongoing another type of analysis based on a different statistical
approach. Moreover, the quantification of BDNF levels will be furthermore explored
through Western Blot or ELISA techniques in order to confirm the results from
densitometric analysis. Likewise, the number of hippocampal neurons for the
assessment of the proteins expression levels will be increased to achieve a more
representative ratio for the protein level after up- or down- regulation of miRNAs.
Finally, a new set of experiments using a multiple miRNAs modulation
approach to study in vitro a condition of RNA regulation will be done to achieve a more
representative depression status.

79
8. REFERENCES
Agostinia M, Tuccia P, Steinerta J, Shalom-Feuerstein R, Rouleauc M, Aberdam, Ian D.
Forsythea D, W. Younga K, Venturae A, Concepcione C, Hane Y, Candib E,
Knighta R, Makf T, Melino G (2011) microRNA-34a regulates neurite
outgrowth, spinal morphology, and function. PNAS 108:21099–21104
Aid T, Kazantseva A, Piirsoo M, Palm K, Timmusk T (2007) Mouse and Rat BDNF
Gene Structure and Expression Revisited. Journal of Neuroscience Research
85:525–535
Amiri A, Cho W, Zhou J, Birnbaum SG, Sinton CM, McKay RM, Parada LF. (2012)
Pten deletion in adult hippocampal neural stem/progenitor cells causes cellular
abnormalities and alters neurogenesis. Journal of Neuroscience 32:5880-5890
Angelucci F, Croce N, Spalletta G, Dinallo V, Gravina P, Bossù P, Federici G,
Caltagirone C, Bernardini S (2011) Paroxetine rapidly modulates the
expression of brain-derived neurotrophic factor mRNA and protein in a human
glioblastoma-astrocytoma cell line. Pharmacology 87:5-10
Barbacid M. (1994) The Trk family of neurotrophin receptors. Journal of Neurobiology
11:1386-403
Barde YA, Edgar D, Thoenen H. (1982) Purification of a new neurotrophic factor from
mammalian brain. EMBO Journal 1:549-53
Baj G, Leone E, Chao M, Tongiorgi E (2011) Spatial segregation of BDNF transcripts
enables BDNF to differentially shape distinct dendritic compartments. PNAS
108: 16813–16818

80
Baudry A, Mouillet-Richard S, Schneider B, Launay JM, Kellermann O (2010) miR-16
targets the serotonin transporter: a new facet for adaptive responses to
antidepressants. Science 329:1537-41
Blair PJ, Harvey J (2012)PTEN: a new player controlling structural and functional
synaptic plasticity. The Journal of Physiology 590
Blugeot A, Rivat C, Bouvier E, Molet J, Mouchard A, Zeau B, Bernard C, Benoliel JJ,
Becker C. (2011) Vulnerability to depression: from brain neuroplasticity to
identification of biomarkers. The Journal of Neuroscience 31:12889-99
Brigadski T, Hartmann M, Lessmann V (2005) Differential Vesicular Targeting and
Time Course of Synaptic Secretion of the Mammalian Neurotrophins. The
Journal of Neuroscience 33:7601–7614
Calabrese F, Molteni R, Maj PF, Cattaneo A, Gennarelli M, Racagni G, Riva MA.
(2009) Chronic duloxetine treatment induces specific changes in the expression
of BDNF transcripts and in the subcellular localization of the neurotrophin
protein.
Calissano M, Latchman DS (2010) Cell-specific regulation of the pro-survival Brn-3b
transcription factor by microRNAs. Molecular and Cellular Neuroscience
45:317-23.
Castrén E, Võikar V, Rantamäki T (2007) Role of neurotrophic factors in depression.
Currentent Opinion in Pharmacology 7:18-21
Chakravarthy S, Saiepour M, Bence M, Perry S, Hartman R, Couey J, Mansvelder H,
Levelt C (2006) Postsynaptic TrkB signaling has distinct roles in spine
maintenance in adult visual cortex and hippocampus. PNAS 103:1071–1076

81
Cull-Candy SG, Leszkiewicz DN (2004) Role of distinct NMDA receptor subtypes at
central synapses. Science´s STKE:signal transduction 19:255
Cunha C, Angelucci A, D'Antoni A, Dobrossy MD, Dunnett SB, Berardi N, Brambilla
R (2009) Brain-derived neurotrophic factor (BDNF) overexpression in the
forebrain results in learning and memory impairments. Neurobiology of
Disease 33:358-368
Croll S, Suri C, Compton D, Simmons M, Yancopoulos G, Lindsay R, Wiegand S,
Rudge J, Scharfman H (1999) Brain-Derived Neurotrophic Factor Transgenic
Mice Exhibit Passive Avoidance Deficits, Increased Seizure Severity and In
Vitro Hyperexcitability in the Hippocampus and Entorhinal Cortex.
Neuroscience 93:1491–1506
Dechant G, Barde Y (2002) The neurotrophin receptor p75NTR: novel functions and
implications for diseases of the nervous system. Nature Neuroscience 5:1131 -
1136
Dweep, H., Sticht, C., Pandey, P., Gretz, N. (2011) miRWalk - database: prediction of
possible miRNA binding sites by "walking" the genes of 3 genomes. Journal of
Biomedical Informatics
Eaton BA, Davis GW (2005) LIM Kinase1 controls synaptic stability downstream of
the type II BMP receptor. Neuron 47:695-708
Erik W. Dent, Elliott B. Merriam, Xindao Hu (2011) The Dynamic Cytoskeleton:
backbone of Dendritic Spine Plasticity. Current Opinion in Neurobiology
21:175–181
Faller M, Guo F (2008) MicroRNA biogenesis: there's more than one way to skin a cat
Biochimica et Biophysica Acta (BBA) - Gene Regulatory Mechanisms 1779:
663–667

82
Fang M, Wang J, Zhang X, Geng Y, Hu Z, Rudd JA, Ling S, Chen W, Han S (2011)
The miR-124 regulates the expression of BACE1/β-secretase correlated with
cell death in Alzheimer's disease. Toxicology Letters 209:94-105
Foletta VC, Moussi N, Sarmiere PD, Bamburg JR, Bernard O (2004) LIM kinase 1, a
key regulator of actin dynamics, is widely expressed in embryonic and adult
tissues. Experimental Cell Research 294:392-405
Fišar Z, Hroudová J (2010) Intracellular Signalling Pathways and Mood Disorders.
Folia Biologica (Praha) 56:135-148
Fuchikami M, Yamamoto S, Morinobu S, Takei S, Yamawaki S (2010) Epigenetic
regulation of BDNF gene in response to stress. Psychiatry Investig. 7:251-256
Gao X, Smith GM, Chen J (2009) Impaired dendritic development and synaptic
formation of postnatal-born dentate gyrus granular neurons in the absence of
brain-derived neurotrophic factor signaling. Experimental Neurology 215:178-
90
Gibney J, Zheng JQ (2003) Cytoskeletal dynamics underlying collateral membrane
protrusions induced by neurotrophins in cultured Xenopus embryonic neurons.
Journal of Neurobiology 54:393-405
Gorski A, Zeiler S, Tamowski S, Jones K (2003) Brain-Derived Neurotrophic Factor Is
Required for the Maintenance of Cortical Dendrites. The Journal of
Neuroscience 23: 6856–6865
He Y, Zhou Y, Xi Q, Cui H, Luo T, Song H, Nie X, Wang L, Ying B (2012) Genetic
Variations in MicroRNA Processing Genes Are Associated with Susceptibility
in Depression. DNA and Cell Biology. DNA and Cell Biology

83
Hohn A, Leibrock J, Bailey K, Barde YA (1990) Identification and characterization of a
novel member of the nerve growth factor/brain-derived neurotrophic factor
family. Nature 22:339-341
Horch HW, Krüttgen A, Portbury SD, Katz LC (1999) Destabilization of cortical
dendrites and spines by BDNF. Neuron 23:353-64
Hu B, Nikolakopoulou A, Cohen-Cory, S (2005) BDNF stabilizes synapses and
maintains the structural complexity of optic axons in vivo. Development
132:4285-4298
Huang JK, Dorey K, Ishibashi S, Amaya E (2007) BDNF promotes target innervation of
Xenopus mandibular trigeminal axons in vivo. BMC Developmental Biology
31:7-59
Huber K, Gallagher S, Warren S, Bear M (2002) Altered synaptic plasticity in a mouse
model of fragile X mental retardation. PNAS 99: 7746–7750
Ji Y, Pang PT, Feng L, Lu B (2005) Cyclic AMP controls BDNF-induced TrkB
phosphorylation and dendritic spine formation in mature hippocampal neurons.
Nature Neuroscience 8:164-72
Kao DI, Aldridge GM, Weiler IJ, Greenough WT (2010) Altered mRNA transport,
docking, and protein translation in neurons lacking fragile X mental retardation
protein. Proceedings of the National Academy of Sciences of the United Ststes
of America 107,:15601-1566
Kim JJ, Diamond DM (2002) The stressed hippocampus, synaptic plasticity and lost
memories. Nature Reviews. Neuroscience. 3:453-62.
Kohara K, Yasuda H, Huang Y, Adachi N, Sohya N, Tsumoto T (2007) A Local
Reduction in Cortical GABAergic Synapses after a Loss of Endogenous Brain-
84
Derived Neurotrophic Factor, as Revealed by Single-Cell Gene Knock-Out
Method. The Journal of Neuroscience 27:7234 –7244
Lambert TJ, Storm DR, Sullivan JM (2010) MicroRNA132 modulates short-term
synaptic plasticity but not basal release probability in hippocampal neurons.
PLoS One 5, e15182
Lee K, Kim JH, Kwon OB, An K, Ryu J, Cho K, Suh YH, Kim HS (2012) An activity-
regulated microRNA, miR-188, controls dendritic plasticity and synaptic
transmission by downregulating neuropilin-2. The Journal of Neuroscience
32:5678-87
Lee R, Kermani P, Teng KK, Hempstead BL (2001) Regulation of cell survival by
secreted proneurotrophins. Science 30:1945-1948
Levi-Montalcini R, Skaper SD, Dal Toso R, Petrelli L, Leon A (1996) Nerve growth
factor: from neurotrophin to neurokine. Trends in Neuroscience 19:514-20
Lou H, Kim SK, Zaitsev E, Snell CR, Lu B, Loh YP (2005) Sorting and activity-
dependent secretion of BDNF require interaction of a specific motif with the
sorting receptor carboxypeptidase e. Neuron 45:245-55
Lu B, Pang P, Woo N (2005) The yin and yang of neurotrophin action. Nature Reviews
Neuroscience 6:603-614
Luine V, Martinez C, Villegas M, Magariños AM, McEwen BS (1996) Restraint stress
reversibly enhances spatial memory performance. Physiology Behaviour
59:27-32.
Magill S, Cambronnea X, Luikarta G, Lioy, Leightona B, Westbrooka G, Mandela G,
Goodmana R (2010) microRNA-132 regulates dendritic growth and
arborization of newborn neurons in the adult hippocampus. PNAS 107:20382–
20387

85
Maisonpierre PC, Le Beau MM, Espinosa R 3rd, Ip NY, Belluscio L, de la Monte SM,
Squinto S, Furth ME, Yancopoulos GD (1991) Human and rat brain-derived
neurotrophic factor and neurotrophin-3: gene structures, distributions, and
chromosomal localizations. Genomics 10:558-68
Matsuda N, Lu H, Fukata Y, Noritake J, Gao H, Mukherjee S, Nemoto T, Fukata M,
Poo M (2009) Differential Activity-Dependent Secretion of Brain-Derived
Matsutani S, Yamamoto N (2004) Brain-derived neurotrophic factor induces rapid
morphological changes in dendritic spines of olfactory bulb granule cells in
cultured slices through the modulation of glutamatergic signaling.
Neuroscience 123:695-702
Meisenzahl EM, Seifert D, Bottlender R, Teipel S, Zetzsche T, Jäger M, Koutsouleris
N, Schmitt G, Scheuerecker J, Burgermeister B, Hampel H, Rupprecht T, Born
C, Reiser M, Möller HJ, Frodl T (2010) Differences in hippocampal volume
between major depression and schizophrenia: a comparative neuroimaging
study. European Archives of Psychiatry Clinical Neuroscience 260:127-37
Milne A, MacQueen GM, Yucel K, Soreni N, Hall GB (2009) Hippocampal metabolic
abnormalities at first onset and with recurrent episodes of a major depressive
disorder: a proton magnetic resonance spectroscopy study. Neuroimage 2009
47: 36-41
Min W, Liu C, Yang Y, Sun X, Zhang B, Xu L, Sun X (2012) Alterations in
hypothalamic-pituitary-adrenal/thyroid (HPA/HPT) axes correlated with the
clinical manifestations of depression. Progress in Neuropsychopharmacology
and Biological Psychiatry
Mouillet-Richard, Baudry A, Launay J, Kellermann (2007) MicroRNAs and depression.
Neurobiology of disease 46:272-278

86
Monteggia LM, Barrot M, Powell CM, Berton O, Galanis V, Gemelli T, Meuth S, Nagy
A, Greene RW, Nestler EJ (2004) Essential role of brain-derived neurotrophic
factor in adult hippocampal function. Proceedings of the National Academy of
Sciences of the United States of America 101:10827-10832
Molteni R, Calabrese F, Chourbaji S, Brandwein C, Racagni G, Gass P, Riva MA
(2010) Depression-prone mice with reduced glucocorticoid receptor expression
display an altered stress-dependent regulation of brain-derived neurotrophic
factor and activity-regulated cytoskeleton-associated protein. Journal of
Psychopharmacology 24:595-603
Mowla S, Hooman S, Farhadi F, Petrecca K, Fawcett J, Seidah N, Morris S, Sossin W,
Murphy R (1999) Differential Sorting of Nerve Growth Factor and Brain-
Derived Neurotrophic Factor in Hippocampal Neurons. The Journal of
Neuroscience 19:2069–2080
Mosmann T (1983) Rapid colorimetric assay for cellular growth and survival:
Application to proliferation and cytotoxicity assays. Journal of Immunological
Methods. 65: 55-63
Mowla S, Farhadi H, Pareek S, Atwal J, Morris S, Seidah N, Murphyi N (2001)
Biosynthesis and Post-translational Processing of the Precursor to Brain-
derived Neurotrophic Factor. The journal of Biological Chemistry 276:12660–
12666
Murphy D, Cole N, Segal M (1998) Brain-derived neurotrophic factor mediates
estradiol-induced dendritic spine formation in hippocampal neurons.
Neurobiology 95: 11412–11417

87
Na J, Gharami K, Liao G, Woo N, Lau A, Vanevski F, Torre E, Jones K, Feng Y, Lu B,
Xu B (2008) Distinct Role of Long 3′UTR BDNF mRNA in Spine
Morphology and Synaptic Plasticity in Hippocampal Neurons. Cell 134, 175–
187
Nibuya M, Nestler EJ, Duman RS (1996) Chronic antidepressant administration
increases the expression of cAMP response element binding protein (CREB) in
rat hippocampus. The Journal of Neuroscience 16:2365-2372.
Oe S, Yoneda Y(2010) Cytoplasmic polyadenylation element-like sequences are
involved in dendritic targeting of BDNF mRNA in hippocampal neurons.
FEBS Letters 15:3424-3430
Pearson-Fuhrhop K, Kleim J, Cramer S (2009) Brain Plasticity and Genetic Factors.
Top Stroke Rehabil 16:282–299
Teng H, Teng K, Lee R, Wright S, Tevar S, Almeida R, Kermani P, Torkin R, Chen Z,
Lee F, Kraemer R, Nykjaer A, Hempstead B (2005) ProBDNF Induces
Neuronal Apoptosis via Activation of a Receptor Complex of p75NTR and
Sortilin. The Journal of Neuroscience 22: 5455–5463
Remenyi J, Hunter CJ, Cole C, Ando H, Impey S, Monk CE, Martin KJ, Barton GJ,
Hutvagner G, Arthur JS (2010) Regulation of the miR-212/132 locus by MSK1
and CREB in response to neurotrophins. The Biochemical Journal 428:281-91.
Rico B, Xu B, Reichardt LF (2002) TrkB receptor signaling is required for
establishment of GABAergic synapses in the cerebellum. Nature Neuroscience
3:225-33
Rodriguez-Tebar A, Dechant G, Barde Y (1990) Binding of brain-derived neurotrophic
factor to the nerve growth factor receptor. Neuron 4:4487-492

88
Roth TL, Lubin FD, Funk AJ, Sweatt JD (2009) Lasting epigenetic influence of early-
life adversity on the BDNF gene. Biological Psychiatry 65:760-769
Russo-Neustadt AA, Chen MJ (2005) Brain-derived neurotrophic factor and
antidepressant activity. Current Pharmaceutical Design. 11:495-510.
Sanchez AL, Matthews BJ, Meynard MM, Hu B, Javed S, Cohen Cory S (2006) BDNF
increases synapse density in dendrites of developing tectal neurons in vivo.
Development 133:2477-86
Saarelainen T, Hendolin P, Lucas G, Koponen E, Sairanen M, MacDonald E, Agerman
K, Haapasalo A, Nawa H, Aloyz R, Ernfors P, Castrén E (2003) Activation of
the TrkB neurotrophin receptor is induced by antidepressant drugs and is
required for antidepressant-induced behavioral effects. The Journal of
Neuroscience 23:349-57.
Schratt G, Tuebing F, Nigh E, Kane C, Sabatini M, Kiebler M, Greenberg M (2006) A
brain-specific microRNA regulates dendritic spine development. Nature
439:283-289
Sapolsky RM (2003) Stress and plasticity in the limbic system. Neurochemical
Research 28:1735-42.
Saus E, Soria V, Escaramís G, Vivarelli F, Crespo JM, Kagerbauer B, Menchón JM,
Urretavizcaya M, Gratacòs M, Estivill X (2010) Genetic variants and abnormal
processing of pre-miR-182, a circadian clock modulator, in major depression
patients with late insomnia. Human Molecular Genetetics 19:4017-4025
Shen W, Wu B, Zhang Z, Dou Y, Rao ZR, Chen YR, Duan S (2006) Activity-induced
rapid synaptic maturation mediated by presynaptic cdc42 signaling. Neuron
50:401-14

89
Smalheiser NR, Lugli G, Rizavi HS, Torvik VI, Turecki G, Dwivedi Y (2012)
MicroRNA expression is down-regulated and reorganized in prefrontal cortex
of depressed suicide subjects. PLoS One 7:33201
Shimada A, Mason A, Morrison M (1998) TrkB Signaling Modulates Spine Density
and Morphology Independent of Dendrite Structure in Cultured Neonatal
Purkinje Cells. The Journal of Neuroscience 18:8559-8570
Sorra KE, Harris KM (2000) Overview on the structure, composition, function,
development, and plasticity of hippocampal dendritic spines. Hippocampus
10:501-511
Sperow M, Berry RB, Bayazitov IT, Zhu G, Baker SJ, Zakharenko SS (2012)
Phosphatase and tensin homologue (PTEN) regulates synaptic plasticity
independently of its effect on neuronal morphology and migration. The Journal
of Physiology 590: 777-92
Tettamanti G, Cattaneo AG, Gornati R, de Eguileor M, Bernardini G, Binelli G. (2010)
Phylogenesis of brain-derived neurotrophic factor (BDNF) in vertebrates. Gene
450: 85-93
Timmusk T, Palm K, Metsis M, Reintam T, Paalme V, Saarma M, Persson H (1993)
Multiple promoters direct tissue-specific expression of the rat BDNF gene.
Neuron 10: 475-89
Tongiorgi E, Domenici L, Simonato M (2006) What is the biological significance of
BDNF mRNA targeting in the dendrites? Clues from epilepsy and cortical
development. Molecular Neurobiology 33:17-32
Tongiorgi E, Baj G (2008) Functions and mechanisms of BDNF mRNA trafficking.
Novartis Foundation Symposium 289:136-47
90
Tsankova NM, Berton O, Renthal W, Kumar A, Neve RL, Nestler EJ (2006) Sustained
hippocampal chromatin regulation in a mouse model of depression and
antidepressant action. Nature Neuroscience 9:519-25
Tyler W, Pozzo-Miller L (2001) BDNF Enhances Quantal Neurotransmitter Release
and Increases the Number of Docked Vesicles at the Active Zones of
Hippocampal Excitatory. Synapses Journal of Neuroscience 21:4249–4258
Ubhi K, Inglis C, Mante M, Patrick C, Adame A, Spencer B, Rockenstein E, May V,
Winkler J, Masliah E (2012) Fluoxetine ameliorates behavioral and
neuropathological deficits in a transgenic model mouse of α-synucleinopathy.
Experimental Neurology 234:405-416
Ullrich A, Schlessinger J (1990) Signal transduction by receptors with tyrosine kinase
activity. Cell 61:203-12
Vo N, Klein ME, Varlamova O, Keller DM, Yamamoto T, Goodman RH, Impey S
(2005) A cAMP-response element binding protein-induced microRNA
regulates neuronal morphogenesis. Proceedings of the National Academy of
Sciences of the United States of America 102:16426-16431
White RE, Giffard RG (2012) MicroRNA-320 induces neurite outgrowth by targeting
ARPP-1. Neuroreport 23:590-595
Wu YJ, Krüttgen A, Möller JC, Shine D, Chan JR, Shooter EM, Cosgaya JM (2004)
Nerve growth factor, brain-derived neurotrophic factor, and neurotrophin-3 are
sorted to dense-core vesicles and released via the regulated pathway in primary
rat cortical neurons. Journal of Neuroscience Research 75:825-34
Wu GY, Zou DJ, Rajan I, Cline H (199) Dendritic dynamics in vivo change during
neuronal maturation. The Journal of Neuroscience 19:4472-83

91
Xu H, Luo C, Richardson JS, Li XM. (2004) Recovery of hippocampal cell
proliferation and BDNF levels, both of which are reduced by repeated restraint
stress, is accelerated by chronic venlafaxine. Pharmacogenomics 4:322-331.
Yang H, Kong W, He L, Zhao JJ, O'Donnell JD, Wang J, Wenham RM, Coppola D,
Kruk PA, Nicosia SV, Cheng JQ (2008) MicroRNA expression profiling in
human ovarian cancer: miR-214 induces cell survival and cisplatin resistance
by targeting PTEN. Cancer Research 68:425-33
Ying SY, Chang DC, Miller JD, Lin SL (2006) The microRNA: overview of the RNA
gene that modulates gene functions. Methods in Molecular Biology 342:1-18.
Yuan XB, Jin M, Xu X, Song YQ, Wu CP, Poo MM, Duan S (2003) Signalling and
crosstalk of Rho GTPases in mediating axon guidance. Nature Cell Biology 5:
38-45
Zhang J, Zhang J, Liu LH, Zhou Y, Li YP, Shao ZH, Wu YJ, Li MJ, Fan YY, Shi HJ. (
2001) Effects of miR-541 on neurite outgrowth during neuronal differentiation.
Cell Biochemistry and Function 29:279-86
Zhong Z, Dong Z, Yang L, Gong Z (2012) miR-21 induces cell cycle at S phase and
modulates cell proliferation by down-regulating hMSH2 in lung cancer.
Journal of Cancer Research and Clinical Oncology
Zhou R, Yuan P, Wang Y, Hunsberger JG, Elkahloun A, Wei Y, Damschroder-
Williams P, Du J, Chen G, Manji HK (2009) Evidence for selective
microRNAs and their effectors as common long-term targets for the actions of
mood stabilizers. Neuropsychopharmacology 34:1395-405