Embed Size (px)
Citation preview

March 2013
2012 Annual Results
Presentation
Disclaimer
2
Forward-Looking Statements
This presentation contains certain forward-looking statements with respect to the financial condition, results of operations and business of Lianhua Supermarket, the chain retailing industry in the PRC and certain of the plans and objectives of the management of Lianhua Supermarket. Such forward-looking statements involve known and unknown risks, uncertainties and other factors which may cause the actual results or performance of Lianhua Supermarket to be materially different from any future results or performance expressed or implied by such forward-looking statements. Such forward-looking statements were based on the assumptions regarding Lianhua Supermarket’s present and future business strategies and the political and economic environment in which Lianhua Supermarket and its subsidiaries will operate in the future. Reliance should not be placed on these forward-looking statements, which reflect the view of Lianhua Supermarket’s management as of the date of this presentation only.
Agenda
3
3
2
1 Market Overview
2 Financial Review
3 Business Review
4 Business Strategy
5 Q & A

Market Overview
Growth of Disposable Income of Urban Residents
5
Market Overview
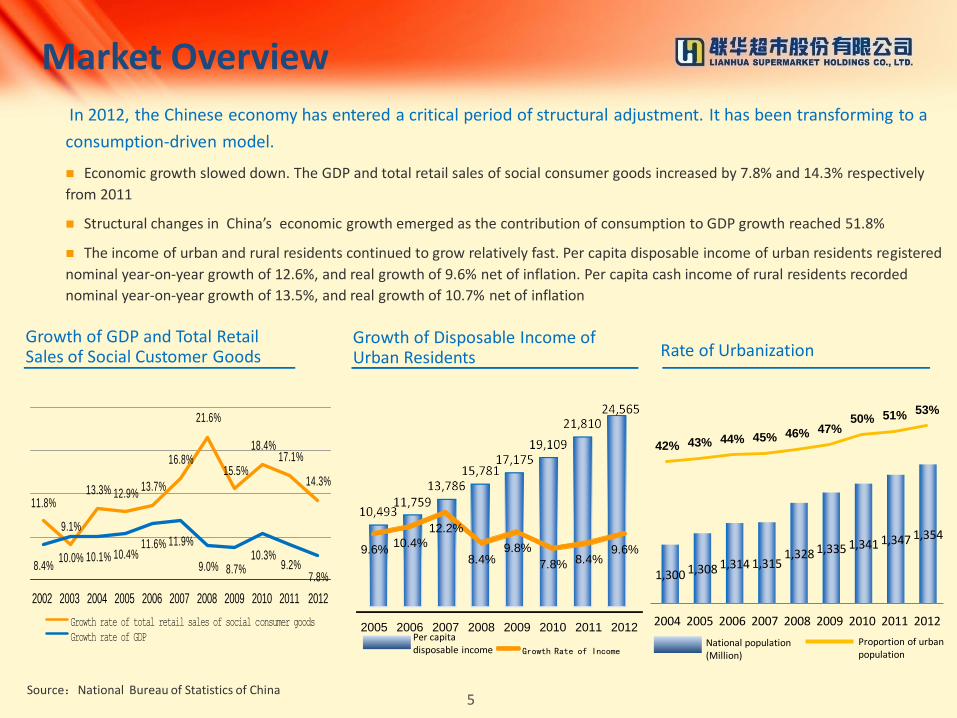
In 2012, the Chinese economy has entered a critical period of structural adjustment. It has been transforming to a
consumption-driven model.
Economic growth slowed down. The GDP and total retail sales of social consumer goods increased by 7.8% and 14.3% respectively
from 2011
Structural changes in China’s economic growth emerged as the contribution of consumption to GDP growth reached 51.8%
The income of urban and rural residents continued to grow relatively fast. Per capita disposable income of urban residents registered
nominal year-on-year growth of 12.6%, and real growth of 9.6% net of inflation. Per capita cash income of rural residents recorded
nominal year-on-year growth of 13.5%, and real growth of 10.7% net of inflation
Per capita disposable income
Growth of GDP and Total Retail Sales of Social Customer Goods Rate of Urbanization
National population (Million)
Proportion of urban population
1,300 1,308 1,314 1,315 1,328 1,335 1,341 1,347 1,354
42% 43% 44% 45% 46% 47% 50% 51% 53%
2004 2005 2006 2007 2008 2009 2010 2011 2012
11.8%
9.1%
13.3% 12.9%13.7%
16.8%
21.6%
15.5%
18.4%17.1%
14.3%
8.4%10.0% 10.1% 10.4%
11.6% 11.9%
9.0% 8.7%10.3%
9.2%7.8%
2002 2003 2004 2005 2006 2007 2008 2009 2010 2011 2012
Growth rate of total retail sales of social consumer goods
Growth rate of GDP
Source:National Bureau of Statistics of China
9.6% 10.4%
12.2%
8.4% 9.8%
7.8% 8.4% 9.6%
2005 2006 2007 2008 2009 2010 2011 2012
Growth Rate of Income
0%
5%
10%
15%
20%
25%
Consumer Price Index
6
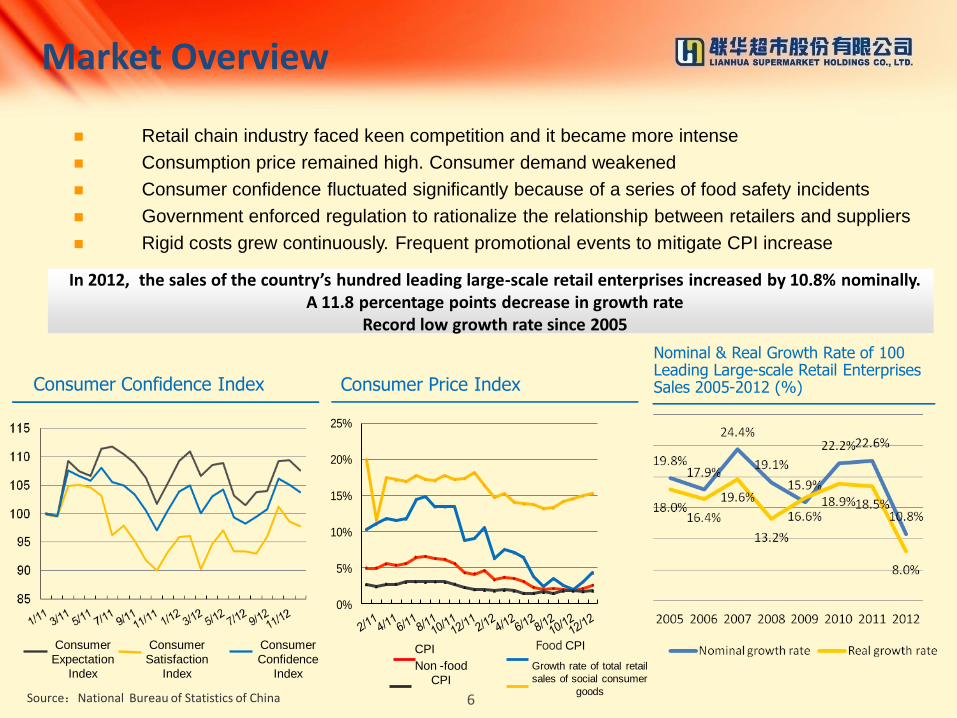
Retail chain industry faced keen competition and it became more intense
Consumption price remained high. Consumer demand weakened
Consumer confidence fluctuated significantly because of a series of food safety incidents
Government enforced regulation to rationalize the relationship between retailers and suppliers
Rigid costs grew continuously. Frequent promotional events to mitigate CPI increase
Nominal & Real Growth Rate of 100 Leading Large-scale Retail Enterprises Sales 2005-2012 (%)
Market Overview
Non -food
CPI
Food CPI
Growth rate of total retail
sales of social consumer
goods
CPI
Source:National Bureau of Statistics of China
Consumer
Expectation
Index
Consumer
Satisfaction
Index
Consumer
Confidence
Index
Consumer Confidence Index
In 2012, the sales of the country’s hundred leading large-scale retail enterprises increased by 10.8% nominally. A 11.8 percentage points decrease in growth rate
Record low growth rate since 2005

Financial Review
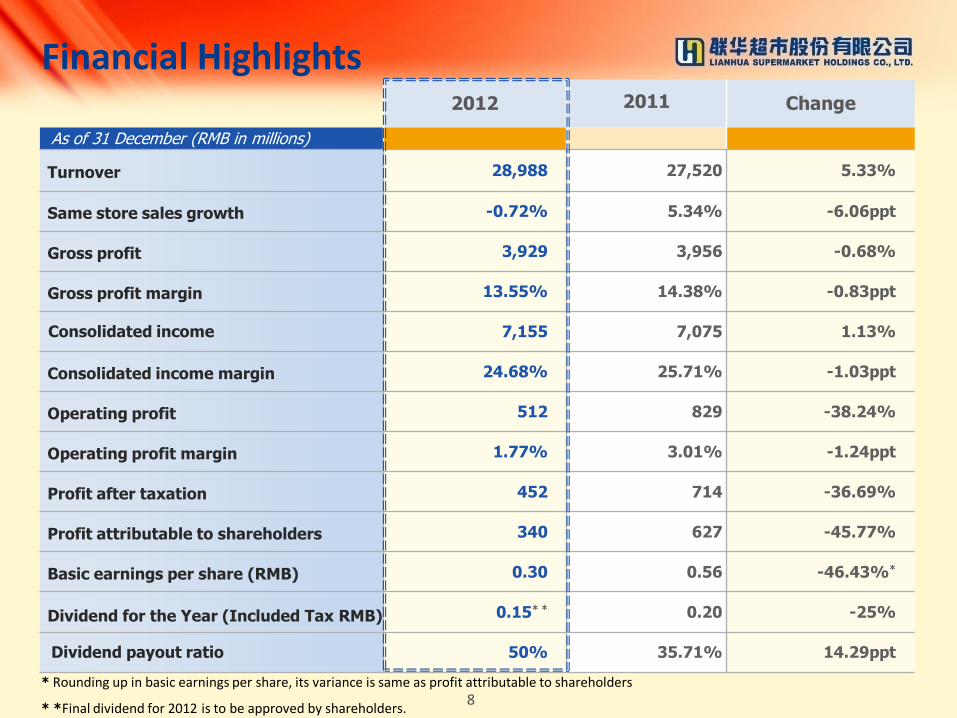
2012 2011 Change
As of 31 December (RMB in millions)
Turnover 28,988 27,520 5.33%
Same store sales growth -0.72% 5.34% -6.06ppt
Gross profit 3,929 3,956 -0.68%
Gross profit margin 13.55% 14.38% -0.83ppt
Consolidated income 7,155 7,075 1.13%
Consolidated income margin 24.68% 25.71% -1.03ppt
Operating profit 512 829 -38.24%
Operating profit margin 1.77% 3.01% -1.24ppt
Profit after taxation 452 714 -36.69%
Profit attributable to shareholders 340 627 -45.77%
Basic earnings per share (RMB) 0.30 0.56 -46.43%*
Dividend for the Year (Included Tax RMB) 0.15* * 0.20 -25%
Dividend payout ratio 50% 35.71% 14.29ppt
Financial Highlights
8 * Rounding up in basic earnings per share, its variance is same as profit attributable to shareholders
* *Final dividend for 2012 is to be approved by shareholders.
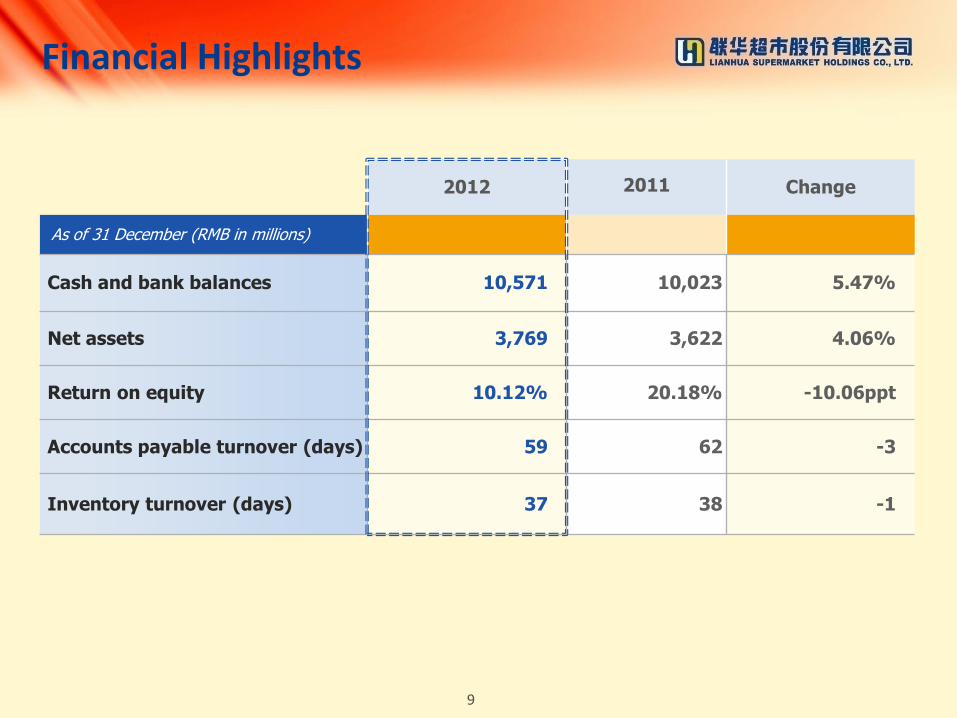
2012 2011 Change
As of 31 December (RMB in millions)
Cash and bank balances 10,571 10,023 5.47%
Net assets 3,769 3,622 4.06%
Return on equity 10.12% 20.18% -10.06ppt
Accounts payable turnover (days) 59 62 -3
Inventory turnover (days) 37 38 -1
Financial Highlights
9
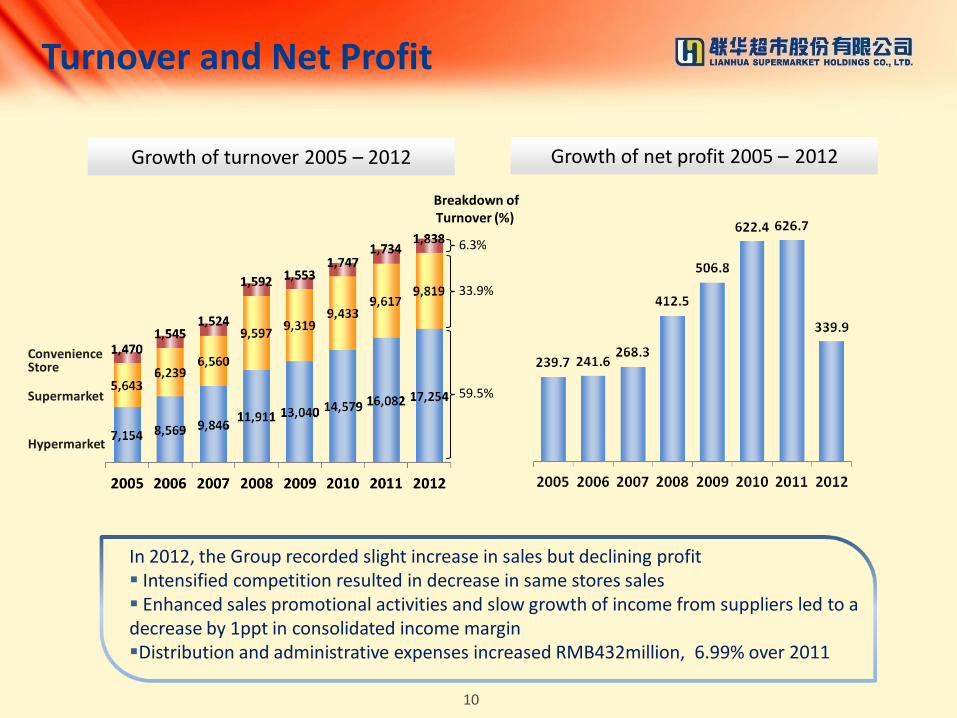
Growth of turnover 2005 – 2012
59.5%
6.3%
33.9%
Turnover and Net Profit
10
Growth of net profit 2005 – 2012
In 2012, the Group recorded slight increase in sales but declining profit Intensified competition resulted in decrease in same stores sales Enhanced sales promotional activities and slow growth of income from suppliers led to a decrease by 1ppt in consolidated income margin Distribution and administrative expenses increased RMB432million, 6.99% over 2011
Convenience Store
Supermarket
Hypermarket
Breakdown of Turnover (%)
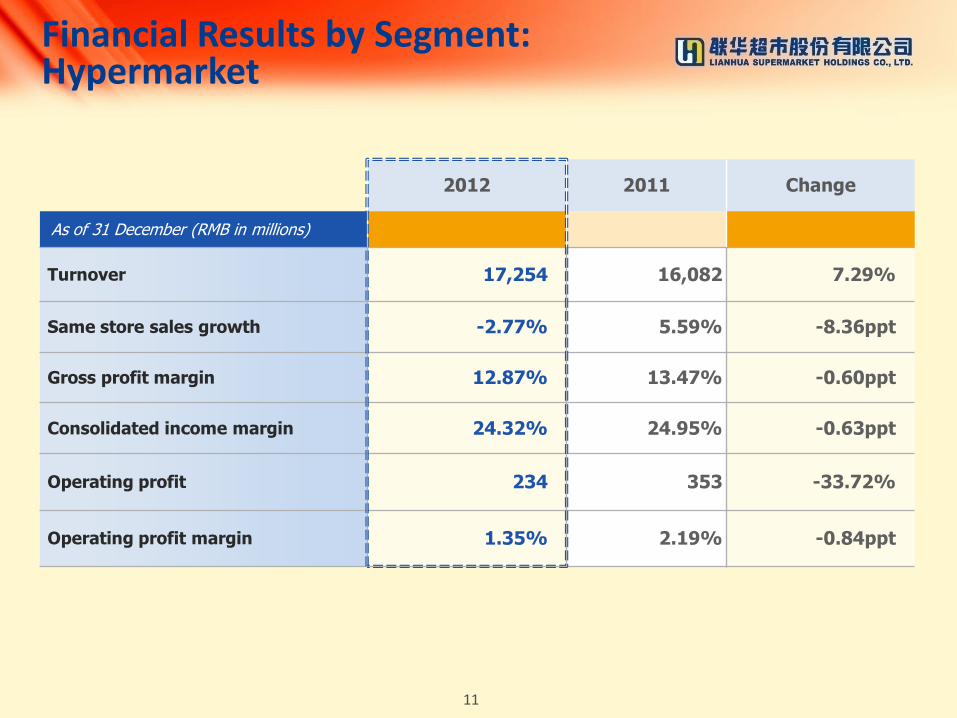
2012 2011 Change
As of 31 December (RMB in millions)
Turnover 17,254 16,082 7.29%
Same store sales growth -2.77% 5.59% -8.36ppt
Gross profit margin 12.87% 13.47% -0.60ppt
Consolidated income margin 24.32% 24.95% -0.63ppt
Operating profit 234 353 -33.72%
Operating profit margin 1.35% 2.19% -0.84ppt
Financial Results by Segment: Hypermarket
11
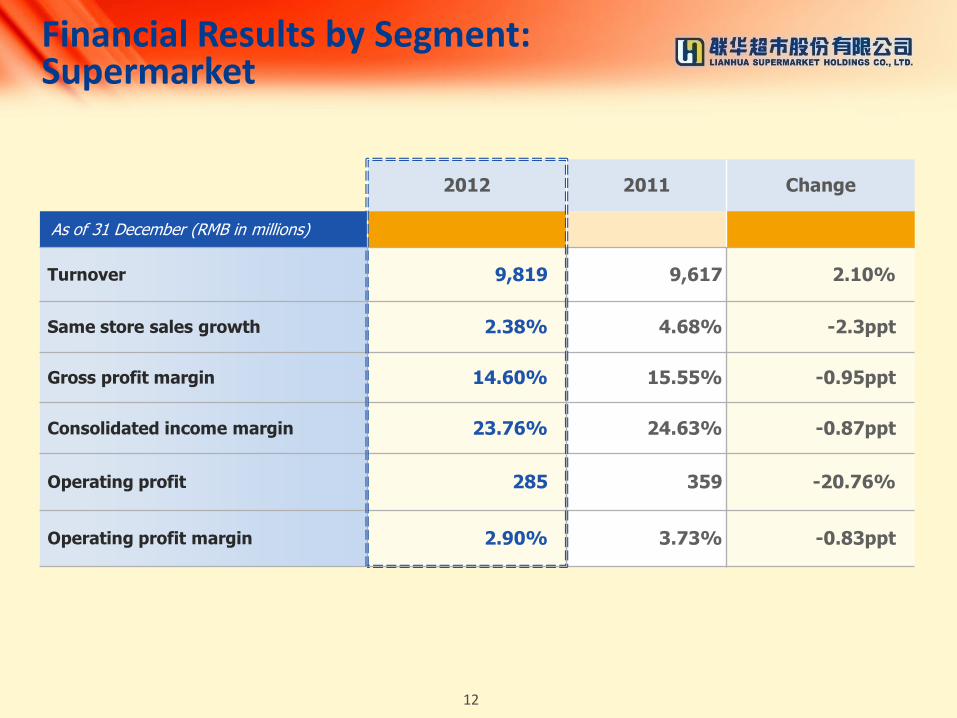
2012 2011 Change
As of 31 December (RMB in millions)
Turnover 9,819 9,617 2.10%
Same store sales growth 2.38% 4.68% -2.3ppt
Gross profit margin 14.60% 15.55% -0.95ppt
Consolidated income margin 23.76% 24.63% -0.87ppt
Operating profit 285 359 -20.76%
Operating profit margin 2.90% 3.73% -0.83ppt
Financial Results by Segment: Supermarket
12
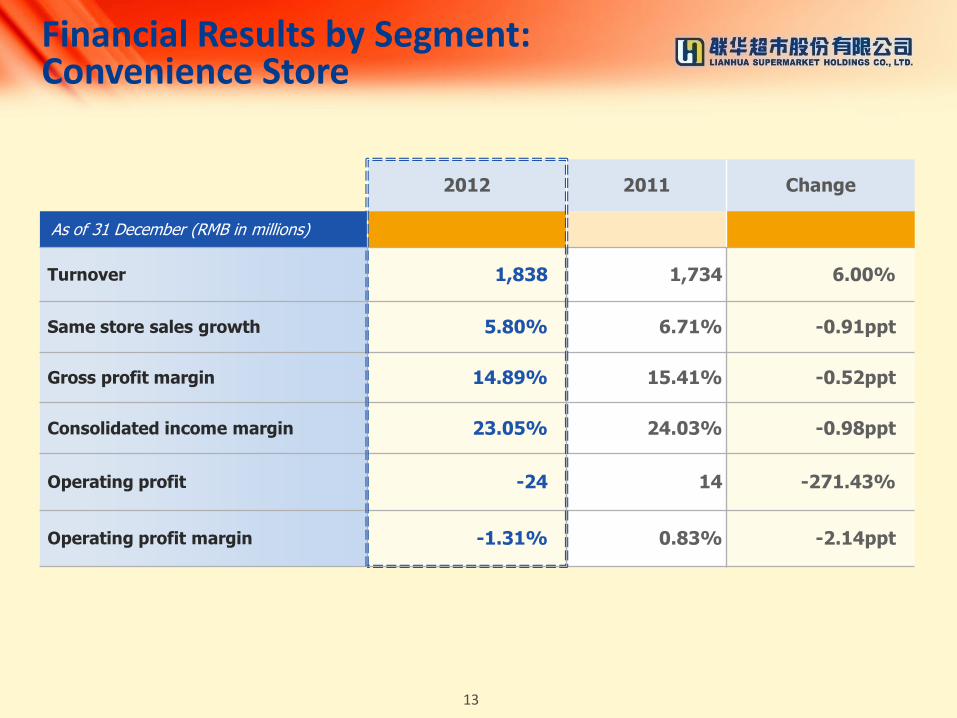
2012 2011 Change
As of 31 December (RMB in millions)
Turnover 1,838 1,734 6.00%
Same store sales growth 5.80% 6.71% -0.91ppt
Gross profit margin 14.89% 15.41% -0.52ppt
Consolidated income margin 23.05% 24.03% -0.98ppt
Operating profit -24 14 -271.43%
Operating profit margin -1.31% 0.83% -2.14ppt
Financial Results by Segment: Convenience Store
13
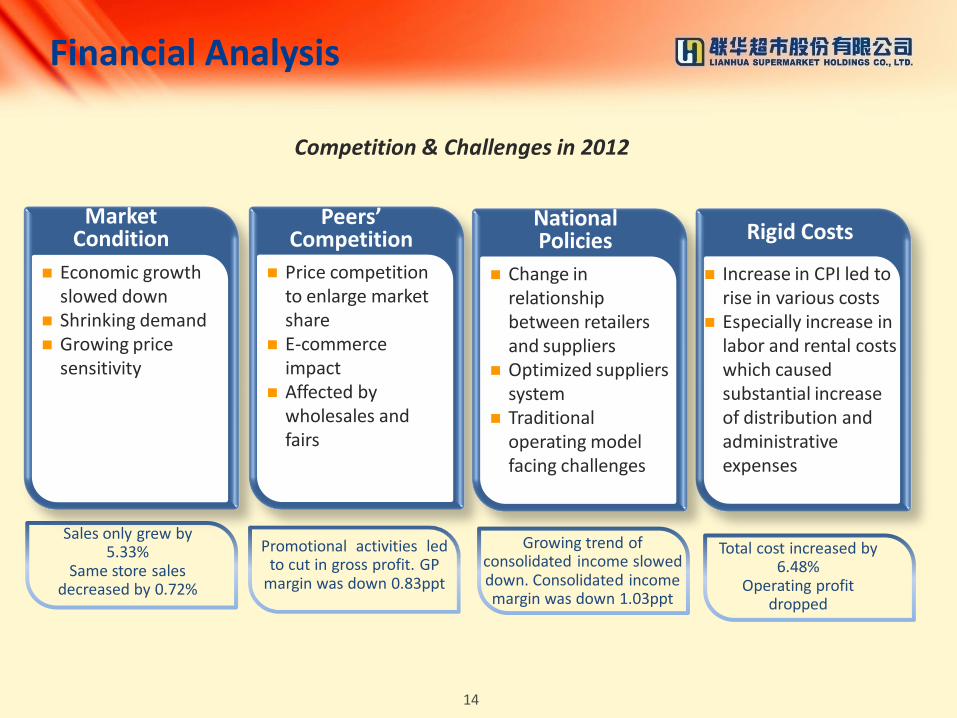
Competition & Challenges in 2012
经济增速放缓
市场需求萎缩
价格敏感上升
添加内容
Market Condition
Rigid Costs
Price competition to enlarge market share
E-commerce impact
Affected by wholesales and fairs
Economic growth slowed down
Shrinking demand Growing price
sensitivity
Change in relationship between retailers and suppliers
Optimized suppliers system
Traditional operating model facing challenges
Increase in CPI led to rise in various costs
Especially increase in labor and rental costs which caused substantial increase of distribution and administrative expenses
Financial Analysis
Sales only grew by 5.33%
Same store sales decreased by 0.72%
Promotional activities led to cut in gross profit. GP
margin was down 0.83ppt
Growing trend of consolidated income slowed down. Consolidated income margin was down 1.03ppt
Total cost increased by 6.48%
Operating profit dropped
14
Peers’ Competition
National Policies

Business Review
16
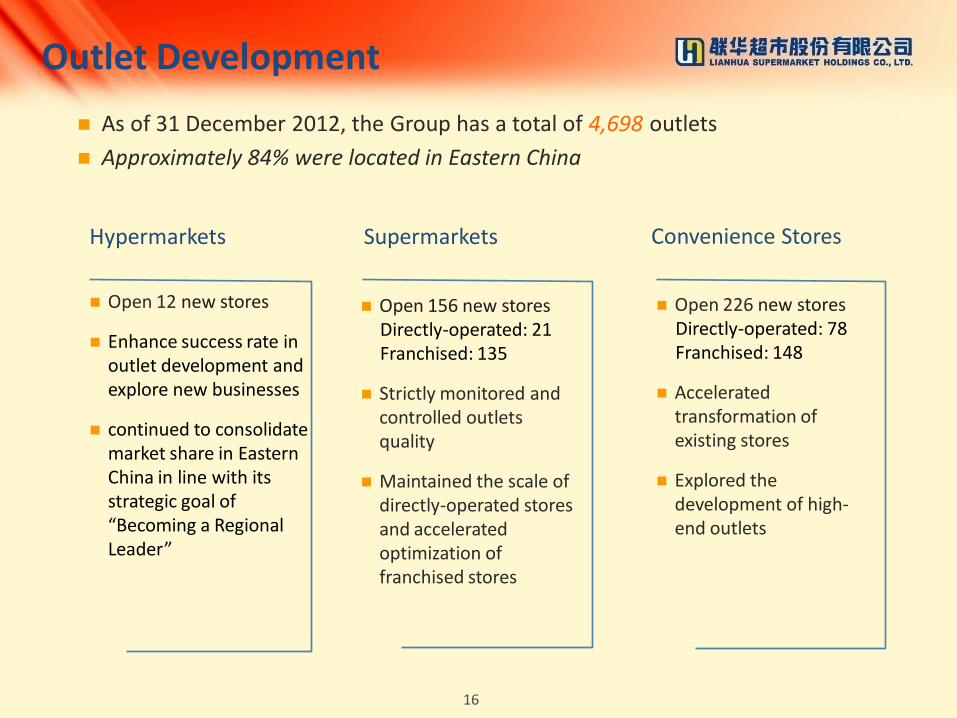
Open 12 new stores
Enhance success rate in outlet development and explore new businesses
continued to consolidate market share in Eastern China in line with its strategic goal of “Becoming a Regional Leader”
Open 226 new stores Directly-operated: 78 Franchised: 148
Accelerated transformation of existing stores
Explored the development of high- end outlets
As of 31 December 2012, the Group has a total of 4,698 outlets
Approximately 84% were located in Eastern China
Outlet Development
Convenience Stores
Open 156 new stores Directly-operated: 21 Franchised: 135
Strictly monitored and controlled outlets quality
Maintained the scale of directly-operated stores and accelerated optimization of franchised stores
Hypermarkets Supermarkets
Outlets Development
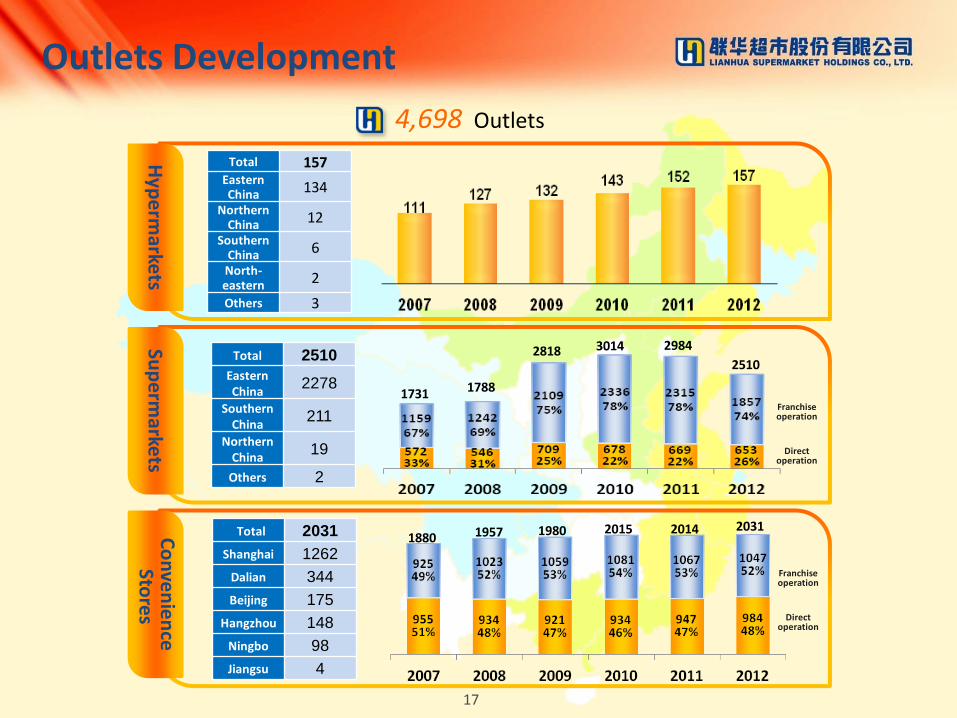
4,698 Outlets
1731 1788
2818 3014 2984
2510
1980 2015 2014 2031 1957 1880
Total 157 Eastern China 134
Northern China 12
Southern China 6
North-eastern 2
Others 3
Hyp
erm
arkets
Total 2510
Eastern China
2278
Southern China
211
Northern China
19
Others 2
Sup
erm
arkets
Co
nve
nie
nce
Sto
res
Total 2031
Shanghai 1262
Dalian 344
Beijing 175
Hangzhou 148
Ningbo 98
Jiangsu 4
Franchise operation
Direct operation
Franchise operation
Direct operation
17
Outlet Development
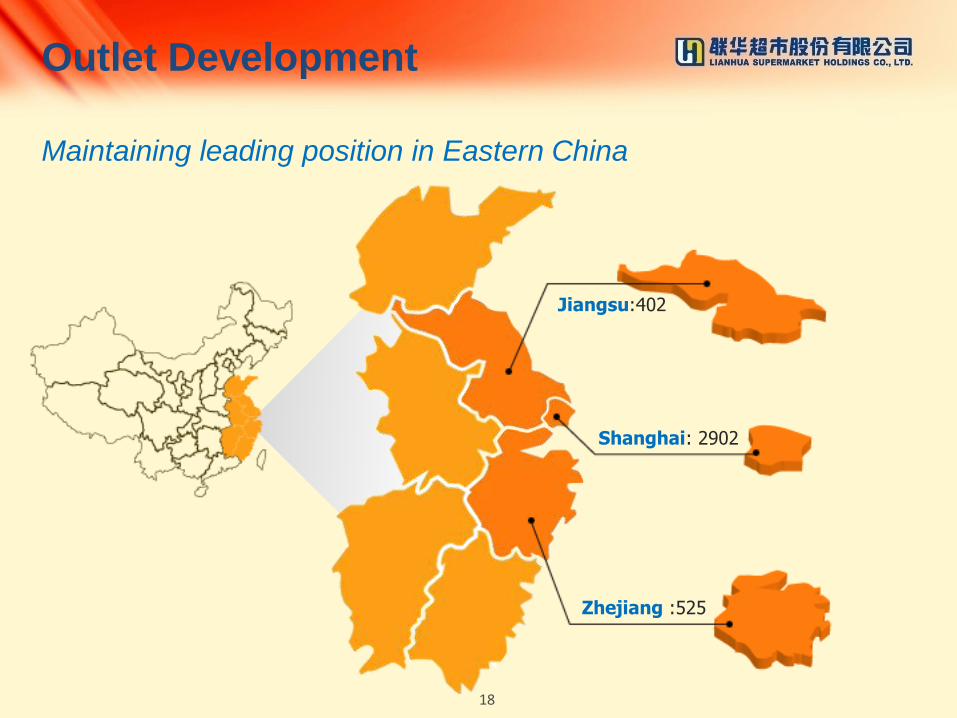
Shanghai: 2902
Jiangsu:402
Zhejiang :525
Maintaining leading position in Eastern China
18
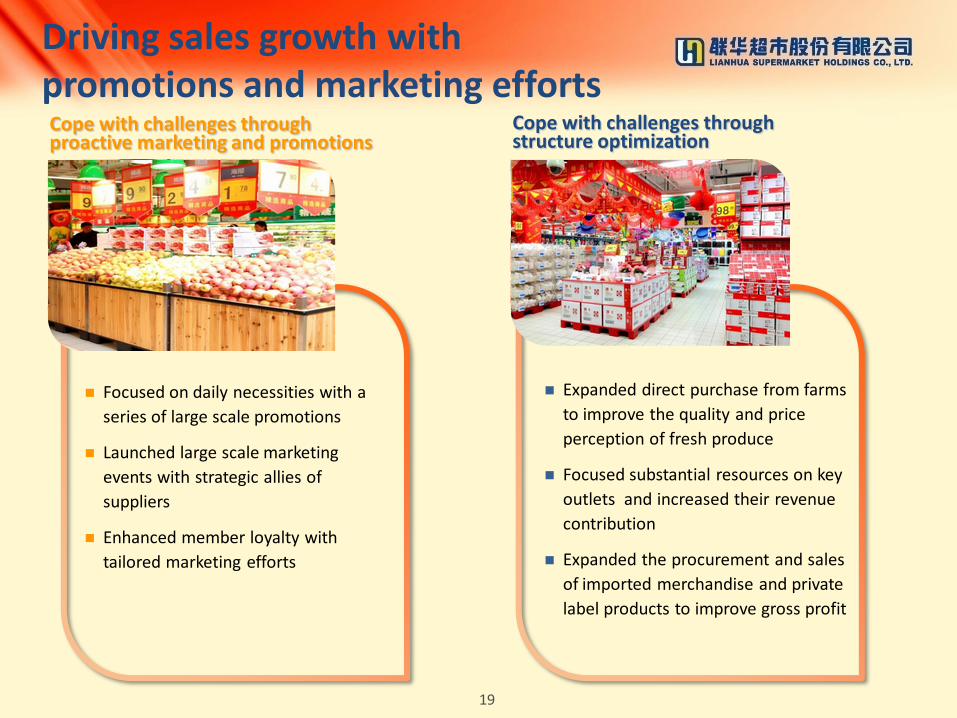
Cope with challenges through structure optimization
Driving sales growth with promotions and marketing efforts
Focused on daily necessities with a
series of large scale promotions
Launched large scale marketing
events with strategic allies of
suppliers
Enhanced member loyalty with
tailored marketing efforts
Cope with challenges through proactive marketing and promotions
Expanded direct purchase from farms
to improve the quality and price
perception of fresh produce
Focused substantial resources on key
outlets and increased their revenue
contribution
Expanded the procurement and sales
of imported merchandise and private
label products to improve gross profit
19

Cope with challenges through innovation
Exploring synergies of online and
offline business in E-commerce
Positive feedbacks on four newly
opened "Sakura Kobo“ cosmeceutical
stores
Completed the roof of main structure
of Jiangqiao logistics center and
launched new fresh produce
processing and distribution center in
Zhejiang Province
Strengthening competitiveness through innovation
Trials of large scale hypermarket outlets offering more functions to customers
Tightened the management of franchised supermarkets and opened more high-end convenient stores
Upgraded membership system and improved information analysis abilities-making progress on membership system construction
Cope with challenges through transformation
20
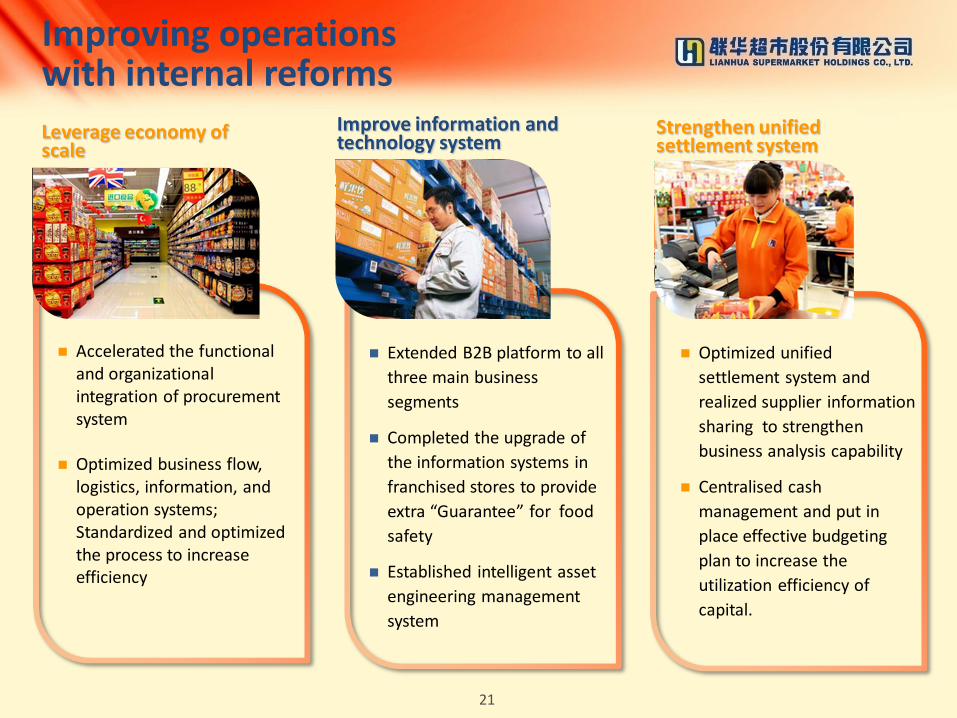
Improve information and technology system
Extended B2B platform to all
three main business
segments
Completed the upgrade of
the information systems in
franchised stores to provide
extra “Guarantee” for food
safety
Established intelligent asset
engineering management
system
Optimized unified
settlement system and
realized supplier information
sharing to strengthen
business analysis capability
Centralised cash
management and put in
place effective budgeting
plan to increase the
utilization efficiency of
capital.
Improving operations with internal reforms
Accelerated the functional and organizational integration of procurement system
Optimized business flow,
logistics, information, and operation systems; Standardized and optimized the process to increase efficiency
Leverage economy of scale
Strengthen unified settlement system
21
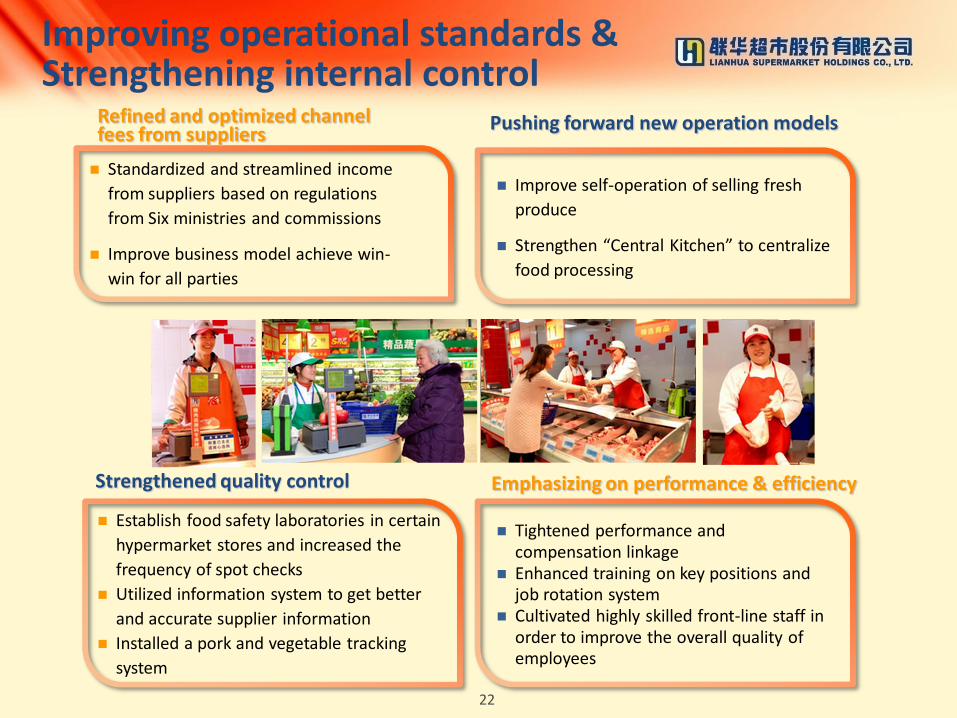
Improving operational standards & Strengthening internal control
Refined and optimized channel fees from suppliers
Improve self-operation of selling fresh
produce
Strengthen “Central Kitchen” to centralize
food processing
Pushing forward new operation models
Establish food safety laboratories in certain
hypermarket stores and increased the
frequency of spot checks
Utilized information system to get better
and accurate supplier information
Installed a pork and vegetable tracking
system
Strengthened quality control Emphasizing on performance & efficiency
22
Standardized and streamlined income
from suppliers based on regulations
from Six ministries and commissions
Improve business model achieve win-
win for all parties
Tightened performance and compensation linkage
Enhanced training on key positions and job rotation system
Cultivated highly skilled front-line staff in order to improve the overall quality of employees

Business Strategy
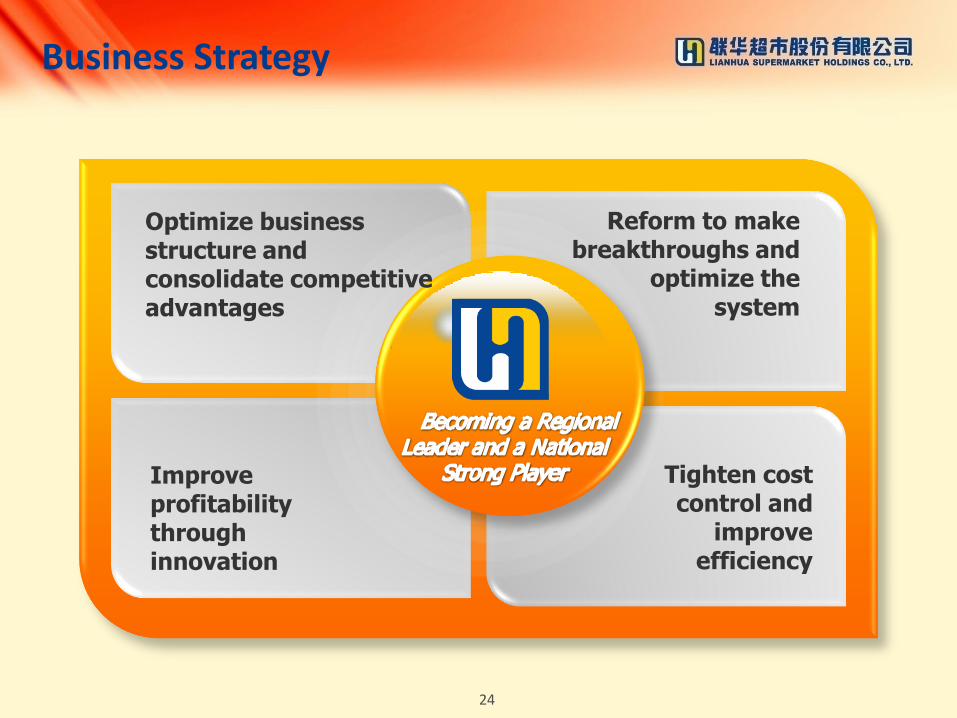
Business Strategy
Improve profitability through innovation
Optimize business structure and consolidate competitive advantages
Reform to make breakthroughs and
optimize the system
Tighten cost
control and improve
efficiency
24
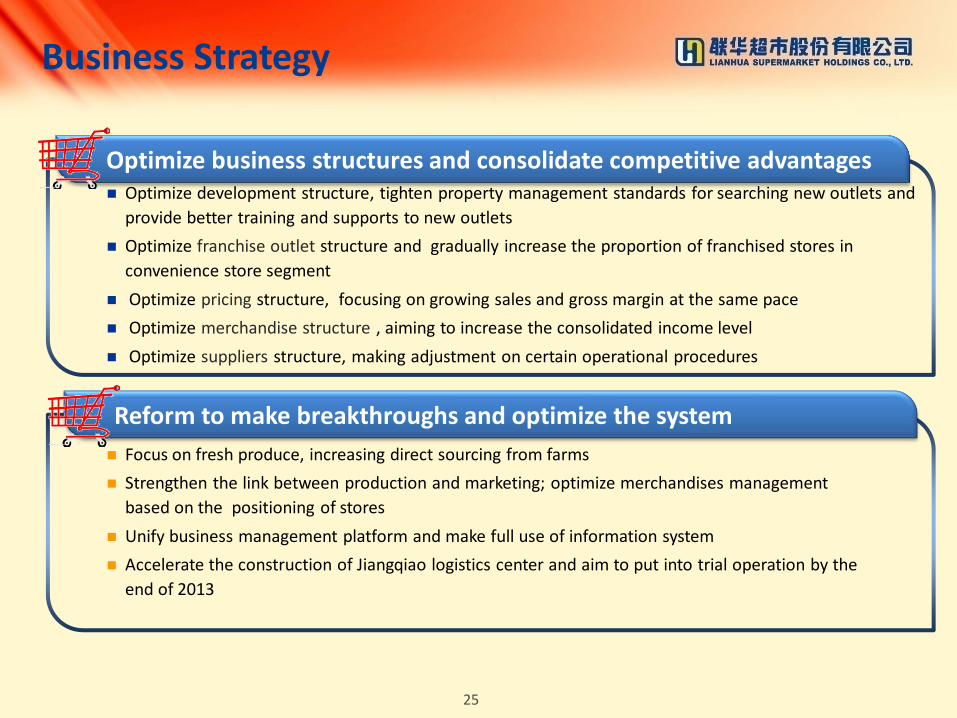
Optimize development structure, tighten property management standards for searching new outlets and
provide better training and supports to new outlets
Optimize franchise outlet structure and gradually increase the proportion of franchised stores in
convenience store segment
Optimize pricing structure, focusing on growing sales and gross margin at the same pace
Optimize merchandise structure , aiming to increase the consolidated income level
Optimize suppliers structure, making adjustment on certain operational procedures
Business Strategy
25
Optimize business structures and consolidate competitive advantages
Focus on fresh produce, increasing direct sourcing from farms
Strengthen the link between production and marketing; optimize merchandises management
based on the positioning of stores
Unify business management platform and make full use of information system
Accelerate the construction of Jiangqiao logistics center and aim to put into trial operation by the
end of 2013
Reform to make breakthroughs and optimize the system

Focus on boosting sales, improve profit model and optimize profit stream
Change management philosophy, clarify strategies for different merchandise, focus on sales
increase of core merchandise categories and items
Continue to expand members and improve the comprehensiveness of the database, enhancing
marketing campaign targeting members
Push forward the development of new business and create synergies with existing segments
Business Strategy
26
Improve profitability through innovation
Lower management costs by structure optimization and providing better services to frontline
Optimize workflow and strictly control expenses
Improve cash management by leveraging the centralized cash management
Tighten cost control and improve efficiency

Q & A

Thank you!