Embed Size (px)
Citation preview
ThePlymouth Rock
Company
2012 Annual Report2014 Annual Report2020
1
The Plymouth Rock Company 695 Atlantic Avenue
Boston, Massachusetts 02111
Chairman’s Letter
February 8, 2021
To Our Shareholders:
The year just ended, 2020, will be likely remembered as the Year of the Covid Pandemic, though for now I prefer to call it the Year from Hell. As if the virus wasn’t enough, it was also the year of an American presidential election that brought to the fore deeply fundamental concerns about our democracy. To mangle a phrase from Charles Dickens, these have been the worst of times and nothing like the best of times. The world, the country, the economy, and many, many individuals shared the year’s pain. Only the most elderly still among us, those who endured the Great Depression and World War II, have lived through a time more frightening and tragic. This was a disappointing year for Plymouth Rock as well, though our wounds were largely self-inflicted. Income for the entire enterprise before unrealized gains on common stock investments was up 44%, from $126 million in 2019 to $181 million. Our enterprise’s fully consolidated comprehensive income, though, reflecting unrealized equity performance as well as the more narrowly defined income, was down dramatically - from $341 million the prior year to $117 million. The yawning gap in comprehensive income from year to year highlights the distinction between a truly spectacular year for our stock portfolio and a markedly substandard year. While I warned in last year’s letter that the felicitous 2019 results were unlikely to be repeated any time soon, I did not anticipate so striking a retreat. At the same time, we can thank our lucky stars that we are not a restaurant, a movie theatre, or a gym. After netting all the various offsetting vectors, our business in 2020 had a year shy of its long-term goals but by no means disastrously so.
The performance numbers cited above apply to our enterprise as a whole, combining the results for premium we underwrite, and backed by your capital, with the premium we manage, backed by policyholders’ capital. Looking more narrowly at the stockholder-owned companies, you can see that net income before considering the changes in unrealized gains was $132 million, slightly better than what was earned a year earlier. Because of our poor stock market performance, though, 2020 comprehensive income for the shareholders, reflecting the unrealized equity portfolio results, was only $108 million, a full $100 million less than in the prior year. The reciprocal group we manage did less well. It recorded $49 million in net income before changes in equity values and only $9 million in 2020 comprehensive income. Book equity for our shareholders rose during the year by $48 million. This measure, of course, understates the true economic gain by the amount of the dividends that were paid out to you, and it also excludes changes in the appraised value of our real estate holdings. The latter of these items ran negative in 2020, although because our real estate portfolio was in flux and Covid created unparalleled rental uncertainties, we did not seek appraisal numbers for all of the properties. With an educated estimate of the drag from real estate, we view the economic return for 2020 as having been 10.4%. As I repeat often, I see the acceptable shareholder return corridor for any normal year as bounded on the weak side by 10% and on the
2
strong side by 20%. This last year’s results came in just over the lower borderline. But don’t be too downhearted. The 36-year compounded annual rate of return on shareholder book value, including both retained earnings and dividends but without benefit of unrealized real estate gains, is still over 18%, and there is little reason to fear that the difficulties faced in 2020 portend a long-term drought. Growth of our enterprise was a major factor in producing the disappointing results, and its damage should be containable over time. The scale of the Plymouth Rock Group, as measured by direct underwritten and managed premiums in force, is now approaching $1.7 billion. The largest of our Company’s three operating units is Mary Boyd’s Independent Agency Group. That group, responsible for that auto insurance channel in all six of the states in which we operate, also accounted for the lion’s share of our operating profits. Written premium for the Independent Agency Group rose by nearly 3% to over $840 million, with growth notched upward in five of our six states. The performance story, although favorable in the aggregate, was more varied than the volume tale. Put succinctly, profits were good in Massachusetts, modest in New Jersey, and minimal in Connecticut and New Hampshire. The bulk of the expansion was in New York and Pennsylvania, though, where all the ink was bright red. Without the benefit of reduced driving owing to the pandemic, of course, the results would have been worse in all six states. Since the pandemic influenced auto insurers like us everywhere, it is worthwhile to examine its broad impacts before looking more deeply at our specific performance by state. According to the U.S. Department of Transportation, miles driven by Americans in 2020 were down over 13% from 2019. In the Northeast region, the drop was only modestly steeper. It always seemed to me, when I experienced the traffic firsthand, that the decrease was steeper than that, but observational impressions can be misleading. While the attenuation in road mileage surely helped our results, the benefit was not a simple function of the mileage decrease. For one thing, we returned to our policyholders in forgone premium increases or refunds a good portion of the potential gain. An increase in the severity of accidents, due to higher driving speeds, swallowed another chunk of it. Among the causes of the severity bump was a relative decrease in the proportion of total mileage related to commuting activity, which tends to generate high-frequency, low-severity accident events. We expect there to be a directionally similar Covid impact on our industry’s 2021 results as well, at least for the first half of the year. Again, though, wherever rates are overall adequate, we expect to return in refunds or reflect in premium charges much of the otherwise available gain. Massachusetts this past year was our biggest and best-performing independent agency state. The combined ratio here in the Bay State, even Covid-adjusted, was securely in the mid-90’s, where it rightly belongs. When we compare ourselves to our Massachusetts independent agency channel peers in recent years, we look to be doing pretty well in both premium growth and loss ratio performance. We can thank our unusually strong product and claims teams for much of this success. Growth has been bolstered by our continuing excellence in customer service and by the marketing advantages of our sports franchise alliances. We have had productive arrangements with the Boston Bruins and the New England Patriots for some time. Mary signed up the Red Sox this past year, so we are now well fixed in this sports-loving region for all seasons of the year. Agents and customers alike enjoy the benefits these relationships provide, and the advertising exposure we get through visibly supporting our teams helps to attract future customers. Plymouth Rock’s Independent Agency exposure to New Hampshire and Connecticut risks remains comparatively meager. These two states together give us about $54 million in annual premium,
3
and both project relatively slow growth in 2021. Absent Covid, New Hampshire would have provided us a small profit on our automobile insurance book. Connecticut would have yet again handed us a small loss. After Massachusetts, the largest state for Plymouth Rock independent agents is New Jersey. The auto insurance results in the Garden State were not impressive. Our 2020 accident year loss ratio for Independent Agency business there was about half a dozen points higher than in Massachusetts. And approved premium rates are not keeping up with trends, so we are concerned that the situation will deteriorate before it improves. New Jersey has been good to us over the years, and we will work hard to strengthen our resources there and improve our communications with the regulatory authorities. Restoring New Jersey profitability in the post-Covid era ranks high on Mary’s task agenda for the coming year. While Massachusetts and New Jersey and the smaller states provide the Independent Agency Group with over 85% of its premium, it is the new jurisdictions, New York and Pennsylvania, that present the greatest trials. A fast start in New York boosted the Independent Agency Group’s written premium to almost $100 million in our two new states. Our Pinstripes Perks program with the New York Yankees probably helped. Both states, though, are losing us money and would have cost us much more without the year’s reduction in road mileage. While we anticipated that we would bear some monetary burdens of growth in our new geographies, it is clear in retrospect that we went into the two new jurisdictions with inadequacy in our rate levels, underwriting discipline, and claims handling resources. It will take time to repair the damage. Consequently, Hal Belodoff and I decided to slow down New York and Pennsylvania growth, constraining our scale somewhat until we have restored strong confidence in the adequacy of our premiums and solidity of our defenses against claims inflation. You should expect to see the wrong color of ink again in those two states during this new year, but hopefully a good bit less than you have seen so far. New York and Pennsylvania, with their large populations, still represent our most promising venues for future expansion on both the top and bottom lines. We trust that the Independent Agency Group’s issues are short-term in nature. The toughest long-term task in the Company may belong to Jeff Briglia, who is just finishing his first year as president of the Direct Group. Jeff’s long-horizon opportunities for triumphs, however, are as outsized as the challenges. Jeff has oversight responsibilities in two sub-channels, the Exclusive Agency business we have written in partnership with Prudential for seventeen years and the Direct Response book we have been building for over ten years now. The total premium written by the Direct Group now exceeds $535 million, 9% more than in the prior year. The Prudential business is anchored by a well-seasoned legacy book which is reliably profitable in both its automobile and homeowners components. Up to this time, the legacy book has remained healthy enough to help pay for the not-yet-accretive new auto volume from Pru agents as well as losses from our immature direct-to-the-consumer business. The legacy business, alas, naturally erodes by attrition over time and will eventually become a minor factor for us. As that book shrinks, it will be necessary for Jeff to turn the bottom line for new Prudential business positive and to earn money, rather than continue to expend it, on the emergent Direct Response book. Meanwhile, the Direct Response channel’s contribution to the volume has passed the $200 million mark.
This, of course, was not an ordinary year. The loss ratio for the Direct Response channel was satisfactory in 2020, but it is not clear that it would have been acceptable absent the Covid-driven reduction in driving mileage. Just as telling, we are concerned that the Direct Response business is not yet meeting a more critical economic test. The first-year cost of writing a policy in that
4
channel is always greater than the first-year revenue. The objective is to have profitable enough renewal years, and enough of those profitable renewal years, to cover the initial acquisition costs and provide a fair profit to boot. So far our Direct Response book of business has not demonstrated sufficient profitability in its renewal years, while its persistency would be inadequate to pay for its acquisition cost even with an adequate level of renewal profits. The tasks involved in finding Direct Response gold in the ore that’s out there include reduction of both acquisition and general expenses and a simultaneous boosting of average policy tenure. And all of this must be accomplished while keeping the loss ratio under control. Over the years, despite a dozen or more attempts, very few national companies have been able to realize this quest. USAA began the journey in 1922, with a more select audience than anyone else has ever been able to find. GEICO was founded by a USAA veteran in 1936, who saw the chance to expand the market beyond military officers while maintaining the concept of writing only for a pre-qualified audience. GEICO kept expanding its target market over the years, causing it to become nearly insolvent in the 1970’s. It found its impressive current footing only under Warren Buffett’s guidance. Progressive is the sole agency writer to have successfully reinvented itself and become a giant in the Direct Response channel. I recall talking to that company’s impresario, the late Peter B. Lewis, a few decades ago as he doggedly committed Progressive profits from that company’s non-standard agency business to orchestrating the metamorphosis. Quite a few other insurers, fainter of heart or shorter of resources, abandoned similar initiatives, but Progressive prevailed handsomely. We hope we can soon prove to you that it is possible to build a similar version of success in our smaller footprint - lacking the head start USAA enjoyed, condensing the stretch of time it took GEICO, and without matching Progressive’s investment. We certainly have a first-rate team now, and, if this past year is an indicator, the Direct Group has a long enough runway. The Direct Group’s overall loss and loss adjustment expense ratio for 2020 was 66%. While these results would have been worse absent Covid, they would have been better without the same correctable entry stumbles in New York and Pennsylvania that plagued its Independent Agency Group sibling. The Direct Group’s volume in those states alone is now about $85 million.
Our Home Insurance Group, led by Bill Martin, had a somewhat mixed year, with no reason to reinterpret its recorded numbers through Covid-corrected lenses. Although growth was superlative, net income before unrealized equity impact was just above the water line. I would like to think the growth reflects a long-term strength while the diminutive 2020 profit margin is owing largely to passing circumstances. Backing the story up a bit, you may recall from prior letters that I have long predicted an eventual diminution of automobile insurance premiums as a consequence of the long march toward better automobile safety technologies. While I believe this trend will not create an adverse environment for Plymouth Rock any time soon, its inevitability in the long run was among the forces impelling us to expand our homeowners writings, where no exogenous force is likely to contract premium. Our favorable experience as a founding investor in Homesite also helped build Plymouth Rock’s skills and confidence in this line of business. So, we brought Bill on as president with a green light to aggressively expand our homeowners book. He and his teammates have taken their charge seriously and, with impressive customer-friendly innovations, they have nearly tripled our writings over the last three years. In-force premium volume now stands at just over $250 million, having grown by 47% during this past year. Bill is hoping we will be listed among the ten largest homeowners carriers in the Northeast very soon. And all of the growth was accomplished without forfeiting the Home Insurance Group’s contribution to profit over the period. Yes, there was a cost to the growth this past year, but not so much that it swallowed all the profits. In addition
5
to growth costs, we had to pay for 18 identified weather-related catastrophes that befell the northeast region during 2020, about twice the number the average year has thrust upon us in this century. While no individual catastrophe, with the possible exception of August’s Isaias, was destructive enough to make the history books, their cumulative effect was to consume Bill’s 2020 catastrophe provision and then some. There is an ample and attractive path ahead of us in the homeowners line. By the time our Home Insurance Group has reached its full potential, Plymouth Rock’s market share in homes should approximate our auto market share in each of our states. Not only do we encourage many of our own customers to buy package policies combining home and auto from us, we also expect to write quite a few customers of partnering personal lines insurers who are interested in limiting potential weather-driven exposure. Evidence and logic tell us that many customers would prefer to buy both home and auto products from us or purchase our easy-to-bind homeowners policies alongside another trusted auto insurance partner company. But we must eschew the temptation to seek full congruence between auto and homeowners profiles. That would risk taking on too much coastal exposure and concentration in compact geographical areas. An irony of our business is that the more a book of auto insurance is clustered, the better we expect it to do. In a tight cluster we get to know the territory and the repair shops, and auto insurance writers have relatively little to fear from coastal exposure. Insuring a highly concentrated book of homes in a coastal zone, on the other hand, can be disastrous. Bill understands all this, and he has taken two important steps to safeguard our enterprise as he continues on our ambitious growth path. One innovation is a differential commission structure that pays agents for business in a manner that reflects long-term catastrophe exposure as well as normal year results. The other is a concentration model that explicitly keeps track of clustering and limits our appetite for business where we already write all we can prudently handle. The risks in home insurance cannot be vanquished completely, but with these protective measures now in use and with the back-up provided by the sophisticated multi-year reinsurance program already in place, Hal and I are comfortable keeping the home light green. Marc Buro, who has been leading our national brokerage operation, InsuraMatch, for over six years, has just lived through an unforgettable year. Marc, Hal, and I all came to believe during the year that the national insurance giant Travelers, with whom Marc was working on some creative marketing initiatives, could do more over any short time frame with what we had built than we could. In early December, therefore, Plymouth Rock signed a Stock Purchase Agreement to sell InsuraMatch to Travelers. The closing has just occurred, and Marc and his team are going to Travelers along with the purchased entity. We will miss Marc and his unusually talented crew. They won't be far away, though; their offices will remain in our building. While the sale means that we will no longer own a state-of-the-art national broker, Plymouth Rock retains its traditional New England agency, Encharter. Our agreement with Travelers allows us to re-enter the national space after a short pause, and Encharter can serve nicely as a foundation for rebuilding a new national enterprise. The selling price for InsuraMatch was $40 million, which both parties thought fair given that InsuraMatch has great promise but has earned no profits as yet. Plymouth Rock is almost never a seller of its component entities, but this transaction makes sense for all involved. I am confident Marc will do well at Travelers. Hal and I both remain as committed as ever to the notion that enhancing our enterprise’s expertise in modern technology-driven insurance marketing is a must for the future.
The most unseemly numbers this past year came from the investment side of our business. Our
6
three-billion-dollar investment portfolio can influence outcomes for the enterprise as much as our underwriting proficiency. Just a year ago, I described 2019 as the best investment year we had ever had. This past year, 2020, our equities handed us the poorest performance we have ever seen by comparison with the market indices. Taking all of our common equity investment returns together, including both dividends and price changes, our return was an embarrassing 1%. Excluding the insurance industry stocks we hold, Plymouth Rock’s core equity portfolio always consists of no more than ten stocks, each one bought to be held over a long holding period. This core investment portfolio produced in 2020 a total rate of return, including dividends, that rounded to the same single percentage point as the aggregate portfolio. Our insurance sector stocks, generally out of favor with investors this past year, performed worse than the core equities, and the investment funds we originated or participate in, constituting about 15% of our overall stock market exposure, underperformed as well. Had we just passively held the Standard & Poor’s 500 Index, the equity return to the Company would have been more like 18%. Let me say right away that Jim Bailey, Rick Childs, and I are the sole responsible parties if we erred. Obviously, the results merit some reflection. Our conclusion to date is that neither the fund composition nor the insurance stocks should give us cause for reconsideration going forward. The decisions of concern in our current discussions involve the makeup of the core equity investment portfolio, which constitutes more than two-thirds of our stock holdings by market value.
At a fundamental level, the poor performance in 2020 can be mainly attributed to our long-held preference for value stocks over the high-flying glamour stocks that soared especially skyward during this year of virtual house arrest. For better or worse, Jim and I continue to find comfort investing in stocks of profitable companies with strong products and prospects that we believe are unreasonably and temporarily out of favor. That said, 2020 was not a good year for our approach. Other than one big winner (Microsoft, which was once a bargain and bought before it was in its current phase of rapid growth), most of our stocks simply turned in sluggish performances. There were two specific stocks in our long-term core portfolio, however, that suffered particularly last year. One of these was Intel and the other was ExxonMobil, both holdings we have owned for many years. Intel shares produced for us about $5 million in 2020 dividends while running up almost $40 million in capital losses. Keeping in mind that Intel shares, even considering this past year, have made Plymouth Rock well over $100 million since our first purchase, Jim and I are now asking ourselves whether gratitude has kept us loyal for too long. The future of the chip industry, with technological, competitive, and geopolitical strategic considerations to weigh, is hard to read. We have trimmed our oversized Intel holdings somewhat already, and we will let you know our conclusions concerning the rest of the Intel position later this year.
Our ExxonMobil shares produced a 2020 total return loss for us of $43 million, an even worse showing than delivered by Intel. Our from-inception return on Exxon is negative by about $11 million. But Jim and I are not ready to abandon the oil and gas industry altogether for two reasons. One is that the coming switch to cleaner, more sustainable alternatives may be a great deal slower than others apparently expect. The second is that the existing energy giants may employ their massive capitalizations and unquestioned expertise to become leaders in the energy changes to come. Having said that, we decided not to stick around and wait for Exxon’s recovery. We became convinced that ExxonMobil will not be as agile and skillful at transition as its competitor, Royal Dutch Shell, so we liquidated our Exxon position and invested the proceeds in Shell. Had we moved more expeditiously in the fall to reinvest the Exxon sale proceeds, we would have enjoyed a large gain in Shell and would have recouped most of our Exxon losses for the year. Nonetheless,
7
we are comfortable with the switch and consider that Shell is now a core holding.
In modest self-defense, Jim and I could ask that you look at the two-year returns on the core equities. Our two-year average equity return for 2019 and 2020 exceeded 15%. Or, alternatively, consider our twenty-five-year inception-to-date rate of return on marketable equities. At 14.5% per annum, our return still handily beats the most commonly used market indices, and that extra return has handsomely enriched shareholders’ equity. But these exculpations do not let us off the hook. The year in progress will be a busy one on the investment side.
The 2020 bond story is what you would expect it to be. As I have repeatedly written, we hold bonds, now in magnitudes approaching a billion and a half dollars, only because of rating agency and regulatory pressure to do so. The risk-reward tradeoff is not attractive to us anywhere along the fixed-income maturity spectrum. So, we take relatively little duration risk and settle for low bond returns. The tax-adjusted 2020 return on our bond portfolio was just over 3%. Unlike in the case of the equities, this paltry result isn't following on a record year we can average it with, and there is no hint of a promise of rich returns in the foreseeable future. We will need to increase our risk tolerance if we are to do any better with respect to current returns. Extending credit risk a little is more comfortable for us than taking on too much duration risk. So last year we modified our guidelines to allow holding more investment grade BBB-rated bonds as a fraction of the portfolio. With A-rated bonds threatening to return about nothing, and relatively thin markets for A-rated securities other than those of financial sector issuers, we believe Plymouth Rock’s strong capital position allows the acceptance of a modicum of additional volatility and risk that will come with increasing again the proportion of triple-B’s we hold. Jim and I can repeat our assurance that bonds in the double-B range, or otherwise below investment grade, do not hold similar allure.
This was yet another active year for our real estate holdings. The market is skittish now about the future of commercial real estate in the post-Covid era. As a consequence, we see the value of our properties as down by something more than 10%. A number of companies intend to make permanent, in varying degrees, the work-from-home experiments that the pandemic necessitated. Not being in that camp, we used the opportunity to acquire another office building that our team can occupy. In 2019, we purchased the building bordering our 695 Atlantic Avenue headquarters in Boston. That building now carries our highly visible signage. This last year’s purchase was of a larger building in Woodbridge, New Jersey, right on the Northeast Corridor Amtrak path. We were already the anchor tenant there, and our lighted top-floor signage is hard to miss at the intersection of the New Jersey Turnpike and the Garden State Parkway. The two purchases bring the value of our real estate holdings to over $200 million, and they should permit us to fulfill our space needs in our two major jurisdictions for many years to come. In another arena, I can report that our private equity investments in Lindsay Goldberg funds (where I continue to play a role) are looking stronger by the year, bolstered by exceptionally impressive returns on Lindsay Goldberg Fund IV and a fast start for Fund V.
I often take advantage of my opportunity to write this letter by allocating some room to political economy. This year the news and the conversations have been so relentlessly full of politics that I sense most folks may want a break from that topic. My principal recommendation at this moment in history is to breathe a sigh of relief. While our health, our economy, and our democracy were endangered and tested during this past year, and seriously so, I am optimistic that we have passed the most hazardous of the perils, with the wounds now on the mend. We should give credit where
8
credit is due. Praise for defending us from the Covid pandemic is owed principally to modern science. Only a short while ago, the treatments and vaccines that will defeat this viral enemy would have been inconceivable. Our democracy was secured by a great many contributors. Greatest single thanks, in my view, should be bestowed on our nation’s robust Constitution. That document, however subject to criticism by today’s standards for its imperfections, was and remains a marvel. It was written at the right time in history, and by the right people, to have given us a sound basis on which to build a market economy and establish protection against both the despotism of individual autocrats and the equally merciless tyranny of intolerant majorities. With respect to the U.S. economy post-pandemic, I remain basically bullish. Some pessimists are saying that the American century is behind us now. And while it is true that our nation’s status after World War II as the world’s sole, unrivaled economic power became unsustainable long ago, I surely wouldn’t go betting that our future placement will be below the summit. The American traditions of entrepreneurship, inventive creativity, and, importantly, a willingness to criticize those in authority and improve upon how they do things, are strengths that endure. No other nation can match us in those strengths. Covid-19 was the dominant external operant on our Company in 2020. It will continue to be important for at least for the first half of 2021. We have so far weathered it intact as a business. Almost all of our employees have been working from home since March, so our offices have not suffered from epidemic spread risk. Those few, under 2% of our overall staff complement, who have been in the offices are volunteers and exceptionally well protected by strict rules of conduct and physical improvements in our workspaces. But working from home, needless to say, doesn’t protect people from acquiring Covid by community spread. Our nearly two thousand people appear to have suffered proportionally less illness than the population as a whole, but our team has not been entirely spared. Tragically, we have lost two valued employees to untimely Covid-related deaths. Case numbers are up this winter almost everywhere, and based on projections of vaccine availability, I can't imagine that we will see even half-full offices again before the warm weather returns. Meanwhile, Hal and I would describe our Company’s work-at-home performance as reassuring. Our claims and customer service staffs have strived valiantly, and we have tried to express our gratitude in videotaped messages throughout the year. Service levels in those areas have been maintained surprisingly well under tough conditions. The technical support our IT folks has been able to provide for remote work has been superlative. Our brave administrative team, many from that unit continuing to work on site, has functioned as well as if the pandemic had never occurred. Hal and I continued throughout 2020 to work principally from the office, but we are lonely. I cannot express how much I long for the full return to our offices of the entire Plymouth Rock workforce. There is every reason to think 2021 will be a better year for all of us.
James M. Stone
PricewaterhouseCoopers LLP, 101 Seaport Boulevard, Suite 500 Boston, MA 02210 T: 617 530 5000, www.pwc.com/us
Report of Independent Auditors
To the Board of Directors of The Plymouth Rock Company
We have audited the accompanying consolidated financial statements of The Plymouth Rock Company and its subsidiaries, which comprise the consolidated balance sheets as of December 31, 2020 and 2019, and the related consolidated statements of comprehensive income, of changes in equity and of cash flows for the years then ended.
Management's Responsibility for the Consolidated Financial Statements
Management is responsible for the preparation and fair presentation of the consolidated financial statements in accordance with accounting principles generally accepted in the United States of America; this includes the design, implementation, and maintenance of internal control relevant to the preparation and fair presentation of consolidated financial statements that are free from material misstatement, whether due to fraud or error.
Auditors’ Responsibility
Our responsibility is to express an opinion on the consolidated financial statements based on our audits. We conducted our audits in accordance with auditing standards generally accepted in the United States of America. Those standards require that we plan and perform the audit to obtain reasonable assurance about whether the consolidated financial statements are free from material misstatement.
An audit involves performing procedures to obtain audit evidence about the amounts and disclosures in the consolidated financial statements. The procedures selected depend on our judgment, including the assessment of the risks of material misstatement of the consolidated financial statements, whether due to fraud or error. In making those risk assessments, we consider internal control relevant to the Company's preparation and fair presentation of the consolidated financial statements in order to design audit procedures that are appropriate in the circumstances, but not for the purpose of expressing an opinion on the effectiveness of the Company's internal control. Accordingly, we express no such opinion. An audit also includes evaluating the appropriateness of accounting policies used and the reasonableness of significant accounting estimates made by management, as well as evaluating the overall presentation of the consolidated financial statements. We believe that the audit evidence we have obtained is sufficient and appropriate to provide a basis for our audit opinion.
Opinion
In our opinion, the consolidated financial statements referred to above present fairly, in all material respects, the financial position of The Plymouth Rock Company and its subsidiaries as of December 31, 2020 and 2019, and the results of their operations and their cash flows for the years then ended in accordance with accounting principles generally accepted in the United States of America.
PricewaterhouseCoopers LLP Boston, Massachusetts March 10, 2021
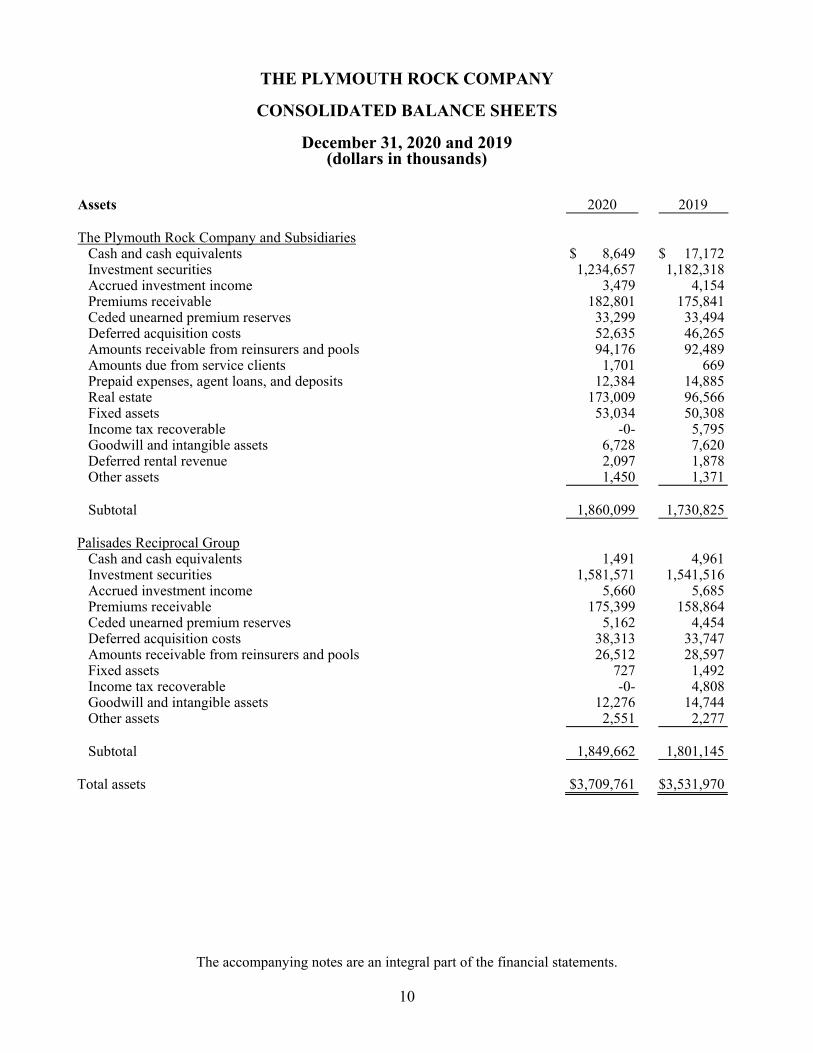
THE PLYMOUTH ROCK COMPANY
The accompanying notes are an integral part of the financial statements.
10
CONSOLIDATED BALANCE SHEETS
December 31, 2020 and 2019
(dollars in thousands)
Assets 2020 2019 The Plymouth Rock Company and Subsidiaries Cash and cash equivalents $ 8,649 $ 17,172 Investment securities 1,234,657 1,182,318 Accrued investment income 3,479 4,154 Premiums receivable 182,801 175,841 Ceded unearned premium reserves 33,299 33,494 Deferred acquisition costs 52,635 46,265 Amounts receivable from reinsurers and pools 94,176 92,489 Amounts due from service clients 1,701 669 Prepaid expenses, agent loans, and deposits 12,384 14,885 Real estate 173,009 96,566 Fixed assets 53,034 50,308 Income tax recoverable -0- 5,795 Goodwill and intangible assets 6,728 7,620 Deferred rental revenue 2,097 1,878 Other assets 1,450 1,371 Subtotal 1,860,099 1,730,825 Palisades Reciprocal Group Cash and cash equivalents 1,491 4,961 Investment securities 1,581,571 1,541,516 Accrued investment income 5,660 5,685 Premiums receivable 175,399 158,864 Ceded unearned premium reserves 5,162 4,454 Deferred acquisition costs 38,313 33,747 Amounts receivable from reinsurers and pools 26,512 28,597 Fixed assets 727 1,492 Income tax recoverable -0- 4,808 Goodwill and intangible assets 12,276 14,744 Other assets 2,551 2,277 Subtotal 1,849,662 1,801,145 Total assets $3,709,761 $3,531,970
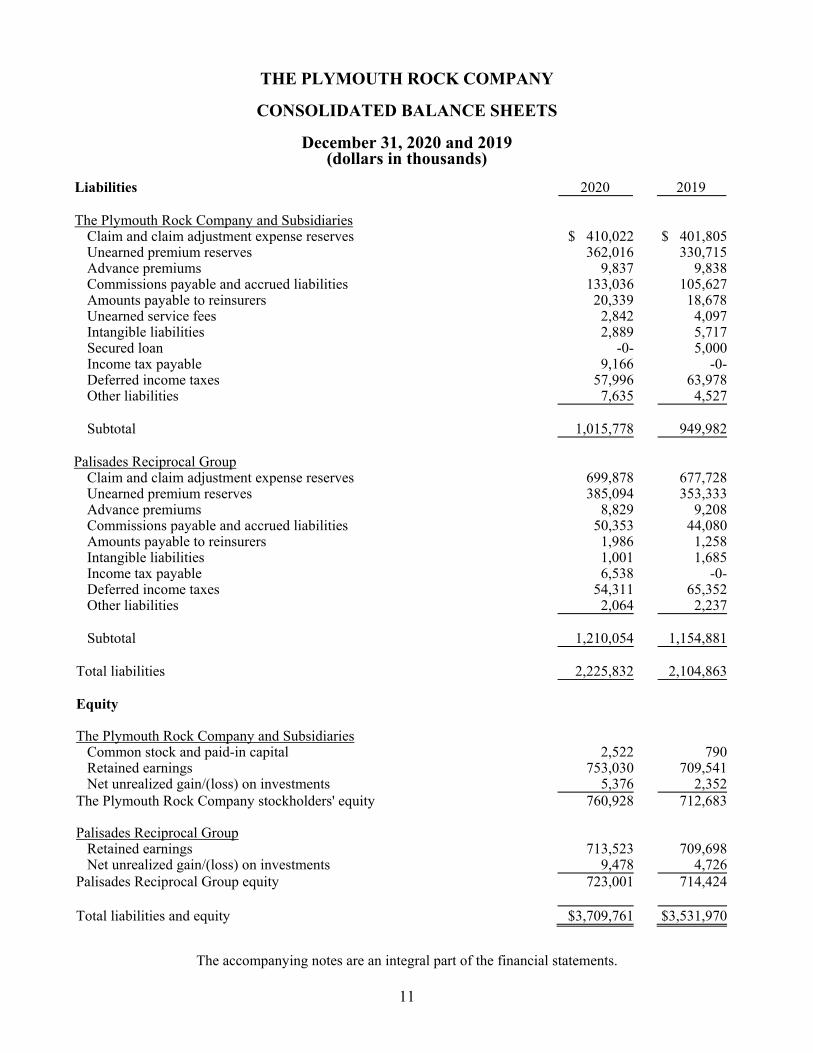
THE PLYMOUTH ROCK COMPANY
The accompanying notes are an integral part of the financial statements.
11
CONSOLIDATED BALANCE SHEETS
December 31, 2020 and 2019
(dollars in thousands)
Liabilities 2020 2019
The Plymouth Rock Company and Subsidiaries Claim and claim adjustment expense reserves $ 410,022 $ 401,805 Unearned premium reserves 362,016 330,715 Advance premiums 9,837 9,838 Commissions payable and accrued liabilities 133,036 105,627 Amounts payable to reinsurers 20,339 18,678 Unearned service fees 2,842 4,097 Intangible liabilities 2,889 5,717 Secured loan -0- 5,000 Income tax payable 9,166 -0- Deferred income taxes 57,996 63,978 Other liabilities 7,635 4,527 Subtotal 1,015,778 949,982 Palisades Reciprocal Group Claim and claim adjustment expense reserves 699,878 677,728 Unearned premium reserves 385,094 353,333 Advance premiums 8,829 9,208 Commissions payable and accrued liabilities 50,353 44,080 Amounts payable to reinsurers 1,986 1,258 Intangible liabilities 1,001 1,685 Income tax payable 6,538 -0- Deferred income taxes 54,311 65,352 Other liabilities 2,064 2,237 Subtotal 1,210,054 1,154,881 Total liabilities 2,225,832 2,104,863 Equity The Plymouth Rock Company and Subsidiaries Common stock and paid-in capital 2,522 790 Retained earnings 753,030 709,541 Net unrealized gain/(loss) on investments 5,376 2,352 The Plymouth Rock Company stockholders' equity 760,928 712,683 Palisades Reciprocal Group Retained earnings 713,523 709,698 Net unrealized gain/(loss) on investments 9,478 4,726 Palisades Reciprocal Group equity 723,001 714,424 Total liabilities and equity $3,709,761 $3,531,970
THE PLYMOUTH ROCK COMPANY
The accompanying notes are an integral part of the financial statements.
12
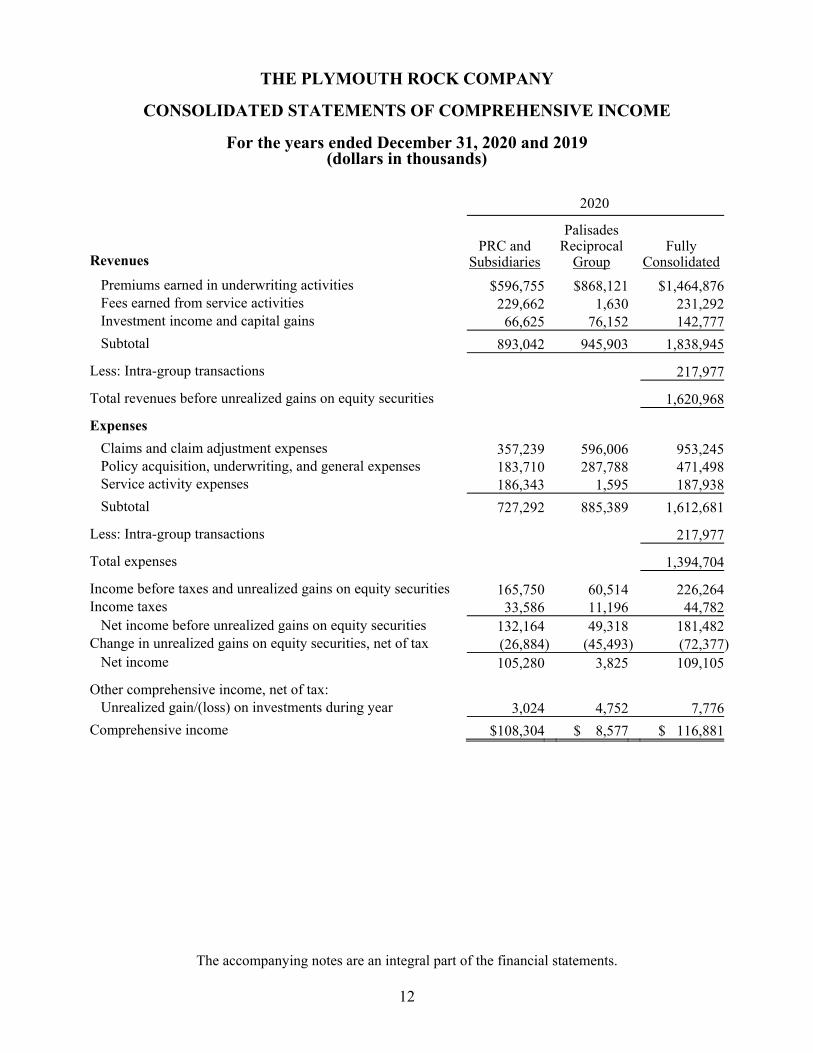
CONSOLIDATED STATEMENTS OF COMPREHENSIVE INCOME
For the years ended December 31, 2020 and 2019
(dollars in thousands)
2020
Revenues
PRC and Subsidiaries
Palisades Reciprocal
Group
Fully
Consolidated
Premiums earned in underwriting activities $596,755 $868,121 $1,464,876 Fees earned from service activities 229,662 1,630 231,292 Investment income and capital gains 66,625 76,152 142,777
Subtotal 893,042 945,903 1,838,945
Less: Intra-group transactions 217,977
Total revenues before unrealized gains on equity securities 1,620,968
Expenses
Claims and claim adjustment expenses 357,239 596,006 953,245 Policy acquisition, underwriting, and general expenses 183,710 287,788 471,498 Service activity expenses 186,343 1,595 187,938
Subtotal 727,292 885,389 1,612,681
Less: Intra-group transactions 217,977
Total expenses 1,394,704
Income before taxes and unrealized gains on equity securities 165,750 60,514 226,264 Income taxes 33,586 11,196 44,782 Net income before unrealized gains on equity securities 132,164 49,318 181,482 Change in unrealized gains on equity securities, net of tax (26,884) (45,493) (72,377) Net income 105,280 3,825 109,105
Other comprehensive income, net of tax: Unrealized gain/(loss) on investments during year 3,024 4,752 7,776
Comprehensive income $108,304 $ 8,577 $ 116,881
THE PLYMOUTH ROCK COMPANY
The accompanying notes are an integral part of the financial statements.
13
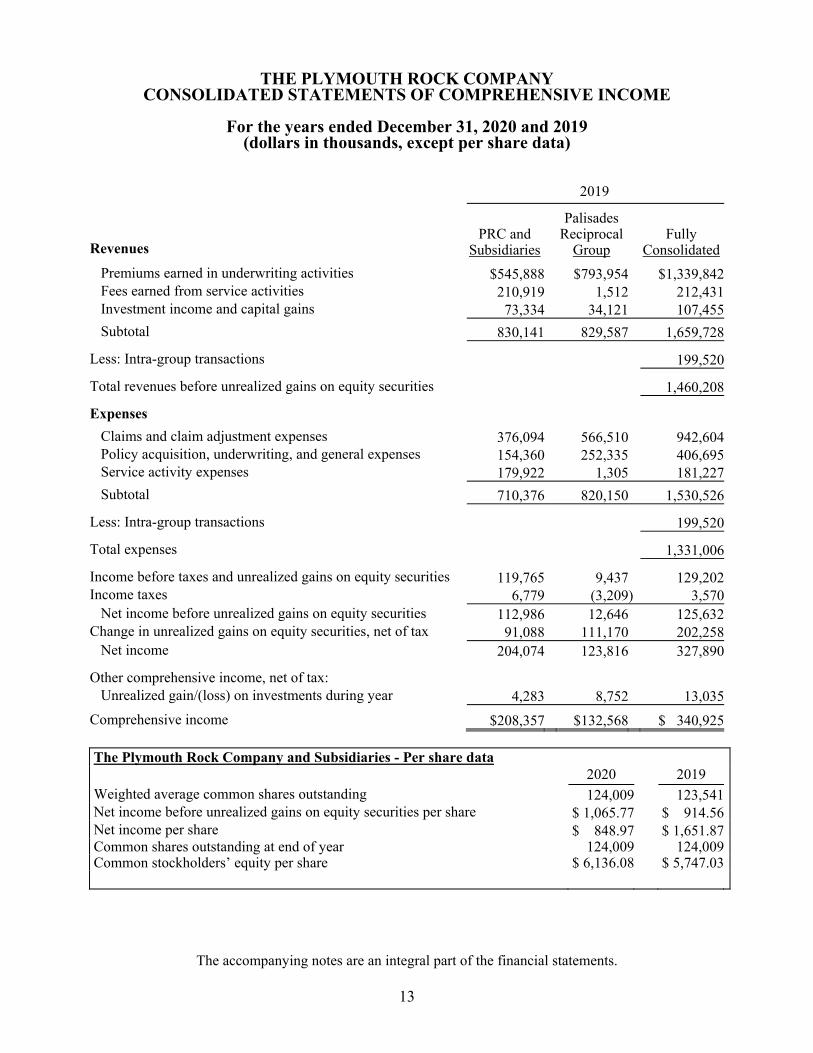
CONSOLIDATED STATEMENTS OF COMPREHENSIVE INCOME
For the years ended December 31, 2020 and 2019 (dollars in thousands, except per share data)
2019
Revenues
PRC and Subsidiaries
Palisades Reciprocal
Group
Fully
Consolidated
Premiums earned in underwriting activities $545,888 $793,954 $1,339,842 Fees earned from service activities 210,919 1,512 212,431 Investment income and capital gains 73,334 34,121 107,455
Subtotal 830,141 829,587 1,659,728
Less: Intra-group transactions 199,520
Total revenues before unrealized gains on equity securities 1,460,208
Expenses
Claims and claim adjustment expenses 376,094 566,510 942,604 Policy acquisition, underwriting, and general expenses 154,360 252,335 406,695 Service activity expenses 179,922 1,305 181,227
Subtotal 710,376 820,150 1,530,526
Less: Intra-group transactions 199,520
Total expenses 1,331,006
Income before taxes and unrealized gains on equity securities 119,765 9,437 129,202 Income taxes 6,779 (3,209) 3,570 Net income before unrealized gains on equity securities 112,986 12,646 125,632 Change in unrealized gains on equity securities, net of tax 91,088 111,170 202,258 Net income 204,074 123,816 327,890
Other comprehensive income, net of tax: Unrealized gain/(loss) on investments during year 4,283 8,752 13,035
Comprehensive income $208,357 $132,568 $ 340,925
The Plymouth Rock Company and Subsidiaries - Per share data 2020 2019 Weighted average common shares outstanding 124,009 123,541 Net income before unrealized gains on equity securities per share $ 1,065.77 $ 914.56 Net income per share $ 848.97 $ 1,651.87 Common shares outstanding at end of year 124,009 124,009 Common stockholders’ equity per share $ 6,136.08 $ 5,747.03
THE PLYMOUTH ROCK COMPANY
The accompanying notes are an integral part of the financial statements.
14
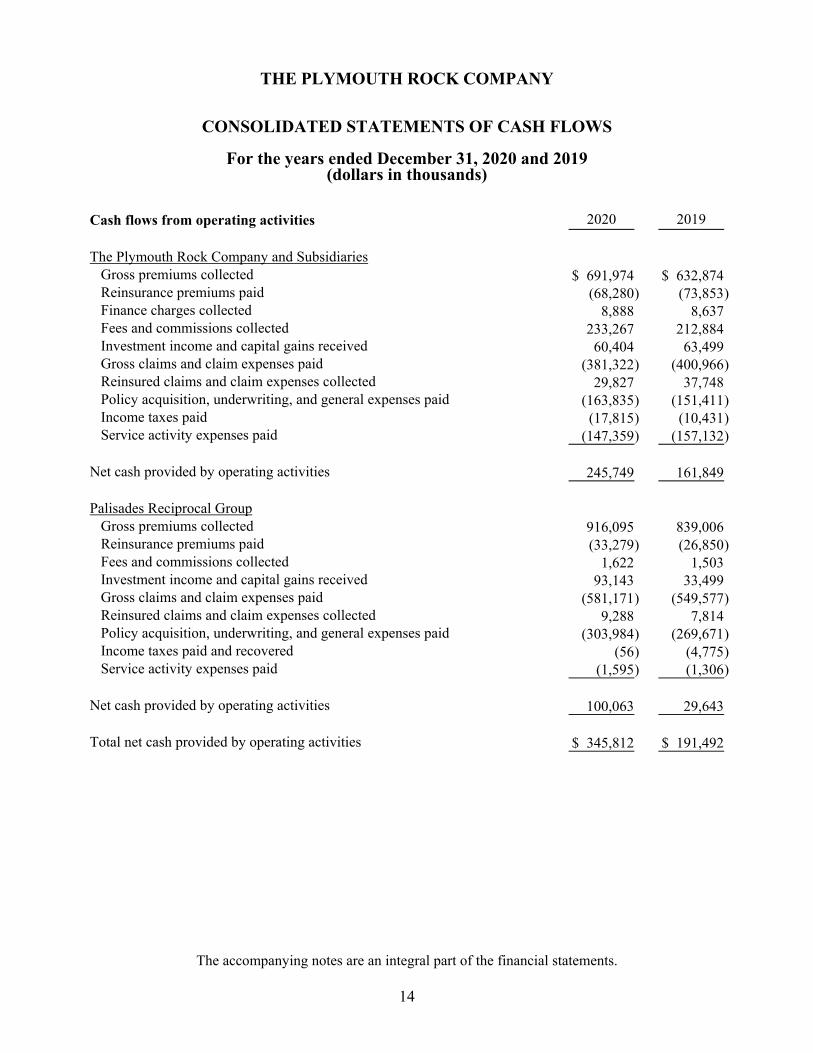
CONSOLIDATED STATEMENTS OF CASH FLOWS
For the years ended December 31, 2020 and 2019 (dollars in thousands)
Cash flows from operating activities 2020 2019 The Plymouth Rock Company and Subsidiaries Gross premiums collected $ 691,974 $ 632,874 Reinsurance premiums paid (68,280 ) (73,853 ) Finance charges collected 8,888 8,637 Fees and commissions collected 233,267 212,884 Investment income and capital gains received 60,404 63,499 Gross claims and claim expenses paid (381,322 ) (400,966 ) Reinsured claims and claim expenses collected 29,827 37,748 Policy acquisition, underwriting, and general expenses paid (163,835 ) (151,411 ) Income taxes paid (17,815 ) (10,431 ) Service activity expenses paid (147,359 ) (157,132 ) Net cash provided by operating activities 245,749 161,849 Palisades Reciprocal Group Gross premiums collected 916,095 839,006 Reinsurance premiums paid (33,279 ) (26,850 ) Fees and commissions collected 1,622 1,503 Investment income and capital gains received 93,143 33,499 Gross claims and claim expenses paid (581,171 ) (549,577 ) Reinsured claims and claim expenses collected 9,288 7,814 Policy acquisition, underwriting, and general expenses paid (303,984 ) (269,671 ) Income taxes paid and recovered (56 ) (4,775 ) Service activity expenses paid (1,595 ) (1,306 ) Net cash provided by operating activities 100,063 29,643 Total net cash provided by operating activities $ 345,812 $ 191,492
THE PLYMOUTH ROCK COMPANY
The accompanying notes are an integral part of the financial statements.
15
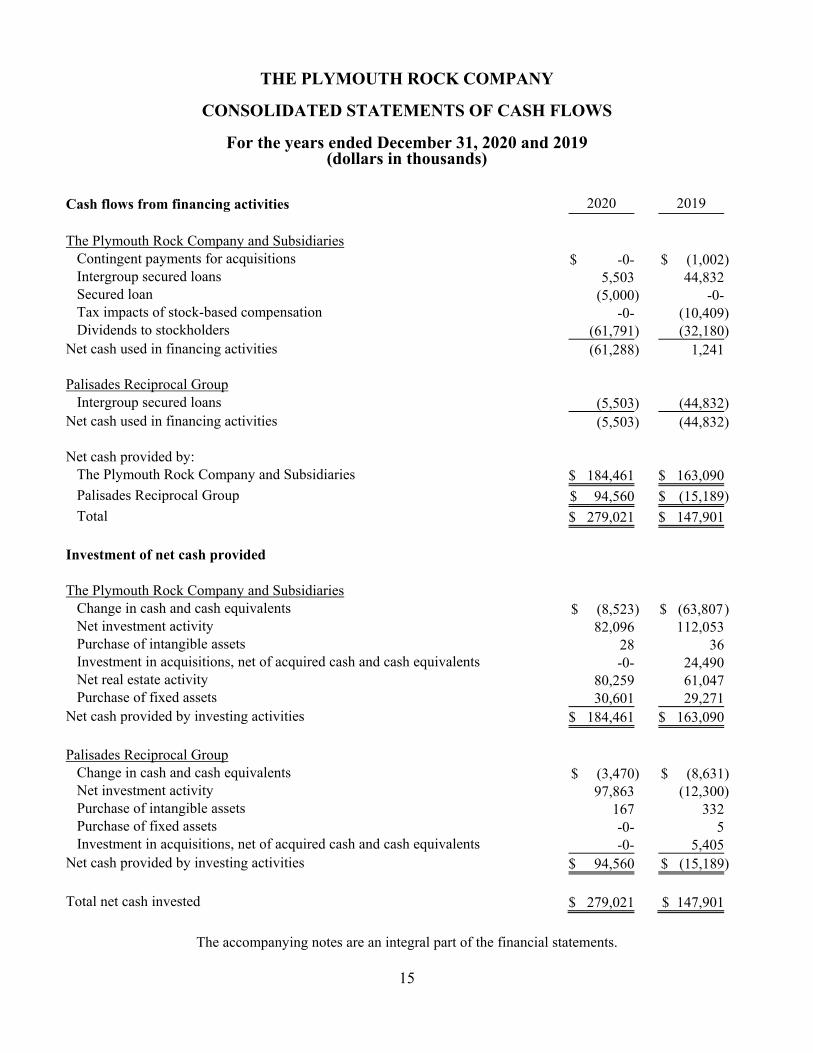
CONSOLIDATED STATEMENTS OF CASH FLOWS
For the years ended December 31, 2020 and 2019
(dollars in thousands)
Cash flows from financing activities 2020 2019 The Plymouth Rock Company and Subsidiaries Contingent payments for acquisitions $ -0- $ (1,002) Intergroup secured loans 5,503 44,832 Secured loan (5,000) -0- Tax impacts of stock-based compensation -0- (10,409) Dividends to stockholders (61,791) (32,180) Net cash used in financing activities (61,288) 1,241 Palisades Reciprocal Group Intergroup secured loans (5,503) (44,832) Net cash used in financing activities (5,503) (44,832) Net cash provided by: The Plymouth Rock Company and Subsidiaries $ 184,461 $ 163,090 Palisades Reciprocal Group $ 94,560 $ (15,189) Total $ 279,021 $ 147,901 Investment of net cash provided The Plymouth Rock Company and Subsidiaries Change in cash and cash equivalents $ (8,523) $ (63,807 ) Net investment activity 82,096 112,053 Purchase of intangible assets 28 36 Investment in acquisitions, net of acquired cash and cash equivalents -0- 24,490 Net real estate activity 80,259 61,047 Purchase of fixed assets 30,601 29,271 Net cash provided by investing activities $ 184,461 $ 163,090 Palisades Reciprocal Group Change in cash and cash equivalents $ (3,470) $ (8,631) Net investment activity 97,863 (12,300) Purchase of intangible assets 167 332 Purchase of fixed assets -0- 5 Investment in acquisitions, net of acquired cash and cash equivalents -0- 5,405 Net cash provided by investing activities $ 94,560 $ (15,189) Total net cash invested $ 279,021 $ 147,901
THE PLYMOUTH ROCK COMPANY
The accompanying notes are an integral part of the financial statements.
16
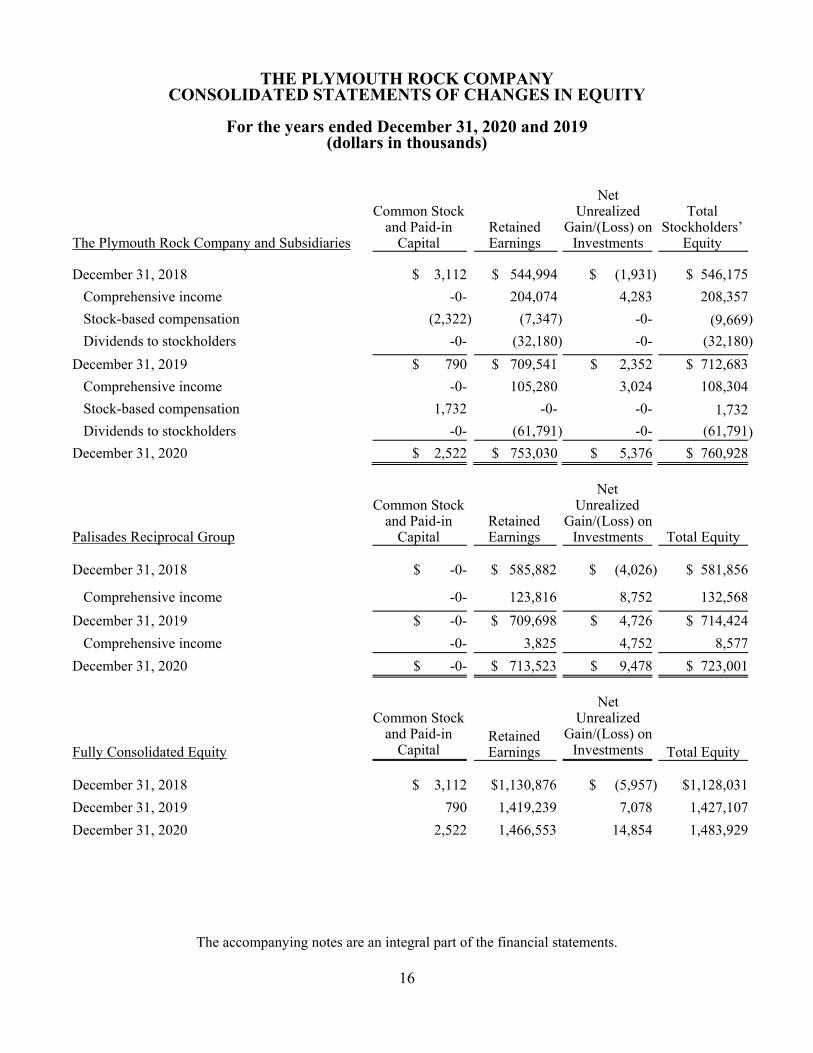
CONSOLIDATED STATEMENTS OF CHANGES IN EQUITY
For the years ended December 31, 2020 and 2019 (dollars in thousands)
The Plymouth Rock Company and Subsidiaries
Common Stock
and Paid-in Capital
Retained Earnings
Net
Unrealized Gain/(Loss) on
Investments
Total Stockholders’
Equity
December 31, 2018 $ 3,112 $ 544,994 $ (1,931) $ 546,175
Comprehensive income -0- 204,074 4,283 208,357
Stock-based compensation (2,322) (7,347) -0- (9,669)
Dividends to stockholders -0- (32,180) -0- (32,180)
December 31, 2019 $ 790 $ 709,541 $ 2,352 $ 712,683
Comprehensive income -0- 105,280 3,024 108,304
Stock-based compensation 1,732 -0- -0- 1,732
Dividends to stockholders -0- (61,791) -0- (61,791)
December 31, 2020 $ 2,522 $ 753,030 $ 5,376 $ 760,928
Palisades Reciprocal Group
Common Stock
and Paid-in Capital
Retained Earnings
Net Unrealized
Gain/(Loss) on Investments Total Equity
December 31, 2018 $ -0- $ 585,882 $ (4,026) $ 581,856
Comprehensive income -0- 123,816 8,752 132,568
December 31, 2019 $ -0- $ 709,698 $ 4,726 $ 714,424
Comprehensive income -0- 3,825 4,752 8,577
December 31, 2020 $ -0- $ 713,523 $ 9,478 $ 723,001
Fully Consolidated Equity
Common Stock
and Paid-in Capital
Retained Earnings
Net
Unrealized Gain/(Loss) on
Investments
Total Equity
December 31, 2018 $ 3,112 $1,130,876 $ (5,957) $1,128,031
December 31, 2019 790 1,419,239 7,078 1,427,107
December 31, 2020 2,522 1,466,553 14,854 1,483,929
THE PLYMOUTH ROCK COMPANY
NOTES TO CONSOLIDATED FINANCIAL STATEMENTS
17
1. Nature of Operations
The Plymouth Rock Company is a privately held company which was founded in 1982 and has been headquartered in Boston, Massachusetts since its inception. Its primary business is the ownership and management of property and casualty insurance companies, specializing in coverage for personal automobiles and homes. The Plymouth Rock Company, through a number of operating subsidiaries, operates in Massachusetts, New York, New Hampshire and Connecticut, and provides various insurance and investment management services for insurance entities in those states and elsewhere in the United States. The Plymouth Rock Company and its wholly owned subsidiaries are generally referred to in these financial statements as “The Plymouth Rock Company and Subsidiaries”. Among The Plymouth Rock Company’s largest businesses is the management of a reciprocal insurance group, which is conducted through a subsidiary. The members of that reciprocal group of companies, which are referred to in these financial statements as the “Palisades Reciprocal Group”, are not owned by The Plymouth Rock Company. They are operated in accordance with New Jersey statutes and regulations applicable to reciprocal and stock insurers. The Palisades Reciprocal Group includes Palisades Safety and Insurance Association, a New Jersey reciprocal insurance exchange, and several subsidiaries, all of which are domiciled in New Jersey and which operate primarily in New Jersey, New York and Pennsylvania. A management company, which is included in The Plymouth Rock Company and Subsidiaries in these financial statements, provides executive management, accounting, marketing, underwriting, and claim adjustment services in exchange for management fees to ten insurers listed below and to three smaller subsidiaries, all of which are included in the Palisades Reciprocal Group. This subsidiary of The Plymouth Rock Company, Plymouth Rock Management Company of New Jersey, provides services to Palisades Safety and Insurance Association, Palisades Insurance Company, Palisades Property and Casualty Insurance Company, High Point Preferred Insurance Company, High Point Safety and Insurance Company, High Point Property and Casualty Insurance Company, Twin Lights Insurance Company, Teachers Auto Insurance Company of New Jersey, AtHome Insurance Company and Rider Insurance Company. The Plymouth Rock Company also has subsidiaries that provide various insurance and investment management services to the Palisades Reciprocal Group in exchange for negotiated fees.
THE PLYMOUTH ROCK COMPANY
NOTES TO CONSOLIDATED FINANCIAL STATEMENTS
18
1. Nature of Operations, continued
The Plymouth Rock Company’s financial statements consolidate the results of the members of the Palisades Reciprocal Group. Accounting Standards Update No. 2015-02 modified the framework for assessing whether a “variable interest entity” in a service relationship should be consolidated for financial reporting purposes by eliminating certain criteria in assessing whether a service arrangement is considered a variable interest and ultimately whether consolidation is required under Accounting Standards Codification Topic 810. The Plymouth Rock Company and Subsidiaries have provided capital to the Palisades Reciprocal Group in the form of surplus notes and preferred stock that account for $18.6 million, or 2.6 percent, of the equity of the Palisades Reciprocal Group at both December 31, 2020 and 2019, respectively. As these surplus notes and preferred stock features are not typical of an ordinary service arrangement, it is appropriate for The Plymouth Rock Company and Subsidiaries to consolidate the results of the members of the Palisades Reciprocal Group. The Plymouth Rock Company and Subsidiaries do not bear direct risk or earn direct rewards on the basis of the performance of the Palisades Reciprocal Group. The results are presented in a consolidated manner despite fundamental legal and regulatory distinctions between The Plymouth Rock Company and Subsidiaries on the one hand and the Palisades Reciprocal Group on the other. For ease of reference, The Plymouth Rock Company and Subsidiaries and the Palisades Reciprocal Group are referred to in the Chairman’s letter together as the “Plymouth Rock Group.” The Independent Agency Group, the Home Insurance Group, and the Direct Group are not legal entities. These names are used for convenience internally, in the Chairman’s letter, and in marketing and certain other communications to refer to groupings by line and distribution channel of the property and casualty insurance sold or serviced in multiple states through legally separate underwriting and managed insurance companies. The use of the word “group” does not imply any legal association, intercompany contract, guaranty or pooling arrangement. Each underwriting and managed insurance company is a separate legal entity that is financially responsible only for its own insurance products and actual coverage is subject to the language of the policies as issued by each separate company.
THE PLYMOUTH ROCK COMPANY
NOTES TO CONSOLIDATED FINANCIAL STATEMENTS
19
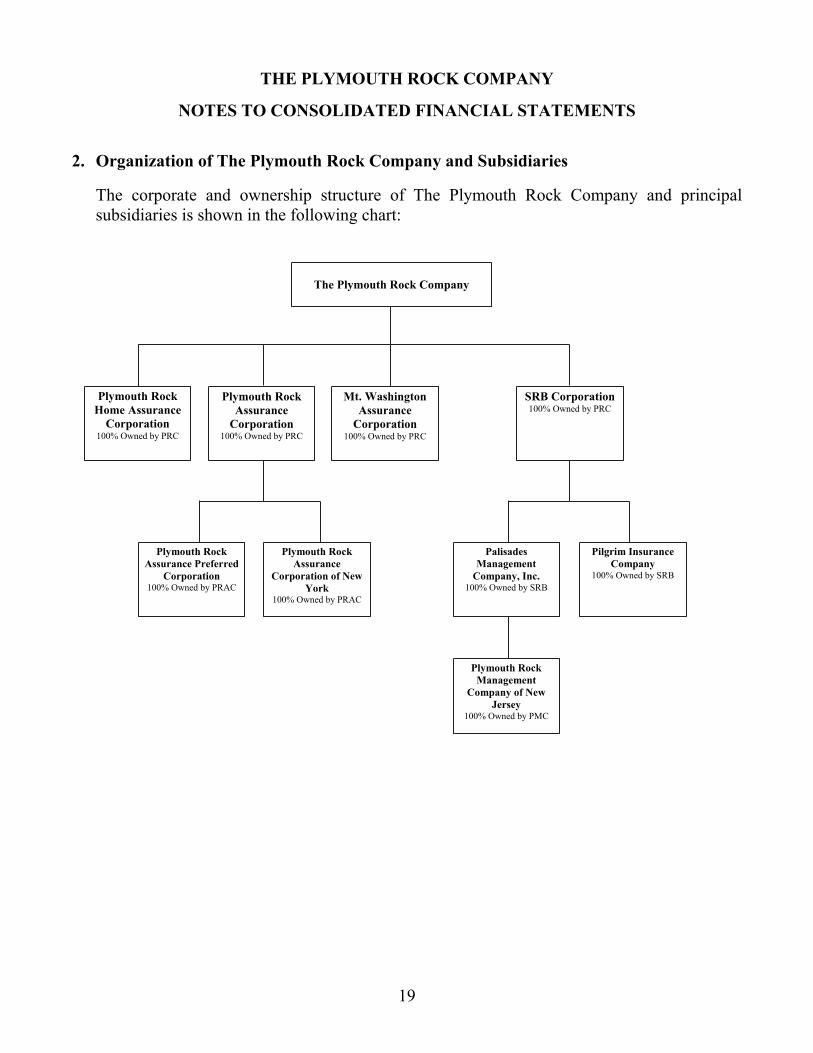
2. Organization of The Plymouth Rock Company and Subsidiaries
The corporate and ownership structure of The Plymouth Rock Company and principal subsidiaries is shown in the following chart:
The Plymouth Rock Company
Plymouth Rock Home Assurance
Corporation 100% Owned by PRC
Plymouth Rock Assurance
Corporation 100% Owned by PRC
Mt. Washington Assurance
Corporation 100% Owned by PRC
SRB Corporation 100% Owned by PRC
Plymouth Rock Assurance Preferred
Corporation 100% Owned by PRAC
Plymouth Rock Assurance
Corporation of New York
100% Owned by PRAC
Palisades Management
Company, Inc. 100% Owned by SRB
Pilgrim Insurance Company
100% Owned by SRB
Plymouth Rock Management
Company of New Jersey
100% Owned by PMC
THE PLYMOUTH ROCK COMPANY
NOTES TO CONSOLIDATED FINANCIAL STATEMENTS
20
2. Organization of The Plymouth Rock Company and Subsidiaries, continued
Effective January 1, 2019, Plymouth Rock Assurance Corporation purchased from ACIC Holding Co., Inc. all of the issued and outstanding shares of MAPFRE Insurance Company of New York, which was subsequently renamed Plymouth Rock Assurance Corporation of New York. Plymouth Rock Assurance Corporation paid $23.4 million in cash to acquire the shares of MAPFRE Insurance Company of New York based on its closing balance sheet as of December 31, 2018. This transaction, the objective of which was to gain both scale and established independent agency relationships in New York, was accounted for as a business combination. The accounting for this transaction is discussed further in Note 12.
On February 1, 2021, SRB Corporation sold to Travelers Marketplace Holdings, LLC (“Travelers”) all of the issued and outstanding equity interests of InsuraMatch, LLC. Travelers paid $40.0 million in cash to acquire the equity interests of InsuraMatch, LLC plus certain agreed upon closing costs. This purchase price is subject to adjustments during 2021 based on the final closing balance sheet to be delivered to SRB Corporation by April 2, 2021 and a reconciliation of profit sharing and supplemental compensation payments due from insurance carriers in respect of 2020 to be delivered to SRB Corporation by July 31, 2021. As part of this transaction InsuraMatch, LLC’s investments in subsidiaries Encharter Insurance, LLC (Massachusetts) and Encharter Insurance, LLC (Connecticut) were distributed to SRB Corporation.
Other subsidiaries include 711 Atlantic Corporation, 711 Atlantic Avenue Company, LLC and 695 Atlantic Avenue Company, L.L.C., which directly or indirectly own real estate; Bunker Hill Insurance Casualty Company, Bunker Hill Property Insurance Company, Bunker Hill Preferred Insurance Company, and Bunker Hill Insurance Company, which are wholly owned subsidiaries of Plymouth Rock Home Assurance Corporation; Shared Technology Services Group Inc. and Perks and More, LLC, which are wholly-owned subsidiaries of SRB Corporation, and High Point Brokerage Company, Inc., National Atlantic Insurance Agency, Inc., and 581 Main Street LLC, which are wholly owned subsidiaries of Palisades Management Company, Inc.
THE PLYMOUTH ROCK COMPANY
NOTES TO CONSOLIDATED FINANCIAL STATEMENTS
21
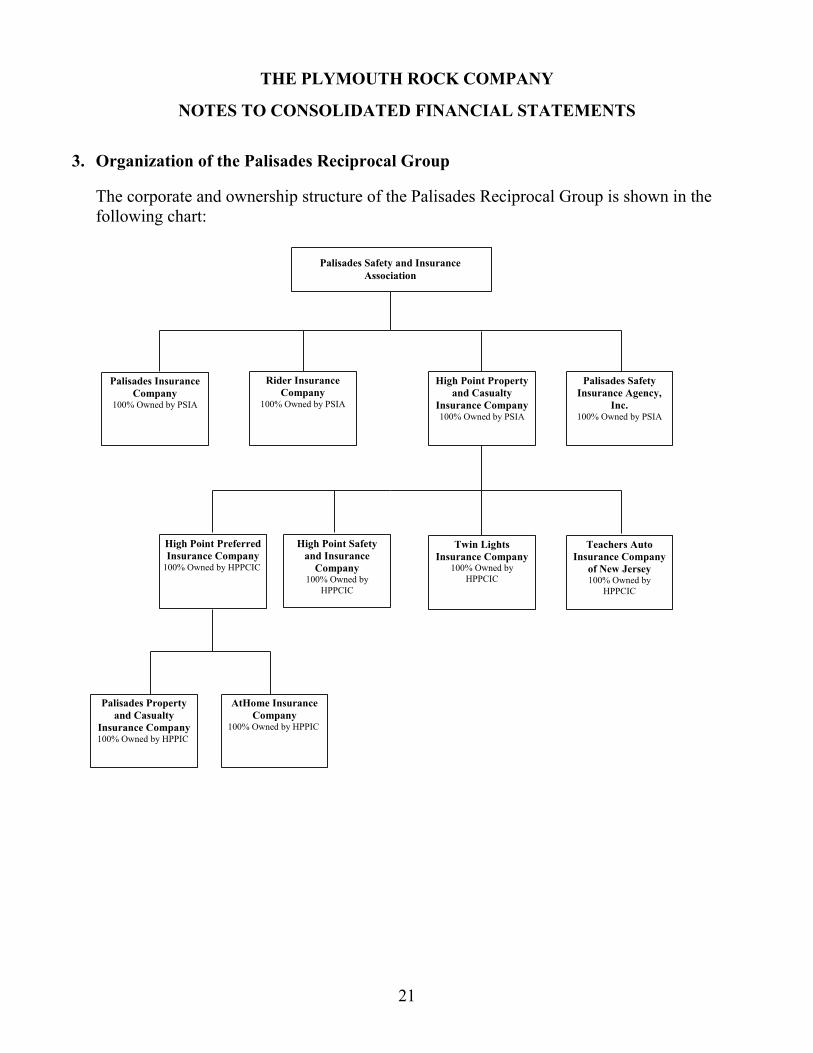
3. Organization of the Palisades Reciprocal Group
The corporate and ownership structure of the Palisades Reciprocal Group is shown in the following chart:
Palisades Safety and Insurance Association
Palisades Safety Insurance Agency,
Inc. 100% Owned by PSIA
High Point Preferred Insurance Company
100% Owned by HPPCIC
High Point Safety and Insurance
Company 100% Owned by
HPPCIC
High Point Property and Casualty
Insurance Company 100% Owned by PSIA
Twin Lights Insurance Company
100% Owned by HPPCIC
Teachers Auto Insurance Company
of New Jersey 100% Owned by
HPPCIC
Palisades Property and Casualty
Insurance Company 100% Owned by HPPIC
AtHome Insurance Company
100% Owned by HPPIC
Palisades Insurance Company
100% Owned by PSIA
Rider Insurance Company
100% Owned by PSIA
THE PLYMOUTH ROCK COMPANY
NOTES TO CONSOLIDATED FINANCIAL STATEMENTS
22
3. Organization of the Palisades Reciprocal Group, continued
On October 17, 2019, Palisades Safety and Insurance Association purchased Rider Insurance Company and Rider Insurance Agency, Inc. (together, “Rider”). Palisades Safety and Insurance Association paid $6.1 million in cash to acquire Rider. This transaction, the objective of which was to expand motorcycle business and offerings in all of Plymouth Rock’s states, was accounted for as a business combination. As the fair value of assets and liabilities acquired exceeded the purchase price, a gain of $3.7 million was recorded in 2019 and is reflected in the “Investment income and capital gains” line of the Consolidated Statements of Comprehensive Income. The accounting for this transaction is discussed further in Note 12.
4. Summary of Significant Accounting Policies
A. Principles of Consolidation
The consolidated financial statements include the accounts of The Plymouth Rock Company and Subsidiaries as well as those of the Palisades Reciprocal Group. Significant accounts and transactions among companies within each of the two groups, as well as those between the groups, have been eliminated upon consolidation. The assets of The Plymouth Rock Company and Subsidiaries have been reduced by amounts due for services provided to the Palisades Reciprocal Group and by the value of certain surplus notes and preferred stock investments in the Palisades Reciprocal Group. The liabilities of The Plymouth Rock Company and Subsidiaries have been reduced by the amount of service fee revenue from the Palisades Reciprocal Group that has not yet been earned as of the balance sheet date. Each of the reductions to the balance sheet of The Plymouth Rock Company and Subsidiaries requires a corresponding reduction on the Palisades Reciprocal Group balance sheet. Therefore, while total assets equal the sum of total liabilities and equity, this equation will not hold within the separate groups presented in the balance sheet.
THE PLYMOUTH ROCK COMPANY
NOTES TO CONSOLIDATED FINANCIAL STATEMENTS
23
4. Summary of Significant Accounting Policies, continued
B. Stock-Based Compensation
Expenses for stock-based employee compensation plans are recorded at their fair value on the basis of an annual independent appraisal. The term “fair value” used here and throughout the notes to the consolidated financial statements means the value at which a transaction would be expected to occur between a willing buyer and seller.
C. Use of Estimates
The preparation of financial statements in conformity with generally accepted accounting principles requires management to make estimates and assumptions. These judgments affect the amounts of assets, liabilities, revenues and expenses reported in the consolidated financial statements and the disclosure of contingent assets and liabilities in the footnotes. Actual results could differ from those estimates.
D. Cash and Investments
Cash and cash equivalents include money market funds and short-term money market instruments with maturity dates no longer than 90 days from the date of acquisition. At December 31, 2020, The Plymouth Rock Company and Subsidiaries held $20.8 million in United States Treasury Bills with maturity dates no longer than 90 days from the date of acquisition. At December 31, 2020 and 2019, the Palisades Reciprocal Group held $24.6 million and $15.6 million, respectively, in United States Treasury Bills with maturity dates no longer than 90 days from the date of acquisition. For both The Plymouth Rock Company and Subsidiaries and the Palisades Reciprocal Group, these securities are included in “Investment securities” in the Company’s Consolidated Balance Sheets. The Plymouth Rock Company and Subsidiaries had a balance of outstanding checks within accrued liabilities of $15.0 million and $4.2 million in 2020 and 2019, respectively. Liabilities for outstanding checks for the Palisades Reciprocal Group were $25.8 million and $15.5 million in 2020 and 2019, respectively. Marketable fixed income and equity securities are carried at their market values. The calculation of gain or loss on the sale of marketable securities is based on specific identification at the time of sale. Changes in the fair value of marketable equity securities available for sale, after deduction of applicable deferred income taxes, are credited or charged directly to net income and affect equity through retained earnings. Changes in the fair value of marketable fixed income securities are credited or charged directly to equity.
THE PLYMOUTH ROCK COMPANY
NOTES TO CONSOLIDATED FINANCIAL STATEMENTS
24
4. Summary of Significant Accounting Policies, continued
D. Cash and Investments, continued
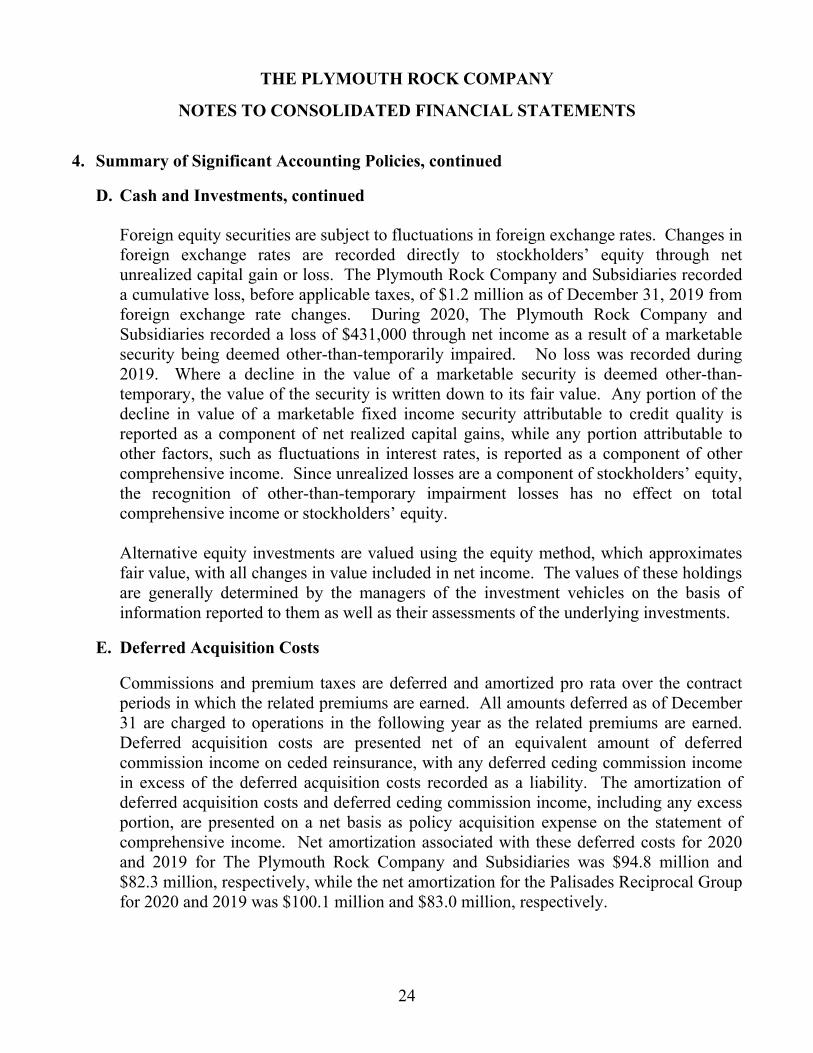
Foreign equity securities are subject to fluctuations in foreign exchange rates. Changes in foreign exchange rates are recorded directly to stockholders’ equity through net unrealized capital gain or loss. The Plymouth Rock Company and Subsidiaries recorded a cumulative loss, before applicable taxes, of $1.2 million as of December 31, 2019 from foreign exchange rate changes. During 2020, The Plymouth Rock Company and Subsidiaries recorded a loss of $431,000 through net income as a result of a marketable security being deemed other-than-temporarily impaired. No loss was recorded during 2019. Where a decline in the value of a marketable security is deemed other-than-temporary, the value of the security is written down to its fair value. Any portion of the decline in value of a marketable fixed income security attributable to credit quality is reported as a component of net realized capital gains, while any portion attributable to other factors, such as fluctuations in interest rates, is reported as a component of other comprehensive income. Since unrealized losses are a component of stockholders’ equity, the recognition of other-than-temporary impairment losses has no effect on total comprehensive income or stockholders’ equity. Alternative equity investments are valued using the equity method, which approximates fair value, with all changes in value included in net income. The values of these holdings are generally determined by the managers of the investment vehicles on the basis of information reported to them as well as their assessments of the underlying investments.
E. Deferred Acquisition Costs
Commissions and premium taxes are deferred and amortized pro rata over the contract periods in which the related premiums are earned. All amounts deferred as of December 31 are charged to operations in the following year as the related premiums are earned. Deferred acquisition costs are presented net of an equivalent amount of deferred commission income on ceded reinsurance, with any deferred ceding commission income in excess of the deferred acquisition costs recorded as a liability. The amortization of deferred acquisition costs and deferred ceding commission income, including any excess portion, are presented on a net basis as policy acquisition expense on the statement of comprehensive income. Net amortization associated with these deferred costs for 2020 and 2019 for The Plymouth Rock Company and Subsidiaries was $94.8 million and $82.3 million, respectively, while the net amortization for the Palisades Reciprocal Group for 2020 and 2019 was $100.1 million and $83.0 million, respectively.
THE PLYMOUTH ROCK COMPANY
NOTES TO CONSOLIDATED FINANCIAL STATEMENTS
25
4. Summary of Significant Accounting Policies, continued
F. Recognition of Premium Revenues
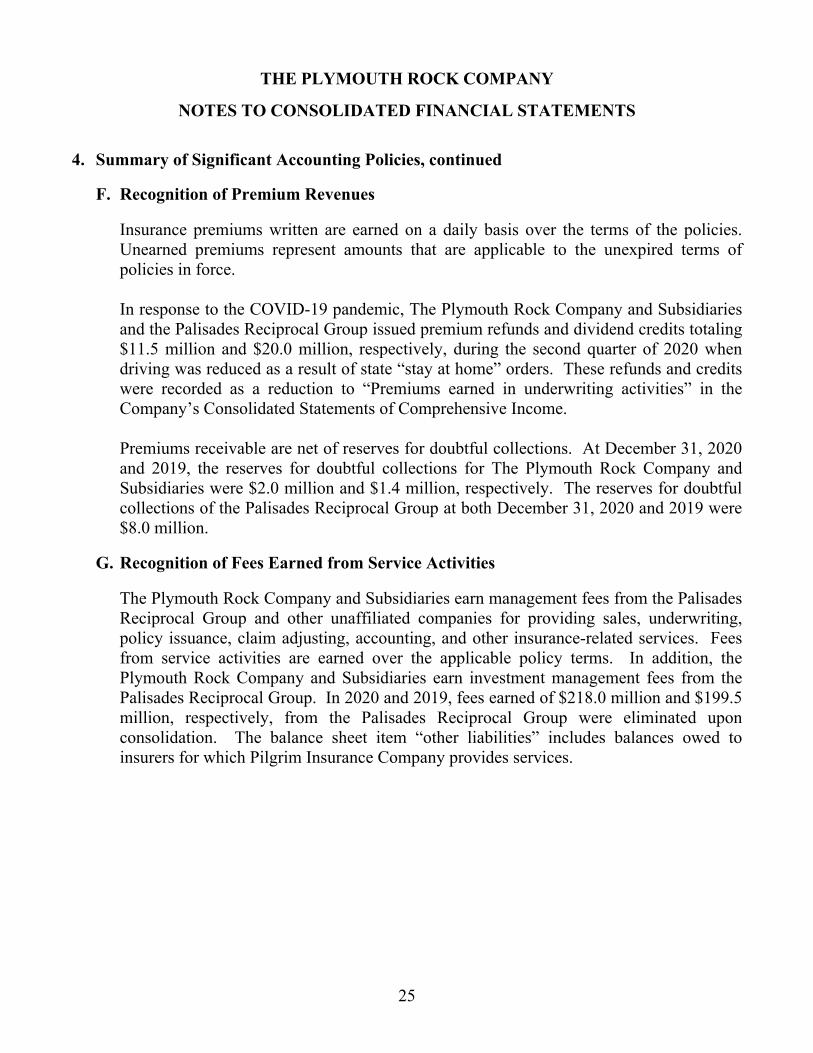
Insurance premiums written are earned on a daily basis over the terms of the policies. Unearned premiums represent amounts that are applicable to the unexpired terms of policies in force. In response to the COVID-19 pandemic, The Plymouth Rock Company and Subsidiaries and the Palisades Reciprocal Group issued premium refunds and dividend credits totaling $11.5 million and $20.0 million, respectively, during the second quarter of 2020 when driving was reduced as a result of state “stay at home” orders. These refunds and credits were recorded as a reduction to “Premiums earned in underwriting activities” in the Company’s Consolidated Statements of Comprehensive Income.
Premiums receivable are net of reserves for doubtful collections. At December 31, 2020 and 2019, the reserves for doubtful collections for The Plymouth Rock Company and Subsidiaries were $2.0 million and $1.4 million, respectively. The reserves for doubtful collections of the Palisades Reciprocal Group at both December 31, 2020 and 2019 were $8.0 million.
G. Recognition of Fees Earned from Service Activities
The Plymouth Rock Company and Subsidiaries earn management fees from the Palisades Reciprocal Group and other unaffiliated companies for providing sales, underwriting, policy issuance, claim adjusting, accounting, and other insurance-related services. Fees from service activities are earned over the applicable policy terms. In addition, the Plymouth Rock Company and Subsidiaries earn investment management fees from the Palisades Reciprocal Group. In 2020 and 2019, fees earned of $218.0 million and $199.5 million, respectively, from the Palisades Reciprocal Group were eliminated upon consolidation. The balance sheet item “other liabilities” includes balances owed to insurers for which Pilgrim Insurance Company provides services.
THE PLYMOUTH ROCK COMPANY
NOTES TO CONSOLIDATED FINANCIAL STATEMENTS
26
4. Summary of Significant Accounting Policies, continued
H. Amortization of Goodwill and Intangible Assets
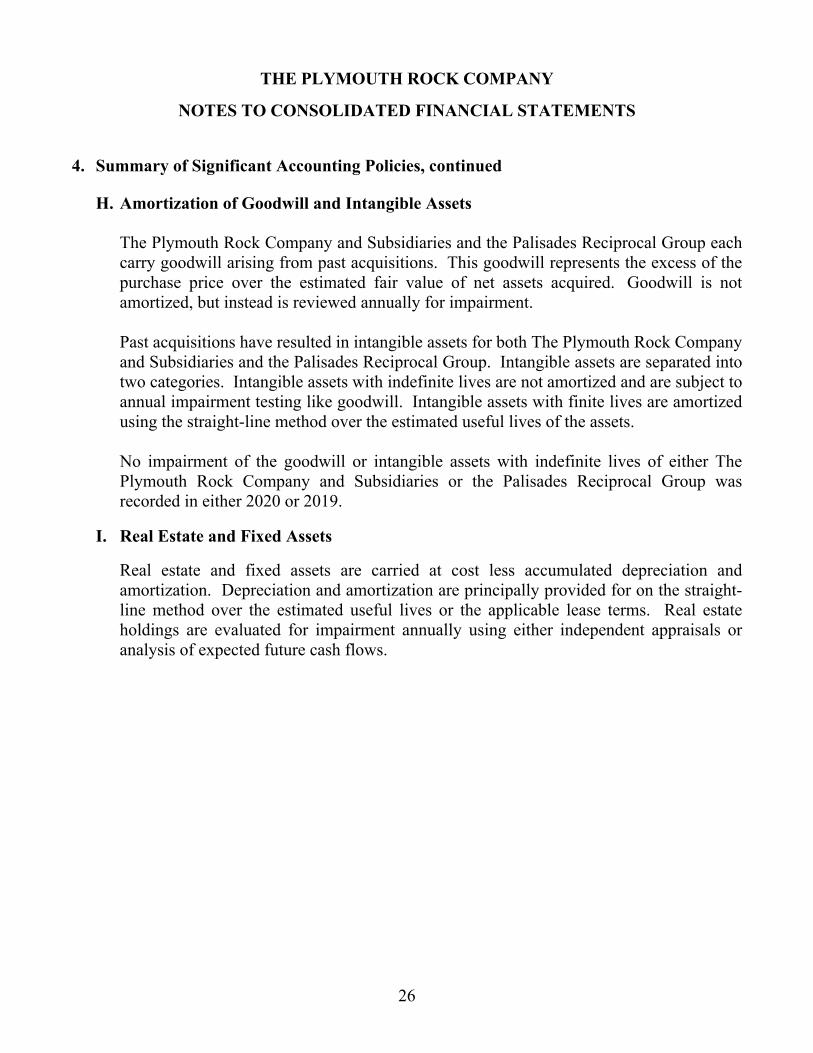
The Plymouth Rock Company and Subsidiaries and the Palisades Reciprocal Group each carry goodwill arising from past acquisitions. This goodwill represents the excess of the purchase price over the estimated fair value of net assets acquired. Goodwill is not amortized, but instead is reviewed annually for impairment. Past acquisitions have resulted in intangible assets for both The Plymouth Rock Company and Subsidiaries and the Palisades Reciprocal Group. Intangible assets are separated into two categories. Intangible assets with indefinite lives are not amortized and are subject to annual impairment testing like goodwill. Intangible assets with finite lives are amortized using the straight-line method over the estimated useful lives of the assets.
No impairment of the goodwill or intangible assets with indefinite lives of either The Plymouth Rock Company and Subsidiaries or the Palisades Reciprocal Group was recorded in either 2020 or 2019.
I. Real Estate and Fixed Assets
Real estate and fixed assets are carried at cost less accumulated depreciation and amortization. Depreciation and amortization are principally provided for on the straight-line method over the estimated useful lives or the applicable lease terms. Real estate holdings are evaluated for impairment annually using either independent appraisals or analysis of expected future cash flows.
THE PLYMOUTH ROCK COMPANY
NOTES TO CONSOLIDATED FINANCIAL STATEMENTS
27
5. Segment Reporting
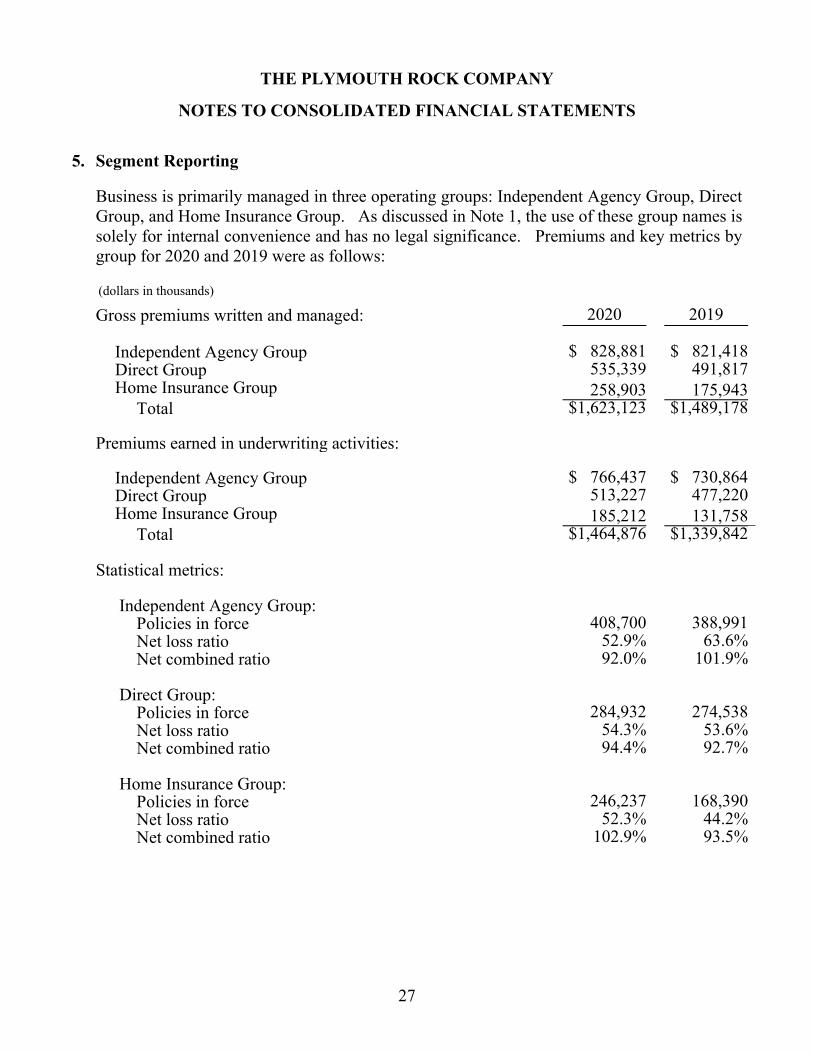
Business is primarily managed in three operating groups: Independent Agency Group, Direct Group, and Home Insurance Group. As discussed in Note 1, the use of these group names is solely for internal convenience and has no legal significance. Premiums and key metrics by group for 2020 and 2019 were as follows:
(dollars in thousands)
Gross premiums written and managed: 2020 2019 Independent Agency Group $ 828,881 $ 821,418 Direct Group 535,339 491,817 Home Insurance Group 258,903 175,943 Total $1,623,123 $1,489,178
Premiums earned in underwriting activities:
Independent Agency Group $ 766,437 $ 730,864 Direct Group 513,227 477,220 Home Insurance Group 185,212 131,758 Total $1,464,876 $1,339,842
Statistical metrics:
Independent Agency Group: Policies in force 408,700 388,991 Net loss ratio 52.9% 63.6% Net combined ratio 92.0% 101.9% Direct Group: Policies in force 284,932 274,538 Net loss ratio 54.3% 53.6% Net combined ratio 94.4% 92.7% Home Insurance Group: Policies in force 246,237 168,390 Net loss ratio 52.3% 44.2% Net combined ratio 102.9% 93.5%
THE PLYMOUTH ROCK COMPANY
NOTES TO CONSOLIDATED FINANCIAL STATEMENTS
28
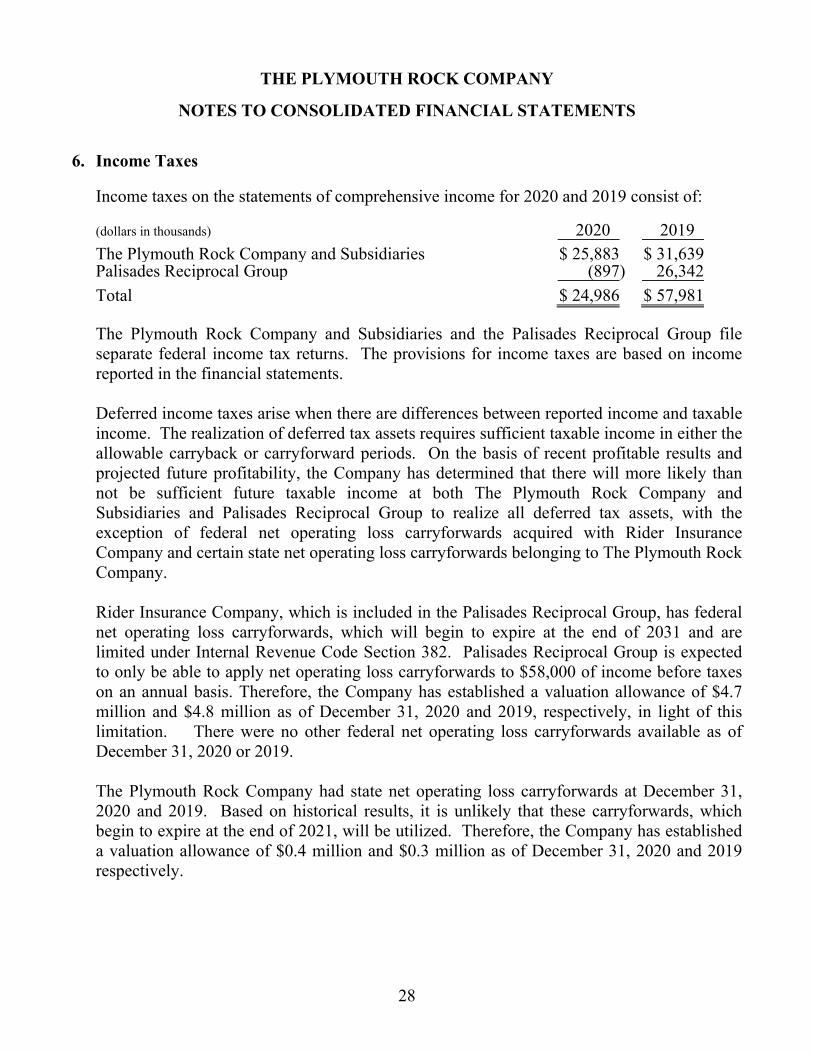
6. Income Taxes
Income taxes on the statements of comprehensive income for 2020 and 2019 consist of:
(dollars in thousands) 2020 2019 The Plymouth Rock Company and Subsidiaries $ 25,883 $ 31,639Palisades Reciprocal Group (897) 26,342
Total $ 24,986 $ 57,981
The Plymouth Rock Company and Subsidiaries and the Palisades Reciprocal Group file separate federal income tax returns. The provisions for income taxes are based on income reported in the financial statements.
Deferred income taxes arise when there are differences between reported income and taxable income. The realization of deferred tax assets requires sufficient taxable income in either the allowable carryback or carryforward periods. On the basis of recent profitable results and projected future profitability, the Company has determined that there will more likely than not be sufficient future taxable income at both The Plymouth Rock Company and Subsidiaries and Palisades Reciprocal Group to realize all deferred tax assets, with the exception of federal net operating loss carryforwards acquired with Rider Insurance Company and certain state net operating loss carryforwards belonging to The Plymouth Rock Company. Rider Insurance Company, which is included in the Palisades Reciprocal Group, has federal net operating loss carryforwards, which will begin to expire at the end of 2031 and are limited under Internal Revenue Code Section 382. Palisades Reciprocal Group is expected to only be able to apply net operating loss carryforwards to $58,000 of income before taxes on an annual basis. Therefore, the Company has established a valuation allowance of $4.7 million and $4.8 million as of December 31, 2020 and 2019, respectively, in light of this limitation. There were no other federal net operating loss carryforwards available as of December 31, 2020 or 2019. The Plymouth Rock Company had state net operating loss carryforwards at December 31, 2020 and 2019. Based on historical results, it is unlikely that these carryforwards, which begin to expire at the end of 2021, will be utilized. Therefore, the Company has established a valuation allowance of $0.4 million and $0.3 million as of December 31, 2020 and 2019 respectively.
THE PLYMOUTH ROCK COMPANY
NOTES TO CONSOLIDATED FINANCIAL STATEMENTS
29
6. Income Taxes, continued
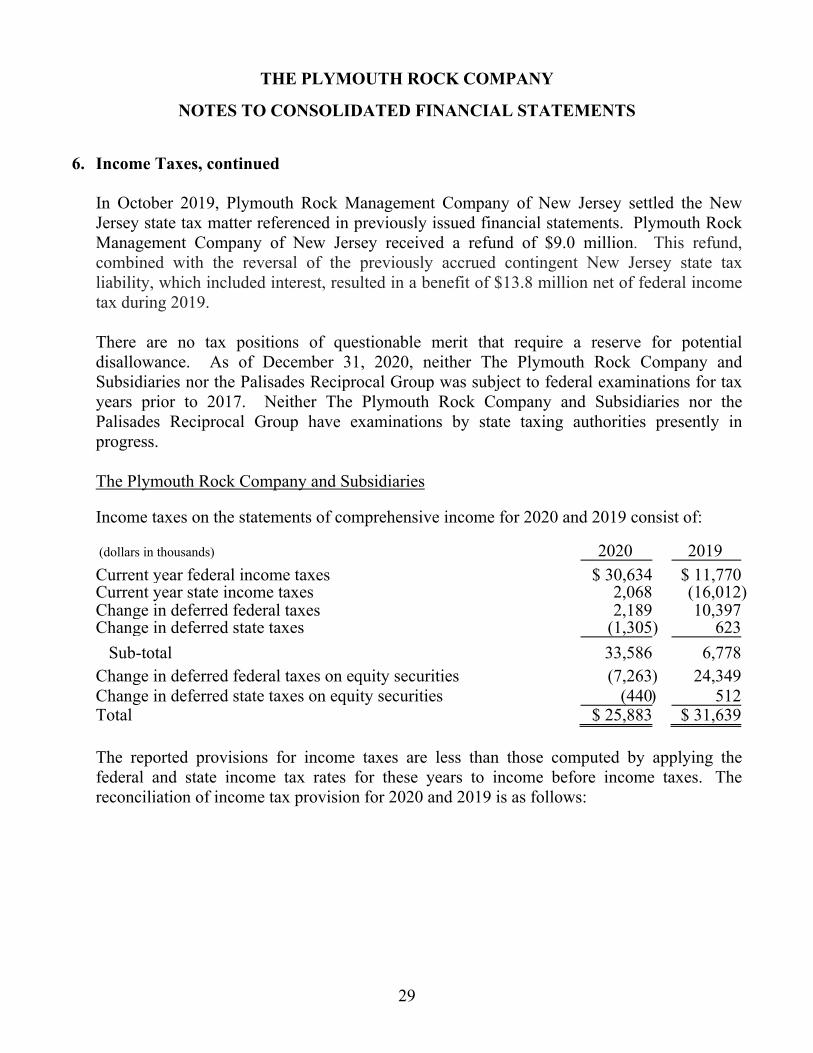
In October 2019, Plymouth Rock Management Company of New Jersey settled the New Jersey state tax matter referenced in previously issued financial statements. Plymouth Rock Management Company of New Jersey received a refund of $9.0 million. This refund, combined with the reversal of the previously accrued contingent New Jersey state tax liability, which included interest, resulted in a benefit of $13.8 million net of federal income tax during 2019.
There are no tax positions of questionable merit that require a reserve for potential disallowance. As of December 31, 2020, neither The Plymouth Rock Company and Subsidiaries nor the Palisades Reciprocal Group was subject to federal examinations for tax years prior to 2017. Neither The Plymouth Rock Company and Subsidiaries nor the Palisades Reciprocal Group have examinations by state taxing authorities presently in progress.
The Plymouth Rock Company and Subsidiaries Income taxes on the statements of comprehensive income for 2020 and 2019 consist of:
(dollars in thousands) 2020 2019
Current year federal income taxes $ 30,634 $ 11,770Current year state income taxes 2,068 (16,012) Change in deferred federal taxes 2,189 10,397 Change in deferred state taxes (1,305) 623
Sub-total 33,586 6,778Change in deferred federal taxes on equity securities (7,263) 24,349Change in deferred state taxes on equity securities (440) 512Total $ 25,883 $ 31,639
The reported provisions for income taxes are less than those computed by applying the federal and state income tax rates for these years to income before income taxes. The reconciliation of income tax provision for 2020 and 2019 is as follows:
THE PLYMOUTH ROCK COMPANY
NOTES TO CONSOLIDATED FINANCIAL STATEMENTS
30
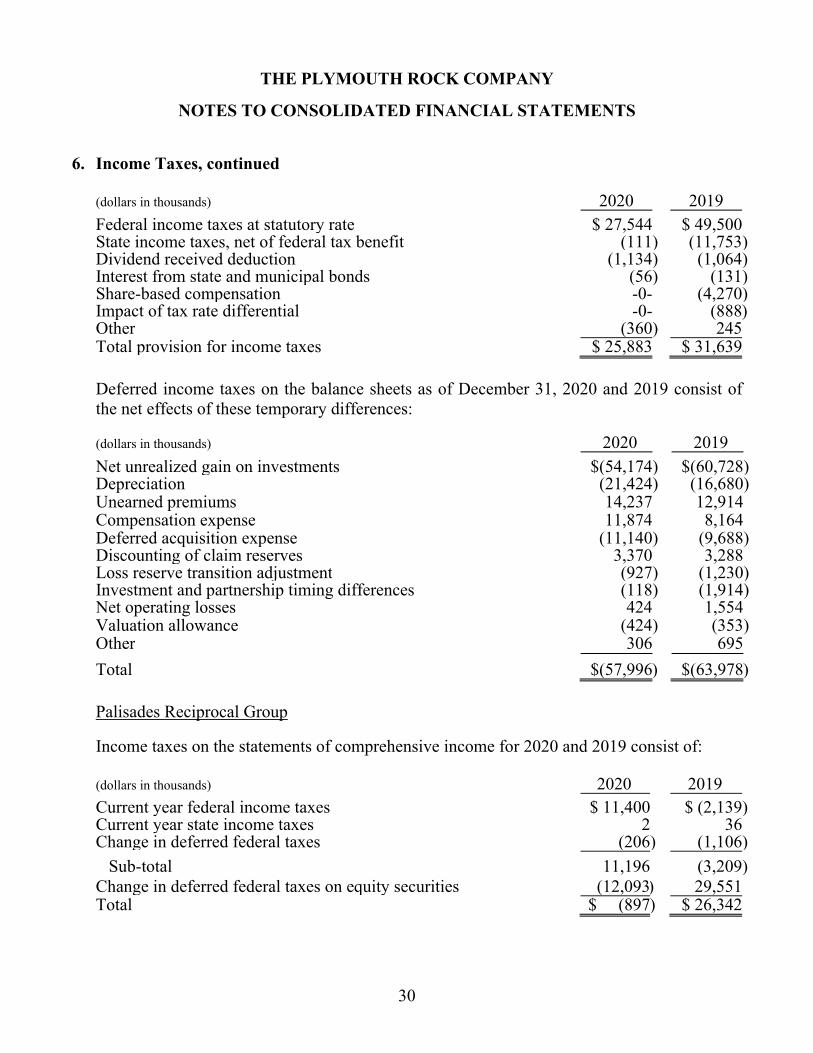
6. Income Taxes, continued
(dollars in thousands) 2020 2019 Federal income taxes at statutory rate $ 27,544 $ 49,500State income taxes, net of federal tax benefit (111) (11,753) Dividend received deduction (1,134) (1,064) Interest from state and municipal bonds (56) (131) Share-based compensation -0- (4,270) Impact of tax rate differential -0- (888) Other (360) 245Total provision for income taxes $ 25,883 $ 31,639
Deferred income taxes on the balance sheets as of December 31, 2020 and 2019 consist of the net effects of these temporary differences:
(dollars in thousands) 2020 2019
Net unrealized gain on investments $(54,174) $(60,728) Depreciation (21,424) (16,680) Unearned premiums 14,237 12,914 Compensation expense 11,874 8,164 Deferred acquisition expense (11,140) (9,688) Discounting of claim reserves 3,370 3,288 Loss reserve transition adjustment (927) (1,230) Investment and partnership timing differences (118) (1,914) Net operating losses 424 1,554 Valuation allowance (424) (353) Other 306 695
Total $(57,996) $(63,978)
Palisades Reciprocal Group
Income taxes on the statements of comprehensive income for 2020 and 2019 consist of: (dollars in thousands) 2020 2019 Current year federal income taxes $ 11,400 $ (2,139) Current year state income taxes 2 36Change in deferred federal taxes (206) (1,106)
Sub-total 11,196 (3,209) Change in deferred federal taxes on equity securities (12,093) 29,551 Total $ (897) $ 26,342
THE PLYMOUTH ROCK COMPANY
NOTES TO CONSOLIDATED FINANCIAL STATEMENTS
31
6. Income Taxes, continued
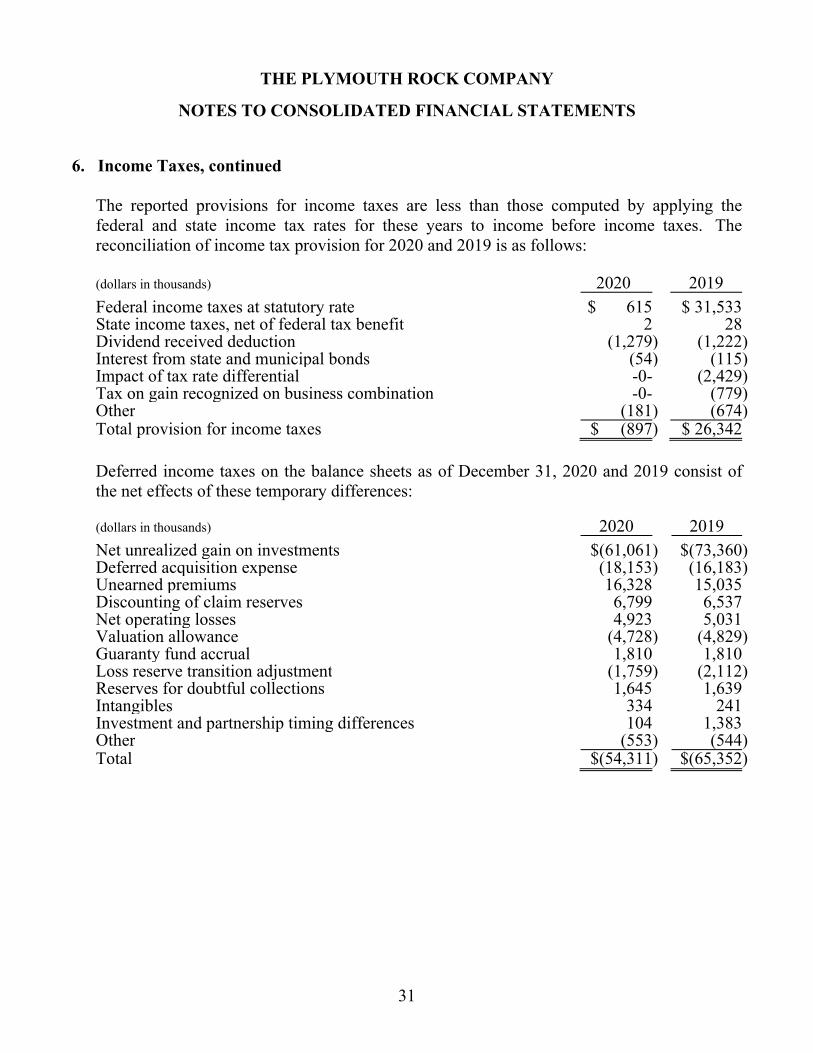
The reported provisions for income taxes are less than those computed by applying the federal and state income tax rates for these years to income before income taxes. The reconciliation of income tax provision for 2020 and 2019 is as follows:
(dollars in thousands) 2020 2019
Federal income taxes at statutory rate $ 615 $ 31,533State income taxes, net of federal tax benefit 2 28Dividend received deduction (1,279) (1,222) Interest from state and municipal bonds (54) (115) Impact of tax rate differential -0- (2,429) Tax on gain recognized on business combination -0- (779) Other (181) (674) Total provision for income taxes $ (897) $ 26,342
Deferred income taxes on the balance sheets as of December 31, 2020 and 2019 consist of the net effects of these temporary differences:
(dollars in thousands) 2020 2019 Net unrealized gain on investments $(61,061) $(73,360) Deferred acquisition expense (18,153) (16,183) Unearned premiums 16,328 15,035 Discounting of claim reserves 6,799 6,537 Net operating losses 4,923 5,031 Valuation allowance (4,728) (4,829) Guaranty fund accrual 1,810 1,810 Loss reserve transition adjustment (1,759) (2,112) Reserves for doubtful collections 1,645 1,639 Intangibles 334 241 Investment and partnership timing differences 104 1,383 Other (553) (544) Total $(54,311) $(65,352)
THE PLYMOUTH ROCK COMPANY
NOTES TO CONSOLIDATED FINANCIAL STATEMENTS
32
7. Claim and Claim Adjustment Expense Reserves
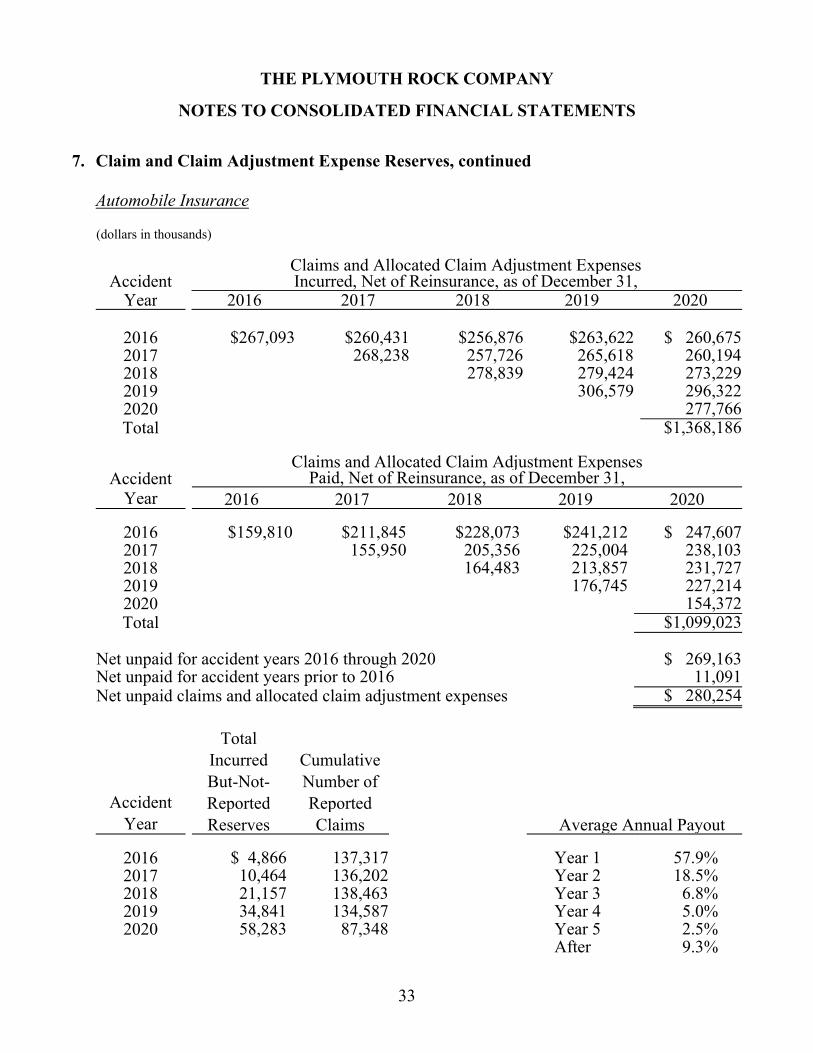
Claim reserves represent the estimated liabilities for claims that have already been reported and for claims that have been incurred but not yet reported. Claim adjustment expense reserves represent the estimated expenses that will be required to settle these claims. Claim and claim adjustment expense reserves are presented on the Consolidated Balance Sheets before estimated recoveries for reinsurance. There are a variety of actuarial methods used to estimate claim reserves and claim adjustment expense reserves, including paid and incurred development methods. When deciding among methods, the credibility of each method based on the maturity of the data available and the claims settlement practices for each particular line of insurance business or coverage within a line of insurance business is evaluated. The methods used are reviewed regularly, and any adjustments to these reserves are reflected in income currently.
The Plymouth Rock Company and Subsidiaries
The following tables provide data regarding incurred and paid claims and claim adjustment expense development as of December 31, 2020, net of reinsurance, as well as the total of incurred-but-not-reported reserves and cumulative number of reported claims for recent accident years for the primary business segments. The incurred-but-not-reported reserves data shown below also include expected development on reported claims. The cumulative number of reported claims is identified at the coverage level and includes claims closed with payment, claims closed without payment, and all open claims. Data as of December 31, 2016 are unaudited. Five years of data are presented, as any claim and claim adjustment expense development beyond that point would be insignificant for the relatively short-tail automobile and home insurance coverages which The Plymouth Rock Company and Subsidiaries primarily write.
THE PLYMOUTH ROCK COMPANY
NOTES TO CONSOLIDATED FINANCIAL STATEMENTS
33
7. Claim and Claim Adjustment Expense Reserves, continued
Automobile Insurance (dollars in thousands)
Claims and Allocated Claim Adjustment Expenses
Accident Incurred, Net of Reinsurance, as of December 31, Year 2016 2017 2018 2019 2020
2016 $267,093 $260,431 $256,876 $263,622 $ 260,675 2017 268,238 257,726 265,618 260,194 2018 278,839 279,424 273,229 2019 306,579 296,322 2020 277,766 Total $1,368,186
Claims and Allocated Claim Adjustment Expenses
Accident Paid, Net of Reinsurance, as of December 31, Year 2016 2017 2018 2019 2020
2016 $159,810 $211,845 $228,073 $241,212 $ 247,607 2017 155,950 205,356 225,004 238,103 2018 164,483 213,857 231,727 2019 176,745 227,214 2020 154,372 Total $1,099,023
Net unpaid for accident years 2016 through 2020 $ 269,163 Net unpaid for accident years prior to 2016 11,091 Net unpaid claims and allocated claim adjustment expenses $ 280,254
Total
Incurred Cumulative
But-Not- Number of
Accident Reported Reported
Year Reserves Claims Average Annual Payout
2016 $ 4,866 137,317 Year 1 57.9% 2017 10,464 136,202 Year 2 18.5% 2018 21,157 138,463 Year 3 6.8% 2019 34,841 134,587 Year 4 5.0% 2020 58,283 87,348 Year 5 2.5%
After 9.3%
THE PLYMOUTH ROCK COMPANY
NOTES TO CONSOLIDATED FINANCIAL STATEMENTS
34
7. Claim and Claim Adjustment Expense Reserves, continued
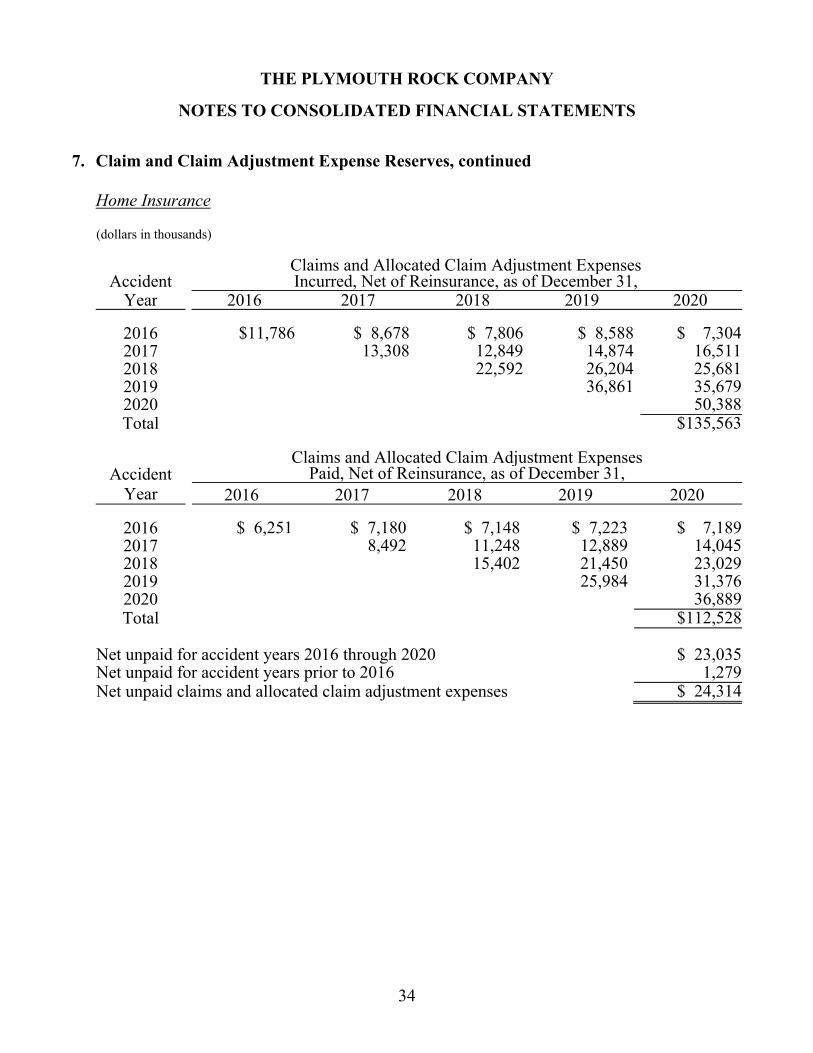
Home Insurance (dollars in thousands)
Claims and Allocated Claim Adjustment Expenses
Accident Incurred, Net of Reinsurance, as of December 31, Year 2016 2017 2018 2019 2020
2016 $11,786 $ 8,678 $ 7,806 $ 8,588 $ 7,304 2017 13,308 12,849 14,874 16,511 2018 22,592 26,204 25,681 2019 36,861 35,679 2020 50,388 Total $135,563
Claims and Allocated Claim Adjustment Expenses
Accident Paid, Net of Reinsurance, as of December 31, Year 2016 2017 2018 2019 2020
2016 $ 6,251 $ 7,180 $ 7,148 $ 7,223 $ 7,189 2017 8,492 11,248 12,889 14,045 2018 15,402 21,450 23,029 2019 25,984 31,376 2020 36,889 Total $112,528
Net unpaid for accident years 2016 through 2020 $ 23,035 Net unpaid for accident years prior to 2016 1,279 Net unpaid claims and allocated claim adjustment expenses $ 24,314
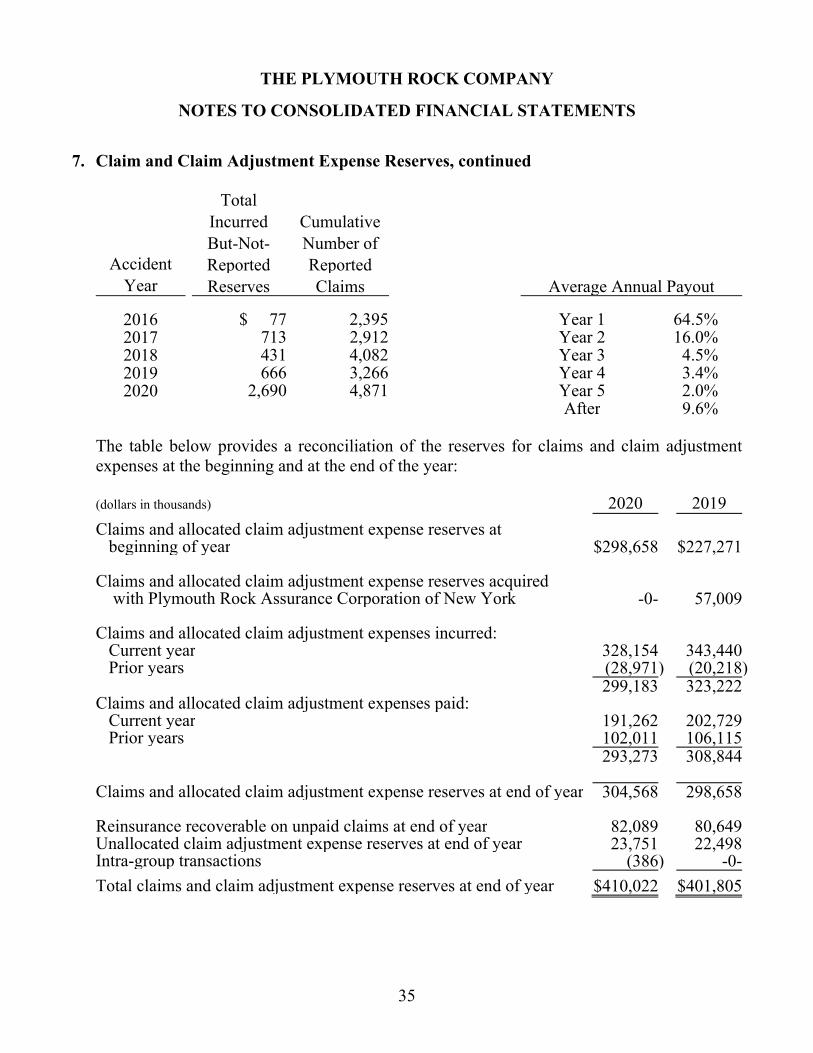
THE PLYMOUTH ROCK COMPANY
NOTES TO CONSOLIDATED FINANCIAL STATEMENTS
35
7. Claim and Claim Adjustment Expense Reserves, continued
Total
Incurred Cumulative
But-Not- Number of
Accident Reported Reported
Year Reserves Claims Average Annual Payout
2016 $ 77 2,395 Year 1 64.5% 2017 713 2,912 Year 2 16.0% 2018 431 4,082 Year 3 4.5% 2019 666 3,266 Year 4 3.4% 2020 2,690 4,871 Year 5 2.0%
After 9.6%
The table below provides a reconciliation of the reserves for claims and claim adjustment expenses at the beginning and at the end of the year: (dollars in thousands) 2020 2019
Claims and allocated claim adjustment expense reserves at beginning of year $298,658 $227,271
Claims and allocated claim adjustment expense reserves acquired with Plymouth Rock Assurance Corporation of New York -0- 57,009 Claims and allocated claim adjustment expenses incurred: Current year 328,154 343,440 Prior years (28,971) (20,218)
299,183 323,222Claims and allocated claim adjustment expenses paid: Current year 191,262 202,729 Prior years 102,011 106,115
293,273 308,844
Claims and allocated claim adjustment expense reserves at end of year 304,568 298,658 Reinsurance recoverable on unpaid claims at end of year 82,089 80,649 Unallocated claim adjustment expense reserves at end of year 23,751 22,498 Intra-group transactions (386) -0-
Total claims and claim adjustment expense reserves at end of year $410,022 $401,805
THE PLYMOUTH ROCK COMPANY
NOTES TO CONSOLIDATED FINANCIAL STATEMENTS
36
7. Claim and Claim Adjustment Expense Reserves, continued
During the year ended December 31, 2020, reserves for claims and allocated claim adjustment expenses for prior years developed favorably by $29.0 million. This was composed of $27.5 million from automobile business and $1.5 million from home business. During the year ended December 31, 2019, reserves for claims and allocated claim adjustment expenses for prior years developed favorably by $20.2 million. This was composed of $18.9 million from automobile business and $1.3 million from home business. Massachusetts private passenger automobile business was the largest contributor to this development in both years. The amounts shown in the preceding table include $73.5 million and $71.2 million of estimated claim and claim adjustment expense reserves related to Pilgrim Insurance Company’s service business as of December 31, 2020 and December 31, 2019, respectively. Offsetting amounts are included in “amounts receivable from reinsurers and pools” as assets on the balance sheet. While these policies are issued by Pilgrim, most of the underwriting results have been ceded either to its clients, a reinsurer or industry pools via quota share reinsurance arrangements such that Pilgrim retains only a relatively small amount of the underwriting risk. Palisades Reciprocal Group
The following tables provide data regarding incurred and paid claims and claim adjustment expense development as of December 31, 2020, net of reinsurance, as well as the total of incurred-but-not-reported reserves and cumulative number of reported claims for recent accident years for the primary business segments. The incurred-but-not-reported reserves data shown below also include expected development on reported claims. The cumulative number of reported claims is identified at the coverage level and includes claims closed with payment, claims closed without payment, and all open claims. Data as of December 31, 2016 are unaudited. Five years of data are presented, as any claim and claim adjustment expense development beyond that point would be insignificant for the relatively short-tail automobile and home coverages which the Palisades Reciprocal Group primarily writes.
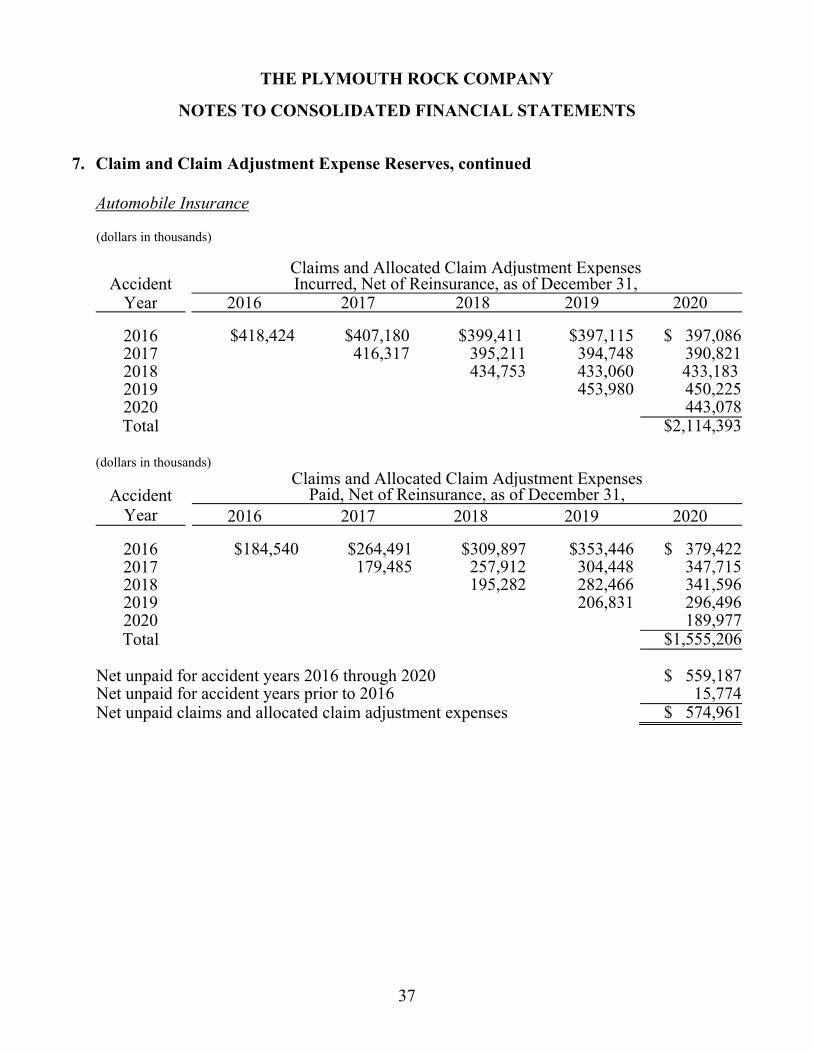
THE PLYMOUTH ROCK COMPANY
NOTES TO CONSOLIDATED FINANCIAL STATEMENTS
37
7. Claim and Claim Adjustment Expense Reserves, continued
Automobile Insurance (dollars in thousands)
Claims and Allocated Claim Adjustment Expenses
Accident Incurred, Net of Reinsurance, as of December 31, Year 2016 2017 2018 2019 2020
2016 $418,424 $407,180 $399,411 $397,115 $ 397,086 2017 416,317 395,211 394,748 390,821 2018 434,753 433,060 433,183 2019 453,980 450,225 2020 443,078 Total $2,114,393
(dollars in thousands)
Claims and Allocated Claim Adjustment Expenses Accident Paid, Net of Reinsurance, as of December 31,
Year 2016 2017 2018 2019 2020
2016 $184,540 $264,491 $309,897 $353,446 $ 379,422 2017 179,485 257,912 304,448 347,715 2018 195,282 282,466 341,596 2019 206,831 296,496 2020 189,977 Total $1,555,206
Net unpaid for accident years 2016 through 2020 $ 559,187 Net unpaid for accident years prior to 2016 15,774 Net unpaid claims and allocated claim adjustment expenses $ 574,961
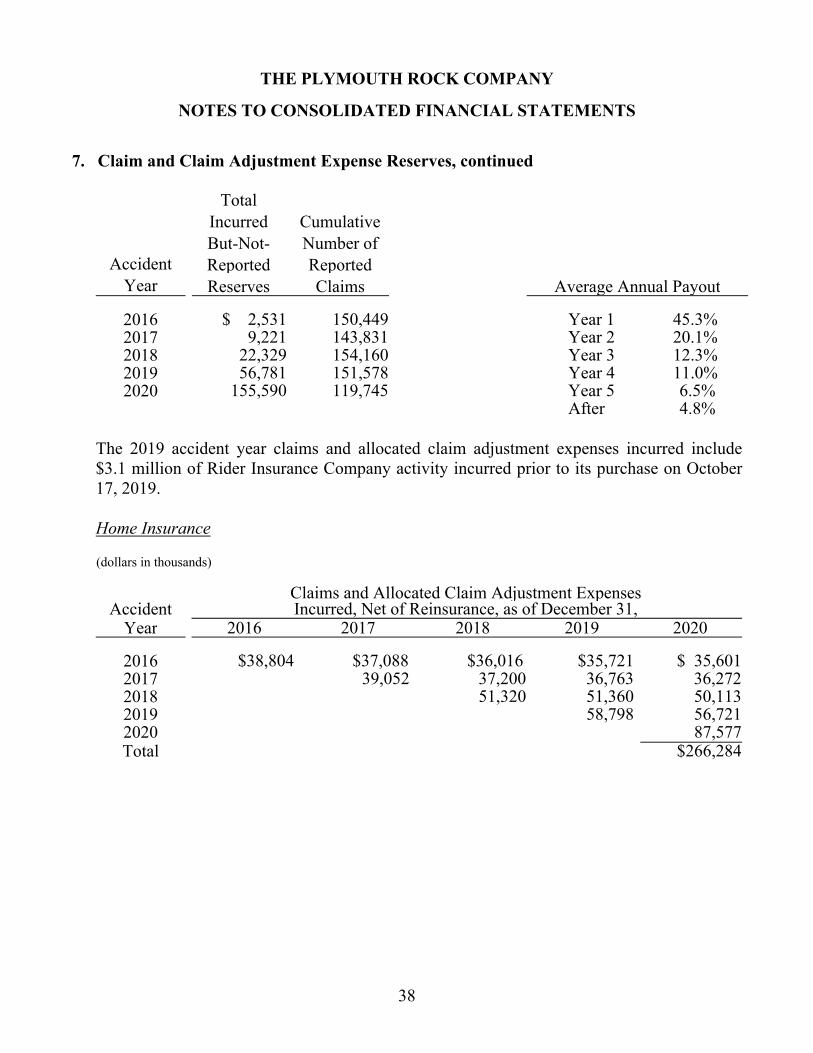
THE PLYMOUTH ROCK COMPANY
NOTES TO CONSOLIDATED FINANCIAL STATEMENTS
38
7. Claim and Claim Adjustment Expense Reserves, continued
Total
Incurred Cumulative
But-Not- Number of
Accident Reported Reported
Year Reserves Claims Average Annual Payout
2016 $ 2,531 150,449 Year 1 45.3% 2017 9,221 143,831 Year 2 20.1% 2018 22,329 154,160 Year 3 12.3% 2019 56,781 151,578 Year 4 11.0% 2020 155,590 119,745 Year 5 6.5%
After 4.8%
The 2019 accident year claims and allocated claim adjustment expenses incurred include $3.1 million of Rider Insurance Company activity incurred prior to its purchase on October 17, 2019. Home Insurance (dollars in thousands)
Claims and Allocated Claim Adjustment Expenses
Accident Incurred, Net of Reinsurance, as of December 31, Year 2016 2017 2018 2019 2020
2016 $38,804 $37,088 $36,016 $35,721 $ 35,601 2017 39,052 37,200 36,763 36,272 2018 51,320 51,360 50,113 2019 58,798 56,721 2020 87,577 Total $266,284
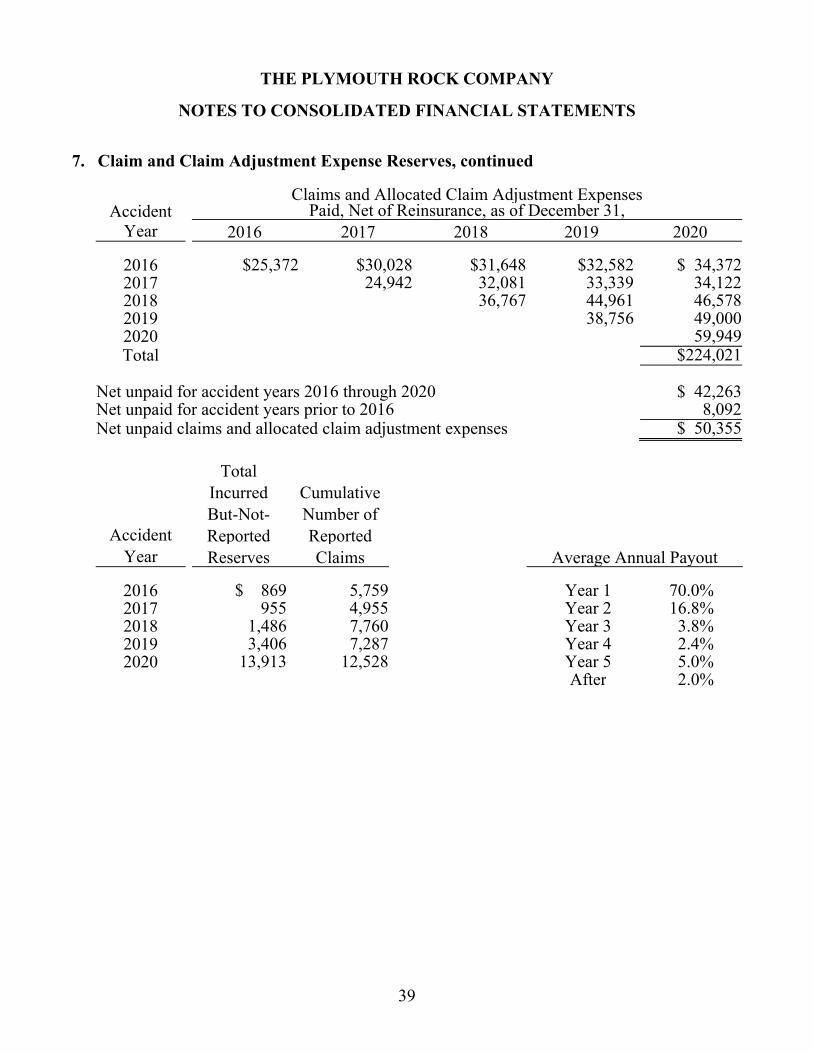
THE PLYMOUTH ROCK COMPANY
NOTES TO CONSOLIDATED FINANCIAL STATEMENTS
39
7. Claim and Claim Adjustment Expense Reserves, continued
Claims and Allocated Claim Adjustment Expenses Accident Paid, Net of Reinsurance, as of December 31,
Year 2016 2017 2018 2019 2020
2016 $25,372 $30,028 $31,648 $32,582 $ 34,372 2017 24,942 32,081 33,339 34,122 2018 36,767 44,961 46,578 2019 38,756 49,000 2020 59,949 Total $224,021
Net unpaid for accident years 2016 through 2020 $ 42,263 Net unpaid for accident years prior to 2016 8,092 Net unpaid claims and allocated claim adjustment expenses $ 50,355
Total
Incurred Cumulative
But-Not- Number of
Accident Reported Reported
Year Reserves Claims Average Annual Payout
2016 $ 869 5,759 Year 1 70.0% 2017 955 4,955 Year 2 16.8% 2018 1,486 7,760 Year 3 3.8% 2019 3,406 7,287 Year 4 2.4% 2020 13,913 12,528 Year 5 5.0%
After 2.0%
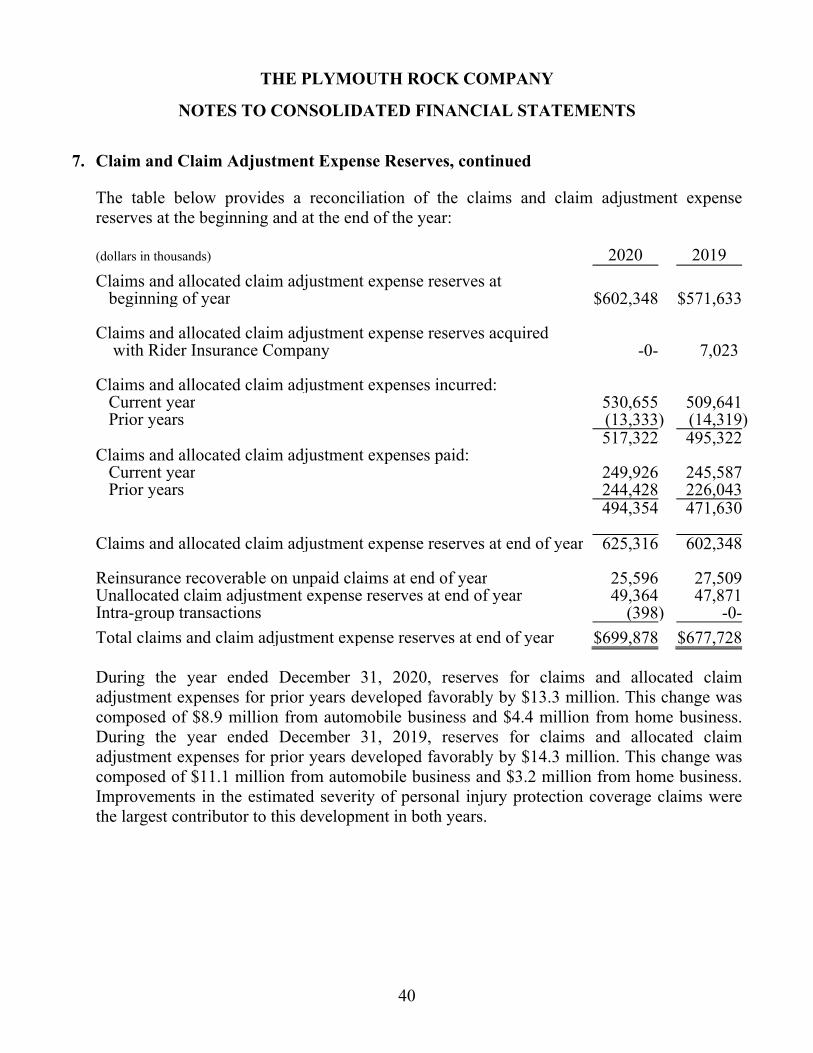
THE PLYMOUTH ROCK COMPANY
NOTES TO CONSOLIDATED FINANCIAL STATEMENTS
40
7. Claim and Claim Adjustment Expense Reserves, continued
The table below provides a reconciliation of the claims and claim adjustment expense reserves at the beginning and at the end of the year: (dollars in thousands) 2020 2019
Claims and allocated claim adjustment expense reserves at beginning of year $602,348 $571,633
Claims and allocated claim adjustment expense reserves acquired with Rider Insurance Company -0- 7,023
Claims and allocated claim adjustment expenses incurred: Current year 530,655 509,641 Prior years (13,333) (14,319)
517,322 495,322Claims and allocated claim adjustment expenses paid: Current year 249,926 245,587 Prior years 244,428 226,043
494,354 471,630
Claims and allocated claim adjustment expense reserves at end of year 625,316 602,348 Reinsurance recoverable on unpaid claims at end of year 25,596 27,509 Unallocated claim adjustment expense reserves at end of year 49,364 47,871 Intra-group transactions (398) -0-
Total claims and claim adjustment expense reserves at end of year $699,878 $677,728
During the year ended December 31, 2020, reserves for claims and allocated claim adjustment expenses for prior years developed favorably by $13.3 million. This change was composed of $8.9 million from automobile business and $4.4 million from home business. During the year ended December 31, 2019, reserves for claims and allocated claim adjustment expenses for prior years developed favorably by $14.3 million. This change was composed of $11.1 million from automobile business and $3.2 million from home business. Improvements in the estimated severity of personal injury protection coverage claims were the largest contributor to this development in both years.
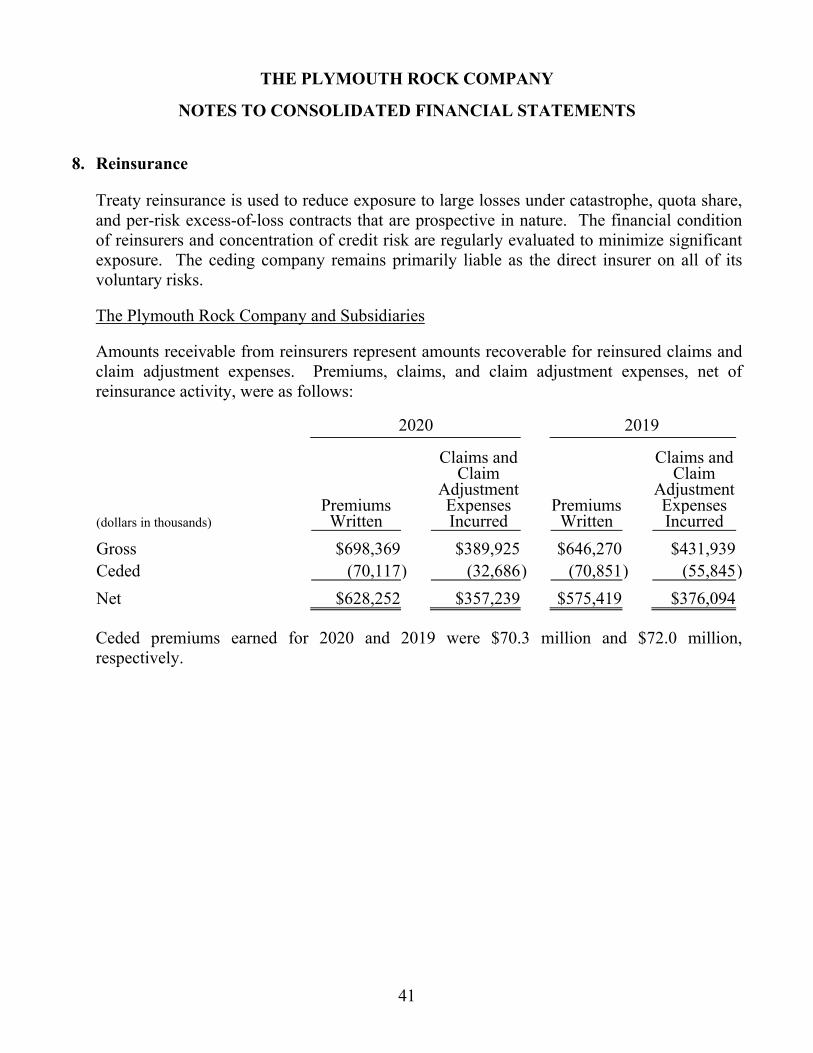
THE PLYMOUTH ROCK COMPANY
NOTES TO CONSOLIDATED FINANCIAL STATEMENTS
41
8. Reinsurance
Treaty reinsurance is used to reduce exposure to large losses under catastrophe, quota share, and per-risk excess-of-loss contracts that are prospective in nature. The financial condition of reinsurers and concentration of credit risk are regularly evaluated to minimize significant exposure. The ceding company remains primarily liable as the direct insurer on all of its voluntary risks.
The Plymouth Rock Company and Subsidiaries Amounts receivable from reinsurers represent amounts recoverable for reinsured claims and claim adjustment expenses. Premiums, claims, and claim adjustment expenses, net of reinsurance activity, were as follows:
2020 2019
Premiums
Claims and Claim
Adjustment Expenses
Premiums
Claims and Claim
Adjustment Expenses
(dollars in thousands) Written Incurred Written Incurred
Gross $698,369 $389,925 $646,270 $431,939 Ceded (70,117 ) (32,686 ) (70,851 ) (55,845 )
Net $628,252 $357,239 $575,419 $376,094
Ceded premiums earned for 2020 and 2019 were $70.3 million and $72.0 million, respectively.
THE PLYMOUTH ROCK COMPANY
NOTES TO CONSOLIDATED FINANCIAL STATEMENTS
42
8. Reinsurance, continued
Concurrent with its acquisition effective April 1, 2018, Plymouth Rock Assurance Preferred Corporation entered into a 100% quota share reinsurance agreement with 21st Century North America Insurance Company under which Plymouth Rock Assurance Preferred Corporation ceded 100% of the underwriting results of all Plymouth Rock Assurance Preferred Corporation policies issued on 21st Century systems through and until December 2018. Claims and claim adjustment expenses of $157,000 and $1.2 million were ceded under this agreement during 2020 and 2019, respectively. Also concurrent with its acquisition, Plymouth Rock Assurance Preferred Corporation entered into service agreements with 21st Century North America Insurance Company and 21st Century Advantage Insurance Company and a 100% quota share reinsurance agreement with 21st Century North America Insurance Company under which Plymouth Rock Assurance Preferred Corporation services and assumes the underwriting results for all New York private passenger automobile policies issued by Plymouth Rock Assurance Preferred Corporation on Plymouth Rock systems on behalf of 21st Century North America Insurance Company and 21st Century Advantage Insurance Company on and after April 1, 2018. Premiums of $6.4 million and claims and claim adjustment expenses of $3.9 million were assumed under this agreement during 2020, while premiums of $7.8 million and claims and claim adjustment expenses of $6.6 million were assumed under this agreement during 2019.
The Plymouth Rock Company and Subsidiaries also has treaties in place for catastrophe reinsurance for automobile and home lines of business, and per-risk excess-of-loss reinsurance for home, commercial automobile, and umbrella lines of business. During the years ended December 31, 2020 and 2019, the underwriting cost incurred for these treaties was $12.6 million and $10.4 million, respectively.
The Plymouth Rock Company and Subsidiaries also has in place 100% quota share reinsurance with the National Flood Insurance Program for flood coverage written on a direct basis. Premiums ceded under this program were $712,000 and $771,000 in 2020 and 2019, respectively, while ceded claims, claim adjustment expenses and ceding commissions totaled $42,000 and $59,000, respectively.
Two subsidiaries of The Plymouth Rock Company, Plymouth Rock Assurance Corporation and Pilgrim Insurance Company, are members of Commonwealth Automobile Reinsurers (CAR), which administers pools for the Massachusetts commercial automobile residual market. Plymouth Rock Assurance Corporation and Pilgrim Insurance Company record their estimated shares of this activity on the basis of information provided by CAR.
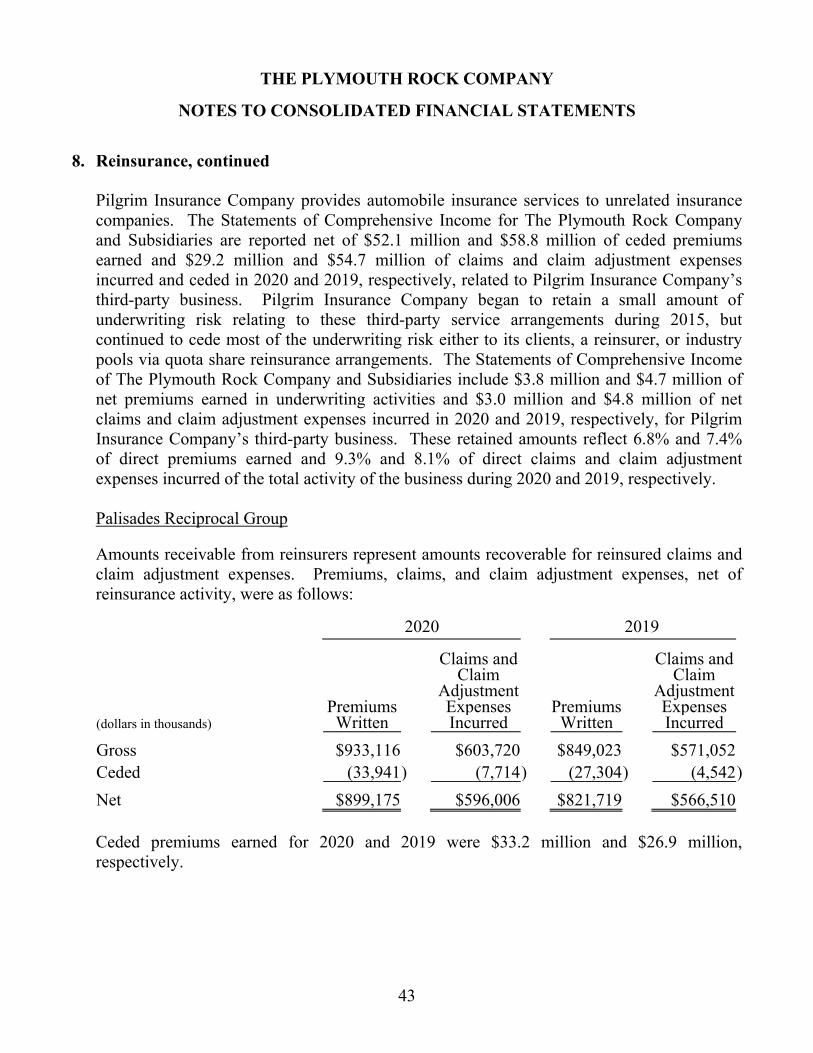
THE PLYMOUTH ROCK COMPANY
NOTES TO CONSOLIDATED FINANCIAL STATEMENTS
43
8. Reinsurance, continued
Pilgrim Insurance Company provides automobile insurance services to unrelated insurance companies. The Statements of Comprehensive Income for The Plymouth Rock Company and Subsidiaries are reported net of $52.1 million and $58.8 million of ceded premiums earned and $29.2 million and $54.7 million of claims and claim adjustment expenses incurred and ceded in 2020 and 2019, respectively, related to Pilgrim Insurance Company’s third-party business. Pilgrim Insurance Company began to retain a small amount of underwriting risk relating to these third-party service arrangements during 2015, but continued to cede most of the underwriting risk either to its clients, a reinsurer, or industry pools via quota share reinsurance arrangements. The Statements of Comprehensive Income of The Plymouth Rock Company and Subsidiaries include $3.8 million and $4.7 million of net premiums earned in underwriting activities and $3.0 million and $4.8 million of net claims and claim adjustment expenses incurred in 2020 and 2019, respectively, for Pilgrim Insurance Company’s third-party business. These retained amounts reflect 6.8% and 7.4% of direct premiums earned and 9.3% and 8.1% of direct claims and claim adjustment expenses incurred of the total activity of the business during 2020 and 2019, respectively.
Palisades Reciprocal Group Amounts receivable from reinsurers represent amounts recoverable for reinsured claims and claim adjustment expenses. Premiums, claims, and claim adjustment expenses, net of reinsurance activity, were as follows:
2020 2019
Premiums
Claims and Claim
Adjustment Expenses
Premiums
Claims and Claim
Adjustment Expenses
(dollars in thousands) Written Incurred Written Incurred
Gross $933,116 $603,720 $849,023 $571,052 Ceded (33,941 ) (7,714 ) (27,304 ) (4,542 )
Net $899,175 $596,006 $821,719 $566,510
Ceded premiums earned for 2020 and 2019 were $33.2 million and $26.9 million, respectively.
THE PLYMOUTH ROCK COMPANY
NOTES TO CONSOLIDATED FINANCIAL STATEMENTS
44
8. Reinsurance, continued
Concurrent with its acquisition effective August 1, 2018, AtHome Insurance Company entered into a 100% quota share reinsurance agreement with 21st Century North America Insurance Company under which AtHome Insurance Company cedes 100% of the underwriting results of all policies issued by AtHome prior to its acquisition. Claims and claim adjustment expenses of $1.1 million and $1.2 million were ceded under this agreement during 2020 and 2019, respectively. As of the time of acquisition, AtHome Insurance Company was not transacting business in any state and had non-renewed its pre-acquisition private passenger automobile business in New York.
The Palisades Reciprocal Group has in place catastrophe reinsurance for the automobile and home lines of business, and per-risk excess-of-loss reinsurance treaties on the home, commercial automobile, and umbrella lines of business. During the years ended December 31, 2020 and 2019, the underwriting cost incurred for these treaties was $21.1 million and $17.2 million, respectively. The Palisades Reciprocal Group also has in place 100% quota share reinsurance with the National Flood Insurance Program for flood coverage that it writes on a direct basis. Premiums ceded under this program were $3.2 million and $3.4 million in 2020 and 2019, respectively, while ceded claims, claim adjustment expenses and ceding commissions totaled $590,000 and $639,000, respectively.
9. Secured Loans
At December 31, 2019, The Plymouth Rock Company had outstanding a secured loan from a bank with a carrying value of $5.0 million. This loan was structured with monthly payments of interest only, payable at a variable interest rate based on LIBOR and was paid in full in December 2020. The Plymouth Rock Company had pledged to the bank, as collateral, securities which had a market value of $7.1 million as of December 31, 2019. The Plymouth Rock Company incurred $92,000 and $179,000 of interest expense on this loan during 2020 and 2019, respectively.
10. Subsequent Events
Subsequent events have been evaluated from December 31, 2020 through March 10, 2021. One event was the sale of InsuraMatch, LLC on February 1, 2021, which is discussed further in Note 2. A second event was SRB Corporation establishing a $30.0 million line of credit with a bank on February 25, 2021 for which $50.0 million of securities were pledged by The Plymouth Rock Company to the bank as collateral.
THE PLYMOUTH ROCK COMPANY
NOTES TO CONSOLIDATED FINANCIAL STATEMENTS
45
11. Commitments and Contingencies
The Plymouth Rock Company and Subsidiaries incurred real estate rental expenses for 2020 and 2019 totaling $5.9 million and $9.8 million, respectively. Over the next five years, the minimum lease obligations to unrelated third parties decline from $4.2 million in 2021 to $325,000 in 2025. Total obligations of The Plymouth Rock Company and Subsidiaries under real estate and automobile leases are $10.6 million through 2026.
Since December 2011, Plymouth Rock Assurance Corporation has entered into several agreements with companies that write Massachusetts private passenger automobile insurance to sell surplus residual market credit premiums that can be used to reduce residual market assignments. Plymouth Rock Assurance Corporation recognized revenue from these sales in the amounts of $153,000 and $737,000 in 2020 and 2019, respectively.
Plymouth Rock Management Company of New Jersey and Palisades Safety and Insurance Association entered into an agreement in September 2019 to purchase $15.0 million of New Jersey economic redevelopment tax credits at a cost of $14.0 million. The credits will be purchased in annual increments of $1.5 million at an annual cost of $1.4 million over a period of 10 years, which is expected to run from 2021 through 2030. The credits are expected to reduce the Palisades Reciprocal Group’s premium tax liability by $1.5 million in each year of the 10-year.
12. Goodwill and Intangible Assets
The Plymouth Rock Company and Subsidiaries InsuraMatch, LLC purchased insurance agencies that resulted in goodwill of $3.4 million at both December 31, 2020 and 2019, respectively. These purchases also gave rise to intangible assets in the form of expirations, noncompetition agreements, and brand names.
During 2017, InsuraMatch, LLC acquired policy expirations and a call center operation. The policy expirations gave rise to intangible assets of $913,000 that are now fully amortized. The acquisition of the call center gave rise to goodwill of $39,000. During 2016, InsuraMatch, LLC entered into an insurance policy renewal rights agreement which gave rise to intangible assets of $11,000 in 2019. Intangible assets, which are amortized over periods ranging from two to 15 years, were carried at $1.7 million and $2.1 million at December 31, 2020 and 2019 respectively. Effective February 1, 2021, the intangible assets associated with the renewal rights agreement entered into 2016 were included in the sale of InsuraMatch, LLC. The value of these intangibles were $1.4 million at December 31, 2020.
THE PLYMOUTH ROCK COMPANY
NOTES TO CONSOLIDATED FINANCIAL STATEMENTS
46
12. Goodwill and Intangible Assets, continued
Amortization associated with these intangible assets for 2020 and 2019 was $346,000 and $802,000, respectively. Amortization is expected to decline from $111,000 in 2021 to $21,000 in 2025.
As part of the purchase of Plymouth Rock Assurance Preferred Corporation, Plymouth Rock Assurance Corporation acquired intangible assets in the form of state licenses and a rating plan, as well as an intangible liability for the value of the business acquired valued at $986,000. This liability, which is being amortized over four years, had amortization of $247,000 in both 2020 and 2019 that resulted in a carrying value of $309,000 and $556,000 at December 31, 2020 and 2019, respectively. Amortization is expected to be $247,000 in 2021 and $62,000 in 2022, respectively. As this transaction was accounted for as an asset purchase, the difference between the purchase price and the fair value of financial assets and liabilities, including the value of business acquired, was allocated to the state licenses and the rate plan. The state licenses, which are intangible assets with indefinite lives, had a carrying value of $263,000 at both December 31, 2020 and 2019.
As part of the purchase of Plymouth Rock Assurance Corporation of New York, Plymouth Rock Assurance Corporation also acquired intangible assets in the form of state licenses and the value of the business acquired valued at $310,000 and $1.3 million, respectively, as well as an intangible liability for the value of renewal obligations valued at $7.7 million. The state licenses, which are intangible assets with indefinite lives, had a carrying value of $310,000 at both December 31, 2020 and 2019. The value of business acquired was amortized over 12 months, consistent with the earning of the unearned premium, therefore the entire $1.3 million was amortized in 2019. The renewal obligation liability, which is being amortized over three years, had amortization of $2.6 million in both 2020 and 2019, that resulted in a carrying value of $2.6 million and $5.2 million at December 31, 2020 and 2019, respectively. Amortization for this liability is expected to be $2.6 million in 2021. This transaction was accounted for as a business combination.
THE PLYMOUTH ROCK COMPANY
NOTES TO CONSOLIDATED FINANCIAL STATEMENTS
47
12. Goodwill and Intangible Assets, continued
Palisades Reciprocal Group
The Palisades Reciprocal Group’s purchase of Teachers Auto Insurance Company of New Jersey in 2007 resulted in goodwill of $3.3 million, which was the carrying value at both December 31, 2020 and 2019. This purchase along with the purchase of renewals from National General Insurance Company in 2017 also resulted in the creation of intangible assets. These intangible assets are in the form of a trademark, a state license and renewal rights. At both December 31, 2020 and 2019, the carrying value of the trademark was $2.4 million and the carrying value of the state license was $150,000. These intangible assets are reviewed annually for impairment; no impairment was recorded in either 2020 or 2019. The remaining intangible assets for the renewal rights are being amortized over 20 years and had a carrying value of $2.8 million and $3.4 million at December 31, 2020 and 2019, respectively. Amortization associated with these intangible assets was $639,000 in 2020 and $713,000 in 2019. Amortization is expected to decline from $572,000 in 2021 to $371,000 in 2025. The Palisades Reciprocal Group also acquired intangible assets in the form of state licenses as part of the purchase of AtHome Insurance Company. As this transaction was accounted for as an asset purchase, the difference between the purchase price and the fair value of financial assets and liabilities, including the value of business acquired, was allocated to the state licenses. The state licenses, which are intangible assets with indefinite lives, had a carrying value of $38,000 at both December 31, 2020 and 2019.
Effective June 14, 2018, Palisades Safety and Insurance Association and Palisades Property and Casualty Insurance Company entered into an agreement with American Commerce Insurance Company and MAPFRE U.S.A. Corp. pursuant to which Palisades Safety and Insurance Association and Palisades Property and Casualty Insurance Company acquired the rights to serve as a replacement carrier for American Commerce Insurance Company’s New Jersey private passenger automobile and home insurance business, respectively. Palisades Reciprocal Group paid $800,000 related to this acquisition in 2018, with a final payment of $1.9 million made in December 2020 based on the earned premium recorded during the first policy year. These replacement carrier rights are intangible assets that will be amortized over a period of 15 years. Amortization of $175,000 and $192,000 was recorded during 2020 and 2019, respectively, leaving carrying values of $2.3 million and $2.6 million at December 31, 2020 and 2019, respectively. Amortization is expected to be $182,000 annually from 2021 through 2025.
THE PLYMOUTH ROCK COMPANY
NOTES TO CONSOLIDATED FINANCIAL STATEMENTS
48
12. Goodwill and Intangible Assets, continued
Effective April 4, 2018, Palisades Property and Casualty Insurance Company also acquired the right to serve as the replacement carrier for Pennsylvania and New York home insurance business from several entities of the Farmers Insurance Group. The purchase price for this business is based on the volume of written premium recorded during the first two policy years, with the final settlement occurring in 2021. These replacement carrier rights are intangible assets that will be amortized over a period of 15 years. The carrying value of these rights was $666,000 and $346,000 at December 31, 2020 and 2019, respectively, with an additional $372,000 of renewal rights being added during 2020. Amortization of $52,000 and $25,000 was recorded during 2020 and 2019, respectively. Amortization is expected to be $50,000 annually from 2021 through 2025.
As part of the purchase of Rider Insurance Company effective October 17, 2019, Palisades Safety and Insurance Association acquired intangible assets in the form of state licenses valued at $655,000, the brand name valued at $25,000, a rating plan valued at $50,000, the value of the business acquired valued at $2.6 million, and renewal obligations at $1.5 million. The state licenses and brand name, which are intangible assets with indefinite lives, had a carrying value of $680,000 at both December 31, 2020 and 2019. The rating plan is being amortized over two years and had amortization of $25,000 and $5,000 in 2020 and 2019, respectively, which left a carrying value of $20,000 and $45,000 at December 31, 2020 and 2019, respectively. Amortization of the rating plan is expected to be $20,000 in 2021. The value of business acquired is amortized over 12 months, consistent with the earning of the unearned premium. There was amortization of $1.7 million and $914,000 on this asset in 2020 and 2019, respectively. The carrying value was $1.7 million at December 31, 2019 and it was fully amortized by the end of 2020. The renewal obligation liability is being amortized over three years and had amortization of $499,000 and $103,000 in 2020 and 2019, respectively, which left carrying values of $894,000 and $1.4 million at December 31, 2020 and 2019, respectively. Amortization for this liability is expected to be $499,000 in 2021 and $395,000 in 2022. This transaction was accounted for as a business combination.
THE PLYMOUTH ROCK COMPANY
NOTES TO CONSOLIDATED FINANCIAL STATEMENTS
49
13. Reconciliation of Net Income to Net Cash Provided by Operating Activities
The following items account for the differences between net income and net cash provided by operating activities:
The Plymouth Rock Company and Subsidiaries
(dollars in thousands) 2020 2019 Net income $105,280 $204,074 Depreciation and amortization 29,778 26,379 Deferred income taxes 497 10,201 Change in unrealized gains on equity securities, net of tax 26,884 (91,088) Other-than-temporary impairment, net of tax (712) (3,065) Change in operating assets and liabilities: Accrued investment income 675 (42) Premiums receivable (6,960) (14,086) Ceded unearned premium reserves 195 1,191 Deferred acquisition costs (6,370) (7,367) Amounts receivable from reinsurers and pools (2,086) (17,962) Claim and claim adjustment expense reserves 8,603 30,973 Unearned premium reserves 31,301 28,340 Advance premiums (1) 812 Commissions payable and accrued liabilities 27,756 13,886 Amounts payable to reinsurers 1,837 (3,002) Unearned service fees 3,645 3,760
Prepaid expenses, agent loans, and deposits 2,501 (4,812) Income tax recoverable and payable 14,961 (14,677)
Amounts due from service clients (729) (2,148) Other assets and other liabilities 8,694 482 Net cash provided by operating activities $245,749 $161,849
THE PLYMOUTH ROCK COMPANY
NOTES TO CONSOLIDATED FINANCIAL STATEMENTS
50
13. Reconciliation of Net Income to Net Cash Provided by Operating Activities, continued
Palisades Reciprocal Group (dollars in thousands) 2020 2019 Net income $ 3,825 $123,816 Depreciation and amortization 2,717 1,960 Deferred income taxes 1,258 (2,553) Change in unrealized gains on equity securities, net of tax 45,493 (111,170) Other-than-temporary impairment, net of tax 5,509 (5,509) Gain recognized on business combination -0- (3,709) Change in operating assets and liabilities: Accrued investment income 25 654 Premiums receivable (16,535) (10,148) Ceded unearned premium reserves (708) (382) Deferred acquisition costs (9,467) (9,148) Amounts receivable from reinsurers and pools 1,523 3,378 Claim and claim adjustment expense reserves 22,548 21,476 Unearned premium reserves 31,761 28,147 Advance premiums (379) 131 Commissions payable and accrued liabilities 5,737 (3,509) Amounts payable to reinsurers 728 454
Income tax recoverable 11,346 (6,895) Other assets and other liabilities (5,318) 2,650 Net cash provided by operating activities $100,063 $ 29,643
THE PLYMOUTH ROCK COMPANY
NOTES TO CONSOLIDATED FINANCIAL STATEMENTS
51
14. Consolidated Revenues
Revenues, net of reinsurance, by company or group for 2020 and 2019 were:
(dollars in thousands) 2020 2019
Underwriting company revenues: Plymouth Rock Assurance Group $ 549,994 $ 497,093 Plymouth Rock Home Assurance Group 86,672 66,667 Palisades Reciprocal Group 945,903 829,587 Subtotal
1,582,569 1,393,347
Management company revenues: The Plymouth Rock Company 69,240 115,309 SRB Corporation 110,624 112,165 InsuraMatch, LLC 8,576 7,783 Pilgrim Insurance Company 30,730 32,606 Plymouth Rock Management Company of New Jersey 213,630 198,744 Subtotal
432,800 466,607
Eliminations with subsidiaries of The Plymouth Rock Company: Technology costs (54,967) (48,512) Dividends (81,197) (116,118) Other (40,260) (35,596) Subtotal
(176,424) (200,226)
Elimination of intra-group transactions (217,977) (199,520) Total revenues before unrealized gains on equity securities $1,620,968 $1,460,208
The reference above to Plymouth Rock Assurance Group refers to the combined revenue of Plymouth Rock Assurance Corporation, Plymouth Rock Assurance Corporation of New York, Plymouth Rock Assurance Preferred Corporation and Mt. Washington Assurance Corporation. The reference above to Plymouth Rock Home Assurance Group refers to the combined revenue of Plymouth Rock Home Assurance Corporation, Bunker Hill Insurance Company, Bunker Hill Insurance Casualty Company, Bunker Hill Preferred Insurance Company and Bunker Hill Property Insurance Company.
THE PLYMOUTH ROCK COMPANY
NOTES TO CONSOLIDATED FINANCIAL STATEMENTS
52
15. Compensation Plans
The Plymouth Rock Company and Subsidiaries maintain a plan under Section 401(k) of the Internal Revenue Code. This plan is a defined contribution plan that covers all employees. Expenses of $11.7 million and $9.2 million were incurred related to this plan during 2020 and 2019, respectively. Deferred compensation plans have been established at The Plymouth Rock Company and several of its subsidiaries for officers, directors, and managers, other than the founding shareholders. In general, these plans provide for a rate of return on deferred compensation equal each year to the rate of return earned by The Plymouth Rock Company and Subsidiaries that year. Incurred expenses related to these plans were $6.6 million and $5.0 million during 2020 and 2019, respectively.
Effective January 15, 2015, stock incentive awards of 6,577 shares were granted to four key officers. The vesting period for these shares ended during 2019 with 4,330 of the shares vesting based on financial performance during the period and an appraised price of $10,950 for The Plymouth Rock Company’s Class A common shares. These awards were exercised for a combination of common stock of The Plymouth Rock Company and cash. Expenses of $2.8 million were recorded related to these awards during 2019. Effective June 1, 2019, stock incentive awards of 6,115 shares were granted to nine key officers. These awards vest in 2024 contingent upon certain financial performance and service requirements being met. On the basis of financial performance, expenses of $3.2 million and $1.2 million were recorded related to these awards during 2020 and 2019, respectively. For awards to be exercised for common shares of The Plymouth Rock Company, the cost to the Company is determined using the Black-Scholes valuation model.
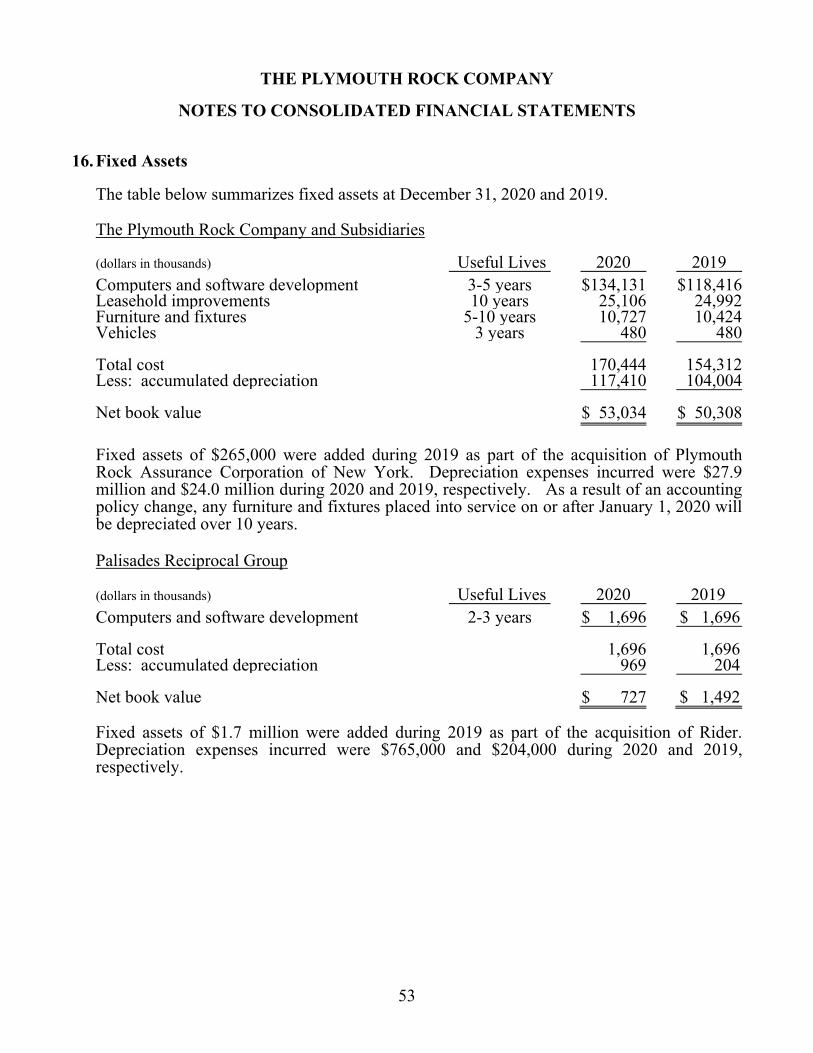
THE PLYMOUTH ROCK COMPANY
NOTES TO CONSOLIDATED FINANCIAL STATEMENTS
53
16. Fixed Assets
The table below summarizes fixed assets at December 31, 2020 and 2019.
The Plymouth Rock Company and Subsidiaries
(dollars in thousands) Useful Lives 2020 2019 Computers and software development 3-5 years $134,131 $118,416 Leasehold improvements 10 years 25,106 24,992 Furniture and fixtures 5-10 years 10,727 10,424 Vehicles 3 years 480 480 Total cost 170,444 154,312 Less: accumulated depreciation 117,410 104,004 Net book value $ 53,034 $ 50,308
Fixed assets of $265,000 were added during 2019 as part of the acquisition of Plymouth Rock Assurance Corporation of New York. Depreciation expenses incurred were $27.9 million and $24.0 million during 2020 and 2019, respectively. As a result of an accounting policy change, any furniture and fixtures placed into service on or after January 1, 2020 will be depreciated over 10 years.
Palisades Reciprocal Group
(dollars in thousands) Useful Lives 2020 2019 Computers and software development 2-3 years $ 1,696 $ 1,696 Total cost 1,696 1,696 Less: accumulated depreciation 969 204 Net book value $ 727 $ 1,492
Fixed assets of $1.7 million were added during 2019 as part of the acquisition of Rider. Depreciation expenses incurred were $765,000 and $204,000 during 2020 and 2019, respectively.

THE PLYMOUTH ROCK COMPANY
NOTES TO CONSOLIDATED FINANCIAL STATEMENTS
54
17. Investment Securities and Investment Income
A. Marketable Securities
The Plymouth Rock Company and Subsidiaries
At December 31, 2020 and 2019, amortized cost, unrealized gains and losses before federal income taxes, and market value of marketable fixed income securities classified as available for sale and marketable common stocks were as follows:
At December 31, 2020: (dollars in thousands)
Amortized Cost
Unrealized Gains
Unrealized Losses
Market Value
U.S. government securities $ 95,898 $ 799 $ 8 $ 96,689State and municipal securities 52,803 1,263 6 54,060Corporate debt securities 308,332 4,699 2 313,029Asset-backed securities 4,112 155 -0- 4,267Common stocks 451,283 244,850 3,597 692,536 Total $912,428 $251,766 $3,613 $1,160,581
At December 31, 2019: (dollars in thousands)
Amortized Cost
Unrealized Gains
Unrealized Losses
Market Value
U.S. government securities $116,494 $ 817 $ 113 $ 117,198State and municipal securities 55,769 581 29 56,321Corporate debt securities 310,328 2,765 15 313,078Asset-backed securities 36,825 253 10 37,068Common stocks 298,071 278,085 4,475 571,681 Total $817,487 $282,501 $4,642 $1,095,346
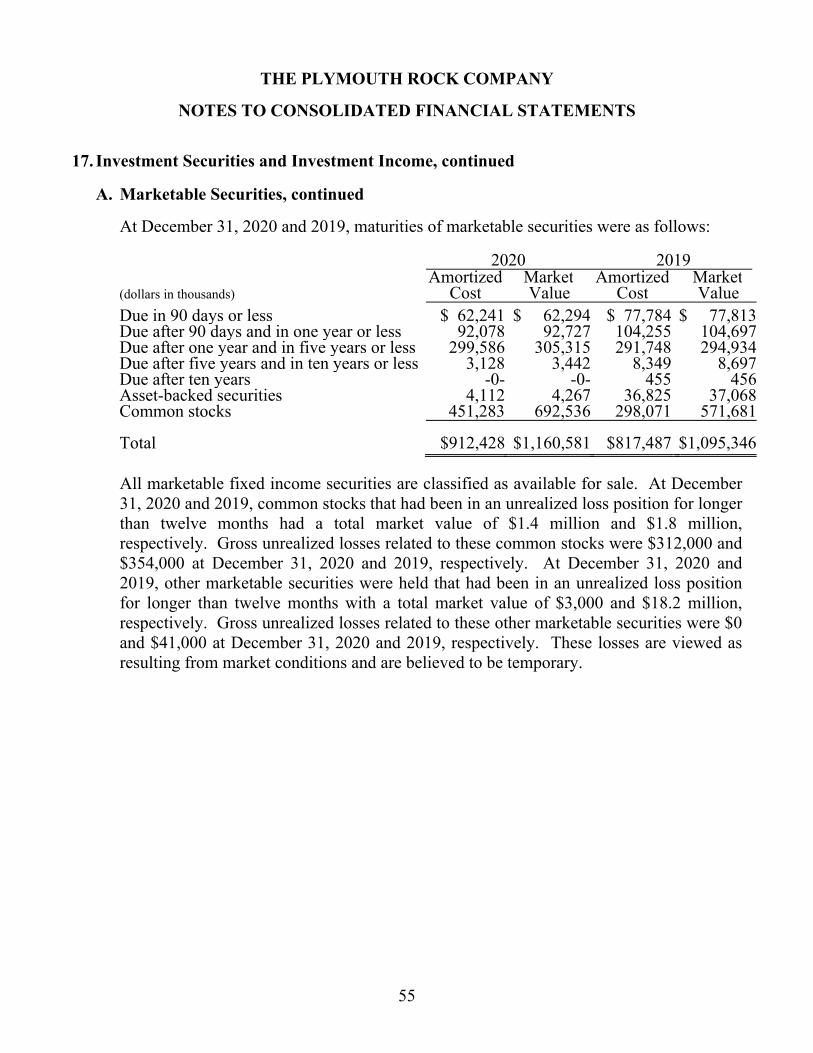
THE PLYMOUTH ROCK COMPANY
NOTES TO CONSOLIDATED FINANCIAL STATEMENTS
55
17. Investment Securities and Investment Income, continued
A. Marketable Securities, continued At December 31, 2020 and 2019, maturities of marketable securities were as follows: 2020 2019 (dollars in thousands)
Amortized Cost
Market Value
Amortized Cost
Market Value
Due in 90 days or less $ 62,241 $ 62,294 $ 77,784 $ 77,813Due after 90 days and in one year or less 92,078 92,727 104,255 104,697Due after one year and in five years or less 299,586 305,315 291,748 294,934Due after five years and in ten years or less 3,128 3,442 8,349 8,697Due after ten years -0- -0- 455 456Asset-backed securities 4,112 4,267 36,825 37,068Common stocks 451,283 692,536 298,071 571,681 Total $912,428 $1,160,581 $817,487 $1,095,346
All marketable fixed income securities are classified as available for sale. At December 31, 2020 and 2019, common stocks that had been in an unrealized loss position for longer than twelve months had a total market value of $1.4 million and $1.8 million, respectively. Gross unrealized losses related to these common stocks were $312,000 and $354,000 at December 31, 2020 and 2019, respectively. At December 31, 2020 and 2019, other marketable securities were held that had been in an unrealized loss position for longer than twelve months with a total market value of $3,000 and $18.2 million, respectively. Gross unrealized losses related to these other marketable securities were $0 and $41,000 at December 31, 2020 and 2019, respectively. These losses are viewed as resulting from market conditions and are believed to be temporary.
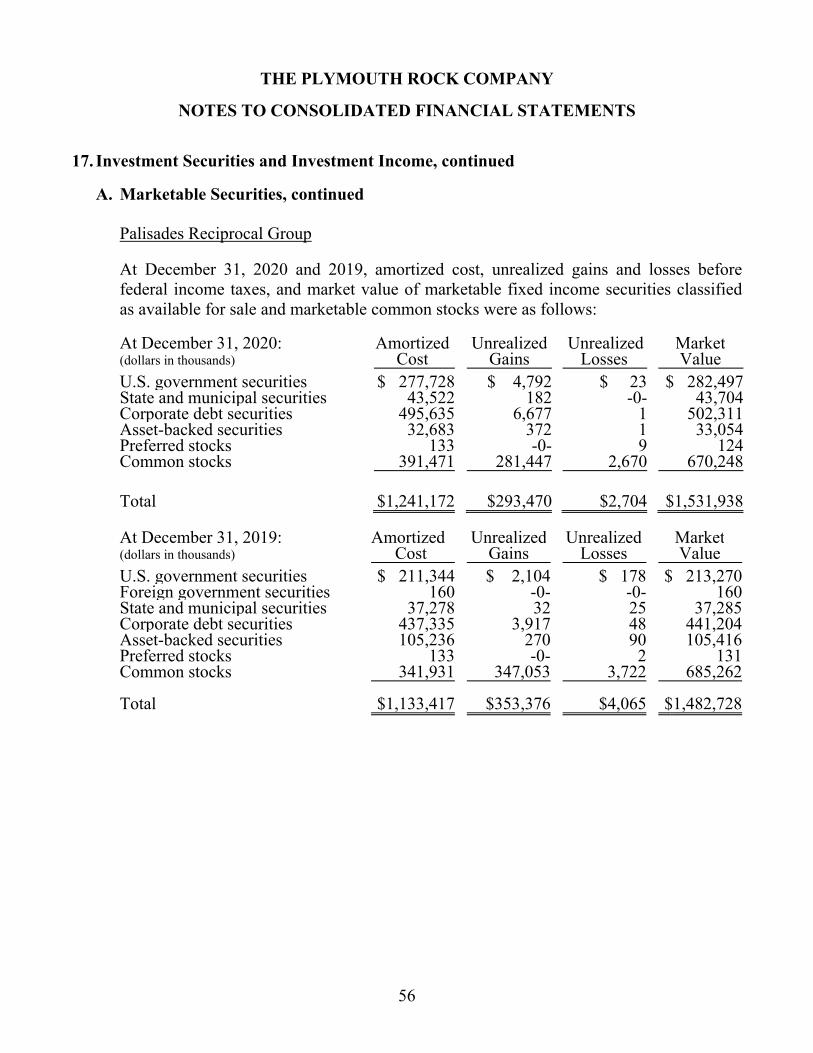
THE PLYMOUTH ROCK COMPANY
NOTES TO CONSOLIDATED FINANCIAL STATEMENTS
56
17. Investment Securities and Investment Income, continued
A. Marketable Securities, continued Palisades Reciprocal Group
At December 31, 2020 and 2019, amortized cost, unrealized gains and losses before federal income taxes, and market value of marketable fixed income securities classified as available for sale and marketable common stocks were as follows: At December 31, 2020: (dollars in thousands)
Amortized Cost
Unrealized Gains
Unrealized Losses
Market Value
U.S. government securities $ 277,728 $ 4,792 $ 23 $ 282,497State and municipal securities 43,522 182 -0- 43,704Corporate debt securities 495,635 6,677 1 502,311Asset-backed securities 32,683 372 1 33,054Preferred stocks 133 -0- 9 124Common stocks 391,471 281,447 2,670 670,248 Total $1,241,172 $293,470 $2,704 $1,531,938
At December 31, 2019: (dollars in thousands)
Amortized Cost
Unrealized Gains
Unrealized Losses
Market Value
U.S. government securities $ 211,344 $ 2,104 $ 178 $ 213,270Foreign government securities 160 -0- -0- 160State and municipal securities 37,278 32 25 37,285Corporate debt securities 437,335 3,917 48 441,204Asset-backed securities 105,236 270 90 105,416Preferred stocks 133 -0- 2 131Common stocks 341,931 347,053 3,722 685,262 Total $1,133,417 $353,376 $4,065 $1,482,728
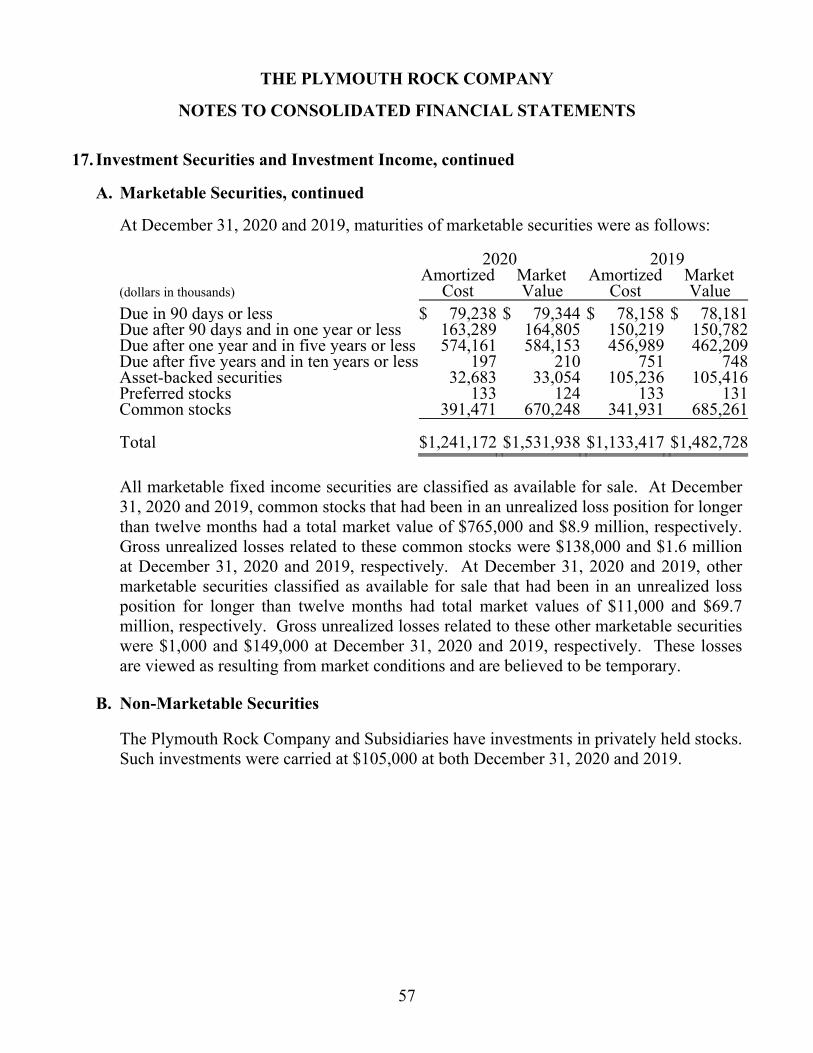
THE PLYMOUTH ROCK COMPANY
NOTES TO CONSOLIDATED FINANCIAL STATEMENTS
57
17. Investment Securities and Investment Income, continued
A. Marketable Securities, continued
At December 31, 2020 and 2019, maturities of marketable securities were as follows: 2020 2019 (dollars in thousands)
Amortized Cost
Market Value
Amortized Cost
Market Value
Due in 90 days or less $ 79,238 $ 79,344 $ 78,158 $ 78,181Due after 90 days and in one year or less 163,289 164,805 150,219 150,782Due after one year and in five years or less 574,161 584,153 456,989 462,209Due after five years and in ten years or less 197 210 751 748Asset-backed securities 32,683 33,054 105,236 105,416Preferred stocks 133 124 133 131Common stocks 391,471 670,248 341,931 685,261 Total $1,241,172 $1,531,938 $1,133,417 $1,482,728
All marketable fixed income securities are classified as available for sale. At December 31, 2020 and 2019, common stocks that had been in an unrealized loss position for longer than twelve months had a total market value of $765,000 and $8.9 million, respectively. Gross unrealized losses related to these common stocks were $138,000 and $1.6 million at December 31, 2020 and 2019, respectively. At December 31, 2020 and 2019, other marketable securities classified as available for sale that had been in an unrealized loss position for longer than twelve months had total market values of $11,000 and $69.7 million, respectively. Gross unrealized losses related to these other marketable securities were $1,000 and $149,000 at December 31, 2020 and 2019, respectively. These losses are viewed as resulting from market conditions and are believed to be temporary.
B. Non-Marketable Securities
The Plymouth Rock Company and Subsidiaries have investments in privately held stocks. Such investments were carried at $105,000 at both December 31, 2020 and 2019.
THE PLYMOUTH ROCK COMPANY
NOTES TO CONSOLIDATED FINANCIAL STATEMENTS
58
17. Investment Securities and Investment Income, continued
C. Alternative Equity Investments
Investments in marketable alternative equities include positions in entities that focus on a diverse range of investment strategies. Substantially all of the investments made by these entities are in publicly traded securities, and investors have contractual rights to withdraw funds from these entities each year. At December 31, 2020 and 2019, The Plymouth Rock Company and Subsidiaries recorded values for these marketable alternative equity investments, which include realized and unrealized gains, of $44.0 million and $54.6 million, respectively. At December 31, 2020 and 2019, the Palisades Reciprocal Group recorded values for these marketable alternative equity investments of $30.1 million and $40.7 million, respectively.
Non-marketable alternative equity investments include interests in partnerships that invest in companies that are not publicly traded. These investments are valued by applying the equity method to values in their most recently available financial statements. The Plymouth Rock Company and Subsidiaries recorded values for non-marketable alternative equity investments of $30.0 million and $32.3 million at December 31, 2020 and 2019, respectively. The Palisades Reciprocal Group recorded values for non-marketable alternative equity investments of $19.5 million and $18.1 million at December 31, 2020 and 2019, respectively.
As of December 31, 2020, The Plymouth Rock Company and Subsidiaries had commitments outstanding to invest $49.7 million in 14 private equity funds. Three of these funds are Lindsay Goldberg & Bessemer L.P. III (Fund III), Lindsay Goldberg & Bessemer L.P. IV (Fund IV), and Lindsay Goldberg & Bessemer L.P. V (Fund V). The Chairman of The Plymouth Rock Company is a member of the general partner that manages each of these funds. At December 31, 2019, The Plymouth Rock Company and Subsidiaries had commitments outstanding to invest $57.1 million in 15 private equity funds. Four of these funds are Lindsay Goldberg & Bessemer L.P. II (Fund II), Lindsay Goldberg & Bessemer L.P. III (Fund III), Lindsay Goldberg & Bessemer L.P. IV (Fund IV), and Lindsay Goldberg & Bessemer L.P. V (Fund V). The Chairman of The Plymouth Rock Company is a member of the general partner that manages each of these four funds.
As of December 31, 2020, the Palisades Reciprocal Group had commitments outstanding to invest $17.4 million in nine private equity funds.
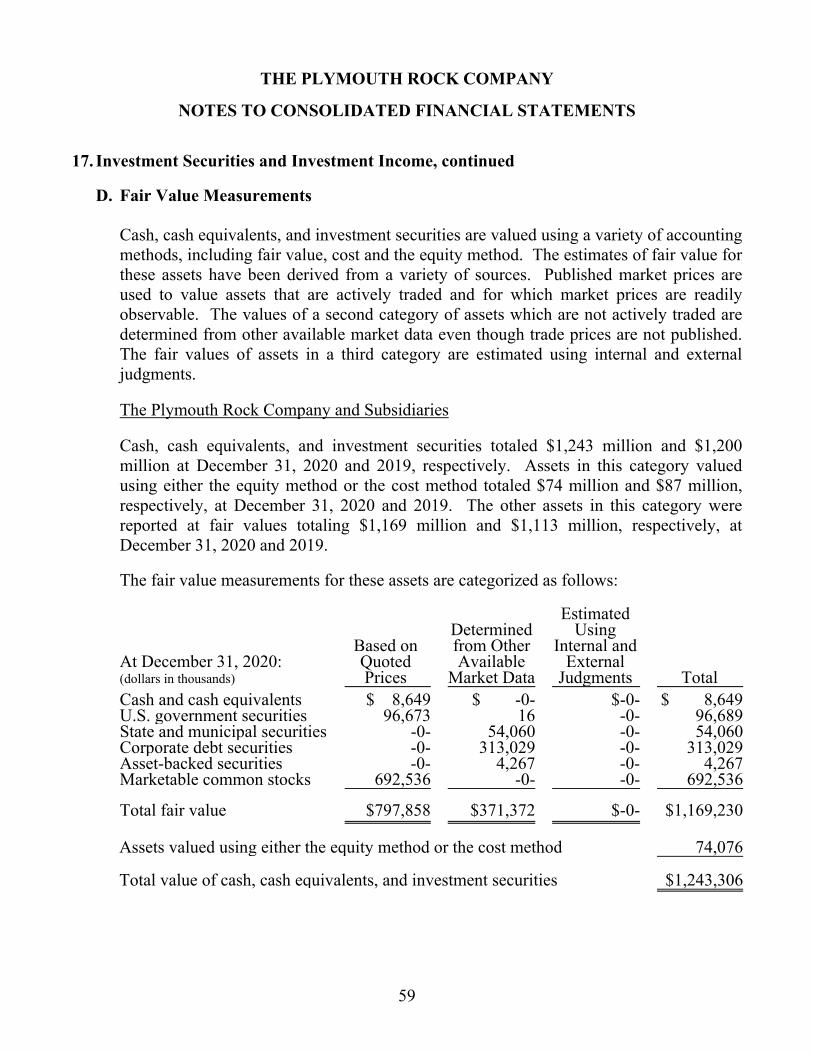
THE PLYMOUTH ROCK COMPANY
NOTES TO CONSOLIDATED FINANCIAL STATEMENTS
59
17. Investment Securities and Investment Income, continued
D. Fair Value Measurements Cash, cash equivalents, and investment securities are valued using a variety of accounting methods, including fair value, cost and the equity method. The estimates of fair value for these assets have been derived from a variety of sources. Published market prices are used to value assets that are actively traded and for which market prices are readily observable. The values of a second category of assets which are not actively traded are determined from other available market data even though trade prices are not published. The fair values of assets in a third category are estimated using internal and external judgments.
The Plymouth Rock Company and Subsidiaries Cash, cash equivalents, and investment securities totaled $1,243 million and $1,200 million at December 31, 2020 and 2019, respectively. Assets in this category valued using either the equity method or the cost method totaled $74 million and $87 million, respectively, at December 31, 2020 and 2019. The other assets in this category were reported at fair values totaling $1,169 million and $1,113 million, respectively, at December 31, 2020 and 2019.
The fair value measurements for these assets are categorized as follows:
At December 31, 2020: (dollars in thousands)
Based on Quoted Prices
Determined from Other Available
Market Data
Estimated Using
Internal and External
Judgments
Total Cash and cash equivalents $ 8,649 $ -0- $-0- $ 8,649 U.S. government securities 96,673 16 -0- 96,689 State and municipal securities -0- 54,060 -0- 54,060 Corporate debt securities -0- 313,029 -0- 313,029 Asset-backed securities -0- 4,267 -0- 4,267 Marketable common stocks 692,536 -0- -0- 692,536 Total fair value $797,858 $371,372 $-0- $1,169,230
Assets valued using either the equity method or the cost method 74,076
Total value of cash, cash equivalents, and investment securities $1,243,306
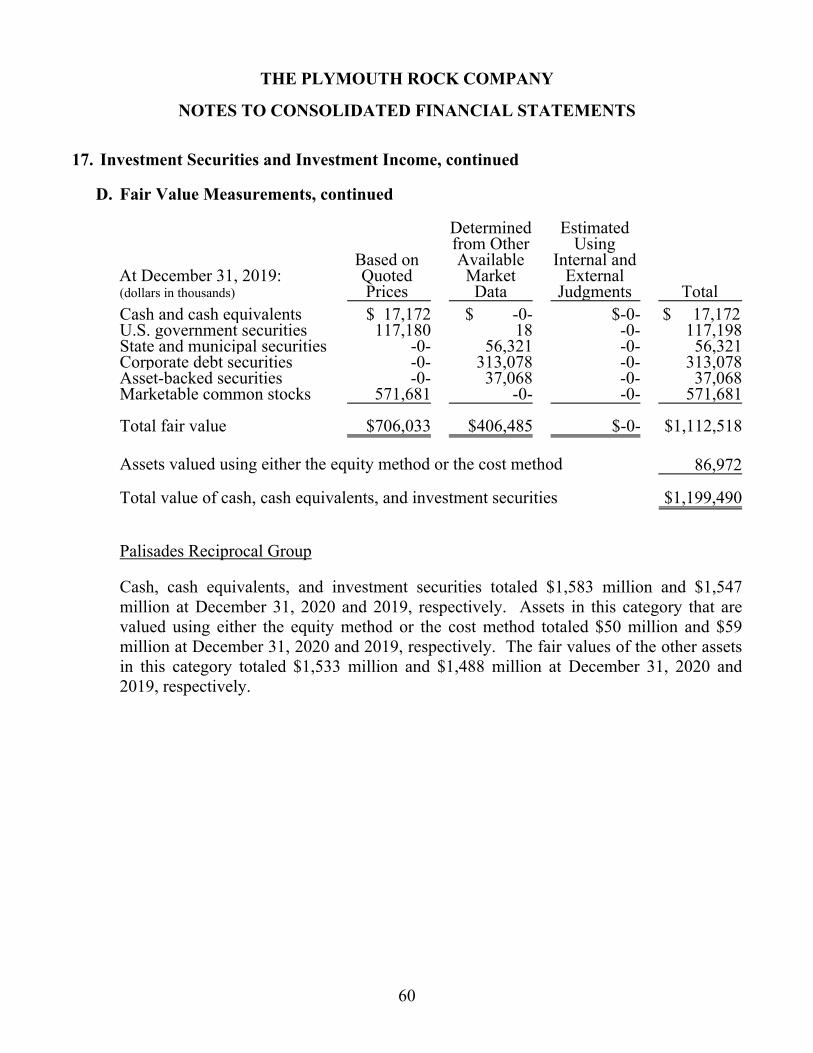
THE PLYMOUTH ROCK COMPANY
NOTES TO CONSOLIDATED FINANCIAL STATEMENTS
60
17. Investment Securities and Investment Income, continued
D. Fair Value Measurements, continued
At December 31, 2019: (dollars in thousands)
Based on Quoted Prices
Determined from Other Available
Market Data
Estimated Using
Internal and External
Judgments
Total Cash and cash equivalents $ 17,172 $ -0- $-0- $ 17,172 U.S. government securities 117,180 18 -0- 117,198 State and municipal securities -0- 56,321 -0- 56,321Corporate debt securities -0- 313,078 -0- 313,078Asset-backed securities -0- 37,068 -0- 37,068Marketable common stocks 571,681 -0- -0- 571,681 Total fair value $706,033 $406,485 $-0- $1,112,518 Assets valued using either the equity method or the cost method 86,972 Total value of cash, cash equivalents, and investment securities $1,199,490
Palisades Reciprocal Group
Cash, cash equivalents, and investment securities totaled $1,583 million and $1,547 million at December 31, 2020 and 2019, respectively. Assets in this category that are valued using either the equity method or the cost method totaled $50 million and $59 million at December 31, 2020 and 2019, respectively. The fair values of the other assets in this category totaled $1,533 million and $1,488 million at December 31, 2020 and 2019, respectively.
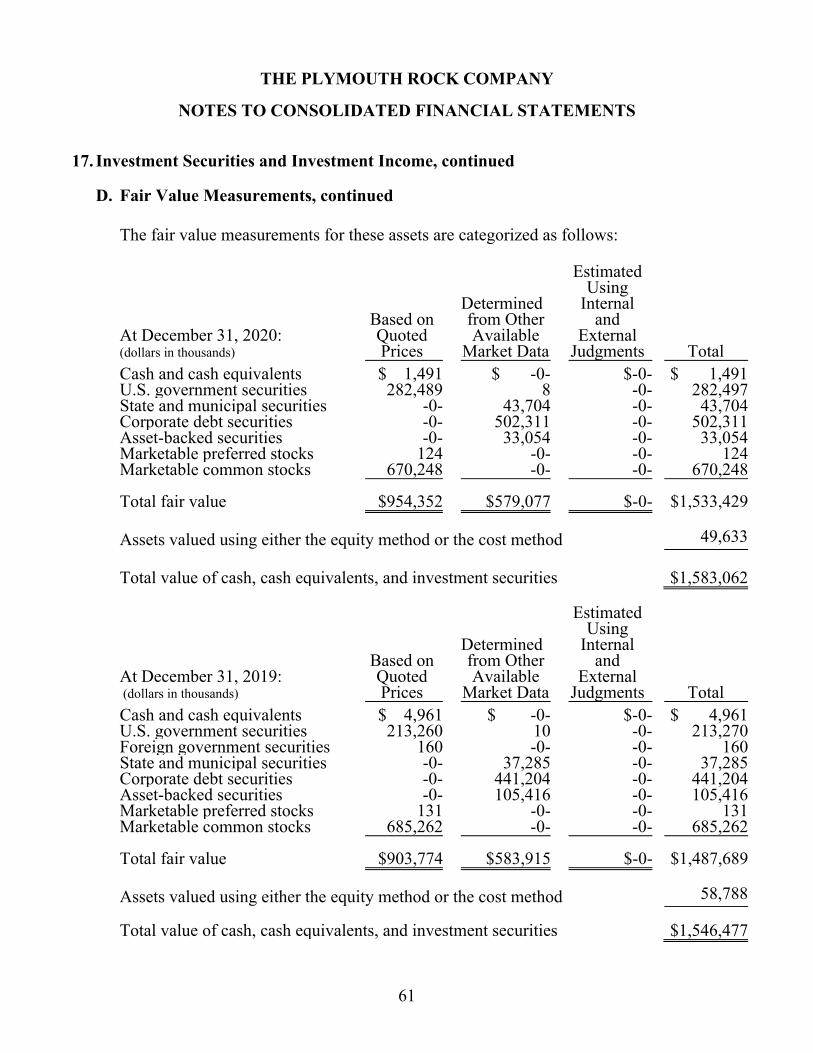
THE PLYMOUTH ROCK COMPANY
NOTES TO CONSOLIDATED FINANCIAL STATEMENTS
61
17. Investment Securities and Investment Income, continued
D. Fair Value Measurements, continued
The fair value measurements for these assets are categorized as follows:
At December 31, 2020: (dollars in thousands)
Based on Quoted Prices
Determined from Other Available
Market Data
Estimated Using
Internal and
External Judgments
Total Cash and cash equivalents $ 1,491 $ -0- $-0- $ 1,491 U.S. government securities 282,489 8 -0- 282,497State and municipal securities -0- 43,704 -0- 43,704Corporate debt securities -0- 502,311 -0- 502,311Asset-backed securities -0- 33,054 -0- 33,054Marketable preferred stocks 124 -0- -0- 124Marketable common stocks 670,248 -0- -0- 670,248 Total fair value $954,352 $579,077 $-0- $1,533,429 Assets valued using either the equity method or the cost method 49,633 Total value of cash, cash equivalents, and investment securities $1,583,062
At December 31, 2019: (dollars in thousands)
Based on Quoted Prices
Determined from Other Available
Market Data
Estimated Using
Internal and
External Judgments
Total Cash and cash equivalents $ 4,961 $ -0- $-0- $ 4,961U.S. government securities 213,260 10 -0- 213,270Foreign government securities 160 -0- -0- 160State and municipal securities -0- 37,285 -0- 37,285Corporate debt securities -0- 441,204 -0- 441,204Asset-backed securities -0- 105,416 -0- 105,416Marketable preferred stocks 131 -0- -0- 131Marketable common stocks 685,262 -0- -0- 685,262 Total fair value $903,774 $583,915 $-0- $1,487,689 Assets valued using either the equity method or the cost method 58,788 Total value of cash, cash equivalents, and investment securities $1,546,477
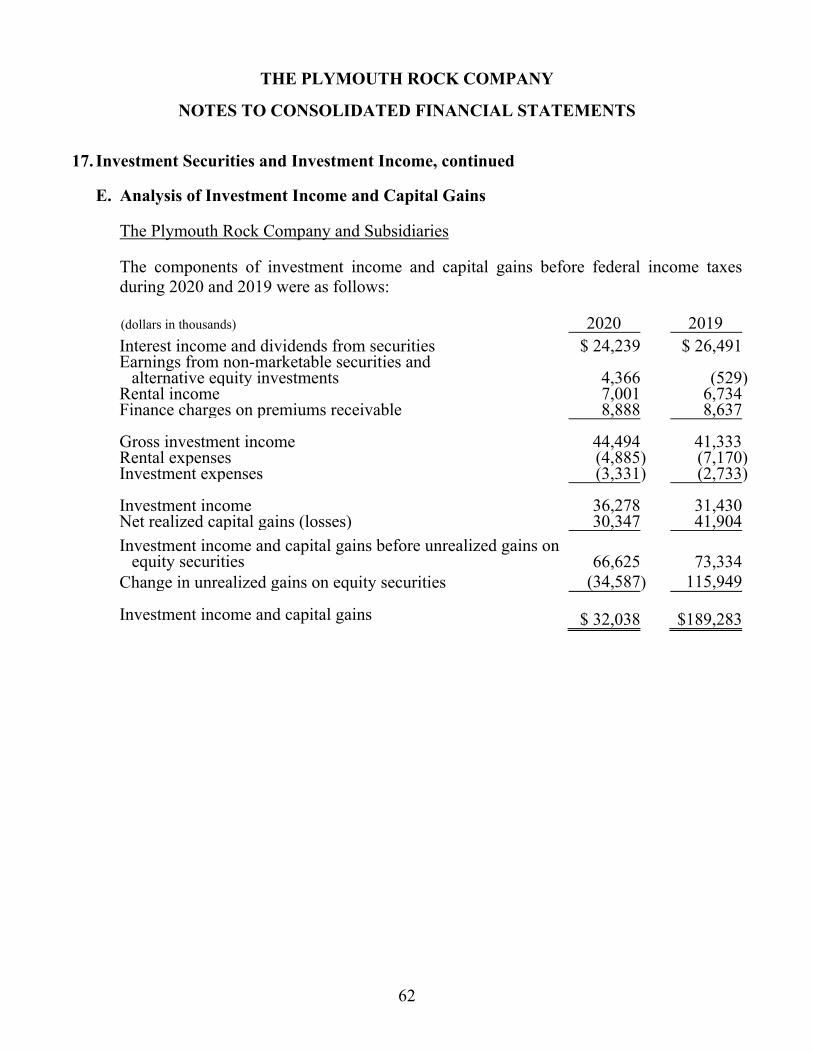
THE PLYMOUTH ROCK COMPANY
NOTES TO CONSOLIDATED FINANCIAL STATEMENTS
62
17. Investment Securities and Investment Income, continued
E. Analysis of Investment Income and Capital Gains
The Plymouth Rock Company and Subsidiaries
The components of investment income and capital gains before federal income taxes during 2020 and 2019 were as follows:
(dollars in thousands) 2020 2019
Interest income and dividends from securities $ 24,239 $ 26,491 Earnings from non-marketable securities and
alternative equity investments 4,366 (529
)
Rental income 7,001 6,734 Finance charges on premiums receivable 8,888 8,637 Gross investment income 44,494 41,333 Rental expenses (4,885) (7,170) Investment expenses (3,331) (2,733) Investment income 36,278 31,430 Net realized capital gains (losses) 30,347 41,904
Investment income and capital gains before unrealized gains on equity securities 66,625 73,334
Change in unrealized gains on equity securities (34,587) 115,949 Investment income and capital gains $ 32,038 $189,283
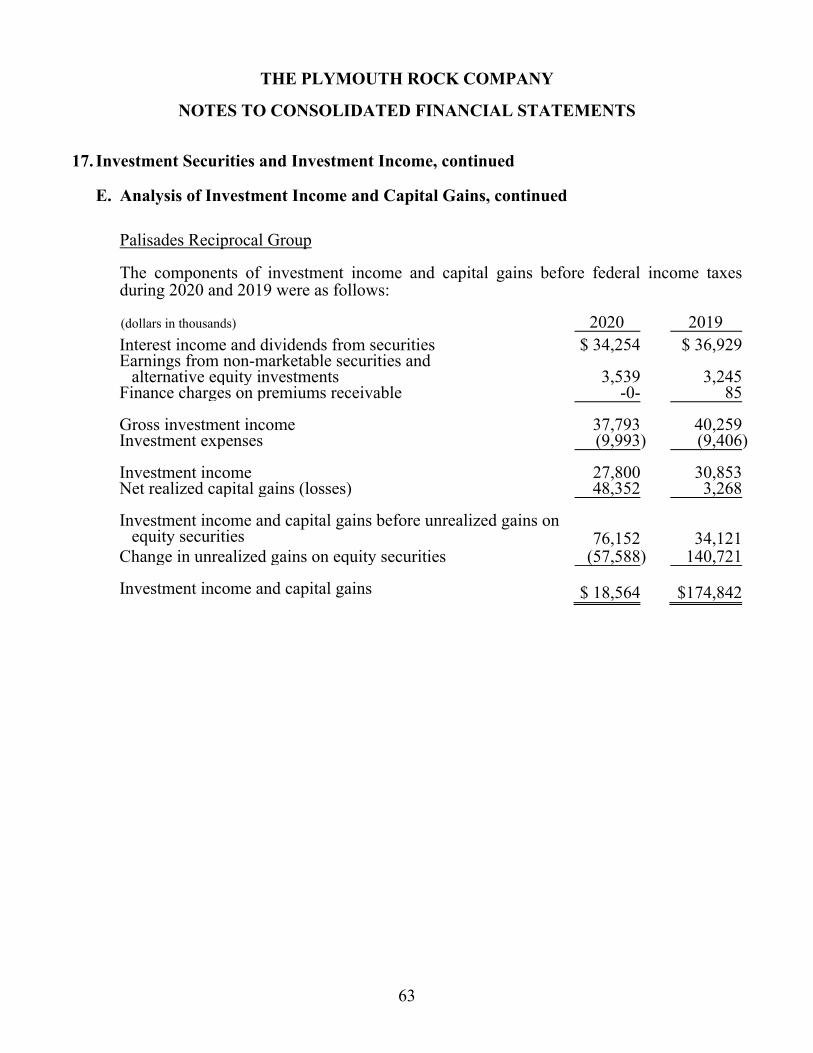
THE PLYMOUTH ROCK COMPANY
NOTES TO CONSOLIDATED FINANCIAL STATEMENTS
63
17. Investment Securities and Investment Income, continued
E. Analysis of Investment Income and Capital Gains, continued
Palisades Reciprocal Group
The components of investment income and capital gains before federal income taxes during 2020 and 2019 were as follows:
(dollars in thousands) 2020 2019 Interest income and dividends from securities $ 34,254 $ 36,929 Earnings from non-marketable securities and
alternative equity investments 3,539 3,245
Finance charges on premiums receivable -0- 85 Gross investment income 37,793 40,259Investment expenses (9,993) (9,406) Investment income 27,800 30,853Net realized capital gains (losses) 48,352 3,268 Investment income and capital gains before unrealized gains on
equity securities 76,152 34,121Change in unrealized gains on equity securities (57,588) 140,721 Investment income and capital gains $ 18,564 $174,842
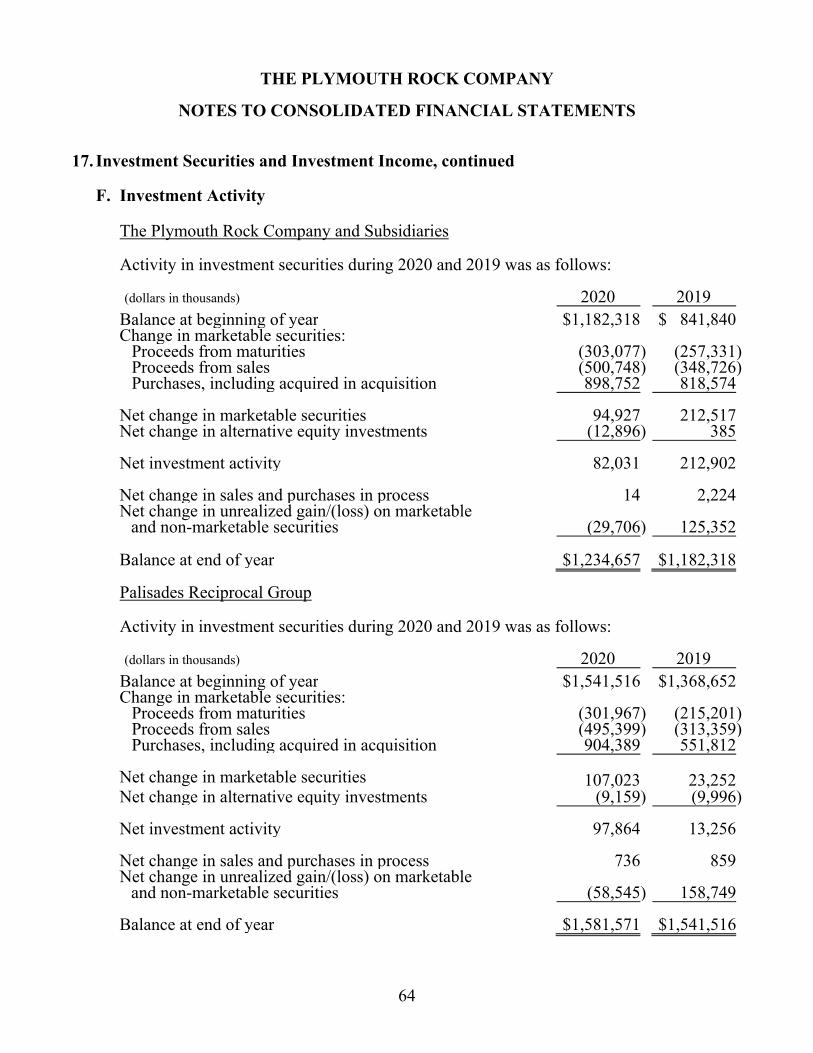
THE PLYMOUTH ROCK COMPANY
NOTES TO CONSOLIDATED FINANCIAL STATEMENTS
64
17. Investment Securities and Investment Income, continued
F. Investment Activity
The Plymouth Rock Company and Subsidiaries
Activity in investment securities during 2020 and 2019 was as follows:
(dollars in thousands) 2020 2019 Balance at beginning of year $1,182,318 $ 841,840 Change in marketable securities:
Proceeds from maturities (303,077) (257,331) Proceeds from sales (500,748) (348,726) Purchases, including acquired in acquisition 898,752 818,574
Net change in marketable securities 94,927 212,517 Net change in alternative equity investments (12,896) 385 Net investment activity 82,031 212,902 Net change in sales and purchases in process 14 2,224 Net change in unrealized gain/(loss) on marketable
and non-marketable securities (29,706 ) 125,352
Balance at end of year $1,234,657 $1,182,318
Palisades Reciprocal Group
Activity in investment securities during 2020 and 2019 was as follows:
(dollars in thousands) 2020 2019
Balance at beginning of year $1,541,516 $1,368,652Change in marketable securities:
Proceeds from maturities (301,967) (215,201) Proceeds from sales (495,399) (313,359) Purchases, including acquired in acquisition 904,389 551,812
Net change in marketable securities 107,023 23,252 Net change in alternative equity investments (9,159) (9,996) Net investment activity 97,864 13,256 Net change in sales and purchases in process 736 859 Net change in unrealized gain/(loss) on marketable
and non-marketable securities (58,545) 158,749 Balance at end of year $1,581,571 $1,541,516
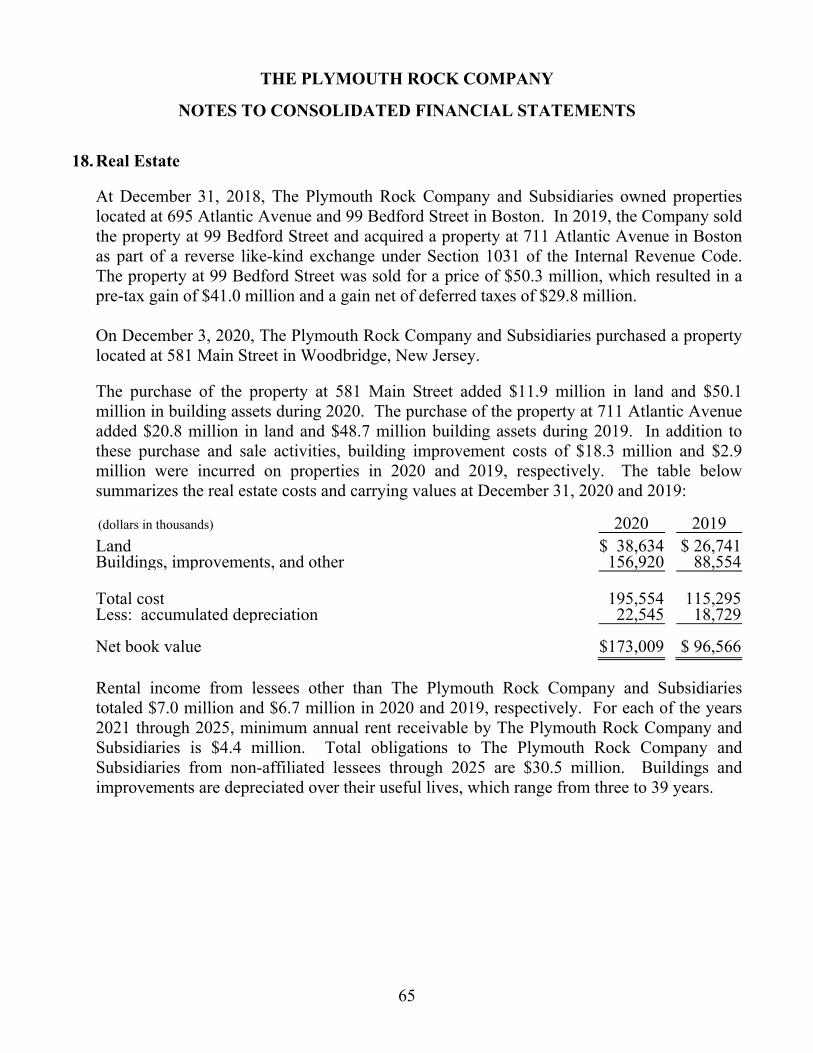
THE PLYMOUTH ROCK COMPANY
NOTES TO CONSOLIDATED FINANCIAL STATEMENTS
65
18. Real Estate
At December 31, 2018, The Plymouth Rock Company and Subsidiaries owned properties located at 695 Atlantic Avenue and 99 Bedford Street in Boston. In 2019, the Company sold the property at 99 Bedford Street and acquired a property at 711 Atlantic Avenue in Boston as part of a reverse like-kind exchange under Section 1031 of the Internal Revenue Code. The property at 99 Bedford Street was sold for a price of $50.3 million, which resulted in a pre-tax gain of $41.0 million and a gain net of deferred taxes of $29.8 million. On December 3, 2020, The Plymouth Rock Company and Subsidiaries purchased a property located at 581 Main Street in Woodbridge, New Jersey.
The purchase of the property at 581 Main Street added $11.9 million in land and $50.1 million in building assets during 2020. The purchase of the property at 711 Atlantic Avenue added $20.8 million in land and $48.7 million building assets during 2019. In addition to these purchase and sale activities, building improvement costs of $18.3 million and $2.9 million were incurred on properties in 2020 and 2019, respectively. The table below summarizes the real estate costs and carrying values at December 31, 2020 and 2019:
(dollars in thousands) 2020 2019
Land $ 38,634 $ 26,741 Buildings, improvements, and other 156,920 88,554 Total cost 195,554 115,295 Less: accumulated depreciation 22,545 18,729 Net book value $173,009 $ 96,566
Rental income from lessees other than The Plymouth Rock Company and Subsidiaries totaled $7.0 million and $6.7 million in 2020 and 2019, respectively. For each of the years 2021 through 2025, minimum annual rent receivable by The Plymouth Rock Company and Subsidiaries is $4.4 million. Total obligations to The Plymouth Rock Company and Subsidiaries from non-affiliated lessees through 2025 are $30.5 million. Buildings and improvements are depreciated over their useful lives, which range from three to 39 years.
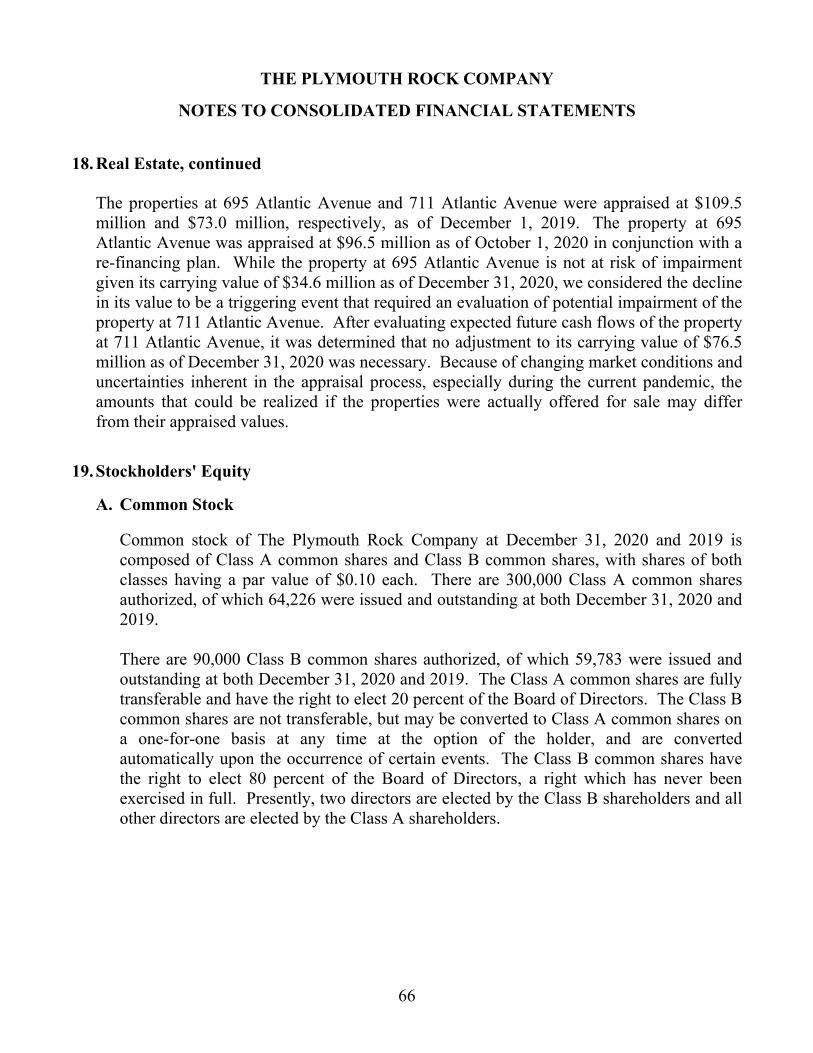
THE PLYMOUTH ROCK COMPANY
NOTES TO CONSOLIDATED FINANCIAL STATEMENTS
66
18. Real Estate, continued
The properties at 695 Atlantic Avenue and 711 Atlantic Avenue were appraised at $109.5 million and $73.0 million, respectively, as of December 1, 2019. The property at 695 Atlantic Avenue was appraised at $96.5 million as of October 1, 2020 in conjunction with a re-financing plan. While the property at 695 Atlantic Avenue is not at risk of impairment given its carrying value of $34.6 million as of December 31, 2020, we considered the decline in its value to be a triggering event that required an evaluation of potential impairment of the property at 711 Atlantic Avenue. After evaluating expected future cash flows of the property at 711 Atlantic Avenue, it was determined that no adjustment to its carrying value of $76.5 million as of December 31, 2020 was necessary. Because of changing market conditions and uncertainties inherent in the appraisal process, especially during the current pandemic, the amounts that could be realized if the properties were actually offered for sale may differ from their appraised values.
19. Stockholders' Equity A. Common Stock
Common stock of The Plymouth Rock Company at December 31, 2020 and 2019 is composed of Class A common shares and Class B common shares, with shares of both classes having a par value of $0.10 each. There are 300,000 Class A common shares authorized, of which 64,226 were issued and outstanding at both December 31, 2020 and 2019.
There are 90,000 Class B common shares authorized, of which 59,783 were issued and outstanding at both December 31, 2020 and 2019. The Class A common shares are fully transferable and have the right to elect 20 percent of the Board of Directors. The Class B common shares are not transferable, but may be converted to Class A common shares on a one-for-one basis at any time at the option of the holder, and are converted automatically upon the occurrence of certain events. The Class B common shares have the right to elect 80 percent of the Board of Directors, a right which has never been exercised in full. Presently, two directors are elected by the Class B shareholders and all other directors are elected by the Class A shareholders.
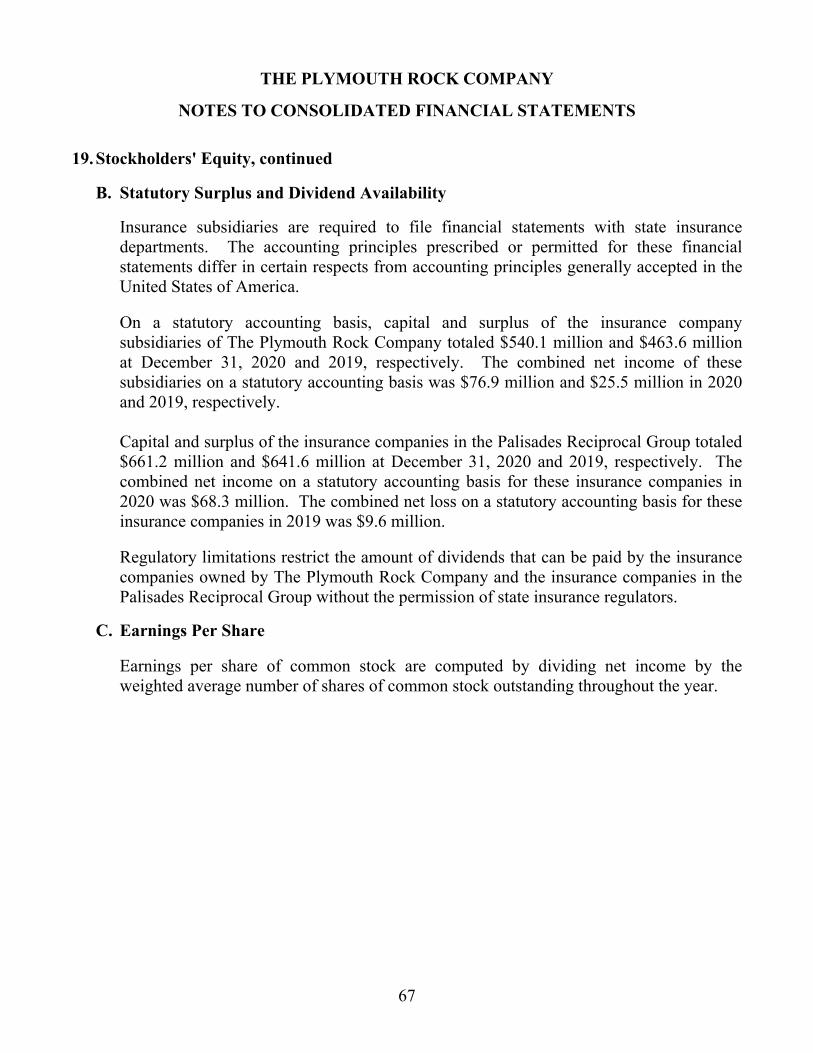
THE PLYMOUTH ROCK COMPANY
NOTES TO CONSOLIDATED FINANCIAL STATEMENTS
67
19. Stockholders' Equity, continued
B. Statutory Surplus and Dividend Availability
Insurance subsidiaries are required to file financial statements with state insurance departments. The accounting principles prescribed or permitted for these financial statements differ in certain respects from accounting principles generally accepted in the United States of America.
On a statutory accounting basis, capital and surplus of the insurance company subsidiaries of The Plymouth Rock Company totaled $540.1 million and $463.6 million at December 31, 2020 and 2019, respectively. The combined net income of these subsidiaries on a statutory accounting basis was $76.9 million and $25.5 million in 2020 and 2019, respectively. Capital and surplus of the insurance companies in the Palisades Reciprocal Group totaled $661.2 million and $641.6 million at December 31, 2020 and 2019, respectively. The combined net income on a statutory accounting basis for these insurance companies in 2020 was $68.3 million. The combined net loss on a statutory accounting basis for these insurance companies in 2019 was $9.6 million.
Regulatory limitations restrict the amount of dividends that can be paid by the insurance companies owned by The Plymouth Rock Company and the insurance companies in the Palisades Reciprocal Group without the permission of state insurance regulators.
C. Earnings Per Share
Earnings per share of common stock are computed by dividing net income by the weighted average number of shares of common stock outstanding throughout the year.
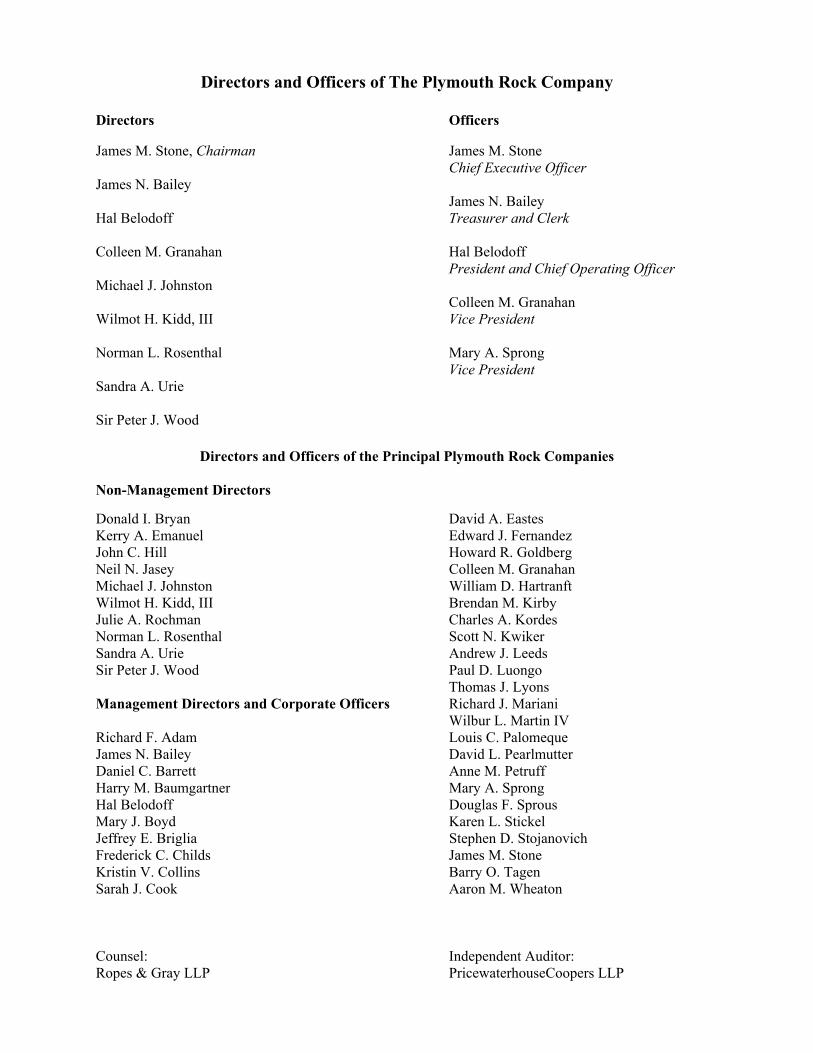
Directors and Officers of The Plymouth Rock Company
Directors Officers James M. Stone, Chairman James M. Stone Chief Executive Officer James N. Bailey James N. Bailey Hal Belodoff Treasurer and Clerk Colleen M. Granahan Hal Belodoff President and Chief Operating Officer Michael J. Johnston Colleen M. Granahan Wilmot H. Kidd, III Vice President Norman L. Rosenthal Mary A. Sprong Vice President Sandra A. Urie Sir Peter J. Wood
Directors and Officers of the Principal Plymouth Rock Companies
Non-Management Directors Donald I. Bryan David A. Eastes Kerry A. Emanuel Edward J. Fernandez John C. Hill Howard R. Goldberg Neil N. Jasey Colleen M. Granahan Michael J. Johnston William D. Hartranft Wilmot H. Kidd, III Brendan M. Kirby Julie A. Rochman Charles A. Kordes Norman L. Rosenthal Scott N. Kwiker Sandra A. Urie Andrew J. Leeds Sir Peter J. Wood Paul D. Luongo Thomas J. Lyons Management Directors and Corporate Officers Richard J. Mariani Wilbur L. Martin IV Richard F. Adam Louis C. Palomeque James N. Bailey David L. Pearlmutter Daniel C. Barrett Anne M. Petruff Harry M. Baumgartner Mary A. Sprong Hal Belodoff Douglas F. Sprous Mary J. Boyd Karen L. Stickel Jeffrey E. Briglia Stephen D. Stojanovich Frederick C. Childs James M. Stone Kristin V. Collins Barry O. Tagen Sarah J. Cook Aaron M. Wheaton Counsel: Independent Auditor: Ropes & Gray LLP PricewaterhouseCoopers LLP