Embed Size (px)
Citation preview

AnnuAl RepoRt
2012 AnnuAl RepoRt

peRfoRmAnce summARy
stRAtegy gAining good momentum And continuing investment in gRowth initiAtives
contents
Performance Summary 1
Growth Plans 2
Chairman’s Report 10
Managing Director’s Report 12
The Results in Brief 14
Food, Liquor and Petrol 16
General Merchandise 22
Hotels 24
Home Improvement 26
Consumer Electronics 27
Discontinued Operations 27
Overheads, Expenses and Balance Sheet 28
Capital Management and Outlook 29
Board of Directors 32
Directors’ Statutory Report 38
Remuneration Report 42
Auditor’s Independence Declaration 71
Corporate Governance Statement 72
Financial Report to Shareholders 88
Shareholder Information 179
www.woolwoRthslimited.com.Au
woolwoRths limited Abn 88 000 014 675
momentumgood
eARnings befoRe inteRest And tAx
AustRAliAn food And liquoR 5.2% pAustRAliAn supeRmARkets 5.3% pnew ZeAlAnd supeRmARkets 17.0% pbig w 0.8% photels 6.5% p
(including petRol)
Our 2012 Corporate Responsibility Report will be published in November. The report will be available on our website.
annual report
2012
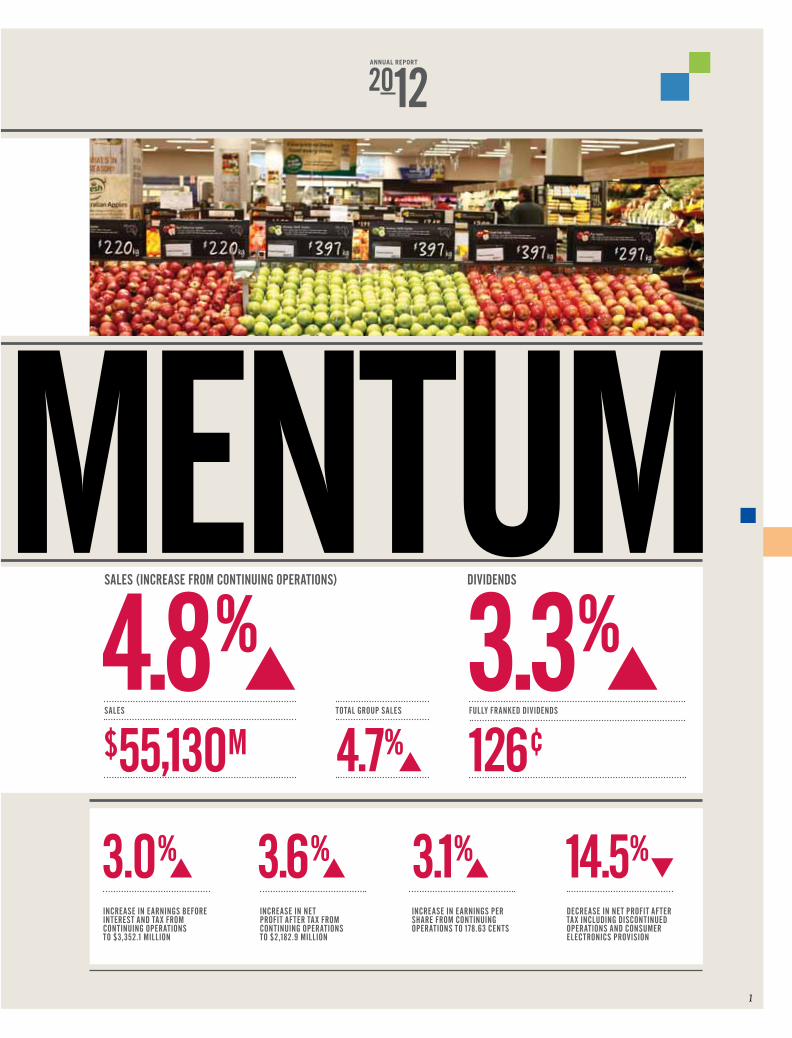
3.1% p
increase in earnings per share from continuing operations to 178.63 cents
3.0% p
increase in earnings before interest and tax from continuing operations to $3,352.1 million
3.6% p
increase in net profit after tax from continuing operations to $2,182.9 million
14.5%
decrease in net profit after tax including discontinued operations and consumer electronics provision
$55,130msales
126¢fully franked dividends
3.3% p
4.7% p
total group sales
sales (increase from continuing operations) dividends
4.8% p
1
momentum

WoolWorths limited AnnuAl report 20122
strategic priority
no.1leadership in food and liquor
extend
growth plans
our
four strategic priorities

3
• re-establish marketing supremacy around value and growth
• unlock sales growth for a tougher consumer and competitive environment
• accelerate our leadership in fresh food
• extend leadership in liquor
• continue momentum to become no.1 in new Zealand
• Growing Australian market share – excellent progress in reinvigorating Australian supermarkets with a focus on Fresh, range, value and in‑store experience
• Fresh marketing campaign – ‘Australia’s Fresh Food People’ marketing campaign launched supported by a new and innovative media integration with ‘The Voice’
• Building for growth – space growth improvements continued including 38 new Australian supermarkets in FY12
• Market leader in Liquor – strong performance led by the award winning Dan Murphy’s
• Growing New Zealand market share – Countdown delivering strong results and market share gains
• Further develop our supermarket offer, particularly in Fresh and multi‑option
• Maintain momentum in New Zealand supermarkets
• Continue to explore opportunities for further growth both domestically and overseas in a prudent manner
priority progress more to do

strategic priority
no.2
maximise shareholder value
act on our portfolio to
WoolWorths limited AnnuAl report 20124
5
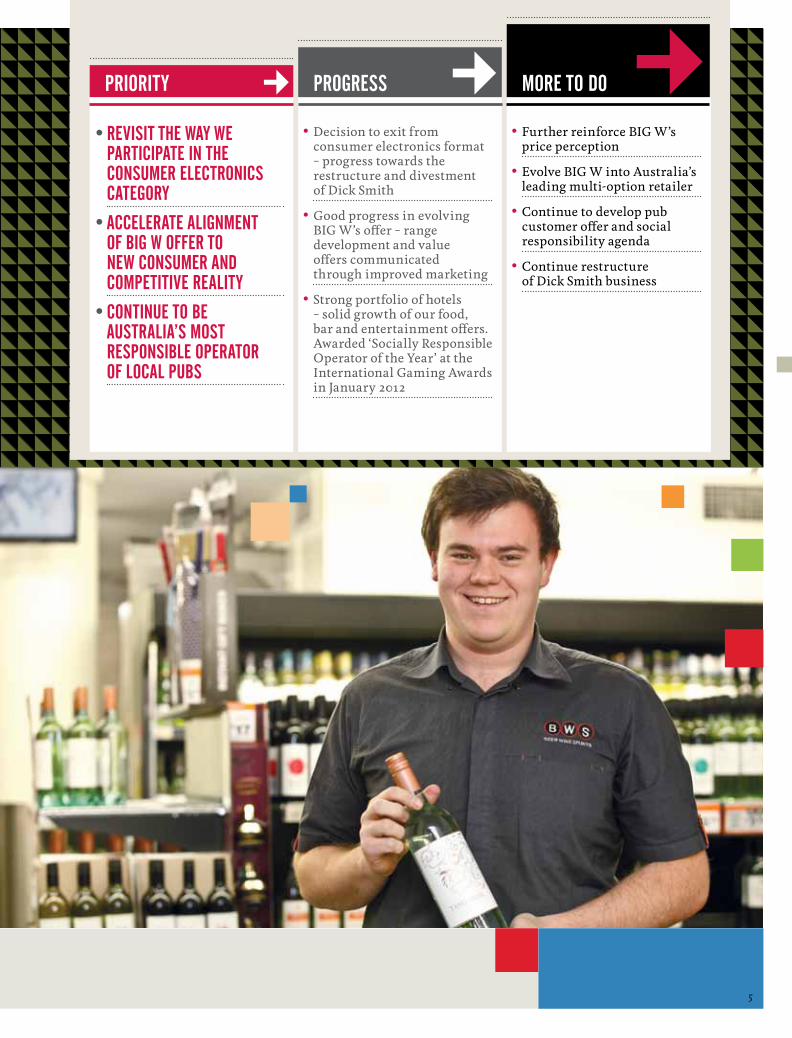
• revisit the way we participate in the consumer electronics category
• accelerate alignment of big w offer to new consumer and competitive reality
• continue to be australia’s most responsible operator of local pubs
• Decision to exit from consumer electronics format – progress towards the restructure and divestment of Dick Smith
• Good progress in evolving BIG W’s offer – range development and value offers communicated through improved marketing
• Strong portfolio of hotels – solid growth of our food, bar and entertainment offers. Awarded ‘Socially Responsible Operator of the Year’ at the International Gaming Awards in January 2012
• Further reinforce BIG W’s price perception
• Evolve BIG W into Australia’s leading multi‑option retailer
• Continue to develop pub customer offer and social responsibility agenda
• Continue restructure of Dick Smith business
priority progress more to do

track record of building new growth
strategic priority
no.3maintain our
WoolWorths limited AnnuAl report 20126

track record of building new growth
7
• be australia’s undisputed leader in multi-option retailing
• scale up from an encouraging start to become a unique, sustainable and profitable home improvement business
• continue to consider new domestic and international growth opportunities
• Innovation – 2.3 million Woolworths, Countdown and BIG W apps downloaded. Australian Supermarkets awarded ORIA’s ‘Best Multi‑Channel Retailer’ and ‘Best Online Retail Marketing Initiative’ for 2012
• Online development – offers are well established for all our businesses
• Multi‑option delivering exceptional sales growth – 95% increase in total online sales for FY12 – 48% excluding Cellarmasters
• New category expansion – 15 Masters stores opened in FY12
• Domestic growth – Acquisitions including five Danks stores, 40 Hotels to date (Compass and Laundy) and Cellarmasters integration completed
• Greater functionality and capability of our multi‑option offer
• Continue successful development of Masters Home Improvement
• Integrate acquisitions to achieve synergies
priority progress more to do

put in place the
enablers for a new era of growth
strategic priority
no.4
WoolWorths limited AnnuAl report 20128

9
• deliver step change in productivity through our supply chain
• leverage investment in customer data to fuel growth and customer centricity
• continue to invest in our business to ensure long-term shareholder growth
• combine the best retail talent in australia with the best in the world
• Logistics – commenced operations in DCs in New Zealand, Tasmania and Hoxton Park, Sydney
• Quantum initiatives – cost savings leveraging group scale and incorporating global best practices will start delivering benefits in FY13 from increased direct global sourcing, new procurement strategy, sustainability cost savings and above store cost savings
• Unlocking customer data – leverage deep insight from Australia and New Zealand’s largest loyalty program. Data driven ‘Category Lab’ continues to extend across our business
• The best people – continued focus on assembling a world class retail team blending the best local and international talent
• Deliver higher efficiencies and lower labour cost per carton using new DC assets
• Continue to leverage customer data across all aspects of each business
• Continue Quantum initiatives covering supply chain, IT, finance, call centres, non‑trading procurement and global direct sourcing
priority progress more to do

james strong
chairman
10
Financial ResultsNet profit after tax from continuing operations increased 3.6 per cent to $2.18 billion on total Group sales from continuing operations of $55.1 billion, up 4.8 per cent.
These results were affected by provisioning for the disposal of the Consumer Electronic business, which has been impacted in recent years by significant price deflation, around the world. On a one off basis, this reduced our after‑tax profits by 14.5% and earnings per share by 14.9%, compared to the previous year.
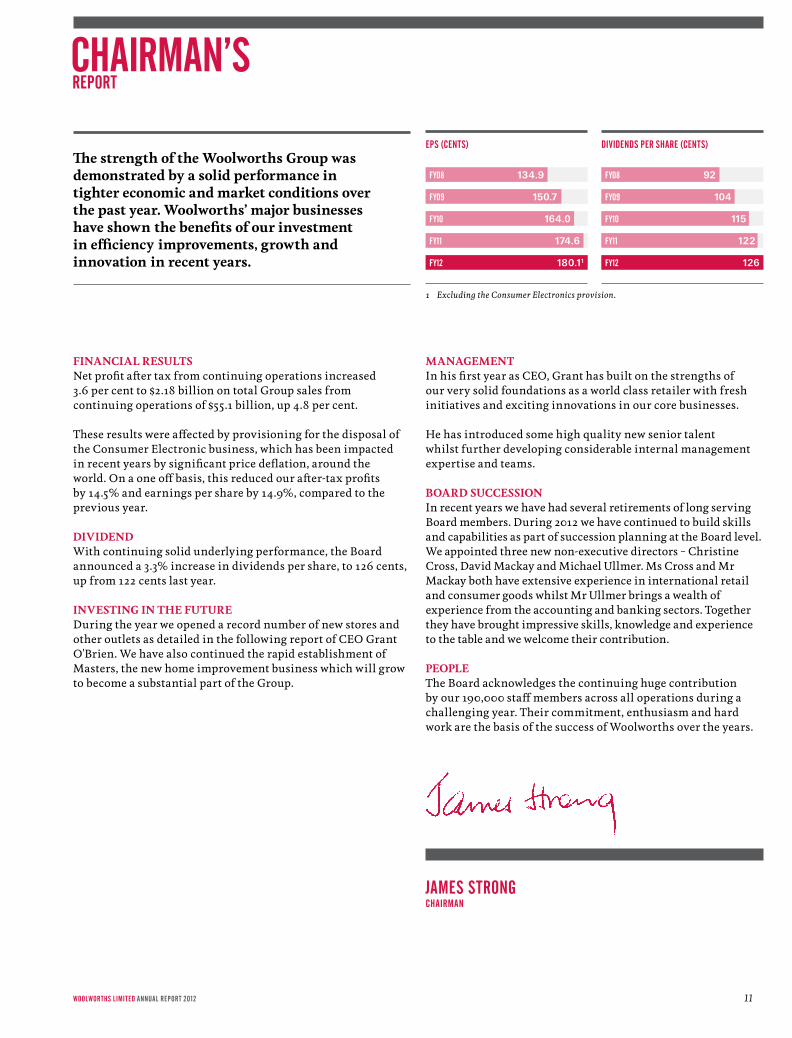
DiviDenDWith continuing solid underlying performance, the Board announced a 3.3% increase in dividends per share, to 126 cents, up from 122 cents last year.
investing in the FutuRe During the year we opened a record number of new stores and other outlets as detailed in the following report of CEO Grant O'Brien. We have also continued the rapid establishment of Masters, the new home improvement business which will grow to become a substantial part of the Group.
ManageMentIn his first year as CEO, Grant has built on the strengths of our very solid foundations as a world class retailer with fresh initiatives and exciting innovations in our core businesses.
He has introduced some high quality new senior talent whilst further developing considerable internal management expertise and teams.
BoaRD succession In recent years we have had several retirements of long serving Board members. During 2012 we have continued to build skills and capabilities as part of succession planning at the Board level. We appointed three new non‑executive directors – Christine Cross, David Mackay and Michael Ullmer. Ms Cross and Mr Mackay both have extensive experience in international retail and consumer goods whilst Mr Ullmer brings a wealth of experience from the accounting and banking sectors. Together they have brought impressive skills, knowledge and experience to the table and we welcome their contribution.
PeoPle The Board acknowledges the continuing huge contribution by our 190,000 staff members across all operations during a challenging year. Their commitment, enthusiasm and hard work are the basis of the success of Woolworths over the years.
The strength of the Woolworths group was demonstrated by a solid performance in tighter economic and market conditions over the past year. Woolworths’ major businesses have shown the benefits of our investment in efficiency improvements, growth and innovation in recent years.
james strong chairman
1 Excluding the Consumer Electronics provision.
chairman’s report
woolworths limited annual report 2012 11
eps (cents) dividends per share (cents)
FY08 134.9
FY09 150.7
FY10 164.0
FY11 174.6
FFY12 180.11
92
104
115
122
126
FY08
FY09
FY10
FY11
FY12

grant o’brien
managing director and ceo
12

Once again Woolworths demonstrated its capacity to evolve the business in keeping with the changed economic and consumer environment. We delivered a profit within our guidance in a year that our customers benefited substantially from lower prices across our brands.
We started this financial year in a period of leadership transition, a lot of strategic questions being posed about our business, and a highly volatile market. Shortly after my appointment as CEO, I laid out our four key strategic goals:
– extend leadership in food and liquor; – maximise shareholder value in our portfolio; – maintain our record of building new growth businesses; and – put in place the enablers for a new era of growth.
I am pleased to report that we are making significant progress against these goals, and we are building a platform for the business as it transforms with its customers and the market.
Creating future shareholder value in this business is at the core of all the transformational work we are doing right now.
As we invest through the tough times, I am very confident this will mean we can continue to grow and deliver into the future. In FY12 we opened 38 supermarkets in Australia, 7 BIG W’s, 20 Dan Murphy’s, 46 BWS stores and 15 Masters stores. Our Masters business, in itself, is an extraordinary new category expansion. We are focused on growing our core businesses and creating new platforms for growth.
I am very proud, therefore, that an Australian business like Woolworths has been able to employ more people and significantly reinvest in the Australian and New Zealand economies despite the strong economic headwinds. Our plans for future growth and requirement for more staff was recognised with a historic agreement with the Australian Government through the Fresh Start agreement.
For this financial year I am pleased to report a solid increase in net profit after tax from continuing operations of 3.6%. Of course, when we include the discontinued Consumer Electronics division we reported a decline in net profit after tax of 14.5%. I announced in January 2012 that we would prepare the Dick Smith business for divestment. It is a relatively small part of the business and this divestment will allow me and my team to be fully focused on the core parts of our business.
Our divisions performed well across the board and I highlight three standouts. First, the engine room of Woolworths, our Australian Food and Liquor business, delivered an increase in EBIT which underlines the fact that efficiency and cost management is at the heart of our operations. It also highlights a significant focus on shrinkage improvement, improvements in buying, further reductions in direct store deliveries and the roll out of new innovations to our store formats. Much of the benefit received from these initiatives has been reinvested in price reductions for our customers.
Second, we continue to make good progress in our Home Improvement business joint venture with Lowe’s Companies, Inc. Highlights included the rapid growth of our first Masters stores with 15 stores opened by the end of FY12. From home renovators to tradies, we are really delighted with the feedback we are getting. Of the 150 sites we plan to secure over five years, there are 112 sites in the pipeline. We expect to have 30 stores opened by the end of FY13 and approximately 100 stores by the end of 2016.
Third, by the end of FY12 Woolworths was Australia’s leading online retailer. Our businesses have embraced innovation and multi‑option retailing to ensure that the needs of our customers are met, no matter how they want to shop. In Australian supermarkets more than 1.8 million customers have the Woolworths app, while across the whole Group we have 2.3 million apps in use and growing by the hour. This multi‑option platform, which we continue to expand and refine, is driving sales and serving our customers better each day and we will continue to be leaders in this exciting space.
We are working hard to ensure that no matter what the environment we will have winning plans for growth that have at their core winning customer propositions.
Woolworths is in many ways a resilient business, and we have at our core some fundamental elements that help us trade through all cycles:
– a strong core business in food and liquor; – a cost‑focused culture throughout the Company; – a very strong customer focus; and – a constant appetite for continuous business improvement.
Woolworths is committed to a program of business transformation that will ensure we extend our leadership position in all of the categories where we are represented. I am confident that Woolworths has Australia’s best retail team who have the expertise and drive to deliver on our plans. We are looking at the future positively and we are confident that we have what it takes to win in any environment.
I would like to take this opportunity to recognise the Woolies team and the Board for their support in my first year as I look forward with great expectation in respect to the future of Woolworths Limited.
grant o'brien managing director and chief executive officer
managing director’s report
13
fy1252 weeks
$m
fy1152 weeks
$m change
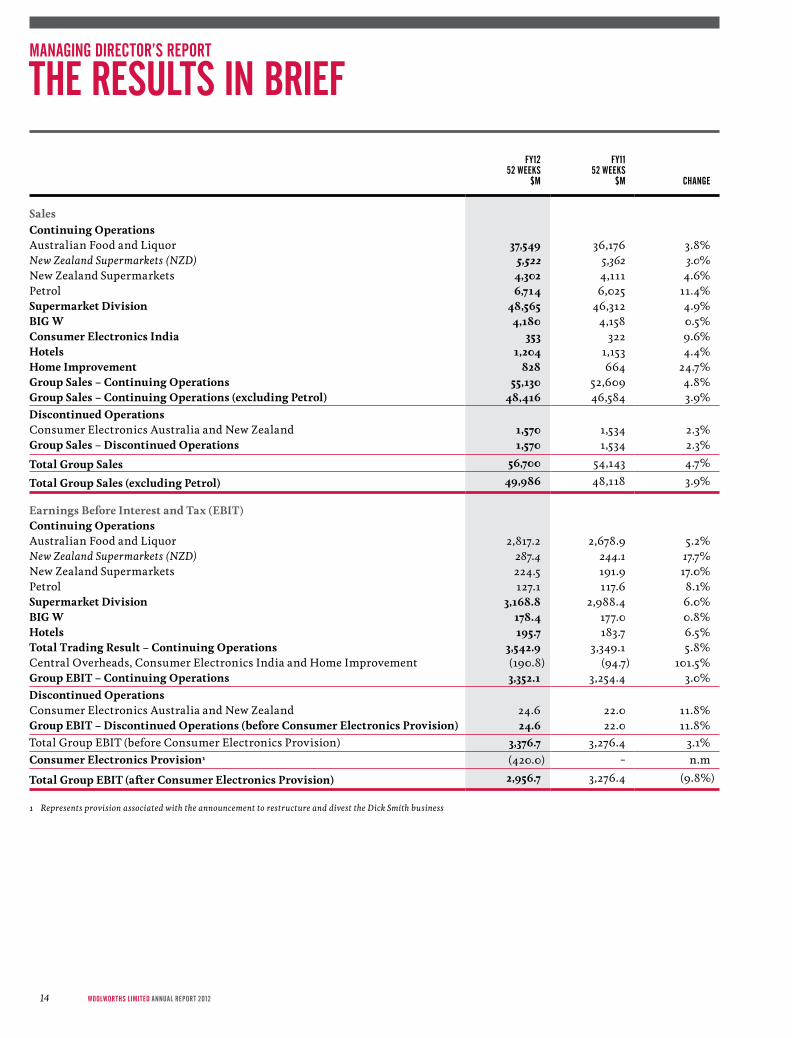
salescontinuing operationsAustralian Food and Liquor 37,549 36,176 3.8%New Zealand Supermarkets (NZD) 5,522 5,362 3.0%New Zealand Supermarkets 4,302 4,111 4.6%Petrol 6,714 6,025 11.4%supermarket Division 48,565 46,312 4.9%Big W 4,180 4,158 0.5%consumer electronics india 353 322 9.6%hotels 1,204 1,153 4.4%home improvement 828 664 24.7%group sales – continuing operations 55,130 52,609 4.8%group sales – continuing operations (excluding Petrol) 48,416 46,584 3.9%Discontinued operationsConsumer Electronics Australia and New Zealand 1,570 1,534 2.3%group sales – Discontinued operations 1,570 1,534 2.3%
total group sales 56,700 54,143 4.7%
total group sales (excluding Petrol) 49,986 48,118 3.9%
earnings Before interest and tax (eBit)continuing operationsAustralian Food and Liquor 2,817.2 2,678.9 5.2%New Zealand Supermarkets (NZD) 287.4 244.1 17.7%New Zealand Supermarkets 224.5 191.9 17.0%Petrol 127.1 117.6 8.1%supermarket Division 3,168.8 2,988.4 6.0%Big W 178.4 177.0 0.8%hotels 195.7 183.7 6.5%total trading Result – continuing operations 3,542.9 3,349.1 5.8%Central Overheads, Consumer Electronics India and Home Improvement (190.8) (94.7) 101.5%group eBit – continuing operations 3,352.1 3,254.4 3.0%Discontinued operationsConsumer Electronics Australia and New Zealand 24.6 22.0 11.8%group eBit – Discontinued operations (before consumer electronics Provision) 24.6 22.0 11.8%Total Group EBIT (before Consumer Electronics Provision) 3,376.7 3,276.4 3.1%consumer electronics Provision1 (420.0) – n.m
total group eBit (after consumer electronics Provision) 2,956.7 3,276.4 (9.8%)
1 Represents provision associated with the announcement to restructure and divest the Dick Smith business
managing director’s report
the results in brief
WoolWorths limited AnnuAl report 201214

fy1252 weeks
$m
fy1152 weeks
$m change
group Profitcontinuing operationsEarnings before interest, tax, depreciation, amortisation and rent (EBITDAR) 5,795.5 5,538.1 4.6%Rent (1,559.7) (1,454.4) 7.2%earnings before interest, tax, depreciation and amortisation (eBitDa) 4,235.8 4,083.7 3.7%Depreciation and amortisation (883.7) (829.3) 6.6%earnings before interest and tax (eBit) 3,352.1 3,254.4 3.0%Net financial expenses1 (283.7) (261.6) 8.4%Income tax expense (885.0) (869.2) 1.8%net profit after income tax 2,183.4 2,123.6 2.8%Non‑controlling interests (0.5) (16.3) (96.9)%Profit from continuing operations after income tax and non‑controlling interests 2,182.9 2,107.3 3.6%Discontinued operationsProfit after income tax from Discontinued operations before consumer electronics Provision
17.5 16.7 4.8%
group net profit after income tax and non‑controlling interests before consumer electronics Provision
2,200.4 2,124.0 3.6%
consumer electronics Provision after income tax (383.7) – n.m
group net profit after income tax, non‑controlling interests and consumer electronics Provision
1,816.7 2,124.0 (14.5)%
Margins – continuing operationsGross Profit 26.26% 26.03% 23 bpsCost of Doing Business 20.18% 19.85% 33 bpsEBIT to sales 6.08% 6.19% (11) bps
ReturnsFunds employed (period end) – continuing operations2 12,753.1 11,802.8 8.1%ROFE (average)2 24.1% 29.3% (520) ppts ROFE (average) before Consumer Electronics Provision2 27.0% 29.3% (230) ppts Weighted average ordinary shares on issue (million) 1,222.0 1,216.2 0.5%Ordinary earnings per share (cents) – continuing and discontinued operations 148.67 174.64 (14.9)%Ordinary earnings per share (cents) – continuing operations 178.63 173.27 3.1%Diluted earnings per share (cents) – continuing and discontinued operations 147.93 173.60 (14.8)%Diluted earnings per share (cents) – continuing operations 177.75 172.24 3.2%Interim dividend per share (cents) 59 57 3.5%Final dividend per share (cents)3 67 65 3.1%Total dividend per share (cents) 126 122 3.3%
Breakdown of net financial expensesInterest expense (net of interest income) (381.2) (332.7)Less interest capitalised 90.1 55.6Net interest expense (291.1) (277.1)Dividend income 7.8 10.6Foreign exchange (loss)/ gain (0.4) 4.9
net financial expenses (283.7) (261.6)
2 Refer page 95 for definitions3 Final dividend payable on 12 October 2012 will be fully franked at 30%
1
15
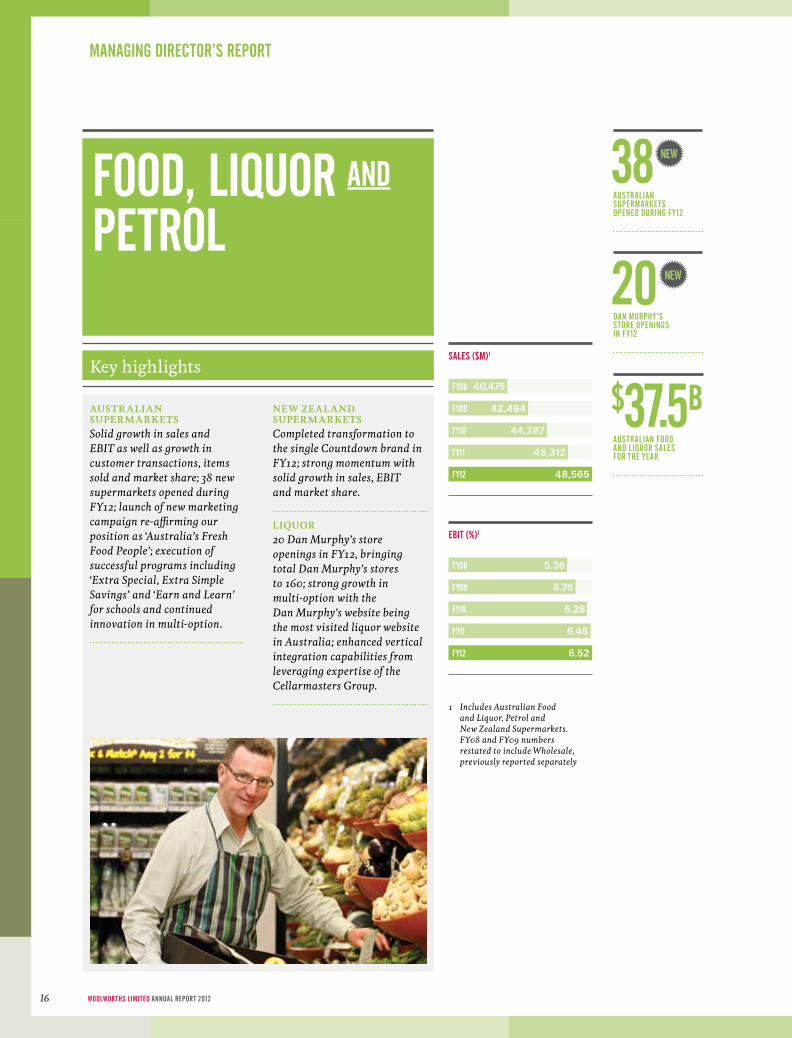
austRalian suPeRMaRkets Solid growth in sales and EBIT as well as growth in customer transactions, items sold and market share; 38 new supermarkets opened during FY12; launch of new marketing campaign re-affirming our position as ‘Australia’s Fresh Food People’; execution of successful programs including ‘Extra Special, Extra Simple Savings’ and ‘Earn and Learn’ for schools and continued innovation in multi-option.
neW ZealanD suPeRMaRkets Completed transformation to the single Countdown brand in FY12; strong momentum with solid growth in sales, EBIT and market share.
liquoR20 Dan Murphy’s store openings in FY12, bringing total Dan Murphy’s stores to 160; strong growth in multi-option with the Dan Murphy’s website being the most visited liquor website in Australia; enhanced vertical integration capabilities from leveraging expertise of the Cellarmasters Group.
38australian supermarkets opened during fy12
$37.5baustralian food and liquor sales for the year
managing director’s report
sales ($m)1
ebit (%)1
5.36
5.76
6.28
6.45
6.52
FY08
FY09
FY10
FY11
FY12
40,475
42,494
44,287
46,312
48,565
FY08
FY09
FY10
FY11
FY12
1 Includes Australian Food and Liquor, Petrol and New Zealand Supermarkets. FY08 and FY09 numbers restated to include Wholesale, previously reported separately
new
dan murphy’s store openings in fy12
20 new
Key highlights
food, liquor and petrol
WoolWorths limited AnnuAl report 201216
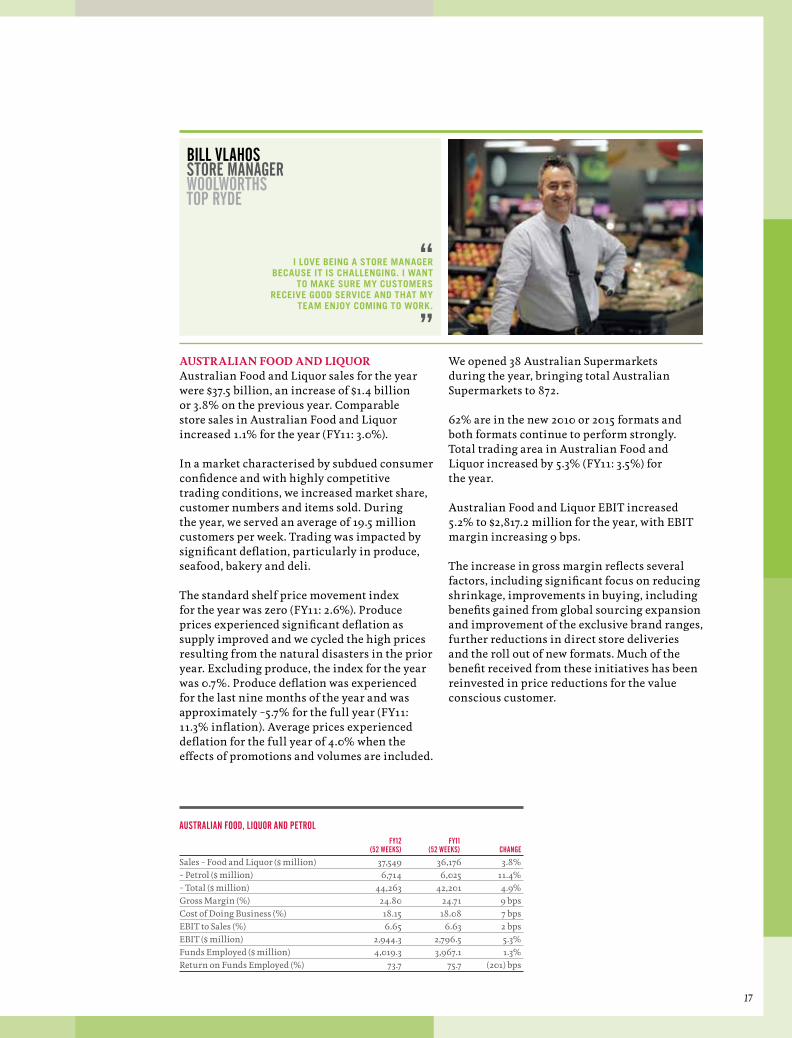
austRalian FooD anD liquoRAustralian Food and Liquor sales for the year were $37.5 billion, an increase of $1.4 billion or 3.8% on the previous year. Comparable store sales in Australian Food and Liquor increased 1.1% for the year (FY11: 3.0%).
In a market characterised by subdued consumer confidence and with highly competitive trading conditions, we increased market share, customer numbers and items sold. During the year, we served an average of 19.5 million customers per week. Trading was impacted by significant deflation, particularly in produce, seafood, bakery and deli.
The standard shelf price movement index for the year was zero (FY11: 2.6%). Produce prices experienced significant deflation as supply improved and we cycled the high prices resulting from the natural disasters in the prior year. Excluding produce, the index for the year was 0.7%. Produce deflation was experienced for the last nine months of the year and was approximately –5.7% for the full year (FY11: 11.3% inflation). Average prices experienced deflation for the full year of 4.0% when the effects of promotions and volumes are included.
We opened 38 Australian Supermarkets during the year, bringing total Australian Supermarkets to 872.
62% are in the new 2010 or 2015 formats and both formats continue to perform strongly. Total trading area in Australian Food and Liquor increased by 5.3% (FY11: 3.5%) for the year.
Australian Food and Liquor EBIT increased 5.2% to $2,817.2 million for the year, with EBIT margin increasing 9 bps.
The increase in gross margin reflects several factors, including significant focus on reducing shrinkage, improvements in buying, including benefits gained from global sourcing expansion and improvement of the exclusive brand ranges, further reductions in direct store deliveries and the roll out of new formats. Much of the benefit received from these initiatives has been reinvested in price reductions for the value conscious customer.
australian food, liquor and petrol fy12 fy11 (52 weeks) (52 weeks) change
Sales – Food and Liquor ($ million) 37,549 36,176 3.8%– Petrol ($ million) 6,714 6,025 11.4%– Total ($ million) 44,263 42,201 4.9%Gross Margin (%) 24.80 24.71 9 bpsCost of Doing Business (%) 18.15 18.08 7 bpsEBIT to Sales (%) 6.65 6.63 2 bpsEBIT ($ million) 2,944.3 2,796.5 5.3%Funds Employed ($ million) 4,019.3 3,967.1 1.3%Return on Funds Employed (%) 73.7 75.7 (201) bps
“ i love being a store manager because it is challenging. i want
to make sure my customers receive good service and that my
team enjoy coming to work.
”
bill vlahos store manager woolworths top ryde
17
CODB was well controlled in dollar terms. CODB as a percentage of sales was impacted by a challenging trading year with significant sell price deflation. The first full year of Cellarmasters CODB also contributed to the increase. There were also additional costs incurred as a result of a higher than usual number of store openings in the year.
liquoRLiquor experienced another year of strong growth across all brands, particularly Dan Murphy’s, gaining further market share and increasing overall profitability at a higher rate than sales growth. Our convenience liquor business (BWS and Woolworths Liquor) also trended well complementing the growth of big box liquor. Group liquor sales (including ALH Group liquor sales) for the year totalled $6.6 billion (FY11: $5.9 billion).
Whilst comparable sales for liquor grew for the year at a faster rate than food, this has not had a material impact on Australian Food and Liquor comparable sales growth.
new south wales and australian capital territory
queensland
western australia
south australia and northern territory
victoria
tasmania
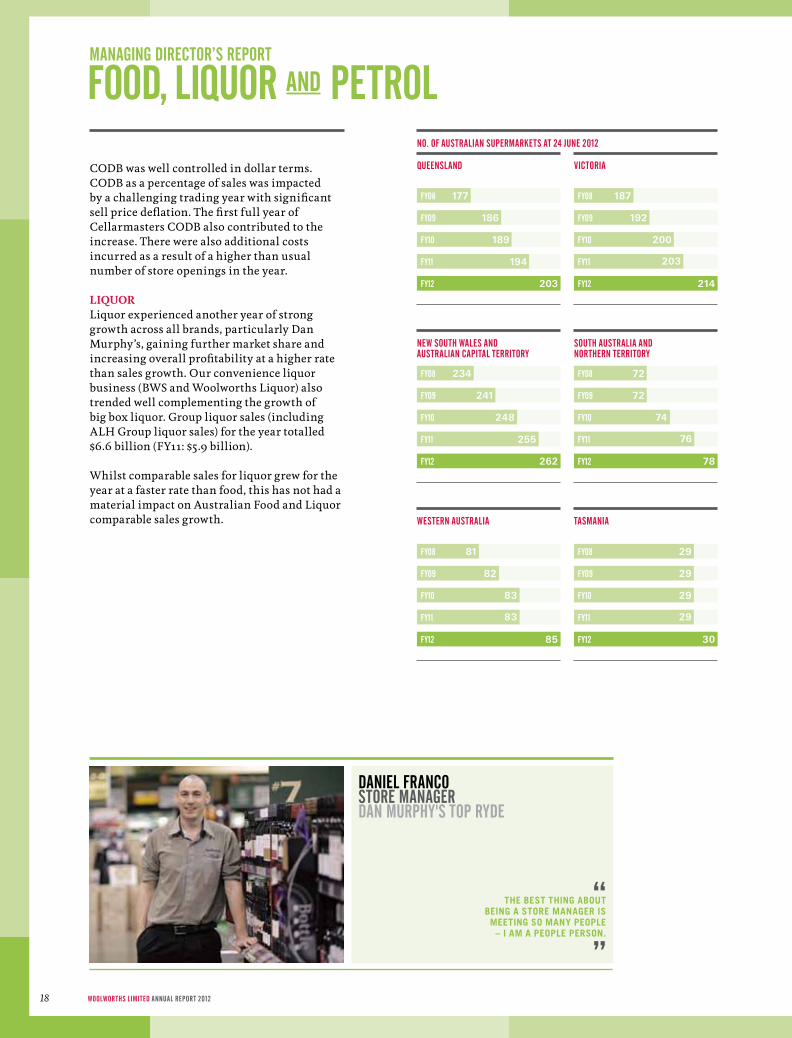
177
186
189
194
203
FY08
FY09
FY10
FY11
FY12
187
192
200
203
214
FY08
FY09
FY10
FY11
FY12
234
241
248
255
262
FY08
FY09
FY10
FY11
FY12
72
72
74
76
78
FY08
FY09
FY10
FY11
FY12
81
82
83
83
85
FY08
FY09
FY10
FY11
FY12
29
29
29
29
30
FY08
FY09
FY10
FY11
FY12
no. of australian supermarkets at 24 june 2012
managing director’s report
food, liquor and petrol
daniel franco store managerdan murphy's top ryde
“ the best thing about being a store manager is meeting so many people
– i am a people person.
”WoolWorths limited AnnuAl report 201218

PetRolPetrol sales for the year, including Woolworths/Caltex Alliance sites, were $6.7 billion, an increase of 11.4% on the previous year. This reflects an increase in average fuel sell prices (FY12: 142.9 cpl, FY11: 131.2 cpl). Comparable sales increased 8.8% for the year.
Petrol volumes increased 1.7% on the previous year, however comparable volumes decreased 0.7%. This reflects the market being flat as a result of higher fuel sell prices and tight family budgets, as well as vehicles becoming more fuel efficient, resulting in customers filling up less regularly whilst continuing to maintain their average dollar fills.
Total merchandise (non‑fuel) sales were up 8.0% for the year and comparable merchandise (non‑fuel) sales were up 2.8% for the year.
Petrol EBIT increased 8.1% to $127.1 million for the year as a result of increased volumes, buying benefits achieved with our supply partner Caltex and a higher percentage of EBIT contributed by non‑fuel sales.
We opened 18 petrol canopies during the year, bringing the total to 599, including 132 Woolworths/Caltex alliance sites.
FunDs eMPloyeDReturn on funds employed (ROFE) for Australian Food and Liquor (including Petrol) for the year was 73.7%, down from 75.7% in the prior year. The decrease is largely attributable to the inclusion of the first full year of Cellarmasters, a strategic multi‑option and production acquisition made in the prior year. Excluding the impact of the Cellarmasters business, ROFE was 79.8%, up from 79.2% in the prior year.
Inventory levels have continued to be well managed with inventory days at year end down 1.0 day.
$6.6b group liquor sales (including alh group liquor sales) 18 canopies during
the year 79.8% rofe (excluding the impact of the cellarmasters business)
kamal singhsite manager
petrol burwood
“ being a petrol site manager means making sure our customers receive the best service every time they stop and fill up.
”
new
19

New Zealand Supermarkets sales for the year were NZ$5.5 billion, an increase of 3.0% on the previous year (4.6% increase in AUD). Strong online sales growth continues with positive response from customers.
Comparable sales grew 3.3% for the year. Impacts stemming from stores closed due to the Christchurch earthquake in February 2011 and the petrol sites transferred back to Gull have been excluded from comparable sales.
The Countdown Supermarkets food price index inflation for the year was 1.1% (FY11: 1.4%).
We opened seven new Countdown supermarkets and reopened one earthquake damaged Countdown during the year, increasing total Countdown supermarkets by year end to 161. There are also 54 franchise stores, having opened three during the year. One Countdown store remains closed as a result of the February 2011 Christchurch earthquake and is planned to reopen in 2013.
Trading EBIT increased 15.9%, with EBIT margin up 59 bps on the previous year. This is a very pleasing result given the supermarket industry has been relatively static over the last 12 months and inflation has been low. The result is underpinned by the shift to the single Countdown brand which has seen great momentum build across the business with growth in market share, customer numbers, basket size and items sold. Customers continue to respond well to the price positioning and the delivery of value provided by Countdown stores.
store numbers – new Zealand (including franchises)
nZ$5.5bnew Zealand supermarket sales for the year
new Zealand supermarkets
FY08 201
FY09 202
FY10 206
FY11 207
FY12 215
managing director’s report
food, liquor and petrol
WoolWorths limited AnnuAl report 201220
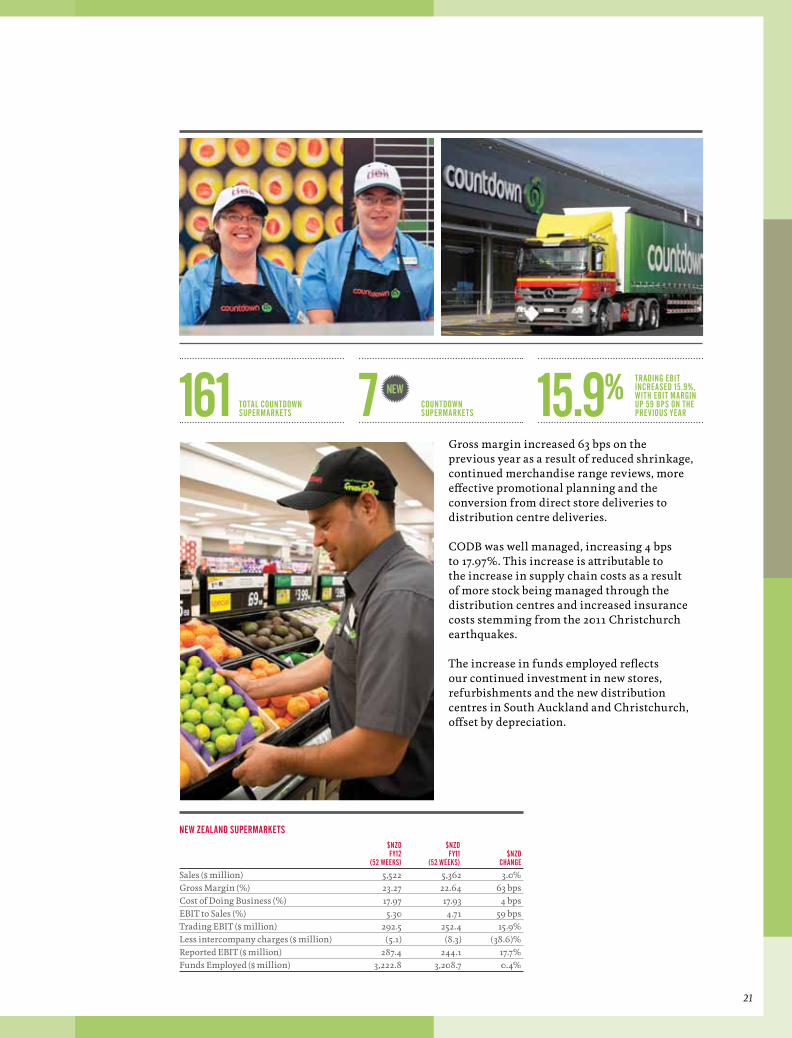
Gross margin increased 63 bps on the previous year as a result of reduced shrinkage, continued merchandise range reviews, more effective promotional planning and the conversion from direct store deliveries to distribution centre deliveries.
CODB was well managed, increasing 4 bps to 17.97%. This increase is attributable to the increase in supply chain costs as a result of more stock being managed through the distribution centres and increased insurance costs stemming from the 2011 Christchurch earthquakes.
The increase in funds employed reflects our continued investment in new stores, refurbishments and the new distribution centres in South Auckland and Christchurch, offset by depreciation.
161 total countdown supermarkets
new7 countdown supermarkets
new Zealand supermarkets $nZd $nZd fy12 fy11 $nZd (52 weeks) (52 weeks) change
Sales ($ million) 5,522 5,362 3.0%Gross Margin (%) 23.27 22.64 63 bpsCost of Doing Business (%) 17.97 17.93 4 bpsEBIT to Sales (%) 5.30 4.71 59 bps Trading EBIT ($ million) 292.5 252.4 15.9%Less intercompany charges ($ million) (5.1) (8.3) (38.6)%Reported EBIT ($ million) 287.4 244.1 17.7%Funds Employed ($ million) 3,222.8 3,208.7 0.4%
15.9% trading ebit increased 15.9%, with ebit margin up 59 bps on the previous year
21
managing director’s report
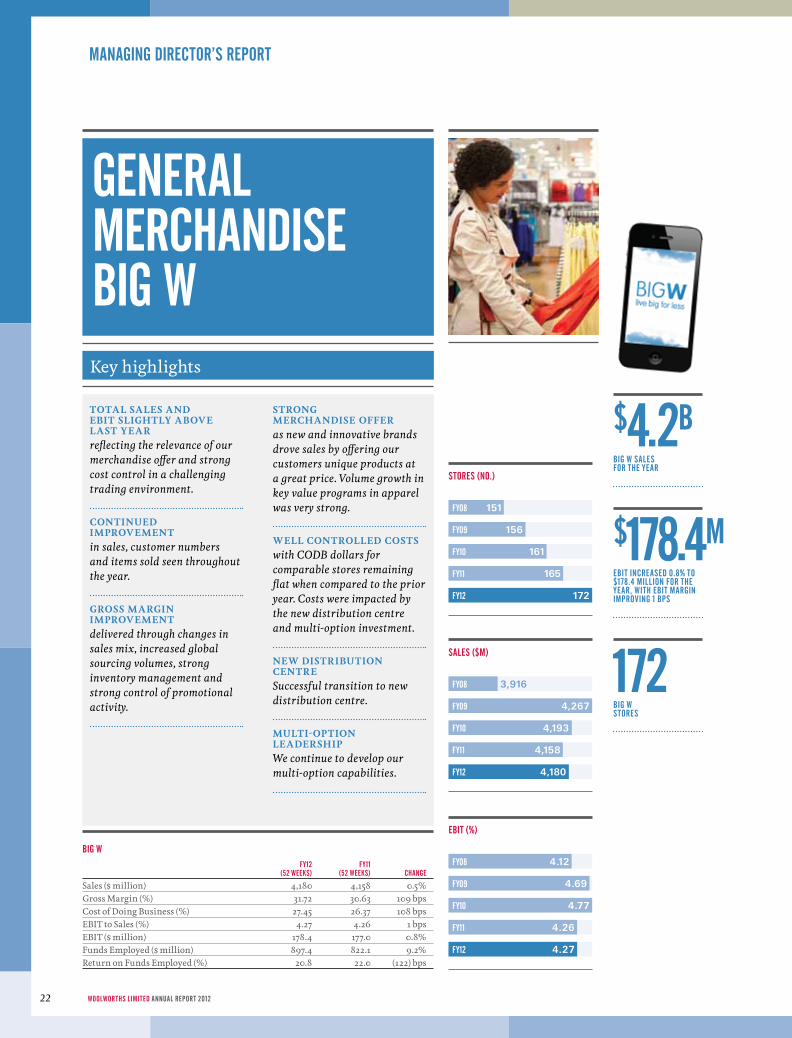
total sales anD eBit slightly aBove last yeaR reflecting the relevance of our merchandise offer and strong cost control in a challenging trading environment.
continueD iMPRoveMentin sales, customer numbers and items sold seen throughout the year.
gRoss MaRgin iMPRoveMentdelivered through changes in sales mix, increased global sourcing volumes, strong inventory management and strong control of promotional activity.
stRong MeRchanDise oFFeRas new and innovative brands drove sales by offering our customers unique products at a great price. Volume growth in key value programs in apparel was very strong.
Well contRolleD costswith CODB dollars for comparable stores remaining flat when compared to the prior year. Costs were impacted by the new distribution centre and multi-option investment.
neW DistRiBution centReSuccessful transition to new distribution centre.
Multi-oPtion leaDeRshiPWe continue to develop our multi-option capabilities.
stores (no.)
151
156
161
165
172
FY08
FY09
FY10
FY11
FY12
sales ($m)
3,916
4,267
4,193
4,158
4,180
FY08
FY09
FY10
FY11
FY12
ebit (%)
4.12
4.69
4.77
4.26
4.27
FY08
FY09
FY10
FY11
FY12
big w fy12 fy11 (52 weeks) (52 weeks) change
Sales ($ million) 4,180 4,158 0.5%Gross Margin (%) 31.72 30.63 109 bpsCost of Doing Business (%) 27.45 26.37 108 bpsEBIT to Sales (%) 4.27 4.26 1 bpsEBIT ($ million) 178.4 177.0 0.8%Funds Employed ($ million) 897.4 822.1 9.2%Return on Funds Employed (%) 20.8 22.0 (122) bps
$4.2bbig w sales for the year
172big w stores
$178.4mebit increased 0.8% to $178.4 million for the year, with ebit margin improving 1 bps
general merchandise big wKey highlights
WoolWorths limited AnnuAl report 201222

BIG W sales for the year were $4.2 billion, an increase of 0.5% on the previous year. Comparable sales for the year decreased 1.5%.
EBIT increased 0.8% to $178.4 million for the year, with EBIT margin improving 1 bps. EBIT growth in the second half was 13.1%, reflecting strong gross margins and well managed costs.
Sales for the second half of the year have shown an improved trend, with total sales increasing 2.9%. Comparable sales increased 0.3% for the second half, which is pleasing given the continued price deflation and challenging retail conditions.
Customer numbers and items sold increased during the year, reflecting our strong brand proposition by offering the lowest prices on the widest range of quality and branded merchandise every day. Areas that performed well during the year include Womenswear, Footwear, Menswear, Toys and Books.
We opened seven new stores during the year, bringing the total to 172.
The changes in Gross Margin % and CODB % reflect:
– CODB dollars for like stores were flat, despite inflationary pressures on costs
– The transition to the new distribution centre at Hoxton Park in Sydney, which opened in March 2012. The additional costs, including transition costs, are recorded in CODB with the benefits recorded in gross profit. The benefits include savings in freight costs and outside storage costs. This shift between CODB and gross margin occurred in the current year and will continue in the next financial year. The transition to the new
distribution centre was very smooth with transition costs of $6.4 million being lower than expected. The benefits of this new infrastructure will emerge in future years and support the growth of the physical stores and the multi‑option business
– Gross margin improvement through changes in sales mix, increased global sourcing volumes, strong inventory management and strong control of promotional activity
– Costs associated with the seven new stores that were opened during the year
– Costs associated with the investment in BIG W’s multi‑option business
– The deflationary environment and its resulting impact on sales
The increase in funds employed of 9.2% reflects continued investment in the BIG W business to build a platform for long term growth. Key investments during the year include seven new stores, refurbishments, supply chain systems, investment in our multi‑option capabilities and the new distribution centre at Hoxton Park.
Average inventory increased 0.4 days when allowing for the impact of incremental indent, driven by the seven new stores. BIG W closing inventory was higher than last year due to seven new stores and the higher investment in high volume apparel lines.
jack mendonca store managerbig w top ryde
“ there are two things i love about my job. the first is coaching and developing staff and the second
is offering my customers a great experience in store.
”
23

managing director’s report
gooD MoMentuM Solid sales and EBIT growth in a challenging trading environment underpinned by customer appreciation of our improved Food and Bar offers.
gRoWth thRough acquisitionAcquired 12 hotels in Western Australia from the receivers of the Compass Group and since year end, acquired 28 hotels from the Laundy, Waugh and DeAngelis Hotel Groups.
Well contRolleD costsStrong cost control throughout the year leading to CODB % improvements.
hotels acquired in western australia from the receivers of the compass group
12 new
hotels acquired since year end from the laundy, waugh and deangelis hotel groups
28 new
Key highlights
hotels
WoolWorths limited AnnuAl report 201224
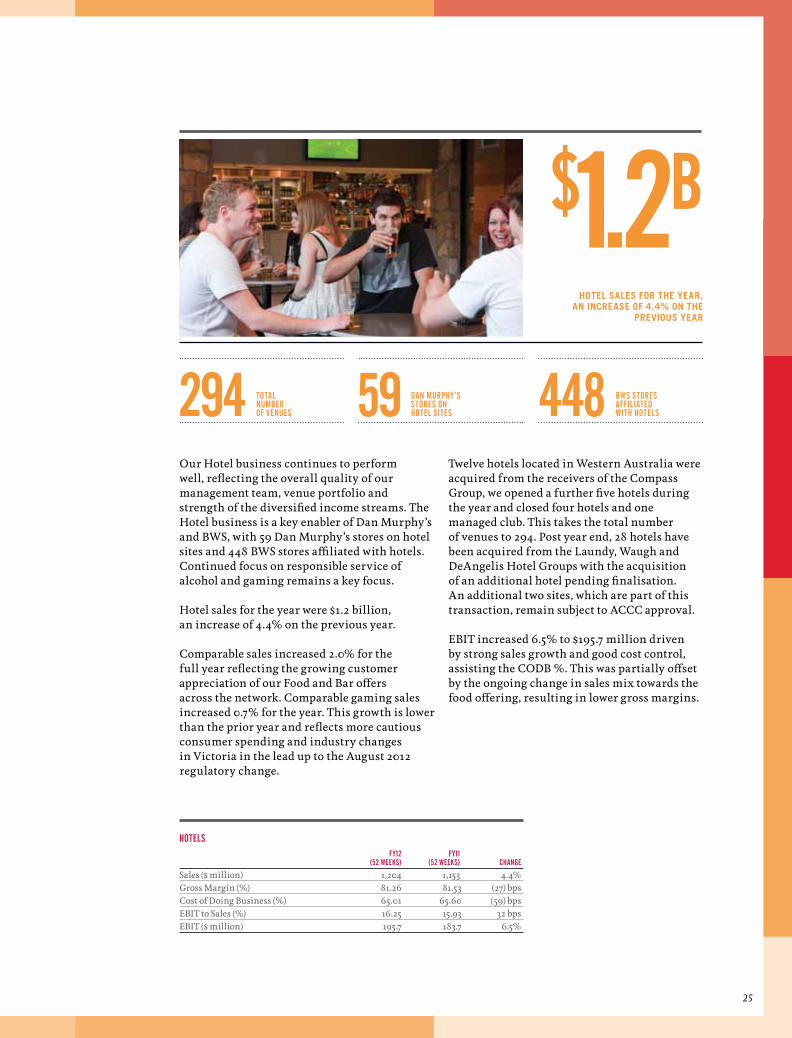
Our Hotel business continues to perform well, reflecting the overall quality of our management team, venue portfolio and strength of the diversified income streams. The Hotel business is a key enabler of Dan Murphy’s and BWS, with 59 Dan Murphy’s stores on hotel sites and 448 BWS stores affiliated with hotels. Continued focus on responsible service of alcohol and gaming remains a key focus.
Hotel sales for the year were $1.2 billion, an increase of 4.4% on the previous year.
Comparable sales increased 2.0% for the full year reflecting the growing customer appreciation of our Food and Bar offers across the network. Comparable gaming sales increased 0.7% for the year. This growth is lower than the prior year and reflects more cautious consumer spending and industry changes in Victoria in the lead up to the August 2012 regulatory change.
Twelve hotels located in Western Australia were acquired from the receivers of the Compass Group, we opened a further five hotels during the year and closed four hotels and one managed club. This takes the total number of venues to 294. Post year end, 28 hotels have been acquired from the Laundy, Waugh and DeAngelis Hotel Groups with the acquisition of an additional hotel pending finalisation. An additional two sites, which are part of this transaction, remain subject to ACCC approval.
EBIT increased 6.5% to $195.7 million driven by strong sales growth and good cost control, assisting the CODB %. This was partially offset by the ongoing change in sales mix towards the food offering, resulting in lower gross margins.
hotels fy12 fy11 (52 weeks) (52 weeks) change
Sales ($ million) 1,204 1,153 4.4%Gross Margin (%) 81.26 81.53 (27) bpsCost of Doing Business (%) 65.01 65.60 (59) bpsEBIT to Sales (%) 16.25 15.93 32 bpsEBIT ($ million) 195.7 183.7 6.5%
$1.2bhotel sales for the year,
an increase of 4.4% on the previous year
294 total number of venues 59 dan murphy’s
stores on hotel sites 448 bws stores
affiliated with hotels
25

managing director’s report
We continue to make good progress on our Home Improvement business joint venture with Lowe’s. Home Improvement sales increased 24.7% to $828 million for the year.
coMMenceD tRaDingOur first Masters store commenced trade during September 2011, with 15 stores open at the end of the year. Feedback has been very positive in relation to the new home improvement offering, with customers welcoming the innovative range, particularly in the tools, home appliance, kitchen and lighting categories.
national PResenceWe now have stores in Western Australia, Victoria, New South Wales, Queensland, ACT and South Australia.
laRge PiPelineOf the 150 sites we plan to secure over five years, there are 112 sites in the pipeline. At the end of the year, there were 12 stores under construction and five completing fitout. We expect at least 30 stores in total to be open by the end of FY13 and approximately 100 stores opened by the end of 2016.
DistRiBution netWoRkOur DC located in Hoppers Crossing Victoria is successfully supporting the Masters store network. Our second DC in Hoxton Park New South Wales will commence dispatch during the next few months and will provide additional support to the network and freight savings across the Group.
online launcheDIn June, we launched Australia’s first online Home Improvement store through the Masters transactional website with over 10,000 visitors a day. This is enabling us to reach more customers with the Masters offering. We continue to increase the range offered online to further improve the customer offer.
successFul acquisitionWe successfully acquired Tait Timber and Hardware in November 2011 and Mittagong Timber and Hardware in February 2012 to further build the Danks Retail business.
“ i have such a supportive team. it makes coming to work an
absolute pleasure and i know that they provide our customers
with great service.
”
rosanna kennedystore support managermasters gregory hills
home improvement
Key highlights
WoolWorths limited AnnuAl report 201226

consumer electronics australia and nZ fy12 fy11 (52 weeks) (52 weeks) change
Sales ($ million) 1,570 1,534 2.3%EBIT before restructure provision ($ million) 24.6 22.0 11.8%EBIT ($ million) (395.4) 22.0 n.m
managing director’s report
consumer electronics india Our business venture with TATA in India now services 77 stores operating under the Croma brand. Sales for the full year were $353 million, up 9.6% on the previous year. EBIT increased to $5.7 million for the year. As part of this venture, Woolworths provides buying, wholesale, supply chain and general consulting services to TATA.
discontinued operations – consumer electronics australia and new ZealandFollowing a strategic review, Woolworths announced on 31 January 2012 that the Dick Smith business would be restructured and divested as a going concern in a staged and managed process. During FY12, as part of the restructure process, 52 underperforming stores across Australia and New Zealand were closed, bringing the total number of stores to 348, including 286 in Australia and 62 in New Zealand at year end. A further 22 stores were closed in July. The core business continues to trade strongly and profitably.
At year end the sale process remains underway and a restructuring loss of $420 million (including $300 million raised at HY12) has been included in the FY12 result. This represents provisions and impairment losses relating to lease exit and restructure costs, goodwill, inventory and property, plant and equipment. As a result of the proposed divestment, Consumer Electronics Australia and New Zealand has been disclosed as a discontinued operation.
The increase in EBIT before the restructure provision reflects the impact of a stronger underlying business, coupled with the successful delivery of a cost optimisation program that has achieved significant sustainable cost reductions across all areas of the business.
consuMeR electRonics austRaliaConsumer Electronics Australia sales increased 2.1% to $1.3 billion for the year.
Comparable sales increased 4.3% for the year reflecting a strong promotional program, stock clearances and store closure sales during the fourth quarter. The value of the Dick Smith brand has been reinforced in the market through campaigns such as ‘Dick Does’ and ‘Cheapest Ever’.
consuMeR electRonics neW ZealanDConsumer Electronics New Zealand sales increased 2.8% to NZ$331 million for the year.
Comparable sales increased 6.9% for the year reflecting the same initiatives as the Australian business during the latter part of the year.
$1.3bconsumer electronics australia sales for the year
$353mconsumer electronics india sales for the year
nZ$331mconsumer electronic new Zealand sales for the year
consumer electronics
27
managing director’s report
overheads, expenses and balance sheet
$2,873.8m cash provided by operating activities
operating activities
strong
our balance sheet and cash flow remain strong
centRal oveRheaDs (incluDing hoMe iMPRoveMent anD consuMeR electRonics inDia)_Central overheads have increased to $190.8 million for the year reflecting expected Home Improvement start‑up costs of approximately $100 million (net of Danks operating profit and before tax and non‑controlling interest). Corporate costs, also included in central overheads, were relatively flat.
cash FloW_Cash generated by normal trading (EBITDA before movements in working capital) increased 3.3% to $4,272.6 million. After taking into account the additional net investment in inventory (largely driven by the start‑up phase of the Masters business) and other changes in working capital, cash from operating activities before interest and tax increased 1.0%.
Net interest paid of $369.3 million (FY11: $309.6 million) increased as a result of higher net debt levels reflecting the funding of planned capital expenditure, including property development activity and the start‑up phase of the Masters business, as well as the full impact of the share buy‑back activity undertaken in the prior year.
Tax payments were $941.4 million in FY12 (FY11: $841.5 million). This increase is mainly attributable to a higher instalment rate in FY12 and higher tax refunds/credits in FY11 related to Research and Development and the Investment Allowance.
Total cash provided by operating activities was $2,873.8 million, down 3.9%.
Cash used in investing activities decreased 4.5% to $2,080.3 million, primarily as a result of lower business acquisitions during FY12.
Free cash flow generated by the business was $996.5 million (FY11: $990.3 million). The cash realisation ratio was 93.7%. After excluding the impact of the additional net investment in inventory which largely resulted from building inventory within the Masters Home Improvement business, the cash realisation ratio was 102.8%.
After taking into account proceeds from share issues and the payment of dividends, additional debt of $206.8 million was drawn during the year.
Balance sheetKey balance sheet movements for the continuing operations of the Group relative to the prior year are explained as follows:
– Inventory increased 8.4%, primarily driven by the building of Masters’ inventory. Excluding Masters, inventory increased 3.3% on the prior year
– Trade payables were in line with the prior year
– Receivables increased 19.9%, primarily reflecting increased prepayments, property deposits and receivables in businesses acquired by Danks
– Fixed assets and investments increased by $1,158.3 million to $9,846.5 million, reflecting ongoing capital expenditure offset by depreciation
– Intangibles increased $116.0 million to $5,282.0 million reflecting intangibles related mainly to acquisitions of the Compass Hotel Group and Home Improvement retail outlets as well as fluctuations in foreign exchange rates which increased the value of intangibles relating to New Zealand Supermarkets
– Net repayable debt (which includes cash, borrowings, financial assets and liabilities) has increased $300.5 million reflecting increased net borrowings to fund capital expenditure and the start‑up phases of the Masters business. The remainder of the increase is due to currency revaluations which have been offset by lower hedge related liabilities
– Return on funds employed declined 237 bps to 27.8% predominately reflecting our investment in the start up phase of Masters and property development undertaken to facilitate ongoing store roll outs
WoolWorths limited AnnuAl report 201228
managing director’s report
capital management and outlook
oBjectivesWoolworths sets its capital structure with the objective of enhancing long term shareholder value through optimising its weighted average cost of capital while retaining flexibility to pursue growth and undertake capital management initiatives. Consistent with this objective, Woolworths has targeted, achieved and maintained its long standing strong investment grade credit ratings from Standard & Poor’s and Moody’s Investor Services.
caPital ManageMentWoolworths will seek to return capital to shareholders when that is consistent with its capital structuring objectives and where it will enhance shareholder value. Since July 2001, over $11.9 billion has been returned to shareholders through dividends (including the final dividend for the financial year ended 24 June 2012) and on‑market and off‑market share buy backs.
Given the trading environment, there was no share buy back activity in 2012 and none is anticipated in 2013.
The payment of the April 2012 and October 2012 dividends will return over $658 million in franking credits to shareholders. Woolworths expects that after these events, there will be approximately $1.5 billion of franking credits available for future distribution.
Over the last few years, Woolworths has been utilising its strong balance sheet to fund growth initiatives such as our property pipeline and our new Masters Home Improvement business. This has seen us draw down debt to fund these initiatives utilising capacity within our existing credit ratings. We expect to utilise additional net borrowings during FY13, however as the Masters business moves towards a breakeven position and we pass the peak in our property development pipeline, net cash generation is expected.
franking credits amount returned to shareholders
$1.5b available for future distribution to shareholders
$11.9b through dividends and share buybacks since july 2001
objectives
woolworths sets its capital structure with the objective of enhancing long term shareholder value
29

managing director’s report
capital management and outlook
Financing tRansactionsIn October 2011, Woolworths executed a A$1.2 billion syndicated revolving bank loan facility comprised of two tranches, three years (A$580 million) and five years (A$620 million). Shortly thereafter, two existing syndicated bank loan facilities of A$800 million and US$700 million, maturing in April and May 2012 respectively, were terminated.
In November 2011, Woolworths issued A$700 million in hybrid notes having a 25 year maturity with a non‑call period of five years.
In March 2012, Woolworths issued A$500 million of Medium Term Notes into the domestic institutional market with a maturity of seven years.
Maturities during the year included A$600 million in perpetual hybrid notes which were redeemed at the expiry of the five year non‑call period in September 2011 and US$300 million in US 144A notes (hedged at A$410 million) in November 2011.
There are no maturities of debt in the immediate term. At the end of FY12, Woolworths had $3.4 billion in undrawn bank loan facilities.
Note: The credit ratings referred to in this document have been issued by a credit rating agency which holds an Australian Financial Services Licence with an authorisation to issue credit ratings to wholesale clients only. The credit ratings in this document are published for the benefit of Woolworths Debt Providers
PRoPeRty sales PRogRaMWoolworths has a history of developing Marketplace style retail centres through its property development arm.
Woolworths increased its involvement in the development of sites using its own balance sheet due to the significant decline in third party property development. This has resulted in Woolworths’ ownership of a larger (than historical) portfolio of retail centres. Woolworths is generally not a long‑term holder of property assets and continues its strategy of divesting property as appropriate market opportunities arise. Woolworths’ total proceeds from the disposal of property for the 2012 financial year were approximately $200 million.
DeFineD Plans to continue sPace Roll outSpace roll out is supported by detailed plans for the next three to five years identifying specific sites.
WoolWorths limited AnnuAl report 201230
gross store openings
in fy12 target
Australian Supermarkets
38 15‑25 new Supermarkets perannum and 3%+ space growth.In FY13, we plan to open 35Supermarkets and will achieve approximately4.2% space growth.
New Zealand Supermarkets
81 3‑5 new Supermarketsper annum.
Dan Murphy’s 20 Plans to open 10‑15 newstores per annum targetingover 200 stores.
BWS 46 Plans to open 6‑10stores (net) per annum.
Petrol 18 Will grow supportingthe Supermarket rollout strategy.
BIG W 7 4‑7 stores per annum.Hotels (ALH Group)
172 Acquire selectively asappropriate opportunities arise.
Home Improvement
203 Planning to secure 150 Masterssites in five years (fromannouncement of JV). Plan toopen 15‑20 Masters stores perannum with approximately 100stores opened by the end of 2016
outlookWe expect the Australian and New Zealand retail sectors to continue to experience challenging trading conditions with low consumer confidence continuing to dampen consumer retail spending in FY13. Woolworths has the ability to adapt to challenging economic circumstances and is proving it is a resilient business.
Masters Home Improvement start‑up costs will continue and are anticipated to be approximately $80 million (net of Danks operating profit and before tax and non‑controlling interests) reflecting the second year of this greenfields development. The amount of these start‑up costs is dependent on a range of factors, in particular, new store roll outs. The quantum of these costs will begin to decline after FY13.
We expect further earnings growth in FY13, with net profit after tax from continuing operations expected to grow in the range of 3% ‑ 6% (on a normalised 52 week basis), subject to the uncertainties detailed above (note: FY13 will be a 53 week year).
1 Includes reopening of one store previously closed as a result of the Christchurch earthquake2 12 hotels located in Western Australia were acquired from the receivers of the Compass Group3 15 Masters stores opened and Danks acquisition of four stores and one truss plant
from Tait Timber and Hardware and Mittagong Timber and Hardware
outlook
woolworths has a clear strategy which is building momentum with benefits arising from continuing investment underpinning long term sustainable profit growth
31

board of
directors
64
10
12
2
8
32

1 James Alexander Strong, AO Chairman
2 Grant O'Brien Managing Director and Chief Executive Officer
3 John Frederick Astbury Director
4 Jillian Rosemary Broadbent, AO Director
5 Christine Cross Director
6 Sir Roderick Sheldon Deane Director
7 Carla (Jayne) Hrdlicka Director
8 Ian John Macfarlane, AC Director
9 Ralph Graham Waters Director
10 Thomas (Tom) William Pockett Finance Director
11 Michael James Ullmer Director
12 Allan Douglas (David) Mackay Director
13 Peter Horton General Counsel and Company Secretary
1
13
11
7
9
35
33
board of directors
james alexander strong, ao chairman
Member: Audit, Risk Management and Compliance Committee, People Policy Committee and Nomination Committee.
Mr Strong is currently Chairman of Kathmandu Holdings Limited (2009 to 2012) and the Organising Committee for the ICC Cricket World Cup 2015. He is also a director of Qantas Airways Limited (2006 to 2012), a member of the Australian Grand Prix Corporation, a member of the Nomura Australia Advisory Board and a Director of The Sydney Writers’ Festival.
Mr Strong was previously Chairman of The Australia Council for the Arts (2006 to 2012), Chairman of Insurance Australia Group Limited (IAG) (director 2001 to August 2010), Chief Executive and Managing Director of Qantas Airways Limited (1993 to 2001), Chairman of Rip Curl Group Pty Limited (director from 2001 to 2008), Group Chief Executive of DB Group Limited in New Zealand, National Managing Partner and later Chairman of law firm Corrs Chambers Westgarth, Chief Executive of Trans Australian Airlines (later Australian Airlines) and Executive Director of the Australian Mining Industry Council.
Mr Strong has been admitted as a barrister and solicitor in various state jurisdictions in Australia. In 2006 he was made an Officer of the Order of Australia for his services to business and commerce, particularly in the aviation, insurance and retail fields, and to the arts as an administrator and philanthropist.
Mr Strong was appointed a Director of Woolworths Limited in March 2000 and Chairman in April 2001. Age: 68.
grant o’brien managing director and chief executive officer
Mr O’Brien’s career extends over 25 years with Woolworths, starting as an Accountant in Purity Supermarkets in Tasmania, a division of Woolworths
Limited. He was appointed Managing Director and Chief Executive Officer on 1 October 2011. Prior to that he held positions as Deputy Chief Executive Officer and CEO Designate, Chief Operating Officer Australian Food and Petrol, Director New Business Development, General Manager Woolworths Liquor, Senior Business Manager Marketing Supermarkets, and Marketing and Merchandise Manager for Purity. He completed the Advanced Management Program at Harvard in 2010.
Mr O’Brien is a Director of The Consumer Goods Forum, the peak global body for food/grocery retailers and manufacturers. Mr O’Brien is a member of the Business Council of Australia. He is also a Director of the Avner Nahmani Pancreatic Cancer Research Fund.
Mr O’Brien was appointed a Director of Woolworths Limited in April 2011. Age: 51.
john frederick astbury faicd
Member: Audit, Risk Management and Compliance Committee (previously Chairman from July 2010 to February 2012 and February 2006 to November 2007), and of the Nomination Committee. He is also a director of Hydrox Holdings Pty Ltd and Chairman of its Audit Committee (since 2009).
Mr John Astbury was a Director of AMP Limited from 2004 to 2007, Insurance Australia Group Limited from 2000 to 2007 and M.I.M. Holdings Limited (now Xstrata Queensland Limited) from 1998 to 2003. He was also the Finance Director of Lend Lease Corporation Ltd and a Chief General Manager, National Australia Bank Limited. He has had a long career in banking and financial services in both the UK and Australia.
Mr Astbury was appointed a Director of Woolworths Limited in January 2004. Age: 68.
jillian rosemary broadbent, ao ba, hondlitt (uws)
Member: Audit, Risk Management and Compliance Committee (since February 2011) and Nomination Committee.
Ms Broadbent has a Bachelor of Arts degree (economics and maths majors) from the University of Sydney and an Honorary PhD from the University of Western Sydney.
Ms Broadbent has extensive experience in corporate banking and finance in both Australia and internationally, primarily with Bankers Trust Australia. She is a Member of the Board of the Reserve Bank of Australia, a non‑executive Director of ASX Limited (since February 2010), Chairman of the Clean Energy Finance Corporation and Chancellor of the University of Wollongong. She is Chairman of the Sydney Theatre Company Foundation.
Ms Broadbent has been a Director of Special Broadcasting Service Corporation (SBS), Qantas Airways Limited, Westfield Property Trusts, Woodside Petroleum Ltd and Coca‑Cola Amatil Ltd (1999 to 2010).
Ms Broadbent was appointed a Director of Woolworths Limited in January 2011. Age: 64.
christine cross bed and msc in food science, and a diploma in management
Member: People Policy Committee (since January 2012) and Nomination Committee.
Ms Cross has a Bachelor Education from Newcastle University, a Master of Science in Food Science from Reading University and a Diploma in Management from the Open University. She is a food scientist by background and previously lectured at Edinburgh and Bath Universities.
Ms Cross has extensive experience in international retail and consumer goods and now runs a retail advisory consultancy business. She started her executive career with Tesco Plc in 1989 holding many key positions throughout the
WoolWorths limited AnnuAl report 201234
company, including the Group Business Development Director for Tesco Plc from April 2002 to June 2003. Ms Cross was variously responsible for Own Brand development, establishment of the Global Sourcing Function and finally Business Development focused on international and small format expansion.
Ms Cross has been a Director of Next Group plc (formerly known as Next PLC) since 2005, of Sonae SGPS SA since 2009 and Plantasgen since 2009. She was formerly a Director of Fairmont Hotels & Resorts Inc, of Empire Company Limited (2003 to 2011), of Taylor Wimpey plc and of Premier Foods plc from January 2008 to January 2010.
Ms Cross is on the Advisory Board of Apax Partners Venture Capital & Private Equity (since January 2005) and of PricewaterhouseCoopers LLP (since January 2010). She is also Chief Retail and Consumer Advisor to PricewaterhouseCoopers LLP.
Ms Cross was appointed a Director of Woolworths Limited in January 2012. Age: 61.
sir roderick sheldon deane knZm, phd, bcom (hons), faca, fcim, fnZim hon lld (vuw)
Sir Roderick Deane has an honorary LLD from Victoria University of Wellington.
Member: People Policy Committee (Chairman until November 2011) and Nomination Committee.
Sir Roderick is the Chairman of the New Zealand Seed Fund (2000 to 2012), the IHC Foundation (2006 to 2012) and is an Advisor to Pacific Road Group Pty Limited (Chairman 2010 to August 2012). Sir Roderick is Patron of New Zealand’s largest charitable organisation, the IHC. He was appointed to the Board of the Anaesthesia and Pain Medicine Foundation in May 2011. He was previously Chairman and a Director of Fletcher Building Limited (2001 to 2010), Telecom Corporation of New Zealand Limited (1999 to 2006, having been CEO 1992 to 1999), Te Papa Tongarewa, The Museum of New Zealand (2000 to 2006)
and ANZ National Bank Limited (1999 to 2006), a Director of ANZ Banking Group Limited (1994 to 2006) and TransAlta Corporation (2000 to 2003), Chief Executive of the Electricity Corporation of NZ Limited (1987 to 2002), Chairman of the State Services Commission (1986 to 1987), Deputy Governor of the Reserve Bank of NZ (1982 to 1986), Chairman of the City Gallery Wellington Foundation (1998 to 2006) and Professor of Economics & Management at Victoria University of Wellington (2000 to 2003).
Sir Roderick was appointed a Knight Companion of the New Zealand Order of Merit in June 2012 for his services to business and the community.
Sir Roderick was appointed a Director of Woolworths Limited in April 2000. Age: 71.
carla (jayne) hrdlicka ba, mba
Member: People Policy Committee and Nomination Committee.
Ms Hrdlicka holds a Bachelor of Arts degree in Economics and Business Administration from the Colorado College, Colorado Springs, Colorado USA and an MBA from Dartmouth College, Hanover, New Hampshire USA.
Ms Hrdlicka is an experienced executive and advisor. She was a Senior Partner with management consulting firm Bain & Company where she led the Asia region Customer Strategy practice for eight years. She is a recognised leader globally on the topic of customer led growth and loyalty. She held numerous leadership positions within the firm including being a founding member of the Bain’s Global Women’s Leadership Council. Ms Hrdlicka has worked across many industries and geographies and has extensive experience in Consumer Products, Retail and Alcoholic Beverages.
Prior to her consulting career, she was an Executive in the publishing and marketing industry.
In August 2010, she joined Qantas Airways as Group Executive Strategy and Information Technology and in July 2012 Ms Hrdlicka was appointed as Chief Executive Officer of Jetstar Group. She is also a member of the Sydney Medical School Deans Advisory Board.
Ms Hrdlicka was appointed a Director of Woolworths Limited in August 2010. Age: 50.
ian john macfarlane, ac bec (hons), mec
Member: Audit, Risk Management and Compliance Committee and Nomination Committee.
Mr Macfarlane is a graduate of Monash University in Melbourne. He was Governor of the Reserve Bank of Australia (RBA) from 1996 until 2006. He held several senior positions with the RBA after joining in 1979. Prior to the RBA, he worked in the Economics Department of the OECD in Paris and at the Institute for Economics and Statistics at Oxford University.
Mr Macfarlane is also a Director of ANZ Banking Group Limited (since 2007), Leighton Holdings Limited (since 2007) and of the Lowy Institute for International Policy (since 2003). He is a member of the International Advisory Board of Goldman Sachs (since 2007) and the International Advisory Board of the China Banking Regulatory Commission (since 2010). Mr Macfarlane is also a member of the Asian Advisory Board of Champ Private Equity (since 2008).
Mr Macfarlane was appointed a Director of Woolworths Limited in January 2007. Age: 66.
allan douglas (david) mackay bba
Member: People Policy Committee (since January 2012) and Nomination Committee.
Mr Mackay has a Bachelor of Business Administration from Charles Sturt University.
35
board of directors
Mr Mackay has extensive Australian and international retail and consumer goods experience. He had a long career with Kellogg in America and internationally, retiring as Chief Executive Officer and President of Kellogg Company in January 2011 after holding a number of key positions within the company in the United Kingdom and the United States of America. Throughout his time at Kellogg, Mr Mackay was a member of Kellogg Company's board and the company's global leadership team.
Mr Mackay was also Managing Director of Sara Lee Bakery in Australia (1992 to 1998) and a former Director and Board Member of the Grocery Manufacturers of Australia, the Australian Food Council, the Industry Affairs Council of the Grocery Manufacturers of America, the executive committee of the Biscuit and Cracker Manufacturers' Association and a member of the Global Consumer Goods Forum.
Mr Mackay is a current Director of Fortune Brands Home & Security Inc. (since October 2011) and an Independent Director and Non‑Executive Chairman of Beam, Inc (since October 2011). He is a member of the Kalamazoo Institute of Arts (Trustee) (since 2009).
Mr Mackay was appointed a Director of Woolworths Limited in January 2012. Age: 56.
thomas (tom) william pockett finance director
Mr Pockett is a member of the Group of 100 and was the National President from August 2000 to January 2003. He is a Fellow of the Institute of Chartered Accountants in Australia (FCA) and was a member of the Financial Reporting Council from March 2003 to March 2006. In 2011, he was appointed Chairman of the Business Council of Taxation Reform.
Mr Pockett joined Woolworths Limited as Chief Financial Officer in August 2002. He previously held the position of Deputy Chief Financial Officer at the Commonwealth Bank of Australia (CBA). Prior to his role with the CBA, he was with
Lend Lease Corporation Ltd. Whilst at Lend Lease he held several senior finance roles in different companies across the Lend Lease Group, including Property and Financial Services, with his last position before moving being General Manager Finance for Lend Lease Corporation Ltd.
Prior to Lend Lease, he was with Chartered Accounting firm Deloitte.
Mr Pockett is also a director of Sunnyfield, a not for profit disability services provider in New South Wales.
Mr Pockett was appointed a Director of Woolworths Limited in November 2006. Age: 54.
michael james ullmer bsc (maths) (hons), fca, sf fin
Chairman: Audit, Risk Management and Compliance Committee (since March 2012 and Member since January 2012) and Member: Nomination Committee.
Mr Ullmer has a degree in mathematics from the University of Sussex. He is a Fellow of the Institute of Chartered Accountants and a Senior Fellow of the Financial Services Institute of Australasia.
Mr Ullmer has extensive experience in the accounting and banking sectors. He was the Deputy Group Chief Executive at National Australia Bank (NAB) from October 2007 until he stepped down from the Bank in August 2011. He joined NAB in 2004 as Finance Director and held a number of key positions including Chairman of the subsidiaries Great Western Bank (US) and JBWere.
Prior to NAB, Mr Ullmer was at Commonwealth Bank of Australia initially as Chief Financial Officer and then Group Executive for Institutional and Business Banking. Before that he was a Partner at Accounting Firms KPMG (1982 to 1992) and Coopers & Lybrand (1992 to 1997).
Mr Ullmer was previously a Director of National Australia Bank (2004 to 2011), Fosters Group Ltd (2008 to 2011), and
Bank of New Zealand (2007 to 2011). He is currently a Director of Lend Lease (since December 2011) and sits on the boards of the National Gallery of Victoria and the Melbourne Symphony Orchestra and chairs the Business Working with Education Foundation. On 1 September 2012 he became a member of the Nomura Australia Advisory Board.
Mr Ullmer was appointed a Director of Woolworths Limited in January 2012. Age: 61.
ralph graham waters cpeng, fie aust, m bus
Chairman: People Policy Committee (since December 2011 and Member since February 2011) and Member: Nomination Committee.
Mr Waters has a Master of Business from Curtin University of Technology, is a Chartered Professional Engineer and a Fellow of the Institution of Engineers Australia. He has had extensive experience in the Australasian building products industry, including as Managing Director of Email Limited and as Chief Executive of Fletcher Building Limited, as well as engineering and management experience in London and the Middle East.
Mr Waters is Chairman of Fletcher Building Limited (director since 2001) and Deputy Chairman of the Organising Committee for the ICC Cricket World Cup 2015. He is also a director of Fonterra Co‑operative Group Limited (since 2006) and he has recently been appointed as a director of Asciano Limited (since 23 August 2012). To accommodate this appointment Mr Waters resigned from Westpac New Zealand Limited effective 1 September 2012 (a director since 2006) and he will also stand down from Fonterra in the near term. In the past, Mr Waters has been Chairman and Director of Fisher and Paykel Appliances Holdings Limited (Director 2001 to February 2011).
Mr Waters was appointed a Director of Woolworths Limited in January 2011. Age: 63.
WoolWorths limited AnnuAl report 201236

management board2012
andrew hall director of corporate and public affairs
penny winn director multi channel and supply chain
cath flynn acting director of human resources (kim schmidt 27 june 2011 to 5 march 2012)
brad banducci director of liquor
julie coates director of big w
tom pockett finance director
peter horton group general counsel and company secretary
steve greentree chief operating officer australian supermarkets and petrol
grant o'brien managing director and ceo
tjeerd jegen managing director of australian supermarkets and petrol
“ we set out what we were going to do, and i’m proud to say that we’ve again delivered against that – that’s what woolies does.”
grant o’brien
37
This Report is given by the Directors in respect of the Woolworths Limited Group (the “Group” or “consolidated entity”) consisting of Woolworths Limited and the entities it controlled at the end of, or during the financial period ended 24 June 2012.
THE DIRECTORSThe persons who have been Directors of the Company at any time during or since the end of the financial period and up to the date of this report are:
NoN-exeCuTive DiReCToRsJ A strong ChairmanJ F AstburyJ R BroadbentC Cross (appointed 30 January 2012)R s DeaneC J HrdlickaL M L’Huillier (retired 24 November 2011)i J MacfarlaneA D D Mackay (appointed 30 January 2012)M J ullmer (appointed 30 January 2012)R G Waters
exeCuTive DiReCToRsM G Luscombe Managing Director and Chief executive officer
(retired 30 september 2011)G o’Brien Managing Director and Chief executive officer
(appointed 1 october 2011) Deputy Chief executive officer
and Chief executive officer Designate (until 30 september 2011)
T W Pockett Finance Director
Details of the experience, qualifications, special responsibilities and other directorships of listed companies in respect of each of the Directors are set out against their respective names from pages 34 to 36.
COMPANY SECRETARYMr Peter John Horton BA LLB.
Mr Horton joined Woolworths in November 2005 as Group General Counsel and Company secretary. Previously Mr Horton was General Manager Legal and Company secretary at WMC Resources Limited.
PRINCIPAL ACTIVITIESWoolworths Limited operates in Australia, New Zealand and india with 3,329 stores and more than 190,000 employees. The Company operates 1,033 supermarkets under the Woolworths and safeway brands in Australia and under the Countdown brand in New Zealand. in addition, 11 Thomas Dux supermarkets operate in Australia. The liquor retailing division services different customer needs through BWs, Dan Murphy’s, Woolworths/safeway attached liquor outlets, supermarket outlets in New Zealand and Cellarmasters. Woolworths also has multi-channel operations for all of its trading divisions.
The petrol retailing division has 599 canopies at year end across Australia of which 132 are co-branded Woolworths/Caltex. The general merchandise division services customers’ everyday needs through 172 BiG W stores. The Hotel division includes 294 premium hotels, including bars, dining, gaming, accommodation and venue hire operations. The Home improvement division includes 21 hardware stores and 15 Masters stores.
Following a strategic review, Woolworths announced on 31 January 2012 that the Dick smith business would be restructured and divested as a going concern in a staged and managed process. At year end there were 348 stores, including 286 in Australia and 62 in New Zealand.
CONSOLIDATED RESULTS AND REVIEW OF THE OPERATIONSThe net amount of consolidated profit for the financial period after income tax expense attributable to members of the Company and its controlled entities was $1,816.7 million (2011: $2,124.0 million).
A review of the operations of the consolidated entity and its principal businesses during the financial period and the results of those operations is set out in the Chairman’s Report and the Managing Director’s Report from pages 10 to 31 inclusive.
DIVIDENDSThe amounts set out below have been paid by the Company during the financial period or have been declared by the Directors of the Company, by way of dividend, but not paid during the financial period up to the date of this Report. All dividends were fully franked at the tax rate indicated.
Franking tax rate%
DiviDenDCents per share
total paiD/payable$m
Final 2011 DividendPaid on 14 october 2011 30 65 792.9interim 2012 DividendPaid on 27 April 2012 30 59 723.9Final 2012 DividendPayable on 12 october 2012 30 67 825.4
DireCtors’ statUtory report
WoolWorths limited AnnuAl report 201238
SIGNIFICANT CHANGES IN THE STATE OF AFFAIRSother than as referred to in the Managing Director’s Report, the significant changes in the state of affairs of the Group during the financial period are as follows:
A net increase in the issued share capital of the Company of 14,126,945 fully paid ordinary shares as a result of:
(i) the issue on 14 october 2011 of 4,201,331 fully paid ordinary shares and the issue on 27 April 2012 of 3,729,213 fully paid ordinary shares pursuant to the Dividend Reinvestment Plan. Neither the 2011 final dividend nor the 2012 interim dividend was underwritten and a cap of 20,000 maximum share participation in the Dividend Reinvestment Plan was in operation for both dividends; and
(ii) the issue on various dates, for cash at the relevant exercise price, of 6,196,401 fully paid ordinary shares as a result of the exercise of options held by a number of executives under the executive option Plan (eoP) and the Long Term incentive Plan (LTiP).
GRANT OF OPTIONSon 12 December 2011 offers were made under the Long Term incentive Plan (LTiP) with an effective date of 1 July 2011 granting 296,761 performance rights with stringent performance measures relating to ePs and TsR hurdles and 2,097,820 performance rights with stringent performance measures relating to NPAT hurdles.
A further 127,000 retention performance rights were offered with effective dates of 1 september 2011, 24 November 2011, 1 December 2011, 12 December 2011, 29 February 2012 and 1 March 2012.
Between 25 June 2012 and 18 september 2012, 1,874,904 shares were allotted as a result of the exercise of options granted under the LTiP in July 2007 and July 2008.
MATTERS SUBSEQUENT TO THE END OF THE FINANCIAL PERIOD on 28 June 2012, ALH Group Pty Ltd (ALH), a 75% owned subsidiary of Woolworths Limited received approval from the Australian Competition and Consumer Commission (ACCC) for the acquisition of 28 Hotels from the Laundy Hotel Group, Waugh Hotel Group and DeAngelis Group. Approval was later obtained from the ACCC for the acquisition of one further hotel and one bottleshop. As at the date of this report, 28 sites have been acquired in five separate tranches for total consideration of $159.8 million. The acquisition of an additional hotel is pending finalisation and two hotels remain subject to ACCC approval.
in 2006 the victorian Government announced new arrangements for gaming machine licenses that came into effect from 16 August 2012. The new arrangements allow venue operators to acquire and operate their own gaming machines in approved venues. ALH has a commitment of $164.3 million to acquire electronic gaming machine entitlements over the next four years and a commitment
to acquire electronic gaming machines to the value of $26.2 million in August 2012. ALH will recognise the entitlement as an intangible asset on acquisition in the 2013 financial year. This will be amortised on a straight line basis over the life of the entitlement. in addition, the obligation to the victorian Government will be recorded at amortised cost and equal the present value of the remaining future payments to be made following initial recognition of the licence in 2012.
FINAL DIVIDENDon 24 August 2012, the Directors declared a final dividend of 67 cents per share, fully franked at the 30% tax rate, on each of the issued ordinary shares of the Company. The final dividend is payable on 12 october 2012.
TRANSACTIONS WITH THE ALH GROUP AND RELATED COMPANIESDetails of certain transactions between the ALH Group and related companies are set out below:
The ALH Group purchased various building supplies and services totalling $766,804 (2011: $18,969,623) from Lifetime Developments Pty Ltd, a company with which Mr Bruce Mathieson is a related party through a family member/s who is/are a Director/Directors of Lifetime Developments Pty Ltd. Amounts were billed based on commercial market rates for such supplies and were due and payable under commercial payment terms.
The ALH Group purchased various building supplies and services totalling $ nil (2011: $3,071,787) from TAG Constructions Pty Ltd, a company with which Mr Bruce Mathieson is a related party through family member/s who is/are a Director/Directors of TAG Constructions Pty Ltd. Amounts were billed based on commercial market rates for such supplies and were due and payable under commercial payment terms.
The ALH Group purchased various marketing services totalling $415,860 (2011: $265,600) from Capricornia Pty Ltd, a company which Mr Bruce Mathieson is a related party. Amounts relate to a pro-rata of shared marketing costs associated with the promotion of two ALH accommodation properties jointly with one Capricornia accommodation property.
The ALH Group purchased trading stock totalling $880,281 (2011: $38,888) from Big Bottle Purchases Pty Ltd, a company which Mr Bruce Mathieson is a related party. Amounts were billed based on commercial market rates for such supplies and were due and payable under commercial payment terms.
These transactions were subject to review and testing on a sample basis by Woolworths’ Business Review (internal audit). significant construction activity is also subject to independent review by a quantity surveyor and competitive tender.
39

TRANSACTIONS WITH THE CELLARMASTERS GROUP AND RELATED COMPANIESDetails of certain transactions between the Cellarmasters Group and related companies are set out below:
A subsidiary in the Cellarmasters Group, New Zealand Wine Cellars Limited purchased grapes and finished products totalling NZ$312,504 from the Aurora vineyard Limited, a company with which Mr Brad Banducci is a related party. Amounts were billed based on commercial market rates for such supplies and were due and payable under commercial payment terms.
DIRECTORS’ INTERESTS IN SHARES/OPTIONS/PERFORMANCE RIGHTSParticulars of Directors’ relevant interests in shares, options and performance rights in the Company as at 18 september 2012 are set out below:
DireCtor shares options perFormanCe rights
J A strong 70,479 – –G o’Brien 40,739 110,665 110,478J F Astbury 12,797 – –J R Broadbent 65,138 – –C Cross 2,300 – –R s Deane 40,000 – –C J Hrdlicka 1,735 – –i J Macfarlane 13,200 – –A D D Mackay 3,790 – –T W Pockett 133,000 246,750 155,882M J ullmer 11,000 – –R G Waters 14,000 – –
DireCtors’ statUtory report
WoolWorths limited AnnuAl report 201240
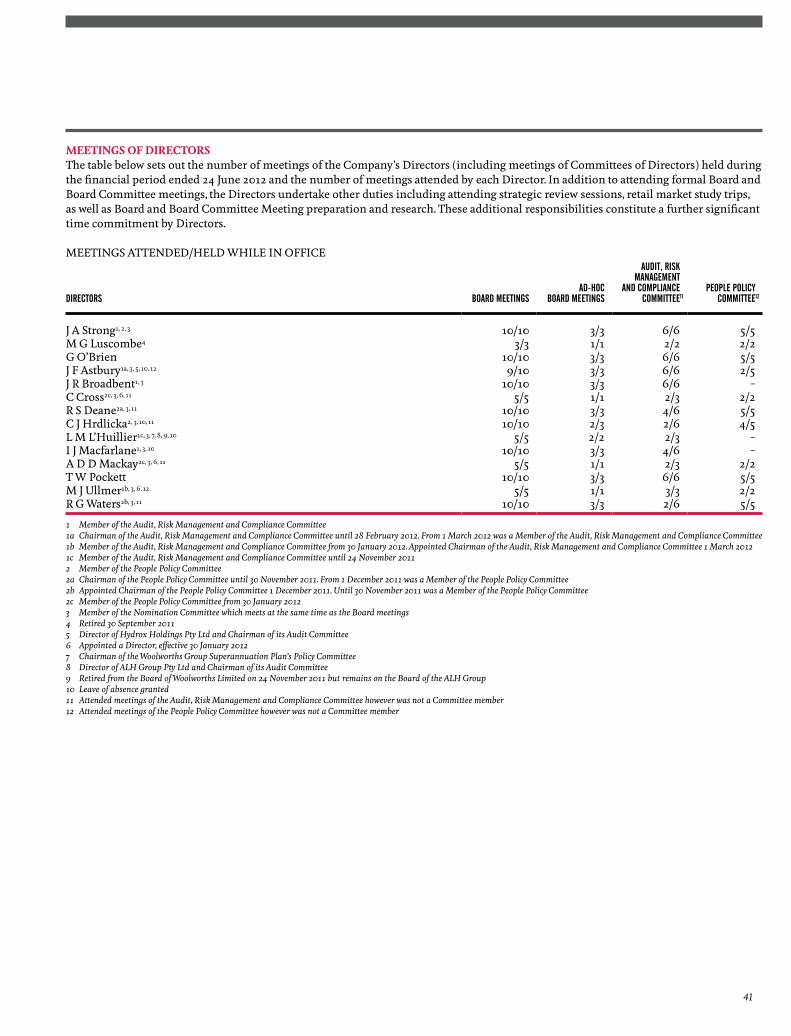
MEETINGS OF DIRECTORSThe table below sets out the number of meetings of the Company’s Directors (including meetings of Committees of Directors) held during the financial period ended 24 June 2012 and the number of meetings attended by each Director. in addition to attending formal Board and Board Committee meetings, the Directors undertake other duties including attending strategic review sessions, retail market study trips, as well as Board and Board Committee Meeting preparation and research. These additional responsibilities constitute a further significant time commitment by Directors.
MeeTiNGs ATTeNDeD/HeLD WHiLe iN oFFiCe
DireCtors boarD meetingsaD-hoC
boarD meetings
aUDit, riskmanagement
anD ComplianCeCommittee11
people poliCyCommittee12
J A strong1, 2, 3 10/10 3/3 6/6 5/5M G Luscombe4 3/3 1/1 2/2 2/2G o’Brien 10/10 3/3 6/6 5/5J F Astbury1a, 3, 5, 10, 12 9/10 3/3 6/6 2/5J R Broadbent1, 3 10/10 3/3 6/6 –C Cross2c, 3, 6, 11 5/5 1/1 2/3 2/2R s Deane2a, 3, 11 10/10 3/3 4/6 5/5C J Hrdlicka2, 3, 10, 11 10/10 2/3 2/6 4/5L M L’Huillier1c, 3, 7, 8, 9, 10 5/5 2/2 2/3 –i J Macfarlane1, 3, 10 10/10 3/3 4/6 –A D D Mackay2c, 3, 6, 11 5/5 1/1 2/3 2/2T W Pockett 10/10 3/3 6/6 5/5M J ullmer1b, 3, 6, 12 5/5 1/1 3/3 2/2R G Waters2b, 3, 11 10/10 3/3 2/6 5/5
1 Member of the Audit, Risk Management and Compliance Committee1a Chairman of the Audit, Risk Management and Compliance Committee until 28 February 2012. From 1 March 2012 was a Member of the Audit, Risk Management and Compliance Committee1b Member of the Audit, Risk Management and Compliance Committee from 30 January 2012. Appointed Chairman of the Audit, Risk Management and Compliance Committee 1 March 20121c Member of the Audit, Risk Management and Compliance Committee until 24 November 20112 Member of the People Policy Committee 2a Chairman of the People Policy Committee until 30 November 2011. From 1 December 2011 was a Member of the People Policy Committee 2b Appointed Chairman of the People Policy Committee 1 December 2011. Until 30 November 2011 was a Member of the People Policy Committee2c Member of the People Policy Committee from 30 January 20123 Member of the Nomination Committee which meets at the same time as the Board meetings4 Retired 30 September 20115 Director of Hydrox Holdings Pty Ltd and Chairman of its Audit Committee6 Appointed a Director, effective 30 January 20127 Chairman of the Woolworths Group Superannuation Plan’s Policy Committee8 Director of ALH Group Pty Ltd and Chairman of its Audit Committee9 Retired from the Board of Woolworths Limited on 24 November 2011 but remains on the Board of the ALH Group10 Leave of absence granted11 Attended meetings of the Audit, Risk Management and Compliance Committee however was not a Committee member 12 Attended meetings of the People Policy Committee however was not a Committee member
41
INTRODUCTION TO THE DIRECTORS’ REMUNERATION REPORT FROM THE CHAIRMAN OF THE PEOPLE POLICY COMMITTEEon behalf of the Board of Woolworths Limited and the People Policy Committee (PPC), i am pleased to present the 2012 remuneration report.
in response to shareholder feedback we have reformatted the report this year with the aim of providing greater clarity to shareholders on Woolworths’ executive remuneration. The report has been simplified and now has a table of contents for ease of reference as well as greater use of tables and graphs to replace lengthy descriptions.
in last year’s letter, we expressed concern regarding the accounting valuations of equity, a view shared by the Corporations and Markets Advisory Committee but, unfortunately, not by the government. Nonetheless, we have included a remuneration summary based on our view of shareholder feedback as well as separate details to comply with the regulatory framework.
in terms of remuneration outcomes for Woolworths’ key management personnel:1. on average, at least 60% of total remuneration is based on
performance related incentives. on a cash basis these have returned between 37% and 72% for FY12;
2. short term incentives as a percentage of net profit after tax (NPAT) have continued to trend down, despite increased returns to shareholders; and
3. on a cash basis, the long term incentives, which were options, have returned a much lower value due to share price volatility.
These outcomes evidence a strong link between performance incentives and shareholder returns.
Regular reviews of remuneration strategy are undertaken to ensure there is alignment to business outcomes and shareholder interests. in particular, we focus on achieving three outcomes of our remuneration strategy: attraction, retention and reward for our employees. Achieving the right balance underpins past performance and will continue to underpin future performance. Following a review this year, there have been minimal changes to reward design for FY13.
The long term incentive plans will undergo one minor naming change. Whilst the plan design has not changed, LTiP 3 will be referred to as Deferred sTi to reflect the actual plan design. To be effective in retaining key talent, this plan is linked to a one year performance measure followed by a requirement to remain employed for a further two years.
The Board believes the structure and governance of remuneration at Woolworths will continue to support business outcomes as well as shareholder and community expectations.
Ralph Waters Chairman – People Policy Committee
TABLE OF CONTENTS
seCtion Contents page
1 executive Remuneration summary 43
1.1 our senior executives (KMP) 43
1.2 executive remuneration framework 44
1.3 Remuneration structure 45
1.4 What we paid our executives 46
1.5 Total targeted remuneration 47
2 executive Remuneration in More Detail 47
2.1 Role of the People Policy Committee 47
2.2 use of remuneration advisors 48
2.3 executive remuneration structure explained 48
2.3.1 Total fixed remuneration 48
2.3.2 short term incentives 48
2.3.3 equity based incentives 52
2.4 Managing Director and Chief executive officer 57
2.5 Terms of executive service agreements 59
3 Non–executive Directors’ arrangements 60
3.1 Remuneration policy and structure 60
3.2 Retirement benefits 61
3.3 Appointment letters, Deeds of Access, insurance and indemnity, Disclosure Deeds
61
4 executive Remuneration statutory Disclosures 62
4.1 KMP remuneration tables 62
4.2 Conditional entitlements to, and shareholdings of KMP 64
4.3 KMP share movements 66
4.4 equity grants and outstanding equity for KMP 67
4.5 outstanding options/rights 69
4.6 Remuneration advisors’ fees 69
DireCtors’ statUtory reportremUneration report
WoolWorths limited AnnuAl report 201242
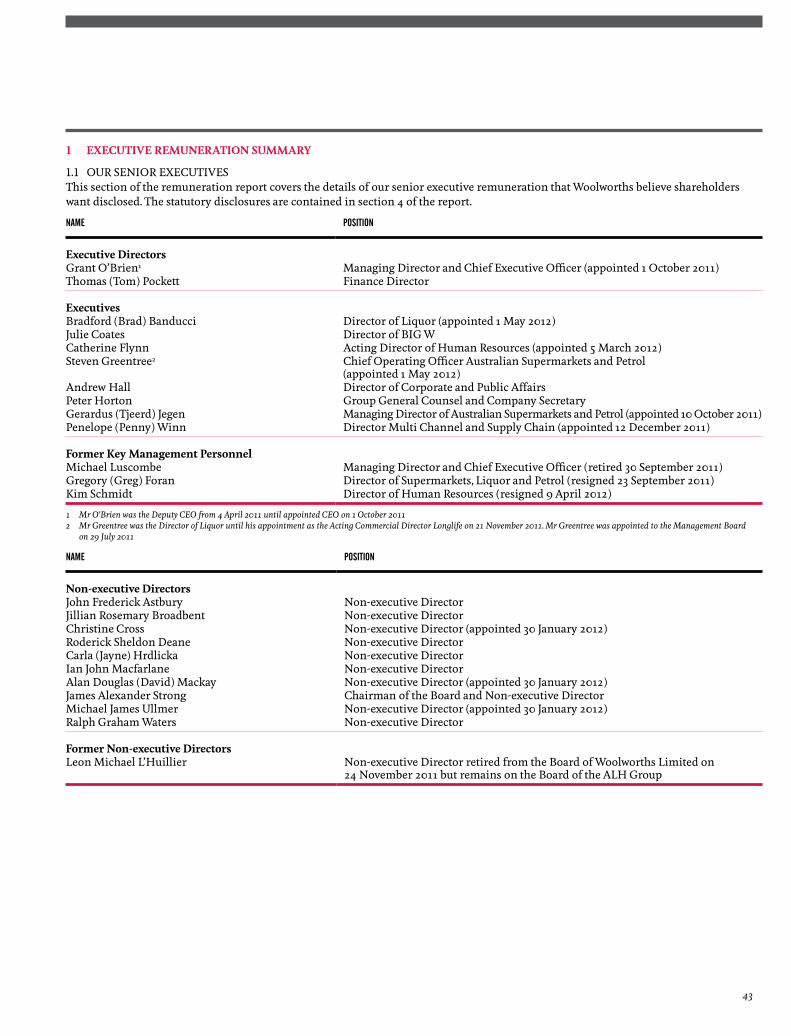
1 EXECUTIVE REMUNERATION SUMMARY
1.1 ouR seNioR exeCuTivesThis section of the remuneration report covers the details of our senior executive remuneration that Woolworths believe shareholders want disclosed. The statutory disclosures are contained in section 4 of the report.
name position
Executive DirectorsGrant o’Brien1 Managing Director and Chief executive officer (appointed 1 october 2011)Thomas (Tom) Pockett Finance Director
ExecutivesBradford (Brad) Banducci Director of Liquor (appointed 1 May 2012)Julie Coates Director of BiG WCatherine Flynn Acting Director of Human Resources (appointed 5 March 2012)steven Greentree2 Chief operating officer Australian supermarkets and Petrol
(appointed 1 May 2012) Andrew Hall Director of Corporate and Public AffairsPeter Horton Group General Counsel and Company secretaryGerardus (Tjeerd) Jegen Managing Director of Australian supermarkets and Petrol (appointed 10 october 2011)Penelope (Penny) Winn Director Multi Channel and supply Chain (appointed 12 December 2011)
Former Key Management PersonnelMichael Luscombe Managing Director and Chief executive officer (retired 30 september 2011)Gregory (Greg) Foran Director of supermarkets, Liquor and Petrol (resigned 23 september 2011)Kim schmidt Director of Human Resources (resigned 9 April 2012)
1 Mr O’Brien was the Deputy CEO from 4 April 2011 until appointed CEO on 1 October 20112 Mr Greentree was the Director of Liquor until his appointment as the Acting Commercial Director Longlife on 21 November 2011. Mr Greentree was appointed to the Management Board
on 29 July 2011
name position
Non-executive DirectorsJohn Frederick Astbury Non-executive DirectorJillian Rosemary Broadbent Non-executive DirectorChristine Cross Non-executive Director (appointed 30 January 2012) Roderick sheldon Deane Non-executive DirectorCarla (Jayne) Hrdlicka Non-executive Directorian John Macfarlane Non-executive DirectorAlan Douglas (David) Mackay Non-executive Director (appointed 30 January 2012) James Alexander strong Chairman of the Board and Non-executive DirectorMichael James ullmer Non-executive Director (appointed 30 January 2012) Ralph Graham Waters Non-executive Director
Former Non-executive DirectorsLeon Michael L’Huillier Non-executive Director retired from the Board of Woolworths Limited on
24 November 2011 but remains on the Board of the ALH Group
43

1.2 exeCuTive ReMuNeRATioN FRAMeWoRKThe executive remuneration framework is designed and continually reviewed to ensure that reward is:1. Aligned to the broader business strategy;2. Consistent with the remuneration strategy and principles; and3. Driving the behaviours required to promote sustainable long term value for shareholders.
MARKET COMPETITIVETo ensure talent is attracted and retained with remuneration that reflects the seniority and complexity of roles
DEMANDING MEASURESReflect both business strategy and the trading environment
PERFORMANCE BASEDOutcomes are linked to the achievement of financial, strategic, non financial and individual measures
ALIGNED TO SHAREHOLDERSShort term and long term incentives are linked respectively to profit, earnings per share and relative total shareholder return
External market data and benchmarking is undertaken to ensure remuneration levels are competitively set
Threshold, target and stretch measures are set in order to drive improvement
A group gateway must be met to qualify for any short term incentive
Short term incentives are based on performance against either budget or targets
Below target individual performers are not eligible to earn any incentive
Long term incentives are based on performance measures that have been chosen to drive long term shareholder value creation and are therefore measured over five years
Executives do not receive dividends on unvested equity
Unvested equity is generally forfeited on resignation
Employment contracts have limits on termination payments and restrictive covenants delaying future employment by major competitors
retain, attraCt anD motivate key talent
align rewarDs to shareholDer valUe Creation
link rewarDs to the Company’s strategiC, FinanCial anD hUman resoUrCes strategies
remUneration strategy
remUneration prinCiples
q
appliCation oF remUneration prinCiples
q qqq
DIRECTORS’ STATUTORY REPORTREMUNERATION REPORT
WoolWorths limited AnnuAl report 201244
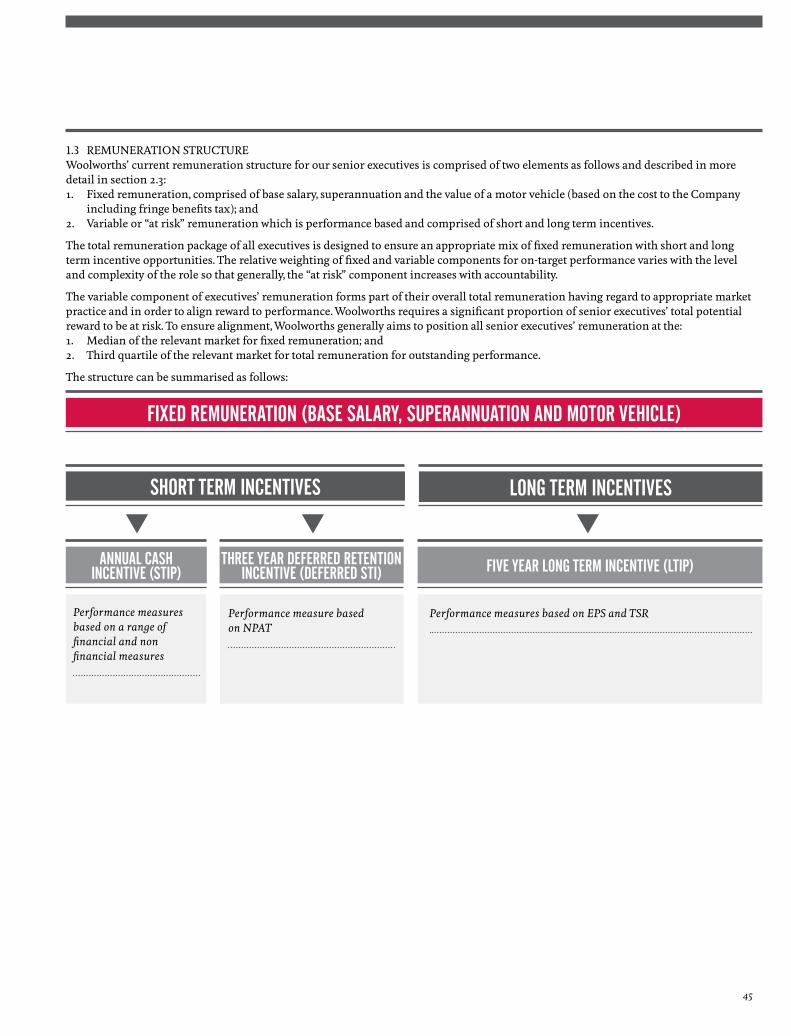
1.3 ReMuNeRATioN sTRuCTuReWoolworths’ current remuneration structure for our senior executives is comprised of two elements as follows and described in more detail in section 2.3:1. Fixed remuneration, comprised of base salary, superannuation and the value of a motor vehicle (based on the cost to the Company
including fringe benefits tax); and2. variable or “at risk” remuneration which is performance based and comprised of short and long term incentives.
The total remuneration package of all executives is designed to ensure an appropriate mix of fixed remuneration with short and long term incentive opportunities. The relative weighting of fixed and variable components for on-target performance varies with the level and complexity of the role so that generally, the “at risk” component increases with accountability.
The variable component of executives’ remuneration forms part of their overall total remuneration having regard to appropriate market practice and in order to align reward to performance. Woolworths requires a significant proportion of senior executives’ total potential reward to be at risk. To ensure alignment, Woolworths generally aims to position all senior executives’ remuneration at the:1. Median of the relevant market for fixed remuneration; and2. Third quartile of the relevant market for total remuneration for outstanding performance.
The structure can be summarised as follows:
annUal Cash inCentive (stip)
three year DeFerreD retention inCentive (DeFerreD sti) Five year long term inCentive (ltip)
FixeD remUneration (base salary, sUperannUation anD motor vehiCle)
short term inCentives long term inCentives
q qq
Performance measures based on a range of financial and non financial measures
Performance measure based on NPAT
Performance measures based on EPS and TSR
45
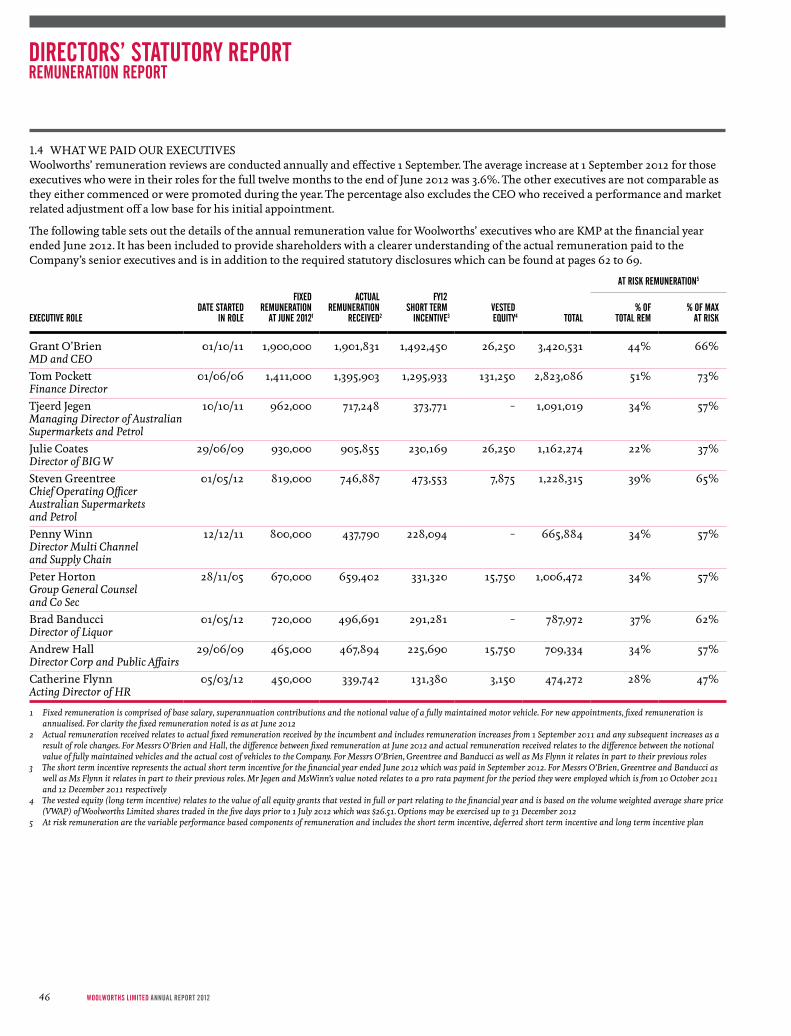
1.4 WHAT We PAiD ouR exeCuTivesWoolworths’ remuneration reviews are conducted annually and effective 1 september. The average increase at 1 september 2012 for those executives who were in their roles for the full twelve months to the end of June 2012 was 3.6%. The other executives are not comparable as they either commenced or were promoted during the year. The percentage also excludes the Ceo who received a performance and market related adjustment off a low base for his initial appointment.
The following table sets out the details of the annual remuneration value for Woolworths’ executives who are KMP at the financial year ended June 2012. it has been included to provide shareholders with a clearer understanding of the actual remuneration paid to the Company’s senior executives and is in addition to the required statutory disclosures which can be found at pages 62 to 69.
at risk remUneration5
exeCUtive roleDate starteD
in role
FixeDremUneration
at JUne 20121
aCtUalremUneration
reCeiveD2
Fy12short term
inCentive3vesteDeqUity4 total
% oFtotal rem
% oF maxat risk
Grant o’Brien MD and CEO
01/10/11 1,900,000 1,901,831 1,492,450 26,250 3,420,531 44% 66%
Tom Pockett Finance Director
01/06/06 1,411,000 1,395,903 1,295,933 131,250 2,823,086 51% 73%
Tjeerd Jegen Managing Director of Australian Supermarkets and Petrol
10/10/11 962,000 717,248 373,771 – 1,091,019 34% 57%
Julie Coates Director of BIG W
29/06/09 930,000 905,855 230,169 26,250 1,162,274 22% 37%
steven Greentree Chief Operating Officer Australian Supermarkets and Petrol
01/05/12 819,000 746,887 473,553 7,875 1,228,315 39% 65%
Penny Winn Director Multi Channel and Supply Chain
12/12/11 800,000 437,790 228,094 – 665,884 34% 57%
Peter Horton Group General Counsel and Co Sec
28/11/05 670,000 659,402 331,320 15,750 1,006,472 34% 57%
Brad Banducci Director of Liquor
01/05/12 720,000 496,691 291,281 – 787,972 37% 62%
Andrew Hall Director Corp and Public Affairs
29/06/09 465,000 467,894 225,690 15,750 709,334 34% 57%
Catherine Flynn Acting Director of HR
05/03/12 450,000 339,742 131,380 3,150 474,272 28% 47%
1 Fixed remuneration is comprised of base salary, superannuation contributions and the notional value of a fully maintained motor vehicle. For new appointments, fixed remuneration is annualised. For clarity the fixed remuneration noted is as at June 2012
2 Actual remuneration received relates to actual fixed remuneration received by the incumbent and includes remuneration increases from 1 September 2011 and any subsequent increases as a result of role changes. For Messrs O’Brien and Hall, the difference between fixed remuneration at June 2012 and actual remuneration received relates to the difference between the notional value of fully maintained vehicles and the actual cost of vehicles to the Company. For Messrs O’Brien, Greentree and Banducci as well as Ms Flynn it relates in part to their previous roles
3 The short term incentive represents the actual short term incentive for the financial year ended June 2012 which was paid in September 2012. For Messrs O’Brien, Greentree and Banducci as well as Ms Flynn it relates in part to their previous roles. Mr Jegen and MsWinn’s value noted relates to a pro rata payment for the period they were employed which is from 10 October 2011 and 12 December 2011 respectively
4 The vested equity (long term incentive) relates to the value of all equity grants that vested in full or part relating to the financial year and is based on the volume weighted average share price (VWAP) of Woolworths Limited shares traded in the five days prior to 1 July 2012 which was $26.51. Options may be exercised up to 31 December 2012
5 At risk remuneration are the variable performance based components of remuneration and includes the short term incentive, deferred short term incentive and long term incentive plan
DIRECTORS’ STATUTORY REPORTREMUNERATION REPORT
WoolWorths limited AnnuAl report 201246
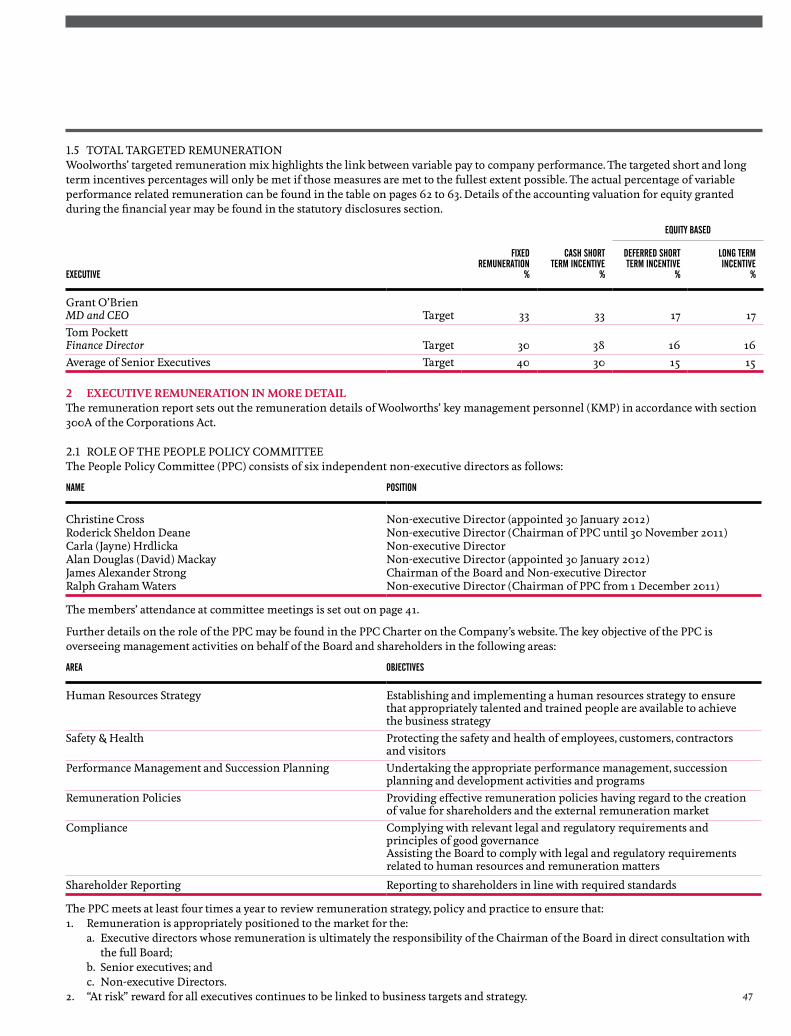
1.5 ToTAL TARGeTeD ReMuNeRATioNWoolworths’ targeted remuneration mix highlights the link between variable pay to company performance. The targeted short and long term incentives percentages will only be met if those measures are met to the fullest extent possible. The actual percentage of variable performance related remuneration can be found in the table on pages 62 to 63. Details of the accounting valuation for equity granted during the financial year may be found in the statutory disclosures section.
eqUity baseD
exeCUtive
FixeDremUneration
%
Cash shortterm inCentive
%
DeFerreD shortterm inCentive
%
long terminCentive
%
Grant o’Brien MD and CEO Target 33 33 17 17Tom Pockett Finance Director Target 30 38 16 16Average of senior executives Target 40 30 15 15
2 EXECUTIVE REMUNERATION IN MORE DETAILThe remuneration report sets out the remuneration details of Woolworths’ key management personnel (KMP) in accordance with section 300A of the Corporations Act.
2.1 RoLe oF THe PeoPLe PoLiCY CoMMiTTee The People Policy Committee (PPC) consists of six independent non-executive directors as follows:
name position
Christine Cross Non-executive Director (appointed 30 January 2012) Roderick sheldon Deane Non-executive Director (Chairman of PPC until 30 November 2011)Carla (Jayne) Hrdlicka Non-executive DirectorAlan Douglas (David) Mackay Non-executive Director (appointed 30 January 2012) James Alexander strong Chairman of the Board and Non-executive DirectorRalph Graham Waters Non-executive Director (Chairman of PPC from 1 December 2011)
The members’ attendance at committee meetings is set out on page 41.
Further details on the role of the PPC may be found in the PPC Charter on the Company’s website. The key objective of the PPC is overseeing management activities on behalf of the Board and shareholders in the following areas:
area obJeCtives
Human Resources strategy establishing and implementing a human resources strategy to ensure that appropriately talented and trained people are available to achieve the business strategy
safety & Health Protecting the safety and health of employees, customers, contractors and visitors
Performance Management and succession Planning undertaking the appropriate performance management, succession planning and development activities and programs
Remuneration Policies Providing effective remuneration policies having regard to the creation of value for shareholders and the external remuneration market
Compliance Complying with relevant legal and regulatory requirements and principles of good governance Assisting the Board to comply with legal and regulatory requirements related to human resources and remuneration matters
shareholder Reporting Reporting to shareholders in line with required standards
The PPC meets at least four times a year to review remuneration strategy, policy and practice to ensure that:1. Remuneration is appropriately positioned to the market for the: a. executive directors whose remuneration is ultimately the responsibility of the Chairman of the Board in direct consultation with
the full Board; b. senior executives; and c. Non-executive Directors.2. “At risk” reward for all executives continues to be linked to business targets and strategy. 47
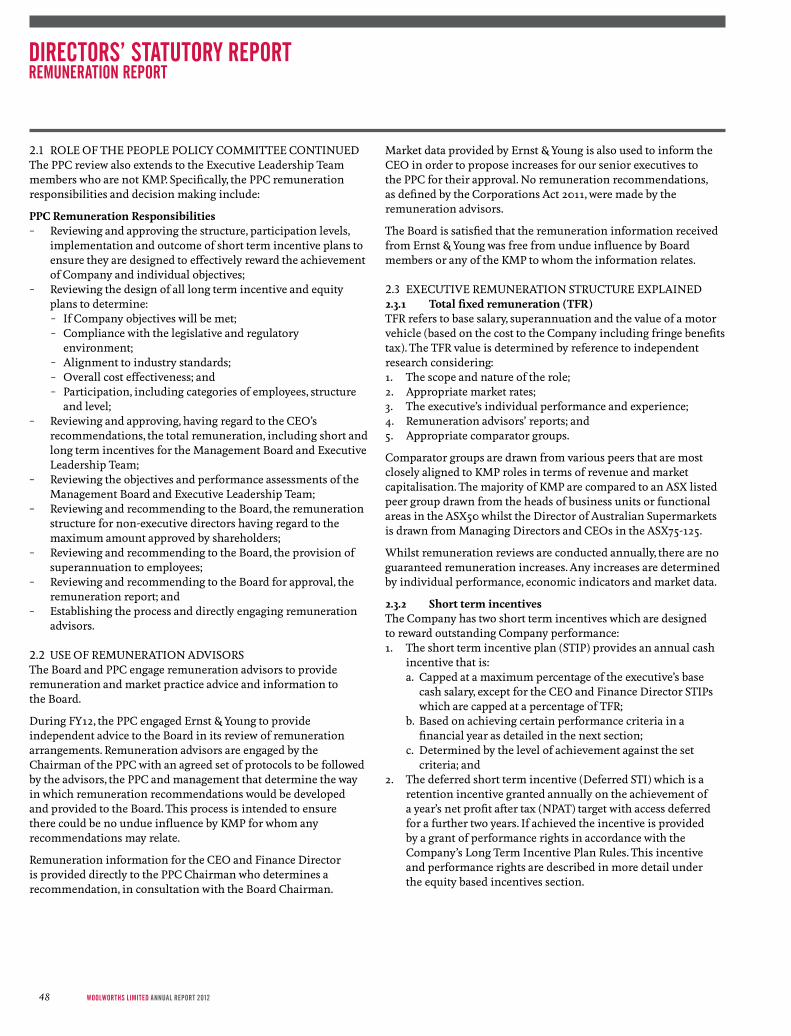
2.1 RoLe oF THe PeoPLe PoLiCY CoMMiTTee CoNTiNueDThe PPC review also extends to the executive Leadership Team members who are not KMP. specifically, the PPC remuneration responsibilities and decision making include:
PPC Remuneration Responsibilities – Reviewing and approving the structure, participation levels,
implementation and outcome of short term incentive plans to ensure they are designed to effectively reward the achievement of Company and individual objectives;
– Reviewing the design of all long term incentive and equity plans to determine:
– if Company objectives will be met; – Compliance with the legislative and regulatory
environment; – Alignment to industry standards; – overall cost effectiveness; and – Participation, including categories of employees, structure
and level; – Reviewing and approving, having regard to the Ceo’s
recommendations, the total remuneration, including short and long term incentives for the Management Board and executive Leadership Team;
– Reviewing the objectives and performance assessments of the Management Board and executive Leadership Team;
– Reviewing and recommending to the Board, the remuneration structure for non-executive directors having regard to the maximum amount approved by shareholders;
– Reviewing and recommending to the Board, the provision of superannuation to employees;
– Reviewing and recommending to the Board for approval, the remuneration report; and
– establishing the process and directly engaging remuneration advisors.
2.2 use oF ReMuNeRATioN ADvisoRsThe Board and PPC engage remuneration advisors to provide remuneration and market practice advice and information to the Board.
During FY12, the PPC engaged ernst & Young to provide independent advice to the Board in its review of remuneration arrangements. Remuneration advisors are engaged by the Chairman of the PPC with an agreed set of protocols to be followed by the advisors, the PPC and management that determine the way in which remuneration recommendations would be developed and provided to the Board. This process is intended to ensure there could be no undue influence by KMP for whom any recommendations may relate.
Remuneration information for the Ceo and Finance Director is provided directly to the PPC Chairman who determines a recommendation, in consultation with the Board Chairman.
Market data provided by ernst & Young is also used to inform the Ceo in order to propose increases for our senior executives to the PPC for their approval. No remuneration recommendations, as defined by the Corporations Act 2011, were made by the remuneration advisors.
The Board is satisfied that the remuneration information received from ernst & Young was free from undue influence by Board members or any of the KMP to whom the information relates.
2.3 exeCuTive ReMuNeRATioN sTRuCTuRe exPLAiNeD2.3.1 Total fixed remuneration (TFR) TFR refers to base salary, superannuation and the value of a motor vehicle (based on the cost to the Company including fringe benefits tax). The TFR value is determined by reference to independent research considering:1. The scope and nature of the role;2. Appropriate market rates; 3. The executive’s individual performance and experience;4. Remuneration advisors’ reports; and5. Appropriate comparator groups.
Comparator groups are drawn from various peers that are most closely aligned to KMP roles in terms of revenue and market capitalisation. The majority of KMP are compared to an Asx listed peer group drawn from the heads of business units or functional areas in the Asx50 whilst the Director of Australian supermarkets is drawn from Managing Directors and Ceos in the Asx75-125.
Whilst remuneration reviews are conducted annually, there are no guaranteed remuneration increases. Any increases are determined by individual performance, economic indicators and market data.
2.3.2 Short term incentivesThe Company has two short term incentives which are designed to reward outstanding Company performance:1. The short term incentive plan (sTiP) provides an annual cash
incentive that is: a. Capped at a maximum percentage of the executive’s base
cash salary, except for the Ceo and Finance Director sTiPs which are capped at a percentage of TFR;
b. Based on achieving certain performance criteria in a financial year as detailed in the next section;
c. Determined by the level of achievement against the set criteria; and
2. The deferred short term incentive (Deferred sTi) which is a retention incentive granted annually on the achievement of a year’s net profit after tax (NPAT) target with access deferred for a further two years. if achieved the incentive is provided by a grant of performance rights in accordance with the Company’s Long Term incentive Plan Rules. This incentive and performance rights are described in more detail under the equity based incentives section.
DIRECTORS’ STATUTORY REPORTREMUNERATION REPORT
WoolWorths limited AnnuAl report 201248
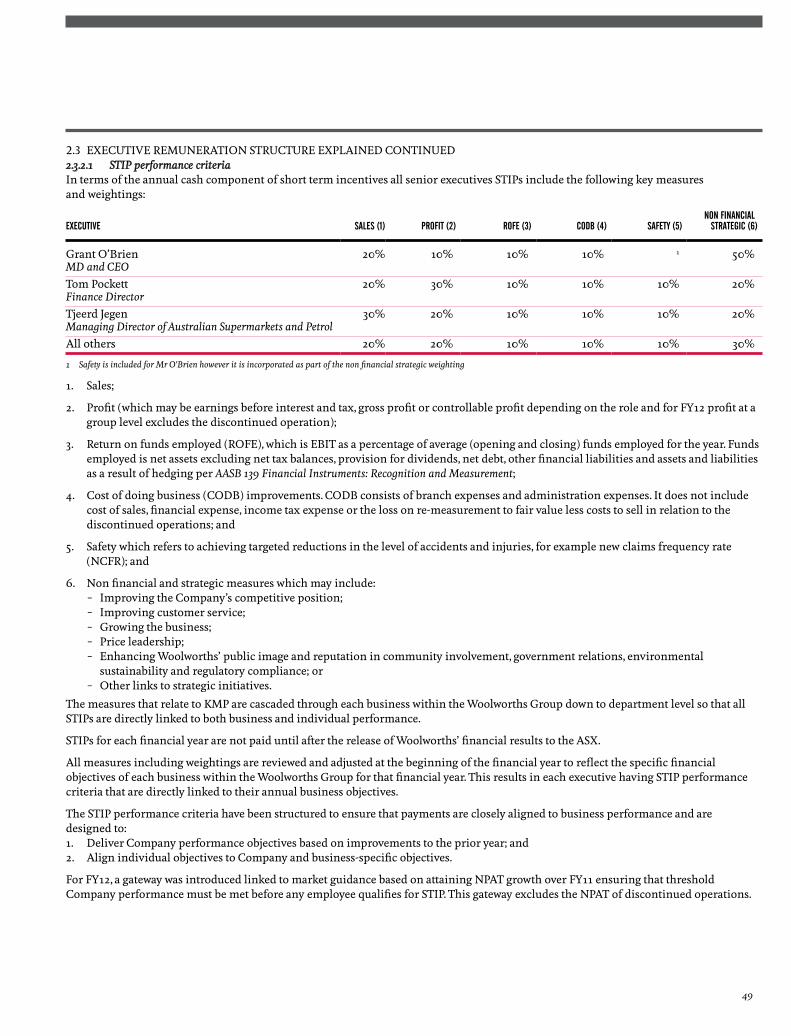
2.3 exeCuTive ReMuNeRATioN sTRuCTuRe exPLAiNeD CoNTiNueD2.3.2.1 STIP performance criteriain terms of the annual cash component of short term incentives all senior executives sTiPs include the following key measures and weightings:
exeCUtive sales (1) proFit (2) roFe (3) CoDb (4) saFety (5)non FinanCial
strategiC (6)
Grant o’Brien MD and CEO
20% 10% 10% 10% 1 50%
Tom Pockett Finance Director
20% 30% 10% 10% 10% 20%
Tjeerd Jegen Managing Director of Australian Supermarkets and Petrol
30% 20% 10% 10% 10% 20%
All others 20% 20% 10% 10% 10% 30%
1 Safety is included for Mr O’Brien however it is incorporated as part of the non financial strategic weighting
1. sales;
2. Profit (which may be earnings before interest and tax, gross profit or controllable profit depending on the role and for FY12 profit at a group level excludes the discontinued operation);
3. Return on funds employed (RoFe), which is eBiT as a percentage of average (opening and closing) funds employed for the year. Funds employed is net assets excluding net tax balances, provision for dividends, net debt, other financial liabilities and assets and liabilities as a result of hedging per AASB 139 Financial Instruments: Recognition and Measurement;
4. Cost of doing business (CoDB) improvements. CoDB consists of branch expenses and administration expenses. it does not include cost of sales, financial expense, income tax expense or the loss on re-measurement to fair value less costs to sell in relation to the discontinued operations; and
5. safety which refers to achieving targeted reductions in the level of accidents and injuries, for example new claims frequency rate (NCFR); and
6. Non financial and strategic measures which may include: – improving the Company’s competitive position; – improving customer service; – Growing the business; – Price leadership; – enhancing Woolworths’ public image and reputation in community involvement, government relations, environmental
sustainability and regulatory compliance; or – other links to strategic initiatives.
The measures that relate to KMP are cascaded through each business within the Woolworths Group down to department level so that all sTiPs are directly linked to both business and individual performance.
sTiPs for each financial year are not paid until after the release of Woolworths’ financial results to the Asx.
All measures including weightings are reviewed and adjusted at the beginning of the financial year to reflect the specific financial objectives of each business within the Woolworths Group for that financial year. This results in each executive having sTiP performance criteria that are directly linked to their annual business objectives.
The sTiP performance criteria have been structured to ensure that payments are closely aligned to business performance and are designed to:1. Deliver Company performance objectives based on improvements to the prior year; and2. Align individual objectives to Company and business-specific objectives.
For FY12, a gateway was introduced linked to market guidance based on attaining NPAT growth over FY11 ensuring that threshold Company performance must be met before any employee qualifies for sTiP. This gateway excludes the NPAT of discontinued operations.
49
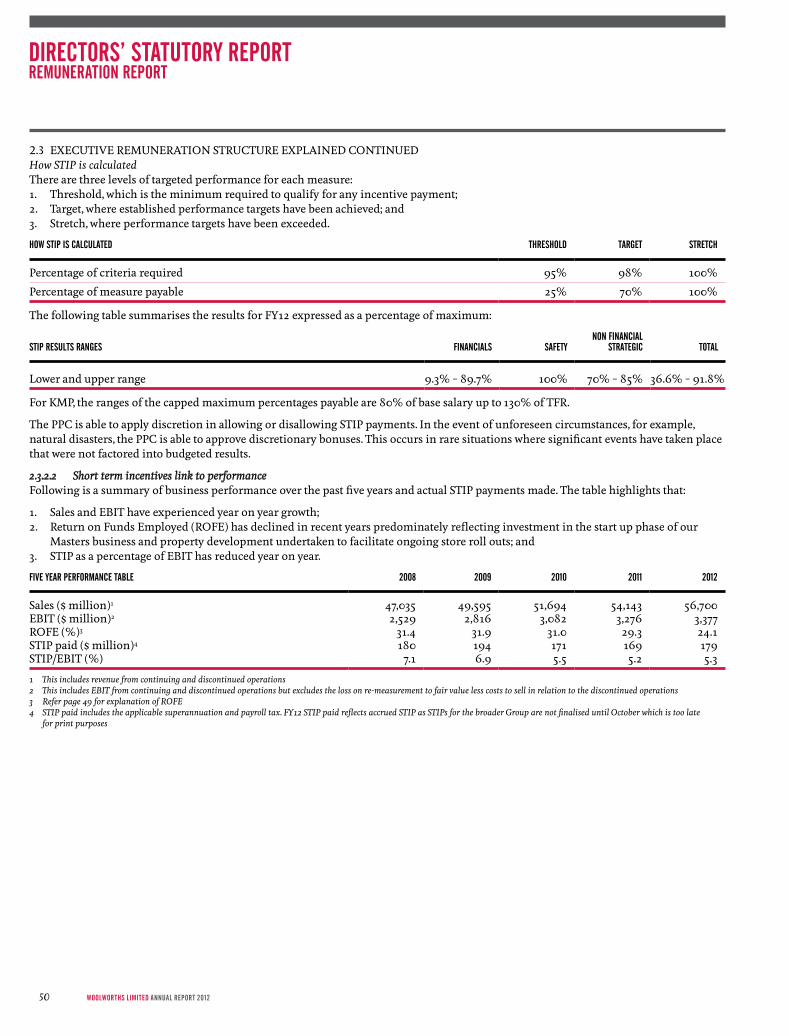
2.3 exeCuTive ReMuNeRATioN sTRuCTuRe exPLAiNeD CoNTiNueDHow STIP is calculatedThere are three levels of targeted performance for each measure:1. Threshold, which is the minimum required to qualify for any incentive payment; 2. Target, where established performance targets have been achieved; and3. stretch, where performance targets have been exceeded.
how stip is CalCUlateD thresholD target stretCh
Percentage of criteria required 95% 98% 100%
Percentage of measure payable 25% 70% 100%
The following table summarises the results for FY12 expressed as a percentage of maximum:
stip resUlts ranges FinanCials saFetynon FinanCial
strategiC total
Lower and upper range 9.3% – 89.7% 100% 70% – 85% 36.6% – 91.8%
For KMP, the ranges of the capped maximum percentages payable are 80% of base salary up to 130% of TFR.
The PPC is able to apply discretion in allowing or disallowing sTiP payments. in the event of unforeseen circumstances, for example, natural disasters, the PPC is able to approve discretionary bonuses. This occurs in rare situations where significant events have taken place that were not factored into budgeted results.
2.3.2.2 Short term incentives link to performanceFollowing is a summary of business performance over the past five years and actual sTiP payments made. The table highlights that:
1. sales and eBiT have experienced year on year growth; 2. Return on Funds employed (RoFe) has declined in recent years predominately reflecting investment in the start up phase of our
Masters business and property development undertaken to facilitate ongoing store roll outs; and3. sTiP as a percentage of eBiT has reduced year on year.
Five year perFormanCe table 2008 2009 2010 2011 2012
sales ($ million)1 47,035 49,595 51,694 54,143 56,700eBiT ($ million)2 2,529 2,816 3,082 3,276 3,377RoFe (%)3 31.4 31.9 31.0 29.3 24.1sTiP paid ($ million)4 180 194 171 169 179sTiP/eBiT (%) 7.1 6.9 5.5 5.2 5.3
1 This includes revenue from continuing and discontinued operations2 This includes EBIT from continuing and discontinued operations but excludes the loss on re-measurement to fair value less costs to sell in relation to the discontinued operations3 Refer page 49 for explanation of ROFE4 STIP paid includes the applicable superannuation and payroll tax. FY12 STIP paid reflects accrued STIP as STIPs for the broader Group are not finalised until October which is too late
for print purposes
DIRECTORS’ STATUTORY REPORTREMUNERATION REPORT
WoolWorths limited AnnuAl report 201250

2.3 exeCuTive ReMuNeRATioN sTRuCTuRe exPLAiNeD CoNTiNueDThe following series of charts depicts the link between Company NPAT performance and:1. short term incentive outcomes across the Group; and2. short term incentive outcomes for KMP.
The decline in short term incentive payments is directly linked to slowing NPAT growth, coming off double digit growth in both 2008 and 2009 to single digit growth in the current economic and trading environment post the global financial crisis.
The latter chart highlights that short term incentives for KMP are a minor percentage (0.25% for FY12) of the overall Group’s total sTiP payments.
total Company stip payments as a perCentage oF npat total DisCloseD exeCUtives’ stip as a perCentage oF npat (total Company Fy12 stip is not FinaliseD – nUmber reFleCts aCCrUal) (Fy12 npat exClUDes the Ceg provision)
0
500
1,000
1,500
2,000
2,500
0
500
1,000
1,500
2,000
2,500
FY08
FY09
FY10
FY11
FY12
FY08
FY09
FY10
FY11
0
5
10
15
20
0.20
0.25
0.30
0.35
0.40
0.45
0.50
0.55
0.60
FY12
NPAT $ million
NPAT
$M
Total STIP payments as a % of NPAT
Tota
l STI
P pa
ymen
ts a
s a
% o
f NPA
T
NPAT
$M
Tota
l STI
P as
a %
of N
PAT
NPAT $ millionDisclosed Executives STIP as a % of NPAT
11.1
%
10.6
%
8.5
%
8.0
%
8.1
%
0.4
1%
0.3
7%
0.2
8%
0.2
7%
0.2
5%
% %
51
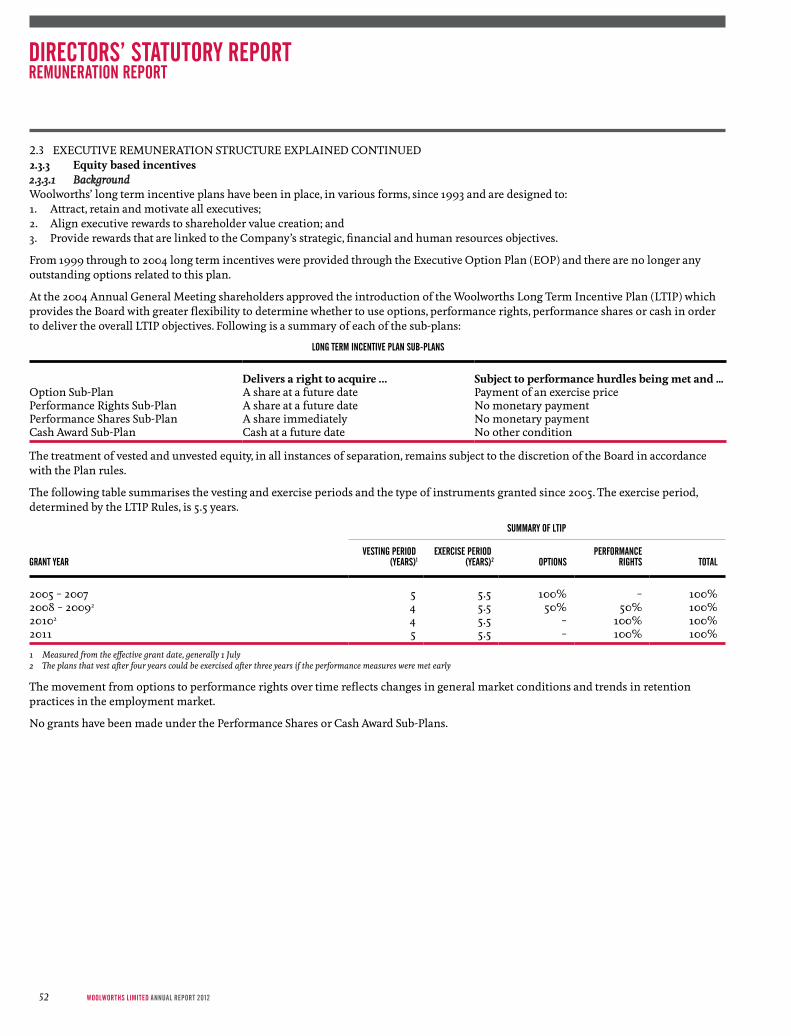
2.3 exeCuTive ReMuNeRATioN sTRuCTuRe exPLAiNeD CoNTiNueD2.3.3 Equity based incentives2.3.3.1 BackgroundWoolworths’ long term incentive plans have been in place, in various forms, since 1993 and are designed to:1. Attract, retain and motivate all executives;2. Align executive rewards to shareholder value creation; and3. Provide rewards that are linked to the Company’s strategic, financial and human resources objectives.
From 1999 through to 2004 long term incentives were provided through the executive option Plan (eoP) and there are no longer any outstanding options related to this plan.
At the 2004 Annual General Meeting shareholders approved the introduction of the Woolworths Long Term incentive Plan (LTiP) which provides the Board with greater flexibility to determine whether to use options, performance rights, performance shares or cash in order to deliver the overall LTiP objectives. Following is a summary of each of the sub-plans:
long term inCentive plan sUb-plans
Delivers a right to acquire … Subject to performance hurdles being met and ...option sub-Plan A share at a future date Payment of an exercise pricePerformance Rights sub-Plan A share at a future date No monetary paymentPerformance shares sub-Plan A share immediately No monetary paymentCash Award sub-Plan Cash at a future date No other condition
The treatment of vested and unvested equity, in all instances of separation, remains subject to the discretion of the Board in accordance with the Plan rules.
The following table summarises the vesting and exercise periods and the type of instruments granted since 2005. The exercise period, determined by the LTiP Rules, is 5.5 years.
sUmmary oF ltip
grant yearvesting perioD
(years)1 exerCise perioD
(years)2 options perFormanCe
rights total
2005 – 2007 5 5.5 100% – 100%2008 – 20092 4 5.5 50% 50% 100%20102 4 5.5 – 100% 100%2011 5 5.5 – 100% 100%
1 Measured from the effective grant date, generally 1 July2 The plans that vest after four years could be exercised after three years if the performance measures were met early
The movement from options to performance rights over time reflects changes in general market conditions and trends in retention practices in the employment market.
No grants have been made under the Performance shares or Cash Award sub-Plans.
DIRECTORS’ STATUTORY REPORTREMUNERATION REPORT
WoolWorths limited AnnuAl report 201252
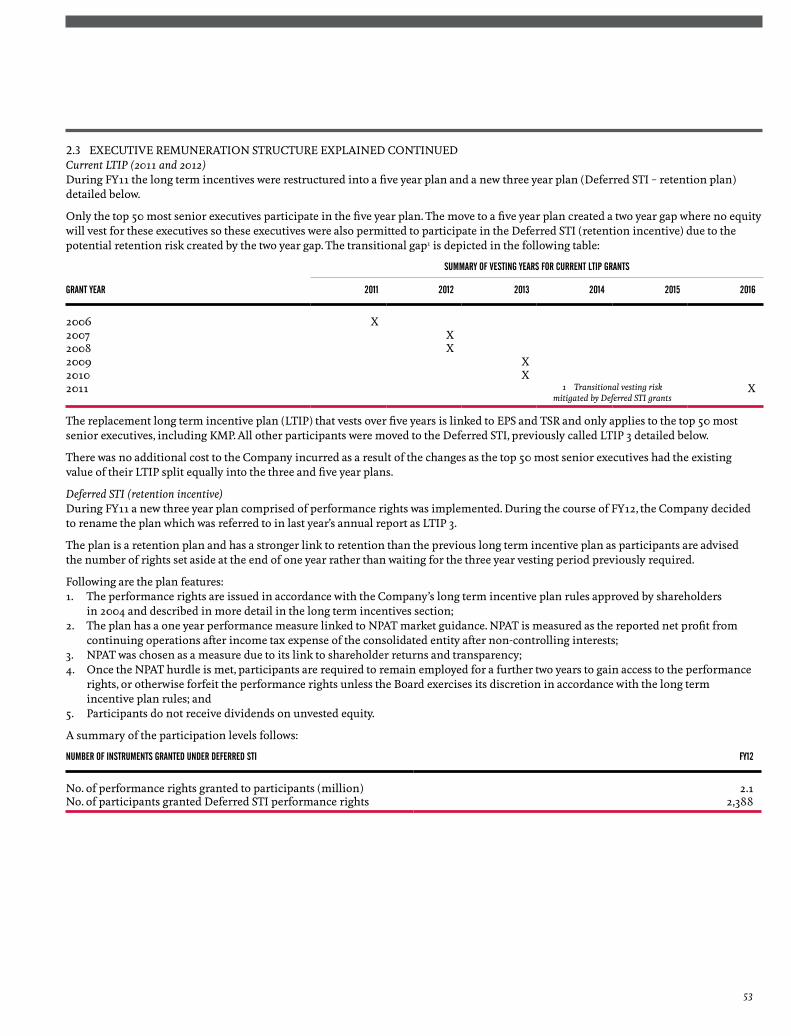
2.3 exeCuTive ReMuNeRATioN sTRuCTuRe exPLAiNeD CoNTiNueDCurrent LTIP (2011 and 2012)During FY11 the long term incentives were restructured into a five year plan and a new three year plan (Deferred sTi – retention plan) detailed below.
only the top 50 most senior executives participate in the five year plan. The move to a five year plan created a two year gap where no equity will vest for these executives so these executives were also permitted to participate in the Deferred sTi (retention incentive) due to the potential retention risk created by the two year gap. The transitional gap1 is depicted in the following table:
sUmmary oF vesting years For CUrrent ltip grants
grant year 2011 2012 2013 2014 2015 2016
2006 x2007 x2008 x2009 x2010 x2011 1 Transitional vesting risk
mitigated by Deferred STI grants x
The replacement long term incentive plan (LTiP) that vests over five years is linked to ePs and TsR and only applies to the top 50 most senior executives, including KMP. All other participants were moved to the Deferred sTi, previously called LTiP 3 detailed below.
There was no additional cost to the Company incurred as a result of the changes as the top 50 most senior executives had the existing value of their LTiP split equally into the three and five year plans.
Deferred STI (retention incentive)During FY11 a new three year plan comprised of performance rights was implemented. During the course of FY12, the Company decided to rename the plan which was referred to in last year’s annual report as LTiP 3.
The plan is a retention plan and has a stronger link to retention than the previous long term incentive plan as participants are advised the number of rights set aside at the end of one year rather than waiting for the three year vesting period previously required.
Following are the plan features:1. The performance rights are issued in accordance with the Company’s long term incentive plan rules approved by shareholders
in 2004 and described in more detail in the long term incentives section;2. The plan has a one year performance measure linked to NPAT market guidance. NPAT is measured as the reported net profit from
continuing operations after income tax expense of the consolidated entity after non-controlling interests; 3. NPAT was chosen as a measure due to its link to shareholder returns and transparency;4. once the NPAT hurdle is met, participants are required to remain employed for a further two years to gain access to the performance
rights, or otherwise forfeit the performance rights unless the Board exercises its discretion in accordance with the long term incentive plan rules; and
5. Participants do not receive dividends on unvested equity.
A summary of the participation levels follows:
nUmber oF instrUments granteD UnDer DeFerreD sti Fy12
No. of performance rights granted to participants (million) 2.1No. of participants granted Deferred sTi performance rights 2,388
53
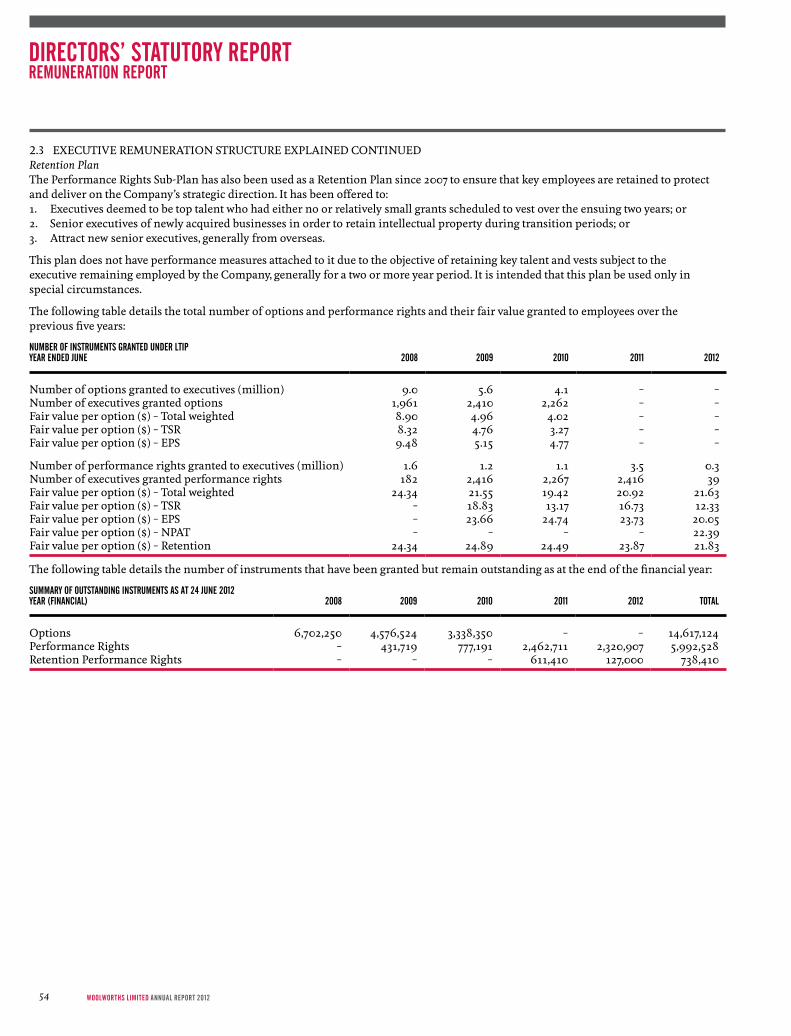
2.3 exeCuTive ReMuNeRATioN sTRuCTuRe exPLAiNeD CoNTiNueDRetention PlanThe Performance Rights sub-Plan has also been used as a Retention Plan since 2007 to ensure that key employees are retained to protect and deliver on the Company’s strategic direction. it has been offered to:1. executives deemed to be top talent who had either no or relatively small grants scheduled to vest over the ensuing two years; or2. senior executives of newly acquired businesses in order to retain intellectual property during transition periods; or3. Attract new senior executives, generally from overseas.
This plan does not have performance measures attached to it due to the objective of retaining key talent and vests subject to the executive remaining employed by the Company, generally for a two or more year period. it is intended that this plan be used only in special circumstances.
The following table details the total number of options and performance rights and their fair value granted to employees over the previous five years:
nUmber oF instrUments granteD UnDer ltipyear enDeD JUne 2008 2009 2010 2011 2012
Number of options granted to executives (million) 9.0 5.6 4.1 – –Number of executives granted options 1,961 2,410 2,262 – –Fair value per option ($) – Total weighted 8.90 4.96 4.02 – –Fair value per option ($) – TsR 8.32 4.76 3.27 – –Fair value per option ($) – ePs 9.48 5.15 4.77 – –
Number of performance rights granted to executives (million) 1.6 1.2 1.1 3.5 0.3Number of executives granted performance rights 182 2,416 2,267 2,416 39Fair value per option ($) – Total weighted 24.34 21.55 19.42 20.92 21.63Fair value per option ($) – TsR – 18.83 13.17 16.73 12.33Fair value per option ($) – ePs – 23.66 24.74 23.73 20.05Fair value per option ($) – NPAT – – – – 22.39Fair value per option ($) – Retention 24.34 24.89 24.49 23.87 21.83
The following table details the number of instruments that have been granted but remain outstanding as at the end of the financial year:
sUmmary oF oUtstanDing instrUments as at 24 JUne 2012year (FinanCial) 2008 2009 2010 2011 2012 total
options 6,702,250 4,576,524 3,338,350 – – 14,617,124Performance Rights – 431,719 777,191 2,462,711 2,320,907 5,992,528Retention Performance Rights – – – 611,410 127,000 738,410
DIRECTORS’ STATUTORY REPORTREMUNERATION REPORT
WoolWorths limited AnnuAl report 201254
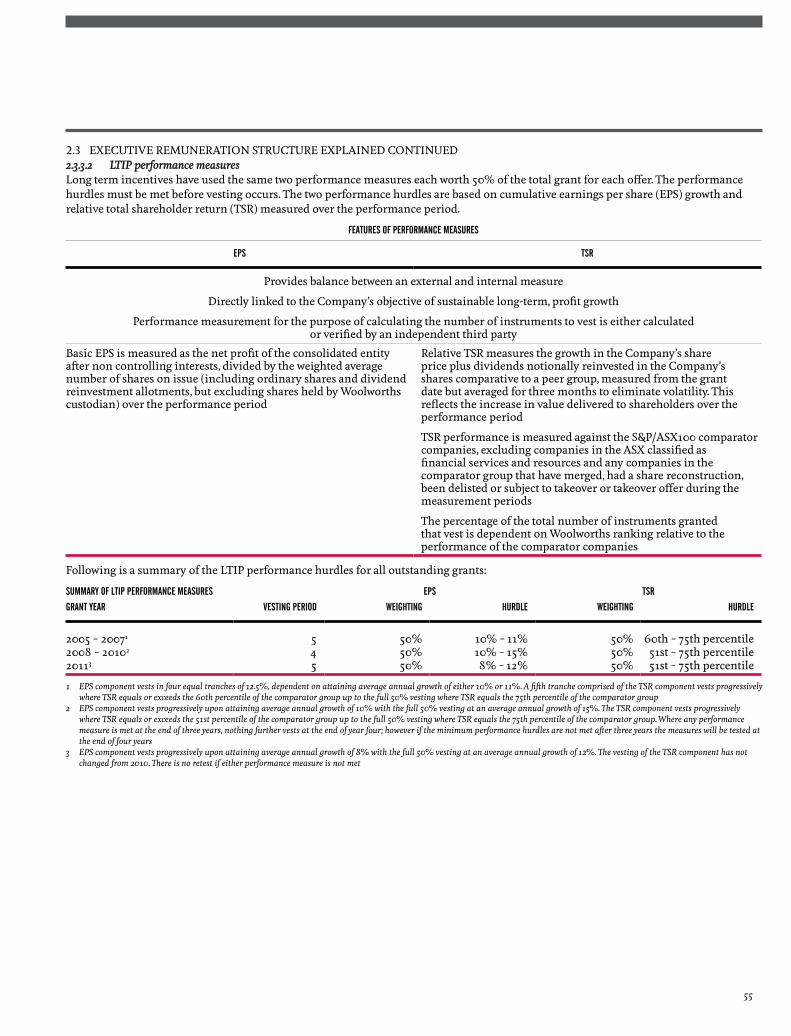
2.3 exeCuTive ReMuNeRATioN sTRuCTuRe exPLAiNeD CoNTiNueD2.3.3.2 LTIP performance measuresLong term incentives have used the same two performance measures each worth 50% of the total grant for each offer. The performance hurdles must be met before vesting occurs. The two performance hurdles are based on cumulative earnings per share (ePs) growth and relative total shareholder return (TsR) measured over the performance period.
FeatUres oF perFormanCe measUres
eps tsr
Provides balance between an external and internal measure
Directly linked to the Company’s objective of sustainable long-term, profit growth
Performance measurement for the purpose of calculating the number of instruments to vest is either calculated or verified by an independent third party
Basic ePs is measured as the net profit of the consolidated entity after non controlling interests, divided by the weighted average number of shares on issue (including ordinary shares and dividend reinvestment allotments, but excluding shares held by Woolworths custodian) over the performance period
Relative TsR measures the growth in the Company’s share price plus dividends notionally reinvested in the Company’s shares comparative to a peer group, measured from the grant date but averaged for three months to eliminate volatility. This reflects the increase in value delivered to shareholders over the performance period
TsR performance is measured against the s&P/Asx100 comparator companies, excluding companies in the Asx classified as financial services and resources and any companies in the comparator group that have merged, had a share reconstruction, been delisted or subject to takeover or takeover offer during the measurement periods
The percentage of the total number of instruments granted that vest is dependent on Woolworths ranking relative to the performance of the comparator companies
Following is a summary of the LTiP performance hurdles for all outstanding grants:
sUmmary oF ltip perFormanCe measUres eps tsr
grant year vesting perioD weighting hUrDle weighting hUrDle
2005 – 20071 5 50% 10% – 11% 50% 60th – 75th percentile2008 – 20102 4 50% 10% – 15% 50% 51st – 75th percentile20113 5 50% 8% – 12% 50% 51st – 75th percentile
1 EPS component vests in four equal tranches of 12.5%, dependent on attaining average annual growth of either 10% or 11%. A fifth tranche comprised of the TSR component vests progressively where TSR equals or exceeds the 60th percentile of the comparator group up to the full 50% vesting where TSR equals the 75th percentile of the comparator group
2 EPS component vests progressively upon attaining average annual growth of 10% with the full 50% vesting at an average annual growth of 15%. The TSR component vests progressively where TSR equals or exceeds the 51st percentile of the comparator group up to the full 50% vesting where TSR equals the 75th percentile of the comparator group. Where any performance measure is met at the end of three years, nothing further vests at the end of year four; however if the minimum performance hurdles are not met after three years the measures will be tested at the end of four years
3 EPS component vests progressively upon attaining average annual growth of 8% with the full 50% vesting at an average annual growth of 12%. The vesting of the TSR component has not changed from 2010. There is no retest if either performance measure is not met
55

2.3 exeCuTive ReMuNeRATioN sTRuCTuRe exPLAiNeD CoNTiNueD2.3.3.3 Link to performanceA comparison of the improved financial performance and benefits for shareholder wealth derived from Woolworths’ long term incentive arrangements and the number of options granted to all executives are shown in the following table:
year enDeD JUne 2008 2009 2010 2011 2012
Basic ePs from continuing and discontinued operations (cents per share) 134.9 150.7 164.0 174.6 148.7Basic ePs from continuing and discontinued operations excluding the CeG provision (cents per share) 134.9 150.7 164.0 174.6 180.1Total dividends (cents per share) 92.0 104.0 115.0 122.0 126.0Market capitalisation ($ million) 30,453 31,906 33,733 33,150 32,498share price (closing) ($) 25.02 25.96 27.40 27.25 26.38Number of executives granted performance rights 182 2,416 2,267 2,416 2,388
0
20
EPS Total Dividends Market CapitalisationFinancial Year
40
60
80
Cent
s Pe
r Sha
re
Mar
ket C
apita
lisat
ion
100
120
140
160
180
200
FY99
FY00
FY01
FY02
FY03
FY04
FY05
FY06
FY07
FY08
FY09
FY10
FY11
FY12
0
5k
10k
15k
20k
25k
30k
35k
40k
ltip link to Company perFormanCe (2012 eps exClUDes the Ce6 provision)
2.3.3.4 Securities dealing policyThe Woolworths securities Dealing Policy was reviewed in september 2011. As part of the policy all members of the senior management team signed a declaration that they have not entered into any arrangements that would contravene the policy.
under the policy, executives may not enter into any derivative (including hedging) transaction that will protect the value of either unvested securities or vested securities that are subject to a disposal restriction, issued as part of the Woolworths Long Term incentive Plan.
Compliance with the policy has been introduced as a condition of participation in the Long Term incentive Plan with effect from 2008. To enter into any such arrangement would breach the conditions of the grant and would result in forfeiture of the relevant securities.
executive compliance with this policy will be monitored through an annual declaration by executives stating that they have not entered into any derivative transaction in relation to their unvested Woolworths securities.
Woolworths does not have holding locks in place on any of the long term incentive schemes.
DIRECTORS’ STATUTORY REPORTREMUNERATION REPORT
WoolWorths limited AnnuAl report 201256

2.4 MANAGiNG DiReCToR AND CHieF exeCuTive oFFiCeR2.4.1 Mr M LuscombeMr Luscombe retired as Ceo, effective 30 september 2011. His service agreement had effect from 1 october 2006 and was a rolling contract. The service agreement provided for 12 months notice of termination on the part of the Company and six months notice on the part of Mr Luscombe. in addition the Company could invoke a restraint period of up to 12 months following separation, preventing the Ceo from engaging in any business activity with major competitors of Woolworths.
The former Ceo’s termination payment was comprised of: – Pro rated sTiP payment for the three months leading up to his retirement paid in september 2012 after the release of the Company’s
FY12 results; – Any accrued statutory entitlements; – Any accrued superannuation entitlements provided by the Woolworths Group superannuation Plan; and – Any LTiP entitlements in accordance with the Plan rules which do not convert to shares until the performance measures have
been met.
2.4.1.1 STIPThe sTiP provides for a maximum annual payment of 130% of TFR to Mr Luscombe. The actual payment was a pro rata payment of $646,847 calculated with regard to achievement of key performance indicators. The performance indicators were based on a combination of detailed measurements of corporate and financial performance and the implementation of strategic operational objectives.
2.4.1.2 Equity plans Mr Luscombe did not participate in Deferred sTi.
Mr Luscombe participated in the Woolworths LTiP. At the time of Mr Luscombe’s retirement, there were outstanding grants of options only, options and performance rights or performance rights only from 2007 through to 2010.
For the 2007 grant, the same performance hurdles and conditions that apply under the Woolworths LTiP applied to options allocated to the Ceo, except that 50% of the allocation vested and became exercisable three years from the effective date of the grant subject to meeting the performance hurdles. The remaining 50% of the allocation vested and became exercisable after five years in accordance with the prescribed conditions.
For the 2008 to 2010 grants, the same performance hurdles and conditions that apply under the Woolworths LTiP applied to the allocation made to the Ceo.
upon his retirement, and subject to vesting in accordance with each grant at the appropriate date, Mr Luscombe became entitled to the following, which is calculated on a pro rata basis having regard to completed months of service over the vesting period:1. 2007 grant: 106,250 options with an exercise price of $25.91;2. 2009 grant: up to 187,500 options with an exercise price of $25.88 and up to 45,881 performance rights may potentially vest at the end
of FY13; and3. 2010 grant: up to 50,914 performance rights may potentially vest at the end of FY13
The 2008 grant vested while Mr Luscombe was employed.
2.4.2 Mr G O’Brien Mr o’Brien was appointed Deputy Ceo and Ceo Designate effective 4 April 2011 and assumed the Ceo role effective 1 october 2011. external independent consultants were engaged to advise the Board in relation to the incoming Ceo’s terms and conditions of employment. Due to the internal appointment and relative experience, the Board determined the commencing remuneration of the incoming Ceo would be lower than more experienced Ceos with the intention to review and adjust the remuneration to be more in line with the median of the relevant peer group, subject to performance in the role.
57
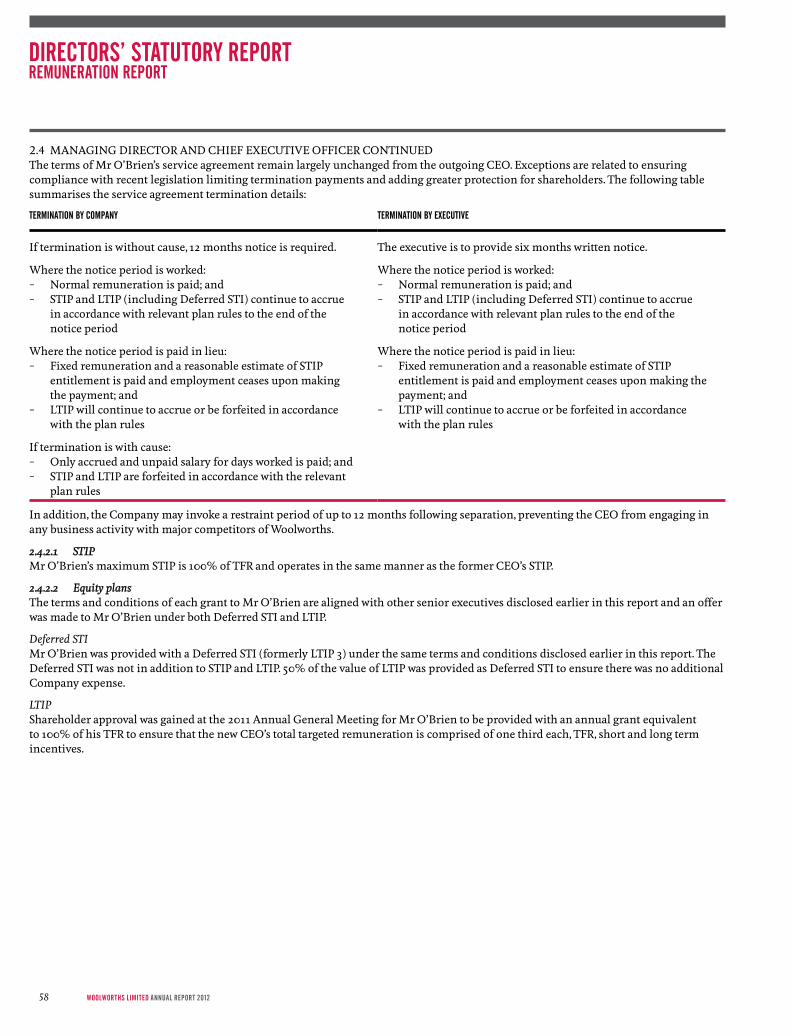
2.4 MANAGiNG DiReCToR AND CHieF exeCuTive oFFiCeR CoNTiNueDThe terms of Mr o’Brien’s service agreement remain largely unchanged from the outgoing Ceo. exceptions are related to ensuring compliance with recent legislation limiting termination payments and adding greater protection for shareholders. The following table summarises the service agreement termination details:
termination by Company termination by exeCUtive
if termination is without cause, 12 months notice is required. The executive is to provide six months written notice.
Where the notice period is worked: – Normal remuneration is paid; and – sTiP and LTiP (including Deferred sTi) continue to accrue
in accordance with relevant plan rules to the end of the notice period
Where the notice period is worked: – Normal remuneration is paid; and – sTiP and LTiP (including Deferred sTi) continue to accrue
in accordance with relevant plan rules to the end of the notice period
Where the notice period is paid in lieu: – Fixed remuneration and a reasonable estimate of sTiP
entitlement is paid and employment ceases upon making the payment; and
– LTiP will continue to accrue or be forfeited in accordance with the plan rules
Where the notice period is paid in lieu: – Fixed remuneration and a reasonable estimate of sTiP
entitlement is paid and employment ceases upon making the payment; and
– LTiP will continue to accrue or be forfeited in accordance with the plan rules
if termination is with cause: – only accrued and unpaid salary for days worked is paid; and – sTiP and LTiP are forfeited in accordance with the relevant
plan rules
in addition, the Company may invoke a restraint period of up to 12 months following separation, preventing the Ceo from engaging in any business activity with major competitors of Woolworths.
2.4.2.1 STIPMr o’Brien’s maximum sTiP is 100% of TFR and operates in the same manner as the former Ceo’s sTiP.
2.4.2.2 Equity plansThe terms and conditions of each grant to Mr o’Brien are aligned with other senior executives disclosed earlier in this report and an offer was made to Mr o’Brien under both Deferred sTi and LTiP.
Deferred STIMr o’Brien was provided with a Deferred sTi (formerly LTiP 3) under the same terms and conditions disclosed earlier in this report. The Deferred sTi was not in addition to sTiP and LTiP. 50% of the value of LTiP was provided as Deferred sTi to ensure there was no additional Company expense.
LTIPshareholder approval was gained at the 2011 Annual General Meeting for Mr o’Brien to be provided with an annual grant equivalent to 100% of his TFR to ensure that the new Ceo’s total targeted remuneration is comprised of one third each, TFR, short and long term incentives.
DIRECTORS’ STATUTORY REPORTREMUNERATION REPORT
WoolWorths limited AnnuAl report 201258
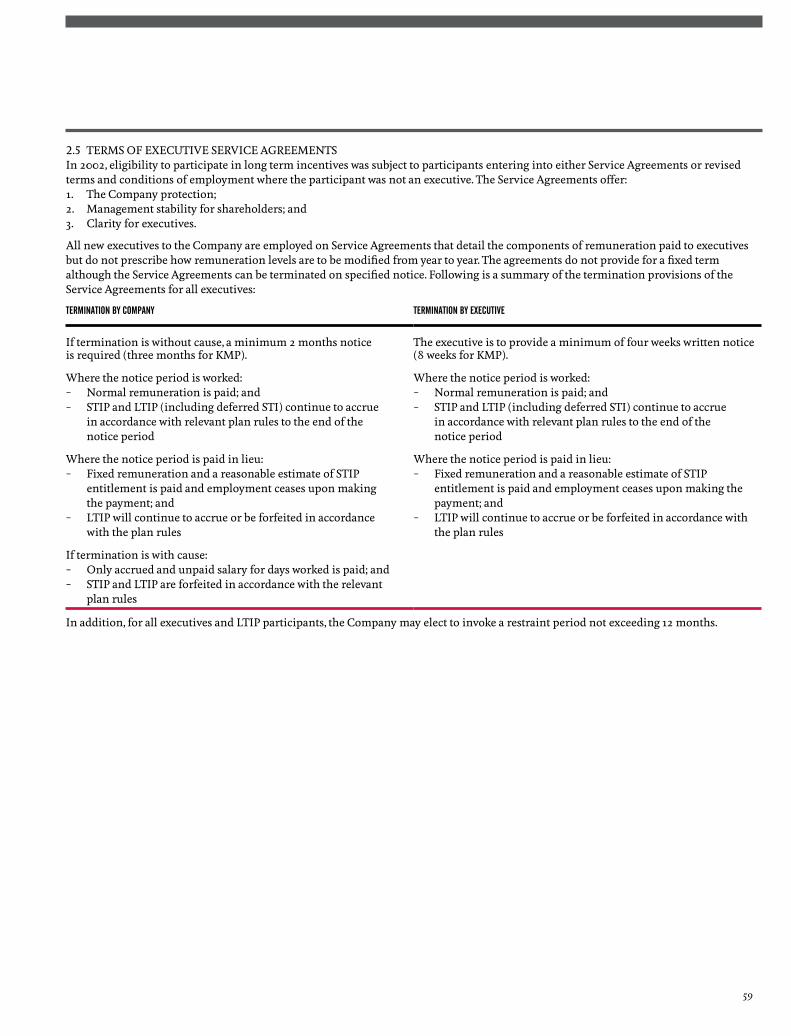
2.5 TeRMs oF exeCuTive seRviCe AGReeMeNTsin 2002, eligibility to participate in long term incentives was subject to participants entering into either service Agreements or revised terms and conditions of employment where the participant was not an executive. The service Agreements offer:1. The Company protection;2. Management stability for shareholders; and3. Clarity for executives.
All new executives to the Company are employed on service Agreements that detail the components of remuneration paid to executives but do not prescribe how remuneration levels are to be modified from year to year. The agreements do not provide for a fixed term although the service Agreements can be terminated on specified notice. Following is a summary of the termination provisions of the service Agreements for all executives:
termination by Company termination by exeCUtive
if termination is without cause, a minimum 2 months notice is required (three months for KMP).
The executive is to provide a minimum of four weeks written notice (8 weeks for KMP).
Where the notice period is worked: – Normal remuneration is paid; and – sTiP and LTiP (including deferred sTi) continue to accrue
in accordance with relevant plan rules to the end of the notice period
Where the notice period is worked: – Normal remuneration is paid; and – sTiP and LTiP (including deferred sTi) continue to accrue
in accordance with relevant plan rules to the end of the notice period
Where the notice period is paid in lieu: – Fixed remuneration and a reasonable estimate of sTiP
entitlement is paid and employment ceases upon making the payment; and
– LTiP will continue to accrue or be forfeited in accordance with the plan rules
Where the notice period is paid in lieu: – Fixed remuneration and a reasonable estimate of sTiP
entitlement is paid and employment ceases upon making the payment; and
– LTiP will continue to accrue or be forfeited in accordance with the plan rules
if termination is with cause: – only accrued and unpaid salary for days worked is paid; and – sTiP and LTiP are forfeited in accordance with the relevant
plan rules
in addition, for all executives and LTiP participants, the Company may elect to invoke a restraint period not exceeding 12 months.
59

3 NON-EXECUTIVE DIRECTORS’ ARRANGEMENTS
3.1 ReMuNeRATioN PoLiCY AND sTRuCTuReNon-executive Directors’ fees are determined by the Board within the aggregate amount approved by shareholders. The current maximum aggregate amount which may be paid in Directors’ fees, as approved at the Annual General Meeting on 18 November 2010 is $4,000,000 per annum. No Directors’ fees are paid to executive Directors.
During the year ended 24 June 2012, the amount of Directors’ base fees paid to each Non-executive Director was increased by 3% to $221,450 per annum effective from 1 september 2011. The Chairman receives a multiple of three times this amount.
Following is a summary of base and committee fees for the last two financial years:
2011 2012
Committee Fees Chair member Chair member
Woolworths Limited 645,000 215,000 664,350 221,450Audit, Risk Management and Compliance Committee 50,000 25,000 51,500 25,750People Policy Committee 50,000 25,000 51,500 25,750Woolworths Group superannuation Plan – 26,520 – 27,315ALH Group Pty Ltd – 84,870 – 87,415ALH Audit Committee 26,520 – 27,315 –Hydrox Holdings Pty Ltd – 84,870 – 87,415Hydrox Audit Committee 26,520 – 27,315 –
in addition to the above fees, effective from 1 september 2011, an overseas Directors’ Allowance of $10,300 (previously $10,000) was also provided to any Non-executive Directors residing outside Australia, representing the additional time and cost involved in attending to Board and Board Committee responsibilities.
ernst & Young provided data on the structure and level of Non-executive Directors’ fees. The information considered the fees paid to Non-executive Directors of Australian listed corporations, the size and complexity of the Company’s operations and the responsibilities and workload requirements of Directors. No element of the remuneration of any Non-executive Director is dependent on the satisfaction of a performance condition. increases for Non-executive Directors were consistent with the overall salary increase awarded to non-eBA employees of the Company.
DIRECTORS’ STATUTORY REPORTREMUNERATION REPORT
WoolWorths limited AnnuAl report 201260

3.2 ReTiReMeNT BeNeFiTs Directors’ Retirement Deeds, which were approved by shareholders in November 1998 entitled each Non-executive Director (appointed prior to January 2004) to receive an allowance on retirement as a Director after a minimum period of service.
The Board determined that it should implement changes to Non-executive Director remuneration consistent with developing market practice and guidelines by discontinuing the on-going accrual of benefits under the existing retirement benefits arrangements on 1 August 2006. The benefits accrued to that date are indexed by reference to the bank bill rate or have been rolled into a defined benefit superannuation fund until retirement occurs. With the cessation of the retirement benefits, all Non-executive Directors (other than the Chairman) receive the same base fees.
3.3 APPoiNTMeNT LeTTeRs, DeeDs oF ACCess, iNsuRANCe AND iNDeMNiTY, DisCLosuRe DeeDsThe Company and each of the Non-executive Directors have entered into an Appointment Letter together with a Deed of Access, insurance and indemnity and a Disclosure Deed (as required under the Asx Listing Rules). The Appointment Letter covers the key aspects of the duties, role and responsibilities of Non-executive Directors.
Non-executive Directors are not appointed for a specific term and their appointment may be terminated by notice from the Director or otherwise pursuant to sections 203B or 203D of the Corporations Act 2001.
61

4 EXECUTIVE REMUNERATION STATUTORY DISCLOSURES
4.1 KMP ReMuNeRATioN TABLes set out in the following table is the remuneration for the KMP of Woolworths Limited and its subsidiaries during the financial years ended 24 June 2012 and 26 June 2011.
short term beneFits
postemployment
beneFitsother long
term beneFitsshare baseD
payments2termination
beneFits total
year salary anD Fees Cash inCentivenon-monetary
beneFits1 sUb totalsUperannUation
anD otherlong serviCe
leave valUe oF eqUity
% oF potentialCash inCentive
paiD% relateD to
perFormanCe3
share baseDpayments as a
% oF total3
Non-executive DirectorsJ Astbury4 2012 377,215 – 1,158 378,373 15,775 – – – 394,148 – – –
2011 372,454 – 1,212 373,666 15,199 – – – 388,865 – – –J Broadbent5 2012 246,000 – 1,158 247,158 15,775 – – – 262,933 – – –
2011 99,571 – 1,212 100,783 6,450 – – – 107,233 – – –C Cross6 2012 104,902 – 1,158 106,060 6,694 – – – 112,754 – – –R Deane7 2012 266,854 – 1,158 268,012 15,775 – – – 283,787 – – –
2011 271,340 – 1,212 272,552 15,199 – – – 287,751 – – –J Hrdlicka8 2012 246,000 – 1,158 247,158 15,775 – – – 262,933 – – –
2011 214,676 – 1,212 215,888 13,601 – – – 229,489 – – –i Macfarlane 2012 246,000 – 1,158 247,158 15,775 – – – 262,933 – – –
2011 238,625 – 1,212 239,837 15,199 – – – 255,036 – – –D Mackay6 2012 104,902 – 1,158 106,060 6,694 – – – 112,754 – – –J strong 2012 661,125 – 1,158 662,283 15,775 – – – 678,058 – – –
2011 640,500 – 1,212 641,712 15,199 – – – 656,911 – – –M ullmer6 2012 113,485 – 1,158 114,643 6,694 – – – 121,337 – – –R Waters9 2012 261,021 – 1,158 262,179 15,775 – – – 277,954 – – –
2011 99,571 – 1,212 100,783 6,450 – – – 107,233 – – –
Executive DirectorsG o’Brien 2012 1,827,514 1,492,450 29,989 3,349,953 247,000 173,746 473,876 – 4,244,575 79% 46.3% 11.2%
2011 1,055,875 493,809 29,773 1,579,457 126,000 275,762 63,111 – 2,044,330 65% 27.2% 3.1%T Pockett 2012 1,317,768 1,295,933 22,044 2,635,745 50,000 27,003 628,556 – 3,341,304 71% 57.6% 18.8%
2011 1,222,026 1,203,369 25,120 2,450,515 50,000 25,189 450,667 – 2,976,371 68% 55.6% 15.1%
ExecutivesB Banducci13 2012 106,136 67,609 1,158 174,903 9,000 7,423 2,048 – 193,374 86% 36.0% 1.1%J Coates 2012 779,528 230,169 22,271 1,031,968 117,391 17,180 178,187 – 1,344,726 37% 30.4% 13.3%
2011 725,582 146,087 22,342 894,011 113,190 21,648 107,628 – 1,136,477 24% 22.3% 9.5%C Flynn13 2012 122,157 76,840 8,958 207,955 12,000 1,992 26,566 – 248,513 78% 41.6% 10.7%s Greentree13 2012 606,992 432,514 27,791 1,067,297 95,000 77,926 225,028 – 1,465,251 89% 44.9% 15.4%A Hall 2012 401,787 225,690 33,552 661,029 25,000 7,569 137,368 – 830,966 71% 43.7% 16.5%
2011 390,164 166,123 27,545 583,832 25,000 8,159 38,276 – 655,267 72% 31.2% 5.8%P Horton 2012 586,945 331,320 20,894 939,159 58,152 11,456 137,368 – 1,146,135 71% 40.9% 12.0%
2011 595,390 244,669 20,933 860,992 56,152 11,658 51,726 – 980,528 72% 30.2% 5.3%T Jegen 2012 681,965 373,771 19,553 1,075,289 25,000 10,276 251,879 – 1,362,444 62% 45.9% 18.5%P Winn 2012 421,740 228,094 7,851 657,685 39,191 6,476 126,913 830,265 75% 42.8% 15.3%
Former Key Management Personnel13, 14, 15
L L’Huillier10 2012 160,296 – 1,158 161,454 6,573 – – – 168,027 – – –2011 374,579 – 1,212 375,791 15,199 – – – 390,990 – – –
D Grady11 2011 98,625 – 1,212 99,837 6,333 – – – 106,170 – – –A Watkins12 2011 22,960 – 1,212 24,172 1,267 – – – 25,439 – – –M Luscombe 2012 529,810 646,847 41,089 1,217,746 137,164 9,790 (269,129) – 1,095,571 73% n.m n.m
2011 2,259,892 2,552,155 33,410 4,845,457 508,901 76,706 299,960 – 5,731,024 72% 49.8% 5.2%G Foran 2012 229,026 – 13,856 242,882 930,706 3,786 (458,865) 488,461 1,206,970 – n.m n.m
2011 1,039,473 643,393 25,420 1,708,286 143,870 32,022 107,628 – 1,991,806 66% 37.7% 5.4%K schmidt 2012 472,476 – 23,025 495,501 542,121 9,519 (310,364) – 736,777 – n.m n.m
2011 520,200 326,226 22,960 869,386 50,000 14,182 18,688 – 952,256 72% 36.2% 2.0%Total 2012 10,871,644 5,401,237 284,769 16,557,650 2,424,805 364,142 1,149,431 488,461 20,984,489 – – –
2011 10,241,503 5,775,831 219,623 16,236,957 1,183,209 465,326 1,137,684 – 19,023,176 – – –
DIRECTORS’ STATUTORY REPORTREMUNERATION REPORT
WoolWorths limited AnnuAl report 201262
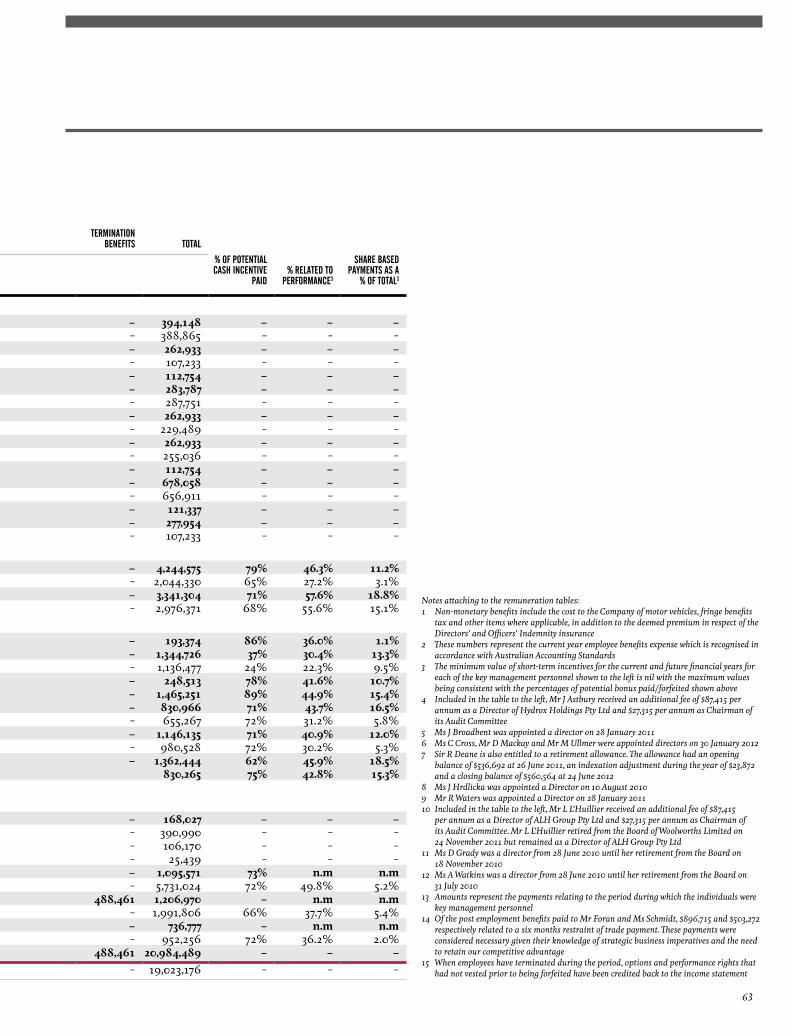
4 EXECUTIVE REMUNERATION STATUTORY DISCLOSURES
4.1 KMP ReMuNeRATioN TABLes set out in the following table is the remuneration for the KMP of Woolworths Limited and its subsidiaries during the financial years ended 24 June 2012 and 26 June 2011.
short term beneFits
postemployment
beneFitsother long
term beneFitsshare baseD
payments2termination
beneFits total
year salary anD Fees Cash inCentivenon-monetary
beneFits1 sUb totalsUperannUation
anD otherlong serviCe
leave valUe oF eqUity
% oF potentialCash inCentive
paiD% relateD to
perFormanCe3
share baseDpayments as a
% oF total3
Non-executive DirectorsJ Astbury4 2012 377,215 – 1,158 378,373 15,775 – – – 394,148 – – –
2011 372,454 – 1,212 373,666 15,199 – – – 388,865 – – –J Broadbent5 2012 246,000 – 1,158 247,158 15,775 – – – 262,933 – – –
2011 99,571 – 1,212 100,783 6,450 – – – 107,233 – – –C Cross6 2012 104,902 – 1,158 106,060 6,694 – – – 112,754 – – –R Deane7 2012 266,854 – 1,158 268,012 15,775 – – – 283,787 – – –
2011 271,340 – 1,212 272,552 15,199 – – – 287,751 – – –J Hrdlicka8 2012 246,000 – 1,158 247,158 15,775 – – – 262,933 – – –
2011 214,676 – 1,212 215,888 13,601 – – – 229,489 – – –i Macfarlane 2012 246,000 – 1,158 247,158 15,775 – – – 262,933 – – –
2011 238,625 – 1,212 239,837 15,199 – – – 255,036 – – –D Mackay6 2012 104,902 – 1,158 106,060 6,694 – – – 112,754 – – –J strong 2012 661,125 – 1,158 662,283 15,775 – – – 678,058 – – –
2011 640,500 – 1,212 641,712 15,199 – – – 656,911 – – –M ullmer6 2012 113,485 – 1,158 114,643 6,694 – – – 121,337 – – –R Waters9 2012 261,021 – 1,158 262,179 15,775 – – – 277,954 – – –
2011 99,571 – 1,212 100,783 6,450 – – – 107,233 – – –
Executive DirectorsG o’Brien 2012 1,827,514 1,492,450 29,989 3,349,953 247,000 173,746 473,876 – 4,244,575 79% 46.3% 11.2%
2011 1,055,875 493,809 29,773 1,579,457 126,000 275,762 63,111 – 2,044,330 65% 27.2% 3.1%T Pockett 2012 1,317,768 1,295,933 22,044 2,635,745 50,000 27,003 628,556 – 3,341,304 71% 57.6% 18.8%
2011 1,222,026 1,203,369 25,120 2,450,515 50,000 25,189 450,667 – 2,976,371 68% 55.6% 15.1%
ExecutivesB Banducci13 2012 106,136 67,609 1,158 174,903 9,000 7,423 2,048 – 193,374 86% 36.0% 1.1%J Coates 2012 779,528 230,169 22,271 1,031,968 117,391 17,180 178,187 – 1,344,726 37% 30.4% 13.3%
2011 725,582 146,087 22,342 894,011 113,190 21,648 107,628 – 1,136,477 24% 22.3% 9.5%C Flynn13 2012 122,157 76,840 8,958 207,955 12,000 1,992 26,566 – 248,513 78% 41.6% 10.7%s Greentree13 2012 606,992 432,514 27,791 1,067,297 95,000 77,926 225,028 – 1,465,251 89% 44.9% 15.4%A Hall 2012 401,787 225,690 33,552 661,029 25,000 7,569 137,368 – 830,966 71% 43.7% 16.5%
2011 390,164 166,123 27,545 583,832 25,000 8,159 38,276 – 655,267 72% 31.2% 5.8%P Horton 2012 586,945 331,320 20,894 939,159 58,152 11,456 137,368 – 1,146,135 71% 40.9% 12.0%
2011 595,390 244,669 20,933 860,992 56,152 11,658 51,726 – 980,528 72% 30.2% 5.3%T Jegen 2012 681,965 373,771 19,553 1,075,289 25,000 10,276 251,879 – 1,362,444 62% 45.9% 18.5%P Winn 2012 421,740 228,094 7,851 657,685 39,191 6,476 126,913 830,265 75% 42.8% 15.3%
Former Key Management Personnel13, 14, 15
L L’Huillier10 2012 160,296 – 1,158 161,454 6,573 – – – 168,027 – – –2011 374,579 – 1,212 375,791 15,199 – – – 390,990 – – –
D Grady11 2011 98,625 – 1,212 99,837 6,333 – – – 106,170 – – –A Watkins12 2011 22,960 – 1,212 24,172 1,267 – – – 25,439 – – –M Luscombe 2012 529,810 646,847 41,089 1,217,746 137,164 9,790 (269,129) – 1,095,571 73% n.m n.m
2011 2,259,892 2,552,155 33,410 4,845,457 508,901 76,706 299,960 – 5,731,024 72% 49.8% 5.2%G Foran 2012 229,026 – 13,856 242,882 930,706 3,786 (458,865) 488,461 1,206,970 – n.m n.m
2011 1,039,473 643,393 25,420 1,708,286 143,870 32,022 107,628 – 1,991,806 66% 37.7% 5.4%K schmidt 2012 472,476 – 23,025 495,501 542,121 9,519 (310,364) – 736,777 – n.m n.m
2011 520,200 326,226 22,960 869,386 50,000 14,182 18,688 – 952,256 72% 36.2% 2.0%Total 2012 10,871,644 5,401,237 284,769 16,557,650 2,424,805 364,142 1,149,431 488,461 20,984,489 – – –
2011 10,241,503 5,775,831 219,623 16,236,957 1,183,209 465,326 1,137,684 – 19,023,176 – – –
Notes attaching to the remuneration tables:1 Non-monetary benefits include the cost to the Company of motor vehicles, fringe benefits
tax and other items where applicable, in addition to the deemed premium in respect of the Directors’ and Officers’ Indemnity insurance
2 These numbers represent the current year employee benefits expense which is recognised in accordance with Australian Accounting Standards
3 The minimum value of short-term incentives for the current and future financial years for each of the key management personnel shown to the left is nil with the maximum values being consistent with the percentages of potential bonus paid/forfeited shown above
4 Included in the table to the left, Mr J Astbury received an additional fee of $87,415 per annum as a Director of Hydrox Holdings Pty Ltd and $27,315 per annum as Chairman of its Audit Committee
5 Ms J Broadbent was appointed a director on 28 January 2011 6 Ms C Cross, Mr D Mackay and Mr M Ullmer were appointed directors on 30 January 20127 Sir R Deane is also entitled to a retirement allowance. The allowance had an opening
balance of $536,692 at 26 June 2011, an indexation adjustment during the year of $23,872 and a closing balance of $560,564 at 24 June 2012
8 Ms J Hrdlicka was appointed a Director on 10 August 20109 Mr R Waters was appointed a Director on 28 January 201110 Included in the table to the left, Mr L L’Huillier received an additional fee of $87,415
per annum as a Director of ALH Group Pty Ltd and $27,315 per annum as Chairman of its Audit Committee. Mr L L’Huillier retired from the Board of Woolworths Limited on 24 November 2011 but remained as a Director of ALH Group Pty Ltd
11 Ms D Grady was a director from 28 June 2010 until her retirement from the Board on 18 November 2010
12 Ms A Watkins was a director from 28 June 2010 until her retirement from the Board on 31 July 2010
13 Amounts represent the payments relating to the period during which the individuals were key management personnel
14 Of the post employment benefits paid to Mr Foran and Ms Schmidt, $896,715 and $503,272 respectively related to a six months restraint of trade payment. These payments were considered necessary given their knowledge of strategic business imperatives and the need to retain our competitive advantage
15 When employees have terminated during the period, options and performance rights that had not vested prior to being forfeited have been credited back to the income statement
63

4.2 CoNDiTioNAL eNTiTLeMeNT To, AND sHARe HoLDiNGs oF KMPThe table below summarises the movements during the year in holdings of option and performance right interests in the Company for the key management personnel for the period. An option or performance right entitles the holder to one ordinary fully paid Woolworths Limited share. There is no amount unpaid on options exercised.
openingbalanCe
options anD perFormanCe rights
granteD asremUneration1
options exerCiseD/perFormanCe
rights matUreD2,3,4options lapseD DUe
to non-vesting5
Closing balanCe options anD
perFormanCe rights holDing6
nUmber oF options vesteD at enD oF year
no. no. $ no. $ no. % no. total exerCisable UnexerCisablevesteD DUring
the year
Executive DirectorsG o’Brien 2012 225,600 96,479 1,819,308 (49,870) 364,210 (715) 1% 271,494 34,415 21,915 12,500 73,035
2011 225,000 20,600 416,738 (20,000) 247,200 – – 225,600 11,250 – 11,250 26,250T Pockett 2012 966,685 77,539 1,462,157 (250,000) 1,447,500 (3,250) 1% 790,974 184,250 121,750 62,500 371,750
2011 985,588 61,097 1,235,992 (80,000) 988,800 – – 966,685 62,500 – 62,500 122,500
ExecutivesB Banducci 2012 – 3,100 69,409 – – – – 3,100 – – – –J Coates 2012 198,100 18,076 340,862 (47,435) 324,980 (357) 1% 168,384 23,458 10,958 12,500 59,643
2011 227,500 20,600 416,738 (50,000) 554,000 – – 198,100 11,250 – 11,250 48,750C Flynn 2012 32,945 2,100 47,019 (6,704) 54,508 (103) 1% 28,238 4,666 3,166 1,500 9,870s Greentree 2012 131,556 33,076 675,362 (18,788) 182,880 (556) 2% 145,288 20,795 17,045 3,750 35,833A Hall 2012 113,223 14,039 264,733 (2,165) 57,286 (318) 2% 124,779 17,240 9,740 7,500 19,405
2011 97,223 16,000 323,680 – – – – 113,223 – – – –P Horton 2012 133,223 14,039 264,733 (22,165) 176,886 (318) 1% 124,779 17,240 9,740 7,500 34,405
2011 167,223 16,000 323,680 (50,000) 618,000 – – 133,223 5,000 – 5,000 42,500T Jegen 2012 – 48,076 979,862 – – – – 48,076 – – – –P Winn 2012 – 33,076 670,712 – – – – 33,076 – – – –
Former Key Management Personnel7
M Luscombe 2012 1,433,369 – – – – (6,500) 1% – – – – –2011 1,641,175 122,194 2,471,985 (330,000) 1,452,300 – – 1,433,369 62,500 – 62,500 372,500
G Foran 2012 198,100 – – (2,435) 64,430 (357) 1% – – – – –2011 227,500 20,600 416,738 (50,000) 521,500 – – 198,100 11,250 – 11,250 48,750
K schmidt 2012 146,556 14,039 264,733 (18,788) 189,930 (556) 1% – – – – –2011 143,556 16,000 323,680 (13,000) 160,680 – – 146,556 3,750 – 3,750 13,500
Total 2012 3,579,357 353,639 6,858,890 (418,350) 2,862,610 (13,030) – 1,738,188 302,064 194,314 107,750 603,9412011 3,714,765 293,091 5,929,231 (593,000) 4,542,480 – – 3,414,856 167,500 – 167,500 674,750
1 Options and performance rights granted as remuneration is the total fair value of options and performance rights granted during the year determined by an independent actuary. This will be recognised in employee benefits expense over the vesting period of the grant, in accordance with Australian Accounting Standards
2 The value of options exercised/performance rights matured during the year is calculated as the market value of shares on the Australian Securities Exchange as at close of trading on the date the options were exercised/performance rights matured after deducting the price paid to exercise the options. No other options were exercised by key management personnel
3 In 2012, the amount paid per share for all options exercised during the year by the above key management personnel was $19.474 In 2011, the amount paid per share for all options exercised during the year by the above key management personnel was $16.46, with the exception of 250,000 options exercised by
M Luscombe where $25.91 was paid per share5 The number of options/performance rights which lapsed as a result of failure to meet performance hurdles. During the 52 weeks ended 26 June 2011, no options lapsed or were forfeited
relating to the key management personnel above as a result of failure to meet performance hurdles6 The number of ordinary shares under option/performance rights as at 24 June 2012/26 June 2011 is equivalent to the option/performance rights holding at that date 7 Key management personnel who ceased employment with the Company during the year. Accordingly, from this time, no further disclosure has been made. The following number of options/
performance rights were forfeited on termination: M Luscombe 230,324, G Foran 126,850 and K Schmidt 116,706
DIRECTORS’ STATUTORY REPORTREMUNERATION REPORT
WoolWorths limited AnnuAl report 201264
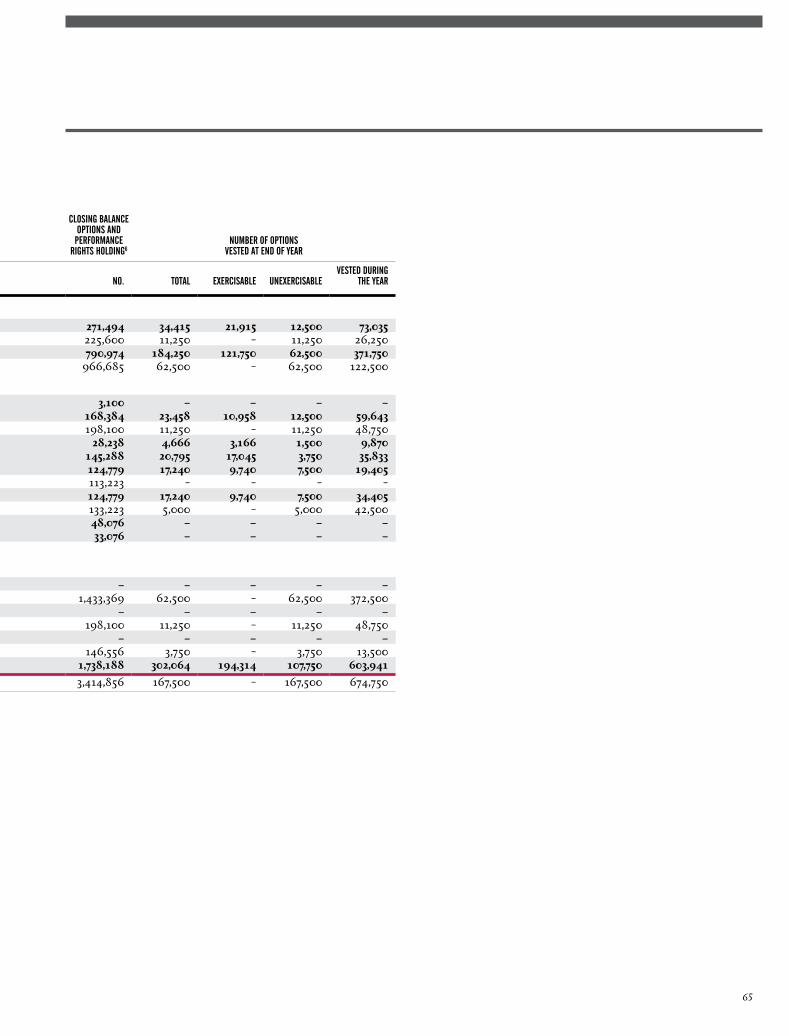
4.2 CoNDiTioNAL eNTiTLeMeNT To, AND sHARe HoLDiNGs oF KMPThe table below summarises the movements during the year in holdings of option and performance right interests in the Company for the key management personnel for the period. An option or performance right entitles the holder to one ordinary fully paid Woolworths Limited share. There is no amount unpaid on options exercised.
openingbalanCe
options anD perFormanCe rights
granteD asremUneration1
options exerCiseD/perFormanCe
rights matUreD2,3,4options lapseD DUe
to non-vesting5
Closing balanCe options anD
perFormanCe rights holDing6
nUmber oF options vesteD at enD oF year
no. no. $ no. $ no. % no. total exerCisable UnexerCisablevesteD DUring
the year
Executive DirectorsG o’Brien 2012 225,600 96,479 1,819,308 (49,870) 364,210 (715) 1% 271,494 34,415 21,915 12,500 73,035
2011 225,000 20,600 416,738 (20,000) 247,200 – – 225,600 11,250 – 11,250 26,250T Pockett 2012 966,685 77,539 1,462,157 (250,000) 1,447,500 (3,250) 1% 790,974 184,250 121,750 62,500 371,750
2011 985,588 61,097 1,235,992 (80,000) 988,800 – – 966,685 62,500 – 62,500 122,500
ExecutivesB Banducci 2012 – 3,100 69,409 – – – – 3,100 – – – –J Coates 2012 198,100 18,076 340,862 (47,435) 324,980 (357) 1% 168,384 23,458 10,958 12,500 59,643
2011 227,500 20,600 416,738 (50,000) 554,000 – – 198,100 11,250 – 11,250 48,750C Flynn 2012 32,945 2,100 47,019 (6,704) 54,508 (103) 1% 28,238 4,666 3,166 1,500 9,870s Greentree 2012 131,556 33,076 675,362 (18,788) 182,880 (556) 2% 145,288 20,795 17,045 3,750 35,833A Hall 2012 113,223 14,039 264,733 (2,165) 57,286 (318) 2% 124,779 17,240 9,740 7,500 19,405
2011 97,223 16,000 323,680 – – – – 113,223 – – – –P Horton 2012 133,223 14,039 264,733 (22,165) 176,886 (318) 1% 124,779 17,240 9,740 7,500 34,405
2011 167,223 16,000 323,680 (50,000) 618,000 – – 133,223 5,000 – 5,000 42,500T Jegen 2012 – 48,076 979,862 – – – – 48,076 – – – –P Winn 2012 – 33,076 670,712 – – – – 33,076 – – – –
Former Key Management Personnel7
M Luscombe 2012 1,433,369 – – – – (6,500) 1% – – – – –2011 1,641,175 122,194 2,471,985 (330,000) 1,452,300 – – 1,433,369 62,500 – 62,500 372,500
G Foran 2012 198,100 – – (2,435) 64,430 (357) 1% – – – – –2011 227,500 20,600 416,738 (50,000) 521,500 – – 198,100 11,250 – 11,250 48,750
K schmidt 2012 146,556 14,039 264,733 (18,788) 189,930 (556) 1% – – – – –2011 143,556 16,000 323,680 (13,000) 160,680 – – 146,556 3,750 – 3,750 13,500
Total 2012 3,579,357 353,639 6,858,890 (418,350) 2,862,610 (13,030) – 1,738,188 302,064 194,314 107,750 603,9412011 3,714,765 293,091 5,929,231 (593,000) 4,542,480 – – 3,414,856 167,500 – 167,500 674,750
1 Options and performance rights granted as remuneration is the total fair value of options and performance rights granted during the year determined by an independent actuary. This will be recognised in employee benefits expense over the vesting period of the grant, in accordance with Australian Accounting Standards
2 The value of options exercised/performance rights matured during the year is calculated as the market value of shares on the Australian Securities Exchange as at close of trading on the date the options were exercised/performance rights matured after deducting the price paid to exercise the options. No other options were exercised by key management personnel
3 In 2012, the amount paid per share for all options exercised during the year by the above key management personnel was $19.474 In 2011, the amount paid per share for all options exercised during the year by the above key management personnel was $16.46, with the exception of 250,000 options exercised by
M Luscombe where $25.91 was paid per share5 The number of options/performance rights which lapsed as a result of failure to meet performance hurdles. During the 52 weeks ended 26 June 2011, no options lapsed or were forfeited
relating to the key management personnel above as a result of failure to meet performance hurdles6 The number of ordinary shares under option/performance rights as at 24 June 2012/26 June 2011 is equivalent to the option/performance rights holding at that date 7 Key management personnel who ceased employment with the Company during the year. Accordingly, from this time, no further disclosure has been made. The following number of options/
performance rights were forfeited on termination: M Luscombe 230,324, G Foran 126,850 and K Schmidt 116,706
65
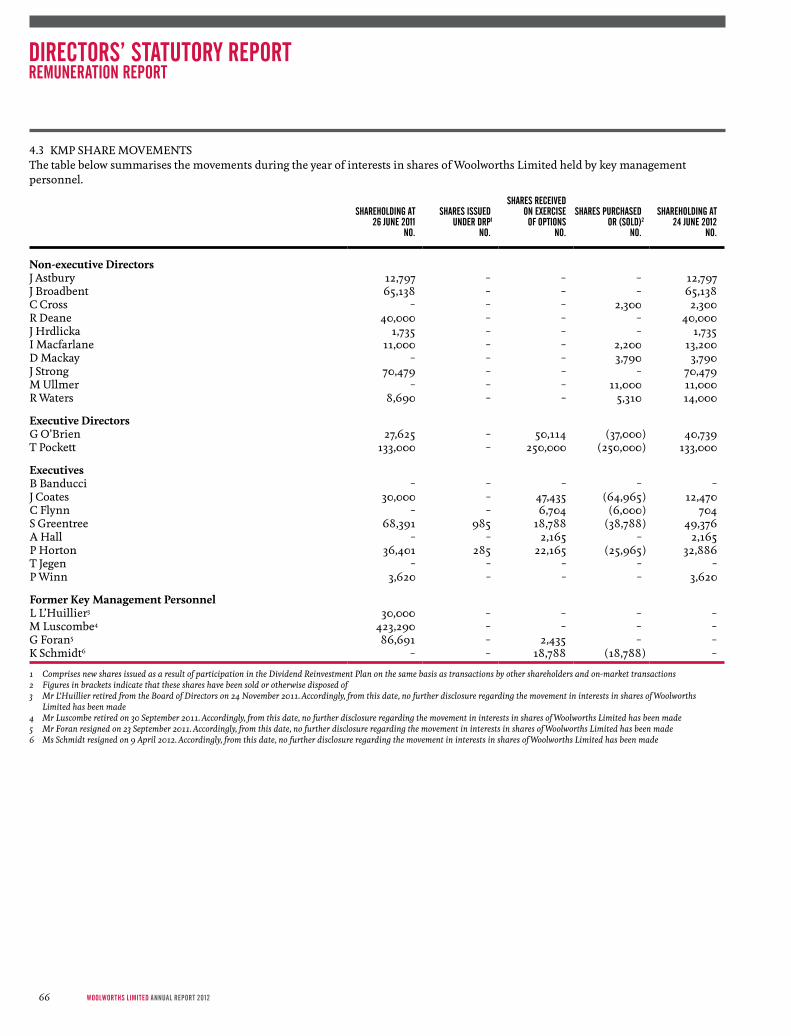
4.3 KMP sHARe MoveMeNTs The table below summarises the movements during the year of interests in shares of Woolworths Limited held by key management personnel.
shareholDing at26 JUne 2011
no.
shares issUeDUnDer Drp1
no.
shares reCeiveDon exerCiseoF options
no.
shares pUrChaseDor (solD)2
no.
shareholDing at24 JUne 2012
no.
Non-executive DirectorsJ Astbury 12,797 – – – 12,797J Broadbent 65,138 – – – 65,138C Cross – – – 2,300 2,300R Deane 40,000 – – – 40,000J Hrdlicka 1,735 – – – 1,735i Macfarlane 11,000 – – 2,200 13,200D Mackay – – – 3,790 3,790J strong 70,479 – – – 70,479M ullmer – – – 11,000 11,000R Waters 8,690 – – 5,310 14,000
Executive Directors G o’Brien 27,625 – 50,114 (37,000) 40,739T Pockett 133,000 – 250,000 (250,000) 133,000
ExecutivesB Banducci – – – – –J Coates 30,000 – 47,435 (64,965) 12,470C Flynn – – 6,704 (6,000) 704s Greentree 68,391 985 18,788 (38,788) 49,376A Hall – – 2,165 – 2,165P Horton 36,401 285 22,165 (25,965) 32,886T Jegen – – – – –P Winn 3,620 – – – 3,620
Former Key Management PersonnelL L’Huillier3 30,000 – – – –M Luscombe4 423,290 – – – –G Foran5 86,691 – 2,435 – –K schmidt6 – – 18,788 (18,788) –
1 Comprises new shares issued as a result of participation in the Dividend Reinvestment Plan on the same basis as transactions by other shareholders and on-market transactions2 Figures in brackets indicate that these shares have been sold or otherwise disposed of3 Mr L’Huillier retired from the Board of Directors on 24 November 2011. Accordingly, from this date, no further disclosure regarding the movement in interests in shares of Woolworths
Limited has been made4 Mr Luscombe retired on 30 September 2011. Accordingly, from this date, no further disclosure regarding the movement in interests in shares of Woolworths Limited has been made5 Mr Foran resigned on 23 September 2011. Accordingly, from this date, no further disclosure regarding the movement in interests in shares of Woolworths Limited has been made6 Ms Schmidt resigned on 9 April 2012. Accordingly, from this date, no further disclosure regarding the movement in interests in shares of Woolworths Limited has been made
DIRECTORS’ STATUTORY REPORTREMUNERATION REPORT
WoolWorths limited AnnuAl report 201266
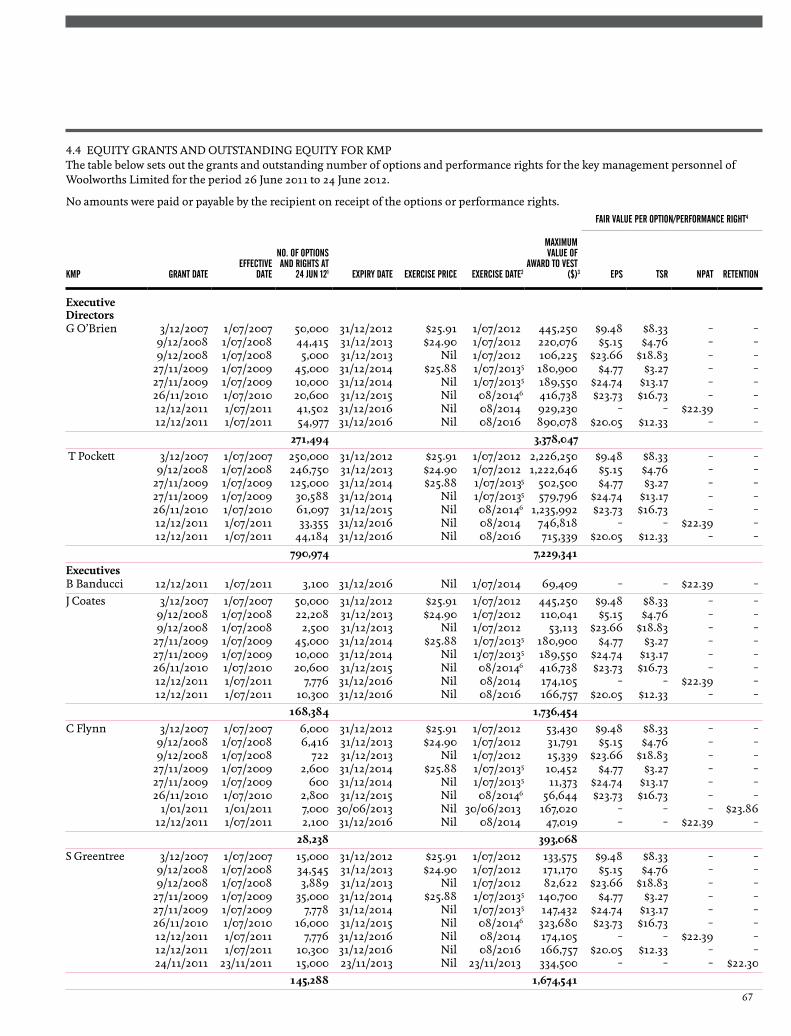
4.4 equiTY GRANTs AND ouTsTANDiNG equiTY FoR KMPThe table below sets out the grants and outstanding number of options and performance rights for the key management personnel of Woolworths Limited for the period 26 June 2011 to 24 June 2012.
No amounts were paid or payable by the recipient on receipt of the options or performance rights.Fair valUe per option/perFormanCe right4
kmp grant DateeFFeCtive
Date
no. oF optionsanD rights at
24 JUn 121 expiry Date exerCise priCe exerCise Date2
maximUmvalUe oF
awarD to vest($)3 eps tsr npat retention
Executive DirectorsG o’Brien 3/12/2007 1/07/2007 50,000 31/12/2012 $25.91 1/07/2012 445,250 $9.48 $8.33 – –
9/12/2008 1/07/2008 44,415 31/12/2013 $24.90 1/07/2012 220,076 $5.15 $4.76 – –9/12/2008 1/07/2008 5,000 31/12/2013 Nil 1/07/2012 106,225 $23.66 $18.83 – –
27/11/2009 1/07/2009 45,000 31/12/2014 $25.88 1/07/20135 180,900 $4.77 $3.27 – –27/11/2009 1/07/2009 10,000 31/12/2014 Nil 1/07/20135 189,550 $24.74 $13.17 – –26/11/2010 1/07/2010 20,600 31/12/2015 Nil 08/20146 416,738 $23.73 $16.73 – –12/12/2011 1/07/2011 41,502 31/12/2016 Nil 08/2014 929,230 – – $22.39 –12/12/2011 1/07/2011 54,977 31/12/2016 Nil 08/2016 890,078 $20.05 $12.33 – –
271,494 3,378,047 T Pockett 3/12/2007 1/07/2007 250,000 31/12/2012 $25.91 1/07/2012 2,226,250 $9.48 $8.33 – –
9/12/2008 1/07/2008 246,750 31/12/2013 $24.90 1/07/2012 1,222,646 $5.15 $4.76 – –27/11/2009 1/07/2009 125,000 31/12/2014 $25.88 1/07/20135 502,500 $4.77 $3.27 – –27/11/2009 1/07/2009 30,588 31/12/2014 Nil 1/07/20135 579,796 $24.74 $13.17 – –26/11/2010 1/07/2010 61,097 31/12/2015 Nil 08/20146 1,235,992 $23.73 $16.73 – –12/12/2011 1/07/2011 33,355 31/12/2016 Nil 08/2014 746,818 – – $22.39 –12/12/2011 1/07/2011 44,184 31/12/2016 Nil 08/2016 715,339 $20.05 $12.33 – –
790,974 7,229,341ExecutivesB Banducci 12/12/2011 1/07/2011 3,100 31/12/2016 Nil 1/07/2014 69,409 – – $22.39 –J Coates 3/12/2007 1/07/2007 50,000 31/12/2012 $25.91 1/07/2012 445,250 $9.48 $8.33 – –
9/12/2008 1/07/2008 22,208 31/12/2013 $24.90 1/07/2012 110,041 $5.15 $4.76 – –9/12/2008 1/07/2008 2,500 31/12/2013 Nil 1/07/2012 53,113 $23.66 $18.83 – –
27/11/2009 1/07/2009 45,000 31/12/2014 $25.88 1/07/20135 180,900 $4.77 $3.27 – –27/11/2009 1/07/2009 10,000 31/12/2014 Nil 1/07/20135 189,550 $24.74 $13.17 – –26/11/2010 1/07/2010 20,600 31/12/2015 Nil 08/20146 416,738 $23.73 $16.73 – –12/12/2011 1/07/2011 7,776 31/12/2016 Nil 08/2014 174,105 – – $22.39 –12/12/2011 1/07/2011 10,300 31/12/2016 Nil 08/2016 166,757 $20.05 $12.33 – –
168,384 1,736,454C Flynn 3/12/2007 1/07/2007 6,000 31/12/2012 $25.91 1/07/2012 53,430 $9.48 $8.33 – –
9/12/2008 1/07/2008 6,416 31/12/2013 $24.90 1/07/2012 31,791 $5.15 $4.76 – –9/12/2008 1/07/2008 722 31/12/2013 Nil 1/07/2012 15,339 $23.66 $18.83 – –
27/11/2009 1/07/2009 2,600 31/12/2014 $25.88 1/07/20135 10,452 $4.77 $3.27 – –27/11/2009 1/07/2009 600 31/12/2014 Nil 1/07/20135 11,373 $24.74 $13.17 – –26/11/2010 1/07/2010 2,800 31/12/2015 Nil 08/20146 56,644 $23.73 $16.73 – –
1/01/2011 1/01/2011 7,000 30/06/2013 Nil 30/06/2013 167,020 – – – $23.8612/12/2011 1/07/2011 2,100 31/12/2016 Nil 08/2014 47,019 – – $22.39 –
28,238 393,068s Greentree 3/12/2007 1/07/2007 15,000 31/12/2012 $25.91 1/07/2012 133,575 $9.48 $8.33 – –
9/12/2008 1/07/2008 34,545 31/12/2013 $24.90 1/07/2012 171,170 $5.15 $4.76 – –9/12/2008 1/07/2008 3,889 31/12/2013 Nil 1/07/2012 82,622 $23.66 $18.83 – –
27/11/2009 1/07/2009 35,000 31/12/2014 $25.88 1/07/20135 140,700 $4.77 $3.27 – –27/11/2009 1/07/2009 7,778 31/12/2014 Nil 1/07/20135 147,432 $24.74 $13.17 – –26/11/2010 1/07/2010 16,000 31/12/2015 Nil 08/20146 323,680 $23.73 $16.73 – –12/12/2011 1/07/2011 7,776 31/12/2016 Nil 08/2014 174,105 – – $22.39 –12/12/2011 1/07/2011 10,300 31/12/2016 Nil 08/2016 166,757 $20.05 $12.33 – –24/11/2011 23/11/2011 15,000 23/11/2013 Nil 23/11/2013 334,500 – – – $22.30
145,288 1,674,54167
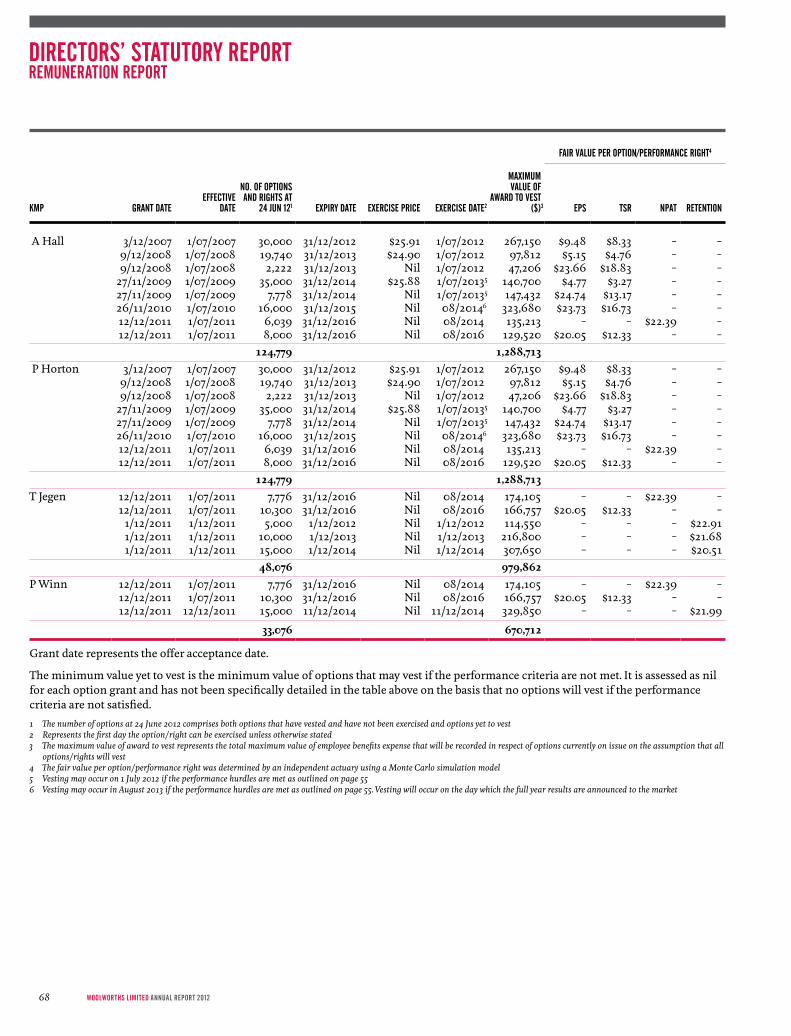
Fair valUe per option/perFormanCe right4
kmp grant DateeFFeCtive
Date
no. oF optionsanD rights at
24 JUn 121 expiry Date exerCise priCe exerCise Date2
maximUmvalUe oF
awarD to vest($)3 eps tsr npat retention
A Hall 3/12/2007 1/07/2007 30,000 31/12/2012 $25.91 1/07/2012 267,150 $9.48 $8.33 – –9/12/2008 1/07/2008 19,740 31/12/2013 $24.90 1/07/2012 97,812 $5.15 $4.76 – –9/12/2008 1/07/2008 2,222 31/12/2013 Nil 1/07/2012 47,206 $23.66 $18.83 – –
27/11/2009 1/07/2009 35,000 31/12/2014 $25.88 1/07/20135 140,700 $4.77 $3.27 – –27/11/2009 1/07/2009 7,778 31/12/2014 Nil 1/07/20135 147,432 $24.74 $13.17 – –26/11/2010 1/07/2010 16,000 31/12/2015 Nil 08/20146 323,680 $23.73 $16.73 – –12/12/2011 1/07/2011 6,039 31/12/2016 Nil 08/2014 135,213 – – $22.39 –12/12/2011 1/07/2011 8,000 31/12/2016 Nil 08/2016 129,520 $20.05 $12.33 – –
124,779 1,288,713 P Horton 3/12/2007 1/07/2007 30,000 31/12/2012 $25.91 1/07/2012 267,150 $9.48 $8.33 – –
9/12/2008 1/07/2008 19,740 31/12/2013 $24.90 1/07/2012 97,812 $5.15 $4.76 – –9/12/2008 1/07/2008 2,222 31/12/2013 Nil 1/07/2012 47,206 $23.66 $18.83 – –
27/11/2009 1/07/2009 35,000 31/12/2014 $25.88 1/07/20135 140,700 $4.77 $3.27 – –27/11/2009 1/07/2009 7,778 31/12/2014 Nil 1/07/20135 147,432 $24.74 $13.17 – –26/11/2010 1/07/2010 16,000 31/12/2015 Nil 08/20146 323,680 $23.73 $16.73 – –12/12/2011 1/07/2011 6,039 31/12/2016 Nil 08/2014 135,213 – – $22.39 –12/12/2011 1/07/2011 8,000 31/12/2016 Nil 08/2016 129,520 $20.05 $12.33 – –
124,779 1,288,713T Jegen 12/12/2011 1/07/2011 7,776 31/12/2016 Nil 08/2014 174,105 – – $22.39 –
12/12/2011 1/07/2011 10,300 31/12/2016 Nil 08/2016 166,757 $20.05 $12.33 – –1/12/2011 1/12/2011 5,000 1/12/2012 Nil 1/12/2012 114,550 – – – $22.911/12/2011 1/12/2011 10,000 1/12/2013 Nil 1/12/2013 216,800 – – – $21.681/12/2011 1/12/2011 15,000 1/12/2014 Nil 1/12/2014 307,650 – – – $20.51
48,076 979,862P Winn 12/12/2011 1/07/2011 7,776 31/12/2016 Nil 08/2014 174,105 – – $22.39 –
12/12/2011 1/07/2011 10,300 31/12/2016 Nil 08/2016 166,757 $20.05 $12.33 – –12/12/2011 12/12/2011 15,000 11/12/2014 Nil 11/12/2014 329,850 – – – $21.99
33,076 670,712
Grant date represents the offer acceptance date.
The minimum value yet to vest is the minimum value of options that may vest if the performance criteria are not met. it is assessed as nil for each option grant and has not been specifically detailed in the table above on the basis that no options will vest if the performance criteria are not satisfied.
1 The number of options at 24 June 2012 comprises both options that have vested and have not been exercised and options yet to vest2 Represents the first day the option/right can be exercised unless otherwise stated3 The maximum value of award to vest represents the total maximum value of employee benefits expense that will be recorded in respect of options currently on issue on the assumption that all
options/rights will vest4 The fair value per option/performance right was determined by an independent actuary using a Monte Carlo simulation model5 Vesting may occur on 1 July 2012 if the performance hurdles are met as outlined on page 556 Vesting may occur in August 2013 if the performance hurdles are met as outlined on page 55. Vesting will occur on the day which the full year results are announced to the market
DIRECTORS’ STATUTORY REPORTREMUNERATION REPORT
WoolWorths limited AnnuAl report 201268
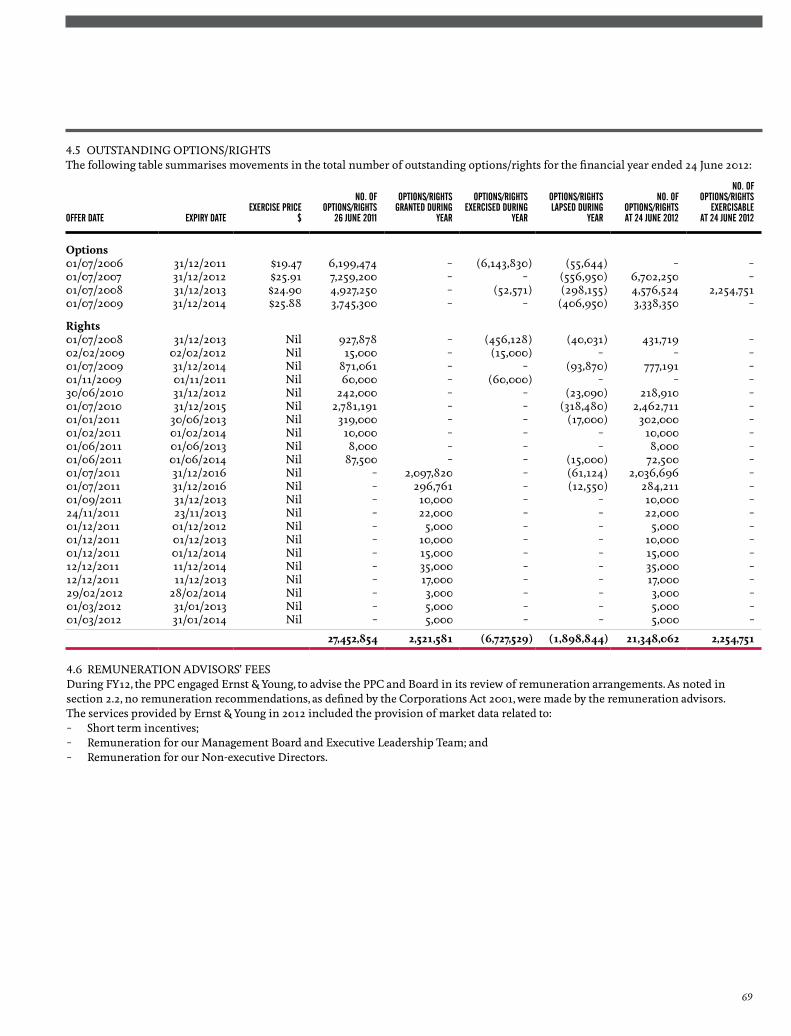
4.5 ouTsTANDiNG oPTioNs/RiGHTs The following table summarises movements in the total number of outstanding options/rights for the financial year ended 24 June 2012:
oFFer Date expiry DateexerCise priCe
$
no. oFoptions/rights
26 JUne 2011
options/rightsgranteD DUring
year
options/rightsexerCiseD DUring
year
options/rightslapseD DUring
year
no. oF options/rightsat 24 JUne 2012
no. oF options/rights
exerCisableat 24 JUne 2012
Options01/07/2006 31/12/2011 $19.47 6,199,474 – (6,143,830) (55,644) – –01/07/2007 31/12/2012 $25.91 7,259,200 – – (556,950) 6,702,250 –01/07/2008 31/12/2013 $24.90 4,927,250 – (52,571) (298,155) 4,576,524 2,254,75101/07/2009 31/12/2014 $25.88 3,745,300 – – (406,950) 3,338,350 –
Rights01/07/2008 31/12/2013 Nil 927,878 – (456,128) (40,031) 431,719 –02/02/2009 02/02/2012 Nil 15,000 – (15,000) – – –01/07/2009 31/12/2014 Nil 871,061 – – (93,870) 777,191 –01/11/2009 01/11/2011 Nil 60,000 – (60,000) – – –30/06/2010 31/12/2012 Nil 242,000 – – (23,090) 218,910 –01/07/2010 31/12/2015 Nil 2,781,191 – – (318,480) 2,462,711 –01/01/2011 30/06/2013 Nil 319,000 – – (17,000) 302,000 –01/02/2011 01/02/2014 Nil 10,000 – – – 10,000 –01/06/2011 01/06/2013 Nil 8,000 – – – 8,000 –01/06/2011 01/06/2014 Nil 87,500 – – (15,000) 72,500 –01/07/2011 31/12/2016 Nil – 2,097,820 – (61,124) 2,036,696 –01/07/2011 31/12/2016 Nil – 296,761 – (12,550) 284,211 –01/09/2011 31/12/2013 Nil – 10,000 – – 10,000 –24/11/2011 23/11/2013 Nil – 22,000 – – 22,000 –01/12/2011 01/12/2012 Nil – 5,000 – – 5,000 –01/12/2011 01/12/2013 Nil – 10,000 – – 10,000 –01/12/2011 01/12/2014 Nil – 15,000 – – 15,000 –12/12/2011 11/12/2014 Nil – 35,000 – – 35,000 –12/12/2011 11/12/2013 Nil – 17,000 – – 17,000 –29/02/2012 28/02/2014 Nil – 3,000 – – 3,000 –01/03/2012 31/01/2013 Nil – 5,000 – – 5,000 –01/03/2012 31/01/2014 Nil – 5,000 – – 5,000 –
27,452,854 2,521,581 (6,727,529) (1,898,844) 21,348,062 2,254,751
4.6 ReMuNeRATioN ADvisoRs’ FeesDuring FY12, the PPC engaged ernst & Young, to advise the PPC and Board in its review of remuneration arrangements. As noted in section 2.2, no remuneration recommendations, as defined by the Corporations Act 2001, were made by the remuneration advisors. The services provided by ernst & Young in 2012 included the provision of market data related to: – short term incentives; – Remuneration for our Management Board and executive Leadership Team; and – Remuneration for our Non-executive Directors.
69
ENVIRONMENTAL REGULATIONexcept as set out below, the operations of the Group are not subject to any particular and significant environmental regulation under a law of the Commonwealth of Australia or of any of its states or territories.
The Group is subject to, and has complied with, the reporting requirements of the National Greenhouse and energy Reporting Act 2007 and the energy efficiency opportunities Act 2007.
The Group is not a liable entity under the Clean energy Act 2011, however the impact of pass through costs from upstream and downstream services is being closely monitored.
The Woolworths Petrol operations are subject to regulations and standards governing the construction and operation of the facilities relating to the storage and dispensing of petroleum products.
The Group may also from time to time be subject to various state and local government food licensing requirements and environmental and town planning regulations incidental to the development of shopping centre sites.
The Group has not incurred any significant liabilities under any environmental legislation.
DIRECTORS’ AND OFFICERS’ INDEMNITY/INSURANCE(i) The Constitution of the Company provides that the Company
may indemnify (to the maximum extent permitted by law) in favour of each Director of the Company, the Company secretary, directors and secretaries of related bodies corporate of the Company, and previous directors and secretaries of the Company and its related bodies corporate (“officers”), against any liability to third parties (other than related Woolworths Group companies) incurred by such officers unless the liability arises out of conduct involving a lack of good faith. The indemnity includes costs or expenses incurred by an officer in successfully defending proceedings or in connection with an application in which the Court grants relief to the specified persons under the Corporations Act 2001;
(ii) each Director has entered into a Deed of indemnity and Access which provides for indemnity against liability as a Director, except to the extent of indemnity under an insurance policy or where prohibited by statute. The Deed also entitles the Director to access Company documents and records, subject to undertakings as to confidentiality; and
(iii) During or since the end of the financial period, the Company has paid or agreed to pay a premium in respect of a contract of insurance insuring officers (and any persons who are officers in the future and employees of the Company or its subsidiaries) against certain liabilities incurred in that capacity. Disclosure of the total amount of the premiums and the nature of the liabilities in respect of such insurance is prohibited by the contract of insurance.
AUDITOR’S INDEPENDENCE DECLARATIONThe auditor’s independence declaration is included on page 71 of the annual report.
NON-AUDIT SERVICESDuring the year, Deloitte Touche Tohmatsu, the Company’s auditors, have performed certain other services in addition to their statutory duties. The Board is satisfied that the provision of those non-audit services during the year provided by the auditor is compatible with, and did not compromise, the auditor independence requirements of the Corporations Act 2001 or as set out in Code of Conduct APES 110 Code of Ethics for Professional Accountants issued by the Accounting Professional & ethical standards Board, as they did not involve reviewing or auditing the auditor’s own work, acting in a management or decision making capacity for the Company, acting as an advocate for the Company or jointly sharing risks or rewards.
Details of amounts paid or payable to the auditor for non-audit services provided during the year by the auditor are outlined in Note 4 to the financial statements.
ROUNDING OF AMOUNTSThe Company is of a kind referred to in Australian securities and investments Commission Class order 98/100 dated 10 July 1998 pursuant to section 341(1) of the Corporations Act 2001 relating to the ‘rounding off’ of amounts in the Financial Report and Directors’ Report. in accordance with that Class order, amounts therein have been rounded off to the nearest tenth of a million dollars except where otherwise indicated.
This Report is made out in accordance with a Resolution of the Directors of the Company on 24 september 2012.
James Strong Grant O’Brien Chairman Managing Director and Ceo
DireCtors’ statUtory report
WoolWorths limited AnnuAl report 201270
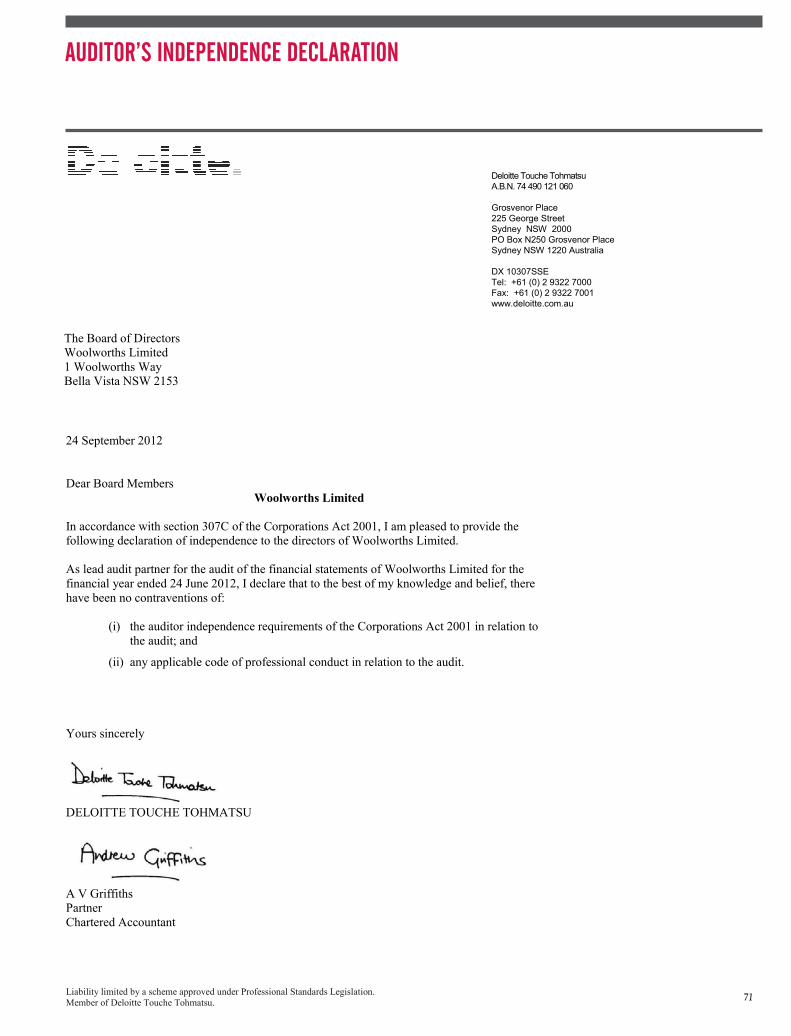
aUDitor’s inDepenDenCe DeClaration
71
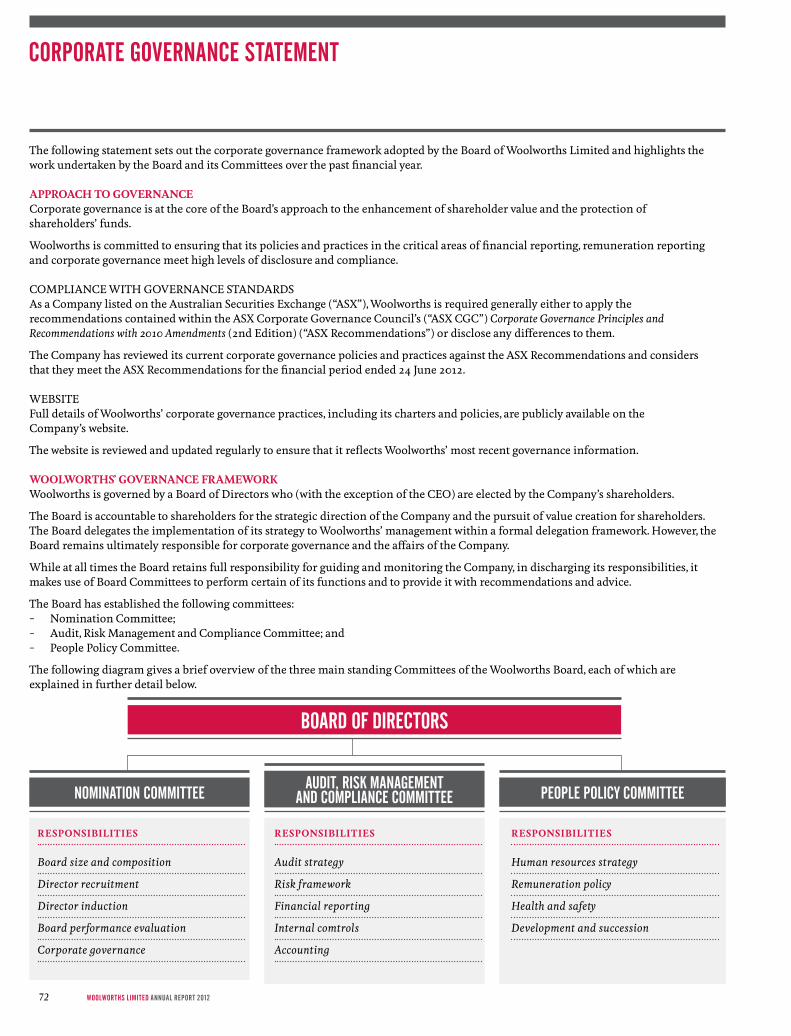
The following statement sets out the corporate governance framework adopted by the Board of Woolworths Limited and highlights the work undertaken by the Board and its Committees over the past financial year.
APPROACH TO GOVERNANCECorporate governance is at the core of the Board’s approach to the enhancement of shareholder value and the protection of shareholders’ funds.
Woolworths is committed to ensuring that its policies and practices in the critical areas of financial reporting, remuneration reporting and corporate governance meet high levels of disclosure and compliance.
CoMPLiANCe WiTH GoveRNANCe sTANDARDsAs a Company listed on the Australian securities exchange (“Asx”), Woolworths is required generally either to apply the recommendations contained within the Asx Corporate Governance Council’s (“Asx CGC”) Corporate Governance Principles and Recommendations with 2010 Amendments (2nd edition) (“Asx Recommendations”) or disclose any differences to them.
The Company has reviewed its current corporate governance policies and practices against the Asx Recommendations and considers that they meet the Asx Recommendations for the financial period ended 24 June 2012.
WeBsiTeFull details of Woolworths’ corporate governance practices, including its charters and policies, are publicly available on the Company’s website.
The website is reviewed and updated regularly to ensure that it reflects Woolworths’ most recent governance information.
WOOLWORTHS’ GOVERNANCE FRAMEWORKWoolworths is governed by a Board of Directors who (with the exception of the Ceo) are elected by the Company’s shareholders.
The Board is accountable to shareholders for the strategic direction of the Company and the pursuit of value creation for shareholders. The Board delegates the implementation of its strategy to Woolworths’ management within a formal delegation framework. However, the Board remains ultimately responsible for corporate governance and the affairs of the Company.
While at all times the Board retains full responsibility for guiding and monitoring the Company, in discharging its responsibilities, it makes use of Board Committees to perform certain of its functions and to provide it with recommendations and advice.
The Board has established the following committees: – Nomination Committee; – Audit, Risk Management and Compliance Committee; and – People Policy Committee.
The following diagram gives a brief overview of the three main standing Committees of the Woolworths Board, each of which are explained in further detail below.
RESPONSIBILITIES
Board size and composition
Director recruitment
Director induction
Board performance evaluation
Corporate governance
RESPONSIBILITIES
Audit strategy
Risk framework
Financial reporting
Internal comtrols
Accounting
RESPONSIBILITIES
Human resources strategy
Remuneration policy
Health and safety
Development and succession
nomination CommitteeaUDit, risk management
anD ComplianCe Committee people poliCy Committee
boarD oF DireCtors
Corporate governanCe statement
WoolWorths limited AnnuAl report 201272

CHAIRMAN AND COMPOSITION OF BOARD COMMITTEESThe Chairman is elected by and from the Non-executive Directors, each of whom is appointed to the Nomination Committee. information on the Company’s Chairman is set out on page 34.
The Non-executive Directors are also appointed to at least one of the Audit, Risk Management and Compliance Committee, or the People Policy Committee.
The Nomination Committee, the Audit, Risk Management and Compliance Committee and the People Policy Committee all have comprehensive Charters defining their roles and responsibilities (as summarised in this Report). These Charters are available on the Company’s website.
THE ROLE OF THE BOARDThe Board’s role is to represent and serve the interests of shareholders by overseeing and appraising the Company’s strategies, policies and performance. The Board’s principal objective is to maintain and increase shareholder value while ensuring that Woolworths’ overall activities are properly managed.
The Board has adopted a Board Charter which sets out how its role, powers and responsibilities are exercised, having regard to principles of good corporate governance, international best practice and applicable laws.
The names, qualifications and details of each Director along with details of the period of office of each Director are included on pages 34 to 36 of this report and the Director’s attendance at Board and Committee meetings are included on page 41.
ResPoNsiBiLiTies AND oBJeCTives The roles, powers and responsibilities of the Board are formalised in the Board Charter, which defines the matters that are reserved for the Board and its Committees, and those that are the responsibility of the Chief executive officer (“Ceo”) and management.
As set out in the Board Charter, the Board is responsible for:
overseeing governanCe risk anD reporting
Strategy – reviewing strategic direction and approving corporate strategic initiatives developed by management;
Major expenditure and capital initiatives – approving major capital expenditure, acquisitions and divestitures, and monitoring capital management;
Leadership selection – selecting and evaluating the performance of the Ceo, and selecting the Finance Director and Company secretary; and
Succession and remuneration planning – planning for Board, Ceo and executive succession and remuneration, and setting Non-executive Director remuneration within shareholder approved limits.
Corporate governance – reviewing and monitoring the Company’s corporate governance policies and practices;
Board performance and composition – evaluating the performance of the Board and determining its size and composition; and
Social responsibility – considering the social, ethical and environmental impact of Woolworths’ activities and operations and setting standards and monitoring compliance with the Company’s social responsibility policies and practices.
Financial performance – reviewing Woolworths’ budget, monitoring management and financial performance;
Financial reporting – considering and approving Woolworths’ half-yearly and annual financial statements, and monitoring and reviewing management processes aimed at ensuring the integrity of financial and other reporting;
Risk management – oversight of the effectiveness of risk management and compliance in the organisation, including safety and health governance arrangements; and
External auditor – selecting and recommending to shareholders the appointment of the external auditor.
73

THE ROLE OF THE BOARD CONTINUED
THe RoLe oF THe Ceo AND MANAGeMeNTPursuant to formal delegations of authority, the Board has delegated the management function to the Ceo. However, ultimate responsibility for strategy and control rests with the Directors.
The Board approves corporate objectives for the Ceo to satisfy and, jointly with the Ceo, develops the duties and responsibilities of the Ceo.
The Ceo is accountable to the Board for the exercise of the delegated authority and, with the support of senior management, must report to the Board on the exercise of the authority through reports, briefings and presentations to the Board.
ResPoNsiBiLiTies AND oBJeCTives The day-to-day management and operations of the Company are the responsibility of the Ceo who reports to the Board on key management and operational issues, including: – developing and implementing corporate strategies and making
recommendations to the Board on significant corporate strategic initiatives;
– appointing and determining the terms of appointment of senior management, developing and maintaining succession plans, and evaluating the performance of key executives;
– developing Woolworths’ annual budget and managing day-to-day operations within the budget (approved by the Board);
– maintaining effective risk management and compliance management frameworks;
– keeping the Board and market fully informed about material continuous disclosure; and
– managing day-to-day operations in accordance with standards for social, ethical and environmental practices.
RevieW oF Ceo AND MANAGeMeNT PeRFoRMANCeThe importance of a clear relationship between management performance and the assessment of remuneration is reflected in our approach to evaluating management performance.
The following process for senior management performance evaluation was undertaken during the reporting period: – the performance evaluation of the Ceo was undertaken by
the Chairman, in consultation with the Board; and – the performance evaluation of other key executives was
undertaken by the Ceo, with the People Policy Committee’s oversight of their objectives and performance assessments.
COMPOSITION AND MEMBERSHIP OF THE BOARD OF DIRECTORSThe Board has adopted a policy of ensuring that it is composed of a majority of independent Non-executive Directors who, with the executive Directors, comprise an appropriate mix of skills to provide the necessary breadth and depth of knowledge and experience to meet the Board’s responsibilities and objectives. The procedure for the selection and appointment of new directors and re-election of incumbent directors, and the Board’s policy for the nomination and appointment of directors, is available on the Company’s website, in the Nomination Committee Charter.
The Nomination Committee, when assisting the Board in reviewing potential candidates for Board appointment and assessing retiring directors standing for re-election, considers a number of factors including: – skills, experience, expertise and personal qualities and
attributes that will best complement the skill set and characteristics of existing directors and enhance Board effectiveness;
– the diversity of Board composition; – the capability of the candidate to devote the necessary time and
commitment to the role; and – potential conflicts of interest, and independence.
sKiLLs, exPeRieNCe AND ATTRiBuTesThe Board recognises that having a range of different skills, backgrounds and experience represented amongst its Directors is important to ensuring robust decision-making processes with a diversity of viewpoints and the effective governance of the Group. The range of skills, backgrounds and experience currently represented on the Board includes experience in senior roles in retail, property, banking and finance, transport, food manufacturing, primary production, construction, management consultancy and telecommunications, as well as qualifications across a range of fields including business management, economics, accounting and the humanities.
The Nomination Committee is responsible for making recommendations to the Board on the most appropriate Board size and composition. This responsibility includes making recommendations on the desirable competencies, experience and attributes of Board members and strategies to address Board diversity.
Directors of Woolworths are required to act at all times with honesty and integrity and must observe the highest standards of ethical behaviour. The Directors must also ensure that no decision or action is taken that has the effect of prioritising their personal interests over the Company’s interests. They must also demonstrate a commitment to the decision making processes of the Board by being prepared to question and critique matters brought to the Board for consideration.
Corporate governanCe statement
WoolWorths limited AnnuAl report 201274

DiReCToR TeNuRe, eLeCTioN AND APPoiNTMeNTThere is no specified term of office for Non-executive Directors.
At each Annual General Meeting (“AGM”) of the Company there must be an election of Directors. Any Non-executive Director and any executive Director other than the Managing Director/Chief executive officer who would otherwise hold office without re-election beyond the third AGM since their appointment or last election, or for at least three years, whichever is the longer, must retire. Any Non-executive Director and any executive Director other than the Managing Director/Chief executive officer who has been appointed during the year must stand for election at the next AGM.
eligible Directors who retire as required may offer themselves for re-election by shareholders at the AGM. Directors offering themselves for election or re-election are invited to make a short presentation to shareholders at the AGM in support of their candidacy for election or re-election.
iNDePeNDeNCe oF DiReCToRsin order for a Director to be considered independent, the Board needs to have determined that the Director does not have a material relationship with the Company, other than solely as a consequence of being a Director.
what is a “material relationship”?a “material relationship” inClUDes a DireCt or inDireCt interest or relationship that CoUlD reasonably be ConsiDereD to inFlUenCe in a material way the DireCtor’s DeCisions in relation to the Company. when ConsiDering whether a relationship is “material”, the boarD will ConsiDer the materiality to eaCh oF the Company, the DireCtor anD the person or organisation with whiCh the DireCtor is relateD (as CUstomer, sUpplier or aDviser). the boarD has not set materiality thresholDs, ConsiDering it more eFFeCtive to assess relationships on the inDiviDUal CirCUmstanCes appliCable on a Case-by-Case basis, anD where appropriate with the assistanCe oF external aDviCe.
The Board only considers Directors to be independent where they are independent of management and free of any business or other relationship that could materially interfere with, or could reasonably be perceived to materially interfere with, the exercise of their unfettered and independent judgment.
Any Director who considers that he/she has or may have a conflict of interest or a material personal interest in any matter concerning the Company is required to give the Board immediate notice of such interest.
The Board regularly reviews the independence of each Non-executive Director in light of the relevant information disclosed to the Board.
With the exception of the Ceo and the Finance Director, all of the Directors are Non-executive Directors and each is considered to be independent.
The Non-executive Directors of the Board will periodically meet without the executive Directors or management being present.
DiReCToRs’ iNDePeNDeNT ADviCe The Directors, the Board and the Board Committees are empowered to seek external professional advice, as considered necessary, at the Company’s expense, subject to prior consultation with the Chairman. if appropriate, any advice so received will be made available to all Directors.
PeRFoRMANCe evALuATioNThe Chairman is responsible for monitoring the contribution of individual Directors and counselling them on any areas which might help improve Board performance. The Chairman, as Chairman of the Nomination Committee, is also responsible for the process for evaluating the performance of the Directors, Board Committees and the Board as a whole. The Board engages external assistance, as appropriate, in reviewing the performance of the Board.
During the reporting period, the Chairman conducted reviews of the Board as a whole, its Committees and its individual Directors. The reviews included one on one discussions between the Chairman and each Director, where the performance of each individual Director was discussed along with the Chairman’s performance.
iNDuCTioN AND DiReCToR DeveLoPMeNTNew Directors receive a letter of appointment which sets out the Company’s expectations of the role, their duties, the terms and conditions of their appointment and their remuneration. The Appointment Letter is consistent with the Asx Recommendations and forms the initial part of the program of induction for Directors.
Directors are also expected to participate in all induction and orientation programs and continuing education, training or development programs arranged for them by the Company secretary. The Company secretary oversees and reviews the Director induction process in order to ensure that it remains effective and up-to-date.
The company secretarial function supports Directors by providing: – access to information in appropriate form, currency and
quality, including procedures to cover additional requests of management;
– continuing education to update and enhance their knowledge as the business environment changes; and
– access to independent professional advice, where requested.
CoMPANY seCReTARYThe Board has appointed Mr P Horton as Company secretary. All Directors have access to the services and advice of the Company secretary. Details of the skills, experience and expertise of the Company secretary are set out on page 38 of this Report.
The Company secretary is responsible for coordination of all Board business, including agendas, Board papers, minutes, communication with regulatory bodies and Asx, and all statutory and other filings.
75

NOMINATION COMMITTEEThe Nomination Committee provides advice and support to the Board in relation to Board composition, governance and performance evaluation.
MeMBeRsHiP AND CHARTeRThe Nomination Committee consists of all of the Non-executive Directors.
The Nomination Committee Charter is available on the Company’s website.
ResPoNsiBiLiTiesThe Nomination Committee has the following responsibilities:
1 reviewing and making recommendations to the Board on the size and composition of the Board, including:
– assessment of necessary and desirable competencies, experience and attributes of Board members;
– strategies to address Board diversity; and
– Board succession plans and the succession of the Chairman of the Board;
2 membership of the Board, including recommendations for the appointment and re-election of Directors, and where necessary propose candidates for consideration by the Board (including in respect of executive Directors); and
3 assisting the Board and the Chairman of the Board as required in evaluating the performance of the Board, its Committees and individual Directors against appropriate measures.
Nomination Committee members are not involved in making recommendations to the Board in respect of themselves.
The Nomination Committee also has responsibility for: – assisting the Board in developing and implementing plans for
identifying, assessing and enhancing Director competencies; – ensuring that an effective induction process is in place and
regularly reviewing its effectiveness; – reviewing the time expected to be devoted by Non-executive
Directors in relation to the Company’s affairs; – making recommendations to the Board on corporate
governance issues as requested by the Board from time to time; and
– reviewing the Board Charter on a periodic basis, and recommending for Board consideration any amendments it considers are necessary.
AUDIT, RISK MANAGEMENT AND COMPLIANCE COMMITTEE The Audit, Risk Management and Compliance Committee provides advice and assistance to the Board in fulfilling the Board’s responsibilities relating to the Group’s internal and external audit functions, risk management and compliance systems and practice, financial statements and market reporting systems, internal accounting and control systems and such other matters as the Board may request from time to time.
The Committee also provides advice and assistance to the Board on the compliance framework, based on Australian standard 3806/2006, and its effectiveness, including legal and regulatory compliance, health and safety, privacy, environment, trade practices and fair trading, and employment obligations. Woolworths has specific policies and processes for addressing these and other compliance areas and the Committee receives and reviews regular management reports in each of these areas.
MeMBeRsHiP AND CHARTeRThe Audit, Risk Management and Compliance Committee must have at least three members and be comprised solely of Non-executive Directors, the majority of whom must be independent. The Chair of the Committee must be an independent Non-executive Director who is not the Chairman of the Board.
All members of the Committee must have appropriate business expertise and be financially literate. At least one member should have relevant financial qualifications and experience, as determined by the Board.
The Audit, Risk Management and Compliance Committee of Directors is currently comprised of Messrs J F Astbury (Chair until February 2012), J A strong and i J Macfarlane, Ms J R Broadbent and Mr M ullmer (joined the Committee in January 2012 and became Chair in March 2012). Mr L M L’Huillier was a member of the Committee until his retirement from the Board in November 2011. The attendance of members at meetings of the Committee is set out on page 41 of the Directors’ Report. The Committee met six times during the financial year.
The Committee has a formal Charter which is available on the Company’s website. The Committee’s Charter was reviewed during the year.
ResPoNsiBiLiTiesThe responsibilities of the Committee extend across the Company’s global operations and include: – External Audit: The Committee oversees the effectiveness
of processes in place for the appointment, performance and independence of external audit services. This is discussed further below.
– Internal Controls: The Committee examines the adequacy of the nature, extent and effectiveness of the internal audit control processes of the Group.
– Risk Management: The Committee assists the Board in overseeing and reviewing the risk management framework and the effectiveness of risk management for the Group.
Corporate governanCe statement
WoolWorths limited AnnuAl report 201276
Management is responsible for identifying, managing and reporting on risk.
– Risk Event “Consideration”: The Committee oversees the appropriate investigation and management reporting of significant risk events and incidents.
– Compliance: The Committee assists the Board in fulfilling its compliance responsibilities and oversees and reviews the Group compliance framework and its effectiveness. The Committee also assists management to foster and support a compliance culture based on appropriate benchmarks.
– Financial Reports: The Committee oversees the Group’s financial reporting processes and reports on the results of its activities to the Board. specifically, the Committee reviews with management and the external auditor the Group’s annual and half-year financial statements and reports to shareholders.
– Accounting Standards and Quality: The Committee oversees the adequacy and effectiveness of the Group’s accounting and financial policies and controls and risk management systems and seeks assurance of compliance with relevant regulatory and statutory requirements.
The Committee processes are designed to establish a proactive framework and dialogue in which the Committee, management and external and internal auditors review and assess the risk framework.
risk in FinanCial reportingin reviewing (anD reCommenDing For approval by the boarD) the Company’s halF-year anD annUal FinanCial statements, annUal report anD asx appenDix 4e/D (annUal/halF-year) statUtory Filings with sUpporting DoCUments anD aCCompanying notes, the Committee has regarD to: – the qUality oF earnings, liqUiDity anD transparenCy anD
aCCUraCy oF reporting;– CritiCal aCCoUnting poliCies applieD anD the impliCations
oF any Changes in sUCh poliCies; ComplianCe with relevant regUlatory anD statUtory reqUirements;
– areas oF signiFiCant JUDgement anD estimates by management anD their treatment in the FinanCial statements; anD signiFiCant or UnUsUal transaCtions or events anD their impliCations For the FinanCial statements.
CoMMiTTee MeeTiNGs AND ACCess To AuDiToRs AND MANAGeMeNTThe Audit, Risk Management and Compliance Committee maintains direct, unfettered access to external auditors, Business Review (internal auditors) and management. The Committee meets regularly with external auditors, Business Review and Compliance, and the Board and Committee meet with Business Review at least twice a year, without any management present.
The Committee has full access to the Group’s records and personnel. The Committee Chairman commits additional time and meets with the Ceo, the Finance Director, senior management,
external auditors, Business Review, Compliance and Legal between meetings, to discuss and review matters relating to Committee functions as appropriate.
The Committee’s Charter requires the key issues and reports discussed at each Committee meeting to be reported to the Board by the Chairman of the Committee at the immediately following Board meeting. These periodic reports to the Board include details of the most significant risks facing the Group and the mitigation strategies and practices adopted by management.
AuDiToR APPoiNTMeNT AND suPeRvisioNThe Committee is involved in the appointment and supervision of the external auditor and Business Review (internal audit).
External Auditor: – Appointment: The Committee nominates the external auditor
to the Board and this appointment is reviewed every three years. external audit performance is reviewed annually
– Partner Rotation: The Company requires the position of the lead client service audit partner to rotate every five years.
– Independence: The Company will not invite to be appointed as Directors any ex-audit partners, and any who may be proposed for appointment in a management position will be subject to Board approval.
– Audit Plans: each year, the Committee reviews and approves the overall scope and plans for the external audit activities, including staffing and fees.
– Audit Reports: The Committee reviews all audit reports provided by the external auditor.
Business Review (internal audit): – Appointment: The Committee is involved in the performance
assessment and appointment or termination of the Head of Business Review.
– Audit Plans: The Committee reviews the overall scope, annual plans and budget for Business Review activities and oversees the alignment of risk management programs and Business Review activities.
– Reports: The Committee reviews all key Business Review reports.
– Access: The Committee has regular direct access to the Head of Business Review, who reports directly to the Ceo.
NoN-AuDiT seRviCesThe Committee has procedures to review proposed services by the providers of the external audit which are unrelated to audit assurance activities and provide advice to the Board on whether and why it is satisfied that the auditor’s independence is not compromised.
The Committee has not set any nominal “cap” on the level of non-audit services to be performed by the external auditor, as it considers that this may restrict the ability of the Company to access the best advisers for the particular task.
Details of the non-audit services provided by the external auditor over the financial year are contained in Note 4 to the Financial statements.
77

RISK MANAGEMENTWoolworths has a sound system of risk management and internal control which, together with its governance structure, is designed to ensure that the material risks of conducting business are effectively managed.
The Risk Management Framework has regard to relevant regulations, standards and guidelines including the Asx Recommendations and the Australian/New Zealand standard As/NZs iso 31000:2009 Risk Management – Principles and guidelines.
RisK MANAGeMeNT PoLiCYThe Risk Management Policy was reviewed by management and formally approved by the Audit, Risk Management and Compliance Committee. The policy reflects the overall risk management philosophy of the Group, the Company’s overall approach to risk management, and the roles and responsibilities for risk management within the Group.
The policy is reviewed periodically by the Committee to ensure its accuracy. The Risk Management Policy is available on the Company’s website.
RoLes AND ResPoNsiBiLiTiesRoles and responsibilities under the Risk Management Framework and Risk Management Policy are divided as follows.
1 The Board is responsible for satisfying itself annually, or more frequently as required, that management has developed and implemented a sound system of risk management and internal control. Detailed work on this task is delegated to the Audit, Risk Management and Compliance Committee and reviewed by the full Board. The Nomination Committee and People Policy Committee also assist the Board in this role.
2 The Audit, Risk Management and Compliance Committee is responsible for assisting the Board in overseeing the Company’s risk management by overseeing management’s actions in the evaluation, management, monitoring and reporting of material strategic, financial, operational and legal/regulatory risks. in providing this oversight, the Committee:
– reviews the framework and methodology for risk identification, the management of risk and the processes for auditing and evaluating the Company’s risk management system;
– provides input into rating business risks; – monitors the alignment of the Company’s risk profile (which
is presented to the Committee on at least an annual basis) with risk appetite and tolerance levels approved by the Board and the broader business and regulatory environment;
– reviews details of material business risks that are reported to the Committee, including detailed risk reports and action plans that are periodically presented to the Committee and any other communications from senior Management, the Risk steering Group and Group Risk and Assurance;
– reviews and where necessary, approves guidelines and policies governing the identification, assessment and management of the Company’s exposure to risk, including the periodic review of those guidelines and policies;
– reviews and approves the delegations of financial authorities and addresses any need to update these authorities on an annual basis; and
– reviews insurance arrangements to ensure appropriate and cost-effective coverage.
The full explanation of the responsibilities of the Committee is contained in its Charter, available on the Company’s website.
The Committee recommends any actions it deems appropriate to the Board for its consideration. The Company’s Business Review function assists the Committee by providing an independent appraisal and reporting of the adequacy and effectiveness of the risk management framework.
3 Management is responsible for designing, implementing and reporting on the adequacy of the Company’s risk management and internal control system and must report to the Audit, Risk Management and Compliance Committee on the effectiveness of the risk management and internal control system during the year and of the Company’s management of its material business risks.
AssuRANCes BY MANAGeMeNTManagement has reported to the Audit, Risk Management and Compliance Committee and the Board on the effectiveness: – of the risk management and internal control system during the
year; and – of the Company’s management of its material business risks.
The Board has received assurance from the Ceo and Finance Director, in accordance with the Corporations Act 2001 (Cth), stating that, in all material respects: – the financial records of the Company for the financial year
have been properly maintained in accordance with section 286 of the Corporations Act;
– the Financial statements, and the Notes to the Financial statements, for the financial year comply with the relevant accounting standards; and
– the Financial statements, and the Notes to the Financial statements, for the financial year give a true and fair view of the financial position and performance of the Company and the Group.
in addition, the Ceo and Finance Director have stated to the Board in writing that: – the assurances given above and the integrity of the Company’s
Financial statements is founded on sound systems of risk management and compliance and internal control which implements, in all material respects, the policies adopted by the Board;
Corporate governanCe statement
WoolWorths limited AnnuAl report 201278
– to the extent they relate to financial reporting, the Company’s risk management and compliance and internal control systems are operating effectively in all material respects;
– nothing has come to their attention since 24 June 2012 that would indicate any material change to the above statements; and
– the assurances made above regarding risk management and compliance and internal control are made in the context of providing a reasonable, but not absolute, level of assurance and do not imply a guarantee against adverse events or more volatile outcomes arising in the future.
The Board’s role in the above assurance includes: – determining the scope of risk management, compliance and
internal control to be covered by the Ceo/Finance Director assurance;
– confirming the internal control benchmark criteria – the Company uses the criteria contained in the Coso internal Controls framework upon which an assessment of the effectiveness of internal controls will be based; and
– satisfying itself that the process underlying assurance is appropriate and that the Ceo and Finance Director are justified in providing their assurance.
PEOPLE POLICY COMMITTEE The Board had established a remuneration committee, named the People Policy Committee, which is designed among other things to ensure that the level and composition of Group remuneration is appropriate and reasonable and that its relationship to performance is clear. The People Policy Committee conforms with the requirements of the Asx Recommendations.
in addition to having responsibilities related to Group remuneration, the People Policy Committee also has broader responsibilities in respect of overseeing and reporting to the Board in respect of Group human resources strategies and processes.
MeMBeRsHiP AND CHARTeRThe People Policy Committee must be comprised of at least three independent, Non-executive Directors. Currently, the Committee comprises Non-executive Directors sir Roderick s Deane (Chair until November 2011), Mr J A strong, Ms C J Hrdlicka and Mr R G Waters (Chair since December 2011). The attendance of members at meetings of the Committee is set out on page 41 of the Directors’ Report.
The formal Charter of the People Policy Committee is available on the Company’s website. During the year, the Charter was reviewed and updated.
ResPoNsiBiLiTiesThe People Policy Committee acts on behalf of the Board and shareholders in respect of human resources to oversee management activities in:1 establishing and implementing a human resources strategy
which ensures that appropriately talented and trained people are available to achieve Woolworths’ business strategy;
2 protecting the safety and health of its employees, customers, contractors and visitors;
3 undertaking the appropriate performance management, succession planning and development activities and programs;
4 providing effective remuneration policies having regard to the creation of value for shareholders and the external remuneration market;
5 complying with relevant legal and regulatory requirements and principles of good governance; and
6 reporting to shareholders in line with required standards.
79
The following sets out the specific powers and functions of the People Policy Committee.
hr strategy remUneration ComplianCe
HR strategy – review the overall human resources strategy, monitor management’s implementation of the human resources strategy, and oversee management’s alignment of the human resources strategy with the Company’s overall business strategy and objectives;
HR policy (including diversity, equal opportunity and unfair dismissal) – review the Company’s policies and performance to assess the effectiveness of the policies and their compliance with relevant legislative, regulatory and governance requirements including eoWA, sexual harassment, diversity and unfair dismissal; and on the proportion of women who are employed by the Group as a whole and at all levels of the Group;
Gender pay equity – review remuneration by gender and make recommendations to the Board;
Performance management and succession planning – review principles, policies and processes for performance management and succession planning and provide oversight to management as it implements the processes to ensure there are sufficient people with the appropriate skills, experience, attributes and capability to deliver the requirements of the business strategy; and
Development – review the principles, policies and programs for the development of Woolworths employees.
Remuneration strategy – review and approve the Group’s overall remuneration policy, including assessing if remuneration is market competitive and designed to attract, motivate and retain employees;
Short term incentives – review and approve short term incentive plans annually to determine if they are designed to effectively reward the achievement of Company and individual objectives, including reviewing their implementation to determine whether they reward individuals fairly and equitably within Company cost-parameters;
Long term incentives – review the design of all employee long term incentive and equity plans annually, to determine if Company objectives are met, compliance with legislative and regulatory requirements, alignment with industry standards and overall cost effectiveness; and make recommendations to the Board for approval of the overall structure and the level of participation in the plans;
Management – review and approve the Ceo’s recommendations in regard to proposed remuneration packages of executives within the Management Board and executive Leadership team; and
Non-executive Directors – review and recommend to the Board the remuneration structure for the Non-executive Directors of the Company, within the maximum amount approved by shareholders.
Health and safety – review the Company’s policies and programs to achieve safety and health objectives, the Company’s health and safety performance against agreed targets and monitor, review and report to the Board on key health and safety issues;
Gender reporting – review and report to the Board at least annually on the proportion of women who are employed by the Group as a whole and at all levels of the Group;
Risk management – provide input to the Group’s management of risks relevant to human resources strategy, policy and practices; and
Remuneration Report – review and approve the Remuneration Report contained within the Annual Report to ensure disclosure meets the requirements of the Corporations Act and the Asx Listing Rules and is in accordance with good corporate governance practice.
ReMuNeRATioN RePoRTin accordance with section 300A of the Corporations Act 2001 (Cth), disclosures in relation to Director and executive remuneration are included in a separate component of the Directors’ Report, entitled Remuneration Report.
Full details of the Company’s remuneration philosophy, structure – including fixed and variable remuneration – and quantum are detailed in the Remuneration Report. The Remuneration Report is set out from pages 42 to 69.
eMPLoYee sHARe PLANsThe Company has established various Plans which have provided for the allocation of shares to more than approximately 45,000 of its permanent employees.
Details of these Plans are set out in Note 23 to the Financial statements – “employee Benefits”.
The Plans are aimed at aligning Woolworths’ employee interests with those of Woolworths’ other shareholders.
Corporate governanCe statement
WoolWorths limited AnnuAl report 201280
CODE OF CONDUCTThe Code of Conduct applies to all employees and sets out the standards in accordance with which they are expected to act. The policy is aimed at the maintenance of standards of honesty, integrity and fair dealing by all employees in their interaction with customers, suppliers, the community, competitors and each other in the performance of their duties and responsibilities.
Woolworths aims to review the terms of the Code of Conduct every two years. The Company is currently reviewing the Code of Conduct and expects the review to be completed and the revised Code of Conduct to be issued during 2013.
All employees are provided with a copy of the Code of Conduct on the commencement of their employment. As the Code of Conduct is reviewed and revised by the Company, employees are provided with an updated version. The Code of Conduct can be found on the Company’s website.
in addition to the Code of Conduct, there are a range of activities and compliance programs across the Company designed to promote and encourage the responsibility and accountability of individuals for reporting unethical practices.
sPeAK uPThe Woolworths Limited group of companies is committed to upholding the behaviours, values and expectations reflected in our Code of Conduct.
in line with this commitment, there are long-standing and accepted procedures in place for raising breaches of the Code of Conduct, which are routinely followed across the business. Managers are expected to address matters raised in this way in a robust manner.
The speak up service was introduced as a channel for employees to raise breaches directly with a party external to the Company. The speak up service is specifically designed for situations when normal escalation procedures have all been exhausted or are not appropriate.
The speak up service is an independent, confidential telephone, internet, email, mail and fax service, operated by an external provider, for employees to report on workplace misconduct.
All matters that constitute a breach of the law or Company policy including the Code of Conduct are within scope of the speak up service, in particular where: – the seriousness of the matter demands immediate investigation
and urgent attention from senior management; – the matter involves fraud, corruption or behaviour that
threatens others; or – the matter has the potential to expose the Company or
individuals who work for the Company to civil or criminal liability or reputation damage.
Dissatisfaction or disagreements of an interpersonal nature that do not breach any policy or law are not within scope.
Woolworths is strongly committed to eliminating workplace misconduct and employees are encouraged to make use of the speak up service if they encounter anything they believe constitutes serious workplace misconduct.
veNDoR sPeAK uPFollowing on from the launch of the employee speak up service, the Company launched the vendor speak up program in March 2012 as an externally hosted hotline for trade partners of any Woolworths trading divisions. The service is available to all trading partners of Woolworths to report matters of a serious nature where the standard escalation procedures have either been exhausted or are not an option.
Woolworths is the first major Australian retailer to adopt such a scheme, as part of its commitment to continuous improvement, transparency and accountability.
issues that can be reported through the vendor speak up service include breaches of the law, in particular restrictive or unconscionable trade practices, or instances where trade partners believe that dealings with a Woolworths business division or employee have created or are likely to create issues such as: – Fraud, corruption or behaviour that threatens others; – People or product safety risk; – Theft; – Conflict of interest; – secret commissions, bribes or corruption; – improper disclosure of confidential information; – Bullying; and – Harassment.
DIVERSITY AT WOOLWORTHS Woolworths appreciates that diversity is essential to its continued growth and success and is committed to fostering and sustaining an inclusive and flexible workplace.
Woolworths is pleased to be in a position to report on its performance in respect of diversity, in line with the Asx Diversity Recommendations. This statement: – sets out Woolworths’ workplace profile and key representation
metrics; – provides a summary of key initiatives that were implemented
during the year pursuant to Woolworths’ Diversity Policy; and – outlines Woolworths’ measurable diversity objectives for
2012/2013.
81
WORKPLACE PROFILEThe current Woolworths workplace profile indicates significant progress has been made to date in respect of diversity:
GeNDeR BALANCe AT WooLWoRTHs – Women constitute more than half of the Woolworths workforce, with 54% of all employees women as at the end of this financial year; – Woolworths aims to have equal representation of men and women in its graduate program with 52% of graduate recruits in 2012
women; and – Women currently hold 28.3%1 of executive leadership roles, up from 16.7% in 2004.
Three of the 10 Non-executive Directors on the Woolworths Board are women.
1 This data includes Supermarkets, BIG W, Logistics, Petrol, Woolworths Liquor Group, Corporate, BTS, Masters, Dick Smith (Australia), Thomas Dux, Progressive Enterprises Limited, Hong Kong, India, Dick Smith (NZ), ALH Group, Cellarmasters, Danks Wholesale and excludes Danks Retail
oTHeR RePReseNTATioN MeTRiCs – Woolworths does not require its employees to declare whether they are Aboriginal or Torres strait islander people. However, 949
employees have voluntarily declared that they are indigenous. This includes 202 indigenous employees who were recruited in 2011/2012 through community-based pre-employment programs.
– Woolworths does not require its employees to declare whether they have a disability. However, 939 employees have voluntarily declared that they have a disability. This includes 439 employees who were recruited through our disability employment partner, Workfocus.
PAY equiTYAs part of its annual remuneration review process, Woolworths undertakes an analysis of pay levels by gender, identifies any differentials, and takes appropriate steps to address any differentials.
LOOKING BACK: 2011/2012 MEASURABLE OBJECTIVESWoolworths launched its new diversity policy in september 2010, which includes a number of diversity-related measurable objectives. Prior to the launch of the diversity policy, diversity objectives were incorporated as part of the equal employment opportunity policy. The diversity policy is available on the Company’s website.
The table below sets out Woolworths’ objectives, the initiatives taken throughout 2011/2012 to achieve them and relevant outcomes.
obJeCtive initiatives anD oUtComes
33% of Non-executive Directors and executive leadership roles (direct reports to the Ceo and their executive reports at the next three levels) to be occupied by women by 2015
– Woolworths is making satisfactory progress toward achieving this objective, with women comprising 30% of Non-executive Directors and executive leadership roles
Continue to incrementally grow the number of women performing senior roles
– A number of key senior female appointments have taken place during the course of 2011/2012 including to the following roles: Regional Manager supermarkets, General Manager Thomas Dux, Area Manager supermarkets, Commercial Manager Petrol, Corporate Finance Manager, Director of Multi Channel, operational Manager Deal Team, Head of online Liquor, General Manager Cellarmaster Wines, General Manager Marketing supermarkets, Group Property operations Manager, Logistics operations Manager Food & Liquor, National operations Manager General Merchandise, Regional Property Development Manager, Manager strategic Project, Merchandise Manager Grocery and operations Development Manager.
– Woolworths made 175 new senior executive appointments during 2011/2012 of which 38% were women.
– As at June 2012, Woolworths employed the following numbers of management employees on a part-time basis: 30 executives (of which 25 were women), 59 senior managers (of which 52 were women) and 514 managers (of which 391 were women).
This data excludes Danks Retail, Progressive Enterprises Limited, Hong Kong, India and Dick Smith (NZ)
Corporate governanCe statement
WoolWorths limited AnnuAl report 201282

obJeCtive initiatives anD oUtComes
– The Managing Director and Ceo of Woolworths is a member of the Male Champions of Change group. The group brings together some of Australia’s most influential and diverse male Ceos and Chairpersons with a view to using their individual and collective influence and commitment to ensure the issue of women’s representation in leadership is elevated on the national business agenda.
– The Managing Director of Progressive enterprises Limited is a member of the New Zealand 25 Percent Group which comprises chairs and Ceos from a selection of private, publicly listed and multi-national companies committed to achieving diversity of thought at senior management level and in boardrooms. The aim of the group is to have 25% female representation on boards in New Zealand by 2015.
Continue to create programs that prepare women to take on senior roles within the business both in operational and specialist support areas
– The development and education programs that were offered to females during 2011/2012 included the following:
– The 12-month Future Leader Program, targeted at managers early in their careers and designed to develop leadership skills to position participants for future promotion. Currently this program has 37% female participation, up from 34% in 2010/2011.
– The 18-month engaging Leaders Program, targeted at leaders who have the potential to move into executive positions in the future. Currently this program has 32% female participation up from 30% in 2010/2011.
– The Day to Day management program, which provides core management principles and is targeted at new frontline managers. Currently this program has 39% female participation up from 30% in 2010/2011.
– The Personal Leadership program, which enables employees to develop insights into their leadership styles and develops personal effectiveness and resilience. Currently this program has 36% female participation up from 33% in 2010/2011.
– Woolworths provides employees with part-time and job-share roles, paid maternity leave, flexible reintegration after parental leave and support during this leave.
– Woolworths is a member of the Chief executive Women’s Group (CeW) and 40 of Woolworths’ female senior executives attended events held by the CeW in 2010/2011.
– During 2011/2012, one female executive won a scholarship through the CeW to attend a program in singapore.
– During 2011/2012, a female executive was one of two winners of the Jack shewmaker scholarship and used her scholarship to attend a program at Harvard.
83
obJeCtive initiatives anD oUtComes
As part of Woolworths’ ongoing commitment to the reconciliation process, continue to assist indigenous Australians to access employment opportunities through our business
– Woolworths launched its Reconciliation Action Plan (Plan) in June 2011 and continues to proactively recruit indigenous Australians through community based pre-employment programs.
– initiatives under the Plan include formal and informal access to work programs, working with indigenous-owned small businesses, and community investment programs.
– During 2011/2012, we have made significant progress in relation to each of these initiatives including as follows:
– 202 indigenous employees were employed through community based pre-employment programs;
– 949 employees voluntarily declared themselves as indigenous which was an increase of 54% compared to last year;
– one indigenous graduate was employed and two indigenous interns were taken on;
– 300 managers attended cultural awareness training; – Woolworths entered into an agreement with the Australian indigenous Minority
supplier Council (AiMsC) to work with indigenous suppliers of goods and services where appropriate. Through this agreement, Woolworths has engaged a number of different indigenous service providers;
– acknowledgement to country was embedded in new store openings and formal events;
– Aboriginal and Torres strait islanders flags are now in 25 locations across Australia; and
– two trucks in the Woolworths fleet are decorated with the Plan artwork, one in New south Wales and one in victoria.
Provide people with a disability employment opportunities and career advancement
– During 2011/2012, Woolworths has continued to look at new and innovative ways of providing people with a disability with employment opportunities. 939 employees declared that they have a disability, which is an increase of 66% from last year.
– in April 2011, National Disability Recruitment Coordinators (NDRC) was awarded an innovation grant to partner with Woolworths on streamlining the process for people with a disability obtaining work in Woolworths stores located in south east victoria. During the 12 month period of the funding, the following results were achieved:
– 45 placements were made in south east victoria; – 101 managers attended disability awareness training; – job role competencies were reviewed to support disability placements; and – a guide to disability employment was developed for store managers nationally.
– Woolworths has been a member of the Australian Network for Disability (AND) for a number of years. Woolworths’ General Manager of Health safety and Wellbeing is a member of the Board of AND.
– in New Zealand, Woolworths Director sir Roderick Deane, is patron to The employers’ Disability Network (eDN), and the Human Resources General Manager for Progressive enterprises Limited is a member of the Board of eDN.
Continue to recognise and celebrate our multicultural diversity and grow our workforce to reflect the diversity of the Australian population
– in recognising and celebrating our diversity, Woolworths has: – celebrated international Family Day with new international team members and
Harmony Day with both employees and customers; – integrated diversity awareness into leadership and development training
programs with 300 managers attending cultural awareness training; and – placed a diversity calendar which is updated weekly on the Woolworths employee
communication and engagement website ‘AllYours’.
LOOKING BACK: 2011/2012 MEASURABLE OBJECTIVES CONTINUED
Corporate governanCe statement
WoolWorths limited AnnuAl report 201284
obJeCtive initiatives anD oUtComes
The ‘Fresh start’ agreement – in April 2012, Woolworths and the Federal Government signed the ‘Fresh start’ agreement to enable collaboration in a structured and aligned way in order to help facilitate employment, workplace participation and skills training right across Australia by creating single points of contact for recruitment, pre-employment programs and skills enhancement.
– The Fresh start agreement focuses on three key priorities: – recruitment for new stores and growth businesses; – advancing workplace participation for people from diverse backgrounds; and – building skills competence to develop long term careers.
LOOKING FORWARD: 2012/2013 MEASURABLE OBJECTIVESWoolworths is committed to the regular review and updating of its measurable objectives to ensure that they continue to be appropriate and operate to enhance Woolworths’ diversity profile. The objectives that Woolworths has reaffirmed during the year are as follows: – 33% of Non-executive Directors and executive leadership roles (direct reports to the Ceo and their executive reports at the next
three levels) to be occupied by women by 2015; – continue to incrementally grow the number of women performing senior roles; – continue to create programs that prepare women to take on senior roles within the business both in operational and specialist
support areas; – as part of Woolworths’ ongoing commitment to the reconciliation process, continue to assist indigenous Australians to access
employment opportunities through our business; – provide people with a disability employment opportunities and career advancement; and – continue to recognise and celebrate our multicultural diversity and grow our workforce to reflect the diversity of our customer.
POLICY ON TRADING IN COMPANY SECURITIES The Company has adopted a securities Dealing Policy which regulates dealings with Woolworths securities by all Woolworths people. The securities Dealing Policy was reviewed during the year. The policy is available on the Company’s website.
The securities Dealing Policy requires Woolworths people to act in accordance with strict guidelines which prohibit trading in the Company’s securities in fixed blackout periods preceding the release of the half-year, annual and quarterly results to the Asx. Additional restrictions apply to Woolworths people (including Directors and designated persons) who are most likely to come into possession of inside information during the course of their work to ensure that they take additional care in relation to dealings in Woolworths securities.
The objective of the policy is not only to require compliance with the law, but to ensure that any dealings in securities by relevant Woolworths parties are above reproach. in addition to the legal consequences for breach, the policy provides for disciplinary action, including dismissal. The policy provides very clear, specific direction to designated persons and other people in relation to prohibited periods for trading in securities.
The securities Dealing Policy has a broad prohibition on hedging of unvested Woolworths securities as well as on vested Woolworths securities that are subject to disposal restrictions. These restrictions are to prevent transactions which could have the effect of distorting the proper functioning of performance hurdles or reduce the intended alignment between management and shareholder interests.
Notwithstanding anything in the securities Dealing Policy, there is no period during which an individual is exempt from the requirements of the Corporations Act 2001 (Cth) with regard to insider trading prohibitions.
CONTINUOUS DISCLOSUREWoolworths’ practice is to release all price sensitive information to the market in a timely manner in accordance with its continuous disclosure obligations under the Corporations Act 2001 (Cth) and Asx Listing Rules.
Woolworths has established a framework to enable the Company to provide shareholders and the market generally with timely, direct and equal access to relevant information about Woolworths.
Woolworths’ Continuous Disclosure Policy aims to: – ensure compliance with continuous disclosure regulatory requirements; – ensure accountability of Woolworths’ senior management level for compliance; and – promote investor confidence in the integrity of Woolworths and its securities.
The Continuous Disclosure Policy is available on the Company’s website.
85
SHAREHOLDER ENGAGEMENT
CoMMuNiCATioN sTRATeGYWoolworths aims to ensure that shareholders are kept informed of all major developments affecting Woolworths. Additionally, we recognise that potential investors and other interested stakeholders may wish to obtain information about Woolworths from time to time.
To achieve this, Woolworths communicates information regularly to shareholders and other stakeholders through a range of forums and publications, as outlined in our shareholder Communications Policy (which can be found on the Company’s website).
iNvesToR CeNTReThe investor Centre is one of the key methods of communicating with the Company’s shareholders. The investor Centre is available through the Company’s website and includes key Woolworths financial and shareholder information, including the Company’s published reports, share price updates, dividend history, presentations and webcasts, shareholder meeting details and all major Asx announcements made by the Company in the last five years.
Corporate governanCe statement
WoolWorths limited AnnuAl report 201286

This page has been left blank intentionally.
87
Contents
Five Year summary 89
Consolidated Income statement 96
Consolidated statement of Comprehensive Income 97
Consolidated Balance sheet 99
Consolidated Cash Flow statement 100
Consolidated statement of Changes in equity 102
notes to the ConsolIdated FInanCIal statements
1 Significant accounting policies 104
2 Profit from operations – continuing operations 114
3 Net financing costs – continuing operations 115
4 Auditors’ remuneration 115
5 Income taxes 116
6 Dividends 118
7 Segment disclosures 119
8 Trade and other receivables 122
9 Other financial assets 122
10 Property, plant and equipment 123
11 Intangible assets 126
12 Trade and other payables 128
13 Other financial liabilities 128
14 Borrowings 129
15 Financing arrangements 130
16 Provisions 131
17 Issued capital 132
18 Reserves 134
19 Retained earnings 135
20 Earnings per share 136
21 Contingent liabilities 137
22 Commitments for expenditure 138
23 Employee benefits 138
24 Key management personnel 146
25 Related parties 151
26 Financial instruments 152
27 Financial risk management 160
28 Subsidiaries 164
29 Deed of cross guarantee 168
30 Business acquisitions 170
31 Subsequent events 172
32 Parent entity information 172
33 Assets held for sale and discontinued operations 174
directors’ declaration 176
Independent auditor’s Report 177
shareholder Information 179
shareholders’ Calendar 182
Company directory 185
2012 FINANCIAL REPORT TO SHAREHOLDERS
WoolWorths limited AnnuAl report 201288
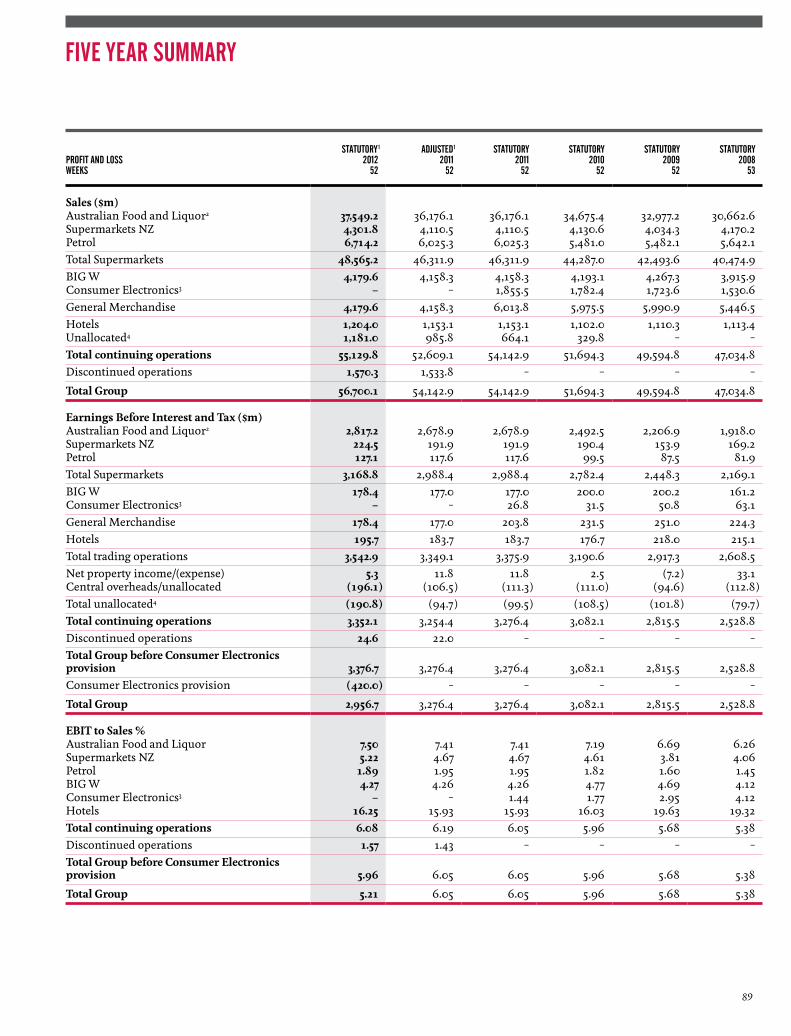
PROFIT AND LOSS WEEkS
STATuTORy 1
201252
ADjuSTED1
201152
STATuTORy2011
52
STATuTORy2010
52
STATuTORy2009
52
STATuTORy2008
53
sales ($m)Australian Food and Liquor2 37,549.2 36,176.1 36,176.1 34,675.4 32,977.2 30,662.6Supermarkets NZ 4,301.8 4,110.5 4,110.5 4,130.6 4,034.3 4,170.2Petrol 6,714.2 6,025.3 6,025.3 5,481.0 5,482.1 5,642.1Total Supermarkets 48,565.2 46,311.9 46,311.9 44,287.0 42,493.6 40,474.9BIG W 4,179.6 4,158.3 4,158.3 4,193.1 4,267.3 3,915.9Consumer Electronics3 – – 1,855.5 1,782.4 1,723.6 1,530.6General Merchandise 4,179.6 4,158.3 6,013.8 5,975.5 5,990.9 5,446.5Hotels 1,204.0 1,153.1 1,153.1 1,102.0 1,110.3 1,113.4Unallocated4 1,181.0 985.8 664.1 329.8 – –total continuing operations 55,129.8 52,609.1 54,142.9 51,694.3 49,594.8 47,034.8Discontinued operations 1,570.3 1,533.8 – – – –
total Group 56,700.1 54,142.9 54,142.9 51,694.3 49,594.8 47,034.8
earnings Before Interest and tax ($m)Australian Food and Liquor2 2,817.2 2,678.9 2,678.9 2,492.5 2,206.9 1,918.0Supermarkets NZ 224.5 191.9 191.9 190.4 153.9 169.2Petrol 127.1 117.6 117.6 99.5 87.5 81.9Total Supermarkets 3,168.8 2,988.4 2,988.4 2,782.4 2,448.3 2,169.1BIG W 178.4 177.0 177.0 200.0 200.2 161.2Consumer Electronics3 – – 26.8 31.5 50.8 63.1General Merchandise 178.4 177.0 203.8 231.5 251.0 224.3Hotels 195.7 183.7 183.7 176.7 218.0 215.1Total trading operations 3,542.9 3,349.1 3,375.9 3,190.6 2,917.3 2,608.5Net property income/(expense) 5.3 11.8 11.8 2.5 (7.2) 33.1Central overheads/unallocated (196.1) (106.5) (111.3) (111.0) (94.6) (112.8)Total unallocated4 (190.8) (94.7) (99.5) (108.5) (101.8) (79.7)total continuing operations 3,352.1 3,254.4 3,276.4 3,082.1 2,815.5 2,528.8Discontinued operations 24.6 22.0 – – – –total Group before Consumer electronics provision 3,376.7 3,276.4 3,276.4 3,082.1 2,815.5 2,528.8Consumer Electronics provision (420.0) – – – – –
total Group 2,956.7 3,276.4 3,276.4 3,082.1 2,815.5 2,528.8
eBIt to sales %Australian Food and Liquor 7.50 7.41 7.41 7.19 6.69 6.26 Supermarkets NZ 5.22 4.67 4.67 4.61 3.81 4.06 Petrol 1.89 1.95 1.95 1.82 1.60 1.45 BIG W 4.27 4.26 4.26 4.77 4.69 4.12 Consumer Electronics3 – – 1.44 1.77 2.95 4.12 Hotels 16.25 15.93 15.93 16.03 19.63 19.32 total continuing operations 6.08 6.19 6.05 5.96 5.68 5.38 Discontinued operations 1.57 1.43 – – – – total Group before Consumer electronics provision 5.96 6.05 6.05 5.96 5.68 5.38
total Group 5.21 6.05 6.05 5.96 5.68 5.38
FIVE yEAR SuMMARy
89

PROFIT AND LOSS WEEkS
STATuTORy 1
201252
ADjuSTED1
201152
STATuTORy2011
52
STATuTORy2010
52
STATuTORy2009
52
STATuTORy2008
53
Profit and loss detail ($m)Continuing operationsSales 55,129.8 52,609.1 54,142.9 51,694.3 49,594.8 47,034.8Cost of goods sold (40,653.5) (38,913.4) (40,049.7) (38,300.7) (36,871.4) (35,134.5)Gross profit 14,476.3 13,695.7 14,093.2 13,393.6 12,723.4 11,900.3Gross profit margin % 26.26 26.03 26.03 25.91 25.66 25.30Cost of doing business (CODB) (11,124.2) (10,441.3) (10,816.8) (10,311.5) (9,907.9) (9,371.5)CODB % 20.18 19.85 19.98 19.95 19.98 19.92Selling, general and admin expenses(excluding rent, depreciation and amortisation) (8,680.8) (8,157.6) (8,417.7) (8,035.9) (7,768.8) (7,405.5)EBITDAR 5,795.5 5,538.1 5,675.5 5,357.7 4,954.6 4,494.8EBITDAR margin % 10.51 10.53 10.48 10.36 9.99 9.56Rent (including fitout rent) (1,559.7) (1,454.4) (1,541.2) (1,477.9) (1,409.7) (1,315.9)EBITDA 4,235.8 4,083.7 4,134.3 3,879.8 3,544.9 3,178.9EBITDA margin (%) 7.68 7.76 7.64 7.51 7.15 6.76Depreciation and amortisation (883.7) (829.3) (857.9) (797.7) (729.4) (650.1)EBIT 3,352.1 3,254.4 3,276.4 3,082.1 2,815.5 2,528.8EBIT margin (%) 6.08 6.19 6.05 5.96 5.68 5.38Net financing cost (244.4) (225.4) (225.3) (181.5) (149.9) (140.8)Woolworths Notes interest (39.3) (36.2) (36.2) (30.0) (39.3) (50.5)Profit before tax 3,068.4 2,992.8 3,014.9 2,870.6 2,626.3 2,337.5Taxation (885.0) (869.2) (874.6) (832.6) (766.3) (686.0)Profit after tax 2,183.4 2,123.6 2,140.3 2,038.0 1,860.0 1,651.5
discontinued operationsProfit after tax 17.5 16.7 – – – –Group net profit after tax before Consumer electronics provision 2,200.9 2,140.3 2,140.3 2,038.0 1,860.0 1,651.5Consumer Electronics provision after tax (383.7) – – – – –Group net profit after tax after Consumer electronics provision 1,817.2 2,140.3 2,140.3 2,038.0 1,860.0 1,651.5Non-controlling interests (0.5) (16.3) (16.3) (17.2) (24.3) (24.7)
Profit attributable to members of Woolworths limited after tax 1,816.7 2,124.0 2,124.0 2,020.8 1,835.7 1,626.8
FIVE yEAR SuMMARy
WoolWorths limited AnnuAl report 201290

BALANCE SHEET ($M)WEEkS
STATuTORy 1
201252
ADjuSTED1
201152
STATuTORy2011
52
STATuTORy2010
52
STATuTORy2009
52
STATuTORy2008
53
Inventory 3,698.3 3,736.5 3,736.5 3,438.8 3,292.6 3,010.0Accounts Payable (4,013.4) (4,132.0) (4,132.0) (3,953.3) (3,855.4) (3,713.6)Net investment in inventory (315.1) (395.5) (395.5) (514.5) (562.8) (703.6)Fixed assets and investments 9,846.5 8,830.5 8,830.5 7,802.9 6,822.2 5,825.5Intangibles 5,282.0 5,236.6 5,236.6 5,071.0 4,933.1 4,835.2Receivables 894.4 778.0 778.0 672.2 467.2 476.9Other creditors (2,954.7) (2,646.8) (2,646.8) (2,455.9) (2,340.4) (2,118.1)total funds employed5 12,753.1 11,802.8 11,802.8 10,575.7 9,319.3 8,315.9Net tax balances 423.2 305.7 305.7 233.6 201.1 100.5net assets employed 13,176.3 12,108.5 12,108.5 10,809.3 9,520.4 8,416.4Cash and borrowings6 (3,916.3) (3,325.3) (3,325.3) (2,828.7) (2,412.3) (2,019.6)Capital call receivable from non-controlling interest – 93.0 93.0 – – –Other financial assets and liabilities (833.7) (1,030.4) (1,030.4) (162.9) (50.8) (161.5)net assets continuing operations 8,426.3 7,845.8 7,845.8 7,817.7 7,057.3 6,235.3
net assets discontinued operations 20.0 – – – – –
total net assets 8,446.3 7,845.8 7,845.8 7,817.7 7,057.3 6,235.3
Non-controlling interests 258.1 252.6 252.6 247.3 244.8 242.4Shareholders’ equity 8,188.2 7,593.2 7,593.2 7,570.4 6,812.5 5,992.9
total equity 8,446.3 7,845.8 7,845.8 7,817.7 7,057.3 6,235.3
CASH FLOW ($M) WEEkS
Continuing and discontinued operationsEBITDA 3,852.6 4,134.3 4,134.3 3,879.8 3,544.9 3,178.9Movement in net investment in inventory (282.6) (75.9) (75.9) (69.5) (138.4) 317.4Other operating cash flows and other non cash 614.5 83.8 83.8 88.4 244.2 (52.9)Net interest paid (369.3) (309.6) (309.6) (249.8) (244.4) (215.5)Tax paid (941.4) (841.5) (841.5) (896.9) (802.1) (573.9)operating cash flow 2,873.8 2,991.1 2,991.1 2,752.0 2,604.2 2,654.0
Payments for property, plant, equipment and intangibles (2,141.8) (2,138.5) (2,138.5) (1,817.7) (1,678.2) (1,748.1)Proceeds on disposal of property, plant and equipment 199.5 394.4 394.4 55.4 18.7 228.4Other investing cash flows (138.0) (433.3) (433.3) (189.9) (146.7) (233.7)Free cash flow 793.5 813.7 813.7 799.8 798.0 900.6
Movement in gross debt (468.9) 1,758.3 1,758.3 486.1 160.8 (132.2)Issue of subsidiary shares to non-controlling interests 203.0 176.6 176.6 79.5 – –Dividends paid (1,317.2) (1,260.0) (1,260.0) (1,164.6) (1,012.4) (862.5)Dividends paid to non-controlling interests (15.6) (13.2) (13.2) (16.8) (29.2) (14.3)Buyback of shares – (738.7) (738.7) (294.6) – –New shares issued 129.5 105.1 105.1 77.5 71.9 72.2Payments for shares acquired by the Woolworths Employee Share Trust – (28.8) (28.8) – – –Effects of exchange rate changes on balance of cash held in foreign currencies 1.3 (6.8) (6.8) (0.2) 3.0 (8.0)
net cash flow (674.4) 806.2 806.2 (33.3) (7.9) (44.2)
91
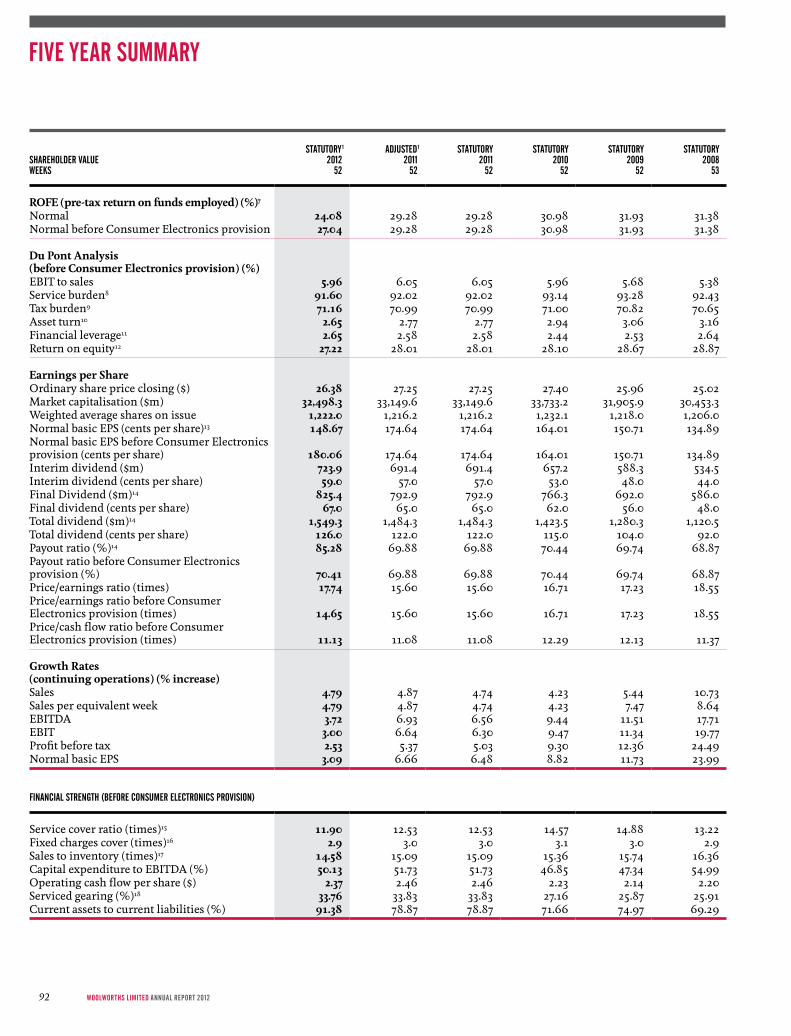
SHAREHOLDER VALuEWEEkS
STATuTORy 1
201252
ADjuSTED1
201152
STATuTORy2011
52
STATuTORy2010
52
STATuTORy2009
52
STATuTORy2008
53
RoFe (pre-tax return on funds employed) (%)7
Normal 24.08 29.28 29.28 30.98 31.93 31.38Normal before Consumer Electronics provision 27.04 29.28 29.28 30.98 31.93 31.38
du Pont analysis (before Consumer electronics provision) (%)EBIT to sales 5.96 6.05 6.05 5.96 5.68 5.38Service burden8 91.60 92.02 92.02 93.14 93.28 92.43Tax burden9 71.16 70.99 70.99 71.00 70.82 70.65Asset turn10 2.65 2.77 2.77 2.94 3.06 3.16Financial leverage11 2.65 2.58 2.58 2.44 2.53 2.64Return on equity12 27.22 28.01 28.01 28.10 28.67 28.87
earnings per shareOrdinary share price closing ($) 26.38 27.25 27.25 27.40 25.96 25.02Market capitalisation ($m) 32,498.3 33,149.6 33,149.6 33,733.2 31,905.9 30,453.3Weighted average shares on issue 1,222.0 1,216.2 1,216.2 1,232.1 1,218.0 1,206.0Normal basic EPS (cents per share)13 148.67 174.64 174.64 164.01 150.71 134.89Normal basic EPS before Consumer Electronics provision (cents per share) 180.06 174.64 174.64 164.01 150.71 134.89Interim dividend ($m) 723.9 691.4 691.4 657.2 588.3 534.5Interim dividend (cents per share) 59.0 57.0 57.0 53.0 48.0 44.0Final Dividend ($m)14 825.4 792.9 792.9 766.3 692.0 586.0Final dividend (cents per share) 67.0 65.0 65.0 62.0 56.0 48.0Total dividend ($m)14 1,549.3 1,484.3 1,484.3 1,423.5 1,280.3 1,120.5Total dividend (cents per share) 126.0 122.0 122.0 115.0 104.0 92.0Payout ratio (%)14 85.28 69.88 69.88 70.44 69.74 68.87Payout ratio before Consumer Electronics provision (%) 70.41 69.88 69.88 70.44 69.74 68.87Price/earnings ratio (times) 17.74 15.60 15.60 16.71 17.23 18.55Price/earnings ratio before Consumer Electronics provision (times) 14.65 15.60 15.60 16.71 17.23 18.55Price/cash flow ratio before Consumer Electronics provision (times) 11.13 11.08 11.08 12.29 12.13 11.37
Growth Rates (continuing operations) (% increase)Sales 4.79 4.87 4.74 4.23 5.44 10.73Sales per equivalent week 4.79 4.87 4.74 4.23 7.47 8.64EBITDA 3.72 6.93 6.56 9.44 11.51 17.71EBIT 3.00 6.64 6.30 9.47 11.34 19.77Profit before tax 2.53 5.37 5.03 9.30 12.36 24.49Normal basic EPS 3.09 6.66 6.48 8.82 11.73 23.99
FINANCIAL STRENGTH (BEFORE CONSuMER ELECTRONICS PROVISION)
Service cover ratio (times)15 11.90 12.53 12.53 14.57 14.88 13.22Fixed charges cover (times)16 2.9 3.0 3.0 3.1 3.0 2.9Sales to inventory (times)17 14.58 15.09 15.09 15.36 15.74 16.36Capital expenditure to EBITDA (%) 50.13 51.73 51.73 46.85 47.34 54.99Operating cash flow per share ($) 2.37 2.46 2.46 2.23 2.14 2.20Serviced gearing (%)18 33.76 33.83 33.83 27.16 25.87 25.91Current assets to current liabilities (%) 91.38 78.87 78.87 71.66 74.97 69.29
FIVE yEAR SuMMARy
WoolWorths limited AnnuAl report 201292
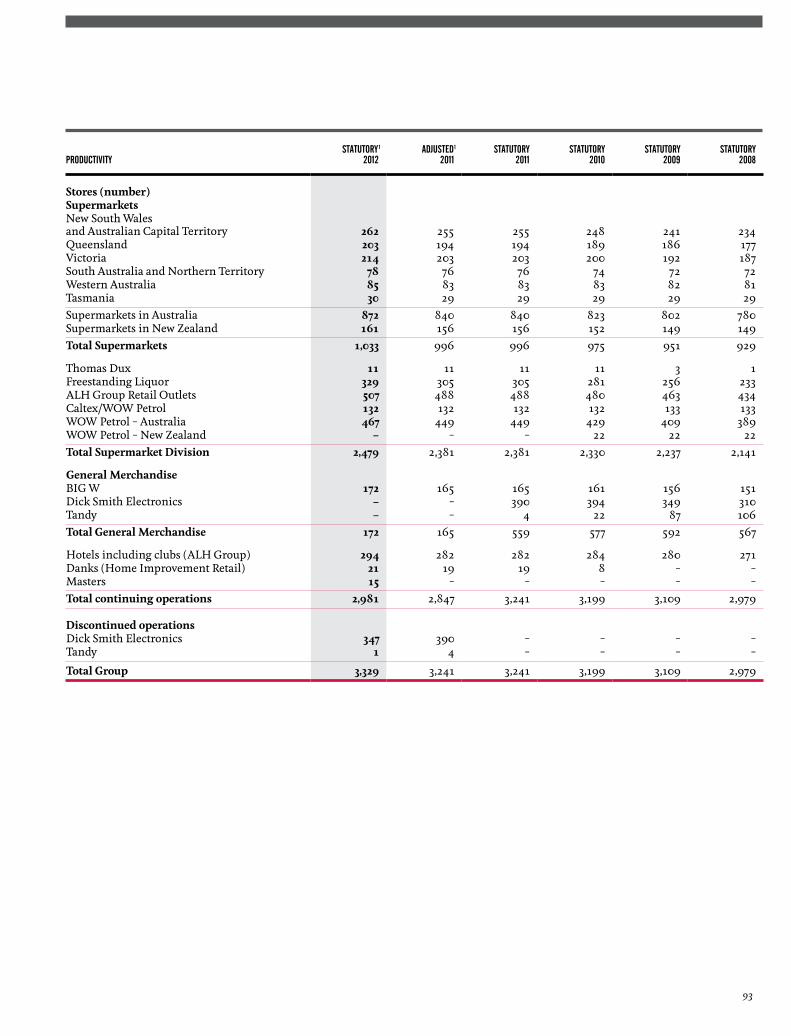
PRODuCTIVITySTATuTORy 1
2012ADjuSTED1
2011STATuTORy
2011STATuTORy
2010STATuTORy
2009STATuTORy
2008
stores (number)supermarketsNew South Wales and Australian Capital Territory 262 255 255 248 241 234 Queensland 203 194 194 189 186 177 Victoria 214 203 203 200 192 187 South Australia and Northern Territory 78 76 76 74 72 72 Western Australia 85 83 83 83 82 81 Tasmania 30 29 29 29 29 29 Supermarkets in Australia 872 840 840 823 802 780 Supermarkets in New Zealand 161 156 156 152 149 149 total supermarkets 1,033 996 996 975 951 929
Thomas Dux 11 11 11 11 3 1 Freestanding Liquor 329 305 305 281 256 233 ALH Group Retail Outlets 507 488 488 480 463 434 Caltex/WOW Petrol 132 132 132 132 133 133 WOW Petrol – Australia 467 449 449 429 409 389 WOW Petrol – New Zealand – – – 22 22 22 total supermarket division 2,479 2,381 2,381 2,330 2,237 2,141
General merchandiseBIG W 172 165 165 161 156 151 Dick Smith Electronics – – 390 394 349 310 Tandy – – 4 22 87 106 total General merchandise 172 165 559 577 592 567
Hotels including clubs (ALH Group) 294 282 282 284 280 271 Danks (Home Improvement Retail) 21 19 19 8 – – Masters 15 – – – – – total continuing operations 2,981 2,847 3,241 3,199 3,109 2,979
discontinued operationsDick Smith Electronics 347 390 – – – – Tandy 1 4 – – – –
total Group 3,329 3,241 3,241 3,199 3,109 2,979
93

STORES (MOVEMENT) Fy12 26 juNE 2011 OPENED/ACQ CLOSED 24 juNE 2012
supermarketsNew South Wales and Australian Capital Territory 255 8 1 262 Queensland 194 14 5 203 Victoria 203 11 – 214 South Australia and Northern Territory 76 2 – 78 Western Australia 83 2 – 85 Tasmania 29 1 – 30 total australian supermarkets 840 38 6 872 Supermarkets – New Zealand 156 8 3 161 total supermarkets 996 46 9 1,033
Thomas Dux 11 – – 11 Freestanding Liquor 305 30 6 329 ALH Group retail outlets 488 36 17 507 Caltex/WOW Petrol 132 – – 132 WOW Petrol – Australia 449 18 – 467 total supermarket division 2,381 130 32 2,479
General merchandiseBIG W 165 7 – 172 total General merchandise 165 7 – 172
Hotels (ALH Group) 282 17 5 294 Danks (Home Improvement Retail) 19 5 3 21 Masters – 15 – 15 total continuing operations 2,847 174 40 2,981
discontinued operationsDick Smith Electronics and Tandy (Aust/NZ) 394 21 67 348
total Group movement 3,241 195 107 3,329
WEEkS
STATuTORy 1
201252
ADjuSTED1
201152
STATuTORy2011
52
STATuTORy2010
52
STATuTORy2009
52
STATuTORy2008
53
area (sqm)Supermarket Division (Australia)19 2,318,756 2,202,620 2,202,620 2,127,195 2,037,680 1,945,641Supermarket Division (New Zealand)20 351,744 333,274 333,274 325,256 303,889 296,549General Merchandise Division21 1,107,732 1,086,082 1,086,082 1,061,934 1,038,561 989,767
sales per average square metreSupermarket Division (Australia)19 15,980.2 16,171.8 16,171.8 16,103.1 16,002.5 15,609.7Supermarket Division (New Zealand)20 15,178.9 15,131.6 15,131.6 15,042.1 15,001.6 15,054.0General Merchandise Division21 5,241.9 5,299.9 5,299.9 5,449.8 5,722.7 5,565.0
FIVE yEAR SuMMARy
WoolWorths limited AnnuAl report 201294
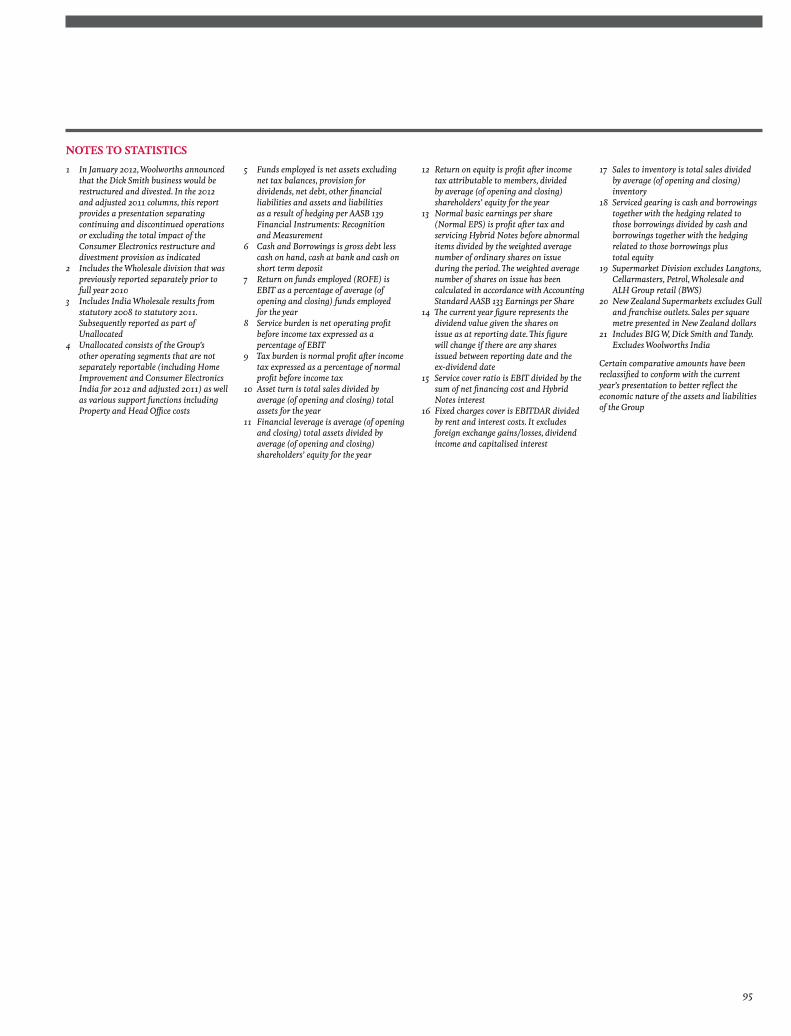
notes to statIstICs1 In January 2012, Woolworths announced
that the Dick Smith business would be restructured and divested. In the 2012 and adjusted 2011 columns, this report provides a presentation separating continuing and discontinued operations or excluding the total impact of the Consumer Electronics restructure and divestment provision as indicated
2 Includes the Wholesale division that was previously reported separately prior to full year 2010
3 Includes India Wholesale results from statutory 2008 to statutory 2011. Subsequently reported as part of Unallocated
4 Unallocated consists of the Group’s other operating segments that are not separately reportable (including Home Improvement and Consumer Electronics India for 2012 and adjusted 2011) as well as various support functions including Property and Head Office costs
5 Funds employed is net assets excluding net tax balances, provision for dividends, net debt, other financial liabilities and assets and liabilities as a result of hedging per AASB 139 Financial Instruments: Recognition and Measurement
6 Cash and Borrowings is gross debt less cash on hand, cash at bank and cash on short term deposit
7 Return on funds employed (ROFE) is EBIT as a percentage of average (of opening and closing) funds employed for the year
8 Service burden is net operating profit before income tax expressed as a percentage of EBIT
9 Tax burden is normal profit after income tax expressed as a percentage of normal profit before income tax
10 Asset turn is total sales divided by average (of opening and closing) total assets for the year
11 Financial leverage is average (of opening and closing) total assets divided by average (of opening and closing) shareholders’ equity for the year
12 Return on equity is profit after income tax attributable to members, divided by average (of opening and closing) shareholders’ equity for the year
13 Normal basic earnings per share (Normal EPS) is profit after tax and servicing Hybrid Notes before abnormal items divided by the weighted average number of ordinary shares on issue during the period. The weighted average number of shares on issue has been calculated in accordance with Accounting Standard AASB 133 Earnings per Share
14 The current year figure represents the dividend value given the shares on issue as at reporting date. This figure will change if there are any shares issued between reporting date and the ex‑dividend date
15 Service cover ratio is EBIT divided by the sum of net financing cost and Hybrid Notes interest
16 Fixed charges cover is EBITDAR divided by rent and interest costs. It excludes foreign exchange gains/losses, dividend income and capitalised interest
17 Sales to inventory is total sales divided by average (of opening and closing) inventory
18 Serviced gearing is cash and borrowings together with the hedging related to those borrowings divided by cash and borrowings together with the hedging related to those borrowings plus total equity
19 Supermarket Division excludes Langtons, Cellarmasters, Petrol, Wholesale and ALH Group retail (BWS)
20 New Zealand Supermarkets excludes Gull and franchise outlets. Sales per square metre presented in New Zealand dollars
21 Includes BIG W, Dick Smith and Tandy. Excludes Woolworths India
Certain comparative amounts have been reclassified to conform with the current year’s presentation to better reflect the economic nature of the assets and liabilities of the Group
95
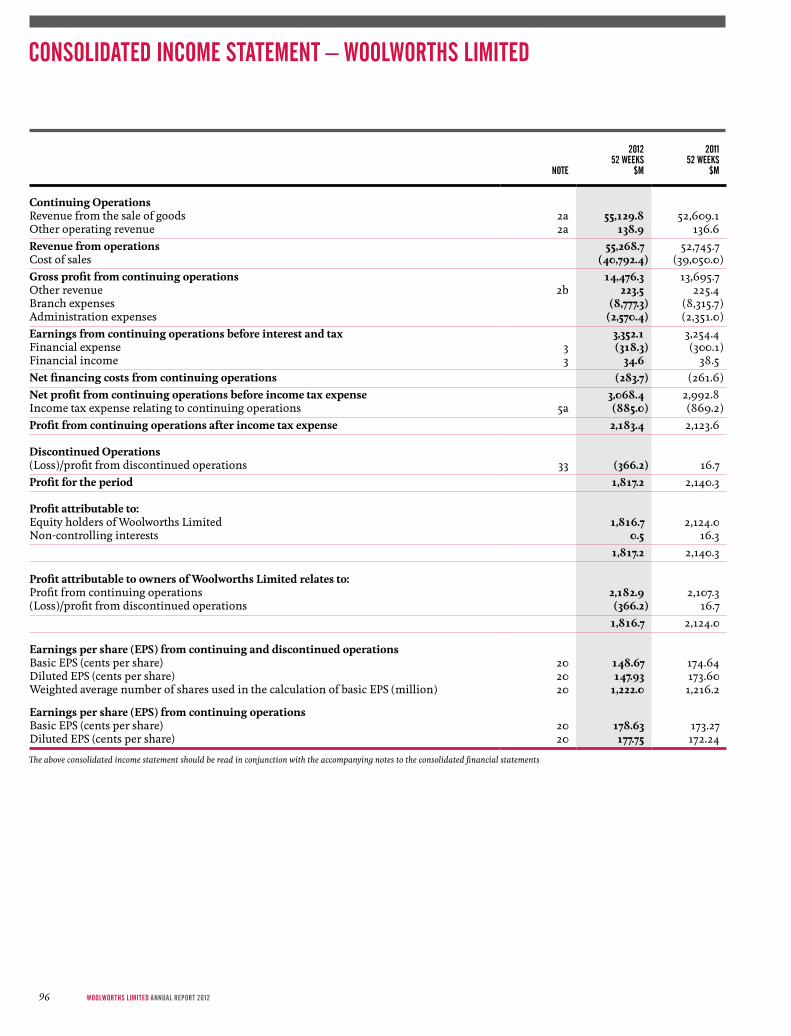
NOTE
201252 WEEkS
$M
201152 WEEkS
$M
Continuing operationsRevenue from the sale of goods 2a 55,129.8 52,609.1Other operating revenue 2a 138.9 136.6Revenue from operations 55,268.7 52,745.7Cost of sales (40,792.4) (39,050.0)Gross profit from continuing operations 14,476.3 13,695.7Other revenue 2b 223.5 225.4Branch expenses (8,777.3) (8,315.7)Administration expenses (2,570.4) (2,351.0)earnings from continuing operations before interest and tax 3,352.1 3,254.4Financial expense 3 (318.3) (300.1)Financial income 3 34.6 38.5net financing costs from continuing operations (283.7) (261.6)net profit from continuing operations before income tax expense 3,068.4 2,992.8Income tax expense relating to continuing operations 5a (885.0) (869.2)Profit from continuing operations after income tax expense 2,183.4 2,123.6
discontinued operations(Loss)/profit from discontinued operations 33 (366.2) 16.7Profit for the period 1,817.2 2,140.3
Profit attributable to:Equity holders of Woolworths Limited 1,816.7 2,124.0Non-controlling interests 0.5 16.3 1,817.2 2,140.3
Profit attributable to owners of Woolworths limited relates to:Profit from continuing operations 2,182.9 2,107.3(Loss)/profit from discontinued operations (366.2) 16.7
1,816.7 2,124.0
earnings per share (ePs) from continuing and discontinued operationsBasic EPS (cents per share) 20 148.67 174.64Diluted EPS (cents per share) 20 147.93 173.60Weighted average number of shares used in the calculation of basic EPS (million) 20 1,222.0 1,216.2
earnings per share (ePs) from continuing operationsBasic EPS (cents per share) 20 178.63 173.27Diluted EPS (cents per share) 20 177.75 172.24
The above consolidated income statement should be read in conjunction with the accompanying notes to the consolidated financial statements
CONSOLIDATED INCOME STATEMENT – WOOLWORTHS LIMITED
WoolWorths limited AnnuAl report 201296
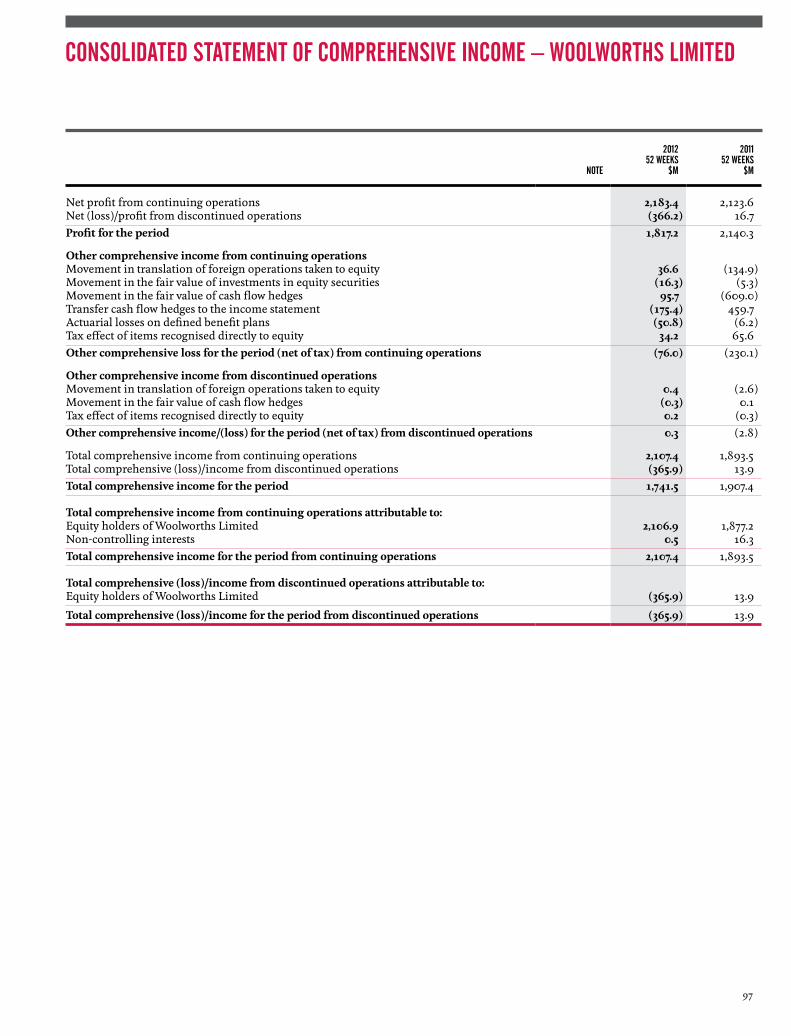
NOTE
201252 WEEkS
$M
201152 WEEkS
$M
Net profit from continuing operations 2,183.4 2,123.6Net (loss)/profit from discontinued operations (366.2) 16.7Profit for the period 1,817.2 2,140.3
other comprehensive income from continuing operationsMovement in translation of foreign operations taken to equity 36.6 (134.9)Movement in the fair value of investments in equity securities (16.3) (5.3)Movement in the fair value of cash flow hedges 95.7 (609.0)Transfer cash flow hedges to the income statement (175.4) 459.7Actuarial losses on defined benefit plans (50.8) (6.2)Tax effect of items recognised directly to equity 34.2 65.6other comprehensive loss for the period (net of tax) from continuing operations (76.0) (230.1)
other comprehensive income from discontinued operationsMovement in translation of foreign operations taken to equity 0.4 (2.6)Movement in the fair value of cash flow hedges (0.3) 0.1Tax effect of items recognised directly to equity 0.2 (0.3)other comprehensive income/(loss) for the period (net of tax) from discontinued operations 0.3 (2.8)
Total comprehensive income from continuing operations 2,107.4 1,893.5Total comprehensive (loss)/income from discontinued operations (365.9) 13.9total comprehensive income for the period 1,741.5 1,907.4
total comprehensive income from continuing operations attributable to:Equity holders of Woolworths Limited 2,106.9 1,877.2Non-controlling interests 0.5 16.3total comprehensive income for the period from continuing operations 2,107.4 1,893.5
total comprehensive (loss)/income from discontinued operations attributable to:Equity holders of Woolworths Limited (365.9) 13.9
total comprehensive (loss)/income for the period from discontinued operations (365.9) 13.9
CONSOLIDATED STATEMENT OF COMPREHENSIVE INCOME – WOOLWORTHS LIMITED
97
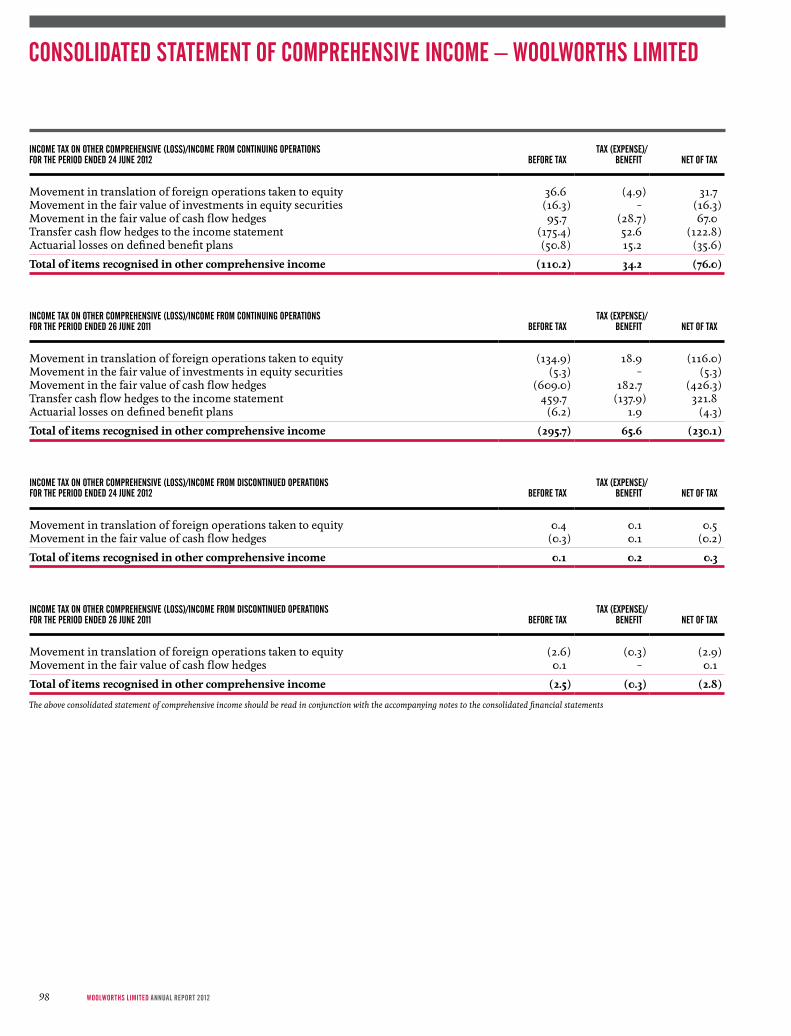
INCOME TAx ON OTHER COMPREHENSIVE (LOSS)/INCOME FROM CONTINuING OPERATIONSFOR THE PERIOD ENDED 24 juNE 2012 BEFORE TAx
TAx (ExPENSE)/BENEFIT NET OF TAx
Movement in translation of foreign operations taken to equity 36.6 (4.9) 31.7Movement in the fair value of investments in equity securities (16.3) – (16.3)Movement in the fair value of cash flow hedges 95.7 (28.7) 67.0Transfer cash flow hedges to the income statement (175.4) 52.6 (122.8)Actuarial losses on defined benefit plans (50.8) 15.2 (35.6)
total of items recognised in other comprehensive income (110.2) 34.2 (76.0)
INCOME TAx ON OTHER COMPREHENSIVE (LOSS)/INCOME FROM CONTINuING OPERATIONS FOR THE PERIOD ENDED 26 juNE 2011 BEFORE TAx
TAx (ExPENSE)/BENEFIT NET OF TAx
Movement in translation of foreign operations taken to equity (134.9) 18.9 (116.0)Movement in the fair value of investments in equity securities (5.3) – (5.3)Movement in the fair value of cash flow hedges (609.0) 182.7 (426.3)Transfer cash flow hedges to the income statement 459.7 (137.9) 321.8Actuarial losses on defined benefit plans (6.2) 1.9 (4.3)
total of items recognised in other comprehensive income (295.7) 65.6 (230.1)
INCOME TAx ON OTHER COMPREHENSIVE (LOSS)/INCOME FROM DISCONTINuED OPERATIONS FOR THE PERIOD ENDED 24 juNE 2012 BEFORE TAx
TAx (ExPENSE)/BENEFIT NET OF TAx
Movement in translation of foreign operations taken to equity 0.4 0.1 0.5Movement in the fair value of cash flow hedges (0.3) 0.1 (0.2)
total of items recognised in other comprehensive income 0.1 0.2 0.3
INCOME TAx ON OTHER COMPREHENSIVE (LOSS)/INCOME FROM DISCONTINuED OPERATIONSFOR THE PERIOD ENDED 26 juNE 2011 BEFORE TAx
TAx (ExPENSE)/BENEFIT NET OF TAx
Movement in translation of foreign operations taken to equity (2.6) (0.3) (2.9)Movement in the fair value of cash flow hedges 0.1 – 0.1
total of items recognised in other comprehensive income (2.5) (0.3) (2.8)
The above consolidated statement of comprehensive income should be read in conjunction with the accompanying notes to the consolidated financial statements
CONSOLIDATED STATEMENT OF COMPREHENSIVE INCOME – WOOLWORTHS LIMITED
WoolWorths limited AnnuAl report 201298

NOTE
2012$M
2011$M
Current assetsCash 833.4 1,519.6Trade and other receivables 8 869.9 856.1Inventories 3,698.3 3,736.5Other financial assets 9 23.8 120.8
5,425.4 6,233.0Assets classified as held for sale 33 376.7 93.9
total current assets 5,802.1 6,326.9
non-current assetsTrade and other receivables 8 24.5 14.9Other financial assets 9 238.8 119.3Property, plant and equipment 10 9,589.0 8,620.3Intangibles 11 5,282.0 5,236.6Deferred tax assets 5d 644.7 510.4
total non-current assets 15,779.0 14,501.5
total assets 21,581.1 20,828.4
Current liabilitiesTrade and other payables 12 5,242.2 5,246.7Borrowings 14 54.4 1,471.1Current tax liabilities 5c 221.5 204.7Other financial liabilities 13 107.4 238.7Provisions 16 939.8 861.0
6,565.3 8,022.2Liabilities directly associated with assets classified as held for sale 33 200.9 –
total current liabilities 6,766.2 8,022.2
non-current liabilitiesBorrowings 14 4,695.3 3,373.8Other financial liabilities 13 887.2 915.5Provisions 16 527.3 465.2Other 258.8 205.9
total non-current liabilities 6,368.6 4,960.4
total liabilities 13,134.8 12,982.6
net assets 8,446.3 7,845.8
equityIssued capital 17 4,336.6 3,988.6Shares held in trust 17 (60.7) (56.1)Reserves 18 (243.9) (236.8)Retained earnings 19 4,163.4 3,897.5
8,195.4 7,593.2Amounts recognised directly in equity relating to assets classified as held for sale 33 (7.2) –
equity attributable to the members of Woolworths limited 8,188.2 7,593.2Non-controlling interests 258.1 252.6
total equity 8,446.3 7,845.8
The above consolidated balance sheet should be read in conjunction with the accompanying notes to the consolidated financial statements
CONSOLIDATED BALANCE SHEET – WOOLWORTHS LIMITED
99
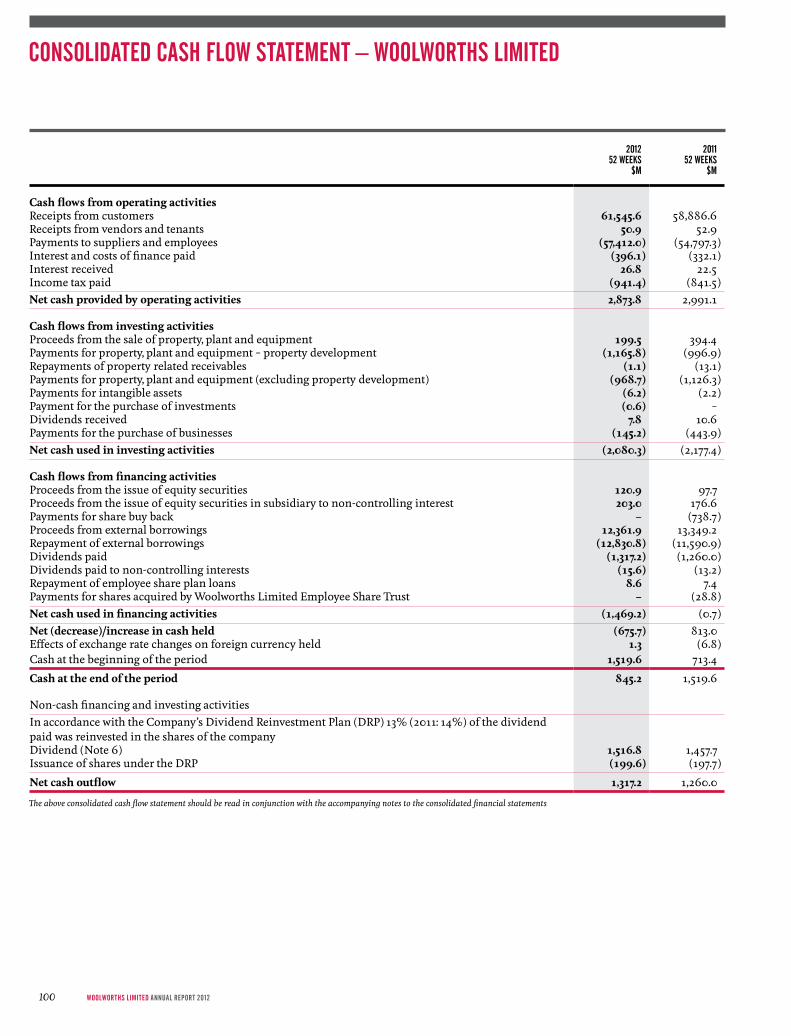
201252 WEEkS
$M
201152 WEEkS
$M
Cash flows from operating activitiesReceipts from customers 61,545.6 58,886.6Receipts from vendors and tenants 50.9 52.9Payments to suppliers and employees (57,412.0) (54,797.3)Interest and costs of finance paid (396.1) (332.1)Interest received 26.8 22.5Income tax paid (941.4) (841.5)net cash provided by operating activities 2,873.8 2,991.1
Cash flows from investing activitiesProceeds from the sale of property, plant and equipment 199.5 394.4Payments for property, plant and equipment – property development (1,165.8) (996.9)Repayments of property related receivables (1.1) (13.1)Payments for property, plant and equipment (excluding property development) (968.7) (1,126.3)Payments for intangible assets (6.2) (2.2)Payment for the purchase of investments (0.6) –Dividends received 7.8 10.6Payments for the purchase of businesses (145.2) (443.9)net cash used in investing activities (2,080.3) (2,177.4)
Cash flows from financing activitiesProceeds from the issue of equity securities 120.9 97.7Proceeds from the issue of equity securities in subsidiary to non-controlling interest 203.0 176.6Payments for share buy back – (738.7)Proceeds from external borrowings 12,361.9 13,349.2Repayment of external borrowings (12,830.8) (11,590.9)Dividends paid (1,317.2) (1,260.0)Dividends paid to non-controlling interests (15.6) (13.2)Repayment of employee share plan loans 8.6 7.4Payments for shares acquired by Woolworths Limited Employee Share Trust – (28.8)net cash used in financing activities (1,469.2) (0.7)net (decrease)/increase in cash held (675.7) 813.0Effects of exchange rate changes on foreign currency held 1.3 (6.8)Cash at the beginning of the period 1,519.6 713.4
Cash at the end of the period 845.2 1,519.6
Non-cash financing and investing activitiesIn accordance with the Company’s Dividend Reinvestment Plan (DRP) 13% (2011: 14%) of the dividend paid was reinvested in the shares of the companyDividend (Note 6) 1,516.8 1,457.7Issuance of shares under the DRP (199.6) (197.7)
net cash outflow 1,317.2 1,260.0
The above consolidated cash flow statement should be read in conjunction with the accompanying notes to the consolidated financial statements
CONSOLIDATED CASH FLOW STATEMENT – WOOLWORTHS LIMITED
WoolWorths limited AnnuAl report 2012100
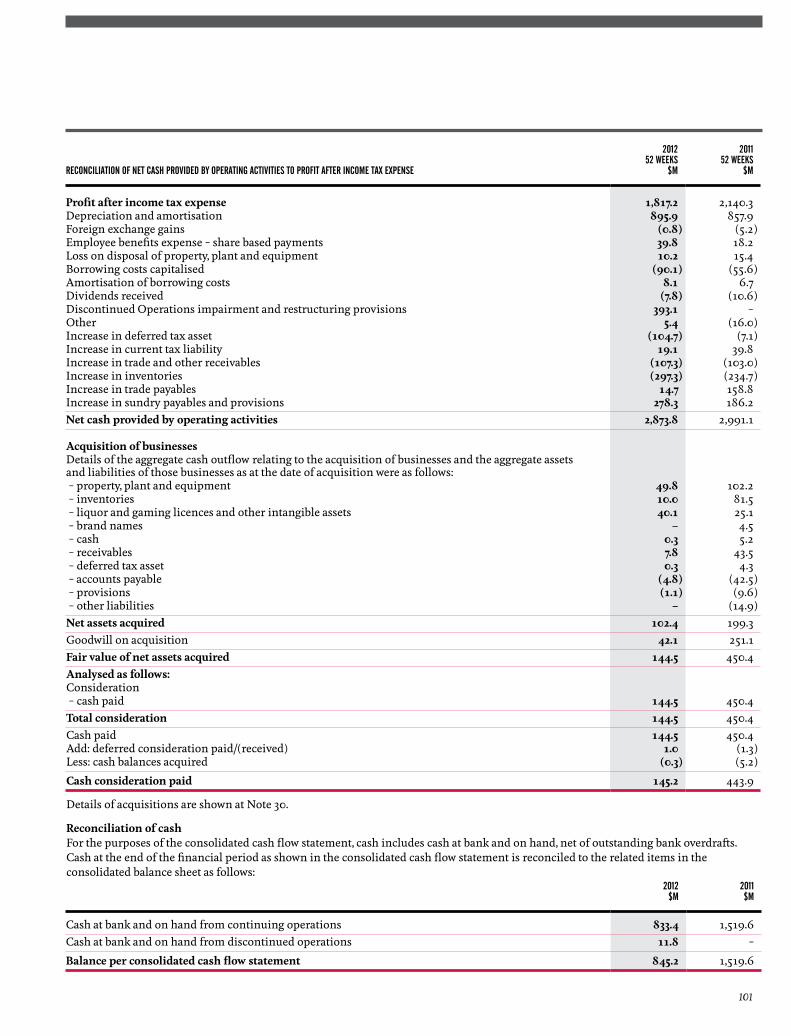
RECONCILIATION OF NET CASH PROVIDED By OPERATING ACTIVITIES TO PROFIT AFTER INCOME TAx ExPENSE
201252 WEEkS
$M
2011 52 WEEkS
$M
Profit after income tax expense 1,817.2 2,140.3Depreciation and amortisation 895.9 857.9Foreign exchange gains (0.8) (5.2)Employee benefits expense – share based payments 39.8 18.2Loss on disposal of property, plant and equipment 10.2 15.4Borrowing costs capitalised (90.1) (55.6)Amortisation of borrowing costs 8.1 6.7Dividends received (7.8) (10.6)Discontinued Operations impairment and restructuring provisions 393.1 –Other 5.4 (16.0)Increase in deferred tax asset (104.7) (7.1)Increase in current tax liability 19.1 39.8Increase in trade and other receivables (107.3) (103.0)Increase in inventories (297.3) (234.7)Increase in trade payables 14.7 158.8Increase in sundry payables and provisions 278.3 186.2net cash provided by operating activities 2,873.8 2,991.1
acquisition of businessesDetails of the aggregate cash outflow relating to the acquisition of businesses and the aggregate assets and liabilities of those businesses as at the date of acquisition were as follows: – property, plant and equipment 49.8 102.2 – inventories 10.0 81.5 – liquor and gaming licences and other intangible assets 40.1 25.1 – brand names – 4.5 – cash 0.3 5.2 – receivables 7.8 43.5 – deferred tax asset 0.3 4.3 – accounts payable (4.8) (42.5) – provisions (1.1) (9.6) – other liabilities – (14.9)net assets acquired 102.4 199.3Goodwill on acquisition 42.1 251.1Fair value of net assets acquired 144.5 450.4analysed as follows:Consideration – cash paid 144.5 450.4total consideration 144.5 450.4Cash paid 144.5 450.4Add: deferred consideration paid/(received) 1.0 (1.3)Less: cash balances acquired (0.3) (5.2)
Cash consideration paid 145.2 443.9
Details of acquisitions are shown at Note 30.
Reconciliation of cashFor the purposes of the consolidated cash flow statement, cash includes cash at bank and on hand, net of outstanding bank overdrafts. Cash at the end of the financial period as shown in the consolidated cash flow statement is reconciled to the related items in the consolidated balance sheet as follows:
2012$M
2011$M
Cash at bank and on hand from continuing operations 833.4 1,519.6Cash at bank and on hand from discontinued operations 11.8 –
Balance per consolidated cash flow statement 845.2 1,519.6
101
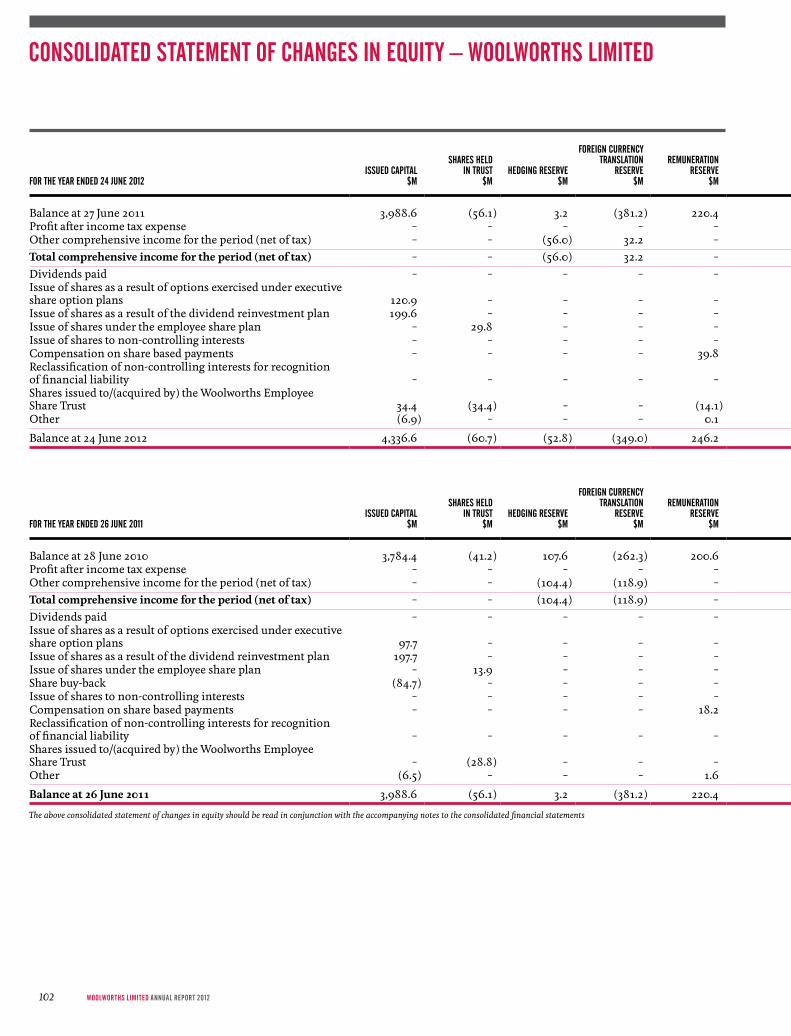
FOR THE yEAR ENDED 24 juNE 2012ISSuED CAPITAL
$M
SHARES HELDIN TRuST
$MHEDGING RESERVE
$M
FOREIGN CuRRENCyTRANSLATION
RESERVE$M
REMuNERATIONRESERVE
$M
ASSET REVALuATIONRESERVE
$M
EQuITy INSTRuMENTRESERVE
$MRETAINED EARNINGS
$M
EQuITy ATTRIBuTABLETO MEMBERS OF
WOOLWORTHS LIMITED$M
NON-CONTROLLINGINTERESTS
$M
TOTALEQuITy
$M
Balance at 27 June 2011 3,988.6 (56.1) 3.2 (381.2) 220.4 16.4 (95.6) 3,897.5 7,593.2 252.6 7,845.8Profit after income tax expense – – – – – – – 1,816.7 1,816.7 0.5 1,817.2Other comprehensive income for the period (net of tax) – – (56.0) 32.2 – – (16.3) (35.6) (75.7) – (75.7)total comprehensive income for the period (net of tax) – – (56.0) 32.2 – – (16.3) 1,781.1 1,741.0 0.5 1,741.5Dividends paid – – – – – – – (1,516.8) (1,516.8) (15.6) (1,532.4)Issue of shares as a result of options exercised under executive share option plans 120.9 – – – – – – – 120.9 – 120.9Issue of shares as a result of the dividend reinvestment plan 199.6 – – – – – – – 199.6 – 199.6Issue of shares under the employee share plan – 29.8 – – – – – – 29.8 – 29.8Issue of shares to non-controlling interests – – – – – – – – – 110.0 110.0Compensation on share based payments – – – – 39.8 – – – 39.8 – 39.8Reclassification of non-controlling interests for recognition of financial liability – – – – – – – – – (89.1) (89.1)Shares issued to/(acquired by) the Woolworths Employee Share Trust 34.4 (34.4) – – (14.1) – – – (14.1) – (14.1)Other (6.9) – – – 0.1 – – 1.6 (5.2) (0.3) (5.5)
Balance at 24 June 2012 4,336.6 (60.7) (52.8) (349.0) 246.2 16.4 (111.9) 4,163.4 8,188.2 258.1 8,446.3
FOR THE yEAR ENDED 26 juNE 2011ISSuED CAPITAL
$M
SHARES HELDIN TRuST
$MHEDGING RESERVE
$M
FOREIGN CuRRENCyTRANSLATION
RESERVE$M
REMuNERATIONRESERVE
$M
ASSET REVALuATIONRESERVE
$M
EQuITy INSTRuMENTRESERVE
$MRETAINED EARNINGS
$M
EQuITy ATTRIBuTABLETO MEMBERS OF
WOOLWORTHS LIMITED$M
NON-CONTROLLINGINTERESTS
$M
TOTALEQuITy
$M
Balance at 28 June 2010 3,784.4 (41.2) 107.6 (262.3) 200.6 16.4 (90.3) 3,855.2 7,570.4 247.3 7,817.7Profit after income tax expense – – – – – – – 2,124.0 2,124.0 16.3 2,140.3Other comprehensive income for the period (net of tax) – – (104.4) (118.9) – – (5.3) (4.3) (232.9) – (232.9)total comprehensive income for the period (net of tax) – – (104.4) (118.9) – – (5.3) 2,119.7 1,891.1 16.3 1,907.4Dividends paid – – – – – – – (1,457.7) (1,457.7) (13.2) (1,470.9)Issue of shares as a result of options exercised under executive share option plans 97.7 – – – – – – – 97.7 – 97.7Issue of shares as a result of the dividend reinvestment plan 197.7 – – – – – – – 197.7 – 197.7Issue of shares under the employee share plan – 13.9 – – – – – – 13.9 – 13.9Share buy-back (84.7) – – – – – – (622.4) (707.1) – (707.1)Issue of shares to non-controlling interests – – – – – – – – – 269.6 269.6Compensation on share based payments – – – – 18.2 – – – 18.2 – 18.2Reclassification of non-controlling interests for recognition of financial liability – – – – – – – – – (267.4) (267.4)Shares issued to/(acquired by) the Woolworths Employee Share Trust – (28.8) – – – – – – (28.8) – (28.8)Other (6.5) – – – 1.6 – – 2.7 (2.2) – (2.2)
Balance at 26 June 2011 3,988.6 (56.1) 3.2 (381.2) 220.4 16.4 (95.6) 3,897.5 7,593.2 252.6 7,845.8
The above consolidated statement of changes in equity should be read in conjunction with the accompanying notes to the consolidated financial statements
CONSOLIDATED STATEMENT OF CHANGES IN EQuITy – WOOLWORTHS LIMITED
WoolWorths limited AnnuAl report 2012102
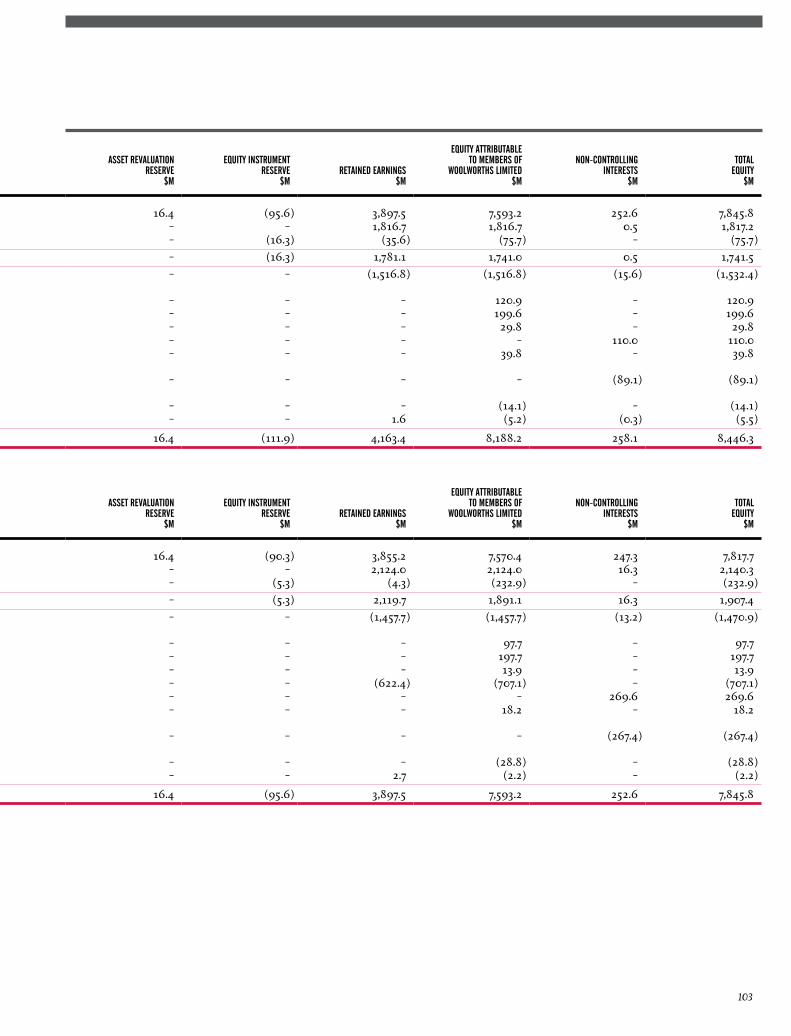
FOR THE yEAR ENDED 24 juNE 2012ISSuED CAPITAL
$M
SHARES HELDIN TRuST
$MHEDGING RESERVE
$M
FOREIGN CuRRENCyTRANSLATION
RESERVE$M
REMuNERATIONRESERVE
$M
ASSET REVALuATIONRESERVE
$M
EQuITy INSTRuMENTRESERVE
$MRETAINED EARNINGS
$M
EQuITy ATTRIBuTABLETO MEMBERS OF
WOOLWORTHS LIMITED$M
NON-CONTROLLINGINTERESTS
$M
TOTALEQuITy
$M
Balance at 27 June 2011 3,988.6 (56.1) 3.2 (381.2) 220.4 16.4 (95.6) 3,897.5 7,593.2 252.6 7,845.8Profit after income tax expense – – – – – – – 1,816.7 1,816.7 0.5 1,817.2Other comprehensive income for the period (net of tax) – – (56.0) 32.2 – – (16.3) (35.6) (75.7) – (75.7)total comprehensive income for the period (net of tax) – – (56.0) 32.2 – – (16.3) 1,781.1 1,741.0 0.5 1,741.5Dividends paid – – – – – – – (1,516.8) (1,516.8) (15.6) (1,532.4)Issue of shares as a result of options exercised under executive share option plans 120.9 – – – – – – – 120.9 – 120.9Issue of shares as a result of the dividend reinvestment plan 199.6 – – – – – – – 199.6 – 199.6Issue of shares under the employee share plan – 29.8 – – – – – – 29.8 – 29.8Issue of shares to non-controlling interests – – – – – – – – – 110.0 110.0Compensation on share based payments – – – – 39.8 – – – 39.8 – 39.8Reclassification of non-controlling interests for recognition of financial liability – – – – – – – – – (89.1) (89.1)Shares issued to/(acquired by) the Woolworths Employee Share Trust 34.4 (34.4) – – (14.1) – – – (14.1) – (14.1)Other (6.9) – – – 0.1 – – 1.6 (5.2) (0.3) (5.5)
Balance at 24 June 2012 4,336.6 (60.7) (52.8) (349.0) 246.2 16.4 (111.9) 4,163.4 8,188.2 258.1 8,446.3
FOR THE yEAR ENDED 26 juNE 2011ISSuED CAPITAL
$M
SHARES HELDIN TRuST
$MHEDGING RESERVE
$M
FOREIGN CuRRENCyTRANSLATION
RESERVE$M
REMuNERATIONRESERVE
$M
ASSET REVALuATIONRESERVE
$M
EQuITy INSTRuMENTRESERVE
$MRETAINED EARNINGS
$M
EQuITy ATTRIBuTABLETO MEMBERS OF
WOOLWORTHS LIMITED$M
NON-CONTROLLINGINTERESTS
$M
TOTALEQuITy
$M
Balance at 28 June 2010 3,784.4 (41.2) 107.6 (262.3) 200.6 16.4 (90.3) 3,855.2 7,570.4 247.3 7,817.7Profit after income tax expense – – – – – – – 2,124.0 2,124.0 16.3 2,140.3Other comprehensive income for the period (net of tax) – – (104.4) (118.9) – – (5.3) (4.3) (232.9) – (232.9)total comprehensive income for the period (net of tax) – – (104.4) (118.9) – – (5.3) 2,119.7 1,891.1 16.3 1,907.4Dividends paid – – – – – – – (1,457.7) (1,457.7) (13.2) (1,470.9)Issue of shares as a result of options exercised under executive share option plans 97.7 – – – – – – – 97.7 – 97.7Issue of shares as a result of the dividend reinvestment plan 197.7 – – – – – – – 197.7 – 197.7Issue of shares under the employee share plan – 13.9 – – – – – – 13.9 – 13.9Share buy-back (84.7) – – – – – – (622.4) (707.1) – (707.1)Issue of shares to non-controlling interests – – – – – – – – – 269.6 269.6Compensation on share based payments – – – – 18.2 – – – 18.2 – 18.2Reclassification of non-controlling interests for recognition of financial liability – – – – – – – – – (267.4) (267.4)Shares issued to/(acquired by) the Woolworths Employee Share Trust – (28.8) – – – – – – (28.8) – (28.8)Other (6.5) – – – 1.6 – – 2.7 (2.2) – (2.2)
Balance at 26 June 2011 3,988.6 (56.1) 3.2 (381.2) 220.4 16.4 (95.6) 3,897.5 7,593.2 252.6 7,845.8
The above consolidated statement of changes in equity should be read in conjunction with the accompanying notes to the consolidated financial statements
103
1 sIGnIFICant aCCoUntInG PolICIes Woolworths Limited (the “Company”) is a company domiciled in Australia. The Financial Report of the Company for the 52 weeks ended 24 June 2012 comprises the Company and its subsidiaries (together referred to as the “consolidated entity” or “Group”).
The Financial Report was authorised for issue by the Directors on 24 September 2012.
(A) STATEMENT OF COMPLIANCEThis Financial Report is a general purpose financial report which has been prepared in accordance with the Corporations Act 2001, Accounting Standards and Interpretations, and complies with other requirements of the law.
The Financial Report represents the consolidated financial statements of the Group.
Accounting Standards include Australian equivalents to International Financial Reporting Standards (‘A-IFRS’). Compliance with A-IFRS ensures that the financial statements and notes of the consolidated entity comply with International Financial Reporting Standards (‘IFRS’).
(B) BASIS OF PREPARATIONThe Financial Report is presented in Australian dollars.
The Financial Report has been prepared on the historical cost basis except for available-for-sale financial assets, derivative financial instruments, financial instruments held for trading, financial assets valued through other comprehensive income and other financial liabilities that are measured at revalued amounts or fair values, as explained in the accounting policies below.
The accounting policies set out below have been applied consistently to all periods presented in these financial statements.
The comparative income statement and statement of comprehensive income has been re-presented as if an operation discontinued during the current year had been discontinued from the start of the comparative year (see Note 33). In addition, comparative amounts relating to rebates were reclassified from payables to receivables to better reflect the economic nature of the assets and liabilities of the Group.
The Company is of a kind referred to in ASIC Class Order 98/100, dated 10 July 1998 and in accordance with the Class Order, amounts in the Financial Report have been rounded off to the nearest million dollars, unless otherwise stated.
new and amended standards adopted by the Group In the current year, the consolidated entity has adopted all of the new and revised Standards and Interpretations issued by the Australian Accounting Standards Board (the ‘AASB’) that are relevant to its operations and effective for annual reporting periods beginning on or after 26 June 2011. These include:
– AASB 124 ‘Related Party Disclosures’ (2009) and AASB 2009‑12 ‘Amendments to Australian Accounting Standards’;
– AASB 2009‑14 ‘Amendments to Australian Interpretation – Prepayments of a Minimum Funding Requirement’;
– AASB 2010‑3 ‘Amendments to Australian Accounting Standards arising from the Annual Improvements Project’;
– AASB 2010‑4 ‘Further Amendments to Australian Accounting Standards arising from the Annual Improvements Project’; and
– AASB 2010‑5 ‘Amendments to Australian Accounting Standards’.
The adoption of these new and revised accounting standards has not resulted in any significant impact on the financial results as the standards and amendments are primarily concerned with disclosures.
In previous financial periods, the Group early adopted AASB 9 Financial Instruments (December 2009) including AASB 2009-11 Amendments to Australian Accounting Standards arising from AASB 9, AASB 9 Financial Instruments (December 2010) and AASB 2010-7 Amendments to Australian Accounting Standards arising from AASB 9 (December 2009). AASB 9 provides an option to designate and measure an investment in equity instruments at fair value with changes recognised in other comprehensive income and only dividends being recognised in profit or loss. The Group elected to apply this option. The application of this standard affected accounting for the investments in The Warehouse Group Limited and Australian Leisure and Entertainment Property Management Limited (the “ALE Property Group”), both of which have been designated as fair value through other comprehensive income. These changes have been adopted retrospectively with no impact on retained earnings in the current or previous financial years.
Issued standards and interpretations not early adoptedThe following standards and Amendment to Standards were available for early adoption and were applicable to the consolidated entity but have not been applied in these financial statements:
– AASB 1053 ‘Application of Tiers of Accounting Standards’ and AASB 2010-2 ‘Amendments to Australian Accounting Standards arising from Reduced Disclosure Requirements’. Woolworths Limited is listed on the Australian Stock Exchange and is not eligible to adopt the new Australian Accounting Standards – Reduced Disclosure Requirements. Applies to annual reporting periods beginning on or after 1 July 2013;
– AASB 1054 ‘Australian Additional Disclosures’ and AASB 2011-1 ‘Amendments to Australian Accounting Standards arising from Trans‑Tasman Convergence Project’. AASB 1054 sets out the Australian-specific disclosures for entities that have adopted Australian Accounting Standards. AASB 2011-1 deletes various Australian-specific guidance and disclosures from other Standards and aligns the wording used to that adopted in IFRSs. This amendment is not expected to have a significant impact on the financial results of the consolidated entity. Applies to annual reporting periods beginning on or after 1 July 2011;
– AASB 2010-6 Amendments to Australian Accounting Standards – Disclosures on Transfers of Financial Assets. This makes amendments to AASB 7 Financial Instruments: Disclosures, to introduce additional disclosures in respect of risk exposures arising from transferred financial assets. This amendment is not expected to have a significant impact on the financial results of the consolidated entity. Applies to annual reporting periods beginning on or after 1 July 2011;
NOTES TO THE CONSOLIDATED FINANCIAL STATEMENTS
WoolWorths limited AnnuAl report 2012104
– AASB 13 ‘Fair Value Measurement’ and AASB 2011‑8 ‘Amendments to Australian Accounting Standards arising from AASB 13’. This standard establishes a single source of guidance for fair value measurements and disclosures about fair value measurements. Applies to annual reporting periods beginning on or after 1 January 2013;
– AASB 119 ‘Employee Benefits’ (2011) and AASB 2011‑10 ‘Amendments to Australian Accounting Standards arising from AASB 119’ (2011). This standard changes the accounting for defined benefit plans and termination benefits. The most significant change relates to the accounting for changes in defined benefit obligations and plan assets. Applies to annual reporting periods beginning on or after 1 January 2013;
– AASB 2010‑8 ‘Amendments to Australian Accounting Standards – Deferred Tax: Recovery of Underlying Assets’. The amendments to AASB 112 provide an exception to the general principles in AASB 112 that the measurement of deferred tax assets and deferred tax liabilities should reflect the tax consequences that would follow from the manner in which the entity expects to recover the carrying amount of an asset. This amendment is not expected to have a significant impact on the financial results of the consolidated entity. Applies to annual reporting periods beginning on or after 1 January 2012;
– AASB 2011‑4 ‘Amendments to Australian Accounting Standards to Remove Individual Key Management Personnel Disclosure Requirements’. Applies to annual reporting periods beginning on or after 1 July 2013; and
– AASB 2011‑9 ‘Amendments to Australian Accounting Standards – Presentation of Items of Other Comprehensive Income’. Applies to annual reporting periods beginning on or after 1 July 2012.
In August 2011, a package of six Standards on consolidation, joint arrangements, associates and disclosures was issued, including AASB 10, AASB 11, AASB 12, AASB 127 (2011), AASB 128 (2011) and AASB 2011-7. These six standards are effective for annual periods beginning on or after 1 January 2013. Key requirements of these six Standards are described below.
– AASB 10 ‘Consolidated Financial Statements’. This standard includes a new definition of control. This standard is not expected to have a significant impact on amounts reported in the consolidated financial statements;
– AASB 11 ‘Joint Arrangements’. This standard deals with how a joint arrangement of which two or more parties have joint control should be classified. It also changes the accounting for jointly controlled entities. This standard is not expected to have a significant impact on amounts reported in the consolidated financial statements;
– AASB 12 ‘Disclosure of Interests in Other Entities’. This is a disclosure standard and is applicable to entities that have interests in subsidiaries, joint arrangements, associates and/or unconsolidated structured entities. In general, the disclosure requirements in AASB 12 are more extensive than those in the current standards;
– AASB 127 ‘Separate Financial Statements’ (2011). This standard is amended by the issuance of AASB 10;
– AASB 128 ‘Investments in Associates and Joint Ventures’ (2011). This standard is amended by the issuance of AASB 10; and
– AASB 2011‑7 ‘Amendments to Australian Accounting Standards arising from the Consolidation and Joint Arrangements standards’.
The following pronouncements approved by the International Accounting Standards Board (IASB)/International Financial Reporting Interpretations Committee (IFRIC) have been identified as those which may impact the Group in the future. An equivalent pronouncement has not yet been issued by the AASB:
– Offsetting Financial Assets and Financial Liabilities (Amendments to IAS 32). Applies to annual reporting periods beginning on or after 1 January 2014;
– Disclosures – Offsetting Financial Assets and Financial Liabilities (Amendments to IFRS 7). Applies to annual reporting periods beginning on or after 1 January 2013; and
– Mandatory Effective Date of IFRS 9 and Transition Disclosures (Amendments to IFRS 9 and IFRS 7). Applies to annual reporting periods beginning on or after 1 January 2015.
The Group has not yet determined the potential effect of these pronouncements on its future financial periods.
Critical accounting estimatesThe preparation of a Financial Report in conformity with Australian Accounting Standards requires management to make judgements, estimates and assumptions that effect the application of policies and reported amounts of assets and liabilities, income and expenses. The estimates and associated assumptions are based on historical experience and various other factors that are believed to be reasonable under the circumstances, the results of which form the basis of making the judgments about carrying values of assets and liabilities that are not readily apparent from other sources. Actual results may differ from these estimates.
Management, together with the Audit, Risk Management and Compliance Committee, determines the development, selection and disclosure of the consolidated entity’s critical accounting policies and estimates and the application of these policies and estimates.
The estimates and judgments that have a risk of causing a significant adjustment to the carrying amounts of assets and liabilities within the next financial year are included in the following notes:
– Note 1(G) and I(I) – Estimation of useful lives of assets; – Note 10 – Impairment of tangible assets; – Note 11 – Impairment of intangible assets; and – Note 1(Q) and 16 – Self-insured risks provisions.
The estimates and underlying assumptions are reviewed on an ongoing basis. Revisions to accounting estimates and underlying assumptions are recognised in the period in which the estimate is revised if the revision affects only that period; or in the period and future periods if the revision affects both current and future periods.
105
1 sIGnIFICant aCCoUntInG PolICIes ContInUed
(C) BASIS FOR CONSOLIDATION(i) subsidiariesThese consolidated financial statements incorporate the assets and liabilities of all subsidiaries of Woolworths Limited (“the Company”) as at 24 June 2012 and the results of all subsidiaries for the period then ended.
Subsidiaries are entities controlled by the Company. Control exists when the Company has the power, directly or indirectly, to govern the financial and operating policies of an entity so as to obtain benefits from its activities. In assessing control, potential voting rights that presently are exercisable or convertible are taken into account. The financial statements of subsidiaries are included in the Financial Report from the date that control commences until the date that control ceases.
Non-controlling interests in the equity and results of subsidiaries are shown as a separate item in the consolidated Financial Report.
(ii) transactions eliminated on consolidationIntra-group balances and transactions and any unrealised gains and losses or income and expenses arising from intra-group transactions, are eliminated in preparing the consolidated Financial Report.
(D) FOREIGN CURRENCyTransactions in foreign currencies are translated at the foreign exchange rate ruling at the date of the transaction. Monetary assets and liabilities denominated in foreign currencies are translated to Australian dollars at the foreign exchange rate ruling at the balance sheet date. Non-monetary assets and liabilities that are measured in terms of historical cost in a foreign currency are translated using the exchange rate at the date of the transaction.
Exchange differences are recognised in the profit or loss in the period in which they arise except that:
– exchange differences on transactions entered into in order to hedge certain foreign currency risks are reported initially in the hedging reserve to the extent the hedge is effective (refer Note 1(F)); and
– exchange differences on monetary items receivable from or payable to a foreign operation for which settlement is neither planned nor likely to occur, and which form part of the net investment in a foreign operation, are recognised in the foreign currency translation reserve and recognised in profit or loss on disposal of the net investment.
Financial statements of foreign operationsThe assets and liabilities of foreign operations, including goodwill and fair value adjustments arising on consolidation, are translated to Australian dollars at foreign exchange rates ruling at the balance sheet date. Revenue and expense items are translated at the average exchange rates for the period. Exchange differences arising on translation of foreign operations, if any, are recognised in the foreign currency translation reserve and recognised in consolidated profit and loss on disposal of the foreign operation.
(E) DERIVATIVE FINANCIAL INSTRUMENTSThe consolidated entity uses derivative financial instruments to hedge its exposure to foreign exchange and interest rate risks arising from operational, financing and investment activities. In accordance with its treasury policy, the consolidated entity does not hold or issue derivative financial instruments for trading purposes. However, derivatives that do not qualify for hedge accounting are accounted for as trading instruments.
Derivative financial instruments are recognised initially at fair value on the date a derivative contract is entered into. Subsequent to initial recognition, derivative financial instruments are stated at fair value. The gain or loss on remeasurement to fair value is recognised immediately in profit or loss unless the derivatives qualify for hedge accounting whereby the timing of the recognition of any resultant gain or loss depends on the nature of the hedge relationship (refer Note 1(F)).
The fair value of interest rate swaps is the estimated amount that the consolidated entity would receive or pay to terminate the swap at the balance sheet date, taking into account current interest rates and the time to maturity.
The fair value of forward exchange contracts is their quoted market price at the balance sheet date, being the present value of the quoted forward price.
(F) HEDGING(i) Cash flow hedgeA cash flow hedge is a hedge of an exposure to uncertain future cash flows. A cash flow hedge results in the uncertain future cash flows being hedged back into fixed amounts. Woolworths’ cash flow hedges include:
– Interest rate swap contracts that convert floating interest rate payments on borrowings into fixed amounts;
– Cross currency interest rate swaps (‘CCIRS’) that convert foreign currency denominated principal and interest rate payments on offshore loans into fixed Australian dollar amounts; and
– Forward foreign exchange contracts that convert foreign currency denominated payments to offshore suppliers and income of offshore subsidiaries into Australian dollar amounts.
Where a derivative financial instrument is designated as a hedge of the variability in cash flows of a recognised asset or liability, or a highly probable forecasted transaction, the effective part of any gain or loss on the derivative financial instrument is recognised directly in equity.
When the forecasted transaction subsequently results in the recognition of a non-financial asset or non-financial liability, the associated cumulative gain or loss is removed from equity and included in the initial cost or other carrying amount of the non-financial asset or liability. If a hedge of a forecasted transaction subsequently results in the recognition of a financial asset or a financial liability, then the associated gains and losses that were recognised directly in equity are reclassified into profit or loss in the same period or periods during which the asset acquired or
NOTES TO THE CONSOLIDATED FINANCIAL STATEMENTS
WoolWorths limited AnnuAl report 2012106
liability assumed affects profit or loss (i.e. when interest income or expense is recognised).
The ineffective part of any derivative designated as a hedge is recognised immediately in the consolidated income statement.
When a hedging instrument expires or is sold, terminated or exercised, or the entity revokes designation of the hedge relationship but the hedged forecast transaction still is expected to occur, the cumulative gain or loss at that point remains in equity and is recognised in accordance with the above policy when the transaction occurs. If the hedged transaction is no longer expected to take place, then the cumulative unrealised gain or loss recognised in equity is recognised immediately in the consolidated income statement.
Gains or losses removed from equity during the period in relation to interest rate hedge instruments are recognised within “net finance costs” in the consolidated income statement.
(ii) Fair value hedgeA fair value hedge is a hedge of a fair value (i.e. “mark-to-market”) exposure arising on a recognised balance sheet asset or liability. A fair value hedge results in the fair value exposure being offset.
Changes in the fair value of derivatives that are designated and qualify as fair value hedges are recorded in profit or loss immediately, together with any changes in the fair value of the hedged asset or liability that is attributable to the hedged risk.
Hedge accounting is discontinued when the hedge instrument expires or is sold, terminated, exercised, or no longer qualifies for hedge accounting. The adjustment to the carrying amount of the hedged item arising from the hedged risk is amortised to profit or loss from that date.
(iii) hedge of monetary assets and liabilities When a derivative financial instrument is used to hedge economically the foreign exchange exposure of a recognised monetary asset or liability, hedge accounting is not applied and any gain or loss on the hedging instrument is recognised in the consolidated income statement.
(G) PROPERTy, PLANT AND EQUIPMENTFreehold land, warehouse, retail, development and other properties are held at the lower of cost less accumulated depreciation and recoverable value (refer Note 1(M)).
Borrowing, holding and development costs on property under development are capitalised until completion of the development.
Land and buildings held for sale are classified as current assets and are valued at the lower of cost and fair value less costs to sell and are not depreciated.
Items of plant and equipment are stated at cost less accumulated depreciation (see below) and impairment losses (refer Note 1(M)).
The cost of self-constructed assets includes the cost of materials, direct labour and an appropriate proportion of overheads. The cost of self-constructed assets and acquired assets includes estimates
of the costs of dismantling and removing the items and restoring the site on which they are located where it is probable that such costs will be incurred and changes in the measurement of existing liabilities recognised for these costs resulting from changes in the timing or outflow of resources required to settle the obligation or from changes in the discount rate.
Property that is being constructed or developed for future use is classified as development properties and stated at the lower of cost less accumulated depreciation and recoverable value (refer Note 1(M)) until construction or development is complete.
Where parts of an item of property, plant and equipment have different useful lives, they are accounted for as separate items of property, plant and equipment.
(i) leased assetsLeases whereby the consolidated entity assumes substantially all of the risks and rewards of ownership are classified as finance leases. Property acquired by way of a finance lease is stated at an amount equal to the lower of its fair value and the present value of the minimum lease payments at inception of the lease, less accumulated depreciation (see below) and impairment losses (refer Note 1(M)). Lease payments are accounted for as described in Note 1(T).
(ii) depreciation(a) Buildings, plant and equipmentBuildings and plant comprising lifts, air conditioning, fire protection systems and other installations are depreciated on a straight-line basis over the estimated useful life of the asset to the consolidated entity. Estimates of remaining useful lives are made on a regular basis for all assets.
The expected useful lives are as follows:
2012 2011
Buildings 25–40 years 25–40 years
Plant and equipment* 3–10 years 3–10 years
* Some immaterial assets have a useful life of greater than 10 years
(b) Leasehold improvementsThe cost of leasehold improvements is amortised over the remaining period of the individual leases or the estimated useful life of the improvement to the consolidated entity, whichever is the shorter. Leasehold improvements held at the reporting date are amortised over a maximum period of 20 years for retail properties and 40 years for hotels.
107
1 sIGnIFICant aCCoUntInG PolICIes ContInUed(c) Plant and equipmentPlant, equipment and shop fittings (including application software) are depreciated on a straight-line basis over the estimated useful life of the asset to the consolidated entity. Estimates of remaining useful lives are made on a regular basis for all assets.
The expected useful lives are as follows:
2012 2011
Plant and equipment* 2.5–10 years 2.5–10 years
* Some immaterial assets have a useful life of greater than 10 years
(d) Proceeds from sale of assetsThe gross proceeds of asset sales are recognised at the date that an unconditional contract of sale is exchanged with the purchaser. The net gain/(net loss) is recorded in other income/(other expenses).
(H) GOODWILLBusiness combinations prior to 27 June 2004As part of its transition to A-IFRS, the consolidated entity elected to restate only those business combinations that occurred on or after 27 June 2004. In respect of business combinations prior to 27 June 2004, goodwill is included on the basis of its deemed cost, which represents the amount recorded under previous Australian GAAP.
Business combinations since 27 June 2004All business combinations are accounted for by applying the purchase method. Entities and businesses acquired are accounted for using the cost method of accounting, whereby fair values are assigned to all the identifiable underlying assets acquired and liabilities assumed, including contingent liabilities, at the date of acquisition.
Goodwill represents the difference between the cost of the acquisition and the fair value of the net identifiable assets acquired. Goodwill is not amortised, but tested for impairment annually and whenever an indication of impairment exists (refer Note 1(M)). Goodwill is stated at cost less any accumulated impairment losses. Goodwill is allocated to cash-generating units. Any impairment is recognised directly in the consolidated income statement and is not subsequently reversed.
(I) OTHER INTANGIBLES(i) Brand namesBrand names recognised by the consolidated entity generally have an indefinite useful life and are not amortised. Each period, the useful life of this asset is reviewed to determine whether events and circumstances continue to support an indefinite useful life assessment for the asset. Such assets are tested for impairment in accordance with the policy stated in Note 1(M).
(ii) liquor licencesLiquor licences are valued at cost. Liquor licences are considered to have an indefinite useful life. As a consequence, no amortisation is charged. They are tested for impairment annually and whenever an indication of impairment exists. Any impairment is recognised immediately in profit or loss.
(iii) Gaming licencesGaming licences are valued at cost. Gaming licences are considered to have an indefinite useful life. As a consequence, no amortisation is charged. They are tested for impairment annually and whenever an indication of impairment exists. Any impairment is recognised immediately in profit or loss.
(iv) Research and developmentExpenditure on research activities, undertaken with the prospect of gaining new technical knowledge and understanding, is recognised in the profit and loss as an expense as incurred.
Expenditure on development activities, whereby research findings are applied to a plan or design for the production of new or substantially improved products and processes, is capitalised if the product or process is technically and commercially feasible and the consolidated entity has sufficient resources to complete development. The expenditure capitalised includes the cost of materials, direct labour and an appropriate proportion of overheads.
Other development expenditure is recognised in the income statement as an expense as incurred. Capitalised development expenditure is stated at cost less accumulated amortisation and impairment losses (refer Note 1(M)).
(v) other intangible assetsOther intangible assets that are acquired by the consolidated entity are stated at cost. These are considered to have an indefinite useful life. As a consequence, no amortisation is charged. Expenditure on internally generated goodwill and brand names is recognised in profit or loss as an expense as incurred.
(J) FINANCIAL ASSETSFinancial assets valued through other comprehensive incomeThe consolidated entity’s investments in equity securities are designated as financial assets valued through other comprehensive income. The investments are initially measured at fair value net of transaction costs.
Subsequent to initial recognition the equity investments are measured at fair value with any change recorded through the equity instrument reserve. Dividend income is recognised in profit or loss in accordance with AASB 118 Revenue. This treatment has been selected as the equity investments in the Warehouse Group Limited and the Australian Leisure and Entertainment Property Management Limited (“ALE Property Group”) are deemed to be strategic equity investments.
trade and other receivablesTrade and other receivables are stated at their cost less impairment losses (refer Note 1(M)).
NOTES TO THE CONSOLIDATED FINANCIAL STATEMENTS
WoolWorths limited AnnuAl report 2012108
(K) INVENTORIESInventories are valued at the lower of cost or net realisable value.
Cost includes all purchase related rebates, settlement discounts and other costs incurred to bring inventory to its present condition and location for sale.
Net realisable value is the estimated selling price in the ordinary course of business, less the estimated costs of completion and selling expenses.
Where inventory systems do not provide appropriate item level information, the retail method technique is adopted in order to measure cost.
(L) CASH AND CASH EQUIVALENTSCash and cash equivalents comprise cash balances and call deposits with an original maturity of three months or less. Bank overdrafts that are repayable on demand and form an integral part of the consolidated entity’s cash management are included as a component of cash and cash equivalents for the purpose of the consolidated cash flow statement.
(M) IMPAIRMENTThe carrying amounts of the consolidated entity’s tangible assets, excluding inventories (refer Note 1(K)) and deferred tax assets (refer Note 1 (V)), are reviewed at each reporting date to determine whether there is any indication of impairment. If any such indication exists, the asset’s recoverable amount is estimated (refer below).
For goodwill and other intangible assets that have an indefinite useful life and intangible assets that are not yet available for use, the recoverable amount is estimated annually and whenever there is an impairment indicator.
An impairment loss is recognised whenever the carrying amount of an asset or its cash generating unit (‘CGU’) exceeds its recoverable amount. Impairment losses are recognised in the income statement unless the asset has previously been revalued, in which case the impairment loss is recognised as a reversal to the extent of that previous revaluation with any excess recognised through the consolidated income statement.
(i) Calculation of recoverable amountThe recoverable amount of the consolidated entity’s investments in held-to-maturity securities and receivables is calculated as the present value of estimated future cash flows, discounted at the original effective interest rate (that is, the effective interest rate computed at initial recognition of these financial assets). Receivables with a short duration are not discounted.
Impairment of receivables is not recognised until objective evidence is available that a loss event has occurred. Significant receivables are individually assessed for impairment.
Impairment testing of significant receivables that are not assessed as impaired individually is performed by placing them into
portfolios of significant receivables with similar risk profiles and undertaking a collective assessment of impairment.
Non-significant receivables are not individually assessed. Instead, impairment testing is performed by placing non-significant receivables in portfolios of similar risk profiles, based on objective evidence from historical experience adjusted for any effects of conditions existing at each balance date.
The recoverable amount of other assets is the greater of their fair value less costs to sell and value in use. In assessing value in use, the estimated future cash flows are discounted to their present value using a pre-tax discount rate that reflects current market assessments of the time value of money and the risks specific to the asset. For an asset that does not generate largely independent cash inflows, the recoverable amount is determined for the cash-generating unit to which the asset belongs.
Impairment losses recognised in respect of a CGU will be allocated first to reduce the carrying amount of any goodwill allocated to the CGU and then to reduce the carrying amount of the other assets in the unit on a pro-rata basis to their carrying amounts.
(ii) Reversals of impairmentAn impairment loss in respect of a held-to-maturity security or receivable is reversed if the subsequent increase in recoverable amount can be related objectively to an event occurring after the impairment loss was recognised.
An impairment loss in respect of goodwill is not reversed. In respect of other assets, an impairment loss is reversed if there has been a change in the estimates used to determine the recoverable amount.
An impairment loss is reversed only to the extent that the asset’s carrying amount does not exceed the carrying amount that would have been determined, net of depreciation or amortisation, if no impairment loss had been recognised.
(N) CAPITAL(i) debt and equity instrumentsDebt and equity instruments are classified as either liabilities or equity in accordance with the substance of the contractual arrangement.
(ii) transaction costs on the issue of equity instrumentsTransaction costs arising on the issue of equity instruments are recognised directly in equity as a reduction of the proceeds of the equity instruments to which the costs relate. Transaction costs are the costs that are incurred directly in connection with the issue of those equity instruments and which would not have been incurred had those instruments not been issued.
(iii) Interest and dividendsInterest and dividends are classified as expenses or as distributions of profit consistent with the balance sheet classification of the related debt or equity instruments or component parts of compound instruments.
109
1 sIGnIFICant aCCoUntInG PolICIes ContInUed
(O) BORROWINGSBorrowings are recognised initially at fair value less attributable transaction costs. Subsequent to initial recognition, borrowings are stated at amortised cost with any difference between cost and redemption value recognised in the consolidated income statement over the period of the borrowings.
Borrowing costs directly attributable to qualifying assets are capitalised as part of the cost of those assets.
(P) EMPLOyEE BENEFITSThe Company sponsors a Superannuation Plan (the ‘Plan’) that provides accumulation type benefits to permanent salaried employees and their dependants on retirement, total disablement or death. Defined benefits have been preserved for members of certain former superannuation funds sponsored by the Company, which are now provided for in the Plan.
The Company’s commitment in respect of accumulation benefits under the Plan is limited to making the specified contributions in accordance with the Rules of the Plan and/or any statutory obligations.
(i) defined contribution plansObligations for contributions to defined contribution superannuation plans are recognised as an expense in the income statement as incurred.
(ii) defined benefit plansWoolworths is the employer sponsor of a defined benefit superannuation fund. Under A-IFRS, the employer sponsor is required to recognise a liability (or asset) where the present value of the defined benefit obligation, adjusted for unrecognised past service cost, exceeds (is less than) the fair value of the underlying net assets of the fund (hereinafter referred to as the “defined benefit obligation”).
The consolidated entity’s net obligation in respect of defined benefit plans is calculated separately for each plan by estimating the amount of future benefit that employees have earned in return for their service in the current and prior periods. That benefit is discounted to determine its present value.
The discount rate is the yield at the balance sheet date on Government bonds that have maturity dates approximating the terms of the consolidated entity’s obligations. The calculation is performed by a qualified actuary using the projected unit credit method.
When the benefits of a plan are improved, the portion of the increased benefit relating to past service by employees is recognised as an expense in the income statement on a straight-line basis over the average period until the benefits become vested. To the extent that the benefits vest immediately, the expense is recognised immediately in the consolidated income statement.
All movements in the defined benefit obligation are recognised in the consolidated income statement except actuarial gains
and losses. All actuarial gains and losses as at 28 June 2004, the date of transition to A-IFRS, were recognised. Actuarial gains and losses that arise subsequent to 28 June 2004 are recognised in full in retained earnings in the period in which they occur and are presented in the consolidated statement of comprehensive income.
When the calculation results in plan assets exceeding liabilities to the consolidated entity, the recognised asset is limited to the net total of any unrecognised actuarial losses and past service costs and the present value of any future refunds from the plan or reductions in future contributions to the plan.
(iii) long-term service benefitsThe consolidated entity’s net obligation in respect of long-term service benefits, other than pension plans, is the amount of future benefit that employees have earned in return for their service in the current and prior periods. The obligation is calculated using expected future increases in wage and salary rates including related on-costs and expected settlement dates and is discounted using the rates attached to Government bonds at the balance sheet date which have maturity dates approximating the terms of the consolidated entity’s obligations.
(iv) share-based payment transactionsEquity settled share based payments form part of the remuneration of employees (including executives) of the consolidated entity.
The consolidated entity recognises the fair value at the grant date of equity settled share based payments (such as options or performance rights) as an employee benefit expense proportionally over the vesting period with a corresponding increase in equity. Fair value is measured at grant date using a Monte Carlo simulation option pricing model performed by an independent valuer which takes into account market based performance conditions. The fair value per instrument is multiplied by the number of instruments expected to vest based on achievement of non-market based performance conditions (e.g. service conditions) to determine the total cost. This total cost is recognised as an employee benefit expense proportionally over the vesting period during which the employees become unconditionally entitled to the instruments.
On vesting and over the vesting period the amount recognised as an employee benefit expense will be adjusted to reflect the actual number of options that vest except where forfeiture is due to failure to achieve market based performance conditions.
The consolidated entity operated an Employee Share Plan (ESP) whereby it provided interest free loans to selected employees to purchase shares in the Company. All shares acquired under the ESP are held by a wholly owned subsidiary of Woolworths as trustee of the share plan trust. Dividends paid by Woolworths are used to repay the loan (after payment of a portion of the dividend to the employee to cover any tax liabilities).
The loans are limited recourse and if the employee elects not to repay the loan, the underlying shares are sold to recover the outstanding loan balance. These have been accounted for as an in-substance option in the financial statements of the consolidated entity.
NOTES TO THE CONSOLIDATED FINANCIAL STATEMENTS
WoolWorths limited AnnuAl report 2012110
(v) Wages and salaries and related employee benefitsProvision is made for benefits accruing to employees in respect of wages and salaries, annual leave, long service leave and sick leave when it is probable that settlement will be required and they are capable of being reliably measured. Provisions made in respect of employee benefits expected to be settled within 12 months are recognised and are measured at their nominal values using the remuneration rate expected to apply at the time of settlement.
Provisions made in respect of employee benefits which are not expected to be settled within 12 months are recognised and measured as the present value of expected future payments to be made in respect of services provided by employees up to period end. Consideration is given to expected future wage and salary levels, experience of employee departures and periods of service.
(Q) PROVISIONSA provision is recognised in the consolidated balance sheet when the consolidated entity has a present legal or constructive obligation as a result of a past event and it is probable that an outflow of economic benefits will be required to settle the obligation.
When some or all of the economic benefits required to settle a provision are expected to be recovered from a third party, the receivable is recognised as an asset if it is virtually certain that recovery will be received and the amount of the receivable can be measured reliably.
The amount recognised as a provision is the best estimate of the consideration required to settle the present obligation at reporting date, taking into account the risks and uncertainties surrounding the obligation. Where a provision is measured using the cash flows estimated to settle the present obligation, its carrying amount is the present value of those cash flows.
(i) RestructuringProvision for restructuring is recognised when the consolidated entity has developed a detailed formal plan for the restructuring and has either:
– entered into firm contracts to carry out the restructuring; or – raised a valid expectation in those affected by the restructuring
that the restructuring will occur.
(ii) onerous contractsA provision for onerous contracts is recognised when the expected benefits to be derived by the consolidated entity from a contract are lower than the unavoidable cost of meeting its obligations under the contract.
(iii) self-insuranceThe consolidated entity provides for self-insured liabilities relating to workers’ compensation and public liability claims. The provisions for such liabilities are based on independent actuarial assessments, which consider numbers, amounts and duration of claims, and allow for future inflation and investment returns.
Allowance is included for injuries which occurred before the balance sheet date, but where the claim is expected to be notified after the reporting date.
The provision is discounted using the Government bond rate with a maturity date approximating the term of the consolidated entity’s obligation.
(iv) WarrantyThe consolidated entity provides for anticipated warranty costs when the underlying products or services are sold. The provision is based upon historical warranty data.
(v) make goodThe consolidated entity has certain operating leases that require the asset to be returned to the lessor in its original condition. These obligations relate to wear and tear on the premises and not dismantling obligations. The operating lease payments do not include an element for repairs/overhauls. A provision for refurbishment costs is recognised over the period of the lease, measured at the expected cost of refurbishment at each reporting date.
(R) FINANCIAL LIABILITIES(i) trade and other payablesThese amounts represent liabilities for goods and services provided to the consolidated entity which were unpaid at the end of the period. The amounts are unsecured and are usually settled within 45 days of recognition.
(ii) Put options over non-controlling interestsThe consolidated entity’s put option over non-controlling interests is classified as a financial liability. The financial liability is measured at fair value. The non-controlling interest continues to have access to voting rights and dividends in the subsidiary and continues to be attributed a share of profits. Subsequently changes in the financial liability are recorded directly in equity.
(S) REVENUE RECOGNITIONIn general, revenue is recognised only when it is probable that the economic benefits comprising the revenue will flow to the entity, the flow can be reliably measured and the entity has transferred the significant risks and rewards of ownership.
In addition to these general criteria, specific revenue recognition criteria apply as follows:
(i) sales revenueSales revenue represents the revenue earned from the provision of products and rendering of services to parties external to the consolidated entity. Sales revenue is only recognised when the significant risks and rewards of ownership of the products, including possession, have passed to the buyer and for services when a right to be compensated has been attained and the stage of completion of the contract can be reliably measured.
Revenue is recognised on a commission only basis where Woolworths acts as an agent rather than a principal in the transaction. Revenue is recognised net of returns.
111
1 sIGnIFICant aCCoUntInG PolICIes ContInUedRevenue from the sale of customer gift cards is recognised when the card is redeemed and the customer purchases the goods by using the card.
(ii) Rental incomeRental income is recognised on a straight-line basis over the term of the lease.
(iii) Financing incomeInterest income is recognised in the consolidated income statement as it accrues, using the effective interest method. Dividend income is recognised in the consolidated income statement on the date the entity’s right to receive payment is established which in the case of quoted securities is the ex-dividend date.
(T) LEASESLeases are classified as finance leases whenever the terms of the lease transfer substantially all the risks and rewards of ownership to the lessee. All other leases are classified as operating leases.
(i) operating lease paymentsPayments made under operating leases are recognised in the consolidated income statement on a straight-line basis over the term of the lease.
Fixed rate increases to lease rental payments, excluding contingent or index based rental increases, such as Consumer Price Index, turnover rental and other similar increases, are recognised on a straight-line basis over the lease term.
An asset or liability arises for the difference between the amount paid and the lease expense brought to account on a straight-line basis.
Lease incentives received are recognised in the consolidated income statement as an integral part of the total lease expense and spread over the lease term.
(U) NET FINANCING COSTSNet financing costs comprise interest payable on borrowings calculated using the effective interest method, interest receivable on funds invested, dividend income, foreign exchange gains and losses and gains and losses on hedging instruments that are recognised in the income statement (refer Note 1(F)).
(V) INCOME TAxIncome tax in the consolidated income statement for the periods presented comprises current and deferred tax. Income tax is recognised in the income statement except to the extent that it relates to items recognised directly in equity, in which case it is recognised in equity. Where it arises from the initial accounting for a business combination, it is taken into account in the determination of goodwill or excess.
Current tax is the expected tax payable on the taxable income for the year, using tax rates enacted or substantively enacted at the balance sheet date and any adjustment to tax payable in respect of previous years. Current tax for current and prior periods is recognised as a liability to the extent it is unpaid.
Deferred tax is provided using the balance sheet method, providing for temporary differences between the carrying amounts of assets and liabilities for financial reporting purposes and the amounts used for taxation purposes. In accordance with AASB 112 Income Taxes, the following temporary differences are not provided for: goodwill, the initial recognition of assets or liabilities in a transaction that is not a business combination and that affects neither accounting nor taxable profit, and differences relating to investments in subsidiaries to the extent that they will probably not reverse in the foreseeable future where the consolidated entity is able to control the reversal of the temporary differences.
The amount of deferred tax provided is based on the expected manner of realisation or settlement of the carrying amount of assets and liabilities, using tax rates enacted or substantively enacted at the balance sheet date.
A deferred tax asset is recognised only to the extent that it is probable that future taxable profits will be available against which the deductible temporary differences or unused tax losses and tax offsets can be utilised.
Deferred tax assets are reduced to the extent that it is no longer probable that the related tax benefit will be realised.
Additional income taxes that arise from the distribution of dividends are recognised at the same time as the liability to pay the related dividend.
Deferred tax assets and liabilities are offset when they relate to income taxes levied by the same taxation authority and the consolidated entity intends to settle its current tax assets and liabilities on a net basis.
(W) NON-CURRENT ASSETS (OR DISPOSAL GROUPS) HELD FOR SALE AND DISCONTINUED OPERATIONSNon-current assets (or disposal groups) are classified as held for sale if their carrying amount will be recovered principally through a sale transaction rather than continuing use and a sale is considered highly probable. They are measured at the lower of their carrying amount and fair value less costs to sell, except for assets such as deferred tax assets, assets arising from employee benefits, financial assets and investment property that are carried at fair value, which are specifically exempt from this requirement.
An impairment loss is recognised for any initial or subsequent write-down of the asset (or disposal group) to fair value less costs to sell. A gain is recognised for any subsequent increases in fair value less costs to sell of an asset (or disposal group), but not in excess of any cumulative impairment loss previously recognised. A gain or loss not previously recognised by the date of the sale of the non-current asset (or disposal group), is recognised at the date of derecognition. Non-current assets (including those that are part of a disposal group) are not depreciated or amortised while they are classified as held for sale. Interest and other expenses attributable to the liabilities of the disposal group classified as held for sale continue to be recognised.
NOTES TO THE CONSOLIDATED FINANCIAL STATEMENTS
WoolWorths limited AnnuAl report 2012112
Non-current assets classified as held for sale and the assets of a disposal group classified as held for sale are presented separately from the other assets in the balance sheet. The liabilities of a disposal group classified as held for sale are presented separately from other liabilities in the balance sheet.
A discontinued operation is a component of the entity that has been disposed of or is classified as held for sale and that represents a separate major line of business or geographical area of operations, is part of a single co-ordinated plan to dispose of such a line of business or area of operations, or is a subsidiary acquired exclusively with a view to resale. The results of discontinued operations are presented separately in the income statement.
(x) GOODS AND SERVICES TAxRevenue, expenses and assets are recognised net of the amount of goods and services tax (GST), except where the amount of GST incurred is not recoverable from the taxation authority. In these circumstances, the GST is recognised as part of the cost of acquisition of the asset or as part of the expense.
Receivables and payables are stated with the amount of GST included. The net amount of GST recoverable from, or payable to, the tax authorities are included as a current asset or liability in the balance sheet.
Cash flows are included in the cash flow statement on a gross basis. The GST components of cash flows arising from investing and financing activities which are recoverable from, or payable to, the tax authorities are classified as operating cash flows.
(y) OPERATING SEGMENT REPORTING(i) Business segmentsSegment information is presented in respect of the consolidated entity’s reportable segments which were identified on the basis of the consolidated entity’s internal reporting on the components of the Group. The identified reportable segments are regularly reviewed by the chief operating decision maker in order to allocate resources to the segment and assess its performance. Inter-segment pricing is determined on an arm’s length basis.
In addition, these business units offer different products and services and are managed separately because they require different technology and marketing strategies. The Group’s five reportable segments related to continuing operations are as follows:
– Retail Operations: – Australian Food and Liquor – procurement of Food and
Liquor and products for resale to customers in Australia – New Zealand Supermarkets – procurement of Food and
Liquor and products for resale to customers in New Zealand – Petrol – procurement of Petroleum products for resale to
customers in Australia – BIG W – procurement of discount general merchandise
products for resale to customers in Australia – Hotels – provision of leisure and hospitality services including
food and alcohol, accommodation, entertainment and gaming.
The Unallocated group consists of the Group’s other operating segments that are not separately reportable (including Home
Improvement and Consumer Electronics India) as well as various support functions including Property and Head Office costs.
Discontinued operations represents the Consumer Electronics segment, which is the procurement of electronic products for resale in Australia and New Zealand.
(ii) Geographical informationSegment assets are based on the geographical location of the assets. Woolworths Limited operates in Australia, New Zealand, Hong Kong and India. The majority of business operations are in Australia and New Zealand. Woolworths operates in New Zealand following the acquisition of Foodland Supermarkets in 2006. The consumer electronics business operates stores based in Australia and New Zealand and has a business venture with TATA in India which operates stores under the Croma brand. The global sourcing office is located in Hong Kong.
(Z) PARENT ENTITy FINANCIAL INFORMATIONFinancial information for the parent entity, Woolworths Limited, disclosed in Note 32 has been prepared on the same basis as the consolidated financial statements, except as set out below:
(i) Investments in subsidiaries Investments in subsidiaries are accounted for at cost.
(ii) tax consolidation The Company and its wholly-owned Australian resident entities have formed a tax-consolidated group with effect from 1 July 2002 and are therefore taxed as a single entity from that date. The head entity within the tax consolidated group is Woolworths Limited.
Tax expense/income, deferred tax assets and deferred tax liabilities arising from temporary differences of the members of the tax consolidated group are recognised by each member of the tax consolidated group where the member would have been able to recognise the deferred tax asset or deferred tax liability on a stand-alone basis.
The head entity, in conjunction with other members of the tax consolidated group, has entered into a tax funding agreement which sets out the funding obligations of members of the tax consolidated group in respect of income tax amounts. The tax funding arrangements require payments to the head entity equal to the current tax liability assumed by the head entity.
In addition, the head entity is required to make payments equal to the current tax asset assumed by the head entity in circumstances where the subsidiary member would have been entitled to recognise the current tax asset on a stand-alone basis.
These tax funding arrangements result in the head entity recognising an inter-entity receivable/payable equal in amount to the tax liability/asset assumed. The inter-entity receivable/payable amounts are at call.
In respect of carried forward tax losses brought into the group on consolidation by subsidiary members, the head entity will pay the subsidiary member for such losses when these losses are transferred to the Woolworths Limited tax consolidated group, where the subsidiary member would have been entitled to recognise the benefit of these losses on a stand-alone basis.
113
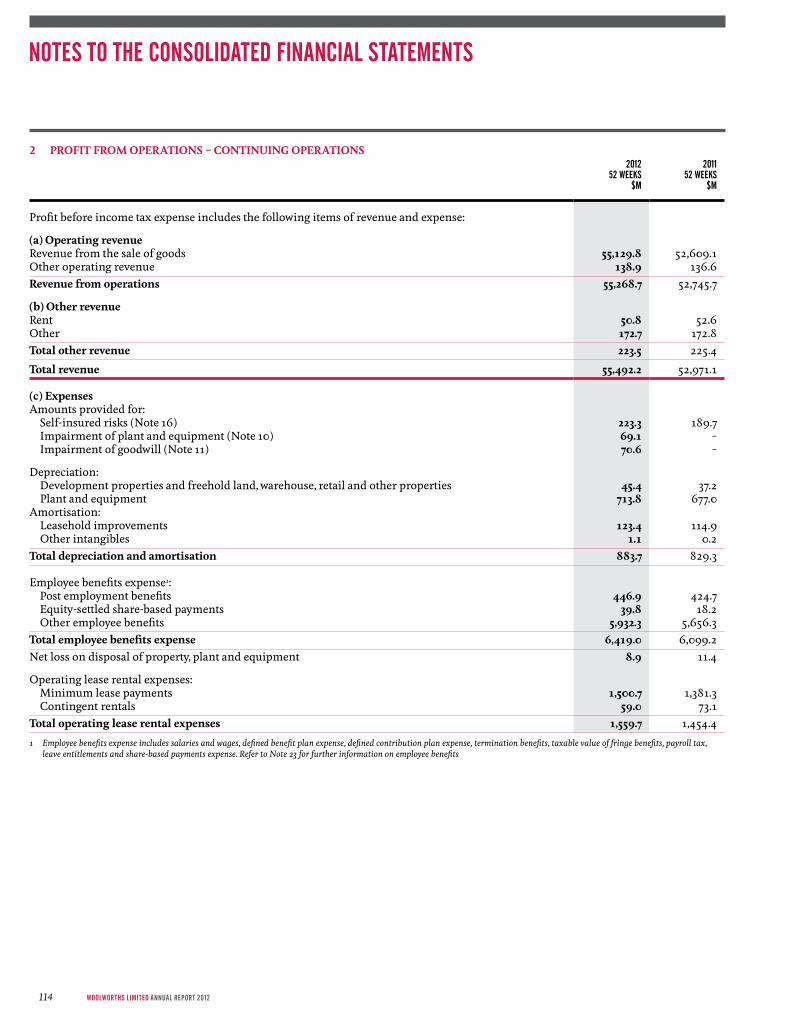
2 PRoFIt FRom oPeRatIons – ContInUInG oPeRatIons2012
52 WEEkS $M
2011 52 WEEkS
$M
Profit before income tax expense includes the following items of revenue and expense:
(a) operating revenueRevenue from the sale of goods 55,129.8 52,609.1Other operating revenue 138.9 136.6Revenue from operations 55,268.7 52,745.7
(b) other revenueRent 50.8 52.6Other 172.7 172.8total other revenue 223.5 225.4
total revenue 55,492.2 52,971.1
(c) expensesAmounts provided for: Self-insured risks (Note 16) 223.3 189.7 Impairment of plant and equipment (Note 10) 69.1 – Impairment of goodwill (Note 11) 70.6 –
Depreciation: Development properties and freehold land, warehouse, retail and other properties 45.4 37.2 Plant and equipment 713.8 677.0Amortisation: Leasehold improvements 123.4 114.9 Other intangibles 1.1 0.2total depreciation and amortisation 883.7 829.3
Employee benefits expense1: Post employment benefits 446.9 424.7 Equity-settled share-based payments 39.8 18.2 Other employee benefits 5,932.3 5,656.3total employee benefits expense 6,419.0 6,099.2Net loss on disposal of property, plant and equipment 8.9 11.4
Operating lease rental expenses: Minimum lease payments 1,500.7 1,381.3 Contingent rentals 59.0 73.1total operating lease rental expenses 1,559.7 1,454.4
1 Employee benefits expense includes salaries and wages, defined benefit plan expense, defined contribution plan expense, termination benefits, taxable value of fringe benefits, payroll tax, leave entitlements and share‑based payments expense. Refer to Note 23 for further information on employee benefits
NOTES TO THE CONSOLIDATED FINANCIAL STATEMENTS
WoolWorths limited AnnuAl report 2012114
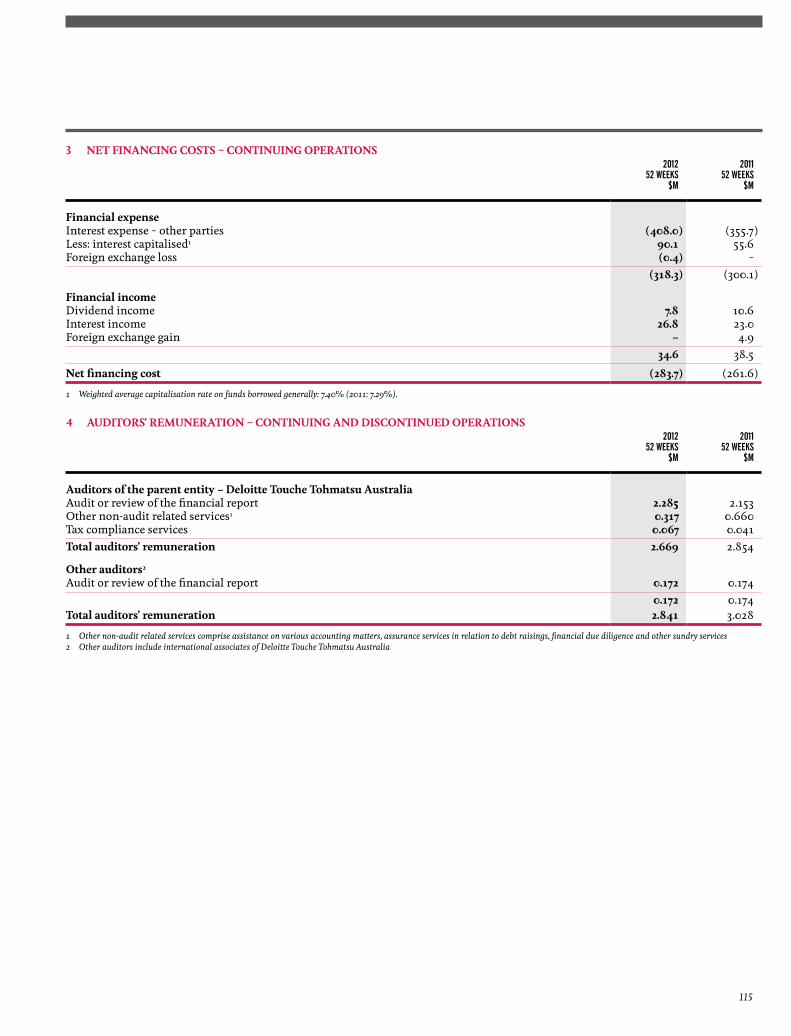
3 net FInanCInG Costs – ContInUInG oPeRatIons 2012
52 WEEkS$M
201152 WEEkS
$M
Financial expenseInterest expense – other parties (408.0) (355.7)Less: interest capitalised1 90.1 55.6Foreign exchange loss (0.4) –
(318.3) (300.1)
Financial incomeDividend income 7.8 10.6Interest income 26.8 23.0Foreign exchange gain – 4.9
34.6 38.5
net financing cost (283.7) (261.6)
1 Weighted average capitalisation rate on funds borrowed generally: 7.40% (2011: 7.29%).
4 aUdItoRs’ RemUneRatIon – ContInUInG and dIsContInUed oPeRatIons2012
52 WEEkS$M
201152 WEEkS
$M
auditors of the parent entity – deloitte touche tohmatsu australiaAudit or review of the financial report 2.285 2.153Other non-audit related services1 0.317 0.660Tax compliance services 0.067 0.041total auditors’ remuneration 2.669 2.854
other auditors2
Audit or review of the financial report 0.172 0.1740.172 0.174
total auditors’ remuneration 2.841 3.028
1 Other non‑audit related services comprise assistance on various accounting matters, assurance services in relation to debt raisings, financial due diligence and other sundry services2 Other auditors include international associates of Deloitte Touche Tohmatsu Australia
115
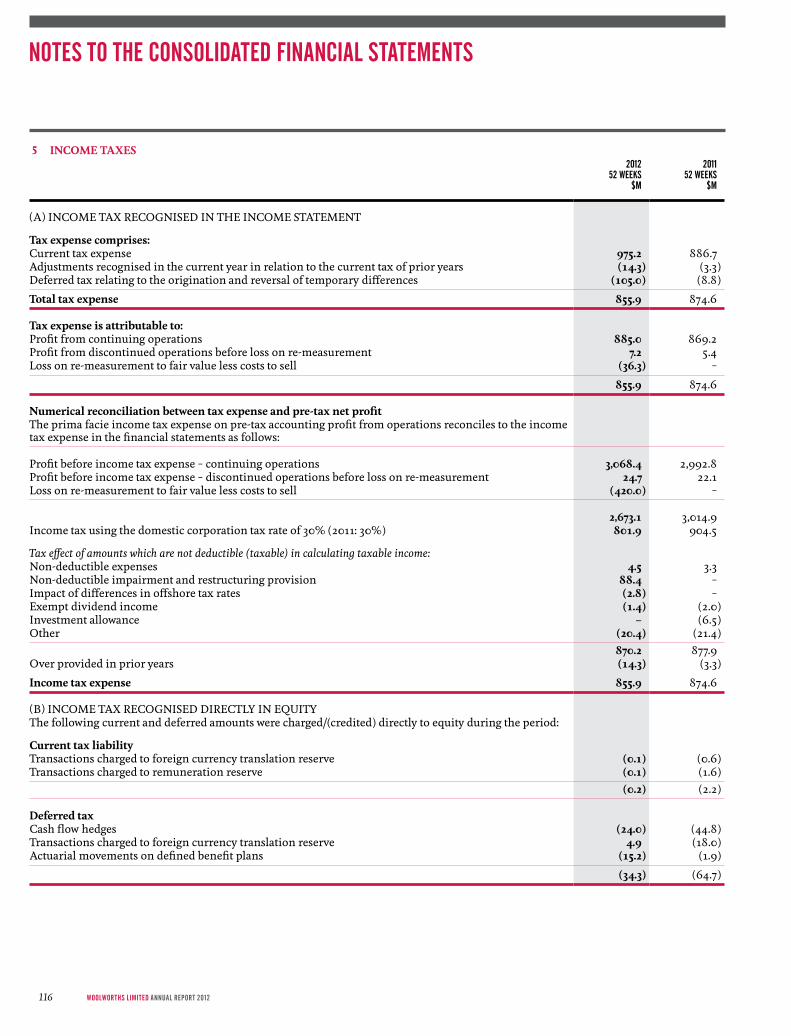
5 InCome taXes2012
52 WEEkS$M
201152 WEEkS
$M
(A) INCOME TAx RECOGNISED IN THE INCOME STATEMENT
tax expense comprises:Current tax expense 975.2 886.7Adjustments recognised in the current year in relation to the current tax of prior years (14.3) (3.3)Deferred tax relating to the origination and reversal of temporary differences (105.0) (8.8)
total tax expense 855.9 874.6
tax expense is attributable to:Profit from continuing operations 885.0 869.2Profit from discontinued operations before loss on re-measurement 7.2 5.4Loss on re-measurement to fair value less costs to sell (36.3) –
855.9 874.6
numerical reconciliation between tax expense and pre-tax net profitThe prima facie income tax expense on pre-tax accounting profit from operations reconciles to the income tax expense in the financial statements as follows:
Profit before income tax expense – continuing operations 3,068.4 2,992.8Profit before income tax expense – discontinued operations before loss on re-measurement 24.7 22.1Loss on re-measurement to fair value less costs to sell (420.0) –
2,673.1 3,014.9Income tax using the domestic corporation tax rate of 30% (2011: 30%) 801.9 904.5
Tax effect of amounts which are not deductible (taxable) in calculating taxable income:Non-deductible expenses 4.5 3.3Non-deductible impairment and restructuring provision 88.4 –Impact of differences in offshore tax rates (2.8) –Exempt dividend income (1.4) (2.0)Investment allowance – (6.5)Other (20.4) (21.4)
870.2 877.9Over provided in prior years (14.3) (3.3)
Income tax expense 855.9 874.6
(B) INCOME TAx RECOGNISED DIRECTLy IN EQUITy The following current and deferred amounts were charged/(credited) directly to equity during the period:
Current tax liabilityTransactions charged to foreign currency translation reserve (0.1) (0.6)Transactions charged to remuneration reserve (0.1) (1.6)
(0.2) (2.2)
deferred taxCash flow hedges (24.0) (44.8)Transactions charged to foreign currency translation reserve 4.9 (18.0)Actuarial movements on defined benefit plans (15.2) (1.9)
(34.3) (64.7)
NOTES TO THE CONSOLIDATED FINANCIAL STATEMENTS
WoolWorths limited AnnuAl report 2012116
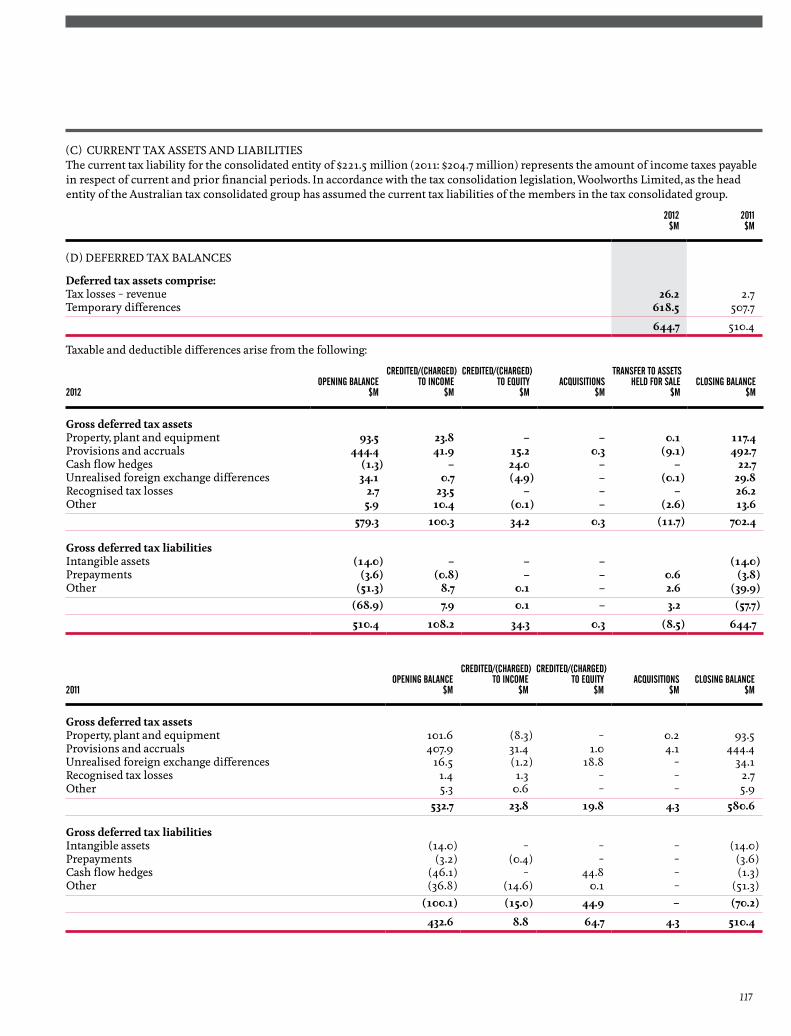
(C) CURRENT TAx ASSETS AND LIABILITIESThe current tax liability for the consolidated entity of $221.5 million (2011: $204.7 million) represents the amount of income taxes payable in respect of current and prior financial periods. In accordance with the tax consolidation legislation, Woolworths Limited, as the head entity of the Australian tax consolidated group has assumed the current tax liabilities of the members in the tax consolidated group.
2012$M
2011$M
(D) DEFERRED TAx BALANCES
deferred tax assets comprise:Tax losses – revenue 26.2 2.7Temporary differences 618.5 507.7
644.7 510.4
Taxable and deductible differences arise from the following:
2012OPENING BALANCE
$M
CREDITED/(CHARGED)TO INCOME
$M
CREDITED/(CHARGED)TO EQuITy
$MACQuISITIONS
$M
TRANSFER TO ASSETSHELD FOR SALE
$MCLOSING BALANCE
$M
Gross deferred tax assetsProperty, plant and equipment 93.5 23.8 – – 0.1 117.4Provisions and accruals 444.4 41.9 15.2 0.3 (9.1) 492.7Cash flow hedges (1.3) – 24.0 – – 22.7Unrealised foreign exchange differences 34.1 0.7 (4.9) – (0.1) 29.8Recognised tax losses 2.7 23.5 – – – 26.2Other 5.9 10.4 (0.1) – (2.6) 13.6
579.3 100.3 34.2 0.3 (11.7) 702.4
Gross deferred tax liabilitiesIntangible assets (14.0) – – – (14.0)Prepayments (3.6) (0.8) – – 0.6 (3.8)Other (51.3) 8.7 0.1 – 2.6 (39.9)
(68.9) 7.9 0.1 – 3.2 (57.7)
510.4 108.2 34.3 0.3 (8.5) 644.7
2011OPENING BALANCE
$M
CREDITED/(CHARGED)TO INCOME
$M
CREDITED/(CHARGED)TO EQuITy
$MACQuISITIONS
$MCLOSING BALANCE
$M
Gross deferred tax assetsProperty, plant and equipment 101.6 (8.3) – 0.2 93.5Provisions and accruals 407.9 31.4 1.0 4.1 444.4Unrealised foreign exchange differences 16.5 (1.2) 18.8 – 34.1Recognised tax losses 1.4 1.3 – – 2.7Other 5.3 0.6 – – 5.9
532.7 23.8 19.8 4.3 580.6
Gross deferred tax liabilitiesIntangible assets (14.0) – – – (14.0)Prepayments (3.2) (0.4) – – (3.6)Cash flow hedges (46.1) – 44.8 – (1.3)Other (36.8) (14.6) 0.1 – (51.3)
(100.1) (15.0) 44.9 – (70.2)
432.6 8.8 64.7 4.3 510.4
117

6 dIVIdends
2012 CENTS PER SHARETOTAL AMOuNT
$M FRANkED DATE OF PAyMENT
Interim 2012 ordinary 59 723.9 100% 27/04/2012Final 2011 ordinary 65 792.9 100% 14/10/2011
total 124 1,516.8
2011 CENTS PER SHARE TOTAL AMOuNT $M FRANkED DATE OF PAyMENT
Interim 2011 ordinary 57 691.4 100% 29/04/2011Final 2010 ordinary 62 766.3 100% 15/10/2010
total 119 1,457.7
All dividends are fully franked at a 30% rate.
On 24 August 2012, the Board of Directors determined a final dividend in respect of the 2012 year of 67 cents (2011: 65 cents) per share 100% franked at a 30% tax rate. The amount that will be paid on 12 October 2012 (2011: 14 October 2011) is expected to be $825.4 million (2011: $792.9 million). As the dividend was declared subsequent to 24 June 2012, no provision has been included as at 24 June 2012.
DIVIDEND REINVESTMENT PLAN (THE PLAN) Under the terms and conditions of the DRP, eligible shareholders may elect to participate in the Plan in respect to all or part of their shareholding, subject to any maximum and/or minimum number of shares to participate in the Plan that the Directors may specify. There is currently no minimum number of shares which a shareholder may designate as participating in the Plan. The maximum number of shares which a shareholder (other than broker’s nominees and certain trustees) may designate as participating in the Plan is 20,000.
FRANKED DIVIDENDS
2012
$M2011$M
The franked portions of the dividends proposed as at 24 June 2012 will be franked out of existing franking credits or out of franked credits arising from the payment of income tax in the period ended 30 June 2013.
Franking credits available for the subsequent financial year 30% (2011: 30%) 1,840.0 1,569.4
The above amounts represent the balances of the franking accounts as at the end of the financial period, adjusted for:
(a) Franking credits that will arise from the payment of income tax payable at the end of the financial period; and(b) Franking debits that will arise from the payment of dividends provided at the end of the financial period.
Franking accounts are presented on a tax paid basis.
The franking account balances reported for the consolidated group are inclusive of $49.2 million (2011: $41.8 million) attributable to the non-controlling interest holders.
NOTES TO THE CONSOLIDATED FINANCIAL STATEMENTS
WoolWorths limited AnnuAl report 2012118
7 seGment dIsClosURes The Group has five reportable segments related to continuing operations, as described below that are the Group’s strategic business units.
The business units offer different products and services and are managed separately because they require different technology and marketing strategies. The following summary describes the operations in each of the Group’s reportable segments:
– Retail Operations: – Australian Food and Liquor – procurement of Food and Liquor and products for resale to customers in Australia; – New Zealand Supermarkets – procurement of Food and Liquor and products for resale to customers in New Zealand; – Petrol – procurement of Petroleum products for resale to customers in Australia; – BIG W – procurement of discount general merchandise products for resale to customers in Australia; and
– Hotels – provision of leisure and hospitality services including food and alcohol, accommodation, entertainment and gaming.
The Unallocated group consists of the Group’s other operating segments that are not separately reportable (including Home Improvement and Consumer Electronics India) as well as various support functions including Property and Head Office costs.
Discontinued operations represents the Consumer Electronics segment, which is the procurement of electronic products for resale in Australia and New Zealand.
There are varying levels of integration between the Australian Food and Liquor and Hotels reportable segments. This includes the common usage of property and services, and some common administration functions. The accounting policies of the reportable segments are the same as described in Note 1.
Information regarding the operations of each segment is included below. Performance is measured based on segment earnings before interest and tax (EBIT). Segment EBIT is measured as management believes that such information is useful in evaluating the results of certain segments relative to other entities that operate within these industries. Inter-segment pricing is determined on an arm’s length basis.
MAJOR CUSTOMERSRevenues from no one single customer amounted to greater than 10% of the Group’s revenues in the current or prior periods.
119

7 seGment dIsClosURes ContInUedAuSTRALIAN
FOOD & LIQuOR1NEW ZEALAND
SuPERMARkETS PETROL BIG W HOTELS2 uNALLOCATED3TOTAL CONTINuING
OPERATIONSDISCONTINuED OPERATIONS4 CONSOLIDATED
2012$A M
2011$A M
2012$A M
2011$A M
2012$A M
2011$A M
2012$A M
2011$A M
2012$A M
2011$A M
2012$A M
2011$A M
2012$A M
2011$A M
2012$A M
2011$A M
2012$A M
2011$A M
Business segmentsSales to customers 37,549.2 36,176.1 4,301.8 4,110.5 6,714.2 6,025.3 4,179.6 4,158.3 1,204.0 1,153.1 1,181.0 985.8 55,129.8 52,609.1 1,570.3 1,533.8 56,700.1 54,142.9 Other operating revenue 132.2 123.9 6.7 12.7 – – – – – – – – 138.9 136.6 – – 138.9 136.6 Inter-segment revenue – – – – – – – – – – 451.3 332.7 451.3 332.7 0.4 0.5 451.7 333.2 segment revenue 37,681.4 36,300.0 4,308.5 4,123.2 6,714.2 6,025.3 4,179.6 4,158.3 1,204.0 1,153.1 1,632.3 1,318.5 55,720.0 53,078.4 1,570.7 1,534.3 57,290.7 54,612.7 Eliminations (451.3) (332.7) (451.3) (332.7) (0.4) (0.5) (451.7) (333.2)Unallocated revenue5 223.5 225.4 223.5 225.4 0.8 0.8 224.3 226.2 total revenue 37,681.4 36,300.0 4,308.5 4,123.2 6,714.2 6,025.3 4,179.6 4,158.3 1,204.0 1,153.1 1,404.5 1,211.2 55,492.2 52,971.1 1,571.1 1,534.6 57,063.3 54,505.7
segment earnings before interest and tax 2,817.2 2,678.9 224.5 191.9 127.1 117.6 178.4 177.0 195.7 183.7 (190.8) (94.7) 3,352.1 3,254.4 24.6 22.0 3,376.7 3,276.4 Loss on remeasurement to fair value less costs to sell (420.0) – (420.0) –earnings before interest and tax 2,817.2 2,678.9 224.5 191.9 127.1 117.6 178.4 177.0 195.7 183.7 (190.8) (94.7) 3,352.1 3,254.4 (395.4) 22.0 2,956.7 3,276.4 Net financing cost (283.7) (261.6) 0.1 0.1 (283.6) (261.5)Profit before income tax expense 3,068.4 2,992.8 (395.3) 22.1 2,673.1 3,014.9 Income tax expense (885.0) (869.2) 29.1 (5.4) (855.9) (874.6)Profit after income tax expense 2,183.4 2,123.6 (366.2) 16.7 1,817.2 2,140.3 Segment depreciation and amortisation 521.3 500.2 84.8 71.5 32.2 31.7 82.7 75.1 64.9 66.6 97.8 84.2 883.7 829.3 12.2 28.6 895.9 857.9
Capital expenditure6 497.9 934.0 202.5 266.8 45.1 58.6 88.1 116.9 180.2 146.1 1,334.5 1,009.1 2,348.3 2,531.5 19.3 53.7 2,367.6 2,585.2
1 Australian Food and Liquor is comprised of supermarket and liquor stores and wholesale food and liquor in Australia2 Hotels is comprised of on‑premise liquor sales, food, accommodation, gaming and venue hire3 Unallocated is comprised of corporate head office, the property division, Consumer Electronics India and the Home Improvement division4 Discontinued operations is comprised of Consumer Electronics Australia and New Zealand5 Unallocated revenue is comprised of rent and other revenue from operating activities across the Group6 Capital expenditure is comprised of property, plant and equipment and intangible asset additions
NOTES TO THE CONSOLIDATED FINANCIAL STATEMENTS
WoolWorths limited AnnuAl report 2012120

7 seGment dIsClosURes ContInUedAuSTRALIAN
FOOD & LIQuOR1NEW ZEALAND
SuPERMARkETS PETROL BIG W HOTELS2 uNALLOCATED3TOTAL CONTINuING
OPERATIONSDISCONTINuED OPERATIONS4 CONSOLIDATED
2012$A M
2011$A M
2012$A M
2011$A M
2012$A M
2011$A M
2012$A M
2011$A M
2012$A M
2011$A M
2012$A M
2011$A M
2012$A M
2011$A M
2012$A M
2011$A M
2012$A M
2011$A M
Business segmentsSales to customers 37,549.2 36,176.1 4,301.8 4,110.5 6,714.2 6,025.3 4,179.6 4,158.3 1,204.0 1,153.1 1,181.0 985.8 55,129.8 52,609.1 1,570.3 1,533.8 56,700.1 54,142.9 Other operating revenue 132.2 123.9 6.7 12.7 – – – – – – – – 138.9 136.6 – – 138.9 136.6 Inter-segment revenue – – – – – – – – – – 451.3 332.7 451.3 332.7 0.4 0.5 451.7 333.2 segment revenue 37,681.4 36,300.0 4,308.5 4,123.2 6,714.2 6,025.3 4,179.6 4,158.3 1,204.0 1,153.1 1,632.3 1,318.5 55,720.0 53,078.4 1,570.7 1,534.3 57,290.7 54,612.7 Eliminations (451.3) (332.7) (451.3) (332.7) (0.4) (0.5) (451.7) (333.2)Unallocated revenue5 223.5 225.4 223.5 225.4 0.8 0.8 224.3 226.2 total revenue 37,681.4 36,300.0 4,308.5 4,123.2 6,714.2 6,025.3 4,179.6 4,158.3 1,204.0 1,153.1 1,404.5 1,211.2 55,492.2 52,971.1 1,571.1 1,534.6 57,063.3 54,505.7
segment earnings before interest and tax 2,817.2 2,678.9 224.5 191.9 127.1 117.6 178.4 177.0 195.7 183.7 (190.8) (94.7) 3,352.1 3,254.4 24.6 22.0 3,376.7 3,276.4 Loss on remeasurement to fair value less costs to sell (420.0) – (420.0) –earnings before interest and tax 2,817.2 2,678.9 224.5 191.9 127.1 117.6 178.4 177.0 195.7 183.7 (190.8) (94.7) 3,352.1 3,254.4 (395.4) 22.0 2,956.7 3,276.4 Net financing cost (283.7) (261.6) 0.1 0.1 (283.6) (261.5)Profit before income tax expense 3,068.4 2,992.8 (395.3) 22.1 2,673.1 3,014.9 Income tax expense (885.0) (869.2) 29.1 (5.4) (855.9) (874.6)Profit after income tax expense 2,183.4 2,123.6 (366.2) 16.7 1,817.2 2,140.3 Segment depreciation and amortisation 521.3 500.2 84.8 71.5 32.2 31.7 82.7 75.1 64.9 66.6 97.8 84.2 883.7 829.3 12.2 28.6 895.9 857.9
Capital expenditure6 497.9 934.0 202.5 266.8 45.1 58.6 88.1 116.9 180.2 146.1 1,334.5 1,009.1 2,348.3 2,531.5 19.3 53.7 2,367.6 2,585.2
1 Australian Food and Liquor is comprised of supermarket and liquor stores and wholesale food and liquor in Australia2 Hotels is comprised of on‑premise liquor sales, food, accommodation, gaming and venue hire3 Unallocated is comprised of corporate head office, the property division, Consumer Electronics India and the Home Improvement division4 Discontinued operations is comprised of Consumer Electronics Australia and New Zealand5 Unallocated revenue is comprised of rent and other revenue from operating activities across the Group6 Capital expenditure is comprised of property, plant and equipment and intangible asset additions
GEOGRAPHICAL INFORMATION The Group operates predominantly in two principal geographical areas – Australia and New Zealand. Inter-segment pricing is determined on an arm’s length basis.
The Group’s revenue from external customers and information about its geographical assets by geographical location are detailed below:
AuSTRALIA NEW ZEALANDTOTAL CONTINuING
OPERATIONS DISCONTINuED OPERATIONS1 CONSOLIDATED
SEGMENT DISCLOSuRESGEOGRAPHICAL SEGMENTS
2012$A M
2011$A M
2012$A M
2011$A M
2012$A M
2011$A M
2012$A M
2011$A M
2012$A M
2011$A M
Sales to customers 50,828.0 48,498.6 4,301.8 4,110.5 55,129.8 52,609.1 1,570.3 1,533.8 56,700.1 54,142.9 Other operating revenue 132.2 123.9 6.7 12.7 138.9 136.6 – – 138.9 136.6 Other revenue 198.3 201.2 25.2 24.2 223.5 225.4 0.8 0.8 224.3 226.2 Revenue from external customers 51,158.5 48,823.7 4,333.7 4,147.4 55,492.2 52,971.1 1,571.1 1,534.6 57,063.3 54,505.7
Non-current assets2 12,141.7 10,989.5 2,855.5 2,795.0 14,997.2 13,784.5 – 203.6 14,997.2 13,988.1
1 Discontinued operations is comprised of Consumer Electronics Australia and New Zealand. In FY12, all assets, related to discontinued operations are classified as current2 Geographical non‑current assets exclude financial instruments (fair value derivatives), deferred tax assets and intercompany receivables
121
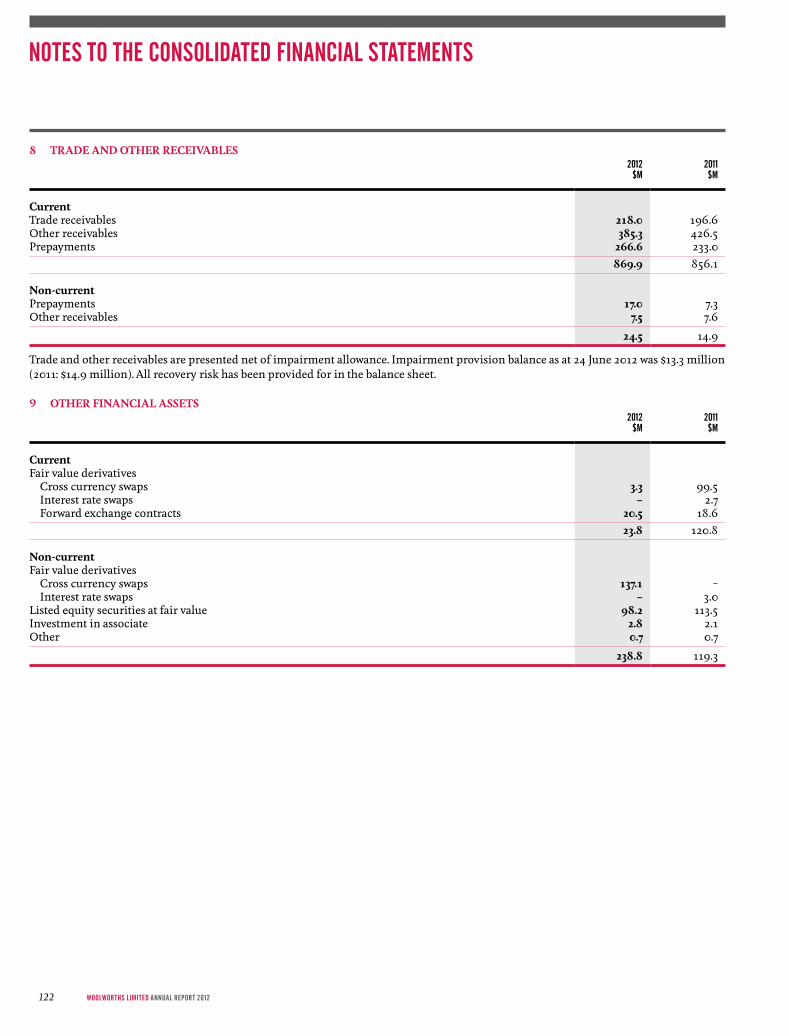
8 tRade and otheR ReCeIVaBles
2012
$M2011$M
CurrentTrade receivables 218.0 196.6Other receivables 385.3 426.5Prepayments 266.6 233.0
869.9 856.1
non-currentPrepayments 17.0 7.3Other receivables 7.5 7.6
24.5 14.9
Trade and other receivables are presented net of impairment allowance. Impairment provision balance as at 24 June 2012 was $13.3 million (2011: $14.9 million). All recovery risk has been provided for in the balance sheet.
9 otheR FInanCIal assets
2012
$M2011$M
CurrentFair value derivatives Cross currency swaps 3.3 99.5 Interest rate swaps – 2.7 Forward exchange contracts 20.5 18.6
23.8 120.8
non-currentFair value derivatives Cross currency swaps 137.1 – Interest rate swaps – 3.0Listed equity securities at fair value 98.2 113.5Investment in associate 2.8 2.1Other 0.7 0.7
238.8 119.3
NOTES TO THE CONSOLIDATED FINANCIAL STATEMENTS
WoolWorths limited AnnuAl report 2012122

10 PRoPeRtY, Plant and eQUIPment
2012
$M2011$M
non-currentDevelopment propertiesAt cost 1,415.9 1,576.3Less: accumulated depreciation (7.5) (12.9)
1,408.4 1,563.4
Freehold land, warehouse, retail and other propertiesAt cost 2,839.0 1,638.5Less: accumulated depreciation (138.8) (91.3)
2,700.2 1,547.2
Leasehold improvementsAt cost 2,270.3 2,080.8Less: accumulated amortisation (917.0) (802.9)
1,353.3 1,277.9
Plant and equipmentAt cost 10,702.6 10,321.2Less: accumulated depreciation (6,575.5) (6,089.4)
4,127.1 4,231.8
total property, plant and equipment – net book value 9,589.0 8,620.3
123
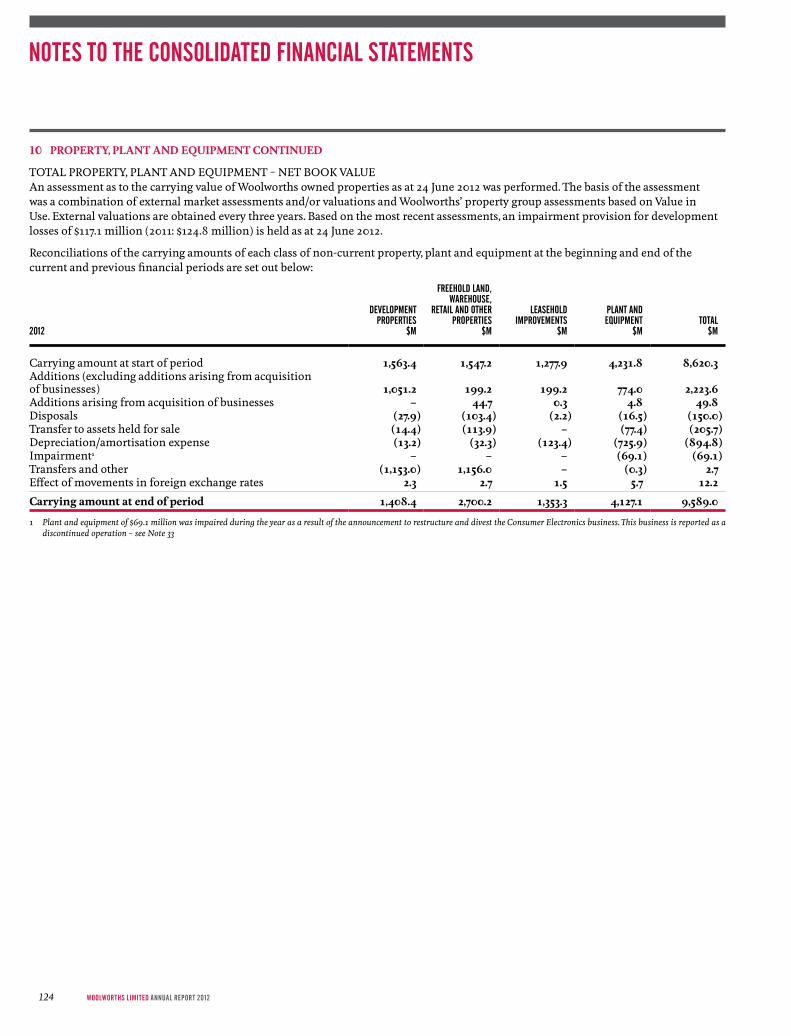
10 PRoPeRtY, Plant and eQUIPment ContInUed
TOTAL PROPERTy, PLANT AND EQUIPMENT – NET BOOK VALUEAn assessment as to the carrying value of Woolworths owned properties as at 24 June 2012 was performed. The basis of the assessment was a combination of external market assessments and/or valuations and Woolworths’ property group assessments based on Value in Use. External valuations are obtained every three years. Based on the most recent assessments, an impairment provision for development losses of $117.1 million (2011: $124.8 million) is held as at 24 June 2012.
Reconciliations of the carrying amounts of each class of non-current property, plant and equipment at the beginning and end of the current and previous financial periods are set out below:
2012
DEVELOPMENTPROPERTIES
$M
FREEHOLD LAND,WAREHOuSE,
RETAIL AND OTHERPROPERTIES
$M
LEASEHOLDIMPROVEMENTS
$M
PLANT ANDEQuIPMENT
$MTOTAL
$M
Carrying amount at start of period 1,563.4 1,547.2 1,277.9 4,231.8 8,620.3Additions (excluding additions arising from acquisition of businesses) 1,051.2 199.2 199.2 774.0 2,223.6Additions arising from acquisition of businesses – 44.7 0.3 4.8 49.8Disposals (27.9) (103.4) (2.2) (16.5) (150.0)Transfer to assets held for sale (14.4) (113.9) – (77.4) (205.7)Depreciation/amortisation expense (13.2) (32.3) (123.4) (725.9) (894.8)Impairment1 – – – (69.1) (69.1)Transfers and other (1,153.0) 1,156.0 – (0.3) 2.7Effect of movements in foreign exchange rates 2.3 2.7 1.5 5.7 12.2
Carrying amount at end of period 1,408.4 2,700.2 1,353.3 4,127.1 9,589.0
1 Plant and equipment of $69.1 million was impaired during the year as a result of the announcement to restructure and divest the Consumer Electronics business. This business is reported as a discontinued operation – see Note 33
NOTES TO THE CONSOLIDATED FINANCIAL STATEMENTS
WoolWorths limited AnnuAl report 2012124

2011
DEVELOPMENTPROPERTIES
$M
FREEHOLD LAND,WAREHOuSE,
RETAIL AND OTHERPROPERTIES
$M
LEASEHOLDIMPROVEMENTS
$M
PLANT ANDEQuIPMENT
$MTOTAL
$M
Carrying amount at start of period 927.8 1,574.6 1,169.5 3,967.2 7,639.1Additions (excluding additions arising from acquisition of businesses) 824.0 168.0 230.2 977.9 2,200.1Additions arising from acquisition of businesses – 61.4 1.2 39.6 102.2Disposals (241.5) (74.5) (3.1) (18.7) (337.8)Transfer to assets held for sale (74.6) (22.6) – (1.7) (98.9)Depreciation/amortisation expense (15.0) (22.2) (114.9) (700.9) (853.0)Transfers and other 150.4 (132.7) 0.2 (11.7) 6.2Effect of movements in foreign exchange rates (7.7) (4.8) (5.2) (19.9) (37.6)
Carrying amount at end of period 1,563.4 1,547.2 1,277.9 4,231.8 8,620.3
IMPAIRMENT OF TANGIBLE ASSETSTangible assets are tested for impairment annually. An impairment loss is recognised whenever the carrying amount exceeds the recoverable amount. The recoverable amount of the asset is the higher of its fair value less costs to sell and its value in use.
The recoverable amount is assessed at the cash generating unit (“CGU”) level, which is the smallest group of assets generating cash flows independent of other CGUs that benefit from the use of the respective tangible asset.
The recoverable amount is determined based on the value in use which is calculated using cash flow projections from the most recent financial budgets approved by management and the Board, the results of which are reviewed by the Board.
The forecasts are extrapolated beyond five years based on estimated long-term growth rates of generally 0%–5%, and do not exceed industry growth rates for the business in which the cash generating unit operates.
The cash flows are discounted to present value using pre-tax discount rates between 14% and 16% (2011: 13% and 16%) depending on the nature of the business and the country of operation. This discount rate is derived from the Group’s post-tax weighted average cost of capital.
The key assumptions for the value in use calculations include sales growth, cost of doing business (CODB) reductions and discount rates (which have been estimated as described above). The assumptions regarding sales growth and CODB reductions are based on past experience and expectations of changes in the market.
125
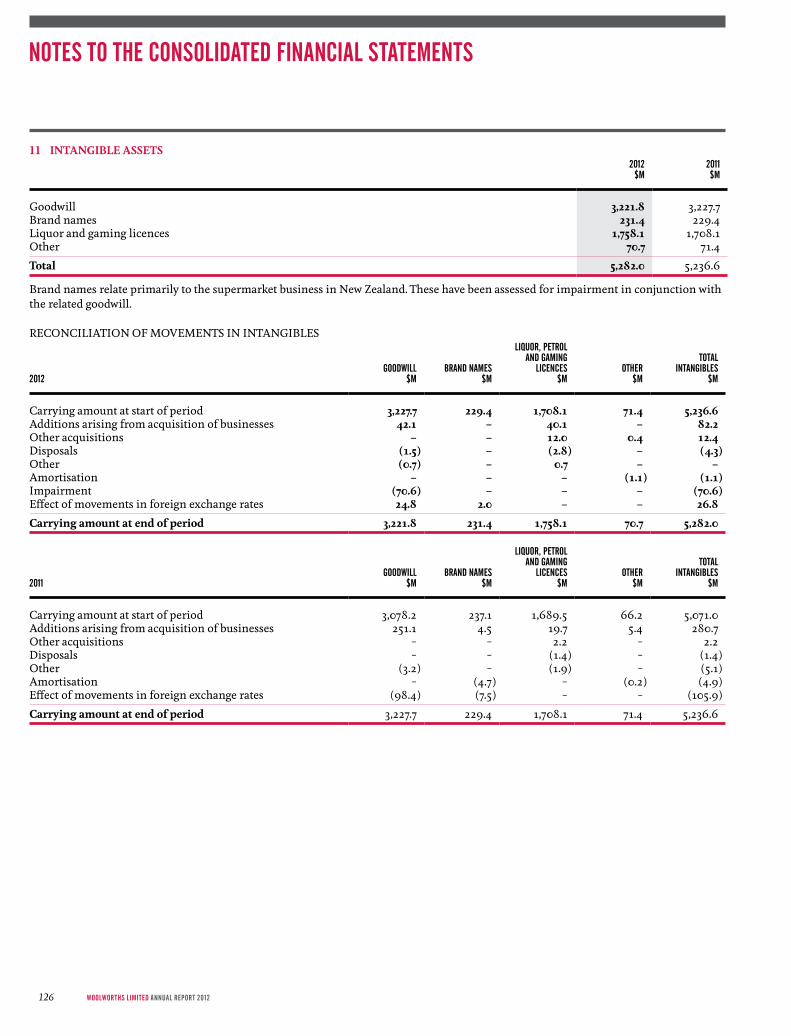
11 IntanGIBle assets
2012
$M2011$M
Goodwill 3,221.8 3,227.7Brand names 231.4 229.4Liquor and gaming licences 1,758.1 1,708.1Other 70.7 71.4
total 5,282.0 5,236.6
Brand names relate primarily to the supermarket business in New Zealand. These have been assessed for impairment in conjunction with the related goodwill.
RECONCILIATION OF MOVEMENTS IN INTANGIBLES
2012
GOODWILL$M
BRAND NAMES$M
LIQuOR, PETROL AND GAMING
LICENCES$M
OTHER$M
TOTAL INTANGIBLES
$M
Carrying amount at start of period 3,227.7 229.4 1,708.1 71.4 5,236.6Additions arising from acquisition of businesses 42.1 – 40.1 – 82.2Other acquisitions – – 12.0 0.4 12.4Disposals (1.5) – (2.8) – (4.3)Other (0.7) – 0.7 – –Amortisation – – – (1.1) (1.1)Impairment (70.6) – – – (70.6)Effect of movements in foreign exchange rates 24.8 2.0 – – 26.8
Carrying amount at end of period 3,221.8 231.4 1,758.1 70.7 5,282.0
2011
GOODWILL$M
BRAND NAMES$M
LIQuOR, PETROL AND GAMING
LICENCES$M
OTHER$M
TOTAL INTANGIBLES
$M
Carrying amount at start of period 3,078.2 237.1 1,689.5 66.2 5,071.0Additions arising from acquisition of businesses 251.1 4.5 19.7 5.4 280.7Other acquisitions – – 2.2 – 2.2Disposals – – (1.4) – (1.4)Other (3.2) – (1.9) – (5.1)Amortisation – (4.7) – (0.2) (4.9)Effect of movements in foreign exchange rates (98.4) (7.5) – – (105.9)
Carrying amount at end of period 3,227.7 229.4 1,708.1 71.4 5,236.6
NOTES TO THE CONSOLIDATED FINANCIAL STATEMENTS
WoolWorths limited AnnuAl report 2012126

Goodwill and intangible assets with indefinite lives are tested for impairment annually and whenever there is an indication that the asset may be impaired. An impairment loss is recognised whenever the carrying amount exceeds the recoverable amount. The recoverable amount of the asset is the higher of its fair value less costs to sell and its value in use.
The recoverable amount is assessed at the cash generating unit (“CGU”) level, which is the smallest group of assets generating cash flows independent of other CGUs that benefit from the use of the respective intangible asset.
The recoverable amount is determined based on the value in use which is calculated using cash flow projections for five years using data from the Group’s latest internal forecasts, the results of which are reviewed by the Board.
The forecasts are extrapolated beyond five years based on estimated long-term growth rates of generally 0%-5%, and do not exceed industry growth rates for the business in which the cash generating unit operates.
The cash flows are discounted to present value using pre-tax discount rates between 14% and 16% (2011: 13% and 16%) depending on the nature of the business and the country of operation. This discount rate is derived from the Group’s post tax weighted average cost of capital.
The key assumptions for the value in use calculations are those regarding discount rates (which have been estimated as described above), long-term growth rates and expected changes in margins. The assumptions regarding long-term growth rates and expected changes in margin (sales growth and CODB reductions) are based on past experience and expectations of changes in the market.
The components of goodwill by segment are as follows:
2012$M
2011$M
Australian Food and Liquor 800.1 801.3New Zealand Supermarkets 1,708.1 1,681.9Consumer Electronics – 70.6Hotels 639.4 629.2Unallocated 74.2 44.7
3,221.8 3,227.7
Goodwill of $70.6 million was impaired during the year as a result of the announcement to restructure and divest the Consumer Electronics business. This business is reported as a discontinued operation – see Note 33.
No other intangible assets were identified as impaired at the reporting date.
127
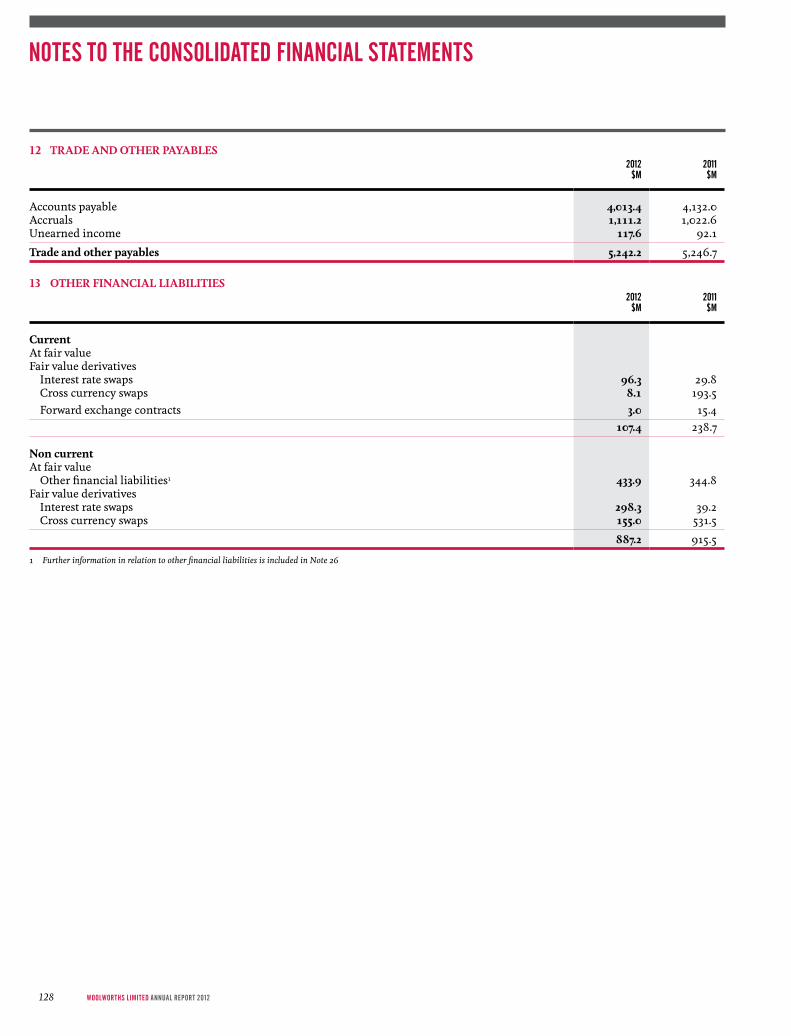
12 tRade and otheR PaYaBles
2012
$M2011$M
Accounts payable 4,013.4 4,132.0Accruals 1,111.2 1,022.6Unearned income 117.6 92.1
trade and other payables 5,242.2 5,246.7
13 otheR FInanCIal lIaBIlItIes
2012
$M2011$M
CurrentAt fair valueFair value derivatives Interest rate swaps 96.3 29.8 Cross currency swaps 8.1 193.5 Forward exchange contracts 3.0 15.4
107.4 238.7
non currentAt fair value Other financial liabilities1 433.9 344.8Fair value derivatives Interest rate swaps 298.3 39.2 Cross currency swaps 155.0 531.5
887.2 915.5
1 Further information in relation to other financial liabilities is included in Note 26
NOTES TO THE CONSOLIDATED FINANCIAL STATEMENTS
WoolWorths limited AnnuAl report 2012128
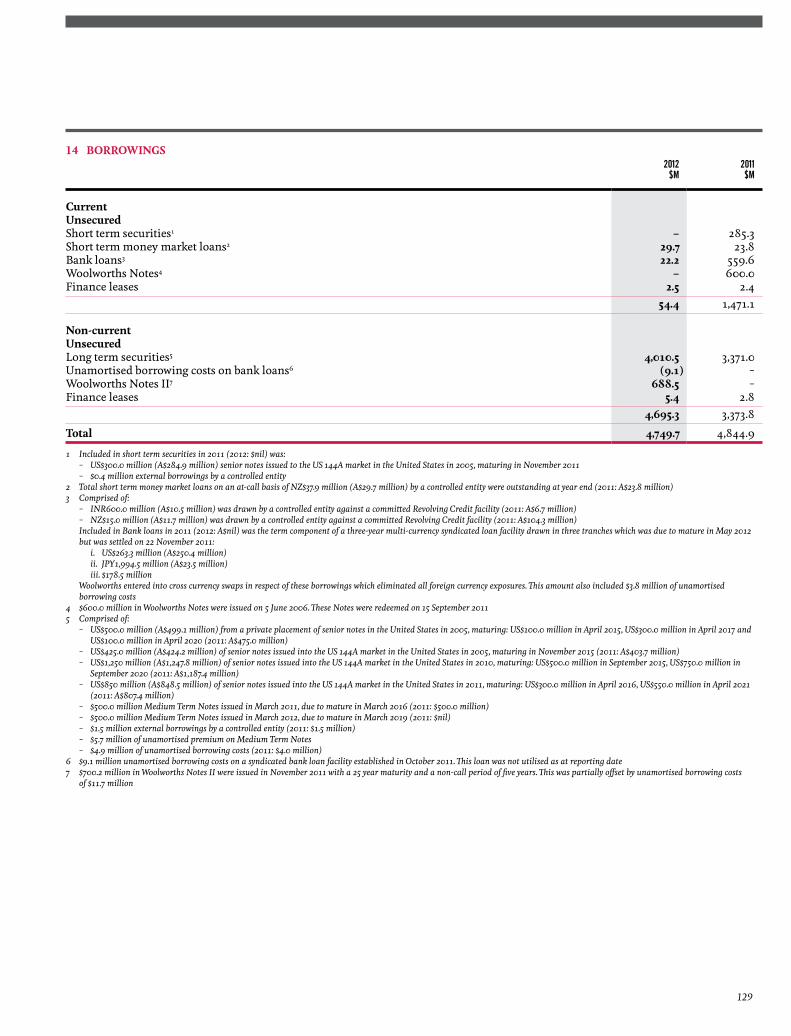
14 BoRRoWInGs2012
$M2011$M
CurrentUnsecuredShort term securities1 – 285.3Short term money market loans2 29.7 23.8Bank loans3 22.2 559.6Woolworths Notes4 – 600.0Finance leases 2.5 2.4
54.4 1,471.1
non-currentUnsecuredLong term securities5 4,010.5 3,371.0Unamortised borrowing costs on bank loans6 (9.1) –Woolworths Notes II7 688.5 –Finance leases 5.4 2.8
4,695.3 3,373.8
total 4,749.7 4,844.9
1 Included in short term securities in 2011 (2012: $nil) was: – US$300.0 million (A$284.9 million) senior notes issued to the US 144A market in the United States in 2005, maturing in November 2011 – $0.4 million external borrowings by a controlled entity2 Total short term money market loans on an at‑call basis of NZ$37.9 million (A$29.7 million) by a controlled entity were outstanding at year end (2011: A$23.8 million)3 Comprised of: – INR600.0 million (A$10.5 million) was drawn by a controlled entity against a committed Revolving Credit facility (2011: A$6.7 million) – NZ$15.0 million (A$11.7 million) was drawn by a controlled entity against a committed Revolving Credit facility (2011: A$104.3 million) Included in Bank loans in 2011 (2012: A$nil) was the term component of a three‑year multi‑currency syndicated loan facility drawn in three tranches which was due to mature in May 2012
but was settled on 22 November 2011: i. US$263.3 million (A$250.4 million) ii. JPY1,994.5 million (A$23.5 million) iii. $178.5 million Woolworths entered into cross currency swaps in respect of these borrowings which eliminated all foreign currency exposures. This amount also included $3.8 million of unamortised
borrowing costs4 $600.0 million in Woolworths Notes were issued on 5 June 2006. These Notes were redeemed on 15 September 20115 Comprised of: – US$500.0 million (A$499.1 million) from a private placement of senior notes in the United States in 2005, maturing: US$100.0 million in April 2015, US$300.0 million in April 2017 and
US$100.0 million in April 2020 (2011: A$475.0 million) – US$425.0 million (A$424.2 million) of senior notes issued into the US 144A market in the United States in 2005, maturing in November 2015 (2011: A$403.7 million) – US$1,250 million (A$1,247.8 million) of senior notes issued into the US 144A market in the United States in 2010, maturing: US$500.0 million in September 2015, US$750.0 million in
September 2020 (2011: A$1,187.4 million) – US$850 million (A$848.5 million) of senior notes issued into the US 144A market in the United States in 2011, maturing: US$300.0 million in April 2016, US$550.0 million in April 2021
(2011: A$807.4 million) – $500.0 million Medium Term Notes issued in March 2011, due to mature in March 2016 (2011: $500.0 million) – $500.0 million Medium Term Notes issued in March 2012, due to mature in March 2019 (2011: $nil) – $1.5 million external borrowings by a controlled entity (2011: $1.5 million) – $5.7 million of unamortised premium on Medium Term Notes – $4.9 million of unamortised borrowing costs (2011: $4.0 million)6 $9.1 million unamortised borrowing costs on a syndicated bank loan facility established in October 2011. This loan was not utilised as at reporting date7 $700.2 million in Woolworths Notes II were issued in November 2011 with a 25 year maturity and a non‑call period of five years. This was partially offset by unamortised borrowing costs
of $11.7 million
129

15 FInanCInG aRRanGements – total GRoUPUnrestricted access was available at the balance date to the following lines of credit:
2012$M
2011$M
total facilitiesBank overdrafts 37.6 43.1Bank loan facilities 3,431.6 3,795.6
3,469.2 3,838.7
Used at balance dateBank loan facilities 51.9 587.2
51.9 587.2
Unused at balance dateBank overdrafts 37.6 43.1Bank loan facilities 3,379.7 3,208.4
3,417.3 3,251.5
Bank loan facilities may be drawn at any time, subject to the terms of the lending agreements. The facilities are denominated in Australian dollars, NZ dollars, US dollars and Indian rupees. The bank overdraft facilities may be drawn at any time.
The above facilities are subject to certain financial covenants and undertakings. No covenants have been breached during the period.
Total facilities exclude Woolworths Notes II, Bonds and Medium Term Notes.
NOTES TO THE CONSOLIDATED FINANCIAL STATEMENTS
WoolWorths limited AnnuAl report 2012130
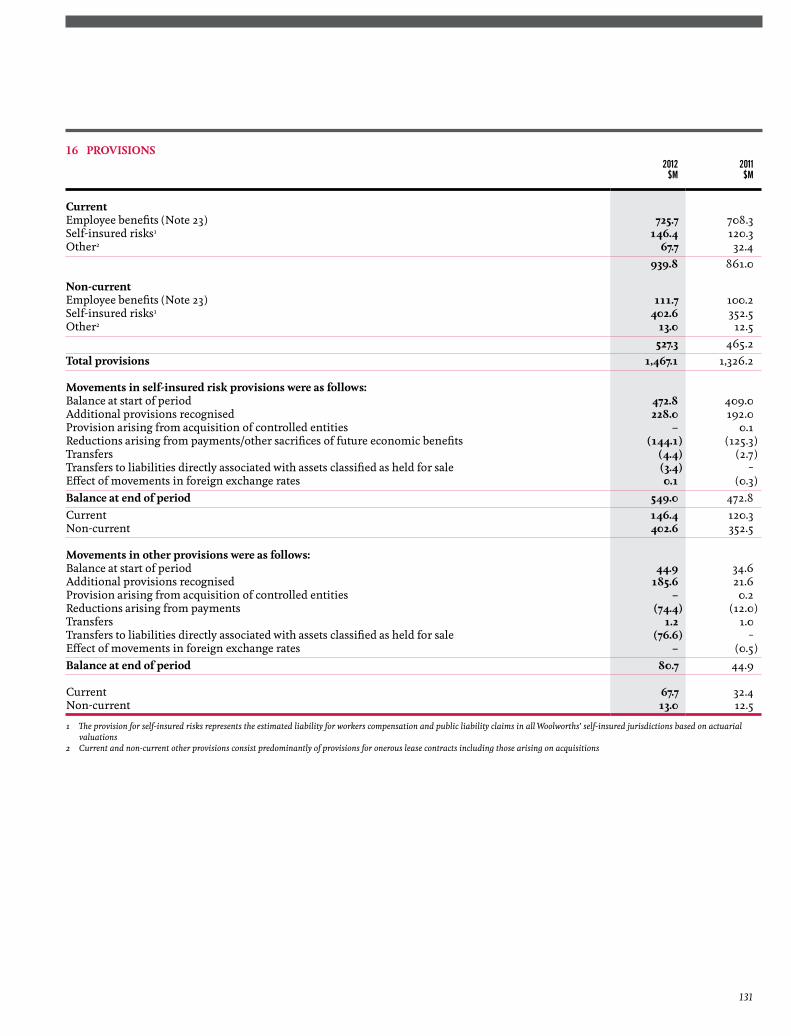
16 PRoVIsIons
2012
$M2011$M
CurrentEmployee benefits (Note 23) 725.7 708.3Self-insured risks1 146.4 120.3Other2 67.7 32.4
939.8 861.0
non-currentEmployee benefits (Note 23) 111.7 100.2Self-insured risks1 402.6 352.5Other2 13.0 12.5
527.3 465.2total provisions 1,467.1 1,326.2
movements in self-insured risk provisions were as follows:Balance at start of period 472.8 409.0Additional provisions recognised 228.0 192.0Provision arising from acquisition of controlled entities – 0.1Reductions arising from payments/other sacrifices of future economic benefits (144.1) (125.3)Transfers (4.4) (2.7)Transfers to liabilities directly associated with assets classified as held for sale (3.4) –Effect of movements in foreign exchange rates 0.1 (0.3)Balance at end of period 549.0 472.8Current 146.4 120.3Non-current 402.6 352.5
movements in other provisions were as follows:Balance at start of period 44.9 34.6Additional provisions recognised 185.6 21.6Provision arising from acquisition of controlled entities – 0.2Reductions arising from payments (74.4) (12.0)Transfers 1.2 1.0Transfers to liabilities directly associated with assets classified as held for sale (76.6) –Effect of movements in foreign exchange rates – (0.5)Balance at end of period 80.7 44.9
Current 67.7 32.4Non-current 13.0 12.5
1 The provision for self‑insured risks represents the estimated liability for workers compensation and public liability claims in all Woolworths’ self‑insured jurisdictions based on actuarial valuations
2 Current and non‑current other provisions consist predominantly of provisions for onerous lease contracts including those arising on acquisitions
131
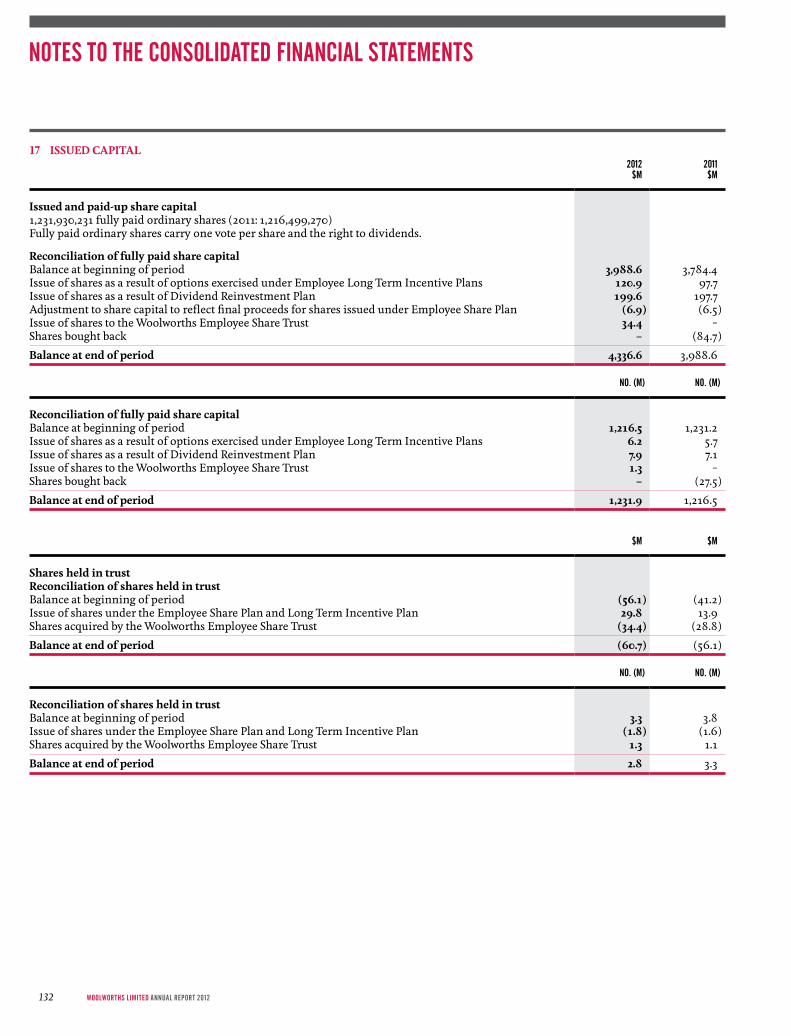
17 IssUed CaPItal
2012 $M
2011$M
Issued and paid-up share capital 1,231,930,231 fully paid ordinary shares (2011: 1,216,499,270) Fully paid ordinary shares carry one vote per share and the right to dividends.
Reconciliation of fully paid share capital Balance at beginning of period 3,988.6 3,784.4Issue of shares as a result of options exercised under Employee Long Term Incentive Plans 120.9 97.7Issue of shares as a result of Dividend Reinvestment Plan 199.6 197.7Adjustment to share capital to reflect final proceeds for shares issued under Employee Share Plan (6.9) (6.5)Issue of shares to the Woolworths Employee Share Trust 34.4 –Shares bought back – (84.7)
Balance at end of period 4,336.6 3,988.6
NO. (M) NO. (M)
Reconciliation of fully paid share capitalBalance at beginning of period 1,216.5 1,231.2Issue of shares as a result of options exercised under Employee Long Term Incentive Plans 6.2 5.7Issue of shares as a result of Dividend Reinvestment Plan 7.9 7.1Issue of shares to the Woolworths Employee Share Trust 1.3 –Shares bought back – (27.5)
Balance at end of period 1,231.9 1,216.5
$M $M
shares held in trustReconciliation of shares held in trustBalance at beginning of period (56.1) (41.2)Issue of shares under the Employee Share Plan and Long Term Incentive Plan 29.8 13.9Shares acquired by the Woolworths Employee Share Trust (34.4) (28.8)
Balance at end of period (60.7) (56.1)
NO. (M) NO. (M)
Reconciliation of shares held in trustBalance at beginning of period 3.3 3.8Issue of shares under the Employee Share Plan and Long Term Incentive Plan (1.8) (1.6)Shares acquired by the Woolworths Employee Share Trust 1.3 1.1
Balance at end of period 2.8 3.3
NOTES TO THE CONSOLIDATED FINANCIAL STATEMENTS
WoolWorths limited AnnuAl report 2012132
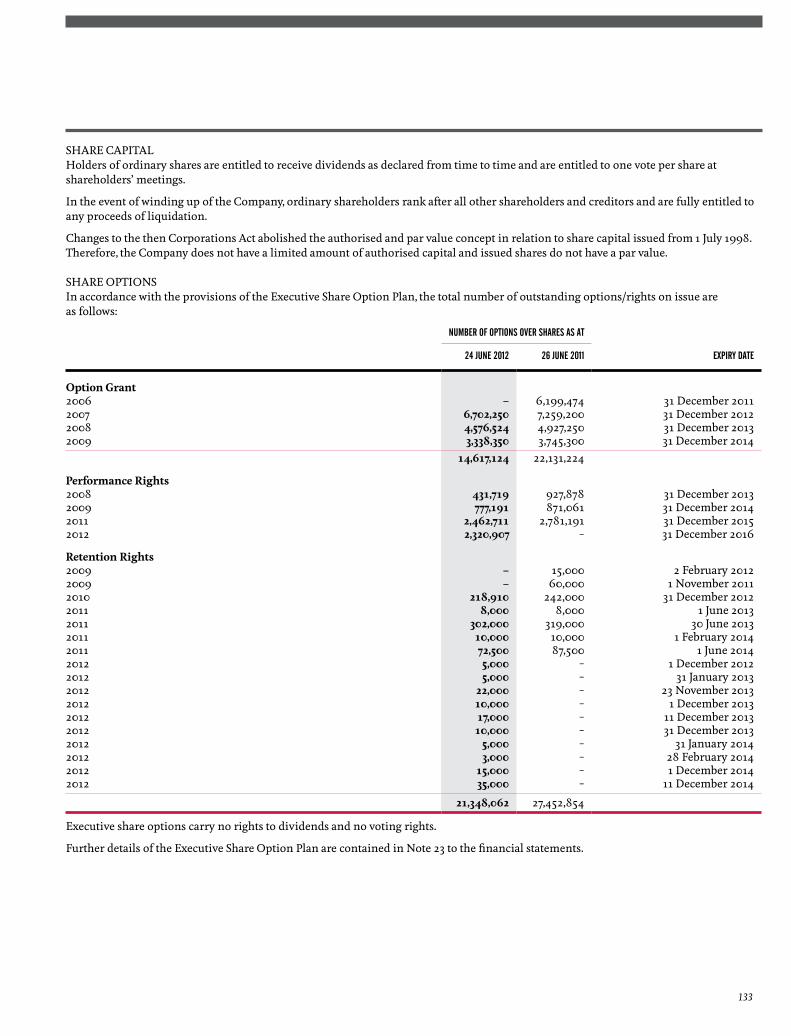
SHARE CAPITALHolders of ordinary shares are entitled to receive dividends as declared from time to time and are entitled to one vote per share at shareholders’ meetings.
In the event of winding up of the Company, ordinary shareholders rank after all other shareholders and creditors and are fully entitled to any proceeds of liquidation.
Changes to the then Corporations Act abolished the authorised and par value concept in relation to share capital issued from 1 July 1998. Therefore, the Company does not have a limited amount of authorised capital and issued shares do not have a par value.
SHARE OPTIONSIn accordance with the provisions of the Executive Share Option Plan, the total number of outstanding options/rights on issue are as follows:
NuMBER OF OPTIONS OVER SHARES AS AT
24 juNE 2012 26 juNE 2011 ExPIRy DATE
option Grant2006 – 6,199,474 31 December 20112007 6,702,250 7,259,200 31 December 20122008 4,576,524 4,927,250 31 December 20132009 3,338,350 3,745,300 31 December 2014
14,617,124 22,131,224
Performance Rights2008 431,719 927,878 31 December 20132009 777,191 871,061 31 December 20142011 2,462,711 2,781,191 31 December 20152012 2,320,907 – 31 December 2016
Retention Rights2009 – 15,000 2 February 20122009 – 60,000 1 November 20112010 218,910 242,000 31 December 20122011 8,000 8,000 1 June 20132011 302,000 319,000 30 June 20132011 10,000 10,000 1 February 20142011 72,500 87,500 1 June 20142012 5,000 – 1 December 20122012 5,000 – 31 January 20132012 22,000 – 23 November 20132012 10,000 – 1 December 20132012 17,000 – 11 December 20132012 10,000 – 31 December 20132012 5,000 – 31 January 20142012 3,000 – 28 February 20142012 15,000 – 1 December 20142012 35,000 – 11 December 2014
21,348,062 27,452,854
Executive share options carry no rights to dividends and no voting rights.
Further details of the Executive Share Option Plan are contained in Note 23 to the financial statements.
133

18 ReseRVes
2012
$M2011$M
Hedging reserve (52.7) 3.2Foreign currency translation reserve (341.9) (381.2)Remuneration reserve 246.2 220.4Asset revaluation reserve 16.4 16.4Equity instrument reserve (111.9) (95.6)
(243.9) (236.8)
HEDGING RESERVEThe hedging reserve comprises the effective portion of the cumulative net change in the fair value of cash flow hedging instruments related to hedged transactions that have not yet occurred. The cumulative deferred gain or loss on the hedge is recognised in profit and loss when the hedged transaction impacts the profit or loss, consistent with applicable accounting policy.
FOREIGN CURRENCy TRANSLATION RESERVEThe foreign currency translation reserve comprises all foreign exchange differences arising from the translation of the financial statements of foreign operations where their functional currency is different to the Group’s presentation currency. Gains and losses on hedging instruments that are designated as hedging instruments for hedges of net investments in foreign operations are also included in the foreign currency translation reserve.
REMUNERATION RESERVEThe employee remuneration reserve comprises the fair value of share based payment plans recognised as an expense in the income statement.
ASSET REVALUATION RESERVEThe asset revaluation reserve arose on acquisition of the previously equity accounted investment in MGW Hotels Pty Ltd and relates to the change in fair value of the consolidated entity’s interest in non-current assets from the date of acquisition of the initial investment to the date control was achieved.
EQUITy INSTRUMENT RESERVEThe equity instrument reserve arises on the revaluation of investments in equity securities. Subsequent to initial recognition, they are measured at fair value with any changes recorded through the equity instrument reserve.
NOTES TO THE CONSOLIDATED FINANCIAL STATEMENTS
WoolWorths limited AnnuAl report 2012134
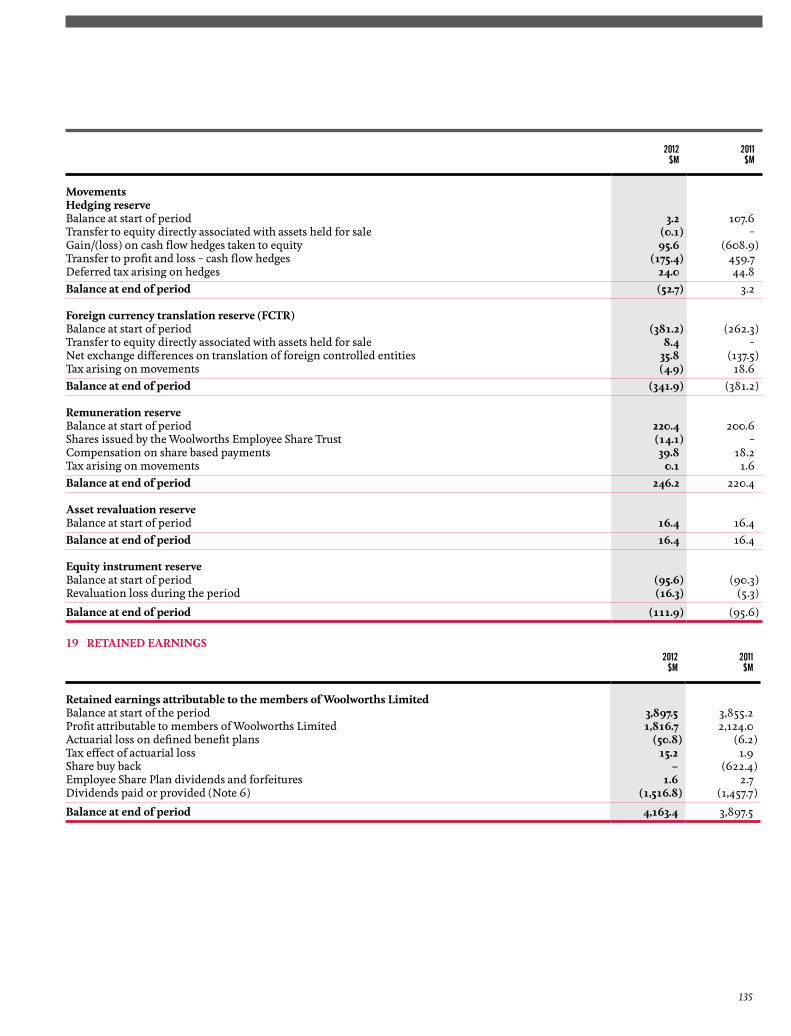
2012$M
2011$M
movementshedging reserveBalance at start of period 3.2 107.6Transfer to equity directly associated with assets held for sale (0.1) –Gain/(loss) on cash flow hedges taken to equity 95.6 (608.9)Transfer to profit and loss – cash flow hedges (175.4) 459.7Deferred tax arising on hedges 24.0 44.8Balance at end of period (52.7) 3.2
Foreign currency translation reserve (FCtR)Balance at start of period (381.2) (262.3)Transfer to equity directly associated with assets held for sale 8.4 –Net exchange differences on translation of foreign controlled entities 35.8 (137.5)Tax arising on movements (4.9) 18.6Balance at end of period (341.9) (381.2)
Remuneration reserveBalance at start of period 220.4 200.6Shares issued by the Woolworths Employee Share Trust (14.1) –Compensation on share based payments 39.8 18.2Tax arising on movements 0.1 1.6Balance at end of period 246.2 220.4
asset revaluation reserveBalance at start of period 16.4 16.4Balance at end of period 16.4 16.4
equity instrument reserveBalance at start of period (95.6) (90.3)Revaluation loss during the period (16.3) (5.3)
Balance at end of period (111.9) (95.6)
19 RetaIned eaRnInGs
2012
$M2011$M
Retained earnings attributable to the members of Woolworths limitedBalance at start of the period 3,897.5 3,855.2Profit attributable to members of Woolworths Limited 1,816.7 2,124.0Actuarial loss on defined benefit plans (50.8) (6.2)Tax effect of actuarial loss 15.2 1.9Share buy back – (622.4)Employee Share Plan dividends and forfeitures 1.6 2.7Dividends paid or provided (Note 6) (1,516.8) (1,457.7)
Balance at end of period 4,163.4 3,897.5
135
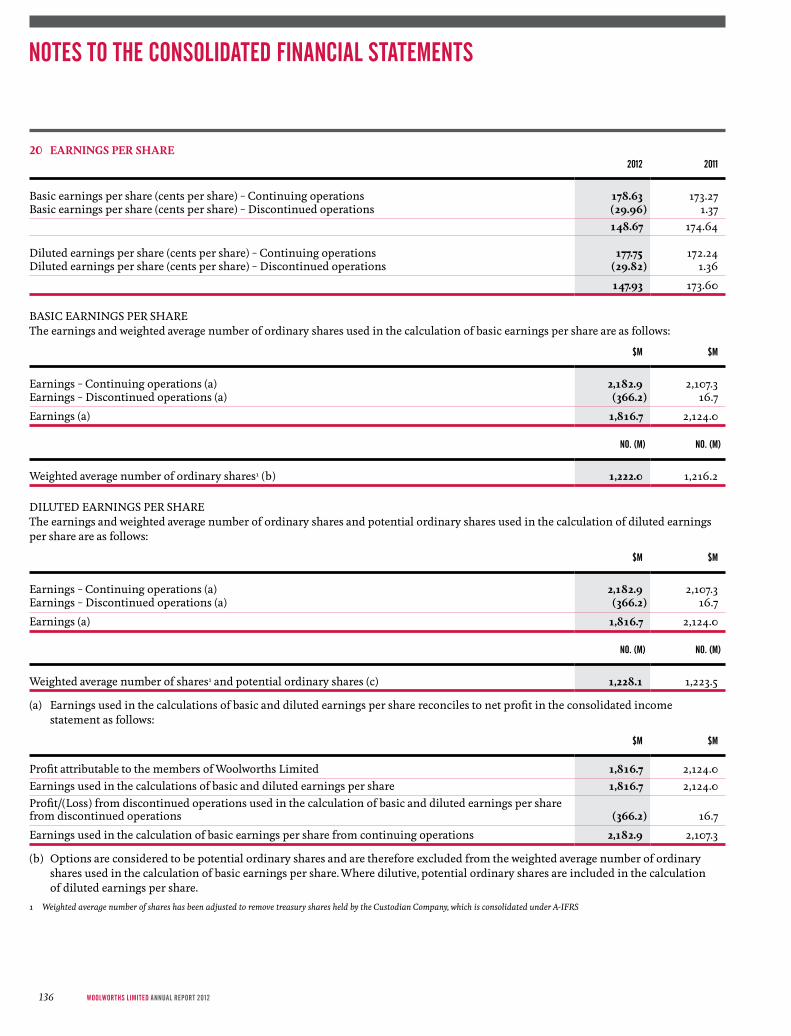
20 eaRnInGs PeR shaRe2012 2011
Basic earnings per share (cents per share) – Continuing operations 178.63 173.27Basic earnings per share (cents per share) – Discontinued operations (29.96) 1.37
148.67 174.64
Diluted earnings per share (cents per share) – Continuing operations 177.75 172.24Diluted earnings per share (cents per share) – Discontinued operations (29.82) 1.36
147.93 173.60
BASIC EARNINGS PER SHAREThe earnings and weighted average number of ordinary shares used in the calculation of basic earnings per share are as follows:
$M $M
Earnings – Continuing operations (a) 2,182.9 2,107.3Earnings – Discontinued operations (a) (366.2) 16.7
Earnings (a) 1,816.7 2,124.0
NO. (M) NO. (M)
Weighted average number of ordinary shares1 (b) 1,222.0 1,216.2
DILUTED EARNINGS PER SHAREThe earnings and weighted average number of ordinary shares and potential ordinary shares used in the calculation of diluted earnings per share are as follows:
$M $M
Earnings – Continuing operations (a) 2,182.9 2,107.3Earnings – Discontinued operations (a) (366.2) 16.7
Earnings (a) 1,816.7 2,124.0
NO. (M) NO. (M)
Weighted average number of shares1 and potential ordinary shares (c) 1,228.1 1,223.5
(a) Earnings used in the calculations of basic and diluted earnings per share reconciles to net profit in the consolidated income statement as follows:
$M $M
Profit attributable to the members of Woolworths Limited 1,816.7 2,124.0Earnings used in the calculations of basic and diluted earnings per share 1,816.7 2,124.0Profit/(Loss) from discontinued operations used in the calculation of basic and diluted earnings per share from discontinued operations (366.2) 16.7
Earnings used in the calculation of basic earnings per share from continuing operations 2,182.9 2,107.3
(b) Options are considered to be potential ordinary shares and are therefore excluded from the weighted average number of ordinary shares used in the calculation of basic earnings per share. Where dilutive, potential ordinary shares are included in the calculation of diluted earnings per share.
1 Weighted average number of shares has been adjusted to remove treasury shares held by the Custodian Company, which is consolidated under A‑IFRS
NOTES TO THE CONSOLIDATED FINANCIAL STATEMENTS
WoolWorths limited AnnuAl report 2012136
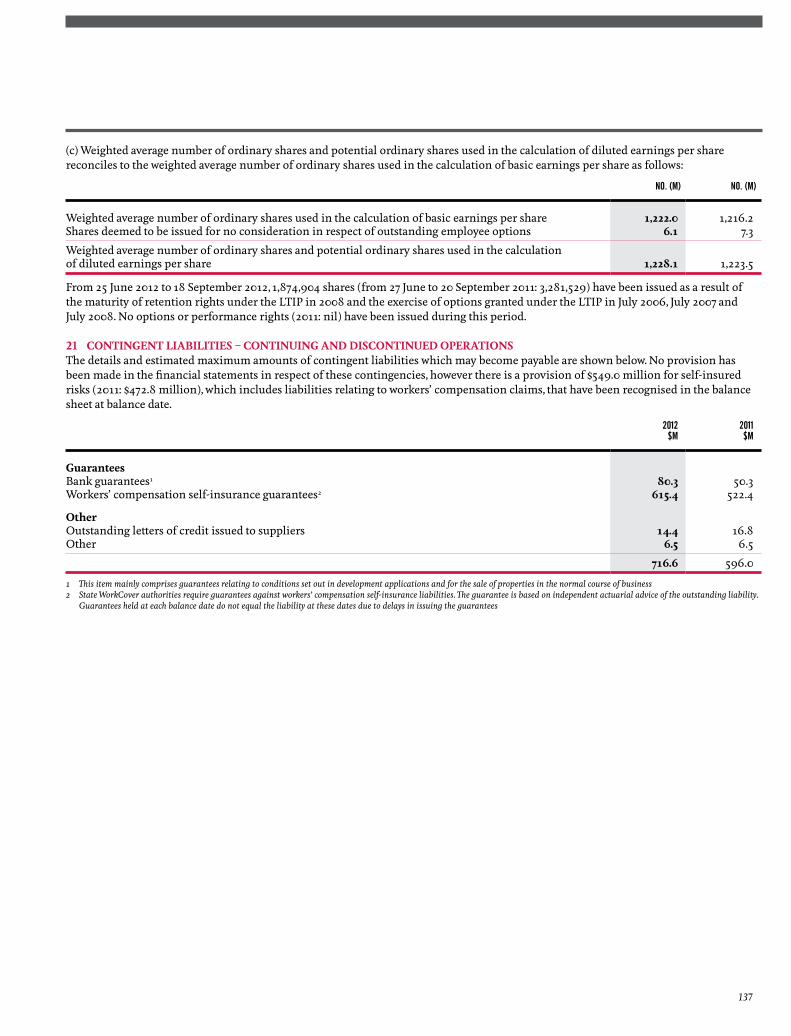
(c) Weighted average number of ordinary shares and potential ordinary shares used in the calculation of diluted earnings per share reconciles to the weighted average number of ordinary shares used in the calculation of basic earnings per share as follows:
NO. (M) NO. (M)
Weighted average number of ordinary shares used in the calculation of basic earnings per share 1,222.0 1,216.2Shares deemed to be issued for no consideration in respect of outstanding employee options 6.1 7.3
Weighted average number of ordinary shares and potential ordinary shares used in the calculation of diluted earnings per share 1,228.1 1,223.5
From 25 June 2012 to 18 September 2012, 1,874,904 shares (from 27 June to 20 September 2011: 3,281,529) have been issued as a result of the maturity of retention rights under the LTIP in 2008 and the exercise of options granted under the LTIP in July 2006, July 2007 and July 2008. No options or performance rights (2011: nil) have been issued during this period.
21 ContInGent lIaBIlItIes – ContInUInG and dIsContInUed oPeRatIonsThe details and estimated maximum amounts of contingent liabilities which may become payable are shown below. No provision has been made in the financial statements in respect of these contingencies, however there is a provision of $549.0 million for self-insured risks (2011: $472.8 million), which includes liabilities relating to workers’ compensation claims, that have been recognised in the balance sheet at balance date.
2012$M
2011$M
Guarantees Bank guarantees1 80.3 50.3Workers’ compensation self-insurance guarantees2 615.4 522.4
otherOutstanding letters of credit issued to suppliers 14.4 16.8Other 6.5 6.5
716.6 596.0
1 This item mainly comprises guarantees relating to conditions set out in development applications and for the sale of properties in the normal course of business2 State WorkCover authorities require guarantees against workers’ compensation self‑insurance liabilities. The guarantee is based on independent actuarial advice of the outstanding liability.
Guarantees held at each balance date do not equal the liability at these dates due to delays in issuing the guarantees
137
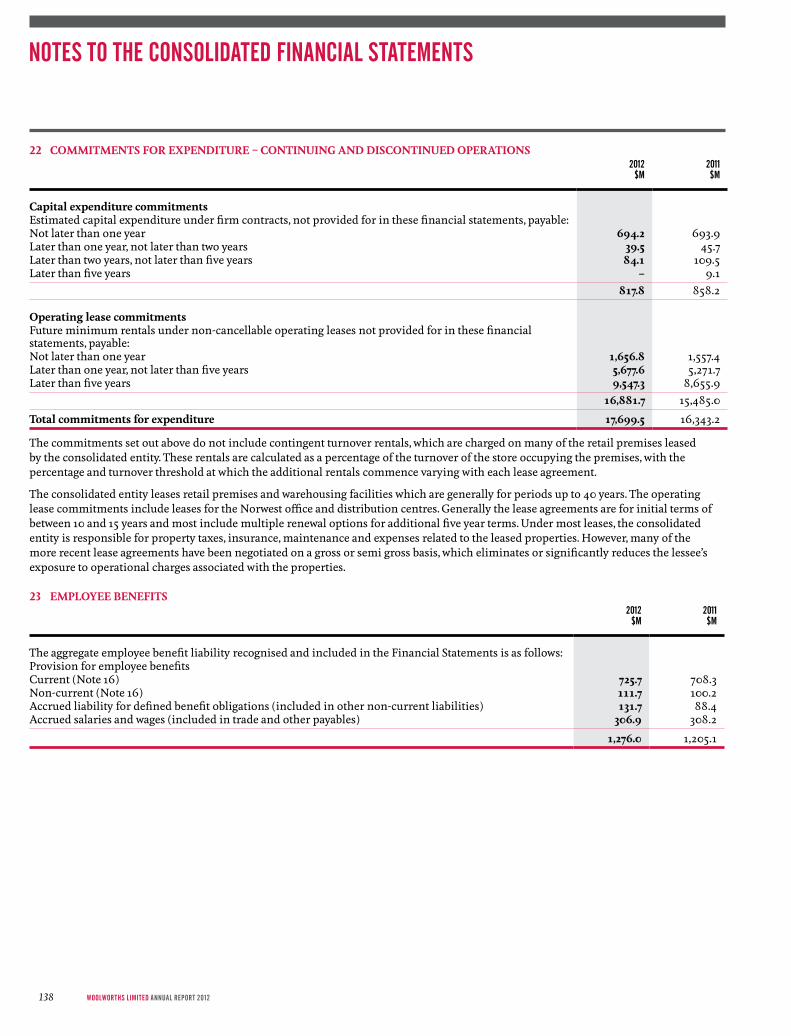
22 CommItments FoR eXPendItURe – ContInUInG and dIsContInUed oPeRatIons2012
$M2011$M
Capital expenditure commitmentsEstimated capital expenditure under firm contracts, not provided for in these financial statements, payable:Not later than one year 694.2 693.9Later than one year, not later than two years 39.5 45.7Later than two years, not later than five years 84.1 109.5Later than five years – 9.1
817.8 858.2
operating lease commitments Future minimum rentals under non-cancellable operating leases not provided for in these financial statements, payable:Not later than one year 1,656.8 1,557.4Later than one year, not later than five years 5,677.6 5,271.7Later than five years 9,547.3 8,655.9
16,881.7 15,485.0
total commitments for expenditure 17,699.5 16,343.2
The commitments set out above do not include contingent turnover rentals, which are charged on many of the retail premises leased by the consolidated entity. These rentals are calculated as a percentage of the turnover of the store occupying the premises, with the percentage and turnover threshold at which the additional rentals commence varying with each lease agreement.
The consolidated entity leases retail premises and warehousing facilities which are generally for periods up to 40 years. The operating lease commitments include leases for the Norwest office and distribution centres. Generally the lease agreements are for initial terms of between 10 and 15 years and most include multiple renewal options for additional five year terms. Under most leases, the consolidated entity is responsible for property taxes, insurance, maintenance and expenses related to the leased properties. However, many of the more recent lease agreements have been negotiated on a gross or semi gross basis, which eliminates or significantly reduces the lessee’s exposure to operational charges associated with the properties.
23 emPloYee BeneFIts2012
$M2011$M
The aggregate employee benefit liability recognised and included in the Financial Statements is as follows:Provision for employee benefitsCurrent (Note 16) 725.7 708.3Non-current (Note 16) 111.7 100.2Accrued liability for defined benefit obligations (included in other non-current liabilities) 131.7 88.4Accrued salaries and wages (included in trade and other payables) 306.9 308.2
1,276.0 1,205.1
NOTES TO THE CONSOLIDATED FINANCIAL STATEMENTS
WoolWorths limited AnnuAl report 2012138

A DEFINED BENEFIT SUPERANNUATION PLANSThe following disclosures set out the accounting for the Plan as recognised in the financial statements of the consolidated entity in accordance with AASB 119 Employee Benefits.
liability for defined benefit obligation24 juNE 12
$M26 juNE 11
$M27 juNE 10
$M28 juNE 09
$M29 juNE 08
$M
Defined benefit obligation1 (2,237.3) (2,104.3) (1,837.0) (1,536.0) (1,609.0)Fair value of assets 2,105.6 2,015.9 1,753.0 1,444.0 1,556.0Liability for defined benefit obligations (131.7) (88.4) (84.0) (92.0) (53.0)
Experience adjustments – liabilities 110.5 43.2 80.0 (310.0) (195.0)Experience adjustments – assets (130.0) (37.0) (82.0) 377.0 235.0
1 Includes contribution tax liability
The consolidated entity makes contributions to a defined benefit plan, Woolworths Group Superannuation Plan (WGSP) that provides superannuation benefits for employees upon retirement.
The Company sponsors the WGSP which consists of members with defined contribution (accumulation) benefits as well as defined benefits members. The Plan also pays allocated pensions to a small number of pensioners.
The members and assets of the WGSP are held in the AMP Superannuation Savings Trust.
Movements in the net liability for defined benefit obligations are recognised in the balance sheet.
2012$M
2011$M
Opening net liability for defined benefit obligations (88.4) (84.0)Contributions by employer 149.8 140.8Expense recognised in the income statement (142.3) (139.0)Actuarial losses recognised directly in equity (Note 19) (50.8) (6.2)
Closing net liability for defined benefit obligations (131.7) (88.4)
Actuarial losses recognised in other comprehensive income during the year were $50.8 million (2011: loss of $6.2 million), with cumulative actuarial losses of $196.7 million (2011: $145.9 million).
Changes in the present value of the defined benefit obligation are as follows:
2012$M
2011$M
Opening defined benefit obligation 2,104.3 1,837.0Current service cost 153.9 150.6Interest cost 138.2 115.4Actuarial (gains)/losses (79.2) 43.2Employee contributions 95.1 99.4Benefits paid (175.0) (141.3)
Closing defined benefit obligation 2,237.3 2,104.3
139
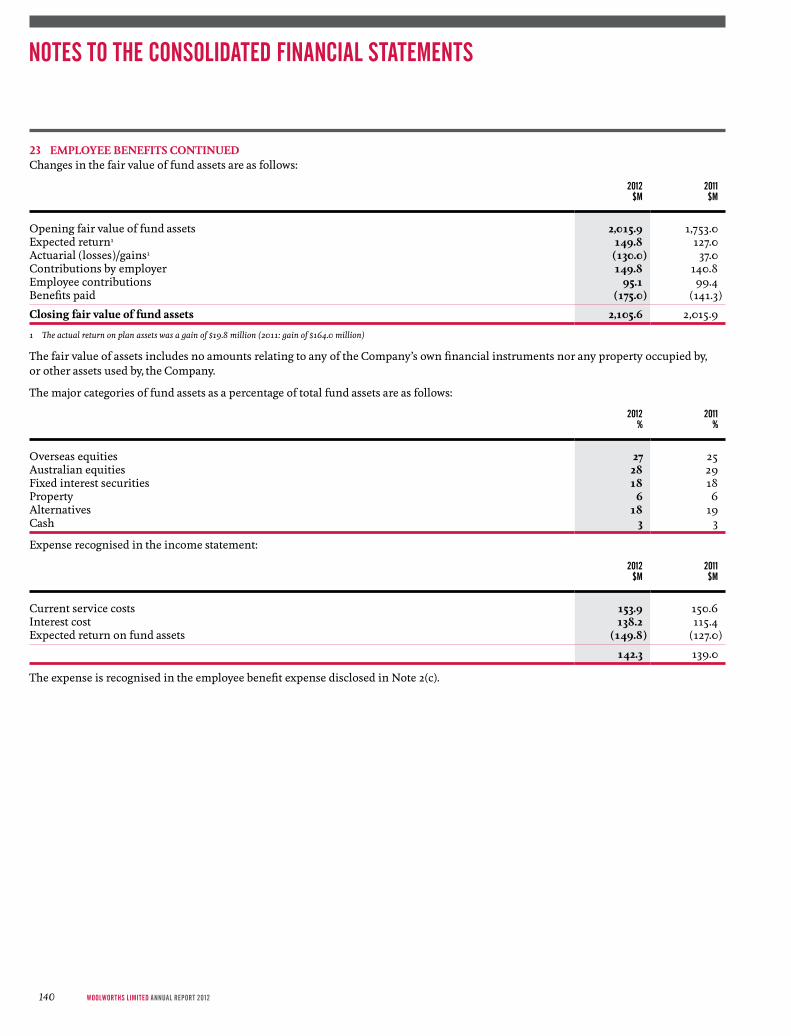
23 emPloYee BeneFIts ContInUedChanges in the fair value of fund assets are as follows:
2012$M
2011$M
Opening fair value of fund assets 2,015.9 1,753.0Expected return1 149.8 127.0Actuarial (losses)/gains1 (130.0) 37.0Contributions by employer 149.8 140.8Employee contributions 95.1 99.4Benefits paid (175.0) (141.3)
Closing fair value of fund assets 2,105.6 2,015.9
1 The actual return on plan assets was a gain of $19.8 million (2011: gain of $164.0 million)
The fair value of assets includes no amounts relating to any of the Company’s own financial instruments nor any property occupied by, or other assets used by, the Company.
The major categories of fund assets as a percentage of total fund assets are as follows:
2012%
2011%
Overseas equities 27 25Australian equities 28 29Fixed interest securities 18 18Property 6 6Alternatives 18 19Cash 3 3
Expense recognised in the income statement:
2012$M
2011$M
Current service costs 153.9 150.6Interest cost 138.2 115.4Expected return on fund assets (149.8) (127.0)
142.3 139.0
The expense is recognised in the employee benefit expense disclosed in Note 2(c).
NOTES TO THE CONSOLIDATED FINANCIAL STATEMENTS
WoolWorths limited AnnuAl report 2012140

The defined benefit obligations have been determined by the Plan actuary, Mr John Burnett, FIAA, Towers Watson, using the projected unit cost method. The following are the principal actuarial assumptions used.
2012 %
2011%
Discount rate (gross of tax) 2.90 5.20Discount rate (net of tax) 2.50 4.40Expected return on fund assets 7.25 7.50Future salary increases 3.00 3.50
The expected returns on assets assumption is determined by weighting the expected long-term return for each asset class by the target allocation of assets to each class. The returns used for each asset class are net of investment tax and investment fees.
Contributions for permanent salaried employees of the consolidated entity are made to certain Company sponsored superannuation funds including the WGSP. These superannuation funds provide lump sum accumulation benefits to members on retirement, death and total and permanent disablement from 1 September 2010. The consolidated entity is legally obliged to contribute to the Company sponsored WGSP at rates as set out in the Trust Deed and Rules and the Participation Deed between the Company and AMP Superannuation Limited. Members contribute to the WGSP at rates dependent upon their membership category.
The expected consolidated entity and employee contributions to the WGSP for the 2013 financial year are $145.3 million and $45.1 million respectively.
The consolidated entity is also obliged to contribute at fixed rates to defined contribution retirement plans for certain employees under industrial agreements and the Superannuation Guarantee legislation. The consolidated entity contributes to various industry based superannuation funds and to the WGSP for non-salaried employees.
The consolidated entity also makes contributions to the long term retirement savings of employees in New Zealand in accordance with KiwiSaver legislation.
B SHARE BASED PAyMENTS executive option Plan (eoP) The Executive Option Plan (EOP) was approved by shareholders in November 1999 and was last offered with an effective grant date of 1 July 2004. During the 52 weeks ended 26 June 2011, the final remaining options outstanding under this plan were exercised.
Awards were made under the EOP in five tranches with each tranche subject to performance hurdles established by the People Policy Committee and approved by the Board.
The Executive Option Plan had the following features:
– An exercise period that commenced after five years, subject to performance hurdles being met and with a maximum exercise period of five and a half years (10 years for options issued prior to 2002);
– Upon exercise, each option entitled the option holder to one ordinary fully paid Woolworths Limited share; – For offers made from 2002 the 50% EPS component vested in four equal tranches of 12.5%, dependent on attaining average annual
growth of either 10% or 11%; – The fifth tranche was comprised of the 50% TSR component which vested progressively where TSR equalled or exceeded the 60th
percentile of the comparator group up to the full 50% vesting where TSR equalled the 75th percentile of the comparator group; and – No further grants have been made under this plan since 2004.
141

23 emPloYee BeneFIts ContInUedWoolworths long term Incentive Plan (ltIP)At the 2004 Annual General Meeting, shareholders approved the introduction of a new long term incentive, the Woolworths Long Term Incentive Plan. The Plan has four Sub-Plans, which are described below, that allows the Board flexibility to determine which of the Sub-Plan’s awards will be granted to deliver the overall LTIP objectives.
From 2005 to 2007 the Option Sub-Plan was used to satisfy Woolworths LTIP requirements. Offers made in 2008 and 2009 used a combination of the Option Sub-Plan and the Performance Rights Sub-Plan and offers in 2010 and 2011 were comprised solely of the Performance Rights Sub-Plan. Irrespective of Sub-Plan, stringent performance measures are set annually and relate to EPS and TSR hurdles. The Performance Shares and Cash Award Sub-Plans have not been used.
summary of sub-PlansDELIVERS A RIGHT TO ACQuIRE ... SuBjECT TO PERFORMANCE HuRDLES BEING MET AND ...
Option Sub-Plan A share at a future date Payment of an exercise pricePerformance Rights Sub-Plan A share at a future date No monetary paymentPerformance Shares Sub-Plan A share immediately No monetary payment
Cash Award Sub-Plan Cash at a future date No other condition
In addition the Performance Rights Sub-Plan has been used as a Retention Plan since 2007 to ensure that key employees are retained to protect and deliver on the Company’s strategic direction. It has been delivered to senior executives who had either no or relatively small option grants scheduled to vest over the ensuing two years. This plan does not have performance measures attached to it due to the objective of retaining key talent and vests subject to the executive remaining employed by the Company for a two year or more period. It is intended that this plan be used only in special circumstances.
summary of outstanding instruments granted under the ltIP (as at 24 June 2012)
yEAR (FINANCIAL) 2008 2009 2010 2011 2012 TOTAL
Options 6,702,250 4,576,524 3,338,350 – – 14,617,124Performance Rights – 431,719 777,191 2,462,711 2,320,907 5,992,528Retention Performance Rights – – – 611,410 127,000 738,410
The LTIP has the following features:
– A maximum exercise period of five and a half years; – Upon exercise, each option entitles the option holder to one ordinary fully paid Woolworths Limited share; – For offers from 2006 through to 2008:
– an exercise period that commences after five years, subject to performance hurdles being met; – the 50% EPS component vests in four equal tranches of 12.5%, dependent on attaining average annual growth of either 10% or
11%; and – a fifth tranche comprised of the 50% TSR component which vests progressively where TSR equals or exceeds the 60th percentile
of the comparator group up to the full 50% vesting where TSR equals the 75th percentile of the comparator group.
– For offers from 2009 through to 2011: – a four year vesting period that may commence vesting after three years, subject to performance hurdles being met; – if the minimum performance hurdles are not met after three years, nothing vests and the measures will be tested at the end of
four years; – where any performance measures are met after three years, nothing further vests at the end of four years; – the 50% EPS component vests progressively upon attaining average annual growth of 10%. At 10% growth, 12.5% EPS will vest
with the full 50% vesting at an average annual growth of 15%; and – the 50% TSR component vests progressively where TSR equals or exceeds the 51st percentile of the comparator group. At the 51st
percentile, 12.5% TSR will vest with the full 50% vesting where TSR equals the 75th percentile of the comparator group.
– For offers in 2012: – a five year vesting period subject to performance hurdles being met; – if the minimum performance hurdles are not met after five years, nothing vests; – the 50% EPS component vests progressively upon attaining average annual growth of 8%. At 8% growth, 12.5% EPS will vest with
the full 50% vesting at an average annual growth of 12%; and – the 50% TSR component vests progressively where TSR equals or exceeds the 51st percentile of the comparator group. At the 51st
percentile, 12.5% TSR will vest with the full 50% vesting where TSR equals the 75th percentile of the comparator group.
NOTES TO THE CONSOLIDATED FINANCIAL STATEMENTS
WoolWorths limited AnnuAl report 2012142
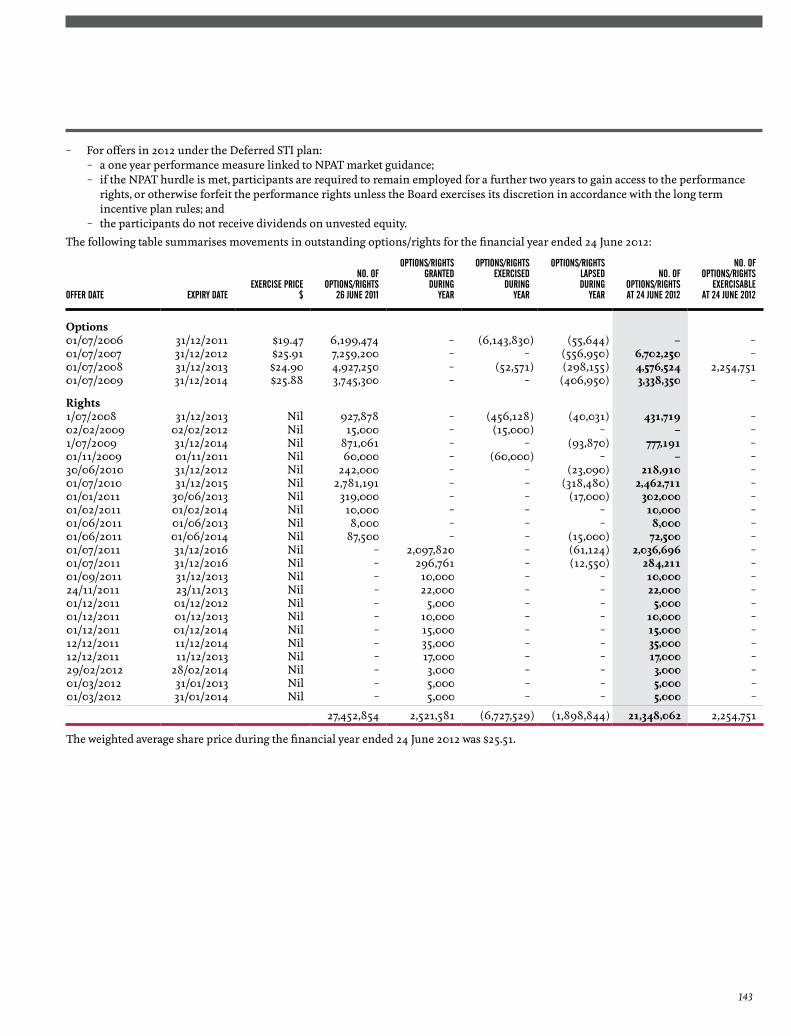
– For offers in 2012 under the Deferred STI plan: – a one year performance measure linked to NPAT market guidance; – if the NPAT hurdle is met, participants are required to remain employed for a further two years to gain access to the performance
rights, or otherwise forfeit the performance rights unless the Board exercises its discretion in accordance with the long term incentive plan rules; and
– the participants do not receive dividends on unvested equity.
The following table summarises movements in outstanding options/rights for the financial year ended 24 June 2012:
OFFER DATE ExPIRy DATEExERCISE PRICE
$
NO. OFOPTIONS/RIGHTS
26 juNE 2011
OPTIONS/RIGHTSGRANTED
DuRINGyEAR
OPTIONS/RIGHTSExERCISED
DuRINGyEAR
OPTIONS/RIGHTSLAPSEDDuRING
yEAR
NO. OFOPTIONS/RIGHTSAT 24 juNE 2012
NO. OFOPTIONS/RIGHTS
ExERCISABLEAT 24 juNE 2012
options01/07/2006 31/12/2011 $19.47 6,199,474 – (6,143,830) (55,644) – –01/07/2007 31/12/2012 $25.91 7,259,200 – – (556,950) 6,702,250 –01/07/2008 31/12/2013 $24.90 4,927,250 – (52,571) (298,155) 4,576,524 2,254,75101/07/2009 31/12/2014 $25.88 3,745,300 – – (406,950) 3,338,350 –
Rights1/07/2008 31/12/2013 Nil 927,878 – (456,128) (40,031) 431,719 –02/02/2009 02/02/2012 Nil 15,000 – (15,000) – – –1/07/2009 31/12/2014 Nil 871,061 – – (93,870) 777,191 –01/11/2009 01/11/2011 Nil 60,000 – (60,000) – – –30/06/2010 31/12/2012 Nil 242,000 – – (23,090) 218,910 –01/07/2010 31/12/2015 Nil 2,781,191 – – (318,480) 2,462,711 –01/01/2011 30/06/2013 Nil 319,000 – – (17,000) 302,000 –01/02/2011 01/02/2014 Nil 10,000 – – – 10,000 –01/06/2011 01/06/2013 Nil 8,000 – – – 8,000 –01/06/2011 01/06/2014 Nil 87,500 – – (15,000) 72,500 –01/07/2011 31/12/2016 Nil – 2,097,820 – (61,124) 2,036,696 –01/07/2011 31/12/2016 Nil – 296,761 – (12,550) 284,211 –01/09/2011 31/12/2013 Nil – 10,000 – – 10,000 –24/11/2011 23/11/2013 Nil – 22,000 – – 22,000 –01/12/2011 01/12/2012 Nil – 5,000 – – 5,000 –01/12/2011 01/12/2013 Nil – 10,000 – – 10,000 –01/12/2011 01/12/2014 Nil – 15,000 – – 15,000 –12/12/2011 11/12/2014 Nil – 35,000 – – 35,000 –12/12/2011 11/12/2013 Nil – 17,000 – – 17,000 –29/02/2012 28/02/2014 Nil – 3,000 – – 3,000 –01/03/2012 31/01/2013 Nil – 5,000 – – 5,000 –01/03/2012 31/01/2014 Nil – 5,000 – – 5,000 –
27,452,854 2,521,581 (6,727,529) (1,898,844) 21,348,062 2,254,751
The weighted average share price during the financial year ended 24 June 2012 was $25.51.
143
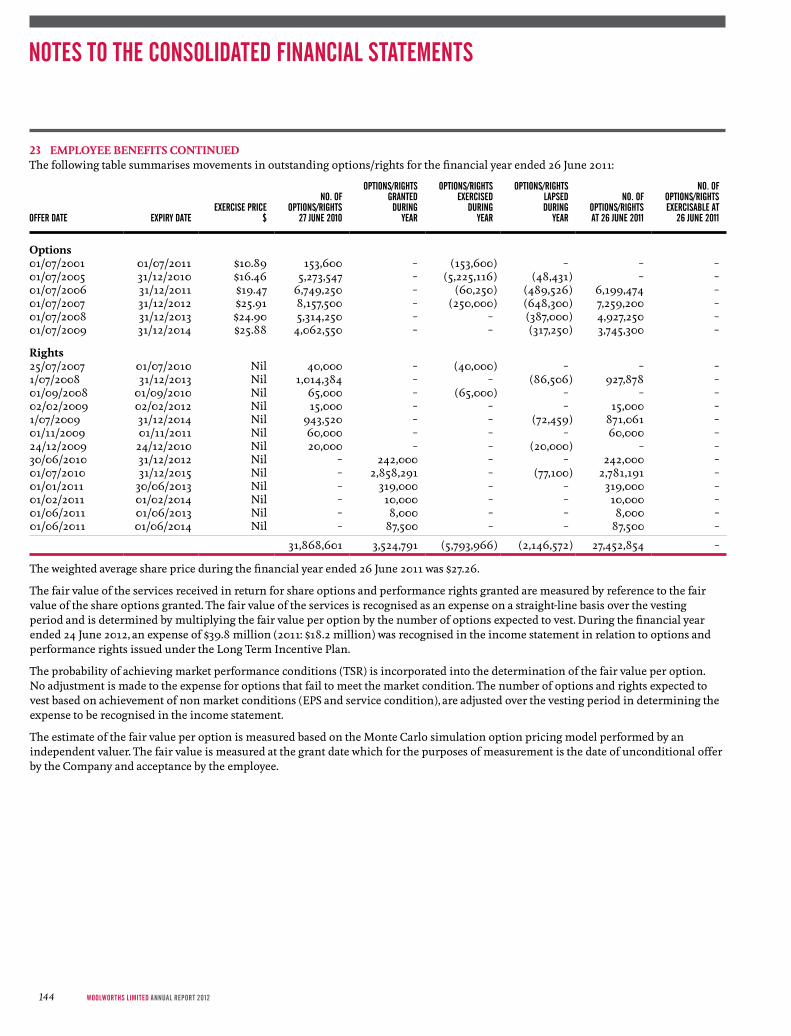
23 emPloYee BeneFIts ContInUedThe following table summarises movements in outstanding options/rights for the financial year ended 26 June 2011:
OFFER DATE ExPIRy DATEExERCISE PRICE
$
NO. OFOPTIONS/RIGHTS
27 juNE 2010
OPTIONS/RIGHTSGRANTED
DuRINGyEAR
OPTIONS/RIGHTSExERCISED
DuRINGyEAR
OPTIONS/RIGHTSLAPSEDDuRING
yEAR
NO. OFOPTIONS/RIGHTSAT 26 juNE 2011
NO. OFOPTIONS/RIGHTSExERCISABLE AT
26 juNE 2011
options01/07/2001 01/07/2011 $10.89 153,600 – (153,600) – – –01/07/2005 31/12/2010 $16.46 5,273,547 – (5,225,116) (48,431) – –01/07/2006 31/12/2011 $19.47 6,749,250 – (60,250) (489,526) 6,199,474 –01/07/2007 31/12/2012 $25.91 8,157,500 – (250,000) (648,300) 7,259,200 –01/07/2008 31/12/2013 $24.90 5,314,250 – – (387,000) 4,927,250 –01/07/2009 31/12/2014 $25.88 4,062,550 – – (317,250) 3,745,300 –
Rights25/07/2007 01/07/2010 Nil 40,000 – (40,000) – – –1/07/2008 31/12/2013 Nil 1,014,384 – – (86,506) 927,878 –01/09/2008 01/09/2010 Nil 65,000 – (65,000) – – –02/02/2009 02/02/2012 Nil 15,000 – – – 15,000 –1/07/2009 31/12/2014 Nil 943,520 – – (72,459) 871,061 –01/11/2009 01/11/2011 Nil 60,000 – – – 60,000 –24/12/2009 24/12/2010 Nil 20,000 – – (20,000) – –30/06/2010 31/12/2012 Nil – 242,000 – – 242,000 –01/07/2010 31/12/2015 Nil – 2,858,291 – (77,100) 2,781,191 –01/01/2011 30/06/2013 Nil – 319,000 – – 319,000 –01/02/2011 01/02/2014 Nil – 10,000 – – 10,000 –01/06/2011 01/06/2013 Nil – 8,000 – – 8,000 –01/06/2011 01/06/2014 Nil – 87,500 – – 87,500 –
31,868,601 3,524,791 (5,793,966) (2,146,572) 27,452,854 –
The weighted average share price during the financial year ended 26 June 2011 was $27.26.
The fair value of the services received in return for share options and performance rights granted are measured by reference to the fair value of the share options granted. The fair value of the services is recognised as an expense on a straight-line basis over the vesting period and is determined by multiplying the fair value per option by the number of options expected to vest. During the financial year ended 24 June 2012, an expense of $39.8 million (2011: $18.2 million) was recognised in the income statement in relation to options and performance rights issued under the Long Term Incentive Plan.
The probability of achieving market performance conditions (TSR) is incorporated into the determination of the fair value per option. No adjustment is made to the expense for options that fail to meet the market condition. The number of options and rights expected to vest based on achievement of non market conditions (EPS and service condition), are adjusted over the vesting period in determining the expense to be recognised in the income statement.
The estimate of the fair value per option is measured based on the Monte Carlo simulation option pricing model performed by an independent valuer. The fair value is measured at the grant date which for the purposes of measurement is the date of unconditional offer by the Company and acceptance by the employee.
NOTES TO THE CONSOLIDATED FINANCIAL STATEMENTS
WoolWorths limited AnnuAl report 2012144
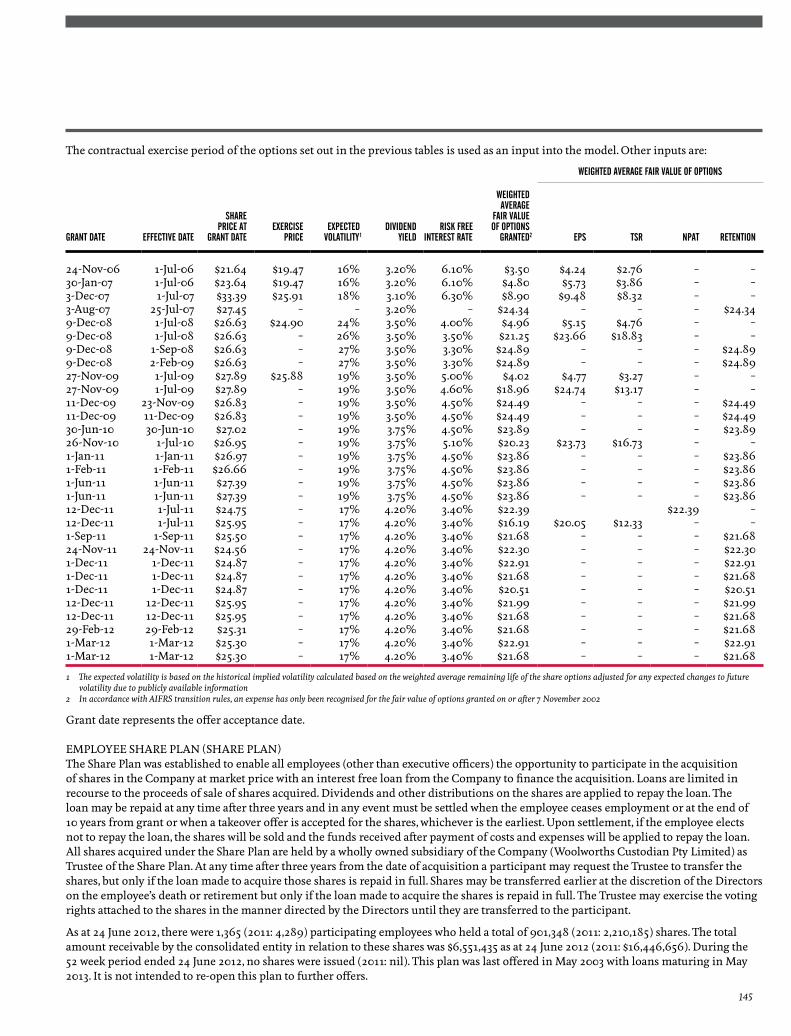
The contractual exercise period of the options set out in the previous tables is used as an input into the model. Other inputs are:
WEIGHTED AVERAGE FAIR VALuE OF OPTIONS
GRANT DATE EFFECTIVE DATE
SHAREPRICE AT
GRANT DATEExERCISE
PRICEExPECTED
VOLATILITy 1DIVIDEND
yIELDRISk FREE
INTEREST RATE
WEIGHTEDAVERAGE
FAIR VALuEOF OPTIONS
GRANTED2 EPS TSR NPAT RETENTION
24-Nov-06 1-Jul-06 $21.64 $19.47 16% 3.20% 6.10% $3.50 $4.24 $2.76 – –30-Jan-07 1-Jul-06 $23.64 $19.47 16% 3.20% 6.10% $4.80 $5.73 $3.86 – –3-Dec-07 1-Jul-07 $33.39 $25.91 18% 3.10% 6.30% $8.90 $9.48 $8.32 – –3-Aug-07 25-Jul-07 $27.45 – – 3.20% – $24.34 – – – $24.349-Dec-08 1-Jul-08 $26.63 $24.90 24% 3.50% 4.00% $4.96 $5.15 $4.76 – –9-Dec-08 1-Jul-08 $26.63 – 26% 3.50% 3.50% $21.25 $23.66 $18.83 – –9-Dec-08 1-Sep-08 $26.63 – 27% 3.50% 3.30% $24.89 – – – $24.899-Dec-08 2-Feb-09 $26.63 – 27% 3.50% 3.30% $24.89 – – – $24.8927-Nov-09 1-Jul-09 $27.89 $25.88 19% 3.50% 5.00% $4.02 $4.77 $3.27 – –27-Nov-09 1-Jul-09 $27.89 – 19% 3.50% 4.60% $18.96 $24.74 $13.17 – –11-Dec-09 23-Nov-09 $26.83 – 19% 3.50% 4.50% $24.49 – – – $24.4911-Dec-09 11-Dec-09 $26.83 – 19% 3.50% 4.50% $24.49 – – – $24.4930-Jun-10 30-Jun-10 $27.02 – 19% 3.75% 4.50% $23.89 – – – $23.8926-Nov-10 1-Jul-10 $26.95 – 19% 3.75% 5.10% $20.23 $23.73 $16.73 – – 1-Jan-11 1-Jan-11 $26.97 – 19% 3.75% 4.50% $23.86 – – – $23.861-Feb-11 1-Feb-11 $26.66 – 19% 3.75% 4.50% $23.86 – – – $23.861-Jun-11 1-Jun-11 $27.39 – 19% 3.75% 4.50% $23.86 – – – $23.861-Jun-11 1-Jun-11 $27.39 – 19% 3.75% 4.50% $23.86 – – – $23.8612-Dec-11 1-Jul-11 $24.75 – 17% 4.20% 3.40% $22.39 $22.39 – 12-Dec-11 1-Jul-11 $25.95 – 17% 4.20% 3.40% $16.19 $20.05 $12.33 – – 1-Sep-11 1-Sep-11 $25.50 – 17% 4.20% 3.40% $21.68 – – – $21.6824-Nov-11 24-Nov-11 $24.56 – 17% 4.20% 3.40% $22.30 – – – $22.301-Dec-11 1-Dec-11 $24.87 – 17% 4.20% 3.40% $22.91 – – – $22.911-Dec-11 1-Dec-11 $24.87 – 17% 4.20% 3.40% $21.68 – – – $21.681-Dec-11 1-Dec-11 $24.87 – 17% 4.20% 3.40% $20.51 – – – $20.5112-Dec-11 12-Dec-11 $25.95 – 17% 4.20% 3.40% $21.99 – – – $21.9912-Dec-11 12-Dec-11 $25.95 – 17% 4.20% 3.40% $21.68 – – – $21.6829-Feb-12 29-Feb-12 $25.31 – 17% 4.20% 3.40% $21.68 – – – $21.681-Mar-12 1-Mar-12 $25.30 – 17% 4.20% 3.40% $22.91 – – – $22.911-Mar-12 1-Mar-12 $25.30 – 17% 4.20% 3.40% $21.68 – – – $21.68
1 The expected volatility is based on the historical implied volatility calculated based on the weighted average remaining life of the share options adjusted for any expected changes to future volatility due to publicly available information
2 In accordance with AIFRS transition rules, an expense has only been recognised for the fair value of options granted on or after 7 November 2002
Grant date represents the offer acceptance date.
EMPLOyEE SHARE PLAN (SHARE PLAN)The Share Plan was established to enable all employees (other than executive officers) the opportunity to participate in the acquisition of shares in the Company at market price with an interest free loan from the Company to finance the acquisition. Loans are limited in recourse to the proceeds of sale of shares acquired. Dividends and other distributions on the shares are applied to repay the loan. The loan may be repaid at any time after three years and in any event must be settled when the employee ceases employment or at the end of 10 years from grant or when a takeover offer is accepted for the shares, whichever is the earliest. Upon settlement, if the employee elects not to repay the loan, the shares will be sold and the funds received after payment of costs and expenses will be applied to repay the loan. All shares acquired under the Share Plan are held by a wholly owned subsidiary of the Company (Woolworths Custodian Pty Limited) as Trustee of the Share Plan. At any time after three years from the date of acquisition a participant may request the Trustee to transfer the shares, but only if the loan made to acquire those shares is repaid in full. Shares may be transferred earlier at the discretion of the Directors on the employee’s death or retirement but only if the loan made to acquire the shares is repaid in full. The Trustee may exercise the voting rights attached to the shares in the manner directed by the Directors until they are transferred to the participant.
As at 24 June 2012, there were 1,365 (2011: 4,289) participating employees who held a total of 901,348 (2011: 2,210,185) shares. The total amount receivable by the consolidated entity in relation to these shares was $6,551,435 as at 24 June 2012 (2011: $16,446,656). During the 52 week period ended 24 June 2012, no shares were issued (2011: nil). This plan was last offered in May 2003 with loans maturing in May 2013. It is not intended to re-open this plan to further offers.
145
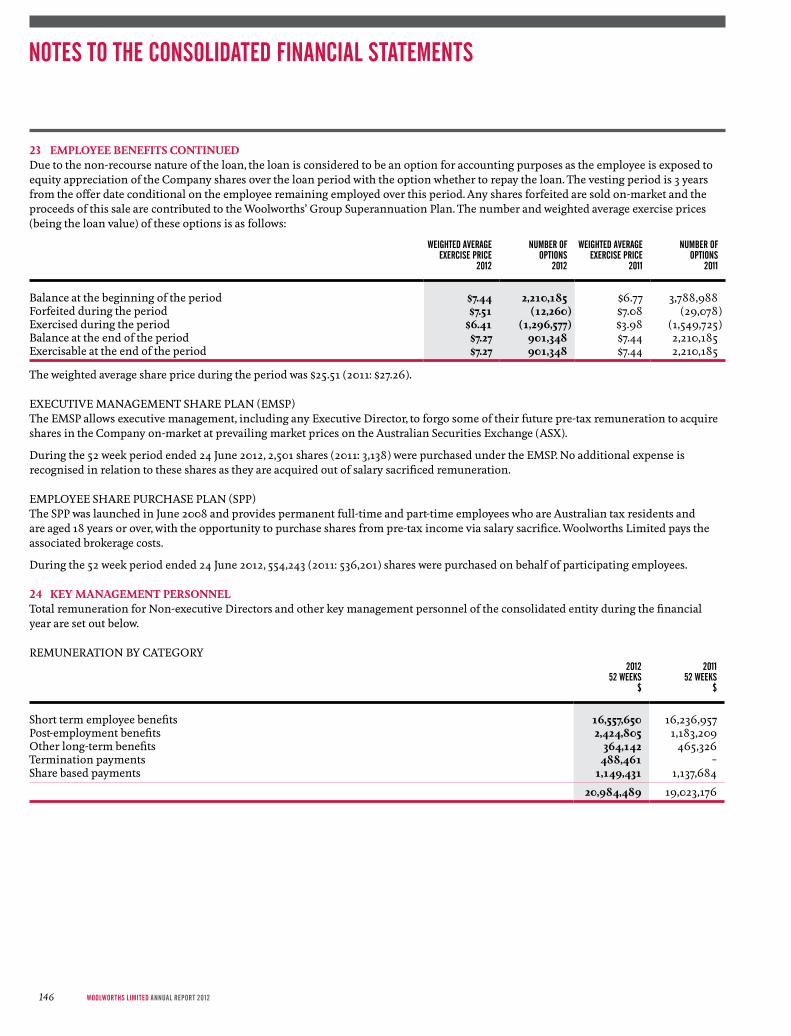
23 emPloYee BeneFIts ContInUedDue to the non-recourse nature of the loan, the loan is considered to be an option for accounting purposes as the employee is exposed to equity appreciation of the Company shares over the loan period with the option whether to repay the loan. The vesting period is 3 years from the offer date conditional on the employee remaining employed over this period. Any shares forfeited are sold on-market and the proceeds of this sale are contributed to the Woolworths’ Group Superannuation Plan. The number and weighted average exercise prices (being the loan value) of these options is as follows:
WEIGHTED AVERAGEExERCISE PRICE
2012
NuMBER OFOPTIONS
2012
WEIGHTED AVERAGEExERCISE PRICE
2011
NuMBER OFOPTIONS
2011
Balance at the beginning of the period $7.44 2,210,185 $6.77 3,788,988Forfeited during the period $7.51 (12,260) $7.08 (29,078)Exercised during the period $6.41 (1,296,577) $3.98 (1,549,725)Balance at the end of the period $7.27 901,348 $7.44 2,210,185Exercisable at the end of the period $7.27 901,348 $7.44 2,210,185
The weighted average share price during the period was $25.51 (2011: $27.26).
ExECUTIVE MANAGEMENT SHARE PLAN (EMSP)The EMSP allows executive management, including any Executive Director, to forgo some of their future pre-tax remuneration to acquire shares in the Company on-market at prevailing market prices on the Australian Securities Exchange (ASx).
During the 52 week period ended 24 June 2012, 2,501 shares (2011: 3,138) were purchased under the EMSP. No additional expense is recognised in relation to these shares as they are acquired out of salary sacrificed remuneration.
EMPLOyEE SHARE PURCHASE PLAN (SPP) The SPP was launched in June 2008 and provides permanent full-time and part-time employees who are Australian tax residents and are aged 18 years or over, with the opportunity to purchase shares from pre-tax income via salary sacrifice. Woolworths Limited pays the associated brokerage costs.
During the 52 week period ended 24 June 2012, 554,243 (2011: 536,201) shares were purchased on behalf of participating employees.
24 KeY manaGement PeRsonnelTotal remuneration for Non-executive Directors and other key management personnel of the consolidated entity during the financial year are set out below.
REMUNERATION By CATEGORy2012
52 WEEkS$
201152 WEEkS
$
Short term employee benefits 16,557,650 16,236,957Post-employment benefits 2,424,805 1,183,209Other long-term benefits 364,142 465,326Termination payments 488,461 –Share based payments 1,149,431 1,137,684
20,984,489 19,023,176
NOTES TO THE CONSOLIDATED FINANCIAL STATEMENTS
WoolWorths limited AnnuAl report 2012146
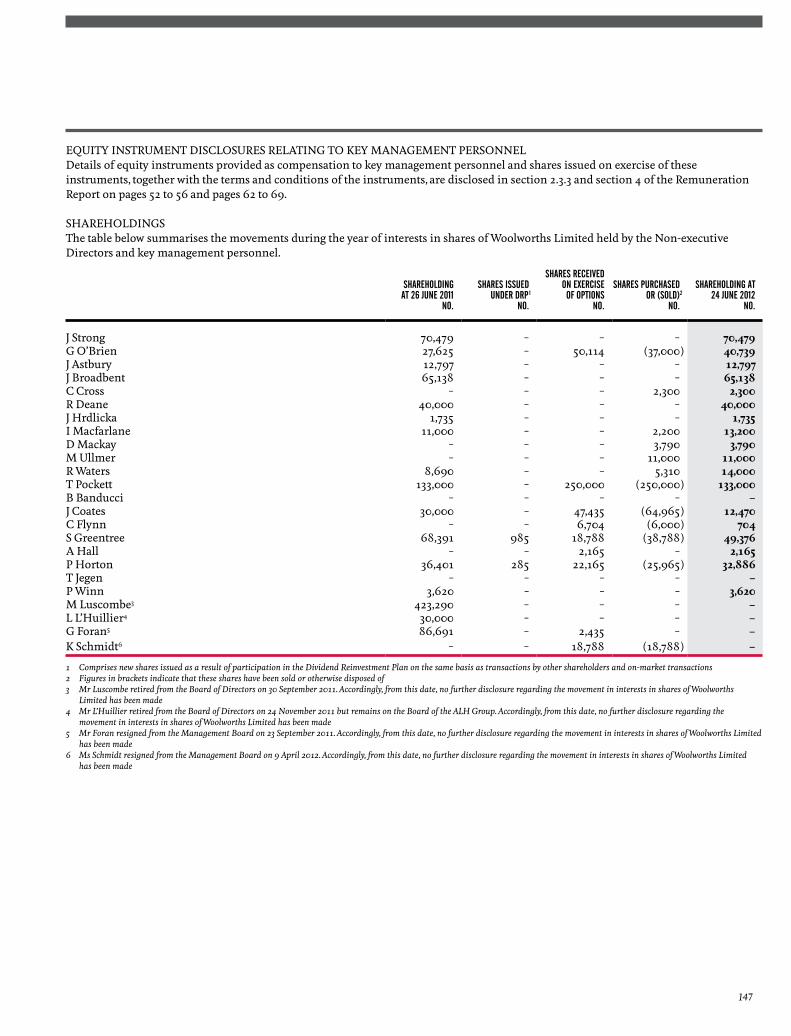
EQUITy INSTRUMENT DISCLOSURES RELATING TO KEy MANAGEMENT PERSONNELDetails of equity instruments provided as compensation to key management personnel and shares issued on exercise of these instruments, together with the terms and conditions of the instruments, are disclosed in section 2.3.3 and section 4 of the Remuneration Report on pages 52 to 56 and pages 62 to 69.
SHAREHOLDINGSThe table below summarises the movements during the year of interests in shares of Woolworths Limited held by the Non-executive Directors and key management personnel.
SHAREHOLDINGAT 26 juNE 2011
NO.
SHARES ISSuED uNDER DRP1
NO.
SHARES RECEIVEDON ExERCISEOF OPTIONS
NO.
SHARES PuRCHASED OR (SOLD)2
NO.
SHAREHOLDING AT24 juNE 2012
NO.
J Strong 70,479 – – – 70,479G O’Brien 27,625 – 50,114 (37,000) 40,739J Astbury 12,797 – – – 12,797J Broadbent 65,138 – – – 65,138C Cross – – – 2,300 2,300R Deane 40,000 – – – 40,000J Hrdlicka 1,735 – – – 1,735I Macfarlane 11,000 – – 2,200 13,200D Mackay – – – 3,790 3,790M Ullmer – – – 11,000 11,000R Waters 8,690 – – 5,310 14,000T Pockett 133,000 – 250,000 (250,000) 133,000B Banducci – – – – –J Coates 30,000 – 47,435 (64,965) 12,470C Flynn – – 6,704 (6,000) 704S Greentree 68,391 985 18,788 (38,788) 49,376A Hall – – 2,165 – 2,165P Horton 36,401 285 22,165 (25,965) 32,886T Jegen – – – – –P Winn 3,620 – – – 3,620M Luscombe3 423,290 – – – –L L’Huillier4 30,000 – – – –G Foran5 86,691 – 2,435 – –K Schmidt6 – – 18,788 (18,788) –
1 Comprises new shares issued as a result of participation in the Dividend Reinvestment Plan on the same basis as transactions by other shareholders and on‑market transactions2 Figures in brackets indicate that these shares have been sold or otherwise disposed of3 Mr Luscombe retired from the Board of Directors on 30 September 2011. Accordingly, from this date, no further disclosure regarding the movement in interests in shares of Woolworths
Limited has been made4 Mr L’Huillier retired from the Board of Directors on 24 November 2011 but remains on the Board of the ALH Group. Accordingly, from this date, no further disclosure regarding the
movement in interests in shares of Woolworths Limited has been made5 Mr Foran resigned from the Management Board on 23 September 2011. Accordingly, from this date, no further disclosure regarding the movement in interests in shares of Woolworths Limited
has been made6 Ms Schmidt resigned from the Management Board on 9 April 2012. Accordingly, from this date, no further disclosure regarding the movement in interests in shares of Woolworths Limited
has been made
147

24 KeY manaGement PeRsonnel ContInUed
SHAREHOLDING AT27 juNE 2010
NO.
SHARES ISSuED uNDER DRP1
NO.
SHARES RECEIVEDON ExERCISEOF OPTIONS
NO.
SHARES PuRCHASED OR (SOLD)2
NO.
SHAREHOLDING AT26 juNE 2011
NO.
J Strong 70,479 – – – 70,479M Luscombe 523,290 – 330,000 (430,000) 423,290G O’Brien 20,000 – 20,000 (12,375) 27,625J Astbury 12,797 – – – 12,797J Broadbent 64,713 425 – – 65,138R Deane 40,000 – – – 40,000D Grady3 36,259 – – – –J Hrdlicka – – – 1,735 1,735L L’Huillier 30,000 – – – 30,000I Macfarlane 8,000 – – 3,000 11,000R Waters – – – 8,690 8,690A Watkins4 11,859 – – – –T Pockett 133,000 – 80,000 (80,000) 133,000J Coates 20,000 – 50,000 (40,000) 30,000G Foran 71,143 848 50,000 (35,300) 86,691A Hall – – – – –P Horton 1,264 137 50,000 (15,000) 36,401K Schmidt – – 13,000 (13,000) –
1 Comprises new shares issued as a result of participation in the Dividend Reinvestment Plan on the same basis as transactions by other shareholders and on‑market transactions2 Figures in brackets indicate that these shares have been sold or otherwise disposed of3 Ms Grady retired from the Board of Directors on 18 November 2010. Accordingly, no further disclosure has been made4 Ms Watkins retired from the Board of Directors on 31 July 2010. Accordingly, no further disclosure has been made
NOTES TO THE CONSOLIDATED FINANCIAL STATEMENTS
WoolWorths limited AnnuAl report 2012148
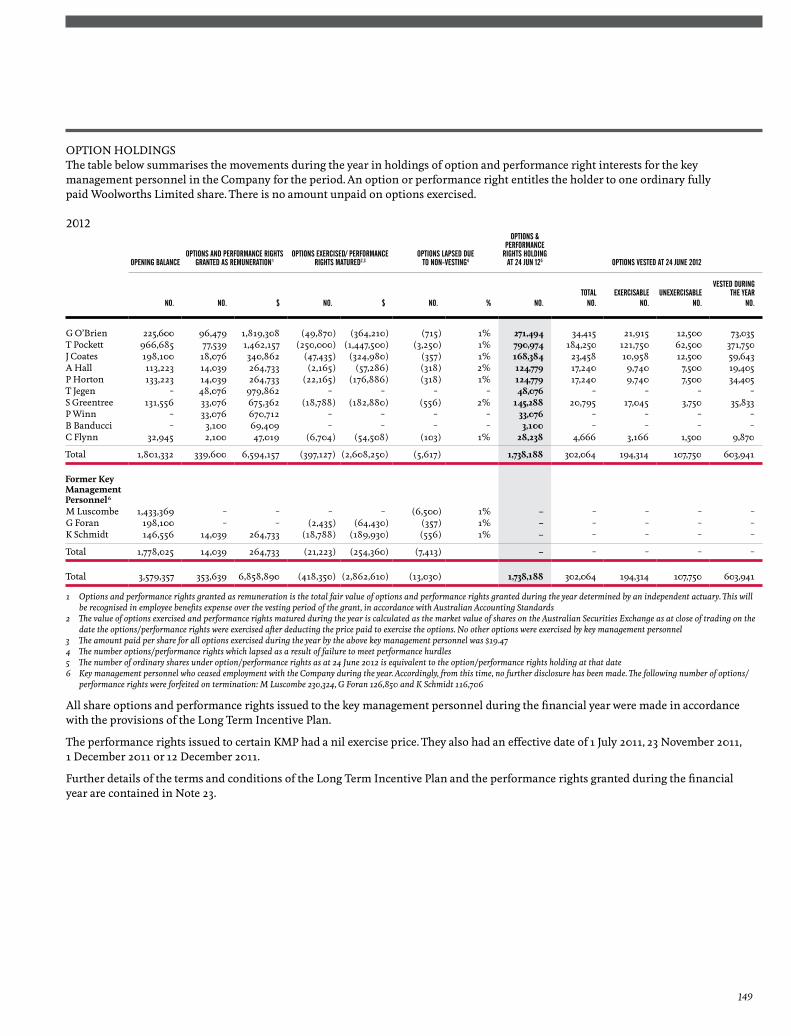
OPTION HOLDINGSThe table below summarises the movements during the year in holdings of option and performance right interests for the key management personnel in the Company for the period. An option or performance right entitles the holder to one ordinary fully paid Woolworths Limited share. There is no amount unpaid on options exercised.
2012
OPENING BALANCEOPTIONS AND PERFORMANCE RIGHTS
GRANTED AS REMuNERATION1OPTIONS ExERCISED/ PERFORMANCE
RIGHTS MATuRED2,3OPTIONS LAPSED DuE
TO NON-VESTING4
OPTIONS &PERFORMANCE
RIGHTS HOLDINGAT 24 juN 125 OPTIONS VESTED AT 24 juNE 2012
TOTAL ExERCISABLE uNExERCISABLEVESTED DuRING
THE yEARNO. NO. $ NO. $ NO. % NO. NO. NO. NO. NO.
G O’Brien 225,600 96,479 1,819,308 (49,870) (364,210) (715) 1% 271,494 34,415 21,915 12,500 73,035T Pockett 966,685 77,539 1,462,157 (250,000) (1,447,500) (3,250) 1% 790,974 184,250 121,750 62,500 371,750J Coates 198,100 18,076 340,862 (47,435) (324,980) (357) 1% 168,384 23,458 10,958 12,500 59,643A Hall 113,223 14,039 264,733 (2,165) (57,286) (318) 2% 124,779 17,240 9,740 7,500 19,405P Horton 133,223 14,039 264,733 (22,165) (176,886) (318) 1% 124,779 17,240 9,740 7,500 34,405T Jegen – 48,076 979,862 – – – – 48,076 – – – –S Greentree 131,556 33,076 675,362 (18,788) (182,880) (556) 2% 145,288 20,795 17,045 3,750 35,833P Winn – 33,076 670,712 – – – – 33,076 – – – –B Banducci – 3,100 69,409 – – – – 3,100 – – – –C Flynn 32,945 2,100 47,019 (6,704) (54,508) (103) 1% 28,238 4,666 3,166 1,500 9,870
Total 1,801,332 339,600 6,594,157 (397,127) (2,608,250) (5,617) 1,738,188 302,064 194,314 107,750 603,941
Former Key management Personnel6
M Luscombe 1,433,369 – – – – (6,500) 1% – – – – –G Foran 198,100 – – (2,435) (64,430) (357) 1% – – – – –K Schmidt 146,556 14,039 264,733 (18,788) (189,930) (556) 1% – – – – –
Total 1,778,025 14,039 264,733 (21,223) (254,360) (7,413) – – – – –
Total 3,579,357 353,639 6,858,890 (418,350) (2,862,610) (13,030) 1,738,188 302,064 194,314 107,750 603,941
1 Options and performance rights granted as remuneration is the total fair value of options and performance rights granted during the year determined by an independent actuary. This will be recognised in employee benefits expense over the vesting period of the grant, in accordance with Australian Accounting Standards
2 The value of options exercised and performance rights matured during the year is calculated as the market value of shares on the Australian Securities Exchange as at close of trading on the date the options/performance rights were exercised after deducting the price paid to exercise the options. No other options were exercised by key management personnel
3 The amount paid per share for all options exercised during the year by the above key management personnel was $19.474 The number options/performance rights which lapsed as a result of failure to meet performance hurdles5 The number of ordinary shares under option/performance rights as at 24 June 2012 is equivalent to the option/performance rights holding at that date6 Key management personnel who ceased employment with the Company during the year. Accordingly, from this time, no further disclosure has been made. The following number of options/
performance rights were forfeited on termination: M Luscombe 230,324, G Foran 126,850 and K Schmidt 116,706
All share options and performance rights issued to the key management personnel during the financial year were made in accordance with the provisions of the Long Term Incentive Plan.
The performance rights issued to certain KMP had a nil exercise price. They also had an effective date of 1 July 2011, 23 November 2011, 1 December 2011 or 12 December 2011.
Further details of the terms and conditions of the Long Term Incentive Plan and the performance rights granted during the financial year are contained in Note 23.
149
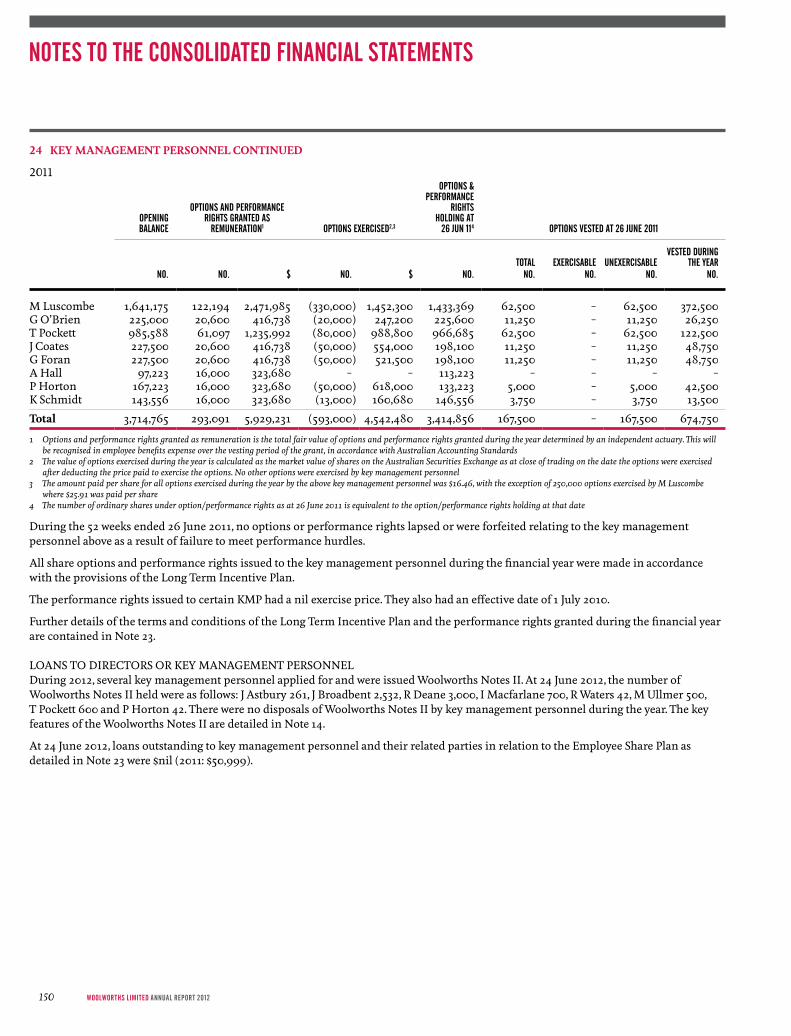
24 KeY manaGement PeRsonnel ContInUed
2011
OPENING BALANCE
OPTIONS AND PERFORMANCE RIGHTS GRANTED AS
REMuNERATION1 OPTIONS ExERCISED2,3
OPTIONS &PERFORMANCE
RIGHTSHOLDING AT
26 juN 114 OPTIONS VESTED AT 26 juNE 2011
TOTAL ExERCISABLE uNExERCISABLEVESTED DuRING
THE yEARNO. NO. $ NO. $ NO. NO. NO. NO. NO.
M Luscombe 1,641,175 122,194 2,471,985 (330,000) 1,452,300 1,433,369 62,500 – 62,500 372,500G O’Brien 225,000 20,600 416,738 (20,000) 247,200 225,600 11,250 – 11,250 26,250T Pockett 985,588 61,097 1,235,992 (80,000) 988,800 966,685 62,500 – 62,500 122,500J Coates 227,500 20,600 416,738 (50,000) 554,000 198,100 11,250 – 11,250 48,750G Foran 227,500 20,600 416,738 (50,000) 521,500 198,100 11,250 – 11,250 48,750A Hall 97,223 16,000 323,680 – – 113,223 – – – –P Horton 167,223 16,000 323,680 (50,000) 618,000 133,223 5,000 – 5,000 42,500K Schmidt 143,556 16,000 323,680 (13,000) 160,680 146,556 3,750 – 3,750 13,500
total 3,714,765 293,091 5,929,231 (593,000) 4,542,480 3,414,856 167,500 – 167,500 674,750
1 Options and performance rights granted as remuneration is the total fair value of options and performance rights granted during the year determined by an independent actuary. This will be recognised in employee benefits expense over the vesting period of the grant, in accordance with Australian Accounting Standards
2 The value of options exercised during the year is calculated as the market value of shares on the Australian Securities Exchange as at close of trading on the date the options were exercised after deducting the price paid to exercise the options. No other options were exercised by key management personnel
3 The amount paid per share for all options exercised during the year by the above key management personnel was $16.46, with the exception of 250,000 options exercised by M Luscombe where $25.91 was paid per share
4 The number of ordinary shares under option/performance rights as at 26 June 2011 is equivalent to the option/performance rights holding at that date
During the 52 weeks ended 26 June 2011, no options or performance rights lapsed or were forfeited relating to the key management personnel above as a result of failure to meet performance hurdles.
All share options and performance rights issued to the key management personnel during the financial year were made in accordance with the provisions of the Long Term Incentive Plan.
The performance rights issued to certain KMP had a nil exercise price. They also had an effective date of 1 July 2010.
Further details of the terms and conditions of the Long Term Incentive Plan and the performance rights granted during the financial year are contained in Note 23.
LOANS TO DIRECTORS OR KEy MANAGEMENT PERSONNELDuring 2012, several key management personnel applied for and were issued Woolworths Notes II. At 24 June 2012, the number of Woolworths Notes II held were as follows: J Astbury 261, J Broadbent 2,532, R Deane 3,000, I Macfarlane 700, R Waters 42, M Ullmer 500, T Pockett 600 and P Horton 42. There were no disposals of Woolworths Notes II by key management personnel during the year. The key features of the Woolworths Notes II are detailed in Note 14.
At 24 June 2012, loans outstanding to key management personnel and their related parties in relation to the Employee Share Plan as detailed in Note 23 were $nil (2011: $50,999).
NOTES TO THE CONSOLIDATED FINANCIAL STATEMENTS
WoolWorths limited AnnuAl report 2012150
25 Related PaRtIes
PARENT ENTITyThe ultimate parent entity is Woolworths Limited, a company incorporated in New South Wales. Disclosures relating to interests in subsidiaries are set out in Note 28.
TRANSACTIONS WITHIN THE GROUPDuring the financial period and previous financial periods, Woolworths Limited advanced and repaid loans to and received loans from, and provided treasury, accounting, legal, taxation and administrative services to other entities within the Group.
Entities within the Group also exchanged goods and services in sale and purchase transactions. All transactions occurred on the basis of normal commercial terms and conditions.
Balances and transactions between the Company and its subsidiaries, which are related parties of the Company, have been eliminated on consolidation and are not disclosed in this note.
TAx CONSOLIDATIONUnder the application of the tax consolidation regime, the Company is assessed on the tax liabilities of the entities in the tax consolidated group. As a consequence of this, the tax exposures relating to wholly owned group members totalling $137.7 million (2011: $112.4 million) are included in the tax liability of the Company. Pursuant to the Group’s Tax Funding Agreement, the Company has charged net tax expense to the group members totalling $137.7 million (2011: $112.4 million) through intercompany accounts.
DIRECTORS AND KEy MANAGEMENT PERSONNELDisclosures relating to Directors and key management personnel are set out in Note 24 and in the Remuneration Report.
151
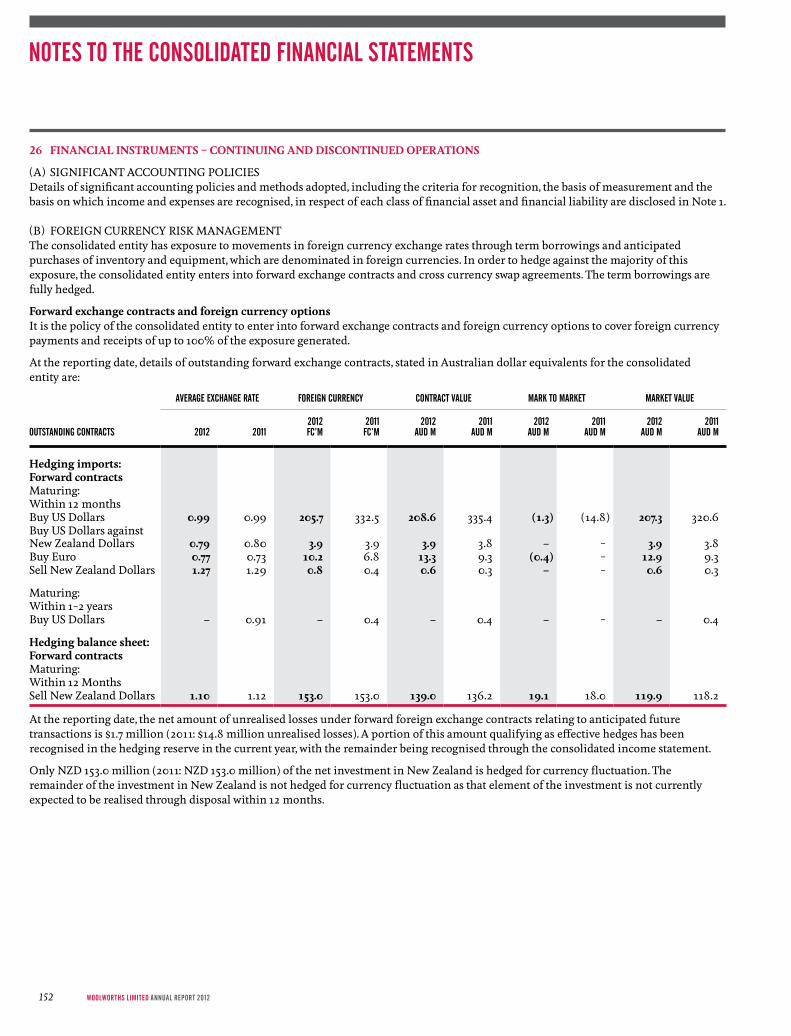
26 FInanCIal InstRUments – ContInUInG and dIsContInUed oPeRatIons
(A) SIGNIFICANT ACCOUNTING POLICIESDetails of significant accounting policies and methods adopted, including the criteria for recognition, the basis of measurement and the basis on which income and expenses are recognised, in respect of each class of financial asset and financial liability are disclosed in Note 1.
(B) FOREIGN CURRENCy RISK MANAGEMENTThe consolidated entity has exposure to movements in foreign currency exchange rates through term borrowings and anticipated purchases of inventory and equipment, which are denominated in foreign currencies. In order to hedge against the majority of this exposure, the consolidated entity enters into forward exchange contracts and cross currency swap agreements. The term borrowings are fully hedged.
Forward exchange contracts and foreign currency optionsIt is the policy of the consolidated entity to enter into forward exchange contracts and foreign currency options to cover foreign currency payments and receipts of up to 100% of the exposure generated.
At the reporting date, details of outstanding forward exchange contracts, stated in Australian dollar equivalents for the consolidated entity are:
AVERAGE ExCHANGE RATE FOREIGN CuRRENCy CONTRACT VALuE MARk TO MARkET MARkET VALuE
OuTSTANDING CONTRACTS 2012 20112012FC’M
2011FC’M
2012AuD M
2011AuD M
2012AuD M
2011AuD M
2012AuD M
2011AuD M
hedging imports:Forward contractsMaturing:Within 12 monthsBuy US Dollars 0.99 0.99 205.7 332.5 208.6 335.4 (1.3) (14.8) 207.3 320.6 Buy US Dollars against New Zealand Dollars 0.79 0.80 3.9 3.9 3.9 3.8 – – 3.9 3.8 Buy Euro 0.77 0.73 10.2 6.8 13.3 9.3 (0.4) – 12.9 9.3 Sell New Zealand Dollars 1.27 1.29 0.8 0.4 0.6 0.3 – – 0.6 0.3
Maturing:Within 1–2 yearsBuy US Dollars – 0.91 – 0.4 – 0.4 – – – 0.4
hedging balance sheet:Forward contractsMaturing:Within 12 MonthsSell New Zealand Dollars 1.10 1.12 153.0 153.0 139.0 136.2 19.1 18.0 119.9 118.2
At the reporting date, the net amount of unrealised losses under forward foreign exchange contracts relating to anticipated future transactions is $1.7 million (2011: $14.8 million unrealised losses). A portion of this amount qualifying as effective hedges has been recognised in the hedging reserve in the current year, with the remainder being recognised through the consolidated income statement.
Only NZD 153.0 million (2011: NZD 153.0 million) of the net investment in New Zealand is hedged for currency fluctuation. The remainder of the investment in New Zealand is not hedged for currency fluctuation as that element of the investment is not currently expected to be realised through disposal within 12 months.
NOTES TO THE CONSOLIDATED FINANCIAL STATEMENTS
WoolWorths limited AnnuAl report 2012152

CROSS CURRENCy SWAP AGREEMENTSTo hedge the risk of adverse movements in foreign exchange rates in relation to borrowings denominated in foreign currency by the consolidated entity, it enters into cross currency swap agreements under which it agrees to exchange specified principal and interest foreign currency amounts at an agreed future date at a specified exchange rate.
The following table details the cross currency swaps outstanding for the consolidated group at the reporting date:
AVERAGE INTEREST RATE AVERAGE ExCHANGE RATE CONTRACT VALuE FAIR VALuE
OuTSTANDING CONTRACTS24-juN-12
%26-juN-11
% 24-juN-12 26-juN-1124-juN-12
$M26-juN-11
$M24-juN-12
$M26-juN-11
$M
maturing:Floating RatesUSDWithin 12 Months1,2,3 – BBSW +145.0bp – 0.751 – 750.9 – (216.7)1 to 2 years1,2,3 – – – – – – – –2 to 3 years1,2,3 BBsW +54.3bp – 0.787 – 127.1 – (15.9) –3 to 4 years1,2,3 BBsW +110.9bp BBSW +54.3bp 0.874 0.787 1,401.1 127.1 (92.5) (21.6)4 to 5 years1,2,3 BBsW +54.6bp BBSW +110.9bp 0.787 0.874 381.2 1,401.1 (27.8) (192.1)5 years +1,2,3 BBsW +176.8bp BBSW +151.4bp 0.963 0.927 1,453.4 1,834.6 95.6 (218.4)
3,362.8 4,113.7 (40.6) (648.8)JPyWithin 12 Months1,2,3 – BBSW +306bp – 74.4 – 26.8 – (3.7)
– 26.8 – (3.7)
3,362.8 4,140.5 (40.6) (652.5)
1 These swap instruments include an interest rate swap component which has been disclosed in the interest rate swap contract section below and have therefore been designated as cash flow hedges due to the currency exposure being hedged in combination with the interest rate exposure via domestic interest rate swaps
2 These swap contracts have cash flow hedge designation3 These fair value calculations include interest accruals as recorded in trade and other payables of $17.9 million (2011: $27.0 million) payable
153
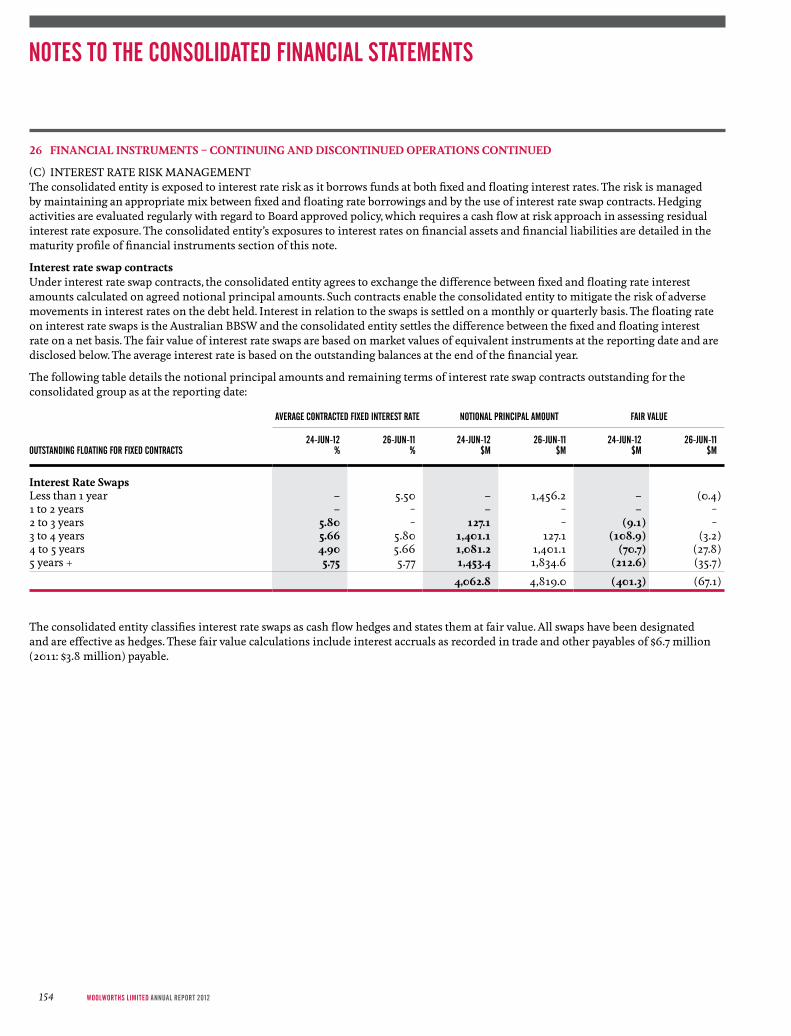
26 FInanCIal InstRUments – ContInUInG and dIsContInUed oPeRatIons ContInUed
(C) INTEREST RATE RISK MANAGEMENTThe consolidated entity is exposed to interest rate risk as it borrows funds at both fixed and floating interest rates. The risk is managed by maintaining an appropriate mix between fixed and floating rate borrowings and by the use of interest rate swap contracts. Hedging activities are evaluated regularly with regard to Board approved policy, which requires a cash flow at risk approach in assessing residual interest rate exposure. The consolidated entity’s exposures to interest rates on financial assets and financial liabilities are detailed in the maturity profile of financial instruments section of this note.
Interest rate swap contractsUnder interest rate swap contracts, the consolidated entity agrees to exchange the difference between fixed and floating rate interest amounts calculated on agreed notional principal amounts. Such contracts enable the consolidated entity to mitigate the risk of adverse movements in interest rates on the debt held. Interest in relation to the swaps is settled on a monthly or quarterly basis. The floating rate on interest rate swaps is the Australian BBSW and the consolidated entity settles the difference between the fixed and floating interest rate on a net basis. The fair value of interest rate swaps are based on market values of equivalent instruments at the reporting date and are disclosed below. The average interest rate is based on the outstanding balances at the end of the financial year.
The following table details the notional principal amounts and remaining terms of interest rate swap contracts outstanding for the consolidated group as at the reporting date:
AVERAGE CONTRACTED FIxED INTEREST RATE NOTIONAL PRINCIPAL AMOuNT FAIR VALuE
OuTSTANDING FLOATING FOR FIxED CONTRACTS24-juN-12
%26-juN-11
%24-juN-12
$M26-juN-11
$M24-juN-12
$M26-juN-11
$M
Interest Rate swapsLess than 1 year – 5.50 – 1,456.2 – (0.4)1 to 2 years – – – – – –2 to 3 years 5.80 – 127.1 – (9.1) –3 to 4 years 5.66 5.80 1,401.1 127.1 (108.9) (3.2)4 to 5 years 4.90 5.66 1,081.2 1,401.1 (70.7) (27.8)5 years + 5.75 5.77 1,453.4 1,834.6 (212.6) (35.7)
4,062.8 4,819.0 (401.3) (67.1)
The consolidated entity classifies interest rate swaps as cash flow hedges and states them at fair value. All swaps have been designated and are effective as hedges. These fair value calculations include interest accruals as recorded in trade and other payables of $6.7 million (2011: $3.8 million) payable.
NOTES TO THE CONSOLIDATED FINANCIAL STATEMENTS
WoolWorths limited AnnuAl report 2012154
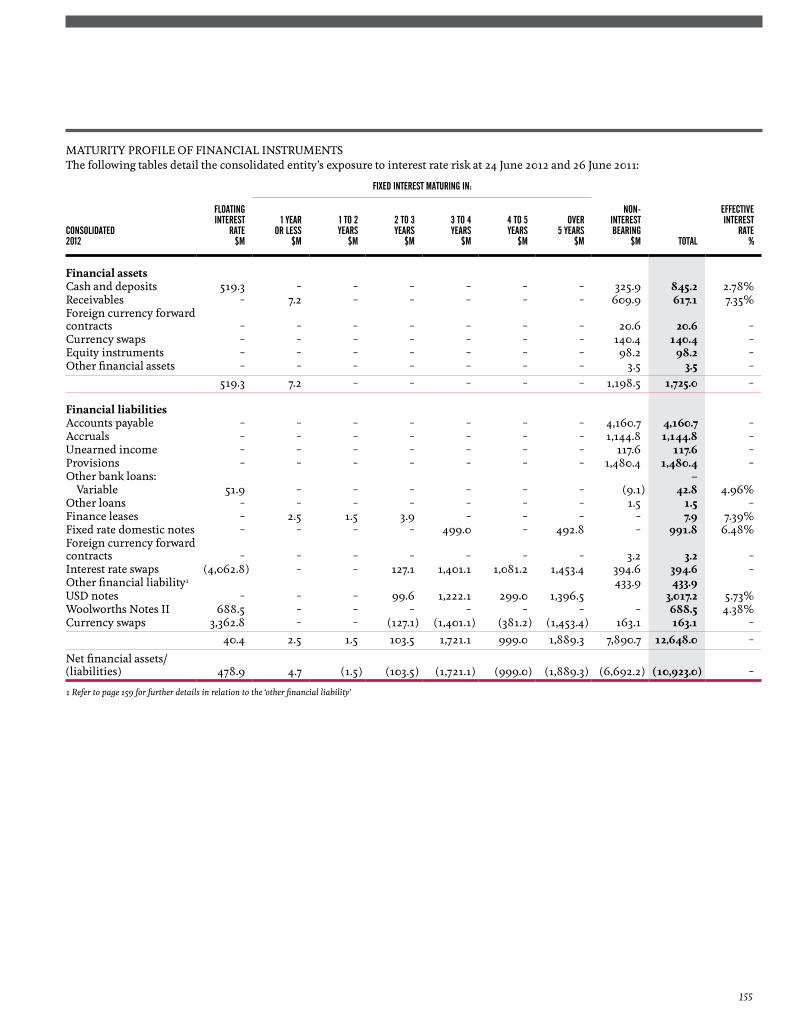
MATURITy PROFILE OF FINANCIAL INSTRUMENTSThe following tables detail the consolidated entity’s exposure to interest rate risk at 24 June 2012 and 26 June 2011:
FIxED INTEREST MATuRING IN:
CONSOLIDATED 2012
FLOATING INTEREST
RATE$M
1 yEAROR LESS
$M
1 TO 2yEARS
$M
2 TO 3yEARS
$M
3 TO 4yEARS
$M
4 TO 5yEARS
$M
OVER5 yEARS
$M
NON-INTERESTBEARING
$M TOTAL
EFFECTIVEINTEREST
RATE%
Financial assetsCash and deposits 519.3 – – – – – – 325.9 845.2 2.78%Receivables – 7.2 – – – – – 609.9 617.1 7.35%Foreign currency forward contracts – – – – – – – 20.6 20.6 –Currency swaps – – – – – – – 140.4 140.4 –Equity instruments – – – – – – – 98.2 98.2 –Other financial assets – – – – – – – 3.5 3.5 –
519.3 7.2 – – – – – 1,198.5 1,725.0 –
Financial liabilitiesAccounts payable – – – – – – – 4,160.7 4,160.7 –Accruals – – – – – – – 1,144.8 1,144.8 –Unearned income – – – – – – – 117.6 117.6 –Provisions – – – – – – – 1,480.4 1,480.4 –Other bank loans: – Variable 51.9 – – – – – – (9.1) 42.8 4.96%Other loans – – – – – – – 1.5 1.5 –Finance leases – 2.5 1.5 3.9 – – – – 7.9 7.39%Fixed rate domestic notes – – – – 499.0 – 492.8 – 991.8 6.48%Foreign currency forward contracts – – – – – – – 3.2 3.2 –Interest rate swaps (4,062.8) – – 127.1 1,401.1 1,081.2 1,453.4 394.6 394.6 –Other financial liability1 433.9 433.9 USD notes – – – 99.6 1,222.1 299.0 1,396.5 3,017.2 5.73%Woolworths Notes II 688.5 – – – – – – – 688.5 4.38%Currency swaps 3,362.8 – – (127.1) (1,401.1) (381.2) (1,453.4) 163.1 163.1 –
40.4 2.5 1.5 103.5 1,721.1 999.0 1,889.3 7,890.7 12,648.0 –
Net financial assets/(liabilities) 478.9 4.7 (1.5) (103.5) (1,721.1) (999.0) (1,889.3) (6,692.2) (10,923.0) –
1 Refer to page 159 for further details in relation to the ‘other financial liability’
155

26 FInanCIal InstRUments – ContInUInG and dIsContInUed oPeRatIons ContInUed
FIxED INTEREST MATuRING IN:
CONSOLIDATED 2011
FLOATING INTEREST
RATE$M
1 yEAROR LESS
$M
1 TO 2yEARS
$M
2 TO 3yEARS
$M
3 TO 4yEARS
$M
4 TO 5yEARS
$M
OVER5 yEARS
$M
NON-INTERESTBEARING
$M TOTAL
EFFECTIVEINTEREST
RATE%
Financial assetsCash and deposits 1,207.7 – – – – – – 311.9 1,519.6 4.48 Receivables – 29.2 7.6 – – – – 593.9 630.7 7.59 Foreign currency forward contracts – – – – – – – 18.6 18.6 –Interest rate swaps – – – – – – – 5.7 5.7 –Currency swaps – – – – – – – 99.5 99.5 –Equity instruments 113.5 113.5Other financial assets – – – – – – – 2.8 2.8 –
1,207.7 29.2 7.6 – – – – 1,145.9 2,390.4 –
Financial liabilitiesAccounts payable – – – – – – – 4,132.0 4,132.0 –Accruals – – – – – – – 1,022.6 1,022.6 –Unearned income – – – – – – – 92.1 92.1 –Provisions – – – – – – – 1,326.2 1,326.2 –Short term securities – – – – – – – – – –Other bank loans: Fixed – – – – – – – – – – Variable 583.4 – – – – – – – 583.4 4.26 Other loans – 0.4 – – – – – 1.5 1.9 6.85 Finance leases – 2.4 1.8 0.8 0.2 – – – 5.2 4.94 Variable rate domestic notes – – – – – – – – – –Fixed rate domestic notes – – – – – 498.7 – – 498.7 6.75 Foreign currency forward contracts – – – – – – – 15.4 15.4 –Interest rate swaps (4,819.0) 1,456.2 – – 127.1 1,401.1 1,834.6 69.0 69.0 –Other financial liability1 – – – – – – – 344.8 344.8 –USD notes – 284.9 – – 94.8 1,162.8 1,613.2 – 3,155.7 5.74 Woolworths Notes 600.0 – – – – – – – 600.0 6.44 Currency swaps 3,773.2 (410.4) – – (127.1) (1,401.1) (1,834.6) 725.0 725.0 –
137.6 1,333.5 1.8 0.8 95.0 1,661.5 1,613.2 7,728.6 12,572.0 –
net financial assets/(liabilities) 1,070.1 (1,304.3) 5.8 (0.8) (95.0) (1,661.5) (1,613.2) (6,582.7) (10,181.6) –
1 Refer to page 159 for further details in relation to the ‘other financial liability’
NOTES TO THE CONSOLIDATED FINANCIAL STATEMENTS
WoolWorths limited AnnuAl report 2012156

FAIR VALUE OF FINANCIAL ASSETS AND FINANCIAL LIABILITIESThe carrying value of cash and cash equivalents, financial assets and non-interest bearing monetary financial liabilities of the consolidated entity approximates their fair value and as such they have been omitted from these disclosures.
The fair value of other monetary financial assets and liabilities is based upon market prices where a market exists or the expected future cash flows, discounted where appropriate by current interest rates for assets and liabilities with similar risk profiles.
For interest rate and cross currency swaps, the fair value has been determined by the net present value of cash flows due under the contracts, using a discount rate appropriate to the type and maturity of the contract.
For forward foreign currency contracts, the fair value is taken to be the unrealised gain or loss at period end calculated by reference to the current forward rates for contracts with similar maturity profiles.
AS AT24-juN-12
AS AT26-juN-11
CARRyINGAMOuNT
$M
FAIRVALuE
$M
CARRyINGAMOuNT
$M
FAIRVALuE
$M
Financial assets/(liabilities):Bank loans1 (52.2) (43.1) (590.2) (586.4)Short term securities – – (888.8) (888.8)Other loans1,2,3 (4,762.0) (4,745.4) (3,411.1) (3,407.1)
total (4,814.2) (4,788.5) (4,890.1) (4,882.3)
Financial assets/(liabilities):Forward foreign currency contracts 17.4 17.4 3.2 3.2Interest rate swaps (401.3) (401.3) (67.1) (67.1)Cross currency swaps (40.6) (40.6) (652.5) (652.5)
total (424.5) (424.5) (716.4) (716.4)
For financial period ended 24 June 2012, the carrying amount of financial assets/liabilities is based on the principal outstanding adjusted for:1 Interest accruals on outstanding debt (total of $38.8 million)2 Unamortised borrowing costs (total of $25.7 million)3 Effect of revaluation of USD borrowings (total of $343.2 million)
157
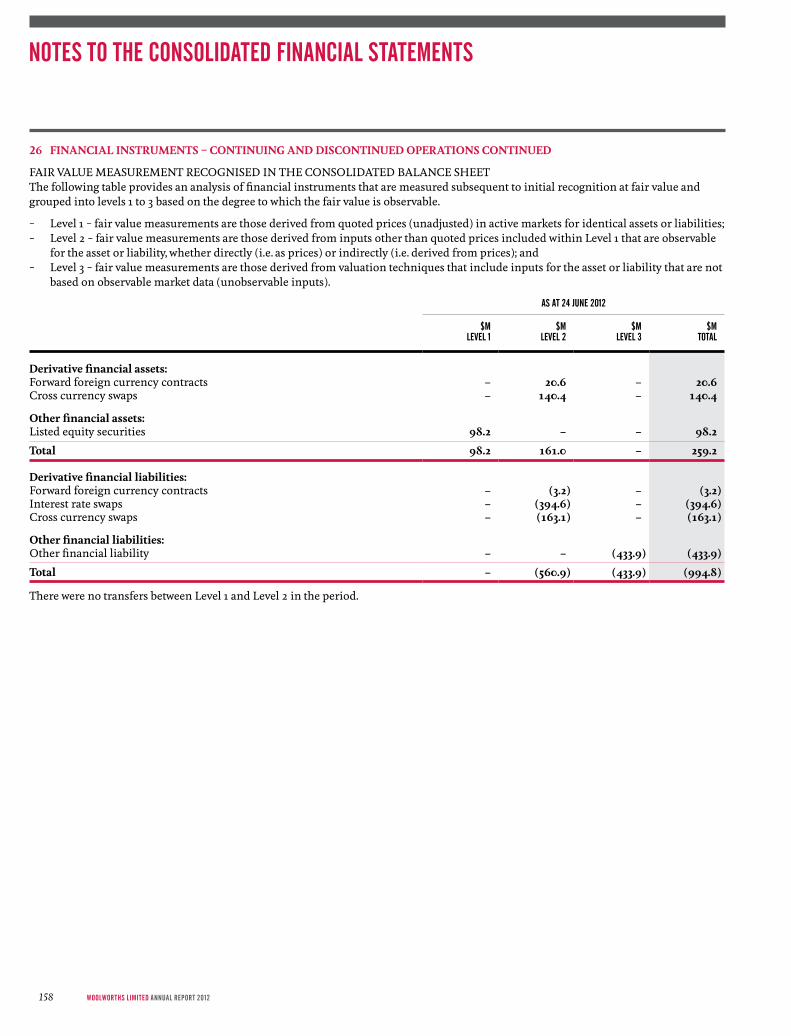
26 FInanCIal InstRUments – ContInUInG and dIsContInUed oPeRatIons ContInUed
FAIR VALUE MEASUREMENT RECOGNISED IN THE CONSOLIDATED BALANCE SHEETThe following table provides an analysis of financial instruments that are measured subsequent to initial recognition at fair value and grouped into levels 1 to 3 based on the degree to which the fair value is observable.
– Level 1 – fair value measurements are those derived from quoted prices (unadjusted) in active markets for identical assets or liabilities; – Level 2 – fair value measurements are those derived from inputs other than quoted prices included within Level 1 that are observable
for the asset or liability, whether directly (i.e. as prices) or indirectly (i.e. derived from prices); and – Level 3 – fair value measurements are those derived from valuation techniques that include inputs for the asset or liability that are not
based on observable market data (unobservable inputs).
AS AT 24 juNE 2012
$MLEVEL 1
$MLEVEL 2
$MLEVEL 3
$MTOTAL
derivative financial assets: Forward foreign currency contracts – 20.6 – 20.6Cross currency swaps – 140.4 – 140.4
other financial assets: Listed equity securities 98.2 – – 98.2
total 98.2 161.0 – 259.2
derivative financial liabilities: Forward foreign currency contracts – (3.2) – (3.2)Interest rate swaps – (394.6) – (394.6)Cross currency swaps – (163.1) – (163.1)
other financial liabilities: Other financial liability – – (433.9) (433.9)
total – (560.9) (433.9) (994.8)
There were no transfers between Level 1 and Level 2 in the period.
NOTES TO THE CONSOLIDATED FINANCIAL STATEMENTS
WoolWorths limited AnnuAl report 2012158

AS AT 26 juNE 2011
$MLEVEL 1
$MLEVEL 2
$MLEVEL 3
$MTOTAL
derivative financial assets: Forward foreign currency contracts – 18.6 – 18.6Interest rate swaps – 5.7 – 5.7Cross currency swaps – 99.5 – 99.5
other financial assets: Listed equity securities 113.5 – – 113.5
total 113.5 123.8 – 237.3
derivative financial liabilities: Forward foreign currency contracts – (15.4) – (15.4)Interest rate swaps – (69.0) – (69.0)Cross currency swaps – (725.0) – (725.0)
other financial liabilities: Other financial liability – – (344.8) (344.8)
total – (809.4) (344.8) (1,154.2)
There were no transfers between Level 1 and Level 2 in the period.
RECONCILIATION OF LEVEL 3 FAIR VALUE MEASUREMENTS OF FINANCIAL LIABILITIES2012
$M2011$M
Opening balance (344.8) (77.3)Issue of equity in subsidiary to non-controlling interest and loss attributable to non-controlling interest (89.1) (267.5)
Closing balance (433.9) (344.8)
Other financial liability includes a put option over a non-controlling interest. Significant assumptions were used in determining the fair value of the put option over the non-controlling interest. Woolworths Limited owns 66.7% of the joint venture entity Hydrox Holdings Pty Ltd (Hydrox). The terms of the Agreement (which was entered in the 2010 financial year) include exit provisions that may be exercised after the fourth anniversary of the Agreement. As a result, the put option over the non-controlling interest has been recorded as a non-current other financial liability as required by Australian Accounting Standards. This other financial liability has been recorded at fair value, determined using internal parameters including the cumulative cash contributions to date and the results of Hydrox.
159
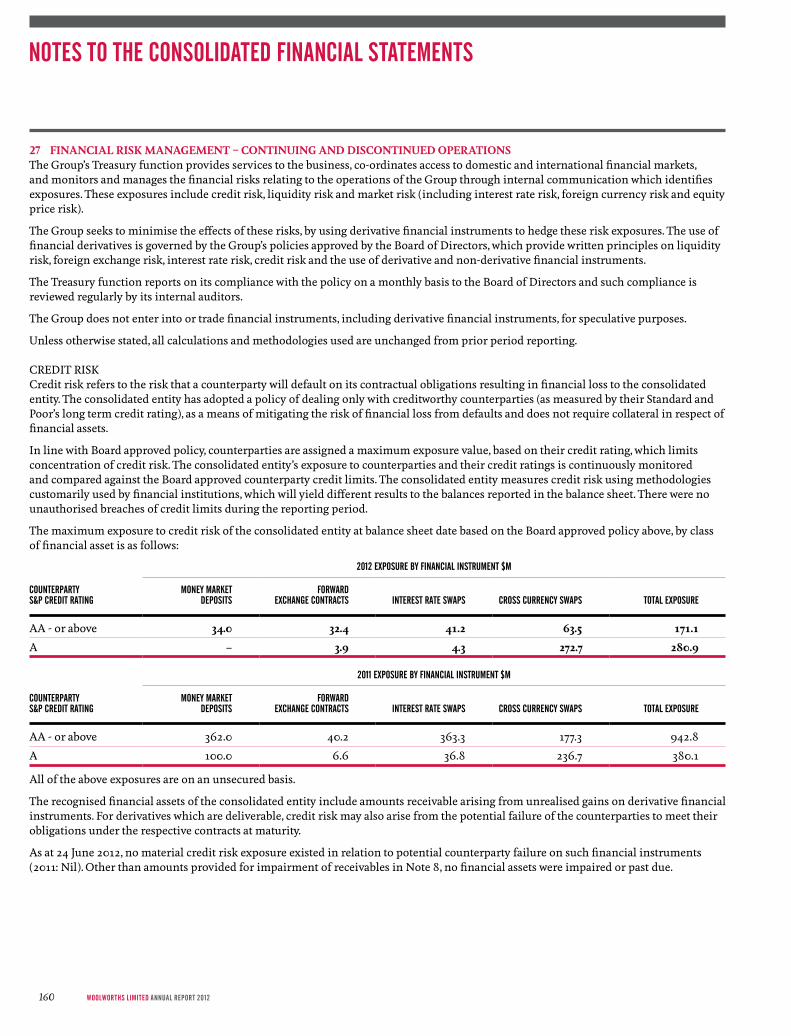
27 FInanCIal RIsK manaGement – ContInUInG and dIsContInUed oPeRatIonsThe Group’s Treasury function provides services to the business, co-ordinates access to domestic and international financial markets, and monitors and manages the financial risks relating to the operations of the Group through internal communication which identifies exposures. These exposures include credit risk, liquidity risk and market risk (including interest rate risk, foreign currency risk and equity price risk).
The Group seeks to minimise the effects of these risks, by using derivative financial instruments to hedge these risk exposures. The use of financial derivatives is governed by the Group’s policies approved by the Board of Directors, which provide written principles on liquidity risk, foreign exchange risk, interest rate risk, credit risk and the use of derivative and non-derivative financial instruments.
The Treasury function reports on its compliance with the policy on a monthly basis to the Board of Directors and such compliance is reviewed regularly by its internal auditors.
The Group does not enter into or trade financial instruments, including derivative financial instruments, for speculative purposes.
Unless otherwise stated, all calculations and methodologies used are unchanged from prior period reporting.
CREDIT RISK Credit risk refers to the risk that a counterparty will default on its contractual obligations resulting in financial loss to the consolidated entity. The consolidated entity has adopted a policy of dealing only with creditworthy counterparties (as measured by their Standard and Poor’s long term credit rating), as a means of mitigating the risk of financial loss from defaults and does not require collateral in respect of financial assets.
In line with Board approved policy, counterparties are assigned a maximum exposure value, based on their credit rating, which limits concentration of credit risk. The consolidated entity’s exposure to counterparties and their credit ratings is continuously monitored and compared against the Board approved counterparty credit limits. The consolidated entity measures credit risk using methodologies customarily used by financial institutions, which will yield different results to the balances reported in the balance sheet. There were no unauthorised breaches of credit limits during the reporting period.
The maximum exposure to credit risk of the consolidated entity at balance sheet date based on the Board approved policy above, by class of financial asset is as follows:
2012 ExPOSuRE By FINANCIAL INSTRuMENT $M
COuNTERPARTy S&P CREDIT RATING
MONEy MARkETDEPOSITS
FORWARDExCHANGE CONTRACTS INTEREST RATE SWAPS CROSS CuRRENCy SWAPS TOTAL ExPOSuRE
AA - or above 34.0 32.4 41.2 63.5 171.1
A – 3.9 4.3 272.7 280.9
2011 ExPOSuRE By FINANCIAL INSTRuMENT $M
COuNTERPARTy S&P CREDIT RATING
MONEy MARkETDEPOSITS
FORWARDExCHANGE CONTRACTS INTEREST RATE SWAPS CROSS CuRRENCy SWAPS TOTAL ExPOSuRE
AA - or above 362.0 40.2 363.3 177.3 942.8
A 100.0 6.6 36.8 236.7 380.1
All of the above exposures are on an unsecured basis.
The recognised financial assets of the consolidated entity include amounts receivable arising from unrealised gains on derivative financial instruments. For derivatives which are deliverable, credit risk may also arise from the potential failure of the counterparties to meet their obligations under the respective contracts at maturity.
As at 24 June 2012, no material credit risk exposure existed in relation to potential counterparty failure on such financial instruments (2011: Nil). Other than amounts provided for impairment of receivables in Note 8, no financial assets were impaired or past due.
NOTES TO THE CONSOLIDATED FINANCIAL STATEMENTS
WoolWorths limited AnnuAl report 2012160

LIQUIDITy RISK Liquidity risk is the risk that the consolidated entity will not be able to meet its financial obligations as they fall due. This risk arises through the possibility that sales income may be reduced due to adverse factors, unusually large amounts may fall due for payment, or existing maturing debt is unable to be refinanced.
The Company has established an appropriate liquidity risk management framework for the consolidated entity’s short, medium and long-term funding liquidity management requirements, which has been approved by the Board of Directors.
The consolidated entity maintains a liquidity reserve in the form of undrawn bilateral standby facilities of at least $1 billion with unexpired tenures of at least 12 months at all times. Additionally, to minimise refinancing and re-pricing risk, there are limitations placed upon amounts which may expire in a 12 month period and amounts which may be from a single source. Included in Note 15 is a summary of undrawn facilities that the consolidated entity has at its disposal to draw upon if required.
The following table details the consolidated entity’s undiscounted financial liabilities and their contractual maturities:
WOOLWORTHS LIMITED GROuPAS AT 24 juNE 2012 ($M)
WOOLWORTHS LIMITED GROuPAS AT 26 juNE 2011 ($M)
MATuRITy ANALySIS OF FINANCIAL LIABILITIES
LESS THAN1 yEAR 1 TO 2 yEARS 2 TO 5 yEARS OVER 5 yEARS TOTAL
LESS THAN1 yEAR 1 TO 2 yEARS 2 TO 5 yEARS OVER 5 yEARS TOTAL
non derivative liabilitiesBank loans (52.2) – – (1.5) (53.7) (698.0) – – (1.5) (699.5)Finance leases (2.5) (1.5) (3.9) – (7.9) (2.4) (1.8) (1.0) – (5.2)Domestic notes (63.8) (63.8) (657.5) (560.0) (1,345.1) (33.8) (33.8) (601.3) – (668.9)USD notes (126.5) (126.5) (2,215.1) (1,674.3) (4,142.4) (538.3) (120.4) (1,867.4) (2,116.9) (4,643.0)Woolworths Notes - – – – – (609.3) – – – (609.3)Woolworths Notes II (47.1) (47.1) (141.2) (1,614.7) (1,850.1) – – – – – Accounts payable (4,160.7) – – – (4,160.7) (4,132.0) – – – (4,132.0)Accruals (1,144.8) – – – (1,144.8) (1,022.6) – – – (1,022.6)total non derivative liabilities (5,597.6) (238.9) (3,017.7) (3,850.5) (12,704.7) (7,036.4) (156.0) (2,469.7) (2,118.4) (11,780.5)
derivative liabilitiesForeign exchange contracts pay (367.5) – – – (367.5) (488.4) (0.4) – – (488.8)Foreign exchange contracts rec 382.8 – – – 382.8 486.7 0.4 – – 487.1 net foreign exchange contracts 15.3 – – – 15.3 (1.7) – – – (1.7)Interest rate swaps pay fixed (223.7) (242.6) (521.9) (294.2) (1,282.4) (235.7) (193.0) (532.1) (400.2) (1,361.0)Interest rate swaps rec floating 150.1 160.9 347.1 183.3 841.4 209.2 167.2 460.1 344.2 1,180.7 net pay IRs1 (73.6) (81.7) (174.8) (110.9) (441.0) (26.5) (25.8) (72.0) (56.0) (180.3)Cross currency swaps pay floating (170.0) (186.7) (2,302.8) (1,726.3) (4,385.8) (1,027.2) (211.3) (2,111.5) (2,296.2) (5,646.2)Cross currency swaps rec fixed 126.5 126.5 2,215.1 1,674.3 4,142.4 911.5 120.4 1,867.4 2,116.9 5,016.2 net pay CCs (43.5) (60.2) (87.7) (52.0) (243.4) (115.7) (90.9) (244.1) (179.3) (630.0)total derivative liabilities (101.8) (141.9) (262.5) (162.9) (669.1) (143.9) (116.7) (316.1) (235.3) (812.0)
total financial liabilities (5,699.4) (380.8) (3,280.2) (4,013.4) (13,373.8) (7,180.3) (272.7) (2,785.8) (2,353.7) (12,592.5)
1 Interest rate swaps are net settled
161
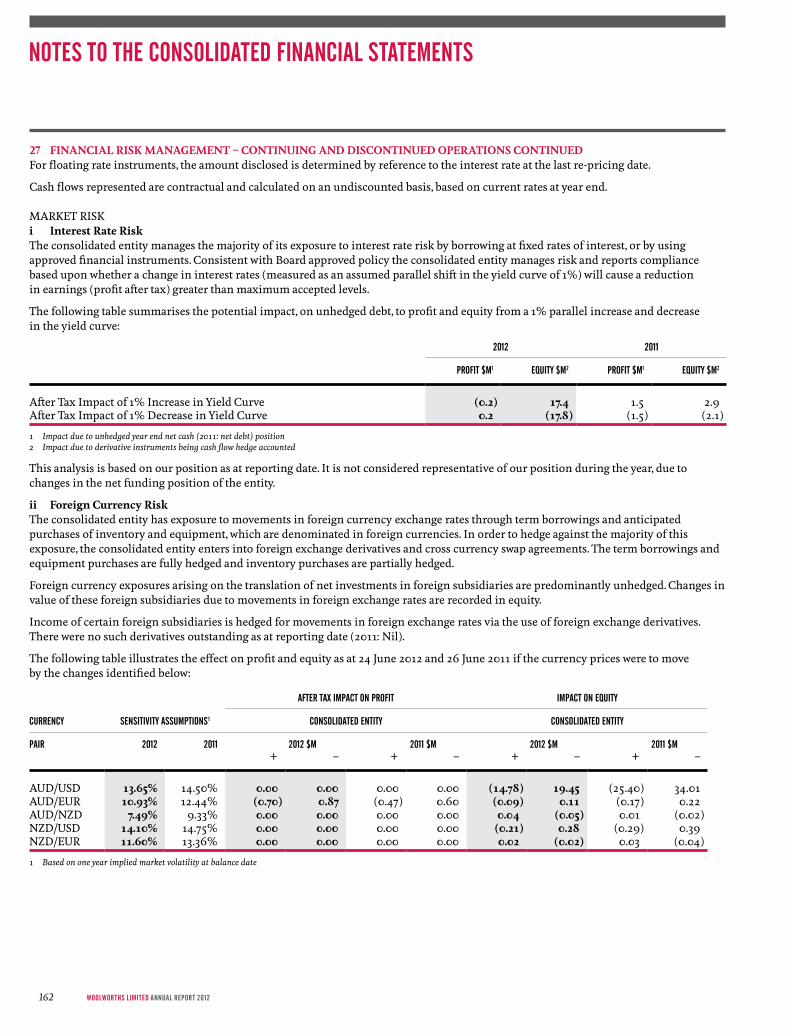
27 FInanCIal RIsK manaGement – ContInUInG and dIsContInUed oPeRatIons ContInUedFor floating rate instruments, the amount disclosed is determined by reference to the interest rate at the last re-pricing date.
Cash flows represented are contractual and calculated on an undiscounted basis, based on current rates at year end.
MARKET RISKi Interest Rate RiskThe consolidated entity manages the majority of its exposure to interest rate risk by borrowing at fixed rates of interest, or by using approved financial instruments. Consistent with Board approved policy the consolidated entity manages risk and reports compliance based upon whether a change in interest rates (measured as an assumed parallel shift in the yield curve of 1%) will cause a reduction in earnings (profit after tax) greater than maximum accepted levels.
The following table summarises the potential impact, on unhedged debt, to profit and equity from a 1% parallel increase and decrease in the yield curve:
2012 2011
PROFIT $M1 EQuITy $M2 PROFIT $M1 EQuITy $M2
After Tax Impact of 1% Increase in yield Curve (0.2) 17.4 1.5 2.9After Tax Impact of 1% Decrease in yield Curve 0.2 (17.8) (1.5) (2.1)
1 Impact due to unhedged year end net cash (2011: net debt) position2 Impact due to derivative instruments being cash flow hedge accounted
This analysis is based on our position as at reporting date. It is not considered representative of our position during the year, due to changes in the net funding position of the entity.
ii Foreign Currency RiskThe consolidated entity has exposure to movements in foreign currency exchange rates through term borrowings and anticipated purchases of inventory and equipment, which are denominated in foreign currencies. In order to hedge against the majority of this exposure, the consolidated entity enters into foreign exchange derivatives and cross currency swap agreements. The term borrowings and equipment purchases are fully hedged and inventory purchases are partially hedged.
Foreign currency exposures arising on the translation of net investments in foreign subsidiaries are predominantly unhedged. Changes in value of these foreign subsidiaries due to movements in foreign exchange rates are recorded in equity.
Income of certain foreign subsidiaries is hedged for movements in foreign exchange rates via the use of foreign exchange derivatives. There were no such derivatives outstanding as at reporting date (2011: Nil).
The following table illustrates the effect on profit and equity as at 24 June 2012 and 26 June 2011 if the currency prices were to move by the changes identified below:
AFTER TAx IMPACT ON PROFIT IMPACT ON EQuITy
CuRRENCy SENSITIVITy ASSuMPTIONS1 CONSOLIDATED ENTITy CONSOLIDATED ENTITy
PAIR 2012 2011 2012 $M 2011 $M 2012 $M 2011 $M+ – + – + – + –
AUD/USD 13.65% 14.50% 0.00 0.00 0.00 0.00 (14.78) 19.45 (25.40) 34.01AUD/EUR 10.93% 12.44% (0.70) 0.87 (0.47) 0.60 (0.09) 0.11 (0.17) 0.22AUD/NZD 7.49% 9.33% 0.00 0.00 0.00 0.00 0.04 (0.05) 0.01 (0.02)NZD/USD 14.10% 14.75% 0.00 0.00 0.00 0.00 (0.21) 0.28 (0.29) 0.39NZD/EUR 11.60% 13.36% 0.00 0.00 0.00 0.00 0.02 (0.02) 0.03 (0.04)
1 Based on one year implied market volatility at balance date
NOTES TO THE CONSOLIDATED FINANCIAL STATEMENTS
WoolWorths limited AnnuAl report 2012162

Sensitivity to foreign exchange exposures is calculated on significant amounts payable in foreign currency less hedges of both foreign currency payables and forecast foreign currency transactions. This analysis is based on our position as at reporting date and it is not considered representative of our position during the year.
As at the reporting date, the Group’s exposure to foreign currency risk after taking into consideration hedges of foreign currency borrowings, foreign currency payables and forecast foreign currency transactions is not considered material.
iii equity Price RiskThe consolidated entity is exposed to changes in the market price of certain equity investments, being the interests held in the Warehouse Group and ALE Group. Subsequent to initial recognition they are measured at fair value with any change recorded in a revaluation reserve in equity. No hedging of this risk is undertaken.
As at the reporting date, the Group’s exposure to equity price risk in respect of its investments in the Warehouse Group and ALE Group is not considered material.
iv Capital managementObjectivesWoolworths sets its capital structure with the objective of enhancing long term shareholder value through optimising its weighted average cost of capital while retaining flexibility to pursue growth and undertake capital management initiatives. Consistent with this objective, Woolworths has targeted, achieved and maintained its strong investment grade credit ratings from Standard & Poor’s and Moody’s Investor Services.
Capital ReturnsWoolworths will seek to return capital to shareholders when that is consistent with its capital structuring objectives and where it will enhance shareholder value. Since July 2001, over $11.9 billion has been returned to shareholders through dividends (including the final dividend for the financial year ended 24 June 2012) and on-market and off-market share buy backs.
Given the trading environment, there was no share buy back activity in 2012 and none is anticipated in 2013.
The payment of the April 2012 and October 2012 dividends will return over $658 million in franking credits to shareholders. Woolworths expects that after these events, there will be approximately $1.5 billion of franking credits available for future distribution.
Financing TransactionsIn October 2011, Woolworths executed a A$1.2 billion syndicated revolving bank loan facility comprised of two tranches, three years (A$580 million) and five years (A$620 million). Shortly thereafter, two existing syndicated bank loan facilities of A$800 million and US$700 million, maturing in April and May 2012 respectively, were terminated.
In November 2011, Woolworths issued A$700 million in hybrid notes having a 25 year maturity with a non-call period of five years.
In March 2012, Woolworths issued A$500 million of Medium Term Notes into the domestic institutional market with a maturity of seven years.
Maturities during the year included A$600 million in perpetual hybrid notes which were redeemed at the expiry of the five year non-call period in September 2011 and US$300 million in US 144A notes (hedged at A$410 million) in November 2011.
There are no maturities of debt in the immediate term. At the end of Fy12, Woolworths had $3.4 billion in undrawn bank loan facilities.
Property Sales ProgramWoolworths has a history of developing Marketplace style retail centres through its property development arm. Woolworths increased its involvement in the development of sites using its own balance sheet due to the significant decline in third party property development. This has resulted in Woolworths’ ownership of a larger (than historical) portfolio of retail centres. Woolworths is generally not a long-term holder of property assets and continues its strategy of divesting property as appropriate market opportunities arise. Woolworths’ total proceeds from the disposal of property for the 2012 financial year were approximately $200 million.
163

28 sUBsIdIaRIesBENEFICIAL HOLDING
NAME OF ENTITy NOTE COuNTRy OF INCORPORATION 24 juNE 2012 26 juNE 2011
Woolworths LimitedA.C.N. 001 259 301 Pty Limited 1 Australia 100 100Advantage Supermarkets Pty Ltd 1 Australia 100 100
Advantage Supermarkets WA Pty Ltd 1 Australia 100 100ALH Group Pty Ltd Australia 75 75
Albion Charles Hotel (BMG) Pty Ltd Australia 100 100ALH Group Property Holdings Pty Limited Australia 100 100Australian Leisure and Hospitality Group Pty Limited Australia 100 100
ALH Group (No. 1) Pty Ltd Australia 100 100Balaclava Hotel (BMG) Pty Ltd Australia 100 100Chelsea Heights Hotel (BMG) Pty Ltd Australia 100 100Cherry Hill Tavern (BMG) Pty Ltd Australia 100 100Club Management (BMG) Pty Ltd Australia 100 100Courthouse Brunswick Hotel (BMG) Pty Ltd Australia 100 100Courthouse Hotel Footscray (BMG) Pty Ltd Australia 100 100Croxton Park Hotel (BMG) Pty Ltd Australia 100 100Daisey’s Club Hotel (BMG) Pty Ltd Australia 100 100Excelsior Hotel (BMG) Pty Ltd Australia 100 100First and Last Hotel (BMG) Pty Ltd Australia 100 100Glengala Hotel (BMG) Pty Ltd Australia 100 100Lyndhurst Club Hotel (BMG) Pty Ltd Australia 100 100Management (BMG) Pty Ltd Australia 100 100Manningham Hotel (BMG) Pty Ltd Australia 100 100MGW Hotels Pty Ltd Australia 100 100
Aceridge Pty Limited Australia 100 100Chatswood Hills Tavern Pty. Ltd. Australia 100 100Dapara Pty Ltd Australia 100 100
Stadform Developments Pty. Limited Australia 100 100Fenbridge Pty. Ltd. Australia 100 100Kawana Waters Tavern No. 3 Pty Ltd Australia 100 100
Kawana Waters Tavern No. 1 Pty Ltd Australia 100 100Kawana Waters Tavern No. 2 Pty Ltd Australia 100 100
Vicpoint Pty Ltd Australia 100 100Milanos Hotel (BMG) Pty Ltd Australia 100 100Monash Hotel (BMG) Pty Ltd Australia 100 100Moreland Hotel (BMG) Pty Ltd Australia 100 100Nu Hotel (BMG) Pty Ltd Australia 100 100Oakleigh Junction Hotel (BMG) Pty Ltd Australia 100 100Palace Hotel Hawthorn (BMG) Pty Ltd Australia 100 100Powel Hotel Footscray (BMG) Pty Ltd Australia 100 100Preston Hotel (BMG) Pty Ltd Australia 100 100Queensbridge Hotel (BMG) Pty Ltd Australia 100 100Racecourse Hotel (BMG) Pty Ltd Australia 100 100Shoppingtown Hotel (BMG) Pty Ltd Australia 100 100Taverner Hotel Group Pty. Ltd. Australia 100 100
Amprok Pty. Ltd. Australia 100 100Auspubs Pty Ltd Australia 100 100Cooling Zephyr Pty Ltd Australia 100 100The Common Link Pty Ltd Australia 100 100E. G. Functions Pty. Ltd. Australia 100 100Elizabeth Tavern Pty. Ltd. Australia 100 100FG Joint Venture Pty Ltd Australia 100 100Fountain Jade Pty. Ltd. Australia 100 100Hadwick Pty Ltd Australia 100 100Markessa Pty. Ltd. Australia 100 100
NOTES TO THE CONSOLIDATED FINANCIAL STATEMENTS
WoolWorths limited AnnuAl report 2012164
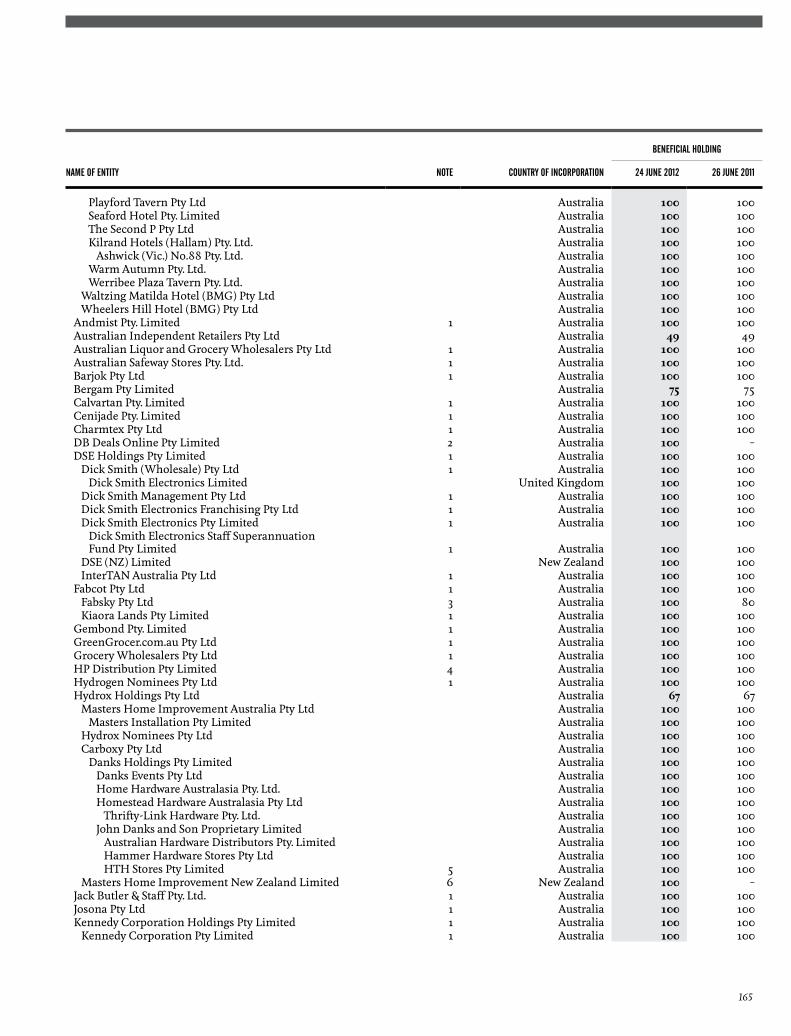
BENEFICIAL HOLDING
NAME OF ENTITy NOTE COuNTRy OF INCORPORATION 24 juNE 2012 26 juNE 2011
Playford Tavern Pty Ltd Australia 100 100Seaford Hotel Pty. Limited Australia 100 100The Second P Pty Ltd Australia 100 100Kilrand Hotels (Hallam) Pty. Ltd. Australia 100 100
Ashwick (Vic.) No.88 Pty. Ltd. Australia 100 100Warm Autumn Pty. Ltd. Australia 100 100Werribee Plaza Tavern Pty. Ltd. Australia 100 100
Waltzing Matilda Hotel (BMG) Pty Ltd Australia 100 100Wheelers Hill Hotel (BMG) Pty Ltd Australia 100 100
Andmist Pty. Limited 1 Australia 100 100Australian Independent Retailers Pty Ltd Australia 49 49Australian Liquor and Grocery Wholesalers Pty Ltd 1 Australia 100 100Australian Safeway Stores Pty. Ltd. 1 Australia 100 100Barjok Pty Ltd 1 Australia 100 100Bergam Pty Limited Australia 75 75Calvartan Pty. Limited 1 Australia 100 100Cenijade Pty. Limited 1 Australia 100 100Charmtex Pty Ltd 1 Australia 100 100DB Deals Online Pty Limited 2 Australia 100 –DSE Holdings Pty Limited 1 Australia 100 100
Dick Smith (Wholesale) Pty Ltd 1 Australia 100 100Dick Smith Electronics Limited United Kingdom 100 100
Dick Smith Management Pty Ltd 1 Australia 100 100Dick Smith Electronics Franchising Pty Ltd 1 Australia 100 100Dick Smith Electronics Pty Limited 1 Australia 100 100
Dick Smith Electronics Staff Superannuation Fund Pty Limited 1 Australia 100 100
DSE (NZ) Limited New Zealand 100 100InterTAN Australia Pty Ltd 1 Australia 100 100
Fabcot Pty Ltd 1 Australia 100 100Fabsky Pty Ltd 3 Australia 100 80Kiaora Lands Pty Limited 1 Australia 100 100
Gembond Pty. Limited 1 Australia 100 100GreenGrocer.com.au Pty Ltd 1 Australia 100 100Grocery Wholesalers Pty Ltd 1 Australia 100 100HP Distribution Pty Limited 4 Australia 100 100Hydrogen Nominees Pty Ltd 1 Australia 100 100Hydrox Holdings Pty Ltd Australia 67 67
Masters Home Improvement Australia Pty Ltd Australia 100 100Masters Installation Pty Limited Australia 100 100
Hydrox Nominees Pty Ltd Australia 100 100Carboxy Pty Ltd Australia 100 100
Danks Holdings Pty Limited Australia 100 100Danks Events Pty Ltd Australia 100 100Home Hardware Australasia Pty. Ltd. Australia 100 100Homestead Hardware Australasia Pty Ltd Australia 100 100
Thrifty-Link Hardware Pty. Ltd. Australia 100 100John Danks and Son Proprietary Limited Australia 100 100
Australian Hardware Distributors Pty. Limited Australia 100 100Hammer Hardware Stores Pty Ltd Australia 100 100HTH Stores Pty Limited 5 Australia 100 100
Masters Home Improvement New Zealand Limited 6 New Zealand 100 –Jack Butler & Staff Pty. Ltd. 1 Australia 100 100Josona Pty Ltd 1 Australia 100 100Kennedy Corporation Holdings Pty Limited 1 Australia 100 100
Kennedy Corporation Pty Limited 1 Australia 100 100
165
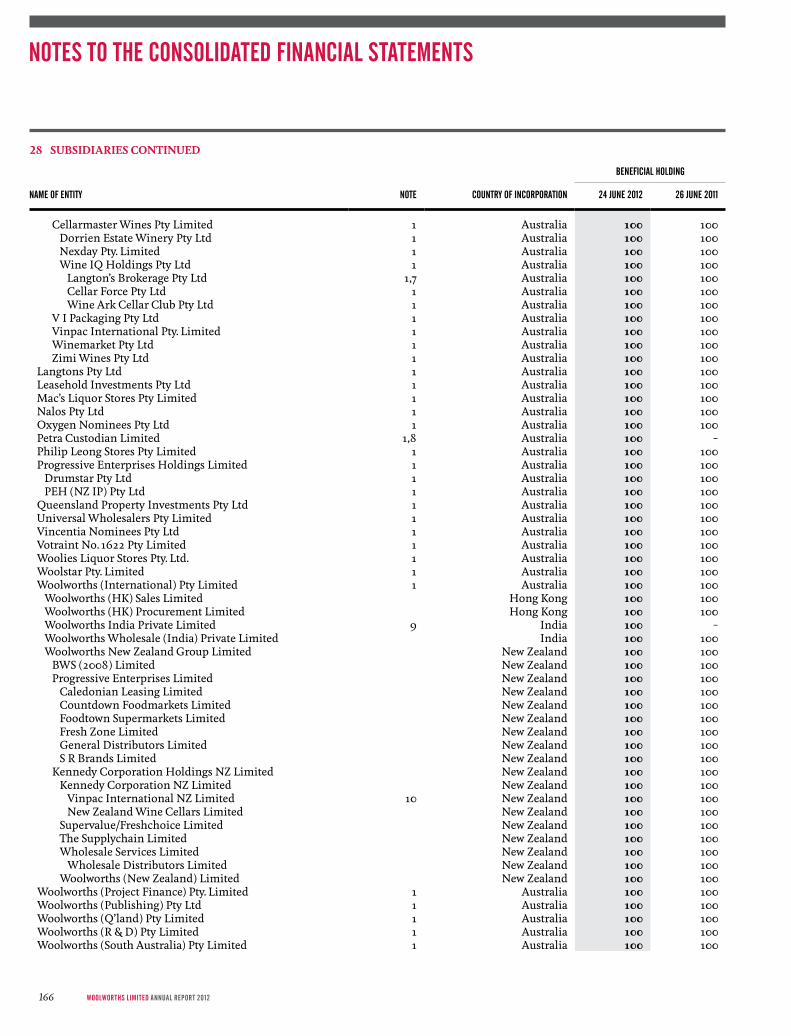
BENEFICIAL HOLDING
NAME OF ENTITy NOTE COuNTRy OF INCORPORATION 24 juNE 2012 26 juNE 2011
Cellarmaster Wines Pty Limited 1 Australia 100 100Dorrien Estate Winery Pty Ltd 1 Australia 100 100Nexday Pty. Limited 1 Australia 100 100Wine IQ Holdings Pty Ltd 1 Australia 100 100
Langton’s Brokerage Pty Ltd 1,7 Australia 100 100Cellar Force Pty Ltd 1 Australia 100 100Wine Ark Cellar Club Pty Ltd 1 Australia 100 100
V I Packaging Pty Ltd 1 Australia 100 100Vinpac International Pty. Limited 1 Australia 100 100Winemarket Pty Ltd 1 Australia 100 100Zimi Wines Pty Ltd 1 Australia 100 100
Langtons Pty Ltd 1 Australia 100 100Leasehold Investments Pty Ltd 1 Australia 100 100Mac’s Liquor Stores Pty Limited 1 Australia 100 100Nalos Pty Ltd 1 Australia 100 100Oxygen Nominees Pty Ltd 1 Australia 100 100Petra Custodian Limited 1,8 Australia 100 –Philip Leong Stores Pty Limited 1 Australia 100 100Progressive Enterprises Holdings Limited 1 Australia 100 100
Drumstar Pty Ltd 1 Australia 100 100PEH (NZ IP) Pty Ltd 1 Australia 100 100
Queensland Property Investments Pty Ltd 1 Australia 100 100Universal Wholesalers Pty Limited 1 Australia 100 100Vincentia Nominees Pty Ltd 1 Australia 100 100Votraint No. 1622 Pty Limited 1 Australia 100 100Woolies Liquor Stores Pty. Ltd. 1 Australia 100 100Woolstar Pty. Limited 1 Australia 100 100Woolworths (International) Pty Limited 1 Australia 100 100
Woolworths (HK) Sales Limited Hong Kong 100 100Woolworths (HK) Procurement Limited Hong Kong 100 100Woolworths India Private Limited 9 India 100 –Woolworths Wholesale (India) Private Limited India 100 100Woolworths New Zealand Group Limited New Zealand 100 100
BWS (2008) Limited New Zealand 100 100Progressive Enterprises Limited New Zealand 100 100
Caledonian Leasing Limited New Zealand 100 100Countdown Foodmarkets Limited New Zealand 100 100Foodtown Supermarkets Limited New Zealand 100 100Fresh Zone Limited New Zealand 100 100General Distributors Limited New Zealand 100 100S R Brands Limited New Zealand 100 100
Kennedy Corporation Holdings NZ Limited New Zealand 100 100Kennedy Corporation NZ Limited New Zealand 100 100
Vinpac International NZ Limited 10 New Zealand 100 100New Zealand Wine Cellars Limited New Zealand 100 100
Supervalue/Freshchoice Limited New Zealand 100 100The Supplychain Limited New Zealand 100 100Wholesale Services Limited New Zealand 100 100
Wholesale Distributors Limited New Zealand 100 100Woolworths (New Zealand) Limited New Zealand 100 100
Woolworths (Project Finance) Pty. Limited 1 Australia 100 100Woolworths (Publishing) Pty Ltd 1 Australia 100 100Woolworths (Q’land) Pty Limited 1 Australia 100 100Woolworths (R & D) Pty Limited 1 Australia 100 100Woolworths (South Australia) Pty Limited 1 Australia 100 100
28 sUBsIdIaRIes ContInUed
NOTES TO THE CONSOLIDATED FINANCIAL STATEMENTS
WoolWorths limited AnnuAl report 2012166
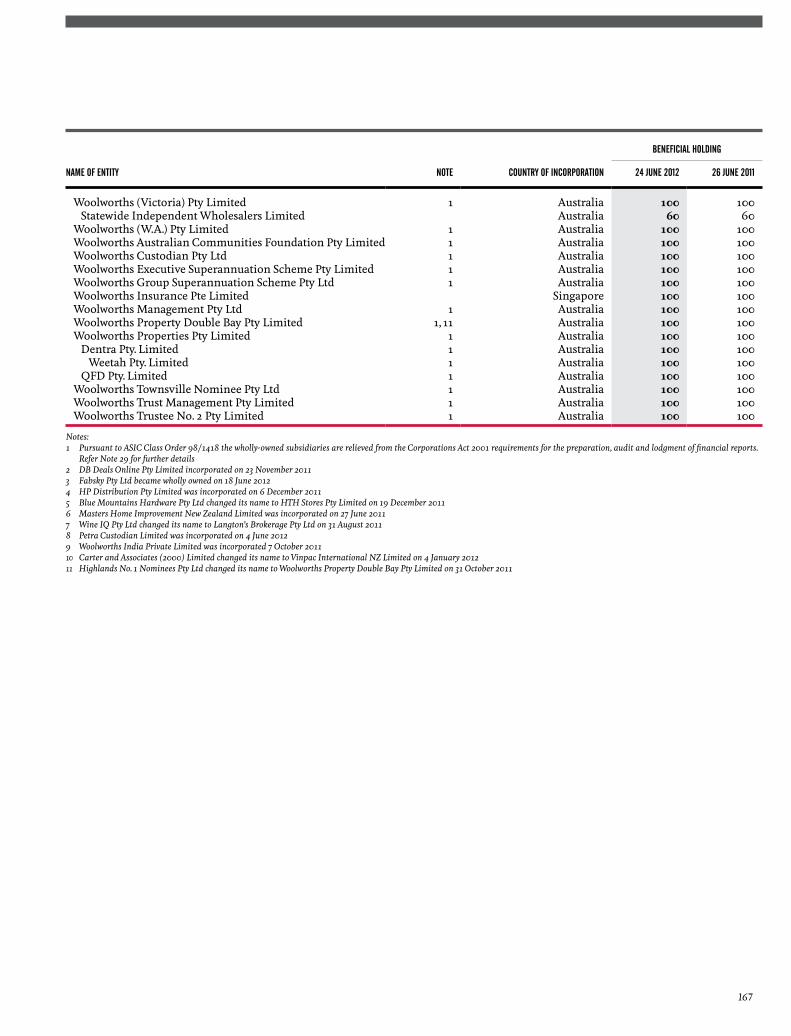
BENEFICIAL HOLDING
NAME OF ENTITy NOTE COuNTRy OF INCORPORATION 24 juNE 2012 26 juNE 2011
Woolworths (Victoria) Pty Limited 1 Australia 100 100Statewide Independent Wholesalers Limited Australia 60 60
Woolworths (W.A.) Pty Limited 1 Australia 100 100Woolworths Australian Communities Foundation Pty Limited 1 Australia 100 100Woolworths Custodian Pty Ltd 1 Australia 100 100Woolworths Executive Superannuation Scheme Pty Limited 1 Australia 100 100Woolworths Group Superannuation Scheme Pty Ltd 1 Australia 100 100Woolworths Insurance Pte Limited Singapore 100 100Woolworths Management Pty Ltd 1 Australia 100 100Woolworths Property Double Bay Pty Limited 1, 11 Australia 100 100Woolworths Properties Pty Limited 1 Australia 100 100
Dentra Pty. Limited 1 Australia 100 100Weetah Pty. Limited 1 Australia 100 100
QFD Pty. Limited 1 Australia 100 100Woolworths Townsville Nominee Pty Ltd 1 Australia 100 100Woolworths Trust Management Pty Limited 1 Australia 100 100Woolworths Trustee No. 2 Pty Limited 1 Australia 100 100
Notes:1 Pursuant to ASIC Class Order 98/1418 the wholly‑owned subsidiaries are relieved from the Corporations Act 2001 requirements for the preparation, audit and lodgment of financial reports.
Refer Note 29 for further details2 DB Deals Online Pty Limited incorporated on 23 November 20113 Fabsky Pty Ltd became wholly owned on 18 June 20124 HP Distribution Pty Limited was incorporated on 6 December 20115 Blue Mountains Hardware Pty Ltd changed its name to HTH Stores Pty Limited on 19 December 20116 Masters Home Improvement New Zealand Limited was incorporated on 27 June 20117 Wine IQ Pty Ltd changed its name to Langton’s Brokerage Pty Ltd on 31 August 20118 Petra Custodian Limited was incorporated on 4 June 20129 Woolworths India Private Limited was incorporated 7 October 201110 Carter and Associates (2000) Limited changed its name to Vinpac International NZ Limited on 4 January 201211 Highlands No. 1 Nominees Pty Ltd changed its name to Woolworths Property Double Bay Pty Limited on 31 October 2011
167
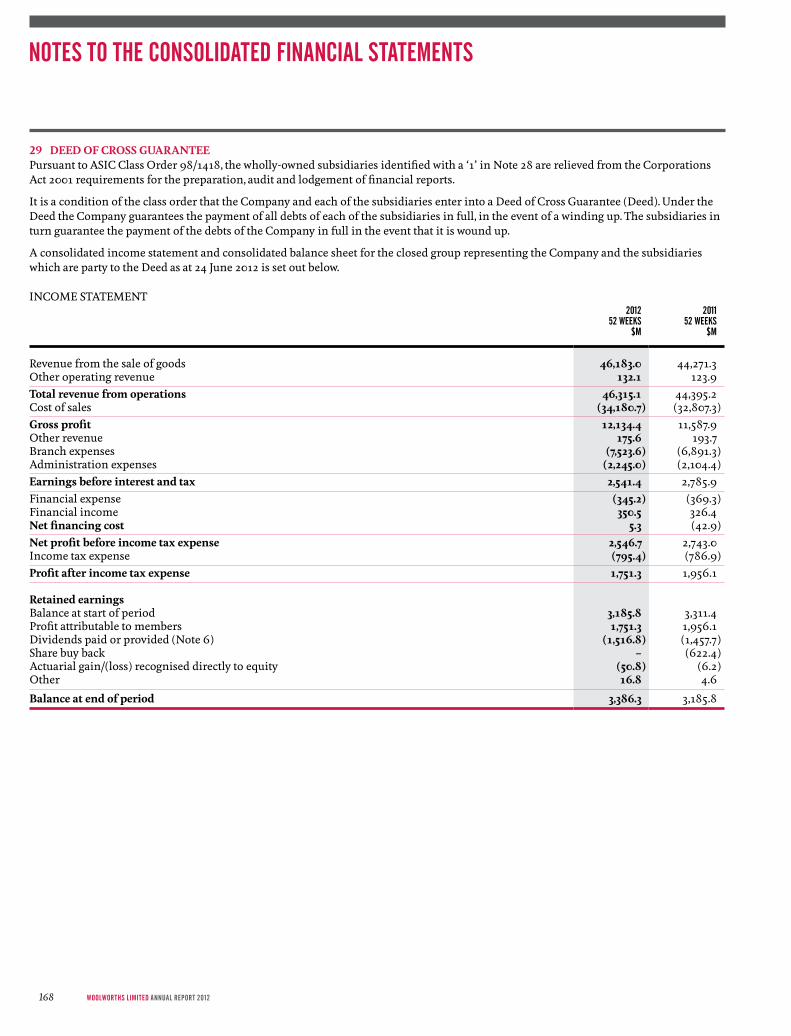
29 deed oF CRoss GUaRantee Pursuant to ASIC Class Order 98/1418, the wholly-owned subsidiaries identified with a ‘1’ in Note 28 are relieved from the Corporations Act 2001 requirements for the preparation, audit and lodgement of financial reports.
It is a condition of the class order that the Company and each of the subsidiaries enter into a Deed of Cross Guarantee (Deed). Under the Deed the Company guarantees the payment of all debts of each of the subsidiaries in full, in the event of a winding up. The subsidiaries in turn guarantee the payment of the debts of the Company in full in the event that it is wound up.
A consolidated income statement and consolidated balance sheet for the closed group representing the Company and the subsidiaries which are party to the Deed as at 24 June 2012 is set out below.
INCOME STATEMENT2012
52 WEEkS$M
201152 WEEkS
$M
Revenue from the sale of goods 46,183.0 44,271.3Other operating revenue 132.1 123.9total revenue from operations 46,315.1 44,395.2Cost of sales (34,180.7) (32,807.3)Gross profit 12,134.4 11,587.9Other revenue 175.6 193.7Branch expenses (7,523.6) (6,891.3)Administration expenses (2,245.0) (2,104.4)earnings before interest and tax 2,541.4 2,785.9Financial expense (345.2) (369.3)Financial income 350.5 326.4net financing cost 5.3 (42.9)net profit before income tax expense 2,546.7 2,743.0Income tax expense (795.4) (786.9)Profit after income tax expense 1,751.3 1,956.1
Retained earningsBalance at start of period 3,185.8 3,311.4Profit attributable to members 1,751.3 1,956.1Dividends paid or provided (Note 6) (1,516.8) (1,457.7)Share buy back – (622.4)Actuarial gain/(loss) recognised directly to equity (50.8) (6.2)Other 16.8 4.6
Balance at end of period 3,386.3 3,185.8
NOTES TO THE CONSOLIDATED FINANCIAL STATEMENTS
WoolWorths limited AnnuAl report 2012168
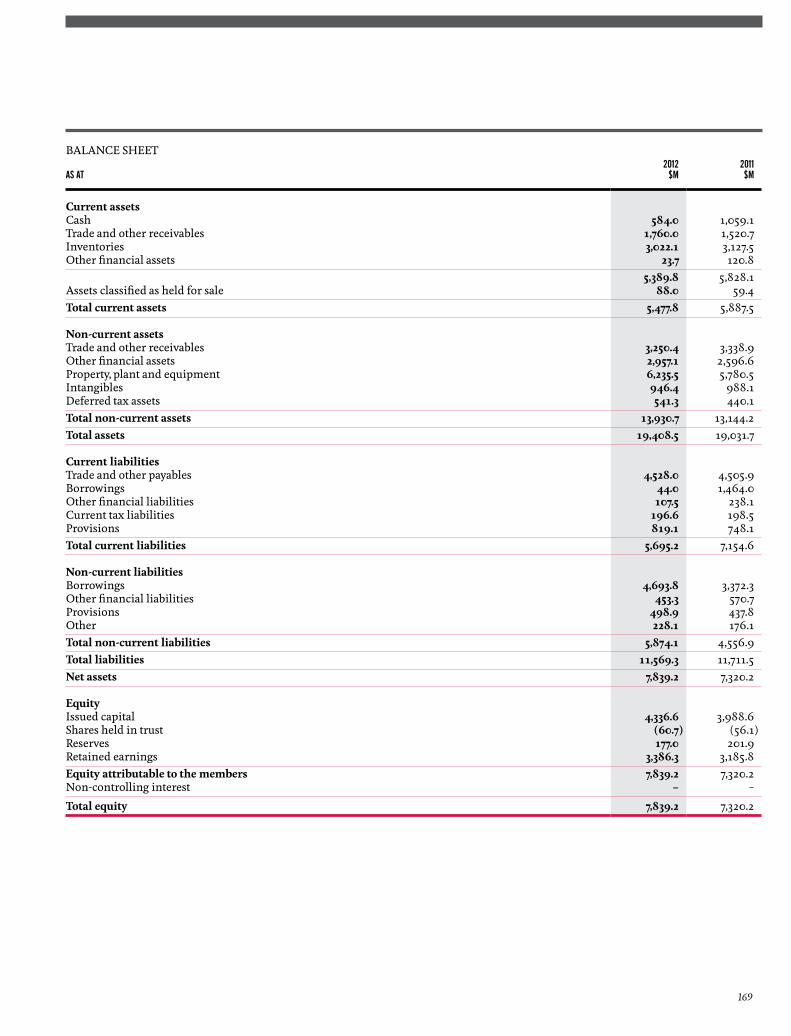
BALANCE SHEET
AS AT 2012
$M2011$M
Current assets Cash 584.0 1,059.1Trade and other receivables 1,760.0 1,520.7Inventories 3,022.1 3,127.5Other financial assets 23.7 120.8
5,389.8 5,828.1Assets classified as held for sale 88.0 59.4total current assets 5,477.8 5,887.5
non-current assetsTrade and other receivables 3,250.4 3,338.9Other financial assets 2,957.1 2,596.6Property, plant and equipment 6,235.5 5,780.5Intangibles 946.4 988.1Deferred tax assets 541.3 440.1total non-current assets 13,930.7 13,144.2total assets 19,408.5 19,031.7
Current liabilitiesTrade and other payables 4,528.0 4,505.9Borrowings 44.0 1,464.0Other financial liabilities 107.5 238.1Current tax liabilities 196.6 198.5Provisions 819.1 748.1total current liabilities 5,695.2 7,154.6
non-current liabilitiesBorrowings 4,693.8 3,372.3Other financial liabilities 453.3 570.7Provisions 498.9 437.8Other 228.1 176.1total non-current liabilities 5,874.1 4,556.9total liabilities 11,569.3 11,711.5net assets 7,839.2 7,320.2
equityIssued capital 4,336.6 3,988.6Shares held in trust (60.7) (56.1)Reserves 177.0 201.9Retained earnings 3,386.3 3,185.8equity attributable to the members 7,839.2 7,320.2Non-controlling interest – –
total equity 7,839.2 7,320.2
169

30 BUsIness aCQUIsItIonsOver the course of the year, the Group acquired the Compass Hotel Group, various hotel venues and other businesses. Each acquisition was for 100% of the respective enterprise. Total consideration paid was $144.5 million comprising plant and equipment ($49.8 million); liquor and gaming licences ($40.1 million) and other working capital balances ($12.5 million), with goodwill on acquisition of $42.1 million. Goodwill has arisen on acquisition of these businesses primarily because of their capacity to generate recurring future revenue streams as well as the specialised knowledge acquired. Acquisition costs totalling $5.3 million were recognised in the income statement.
ENTITy/BuSINESS ACQuIRED2012 PRINCIPAL ACTIVITy DATE OF ACQuISITION
PROPORTION OF OWNERSHIP ACQuIRED
COST OF ACQuISITION$M
Compass Hotel group Hotels 28 November 2011 100% 88.4Miscellaneous businesses Supermarkets, Home
Improvement andLiquor Retail
various 100% 56.1
total 144.5
Further detail in respect of the above acquisitions (represented primarily by the acquisition of the Compass Hotel Group) are included in the consolidated cash flow statement, Note 10 and Note 11.
In 2011, the Group acquired the Cellarmasters Group, various hotel venues and other businesses. Each acquisition was for 100% of the respective enterprise. Total consideration paid was $450.4 million comprising plant and equipment ($102.2 million); liquor and gaming licences ($25.1 million) and other working capital balances ($72.0 million), with goodwill on acquisition of $251.1 million. Goodwill has arisen on acquisition of these businesses primarily because of their capacity to generate recurring future revenue streams as well as the specialised knowledge acquired. Acquisition costs totalling $7.0 million were recognised in the income statement.
ENTITy/BuSINESS ACQuIRED2011 PRINCIPAL ACTIVITy DATE OF ACQuISITION
PROPORTION OF OWNERSHIP ACQuIRED
COST OF ACQuISITION$M
Cellarmasters Liquor retail 29 April 2011 100% 343.6Miscellaneous businesses Supermarkets, Home
Improvement andLiquor Retail
various 100% 106.8
total 450.4
The provisional accounting in respect of the 2011 acquisitions was finalised in the 2012 financial year.
NOTES TO THE CONSOLIDATED FINANCIAL STATEMENTS
WoolWorths limited AnnuAl report 2012170
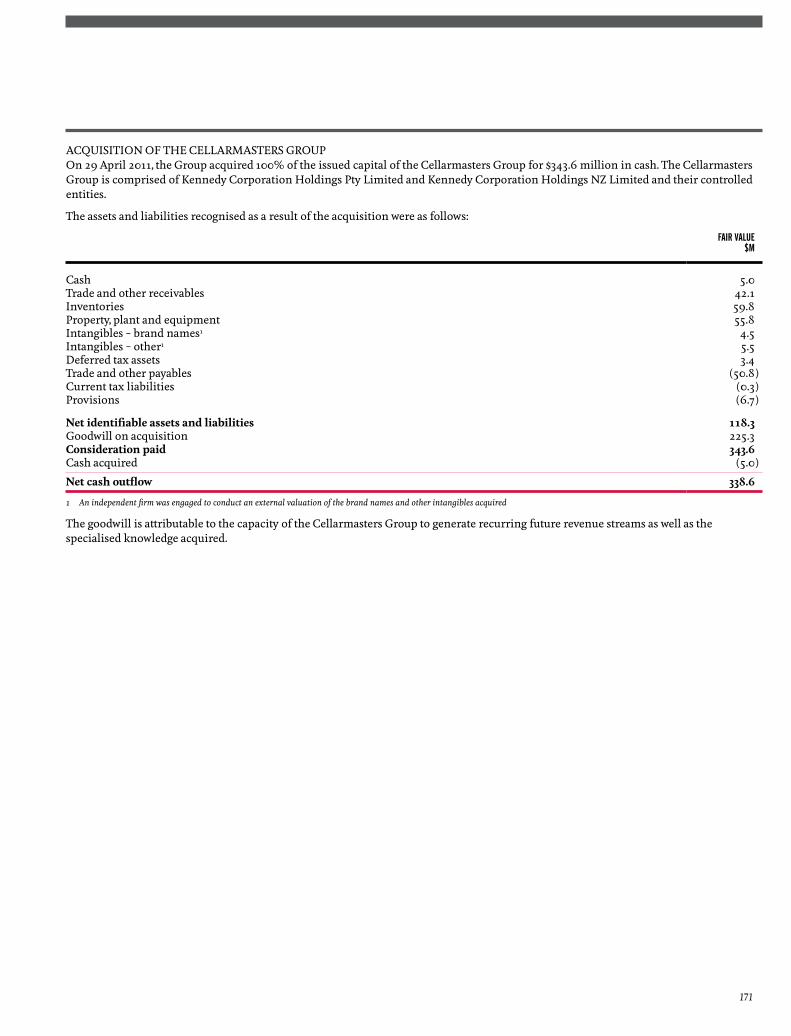
ACQUISITION OF THE CELLARMASTERS GROUPOn 29 April 2011, the Group acquired 100% of the issued capital of the Cellarmasters Group for $343.6 million in cash. The Cellarmasters Group is comprised of Kennedy Corporation Holdings Pty Limited and Kennedy Corporation Holdings NZ Limited and their controlled entities.
The assets and liabilities recognised as a result of the acquisition were as follows:
FAIR VALuE$M
Cash 5.0Trade and other receivables 42.1Inventories 59.8Property, plant and equipment 55.8Intangibles – brand names1 4.5Intangibles – other1 5.5Deferred tax assets 3.4Trade and other payables (50.8)Current tax liabilities (0.3)Provisions (6.7)
net identifiable assets and liabilities 118.3Goodwill on acquisition 225.3Consideration paid 343.6Cash acquired (5.0)
net cash outflow 338.6
1 An independent firm was engaged to conduct an external valuation of the brand names and other intangibles acquired
The goodwill is attributable to the capacity of the Cellarmasters Group to generate recurring future revenue streams as well as the specialised knowledge acquired.
171
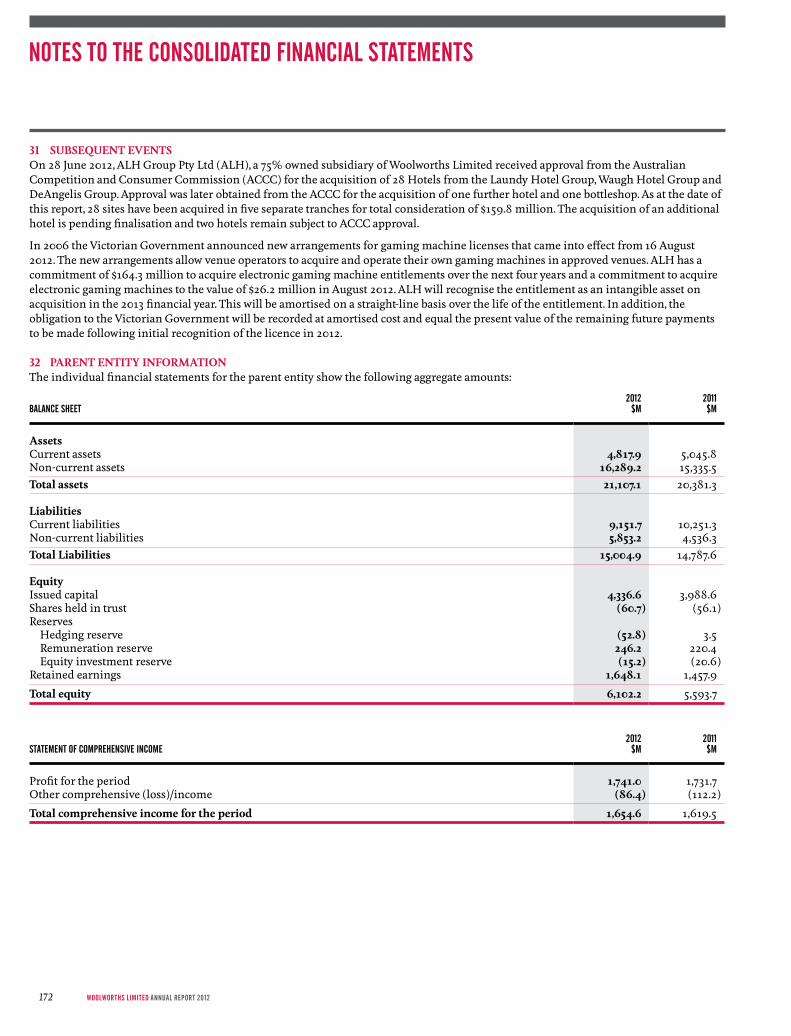
31 sUBseQUent eVents On 28 June 2012, ALH Group Pty Ltd (ALH), a 75% owned subsidiary of Woolworths Limited received approval from the Australian Competition and Consumer Commission (ACCC) for the acquisition of 28 Hotels from the Laundy Hotel Group, Waugh Hotel Group and DeAngelis Group. Approval was later obtained from the ACCC for the acquisition of one further hotel and one bottleshop. As at the date of this report, 28 sites have been acquired in five separate tranches for total consideration of $159.8 million. The acquisition of an additional hotel is pending finalisation and two hotels remain subject to ACCC approval.
In 2006 the Victorian Government announced new arrangements for gaming machine licenses that came into effect from 16 August 2012. The new arrangements allow venue operators to acquire and operate their own gaming machines in approved venues. ALH has a commitment of $164.3 million to acquire electronic gaming machine entitlements over the next four years and a commitment to acquire electronic gaming machines to the value of $26.2 million in August 2012. ALH will recognise the entitlement as an intangible asset on acquisition in the 2013 financial year. This will be amortised on a straight-line basis over the life of the entitlement. In addition, the obligation to the Victorian Government will be recorded at amortised cost and equal the present value of the remaining future payments to be made following initial recognition of the licence in 2012.
32 PaRent entItY InFoRmatIon The individual financial statements for the parent entity show the following aggregate amounts:
BALANCE SHEET2012
$M2011$M
assetsCurrent assets 4,817.9 5,045.8Non-current assets 16,289.2 15,335.5total assets 21,107.1 20,381.3
liabilitiesCurrent liabilities 9,151.7 10,251.3Non-current liabilities 5,853.2 4,536.3total liabilities 15,004.9 14,787.6
equityIssued capital 4,336.6 3,988.6Shares held in trust (60.7) (56.1)Reserves Hedging reserve (52.8) 3.5 Remuneration reserve 246.2 220.4 Equity investment reserve (15.2) (20.6)Retained earnings 1,648.1 1,457.9
total equity 6,102.2 5,593.7
STATEMENT OF COMPREHENSIVE INCOME2012
$M2011$M
Profit for the period 1,741.0 1,731.7Other comprehensive (loss)/income (86.4) (112.2)
total comprehensive income for the period 1,654.6 1,619.5
NOTES TO THE CONSOLIDATED FINANCIAL STATEMENTS
WoolWorths limited AnnuAl report 2012172
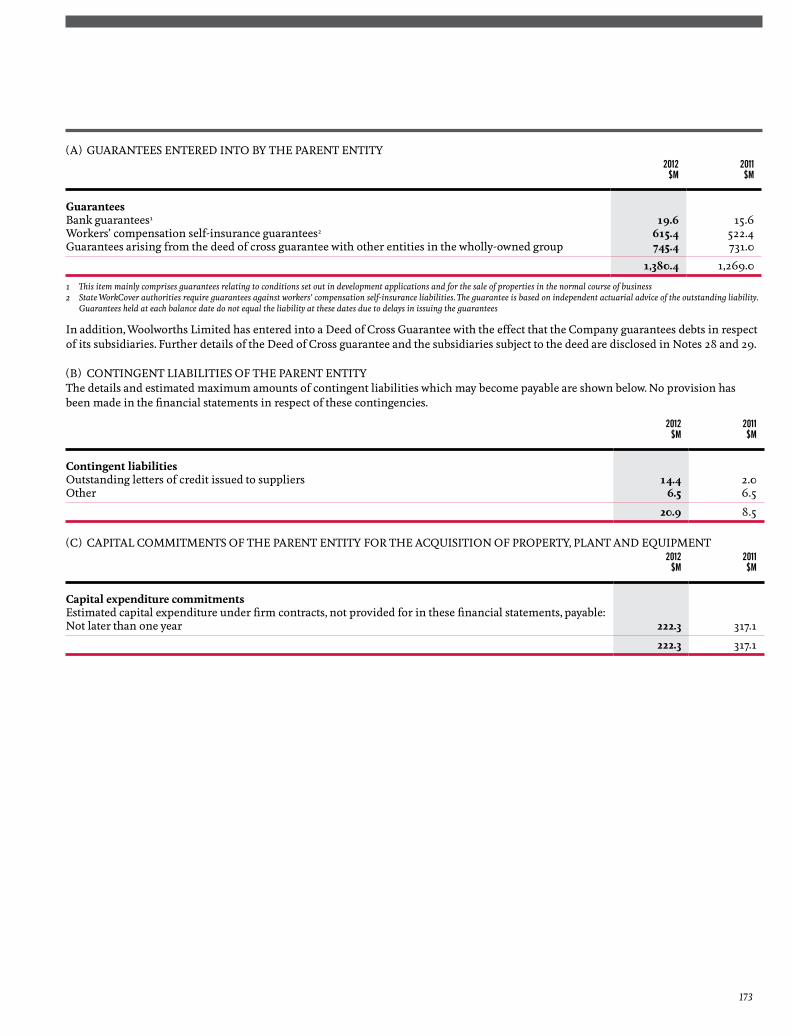
(A) GUARANTEES ENTERED INTO By THE PARENT ENTITy 2012
$M2011$M
Guarantees Bank guarantees1 19.6 15.6Workers’ compensation self-insurance guarantees2 615.4 522.4Guarantees arising from the deed of cross guarantee with other entities in the wholly-owned group 745.4 731.0
1,380.4 1,269.0
1 This item mainly comprises guarantees relating to conditions set out in development applications and for the sale of properties in the normal course of business2 State WorkCover authorities require guarantees against workers’ compensation self‑insurance liabilities. The guarantee is based on independent actuarial advice of the outstanding liability.
Guarantees held at each balance date do not equal the liability at these dates due to delays in issuing the guarantees
In addition, Woolworths Limited has entered into a Deed of Cross Guarantee with the effect that the Company guarantees debts in respect of its subsidiaries. Further details of the Deed of Cross guarantee and the subsidiaries subject to the deed are disclosed in Notes 28 and 29.
(B) CONTINGENT LIABILITIES OF THE PARENT ENTITy The details and estimated maximum amounts of contingent liabilities which may become payable are shown below. No provision has been made in the financial statements in respect of these contingencies.
2012$M
2011$M
Contingent liabilitiesOutstanding letters of credit issued to suppliers 14.4 2.0Other 6.5 6.5
20.9 8.5
(C) CAPITAL COMMITMENTS OF THE PARENT ENTITy FOR THE ACQUISITION OF PROPERTy, PLANT AND EQUIPMENT2012
$M2011$M
Capital expenditure commitmentsEstimated capital expenditure under firm contracts, not provided for in these financial statements, payable:Not later than one year 222.3 317.1
222.3 317.1
173
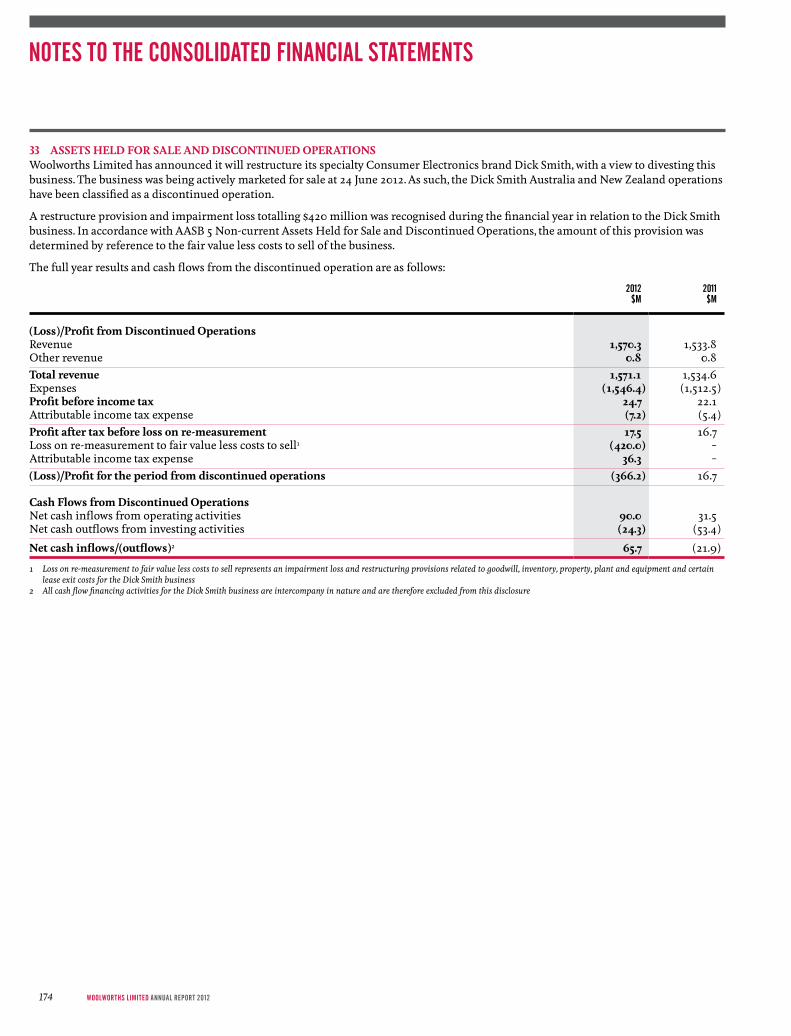
33 assets held FoR sale and dIsContInUed oPeRatIons Woolworths Limited has announced it will restructure its specialty Consumer Electronics brand Dick Smith, with a view to divesting this business. The business was being actively marketed for sale at 24 June 2012. As such, the Dick Smith Australia and New Zealand operations have been classified as a discontinued operation.
A restructure provision and impairment loss totalling $420 million was recognised during the financial year in relation to the Dick Smith business. In accordance with AASB 5 Non-current Assets Held for Sale and Discontinued Operations, the amount of this provision was determined by reference to the fair value less costs to sell of the business.
The full year results and cash flows from the discontinued operation are as follows:
2012$M
2011$M
(loss)/Profit from discontinued operationsRevenue 1,570.3 1,533.8Other revenue 0.8 0.8total revenue 1,571.1 1,534.6Expenses (1,546.4) (1,512.5)Profit before income tax 24.7 22.1Attributable income tax expense (7.2) (5.4)Profit after tax before loss on re-measurement 17.5 16.7Loss on re-measurement to fair value less costs to sell1 (420.0) –Attributable income tax expense 36.3 –(loss)/Profit for the period from discontinued operations (366.2) 16.7
Cash Flows from discontinued operationsNet cash inflows from operating activities 90.0 31.5Net cash outflows from investing activities (24.3) (53.4)
net cash inflows/(outflows)2 65.7 (21.9)
1 Loss on re‑measurement to fair value less costs to sell represents an impairment loss and restructuring provisions related to goodwill, inventory, property, plant and equipment and certain lease exit costs for the Dick Smith business
2 All cash flow financing activities for the Dick Smith business are intercompany in nature and are therefore excluded from this disclosure
NOTES TO THE CONSOLIDATED FINANCIAL STATEMENTS
WoolWorths limited AnnuAl report 2012174
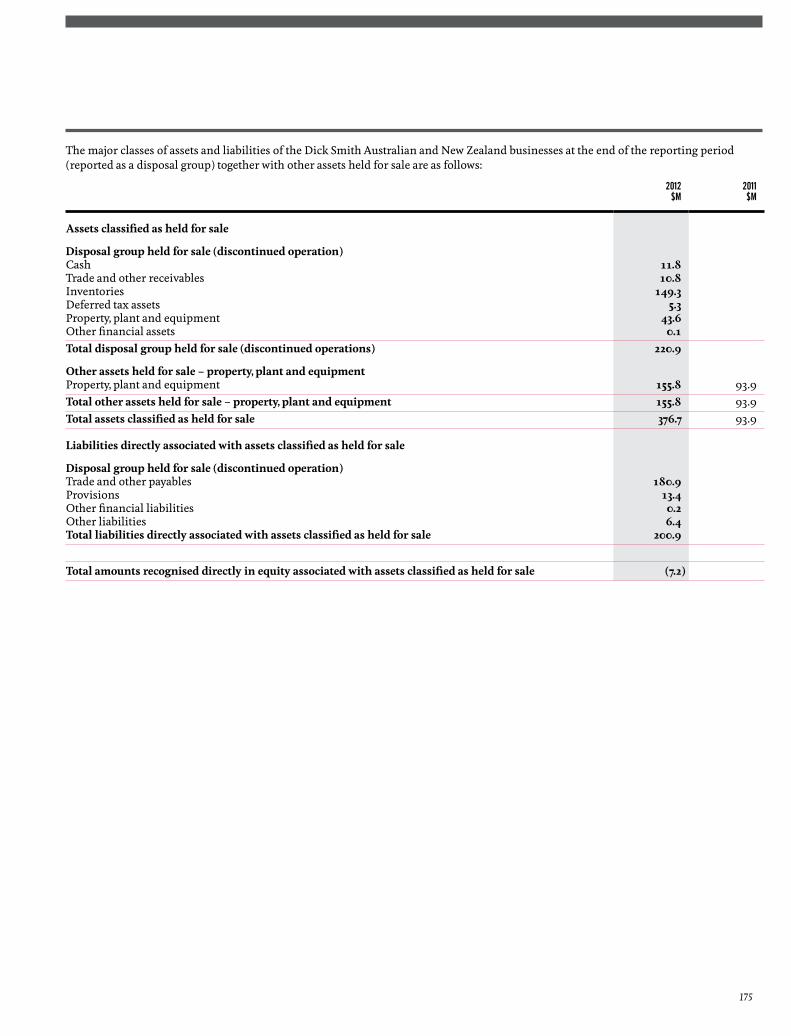
The major classes of assets and liabilities of the Dick Smith Australian and New Zealand businesses at the end of the reporting period (reported as a disposal group) together with other assets held for sale are as follows:
2012$M
2011$M
assets classified as held for sale
disposal group held for sale (discontinued operation)Cash 11.8Trade and other receivables 10.8Inventories 149.3Deferred tax assets 5.3Property, plant and equipment 43.6Other financial assets 0.1total disposal group held for sale (discontinued operations) 220.9
other assets held for sale – property, plant and equipmentProperty, plant and equipment 155.8 93.9total other assets held for sale – property, plant and equipment 155.8 93.9total assets classified as held for sale 376.7 93.9
liabilities directly associated with assets classified as held for sale
disposal group held for sale (discontinued operation)Trade and other payables 180.9Provisions 13.4Other financial liabilities 0.2Other liabilities 6.4total liabilities directly associated with assets classified as held for sale 200.9
total amounts recognised directly in equity associated with assets classified as held for sale (7.2)
175
The Directors declare that:
(a) in the Directors’ opinion, there are reasonable grounds to believe that the Company will be able to pay its debts as and when they become due and payable;
(b) in the Directors opinion, the attached financial statements are in compliance with International Financial Reporting Standards, as stated in Note 1 to the Financial Statements;
(c) in the Directors’ opinion, the attached Financial Statements and notes thereto are in accordance with the Corporations Act 2001, including compliance with accounting standards and giving a true and fair view of the financial position and performance of the consolidated entity; and
(d) the Directors have been given the declarations required by s.295A of the Corporations Act 2001.
At the date of this declaration, the Company is within the class of companies affected by ASIC Class Order 98/1418. The nature of the deed of cross guarantee is such that each company which is party to the deed guarantees to each creditor payment in full of any debt in accordance with the deed of cross guarantee.
In the Directors’ opinion, there are reasonable grounds to believe that the Company and the companies to which the ASIC Class Order applies, as detailed in Notes 28 and 29 to the Financial Statements will, as a group, be able to meet any obligations or liabilities to which they are, or may become, subject by virtue of the deed of cross guarantee.
Signed in accordance with a resolution of the Directors made pursuant to s.295(5) of the Corporations Act 2001.
On behalf of the Directors
James strong Grant o’Brien Chairman Managing Director and CEO
24 September 2012
DIRECTORS’ DECLARATION
WoolWorths limited AnnuAl report 2012176

INDEPENDENT AuDITOR’S REPORT
177

INDEPENDENT AuDITOR’S REPORT
WoolWorths limited AnnuAl report 2012178
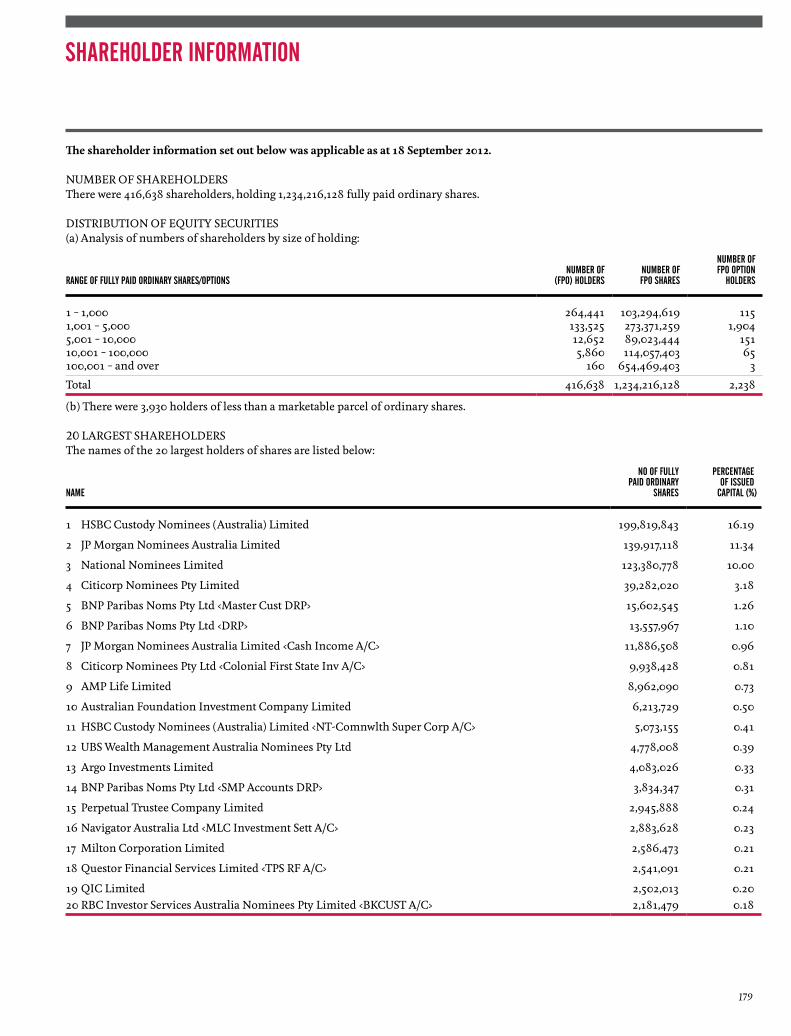
The shareholder information set out below was applicable as at 18 september 2012.
NUMBER OF SHAREHOLDERSThere were 416,638 shareholders, holding 1,234,216,128 fully paid ordinary shares.
DISTRIBUTION OF EQUITy SECURITIES(a) Analysis of numbers of shareholders by size of holding:
RANGE OF FuLLy PAID ORDINARy SHARES/OPTIONS NuMBER OF (FPO) HOLDERS
NuMBER OFFPO SHARES
NuMBER OFFPO OPTION
HOLDERS
1 – 1,000 264,441 103,294,619 1151,001 – 5,000 133,525 273,371,259 1,9045,001 – 10,000 12,652 89,023,444 15110,001 – 100,000 5,860 114,057,403 65100,001 – and over 160 654,469,403 3
Total 416,638 1,234,216,128 2,238
(b) There were 3,930 holders of less than a marketable parcel of ordinary shares.
20 LARGEST SHAREHOLDERSThe names of the 20 largest holders of shares are listed below:
NAME
NO OF FuLLyPAID ORDINARy
SHARES
PERCENTAGE OF ISSuED
CAPITAL (%)
1 HSBC Custody Nominees (Australia) Limited 199,819,843 16.19
2 JP Morgan Nominees Australia Limited 139,917,118 11.34
3 National Nominees Limited 123,380,778 10.00
4 Citicorp Nominees Pty Limited 39,282,020 3.18
5 BNP Paribas Noms Pty Ltd <Master Cust DRP> 15,602,545 1.26
6 BNP Paribas Noms Pty Ltd <DRP> 13,557,967 1.10
7 JP Morgan Nominees Australia Limited <Cash Income A/C> 11,886,508 0.96
8 Citicorp Nominees Pty Ltd <Colonial First State Inv A/C> 9,938,428 0.81
9 AMP Life Limited 8,962,090 0.73
10 Australian Foundation Investment Company Limited 6,213,729 0.50
11 HSBC Custody Nominees (Australia) Limited <NT-Comnwlth Super Corp A/C> 5,073,155 0.41
12 UBS Wealth Management Australia Nominees Pty Ltd 4,778,008 0.39
13 Argo Investments Limited 4,083,026 0.33
14 BNP Paribas Noms Pty Ltd <SMP Accounts DRP> 3,834,347 0.31
15 Perpetual Trustee Company Limited 2,945,888 0.24
16 Navigator Australia Ltd <MLC Investment Sett A/C> 2,883,628 0.23
17 Milton Corporation Limited 2,586,473 0.21
18 Questor Financial Services Limited <TPS RF A/C> 2,541,091 0.21
19 QIC Limited 2,502,013 0.2020 RBC Investor Services Australia Nominees Pty Limited <BKCUST A/C> 2,181,479 0.18
SHAREHOLDER INFORMATION
179

SUBSTANTIAL SHAREHOLDERSAs at 18 September 2012, there were no substantial shareholders in the Company that had provided substantial shareholding notices.
UNQUOTED EQUITy SECURITIESAs at 18 September 2012, there were 9,805,363 options granted over unissued ordinary shares in the Company to employees.
ANNUAL GENERAL MEETINGThe Annual General Meeting of Woolworths Limited will be held on Thursday, 22 November 2012 at 11am (Adelaide time) at the Adelaide Convention Centre, North Terrace, Adelaide SA 5000. Full details are contained in the Notice of Meeting which has been sent to all shareholders.
VOTING RIGHTSOn a show of hands at a General Meeting of the Company, every member present in person or by proxy shall have one vote and upon a poll each person present in person or by proxy shall have one vote for each ordinary share held.
SHAREHOLDER ENQUIRIESEnquiries and correspondence regarding shareholdings should be directed to Woolworths Limited Share Registrar, Computershare Investor Services Pty Limited, by telephone on 1300 368 664, by facsimile on (02) 8235 8150 or online via the Shareholder Centre on the Woolworths Limited website at www.woolworthslimited.com.au or by visiting the Computershare website at www.computershare.com.au.
EMPLOyEE SHAREHOLDER INFORMATIONFor information on Woolworths Limited employee shareholdings please contact:
Woolworths Shareholder Relations 1 Woolworths Way Bella Vista NSW 2153
Telephone: (02) 8885 1066, (02) 8885 1068 or (02) 8885 3081 Facsimile: (02) 8888 1066, (02) 8888 1068 or (02) 8888 3081
FINAL DIVIDENDThe final dividend of 67 cents per share will be paid on 12 October 2012 to shareholders entitled to receive dividends and registered on 14 September 2012 (Record Date).
DIRECT PAyMENT TO SHAREHOLDERS’ ACCOUNTSOn Woolworths Limited ordinary fully paid shares, dividends may be paid directly into bank, building society or credit union accounts in Australia and New Zealand. Payments are electronically credited on the dividend payment date and a dividend advice confirming deposit details can either be received electronically by shareholders or will be mailed on payment date.
WOOLWORTHS NOTESOn 15 September 2011, the Woolworths Notes I were redeemed in accordance with the terms of issue set out in the Trust Deed dated 3 April 2006. On 18 October 2011, the Company announced to the Australian Securities Exchange (ASx) an Offer of dated, unsecured, subordinated, cumulative notes at $100 each (Woolworths Notes II) and lodged with the Australian Securities and Investments Commission a prospectus for the Offer. Woolworths intended to raise $700 million with the ability to raise more or less. On 24 November 2011 the Company announced the successful completion of the offer raising $700,248,300.
DIVIDEND REINVESTMENT PLAN (DRP)The Rules of the Dividend Reinvestment Plan (DRP) remain in place and residual balances recorded in a participant’s DRP account are carried forward and applied to the next dividend. There is no DRP discount and there is a limit on DRP participation of 20,000 shares. There is currently no minimum number of shares required for participation.
SHAREHOLDER INFORMATION
WoolWorths limited AnnuAl report 2012180
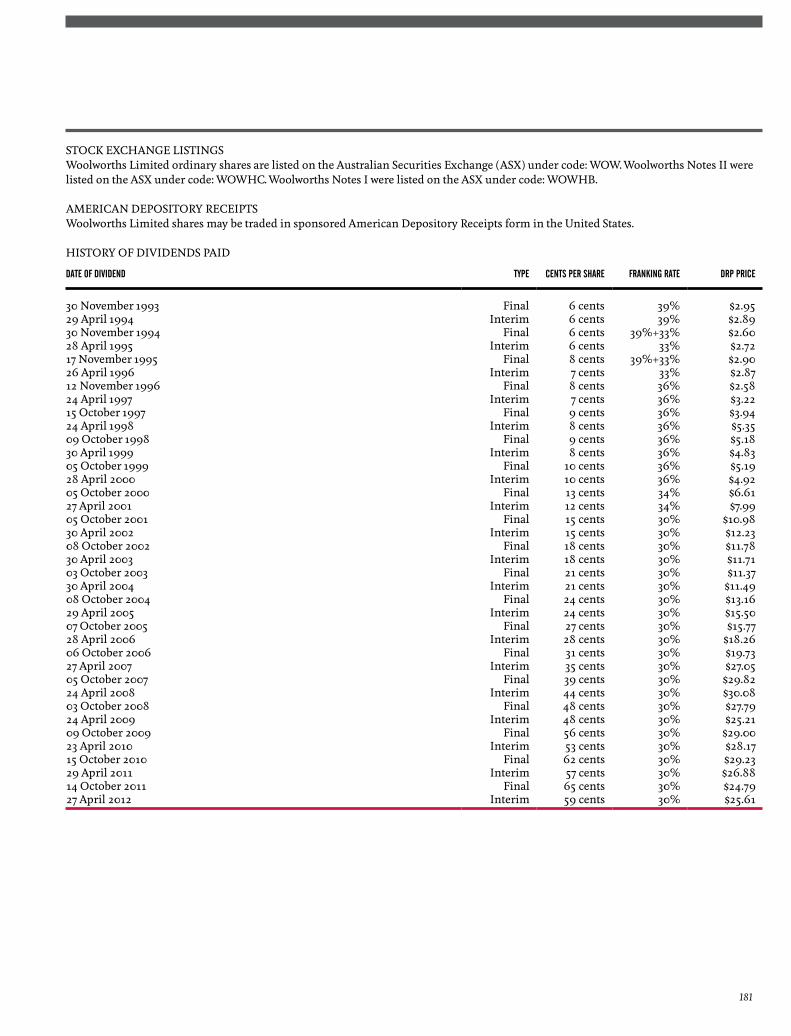
STOCK ExCHANGE LISTINGSWoolworths Limited ordinary shares are listed on the Australian Securities Exchange (ASx) under code: WOW. Woolworths Notes II were listed on the ASx under code: WOWHC. Woolworths Notes I were listed on the ASx under code: WOWHB.
AMERICAN DEPOSITORy RECEIPTSWoolworths Limited shares may be traded in sponsored American Depository Receipts form in the United States.
HISTORy OF DIVIDENDS PAID
DATE OF DIVIDEND TyPE CENTS PER SHARE FRANkING RATE DRP PRICE
30 November 1993 Final 6 cents 39% $2.9529 April 1994 Interim 6 cents 39% $2.8930 November 1994 Final 6 cents 39%+33% $2.6028 April 1995 Interim 6 cents 33% $2.7217 November 1995 Final 8 cents 39%+33% $2.9026 April 1996 Interim 7 cents 33% $2.8712 November 1996 Final 8 cents 36% $2.5824 April 1997 Interim 7 cents 36% $3.2215 October 1997 Final 9 cents 36% $3.9424 April 1998 Interim 8 cents 36% $5.3509 October 1998 Final 9 cents 36% $5.1830 April 1999 Interim 8 cents 36% $4.8305 October 1999 Final 10 cents 36% $5.1928 April 2000 Interim 10 cents 36% $4.9205 October 2000 Final 13 cents 34% $6.6127 April 2001 Interim 12 cents 34% $7.9905 October 2001 Final 15 cents 30% $10.9830 April 2002 Interim 15 cents 30% $12.2308 October 2002 Final 18 cents 30% $11.7830 April 2003 Interim 18 cents 30% $11.7103 October 2003 Final 21 cents 30% $11.3730 April 2004 Interim 21 cents 30% $11.4908 October 2004 Final 24 cents 30% $13.1629 April 2005 Interim 24 cents 30% $15.5007 October 2005 Final 27 cents 30% $15.7728 April 2006 Interim 28 cents 30% $18.2606 October 2006 Final 31 cents 30% $19.7327 April 2007 Interim 35 cents 30% $27.0505 October 2007 Final 39 cents 30% $29.8224 April 2008 Interim 44 cents 30% $30.0803 October 2008 Final 48 cents 30% $27.7924 April 2009 Interim 48 cents 30% $25.2109 October 2009 Final 56 cents 30% $29.0023 April 2010 Interim 53 cents 30% $28.1715 October 2010 Final 62 cents 30% $29.2329 April 2011 Interim 57 cents 30% $26.8814 October 2011 Final 65 cents 30% $24.7927 April 2012 Interim 59 cents 30% $25.61
181
2012
OCTOBER12 Payment date for final dividend Announcement of first quarter sales results
NOVEMBER22 Annual General Meeting Adelaide
2013
JANUARy/FEBRUARyAnnouncement of second quarter sales results Half year results announcement
MARCHRecord Date for interim dividend
APRILPayment of interim dividend Announcement of third quarter sales results
JULyAnnouncement of fourth quarter sales results
AUGUSTPreliminary full year results and final dividend announcement
Please note: the timing of events may be subject to change
SHAREHOLDERS’ CALENDAR
WoolWorths limited AnnuAl report 2012182

This page has been left blank intentionally.
183

This page has been left blank intentionally.
WoolWorths limited AnnuAl report 2012184
momentumWoolworths LimitedPrincipal registered office in Australia 1 Woolworths Way Bella Vista NSW 2153 Tel: (02) 8885 0000 Web: www.woolworthslimited.com.au
BIG WWeb: www.bigw.com.au
National SupermarketsWeb: www.woolworths.com.au
Woolworths PetrolTel: 1300 655 055 Web: www.woolworthspetrol.com.au
BWSWeb: www.beerwinespirits.com.au
Dan Murphy’s789 Heidelberg Road Alphington Vic 3078 Tel: (03) 9497 3388 Fax: (03) 9497 2782 Web: www.danmurphys.com.au
Dick Smith2 Davidson Street Chullora NSW 2190 Tel: (02) 9642 9100 Fax: (02) 9642 9111 Web: www.dicksmith.com.au
Progressive Enterprises Limited80 Favona Road Mangere 2024 Auckland New Zealand Tel: +64 (9) 275 2788 Fax: +64 (9) 275 3074 Web: www.progressive.co.nz
CellarmastersWeb: www.cellarmasters.com.au
Masters Home ImprovementWeb: www.masters.com.au
DanksWeb: www.danks.com.au
ALH Group Pty Ltd- Registered Office 1 Woolworths Way
Bella Vista NSW 2153 Tel: (02) 8885 0000 Web: www.alhgroup.com.au
- Victorian Office Ground Floor
16-20 Claremont Street South Yarra Vic 3141 Tel: (03) 9829 1000
- Queensland Office Level 1
152 Oxford Street Bulimba Qld 4171 Tel: (07) 3909 4800
Company SecretaryPeter Horton
Share RegistrarComputershare Investor Services Pty Limited Level 4 60 Carrington Street Sydney NSW 2000 Tel: 1300 368 664 Fax: (02) 8234 5050 Web: www.computershare.com.au
AuditorDeloitte Touche Tohmatsu 225 George Street Sydney NSW 2000 Tel: (02) 9322 7000 Web: www.deloitte.com.au
compAny diRectoRy
185

2012 AnnuAl RepoRt
www.woolwoRthslimited.com.Au