Embed Size (px)
Citation preview

2012
Agriculture economy
Employment and earnings
Agriculture labor market
H-2A and prevailing wages Irrigation and agriculture
AGRICULTURALWORKFORCE
Labor Market and Performance Analysis
December 2013

2012 Agricultural Workforce Report
Washington State Employment Security Department Dale Peinecke, commissioner
Labor Market and Performance Analysis Cynthia Forland, director Ernst W. Stromsdorfer, economist John H. Wines, economist
Published December 2013
This report was prepared in accordance with the Revised Code of Washington (RCW) 50.38.060.
This report and other agricultural and labor market information are available at esd.wa.gov/employmentdata or call our Labor Market Information Center at 800-215-1617.
“Green apples” Photo by ©Ghoststone/canstock.com“Apple picker” Photo by ©Jupiterimages/Comstock.com“Irrigation” Photo by ©David Gaylor/Dreamstime.com“Picking cherries” Photo by ©Linna Xu/iStock.co
The Employment Security Department is an equal-opportunity employer and provider of programs and services. Auxiliary aids and services are available upon request to people with disabilities. Washington Relay Service: 711.
LM-13-0371

2012 Agricultural Workforce Report December 2013Employment Security Department Page i
ContentsAcknowledgments .................................................................................................................................................... ii
Executive summary .................................................................................................................................................. iii
Chapter 1: The state of the agricultural economy .................................................................................................. 1
Chapter 2: Washington’s agricultural employment and average earnings ............................................................ 15
Chapter 3: Employment and unemployment in Washington’s agricultural labor market .................................... 33
Chapter 4: H-2A employment and the issue of hired labor shortages .................................................................. 39
Chapter 5: The impact of irrigation on agricultural production and employment ............................................... 53
Bibliography ............................................................................................................................................................ 61
Appendices .............................................................................................................................................................. 63
Glossary .................................................................................................................................................................... 75
December 2013 2012 Agricultural Workforce ReportPage ii Employment Security Department
AcknowledgmentsThe authors acknowledge the significant support and advice received in writing this report. Our thanks to all.
Robert Haglund and Donald Krug provided substantial contributions to the design, execution and interpretation of the report.
Any remaining errors are the responsibility of the authors.
Ernst W. Stromsdorfer, economist John H. Wines, economist

2012 Agricultural Workforce Report December 2013Employment Security Department Page iii
Executive summaryAgriculture is a key component of Washington state’s economy. Agricultural production was valued at $9.2 billion in 2011, comprising 2.6 percent of the state’s gross domestic product (GDP). Agriculture production value has increased significantly since the Great Recession, surpassing pre-recession levels for the first time in 2011. Agriculture produced an annual average of more than 88,000 jobs in 2012, almost half of which were seasonal. Farmworkers in Washington earned $2.1 billion in 2012 and almost 40,000 agriculture-related manufacturing workers earned an additional $1.7 billion.
The state is characterized by rich and varied soils and climate, plus extensive irrigation resources that yield over 300 diverse crops annually. Crops account for about 70 percent of production value, with the remainder consisting of specialty products and livestock and related products, such as milk. Washington is the leading producer of hops in the United States and has a reputation as a leader in the production of tree fruits – particularly apples, cherries and pears. While soil quality and climate are critical to production of these and other high-value crops in eastern Washington, irrigation was the catalyst that made these activities economically viable in that part of the state.
Washington state’s leadership in the production of numerous crops is reflected in the strength of its exports. More than one-third of Washington’s agricultural production by value is exported to other countries. Three commodities accounted for more than half of the $3.3 billion in agricultural exports in 2011: wheat, fresh fruits and processed fruits. While processed and fresh fruit exports increased by 17 and 21 percent, respectively, from 2010 to 2011, wheat exports increased by a hefty 70 percent. Most of the remainder of the state’s agricultural production is consumed in other states.
The effect of the H-2A guest worker program on seasonal worker shortages in WashingtonThe H-2A guest worker program is intended to alleviate shortages of seasonal agricultural workers. Thirty-three Washington-based growers were certified to contract with 3,953 H-2A workers in 2012. These workers accounted for 4.3 percent of the 92,840 peak seasonal employment during July.
Washington state growers have been reporting generalized shortages of workers beginning in August 2011. Peak shortages occurred in September of each year, corresponding to an overlap of the apple- and pear-picking seasons. Growers reported shortages of over 5,000 workers during the picking seasons, so although the H-2A program has helped alleviate seasonal shortages, it has not been able to fully accommodate the reported worker shortages.
Unemployment insurance claims by agricultural workers reflect the seasonal nature of agricultural employment in WashingtonUnemployment-insurance (UI) claims by agricultural workers increase significantly following the fruit-picking seasons, peak in January, then steadily decline through October (with a slight increase between fruit-picking seasons in late summer). For example, agriculture worker UI claims decreased from 6,099 in January 2012 to 1,267 in October, then rose to 5,785 in December. Nonfarm unemployment-insurance claims, on the other hand, show no discernible seasonal pattern.

December 2013 2012 Agricultural Workforce ReportPage iv Employment Security Department

2012 Agricultural Workforce Report December 2013Employment Security Department Page 1
Chapter 1: The state of the agricultural economyThis chapter describes the agricultural sector’s role in the overall economy of Washington state. The estimates for the current and inflation-adjusted dollar production values – both agricultural commodities and the costs associated with their production – are for calendar year 2011. Employment and earnings data in subsequent chapters are for calendar year 2012.
Agricultural output in quantity terms can vary considerably from year to year based on such factors as new orchard acreage, planting density per acre, the weather, product prices and demand. These complex growing and market conditions affect the demand for labor.1 For example, the national index of prices for fruits and nuts rose from 169 (December 2011) to 189 (December 2012), a change of 20 index points or an 11.8 percent increase year over year (Figure 1-3).
In many respects, especially with respect to the demand for seasonal labor, apple production dominates the infrastructure of the agricultural sector in Washington state. Washington apple growers increased production by 4 percent from 2009 through 2011, while prices received by growers increased by 24.3 percent per pound. This suggests an increase in apple demand greater than the increase in apple supply over the three-year period.
In contrast, sweet cherry production in Washington fell from 490 million pounds in 2009 to 400 million pounds in 2011. This 18.4 percent decrease coincided with a 154.7 percent increase in the average price per pound received by growers – $0.53 per pound in 2009 rising to $1.35 per pound in 2011. However, tart cherry production rose by 25.1 percent from 2009 to 2011, while prices received by growers dropped by 33.3 percent.2
The value of agricultural productionThe 2011 market value of agricultural production in Washington state reached a record of $9.2 billion, an increase of 15.5 percent over 2010. (See Figure 1-1.) Washington’s gross domestic product (GDP) increased 4.5 percent, to $355.1 billion over the same period.3
Figure 1-1 provides total value of agricultural production with and without the inclusion of government payments. Washington state’s total value of agricultural production plus government payments reached $9.4 billion in 2011.4 These government payments fall into two categories: commodity-related payments and conservation-related payments. Commodity-related payments target specific commodities and are designed to establish price and income support, stabilize production and provide a safety net for farmers. However, these payments do not represent increases in the value of agricultural production, since they are essentially transfer payments. Conservation-related payments also fall into two categories: land-retirement payments and working-land program payments. Land-retirement payments are made to remove environmentally sensitive acreage from production. Working-land program payments are made to address environmental problems, such as pesticide runoff, on acreage in active production. In summary, government payments do provide social benefits, both monetary and non-monetary.5
1 Local geographic variations in this seasonal timing for the demand for labor can lead to spot shortages in any given locale and for any given grower, even when the overall supply of labor is adequate for the statewide growing and harvesting season.
2 U.S. Department of Agriculture, Economic Research Service, “Fruit and Tree nuts Outlook,” FTS-353, September 27, 2012, Table 3, page 6, Table 10, page 20 and Table 11, page 22.
3 The source of the state gross domestic product (GDP) estimates is U.S. Department of Commerce, Bureau of Economic Analysis. “Widespread Economic Growth Across States in 2011,”News Release, BEA 12-22, June 5, 2012, Table 4. Contrasting estimates for 2010 compared to 2009 were 3.9 percent for state GDP and 11.5 percent for the value of agricultural production.
4 As used in this report, the total value of agricultural production does not include related government payments.5 The payments are, in effect, for “services rendered.” However, the economic value of those services is hard to measure and is not necessarily equal to the sum of government payments. The social economic value, the value to the public, of these services could be higher, lower or equal to the sum of government payments.
December 2013 2012 Agricultural Workforce ReportPage 2 Employment Security Department
Chapter 1 – The state of the agricultural economy
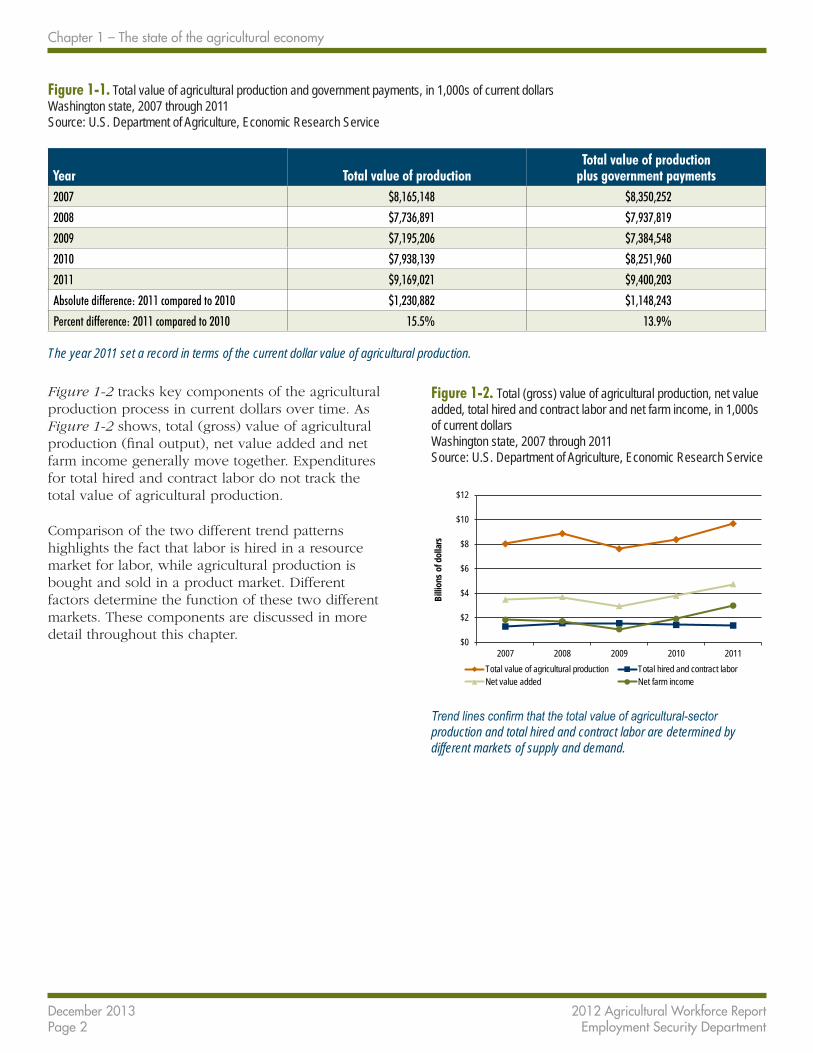
Figure 1-1. Total value of agricultural production and government payments, in 1,000s of current dollars Washington state, 2007 through 2011 Source: U.S. Department of Agriculture, Economic Research Service
Year Total value of productionTotal value of production
plus government payments2007 $8,165,148 $8,350,252
2008 $7,736,891 $7,937,819
2009 $7,195,206 $7,384,548
2010 $7,938,139 $8,251,960
2011 $9,169,021 $9,400,203
Absolute difference: 2011 compared to 2010 $1,230,882 $1,148,243
Percent difference: 2011 compared to 2010 15.5% 13.9%
The year 2011 set a record in terms of the current dollar value of agricultural production.
Figure 1-2 tracks key components of the agricultural production process in current dollars over time. As Figure 1-2 shows, total (gross) value of agricultural production (final output), net value added and net farm income generally move together. Expenditures for total hired and contract labor do not track the total value of agricultural production.
Comparison of the two different trend patterns highlights the fact that labor is hired in a resource market for labor, while agricultural production is bought and sold in a product market. Different factors determine the function of these two different markets. These components are discussed in more detail throughout this chapter.
Figure 1-2. Total (gross) value of agricultural production, net value added, total hired and contract labor and net farm income, in 1,000s of current dollars Washington state, 2007 through 2011 Source: U.S. Department of Agriculture, Economic Research Service
$0
$2
$4
$6
$8
$10
$12
2007 2008 2009 2010 2011
Billio
ns o
f dol
lars
Total value of agricultural production Total hired and contract laborNet value added Net farm income
Trend lines confirm that the total value of agricultural-sector production and total hired and contract labor are determined by different markets of supply and demand.

2012 Agricultural Workforce Report December 2013Employment Security Department Page 3
Chapter 1 – The state of the agricultural economy
Volatility in agricultural pricesAs discussed in previous years’ reports, the value of agricultural production depends on demand for and supply of agricultural products in both the United States and world markets. This is particularly true for Washington state, since more than a third of state agricultural production is exported to overseas markets, with most of the remaining two-thirds being exported to the other 49 states.6
Figure 1-3 shows recent changes in the price indices for a wide range of agricultural products. All products except commercial vegetables, dairy products and potatoes and dry beans show a gain in prices from 2011 to 2012. This reflects an increase in product demand, which then also reflects an increase in demand for agricultural labor, especially during harvest season.
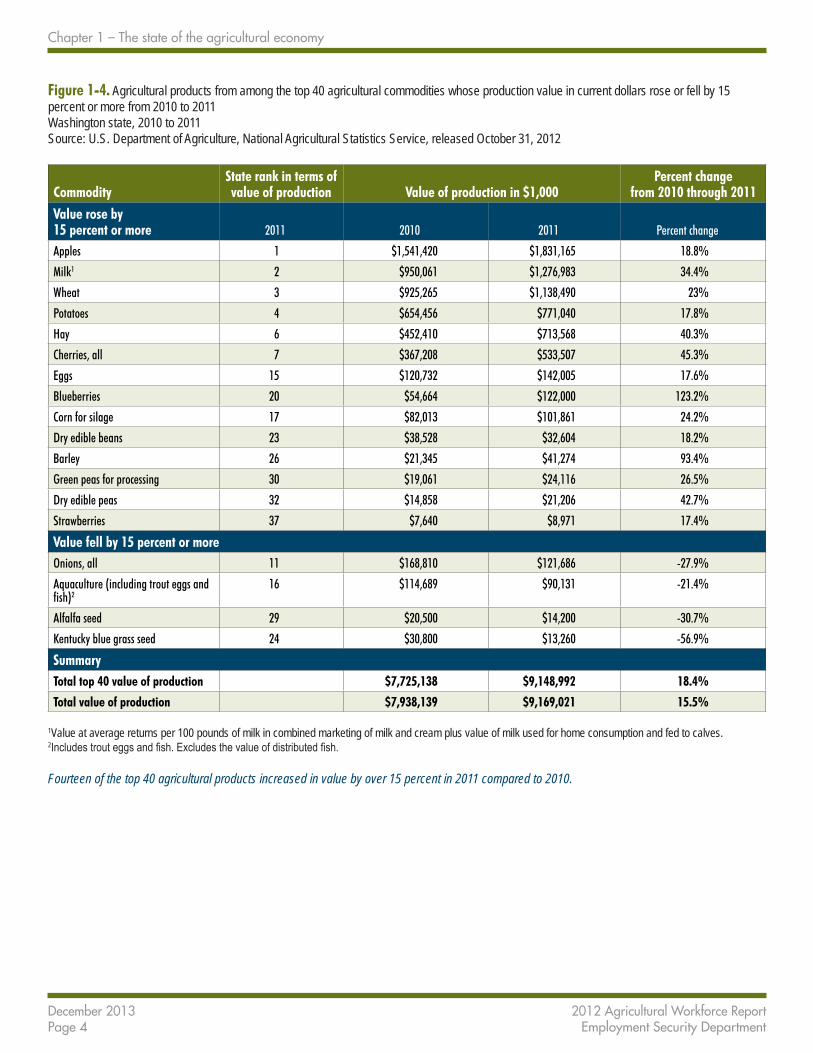
Year-over-year changes to the total value of agricultural production further highlight the changing situation of supply and demand for agricultural products as shown in Figure 1-4.
As in 2010, the crops and products that rose in value in 2011 included large value producers for agriculture, such as apples, milk, wheat, potatoes, hay and all cherry varieties. Apples rose by 18.8 percent, milk rose by 34.4 percent, wheat by 23 percent, potatoes by 17.8 percent, hay by 40.3 percent and all cherries by 45.3 percent. Only four crops and products of Washington’s top 40 products fell in value by 15 percent or more in 2011. These four comprised only $239 million of production value.
Figure 1-3. Index of agricultural prices received by farmers, base year 1990 through 1992 = 100 Washington state, 2007 through 2012 Source: U.S. Department of Agriculture, Agricultural Prices, ISSN: 1937-4216, released July 31, 2013
YearAll farm products All crops
Feed grains and hay
Fruits and nuts
Commercial vegetables
Potatoes and dry beans
Meat animals
Dairy products
Poultry and eggs
2007 136 142 152 158 158 126 118 146 140
2008 149 169 206 149 151 157 117 140 151
2009 131 151 162 140 161 150 106 98 139
2010 141 154 165 155 162 140 123 125 152
2011 178 204 253 169 169 171 151 154 152
2012 191 222 284 189 146 164 160 142 163
Since the base period 20 years ago, all agricultural commodities have risen in price, but all commodities show year-to-year volatility that adds to uncertainty in the production plans of agricultural producers.
6 Input-output analysis of total state GDP indicates that Washington’s foreign external trade has increased from an export level of 28.1 percent of total state GDP in 1963 to 38.2 percent in 2007. William B. Beyers and Ta-Win Lin, “The 2007 Washington Input-Output Study,” (2007 WA I-O), Table 1-2, page 6, August 2012.
December 2013 2012 Agricultural Workforce ReportPage 4 Employment Security Department
Chapter 1 – The state of the agricultural economy
Figure 1-4. Agricultural products from among the top 40 agricultural commodities whose production value in current dollars rose or fell by 15 percent or more from 2010 to 2011 Washington state, 2010 to 2011 Source: U.S. Department of Agriculture, National Agricultural Statistics Service, released October 31, 2012
CommodityState rank in terms of value of production Value of production in $1,000
Percent change from 2010 through 2011
Value rose by 15 percent or more 2011 2010 2011 Percent change
Apples 1 $1,541,420 $1,831,165 18.8%
Milk1 2 $950,061 $1,276,983 34.4%
Wheat 3 $925,265 $1,138,490 23%
Potatoes 4 $654,456 $771,040 17.8%
Hay 6 $452,410 $713,568 40.3%
Cherries, all 7 $367,208 $533,507 45.3%
Eggs 15 $120,732 $142,005 17.6%
Blueberries 20 $54,664 $122,000 123.2%
Corn for silage 17 $82,013 $101,861 24.2%
Dry edible beans 23 $38,528 $32,604 18.2%
Barley 26 $21,345 $41,274 93.4%
Green peas for processing 30 $19,061 $24,116 26.5%
Dry edible peas 32 $14,858 $21,206 42.7%
Strawberries 37 $7,640 $8,971 17.4%
Value fell by 15 percent or moreOnions, all 11 $168,810 $121,686 -27.9%
Aquaculture (including trout eggs and fish)2
16 $114,689 $90,131 -21.4%
Alfalfa seed 29 $20,500 $14,200 -30.7%
Kentucky blue grass seed 24 $30,800 $13,260 -56.9%
SummaryTotal top 40 value of production $7,725,138 $9,148,992 18.4%
Total value of production $7,938,139 $9,169,021 15.5%
1Value at average returns per 100 pounds of milk in combined marketing of milk and cream plus value of milk used for home consumption and fed to calves. 2Includes trout eggs and fish. Excludes the value of distributed fish.
Fourteen of the top 40 agricultural products increased in value by over 15 percent in 2011 compared to 2010.

2012 Agricultural Workforce Report December 2013Employment Security Department Page 5
Chapter 1 – The state of the agricultural economy
Figure 1-5. Percent change in value of production by commodity, 2011 compared to the average of the period 2004 through 2006, in current dollars Washington state, 2004 through 2006 and 2010 through 2011 Source: U.S. Department of Agriculture, National Agricultural Statistics Service
Agricultural commodity
2011average percent share of total
value of production
2004 through 2006 average percent share of total
value of production
Difference:2011 percent minus2004 through 2006
average percentField crops 35.3% 31.2% 4.1%
Fruits and nuts 27.3% 27.2% 0.1%
Commercial vegetables 5.2% 6% -0.8%
Berry crops 2.0% 1.2% 0.8%
Total crops 69.8% 65.7% 4.1%
Specialty products 4.1% 6.9% -2.8%
Livestock and products 26% 27.4% -1.4%
Commodity values in 2011 are similar to those in earlier periods.
Changes in the shares of agricultural commodities over timeFigure 1-5 provides detail on the changing share of production among agricultural commodities since the base period of 2004 through 2006. Crops comprised almost 70 percent of total agricultural production value in 2011, an increase of over four percentage points from the 2004 through 2006 period. Field crops accounted for most of this increased share, while fruits and nuts held steady at 27 percent. Livestock and products’ share decreased, but still accounted for more than a quarter of the state’s agricultural output by value.
The effect of changes in the total (gross) value of production on revenue sharesThe value of Washington state’s highly varied agricultural production is summarized as a yearly total value yield – total physical output multiplied by market price. The production components of this annual total value can be broken down as to both their source (e.g., wheat sales) and their recipients (e.g., hired labor or net farm income).
The year-to-year changes in the total value of production, as well as the changing mix in total value accruing each year to the state’s agricultural production, affect the returns to net value added, net farm income and total hired and contract labor, which are discussed in detail in this section. Figure 1-6 shows these relationships over the period 2007 through 2011. See Appendix Figure A1-1 for a detailed breakdown of agriculture-sector production expenses in Washington state in 2011.
Net value addedNet value added is the increase in the value of agricultural production due to the application of the agricultural producer’s resource inputs, such as the producer’s labor time spent in management and direct agricultural production, the producer’s capital and land and the labor that the producer hires.
Other factors of production purchased to facilitate agricultural production, such as gasoline, diesel fuel, electricity, fertilizer and seed, do not contribute to the net value added of agricultural production for that producer. Prior production processes of firms that supply needed inputs, such as fertilizer, capture the net value added of these purchased inputs and must be subtracted from the total (gross) value of agricultural production in order to measure the net contribution of Washington state agricultural producers due to the annual total value of production.

December 2013 2012 Agricultural Workforce ReportPage 6 Employment Security Department
Chapter 1 – The state of the agricultural economy
7 U.S. Department of Agriculture, Economic Research Service, Farm Sector Income & Finances, Farm Income and Wealth Statistics, “Value-Added to the U.S. Economy by the Agricultural Sector via the Production of Goods and Services, 1950 through 2011.”
8 U.S. Department of Agriculture, Economic Research Service, Data Sets, Farm Income and Wealth Statistics.
The percent of net value added generally corresponds with the changes in the total value of agricultural-sector production over the period 2007 through 2011. When the value of total production rises, net value added rises. When the value of total production falls, net value added falls.
For 2011, Washington’s net value added of 49.1 percent of the total value of agricultural production was greater than the net value added nationwide of 39.9 percent.7 Part of the reason was due to the relatively large amount of labor that Washington producers add to the production process. Much of the high-quality Washington agricultural output, such as apples, sweet cherries and pears is relatively labor intensive compared to, say, wheat production in Kansas. However, for 2011, in particular, it is notable that the share of total hired and contract labor as a percent of net value added dropped to 28.7 percent in 2011 compared to its 37.4 percent share in 2010. For 2011, the increase in both output and prices for Washington agricultural products was a major factor in explaining the increase in the share of net value added compared to earlier years (Figure 1-6).
Net farm incomeNet farm income is a component of net value added. It is the revenue left over for owners/operators after all expenses, including the cost of hired and contract labor, have been paid out of the revenue earned from final agricultural-sector production.
Statewide, net farm income in 2011 was $3 billion. Nationwide, net farm income in 2011 was $117.9 billion.8 Nationwide, net farm income as a percent of net value added equaled 70.7 percent. For Washington state, the comparable figure was 62.9 percent. This is another example of the effect of Washington’s labor-intensive crops.
Figure 1-6. The relationship between measures of agricultural production value, net value added, net farm income, labor costs and total costs of production, current dollars Washington state, 2007 through 2011 Source: U.S. Department of Agriculture, Economic Research Service
Production measures 2007 2008 2009 2010 2011Total value of agricultural-sector production in $1,000s1 $8,018,349 $8,857,011 $7,614,730 $8,362,851 $9,670,478
Net value added as a percent of total value of agricultural-sector production2 43.3% 44.7% 38.8% 45.2% 49.1%
Net farm income as a percent of net value added 52.5% 46.3% 36.1% 50.3% 62.9%
Total hired and contract labor as a percent of net value added 36.7% 42.2% 52.2% 37.4% 28.7%
Total hired and contract labor as a percent of the total value of production 15.9% 17.6% 20.3% 16.9% 14.1%
Total cost of production as a percent of the total value of production3 56.7% 58.3% 61.2% 54.8% 50.9%
Total hired and contract labor as a percent of the total costs of production3 28.1% 30.1% 33.1% 30.9% 27.7%
1Production value is revised annually for prior years, so these figures may not match those in earlier reports. 2Net Farm Income includes direct government payments. Final agricultural-sector output does not, since such payments are transfer payments and are not net additions to economic production. Exclusion of direct government payments will reduce these percentages somewhat. 3Total cost of production equals total value of agricultural-sector production minus net value added. Payments to labor are a part of net value added.
There is an inverse relationship between net farm income and total hired and contract labor as a percent of net value added.

2012 Agricultural Workforce Report December 2013Employment Security Department Page 7
Chapter 1 – The state of the agricultural economy
9 We include contract labor as a share of value added since the agricultural producer is hiring some management skills, which are labor search costs and accounting costs in this case, plus the direct agricultural labor provided by this labor. Source: U.S. Department of Agriculture, Economic Research Service, Farm Sector Income & Finances, “Income Statement for the Farm Sector, 2009-2013F” (F= forecast).
10 A discussion of the potential impact on farm businesses of recent tax reform discussions in Congress and the Obama Administration is available in: James M. Williamson, Ron Durst and Tracey Farrigan, The Potential Impact of Tax Reform on Farm Business and Rural Households,” USDA, Economic Research Service, Economic Information Bulletin Number 107, February 2013.
Total hired and contract laborTotal hired and contract labor is a share of net value added.9 Its percentage share of net value added rises as the total value of agricultural production falls, other things equal. Thus, in 2009, this share was a record high of 52.2 percent, but as the value of agricultural production rose in 2011 relative to 2009, the labor share fell to 28.7 percent. In contrast, for 2011, nationwide, the share of total hired and contract labor as a percent of net value added was only 16.2 percent. Similarly, the share of hired and contract labor as a percent of the total costs of production was 27.7 percent for Washington state in 2011, while the comparable nationwide estimate was 8.7 percent.
To summarize, these comparisons of the components of the total value of production reveal the relatively high proportion of labor used in Washington state’s agricultural sector. However, this higher labor share also contributes to a higher value added. Yet, for 2011, the increase in agricultural product demand was the major determinant of net value added for Washington state agriculture.
Other expensesAppendix Figure A1-1 provides detail on 33 diverse expense categories for 2011, in current dollars. These categories are not mutually exclusive; some represent sub-totals of other items. For 2011 current dollar total expenses incurred in agricultural-sector production, excluding operator dwellings was estimated to be $6,655.6 million.
Some of the proportionately large expense categories were:
• Hired and contract labor expenses – $1,363.1 million or 19.7 percent
• Farm origin expenses – $1,201.1 million or 17.4 percent
• Manufactured input expenses – $1,168.2 million or 17.6 percent
• Fertilizer and lime expenses, fuel and oil expenses and electricity expenses (expenses dependent, in whole or part, on the cost of hydrocarbon inputs) – $808.2 million or 11.7 percent
• Marketing, storage and transportation expenses – $804.9 million or 11.6 percent
• Capital consumption, including operator dwellings – $601.4 million or 8.7 percent
• Interest expenses, including operator dwellings – $260.4 million or 3.8 percent
• Property taxes, including operator dwellings – $210 million or 3.0 percent.10
Total labor expenses for Washington state equaled 19.7 percent of total expenses incurred in agricultural-sector production, excluding operator dwellings. The comparable percent for agricultural production nationwide was 12.4 percent in 2011.
An additional important fact is that, for Washington, contract labor was only 0.8 percent of total labor expenses in 2011. In contrast, for California, contract labor was 30.1 percent of total labor expenses and Oregon’s was 11.4 percent. In short, Washington growers do not rely heavily on contract labor as a fundamental source of labor supply.
December 2013 2012 Agricultural Workforce ReportPage 8 Employment Security Department
Chapter 1 – The state of the agricultural economy
11 Fiscal year 2013 agricultural exports are predicted to be $142 billion – an increase of 4.6 percent over fiscal year 2012. See: U.S. Department of Agriculture, Economic Research Service, “Outlook for U.S. Agricultural Trade,” AES-77, February 21, 2013. This report contains extensive detail on the composition of agricultural exports by commodity.
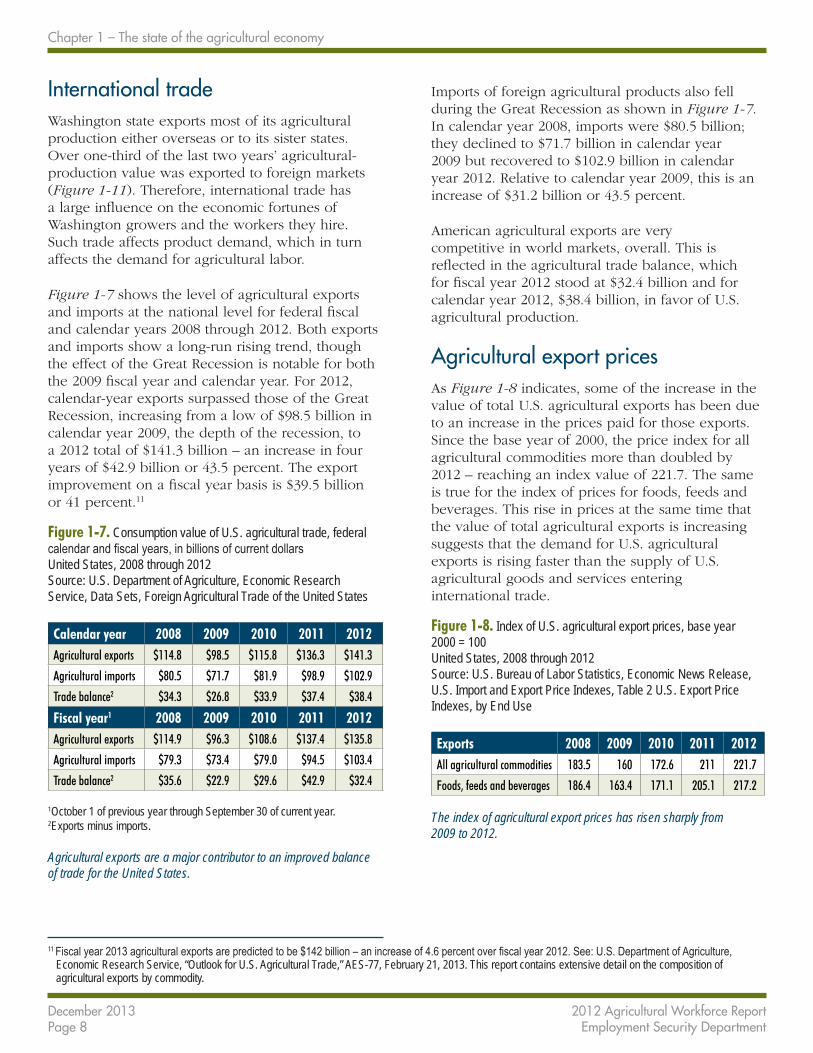
International tradeWashington state exports most of its agricultural production either overseas or to its sister states. Over one-third of the last two years’ agricultural-production value was exported to foreign markets (Figure 1-11). Therefore, international trade has a large influence on the economic fortunes of Washington growers and the workers they hire. Such trade affects product demand, which in turn affects the demand for agricultural labor.
Figure 1-7 shows the level of agricultural exports and imports at the national level for federal fiscal and calendar years 2008 through 2012. Both exports and imports show a long-run rising trend, though the effect of the Great Recession is notable for both the 2009 fiscal year and calendar year. For 2012, calendar-year exports surpassed those of the Great Recession, increasing from a low of $98.5 billion in calendar year 2009, the depth of the recession, to a 2012 total of $141.3 billion – an increase in four years of $42.9 billion or 43.5 percent. The export improvement on a fiscal year basis is $39.5 billion or 41 percent.11
Figure 1-7. Consumption value of U.S. agricultural trade, federal calendar and fiscal years, in billions of current dollars United States, 2008 through 2012 Source: U.S. Department of Agriculture, Economic Research Service, Data Sets, Foreign Agricultural Trade of the United States
Calendar year 2008 2009 2010 2011 2012Agricultural exports $114.8 $98.5 $115.8 $136.3 $141.3
Agricultural imports $80.5 $71.7 $81.9 $98.9 $102.9
Trade balance2 $34.3 $26.8 $33.9 $37.4 $38.4
Fiscal year1 2008 2009 2010 2011 2012Agricultural exports $114.9 $96.3 $108.6 $137.4 $135.8
Agricultural imports $79.3 $73.4 $79.0 $94.5 $103.4
Trade balance2 $35.6 $22.9 $29.6 $42.9 $32.4
1October 1 of previous year through September 30 of current year. 2Exports minus imports.
Agricultural exports are a major contributor to an improved balance of trade for the United States.
Imports of foreign agricultural products also fell during the Great Recession as shown in Figure 1-7. In calendar year 2008, imports were $80.5 billion; they declined to $71.7 billion in calendar year 2009 but recovered to $102.9 billion in calendar year 2012. Relative to calendar year 2009, this is an increase of $31.2 billion or 43.5 percent.
American agricultural exports are very competitive in world markets, overall. This is reflected in the agricultural trade balance, which for fiscal year 2012 stood at $32.4 billion and for calendar year 2012, $38.4 billion, in favor of U.S. agricultural production.
Agricultural export pricesAs Figure 1-8 indicates, some of the increase in the value of total U.S. agricultural exports has been due to an increase in the prices paid for those exports. Since the base year of 2000, the price index for all agricultural commodities more than doubled by 2012 – reaching an index value of 221.7. The same is true for the index of prices for foods, feeds and beverages. This rise in prices at the same time that the value of total agricultural exports is increasing suggests that the demand for U.S. agricultural exports is rising faster than the supply of U.S. agricultural goods and services entering international trade.
Figure 1-8. Index of U.S. agricultural export prices, base year 2000 = 100 United States, 2008 through 2012 Source: U.S. Bureau of Labor Statistics, Economic News Release, U.S. Import and Export Price Indexes, Table 2 U.S. Export Price Indexes, by End Use
Exports 2008 2009 2010 2011 2012All agricultural commodities 183.5 160 172.6 211 221.7
Foods, feeds and beverages 186.4 163.4 171.1 205.1 217.2
The index of agricultural export prices has risen sharply from 2009 to 2012.

2012 Agricultural Workforce Report December 2013Employment Security Department Page 9
Chapter 1 – The state of the agricultural economy
Figure 1-9. Top six U.S. agricultural export destinations, U.S. value, in billions of current dollars United States, calendar year 2008 through 2012 Source: U.S. Department of Agriculture, Economic Research Service, Data Sets, Foreign Agricultural Trade of the United States
2008 2009 2010 2011 2012Foreign total $114.8 Foreign total $98.5 Foreign total $115.8 Foreign total $136.4 Foreign total $141.3
Canada $16.3 Canada $15.7 China $17.5 Canada $19.0 China $26.0
Mexico $15.5 China $13.1 Canada $16.9 China $18.9 Canada $20.6
Japan $13.2 Mexico $12.9 Mexico $14.6 Mexico $18.3 Mexico $18.9
China $12.1 Japan $11.1 Japan $11.8 Japan $14.1 Japan $13.5
EU-27 $10.1 EU-27 $7.4 EU-27 $8.9 EU-27 $9.7 EU-27 $10.1
South Korea $5.6 South Korea $3.9 South Korea $5.3 South Korea $7.0 South Korea $6.0
China’s imports of U.S. agricultural commodities have increased by an average of 21.8 percent annually from 2008 through 2012.
Top U.S. agricultural export destinations and import sourcesFigure 1-9 presents the top six U.S. agricultural commodity export destinations from 2008 through 2012. These countries accounted for well over half of total agricultural exports in 2012.
Canada and China imported almost the same dollar amount of U.S. agricultural commodities in 2011. However, China, with its massive consumer base and the continual appreciation in the value of the yuan relative to the U.S. dollar, has since emerged as the leading importer of U.S. agricultural commodities. The quantity demanded of U.S. agricultural exports to China surged by 37.6 percent in one year between 2011 and 2012. Exports to Canada rose by 8.4 percent; exports to Mexico by 3.3 percent. Exports to Japan fell from 2011 to 2012 by 4.3 percent, even with the modest appreciation of the yen over that same period. The European Union-27 countries have consistently ranked in fifth place for the past five years. South Korea has consistently ranked in sixth place over this five-year period, importing $6.0 billion of U.S. agricultural goods in calendar year 2012. It remains to be seen what impact the new trade bill with South Korea will have.
Figure 1-10 shows the top five agricultural import sources for the United States from 2008 through 2012. The most notable aspect of this figure is that while Canada, the EU-27 and Mexico’s imports and exports of agricultural commodities are in approximate balance, China’s exports of agricultural commodities to the U.S. are only 17.3 percent of the agricultural commodities it imports from the United States. This imbalance reflects, in part at least, the comparative advantage the U.S. has in certain agricultural commodities relative to China, even though wage rates in China are considerably lower than in the United States.12
12 For an objective discussion of the differences in real wage rates for unskilled labor in America versus other nations, including China, see Orley Ashenfelter, “Comparing Real Wage Rates.” American Economic Review, Vol. 102, No. 2, 2012.

December 2013 2012 Agricultural Workforce ReportPage 10 Employment Security Department
Chapter 1 – The state of the agricultural economy
Figure 1-10. Top five U.S. agricultural import origins, U.S. value, in billions of current dollars United States, calendar year 2008 through 2012 United States, calendar year 2008 through 2012 Source: U.S. Department of Agriculture, Economic Research Service, Data Sets, Foreign Agricultural Trade of the United States
2008 2009 2010 2011 2012Foreign total $80.5 Foreign total $71.7 Foreign total $81.9 Foreign total $98.9 Foreign total $102.9
Canada $18.0 Canada $14.7 Canada $16.2 Canada $18.9 Canada $20.2
EU-27 $15.8 EU-27 $13.6 EU-27 $14.2 Mexico $15.8 EU-27 $16.6
Mexico $10.9 Mexico $11.4 Mexico $13.6 EU-27 $15.7 Mexico $16.4
China $3.5 China $2.9 China $3.4 Indonesia $4.2 India $5.4
Indonesia $2.8 Brazil $2.4 Brazil $2.9 Brazil $4.0 China $4.5
Canada and Mexico continue to be the top single-nation exporters of agricultural goods and services to the U.S. in 2012.
Detail on Washington agricultural commodity exports13
Figure 1-11 provides the dollar values for Washington exports from 2007 through 2011 for selected agricultural commodities. The export of fresh vegetables increased by 12.9 percent from 2010 to 2011. Processed vegetable exports increased by 17.7 percent. Fresh fruit exports increased by 17.2 percent year over year. Processed fruit exports increased by 20.5 percent. Other large year-over-year increases were wheat – 70.4 percent; corn – 42.2 percent; dairy – 38.1 percent; feeds and fodder – 27.8 percent; and beef and veal exports – 16.6 percent. Exports of oil cake and meal and vegetable oils remained unchanged year over year. The export of tree nuts declined by 11.1 percent, while the exports of plant seeds declined 23.9 percent. Other commodity exports declined by 9.3 percent.
13 For a discussion of how Washington state exports are estimated, see: Cassey, A.J., “The Collection and Description of Washington State Export Data,” Washington State University Extension Fact Sheet, FS006E, no date.
Economy-wide effects of the agricultural sector – input-output analysisThe Washington state input-output model provides a detailed picture of the state’s economic structure, including inter-industry linkages and the state economy’s dependence on U.S. domestic and international markets. The Input-Output Table provides estimates of the interdependence of industrial sectors in the state economy. Updated periodically, the latest input-output model is based on 2007 data.
The Input-Output Table reports the distribution of sales and purchases of each sector in the state economy. It reports business sales to industrial sectors and to final demand categories (households, investors and governments) located in Washington state, as well as to markets outside Washington state (exports to other parts of the U.S., to foreign countries and to the federal government). The table also identifies purchases made by sectors from Washington industries, payments of labor income and other value added and purchases made out of state.

2012 Agricultural Workforce Report December 2013Employment Security Department Page 11
Chapter 1 – The state of the agricultural economy
Figure 1-11. Value of Washington agricultural exports by selected commodity groups, based on share of production, in millions of current dollars1 Washington state, 2007 through 2011 Source: U.S. Department of Agriculture, National Agricultural Statistics Service, Economic Research Service, Foreign Agricultural Service, released October 31, 2012
Variables and commodity groups 2007 2008 2009 2010 2011
Absolute change2011 compared to
2010
Percent change2011 compared to
2010Value of agricultural-sector production
$8,165,148 $7,736,891 $7,195,206 $7,938,139 $9,169,021 $1,230,882 15.5%
Value of estimated foreign exports
$2,354,100 $2,775,300 $2,206,200 $2,658,600 $3,321,100 $662,500 24.9%
Exports as a percent of production value
28.8% 35.9% 30.7% 33.5% 36.2% 2.7% 8.1%
Commodity group exportedBeef and veal exports $38.1 $39.9 $42.2 $51.8 $60.4 $8.6 16.6%
Pork $1.2 $1.4 $1.4 $1.8 $1.9 $0.1 5.6%
Hides and skins $31.5 $25.8 $20.1 $29.0 $29.7 $0.7 2.4%
Dairy $89 $108 $63 $112 $154 $42.5 38.1%
Vegetables, fresh $108.1 $121.9 $119.7 $126.8 $143.2 $16.4 12.9%
Vegetables, processed $148.4 $197.6 $192.8 $197.4 $232.3 $34.9 17.7%
Fruits, fresh $497.7 $638.3 $502.3 $620.2 $726.9 $106.7 17.2%
Fruits, processed $329.5 $418.2 $321.4 $384.7 $463.7 $79 20.5%
Tree nuts $1.1 $1.4 $1.0 $0.9 $0.8 -$0.1 -11.1%
Wheat $595.5 $539.6 $328.7 $497.6 $847.7 $350.1 70.4%
Corn $17.4 $25.3 $15.2 $18.0 $25.6 $7.6 42.2%
Grain products, processed $29.5 $28.5 $26.1 $27.6 $29.9 $2.3 8.3%
Feeds and fodder $128.3 $171.1 $157.5 $218.5 $279.3 $60.8 27.8%
Oil cake and meal $0.2 $0.4 $0.4 $0.4 $0.4 $0.0 0.0%
Vegetable oils $0.3 $0.5 $0.4 $0.4 $0.4 $0.0 0.0%
Sugar $1.6 $1.6 $0.0 $0.0 $0.1 $0.1 not defined
Plant seeds $74.9 $99.4 $102.5 $87.2 $66.4 -$20.8 -23.9%
Other2 $261.8 $356.7 $311.8 $284.9 $258.3 -$26.6 -9.3%
1Estimates are based on cash receipts. On December 17, 2012, the calendar year (new series) state export data for several agricultural export categories were corrected. The values for feeds and fodders and for grain products were corrected for all states and all years. 2This group includes live animals, other meats, animal parts, eggs, wine, beer, other beverages, coffee, cocoa, hops, nursery crops, inedible materials and prepared foods.
Agricultural commodity exports increased in value by 24.9 percent from 2010 to 2011.

December 2013 2012 Agricultural Workforce ReportPage 12 Employment Security Department
Chapter 1 – The state of the agricultural economy
Figure 1-12 shows, for 2007, the economy-wide effect of the two components of the agricultural sector (crop and animal), plus the food, beverage and tobacco manufacturing sector and seven additional sectors related to the overall production of agriculture in the state. For crop production, we see that:
• Each $1 million of direct output in crop production results in 17.79 jobs.
• Each direct job in crop production results in 0.56 additional jobs created in the state (one direct-demand job plus 0.56 jobs due to indirect and induced demand).14
14 A recent estimate for the apple industry is 1.47. For potatoes, a recent estimate is 2.36. See: Globalwise Inc. and Belrose Inc., “The Washington Apple Industry: Contributions to the State Economy and the Important Role of Exports,” Vancouver, Washington and Pullman, Washington, respectively, August 29, 2012, Table 3, page 13; and, David Holland and Nick Beleiciks, “The Economic Impact of Potatoes in Washington State,” Washington State University, School of Economic Sciences, EB 1953E, 2006, Table 8, page 19.
Figure 1-12. Selected input-output multipliers Washington state, 2007 Source: Washington State Office of Financial Management, The 2007 Washington Input-Output Study (2007 WA I-O), August 2012
Industry sectors
Total jobsper $1 milliondirect output
Total employmentper direct job
Total dollardirect output
per dollarof final demand
Total labor incomeper dollar
of final demandAgriculture sectors1
Crop production 17.79 1.56 $1.96 $0.63
Animal production 15.4 2.16 $2.28 $0.67
Food, beverage and tobacco manufacturing 6.67 3.47 $1.78 $0.32
Agriculture-supporting sectorsAir transportation 5.91 2.84 $1.69 $0.33
Water transportation 8.73 3.29 $1.96 $0.50
Truck transportation 13.23 2.11 $2.10 $0.64
Support activities for storage, transportation and warehousing
13.6 2.63 $2.23 $0.72
Wholesale 9.6 2.18 $1.74 $0.55
Credit intermediation and related activities 8.5 4.22 $2.08 $0.49
Other finance and insurance 16.07 2.78 $2.52 $0.82
1See narrative preceding this figure for an explanation of how to interpret the coefficients in this figure. It is incorrect to compute a column average of any given set of estimates for any one of the four measures presented in this figure.
Crop production creates about 0.56 additional jobs for each direct job in crop production. The estimate for animal production is 1.16 additional jobs.
• Each dollar of direct output results in an additional $0.96 in final demand ($1.00 direct demand plus $0.96 indirect and induced demand).
• For each dollar of final demand, $0.63 of that dollar is labor income.
Although the values are different, the same components are provided for animal production and food, beverage and tobacco manufacturing in Figure 1-12.

2012 Agricultural Workforce Report December 2013Employment Security Department Page 13
Chapter 1 – The state of the agricultural economy
Agriculture-sector contribution to the state gross domestic productPolicymakers often need to know the total dollar effect of an economic sector on state gross domestic product (GDP). For every dollar of crop production, a total of 1.96 dollars in total dollar output is generated, including the dollar from crop production. Although the currently available input-output coefficients are for 2007, the following calculation is instructive, since the total contribution of agricultural production to the state economy is thereby estimated. For 2011, crop production contributed $6.4 billion directly to state GDP. Applying the multiplier of 1.96, the final dollar amount would be $12.6 billion. For animal production, the estimate would be $2.4 billion multiplied by 2.28 or $5.5 billion. The sum of these two effects for all agriculture on state GDP is an estimated $18.1 billion.
Other agriculture-sector effectsFigure 1-12 includes input-output data on other economic sectors that support agriculture. Total employment for each direct job created in selected support sectors is generally higher than that in either crop or animal production. It takes much less labor to generate $1 million of direct output in the food, beverage and tobacco manufacturing sector, for instance, compared to crop production or animal production. Total dollar output per dollar of final demand is lower than either crop or animal production. Finally, only $0.32 of every dollar of final demand goes to labor income.
Total jobs per $1 million of direct output vary considerably for the selected supporting industry sectors, ranging from a low of 5.91 (1 direct plus 4.91 indirect and induced) jobs for air transportation to a high of 16.07 total jobs in other finance and insurance.
Summary• The total value of agricultural production in
Washington reached a record of $9.2 billion in 2011, excluding government transfer payments.
• The prices of agricultural products continue to be volatile year over year. The overall price picture is one of price volatility along a rising price trend.
• The gradual change in the composition of Washington state agricultural commodities continued through 2011.
• Net value added as a percent of the gross value of production is higher for Washington state than for American agriculture nationwide, due to the state’s labor-intensive crops.
• Agricultural export prices have been rising as well as the total value of exports, suggesting a continuing increase in the demand for Washington state agricultural products.
• Canada, China and Mexico continue to be the largest importers of U.S. agricultural products for calendar year 2012. Each imported over $18 billion in U.S. agricultural products in 2012.
• Canada, the EU-27 and Mexico are the largest agricultural exporters to the United States.
• Washington state exports have increased for most commodity groups.
• Each one million dollars of agricultural output directly generates 17.79 jobs.
• Each agricultural job generates an additional 0.56 jobs.
• The sum of direct, indirect and induced demand due to the agricultural sector is estimated at $18 billion annually.

December 2013 2012 Agricultural Workforce ReportPage 14 Employment Security Department
Chapter 1 – The state of the agricultural economy

2012 Agricultural Workforce Report December 2013Employment Security Department Page 15
Chapter 2: Washington’s agricultural employment and average earningsWashington state’s agricultural economy operates within the context of the economies of the Pacific region of the United States, the United States as a whole and elements of the international economy. Its labor market is a complex composite, involving annual sources of labor supply from within the state, from Oregon and California, the rest of the United States and internationally, mainly from Mexico. A natural consequence to this labor market structure is the fact that the United States imports agricultural commodities in various conditions of preparation for U.S. consumer use. Thus, Washington growers and agricultural workers compete directly with international agricultural commodity and labor markets.
There are different sources and definitions for information on employment and earnings in the national economy and the state’s agricultural economy. Each measure provides a slightly different picture of the overall agricultural labor market in the state, the Pacific coast region and across the nation. Covered UI employment, often referred to as Quarterly Census of Employment and Wages data (QCEW), includes approximately 85 percent of all employers in the state and almost all agricultural employment in Washington. The data are based on business location and counts jobs, not employees. Local Area Unemployment Statistics (LAUS) data, on the other hand, are collected from households and include all employment reported at the place of residence.
We also publish total agricultural employment data that includes non-covered employment (Appendix Figure A2-1). These data provide a more complete picture of agricultural employment and includes hobby farms and any businesses that do agricultural
production but are not classified by industry code (NAICS15) as agricultural employers. Due to these facts, 51 percent of their revenue does not come from agricultural activities. We provide these different sources to more fully describe the agricultural economy in the state, since any one measure and its source may be deficient in explaining a particular labor market phenomenon. We have found that these complementary sets of data tend to move in the same direction at a given point in time even though the variable definitions (e.g., what is considered a “farm” business?) and the sample timing, sampling frames and sampling methods differ.
The average monthly agricultural employment in Washington16 rose from 81,573 workers in 2011 to 87,249 workers in 2012 – a 7 percent increase. Seasonal workers increased from a monthly average of 40,279 workers in 2011 to 43,881 in 2012 – an 8.9 percent increase in one year. Non-seasonal employment in the state increased from a monthly average of 41,294 workers in 2011 to 43,199 workers in 2012 – a 4.6 percent increase.
Regional and national agricultural employment17
The U.S. Department of Agriculture conducts a quarterly survey of farms to develop estimates of employment, hours worked and hourly wage rates.18
These data are not limited to employment that is covered by the unemployment-insurance program. Results are reported by region and nationally. Washington and Oregon are combined to make up the Pacific region. Although results for Washington cannot be singled out, these data do provide an important comparison at the regional and national levels.
15 See Glossary for a definition of NAICS.16 Employment Security Department/LMPA, Agricultural Employment and Wage survey. 17 The data in this section are based on the quarterly nationwide Farm Labor Survey conducted by the U.S. Department of Agriculture. An important characteristic of
this design is the designation of a “farm” – an agricultural entity that has at least $1,000 in sales in the given sample period. This definition of “farm” is different from the type of agricultural operation typically reported in this report, since much of the data in this report comes from farm operations that hire at least one worker who is covered by the unemployment-insurance program. Any agricultural producer who does not hire labor outside of the family is not represented, even if the producer has a significant quantity of output and sales.
18 The estimated hourly “wage rate” is actually total earnings divided by total hours worked. Therefore, the “wage rate” estimate includes the base hourly wage rate plus any bonuses, tips, etc. that are paid to the worker. It also includes piece-rate earnings converted to hourly rates.

December 2013 2012 Agricultural Workforce ReportPage 16 Employment Security Department
Chapter 2 – Washington’s agricultural employment and average earnings
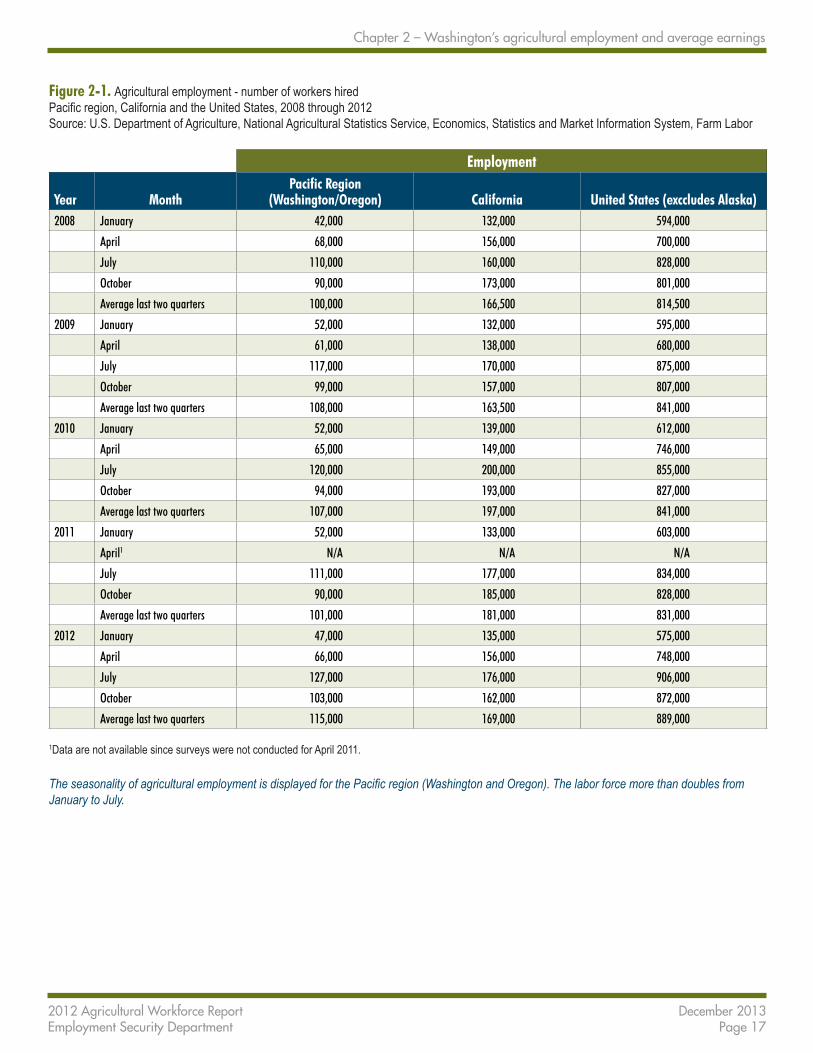
Figure 2-1 compares hired farm-labor employment19 in Washington and Oregon with California and the nation for the period 2008 through 2012. Hired farm labor includes seasonal workers hired by the grower. The time span picks up the recovery period of the Great Recession.
Washington/Oregon, California and the United States all experience seasonality, with the lowest employment occurring in the first quarter of each calendar year and the highest generally in the third quarter. California is distinct in that the highest employment levels sometimes occur in the fourth quarter. Given the heavy concentration of labor employed in both the third and fourth quarters, Figure 2-1 also includes the average of those two quarters for each year and region. Nationally, this average has been increasing over time, with the exception of 2010 when it was flat, and 2011 when it declined. The Pacific region (Washington and Oregon) experienced a similar pattern. California, on the other hand, experienced a large increase in 2010, followed by declines in 2011 and 2012.
Weekly hours workedFigure 2-2 shows that average weekly hours worked in California are consistently higher every year for the past five years compared to both the Pacific region and the United States. There is no consistent trend in average weekly hours worked for the Pacific region or the United States. There may be a pattern for all three geographic regions in relation to the Great Recession, however, with slightly fewer hours worked in the third and fourth quarters of 2009 than in other years.
19 The Farm Labor Survey distinguishes between hired farmworkers and agricultural service workers. Both perform agricultural work, but hired farmworkers are employed by the farm while agricultural service workers perform services on a contract or fee basis. The survey only collects information on agricultural services workers for California and Florida, so those data are not included in this report. Hired farmworkers also include supervisors.
20 It is important to note that higher average hourly earnings do not necessarily mean higher labor costs. Insofar as the wage rate measures the productivity of workers, higher average hourly earnings are an index of higher hourly productivity, other things equal.
Average hourly earningsEstimated average hourly earnings are total weekly earnings divided by total hours worked per week. Weekly earnings are a composite of the average hourly wage rate, piece rates and any bonuses, overtime, jury pay, etc. that a worker may receive. Average hourly earnings are often, but not always, lower in the first quarter of the year than they are in the remaining three quarters of the calendar year.
Figure 2-3 shows that livestock workers consistently earned more than field workers did across all geographic areas. Field workers in Washington/Oregon generally have higher average hourly earnings in the third and fourth quarters than do field workers in other areas.20
Comparing all agricultural workers in the fourth quarter of 2012 (October), those in Washington/Oregon earned 15.9 percent more than their counterparts in California and 15.6 percent more than their counterparts across the United States. These percentage differences can be due to labor supply factors, either labor demand factors or both.
2012 Agricultural Workforce Report December 2013Employment Security Department Page 17
Chapter 2 – Washington’s agricultural employment and average earnings
Figure 2-1. Agricultural employment - number of workers hired Pacific region, California and the United States, 2008 through 2012 Source: U.S. Department of Agriculture, National Agricultural Statistics Service, Economics, Statistics and Market Information System, Farm Labor
Employment
Year MonthPacific Region
(Washington/Oregon) California United States (exccludes Alaska)2008 January 42,000 132,000 594,000
April 68,000 156,000 700,000
July 110,000 160,000 828,000
October 90,000 173,000 801,000
Average last two quarters 100,000 166,500 814,500
2009 January 52,000 132,000 595,000
April 61,000 138,000 680,000
July 117,000 170,000 875,000
October 99,000 157,000 807,000
Average last two quarters 108,000 163,500 841,000
2010 January 52,000 139,000 612,000
April 65,000 149,000 746,000
July 120,000 200,000 855,000
October 94,000 193,000 827,000
Average last two quarters 107,000 197,000 841,000
2011 January 52,000 133,000 603,000
April1 N/A N/A N/A
July 111,000 177,000 834,000
October 90,000 185,000 828,000
Average last two quarters 101,000 181,000 831,000
2012 January 47,000 135,000 575,000
April 66,000 156,000 748,000
July 127,000 176,000 906,000
October 103,000 162,000 872,000
Average last two quarters 115,000 169,000 889,000
1Data are not available since surveys were not conducted for April 2011.
The seasonality of agricultural employment is displayed for the Pacific region (Washington and Oregon). The labor force more than doubles from January to July.

December 2013 2012 Agricultural Workforce ReportPage 18 Employment Security Department
Chapter 2 – Washington’s agricultural employment and average earnings
Figure 2-2. Average weekly hours worked in agricultural employment Pacific region, California and the United States, 2008 through 2012 Source: U.S. Department of Agriculture, National Agricultural Statistics Service, Economics, Statistics and Market Information System, Farm Labor
Average weekly hours worked
Year MonthPacific Region
(Washington/Oregon) California United States (excludes Alaska)2008 January 36 41 38
April 44 45 41
July 41 46 41
October 46 46 41
Average last two quarters 43 46 41
2009 January 38 41 38
April 38 44 40
July 40 46 40
October 38 42 39
Average last two quarters 39 44 39
2010 January 37 41 37
April 41 43 40
July 43 43 41
October 41 45 42
Average last two quarters 42 44 41
2011 January 36 42 39
April1 N/A N/A N/A
July 43 45 41
October 41 44 42
Average last two quarters 42 45 42
2012 January 39 43 40
April 42 40 39
July 43 45 40
October 44 47 42
Average last two quarters 44 46 41
1Data are not available since surveys were not conducted for April 2011.
There is no clear-cut year-over-year trend in average hours worked per week for the Pacific region.

2012 Agricultural Workforce Report December 2013Employment Security Department Page 19
Chapter 2 – Washington’s agricultural employment and average earnings
Figure 2-3. Average hourly earnings by type of agricultural labor,21 current dollars Pacific region (Washington/Oregon), California (CA) and the United States (U.S.), 2008 through 2012 Source: U.S. Department of Agriculture, National Agricultural Statistics Service, Economics, Statistics and Market Information System, Farm Labor
Average hourly earningsField workers only Livestock workers only Field and livestock workers All agricultural workers
Year MonthPacific region CA U.S.1
Pacific region CA U.S. 1
Pacific region CA U.S.1
Pacific region CA U.S.1
2008 January $9.94 $10.20 $9.67 $11.68 $10.70 $10.18 $10.14 $10.32 $9.88 $11.25 $11.56 $10.81
April $9.14 $10.00 $9.65 $11.34 $11.00 $10.24 $9.41 $10.16 $9.84 $10.00 $11.05 $10.57
July $9.85 $9.85 $9.66 $10.22 $11.00 $9.98 $9.87 $10.00 $9.74 $10.35 $10.74 $10.34
October $10.94 $9.95 $10.05 $10.54 $11.90 $10.21 $10.90 $10.22 $10.09 $11.37 $10.93 $10.70
2009 January $10.35 $9.80 $9.96 $9.48 $10.95 $10.27 $10.25 $10.09 $10.08 $11.40 $11.15 $10.93
April $10.67 $9.96 $9.99 $12.09 $10.93 $10.25 $10.80 $10.14 $10.07 $11.55 $11.07 $10.84
July $10.93 $10.10 $10.04 $11.77 $11.30 $10.05 $11.00 $10.30 $10.04 $11.43 $11.08 $10.66
October $11.07 $10.25 $10.25 $10.42 $11.05 $10.23 $11.00 $11.40 $10.24 $11.82 $11.25 $10.91
2010 January $9.77 $10.32 $10.10 $10.55 $11.24 $10.31 $9.95 $10.56 $10.18 $11.05 $11.68 $11.08
April $10.02 $9.96 $10.03 $11.73 $10.93 $10.30 $10.25 $10.16 $10.12 $11.18 $11.07 $10.82
July $10.65 $10.10 $10.09 $11.89 $11.10 $10.15 $10.75 $10.23 $10.11 $11.27 $11.12 $10.79
October $10.95 $10.20 $10.49 $10.97 $11.25 $10.28 $10.95 $10.35 $10.43 $11.59 $11.20 $11.13
2011 January $10.72 $9.98 $10.26 $11.53 $10.75 $10.52 $10.90 $10.14 $10.37 $11.80 $11.12 $11.30
April2 N/A N/A N/A N/A N/A N/A N/A N/A N/A N/A N/A N/A
July $10.82 $10.10 $10.27 $10.56 $10.90 $10.29 $10.80 $10.20 $10.28 $11.28 $10.90 $10.93
October $11.42 $10.15 $10.54 $11.78 $11.20 $10.67 $11.45 $10.30 $10.57 $12.04 $10.96 $11.15
2012 January $10.73 $10.08 $10.39 $12.58 $11.75 $10.96 $11.00 $10.42 $10.58 $11.85 $11.38 $11.52
April $10.85 $10.55 $10.50 $12.62 $11.85 $10.95 $11.04 $10.83 $10.62 $11.67 $11.81 $11.41
July $11.66 $10.75 $10.71 $12.15 $11.55 $10.89 $11.70 $10.85 $10.75 $12.10 $11.61 $11.36
October $13.49 $10.70 $11.22 $11.41 $11.50 $10.83 $13.30 $10.80 $11.13 $13.59 $11.73 $11.76
1United States excludes Alaska. 2Data are not available since surveys were not conducted for April 2011.
Average hourly earnings in the Pacific region are generally higher than in California and the United States as a whole, particularly during the third and fourth quarter harvest season.
21 Types of work identified in the survey include field, livestock, supervisors and other.

December 2013 2012 Agricultural Workforce ReportPage 20 Employment Security Department
Chapter 2 – Washington’s agricultural employment and average earnings
Figure 2-4. Full- and part-time agricultural employment, including agriculture and forestry support activities Washington state, 2002 through 2011 Source: U.S. Department of Commerce, Bureau of Economic Analysis, Regional Economic Accounts, Table SA-25N and SA-27N
Farm employment (jobs)Agriculture and
forestry support (jobs) activities
YearFarm proprietors
employment1Wage and salary
employmentTotal farm
employment2Wage and salary
employment
Total support activity
employment2002 34,547 44,116 78,663 15,809 20,063
2003 32,733 47,682 80,415 16,320 19,769
2004 31,561 42,139 73,700 16,969 20,550
2005 31,097 42,649 73,746 18,036 21,487
2006 30,089 43,496 73,585 18,775 22,102
2007 34,673 40,162 74,835 18,905 22,751
2008 34,699 47,163 81,862 18,531 22,495
2009 34,522 50,520 85,042 19,543 23,712
2010 34,526 48,899 83,425 18,931 23,044
2011 34,662 46,644 81,306 21,956 25,833
Percent change: 2011 compared to 2010 0.4% -4.6% -2.6% 16% 12.1%
1This variable measures the number of non-corporate farm operators, sole proprietors and partners who operate a farm that produces $1,000 or more of farm products per year. 2 Estimates are based on the 2002 and 2007 North American Industry Classification (NAICS). This variable is the number of workers engaged in the production of agricultural commodities, either livestock or crops, whether as a sole proprietor, partner or hired labor.
Agriculture and forestry support jobs have shown a steady increase over the past decade.
22 See: “State Personal Income and Employment Methodology,” U.S. Department of Commerce, Bureau of Economic Analysis, September 2012 (http://www.bea.gov/regional/pdf/spi2011.pdf).
Agricultural employment in Washington state
Full- and part-time employmentThe U.S. Department of Commerce’s Bureau of Economic Analysis (BEA) uses a combination of administrative records and census data to develop estimates of agricultural employment.22 The BEA calculates total employment estimates using proprietors’ reported employment and wage and salary employment, the latter of which is based on the Quarterly Census of Employment and Wages (QCEW). The QCEW in turn is based on unemployment-insurance program data. As with the U.S. Department of Agriculture data discussed in the
first part of this chapter, these estimates are not limited to employment that is covered by the unemployment-insurance program.
Figure 2-4 shows estimates of farm proprietor employment, wage and salary employment and total farm employment. The year-over-year changes for 2011 compared to 2010 show both percentage increases and decreases. Farm proprietor employment (jobs, not unique workers) increased only 0.4 percent while farm wage and salary employment decreased 4.6 percent and total farm employment decreased by 2.6 percent. Agriculture and forestry support jobs increased by 16 percent and total support activity employment increased by 12.1 percent. The increase in agriculture and forestry support jobs over the
2012 Agricultural Workforce Report December 2013Employment Security Department Page 21
Chapter 2 – Washington’s agricultural employment and average earnings
decade indicates an increase in the use of capital relative to labor and a possible substitution of this form of more capital-intensive labor service for regular farm employment, other things equal.
Appendix figures A2-2 through A2-8 provide detailed information on monthly agricultural employment by activity for each agricultural reporting area for 2012.
Seasonal and non-seasonal employmentGiven the seasonal nature of agricultural labor, the Washington State Employment Security Department conducts a monthly survey of agricultural employers to gather information on seasonal employment and wages.23 Figures 2-5 and 2-6 show seasonal, non-seasonal and total employment for 2011 and 2012, respectively, based on the monthly survey and the Quarterly Census of Employment and Wages (QCEW), which includes approximately 85 percent of all employment covered by unemployment insurance, including almost all agricultural employment.
On an annual basis, almost half of the state’s agriculture employment is seasonal in nature. Whereas non-seasonal employment shows little month-to-month variation, seasonal employment varies considerably, reflecting the crops grown in Washington.
The monthly pattern of seasonal and total employment has been bi-modal for a number of years – there are two peaks in the distribution of employment by month. The exact timing of this historical pattern varies somewhat from year to year, based largely on weather patterns as these patterns affect the apple, cherry and pear harvests, to name the key crops that drive most of the seasonal employment in the state.
The July peak represents the height of the sweet cherry harvest; the September/October peak represents the height of the apple harvest. In some years, the cherry peak occurs earlier in June, and the apple peak can occur in September as well as October. Weather patterns have an important effect on the timing of the demand and supply of migrant and seasonal labor and can result in local spot shortages and even statewide shortages in labor supply for specific crops.24
In 2011, a cool spring delayed the apple, cherry and pear harvests by as much as two weeks. In 2011, seasonal employment in June, the start of the sweet cherry harvest, was only 43,323 workers; in 2012 it was 65,940. In July 2011, peak seasonal employment was 86,020; in 2012 it was 94,976. The late harvest for cherries extended well into August in 2011, with 65,991 seasonal workers at that time.
Seasonal employment (jobs, not workers) during the fall pear and apple harvests peaked in October for the 2011 season and September for the 2012 season. In 2011, seasonal employment was 64,599, 66,516 and 33,133 for September, October and November, respectively. In contrast, over the same three months in 2012, employment was 67,717, 62,174 and 33,980, respectively.
23 See: Monthly Agriculture Employment and Wage Report, Employment Security Department/LMPA (https://fortress.wa.gov/esd/employmentdata/reports-publications/industry-reports/agricultural-employment-and-wage-report).
24 There is no theoretical economic definition of a shortage nor is there a nationally agreed-upon policy definition. When we refer to a “shortage” in this report, it means that growers have reported a shortage or it has been determined that wage rates have risen in an effort to bring forth more workers and eliminate the shortage.

December 2013 2012 Agricultural Workforce ReportPage 22 Employment Security Department
Chapter 2 – Washington’s agricultural employment and average earnings
Figure 2-6. Total, seasonal and non-seasonal agricultural employment, by month Washington state, 2012 Source: Employment Security Department/LMPA, Agricultural Employment and Wage survey
Jan Feb Mar Apr May Jun Jul Aug Sep Oct Nov DecSeasonal 18,393 19,608 23,858 27,443 33,197 65,940 94,976 64,914 67,717 62,174 33,980 17,903Nonseasonal 39,249 42,809 43,412 43,587 41,486 41,920 46,297 46,651 44,791 42,523 44,757 44,831Total 57,642 62,417 67,270 71,030 74,683 107,860 141,273 111,565 112,508 104,697 78,737 62,734
0
20,000
40,000
60,000
80,000
100,000
120,000
140,000
160,000
Empl
oym
ent
Average44,17543,52687,701
Seasonal labor demand for apples peaked in September of 2012, earlier than the slight October peak in 2011.
Figure 2-5. Total, seasonal and non-seasonal agricultural employment, by month Washington state, 2011 Source: Employment Security Department/LMPA, Agricultural Employment and Wage survey
Jan Feb Mar Apr May Jun Jul Aug Sep Oct Nov DecSeasonal 17,845 20,689 21,176 23,984 24,719 43,323 86,020 65,991 64,599 66,516 33,133 15,353Nonseasonal 37,889 39,882 41,476 41,781 41,396 41,624 43,132 41,671 42,325 43,557 39,060 41,736Total 55,734 60,571 62,652 65,765 66,115 84,947 129,152 107,662 106,924 110,073 72,193 57,089
0
20,000
40,000
60,000
80,000
100,000
120,000
140,000
Empl
oym
ent
Average40,27941,29481,573
The sweet cherry seasonal labor peak was in July; the seasonal labor peak for apples was in October.

2012 Agricultural Workforce Report December 2013Employment Security Department Page 23
Chapter 2 – Washington’s agricultural employment and average earnings
The regional distribution of agricultural employmentThe Employment Security Department’s monthly seasonal agriculture survey provides information on seasonal and non-seasonal agricultural employment by region.
The proportional geographic distribution of Washington state’s agricultural employment is shown in Figure 2-7. Year over year, the percentage distribution of agricultural employment in the 12 workforce development areas (WDAs) has been relatively stable. This is also true of the nine metropolitan divisions (MDs) and metropolitan statistical areas (MSAs). Five of the MDs and MSAs did not change their share of agricultural employment from 2011 to 2012. Of the four that did
change their share, changes were minimal – two differed year over year by 0.1 percentage point and the other two by 0.4 percentage points.
In 2012, four non-metropolitan counties employed 23 percent of the state’s agricultural employment: Grant, 10.1 percent; Okanogan, 6.1 percent; Skagit, 3 percent; and Walla Walla, 3.8 percent. In 2011, these same four counties employed a total share of 23 percent. Two MSAs, Yakima and Wenatchee, accounted for 39.7 percent of the state’s agricultural employment.
The state is divided into six agricultural growing regions for statistical reporting purposes, referred to as agricultural reporting areas. The regions are based on agricultural economic similarity. Some of these regions in eastern Washington
Figure 2-7. Total agricultural employment in percent by metropolitan division (MD), metropolitan statistical area (MSA) and county within the 12 workforce development areas (WDAs) Washington state, 2012 Source: Employment Security Department/LMPA; U.S. Bureau of Labor Statistics, Local Area Unemployment Statistics
Workforce development areas 08, 09 and 11 contain the bulk of seasonal and non-seasonal agricultural employment.

December 2013 2012 Agricultural Workforce ReportPage 24 Employment Security Department
Chapter 2 – Washington’s agricultural employment and average earnings
are geographically similar to the state’s workforce development areas. Because these agricultural reporting areas are more relevant to agricultural activity, we report sub-state data in the remainder of this chapter by these regions, which are displayed in Figure 2-8.
Appendix figures A2-2 through A2-8 provide detailed information on monthly agricultural employment by activity statewide and for each agricultural reporting area for 2012.
Seasonal employment by region and cropThe Employment Security Department’s monthly seasonal agriculture survey provides information on seasonal employment by crop and by region. Seasonal employment varies by crop and by region mainly due to weather in any given growing year. Over time, seasonal employment varies by crop composition due to changing demand and by technology, e.g., the number and variety of apple trees planted per acre and their method of planting.
Figure 2-9 shows seasonal agricultural employment by agricultural reporting area and crop for 2010, 2011 and 2012. Three reporting areas (South Central Area 2, North Central Area 3 and Columbia Basin Area 4) experienced growth in both 2011 and 2012, while the other three areas experienced a drop in seasonal employment in 2011 followed by growth in 2012. South Central Area 2 experienced the greatest absolute change in employment from 2010 to 2012 (2,861) as well as the greatest percentage change over the period (25.7 percent). Although the implementation of new technology could affect year-to-year changes, short-run variations are most likely due to weather effects.
Figure 2-8. Agricultural reporting areas 1 through 6 Washington state, 2012 Source: Employment Security Department/LMPA, Agricultural Employment and Wage survey
Agricultural reporting areas are more reflective of agricultural activity then are workforce development areas.

2012 Agricultural Workforce Report December 2013Employment Security Department Page 25
Chapter 2 – Washington’s agricultural employment and average earnings
Figure 2-9. Average annual seasonal agricultural employment by region and crop Washington state, 2012 compared to 2010 and 2011 Source: Employment Security Department/LMPA, Agricultural Employment and Wage survey
Areas and crops
2010average annual
seasonal employment
2011average annual
seasonal employment
2012 average annual
seasonal employment
2010 to 2012 change
2010 to 2012 percent change
2011 to 2012 change
2011 to 2012 percent change
State totals 39,375 40,282 44,176 4,801 12.2% 3,894 9.7%
Agricultural reporting area
Western Area 1 3,865 3,724 3,914 49 1.3% 190 5.1%
South Central Area 2 11,142 12,764 14,003 2,861 25.7% 1,239 9.7%
North Central Area 3 9,513 10,220 10,519 1,006 10.6% 299 2.9%
Columbia Basin Area 4 5,920 6,419 7,222 1,302 22% 803 12.5%
South Eastern Area 5 8,392 6,765 8,079 -313 -3.7% 1,314 19.4%
Eastern Area 6 543 390 439 -104 -19.2% 49 12.6%
Crop totals1
Apples 18,909 19,663 20,925 2,015 10.7% 1,261 6.4%
Cherries 6,213 6,685 7,973 1,760 28.3% 1,288 19.3%
Pears 1,705 1,560 1,207 -498 -29.2% -351 -22.6%
Other tree fruit 503 382 349 -154 -30.6% -33 -8.6%
Grapes 1,717 1,629 1,392 -325 -18.9% -237 -14.5%
Blueberries 500 726 651 151 30.2% -75 -10.3%
Raspberries 728 835 802 74 10.2% -33 -4.0%
Strawberries 368 335 186 -182 -49.5% -149 -44.5%
Hops 534 844 960 426 79.8% 116 13.7%
Nurseries 417 967 904 487 116.8% -63 -6.5%
Wheat/grain 462 414 332 -130 -28.1% -82 -19.8%
Asparagus 462 323 402 -60 -13% 79 24.5%
Onions 851 831 1,095 244 28.7% 264 31.8%
Potatoes 913 1,577 1,130 217 23.8% -447 -28.3%
Misc. vegetables 1,205 678 1,291 86 7.1% 613 90.4%
Other seasonal crops 3,056 2,791 4,504 1,448 47.4% 1,713 61.4%
1Some crop data is suppressed for confidentiality reasons.
Seasonal employment increased from 2010 to 2012, with apples and sweet cherries accounting for most of the increase.

December 2013 2012 Agricultural Workforce ReportPage 26 Employment Security Department
Chapter 2 – Washington’s agricultural employment and average earnings
Figure 2-10. Total firms, average monthly jobs and total annual and average annual before-tax earnings by industry, in current dollars Washington state, 2011 compared to 2009 and 2010 Source: Employment Security Department/LMPA; U.S. Bureau of Labor Statistics, Quarterly Census of Employment and Wages
Industry
2011numberof firms
2011total annual
earnings(the wage bill)
2011averagemonthly
jobs
2011average annual
earningsper job
2010average annual
earningsper job
Percentchange in
2011 earnings compared to 2010
Percent change in
2011 earnings compared to 2009
Production agriculture total 5,153 $1,599,695,287 73,990 $21,620 $20,974 3.1% 0.9%
Poultry and egg production 30 $17,592,649 600 $29,321 $27,990 4.8% -7.3%
Cattle ranching and farming 595 $133,022,194 4,552 $29,223 $29,259 -0.1% 1.5%
Other crop farming 776 $170,652,932 6,354 $26,858 $26,895 -0.1% 2.1%
Support activities for crop production 60 $379,027,546 15,824 $23,953 $24,578 -2.5% -1.4%
Greenhouse, nursery and floriculture 315 $74,247,888 4,342 $24,119 $23,987 0.5% 3.6%
Other animal production 91 $6,002,518 243 $24,702 $23,215 6.4% 4.2%
Vegetable and melon farming 226 $77,320,546 2,843 $27,197 $25,950 4.8% -2.8%
Support activities for animal production 167 $12,677,239 480 $26,411 $25,133 5.1% 10.8%
Oilseed and grain farming 830 $40,663,370 1,588 $25,607 $24,314 5.3% 13.3%
Fruit and tree nut farming 2,010 $667,337,334 36,388 $18,339 $17,138 7% 6.5%
Other industries 53 $21,151,071 776 $27,257 $26,889 1.4% -5.6%
Agriculture manufacturing total 1,332 1,905,839,196 45,931 $41,493 $39,188 5.9% 0.2%
Seafood product preparation and packaging 90 $388,130,389 7,058 $54,992 $51,201 7.4% 4.4%
Dairy product manufacturing1 * * * * * * *
Grain and oilseed milling1 * * * * * * *
Beverage manufacturing 332 $185,763,540 4,580 $40,560 $39,446 2.8% 1.5%
Animal food manufacturing 49 $30,928,765 710 $43,562 $40,058 8.7% 4.4%
Other food manufacturing 163 $157,379,841 4,061 $38,750 $37,895 2.3% 3.3%
Fruit and vegetable preserving and specialty 77 $423,971,193 10,898 $38,904 $38,596 0.8% 2.6%
Bakeries and tortilla manufacturing1 * * * * * * *
Animal slaughtering and processing 84 $164,657,281 4,822 $34,147 $35,311 -3.3% 1.5%
Sugar and confectionery product manufacturing1 * * * * * * *
Other industries 537 $555,008,187 13,802 $40,213 $33,563 19.8% 16.9%
1Not published due to confidentiality. *Totals are folded into “Other industries.”
In 2011, employment was 37.9 percent lower in agricultural manufacturing compared to production agriculture but average annual earnings were 47.9 percent higher.

2012 Agricultural Workforce Report December 2013Employment Security Department Page 27
Chapter 2 – Washington’s agricultural employment and average earnings
Viewing crop production over time yields a different view of the changing demand for labor. Crops showing a consistent increase in employed workers in the past three years were apples, cherries and hops. Blueberries, raspberries, nurseries and potatoes increased employment from 2010 to 2011, dropping in 2012 relative to 2011, but maintaining a higher employment level in 2012 compared to 2010. Crops showing a consistent decrease in production in the past three years were other tree fruits (peaches, nectarines, prunes and plums), pears, grapes, wheat/grain and strawberries. Asparagus, onions, miscellaneous vegetables and other seasonal crops declined in employment from 2010 to 2011 and then rose in 2012 relative to 2011.
Employment and earnings by industry The Quarterly Census of Employment and Wages provides data on agricultural employment and wages by industry sector. These data relate to employers who hire at least one worker who is covered by the unemployment-insurance program.
Based on this source, in 2011 there were 5,153 agricultural producers, a 5.1 percent decrease from 5,430 producers in 2010 (Figure 2-10). Monthly average employment increased by 4.1 percent, however, from 71,082 jobs in 2010 to 73,990 in 2011.25 The total wage bill also increased, from $1,511,097,697 in 2010 to $1,599,695,287 in 2011, a 5.9 percent increase. Average annual earnings per-job also increased, from $20,974 in 2010 to $21,620 in 2011, a 3.1 percent increase.26
The output from the Washington agricultural-production sector and agricultural imports from outside of Washington supply the agricultural-manufacturing sector. In 2011, 1,332 agricultural manufacturing firms employed an average of 45,931 workers per month. In 2010, there were 1,249 such firms employing an average monthly labor force of 39,574 workers over the calendar year. Thus, in one year both the number of firms increased as well as the number of jobs.27
25 See ESD/LMPA, 2011 Agricultural Workforce, Figure 2-11, page 22 for the 2010 data.26 See the 2011 Agricultural Workforce, Figure 2-11, page 22.27 See the 2011 Agricultural Workforce, Figure 2-11. Page 22..28 See the 2011 Agricultural Workforce, Figure 2-11. Page 22.29 See the 2011 Agricultural Workforce, Figure 2-11. Page 22.
The total wage bill for the agricultural-manufacturing sector in 2011 was considerably greater than that of production agriculture – $1.9 billion compared to $1.6 billion, respectively. In addition, average annual earnings in agricultural manufacturing were almost double that of average annual earnings in production agriculture – $41,493 versus $21,620.
For production agriculture by industry, average annual earnings show a mixed pattern of increases and decreases for 2011 compared to 2010. Average annual earnings rose in poultry and egg production, greenhouse, nursery and floriculture, other animal production, vegetable and melon farming, support activities for animal production, oilseed and grain farming, fruit and tree nut farming and all other industry sectors. Average annual earnings fell slightly in cattle ranching and farming, other crop farming and support activities for crop production.28
The highest average annual earnings in production agriculture were for workers in poultry and egg production followed by cattle ranching and farming, at $29,321 and $29,223, respectively. The lowest average annual earnings were for workers in fruit and tree nut farming, at $18,339. This earnings pattern has persisted for a number of years.
Comparing 2011 average annual earnings in agricultural manufacturing with those of 2010, we see a general rise in such earnings for 2011, the one exception being a 3.3 percent drop in annual earnings for animal slaughtering and processing. For agricultural manufacturing, the highest average annual earnings were for workers in seafood production preparation and packaging. These workers earned 32.5 percent more per year compared to the average worker in agricultural manufacturing – $54,992 compared to $41,493.29

December 2013 2012 Agricultural Workforce ReportPage 28 Employment Security Department
Chapter 2 – Washington’s agricultural employment and average earnings
Apples, cherries and pearsUnemployment-insurance program wage files provide data on agricultural employment and wages for specific crops. This is supplemented by the Employment Security Department’s monthly survey of growers to provide earnings estimates. The production of apples, cherries and pears dominates the demand for seasonal and migrant labor in Washington during the state’s long harvest season, as shown in Figure 2-9. Thus, the wage level and distribution in these three types of production are of particular concern to both the growers of these crops and the workers involved in their production.
Both current and inflation-adjusted measures are important to the grower. First, current wages measure how much – more, the same or less – the grower must pay to hire labor to produce a unit of output in the current growing and harvesting season. Given the crop quality and quantity, factors that interact with the weather over the growing and harvest season, will the grower need more or less cash to finance the labor needed? Second, inflation-adjusted dollars inform the grower as to whether the real cost of labor is rising, falling or staying constant over time.
Figures 2-11, 2-12 and 2-13 show the patterns of average hourly wages from 2006 through 2012 for the apple, cherry and pear peak harvest periods. Note that average hourly wages for the three fruit varieties are well above the state’s minimum wage, which was $9.04 in 2012.
Refer to Appendix Figure A2-9 for average hourly wage data from 2002 through 2012.
ApplesCurrent dollar average hourly before-tax earnings increased significantly from 2006 to 2007, fell less steeply from 2007 through 2010, but then surged upward through 2012. Measured in inflation-adjusted dollars, earnings were about the same in 2012 as in 2006.
Figure 2-11. Average hourly before-tax earnings, apple harvest, current and inflation-adjusted dollars Washington state, 2006 through 2012, fourth-quarter data Source: Employment Security Department/LMPA, Unemployment Insurance Wage File
$0$2$4$6$8
$10$12$14$16$18$20
2006 2007 2008 2009 2010 2011 2012
Earn
ings
Apples, current dollars Apples, inflation-adjusted dollars
The changes in apple harvest wages reflect changes in the supply and demand for harvest labor.
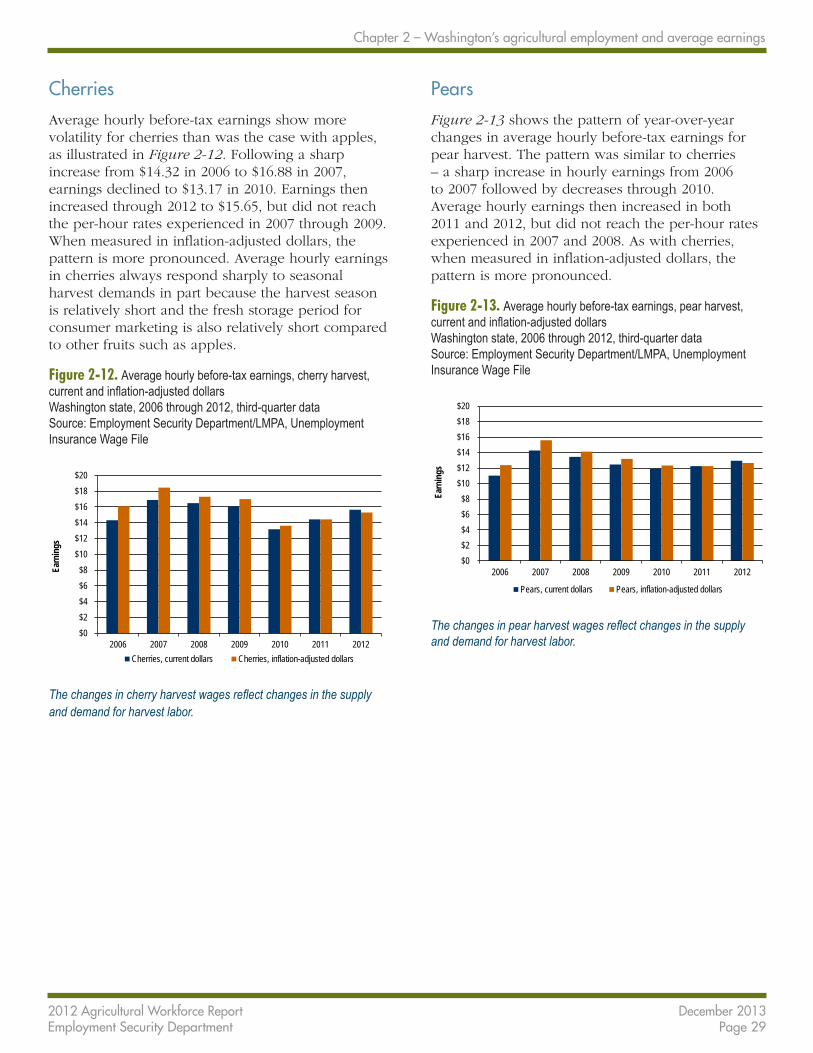
2012 Agricultural Workforce Report December 2013Employment Security Department Page 29
Chapter 2 – Washington’s agricultural employment and average earnings
CherriesAverage hourly before-tax earnings show more volatility for cherries than was the case with apples, as illustrated in Figure 2-12. Following a sharp increase from $14.32 in 2006 to $16.88 in 2007, earnings declined to $13.17 in 2010. Earnings then increased through 2012 to $15.65, but did not reach the per-hour rates experienced in 2007 through 2009. When measured in inflation-adjusted dollars, the pattern is more pronounced. Average hourly earnings in cherries always respond sharply to seasonal harvest demands in part because the harvest season is relatively short and the fresh storage period for consumer marketing is also relatively short compared to other fruits such as apples.
Figure 2-12. Average hourly before-tax earnings, cherry harvest, current and inflation-adjusted dollars Washington state, 2006 through 2012, third-quarter data Source: Employment Security Department/LMPA, Unemployment Insurance Wage File
$0$2$4$6$8
$10$12$14$16$18$20
2006 2007 2008 2009 2010 2011 2012
Earn
ings
Cherries, current dollars Cherries, inflation-adjusted dollars
The changes in cherry harvest wages reflect changes in the supply and demand for harvest labor.
PearsFigure 2-13 shows the pattern of year-over-year changes in average hourly before-tax earnings for pear harvest. The pattern was similar to cherries – a sharp increase in hourly earnings from 2006 to 2007 followed by decreases through 2010. Average hourly earnings then increased in both 2011 and 2012, but did not reach the per-hour rates experienced in 2007 and 2008. As with cherries, when measured in inflation-adjusted dollars, the pattern is more pronounced.
Figure 2-13. Average hourly before-tax earnings, pear harvest, current and inflation-adjusted dollars Washington state, 2006 through 2012, third-quarter data Source: Employment Security Department/LMPA, Unemployment Insurance Wage File
$0$2$4$6$8
$10$12$14$16$18$20
2006 2007 2008 2009 2010 2011 2012
Earn
ings
Pears, current dollars Pears, inflation-adjusted dollars
The changes in pear harvest wages reflect changes in the supply and demand for harvest labor.

December 2013 2012 Agricultural Workforce ReportPage 30 Employment Security Department
Chapter 2 – Washington’s agricultural employment and average earnings
Average and median hourly before-tax earnings for selected agricultural commoditiesFigure 2-14 shows current dollar average and median hourly before-tax earnings for selected agricultural commodities. These data are based on the Unemployment Insurance Wage File.30 Statistical significance tests revealed that average hourly earnings for each agricultural commodity included in the table were significantly different from the all-agriculture estimate.
Workers in all agricultural industries earned an average of $14.14 per hour before taxes. However, half of all agricultural workers earned $13.38 or less
Figure 2-14. Average and median hourly before-tax earnings3 by selected agricultural commodities, current dollars Washington state, 2012 Source:Employment Security Department/LMPA, Unemployment Insurance Wage File
NAICS Agricultural commoditiesNumber
of growers
Averagebefore-tax
hourly earnings
Medianbefore-tax
hourly earning 111331 Apples1 879 $12.65 $12.70
111339 Non-apple tree fruit2 998 $13.17 $13.86
111332 Grapes 239 $14.56 $11.00
111140 Wheat 779 $16.17 $15.02
111211 Potatoes 112 $16.12 $14.38
111219 Vegetables 221 $13.74 $11.62
111421, 111422 Nursery and floriculture 282 $13.81 $11.99
1119 Other crop farming 559 $13.28 $13.50
112 Animal production 760 $15.85 $13.88
1151 Support activities for crop production 296 $13.31 $14.16
1152 Support activities for animal production 153 $15.86 $13.98
111, 112, 1151, 1152 All agriculture 5,726 $14.14 $13.38
1Includes some employers that also grow non-apple tree fruit. 2Includes some employers that also grow apples. 3Based on full-time equivalent of 173.3 hours per month.
Average and median hourly before-tax earnings differed by industry.
30 The average hourly earnings estimate includes the base hourly rate of pay plus any additional bonuses, tips or other money payments made to the worker during the pay period in question.
per hour, the median hourly before-tax earnings rate. The highest average hourly earnings are for wheat workers, at $16.17 per hour, followed by potato workers at $16.12 per hour.
Apple workers, the lowest paid workers, earned $12.65 per hour while non-apple tree fruit workers earned $13.17. Note that half of all non-apple tree fruit workers earned $13.86 or more per hour, in contrast to apple workers, half of whom earned $12.70 or more per hour.

2012 Agricultural Workforce Report December 2013Employment Security Department Page 31
Chapter 2 – Washington’s agricultural employment and average earnings
Annual hours and months worked for selected agricultural commoditiesFigure 2-15 shows average and median annual hours and months worked for selected agricultural commodities in 2012. Statistical significance tests were conducted for each average hours estimate relative to average annual hours worked for agriculture overall. Note that the hourly estimate for workers in each of the commodities was statistically significantly different from the all agriculture average. In addition, median hours worked annually were always lower than average annual hours worked, except for other crop farming.
Figure 2-15. Median and average annual hours and months per worker by selected agricultural commodities Washington state, 2012 Source:Employment Security Department/LMPA, Unemployment Insurance Wage File
NAICS Agricultural commoditiesNumber
of growersAverage
annual hoursMedian
annual hoursAverage annual months worked3
111331 Apples1 879 854 495 4.9
111339 Non-apple tree fruit2 998 687 282 4.0
111332 Grapes 239 1,086 697 6.3
111140 Wheat 779 1,142 1,041 6.6
111211 Potatoes 112 1,423 1,349 8.2
111219 Vegetables 221 1,261 918 7.3
111421, 111422 Nursery and floriculture 282 1,382 992 8.0
1119 Other crop farming 559 1,170 1,301 6.7
112 Animal production 760 1,837 1,494 10.6
1151 Support activities for crop production 296 1,161 1,109 6.7
1152 Support activities for animal production
153 1,218 1,173 7.0
111, 112, 1151, 1152 All agriculture 5,726 997 799 5.8
1Includes some employers that also grow non-apple tree fruit. 2Includes some employers that also grow apples. 3Based on full-time equivalent of 173.3 hours per month.
Both average and median annual hours worked varied widely among different agricultural commodities.
For all agricultural industries, workers averaged 997 hours in 2012, equivalent to 5.8 months. Non-apple tree fruit and apple workers put in the fewest hours per worker, equivalent to 4.9 months per year. On the other hand, workers in animal production put in an average of 1,837 hours annually – at an equivalent of 10.6 months, effectively full time.

December 2013 2012 Agricultural Workforce ReportPage 32 Employment Security Department
Chapter 2 – Washington’s agricultural employment and average earnings
Summary• The average monthly agricultural employment
in Washington increased from 81,573 workers in 2011 to 87,249 workers in 2012.
• Seasonal agricultural workers in Washington increased by 8.9 percent from 2011 to 2012.
• Overall, average hourly earnings in agriculture were higher for Washington/Oregon than for California and the United States overall.
• The seasonal pattern in employment has changed slightly from 2012 compared to 2011, largely reflecting seasonal weather patterns.
• The regional distribution of agricultural labor in Washington for 2012 continues to remain relatively stable, consistent with earlier years.
• Seasonal workers in apples, cherries and pears account for the majority of seasonal employment in Washington agriculture.
• Workers in agriculture manufacturing earn about twice as much annually as do workers in production agriculture.
• Average hourly before-tax earnings in the three principle fruit harvests (apple, cherry and pear) increased from 2010 through 2012.
• For 2012, workers in all agricultural industries earn an average of $14.14 per hour; one half of these workers earn $13.38 or less.
• Wheat and potato workers have the highest average hourly wage rate; apple workers have the lowest.
• Overall, agricultural workers averaged 997 hours per year or an estimated 5.8 months. Workers in animal production have the highest hours and months worked; workers in non-apple tree fruit have the lowest.

2012 Agricultural Workforce Report December 2013Employment Security Department Page 33
Chapter 3: Employment and unemployment in Washington’s agricultural labor marketEvery month, the federal Bureau of Labor Statistics (BLS), in conjunction with the Census Bureau, surveys households to learn whether residents are employed, unemployed and looking for work, or out of the labor force – not working and not looking for work. These survey data are used to create the Local Area Unemployment Statistics (LAUS) report, including monthly estimates of the labor force, employment and unemployment levels. Unemployment rates are calculated statewide, by county, metropolitan divisions (MDs) and metropolitan statistical areas (MSAs). The LAUS database includes individuals not covered by the unemployment-insurance program, such as the self-employed, non-paid family members and undocumented workers. LAUS is the source of the employment data included in Figure 3-1.
The data reported in figures 3-2, 3-3 and 3-4, include unemployed individuals who are receiving unemployment benefits. The unemployment-insurance program covers almost all agricultural employment in Washington.
Seasonal shifts in the employed labor forceFigure 3-1 compares the level of January employment to employment during the peak employment month for metropolitan areas, including two with high levels of agricultural activity (Wenatchee MSA and Yakima MSA) and six non-metropolitan agricultural counties for 2010 through 2012. Comparing agricultural MSAs and counties to non-agricultural metropolitan areas reveals the effects of agricultural activity on employment patterns:
• Employment during peak employment months is much higher than January employment in agricultural MSAs and counties compared to non-agricultural areas.
• The peak month for employment was always between June and October in agricultural areas and counties, but never in the late spring or summer in non-agricultural areas.
Key agricultural countiesAll six agricultural counties increased workers from January levels during each of these years. Depending upon the year, agricultural commodity and weather, the peak employment month ranged from June to October. Okanogan county had the largest percentage shift in employment for each of the three years, ranging from a three-year high of 56.2 percent in 2012 to a three-year low of 47.4 percent in 2011. Skagit County had the lowest percentage shift ranging from 5.3 percent in 2010 to 3.6 percent in 2011.
MDs and MSAsFrom 2010 through 2012, the eight MDs and MSAs supplied over 2,400,000 employed workers to the state economy during their peak employment months. The six non-agricultural metropolitan areas had a much higher component of nonfarm employment than did the two agricultural MSAs and six agricultural counties. Seasonal hiring is less of a factor affecting employment for these areas.
Variation between January and the peak month was never more than three percent for the six non-agricultural MDs and MSAs. On the other hand, peak employment increased much more in agricultural MSAs, as much as 36.2 percent for the Wenatchee MSA and 23.3 percent for the Yakima MSA.

December 2013 2012 Agricultural Workforce ReportPage 34 Employment Security Department
Figure 3-1. Total employment for January and peak labor-force participation month, selected counties, metropolitan divisions (MD) and metropolitan statistical areas (MSA), not seasonally adjusted Washington state, 2010 through 2012 Source: Employment Security Department/LMPA; U.S Bureau of Labor Statistics, Local Area Unemployment Statistics
January and peak month employment2010 2011 2012
Agricultural areas
January empl.
Peak month
Peak monthempl.
Percent change2010
January empl.
Peak month
Peak monthempl.
Percent change2011
January empl.
Peak month
Peak monthempl.
Percent change 2012
Key agricultural countiesBenton 84,100 6 94,030 11.8% 86,770 7 93,580 7.8% 84,320 6 91,410 8.4%
Franklin 31,920 6 35,690 11.8% 32,930 7 35,520 7.9% 33,130 6 35,920 8.4%
Grant 33,130 9 41,220 24.4% 33,670 9 41,790 24.1% 34,090 6 43,090 26.4%
Okanogan 16,180 7 25,160 55.5% 16,430 7 24,210 47.4% 15,900 7 24,840 56.2%
Skagit 50,660 7 53,350 5.3% 50,240 10 52,050 3.6% 49,710 10 52,310 5.2%
Walla Walla 27,480 6 30,650 11.5% 27,550 10 29,820 8.2% 27,430 7 29,570 7.8%
Total 243,470 280,100 15% 247,590 276,970 11.9% 244,580 277,140 13.3%
Agricultural MSA*Wenatchee MSA 52,520 7 69,400 32.1% 52,160 7 69,080 32.4% 52,090 7 70,930 36.2%
Yakima MSA 105,130 7 124,190 18.1% 104,950 7 125,180 19.3% 104,440 7 128,770 23.3%
Total 157,650 193,590 22.8% 157,110 194,260 23.6% 156,530 199,700 27.6%
Nonfarm MD/MSA*Bellingham MSA 95,770 4 97,890 2.2% 95,990 11 98,830 3% 96,240 4 99,090 3%
Bremerton MSA 114,710 12 115,310 0.5% 113,160 12 114,250 1% 112,290 1 112,290 0.0%
Olympia MSA 119,370 11 120,810 1.2% 118,400 11 121,190 2.4% 117,220 11 118,330 0.9%
Seattle MD 1,344,000 4 1,368,050 1.8% 1,344,060 12 1,383,080 2.9% 1,377,550 9 1,408,910 2.3%
Spokane MSA 211,340 11 216,560 2.5% 209,410 11 213,340 1.9% 208,640 11 214,660 2.9%
Tacoma MD 351,890 12 356,800 1.4% 349,550 12 357,620 2.3% 351,320 12 357,330 1.7%
Total 2,237,080 2,275,420 1.7% 2,230,570 2,288,310 2.6% 2,263,260 2,310,610 2.1%
*MD = Metropolitan Division; MSA = Metropolitan Statistical Area.
Seasonal peak employment varies sharply for agricultural regions and counties.

2012 Agricultural Workforce Report December 2013Employment Security Department Page 35
Chapter 3 – Employment and unemployment in Washington’s agricultural labor market
Unemployed workers covered by unemployment insuranceUnemployment compensation is only available to workers no longer employed who had a job covered by the unemployment-insurance system, which includes most agricultural workers. Examining the number of continued claims provides an idea of the number of workers looking for and available for work.
Claimants in these tables are the numbers of individuals receiving benefits. Claims are the number of claims that are filed. In addition, the former employer who paid the highest base-year wages is noted as the industry affiliation for the claimant, which may not be their most recent employer.
Agriculture continued claims31
The pattern of agricultural-worker continued claims reflects seasonal changes in agricultural labor supply and demand. In 2008, there was an average of 2,824 monthly-continued claims32 (Figure 3-2). On an annual basis, continued claims in agriculture peaked at 4,395 monthly claims in 2010 and then dropped to 3,482 continued claims in 2012. This amounts to a 20.8 percent drop in continued claims from 2010 to 2012, showing a general tightening of the labor market, but this was still considerably higher than in 2008.
The seasonal patterns were consistent from year to year. Continued claims peaked in January. They dropped steadily to July; rose again in August, depending on weather patterns, then dropped again in September or October, only to rise again through November and December.
31 Defined as individuals who are eligible for unemployment-insurance benefits and who are in a waiting period for unemployment-insurance credit or who are requesting payments of unemployment-insurance benefits for one or more weeks of unemployment.
32 This total is a duplicated count. Some workers appear in more than one month’s count.
Seasonal labor demand significantly reduced the number of continued claims. Comparing January continued claims with July, the number dropped by 2,871 claims in 2008 and 4,709 in 2012. Comparing January with October, continued claims dropped by 3,591 in 2008, 5,161 in 2010 and 4,832 in 2012.
Figure 3-2. Agriculture continued claims1 for unemployment benefits, by month Washington state, 2007 through 2011 Source: Employment Security Department/LMPA, Unemployment Insurance Data Warehouse, Continued Claims Table
0
1,000
2,000
3,000
4,000
5,000
6,000
7,000
8,000
Jan Feb Mar Apr May Jun Jul Aug Sep Oct Nov Dec
Num
ber o
f con
tinue
d cla
ims
2008 2009 2010 2011 2012
1Claims data for years 2008 through 2012 in this year’s report use the North American Industry Classification System (NAICS). Previous years’ reports for this data used the Standard Industrial Classification (SIC).
Unemployment-insurance continued claims for agriculture have historically dropped steadily through the year, increased between fruit harvesting seasons, then increased dramatically at the end of the year.

December 2013 2012 Agricultural Workforce ReportPage 36 Employment Security Department
Chapter 3 – Employment and unemployment in Washington’s agricultural labor market
Nonfarm continued claimsFigure 3-3 shows the seasonal pattern of continued claims for nonfarm workers. Unlike the pattern for agriculture, except for 2009, there was a general, but typically smooth drop in continued claims from January to September with an increase that occurred from October through December. Both the agricultural and the nonfarm continued claims showed a sharp jump for September 2011. This was apparently due to a change in administrative procedures in the unemployment-insurance program.
Figure 3-3. Nonfarm continued claims1 for unemployment benefits, by month Washington state, 2008 through 2012 Source: Employment Security Department/LMPA, Unemployment Insurance Data Warehouse, Continued Claims Table
0
20,000
40,000
60,000
80,000
100,000
120,000
140,000
160,000
180,000
Jan Feb Mar Apr May Jun Jul Aug Sep Oct Nov Dec
Num
ber o
f con
tinue
d cla
ims
2008 2009 2010 2011 2012
1Claims data for years 2008 through 2012 in this year’s report use the North American Industry Classification System (NAICS). Previous years’ reports for this data used the Standard Industrial Classification (SIC).
The historical month-to-month pattern for nonfarm continued claims showed less seasonality than agriculture.
Distinct claims by agricultural industry
Figure 3-4 shows distinct claims in agriculture by industry for 2008 through 2012. Claimants could have filed one or more claims during the year but they are only counted once. Detail is provided for 32 agricultural industries plus an other category.
Unduplicated claims rose from 10,087 in 2008 to a high of 13,261 in 2010 and then dropped back to 12,550 in 2012. Thus, over 10,000 workers from agricultural industries filed claims at some point during these five years. Much of this labor is specialized. Workers in finfish farming and fish hatcheries or shellfish farming, for example, are not close substitutes for workers in grape vineyards or wheat farming.
Due to growers’ recent reports of labor shortages for apple and other tree fruit harvests, the claims data for apple orchards and other non-citrus fruit farming were tabulated. The seasonal harvest surge for the fresh fruit harvest periods amounted to 40,000 to 60,000 workers each season. Annual hired claimants during this period totaled 3,325 workers in 2008, rose to 4,254 workers in 2010 and then dropped back to 3,983 workers in 2012 or about 8 percent of the peak season surge.

2012 Agricultural Workforce Report December 2013Employment Security Department Page 37
Chapter 3 – Employment and unemployment in Washington’s agricultural labor market
Figure 3-4. Annual unduplicated unemployment-insurance claims by selected agricultural industries1 Washington state, 2008 through 2012 Source: Employment Security Department/LMPA, Unemployment Insurance Data Warehouse, Continued Claims Table
Industry
Annual total
continuedclaims 2008
Annual total
continued claims 2009
Annual change
2008/2009
Annual total
continued claims 2010
Annual change
2009/2010
Annual total
continued claims 2011
Annual change
2010/2011
Annual total
continued claims 2012
Annual change
2011/2012Postharvest crop activities (except cotton ginning)
2,896 3,184 9.9% 4,078 28.1% 3,852 -5.5% 3,684 -4.4%
Apple orchards 1,867 2,239 19.9% 2,448 9.3% 2,357 -3.7% 2,374 0.7%
Other non-citrus fruit farming
1,458 1,567 7.5% 1,806 15.3% 1,648 -8.7% 1,609 -2.4%
All other miscellaneous crop farming
979 1,222 24.8% 1,232 0.8% 1,155 -6.3% 1,216 5.3%
Other vegetable (except potato) and melon farming
397 465 17.1% 508 9.2% 537 5.7% 562 4.7%
Grape vineyards 410 502 22.4% 526 4.8% 503 -4.4% 463 -8%
Nursery and tree production 334 487 45.8% 530 8.8% 495 -6.6% 505 2%
Potato farming 320 324 1.3% 331 2.2% 334 0.9% 346 3.6%
Floriculture production 229 283 23.6% 326 15.2% 300 -8% 300 0.0%
Hay farming 205 235 14.6% 251 6.8% 256 2% 261 2%
Berry (except strawberry) farming
127 168 32.3% 197 17.3% 223 13.2% 220 -1.3%
Wheat farming 131 180 37.4% 198 10% 212 7.1% 194 -8.5%
Farm labor contractors and crew leaders
86 121 40.7% 141 16.5% 121 -14.2% 154 27.3%
Dairy cattle and milk production
89 144 61.8% 121 -16% 108 -10.7% 112 3.7%
Soil preparation, planting and cultivating
74 78 5.4% 90 15.4% 98 8.9% 103 5.1%
Farm management services 70 82 17.1% 78 -4.9% 71 -9% 76 7%
Chicken egg production 128 61 -52.3% 35 -42.6% 29 -17.1% 38 31%
Shellfish farming 28 42 50% 46 9.5% 37 -19.6% 57 54.1%
Beef cattle ranching and farming
32 43 34.4% 42 -2.3% 37 -11.9% 46 24.3%
Fruit and tree nut combination farming
24 34 41.7% 35 2.9% 37 5.7% 48 29.7%
Cattle feedlots 32 33 3.1% 41 24.2% 30 -26.8% 21 -30%
Support activities for animal production
16 39 143.8% 51 30.8% 30 -41.2% 15 -50%
Corn farming 23 33 43.5% 24 -27.3% 20 -16.7% 19 -5%
Crop harvesting, primarily by machine
26 27 3.8% 23 -14.8% 19 -17.4% 18 -5.3%
All other grain farming 15 22 46.7% 20 -9.1% 23 15% 29 26.1%
Mushroom production 14 17 21.4% 14 -17.6% 9 -35.7% 12 33.3%

December 2013 2012 Agricultural Workforce ReportPage 38 Employment Security Department
Chapter 3 – Employment and unemployment in Washington’s agricultural labor market
Industry
Annual total
continuedclaims 2008
Annual total
continued claims 2009
Annual change
2008/2009
Annual total
continued claims 2010
Annual change
2009/2010
Annual total
continued claims 2011
Annual change
2010/2011
Annual total
continued claims 2012
Annual change
2011/2012Finfish farming and fish hatcheries
12 9 -25% 8 -11.1% 16 100% 16 0.0%
Strawberry farming 13 8 -38.5% 10 25.0% 11 10% 8 -27.3%
Oilseed and grain combination farming
11 8 -27.3% 7 -12.5% 7 0.0% 7 0.0%
All other animal production 13 15 15.4% 4 -73.3% 8 100% 7 -12.5%
Horses and other equine production
10 11 10% 12 9.1% 8 -33.3% 4 -50%
Apiculture 5 6 20% 10 66.7% 10 0.0% 10 0.0%
Other 13 24 84.6% 18 -25% 17 -5.6% 16 -5.9%
Totals 10,087 11,713 16.1% 13,261 13.2% 12,618 -4.8% 12,550 -0.5%
1Claims data for years 2008 through 2012 in this year’s report use the North American Industry Classification System (NAICS). Previous years’ reports for this data used the Standard Industrial Classification (SIC).
Annual total continued claims for 2012 showed a decrease of 0.5 percent from 2011.
Summary• The labor force is a dynamic economic
institution; continuous changes occur in the numbers of employed, unemployed and those out of the labor force. This adds uncertainty to the labor force planning of growers.
• Seasonal employment is much more of a factor for the six key agricultural counties and two heavily agricultural MSAs in the state than for the state’s six urban metropolitan divisions and metropolitan statistical areas. This high seasonality also lends uncertainty to the growers’ labor force planning.
• Unemployment percentages and levels are an index of the labor supply for growers. In general, based on these data, agricultural labor markets have tightened up over the period 2010 through 2012.
• Continued claims in agriculture show a distinct seasonal pattern. The magnitude of these claims is small relative to the annual increase in demand for seasonal agricultural workers.

2012 Agricultural Workforce Report December 2013Employment Security Department Page 39
33 U.S. Department of Homeland Security, “H-2A Temporary Agricultural Worker Program” (https://www.dhs.gov/h-2a-temporary-agricultural-worker-program).
Chapter 4: H-2A employment and the issue of hired labor shortagesH-2A employment: Washington and the United States The federal H-2A guest worker program allows U.S. employers to hire foreign workers on a temporary basis to perform agricultural work when there are not sufficient U.S. workers. The H-2A program was instituted to meet this need for seasonal and temporary labor, without adding permanent residents to the population.33 Since workers under the program do not remain in the United States after the end of their contracted employment period, there is no annual limit to the number of H-2A workers who may enter the United States to work.
At the federal level, certified employer applications for H-2A workers have grown from 6,550 in 2006 to 7,836 in 2012, a 19.6 percent increase. The number of workers certified over that time has grown by an even greater amount, from 59,110 to 85,487, a 44.6 percent increase. The number of employer applications certified in Washington state increased from 11 in 2006 to 33 in 2012. The number of workers certified increased from 814 in 2006 to 3,953 in 2012. There were some decreases in applicants, workers certified, or both in 2009 and 2010 (Figure 4-1).
Figure 4-1. H-2A certifications United States and Washington state, 2006 through 2012 Source: Employment Security Department/Workforce & Career Development Division; U.S. Department of Labor, Office of Foreign Labor Certification, Fiscal Year Performance Summaries
H-2A certificationsUnited States1 Washington state2
Year
Employer applications
certified
Percent change
year to yearWorkers certified
Percent change
year to year
Employer applications
certified
Percent change
year to yearWorkers certified
Percent change
year to year2006 6,550 -0.8% 59,110 22.3% 11 57.1% 814 *
2007 7,491 14.4% 76,814 30% 26 136.4% 1,688 107.4%
2008 7,944 6.0% 82,099 6.9% 34 13.3% 2,513 40.1%
2009 7,665 -3.5% 86,014 4.8% 30 -11.8% 1,882 -25.1%
2010 6,988 -8.8% 79,011 -8.1% 25 -16.7% 2,981 58.4%
2011 7,000 0.2% 77,246 -2.2% 18 -28.0% 3,182 7%
2012 7,836 11.9% 85,487 10.7% 33 83.3% 3,953 24.2%
* No 2005 comparison data. 1 National data are on a federal fiscal year basis. 2 Washington data do not include applications submitted for sheepherder or beekeeper jobs.
With the exception of 2009, the depth of the recent recession, the number of H-2A workers has been steadily increasing in Washington state.

December 2013 2012 Agricultural Workforce ReportPage 40 Employment Security Department
Chapter 4 – H-2A employment and the issue of hired labor shortaages
The H-2A program and agricultural wagesFederal regulations require that growers pay the highest of the following:
• the federal Adverse Effect Wage Rate (AEWR);34
• the state prevailing wage; or
• the state or federal minimum wage.
In addition, all non-H-2A workers performing the same tasks or jobs employed by the H-2A employer must be paid the same wage rate or piece rate as is paid to the H-2A worker for that task or job.
The AEWR in Washington is equal to the annual weighted average hourly wage rate for field and livestock workers (combined) for the region (Washington and Oregon). It is calculated annually by the U.S. Department of Labor using the U.S. Department of Agriculture’s annual wage rates from its regional Farm Labor Survey of nonfamily field and livestock workers.
Prevailing wage rates are revised every two years based on surveys of fruit growers conducted by the Washington State Employment Security Department’s Labor Market and Performance Analysis branch (LMPA). LMPA surveys fruit growers on four activities: apple thinning, cherry harvest, pear harvest and apple harvest. The survey responses are analyzed based on the U.S. Department of Labor’s (DOL) methodology. The results are used by DOL to establish wages under the federal H-2A guest worker program. Currently, prevailing wage rates are based on results of a survey conducted in 2011. Prevailing wage rates for 2014 and 2015 will be based on a survey conducted during the summer and fall of 2013. The current prevailing wage rates for Washington and other states are posted on the DOL website at http://www.foreignlaborcert.doleta.gov/aowl.cfm.
State prevailing wages vary among both products and production methods and are usually expressed in piece-rate terms such as by the bin or lug. Appendix Figure A4-1 provides the full set of prevailing wage rates for H-2A workers for 2012 in Washington. The AEWR varies among states and is currently $12 an hour in Washington (shown in Figure 4-2). Since the federal and state minimum wage are both well below the AEWR, the minimum wage paid to farmworkers is either the state prevailing wage for a given product/production method combination or the AEWR. In cases where workers are paid piece rates, workers are guaranteed $12 an hour (the AEWR), but may earn more based on their productivity.
It is difficult to know for certain what effect the H-2A program is having on agricultural wages in Washington. As presented in Figure 2-14, median before-tax hourly earnings in 2012 ranged from $11.00 to $15.02. The AEWR may be acting as a floor for less productive workers who might have earned less than $12 in the absence of the AEWR. It is also difficult to know what bin or lug rates would have been in the absence of prevailing wages, particularly in light of seasonal worker shortages.
The remainder of this chapter analyzes the seasonal agricultural workforce and discusses the issue of worker shortages.
34 The AEWR is determined by the U.S. Department of Labor and is not based on any ESD/LMPA survey or data source.

2012 Agricultural Workforce Report December 2013Employment Security Department Page 41
Chapter 4 – H-2A employment and the issue of hired labor shortaages
Seasonal employment and wage rate data – the monthly Agricultural Employment and Wage surveyThe Agricultural Employment and Wage survey is a monthly survey of the employment and wages for a probability sample of 2,000 agricultural growers in the state. This is a scientific survey with greater weight in the sample estimates given to larger growers.35 Agricultural operators are surveyed for employment data for seasonal workers, type of crop, work activity and wage rates.
Based on these data, estimates are developed on the size of the workforce and average piece rates or hourly earnings for each activity. For the purpose of the survey, seasonal workers are those working less than 150 days per year. All total and seasonal employment numbers represent jobs rather than workers. A single worker could hold more than one job over the growing and harvesting seasons of different crops.
Some variation in reporting of seasonal data can be attributed to the requirement that employment be reported in the pay period including the 12th of the month. Because the timing of a given crop’s harvest and other activities can be affected by weather and other conditions, periods of peak employment do not always fit precisely within the reporting period. This reporting condition can lead to some variation of estimated employment by crop when comparing a given activity for similar time periods. This is especially true for the cherry harvest period.
35 Technically, the sample is selected from the population frame of all growers in the state based a probability that is proportional to grower size (PPS), where grower size is measured as the number of employees the grower has at the point of development of the population frame. Growers having 50 or more employees are drawn into the sample with certainty. The population frame is defined by the Quarterly Census of Employment and Wages (QCEW).
Figure 4-2. The Adverse Effect Wage Rate (AEWR), current and inflation-adjusted dollars, CPI-W 2011 = 100 Washington, Oregon and California, 2004 through 2013 Source: U.S. Department of Labor, Employment and Training Administration, Office of Foreign Labor Certification, Adverse Effect Wage Rate (AEWR)
Current dollars Inflation-adjusted dollarsYear Washington Oregon California Washington Oregon California2004 $8.73 $8.73 $8.50 $10.48 $10.48 $10.20
2005 $9.03 $9.03 $8.56 $10.48 $10.48 $9.93
2006 $9.01 $9.01 $9.00 $10.12 $10.12 $10.11
2007 $9.77 $9.77 $9.20 $10.68 $10.68 $10.05
2008 $9.94 $9.94 $9.72 $10.44 $10.44 $10.21
2009 $10.12 $10.12 $10.16 $10.70 $10.70 $10.74
2010 $10.85 $10.85 $10.25 $11.23 $11.23 $10.61
2011 $10.60 $10.60 $10.31 $10.60 $10.60 $10.31
2012 $10.92 $10.92 $10.24 $10.68 $10.68 $10.01
2013 $12.00 $12.00 $10.74 $11.74 $11.74 $10.50
The AEWR increase since 2004 exceeds the increase due to the rise in the CPI-W by 16 percent.

December 2013 2012 Agricultural Workforce ReportPage 42 Employment Security Department
Chapter 4 – H-2A employment and the issue of hired labor shortaages
The state is grouped into six areas based on agricultural economic similarity as shown in Figure 2-8 in Chapter 2. Considerable detail is provided for apple, cherry and pear production since the seasonal surge in employment is concentrated in and driven by these three fruit crops. The fresh fruit crops, especially apples, significantly affect the agricultural infrastructure of the state. The cherry crop has a significant impact on state agriculture since the harvest period is concentrated in such a short time period. The volume of the apple harvest over the harvest season is the major factor affecting longer-term seasonal employment. The pear harvest is important as a bridge in labor demand from the tapering off of the cherry harvest to the full surge in labor demand for the apple harvest.
The tables and charts presented in this report compare the seasonal agricultural employment for the state and the six areas for the peak month of 2012, the previous month and the previous year for that same month as shown in Figures 4-3 and 4-5. Employment for each crop activity is noted as a percent change relative to the previous month and previous year. Crops having the greatest increase and greatest decrease in employment are highlighted in the narrative. Figures 4-4 and 4-6 show the top four crop activities by employment and wage rate for each of the six agricultural reporting areas.
Employment – cherriesFigure 4-3 shows the regional structure of seasonal employment for the peak cherry harvest period of July 2012. An estimated 92,840 jobs were reported for that month. The harvest was concentrated in the South Central and North Central geographic regions of the state where 56,780 jobs were reported, 61.2 percent of the total seasonal jobs that month. From June through July 2012, total agricultural employment jumped by 43,590 jobs, of which 35,120 were seasonal jobs.
Wage rates – cherriesFigure 4-4 shows the estimated average hourly wage and piece rates offered for the top four crop activities in each reporting area for the peak cherry harvest period of 2012. Workers receiving piece rates often earn more than those paid by the hour
for the same activity. Median and average before-tax earnings were shown in Figure 2-14, where all earnings were converted to hourly rates.
Variations in demand and supply conditions are revealed by the data. Take, for instance, the apple hand thinner. This job paid $9.88 per hour in the Eastern area; $9.40 in the South Eastern area; $9.47 per hour in the North Central area; $9.70 per hour in the Columbia Basin area; and $9.21 per hour in the South Central area. Cherry harvester wage rates reflect regional differences as well for the same harvest month.
Employment – applesTotal and seasonal employment for the peak apple harvest month of October 2012 is shown in Figure 4-5. Total employment was not as high in October as it was in July, 107,180 jobs versus 139,220 jobs. However, the apple harvest season extended over a much longer time period, with different varieties of apples maturing at different times.
The South Central and North Central areas held 37,670 jobs out of the seasonal total of 64,860 jobs or 58.1 percent of all seasonal jobs in that month. Statewide, total agricultural employment dropped by 11,700 jobs from September to October. An estimated 6,990 of this drop, 59.7 percent, were seasonal jobs.
Wage rates – apples Average hourly and piece rates are shown in Figure 4-6 for the peak month of the apple harvest in 2012. As with the peak harvest month for cherries, there were differences in average hourly wage rates for the same job across the different agricultural reporting areas. Apple harvesters earned the lowest average hourly wage rate of $10.30 in the Columbia Basin area and the highest ($10.80) in the North Central area. Growers needing apple harvesters had to compete against growers who paid pear harvesters an average hourly wage of $14.00 per hour in the North Central area. Growers needing apple harvesters in the Columbia Basin and South Eastern areas had to compete against growers paying slightly higher wage rates to grape harvesters.

2012 Agricultural Workforce Report December 2013Employment Security Department Page 43
Chapter 4 – H-2A employment and the issue of hired labor shortaages
Figure 4-3. Agricultural employment1 during the month of peak cherry employment Washington state and six agricultural reporting areas, June and July, 2011 and 2012 Source: Employment Security Department/LMPA, Agricultural Employment and Wage survey
Agricultural employment July 2012
Agricultural reporting area
Seasonal employment
Percent of seasonal
employmentPermanent
employment
Percent of permanent
employmentTotal
employmentPercent of total
employmentStatewide 92,840 100% 46,380 100% 139,220 100%
Western 8,790 9.5% 7,210 15.5% 16,000 11.5%
South Central 26,620 28.7% 17,120 36.9% 43,740 31.4%
North Central 30,160 32.5% 8,360 18% 38,520 27.7%
Columbia Basin 10,940 11.8% 4,740 10.2% 15,680 11.3%
South Eastern 15,450 16.6% 8,070 17.4% 23,520 16.9%
Eastern 880 0.9% 880 1.9% 1,760 1.3%
Total agricultural employment June and July, 2011 and 2012Agricultural reporting area
July 2012 preliminary
June 2012 revised
July 2011 revised
ChangeJune 2012 to
July 2012
ChangeJuly 2011 to
July 2012
Percent change June 2012 to
July 2012
Percent change July 2011 to
July 2012Statewide 139,220 95,630 129,160 43,590 10,060 45.6% 7.8%
Western 16,000 10,820 14,080 5,180 1,920 47.9% 13.6%
South Central 43,740 32,480 42,310 11,260 1,430 34.7% 3.4%
North Central 38,520 19,750 34,210 18,770 4,310 95% 12.6%
Columbia Basin 15,680 12,470 14,730 3,210 950 25.7% 6.4%
South Eastern 23,520 18,510 22,260 5,010 1,260 27.1% 5.7%
Eastern 1,760 1,600 1,570 160 190 10% 12.1%
Seasonal agricultural employment June and July, 2011 and 2012Agricultural reporting area
July 2012 preliminary
June 2012 revised
July 2011 revised
ChangeJune 2012 to
July 2012
ChangeJuly 2011 to
July 2012
Percent change June 2012 to
July 2012
Percent change July 2011 to
July 2012Statewide 92,840 57,720 86,030 35,120 6,810 37.8% 7.9%
Westernzz 8,790 3,770 7,130 5,020 1,660 57.1% 23.3%
South Central 26,620 21,450 30,100 5,170 -3,480 19.5% -11.6%
North Central 30,160 12,260 24,370 17,900 5,790 59.4% 23.8%
Columbia Basin 10,940 8,340 9,740 2,600 1,200 23.7% 12.3%
South Eastern 15,450 11,330 14,250 4,120 1,200 26.7% 8.4%
Eastern 880 570 440 310 440 35.2% 100%
1Employment estimates published in this report are not seasonally adjusted and are not adjusted for multiple jobholders; the number of jobs is being counted, not the number of workers.
Statewide seasonal employment increased month over month.

December 2013 2012 Agricultural Workforce ReportPage 44 Employment Security Department
Chapter 4 – H-2A employment and the issue of hired labor shortaages
Figure 4-4. Average hourly wage rates and piece rates, selected occupations and activities Washington state’s six agricultural reporting areas, July 2012 Source: Employment Security Department/LMPA, Agricultural Employment and Wage survey
Reporting area and activity Employment Hourly wage rate Piece rateWesternRaspberry harvester 1,930 $9.10/hr
Raspberry sorter/grader/packer 1,490 $9.04/hr
Strawberry harvester * *
Nursery worker 410 $10.08/hr
South Central Cherry harvester 7,160 $9.76/hr or $4.20 - $7.25 per lug
Apple hand thinner 6,710 $9.21/hr or $0.50 - $3.00 per tree
Cherry sorter/grader/packer 5,260 $9.17/hr
Apple worker 1,050 $9.84/hr
North CentralCherry harvester 21,010 $9.23/hr or $3.00 - $7.25 per lug
Apple hand thinner 2,410 $9.47/hr or $0.80 - $1.60 per tree
Contract post-harvest sorter/grader/packer 1,850 $9.04/hr
Cherry sorter/grader/packer 1,610 $9.06/hr
Columbia Basin Cherry harvester 4,200 $9.04/hr or $3.50 - $6.50 per lug
Apple hand thinner 2,850 $9.70/hr or $0.60 - $5.00 per tree
Mint harvester * *
Blueberry harvester 550 Not Reported
South Eastern Cherry harvester 5,260 $9.43/hr or $5.00 - $6.00 per lug
Blueberry harvester 4,050 $9.04/hr
Apple hand thinner 3,040 $9.40/hr
Grapes trainer 540 $9.46/hr
Eastern Apple hand thinner 120 $9.88/hr
Cherry harvester 120 $9.09/hr
Wheat worker 100 $11.64/hr
Apple harvester 50 Not Reported
*Not published due to lack of statistical significance or to ensure employer confidentiality.
Average wage rates for given agricultural activities vary by agricultural reporting area, reflecting local differences in demand and supply conditions.

2012 Agricultural Workforce Report December 2013Employment Security Department Page 45
Chapter 4 – H-2A employment and the issue of hired labor shortaages
Figure 4-5. Agricultural employment1 during the month of peak apple employment Washington state and six agricultural reporting areas, September and October, 2011 and 2012 Source: Employment Security Department/LMPA, Agricultural Employment and Wage survey
Agricultural employment October 2012
Agricultural reporting area
Seasonal employment
Percent of seasonal
employmentPermanent
employment
Percent of permanent
employmentTotal
employmentPercent of total
employmentStatewide 64,870 100% 42,310 100% 107,180 100%
Western 4,630 7.1% 7,370 17.4% 12,000 11.2%
South Central 20,830 32.1% 12,920 30.5% 33,750 31.5%
North Central 16,840 26.0% 9,510 22.5% 26,350 24.6%
Columbia Basin 10,850 16.7% 4,590 10.8% 15,440 14.4%
South Eastern 11,290 17.4% 6,560 15.5% 17,850 16.7%
Eastern 520 0.8% 1,270 3.0% 1,790 1.7%
Total agricultural employment September and October, 2011 and 2012
Agricultural reporting area
October 2012 preliminary
September 2012 revised
October 2011 revised
Change September 2012
compared to October 2012
Change October 2011 compared to October 2012
Percentchange September
2012 compared to October 2012
Percent change October 2011 compared to October 2012
Statewide 107,180 118,880 103,100 -11,700 4,080 -9.8% 4%
Western 12,000 12,780 11,250 -780 750 -6.1% 6.7%
South Central 33,750 39,930 33,650 -6,180 100 -15.5% 0.3%
North Central 26,350 28,020 25,440 -1,670 910 -6% 3.6%
Columbia Basin 15,440 16,350 14,280 -910 1,160 -5.6% 8.1%
South Eastern 17,850 19,690 16,740 -1,840 1,110 -9.3% 6.6%
Eastern 1,790 2,110 1,740 -320 50 -15.2% 2.9%
Seasonal agricultural employment September and October, 2011 and 2012
Agricultural reporting area
October 2012 preliminary
September 2012 revised
October 2011 revised
Change September 2012
compared to October 2012
Change October 2011 compared to October 2012
Percentchange September
2012 compared to October 2012
Percent change October 2011 compared to October 2012
Statewide 64,860 71,850 65,520 -6,990 -660 -9.7% -1%
Western 4,630 5,580 3,960 -950 670 -17% 16.9%
South Central 20,830 23,690 23,690 -2,860 -2,860 -12.1% -12.1%
North Central 16,840 18,610 17,340 -1,770 -500 -9.5% -2.9%
Columbia Basin 10,750 11,560 11,950 -810 -1,200 -7.0% -10%
South Eastern 11,290 11,440 8,980 -150 2,310 -1.5% 25.7%
Eastern 520 970 600 -450 -80 -46.4% -13.3%
1Employment estimates published in this report are not seasonally adjusted and are not adjusted for multiple jobholders; the number of jobs is being counted, not the number of workers.
Statewide seasonal employment declined month over month.

December 2013 2012 Agricultural Workforce ReportPage 46 Employment Security Department
Chapter 4 – H-2A employment and the issue of hired labor shortaages
Figure 4-6. Average wage rates and piece rates, selected occupations and activities Washington state’s six agricultural reporting areas, October 2012 Source: Employment Security Department/LMPA, Agricultural Employment and Wage survey
Reporting area and activity Employment Hourly wage rate Piece rateWesternOther general farm worker 440 $9.06/hr
Blueberry harvester 430 $9.04/hr
Pumpkin worker * *
Raspberry pruner 340 $9.53/hr or $0.21 - $0.27 per plant
South Central Apple harvester 16,090 $10.56/hr or $16.00 - $28.00 per bin
Pear harvester 740 $9.04/hr
Apple sorter/grader/packer 580 $9.24/hr
Hops worker * *
North CentralApple harvester 14,780 $10.80/hr or $15.00 - $40.00 per bin
Pear harvester 510 $14.00/hr or $19.00 - $23.00 per bin
Apple worker 420 $10.77/hr
Nursery and tree worker 360 $9.04/hr
Columbia Basin Apple harvester 7,370 $10.30/hr or $16.00 - $30.00 per bin
Apple worker 640 $10.44/hr
Grapes harvester 550 $10.50/hr
Sweet corn sorter/grader/packer * *
South Eastern Apple harvester 8,290 $10.45/hr or $15.00 - $30.00 per bin
Grapes harvester 820 $10.98/hr
Potato worker 450 $9.05/hr
Potato harvester 260 $9.49/hr
Eastern Miscellaneous fruit trees worker 200 $ 9.04/hr
Wheat tractor operator 60 $12.86/hr
Wheat worker 50 $13.67/hr
Pumpkin harvester * *
*Not published due to lack of statistical significance or to ensure employer confidentiality.
Average wage rates for given agricultural activities vary by agricultural reporting area, reflecting local differences in demand and supply conditions.

2012 Agricultural Workforce Report December 2013Employment Security Department Page 47
Chapter 4 – H-2A employment and the issue of hired labor shortaages
The issue of seasonal labor shortageWashington state growers did not report agricultural labor shortages during the depths of the Great Recession. This situation has changed. Generalized shortages, not spot shortages,36 have been reported beginning in August 2011 and continuing into most of 2012 based on the monthly Agricultural Employment and Wage survey. These shortages are presented in Figure 4-7 as a percent of the total labor force desired by the grower. Shortages exceeded five percent every month from April through September for the first time in 2012.
Figure 4-7. Seasonal agricultural labor shortage1 as reported by agricultural producers, in percent, weighted by the total labor force reporting Washington state, 2007 through 2012 Source: Employment Security Department/LMPA, Agricultural Employment and Wage survey
0%
1%
2%
3%
4%
5%
6%
7%
8%
9%
2007 2008 2009 2010 2011 2012
Perc
ent o
f sea
sona
l labo
r sho
rtage
Year and quarter
Q1 Q2 Q3 Q4
1Labor shortage percent is the total reported additional seasonal labor needed divided by total reported seasonal labor.
Generalized, not spot shortages were reported in 2012.
The reasons for these reported labor shortages are not fully understood. Improved economic conditions in Washington may be leading to a tighter labor market and more opportunities for work outside of agriculture. Bumper crops also push up demand for labor.
Tighter labor supply may also be causing shortages. A large number of seasonal agricultural workers in Washington are from Latin America, in particular, Mexico. The Pew Hispanic Research Center estimated in 2012 that overall migration from Mexico fell to zero following the Great Recession – that is, the number of Mexican migrants (authorized and unauthorized) to America equaled the number of Mexicans who emigrated back to Mexico. Pew reports:
“The standstill appears to be the result of many factors, including the weakened U.S. job and housing construction markets, heightened border enforcement, a rise in deportations, the growing dangers associated with illegal border crossing, the long-term decline in Mexico’s birth rates and broader economic conditions in Mexico.”37
36 The term “spot shortage” refers to a localized shortage situation that may simply be due to, say, insufficient timely advertising for labor on the part of a grower or growers in a given locale. A “generalized shortage” refers to a shortage situation in which due to, say, increased border surveillance and enforcement, there are fewer workers to meet the seasonal demand for labor. In this case, the shortage pervades the entire agricultural labor market.
37 Passel, Jeffrey, D’Vera Cohn and Ana Gonzalez-Barrera, “Net Migration from Mexico Falls to Zero–and Perhaps Less,” Pew Research, Hispanic Center, Updated May 3, 2012. This update includes the full methodology appendix and a statistical profile of Mexican immigrants in the United States.

December 2013 2012 Agricultural Workforce ReportPage 48 Employment Security Department
Chapter 4 – H-2A employment and the issue of hired labor shortaages
Analyzing the seasonal agricultural labor shortage issue is complicated by the fact that federal officials do not know the full extent of the use of unauthorized workers. The U.S. Department of Labor estimated that 48 percent of all hired crop workers were found to be unauthorized.38
The H-2A program was set up to alleviate worker shortages. It adds legal agricultural workers to the state’s agricultural labor force but only makes a small contribution to meeting the seasonal demand for workers during critical fresh fruit harvest periods. For example, the H-2A program certified 3,953 seasonal workers for Washington state during 2012, while total employment during the peak cherry harvest month of July was 139,220 workers, including 92,840 seasonal workers. These H-2A workers thus comprised only 4.8 percent of the seasonal jobs for July.
Grower response to reported shortages of hired agricultural laborWe analyzed the response of growers to reported labor shortages by looking at changes in employment and average wages, both year-to-year and within growing seasons. Figure 4-8 presents month-over-month and year-over-year employment and piece rates for apple, cherry and pear harvest periods. The data are shown for the relevant harvest months for each type of tree fruit for 2011 and 2012. It should be noted that different fruit varieties have differing piece rates, which will account for some portion of the wage rate changes during the harvest season.
ApplesIn 2011, employment peaked in October, whereas it peaked in September in 2012. Bin rates were higher each month in 2012 than in 2011, peaking both years in November. In this case, the correlation between bin (wage) rates and employment was not consistent over time.
CherriesBetween 2011 and 2012, there was a piece rate increase and an employment increase for cherries during the month of July, the peak harvest month, but not in June or August when the opposite was noted.
PearsBetween 2011 and 2012, there was evidence of a relationship between piece rate increases and employment increases in August, but not in September or October. There was no lagged relationship between piece rate increases in August and employment in September.
AnalysisThe overall picture when comparing 2011 with 2012 is that there was a period of peak employment and one of peak wages, but they did not exactly coincide or move in the same direction for the various crops. The evidence presented here is from a two-year comparison of data and does not constitute a trend.
38 U.S. Department of Labor, Employment and Training Administration, National Agricultural Workers Survey (NAWS), Public Data for 2007-2009 (www.doleta.gov/agworker/naws.cfm). A review of the sampling methods for this survey of agricultural workers (the workers are the sample unit of observation, not the employer) shows that non-response to the survey at any given sample point is treated as random. If there are 10 workers to be sampled at a given site and only four are located and agree to be interviewed (strict anonymity of the responses is guaranteed), the four responses are weighted up to the total of 10 that were selected for the sample site. This assumption of randomness of nonresponse is a very strong assumption. It is reasonable to assume, since undocumented workers have an incentive not to be interviewed in spite of the guarantee of anonymity, that undocumented workers are underrepresented in the total sample and in the weighted population estimates. Thus, the 48 percent estimate may be at the low end of the range of actual percent of undocumented workers.

2012 Agricultural Workforce Report December 2013Employment Security Department Page 49
Chapter 4 – H-2A employment and the issue of hired labor shortaages
Graphic relationships between year-over-year piece rate levels and 2012 monthly estimates of labor shortagesFigures 4-9, 4-10 and 4-11 graph the year-over-year piece rates for apple, cherry and pear harvests in 2011 and 2012 and monthly reports of labor shortages in 2012. The shortage reports are not limited to just apple, cherry or pear harvesting, but include all seasonal crop activities.
Most tree-fruit growers produce multiple crops. In 2012, 36 percent of growers grew only apples, 16 percent grew apples, cherries and pears, 13 percent grew apples and pears and 35 percent grew apples and cherries.39 Thus, any correspondence between the reports of labor shortages and a specific bin or lug piece rate is limited. It is important to note that while wage rate levels have generally increased year over year, it is the month-to-month change in wage rate levels that may indicate that there is a
labor shortage during that time period. Year-over-year increases in wage rate levels can be due to factors other than a labor shortage, such as adjustments to inflation.
Figure 4-9 for apples shows monthly reports of shortages increasing in April 2012, prior to the surge in the harvest season in August and peaking in September.
Figure 4-10 for cherry harvest shows that the lug rates paid during 2012 had little relation to changes in the report of labor shortages. Lug rates were higher in June, July and September of 2012 than in 2011, but were not statistically significant month over month. In this time period, other seasonal crop activities may have had a larger influence on the reported labor shortages. Factors other than labor shortages, such as an inflation adjustment to maintain real wage levels, could have contributed to the year-over-year increase in average earnings.
39 Source: ESD 2011 H-2A tree fruit wage surveys
Figure 4-8. Average piece rates and employment for apple, cherry and pear harvest periods, current dollars Washington state, 2011 and 2012 Source: Employment Security Department/LMPA, Agricultural Employment and Wage survey
Piece ratesand seasonal employment 2011 2012
Percent change from
2011 to 2012 2011 2012
Percent change from
2011 to 2012 2011 2012
Percent change from
2011 to 2012Apples September October NovemberApple bin rates $20.41 $21.12 3.5% $20.03 $21.28 6.2% $22.80 $23.15 1.5%
Employment 5,993 9,362 56.2% 8,021 8,763 9.3% 4,443 2,672 -39.9%
Cherries June July August Cherry lug rates $4.40 $5.38 22.3% $4.37 $5.18 18.5% $4.40 $4.30 -2.3%
Employment 660 575 -12.9% 2,255 2,511 11.4% 1,910 2,121 11%
Pears August September October Pear bin rates $16.34 $16.85 3.1% $17.72 $20.39 15.1% $18.73 $20.43 9.1%
Employment 187 537 187.2% 778 699 -10.1% 480 124 -74.2%
Wages and employment increased in 2012 peak harvest months compared to 2011.

December 2013 2012 Agricultural Workforce ReportPage 50 Employment Security Department
Chapter 4 – H-2A employment and the issue of hired labor shortaages
Figure 4-9. Apple harvest average bin rates in current dollars and reported labor shortage Washington state, 2011 and 2012 Source: Employment Security Department/LMPA, Agricultural Employment and Wage survey
0%1%2%3%4%5%6%7%8%9%10%
$0
$5
$10
$15
$20
$25
Jan* Feb* Mar* Apr* May* Jun* Jul* Aug Sep Oct Nov Dec*
Perc
ent
repo
rted
labor
sho
rtage
Aver
age b
in ra
tes
2011 Wages 2012 Wages 2012 Labor shortage
*No apple harvest occurred in these months.
Grower reports of labor shortages before and during the apple harvest season were followed by statistically significant year-over-year bin piece-rate increases.
Figure 4-10. Cherry harvest average lug rates in current dollars and reported labor shortage Washington state, 2011 and 2012 Source: Employment Security Department/LMPA, Agricultural Employment and Wage survey
0%1%2%3%4%5%6%7%8%9%10%
$0
$1
$2
$3
$4
$5
$6
Jan* Feb* Mar* Apr* May* Jun Jul Aug Sep Oct* Nov* Dec*
Perc
ent r
epor
ted
labor
shor
tage
Aver
age l
ug ra
tes
2011 Wages 2012 Wages 2012 Labor shortage
*No cherry harvest occurred in these months.
Grower reports of shortages during the harvest period were followed by higher year-over-year lug rates for June, July and September 2012, but these were not statistically significant.
Figure 4-11. Pear harvest average bin rates in current dollars and reported labor shortage Washington state, 2011 and 2012 Source: Employment Security Department/LMPA, Agricultural Employment and Wage survey
0%1%2%3%4%5%6%7%8%9%10%
$0
$5
$10
$15
$20
$25
Jan* Feb* Mar* Apr* May* Jun* Jul* Aug Sep Oct Nov* Dec*
Perc
ent r
epor
ted
labor
shor
tage
Aver
age b
in ra
tes
2011 Wages 2012 Wages 2012 Labor shortage
*No pear harvest occurred in these months.
Grower reports of labor shortages during the pear harvest season were followed by a statistically significant month-over-month wage increase in September 2012 compared to 2011.
Figure 4-11 indicates that average pear bin rates in the harvest months of 2012 exceeded bin rates for the same months in 2011. Bin rates in 2012 peaked in October following the peak in reports of shortages. Grower reports of shortages during the pear harvest period were followed by a statistically significant month-over-month wage increase in September 2012 compared to 2011. Again, these changes in monthly and year-over-year average earnings can have explanations other than the monthly report of labor shortages.
ConclusionThe comparison of monthly wage-level changes, year over year, while suggestive, is not proof of an existing monthly labor shortage, since factors other than labor shortages can also contribute to monthly or year-over-year increases in wage levels, the most likely candidate being wage inflation adjustments. A complex statistical study would be needed to sort out the effect of these competing explanations for increases in annual average wage-rate levels.

2012 Agricultural Workforce Report December 2013Employment Security Department Page 51
Chapter 4 – H-2A employment and the issue of hired labor shortaages
Summary• The federal H-2A guest worker program is
intended to supply needed agricultural labor over the growing and harvest seasons in U.S. agriculture.
• Shortages of hired agricultural workers to fill seasonal thinning and harvest jobs have been consistently reported by Washington growers beginning in August 2011 and continuing into 2012.
• Average wage increases during peak harvest months for apples, cherries and pears may indicate a shortage of labor.
• In recent years, in-migration from Mexico and out-migration to Mexico has cancelled each other out.

December 2013 2012 Agricultural Workforce ReportPage 52 Employment Security Department
Chapter 4 – H-2A employment and the issue of hired labor shortaages

2012 Agricultural Workforce Report December 2013Employment Security Department Page 53
Chapter 5: The impact of irrigation on agricultural production and employmentIrrigation in Washington stateIrrigation has helped to make Eastern Washington one of the nation’s showpieces of agricultural success. Before the 1930s, lack of irrigation water remained the major obstacle to expanding productive agricultural land and economic development in the region. Then the federal government began the major land reclamation projects that involved building the Grand Coulee Dam, a high dam begun in 1933 and completed in 1942. This added significant irrigation capacity to Eastern Washington agriculture.
In the 1950s, the Columbia Basin Irrigation Project expanded the amount of water going to the state’s eastern agricultural region. The Columbia River mainstem currently has 11 dams, resulting in an increase in potential irrigation acreage. For a detailed description of their water utilization, see http:// www.ecy.wa.gov/programs/wr/cwp/cr_wtrbud.html
Based on data from the 2007 Census of Agriculture, irrigated acreage as a percent of total acreage on farms that have some irrigated acres has gradually increased. Starting with 1982, 20 percent of the land on farms with some irrigation was irrigated; for 1987, 18.6 percent; for 1992, 20.5 percent; for 1997, 21.6 percent; for 2002, 22.7 percent; and for 2007, 22.8 percent.40
There are four basic water delivery systems: gravity; sprinkler; drip, trickle or low-flow micro sprinklers; and sub-irrigation. In some water delivery systems, fertilizer and insecticides can be added to the water directly. Nationally, for 2008, irrigation water was delivered through those systems in the following percents: 40.1 percent; 56.2 percent; 6.8 percent and 0.4 percent, respectively. For Washington state in 2008, the respective percents were 11.9 percent, 82.3 percent and 8.3 percent. Sub-irrigation was not employed in the state in 2008.41
The value of farmland irrigationThough not all increases in the value of Washington state agriculture have been due to changes in irrigated acreage and irrigation technology, the following data are of interest. In 1930, irrigated acreage in Washington state comprised less than 500,000 total acres, as shown in Figure 5-1. The 1930 value of production of all agricultural crops in 2011 inflation-adjusted dollars approached $985 million. This includes irrigated and non-irrigated crops.
By 1950, irrigated farm acreage stood at 589,035 acres, an increase of 18 percent compared to 1930, while the value of crops in inflation-adjusted dollars fell by 1.4 percent to $971 million. By 1974, farms had 1,309,018 irrigated acres, an increase of 162.2 percent relative to 1930. The inflation-adjusted value of production rose to over $4.3 billion, an increase of 342.9 percent.
By 2007, the latest data based on the U.S. Census of Agriculture, irrigated acreage amounted to 1,735,917 acres, a drop of 87,238 irrigated acres compared to 2002, but an increase of 247.7 percent compared to 1930. Over that period, the inflation-adjusted value of crops increased by 382.8 percent from $985 million in 1930 to $4.8 billion in 2007.
40 U.S. Department of Agriculture, 2007 Census of Agriculture – State Data, Table 1. Historical Highlights: 2007 and Earlier Census Years.41 U.S. Department of Agriculture, 2007 Census of Agriculture, Table 4. Land Irrigation by Method of Water Distribution: 2008 and 2003.

December 2013 2012 Agricultural Workforce ReportPage 54 Employment Security Department
Chapter 5 – The impact of irrigation on agricultural production and employment
Figure 5-1. Irrigated acreage, crop value in current and inflation-adjusted dollars, Index for all farm products, 2007 = 100 Washington state, selected years, 1930 through 2007 Source: U.S. Department of Agriculture, National Agricultural Statistics Service
Washington state irrigated acreage and crop valueCumulative
percent change Crop value Cumulative
percent change Crop value Cumulative
Percent Change
YearIrrigated
land - acres1Irrigated
land - acresAll crops
(current dollars)Crop value
(current dollars)
All crops(inflation-adjusted
dollars)
Crop value(inflation-adjusted
dollars)1930 499,283 * $144,836,829 * $984,890,437 *
1945 520,153 4.2% $301,723,221 108.3% $1,243,465,396 26.3%
1950 589,035 18% $292,784,413 102.1% $971,187,321 -1.4%
1954 778,135 55.9% $403,645,840 178.7% $1,407,585,493 42.9%
1959 1,006,969 101.7% $344,738,000 138% $1,233,799,158 25.3%
1964 1,149,852 130.3% $374,994,000 158.9% $1,416,644,000 43.8%
1969 1,224,238 145.2% $420,872,000 190.6% $1,331,130,047 35.2%
1974 1,309,018 162.2% $1,154,631,000 697.2% $4,361,939,333 342.9%
1978 1,639,189 228.3% $1,293,857,000 793.3% $4,291,818,341 335.8%
1982 1,638,470 228.2% $1,714,741,000 1083.9% $4,664,095,520 373.6%
1987 1,518,684 204.2% $1,688,656,000 1065.9% $3,145,989,260 219.4%
1992 1,641,437 228.8% $2,451,605,000 1592.7% $3,547,002,979 260.1%
1997 1,705,025 241.5% $3,403,524,000 2249.9% $5,200,890,607 428.1%
2002 1,823,155 265.2% $3,582,818,000 2373.7% $4,972,073,959 404.8%
2007 1,735,917 247.7% $4,754,898,000 3182.9% $4,754,898,000 382.8%
*Data not available. 1The recorded acreage is for farms having some irrigated land. For example, in 2002 and 2007, actual irrigated cropland was approximately 23 to 24 percent of the total acres of land in farms containing some irrigated acres.
Irrigated acres have dramatically increased in the post-WWII decades from 1930 levels.

2012 Agricultural Workforce Report December 2013Employment Security Department Page 55
Chapter 5 – The impact of irrigation on agricultural production and employment
ApplesThough many crops benefited from the availability of irrigation, the situation with respect to apples is of interest, since apple production dominates the agricultural economy in portions of Eastern Washington. Apples are a water-intensive crop, requiring somewhat more than 40 inches of rain per year. In contrast, average annual rainfall in Richland from 1948 through 2010 was 7.14 inches; in Wenatchee, from 1877 through 2010, 8.85 inches; and in the Yakima region, 8.11 inches over the period 1946 through 2010.42
As shown in Figure 5-2, 874,000 tons of apples were produced on 86,500 acres in 1930 in Washington. Both acreage and production declined during the 1930s and it was not until 1982 that acreage once again reached the 1930 level and 1974 that production reached the 1930 level. Acreage has since stabilized at 153,000 acres after peaking at 170,000 in 1997. Production, on the other hand, has increased since 1997 to 2,775,000 tons in 2010, an increase of 218 percent since 1930, well above the 77 percent acreage increase. Yield per acre thus increased from an estimated 10.1 tons per acre in 1930 to an estimated 18.2 tons per acre in 2010, an increase of 80 percent. Some of this increased yield is due to increased irrigation water and improved irrigation technology. Both irrigated acreage and production per acre increased.
Cherries Figure 5-3 displays the historical evolution of cherry production in the state. Cherry acreage was estimated at 8,200 acres in 1940. Acreage declined to 5,400 acres by 1959. Starting in 1964, with 7,600 acres in production, cherry acreage expanded continually, reaching 35,000 acres by 2009. Cherry acreage declined slightly, to 34,000 acres, in 2010. Production in 1935 was an estimated 13,200 tons. Production fluctuated over the years as acreage changed, reaching 95,000 in 1997.
The availability of annual data from 2002 through 2010 provides an indication of the year-to-year volatility in cherry yields. Acreage increased moderately during the period and then declined slightly in 2010. However, production almost doubled from 2002 to 2006, followed by a modest decline in 2007. Production then seesawed, reaching a trough of 100,000 tons in 2008 before rebounding to 245,000 tons in 2009. An estimated 156,000 tons were produced in 2010.
Yield fluctuated accordingly. Over the long term, improved yields were due to technological changes, including irrigation, while short-term fluctuations are affected by weather. These year-to-year changes in production increase grower uncertainty with respect to planning for the needed seasonal labor force from year to year.
PearsFigure 5-4 displays the historical evolution of pear production in the state. Pear acreage increased by a much smaller amount than either apples or cherries since 1930. Production more than tripled, however, leading to greatly increasing yields. In 2010, 390,000 tons of pears were grown on 23,000 acres.
42 Western Regional Climate Center, Historical Climate Information, Comparative Data for Western States, Washington, Monthly Average Precipitation (inches).

December 2013 2012 Agricultural Workforce ReportPage 56 Employment Security Department
Chapter 5 – The impact of irrigation on agricultural production and employment
Figure 5-2. Apple acreage, acreage yield and total production Washington state, selected years, 1930 through 2010 Source: U.S. Department of Agriculture, National Agricultural Statistics Service
Washington state apple acreage and crop value
Year Apple acreage
Cumulativepercent change
in apple acreageYield
per acre (tons)
Cumulativepercent changein yield per acre
Total production (in 000 tons)
1930 86,500 * 10.1 * 874
1935 63,500 -27% 11.3 12% 718
1940 64,000 -26% 9.2 -9% 590
1945 65,100 -25% 9.4 -7% 610
1950 57,000 -34% 14.4 43% 821
1954 53,300 -38% 9.9 -2% 528
1959 55,600 -36% 9.5 -6% 528
1964 80,000 -8% 8.1 -20% 645
1969 58,000 -33% 14.6 45% 848
1974 72,200 -17% 12.5 24% 903
1978 81,000 -6% 13.3 31% 1,074
1982 95,000 10% 13.8 36% 1,308
1987 135,000 56% 18.5 83% 2,500
1992 142,000 64% 16.4 62% 2,325
1997 170,000 97% 14.7 46% 2,500
2002 155,000 79% 16.5 63% 2,550
2003 155,000 79% 14.7 46% 2,275
2004 155,000 79% 19.9 97% 3,075
2005 154,000 78% 18.5 83% 2,850
2006 154,000 78% 18.0 78% 2,775
2007 153,000 77% 17.00 68% 2,600
2008 153,000 77% 18.45 83% 2,825
2009 153,000 77% 17.00 68% 2,600
2010 153,000 77% 18.15 80% 2,775
*Data not available.
Yield per acre has increased by 80 percent since 1930.

2012 Agricultural Workforce Report December 2013Employment Security Department Page 57
Chapter 5 – The impact of irrigation on agricultural production and employment
Figure 5-3. Cherry acreage, acreage yield and total production Washington state, selected years, 1930 through 2010 Source: U.S. Department of Agriculture, National Agricultural Statistics Service
Washington state cherry acreage and crop value
Year Cherry acreage
Cumulativepercent change
in cherry acreageYield
per acre (tons)
Cumulativepercent changein yield per acre
Total production (in tons)
1930 * * * * *
1935 * * * * 13,200
1940 8,200 * 2.8 * 23,000
1945 9,400 15% 3.5 23% 32,400
1950 9,000 10% 1.8 -35% 16,500
1954 7,400 -10% 3.0 9% 22,500
1959 5,400 -34% 2.7 -5% 14,400
1964 7,600 -7% 2.9 4% 22,200
1969 9,200 12% 2.7 -5% 24,500
1974 11,200 37% 4.0 44% 45,000
1978 11,800 44% 4.5 61% 59,300
1982 11,200 37% 5.9 110% 66,000
1987 12,200 49% 6.1 117% 74,000
1992 14,000 71% 6.9 148% 86,000
1997 18,000 120% 5.3 89% 95,000
2002 26,000 217% 3.4 20% 87,000
2003 27,000 229% 4.4 56% 118,000
2004 29,000 254% 4.6 65% 134,000
2005 31,000 278% 4.4 58% 137,000
2006 32,000 290% 5.3 88% 168,000
2007 33,000 302% 4.8 70% 157,000
2008 33,000 302% 3.03 8% 100,000
2009 35,000 327% 7.00 150% 245,000
2010 34,000 315% 4.59 64% 156,000
*Data not available.
Cherry acreage has more than tripled since 1940.

December 2013 2012 Agricultural Workforce ReportPage 58 Employment Security Department
Chapter 5 – The impact of irrigation on agricultural production and employment
Figure 5-4. Pear acreage, acreage yield and total production Washington state, selected years, 1930 through 2010 Source: U.S. Department of Agriculture, National Agricultural Statistics Service
Washington state pear acreage and crop value
Year Pear acreage
Cumulativepercent changein pear acreage
Yieldper acre (tons)
Cumulativepercent changein yield per acre
Total production (in tons)
1930 16,800 * 7.02 * 117,930
1935 19,400 15% 7.85 12% 152,280
1940 19,100 14% 8.40 20% 160,500
1945 19,600 17% 9.91 41% 194,250
1950 18,600 11% 6.83 -3% 127,000
1954 16,900 1% 9.09 29% 136,750
1959 17,000 1% 6.00 -15% 102,000
1964 20,800 24% 6.08 -13% 126,500
1969 21,200 26% 5.52 -21% 117,000
1974 19,000 13% 11.20 60% 213,300
1978 20,300 21% 12.10 72% 246,000
1982 20,300 21% 13.00 85% 264,800
1987 22,900 36% 14.70 109% 336,000
1992 23,800 42% 14.20 102% 337,000
1997 24,400 45% 18.60 165% 455,000
2002 24,800 48% 15.70 124% 389,000
2003 25,500 52% 16.50 135% 422,000
2004 25,500 52% 14.40 105% 336,000
2005 24,700 47% 16.70 138% 413,000
2006 24,000 43% 15.00 114% 361,000
2007 24,000 43% 16.80 139.3% 402,000
2008 24,000 43% 15.70 123.6% 377,000
2009 24,000 43% 18.80 167.8% 452,000
2010 23,000 37% 17.00 142.2% 390,000
*Data not available.
Yield per acre has more than doubled since 1930.

2012 Agricultural Workforce Report December 2013Employment Security Department Page 59
Chapter 5 – The impact of irrigation on agricultural production and employment
Employment effectsThe expansion of Eastern Washington agriculture due in large part to the spread of irrigation had an important effect on agricultural employment in the state. In 1900, according to U.S. Census data which undercounts agricultural workers,43 there was an estimated 16,760 farmworkers in Washington. By 1930, this number had risen to 35,451 workers. The count fell to 27,386 workers by 1950, but then rose to 53,904 by 1960. In 10 years, from 1950 to 1960, the agricultural labor force had effectively doubled, as did irrigated land acreage. Over this same period, the number of employed agricultural workers in the United States declined from 7,160,000 in 1950 to 5,458,000 in 1960.44 The correlation between irrigation expansion, tree fruit production increases and increases in the agricultural labor force is clear, though the exact degree of causality is not.45
The Census also revealed the changing ethnic composition of the agricultural labor force. In 1900, 99 percent of total farmworkers were white, non-Hispanic and 1 percent were Hispanic. In 1950, 87 percent were white, non-Hispanic; 6 percent were Hispanic; 4 percent were Native American; and 3 percent were of Asian race/ethnicity. By 2000, 35 percent of the Census-enumerated agricultural labor force was white; 59 percent was Hispanic; 3 percent was Native American; and, 2 percent was Asian.46
43 See James N. Gregory, “Toward a History of Farm Workers in Washington State,” Chapter 1, Farm Workers in Washington State History Project, 2009. The decennial Census is taken in the spring and thus misses those workers employed during the peak harvest seasons for tree fruit and other crops. Highly mobile workers are also often missed by the Census. Finally, “…those who work part of the year in agriculture and part of the year in other jobs may call themselves ’laborer’” instead of farm workers.”
44 Daly, Patricia A., “Agricultural employment: has the decline ended?” Monthly Labor Review, November 1981, Table 2. Page 13.45 James N. Gregory, “Toward a History of Farm Workers in Washington State,” Chapter 1, Farm Workers in Washington State History Project, 2009.46 James N. Gregory, “Toward a History of Farm Workers in Washington State,” Chapter 1, Farm Workers in Washington State History Project, 2009.
Summary• Irrigation has helped to create a tree-fruit
industry, particularly apples and sweet cherries, in Washington state.
• Average yield per acre of cherries varies sharply from year to year as a function of weather, thus creating uncertainty in growers’ planning for needed harvest labor.
• Agricultural employment has expanded in Washington because of increased production aided by an expansion of irrigation.

December 2013 2012 Agricultural Workforce ReportPage 60 Employment Security Department
Chapter 5 – The impact of irrigation on agricultural production and employment

2012 Agricultural Workforce Report December 2013Employment Security Department Page 61
BibliographyAshenfelter, Orley, “Comparing Real Wage Rates,” American Economic Review, Vol. 102, No. 2. 2012.
Beyers, William B. and Ta-Win Lin, “The 2007 Washington Input-Output Study,” (2007 WA I-O), Table 1-2, page 6, August 2012.
Cassey, A.J., “The Collection and Description of Washington State Export Data,” Washington State University Extension Fact Sheet, FS006E, No date.
Globalwise Inc. in association with Belrose Inc., “The Washington Apple Industry: Contributions to the State Economy and the Important Role of Exports.” Vancouver, Washington and Pullman, Washington, August 29, 2012.
Gregory, James N., “Toward a History of Farm Workers in Washington State,” Chapter 1, Farm Workers in Washington State History Project, University of Washington, Department of History. 2009.
Gunter, Lewell F., Joseph C. Jarrett and James A. Duffield, “Effect of U.S. Immigration Reform on Labor-Intensive Agricultural Commodities,” American Journal of Agricultural Economics, Vol. 74, No. 4, 1992.
Hertz, Tom and Steven Zahniser, “Is There a Farm Labor Shortage?” American Journal of Agricultural Economics, Vol. 95, No. 2, Published online December 11, 2012.
Hoang, Mai, Yakima Herald-Republic, “Free Trade Lifts Cherry Sales to Korea,” July 26, 2012.
Holland, David and Nick Beleiciks, “The Economic Impact of Potatoes in Washington State,” Farm Business Management Reports, EB 1953E, School of Economic Sciences, Washington State University, Pullman, Washington.
Passel, Jeffrey, D’Vera Cohn and Ana Gonzalez-Barrera, “Net Migration from Mexico Falls to Zero-and Perhaps Less,” Pew Research, Hispanic Center, Updated May 3, 2010.
Storchmann, Karl, “The Economic Impact of the Wine Industry on Hotels and Restaurants in Walla Walla,”
AAWE Working Paper No. 18, June 2008.
U.S. Department of Agriculture, Economic Research Service and Foreign Agricultural Service, Outlook for U.S. Agricultural Trade, AES-77, February 21, 2013.
U.S. Department of Agriculture, 2007 Census of Agriculture, State data, Table 10. Irrigation: 2007 and 2002.
U.S. Department of Agriculture, Economic Research Service, Data Sets, Foreign Agricultural Trade of the United States.
U.S. Department of Agriculture, Economic Research Service, “Farm Labor: Background,” No date.
U.S. Department of Agriculture, Economic Research Service, “Fruit and Tree Nuts Outlook,” FTS-353, September 27, 2012.
U.S. Department of Agriculture, Economic Research Service, Farm Sector Income & Finances, Farm Income and Wealth Statistics, “Value-Added to the U.S. Economy by the Agricultural Sector via the Production of Goods and Services, 1950 through 2011.”
U.S. Department of Agriculture, Economic Research Service, Farm Sector Income & Finances, “Income Statement for the Farm Sector, 2009-2013F” (F= forecast).
U.S. Department of Agriculture, National Agricultural Statistics Service, “Agricultural Prices,” ISSN 1937-4216, Released July 31, 2012.
U.S. Department of Agriculture, National Agricultural Statistics Service, “Washington Crop Weather,” various issues. 2012.
U.S. Department of Agriculture, 2007 Census of Agriculture – State Data, Table 1. Historical Highlights: 2007 and Earlier Census Years and Table 4. Land Irrigation by Method of Water Distribution: 2008 and 2003.
U.S. Department of Commerce, Bureau of Economic Analysis, “Widespread Economic

December 2013 2012 Agricultural Workforce ReportPage 62 Employment Security Department
Bibliography
Growth Across States in 2011,” News Release, BEA 12-22. June 5, 2012.
U.S. Department of Commerce, Bureau of Economic Analysis, “State Personal Income and Employment Methodology,” September 2012.
U.S. Federal Reserve System, Board of Governors, Economic Research and Data, Foreign Exchange Rates – H.10, Country Data.
U. S. General Accountability Office, “H-2A Visa Program. Modernization and Improved Guidance Could Reduce Employer Application Burden,” GAO-12-706, September 2012.
U.S. Department of Homeland Security, “H-2A Temporary Agricultural Worker Program,” https://www.dhs.gov/h-2a-temporary-agriculutural-worker-program.
U.S. Department of Labor, Employment and Training Administration, National Agricultural Workers Survey (NAWS), Public Data for 2007-2009, www.doleta.gov/agworker/naws.cfm.
Veneri, Carolyn M., “Can Occupational Labor Shortages Be Identified Using Available Data?” Monthly Labor Review, Vol. 122, No. 3, March 1999.
Washington State Employment Security Department, Labor Market and Performance Analysis branch. 2012 Labor Market and Economic Report,” January 2013.
Washington State House Ways and Means Committee, “Input-Output Fundamentals.” Testimony of Marc Baldwin, Office of Financial Management, September 22, 2011.
Washington State Office of Financial Management, The 2007 Washington Input-Output Study (2007 WA I-O), August 2012.
Washington State Office of Financial Management, Forecasting Division, The 2002 Washington Input-Output Table, No date.
Western Regional Climate Center, Historical Climate
Information, Comparative Data for Western States, Washington, Monthly Average Precipitation (inches).
Williamson, James M., Ron Durst and Tracey Farrigan, “The Potential Impact of Tax Reform on Farm Businesses and Rural Households,” U.S. Department of Agriculture, Economic Research Service, Economic Information Bulletin Number 2107, February 2013.
Zahniser, Tom Hertz, Peter Dixon and Maureen Rimmer, “The Potential Impact of Changes in Immigration Policy on U.S. Agriculture and the Market for Hired Farm Labor,” U.S. Department of Agriculture, Economic Research Service, Economic Research Report Number 135, May 2012.

2012 Agricultural Workforce Report December 2013Employment Security Department Page 63
Appendices
Appendix Figure A1-1. Total expenses incurred in agricultural-sector production, current dollars in millions Washington state, 2011 Source: U.S. Department of Agriculture, Economic Research Service, U.S. and State Farm Income and Wealth Statistics, Production expenses, U.S. and State-level tables, 1949 to 2011, February 13, 2013
Expense category1
2011 expensesin millions, current
dollars
Percent of value of total expenses incurred
shown in row 1a.1. a. Total expenses incurred in production of agricultural-sector output, including operator dwellings4 $6,916.3 100% b. Total expenses incurred in production of agricultural-sector output, excluding operator dwellings4 $6,655.6 96.2%2. Nonfactor payments, excluding dwellings2 $4,915.5 71.1%3. Payments to stakeholders3 $1,758.9 25.4%4. Factor payments to non-operators, excluding operator dwellings $1,740.2 25.2%5. a. Purchased inputs, including operator dwellings4 $4,292.6 62.1% b. Purchased inputs, excluding operator dwellings4 $4,193.3 60.6%6. Farm origin expenses $1,201.1 17.4%7. Purchased feed expenses $800 11.6%8. Purchased livestock and poultry expenses $151.1 2.2%9. Purchased seed expenses $250 3.6%10. Manufactured input expenses $1,168.2 16.9%11. Fertilizer and lime expenses $380 5.5%12. Pesticide expenses $360 5.2%13. Fuel and oil expenses $326.5 4.7%14. Electricity expenses $101.7 1.5%15. Other purchased inputs, including operator dwellings $1,923 27.8%16. Repair and maintenance, including operator dwellings $363.2 5.3%17. Machine hire and custom work expenses $128.3 1.9%18. Marketing, storage and transportation expenses $804.9 11.6%19. Motor vehicle and licensing fees $14 0.2%20. Total labor expenses $1,363.1 19.7%21. a. Contract labor expenses5 $53.4 0.8% b. Hired labor expenses5 $1,309.7 18.9%22. Cash labor expenses $1,327.9 19.2%23. a. Interest expenses, including operator dwellings4 $260.4 3.8% b. Interest expenses, excluding operator dwellings4 $241.7 3.5%24. Non-real estate interest expenses $105.9 1.5%25. Net rent to non-operator landowners, including landlord capital consumption $188.7 2.7%26 a. Property taxes, including operator dwellings4 $210 3.0% b. Property taxes, excluding operator dwellings4 $183.2 2.6%27 a. Capital consumption, including operator dwellings4 $601.4 8.7% b. Capital consumption, excluding operator dwellings4 $485.6 7%
1These expense categories are not always mutually exclusive. Each entry in this figure is an individual component of cost. Each component comes from a separate table that details the definition of the cost or expense category as a relatively long footnote. These percents do not, therefore, add up to 100%. 2Nonfactor payments are the sum of intermediated product expenses, capital consumption and property taxes. 3Payments to stakeholders are expenses incurred for the use of the principal factors of production: land, labor and capital. 4These components are defined the same except for the clearly indicated inclusion or exclusion. 5The sum of 21a and 21b equals item 20.

December 2013 2012 Agricultural Workforce ReportPage 64 Employment Security Department
Appendices
Appendix Figure A2-1. Number of agricultural jobholders1 by month and annual average statewide and by county, metropolitan division (MD) and metropolitan statistical area (MSA) Washington state, 2012 Source: Employment Security Department/LMPA; U.S Bureau of Labor Statistics, Local Area Unemployment Statistics
Area Jan Feb Mar Apr May Jun Jul Aug Sep Oct Nov Dec AverageWashington 72,820 79,230 86,130 91,390 96,790 131,630 165,350 133,650 133,030 122,670 86,180 71,100 105,830Bellingham MSA 2,680 3,000 3,250 3,180 3,390 3,790 6,310 6,160 3,980 3,290 2,600 2,930 3,710Bremerton MSA 310 340 380 400 430 460 450 410 380 390 380 330 390Olympia MSA 1,290 1,410 1,550 1,600 1,760 1,850 1,910 1,870 1,790 1,500 1,360 1,320 1,600Kennewick-Pasco-Richland MSA 8,580 9,320 10,130 11,170 12,850 19,340 20,750 15,950 16,130 13,990 9,370 7,600 12,030
Seattle-Bellevue-Everett MD 2,880 3,170 3,430 3,670 3,930 4,030 4,380 4,210 3,810 3,800 3,050 2,920 3,610
Spokane MSA 1,170 1,320 1,480 1,650 1,800 1,880 1,880 1,790 1,680 1,560 1,290 1,190 1,560Tacoma MD 1,100 1,160 1,360 1,320 1,380 1,400 1,440 1,330 1,260 1,300 1,070 1,070 1,270Wenatchee MSA 9,200 9,780 9,880 9,860 9,900 16,770 26,460 19,400 16,690 17,290 11,480 8,950 13,810Yakima MSA 19,480 20,880 22,530 22,830 24,490 35,810 45,990 33,580 38,100 33,250 23,450 18,800 28,270Adams 1,310 1,410 1,640 2,280 2,100 2,740 3,060 2,820 2,880 2,790 1,650 1,300 2,170Asotin 110 130 150 170 180 170 180 170 170 150 130 130 150Clallam 280 300 320 350 370 400 460 420 400 330 300 290 350Clark 1,000 1,100 1,180 1,260 1,420 1,860 2,140 1,810 1,370 1,210 1,070 1,040 1,370Columbia 210 230 250 260 280 310 340 390 330 290 220 230 280Cowlitz 360 390 430 510 560 580 750 690 530 450 390 390 500Ferry 90 100 110 120 130 140 140 130 120 100 90 80 110Garfield 130 150 160 160 170 190 190 220 180 170 140 140 170Grant 7,060 7,740 8,490 9,720 10,250 14,350 15,180 12,970 14,960 12,430 9,010 6,450 10,720Grays Harbor 410 520 620 650 630 640 630 580 530 500 400 380 540Island 280 300 320 330 350 370 400 370 350 320 300 310 330Jefferson 130 130 140 150 160 170 170 170 160 150 130 130 150Kittitas 900 1,010 1,090 1,890 1,270 1,400 1,420 1,510 1,380 1,620 1,050 700 1,270Klickitat 1,100 1,430 1,570 1,760 1,880 2,100 2,790 2,340 2,130 2,100 1,430 1,180 1,820Lewis 950 1,040 1,130 1,200 1,290 1,310 1,360 1,520 1,310 1,190 1,130 1,030 1,210Lincoln 590 640 700 670 710 740 800 930 780 710 590 580 700Mason 350 360 390 440 460 480 490 500 460 430 410 380 430Okanogan 3,600 4,020 4,550 4,510 4,970 7,110 12,310 9,350 9,470 8,570 5,010 3,980 6,450Pacific 300 320 340 370 390 410 430 410 390 380 300 280 360Pend Oreille 110 130 140 150 160 170 180 160 160 130 120 110 140San Juan 130 140 150 180 190 210 210 200 180 170 150 130 170Skagit 2,370 2,530 3,130 3,110 3,200 3,050 4,150 3,910 3,710 3,690 2,530 2,350 3,140Skamania 80 90 100 130 110 120 120 120 130 150 100 80 110Stevens 490 550 600 690 750 810 810 740 700 610 520 490 650Wahkiakum 40 50 60 60 70 70 70 70 60 50 50 40 60Walla Walla 2,830 3,060 3,320 3,520 3,640 5,180 5,680 4,980 5,050 4,530 4,000 2,880 4,060Whitman 920 980 1,060 1,070 1,170 1,220 1,320 1,470 1,320 1,090 910 910 1,120
1All numbers rounded to the nearest 10. Total agricultural employment includes covered and non-covered employment, not adjusted for multiple jobholders.

2012 Agricultural Workforce Report December 2013Employment Security Department Page 65
Appendices
Appendix Figure A2-2. Employment of covered seasonal agricultural workers by crop and agricultural reporting area Washington state, 2012 Source: Employment Security Department/LMPA, Agricultural Employment and Wage survey
Covered seasonal employment, Washington stateActivity Jan Feb Mar Apr May Jun Jul Aug Sep Oct Nov Dec AverageState totals,** all activities 18,393 19,608 23,858 27,443 33,197 65,940 94,976 64,914 67,717 62,174 33,980 17,903 44,175
Apples, total 10,726 10,455 10,924 13,143 12,888 25,793 20,800 19,114 44,738 47,135 25,400 9,974 20,925Apple pruning 9,116 9,018 8,615 4,006 2,464 95 0 676 108 73 1,115 7,915 3,600Apple thinning * * 0 2,927 4,505 21,861 17,879 11,567 1,036 * 0 0 4,981Apple harvester 0 0 0 0 0 41 278 2,651 40,748 44,902 19,730 495 9,070Apple sort, grade, pack 845 778 388 272 428 377 316 0 1,053 655 1,789 732 636
Other apple activities 761 651 1,921 5,938 5,491 3,419 2,327 4,220 1,793 1,502 2,766 832 2,635Cherries, total 1,758 1,283 1,226 1,046 3,005 20,036 46,921 16,984 1,046 374 821 1,172 7,973Cherry pruning 1,658 1,137 1,050 386 515 75 0 108 55 69 462 974 541Cherry harvester 0 0 0 0 0 13,294 38,505 15,558 585 * 0 0 5,662Other cherry activities 100 146 176 660 2,490 6,667 8,416 1,318 406 299 359 198 1,770
Pears, total 784 610 527 288 561 1,492 694 3,253 2,944 1,184 587 1,562 1,207Pear pruning 773 523 475 207 76 38 37 0 0 26 494 1,478 344Pear thinning 0 57 48 51 396 1,315 406 76 0 0 0 57 201Pear harvester 0 0 0 0 0 0 30 2,815 2,694 1,119 93 0 563Other pear activities * 30 * 30 89 139 221 362 250 52 0 40 102Other tree fruit workers * * * 254 334 372 1,187 1,722 152 136 0 0 349
Grape workers 628 1,851 2,520 1,927 1,499 1,461 1,976 1,085 1,502 1,541 434 276 1,392Blueberry workers 303 328 378 150 110 286 107 3,196 1,691 825 331 109 651Raspberry workers 468 307 481 470 483 747 3,467 1,741 217 400 575 268 802Strawberry workers 0 0 * * 85 327 1,765 24 * 0 0 0 183Bulb workers1 0 0 0 * 30 43 22 53 39 * 64 72 27Hop workers 85 284 938 981 1,643 1,468 1,120 827 2,337 569 770 497 960Nursery workers 347 654 1,534 1,607 1,568 1,357 951 775 672 263 578 545 904Wheat/grain workers 34 35 149 167 256 352 502 1,334 593 303 169 92 332Asparagus workers 0 0 67 561 2,115 1,910 102 70 0 0 0 0 402Cucumber workers 0 0 0 0 0 * 20 204 190 69 0 0 41Onion workers 352 404 514 993 1,210 1,494 1,317 2,295 1,938 743 819 1,063 1,095Potato workers 814 706 777 1,336 1,140 1,010 829 1,708 1,790 2,232 654 565 1,130Miscellaneous vegetable workers 197 445 434 750 1,263 1,347 2,983 2,751 2,350 2,294 438 240 1,291
Other seasonal workers 1,886 2,242 3,361 3,753 5,007 6,432 10,213 7,766 5,516 4,079 2,340 1,455 4,504
1The 2007 conversion from SIC to NAICS industry codes placed most bulb growers into the nursery sector. *Monthly and annual estimates that are less than 20 workers are not reported due to insufficient information. **Totals do not add up to sum of detail breakouts due to screening out of monthly and annual estimates to ensure employer confidentiality.

December 2013 2012 Agricultural Workforce ReportPage 66 Employment Security Department
Appendices
Appendix Figure A2-3. Employment of covered seasonal agricultural workers by crop and agricultural reporting area Western Area 1, 2012 Source: Employment Security Department/LMPA, Agricultural Employment and Wage survey
Covered seasonal employment, Western Area 1Activity Jan Feb Mar Apr May Jun Jul Aug Sep Oct Nov Dec AverageTotal** 1,720 1,882 3,134 3,120 3,572 4,077 8,363 8,003 5,012 4,187 2,213 1,682 3,914Blueberry workers 303 328 378 150 110 286 107 3,196 1,691 825 331 109 651Raspberry workers 468 307 481 470 483 747 3,467 1,741 217 400 575 268 802Strawberry workers 0 0 * * 85 327 1,765 * * 0 0 0 181Bulb workers1 0 0 0 * 30 43 22 53 39 * 64 72 27Cucumber workers 0 0 0 0 0 * 20 204 190 69 0 0 41Potato workers 370 277 352 135 193 99 60 73 96 444 307 158 214Misc. Vegetable workers 104 179 258 386 505 588 871 941 991 1,072 420 235 546
Nursery workers 274 520 1,383 1,292 1,303 1,128 917 700 608 257 216 451 754Rhubarb workers 47 64 * 41 170 98 129 80 44 0 0 * 57Other Seasonal workers 154 207 265 629 693 748 1,005 1,003 1,134 1,106 300 384 636
1The 2007 conversion from SIC to NAICS industry codes placed most bulb growers into the nursery sector. *Monthly and annual estimates that are less than 20 workers are not reported due to insufficient information. **Totals do not add up to sum of detail breakouts due to screening out of monthly and annual estimates to ensure employer confidentiality.

2012 Agricultural Workforce Report December 2013Employment Security Department Page 67
Appendices
Appendix Figure A2-4. Employment of covered seasonal agricultural workers by crop and agricultural reporting area South Central Area 2, 2012 Source: Employment Security Department/LMPA, Agricultural Employment and Wage survey
Covered seasonal employment, South Central Area 2Activity Jan Feb Mar Apr May Jun Jul Aug Sep Oct Nov Dec AverageTotal** 6,211 6,140 7,021 7,825 10,393 23,073 29,312 17,000 22,176 20,345 12,010 6,524 14,003Apples, total 4,431 3,716 3,400 3,450 3,238 10,002 8,549 6,438 15,818 16,944 10,527 4,906 7,618Apple pruning 4,044 3,070 2,830 960 904 91 0 52 0 0 153 4,031 1,345Apple thinning 0 0 0 760 988 8,814 7,308 5,054 0 0 0 0 1,910Apple harvester 0 0 0 0 0 0 0 928 14,975 15,925 7,970 0 3,317Apple sort, grade, pack 205 207 74 111 242 373 0 0 554 655 1,384 705 376Other apple activities 182 439 496 1,619 1,104 724 1,241 404 289 364 1,020 170 671Cherries, total 239 334 222 312 1,358 7,063 14,582 1,453 31 31 111 278 2,168Cherry pruning 176 197 203 81 50 * 0 0 0 0 20 278 85Cherry harvester 0 0 0 0 0 2,806 8,510 800 0 6 0 0 1,010Other cherry activity 63 137 * 231 1,308 4,246 6,072 653 31 25 91 0 1,073Pears, total 325 268 194 110 200 465 162 2,725 955 688 150 602 570Pear pruning 325 225 194 33 46 * 0 0 0 0 150 545 128Pear thinning 0 * 0 51 108 379 132 43 0 0 0 57 65Pear harvester 0 0 0 0 0 0 30 2,507 955 688 0 0 348Other pear activities 0 30 0 26 46 69 0 175 0 0 0 0 29Other tree fruit, total 0 0 * 79 68 143 824 1,543 152 136 0 0 246Other tree fruit pruner 0 0 0 79 0 0 0 0 0 0 0 0 *Other tree fruit harvester 0 0 0 0 0 34 730 1,371 148 136 0 0 202
Other tree fruit activities 0 0 * 0 68 109 94 172 * 0 0 0 38Grapes, total 358 1,030 1,285 939 868 694 1,021 653 992 423 121 186 714Grape pruning 219 1,015 1,118 192 * 0 0 0 0 0 0 157 227Grape harvester 0 0 0 0 0 0 212 50 826 328 52 0 122Other grape activity 139 * 167 747 851 694 809 603 166 95 69 29 365Asparagus workers 0 0 67 299 1,119 1,016 73 20 0 0 0 0 216Hops, total 85 284 938 877 1,562 1,335 1,120 827 2,337 569 770 497 933Hop twining & training 0 0 98 423 94 544 0 0 0 61 0 228 121Hop harvester 0 0 0 0 0 0 0 419 2,247 0 0 0 222Other hop activity 85 284 840 454 1,468 791 1,120 408 90 508 770 269 591Onion workers 0 73 153 187 216 163 278 402 437 93 0 0 167Potato workers 0 38 40 129 116 140 549 776 0 98 0 0 157Misc. vegetable workers 44 184 107 252 315 566 1,095 388 437 724 0 0 343Other seasonal workers 729 213 611 1,191 1,333 1,486 1,059 1,775 1,017 639 331 55 870
*Monthly and annual estimates that are less than 20 workers are not reported due to insufficient information. **Totals do not add up to sum of detail breakouts due to screening out of monthly and annual estimates to ensure employer confidentiality.

December 2013 2012 Agricultural Workforce ReportPage 68 Employment Security Department
Appendices
Appendix Figure A2-5. Employment of covered seasonal agricultural workers by crop and agricultural reporting area North Central Area 3, 2012 Source: Employment Security Department/LMPA, Agricultural Employment and Wage survey
Covered seasonal employment, North Central Area 3Activity Jan Feb Mar Apr May Jun Jul Aug Sep Oct Nov Dec AverageTotal** 3,383 3,664 4,390 5,010 5,413 13,621 29,106 19,322 16,490 14,876 6,822 4,136 10,519Apples, total 2,101 2,317 2,786 3,884 3,248 6,628 3,271 3,979 12,938 13,617 5,123 2,539 5,203Apple pruning 1,304 1,722 1,910 1,562 789 * 0 53 87 71 847 2,213 880Apple thinning * * 0 46 843 5,104 2,435 1,525 644 * 0 0 883Apple harvester 0 0 0 0 0 41 278 616 11,504 13,088 3,147 95 2,397Apple sort, grade, pack 640 571 314 161 186 * 316 0 499 0 405 27 260
Other apple activities 153 * 562 2,115 1,430 1,475 242 1,785 204 455 724 204 780Cherries, total 515 609 627 430 1,040 3,640 22,462 13,752 960 274 586 313 3,767Cherry pruning 478 605 565 232 381 49 0 0 0 0 442 279 253Cherry harvester 0 0 0 0 0 1,661 20,667 13,310 585 0 0 0 3,019Other cherry activity 37 * 62 198 659 1,930 1,795 442 375 274 144 34 496Pears, total 459 342 333 178 361 993 532 528 1,989 496 437 960 634Pear pruning 448 298 281 174 30 21 37 0 0 26 344 933 216Pear thinning 0 44 48 0 288 936 274 33 0 0 0 0 135Pear harvester 0 0 0 0 0 0 0 308 1,739 431 93 0 214Other pear activities * 0 * * 43 36 221 187 250 39 0 27 69Other tree fruit workers 0 * * 0 50 70 126 83 0 0 0 0 28
Other seasonal workers 308 392 637 518 714 2,290 2,715 980 603 489 676 324 887
*Monthly and annual estimates that are less than 20 workers are not reported due to insufficient information. **Totals do not add up to sum of detail breakouts due to screening out of monthly and annual estimates to ensure employer confidentiality.

2012 Agricultural Workforce Report December 2013Employment Security Department Page 69
Appendices
Appendix Figure A2-6. Employment of covered seasonal agricultural workers by crop and agricultural reporting area South Central Area 4, 2012 Source: Employment Security Department/LMPA, Agricultural Employment and Wage survey
Covered seasonal employment, South Central Area 4Activity Jan Feb Mar Apr May Jun Jul Aug Sep Oct Nov Dec AverageTotal** 3,012 3,634 3,776 6,017 6,360 10,640 11,756 9,644 11,864 11,138 6,184 2,642 7,222Apples, total 2,138 2,070 1,989 3,182 3,005 6,366 3,603 5,079 8,943 8,411 4,452 1,592 4,236Apple pruning 2,075 2,038 1,736 879 324 0 0 571 21 0 96 1,191 744Apple thinning 0 0 0 1,119 783 5,999 3,092 2,896 0 0 0 0 1,157Apple harvester 0 0 0 0 0 0 0 563 8,365 7,775 3,730 0 1,703Other apple activities 63 32 253 1,184 1,898 367 511 1,049 557 636 626 401 631Cherries, total 136 142 68 185 306 1,622 5,128 1,584 48 69 124 290 809Cherry pruning 136 142 40 * 0 0 0 103 48 69 0 223 64Cherry harvester 0 0 0 0 0 1,499 4,594 1,448 0 0 0 0 628Other cherry activity 0 0 28 178 306 123 534 33 0 0 124 67 116Pear workers 0 0 0 0 0 34 0 0 0 * 0 * *Mint workers 0 0 0 0 0 0 519 195 * 46 0 0 65Other tree fruit workers 0 0 0 70 53 0 237 0 0 0 0 0 30Asparagus workers 0 0 0 200 298 298 0 0 0 0 0 0 66Onion workers 158 131 182 413 391 747 393 736 529 323 178 23 350Potatoes, total 243 383 72 587 405 285 161 162 821 732 213 376 370Potato harvester 0 0 0 50 * 0 0 0 398 145 69 0 55Potato sort, grade, pack 48 71 23 381 315 234 72 59 295 406 39 261 184Other potato activities 195 312 49 156 87 51 89 103 128 181 105 115 131Misc. vegetable workers 0 * 42 * 126 60 318 194 453 463 * 0 140Wheat/grain workers * * * * 42 75 137 205 43 36 25 * 51Nursery workers 42 105 140 226 183 203 * 54 * 0 350 0 110Other seasonal workers 291 792 1,265 1,139 1,551 950 1,258 1,435 1,001 1,045 824 334 990
*Monthly and annual estimates that are less than 20 workers are not reported due to insufficient information. **Totals do not add up to sum of detail breakouts due to screening out of monthly and annual estimates to ensure employer confidentiality.

December 2013 2012 Agricultural Workforce ReportPage 70 Employment Security Department
Appendices
Appendix Figure A2-7. Employment of covered seasonal agricultural workers by crop and agricultural reporting area South Eastern Area 5, 2012 Source: Employment Security Department/LMPA, Agricultural Employment and Wage survey
Covered seasonal employment, South Eastern Area 5Activity Jan Feb Mar Apr May Jun Jul Aug Sep Oct Nov Dec AverageTotal** 3,871 4,136 5,378 5,248 7,141 13,981 15,621 9,786 11,310 11,099 6,599 2,773 8,079Apples, total 2,056 2,352 2,749 2,627 3,397 2,797 5,377 3,618 7,039 8,163 5,298 937 3,868Apple pruning 1,693 2,188 2,139 605 447 0 0 0 0 * * 480 631Apple thinning 0 0 0 1,002 1,891 1,944 5,044 2,092 392 0 0 0 1,030Apple harvester 0 0 0 0 0 0 0 544 5,904 8,114 4,883 400 1,654Other apple activities 363 164 610 1,020 1,059 853 333 982 743 47 396 57 552Cherries, total 868 198 309 119 301 7,711 4,749 195 * 0 0 291 1,229Cherry pruning 868 193 242 66 84 * 0 * * 0 0 194 140Cherry harvester 0 0 0 0 0 7,328 4,734 0 0 0 0 0 1,005Other cherry activity 0 * 67 53 217 368 * 190 0 0 0 97 84Other tree fruit workers * 0 * 105 163 159 0 96 0 0 0 0 44Grape workers 270 821 1,235 988 631 767 955 432 510 1,118 313 90 678Asparagus workers 0 0 0 62 698 596 29 50 0 0 0 0 120Hop workers 0 0 0 104 81 133 0 0 0 0 0 0 27Onion workers 194 200 179 393 603 584 646 1,157 972 327 641 1,040 578Potatoes, total 201 * 313 485 426 486 59 697 873 958 134 31 389Potato harvester 0 0 0 0 0 0 0 140 372 287 91 0 74Potato sort, grade, pack 196 0 234 379 358 411 0 443 * * 0 0 170Other potato activities * * 79 106 68 75 59 114 490 659 43 31 145Misc. vegetable workers * * 22 70 147 35 570 1,148 425 35 0 0 205Wheat/grain workers 0 * 102 80 91 85 130 350 156 56 44 * 93Nursery workers 0 0 0 0 0 0 0 0 53 0 0 94 *Strawberry workers 0 0 0 0 0 0 0 24 0 0 0 0 *Other seasonal workers 269 540 464 215 603 628 3,106 2,019 1,275 442 169 272 834
*Monthly and annual estimates that are less than 20 workers are not reported due to insufficient information. **Totals do not add up to sum of detail breakouts due to screening out of monthly and annual estimates to ensure employer confidentiality.

2012 Agricultural Workforce Report December 2013Employment Security Department Page 71
Appendices
Appendix Figure A2-8. Employment of covered seasonal agricultural workers by crop and agricultural reporting area Eastern Area 6, 2012 Source: Employment Security Department/LMPA, Agricultural Employment and Wage survey
Covered seasonal employment, Eastern Area 6Activity Jan Feb Mar Apr May Jun Jul Aug Sep Oct Nov Dec AverageTotal** 196 152 159 223 318 548 818 1,159 865 529 152 146 439Wheat/grain, total 30 25 29 73 123 192 235 779 394 211 100 60 188Wheat/grain harvester 0 0 0 0 0 48 38 415 249 46 * * 67Wheat/grain equipment operator 0 0 0 42 53 24 25 260 90 65 43 22 52
Other wheat/grain activity 30 25 29 31 70 120 172 104 55 100 51 32 68
Nursery workers 31 29 * 89 82 26 32 21 0 * * 0 28Other seasonal workers 135 98 119 61 113 330 551 359 471 312 40 86 223
*Monthly and annual estimates that are less than 20 workers are not reported due to insufficient information. **Totals do not add up to sum of detail breakouts due to screening out of monthly and annual estimates to ensure employer confidentiality.
Appendix Figure A2-9. Average hourly before-tax earnings, apples, cherries and pears, current and inflation-adjusted dollars, CPI-W 2011 = 100 Washington state, 2002 through 2012 Source: Employment Security Department/LMPA, Unemployment Insurance Wage File
YearApples,
current dollars
Apples,inflation-
adjusted dollarsCherries,
current dollars
Cherries,inflation-
adjusted dollarsPears,
current dollars
Pears,inflation-
adjusted dollars2002 $9.83 $12.38 $10.79 $13.59 $9.47 $11.932003 $9.75 $12.02 $11.58 $14.28 $9.99 $12.322004 $10.06 $12.08 $11.33 $13.60 $9.83 $11.802005 $10.31 $11.96 $11.68 $13.55 $10.49 $12.172006 $11.42 $12.83 $14.32 $16.09 $11.02 $12.382007 $12.22 $13.36 $16.88 $18.45 $14.27 $15.602008 $12.19 $12.80 $16.48 $17.31 $13.45 $14.132009 $12.14 $12.83 $16.07 $16.99 $12.47 $13.182010 $11.90 $12.32 $13.17 $13.63 $11.91 $12.332011 $12.45 $12.45 $14.44 $14.44 $12.26 $12.262012 $13.13 $12.84 $15.65 $15.31 $12.95 $12.67

December 2013 2012 Agricultural Workforce ReportPage 72 Employment Security Department
Appendices
Appendix Figure A4-1. Median wage rates for H-2A workers by type of pruning, thinning or harvest activity, selected crops and orchard configurations Washington state, 2011 Source: U.S. Department of Labor, Employment and Training Administration, Office of Foreign Labor Certification, Agricultural Online Wage Library
Type of fruit, activity and orchard configuration Pay ratesGolden apple, harvest - all cultivations $20.00 per bin (47 inch X 47 inch X 24 1/2 inch)Golden apple, harvest - strip picking, medium density, trellised $20.00 per bin (47 inch X 47 inch X 24 1/2 inch)Golden apple, harvest - strip picking, low density, non-trellised $19.00 per bin (47 inch X 47 inch X 24 1/2 inch)Golden apple, harvest - strip picking, medium density, non-trellised $18.00 per bin (47 inch X 47 inch X 24 1/2 inch)Pink Lady apple, harvest - all cultivations $23.25 per bin (47 inch X 47 inch X 24 1/2 inch)Pink Lady apple, harvest - strip picking, medium density, trellised $25.00 per bin (47 inch X 47 inch X 24 1/2 inch)Pink Lady apple, harvest - color picking, medium density, trellised $20.00 per bin (47 inch X 47 inch X 24 1/2 inch)Pink Lady apple, harvest - strip picking, high density, trellised $25.00 per bin (47 inch X 47 inch X 24 1/2 inch)Pink Lady apple, harvest - strip picking, medium density, non-trellised $20.00 per bin (47 inch X 47 inch X 24 1/2 inch)Braeburn apple, harvest - all cultivations $20.00 per bin (47 inch X 47 inch X 24 1/2 inch)Braeburn apple, harvest - strip picking, medium density, trellised $20.00 per bin (47 inch X 47 inch X 24 1/2 inch)Braeburn apple, harvest - strip picking, medium density, non-trellised $17.00 per bin (47 inch X 47 inch X 24 1/2 inch)Braeburn apple, harvest - color picking, medium density, non-trellised $25.00 per bin (47 inch X 47 inch X 24 1/2 inch)Fuji apple, harvest - all cultivations $25.00 per bin (47 inch X 47 inch X 24 1/2 inch)Fuji apple, harvest - strip picking, medium density, trellised $25.00 per bin (47 inch X 47 inch X 24 1/2 inch)Fuji apple, harvest - color picking, medium density, trellised $24.00 per bin (47 inch X 47 inch X 24 1/2 inch)Fuji apple, harvest - strip picking, low density, non-trellised $30.00 per bin (47 inch X 47 inch X 24 1/2 inch)Fuji apple, harvest - strip picking, medium density, non-trellised $22.00 per bin (47 inch X 47 inch X 24 1/2 inch)Gala apple, harvest - all cultivations $20.00 per bin (47 inch X 47 inch X 24 1/2 inch)Gala apple, harvest - color picking, medium density, trellised $22.00 per bin (47 inch X 47 inch X 24 1/2 inch)Gala apple, harvest - strip picking, medium density, trellised $18.00 per bin (47 inch X 47 inch X 24 1/2 inch)Gala apple, harvest - strip picking, low density, non-trellised $18.00 per bin (47 inch X 47 inch X 24 1/2 inch)Gala apple, harvest - strip picking, medium density, non-trellised $22.00 per bin (47 inch X 47 inch X 24 1/2 inch)Gala apple, harvest - color picking, medium density, non-trellised $20.00 per bin (47 inch X 47 inch X 24 1/2 inch)Granny Smith apple, harvest - all cultivations $20.00 per bin (47 inch X 47 inch X 24 1/2 inch)Granny Smith apple, harvest - strip picking, medium density, trellised $20.00 per bin (47 inch X 47 inch X 24 1/2 inch)Granny Smith apple, harvest - strip picking, medium density, non-trellised $18.00 per bin (47 inch X 47 inch X 24 1/2 inch)Granny Smith apple, harvest - strip picking, low density, non-trellised $20.00 per bin (47 inch X 47 inch X 24 1/2 inch)Honey Crisp apple, harvest - all cultivations $20.00 per bin (47 inch X 47 inch X 24 1/2 inch)Honey Crisp apple, harvest - strip picking, medium density, trellised $20.00 per bin (47 inch X 47 inch X 24 1/2 inch)Honey Crisp apple, harvest - color picking, medium density, trellised $26.00 per bin (47 inch X 47 inch X 24 1/2 inch)Honey Crisp apple, harvest - strip picking, low density, non-trellised $25.00 per bin (47 inch X 47 inch X 24 1/2 inch)Honey Crisp apple, harvest - color picking, low density, non-trellised $25.00 per bin (47 inch X 47 inch X 24 1/2 inch)Red Delicious apple, harvest - all cultivations $17.00 per bin (47 inch X 47 inch X 24 1/2 inch)Red Delicious apple, harvest - strip picking, medium density, non-trellised $17.00 per bin (47 inch X 47 inch X 24 1/2 inch)Red Delicious apple, harvest - strip picking, low density, non-trellised $17.00 per bin (47 inch X 47 inch X 24 1/2 inch)Red Delicious apple, harvest - strip picking, medium density, trellised $16.00 per bin (47 inch X 47 inch X 24 1/2 inch)Apple tree, thinning - all cultivations $8.67 per hourApple tree, thinning - medium tree size, low density, non-trellised $9.00 per hourApple tree, thinning - medium tree size, medium density, trellised $9.00 per hourApple tree, thinning - medium tree size, medium density, non-trellised $8.67 per hourApple tree, thinning - medium tree size, high density, trellised $8.67 per hourApple tree, thinning - medium tree size, low density, trellised $8.67 per hourApple tree, thinning - large tree size, low density, non-trellised $8.75 per hour

2012 Agricultural Workforce Report December 2013Employment Security Department Page 73
Appendices
Appendix Figure A4-1. (continued)
Type of fruit, activity and orchard configuration Pay ratesRed cherry, harvest - all cultivations $5.00 per 30 lb. lugRed cherry, harvest - medium density, medium tree size $5.00 per 30 lb. lugRed cherry, harvest - low density, large tree size $5.00 per 30 lb. lugRed cherry, harvest - low density, medium tree size $5.00 per 30 lb. lugYellow cherry, harvest - all cultivations $5.00 per 20 lb. lugYellow cherry, harvest - low density, medium tree size $5.00 per 20 lb. lugYellow cherry, harvest - low density, small tree size $6.00 per 20 lb. lugYellow cherry, harvest - medium density, medium tree size $5.50 per 20 lb. lugD’Anjou pear, harvest - all cultivations $19.00 per bin (47 inch X 47 inch X 24 1/2 inch)D’Anjou pear, harvest - medium tree size $20.00 per bin (47 inch X 47 inch X 24 1/2 inch)D’Anjou pear, harvest - large tree size $18.00 per bin (47 inch X 47 inch X 24 1/2 inch)Bartlett pear, harvest - all cultivations $18.00 per bin (47 inch X 47 inch X 24 1/2 inch)Bartlett pear, harvest - medium tree size $18.00 per bin (47 inch X 47 inch X 24 1/2 inch)Bartlett pear, harvest - large tree size $18.00 per bin (47 inch X 47 inch X 24 1/2 inch)Bartlett pear, harvest - small tree size $18.00 per bin (47 inch X 47 inch X 24 1/2 inch)Golden apple, harvest - strip picking, medium density, non-trellised $20.00 per bin (47 inch X 47 inch X 24 1/2 inch)Pink Lady apple, harvest - strip picking, medium density, trellised $23.25 per bin (47 inch X 47 inch X 24 1/2 inch)Braeburn apple, harvest - strip picking, medium density, non-trellised $20.00 per bin (47 inch X 47 inch X 24 1/2 inch)Fuji apple, harvest - strip picking, low density, non-trellised $25.00 per bin (47 inch X 47 inch X 24 1/2 inch)Gala apple, harvest - strip picking, medium density, trellised $20.00 per bin (47 inch X 47 inch X 24 1/2 inch)Granny Smith apple, harvest - strip picking, medium density, trellised $20.00 per bin (47 inch X 47 inch X 24 1/2 inch)Honey Crisp apple, harvest - strip picking, medium density, trellised $20.00 per bin (47 inch X 47 inch X 24 1/2 inch)Red Delicious apple, harvest - strip picking, low density, non-trellised $17.00 per bin (47 inch X 47 inch X 24 1/2 inch)Apple tree, thinning $8.67 per hourRed cherry, harvest $5.00 per 30 lb. lugYellow cherry, harvest $5.00 per 20 lb. lugD’Anjou pear, harvest $19.00 per bin (47 inch X 47 inch X 24 1/2 inch)Bartlett pear, harvest $18.00 per bin (47 inch X 47 inch X 24 1/2 inch)Granny Smith apple, harvest - strip picking, low density, non-trellised $18.00 per bin (47 inch X 47 inch X 24 1/2 inch)Honey Crisp apple, harvest No finding1
Junami apple, harvest No finding1
Cameo apple, harvest No finding1
Lady Alice apple, harvest No finding1
Bosc pears, harvest No finding1
Golden apple, harvest - strip picking, medium density, non-trellised $17.00 per bin (47 inch X 47 inch X 24 1/2 inch)Pink Lady apple, harvest - strip picking, medium density, trellised $17.00 per bin (47 inch X 47 inch X 24 1/2 inch)Braeburn apple, harvest - strip picking, medium density, non-trellised $17.00 per bin (47 inch X 47 inch X 24 1/2 inch)Red Delicious apple, harvest - strip picking, low density, non-trellised $15.00 per bin (47 inch X 47 inch X 24 1/2 inch)Fuji apple, harvest - strip picking, low density, non-trellised $22.00 per bin (47 inch X 47 inch X 24 1/2 inch)Gala apple, harvest - strip picking, medium density, trellised $20.00 per bin (47 inch X 47 inch X 24 1/2 inch)
1For all criteria job orders, if a prevailing wage determination results in a No Finding for the particular crop activity, the employer shall offer and pay the worker(s) the legal state or Federal minimum, the agreed-upon collective bargaining wage rate or the Adverse Effect Wage Rate (AEWR) for that state, whichever is highest.
December 2013 2012 Agricultural Workforce ReportPage 74 Employment Security Department
Appendices

2012 Agricultural Workforce Report December 2013Employment Security Department Page 75
GlossaryFollowing are definitions of terms and concepts used in this report.
Current dollars – The dollar value or price of a good or service that is not adjusted for inflation in the economy. In general, when there is a continuous increase in the general price level over time it is not correct to compare the dollar value of goods or services between time periods in current dollar prices, especially as the time interval increases.
Foreign exchange rate – This is the price of one international currency in terms of another. This is also termed the exchange rate.
Inflation-adjusted dollars – The adjustment of the dollar value or price of a good or service to compensate for general inflation in the economy over time. Inflation adjustment of a good or service relative to some base year of comparison allows one to observe changes in what is termed the real value of that good or service over time.
Input-output table – An economic model and analytical technique that simultaneously relates all of the inputs bought by a given production sector from all other production sectors in the economy and at the same time also relates all of the outputs of that sector sold to all other productive sectors. This model is also known as inter-industry analysis.
Multiplier – With respect to input-output analysis, the process whereby the addition of one more unit of output or expenditure in the economy generates additional output, employment or income.
NAICS – The North American Industry Classification System developed using a production-oriented conceptual framework, groups establishments into industries based on the activity in which they are primarily engaged. Establishments using similar raw material inputs, similar capital equipment and similar labor are classified in the same industry. In other words, establishments that do similar things in similar ways are classified together. See: http://www.bls.gov/bls/naics.htm.
Not seasonally adjusted – This term is used to describe data series that have not been subjected to the seasonal-adjustment process. In other words, the effects of regular or seasonal patterns have not been removed from these series.
Seasonal worker – A person employed in work of a seasonal or other temporary nature who is not required to be absent overnight from his or her permanent place of residence. The same exceptions previously listed for migrant agricultural worker apply here.
Shortage of labor – There is no official definition of a labor shortage. Empirically, a shortage is the difference between the quantity of labor supplied and the quantity of labor demanded when the hourly wage rate (or its piece-rate equivalent) lies below the equilibrium market wage rate – the wage rate that exactly balances the quantity supplied and the quantity demanded. The shortage concept can also be thought of as excess demand at the price or wage currently being offered. For this kind of shortage to exist, the wage rate being offered is below what workers are willing to accept. Increasing the wage rate will tend to reduce or eliminate the shortage.
Value added – In general, the difference between the price at which some quantity of output can be sold, such as a metric ton of apples and the cost of all intermediate inputs used to produce that output. Gasoline and fertilizer would be intermediate inputs since these inputs are purchased from other producers. However, inputs provided directly by the producer or grower, such as the labor of the agricultural producer and any labor hired by him or her, is a contribution to value added.
Wage bill – The product of the earnings or wages paid to workers times the number of workers hired. From the growers and society’s standpoint, this is a cost of production. From society’s standpoint this is also a contribution to value added.