Embed Size (px)
DESCRIPTION
retergergrg gfregrgerg fragrgr rgargar rgarg rr g
Citation preview
Int. J. Computers in Healthcare, Vol. 1, No. 4, 2012 283
Copyright © 2012 Inderscience Enterprises Ltd.
A case study on monitoring reaction times with a wearable user interface during daily life
Burcu Cinaz* and Bert Arnrich ETH Zurich, Electronics Laboratory, Gloriastrasse 35, 8092 Zurich, Switzerland E-mail: [email protected] E-mail: [email protected] *Corresponding author
Roberto La Marca Department of Psychology, University of Zurich, 8050 Zurich, Switzerland E-mail: [email protected]
Gerhard Tröster ETH Zurich, Electronics Laboratory, Gloriastrasse 35, 8092 Zurich, Switzerland E-mail: [email protected]
Abstract: Reaction time tests are known as sensitive tests for measuring cognitive efficiency, cognitive decline, early attention complaints, and memory impairments. A main drawback of existing computer-based reaction time tests is their incompatibility with daily life. As a consequence, it is not feasible so far to assess variations in cognitive efficiency which are caused by influencing factors occurring in daily life. In order to overcome this limitation, in recent work, we have designed and implemented a wearable watch-like reaction time test tool. In this contribution, we present a case study when employing the wearable reaction time test in the work environment of a graphic designer. We show that our tool allows to continuously collect reaction times throughout 15 working days. Besides collecting reaction times, we employed an experience sampling method to gather subjective data on mood and perceived workload. The correlation analysis showed that mean reaction time is significantly positive correlated with mental and temporal demand. High level of arousal results in slowing of reaction times and higher variability whereas a low arousal results in lower variability of reaction times.
Keywords: wearable computing; reaction time test; user interface; wearable reaction time test; case study; cognitive efficiency.
Reference to this paper should be made as follows: Cinaz, B., Arnrich, B., La Marca, R. and Tröster, G. (2012) ‘A case study on monitoring reaction times with a wearable user interface during daily life’, Int. J. Computers in Healthcare, Vol. 1, No. 4, pp.283–303.
284 B. Cinaz et al.
Biographical notes: Burcu Cinaz received her Bachelor in Business Informatics at Marmara University in Istanbul in 2004 and Diploma in Computer Science at the University of Bremen in Germany in 2008. Since 2009, she is a PhD student at the Wearable Computing Laboratory of ETH Zurich, Switzerland.
Bert Arnrich received his Diploma in Natural Science Informatics (Dipl.-Inform.) (MSc) from the University of Bielefeld, Germany in 2001 and Doctor of Engineering Sciences (Dr.-Ing.) (PhD) in 2006. Since 2006, he is a Senior Researcher at the Wearable Computing Laboratory of ETH Zurich, Switzerland.
Roberto La Marca received his Master Diploma in Psychology, Psychopathology, and Labour Law in 2005. In 2009, he received his PhD in Psychology and Neuroscience. He is a Senior Researcher at the University of Zurich, an Honorary Research Fellow at the University College London, and a member of the Wearable Computing Laboratory of ETH Zurich.
Gerhard Tröster studied electrical engineering in Darmstadt and Karlsruhe, Germany, earning his Doctorate in 1984 at the Technical University of Darmstadt about the design of analogue integrated circuits. Since 1993, he directs the Electronics Laboratory at ETH Zurich.
This paper is a revised and expanded version of a paper entitled ‘Monitoring of cognitive functioning by measuring reaction times with wearable devices’ presented at the First International Workshop on Pervasive Care for People with Dementia and their Carers (PCPDC-2011), Dublin, Republic of Ireland, May 2011.
1 Introduction
Reaction time tests measure how rapidly stimuli information can be processed and a response to it can be activated (Luce, 1986). In other words, reaction time tests measure the elapsed time between the occurrence of a stimulus and the individual’s response to it. Since the middle of the 19th century, reaction time has been extensively investigated by experimental psychologists. In the last decades, several computer-based reaction time tests have been developed in which a subject has to respond to visual stimuli by using keyboard, mouse or special buttons. According to Jensen (2006), reaction time tests are well suited for cognitive assessment tests since reaction time tests offer a high sensitivity for detecting variation in cognitive efficiency and they can be repeated virtually an unlimited amount of times. An extensive review about computer-based cognitive tests can be found in Wild et al. (2008). There are several examples on how reaction time tests are applied to assess variations in cognitive functioning, such as detection of cognitive decline or determination of the ability to manage complex activities like driving, piloting, search and rescue. For example, Kosinski (2009) reported that cognitive impairment influences length and variability of reaction times. In Gorus et al. (2008), it was shown that persons with cognitive deterioration demonstrated more intra-individual performance variability and more slowing in their reaction time than cognitively healthy elderly. Further, Braverman et al. (2010) showed that a reaction time test is an accurate predictor of early attention complaints and memory impairments.
A case study on monitoring reaction times with a wearable user interface 285
The main drawback of existing computer-based reaction time tests is their incompatibility with daily life since subjects have to interrupt their daily routine for several minutes and provide their full attention in order to perform the reaction time test. This restriction prohibits the measurement of cognitive efficiency during daily routine tasks. As a consequence, it is not feasible so far to assess variations in cognitive efficiency which are caused by influencing factors occurring in daily life like variations in cognitive load during work or activities of daily life. In order to overcome this limitation, in previous work, we have designed and implemented a wearable watch-like reaction time test tool which allows to collect reaction times throughout daily life. Instead of a visual stimulus a haptic stimulus is employed from time to time and instead of a keyboard response the user is able to react with a simple hand movement. Haptic stimulus was chosen since the visual and auditory channel is often already occupied for everyday life tasks. User’s hand movement response is automatically recognised with an integrated inertial measurement unit (IMU) and thus the reaction time to the haptic stimulus can be measured.
In order to show to what extent the wearable reaction time test is an accurate new tool to measure reaction times, in recent work we have conducted an experiment in which we analysed the reaction times of 20 subjects in an idle condition and under cognitive load (Cinaz et al., 2012). During the idle condition, subjects had to perform the wearable reaction time test followed by operating a state of the art desktop-based reaction time test. In order to influence length and variability of reaction times, we applied cognitive load to all subjects in a separate load condition. Here, the subjects had to solve mental tasks in addition to performing the reaction time test. Like in the first idle condition, subjects had to perform the wearable reaction time test followed by operating a state of the art desktop-based reaction time test. The results showed that the mean reaction times of the subjects were always increased during the load condition compared to the idle condition in wearable and desktop settings. Second, it could be observed that the variability of reaction times was increased during the load condition in both wearable and desktop settings. Based on the achieved results, we could show that the wearable reaction time test is an accurate tool to measure variations in length and variability of reaction times.
In this contribution, we extend our work by transferring our approach from controlled laboratory settings to an unrestricted daily life environment. In a case study, we present our methods and findings when employing the wearable reaction time test tool in the daily work life of a graphic designer. We continuously collected reaction time data and self-experience ratings on mood and workload throughout 15 working days. The first three working days were characterised by normal job demands, which we denote as ‘baseline’ measurement. During the remaining 12 days, the designer was confronted with four workload factors that are common when a designer has to deliver a creative outcome in a limited time: stress, sleep deprivation, night shift, and moderate alcohol consumption.
In this case study, we target four main topics:
1 continuously monitoring of reaction times in a real world working setting without interrupting the daily routine of a graphic designer
2 investigating the observed variations in length and variability of reaction times regarding the four workload factors
286 B. Cinaz et al.
3 investigating the correlations between reaction time features and perceived workload
4 investigating the correlations between reaction time features and subjective ratings on mood.
In the following, we first present related work. Next, we describe our wearable reaction time test implementation. Afterwards, we explain the real life employment followed by data analysis methods. Finally, we present and discuss the achieved results and provide a conclusion and an outlook.
2 Related work
There exist mainly three kinds of reaction time tests: simple, recognition and choice reaction time tests (Kosinski, 2009). Simple reaction time tests consist of one stimulus and one response. In desktop-based simple reaction time tests, a dedicated stimulus is temporary shown at random time intervals on the screen. The subject has to concentrate on the appearance of the stimulus and every time the subject recognises the stimulus he has to press a dedicated key as fast as possible. Differently, in recognition reaction time tests, the subject has to differentiate between a dedicated stimulus (target) and other stimuli (non-target). This is sometimes called ‘go/no-go’ reaction time task. In desktop-based go/no-go tests the target stimulus and the non-target stimuli are temporary shown in a random sequence on the screen. The subject has to be attentive to the appearance of the target stimulus and ignore the non-target stimuli. As soon as the subject recognises the target, he has to respond as fast as possible by pressing a dedicated key. Lastly, choice reaction time tests include multiple stimuli and multiple responses. The subject has to respond to each stimulus with a corresponding response, e.g., by pressing a certain key whenever a corresponding letter appears on the screen. A detailed series of recommendations on how to conduct laboratory experiments using reaction time tests and how to analyse the collected data can be found in Jensen (2006), Luce (1986) and Whelan (2008).
Since reaction time has been extensively investigated for many years, there exists a broad variety of clinical studies which have been summarised in a literature review by Kosinski (2009). For example, it is known that age-related diseases like cognitive impairment are important factors which influence length and variability of reaction time. Gorus et al. (2008) showed that persons with cognitive deterioration demonstrated more intra-individual performance variability and more slowing in their reaction time than cognitively healthy elderly. Braverman et al. (2010) showed in a clinical setting that a go/no-go reaction time test is an accurate predictor of early attention complaints and memory impairments. In Vaurio et al. (2009), it was shown that children diagnosed with attention deficit hyperactive disorder (ADHD) are characterised by an increased variability in reaction time. In Scholz et al. (2009), the effect of psychosocial stress on reaction time was investigated in a controlled experimental setting. The authors were able to show that participants under stress revealed slower reaction time.
Most of the studies have in common that desktop-based reaction time tests were employed in laboratory settings which require the full attention of the subject for several minutes. Hence, it is not feasible so far to measure reaction times during everyday-life in
A case study on monitoring reaction times with a wearable user interface 287
order to assess variations in cognitive efficiency which are caused by influencing factors occurring in daily life like variations in cognitive load during work or activities of daily life. Only a few studies exist which investigated the feasibility of measuring reaction times during everyday activities. Lieberman et al. (2007) implemented a wrist-worn reaction time device to assess vigilance. Visual and auditory stimuli were generated with three LEDs and a miniature speaker. The user had to react by pressing one of the two push buttons on the device. Ivorra et al. (2008) implemented a haptic stimulus to interrogate the central nervous system in a minimally obtrusive way. As the response the detection of a wrist movement is defined. In a first feasibility study, they showed that a simple reaction time test can be continuously administered throughout the course of normal life activities. However, an evaluation of the wearable implementation in comparison with state of the art desktop-based reaction time tests is missing and the obtained reaction times were not further analysed. In our recent work (Cinaz et al., 2011), we followed the approach of Ivorra et al. (2008) and designed a wearable reaction time device which combines the generation of haptic stimuli and the recognition of forearm rotation as subject’s response.
3 Wearable reaction time test
3.1 System design
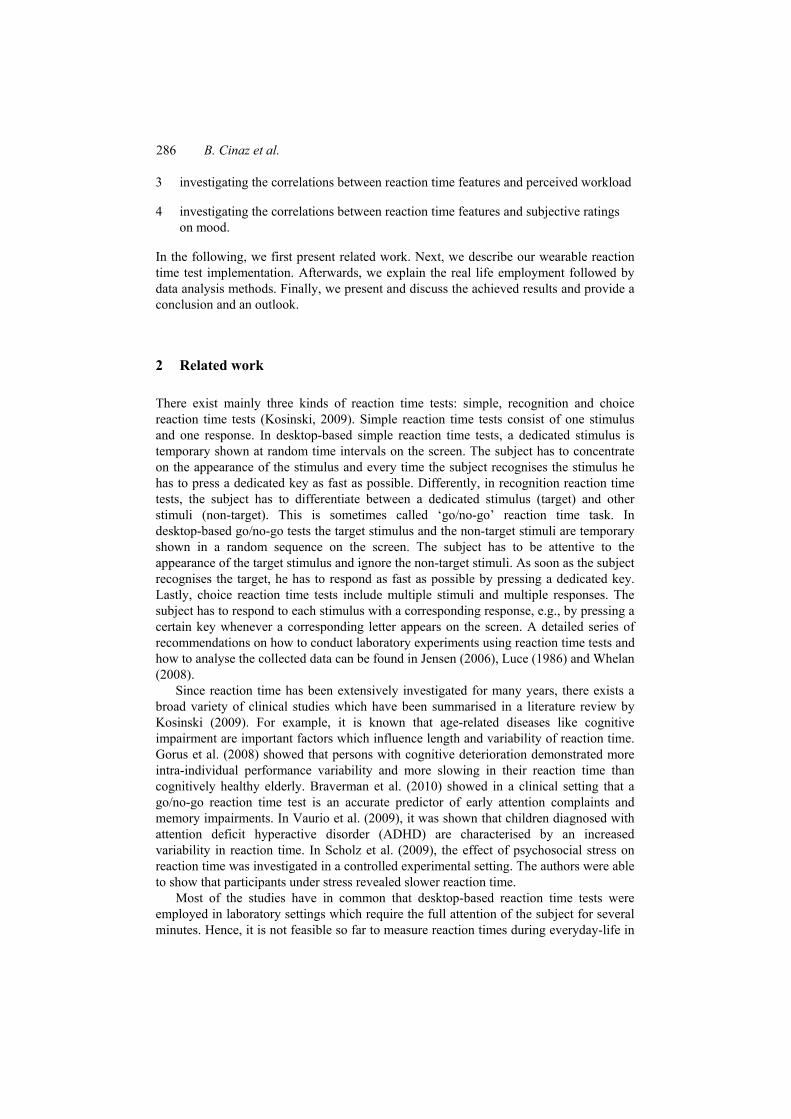
In our previous work, we have designed and implemented a watch-like wearable user interface to measure reaction time (Cinaz et al., 2011). The main design goal was to enable a mobile measurement of reaction time throughout daily life. In order to achieve this goal, we replaced the state of the art visual stimuli by haptic stimuli which can be recognised without paying continuous attention to it. Second, we replaced the state of the art push buttons by detecting a dedicated rotation of the forearm as response to the stimuli. As a result the wearable reaction time test consists of two main modules: a stimulus module generating haptic stimuli and an IMU module detecting forearm rotations. We applied the haptic stimuli on the wrist since according to the literature the wrist is a recommended stimulus site for wearable tactile displays (Chen et al., 2008; Lee and Starner, 2010; Matscheko et al., 2010; Oakley et al., 2006). For generating vibro-tactile stimuli, we used a coreless mini DC vibration motor. In order to maximise the vibration amplitude and to ensure a proper sense of the vibration, we placed the motor in a separate plastic enclosure. In order to guarantee a continuous operation during at least one day, the stimuli module has its own battery supply. In addition, we integrated an audio driver in order to allow the generation of auditory stimuli through headphones. The IMU module consists of the so-called ETHOS which includes a three-axis accelerometer and gyroscope to recognise the subject’s gesture response (Harms et al., 2010). The accelerometer and gyroscope is sampled with a frequency of 128 Hz. An implementation of a wearable simple reaction time test can be seen in Figure 1. The detailed description of the hardware platform can be found in Cinaz et al. (2011) and Harms et al. (2010).
We modified the firmware version of the ETHOS to control the haptic stimuli module. Similar to the wearable reaction time test presented in Ivorra et al. (2008), we have defined the response gesture as a fast rotation of the forearm.
288 B. Cinaz et al.
3.2 Evaluation in a laboratory experiment
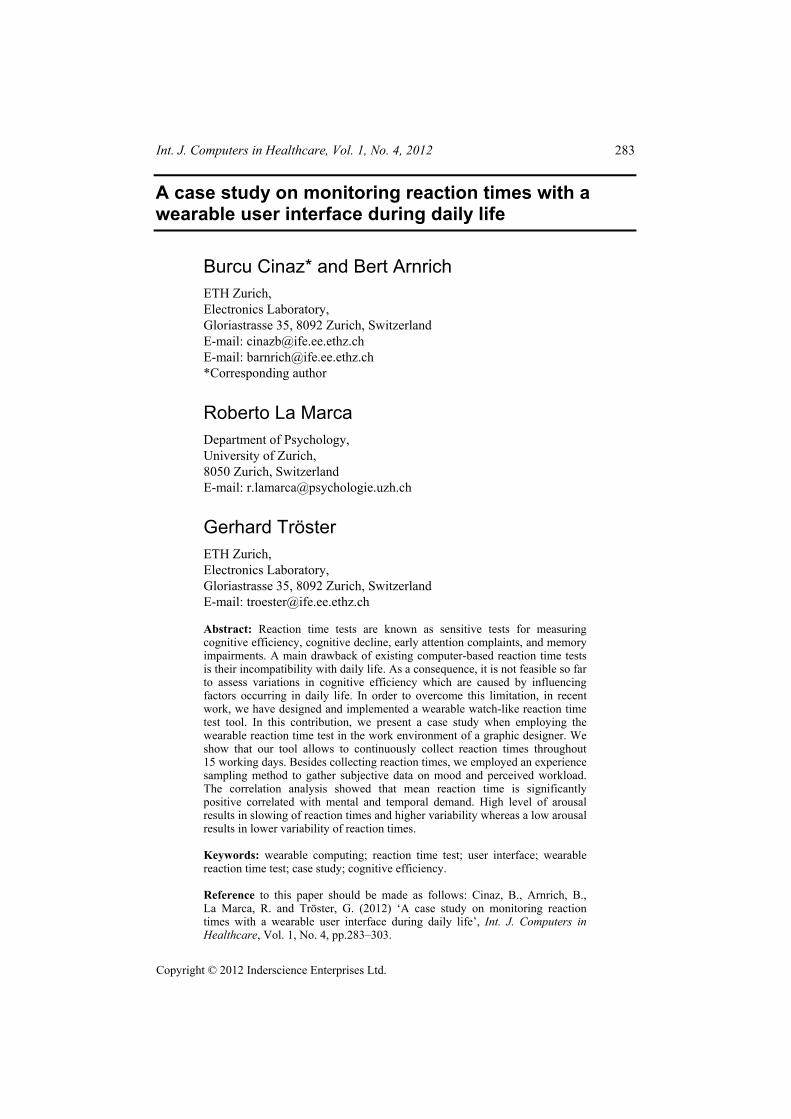
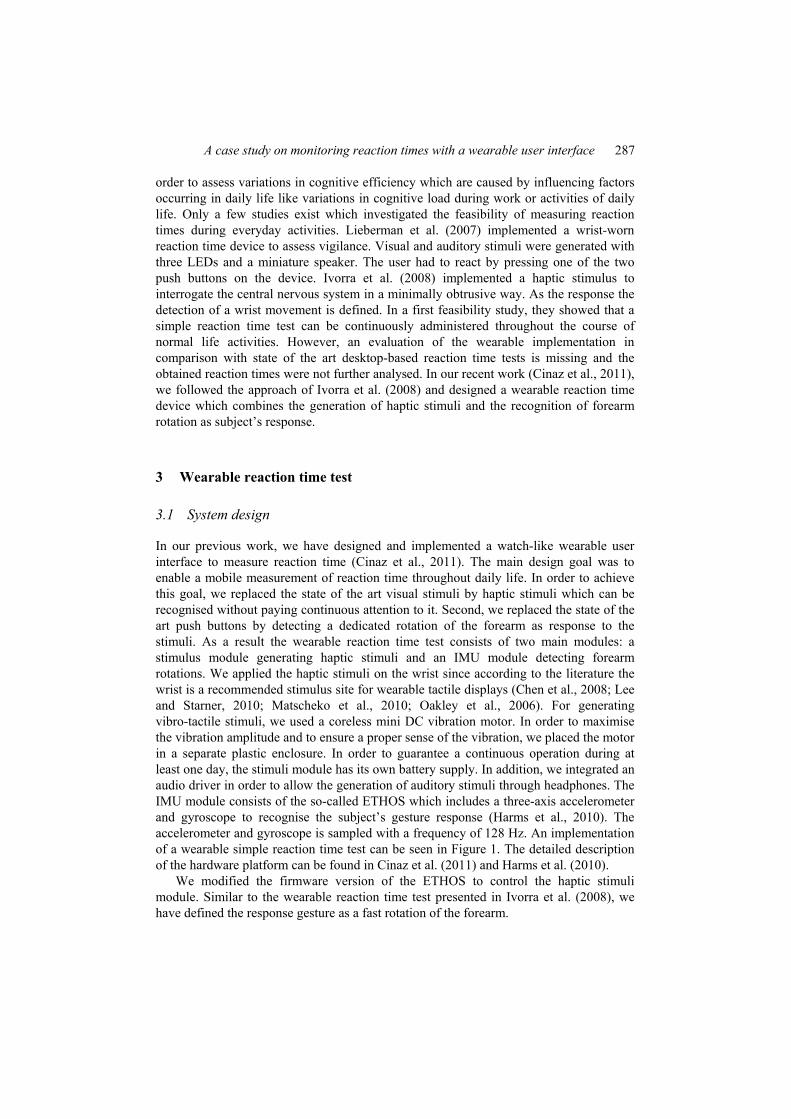
In our recent work, we have implemented a wearable go/no-go task (Cinaz et al., 2012). In order to evaluate the wearable interface, we have conducted an experiment to compare the reaction times obtained by the wearable interface with those collected by a desktop-based reaction time test. For the desktop-based reaction time test, we used a free version of the go/no-go TOVA test (PEBL, http://pebl.sourceforge.net/; Forbes, 1998). As exemplary shown in Figure 2, a white square appears for 100 ms on the screen, with a black square within it. Participant must respond only to targets (the black square on top) and ignore the non-targets (the black square on the bottom). Each stimulus is presented at 2,000 ms intervals. A wearable implementation of the TOVA test is shown in the lower part of Figure 2. Participant must respond only if they perceive a haptic stimulus on the lower side of the forearm (target) and ignore the haptic stimulus on the upper side of the forearm (non-target). Similar to the desktop-based reaction time test, each haptic stimulus of the wearable device is generated for 100 ms at 2,000 ms intervals.
Figure 1 Wearable implementation of a simple reaction time test (see online version for colours)
Notes: The haptic stimuli are generated as vibrations on the lower side of the wrist. The IMU is placed on the opposite side to recognise the user’s hand gesture responses.
Figure 2 (a) Target and non-target stimulus types of the TOVA test (b) implementation of a wearable TOVA test (see online version for colours)
(a)
(b)
A case study on monitoring reaction times with a wearable user interface 289
Each setting (desktop-based vs. wearable) consisted of two experimental conditions:
1 idle condition in which the subject is just performing the reaction time test
2 cognitive load condition in which the subject is performing a cognitive performance task in parallel to the reaction time test.
As cognitive task, we employed a variant of the N-Back test, the so-called ‘Audio 2-Back’ (Brain Workshop, http://brainworkshop.sourceforge.net; Jaeggi et al., 2008). In the Audio 2-Back task, a letter is presented to the subject via an audio message in regular time intervals. The subject must only respond if the currently pronounced letter is the same as the one that was pronounced two positions back. Since the subject has to memorise the two prior letters and has to perform a comparison with the current letter in time, this task induces additional cognitive load. Whenever a sound match occurs, the subject has to say ‘match’. In order to keep the subject engaged in the second task, the experiment leader continuously controls the answer of the subject and provides direct feedback to the subject about correct and false answers. A total of 20 subjects participated in our experiment. Each subject performed four different reaction time tests in the following order:
1 desktop-based in idle condition
2 desktop-based under cognitive load
3 wearable in idle condition
4 wearable under cognitive load.
Each condition lasts 10 minutes and contains 320 stimuli (160 targets and 160 non-targets).
The results showed that subjects were always significantly slower during the cognitive load condition compared to the idle condition for both desktop and wearable settings (p < 0.001). Second, we could observe that the variability is increased during the load condition for both settings. Subjects demonstrated higher variability under load condition compared to idle condition (p < 0.001). Based on the achieved results, we concluded that our wearable reaction time test is suitable to measure factors which influence length and variability of reaction times.
4 Case study
In this case study, we employed the wearable reaction time test tool in the daily work life of a graphic designer. Since this case study was the first attempt to collect reaction times in real life, we opted for collecting reaction times with a moderate high sampling rate. We decided to collect at least 20 reaction time measurements within a 30 minutes period. As a consequence, we generated haptic stimuli at random intervals varying between 60 sec and 90 sec.
Our test subject was a 25-year-old female master student of graphic design. We conducted the case study while our subject was working on her master thesis. The topic of her master thesis was to investigate the influence of typical work-related stress factors on the design process. In total, we monitored our subject throughout 15 working days. The first three working days were characterised by normal job demands, which we denote
290 B. Cinaz et al.
as ‘baseline’ measurement. During the remaining 12 days, the designer was confronted with four workload factors that are common when a designer has to deliver a creative outcome in a limited time: stress, sleep deprivation, night shift, and moderate alcohol consumption. The case study pursues four main aims:
1 to continuously collect reaction times in a real-world working setting without interrupting the daily routine of a graphic designer
2 to investigate the observed variations in length and variability of reaction times regarding the four workload factors
3 to correlate the observed reaction time features with perceived workload ratings
4 to investigate the correlations between reaction time features and subjective ratings on mood.
In the following, we first explain the induced workload factors in more detail. Next, we describe the employed experience sampling method to collect subjective ratings on perceived workload and mood.
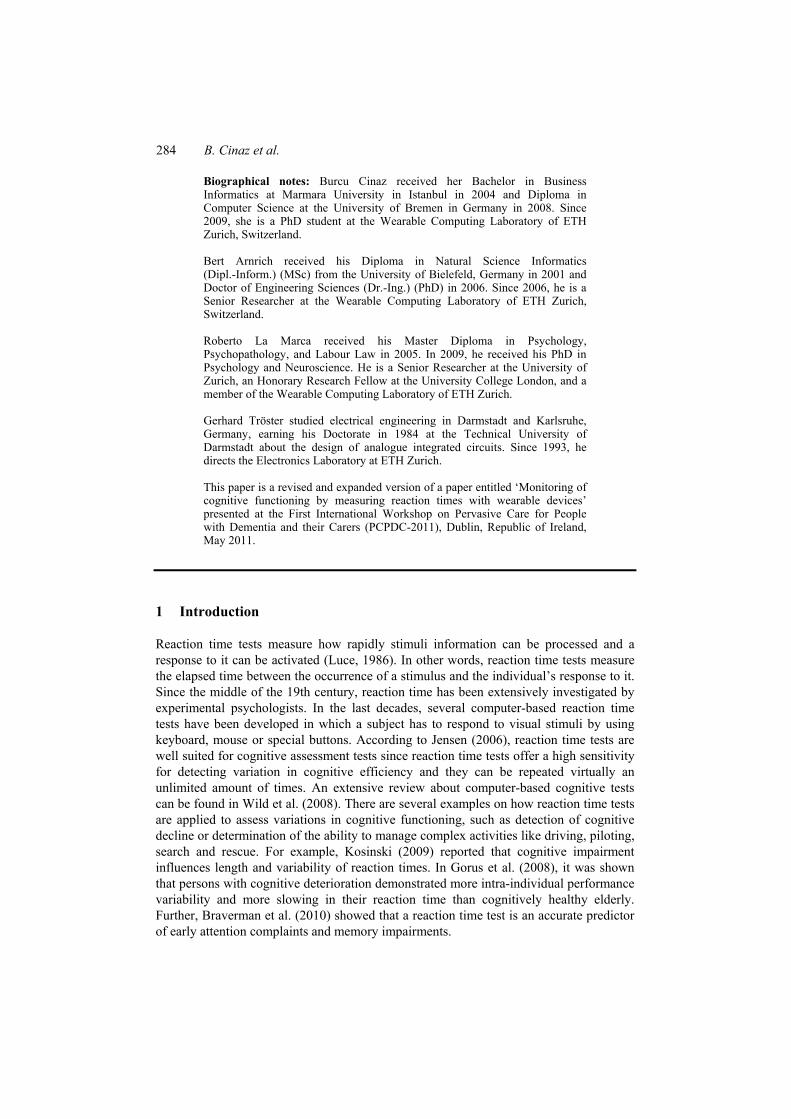
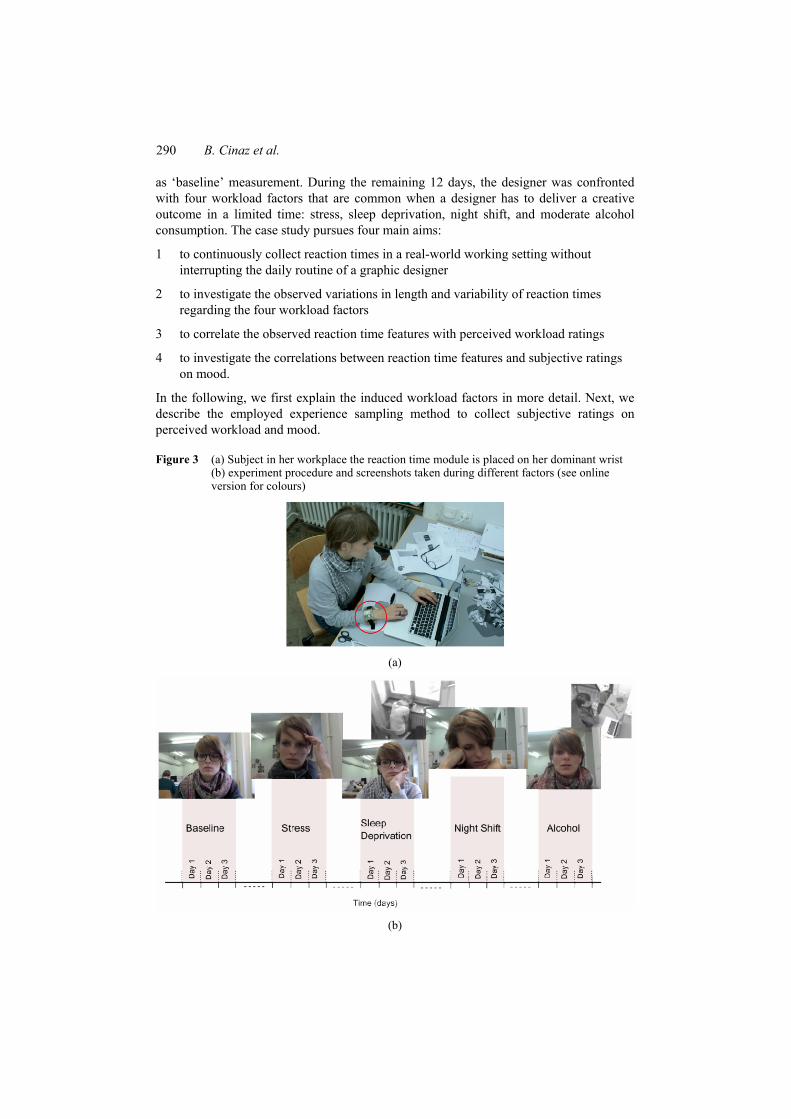
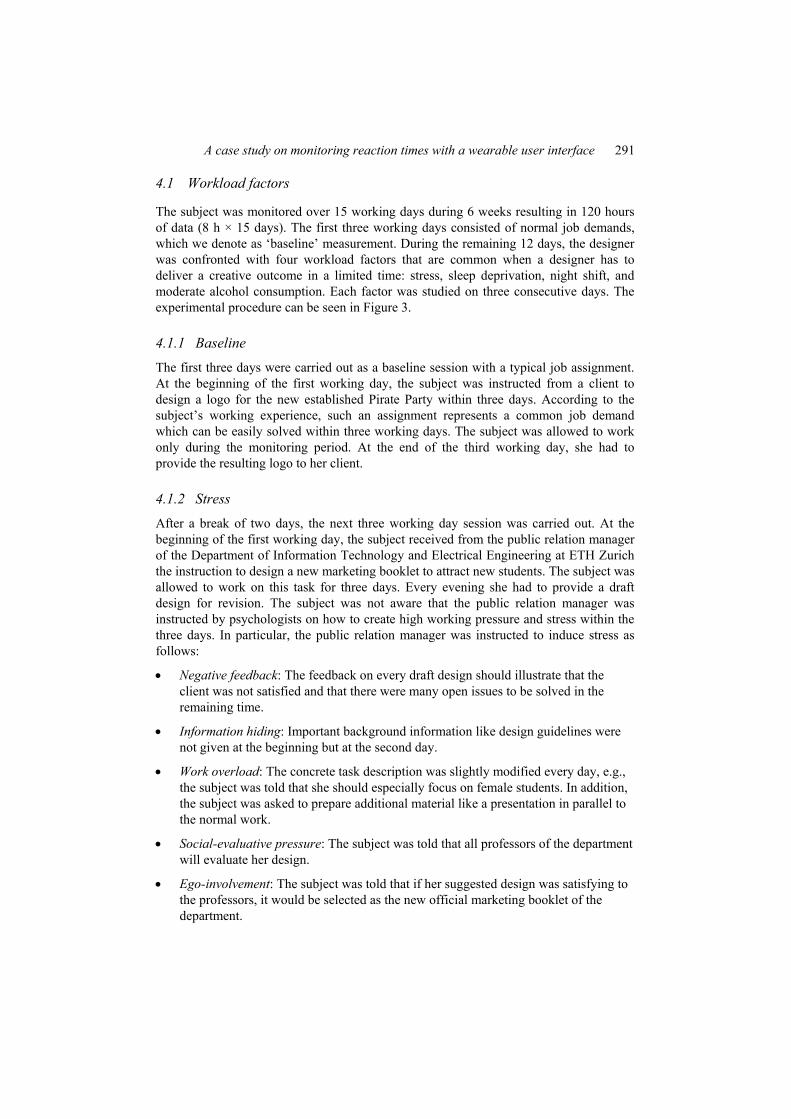
Figure 3 (a) Subject in her workplace the reaction time module is placed on her dominant wrist (b) experiment procedure and screenshots taken during different factors (see online version for colours)
(a)
(b)
A case study on monitoring reaction times with a wearable user interface 291
4.1 Workload factors
The subject was monitored over 15 working days during 6 weeks resulting in 120 hours of data (8 h × 15 days). The first three working days consisted of normal job demands, which we denote as ‘baseline’ measurement. During the remaining 12 days, the designer was confronted with four workload factors that are common when a designer has to deliver a creative outcome in a limited time: stress, sleep deprivation, night shift, and moderate alcohol consumption. Each factor was studied on three consecutive days. The experimental procedure can be seen in Figure 3.
4.1.1 Baseline
The first three days were carried out as a baseline session with a typical job assignment. At the beginning of the first working day, the subject was instructed from a client to design a logo for the new established Pirate Party within three days. According to the subject’s working experience, such an assignment represents a common job demand which can be easily solved within three working days. The subject was allowed to work only during the monitoring period. At the end of the third working day, she had to provide the resulting logo to her client.
4.1.2 Stress
After a break of two days, the next three working day session was carried out. At the beginning of the first working day, the subject received from the public relation manager of the Department of Information Technology and Electrical Engineering at ETH Zurich the instruction to design a new marketing booklet to attract new students. The subject was allowed to work on this task for three days. Every evening she had to provide a draft design for revision. The subject was not aware that the public relation manager was instructed by psychologists on how to create high working pressure and stress within the three days. In particular, the public relation manager was instructed to induce stress as follows:
• Negative feedback: The feedback on every draft design should illustrate that the client was not satisfied and that there were many open issues to be solved in the remaining time.
• Information hiding: Important background information like design guidelines were not given at the beginning but at the second day.
• Work overload: The concrete task description was slightly modified every day, e.g., the subject was told that she should especially focus on female students. In addition, the subject was asked to prepare additional material like a presentation in parallel to the normal work.
• Social-evaluative pressure: The subject was told that all professors of the department will evaluate her design.
• Ego-involvement: The subject was told that if her suggested design was satisfying to the professors, it would be selected as the new official marketing booklet of the department.
292 B. Cinaz et al.
4.1.3 Partial sleep deprivation
After a break of one week, the subject was monitored during partial sleep deprivation. On the first day, the subject started to work after a night of seven hour normal sleep duration. The subject was instructed from a client to design T-shirt for the internet portal ‘evernote’. In the remaining two nights, the sleep duration was reduced to four hours.
4.1.4 Night shift
After a break of three days, the night shift session was carried out. The subject worked between midnight and 8 AM and was sleeping during daytime. At the beginning of the first working day, the subject was instructed from a client to design a new concept for the German internet blog ‘Sichtweise Fotografie’.
4.1.5 Alcohol
After a break of two weeks, the next three working day session was carried out. During this condition, the subject worked between normal office hours (~10 AM to ~6 PM). In the afternoon she drank 2–3 glass of wine. At the beginning of the first working day, the subject was instructed from a client to design a new logo for the Institute Human Computer Interaction of Konstanz University.
4.2 Experience sampling
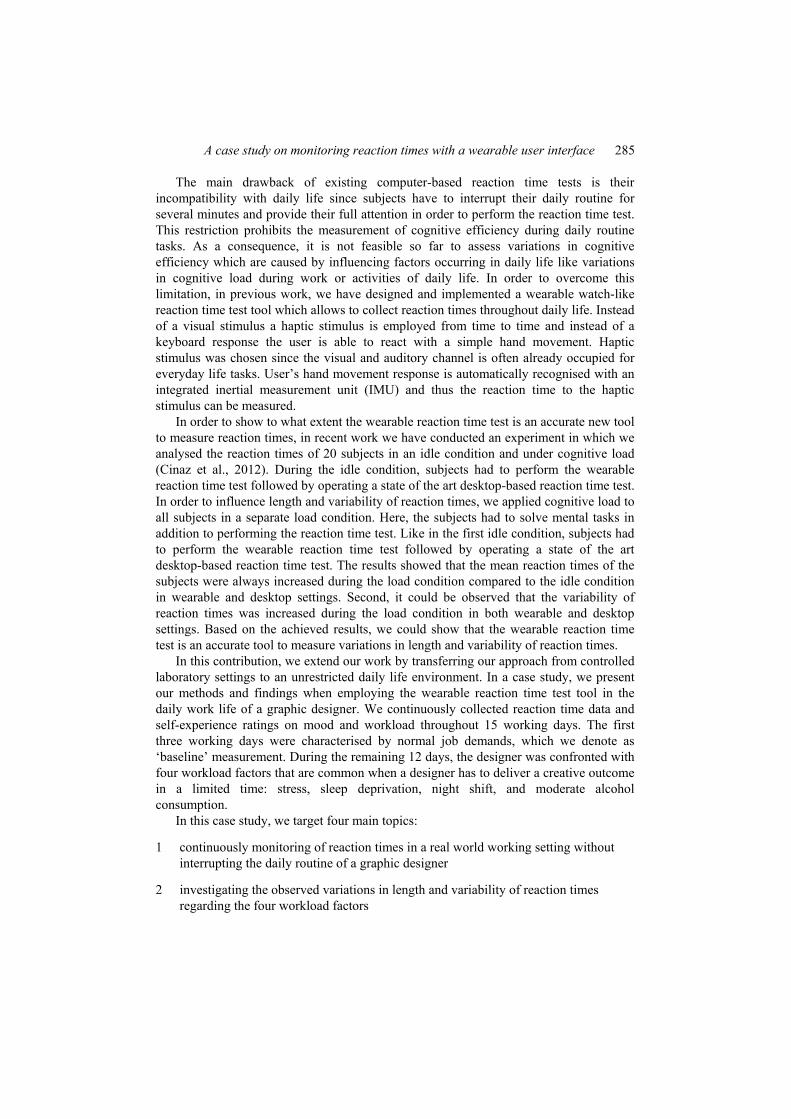
In order to examine the relationship between reaction time data and self-reported ratings on mood and workload, we used an experience sampling methodology (ESM) known from Larson and Csikszentmihalyi (1983), and Scollon et al. (2003). The subject was randomly probed eight times per day to complete a set of questionnaires. The minimum and maximum time interval between successive questionnaires was set to 30 and 120 minutes, respectively. The subject was prompted to fill out the questionnaires by applying ten consecutive haptic stimuli at 1 second intervals. It took approximately 2–3 minutes to complete all questionnaire items. The experience sampling approach is depicted in Figure 4. At each probe, we assessed subject’s current mood with the presentation of 15 adjectives on a visual analogue scale (from 0 = not at all to 10 = a great deal) using a short version of the positive and negative affect schedule (Watson et al., 1988). The 15 items consisted of seven negative (‘bored’, ‘tired’, ‘stressed’, ‘anxious’, ‘angry’, ‘depressed’, and ‘nervous’), seven positive (‘relaxed’, ‘happy’, ‘concentrated’, ‘alert’, ‘interested’, ‘active’, and ‘excited’) and one sleepiness item (‘sleepy’).
In addition, the subject was asked to assess her perceived workload regarding the last working activities. For this subjective rating, we employed the NASA task load index (TLX) from Hart and Stavenland (1988). First, the subject has to rate 6 items on a scale from 1 to 20 that best indicate her experience in the task. The rating consists of the following items: mental demand, physical demand, temporal demand, own performance, effort and frustration. Next, the subject is systematically asked which of the items represents the more important contributor to the workload. Based on these comparisons, the total workload is computed as a weighted average of the ratings.
A case study on monitoring reaction times with a wearable user interface 293
All questionnaire items were completed on the subject’s computer. Beside the randomly generated probes, the subject filled the questionnaire also at the beginning of each day before starting to work.
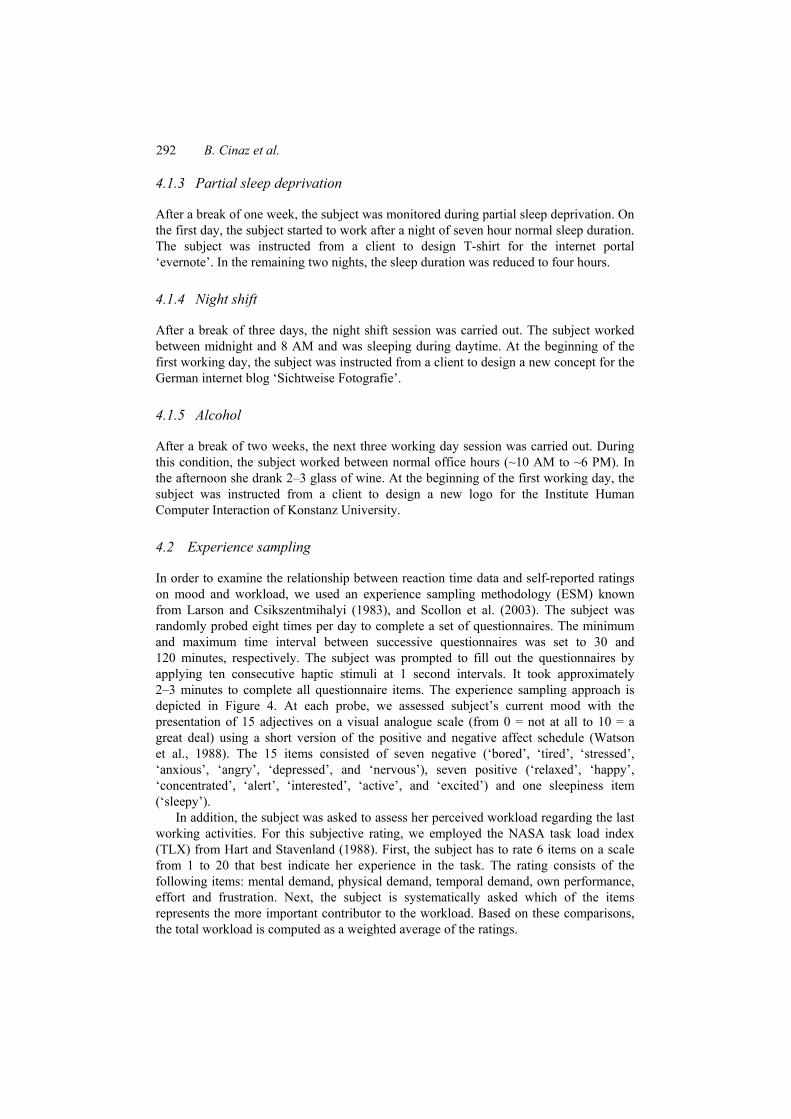
Figure 4 We programmed an experience sampling event in the reaction time module to signal the subject when to complete the questionnaire (see online version for colours)
Note: Every time ten consecutive haptic stimuli (at 1 second intervals) occurred, the subject had to fill out the questionnaire items.
5 Data analysis
In the following, we first provide a description of our methods to automatically detect user’s hand movement as response to the applied haptic stimuli. Next, we describe how the reaction time measures were computed. Finally, we explain how we correlated the reaction time features with the self-experience data on mood ratings and NASA workload items.
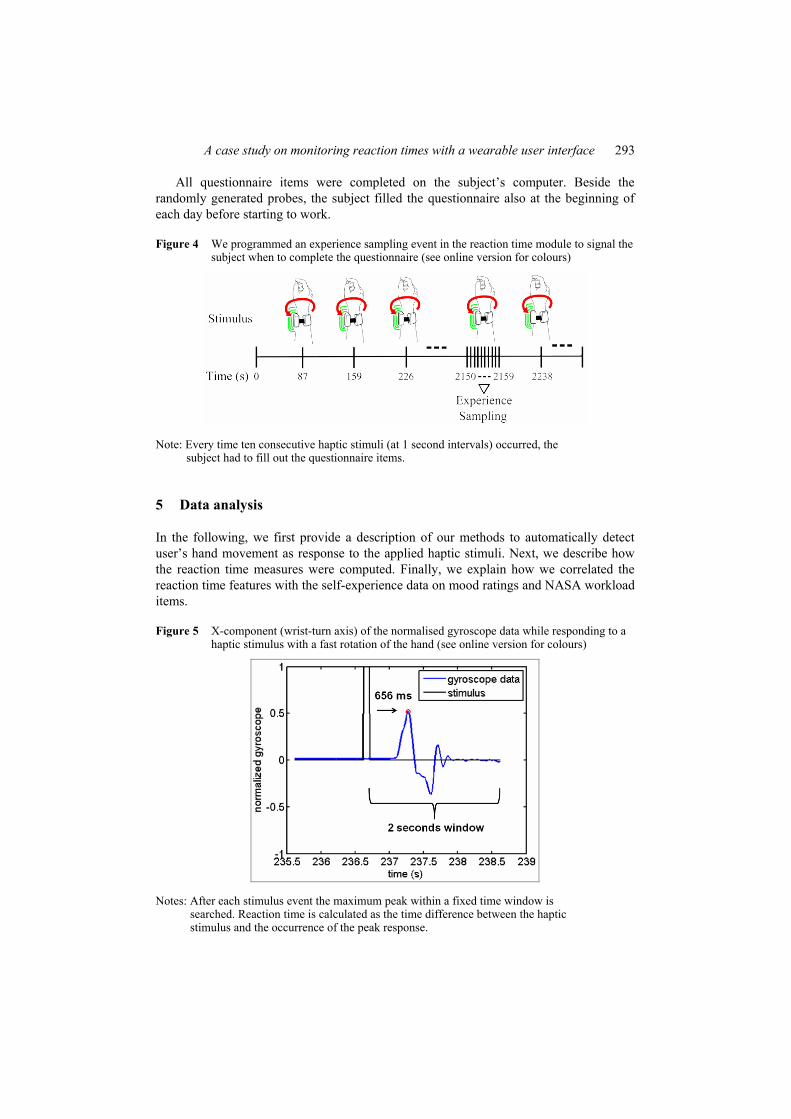
Figure 5 X-component (wrist-turn axis) of the normalised gyroscope data while responding to a haptic stimulus with a fast rotation of the hand (see online version for colours)
Notes: After each stimulus event the maximum peak within a fixed time window is searched. Reaction time is calculated as the time difference between the haptic stimulus and the occurrence of the peak response.
294 B. Cinaz et al.
5.1 Preprocessing and peak detection
In order to detect subject’s hand response to a stimulus, we analysed the gyroscope data obtained by the IMU module. First, the gyroscope data is normalised to values between –1 and 1. Second, the raw gyroscope data is smoothed using a simple moving average filtering. Then, a window of 2 seconds length is aligned on each stimulus event and the local maximum point is located within this window. If the maximum peak is larger than a decision threshold, it is classified as a correct reaction gesture; otherwise it is classified as a non-reaction, i.e., it is assumed that the user has not responded to the stimulus. The normalised gyroscope data while responding to a haptic stimulus is exemplary shown in Figure 5.
The decision threshold was estimated by applying a Naive Bayes classifier. In a first step, we selected a total of 120 responses and 120 non-responses by a visual inspection of the gyroscope data. This data was then used to define a decision threshold using the Naive Bayes classifier. After applying Naive Bayes, a visual inspection of 2,304 reaction hand gestures revealed an accuracy of 99%.
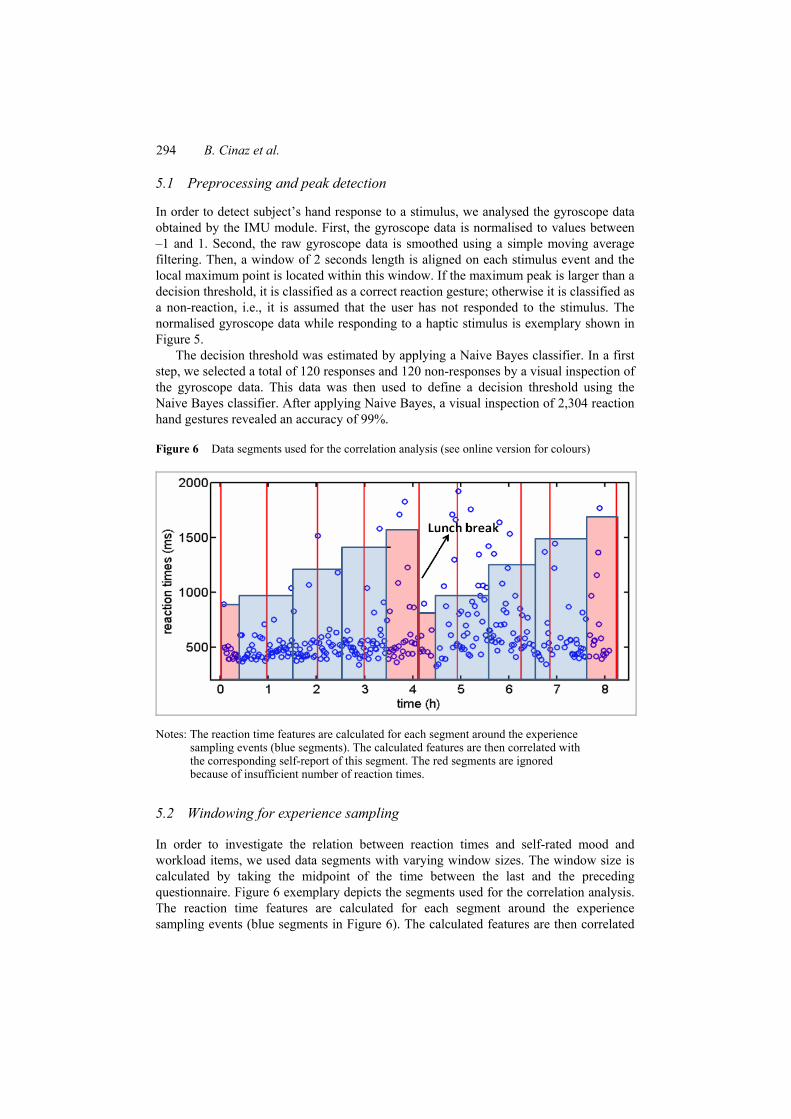
Figure 6 Data segments used for the correlation analysis (see online version for colours)
Notes: The reaction time features are calculated for each segment around the experience sampling events (blue segments). The calculated features are then correlated with the corresponding self-report of this segment. The red segments are ignored because of insufficient number of reaction times.
5.2 Windowing for experience sampling
In order to investigate the relation between reaction times and self-rated mood and workload items, we used data segments with varying window sizes. The window size is calculated by taking the midpoint of the time between the last and the preceding questionnaire. Figure 6 exemplary depicts the segments used for the correlation analysis. The reaction time features are calculated for each segment around the experience sampling events (blue segments in Figure 6). The calculated features are then correlated
A case study on monitoring reaction times with a wearable user interface 295
with the mood and perceived workload ratings of this segment. The first and the last segment of every four hour session (red segments in Figure 6) are not used in the correlation analysis since the amount of data here is only half as much as in the other segments. For each segment, the following features are calculated: mean reaction time, standard deviation of reaction time and number of omission errors defined as the number of missing responses to the stimuli.
6 Results and discussion
Our first goal was to show that a continuous collection of reaction times in a real-world working setting is feasible without interrupting the daily routine. In the presented case study, we were able to show that even when employing a moderate high sampling frequency (60–90 s stimuli interval) our wearable reaction time test tool allows to continuously collect reaction times throughout 15 working days of a graphic designer. Our test subject was able to successfully complete all job demands over the complete monitoring period while performing the wearable reaction time test in parallel without interrupting her daily working routine. Hence, we were able to present a successful example showing that our wearable reaction time test tool is appropriate to continuously collect reaction times in real world working settings.
In the following, we present the results of our remaining three goals: variations in length and variability of reaction times regarding the four workload factors, correlations of reaction time features with perceived workload ratings, and correlations between reaction time features and subjective ratings on mood.
6.1 Reaction time measures under workload
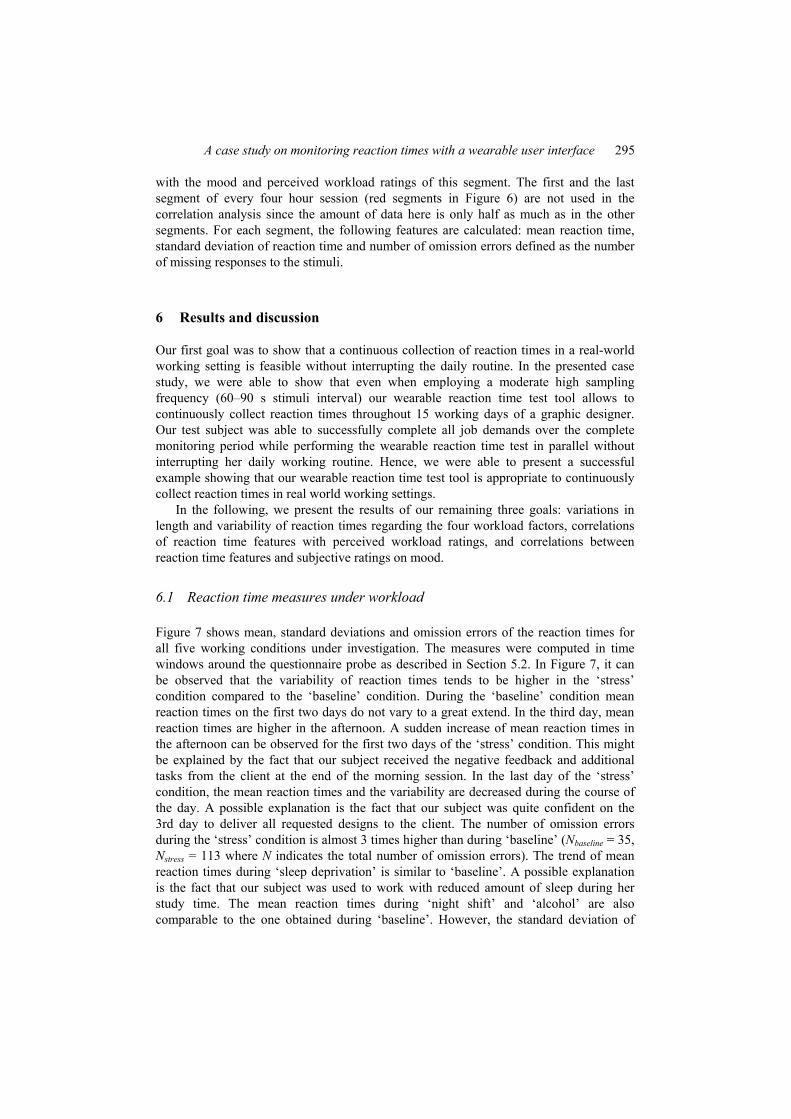
Figure 7 shows mean, standard deviations and omission errors of the reaction times for all five working conditions under investigation. The measures were computed in time windows around the questionnaire probe as described in Section 5.2. In Figure 7, it can be observed that the variability of reaction times tends to be higher in the ‘stress’ condition compared to the ‘baseline’ condition. During the ‘baseline’ condition mean reaction times on the first two days do not vary to a great extend. In the third day, mean reaction times are higher in the afternoon. A sudden increase of mean reaction times in the afternoon can be observed for the first two days of the ‘stress’ condition. This might be explained by the fact that our subject received the negative feedback and additional tasks from the client at the end of the morning session. In the last day of the ‘stress’ condition, the mean reaction times and the variability are decreased during the course of the day. A possible explanation is the fact that our subject was quite confident on the 3rd day to deliver all requested designs to the client. The number of omission errors during the ‘stress’ condition is almost 3 times higher than during ‘baseline’ (Nbaseline = 35, Nstress = 113 where N indicates the total number of omission errors). The trend of mean reaction times during ‘sleep deprivation’ is similar to ‘baseline’. A possible explanation is the fact that our subject was used to work with reduced amount of sleep during her study time. The mean reaction times during ‘night shift’ and ‘alcohol’ are also comparable to the one obtained during ‘baseline’. However, the standard deviation of
296 B. Cinaz et al.
reaction times for all three conditions is always increased in comparison to ‘baseline’. Especially during ‘night shift’ we can observe a steady increase on both mean reaction times and variability during the course of three days. The highest omission errors can be observed for the ‘night shift’ and ‘alcohol’ conditions (Nnightshift = 156, Nalcohol = 146). These highest omission errors during night shift are caused by falling asleep from time to time. This was visible in the continuous video recording obtained from our subject’s working place. In general, an increase in the errors can be observed especially during the second half of each working day which is in line with a reduction of the concentration level and with an increase of sleepiness.
Figure 7 Mean, standard deviations and omission errors (missing responses) of reaction times over 15 working days (see online version for colours)
A case study on monitoring reaction times with a wearable user interface 297
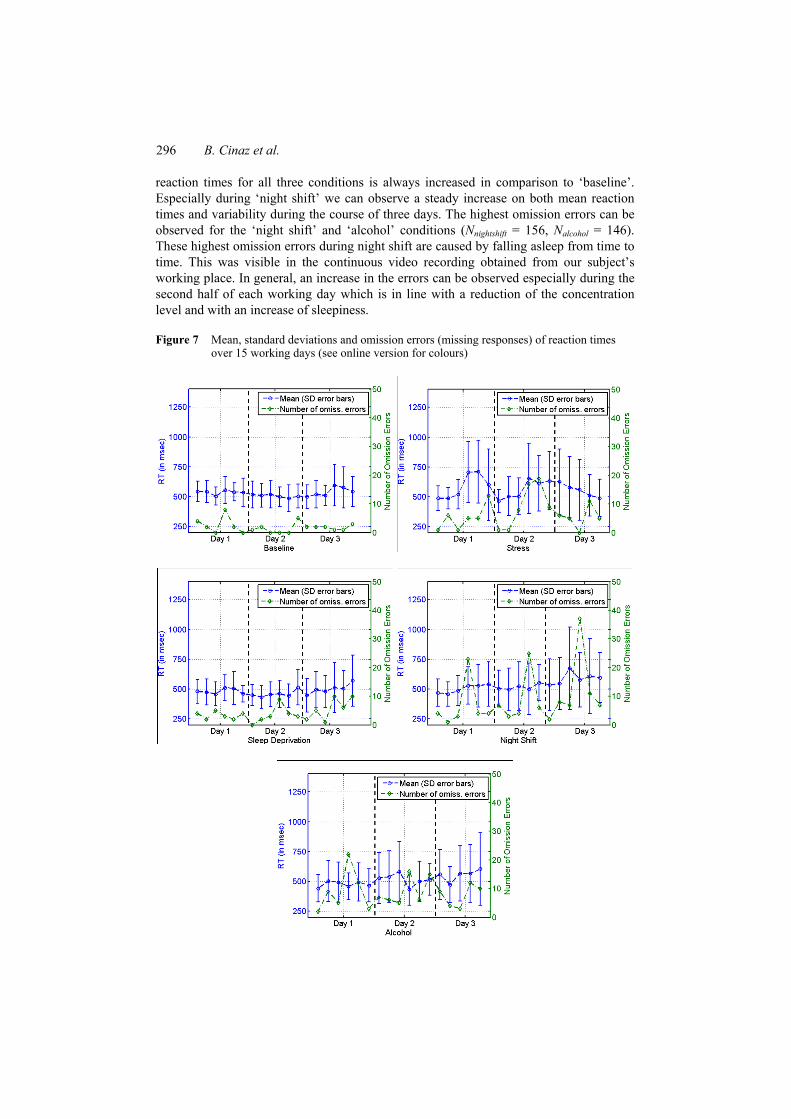
Figure 8 Boxplots of mean, STD reaction times and omission errors for each workload factor (see online version for colours)
Figure 8 shows the boxplots of mean, standard deviation and omission errors of reaction times for each workload factor. ANOVA with pairwise comparison revealed that mean reaction times of the ‘stress’ condition were significantly higher than those collected during ‘sleep deprivation’ and ‘alcohol’ conditions (p < 0.05). Besides, ‘sleep deprivation’ condition showed a significant lower mean reaction time compared to ‘night shift’ (p < 0.05). The mean reaction times of the ‘baseline’ condition did not show a significant difference from other conditions. There were significant group differences in variability of reaction times for each of the conditions. Pairwise comparison showed a significant increase in variability during ‘stress’, ‘night shift’ and ‘alcohol’ compared to ‘baseline’ (p < 0.05). A significant difference between ‘baseline’ and ‘sleep deprivation’
298 B. Cinaz et al.
as well as between ‘stress’, ‘night shift’ and ‘alcohol’ was not observed. According to the pairwise comparison of omission errors, the subject showed significantly higher number of omission errors during ‘night shift’ and ‘alcohol’ conditions compared to ‘baseline’ condition (p < 0.05). However, a significant difference was not observed for the ‘stress’ and ‘sleep deprivation’ conditions.
In summary, we can conclude that our test subject showed a significant increased variability of reaction times during stress in comparison to baseline. Sleep deprivation did not show a significant difference to baseline. This might originate from the fact that our subject was used to work under reduced amount of sleep during her study time. Hence, we could not observe significant differences of any reaction time measure for the ‘sleep deprivation’ condition in comparison to the baseline session. Compared to ‘baseline’ condition, our subject showed a significant increased variability of reaction times and a significantly higher number of omission errors during ‘night shift’. The high number of omission errors during night shift are caused by falling asleep from time to time as evident from the video recording obtained from our subject’s working place. Similar to ‘night shift’, our subject showed under moderate alcohol consumption a significant increased variability of reaction times and a significantly higher number of omission errors in comparison to ‘baseline’.
6.2 Correlation of reaction time measures with perceived workload
In order to perform the correlation analysis, for each day we analysed the data from six questionnaire probes (except three days where only five questionnaires were available) as described in Section 5.2. With a total amount of 87 observations, the correlation for each questionnaire item was computed.
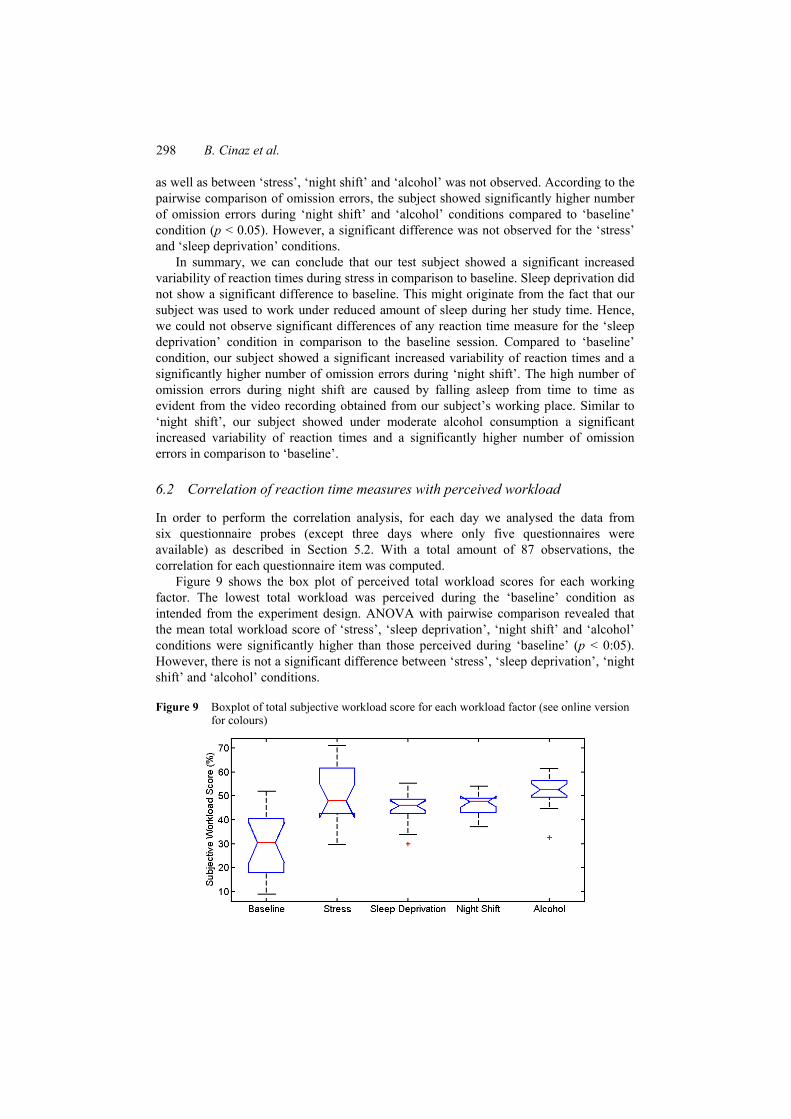
Figure 9 shows the box plot of perceived total workload scores for each working factor. The lowest total workload was perceived during the ‘baseline’ condition as intended from the experiment design. ANOVA with pairwise comparison revealed that the mean total workload score of ‘stress’, ‘sleep deprivation’, ‘night shift’ and ‘alcohol’ conditions were significantly higher than those perceived during ‘baseline’ (p < 0:05). However, there is not a significant difference between ‘stress’, ‘sleep deprivation’, ‘night shift’ and ‘alcohol’ conditions.
Figure 9 Boxplot of total subjective workload score for each workload factor (see online version for colours)
A case study on monitoring reaction times with a wearable user interface 299
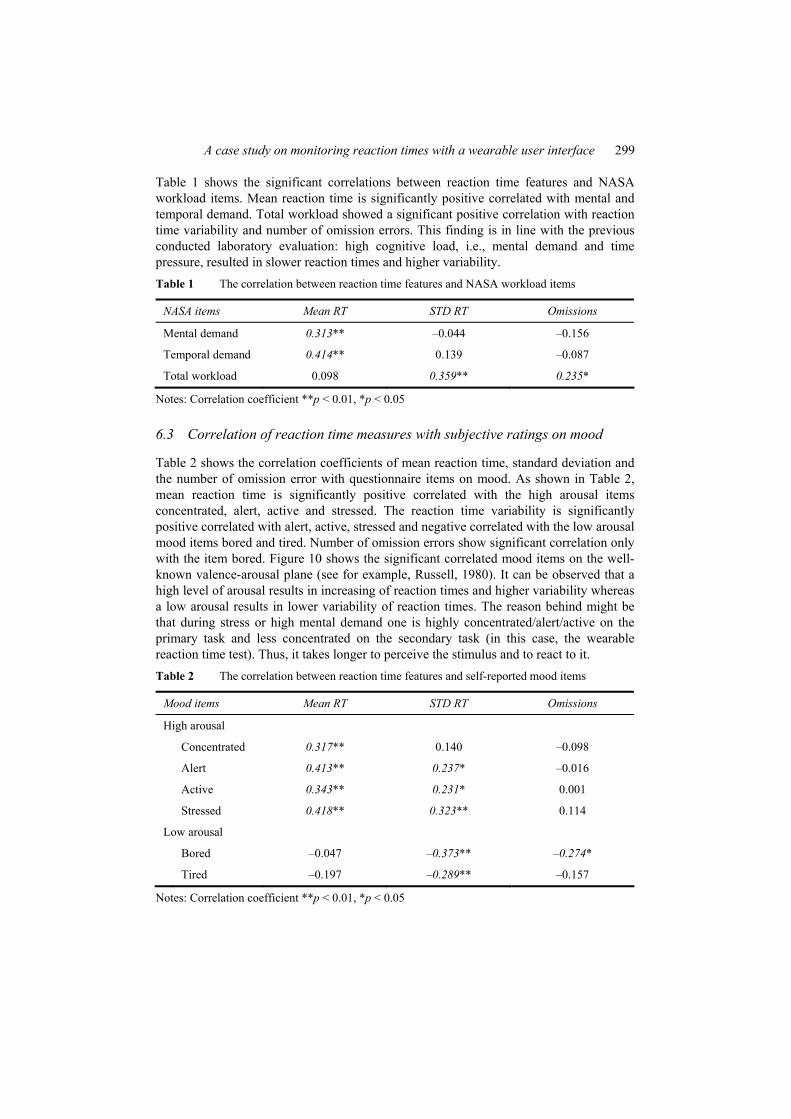
Table 1 shows the significant correlations between reaction time features and NASA workload items. Mean reaction time is significantly positive correlated with mental and temporal demand. Total workload showed a significant positive correlation with reaction time variability and number of omission errors. This finding is in line with the previous conducted laboratory evaluation: high cognitive load, i.e., mental demand and time pressure, resulted in slower reaction times and higher variability. Table 1 The correlation between reaction time features and NASA workload items
NASA items Mean RT STD RT Omissions
Mental demand 0.313** –0.044 –0.156
Temporal demand 0.414** 0.139 –0.087
Total workload 0.098 0.359** 0.235*
Notes: Correlation coefficient **p < 0.01, *p < 0.05
6.3 Correlation of reaction time measures with subjective ratings on mood
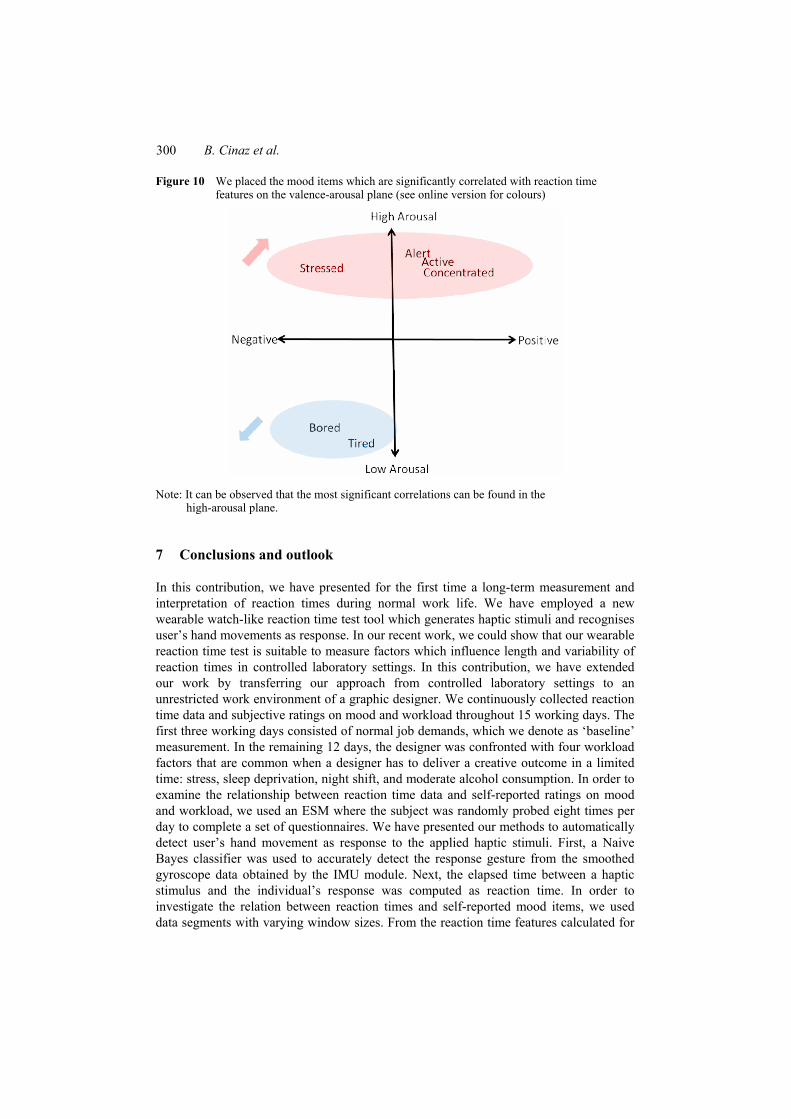
Table 2 shows the correlation coefficients of mean reaction time, standard deviation and the number of omission error with questionnaire items on mood. As shown in Table 2, mean reaction time is significantly positive correlated with the high arousal items concentrated, alert, active and stressed. The reaction time variability is significantly positive correlated with alert, active, stressed and negative correlated with the low arousal mood items bored and tired. Number of omission errors show significant correlation only with the item bored. Figure 10 shows the significant correlated mood items on the well-known valence-arousal plane (see for example, Russell, 1980). It can be observed that a high level of arousal results in increasing of reaction times and higher variability whereas a low arousal results in lower variability of reaction times. The reason behind might be that during stress or high mental demand one is highly concentrated/alert/active on the primary task and less concentrated on the secondary task (in this case, the wearable reaction time test). Thus, it takes longer to perceive the stimulus and to react to it. Table 2 The correlation between reaction time features and self-reported mood items
Mood items Mean RT STD RT Omissions
High arousal
Concentrated 0.317** 0.140 –0.098
Alert 0.413** 0.237* –0.016
Active 0.343** 0.231* 0.001
Stressed 0.418** 0.323** 0.114
Low arousal
Bored –0.047 –0.373** –0.274*
Tired –0.197 –0.289** –0.157
Notes: Correlation coefficient **p < 0.01, *p < 0.05
300 B. Cinaz et al.
Figure 10 We placed the mood items which are significantly correlated with reaction time features on the valence-arousal plane (see online version for colours)
Note: It can be observed that the most significant correlations can be found in the high-arousal plane.
7 Conclusions and outlook
In this contribution, we have presented for the first time a long-term measurement and interpretation of reaction times during normal work life. We have employed a new wearable watch-like reaction time test tool which generates haptic stimuli and recognises user’s hand movements as response. In our recent work, we could show that our wearable reaction time test is suitable to measure factors which influence length and variability of reaction times in controlled laboratory settings. In this contribution, we have extended our work by transferring our approach from controlled laboratory settings to an unrestricted work environment of a graphic designer. We continuously collected reaction time data and subjective ratings on mood and workload throughout 15 working days. The first three working days consisted of normal job demands, which we denote as ‘baseline’ measurement. In the remaining 12 days, the designer was confronted with four workload factors that are common when a designer has to deliver a creative outcome in a limited time: stress, sleep deprivation, night shift, and moderate alcohol consumption. In order to examine the relationship between reaction time data and self-reported ratings on mood and workload, we used an ESM where the subject was randomly probed eight times per day to complete a set of questionnaires. We have presented our methods to automatically detect user’s hand movement as response to the applied haptic stimuli. First, a Naive Bayes classifier was used to accurately detect the response gesture from the smoothed gyroscope data obtained by the IMU module. Next, the elapsed time between a haptic stimulus and the individual’s response was computed as reaction time. In order to investigate the relation between reaction times and self-reported mood items, we used data segments with varying window sizes. From the reaction time features calculated for
A case study on monitoring reaction times with a wearable user interface 301
each segment around the experience sampling events, we have computed the correlations with the corresponding self-report items.
We could observe that our test subject showed a significant increased variability of reaction times during stress in comparison to baseline. Sleep deprivation did not show a significant difference to baseline since our subject was used to work under reduced amount of sleep. Compared to baseline condition, our subject showed a significant increased variability of reaction times and a significant higher number of omission errors during night shift. The high number of omission errors during night shift were caused by the fact that our subject felled asleep from time to time. Similar to night shift, our subject showed under moderate alcohol consumption a significant increased variability of reaction times and a significant higher number of omission errors in comparison to baseline.
The correlation analysis of reaction time measures with perceived workload showed that mean reaction time is significantly positive correlated with mental and temporal demand. Total workload showed a significant positive correlation with reaction time variability and number of omission errors. This finding is in line with the previous conducted laboratory evaluation: high cognitive load, i.e., mental demand and time pressure, resulted in slower reaction times and higher variability.
The correlation analysis of reaction time measures with subjective ratings on mood showed that mean reaction time is significantly positive correlated with the high arousal items concentrated, alert, active and stressed while reaction time variability is significantly positive correlated with alert, active, stressed and negative correlated with the low arousal mood items bored and tired. The number of omission errors is significant negative correlated with the item bored. In the valence-arousal plane, it is obvious that a high level of arousal results in increasing reaction times and higher variability whereas a low arousal results in lower variability of reaction times.
Finally, we conclude that the presented case study shows for the first time that a wearable watch-like reaction time test tool enables a long-term measurement and interpretation of reaction times during normal work life activities. Thus, it becomes feasible to measure reaction times during everyday-life in order to assess variations in cognitive efficiency which are caused by influencing factors occurring in daily life like variations in cognitive load during work or activities of daily life.
In future work, we will investigate elderly people. We already started with monitoring reaction times of healthy elderly during daily life activities like reading, writing and walking. Next, in cooperation with psychologists we are planning to monitor reaction times of elderly with mild cognitive impairment during daily life activities. We will compare the achieved results with the ones obtained from healthy elderly in order enable a detection of mild cognitive impairment during daily life monitoring.
Acknowledgements
The authors would like to thank our test subject Sonja Zagermann who allowed us to monitor her daily working routine throughout 15 days. In addition, the authors acknowledge the cooperation with the public relation manager Andrea Holle from the ITET Department of ETH Zurich for inducing stress to our test subject.
302 B. Cinaz et al.
References Brain Workshop, available at http://brainworkshop.sourceforge.net (accessed on 5 February 2010). Braverman, E.R., Chen, A.L., Chen, T.J., Schoolfield, J.D., Notaro, A., Braverman, D., Kerner, M.,
Blum, S.H., Arcuri, V., Varshavskiy, M., Damle, U., Downs, B.W., Waite, R.L., Oscar-Berman, M., Giordano, J. and Blum, K. (2010) ‘Test of variables of attention (TOVA) as a predictor of early attention complaints, an antecedent to dementia’, Neuropsychiatric Disease and Treatment, Vol. 6, No. 1, pp.681–690.
Chen, H-Y., Santos, J., Graves, M., Kim, K. and Tan, H.Z. (2008) ‘Tactor localization at the wrist’, in EuroHaptics’08: Proceedings of the 6th international conference on Haptics: Perception, Devices and Scenarios, Madrid, Spain, pp.209–218.
Cinaz, B., Vogt, C., Arnrich, B. and Tröster, G. (2011) ‘A wearable user interface for measuring reaction time’, in AmI’11: Proceedings of the Second International Conference on Ambient Intelligence, Amsterdam, The Netherlands, pp.41–50.
Cinaz, B., Vogt, C., Arnrich, B. and Tröster, G. (2012) ‘Implementation and evaluation of wearable reaction time tests’, accepted for publication in Pervasive and Mobile Computing, forthcoming.
Forbes, G.B. (1998) ‘Clinical utility of the test of variables of attention (TOVA) in the diagnosis of attention-deficit/hyperactivity disorder’, Journal of Clinical Psychology, Vol. 54, No. 4, pp.461–476.
Gorus, E., De Raedt, R., Lambert, M., Lemper, J.C. and Mets, T. (2008) ‘Reaction times and performance variability in normal aging, mild cognitive impairment, and Alzheimer’s disease’, Journal of Geriatric Psychiatry and Neurology, Vol. 21, No. 3, pp.204–218.
Harms, H., Amft, O., Winkler, R., Schumm, J., Kusserow, M. and Tröster, G. (2010) ‘ETHOS: miniature orientation sensor for wearable human motion analysis’, in Proceedings of Sensors, 2010 IEEE, Waikoloa, USA, pp.1037–1042.
Hart, S.G. and Stavenland, L.E. (1988) ‘Development of NASA-TLX (task load index): results of empirical and theoretical research’, Human Mental Workload, pp.139–183, Elsevier.
Ivorra, A., Daniels, C. and Rubinsky, B. (2008) ‘Minimally obtrusive wearable device for continuous interactive cognitive and neurological assessment’, Physiological Measurement, Vol. 29, No. 5, pp.543–554.
Jaeggi, S.M., Buschkuehl, M., Jonides, J. and Perrig, W.J. (2008) ‘Improving fluid intelligence with training on working memory’, Proceedings of the National Academy of Sciences of the United States of America, Vol. 105, pp.6829–6833.
Jensen, A.R. (2006) Clocking the Mind: Mental Chronometry and Individual Differences, Elsevier, Oxford, UK.
Kosinski, R.J. (2009) ‘A literature review on reaction time’, available at http://biae.clemson.edu/bpc/bp/Lab/110/reaction.htm (accessed on 8 March 2010).
Larson, R. and Csikszentmihalyi, M. (1983) ‘The experience sampling method’, New Directions for Methodology of Social & Behavioral Science, Vol. 15, pp.41–56.
Lee, S.C. and Starner, T. (2010) ‘BuzzWear: alert perception in wearable tactile displays on the wrist’, in CHI’10: Proceedings of the 28th International Conference on Human Factors in Computing Systems, Atlanta, Georgia, USA, pp.433–442.
Lieberman, H.R., Kramer, F.M., Montain, S.J. and Niro, P. (2007) ‘Field assessment and enhancement of cognitive performance: development of an ambulatory vigilance monitor’, Aviation, Space, and Environmental Medicine, Vol. 78, Suppl. 5, pp.B268–B275.
Luce, R.D. (1986) Response Times: Their Role in Inferring Elementary Mental Organization, Oxford University Press, USA.
Matscheko, M., Ferscha, A., Riener, A. and Lehner, M. (2010) ‘Tactor placement in wrist worn wearables’, in ISWC’10: 14th Annual IEEE International Symposium on Wearable Computers, Seoul, South Korea, pp.1–8.
A case study on monitoring reaction times with a wearable user interface 303
Oakley, I., Kim Y., Lee J. and Ryu, J. (2006) ‘Determining the feasibility of forearm mounted vibrotactile displays’, in HAPTICS’06: Proceedings of the Symposium on Haptic Interfaces for Virtual Environment and Teleoperator Systems, Arlington, VA, USA, pp.81–88.
PEBL: Psychological Test Battery, available at http://pebl.sourceforge.net/ (accessed on 10 June 2010).
Russell, J.A. (1980) ‘A circumplex model of affect’, Journal of Personality and Social Psychology, Vol. 39, No. 6, pp.1161–1178.
Scholz, U., Marca, R.L., Nater, U.M., Aberle, I., Ehlert, U., Hornung, R., Martin, M. and Kliegel, M. (2009) ‘Go no-go performance under psychosocial stress: Beneficial effects of implementation intentions’, Neurobiology of Learning and Memory, Vol. 91, No. 1, pp.89–92.
Scollon, C.N., Kim-Prieto, C. and Diener, E. (2003) ‘Experience sampling: promises and pitfalls, strengths and weaknesses’, Journal of Happiness Studies, Vol. 4, No. 1, pp.5–34.
Vaurio, R.G., Simmonds, D.J. and Mostofsky, S.H. (2009) ‘Increased intra-individual reaction time variability in attention-deficit/hyperactivity disorder across response inhibition tasks with different cognitive demands’, Neuropsychologia, Vol. 47, No. 12, pp.2389–2396.
Watson, D., Clark, L.A. and Tellegen, A. (1988) ‘Development and validation of brief measures of positive and negative affect: the PANAS scales’, Journal of Personality and Social Psychology, Vol. 54, No. 6, pp.1063–1070.
Whelan, R. (2008) ‘Effective analysis of reaction time data’, The Psychological Record, Vol. 58, No. 3, pp.475–482.
Wild, K., Howieson, D., Webbe, F., Seelye, A. and Kaye, J. (2008) ‘Status of computerized cognitive testing in aging: a systematic review’, Alzheimer’s and Dementia, Vol. 4, No. 6, pp.428–437.