Embed Size (px)
Citation preview

2012-2014 Unit Comparative Analysis
Performance Overview of the Country
Rhoda Smolow, Organization Department ChairAnita Levy, Revenue Share Project Manager
Viviane Kovacs, Annual Plan Project ManagerLindy Ettin, Unit Services Director
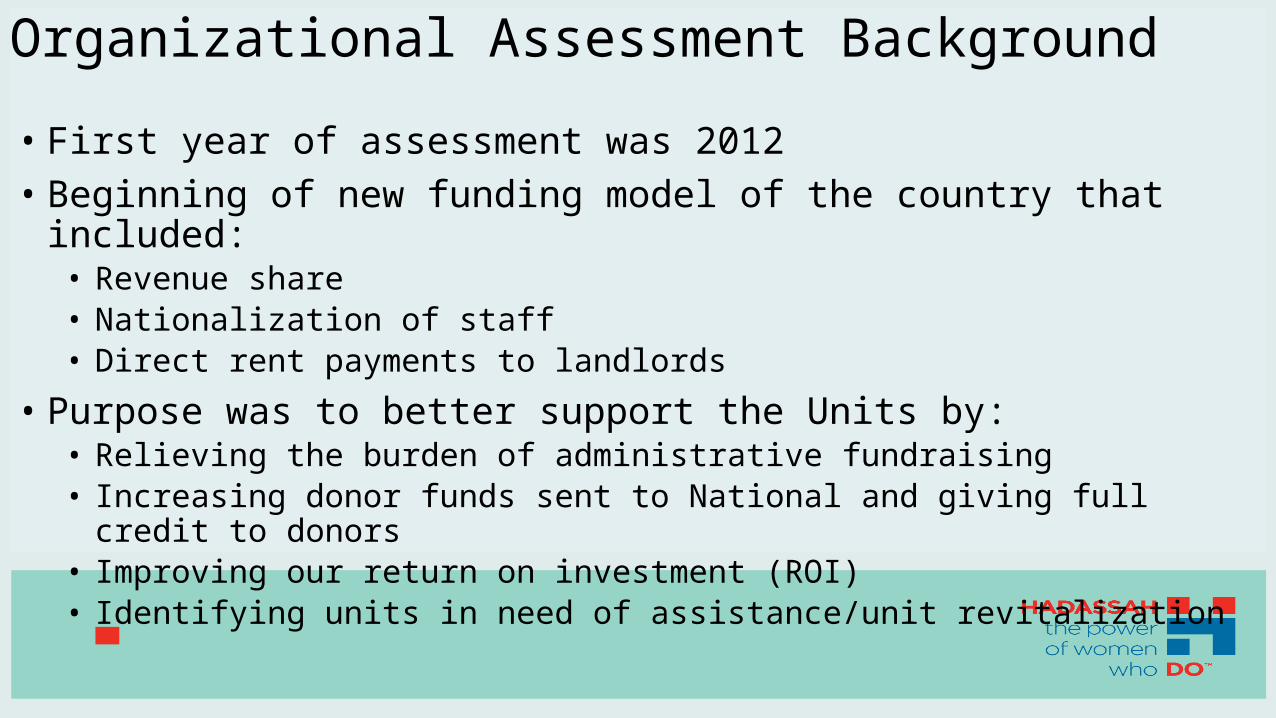
Organizational Assessment Background
• First year of assessment was 2012• Beginning of new funding model of the country that included:• Revenue share• Nationalization of staff• Direct rent payments to landlords
• Purpose was to better support the Units by:• Relieving the burden of administrative fundraising• Increasing donor funds sent to National and giving full credit to donors• Improving our return on investment (ROI)• Identifying units in need of assistance/unit revitalization

Background Continued
• Results of Assessment• Unit Profiles• Structure for Action Committee• Implementation teams to act on initiatives identified by the Structure for
Action Committee• Hub in Super South was a direct result of the Implementation Teams• Extended Staff Support Model is in addition to the staff support already in place but
for Regions and Chapters with no staff• Additional National Training in Local Areas • Blue Print Training • Visits from Leadership and Organization Department volunteers and staff

Data Sources• Pledge Maker Goal vs. Actual Report • Membership
• Business Objects Report• Fundraising• Donor count
• Finance End of Year Budget vs. Actual Report• Leadership, Chapter, Fundraising Health Status Report (2012 & 2013
only)
Staff in Development, DPC and Operations were consulted to confirm the reports and numbers are accurate to the best of our knowledge and the data we have

Income
• This chart shows the sum total of fundraising income raised by geography, including Grassroots, Major Gifts and Tower• This includes Unrestricted and Lightly Restricted, Cash Only Donations
Reminder:2012: 0 credit for BESAP2013: 20% Credit for Unrestricted BESAP2014: 100% Credit for Unrestricted BESAP

Summary of Fundraising

Expenses
Offices:• There are currently 31 Chapter, Region and Big Chapter Offices • Some offices are shared by Chapters and Regions
Staff:• There are 63 staff positions in our offices across the US• 33 Full Time positions (35 hrs/week)• 30 Part Time positions (11 – 33 hrs/week)Revenue Share:• 2012: 41% of Revenue Share Allocated was Requested• 2013: 47% of Revenue Share Allocated was Requested*• 2014: 58% of Revenue Share Allocated was Requested*

2014 Expenses vs Income

Local Average Cost Benefit Analysis
Leadership, Chapter, Fundraising Health
• A reminder to please submit your worksheets to Heather Simon ASAP• Deadline is Friday, June 26• Information in the following slides is for 2012 and 2013 only

Leadership Health by Units

Leadership Health by Members

Chapter Health by Units

Fundraising Health by Units

What do you do with this information?• This information should help you in preparing your 2016 Annual Plan• Each President will receive a personalized Unit Profile • Your goal is to identify strategies to improve your units’ performance
1. Review the data with your board to understand where your unit is underperforming 2. Together determine where help is warranted:
a. Should you let the red units do their own thing with little intervention or cost to the Region, etc.b. Should you focus on the orange or yellow units that could improvec. Decide who will be responsible for working with the units identifiedd. Encourage activity and participation in the weakening areas
3. Determine how you want to increase your fundraising for the coming year 4. Decide on new ways to increase your membership numbers5. Consider Resources Needed (time, money, volunteers, staff, etc)6. What is the Return On Investment? (ROI)7. Using SMART Goals include activities in your Annual Plan that will address these
issues

SMART GoalsSpecificDoes it specify exactly what is desired? Is it clear? Does is clearly define what it is you want to accomplish?
MeasurableCan it be measured objectively? Will success be obvious? Does it attribute a specific number that will indicate success?
AchievableIs it realistic to expect your group to achieve this goal? Is the number you set higher than previous goals, but not so high it sets volunteers up for failure?
RelevantDoes the goal pertain to the team (or organizational) mission and values? Does the goal support Hadassah’s mission and the unit’s vision?
TimelyIs this goal appropriate at this particular time? Does is define when the goal will begin and end?

Q & A
That was a lot of numbers and a lot of colors!
What questions do you have?