Embed Size (px)
Citation preview
2013-2014 TEXAS ACADEMIC PERFORMANCE REPORT (TAPR) ANNUAL REPORT
January 15, 2015
JISD School Board
Dr. Willis Mackey Superintendent Steve Salyer President Gilbert Flores Vice President Jose Macias Secretary Sonny-Peter Merrell Assist. Secretary June Adair Trustee Richard LaFoille Trustee Arnoldo Salinas Trustee
The District is required to provide a hearing for public discussion of the Texas Academic Performance Report (TAPR) under the Texas Education Code, §39.306. Commissioner’s Rules on Reporting Requirements (Texas Administrative Code 19, Subchapter BB.) •This hearing must be held within 90 days after the report is received from the Texas Education Agency (TEA). •The TAPR must be published within two weeks after the public hearing.
TAPR Report Information

TAPR Report Student enrollment and academic performance in
postsecondary institutions from the Texas Higher Education Coordinating Board (THECB)
Report on violent or criminal incidents
Campus performance objectives PEIMS Financial Standard Report
TAPR Annual Report
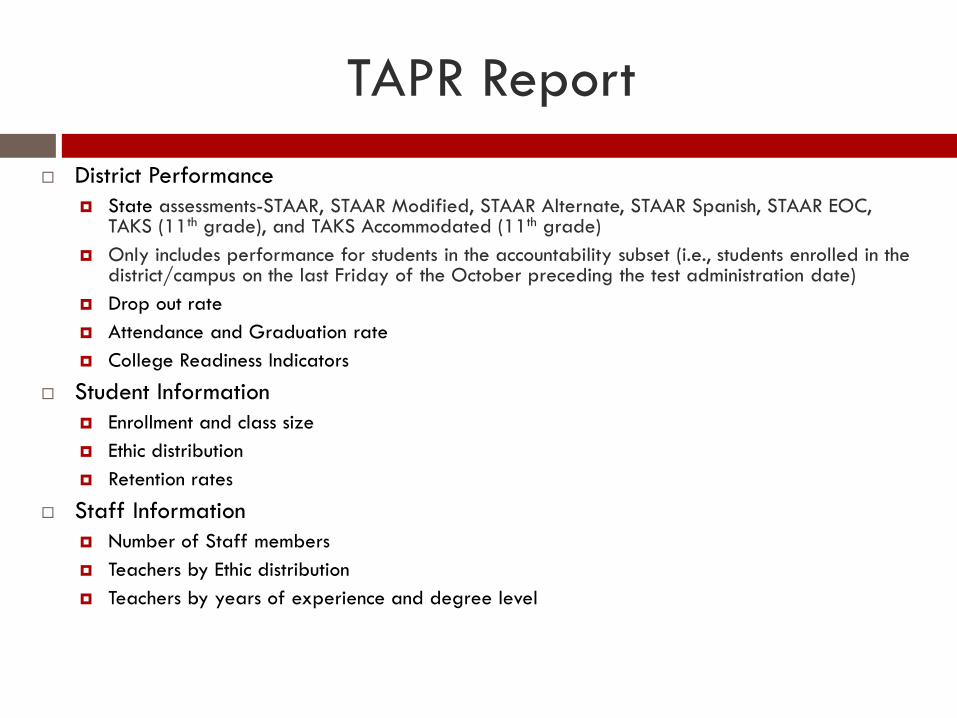
TAPR Report District Performance
State assessments-STAAR, STAAR Modified, STAAR Alternate, STAAR Spanish, STAAR EOC, TAKS (11th grade), and TAKS Accommodated (11th grade)
Only includes performance for students in the accountability subset (i.e., students enrolled in the district/campus on the last Friday of the October preceding the test administration date)
Drop out rate Attendance and Graduation rate College Readiness Indicators
Student Information Enrollment and class size Ethic distribution Retention rates
Staff Information Number of Staff members Teachers by Ethic distribution Teachers by years of experience and degree level
2014 Accountability Rating
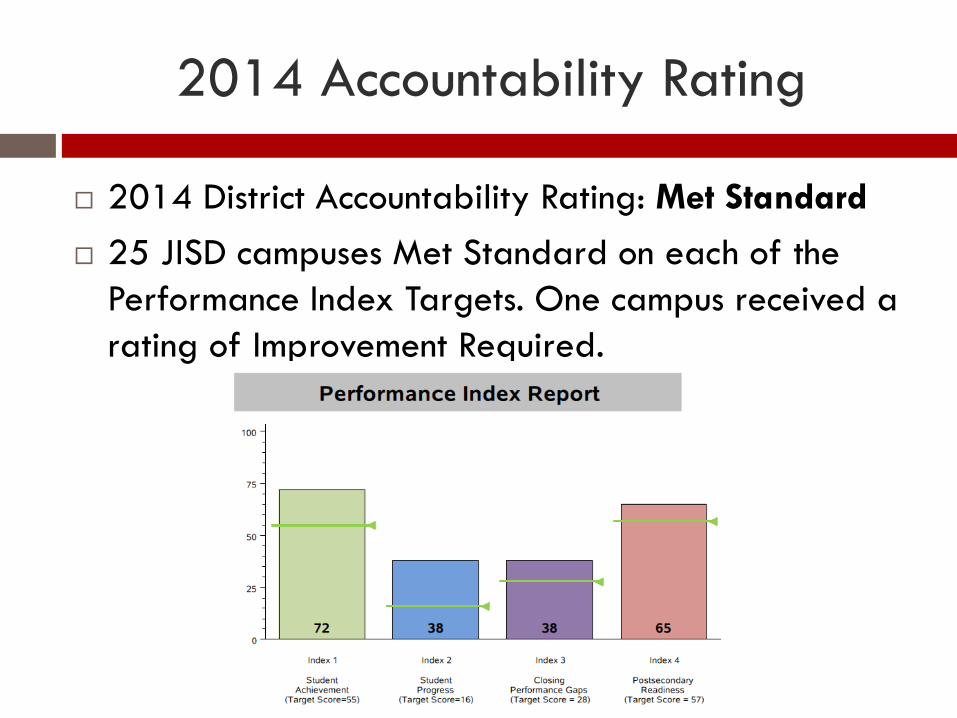
2014 District Accountability Rating: Met Standard
25 JISD campuses Met Standard on each of the Performance Index Targets. One campus received a rating of Improvement Required.
Campus Distinction Designations
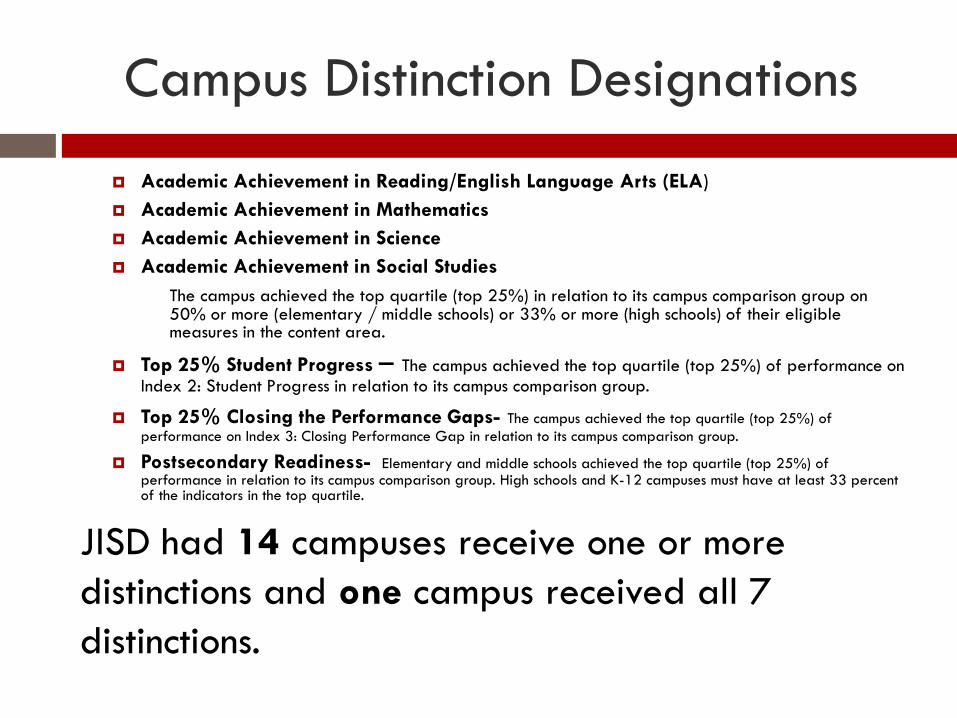
Academic Achievement in Reading/English Language Arts (ELA) Academic Achievement in Mathematics Academic Achievement in Science Academic Achievement in Social Studies The campus achieved the top quartile (top 25%) in relation to its campus comparison group on 50% or more (elementary / middle schools) or 33% or more (high schools) of their eligible measures in the content area.
Top 25% Student Progress – The campus achieved the top quartile (top 25%) of performance on Index 2: Student Progress in relation to its campus comparison group.
Top 25% Closing the Performance Gaps- The campus achieved the top quartile (top 25%) of performance on Index 3: Closing Performance Gap in relation to its campus comparison group.
Postsecondary Readiness- Elementary and middle schools achieved the top quartile (top 25%) of performance in relation to its campus comparison group. High schools and K-12 campuses must have at least 33 percent of the indicators in the top quartile.
JISD had 14 campuses receive one or more distinctions and one campus received all 7 distinctions.
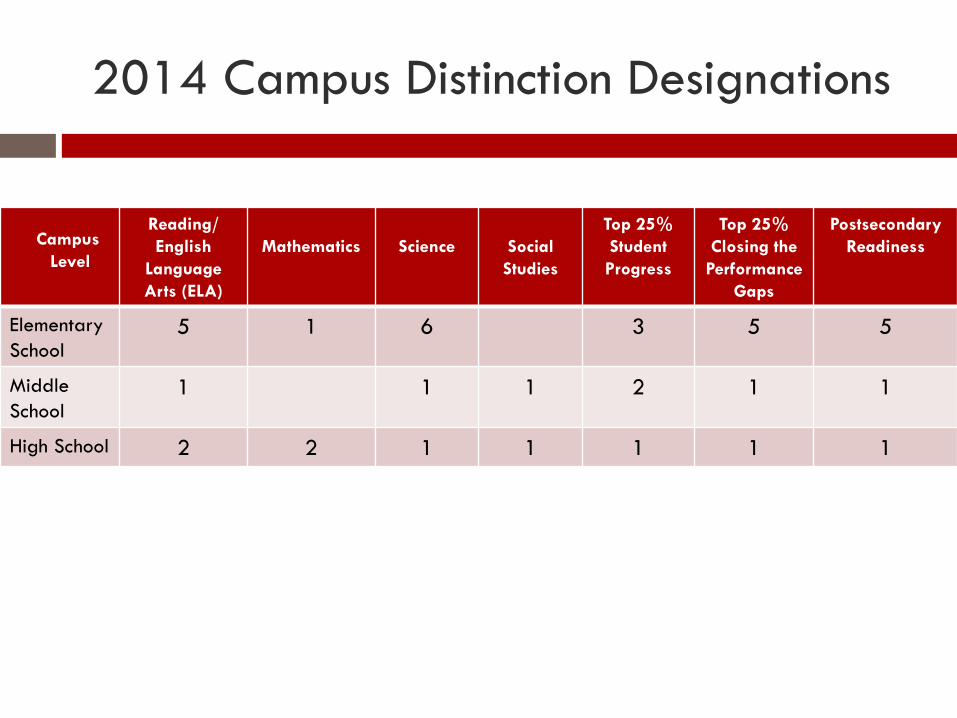
2014 Campus Distinction Designations
Reading/ English
Language Arts (ELA)
Mathematics
Science
Social Studies
Top 25% Student Progress
Top 25% Closing the
Performance Gaps
Postsecondary Readiness
Elementary School
5 1 6 3 5 5
Middle School
1 1 1 2 1 1
High School 2 2 1 1 1 1 1
Campus Level

House Bill 5 Community and Student Engagement
Under House Bill 5 (passed last year by the 83rd Texas Legislature), all districts are required to evaluate the district's performance and the performance of each campus in regard to community and student engagement. House Bill 5 requires a local committee or committees to determine the criteria that the district uses to evaluate and assign performance ratings and to evaluate the district's compliance with statutory reporting and policy requirements. Districts must assign one of four performance ratings - Exemplary, Recognized, Acceptable or Unacceptable - to the district and each campus for overall performance, including the following categories: •
House Bill 5 EOC Remediation Effectiveness
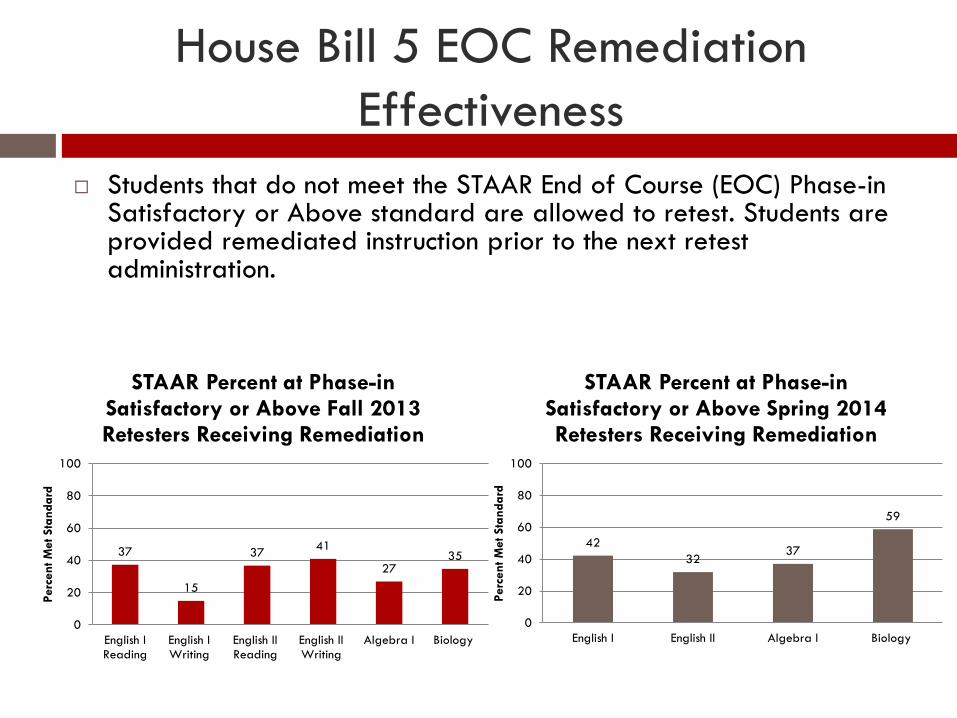
Students that do not meet the STAAR End of Course (EOC) Phase-in Satisfactory or Above standard are allowed to retest. Students are provided remediated instruction prior to the next retest administration.
42 32
37
59
0
20
40
60
80
100
English I English II Algebra I Biology
Perc
ent M
et S
tand
ard
STAAR Percent at Phase-in Satisfactory or Above Spring 2014 Retesters Receiving Remediation
37
15
37 41
27 35
0
20
40
60
80
100
English IReading
English IWriting
English IIReading
English IIWriting
Algebra I Biology
Perc
ent M
et S
tand
ard
STAAR Percent at Phase-in Satisfactory or Above Fall 2013 Retesters Receiving Remediation

Student Information
2013-2014 JISD Total Enrollment 22,928 (+352)
70.5% of students are Economically Disadvantaged (+8.1)
8.2% of students are English Language Learners (ELL) (+ 0.1)
64.6% of students are At-Risk (+8.8)
24.0
52.8
17.8
0.3 1.7 0.3 3.1
23.2
54.8
16.4
0.3 1.8 0.3 3.2
0.0
10.0
20.0
30.0
40.0
50.0
60.0
African American Hispanic White Amer. Indian Asian Pacific Islander Two or More
Perc
ent E
nrol
lmen
t
JISD Ethic Distribution
2013
2014

Student Information
1,749
5,621
1,793 2,106 1,879
5,095
1,785
2,213
0
1,000
2,000
3,000
4,000
5,000
6,000
Bilingual/ESLEducation
Career &TechnicalEducation
Gifted &Talented
Special Ed
Num
ber
of S
tude
nts
Student Enrollment by Program
2013
2014
- 200 400 600 800
1,000 1,200 1,400 1,600 1,800 2,000
Student Enrollment by Grade
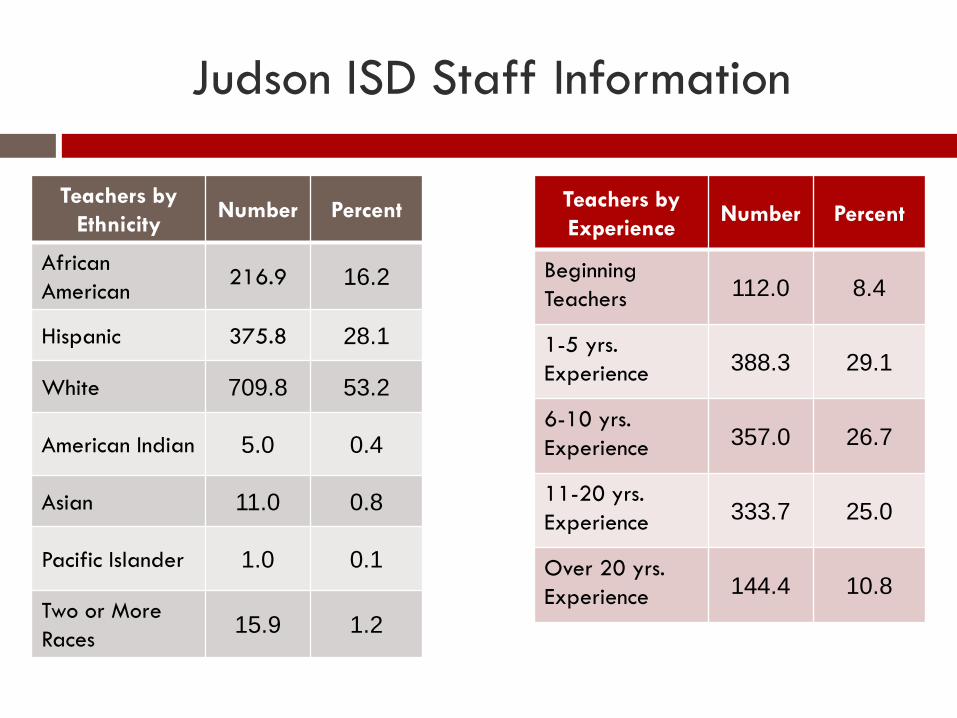
Judson ISD Staff Information
Teachers by Ethnicity
Number Percent
African American
216.9 16.2
Hispanic 375.8 28.1
White 709.8 53.2
American Indian 5.0 0.4
Asian 11.0 0.8
Pacific Islander 1.0 0.1
Two or More Races 15.9 1.2
Teachers by Experience
Number Percent
Beginning Teachers 112.0 8.4
1-5 yrs. Experience 388.3 29.1
6-10 yrs. Experience 357.0 26.7
11-20 yrs. Experience 333.7 25.0
Over 20 yrs. Experience 144.4 10.8
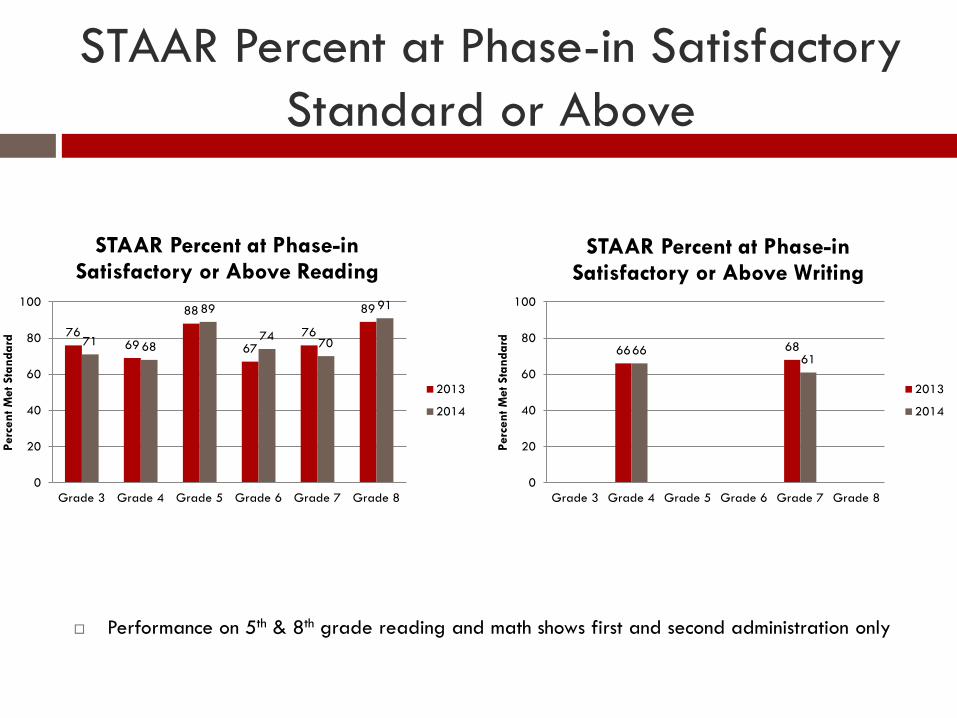
STAAR Percent at Phase-in Satisfactory Standard or Above
Performance on 5th & 8th grade reading and math shows first and second administration only
76 69
88
67 76
89
71 68
89
74 70
91
0
20
40
60
80
100
Grade 3 Grade 4 Grade 5 Grade 6 Grade 7 Grade 8
Perc
ent M
et S
tand
ard
STAAR Percent at Phase-in Satisfactory or Above Reading
2013
2014
66 68 66 61
0
20
40
60
80
100
Grade 3 Grade 4 Grade 5 Grade 6 Grade 7 Grade 8Pe
rcen
t Met
Sta
ndar
d
STAAR Percent at Phase-in Satisfactory or Above Writing
2013
2014

STAAR Percent at Phase-in Satisfactory Standard or Above
Performance on 5th & 8th grade reading and math shows first and second administration only
66 62
89
67 69
83
65 63
89
72
60
81
0
20
40
60
80
100
Grade 3 Grade 4 Grade 5 Grade 6 Grade 7 Grade 8
Perc
ent M
et S
tand
ard
STAAR Percent at Phase-in Satisfactory or Above Mathematics
2013
2014
71 68 72 66
0
20
40
60
80
100
Grade 4 Grade 5 Grade 6 Grade 7 Grade 8Pe
rcen
t Met
Sta
ndar
d
STAAR Percent at Phase-in Satisfactory or Above Science
2013
2014

STAAR Percent at Phase-in Satisfactory Standard or Above
63 57
0
20
40
60
80
100
Grade 3 Grade 4 Grade 5 Grade 6 Grade 7 Grade 8
Perc
ent M
et S
tand
ard
STAAR Percent at Phase-in Satisfactory or Above Social Studies
2013
2014

STAAR End of Course (EOC) Percent at Phase-in Satisfactory Standard or Above
Includes cumulative performance from EOC assessments administered in July 2013, December 2013 and Spring 2014
69
80
65 66 72
86 93
0
20
40
60
80
100
English I English II Algebra I Biology US History
Perc
ent M
et S
tand
ard
STAAR Percent at Phase-in Satisfactory or Above End of Course
2013
2014
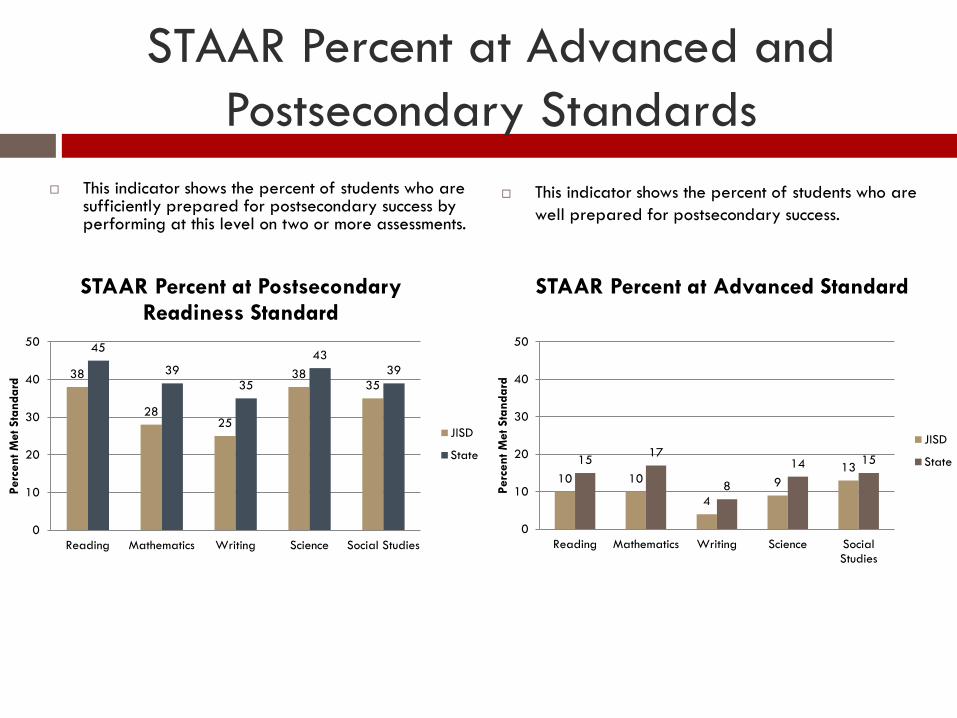
STAAR Percent at Advanced and Postsecondary Standards
This indicator shows the percent of students who are sufficiently prepared for postsecondary success by performing at this level on two or more assessments.
10 10
4 9
13 15 17
8
14 15
0
10
20
30
40
50
Reading Mathematics Writing Science SocialStudies
Perc
ent M
et S
tand
ard
STAAR Percent at Advanced Standard
JISD
State
38
28 25
38 35
45
39 35
43 39
0
10
20
30
40
50
Reading Mathematics Writing Science Social Studies
Perc
ent M
et S
tand
ard
STAAR Percent at Postsecondary Readiness Standard
JISD
State
This indicator shows the percent of students who are well prepared for postsecondary success.
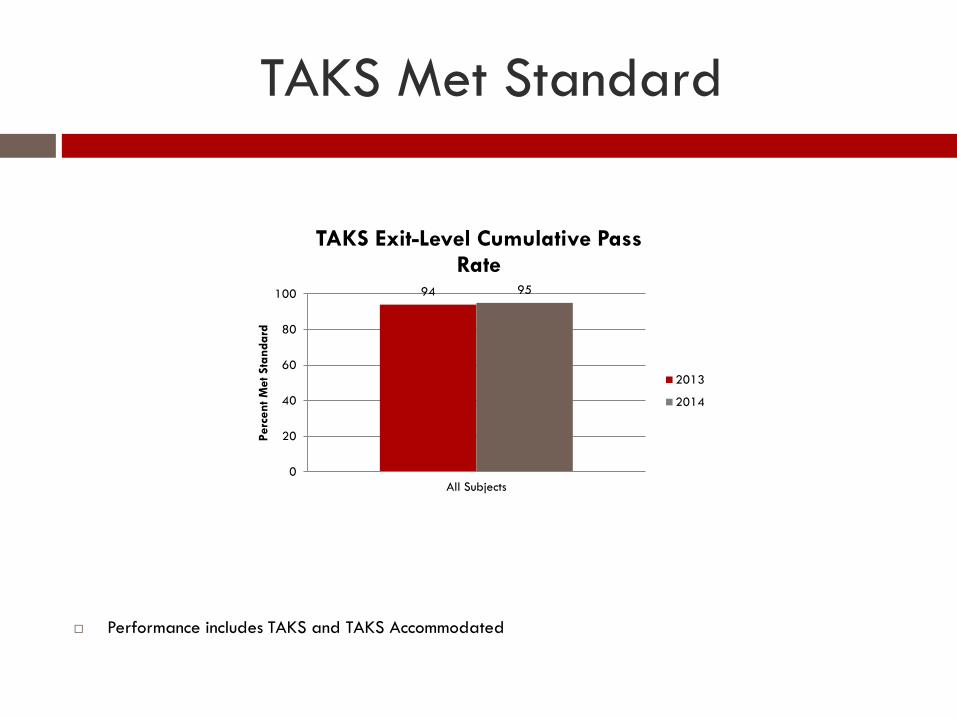
TAKS Met Standard
Performance includes TAKS and TAKS Accommodated
94 95
0
20
40
60
80
100
All Subjects
Perc
ent M
et S
tand
ard
TAKS Exit-Level Cumulative Pass Rate
2013
2014

Progress Measure
This indicator shows the percent of students who met or exceeded the STAAR progress measure as determined by comparing a student’s gain score— the difference between the student’s current year score and prior year score—to a progress target.
59 55 61 60
0
20
40
60
80
100
Reading Mathematics
Perc
ent M
et o
r Ex
ceed
ed
2014 STAAR Percent Met or Exceeded Progress
JISD
State
16 14 17 18
0
20
40
60
80
100
Reading Mathematics
Perc
ent E
xcee
ded
2014 STAAR Percent Exceeded Progress
JISD
State
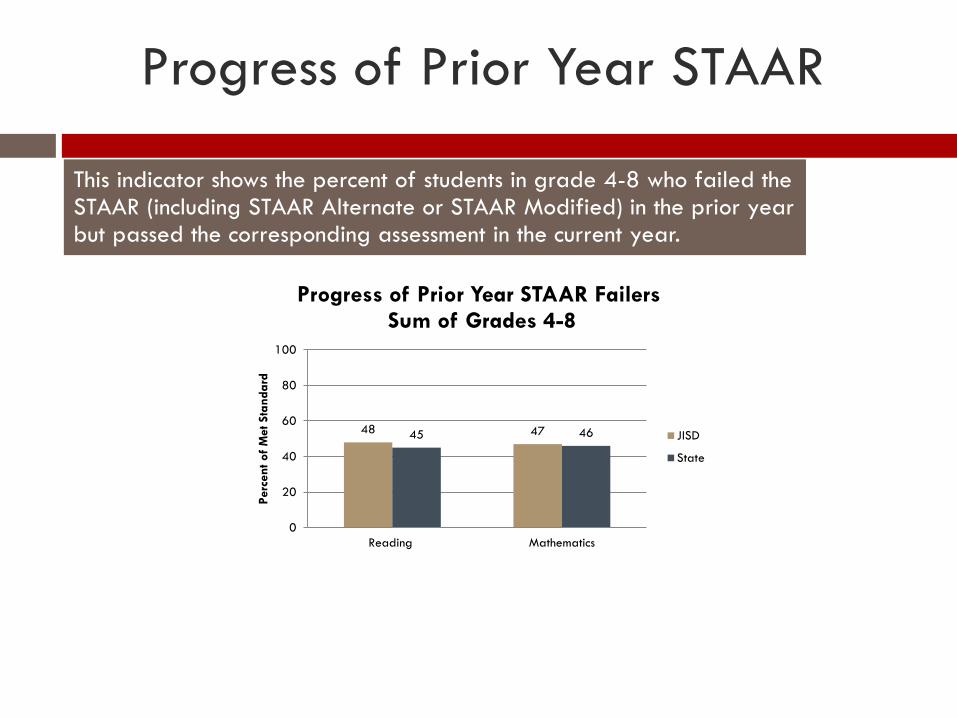
Progress of Prior Year STAAR
This indicator shows the percent of students in grade 4-8 who failed the STAAR (including STAAR Alternate or STAAR Modified) in the prior year but passed the corresponding assessment in the current year.
48 47 45 46
0
20
40
60
80
100
Reading Mathematics
Perc
ent o
f M
et S
tand
ard
Progress of Prior Year STAAR Failers Sum of Grades 4-8
JISD
State

Student Success Initiative (SSI) This indicator shows the percent of students who did not pass the first administration of the STAAR. Students who did not pass the test during the first administration must be provided accelerated instruction in preparation for the second administration.
This indicator shows the cumulative (and unduplicated) percent of students who took and passed the tests in the first and second administrations combined.
22 21 17
21 23 21 17 20
0
20
40
60
80
100
Grade 5Reading
Grade 5Mathematics
Grade 8Reading
Grade 8Mathematics
Perc
ent o
f St
uden
ts
Student Success Initiative Students Requiring Accelerated
Instruction
JISD
State
89 89 91 87 86 88 89 87
0
20
40
60
80
100
Grade 5Reading
Grade 5Mathematics
Grade 8Reading
Grade 8Mathematics
Perc
ent M
et S
tand
ard
Student Success Initiative STAAR Cumulative Met Standard
JISD
State
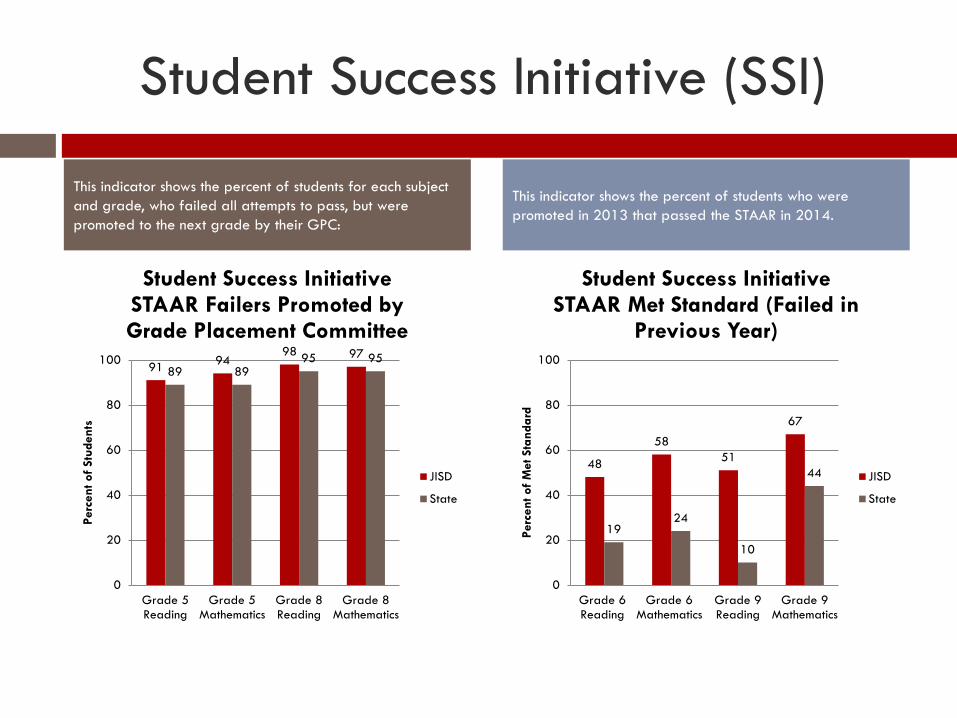
Student Success Initiative (SSI)
This indicator shows the percent of students for each subject and grade, who failed all attempts to pass, but were promoted to the next grade by their GPC:
This indicator shows the percent of students who were promoted in 2013 that passed the STAAR in 2014.
91 94 98 97
89 89 95 95
0
20
40
60
80
100
Grade 5Reading
Grade 5Mathematics
Grade 8Reading
Grade 8Mathematics
Perc
ent o
f St
uden
ts
Student Success Initiative STAAR Failers Promoted by Grade Placement Committee
JISD
State
48
58 51
67
19 24
10
44
0
20
40
60
80
100
Grade 6Reading
Grade 6Mathematics
Grade 9Reading
Grade 9Mathematics
Perc
ent o
f M
et S
tand
ard
Student Success Initiative STAAR Met Standard (Failed in
Previous Year)
JISD
State
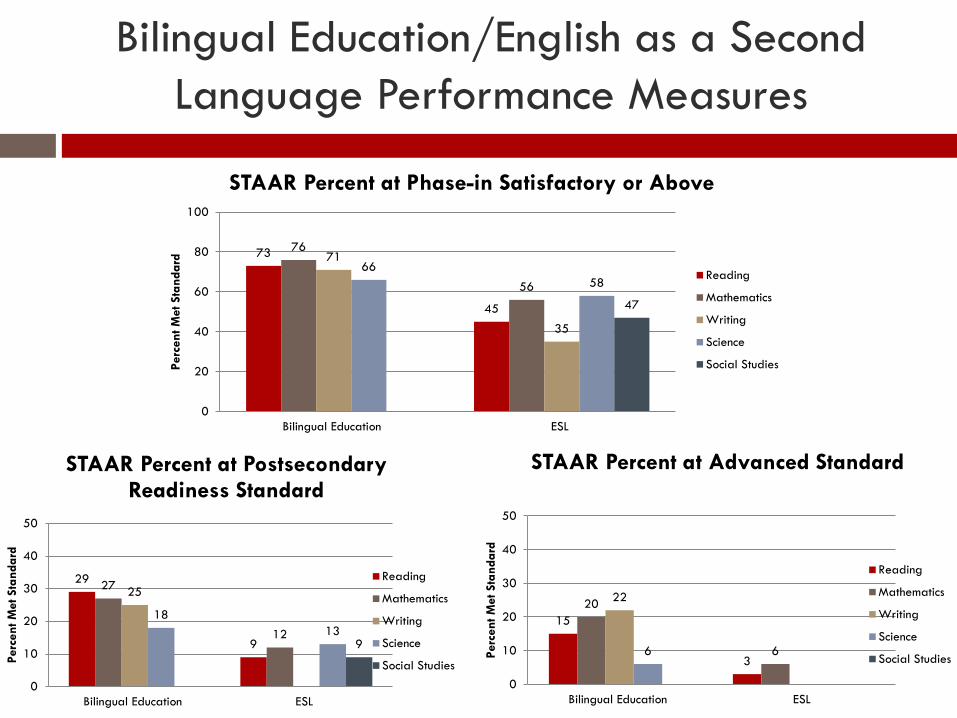
Bilingual Education/English as a Second Language Performance Measures
29
9
27
12
25
18 13
9
0
10
20
30
40
50
Bilingual Education ESL
Perc
ent M
et S
tand
ard
STAAR Percent at Postsecondary Readiness Standard
Reading
Mathematics
Writing
Science
Social Studies
15
3
20
6
22
6
0
10
20
30
40
50
Bilingual Education ESL
Perc
ent M
et S
tand
ard
STAAR Percent at Advanced Standard
Reading
Mathematics
Writing
Science
Social Studies
73
45
76
56
71
35
66 58
47
0
20
40
60
80
100
Bilingual Education ESL
Perc
ent M
et S
tand
ard
STAAR Percent at Phase-in Satisfactory or Above
Reading
Mathematics
Writing
Science
Social Studies

Bilingual Education/English as a Second Language Performance Measures
74
55
79
47
0
20
40
60
80
100
Bilingual Education ESL
Perc
ent M
et S
tand
ard
STAAR Percent Met or Exceeded Progress
Reading
Mathematics 30
15
40
10
0
20
40
60
80
100
Bilingual Education ESL
Perc
ent M
et S
tand
ard
STAAR Percent Exceeded Progress
Reading
Mathematics
56
33
60
37
0
20
40
60
80
100
Bilingual Education ESL
Perc
ent M
et S
tand
ard
Progress Prior Year STAAR Failers Sum of Grade 4-8
Reading
Mathematics
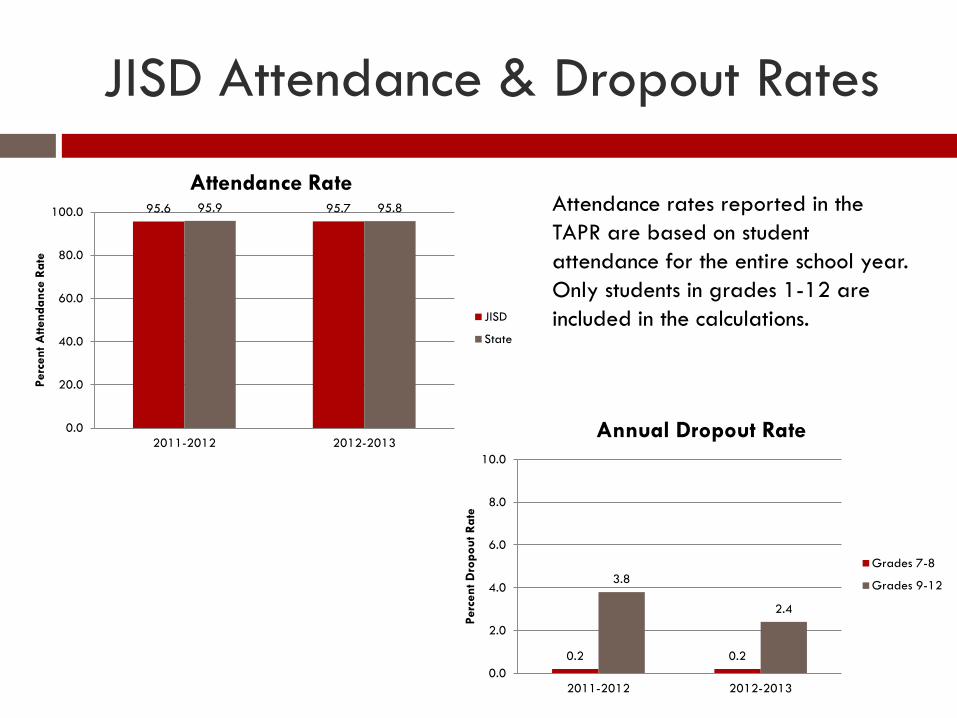
JISD Attendance & Dropout Rates
Attendance rates reported in the TAPR are based on student attendance for the entire school year. Only students in grades 1-12 are included in the calculations.
95.6 95.7 95.9 95.8
0.0
20.0
40.0
60.0
80.0
100.0
2011-2012 2012-2013
Perc
ent A
ttend
ance
Rat
e
Attendance Rate
JISD
State
0.2 0.2
3.8
2.4
0.0
2.0
4.0
6.0
8.0
10.0
2011-2012 2012-2013
Perc
ent D
ropo
ut R
ate
Annual Dropout Rate
Grades 7-8
Grades 9-12

Graduation Rate
The 4-Year Longitudinal Rate, the cohort consists of students who first attended ninth grade in 2009-10. They are followed through their expected graduation with the class of 2013.
84%
0% 4% 12%
Four Year Longitudinal Graduation Rate Grades 9-12 Class of 2013
Graduated Received GED Continued HS Dropped Out (4-yr)
87%
1% 1% 11%
Five Year Longitudinal Graduation Rate Grades 9-12 Class of 2012
Graduated Received GED Continued HS Dropped Out (4-yr)
The 5-Year Extended Longitudinal Rate, the cohort consists of students who first attended ninth grade in 2008-09. They are followed for five years, and included if they graduated within a year after their expected graduation with the class of 2012.

College Readiness Indicators 2012-2013sy
28.0% of JISD High School students completed and received credit for at least one or more Advanced/Dual Enrollment Course in grades 9-12.
82.4% of the Class of 2013 completed the Recommended High School Plan or Distinguished Academic Plan Graduation Programs
AP and IB examination results (students in grades11and12 taking at least one examination) 11.4% tested 51.1% of those taking the exams met or exceeded exam criterion
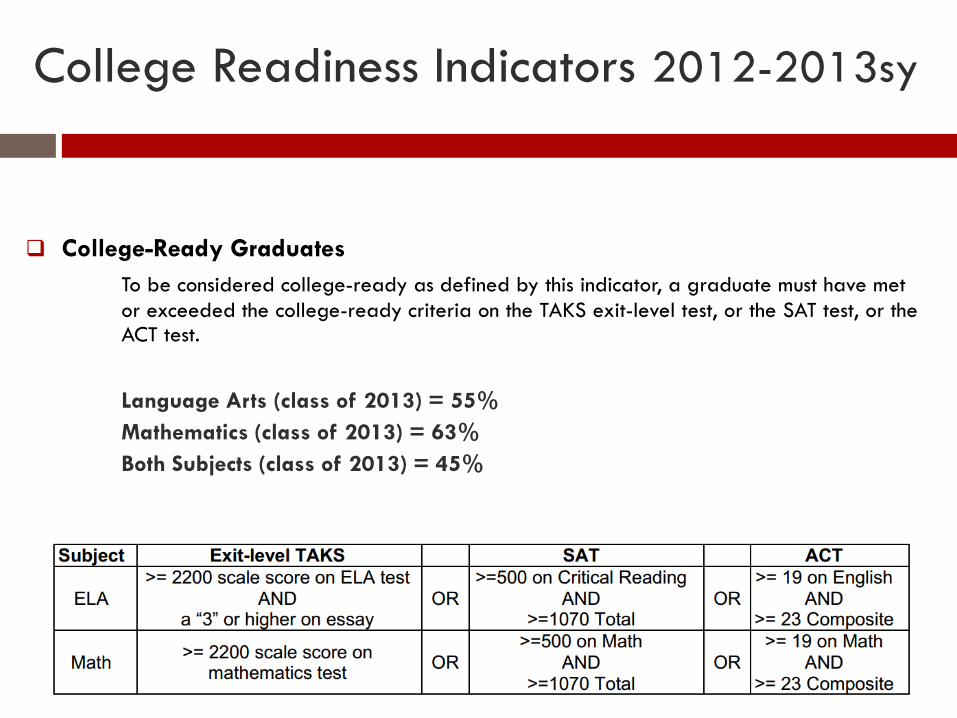
College Readiness Indicators 2012-2013sy
College-Ready Graduates
To be considered college-ready as defined by this indicator, a graduate must have met or exceeded the college-ready criteria on the TAKS exit-level test, or the SAT test, or the ACT test.
Language Arts (class of 2013) = 55% Mathematics (class of 2013) = 63% Both Subjects (class of 2013) = 45%

College Readiness Indicators
SAT/ACT (2013) Participation Rate = 67.9% At or Above Criterion = 12.1%
SAT Class of 2013 ACT Class of 2013 Average score = 1329 Average Score=19.0
State Average = 1422 State Average Score=20.6
Texas Institution of Higher Education (IHE) 2011-2012sy
50.0% Graduates Enrolled in Texas Institution of Higher Education
53.9% of Graduates in Texas Institution of Higher Education Completing One year without remediation
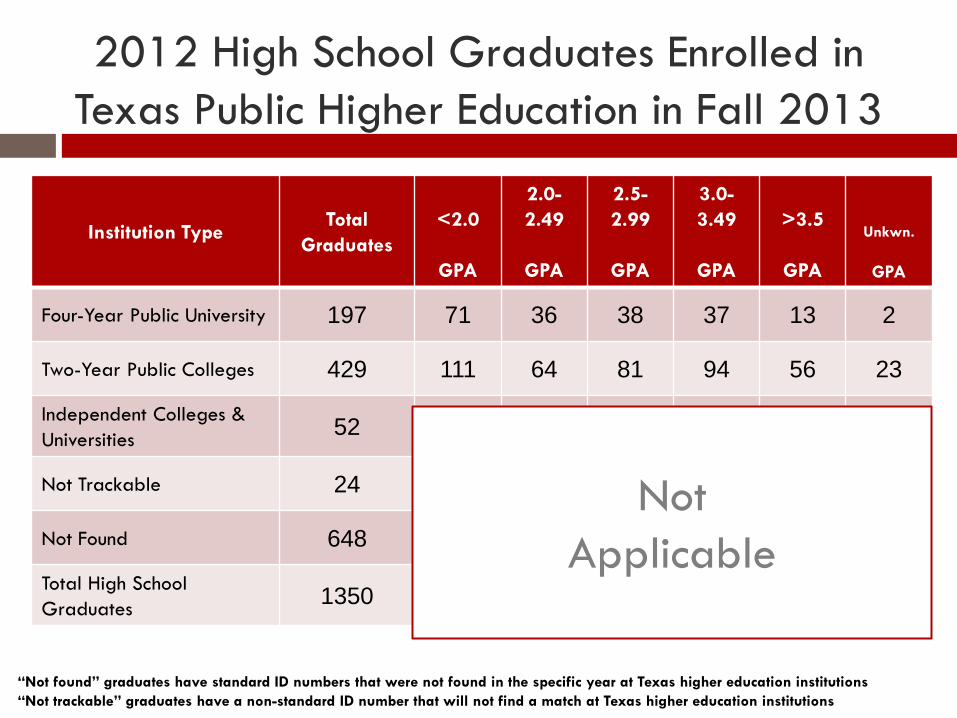
2012 High School Graduates Enrolled in Texas Public Higher Education in Fall 2013
Institution Type Total
Graduates <2.0
GPA
2.0-2.49
GPA
2.5-2.99
GPA
3.0-3.49
GPA
>3.5
GPA
Unkwn.
GPA
Four-Year Public University 197 71 36 38 37 13 2
Two-Year Public Colleges 429 111 64 81 94 56 23
Independent Colleges & Universities 52
Not Trackable 24
Not Found 648
Total High School Graduates 1350
Not Applicable
“Not found” graduates have standard ID numbers that were not found in the specific year at Texas higher education institutions “Not trackable” graduates have a non-standard ID number that will not find a match at Texas higher education institutions
Campus Improvement Plans Set performance objectives based on TAPR, and Periodically measure progress toward those objectives Campus Performance Objectives are approved by the Board Campus Improvement Plans for each campus are posted on the district’s website. http://www.judsonisd.org/district/instruction/ImprovementPlans.cfm
Campus Performance Objectives
Texas statute (TEC 39.053) requires every district to publish a report on violent and criminal incidents at campuses in the district by: • Number, type and rate. • School prevention & interventions
Violent and Criminal Incidents
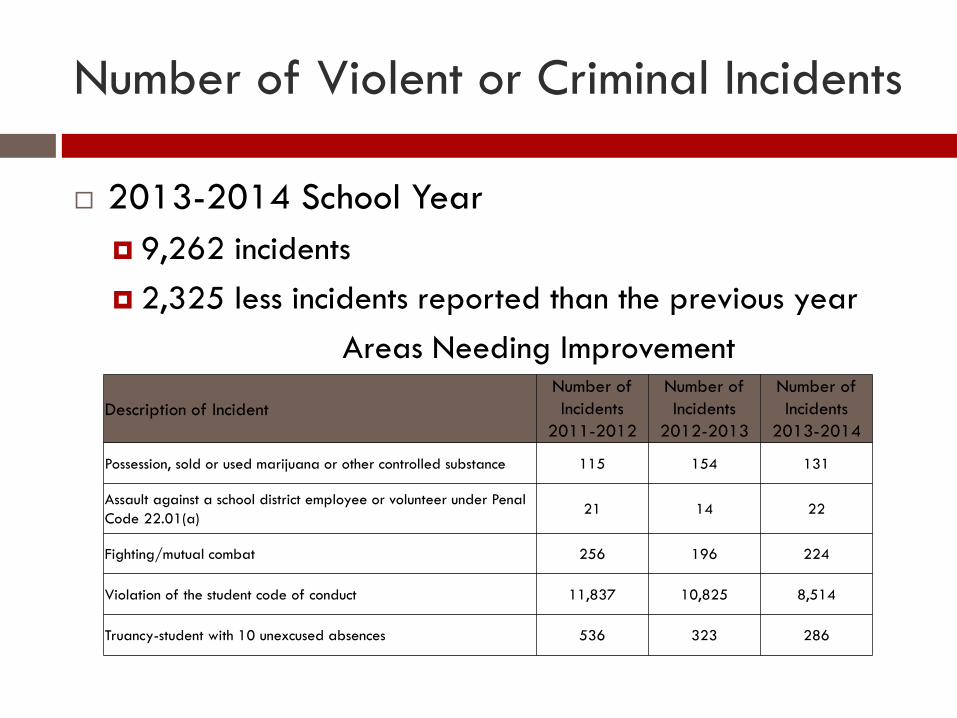
Number of Violent or Criminal Incidents
2013-2014 School Year 9,262 incidents 2,325 less incidents reported than the previous year
Areas Needing Improvement Description of Incident
Number of Incidents
2011-2012
Number of Incidents
2012-2013
Number of Incidents
2013-2014
Possession, sold or used marijuana or other controlled substance 115 154 131
Assault against a school district employee or volunteer under Penal Code 22.01(a)
21 14 22
Fighting/mutual combat 256 196 224
Violation of the student code of conduct 11,837 10,825 8,514
Truancy-student with 10 unexcused absences 536 323 286

School Violence Prevention and Interventions
Our district Crisis Management Plan addresses policies and procedures that have been approved by the Board of Trustees. These procedures require...
...a Campus Crisis Management Plan ...a Student Code of Conduct ...Safety Drills ...periodical Safety Meetings with each Campus Crisis Management Team The Director of Pupil Services meets with each Campus Crisis
Management Team at the beginning of each school year to review and update policy and procedures.
School Violence Prevention and Interventions
All bullying allegations reported through our bullying alert system, located on our district website home page, are immediately sent to campus administration, the Director of Pupil Services and the Executive Director of Student Support Services, who are then instructed to promptly investigate the allegations made.
Our Raptor System, used to scan any nonemployee visitors
drivers licenses, automatically notify the person scanning the ID, the campus administration, the Executive Director of Student Support Services, the Director of Pupil Services and the Chief Technology Officer of a registered sex offender or anyone with a criminal background that could pose a threat to the campus. This ensures that the person is identified and removed from the campus.

School Violence Prevention and Interventions
The adopted 2013-2014 Student Code of Conduct sets for the rules and expectations of all JISD students and the possible outcome should a student choose to not uphold the rules set for by the Student Code of Conduct.

The TAPR Annual Report is available on the JISD district website. The TAPR Annual Report is also located at the JISD Education Resource Center, Woodlake Hills Middle School, and Hopkins Elementary School.
Contact Information: Rebecca Defenbaugh Office of Data Research & Accountability 210-945-5552
Additional Information