Embed Size (px)
Citation preview
2012-2013 State FFA
Farm Business Management
Career Development Event
Preparation Guide
Prepared by
Sarah A. Drollette
Department of Applied Economics
Utah State University
FFA Advisors,
This guide is designed to provide information you may use to help your students better prepare for the
state-level FFA Farm Business Management Career Development Event. The following materials include
information regarding the format, rules, and scoring of the Farm Business Management event and what
students can expect on the day of the event. Also included is an outline and some definitions, examples,
and explanations relating to topics that may be included in the sections of the event.
In response to input from FFA advisors of participating chapters in past years, the format of the event
last year and this year has been modified relative to previous years. These modifications are meant to
shorten and decrease the difficulty level of the event. The new format is outlined in this guide.
For those students who advance to the national level event, it is important to note that this guide does
not address all the principles and concepts that may be used in the national event. Students should
refer to the National FFA website for more information regarding what to expect at the national event.
I hope this guide will be useful in helping your students prepare for the state event and I welcome any
feedback you may have.
Sincerely,
Sarah A. Drollette
Extension Educator
Department of Applied Economics
Utah State University
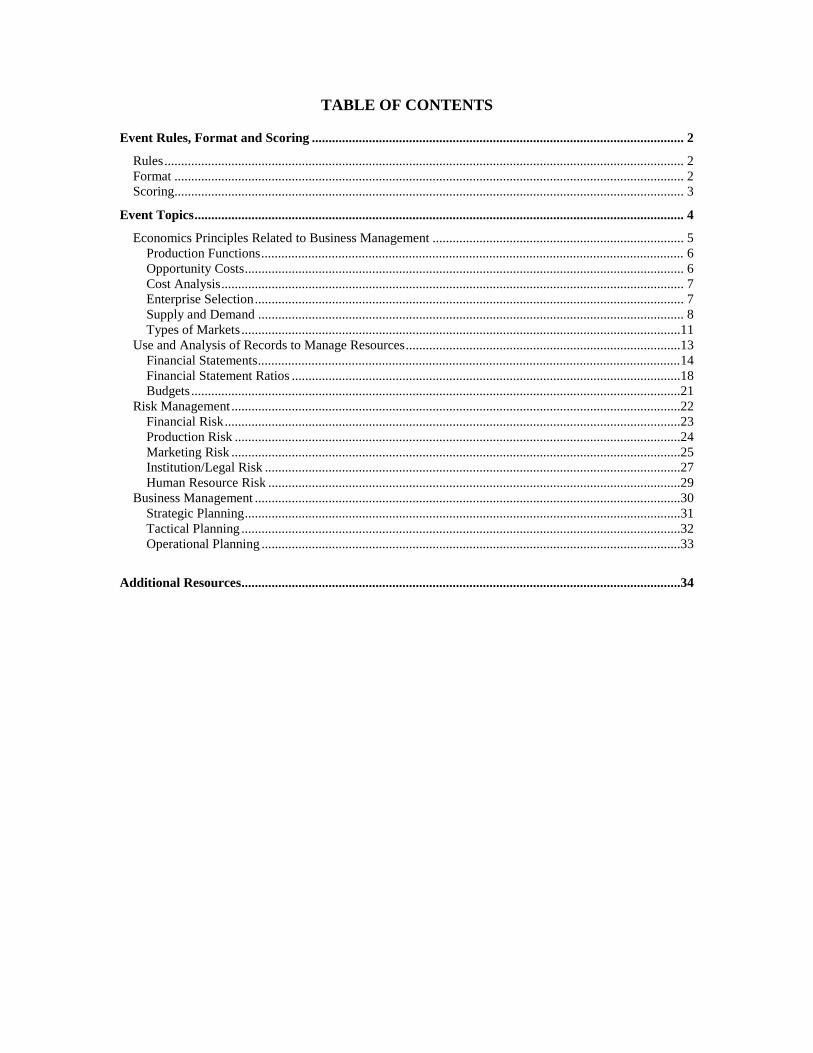
TABLE OF CONTENTS
Event Rules, Format and Scoring ............................................................................................................... 2
Rules ........................................................................................................................................................... 2
Format ........................................................................................................................................................ 2
Scoring........................................................................................................................................................ 3
Event Topics .................................................................................................................................................. 4
Economics Principles Related to Business Management ........................................................................... 5
Production Functions .............................................................................................................................. 6
Opportunity Costs ................................................................................................................................... 6
Cost Analysis .......................................................................................................................................... 7
Enterprise Selection ................................................................................................................................ 7
Supply and Demand ............................................................................................................................... 8
Types of Markets ...................................................................................................................................11
Use and Analysis of Records to Manage Resources ..................................................................................13
Financial Statements ..............................................................................................................................14
Financial Statement Ratios ....................................................................................................................18
Budgets ..................................................................................................................................................21
Risk Management ......................................................................................................................................22
Financial Risk ........................................................................................................................................23
Production Risk .....................................................................................................................................24
Marketing Risk ......................................................................................................................................25
Institution/Legal Risk ............................................................................................................................27
Human Resource Risk ...........................................................................................................................29
Business Management ...............................................................................................................................30
Strategic Planning ..................................................................................................................................31
Tactical Planning ...................................................................................................................................32
Operational Planning .............................................................................................................................33
Additional Resources...................................................................................................................................34
Farm Business Management CDE Preparation Guide
Farm Business Management CDE Preparation Guide P a g e | 2
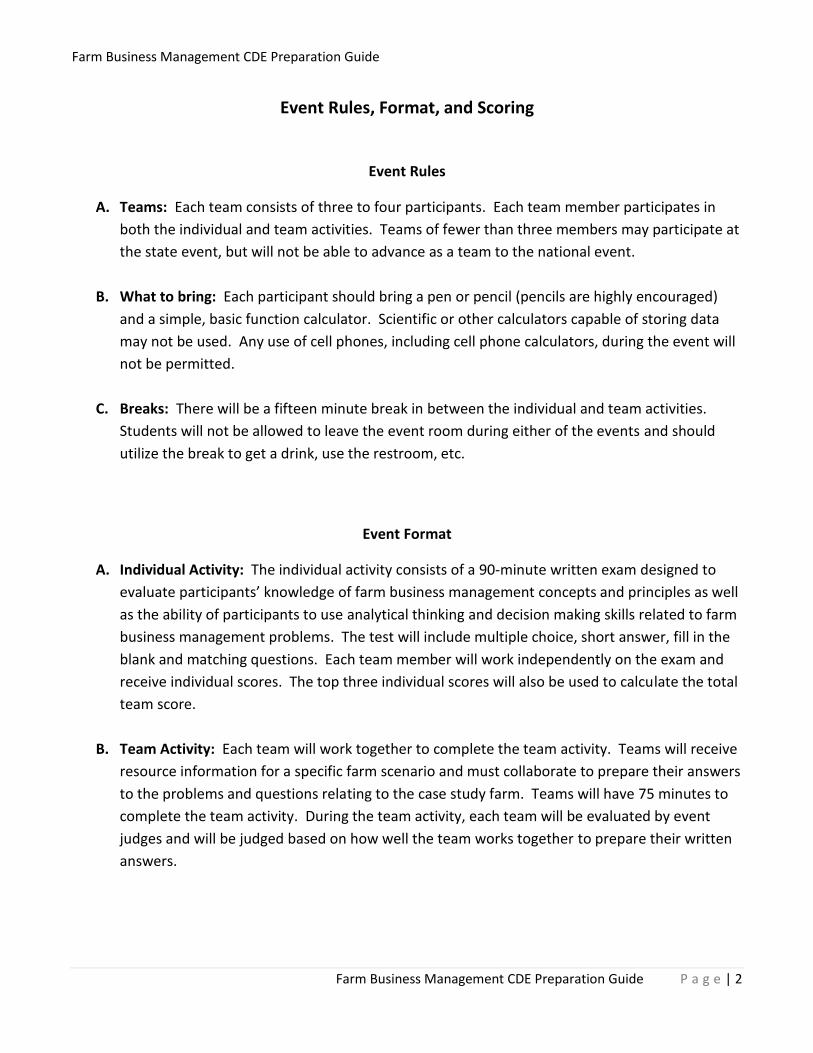
Event Rules, Format, and Scoring
Event Rules
A. Teams: Each team consists of three to four participants. Each team member participates in
both the individual and team activities. Teams of fewer than three members may participate at
the state event, but will not be able to advance as a team to the national event.
B. What to bring: Each participant should bring a pen or pencil (pencils are highly encouraged)
and a simple, basic function calculator. Scientific or other calculators capable of storing data
may not be used. Any use of cell phones, including cell phone calculators, during the event will
not be permitted.
C. Breaks: There will be a fifteen minute break in between the individual and team activities.
Students will not be allowed to leave the event room during either of the events and should
utilize the break to get a drink, use the restroom, etc.
Event Format
A. Individual Activity: The individual activity consists of a 90-minute written exam designed to
evaluate participants’ knowledge of farm business management concepts and principles as well
as the ability of participants to use analytical thinking and decision making skills related to farm
business management problems. The test will include multiple choice, short answer, fill in the
blank and matching questions. Each team member will work independently on the exam and
receive individual scores. The top three individual scores will also be used to calculate the total
team score.
B. Team Activity: Each team will work together to complete the team activity. Teams will receive
resource information for a specific farm scenario and must collaborate to prepare their answers
to the problems and questions relating to the case study farm. Teams will have 75 minutes to
complete the team activity. During the team activity, each team will be evaluated by event
judges and will be judged based on how well the team works together to prepare their written
answers.
Farm Business Management CDE Preparation Guide
Farm Business Management CDE Preparation Guide P a g e | 3
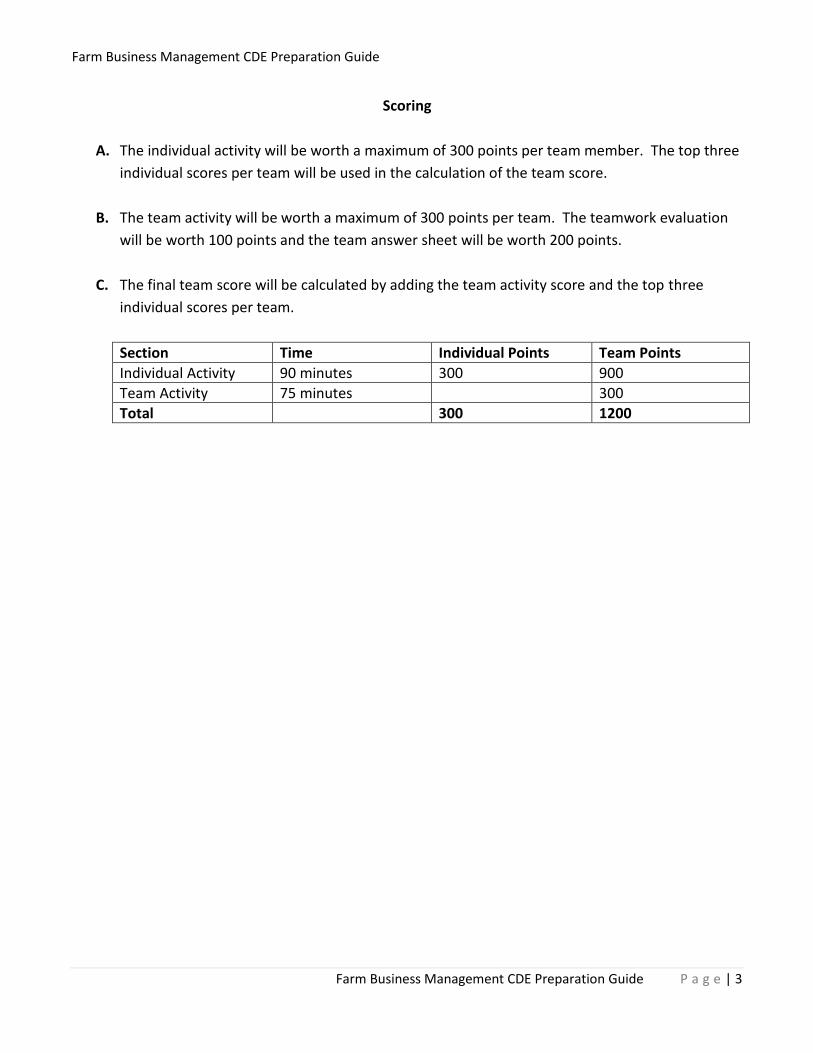
Scoring
A. The individual activity will be worth a maximum of 300 points per team member. The top three
individual scores per team will be used in the calculation of the team score.
B. The team activity will be worth a maximum of 300 points per team. The teamwork evaluation
will be worth 100 points and the team answer sheet will be worth 200 points.
C. The final team score will be calculated by adding the team activity score and the top three
individual scores per team.
Section Time Individual Points Team Points
Individual Activity 90 minutes 300 900
Team Activity 75 minutes 300
Total 300 1200
Farm Business Management CDE Preparation Guide
Farm Business Management CDE Preparation Guide P a g e | 4
Event Topics
The following section contains definitions and principles related to farm business management
topics that may be included in the farm business management career development event. This
preparation guide only contains brief explanations and examples of these topics, and should
not be viewed as a definitive source of information relative to any of these concepts. Further
understanding may be gained from additional sources; some additional resources are listed at
the end of this guide.
These topics do not incorporate all concepts that may be included in the national event.
Students who advance to the national level event may refer to the National FFA website
regarding preparation for the national event.
Farm Business Management CDE Preparation Guide
Farm Business Management CDE Preparation Guide P a g e | 5
Economic Principles Related to Business Management
1. Production Functions
A. Diminishing returns
B. Profit maximization
2. Opportunity Costs
3. Cost Analysis
A. Fixed costs
B. Variable costs
C. Total costs
D. Average costs
E. Marginal costs
4. Enterprise Selection
A. Specialization
B. Diversification
5. Supply and Demand
A. Law of Demand
B. Law of Supply
C. Equilibrium
D. Substitute and complementary goods
E. Comparative advantage
6. Types of Markets
A. Perfectly competitive markets
B. Monopolistic competition markets
C. Oligopoly markets
D. Monopoly markets
Farm Business Management CDE Preparation Guide
Farm Business Management CDE Preparation Guide P a g e | 6
Production Functions
Production functions show the relationship between inputs and outputs. In general, increases in
inputs will increase output until a maximum production point is reached. (Note: The production
function does not take into account input and output prices. Thus, the maximum production point
is not the same as the profit maximizing point.)
A. Diminishing returns: As inputs increase from zero, outputs will increase at an increasing rate.
At a certain point, however, outputs will continue increasing but at a decreasing rate. Thus for
each additional unit of input, the additional amount of output produced will become smaller
and smaller. This is known as diminishing returns. Output will continue to increase at a
decreasing rate until the maximum production point where continued increases will actually
decrease output.
For example, adding water to a corn field will increase the corn yield. Adding more water will
continue to increase corn yield, but at some point the increase in output diminishes relative to
the input. Once the maximum production point it reached, adding more water will no longer
increase yield, but decrease it and adding way too much water may flood the field and destroy
output completely.
B. Profit maximization: The profit maximizing point occurs where marginal revenue is equal to
marginal cost (MR=MC).
i. Marginal revenue: Marginal revenue is the additional revenue generated from the sale
of an additional unit of output.
ii. Marginal cost: Marginal cost is the additional cost incurred from an additional unit of
output produced.
Opportunity Costs
An opportunity cost is the highest-valued alternative that must be foregone when a choice is made.
For example, if a producer chooses to grow wheat and his next best alternative is to grow corn, the
opportunity cost of growing wheat would be the value of growing corn. Opportunity costs relate to
resources, including labor, as well as investment opportunities.
Farm Business Management CDE Preparation Guide
Farm Business Management CDE Preparation Guide P a g e | 7
Cost Analysis
Business costs are made up of several different types of costs.
A. Fixed costs: Costs that do not change with changes in output. Fixed costs may include: loan or
mortgage interest expenses, property taxes, insurance, etc.
B. Variable costs: Costs that change with changes in output. Variable costs increase when output
increases. Examples of variable costs may include: feed, labor, seed, fuel, etc.
C. Total costs: The total cost required to produce a certain level of output.
Total costs = Variable costs + Fixed Costs
D. Average costs: The cost of producing a certain level of output divided by the number of units
produced. Average costs can be calculated for fixed, variable, and total costs.
E. Marginal costs: Marginal cost is the additional cost incurred from an additional unit of output
produced.
Enterprise Selection
A. Specialization: Specialization includes focusing all production energies in the production of one
commodity or product. In general, specializing in one product in which the producer has a
comparative advantage will increase overall farm profits.
B. Diversification: Diversification includes producing more than one product. A producer who
diversifies may produce several types of crops or livestock commodities. Diversification may
decrease total profits, but will generally decrease risk as well.
Farm Business Management CDE Preparation Guide
Farm Business Management CDE Preparation Guide P a g e | 8
Supply and Demand
A. Law of Supply: There is a direct relationship between the price of a good and the quantity
supplied, ceteris paribus. In other words, as the price of a good increases, the quantity supplied
increases or as the price decreases, the quantity supplied decreases. Supply can be graphically
depicted by an upward sloping curve.
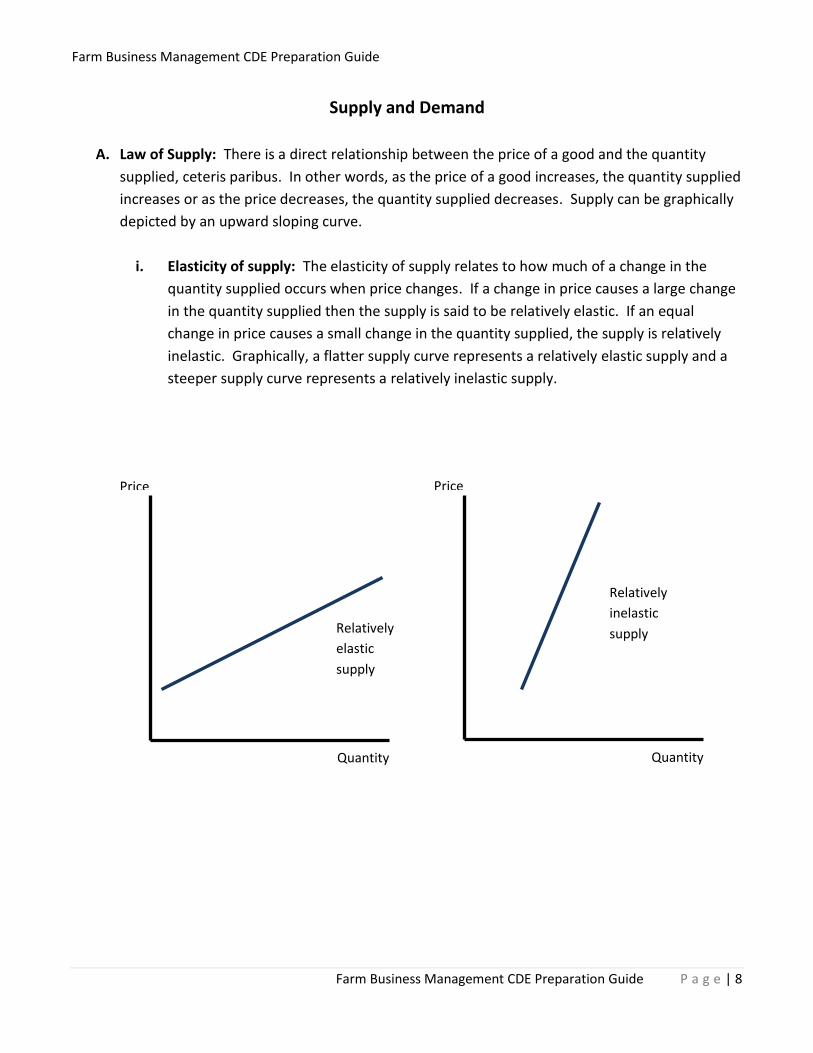
i. Elasticity of supply: The elasticity of supply relates to how much of a change in the
quantity supplied occurs when price changes. If a change in price causes a large change
in the quantity supplied then the supply is said to be relatively elastic. If an equal
change in price causes a small change in the quantity supplied, the supply is relatively
inelastic. Graphically, a flatter supply curve represents a relatively elastic supply and a
steeper supply curve represents a relatively inelastic supply.
Price
Quantity
Relatively
elastic
supply
Price
Quantity
Relatively
inelastic
supply
Farm Business Management CDE Preparation Guide
Farm Business Management CDE Preparation Guide P a g e | 9
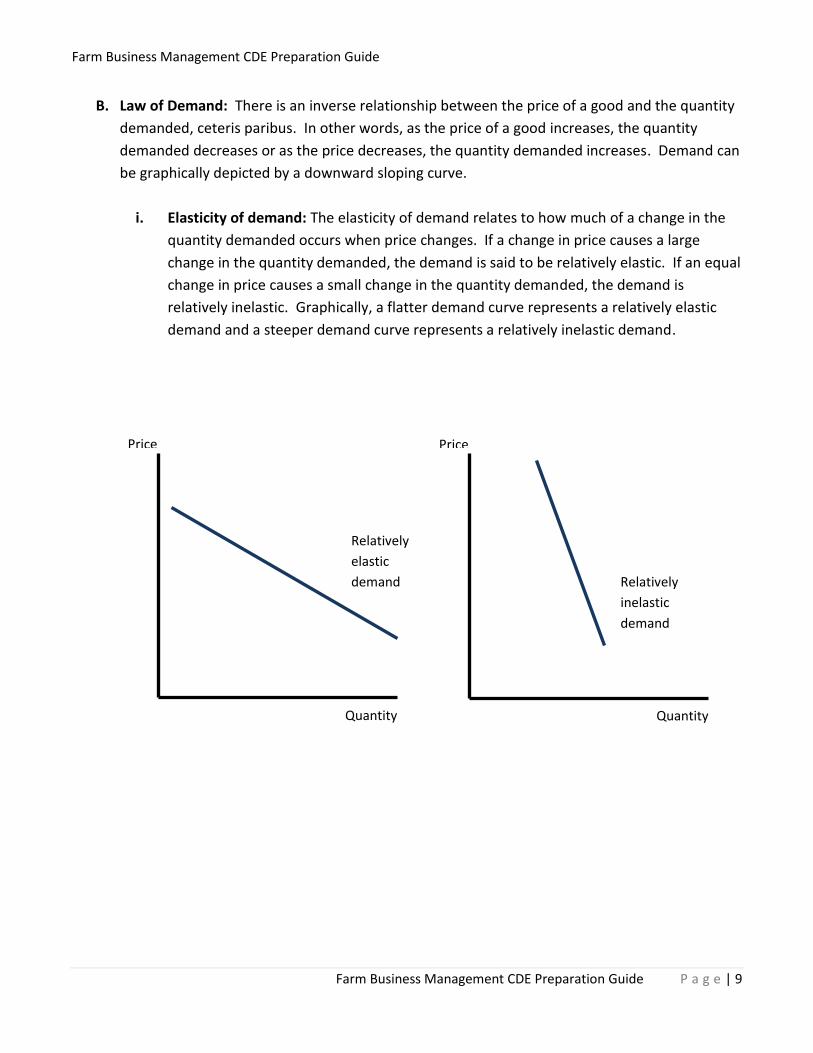
B. Law of Demand: There is an inverse relationship between the price of a good and the quantity
demanded, ceteris paribus. In other words, as the price of a good increases, the quantity
demanded decreases or as the price decreases, the quantity demanded increases. Demand can
be graphically depicted by a downward sloping curve.
i. Elasticity of demand: The elasticity of demand relates to how much of a change in the
quantity demanded occurs when price changes. If a change in price causes a large
change in the quantity demanded, the demand is said to be relatively elastic. If an equal
change in price causes a small change in the quantity demanded, the demand is
relatively inelastic. Graphically, a flatter demand curve represents a relatively elastic
demand and a steeper demand curve represents a relatively inelastic demand.
Price
Quantity
Relatively
elastic
demand
Price
Quantity
Relatively
inelastic
demand
Farm Business Management CDE Preparation Guide
Farm Business Management CDE Preparation Guide P a g e | 10
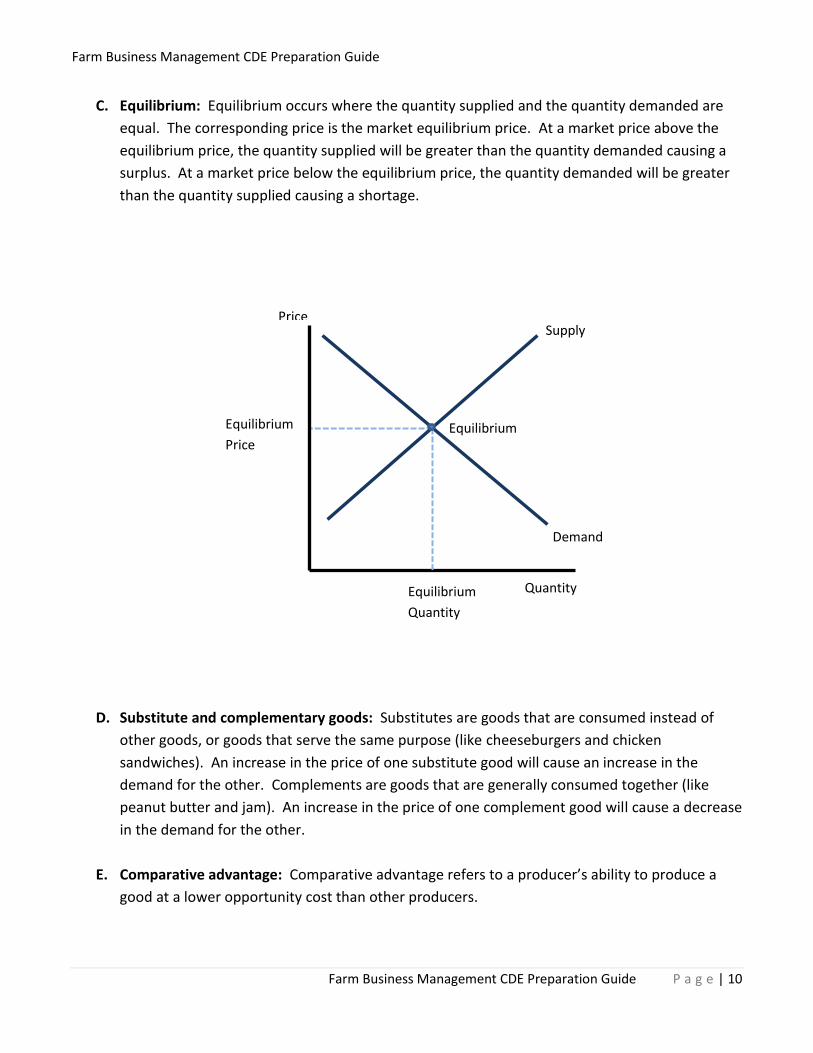
C. Equilibrium: Equilibrium occurs where the quantity supplied and the quantity demanded are
equal. The corresponding price is the market equilibrium price. At a market price above the
equilibrium price, the quantity supplied will be greater than the quantity demanded causing a
surplus. At a market price below the equilibrium price, the quantity demanded will be greater
than the quantity supplied causing a shortage.
D. Substitute and complementary goods: Substitutes are goods that are consumed instead of
other goods, or goods that serve the same purpose (like cheeseburgers and chicken
sandwiches). An increase in the price of one substitute good will cause an increase in the
demand for the other. Complements are goods that are generally consumed together (like
peanut butter and jam). An increase in the price of one complement good will cause a decrease
in the demand for the other.
E. Comparative advantage: Comparative advantage refers to a producer’s ability to produce a
good at a lower opportunity cost than other producers.
Supply
Demand
Equilibrium
Price
Quantity
Equilibrium
Price
Equilibrium
Quantity
Farm Business Management CDE Preparation Guide
Farm Business Management CDE Preparation Guide P a g e | 11
Types of Markets
A. Perfect competition markets (or Price-taker markets): A market structure characterized by:
i. Many sellers; each seller is small relative to the total market.
ii. Homogeneous products
iii. No barriers to entry
iv. Price-takers: Sellers must take the market price for their good in order to sell their
product.
v. Examples: Wheat, eggs, milk, etc. A high percentage of agricultural businesses, or at
least commodity businesses, are price-takers.
B. Monopolistic competition markets (or Competitive price-searcher markets): A market
structure characterized by:
i. Many sellers
ii. Differentiated products: Products are distinguished from similar products based on
quality, design, or other promotional characteristics.
iii. Low barriers to entry
iv. Price-searchers: Sellers set the price they charge for their product. They face
downward sloping demand curves, so increases in price will reduce quantity demanded
and decreasing prices will increase the quantity demanded. Demand curves will be
relatively elastic since there are many substitutes available.
v. Examples: Many agricultural producers strive to differentiate their products in an effort
to set their own prices and capture higher revenue for their products. Examples may
include specialty cheese producers, organic vegetable producers, etc.
C. Oligopoly markets: A market structure characterized by:
i. Small number of sellers
ii. Homogeneous or differentiated products
iii. Relatively high barriers to entry: Barriers to entry may include government franchises,
licensing, patents, economies of scale, etc.
iv. Price-searchers: Sellers set the price they charge for their product. When setting prices,
however, producers must take into account how their actions will affect rival businesses
and how their rivals may react.
v. Examples: Examples of oligopolies may include automobile companies, aircraft
producers, some agricultural input companies (such as seed and chemical companies),
or some types of agricultural processing companies.
Farm Business Management CDE Preparation Guide
Farm Business Management CDE Preparation Guide P a g e | 12
D. Monopoly markets: A market structure characterized by:
i. One seller
ii. Sell a specific product which has no good substitute
iii. High barriers to entry
iv. Price-searchers: The one seller sets the price they charge for their product.
v. Examples: In most cases, government controls prevent the development of monopolies
to preserve competition. In some cases, law dictates a single producer for some
industries such as local telephone, electricity, or water services, where numerous
producers would be generally detrimental. In such cases, government may set specific
controls to regulate the way the monopoly operates.
Farm Business Management CDE Preparation Guide
Farm Business Management CDE Preparation Guide P a g e | 13
Use and Analysis of Records to Manage Resources
1. Financial Statements
A. Balance Sheet
B. Income Statement
C. Statement of Owner Equity
D. Statement of Cash Flows
2. Financial Statement Ratios
A. Solvency
B. Liquidity
C. Profitability
D. Repayment Capacity
E. Financial Efficiency
3. Budgeting
A. Enterprise budgets
B. Partial budgets
C. Whole farm budgets
Farm Business Management CDE Preparation Guide
Farm Business Management CDE Preparation Guide P a g e | 14
Financial Statements
A. Balance Sheet: The Balance sheet shows a snapshot of your company’s financial situation at a
point in time. It measure assets, liabilities, and owner’s equity and is based upon the
accounting equation: Assets = Liabilities + Owner’s Equity. A balance sheet represents this
equation by listing the business’ assets on the left side and liabilities and owner’s equity on the
right side.
i. Assets: Assets include everything the business owns. Assets are separated into two
categories, current and non-current assets.
Current Assets: Current assets include cash and assets that can easily be
converted to cash and will either be used or converted to cash during the year.
Examples of current assets include cash, checking and savings account balances,
accrued interest earned, crops and feed inventory, feeder livestock, government
payments, prepaid expenses, accounts receivable (money owed to the business
due within 12 months), etc.
Non-Current Assets: Non-current assets include assets that are utilized in the
business on an ongoing basis and will not be converted to cash during the year.
Examples of non-current assets include machinery, equipment, breeding
livestock, land, buildings, etc.
ii. Liabilities: Liabilities include everything that the business owes. Liabilities are
separated into two categories, current and non-current liabilities.
Current Liabilities: Current liabilities include obligations that must be paid within
the next year. Examples of current liabilities include, accounts payable (money
the business owes due within 12 months), credit card balances, accrued interest
and taxes, short-term loans (12 months), portions of long-term loans due within
the next 12 months, etc.
Non-Current Liabilities: Non-current liabilities include must be paid but are not
due within the next 12 months. Examples of non-current liabilities include any
loans for land, machinery, equipment, breeding livestock, and so on that are not
due in the next 12 months excluding the portion of the loan due within the next
12 months.
iii. Owner’s Equity: Owner’s Equity (or Net Worth) can be calculated by subtracting total
liabilities from total assets, and represents the portion of assets owned by the business
owners.
Farm Business Management CDE Preparation Guide
Farm Business Management CDE Preparation Guide P a g e | 15
Financial ratios calculated from the balance sheet include (but are not limited to):
Working capital Current Ratio
Debt/Asset Ratio Debt/Equity Ratio
Equity/Asset Ratio
B. Income Statement: The Income Statement shows the net income, or profit, of a business over a
period of time, usually a year. The income statement measures revenue and expenses.
Cost vs. Accrual: Income statements can be prepared on either a cash or an accrual adjusted
basis. A cash-basis income statement measures revenue when it is received and expenses
when they are paid. An accrual adjusted income statement measures revenue when it is
earned and expenses when they are incurred. Often an accrual adjusted income statement is
prepared by beginning with a cash-basis income statement and adding accrual adjustments to
the revenue and expenses of a cash-basis income statement.
i. Revenue: The income earned for the production of the business commodity or output.
Revenue Accrual Adjustments: Revenue accrual adjustments may include the value of
products produced during the income statement period but not sold during that period
or products that have been sold but for which payment has not been received. These
adjustments would also be reflected on the balance sheet as changes in current asset
accounts such as accounts receivable, market livestock inventory, crops inventory, etc.
ii. Expenses: Costs that have been incurred to produce revenue.
Expense Accrual Adjustments: Expense accrual adjustments may include costs incurred
during the income statement period but not paid during that period. These adjustments
would show up on the balance sheet as increases in current liability accounts such as
accounts payable. Depreciation would also be considered an expense accrual
adjustment on the income statement.
iii. Net Income: Net income is equal to revenue minus expenses.
Accrual Adjusted Net Income: The accrual adjusted net income is equal to revenue
(including accrual adjustments) minus expenses (including accrual adjustments).
Financial ratios calculated from the income statement include (but are not limited to):
Return on Assets (also uses information from the balance sheet)
Return on Equity (also uses information from the balance sheet)
Operating Profit Margin Ratio Operating Expenses Ratio
Labor Productivity Ratio
Farm Business Management CDE Preparation Guide
Farm Business Management CDE Preparation Guide P a g e | 16
C. Statement of Owner Equity: On the balance sheet, owner equity (or net worth) is calculated by
subtracting liabilities from assets. On the statement of owner equity, net worth is calculated
differently and should equal the calculation from the balance sheet if all accounts are
reconciled correctly. Like the balance sheet, the statement of owner equity is generally
prepared once a year along with the balance sheet. Unlike the balance sheet, the statement of
owner equity also identifies the source of changes in net worth for the year period. On the
statement of owner equity, net worth is calculated as follows:
Ending Net Worth = Beginning Net Worth + Net Income + Non-Business Cash Inflows –
Owner Withdrawals + Asset Valuation Changes + Contributed or Distributed Capital
i. Net Income: Net income is calculated on the income statement for the given year.
ii. Non-Business Cash Inflows: Non-business cash inflows represent any money put into
the business from outside sources, such as owner contributions.
iii. Owner Withdrawals: Owner withdrawals represent any money taken out of the
business by the owners including for family living expenses.
iv. Asset Valuation Changes: If market information is included on a balance sheet, asset
valuation changes on the statement of owner equity would include the changes in the
market value of business assets.
v. Contributed or Distributed Capital: Contributed or distributed capital represents any
increases in capital that came from an outside source, or any distribution of capital to an
outside source.
D. Statement of Cash Flows: The statement of cash flows shows the inflows and outflows of cash
on the farm business for a period of time. Historical cash flows statements show past inflows at
outflows of cash for a certain time period, often a month or a year. Cash flows projections can
be prepared based on historical cash flows statements and expected future business activity
help managers ensure that the business will have enough cash inflows to cover the cash
outflows and maintain a successful business operation. The statement of cash flows is
separated into the following three cash flows sections:
i. Cash flows from operating activities: This section captures the inflows and outflows of
cash necessary for the operation of the farm enterprise. For example, inflows from the
sale of produced commodities or outflows for payment of expenses such as seed, fuel,
feed, and other operating expenses would fall under this section.
Farm Business Management CDE Preparation Guide
Farm Business Management CDE Preparation Guide P a g e | 17
ii. Cash flows from investing activities: This section captures the inflows and outflows of
cash relative to investment activities. For example, outflows for the purchase of
productive assets such as breeding livestock, machinery, farm land, etc. or inflows from
the sale of such assets or returns from other investments would fall under this section.
iii. Cash flows from financing activities: This section captures the inflows and outflows of
cash relative to financing activities. For example, inflows from acquired operating or
term loans or outflows for repayment of loans would fall under this section. Dividends
paid to owners would also be included in this section.
The inflows and outflows in these sections are calculated and yield either a positive or negative
cash flow for the year period. A positive cash flow at the end of the year means that inflows
were greater than outflows. Positive cash flows show up on the year-end balance sheet as an
increase in current assets (under cash on hand or checking account balances, etc.), and thus
increase total assets and net worth. Negative cash flow means that outflows were greater than
inflows. In the case of a negative cash flow, a producer may negotiate payment terms with a
vendor or an operating loan carryover to facilitate continued business operation. A negative
cash flow usually shows up on the year-end balance sheet as an operation loan carryover,
account payable increase, or some other liability increase.
Farm Business Management CDE Preparation Guide
Farm Business Management CDE Preparation Guide P a g e | 18
Financial Statement Ratios
A. Solvency: Solvency measures the amount of borrowed capital compared to capital invested by
owners. Solvency shows the ability of the business to repay all debt if all assets were sold.
Solvency measures include:
i. Debt/Asset Ratio: The debt-to-asset ratio shows farm liabilities relative to farms assets.
The higher the debt-to-asset ratio the more money creditors have in the business
relative to the owner and the higher financial risk the farm business faces. In general, a
debt-to-asset ratio below 0.50 is desirable. The debt-to-asset ratio is calculated from
information on the balance sheet, as follows:
Debt/Asset Ratio = Total Farm Liabilities / Total Farm Assets
ii. Debt/Equity Ratio: The debt-to-equity ratio measures the relationship between farm
debt capital and equity capital. Ratios less than 1 are preferable and mean that
creditors have less money in the business than the owner. The debt-to-equity ratio is
calculated from information on the balance sheet, as follows:
Debt/Equity Ratio = Total Farm Liabilities / Total Farm Equity
iii. Equity/Asset Ratio: The equity-to-asset ratio measures of how much of the farm’s
assets are financed by the owner compared with the debt-to-asset ratio which shows
how much of the farm’s assets are financed by creditors. A debt-to-equity ratio above
0.50 means the owner has more money in the business than creditors. The equity-to-
asset ratio is calculated from information on the balance sheet, as follows:
Equity/Asset Ratio = Total Farm Equity / Total Farm Assets
B. Liquidity: Measured the business’ ability to meet the ongoing financial obligations of running
the operation. Liquidity deals with the relationship between assets and liabilities and
operational cash flow. Liquidity measures include:
i. Working Capital: Working capital measures the amount of capital that would be
available for use to purchase inputs after all current assets are sold and all current
liabilities are paid. In general, a positive working capital is desirable. Working capital is
calculated from information on the balance sheet, as follows:
Working Capital = Total Current Farm Assets – Total Current Farm Liabilities
Farm Business Management CDE Preparation Guide
Farm Business Management CDE Preparation Guide P a g e | 19
ii. Current Ratio: The current ratio measures the relationship between current assets and
current liabilities. The higher the current ratio, the more liquid the business is. In
general, a current ratio above 1.5 is desirable, but a current ratio too high may reduce
the profitability of the business. The current ratio is calculated from information on the
balance sheet, as follows:
Current Ratio = Total Current Farm Assets / Total Current Farm Liabilities
C. Profitability: Measures the profits of the business relative to the labor, management, and
capital used in the operation. Profitability measures include:
i. Net Farm Income: While not considered a ratio, net farm income shows the revenue
associated with the expenses of production and is a dollar figure of the profitability of
the farm operation. Net income is calculated on the income statement, as follows:
Net Farm Income = Revenue - Expenses
ii. Return on Assets (ROA): The return on assets ratio measures the rate of return on farm
assets and is calculated using information from the income statement and the balance
sheet as follows:
Return on Assets = (Net Farm Income from Operations + Farm Interest Expense – Value
of Unpaid Operator and Family Labor and Management) / Average Total Farm Assets
iii. Return on Equity (ROE): The return on equity ratio measures the rate of return on the
owner’s equity and is calculated using information from the income statement and the
balance sheet as follows:
Return on Equity = (Net Farm Income from Operations – Value of Unpaid Operator and
Family Labor and Management) / Average Total Farm Equity
iv. Operating Profit Margin Ratio: The operating profit margin ratio measures the returns
to capital relative to gross farm revenue and is calculated from the income statement as
follows:
Operating Profit Margin Ratio = (Net Farm Income from Operations + Farm Interest
Expense –Value of Unpaid Operator and Family Labor and Mgmt.)/ Gross Farm Revenues
Farm Business Management CDE Preparation Guide
Farm Business Management CDE Preparation Guide P a g e | 20
D. Repayment capacity: Measures the ability to repay debt. Repayment capacity measures
include:
i. Debt/Income Ratio: The debt-to-income ratio measures farm debt relative to income
and is calculated from information on the balance sheet and income statement as
follows:
Debt/Income Ratio = Average Total Farm Liabilities / Net Farm Income from Operations
E. Financial efficiency: Measures the efficiency of the use of financial inputs to create output.
Financial efficiency measures include:
i. Asset Turnover Ratio: The asset turnover ratio measures the how well or efficiently
farm assets are used to create revenue and is calculated from information on the
balance sheet and income statement as follows:
Asset Turnover Ratio = Gross Farm Revenue / Average Total Farm Assets
ii. Operating Expense Ratio: The operating expense ratio measures the how efficiently
farm operating expenses are used to create revenue and is calculated from information
on the income statement as follows:
Operating Expense Ratio = (Total Farm Operating Expenses – Depreciation Expense) /
Gross Farm Revenues
iii. Labor Productivity Ratio: The labor productivity ratio measures the how efficiently labor
is used to create revenue and is calculated from information on the income statement
as follows:
Labor Productivity Ratio = Gross Farm Revenues / (Labor Expenses + Value of Unpaid
Operator and Family Labor and Management)
Farm Business Management CDE Preparation Guide
Farm Business Management CDE Preparation Guide P a g e | 21
Budgets
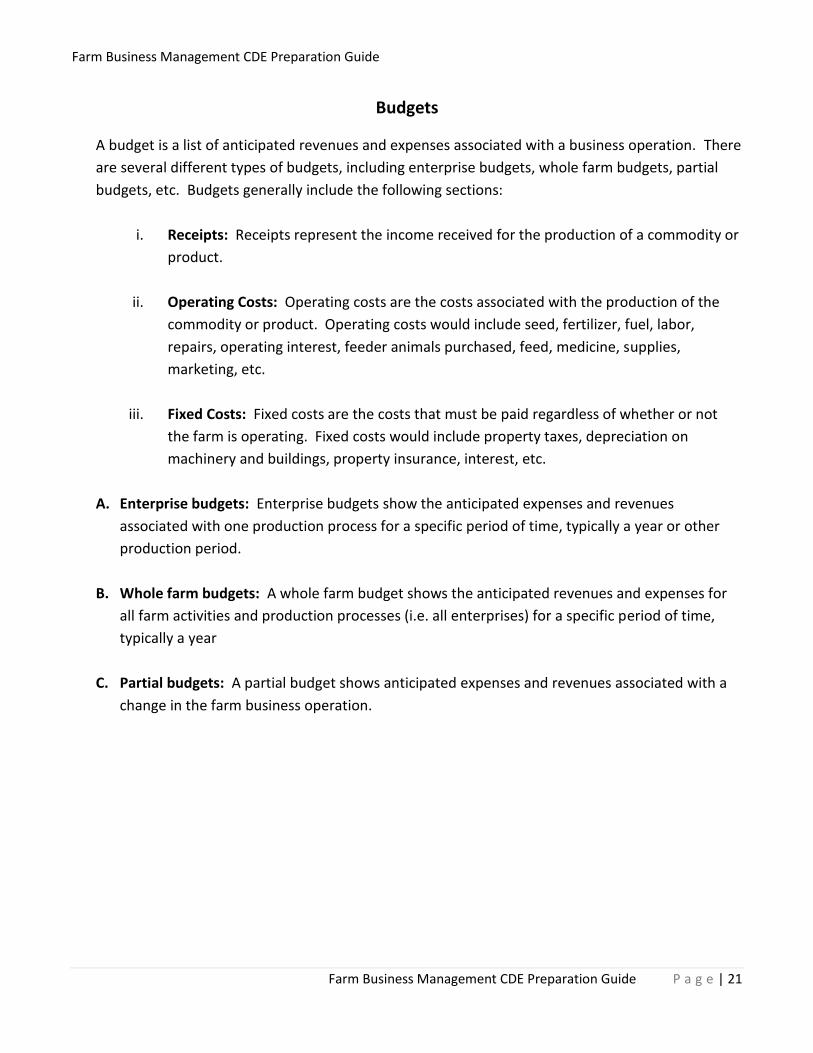
A budget is a list of anticipated revenues and expenses associated with a business operation. There
are several different types of budgets, including enterprise budgets, whole farm budgets, partial
budgets, etc. Budgets generally include the following sections:
i. Receipts: Receipts represent the income received for the production of a commodity or
product.
ii. Operating Costs: Operating costs are the costs associated with the production of the
commodity or product. Operating costs would include seed, fertilizer, fuel, labor,
repairs, operating interest, feeder animals purchased, feed, medicine, supplies,
marketing, etc.
iii. Fixed Costs: Fixed costs are the costs that must be paid regardless of whether or not
the farm is operating. Fixed costs would include property taxes, depreciation on
machinery and buildings, property insurance, interest, etc.
A. Enterprise budgets: Enterprise budgets show the anticipated expenses and revenues
associated with one production process for a specific period of time, typically a year or other
production period.
B. Whole farm budgets: A whole farm budget shows the anticipated revenues and expenses for
all farm activities and production processes (i.e. all enterprises) for a specific period of time,
typically a year
C. Partial budgets: A partial budget shows anticipated expenses and revenues associated with a
change in the farm business operation.
Farm Business Management CDE Preparation Guide
Farm Business Management CDE Preparation Guide P a g e | 22
Risk Management
1. Financial Risk
A. Financial Statements
B. Credit and Loans
C. Renting or Leasing
D. Land Acquisition and Ownership
E. Insurance
2. Production Risk
A. Insurance
B. Diversification
C. Excess Capacity
D. Share Leases
E. Government Programs
3. Marketing Risk
A. Storage
B. Forward Contracts
C. Futures Contracts
D. Options
E. Insurance
F. Government Programs
4. Institutional/Legal Risk
A. Estate and Transition Planning
B. Business Organization
C. Written Agreements
D. Knowledge
5. Human Resources Risk
A. Organization
B. Training Programs
C. Hiring Employees
D. Employee Handbook
E. Succession Plan
Farm Business Management CDE Preparation Guide
Farm Business Management CDE Preparation Guide P a g e | 23
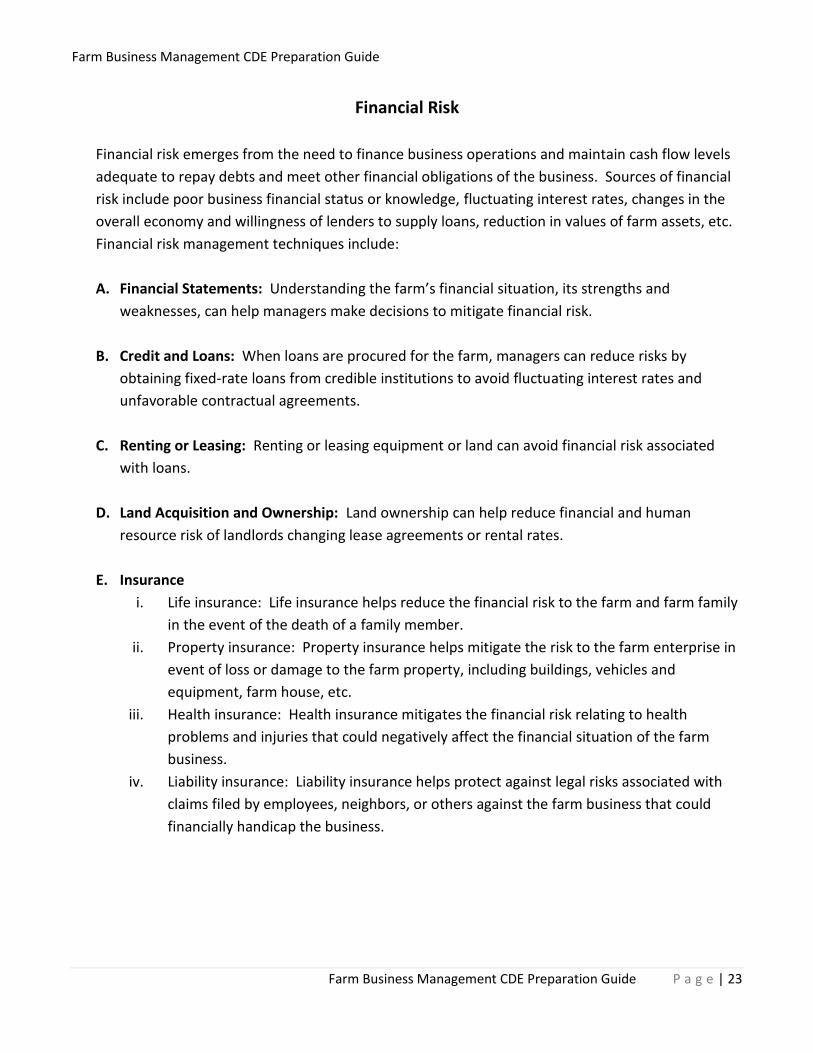
Financial Risk
Financial risk emerges from the need to finance business operations and maintain cash flow levels
adequate to repay debts and meet other financial obligations of the business. Sources of financial
risk include poor business financial status or knowledge, fluctuating interest rates, changes in the
overall economy and willingness of lenders to supply loans, reduction in values of farm assets, etc.
Financial risk management techniques include:
A. Financial Statements: Understanding the farm’s financial situation, its strengths and
weaknesses, can help managers make decisions to mitigate financial risk.
B. Credit and Loans: When loans are procured for the farm, managers can reduce risks by
obtaining fixed-rate loans from credible institutions to avoid fluctuating interest rates and
unfavorable contractual agreements.
C. Renting or Leasing: Renting or leasing equipment or land can avoid financial risk associated
with loans.
D. Land Acquisition and Ownership: Land ownership can help reduce financial and human
resource risk of landlords changing lease agreements or rental rates.
E. Insurance
i. Life insurance: Life insurance helps reduce the financial risk to the farm and farm family
in the event of the death of a family member.
ii. Property insurance: Property insurance helps mitigate the risk to the farm enterprise in
event of loss or damage to the farm property, including buildings, vehicles and
equipment, farm house, etc.
iii. Health insurance: Health insurance mitigates the financial risk relating to health
problems and injuries that could negatively affect the financial situation of the farm
business.
iv. Liability insurance: Liability insurance helps protect against legal risks associated with
claims filed by employees, neighbors, or others against the farm business that could
financially handicap the business.
Farm Business Management CDE Preparation Guide
Farm Business Management CDE Preparation Guide P a g e | 24
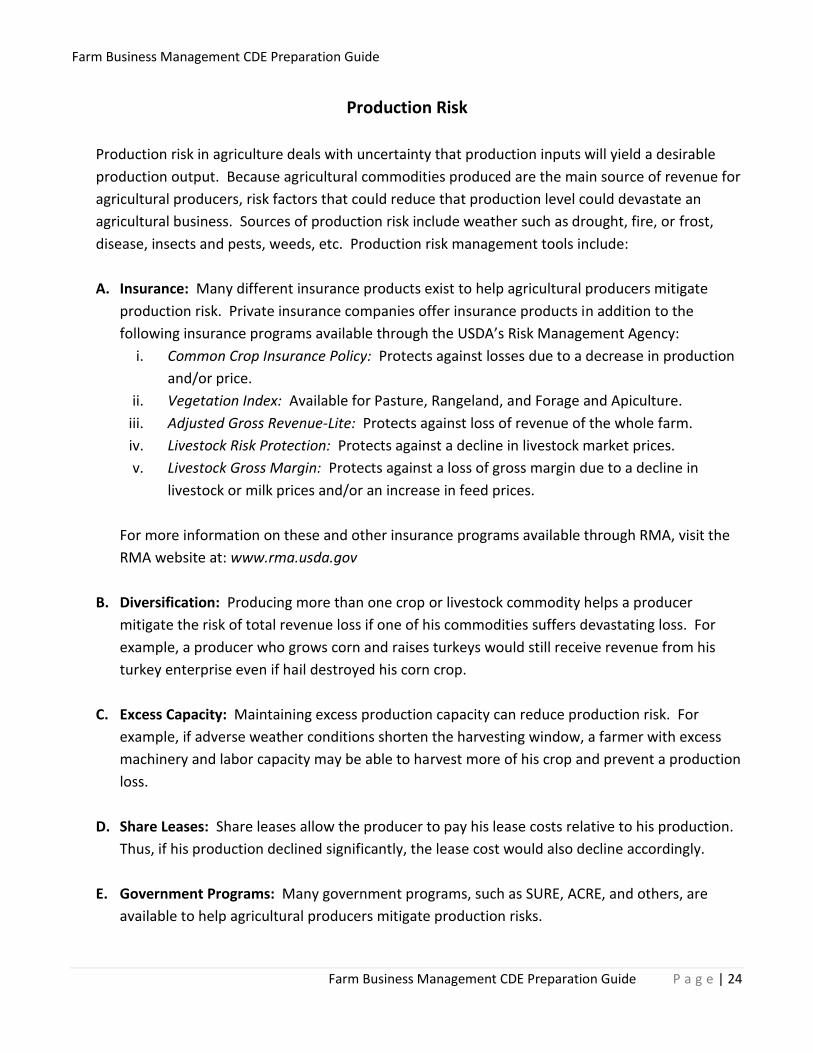
Production Risk
Production risk in agriculture deals with uncertainty that production inputs will yield a desirable
production output. Because agricultural commodities produced are the main source of revenue for
agricultural producers, risk factors that could reduce that production level could devastate an
agricultural business. Sources of production risk include weather such as drought, fire, or frost,
disease, insects and pests, weeds, etc. Production risk management tools include:
A. Insurance: Many different insurance products exist to help agricultural producers mitigate
production risk. Private insurance companies offer insurance products in addition to the
following insurance programs available through the USDA’s Risk Management Agency:
i. Common Crop Insurance Policy: Protects against losses due to a decrease in production
and/or price.
ii. Vegetation Index: Available for Pasture, Rangeland, and Forage and Apiculture.
iii. Adjusted Gross Revenue-Lite: Protects against loss of revenue of the whole farm.
iv. Livestock Risk Protection: Protects against a decline in livestock market prices.
v. Livestock Gross Margin: Protects against a loss of gross margin due to a decline in
livestock or milk prices and/or an increase in feed prices.
For more information on these and other insurance programs available through RMA, visit the
RMA website at: www.rma.usda.gov
B. Diversification: Producing more than one crop or livestock commodity helps a producer
mitigate the risk of total revenue loss if one of his commodities suffers devastating loss. For
example, a producer who grows corn and raises turkeys would still receive revenue from his
turkey enterprise even if hail destroyed his corn crop.
C. Excess Capacity: Maintaining excess production capacity can reduce production risk. For
example, if adverse weather conditions shorten the harvesting window, a farmer with excess
machinery and labor capacity may be able to harvest more of his crop and prevent a production
loss.
D. Share Leases: Share leases allow the producer to pay his lease costs relative to his production.
Thus, if his production declined significantly, the lease cost would also decline accordingly.
E. Government Programs: Many government programs, such as SURE, ACRE, and others, are
available to help agricultural producers mitigate production risks.
Farm Business Management CDE Preparation Guide
Farm Business Management CDE Preparation Guide P a g e | 25
Marketing Risk
Marketing risk, also referred to as price risk, deals with uncertainty about commodity prices and
the possibility of a change in prices that would adversely affect the farmer. Volatility in commodity
supply and demand factors underlies price risk. These factors include production levels, increasing
global interaction in commodity markets and governmental influences, changes in consumer
incomes, the strength of the general economy, government trade and energy policies, exchange
rates, etc. Marketing risk management techniques may include:
A. Storage: When the cash market prices for commodities are low, producers may store outputs
until cash market prices become more favorable. Similar strategy can be used to acquire inputs
at lower prices and storing them for use when input prices increase.
B. Forward Contracts: Contracting the sale of a commodity for a future date at a specific price
protects the producer against declines in that commodity price and loss of revenue. Contracts
can also be made to protect against increasing input prices.
C. Futures Contracts: Futures contracts can be used to protect against output price declines and
input price increases. A futures contract is an obligation to buy or sell a certain amount of a
commodity for a certain price and a specific date in the future. Futures contracts can protect
against decreases in output prices, but the producer forgoes the opportunity to gain from
increases in output commodity prices. Similarly, futures contracts can protect against increases
in input prices, but the producer gives up the opportunity to take advantage of lower costs if
input prices decline.
D. Options: Options are the right, but not the obligation, to buy (put option) or sell (call option)
an underlying futures contract. Options are similar to futures contracts except producers are
able to take advantage of higher revenues if output prices increase or input prices decline.
There is an additional premium cost for options above futures contracts.
E. Insurance: Various different insurance products are available to help farmers reduce market
risk. Often, insurance products are designed to mitigate several different types of risk,
including production and market risk. Some of the insurance products available from USDA’s
Risk Management Agency include: Common Crop Insurance Program, Adjusted Gross Revenue-
Lite, Vegetation Index, Livestock Risk Protection, and Livestock Gross Margin.
Farm Business Management CDE Preparation Guide
Farm Business Management CDE Preparation Guide P a g e | 26
F. Government Programs: Government programs can also help producers reduce marketing risk.
Some of the current programs available include producer price support programs, disaster
assistance programs such as SURE and ACRE, and others.
Farm Business Management CDE Preparation Guide
Farm Business Management CDE Preparation Guide P a g e | 27
Institutional/Legal Risk
Institutional and legal risk is related to requirement for producers to adhere to all the institutional
and legal regulations and policies associated with having a business and business succession.
Sources of institutional and legal risk include changing government policies affecting agricultural
businesses, legal implications related to contracts and business agreements, laws relating to taxes,
labor, safety and business transition, tort liability, etc. Institutional and legal risk management
techniques include:
A. Estate and Transition Planning: Properly planning and preparing for farm transition will help
owners avoid unexpected difficulty relating to taxes and other institutional policies regarding
farm succession.
B. Business Organization: The way a business is organized affects the level to which the
producers would personally be held liable if the business were in trouble. Types of business
organizations include:
i. Sole Proprietorship: A type of business entity with one owner and which has no
separate existence from its owner. The producer has unlimited personal liability with
this type of business organization and would be personally liable for all business
obligations.
ii. Partnership: A type of business entity with two or more owners. Producers have
unlimited liability in partnerships, and each member of the partnership can be held
personally liable for all business obligations despite the actions of the other partner.
iii. Corporations: A type of business entity with many owners and which is a separate
entity from its owners. With this business type a producer would have limited liability
proportionate to his stock investment.
iv. Limited Liability Company (LLC): A hybrid business entity with one member (single-
member) or many members (multi-member) and which is a separate entity from its
owners. With this business organization, a producer would have limited liability
proportionate to his investment in the company.
C. Written Agreements: While verbal contracts are technically legally binding, in the event that a
conflict arises over a contract it is much easier to remember and reproduce the details of a
contract if it has been written and signed by both parties. Depending on the nature of the
contract, some contracts may necessitate profession legal advice and/or legal documents while
other contracts may be simple enough to require only a written note with signatures.

Farm Business Management CDE Preparation Guide
Farm Business Management CDE Preparation Guide P a g e | 28
D. Knowledge: Having a good working knowledge of institutional policies and laws relating to
agricultural businesses will help producers avoid circumstances that would negatively affect
their agricultural operation.
Farm Business Management CDE Preparation Guide
Farm Business Management CDE Preparation Guide P a g e | 29
Human Resource Risk
Human resource risk comes from uncertainty relating to individuals and their roles either directly
or indirectly relating to the farm business. Sources of human resource risk include sickness or
injury, death, relationship problems or divorce, poor communication, lack of necessary
qualifications or training, poor performance or work ethic, etc. Human resource risk management
techniques include:
A. Organization: A good organizational structure establishes the roles and responsibilities of each
member of the farm business and outlines lines of authority and job duties for each employee.
This helps reduce confusion relating to the management and performance of job tasks.
B. Training Programs: Adequately training employees helps mitigate the risk of on-the job
accidents or production or efficiency losses due to improper completion of tasks.
C. Hiring Employees: When hiring employees, creating a comprehensive job description and
interview schedule will help employers properly match new employees with various skills and
qualifications to appropriate positions. Once new employees are hired, an employee
orientation should outline job duties and employee evaluation methods and will give the new
employee a greater chance for success.
D. Employee Handbook: An employee handbook should outline employee policies and
procedures relating to employment status and compensation, benefits, employee leave,
payroll, work hours, employee conduct, etc. A well-organized employee handbook helps
reduce uncertainty for all individuals involved in the farm business, and can also reduce legal
risk associated with the operation.
E. Succession Plan: A succession plan should outline how the business will be passed from one
generation to the next, and will help avoid arguments or unmet expectations individuals may
have regarding the future of the business.
Farm Business Management CDE Preparation Guide
Farm Business Management CDE Preparation Guide P a g e | 30
Business Management
1. Strategic Planning
A. Vision Statement
B. Mission Statement
C. Strategic Goals
2. Tactical Planning
A. Tactical Objectives
3. Operational Planning
A. Operational Plans
Farm Business Management CDE Preparation Guide
Farm Business Management CDE Preparation Guide P a g e | 31
Strategic Planning
For any agricultural operation to be successful, it is imperative to have an idea of what that success
would look like. As the enlightening exchange between Alice and the Cheshire Cat suggests, if you
don’t know where you want to get, it doesn’t really matter what road you take. And so, to successfully
manage a business, it is important for all business managers and members of the operation to
understand the long-term vision for the company and to strategically plan how to get there.
A. Vision Statement: A vision statement outlines the long-term overall vision of what owners
and/or managers want the operation to become. It includes some description of the
operation’s purpose, like a mission statement, but also includes a description of the values of
the company. It outlines its idealistic view of the future and reveals the value of the company’s
mission to those in its sphere of influence.
B. Mission Statement: A mission statement is a clear and concise statement describing the
operation’s purpose and objectives. A mission statement describes what a company does to
achieve its overall vision. Components of a mission statement may include: products produced,
marketing techniques, customer base, measures of success, distinction relative to other market
producers, etc.
C. Strategic Goals: Strategic goals may be viewed as the stepping stones created to lead to the
long-term vision. Strategic goals outline how the mission and vision statement will be achieved
and should be specific, measurable, attainable, related, and tractable (SMART).
SMART Goals:
i. Specific: Specific goals are clear and precise statements describing exactly what is to be
accomplished.
ii. Measurable: Measurable goals provide a way to measure performance and progress
and allow the goal-setter to know when the goal has been reached.
iii. Attainable: Attainable goals can realistically be accomplished by the goal-setter.
iv. Related: Strategic goals should be related to one another. That is, they should all work
toward the same vision and not pull the operation in different directions.
v. Tractable: Tractable goals can be managed or controlled by the goal-setter.
Farm Business Management CDE Preparation Guide
Farm Business Management CDE Preparation Guide P a g e | 32
Tactical Planning
The mission statement and vision statement represent a futuristic state or ideal and give the
agricultural operation manager an end destination to be reached, but they do not ensure that he
arrives at that destination. Tactical planning refers to how resources should be used to achieve the
strategic goals and, ultimately, the company vision. Tactical planning sets out a series of events or
accomplishments that must be reached in an orderly way to achieve the strategic goals.
A. Tactical Objectives: Tactical objectives are the practical actions that should be taken to achieve
the strategic goals. Each tactical objective should be specifically related to a strategic goal.
Tactical objectives usually outline a timetable for achievement.
Farm Business Management CDE Preparation Guide
Farm Business Management CDE Preparation Guide P a g e | 33
Operational Planning
Operational planning turns the tactical objectives into a set of specific steps that will be taken to meet
the tactical objectives. This is where the visions, goals, and objectives turn into the day-to-day
operations and those actions are implemented.
A. Operational Plans: Operational plans are the day-to-day actions that will be implemented to
meet the tactical objectives. These plans are very specific and usually include a planned
completion date, a specific person responsible for completion, and a reporting method for
progress and completion.
Farm Business Management CDE Preparation Guide
Farm Business Management CDE Preparation Guide P a g e | 34
Additional Resources and References
Websites:
Applied Economics Extension Website: apecextension.usu.edu
National FFA Organization-Farm Business Management CDE:
https://www.ffa.org/Programs/Awards/CDE
Risk Management Agency Website: www.rma.usda.gov
Books:
Farm and Ranch Business Management: An introduction to sound management practices. John Deere
Publishing, 2011.
Hoag, Dana L. Applied Risk Management in Agriculture. CRC Press, Boca Raton, FL, 2010.
Hudson, Darren. Agricultural Markets and Prices. Blackwell Publishing, Malden, MA, 2007.
Oltmans, Arnold W., Canny A. Klinefelter, and Thomas L. Frey. AFRA: Agricultural Financial Reporting
and Analysis. Doane Agricultural Services Company, St. Louis, MO, 2001.
Farm Business Management CDE Preparation Guide
Farm Business Management CDE Preparation Guide P a g e | 35
Utah State University is committed to providing an environment free from harassment and other forms
of illegal discrimination based on race, color, religion, sex, national origin, age (40 and older), disability,
and veteran’s status. USU’s policy also prohibits discrimination on the basis of sexual orientation in
employment and academic related practices and decisions.
Utah State University employees and students cannot, because of race, color, religion, sex,
national origin, age, disability, or veteran’s status, refuse to hire; discharge; promote; demote;
terminate; discriminate in compensation; or discriminate regarding terms, privileges, or conditions of
employment, against any person otherwise qualified. Employees and students also cannot discriminate
in the classroom, residence halls, or in on/off campus, USU-sponsored events and activities.
This publication is issued in furtherance of Cooperative Extension work, acts of May 8 and June 30,
1914, in cooperation with the U.S. Department of Agriculture, Noelle E. Cockett, Vice President for
Extension and Agriculture, Utah State University.