Embed Size (px)
Citation preview

2012‐13
Annual Accountability Report
STATE UNIVERSITY SYSTEM of FLORIDA Board of Governors
FLORIDA STATE UNIVERSITY
PENDING BOARD OF TRUSTEES APPROVAL

1
Annual Accountability Report 2012-2013
FLORIDA STATE UNIVERSITY
PENDING BOT APPROVAL 12‐19‐2013
TABLE OF CONTENTS EXECUTIVE SUMMARY DASHBOARD p. 2 KEY ACHIEVEMENTS p. 5 NARRATIVE p. 6
DATA TABLES SECTION 1. FINANCIAL RESOURCES p. 16 SECTION 2. PERSONNEL p. 20 SECTION 3. ENROLLMENT p. 21 SECTION 4. UNDERGRADUATE EDUCATION p. 23 SECTION 5. GRADUATE EDUCATION p. 32 SECTION 6. RESEARCH & ECONOMIC DEVELOPMENT p. 36
2
Annual Accountability Report 2012-2013
FLORIDA STATE UNIVERSITY
PENDING BOT APPROVAL 12‐19‐2013
Dashboard
Headcount Enrollments
Fall 2012
% Total
2007-2012 % Change Degree Programs Offered Carnegie Classifications
(as of 2012)
TOTAL 41,226 100% 1% TOTAL (as of Spring 2013) 270 Basic:
Research Universities (very high research activity) White 27,281 66% -6%* Baccalaureate 95
Hispanic 5,730 14% 40%* Master’s 108 Undergraduate Instructional Program:
Balanced arts & sciences/professions,
high graduate coexistence Black 3,584 9% -18%* Research Doctorate 64 Other 4,631 11% 36%* Professional Doctorate 3 Graduate
Instructional Program: Comprehensive doctoral with medical/veterinary Full-Time 35,170 85% 3% Faculty
(Fall 2012) Full-Time
Part- Time Part-Time 6,056 15% -13%
Size and Setting: Large four-year, primarily
nonresidential Undergraduate 31,896 77% 2% TOTAL 1,716 493 Graduate 8,139 20% -5% Tenure & Ten. 1,021 6 Community
Engagement: Curricular Engagement and Outreach and Partnerships Unclassified 1,191 3% 13% Non-Tenured Faculty 695 487
Note* : The U.S. Dept. of Education definition for race changed in Summer 2010 - resulting in an increase for Hispanic & Other, and a decrease for White and Black subgroups (see p.28).
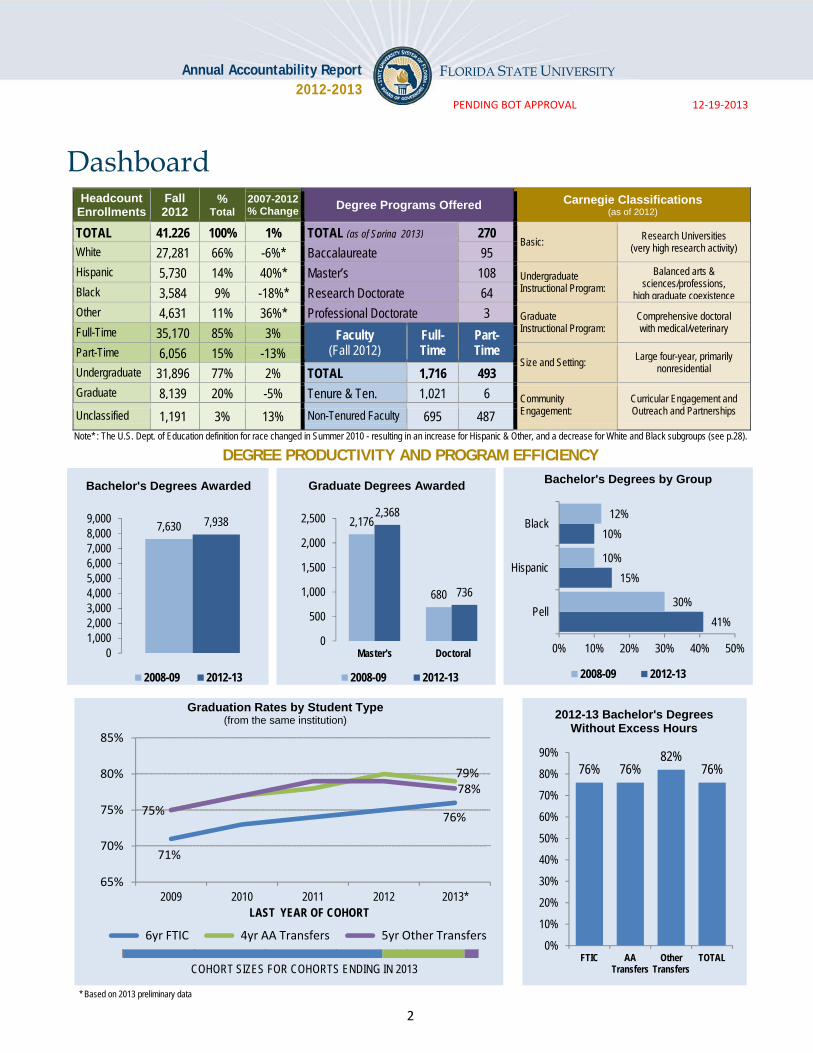
DEGREE PRODUCTIVITY AND PROGRAM EFFICIENCY
7,630 7,938
01,0002,0003,0004,0005,0006,0007,0008,0009,000
2008-09 2012-13
Bachelor's Degrees Awarded
2,176
680
2,368
736
0
500
1,000
1,500
2,000
2,500
2008-09 2012-13
Graduate Degrees Awarded
Master's Doctoral
41%
15%
10%
30%
10%
12%
0% 10% 20% 30% 40% 50%
Pell
Hispanic
Black
2008-09 2012-13
Bachelor's Degrees by Group
71%
76%
79%
75%
78%
65%
70%
75%
80%
85%
2009 2010 2011 2012 2013*
6yr FTIC 4yr AA Transfers 5yr Other Transfers
Graduation Rates by Student Type(from the same institution)
LAST YEAR OF COHORT
COHORT SIZES FOR COHORTS ENDING IN 2013
76% 76%82%
76%
0%
10%
20%
30%
40%
50%
60%
70%
80%
90%
FTIC AA Transfers
Other Transfers
TOTAL
2012-13 Bachelor's Degrees Without Excess Hours
* Based on 2013 preliminary data

3
Annual Accountability Report 2012-2013
FLORIDA STATE UNIVERSITY
PENDING BOT APPROVAL 12‐19‐2013
Dashboard DEGREES AWARDED IN PROGRAMS OF STRATEGIC EMPHASIS
RESEARCH AND COMMERCIALIZATION ACTIVITY
RESOURCES
98
216
472
961
1,452
116
272
377
984
1,109
0 500 1,000 1,500 2,000
Education(Critical)
Health(Critical)
Security
Global
STEM
2008-09 2012-13
Bachelor's Degrees Awarded inAreas of Strategic Emphasis
57
78
141
221
467
159
35
92
152
358
0 100 200 300 400 500
Education(Critical)
Security
Global
Health(Critical)
STEM
2008-09 2012-13
Graduate Degrees Awarded inAreas of Strategic Emphasis
66% 64% 71% 64% 66%
$211.6 $237.8 $227.3 $230.4 $225.4
$0
$100
$200
$300
2007-08 2008-09 2009-10 2010-11 2011-12
EXTERNAL INTERNAL (State & Univ.)
Total R&D Expenditures ($ Millions)with Percent Funded Externally
$1.26 $1.19$1.31 $1.47
$1.33
0246810121416
$0.0
$0.5
$1.0
$1.5
$2.0
2007-08 2008-09 2009-10 2010-11 2011-12
Lice
nses
Exe
cute
d
Lice
nsin
g R
even
ue ($
M)
Licensing Revenue Licenses Executed
Technology Transfer: Licenses and Licensing Revenue
2008-09 2009-10 2010-11 2011-12 2012-13
TOTAL $12,760 $12,079 $12,534 $11,579 $10,815
TUITION $3,785 $4,264 $4,557 $4,940 $5,782
STATE $8,975 $7,815 $7,978 $6,638 $5,033
70% 65% 64% 57% 47%
$12,760 $12,079 $12,534 $11,579 $10,815
$0
$5,000
$10,000
$15,000 Appropriated Funding Per Actual US FTE
Note: Tuition is the appropriated budget authority, not the amount actually collected. This tuition data does not include non-instructional local fees. State includes General Revenues, Lottery and Other Trust funds (i.e., Federal Stimulus for 2009-10 and 2010-11 only). State funded financial aid programs that follow the student are included in tuition data. Student FTE are actual (not funded) and based on the national definition.
4
Annual Accountability Report 2012-2013
FLORIDA STATE UNIVERSITY
PENDING BOT APPROVAL 12‐19‐2013
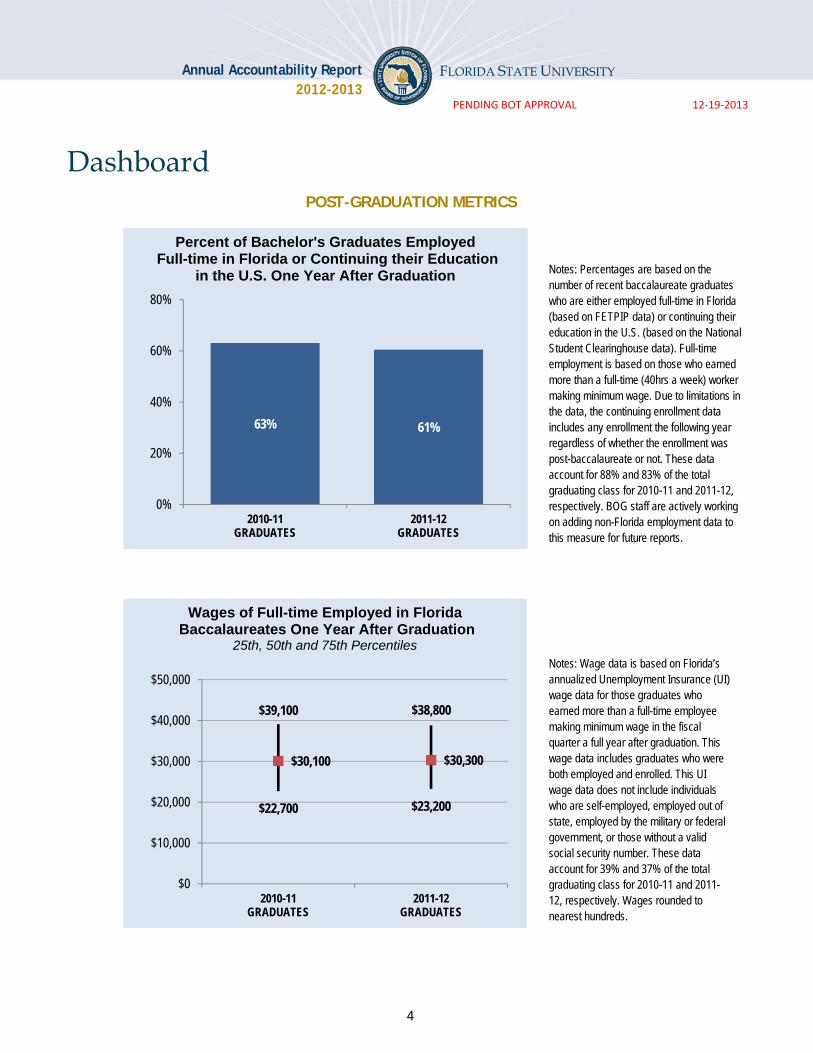
Dashboard POST-GRADUATION METRICS
63% 61%
0%
20%
40%
60%
80%
2010-11GRADUATES
2011-12GRADUATES
Percent of Bachelor's Graduates EmployedFull-time in Florida or Continuing their Education
in the U.S. One Year After Graduation
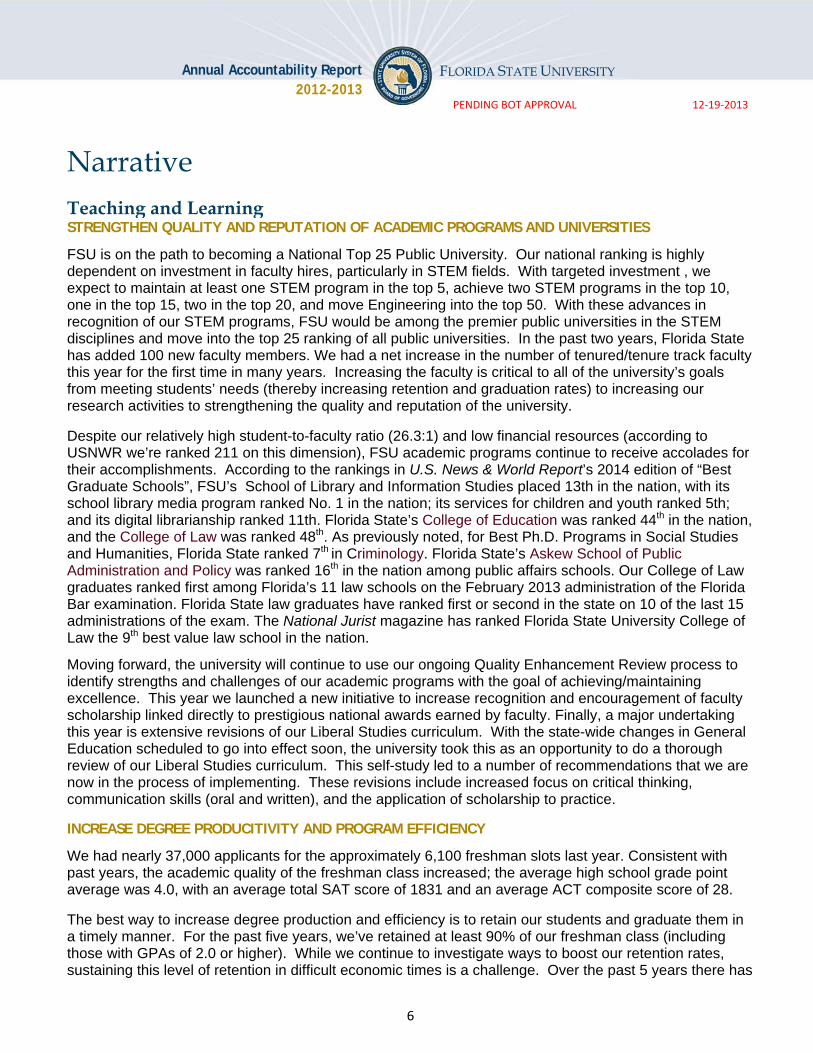
$22,700 $23,200
$30,100 $30,300
$39,100 $38,800
$0
$10,000
$20,000
$30,000
$40,000
$50,000
2010-11GRADUATES
2011-12GRADUATES
Wages of Full-time Employed in FloridaBaccalaureates One Year After Graduation
25th, 50th and 75th Percentiles
Notes: Percentages are based on the number of recent baccalaureate graduates who are either employed full-time in Florida (based on FETPIP data) or continuing their education in the U.S. (based on the National Student Clearinghouse data). Full-time employment is based on those who earned more than a full-time (40hrs a week) worker making minimum wage. Due to limitations in the data, the continuing enrollment data includes any enrollment the following year regardless of whether the enrollment was post-baccalaureate or not. These data account for 88% and 83% of the total graduating class for 2010-11 and 2011-12, respectively. BOG staff are actively working on adding non-Florida employment data to this measure for future reports.
Notes: Wage data is based on Florida’s annualized Unemployment Insurance (UI) wage data for those graduates who earned more than a full-time employee making minimum wage in the fiscal quarter a full year after graduation. This wage data includes graduates who were both employed and enrolled. This UI wage data does not include individuals who are self-employed, employed out of state, employed by the military or federal government, or those without a valid social security number. These data account for 39% and 37% of the total graduating class for 2010-11 and 2011-12, respectively. Wages rounded to nearest hundreds.

5
Annual Accountability Report 2012-2013
FLORIDA STATE UNIVERSITY
PENDING BOT APPROVAL 12‐19‐2013
Key Achievements (2012 –2013) STUDENT AWARDS/ACHIEVEMENTS
1. FSU student Madison Marks was selected as a finalist for the 2013 Rhodes Scholarship and two students — Joseph “Tony” Manning and Matthew Vedrin — were awarded Boren Undergraduate Scholarships, and Vedrin also received a 2013 Goldwater Scholarship.
2. For the second year in a row, Florida State University is one of the nation's top research institutions for producing student Fulbright scholars, according to the Chronicle of Higher Education. Florida State also leads the State in the number of students who received Fulbright fellowships for the 2013-2014 academic year with 10 FSU awardees.
3. For the third time in four years, a FSU College of Medicine student has received the prestigious Herbert W. Nickens Medical Student Scholarship awarded by the Association of American Medical Colleges outstanding third-year medical students who have led efforts to eliminate inequities in medical education and health care and demonstrated leadership in addressing minorities’ educational, societal and health-care needs. This year’s recipient is Shermeeka Hogans-Mathews.
FACULTY AWARDS/ACHIEVEMENTS 1. Matthew Goff (Religion) was named a Humboldt Research Fellow and Svetla Slaveva (Classics)
was awarded a Research Fellowship from the Humboldt Foundation. 2. Bryan Cuevas (Religion) was awarded a Guggenheim Fellowship and a National Endowment for
the Humanities Fellowship. 3. Jon Maner (Psychology) received the distinguished early career award from the American
Psychological Association and Roy Baumeister (Psychology) was named the William James Fellow for Lifetime Achievement.
PROGRAM AWARDS/ACHIEVEMENTS
1. The FSU College of Business was named at the top of “Best for Vets: Business Schools” rankings by Military Times.
2. The FSU College of Law was ranked fifth among the nation’s law schools and the FSU College of Medicine was ranked eighth among the nation’s medical schools by the Hispanic Business’ 2013 Best Schools for Hispanics..
3. According to U.S. News & World Report’s 2014 edition of Best Graduate Schools, the FSU College of Criminology is ranked 7th in the nation.
RESEARCH AWARDS/ACHIEVEMENTS 1. FSU successfully negotiated with the National Science Foundation a 5-year renewal of the
National High Magnetic Field Laboratory. 2. Professor Alan Marshall (Chemistry) was named a fellow of the highly prestigious American
Academy of Arts and Sciences and Greg Erickson (Biology) was named a fellow of the American Association for the Advancement of Science.
3. Two FSU professors, Sungmoon Jung (Engineering) and Zhenghao Zhang (Computer Science), received NSF Career Awards.
INSTITUTIONAL AWARDS/ACHIEVEMENTS 1. U.S. News & World Report (USNWR) ranked Florida State as the nation’s most efficient public
university in December because of its success in providing students with a quality education despite having fewer financial resources. Florida State also ranks high on the U.S. Department of Education’s “College Scorecard”, which evaluates schools on their affordability and value.
2. According to USNWR, the university’s quality ranking among all universities moved up 6 places to 91 and among public universities to 40.
3. FSU ranked in the Top 10 Best Colleges for Veterans this year by the Military Times.
6
Annual Accountability Report 2012-2013
FLORIDA STATE UNIVERSITY
PENDING BOT APPROVAL 12‐19‐2013
Narrative
Teaching and Learning STRENGTHEN QUALITY AND REPUTATION OF ACADEMIC PROGRAMS AND UNIVERSITIES
FSU is on the path to becoming a National Top 25 Public University. Our national ranking is highly dependent on investment in faculty hires, particularly in STEM fields. With targeted investment , we expect to maintain at least one STEM program in the top 5, achieve two STEM programs in the top 10, one in the top 15, two in the top 20, and move Engineering into the top 50. With these advances in recognition of our STEM programs, FSU would be among the premier public universities in the STEM disciplines and move into the top 25 ranking of all public universities. In the past two years, Florida State has added 100 new faculty members. We had a net increase in the number of tenured/tenure track faculty this year for the first time in many years. Increasing the faculty is critical to all of the university’s goals from meeting students’ needs (thereby increasing retention and graduation rates) to increasing our research activities to strengthening the quality and reputation of the university.
Despite our relatively high student-to-faculty ratio (26.3:1) and low financial resources (according to USNWR we’re ranked 211 on this dimension), FSU academic programs continue to receive accolades for their accomplishments. According to the rankings in U.S. News & World Report’s 2014 edition of “Best Graduate Schools”, FSU’s School of Library and Information Studies placed 13th in the nation, with its school library media program ranked No. 1 in the nation; its services for children and youth ranked 5th; and its digital librarianship ranked 11th. Florida State’s College of Education was ranked 44th in the nation, and the College of Law was ranked 48th. As previously noted, for Best Ph.D. Programs in Social Studies and Humanities, Florida State ranked 7th in Criminology. Florida State’s Askew School of Public Administration and Policy was ranked 16th in the nation among public affairs schools. Our College of Law graduates ranked first among Florida’s 11 law schools on the February 2013 administration of the Florida Bar examination. Florida State law graduates have ranked first or second in the state on 10 of the last 15 administrations of the exam. The National Jurist magazine has ranked Florida State University College of Law the 9th best value law school in the nation.
Moving forward, the university will continue to use our ongoing Quality Enhancement Review process to identify strengths and challenges of our academic programs with the goal of achieving/maintaining excellence. This year we launched a new initiative to increase recognition and encouragement of faculty scholarship linked directly to prestigious national awards earned by faculty. Finally, a major undertaking this year is extensive revisions of our Liberal Studies curriculum. With the state-wide changes in General Education scheduled to go into effect soon, the university took this as an opportunity to do a thorough review of our Liberal Studies curriculum. This self-study led to a number of recommendations that we are now in the process of implementing. These revisions include increased focus on critical thinking, communication skills (oral and written), and the application of scholarship to practice.
INCREASE DEGREE PRODUCITIVITY AND PROGRAM EFFICIENCY
We had nearly 37,000 applicants for the approximately 6,100 freshman slots last year. Consistent with past years, the academic quality of the freshman class increased; the average high school grade point average was 4.0, with an average total SAT score of 1831 and an average ACT composite score of 28.
The best way to increase degree production and efficiency is to retain our students and graduate them in a timely manner. For the past five years, we’ve retained at least 90% of our freshman class (including those with GPAs of 2.0 or higher). While we continue to investigate ways to boost our retention rates, sustaining this level of retention in difficult economic times is a challenge. Over the past 5 years there has
7
Annual Accountability Report 2012-2013
FLORIDA STATE UNIVERSITY
PENDING BOT APPROVAL 12‐19‐2013
been a substantial increase in the percentage of baccalaureate degrees awarded to Pell-Grant recipients, from 30% in 2008-09 to 41% in 2012-13. The rise in Pell-Grant recipients coupled with changes to the Bright Futures program raise concerns about the possible negative impact that economic disadvantage may have on retention of students. The university has committed additional funding for need-based scholarships to minimize loss of students due to financial hardships.
We have a number of programs in place to improve retention. We are expanding our outreach to high school and community college students in an effort to better prepare students for the transition to the university. Advising First, our team of advisors who specialize in working with lower division students, hosted the first annual College Survival 101 day camp for local high school seniors. FSU’s Center for Academic Retention and Enhancement (CARE) continues to enroll, assist and support a highly diverse population of first generation and socio-economically disadvantaged FSU undergraduate students. We had 342 students enrolled in our Summer Bridge Program and, for the first time, a parent orientation session was added. CARE, in partnership with faculty from the College of Social Work, launched a new program, Unconquered Scholars, designed to provide additional academic and personal support to students previously classified as foster care, homeless, wards of the State, or relative care.
FSU was recently recognized as one of the top 10 colleges in the country for veterans. We consider our Student Veteran Center to be a model for the nation. It serves as the focal point for all campus veteran support services, from transition assistance, to VA benefit certification, to educational assistance. The Center also promotes awareness of Seminole veteran heritage and veteran related issues to campus and alumni populations alike. Annual events like the Student Veteran Film Festival, now in its third year, is an example of the campus activities aimed at promoting a supportive and inviting campus for veterans. The annual festival encapsulates the shared vision and commitment by Florida State to become the most veteran-friendly university in the country.
There has been a steady increase in graduation rates of our FTIC students each year for the past 3 years. Over the past 5 years, our 4- and 6-year graduation rates for FTIC students increased by 12 and 5 percentage points, respectively. While we are pleased with these improvements, we continue to explore ways to increase these numbers. We plan to expand and strengthen academic support and tutoring to determine the impact on reduced time to degrees. Last year, we logged almost 17,000 student tutoring contacts, a 93% increase over the previous (first) year of operation. We are also exploring more accelerated academic programs that enable students to get an early start on graduate studies. Our most recent program is a 3 + 3 accelerated BA/BS/JD degree. Students in the program complete their major requirements in 3 years and are taking first year law school courses in their 4th year. By offering more of these types of accelerated degrees we hope to increase degree productivity as well as program efficiency.
Finally, limiting excess hours is another important way to increase efficiency. While more than three-quarters of our students graduate without excess hours, we are investigating ways to increase these numbers. We are devoting resources to enhanced advising of students who enter as exploratory majors and to those who change majors after a few years. We also believe that creation of more accelerated academic programs may also reduce excess hours of some of our best and brightest students.
INCREASE THE NUMBER OF DEGREES AWARDED IN S.T.E.M. AND OTHER PROGRAMS OF STRATEGIC EMPHASIS
The number of graduate degrees awarded across all programs of strategic emphasis has increased only modestly over the past 5 years (from 28% to 31%) but the increase of STEM graduate degrees is substantially higher with about a 30% increase in degrees since 2008. The single most important factor for increasing graduate degrees in these programs is the addition of faculty. The university is targeting faculty hires to address the needs of programs of strategic emphasis. The state-supported increases in
8
Annual Accountability Report 2012-2013
FLORIDA STATE UNIVERSITY
PENDING BOT APPROVAL 12‐19‐2013
funding for graduate students and the university’s efforts to improve health benefits for our students should help the university to successfully compete for top applicants to these programs.
There has been a steady rise in the number of baccalaureate degrees awarded in programs of strategic emphasis, especially STEM programs. There was an increase in Baccalaureate degrees in STEM fields of 12% over the previous year and an increase of 31% over the past 5 years. The university’s investment in faculty hires in STEM fields is critical to ensuring that we are able to offer the courses and research experiences to retain and graduate STEM students. The university is also ramping up our efforts to recruit top students interested in STEM majors. We are identifying high school students with high achievement in math and science and getting the word out that FSU is an ideal place for them to pursue their studies. A newly formed team of students called the STEM Leadership Corps (SLC) will travel to high schools across the state of Florida to encourage students to come to FSU. The SCL consists of FSU students from a variety of STEM majors who are focused on service learning opportunities in STEM fields and who participate in outreach to schools for STEM education and recruiting. They produce videos, web sites and social media campaigns focused on student engagement and mentoring in STEM. Second, we are investing in scholarships for STEM-ready students, those with high SAT/ACT quantitative scores and an interest in a STEM major. We are also pursuing opportunities for external funding in support of scholarships for STEM students. For example, the university recently submitted a proposal to the NSF for a focus on student veterans to encourage and support their pursuit of majors in STEM. Another example is the funding for scholarships recently awarded to our Department of Computer Science from the U.S. Department of Education and the National Science Foundation.
Once students are enrolled at FSU, we are working hard to retain them in STEM majors. Tutoring is readily available to students, particularly for those gateway courses that may deter some students from continuing STEM studies. We have substantially increased opportunities for undergraduate research, beginning in the freshman year; an effort we believe will help students remain engaged in their studies and committed to pursuing STEM majors. One of the investments the university has made is in our Undergraduate Research Opportunities Program (UROP). This program is in high student demand, particularly among our Honors students. While this program is open to all students, a majority of the students participating in the UROP program are STEM majors. Students are also invited to submit proposals for presentation at the university’s “Showcase of Undergraduate Research Excellence” a bi-annual event co-sponsored by the Office of Undergraduate Research and the Office of National Fellowships. In addition to opportunities for research, we are also increasing opportunities for students to participate in project-based competitions that allow them to put their scholarship into practice. A good example of this is our new multidisciplinary DIGITECH week that promotes and rewards the development of digital technology applications and our campus-based competitive fair inNOLEvation.
As part of revisions to our Liberal Studies program we are promoting the development of capstone courses that will help students put their scholarship into practice. There is a concerted effort to increase project-based courses because these experiential learning experiences increase student engagement and help to prepare them for the workforce. An example of this type of course is the two-semester capstone course in our College of Engineering. The “Senior Design Project” requires students to work in teams to tackle projects that are submitted by engineering firms and organizations.
Scholarship, Research and Innovation STRENGTHEN QUALITY AND REPUTATION OF SCHOLARSHIP, RESEARCH AND INNOVATION
Attaining our goal of becoming a Top 25 public university is highly dependent on investment in STEM fields. We are moving aggressively on this front by making strategic hires of faculty in the STEM fields. Materials for energy and defense, protecting the environment, and maximizing human health and quality of life are likely to remain as enduring challenges, for which the potential for innovation is high and the
9
Annual Accountability Report 2012-2013
FLORIDA STATE UNIVERSITY
PENDING BOT APPROVAL 12‐19‐2013
value to the State of Florida is significant. We instituted three interdisciplinary faculty hiring initiatives in these areas.
Materials research was the lynchpin in the digital revolution and a pre-requisite for the explosive growth of Silicon Valley. Today, materials research is characterized by innovations that cross almost every sector of society from the artificial growth of human bone and targeted delivery of cancer-fighting drugs that are revolutionizing human health to placing high-powered computers in the palm of a hand. It is also the lynchpin for solving the problems that limit the use of renewable energies – energy storage and transmission. The marriage between materials and energy has high potential to be transformative and this plays to Florida State’s strengths. Consequently, FSU is leveraging current capabilities to attract the best and brightest – crossing physics, chemistry, biology and engineering to solve the problems that currently limit the use of renewable energies, as well as strengthen our role in innovation across a broad number of industries and products. Last year we attracted over 450 applications and hired three top scholars in energy and materials. This year’s recruitment has attracted an even larger and more impressive pool of applicants. We anticipate hiring as many as 6-9 new faculty members this year in this important area of research.
FSU initiated a second interdisciplinary hiring initiative this year in the area of Marine and Coastal Ecosystems. This initiative builds on our excellent programs and faculty in Oceanography and Marine Biology. FSU is the lead institution of a large consortium involving 10 universities who are engaged in the interdisciplinary study of deep sea to coast connectivity in the northeastern Gulf of Mexico that was initiated in response to the BP oil spill. New hires will be important additions to this work. Over the next two years, we expect to hire up to 9 tenure track faculty members with expertise in these areas.
Finally, the university launched an interdisciplinary faculty hiring initiative in the area of Brain Health and Disease this year. We anticipate hiring up to 9 tenure-track faculty members in this area of research over the next two years. Related to this hiring initiative, the university proposes to create an FSU Institute for Successful Longevity (ISL). This institute is devoted to interdisciplinary research, training and service focused on understanding the mechanisms of age-associated disorders and functional/cognitive declines; developing holistic interventions to promote healthy aging and high quality of life; disseminating this knowledge to the community, to aging adults and to their caregivers; and cultivating the scientific, social, and political leadership on this issue that will engage the nation.
INCREASE RESEARCH AND COMMERCIALIZATION ACTIVITY
Our faculty continues to do well in attracting external support of their research. The number of grant awards in FY 2013 was $202.2M and our externally-funded research expenditures equaled $201.8M. As reported in Table 1D, both revenues and expenditures from Contracts and Grants increased from 2011-12 to 2012-13. We estimate yet another increase in both measures for the current year. This is impressive in light of the current funding climate at the Federal, State and private levels.
In support of research activities of our faculty, post-doctoral fellows, and students, the university expanded and enhanced its Research Computing Center (RCC). The RCC is a key player in supporting groundbreaking research. RCC staff members offer free consulting services, from writing grant proposals to developing complex workflows. The RCC provides services at subsidized rates for university faculty and students, making research affordable for those who would otherwise have to spend money at outside resources to aid their studies.
As for increasing commercialization activity, FSU has a deliberate approach in translating intellectual property to the marketplace and we are moving in several areas to accelerate the process. FSU begins with a large number of invention and creative work disclosures, to file a significant number of patent

10
Annual Accountability Report 2012-2013
FLORIDA STATE UNIVERSITY
PENDING BOT APPROVAL 12‐19‐2013
applications that result in a set of patents, and then a smaller set of licenses and startup companies. Startup companies tend to be the riskiest. The last three years had a higher disclosure rate than any prior three-year period (statistics compiled since FY 2000). We have a record number of 124 patent applications pending, we received a record number of patents (43) as well as a record number of new licenses (15; with five additional licenses in progress) and we initiated a record number of new startup companies (4).
FSU typically awards GAP funding in a competitive process to create startup companies, about a third of which occupy leased space enabled by the Office of Research. In addition, we seek licensing and option agreements with the private sector to assess intellectual property and take our inventions and creative works to the market. Despite record numbers, FSU is working to accelerate this process. We are working to create a unique partnership through the formation of a LLC with the private sector that hires the expertise to attract investors and develop proposals for small business funding (SBIR and STTR) to advance our technology to the level of product delivery and to create additional royalty income for the university. This now creates three mechanisms for taking intellectual property to the market: (1) university incentivized start-ups, (2) direct partnership with companies, and (3) a private sector partnership designed to attract dollars for applied research and development leading to the delivery of a product. FSU is also active in promoting Florida’s Institute for Commercialization of Public Research, which finances loans to startups as an additional acceleration mechanism. Like many universities, Florida State University also offers a Sneak Peek which is an opportunity for investors to gain a first look at FSU creative works. In addition, FSU is proposing to develop a team to study startup companies generated by universities since 1980, using 150 universities as the source of data for generation of startups, creation of jobs, and paths to the marketplace.
A few examples of our success in moving research to the marketplace include:
‐ Two researchers at Florida State University’s NHMFL launched a new business based on research into the development of synthetic crystals. NHMFL scientist Jeffrey Whalen and his business partner, physicist Theo Siegrist, brainstorm new formulas for synthetic crystals and produce them in special ovens at temperatures equivalent to what have been recorded inside volcanoes. They plan to market two new crystals this year after patenting their crystal growth technique and compositions through FSU, and to eventually become a world-class competitor with companies in China and Russia that sell crystals similar to those they produce. Bing Energy International has an exclusive commercialization agreement to use Florida State University professor Dr. Jim P. Zheng’s patented breakthrough nanotechnology to create a more commercially viable fuel cell. Building on the groundbreaking work of Dr. Ben Wang, inventor of buckypaper, Zheng has pioneered a fuel cell that incorporates a thin membrane composed of carbon nanotubes, reducing the need for expensive platinum that, until now, have made fuel cells too expensive to be widely marketed (from http://bingenergyinc.com/index.php/us).
INCREASE COLLABORATION AND EXTERNAL SUPPORT FOR RESEARCH ACTIVITY
As previously mentioned, FSU is building on its strengths with targeted interdisciplinary hiring initiatives in the areas of Energy and Materials, Marine and Coastal Ecosystems, and Brain Health and Disease. These initiatives are expected to foster cross-disciplinary research collaborations of the type that will increase our success in competing for program project and center grants.
Our initiative in Energy and Materials research builds on the strength of having the National High Magnetic Field Laboratory (NHMFL) on our campus. This year the university successfully negotiated with the National Science Foundation a five-year renewal of the NHMFL. The NHMFL continues to attract
11
Annual Accountability Report 2012-2013
FLORIDA STATE UNIVERSITY
PENDING BOT APPROVAL 12‐19‐2013
hundreds of visiting scholars each year and to set world records. For example, NHMFL scientists broke the 100 tesla barrier setting a world record of 100.75 tesla for a non-destructive magnet. Advances in instrumentation enabled NHMFL scientists to perform experiments that were not previously possible. NHMFL scientists at its Applied Superconductivity Center have shown that the critical current for wires processed at 25 bar is more than five times higher than samples processed at 1 bar with closed ends, a geometry that mimics a coil-length wire. These results demonstrate a wire fabrication process that makes it an attractive conductor for future high field magnets. In collaboration with theoreticians from Spain and Japan, FSU experimentalists at the NHMFL used a pulsed laser vaporization source coupled to an ultrahigh-resolution Fourier Transform Ion Cyclotron Resonance (FT-ICR) mass spectrometer to detect the smallest fullerene. Fullerenes ("Buckyballs") have fascinated chemists since the original discovery of C60, leading to the 1996 Nobel Prize in Chemistry for Curl, Kroto, and Smalley. Although fullerenes of various sizes have since been observed, the theoretically smallest fullerene, C28, has until now escaped detection, due to its high curvature and thus high reactivity. The NHMFL scientists stabilized the C28 fullerene by encapsulation of an appropriate metal ion, such as titanium, zirconium, or uranium directly into the buckyball from carbon vapor.
The hiring initiative in Marine and Coastal Ecosystems builds on our excellent programs in Marine Biology and Oceanography. FSU faculty members working in this area have been successful in collaborating with other universities to successfully compete for major external funding of their research. The best example of this is the Deep-C (Deep Sea to Coast Connectivity in the Eastern Gulf of Mexico) Consortium, a long-term, interdisciplinary study of deep sea to coast connectivity in the northeastern Gulf of Mexico. The study is investigating the consequences of petroleum hydrocarbon release in the deep Gulf on living marine resources and ecosystem health. Deep-C consists of ten major institutions that have been actively involved in assessing the impact of the Gulf oil spill. The institutions are Florida State University (lead institution), Georgia Institute of Technology, Dauphin Island Sea Lab, Naval Research Laboratory at the Stennis Space Center, Norwegian Meteorological Institute, University of Miami Rosenstiel School of Marine & Atmospheric Science, Science Application International Corporation, University of South Florida, University of West Florida and the Woods Hole Oceanographic Institution.
Creation of interdisciplinary institutes is another way that the university builds research collaborations. For example, our Learning Systems Institute (LSI) brings together researchers in psychology, education, communication, and several other academic units on campus to tackle research pertaining to best practices in K-12 education. This institute, which includes the Florida Center for Reading Research (FCRR), has been very successful in competing for federal research grants. For example, three of FCRR’s current interdisciplinary research awards total more than $70M. Another one of LSI’s centers, the Florida Center for Research in Science, Technology, Engineering and Mathematics (FCR-STEM), received a $2.9M grant from the Florida Department of Education’s Race to the Top program to study the impact of an intervention developed by FSU researchers to improve math and science achievement in K-12 students.
Community and Business Engagement STRENGTHEN QUALITY AND REPUTATION OF COMMITMENT TO COMMUNITY AND BUSINESS ENGAGEMENT
Florida State is in the midst of transforming, with the city and county, one of the most blighted areas in Tallahassee. Beginning with a vision that incorporates a revitalized Civic Center, a new FSU-branded conference hotel with retail and restaurants and College Town (a mixed-use housing and retail development), and in combination with the city’s investment in Gaines Street, Tallahassee will have a major pedestrian-friendly “Madison Mile” that stretches from the Civic Center to the FSU Stadium. It provides an outstanding venue for visitors and residents, particularly before and after major events at the Civic Center or at the Stadium. Our vision moves us from a dilapidated set of old warehouses to a

12
Annual Accountability Report 2012-2013
FLORIDA STATE UNIVERSITY
PENDING BOT APPROVAL 12‐19‐2013
stretch of retail and restaurants that match up with similar venues in Boulder Colorado or Madison Wisconsin. This new venue should help attract conferences, more visitors to our events, and positively alter the perspectives of those who are considering a move to the region. The master plan for the region is a full partnership between the community and Florida State University. As a testament to the positive reputation FSU has with the local community, our proposal to bring a major hotel chain to the campus received the most support of all proposals submitted to the community planning council. Our reputation of commitment to the community is also strengthened by the beneficial partnerships that have developed between the university and community businesses and organizations. For example, FSU’s College of Nursing partnered with Tallahassee Memorial HealthCare to develop a new facility in which to collaborate on research to optimize health care for patients, their families and the community through improved nursing practices. This facility, the Tallahassee Memorial HealthCare Center for Research and Evidence-based Practice, marks the largest direct investment in research infrastructure in the 60-year history of the College of Nursing. The center will serve as the focal point for interdisciplinary health care research collaborations across the FSU campus and with Tallahassee Memorial HealthCare’s nursing staff. It provides the structure and opportunities for Tallahassee’s healthcare professionals and FSU students and faculty to make significant contributions to the advancement of nursing science and practice. Through its academic programs, the university is also able to improve availability of services to the region. A good example of this is the recently expanded services of the L.L. Schendel Speech and Hearing Clinic, operated by Florida State University’s School of Communication Science & Disorders (SCSD). With the expertise of our faculty, this clinic is now providing services for the hearing impaired that includes programming of cochlear implants — a service that previously had not been available in North Florida.
Finally, the university is strengthening its commitment to community and business engagement through its focus on entrepreneurship opportunities on our campus. At most universities, business courses are available only to business majors, yet entrepreneurs span a wide variety of majors, and to limit such valuable education to only those majoring in business is to lose out on opportunities to strengthen the value of degrees in other fields (e.g., consider the increased value of a degree in engineering if it is combined with courses in business and entrepreneurship). In addition to business courses, there is a considerable benefit to having our students learn from individuals who are “professors” by virtue of practice and experience. We are in the process of hiring entrepreneurs-in-residence for all our colleges. We expect these hires to have considerable benefit to our students in terms of career preparation and success. These hires will also benefit the university by providing in-house expertise on taking ideas to the marketplace.
INCREASE COMMUNITY AND BUSINESS WORKFORCE
Tallahassee has three unique higher education institutions within a 5-mile radius that together offer an extraordinarily broad set of degree and associate degree opportunities. We have agreed to work together to promote economic development. The power of the three institutions in attracting new business opportunities to the region and to Florida has not been tapped, yet the potential is enormous. To reach this potential, FSU, FAMU, and TCC are actively developing opportunities to collaborate. This commitment is contained in a brochure “Educate your Business” which is being distributed through the local Chamber and the Economic Development Council (EDC). This is another example of FSU efforts to connect with business and to be part of the team in attracting new businesses to the region, and doing so in a manner that helps guide students toward job opportunities. The three institutions have created a consortium to promote the success of our student veterans, by expanding their educational opportunities, creating a broader sense of community, and creating strong linkages to potential employers.
13
Annual Accountability Report 2012-2013
FLORIDA STATE UNIVERSITY
PENDING BOT APPROVAL 12‐19‐2013
In addition to our partnership with other educational institutions, the research, training and service activities of FSU make important contributions to increasing the workforce. For example, Florida State’s Information Institute, part of the School of Library and Information Studies in the College of Communication and Information received a four-year, $847,000 award from the National Science Foundation-Advanced Technological Education (NSF-ATE) program to support a study of the educational and career pathways of information technology technicians who support broadband deployment in rural Northwest Florida communities. The project, “Assessing Information Technology Educational Pathways that Promote Deployment and Use of Rural Broadband,” was prompted by the growth of broadband use in all industries that has resulted in a significant workforce need for IT/broadband workers. The project team will identify the workplace roles of broadband technicians; the education needed to develop skills to be successful in these roles; and the processes to sustain partnerships between educational and industry stakeholders. Another example is our computer science department’s contributions to increasing the workforce in this critical field. They were recently awarded more than $3.2 million from the U.S. Department of Education and the National Science Foundation to provide scholarships to support students studying computer science, computer criminology, computational biology, information security and computer and network system administration. These scholarships are helping to increase the number of graduates with the expertise to meet local, regional and national workforce needs. INCREASE LEVELS OF COMMUNITY AND BUSINESS ENGAGEMENT
FSU now participates in economic development councils at a high level. The President is a member of the steering committee of Imagine Tallahassee and is a member of the board of the Economic Development Council (EDC). FSU’s Chief of Staff is a new member of the Tallahassee Chamber of Commerce. The Vice President for Research and Vice President for University Relations are also actively involved in EDC efforts to promote economic opportunities generated through partnerships with the university. Florida State is actively incubating companies based on university-wide and college-based efforts. At the university level, companies are incubated based on GAP funding and enabling the leasing of space in Tallahassee. In the College of Business, the InNOLEvation Accelator – is a focal point for undergraduate business start-up activity providing student entrepreneurs with resources needed during start-up. A dedicated facility with private office space supports as many as eight early stage ventures and offers common areas for students to take time out to discuss their ideas in a relaxed environment. Tallahassee is currently host to a variety of efforts to provide incubator space and expertise to developing companies. FSU is contributing to these efforts through provision of space, expertise, resources, and perhaps most important, the new ideas and technology that form the basis for a number of the start-ups populating these efforts. The university is also exploring additional partnerships, including with the city and county, to enable new companies to find their start in Tallahassee. Finally, the university engages the business community through our Career Center. Local, regional and national employers visit our campus multiple times per year to participate in career fairs hosted by the Career Center. Our Career Center staff work closely with local employers to develop internship sites for students who want the opportunity to “learn on the job”. Internships not only benefit our students by helping prepare them for the workforce but our students also provide valuable services to local businesses and organizations.

14
Annual Accountability Report 2012-2013
FLORIDA STATE UNIVERSITY
PENDING BOT APPROVAL 12‐19‐2013
Data Tables
FINANCIAL RESOURCES Table 1A. Education and General Revenues Table 1B. Education and General Expenditures
Table 1C. Funding per Student FTE
Table 1D. Other Budget Entities
Table 1E. Voluntary Support of Higher Education
Table 1F. Tuition Differential Fee
PERSONNEL Table 2A. Personnel Headcount
ENROLLMENT Table 3A. Full-time Equivalent (FTE) Enrollment
Table 3C. Enrollment by Method of Instruction
UNDERGRADUATE EDUCATION Table 4A. Baccalaureate Degree Program Changes in AY 2011-2012
Table 4B. Retention Rates
Table 4C. Full-time, First-Time-in-College (FTIC) Six-Year Graduation Rates
Table 4D. Full- and Part-time FTIC Graduation Rates
Table 4E. AA Transfers Graduation Rates
Table 4F. Other Transfers Graduation Rates
Table 4G. Baccalaureate Degrees Awarded
Table 4H. Baccalaureate Degrees Awarded in Areas of Strategic Emphasis
Table 4I. Baccalaureate Degrees Awarded to Underrepresented Groups
Table 4J. Baccalaureate Degrees Without Excess Credit Hours
Table 4K. Undergraduate Course Offerings
Table 4L. Faculty Teaching Undergraduates
Table 4M. Student/Faculty Ratio
Table 4N. Licensure/Certification Exam: Nursing (NCLEX)
GRADUATE EDUCATION Table 5A. Graduate Degree Program Changes in AY 2011-2012 Table 5B. Graduate Degrees Awarded
Table 5C. Graduate Degrees Awarded in Areas of Strategic Emphasis
Table 5D. Licensure/Certification Exams for Graduate Programs
RESEARCH & ECONOMIC DEVELOPMENT Table 6A. Research and Development Expenditures
Table 6B. Centers of Excellence
15
Annual Accountability Report 2012-2013
FLORIDA STATE UNIVERSITY
PENDING BOT APPROVAL 12‐19‐2013
Section 1 – Financial Resources
TABLE 1A. University Education and General Revenues
2009-10 Actual
2010-11 Actual
2011-12 Actual
2012-13 Actual
2013-14 Estimates
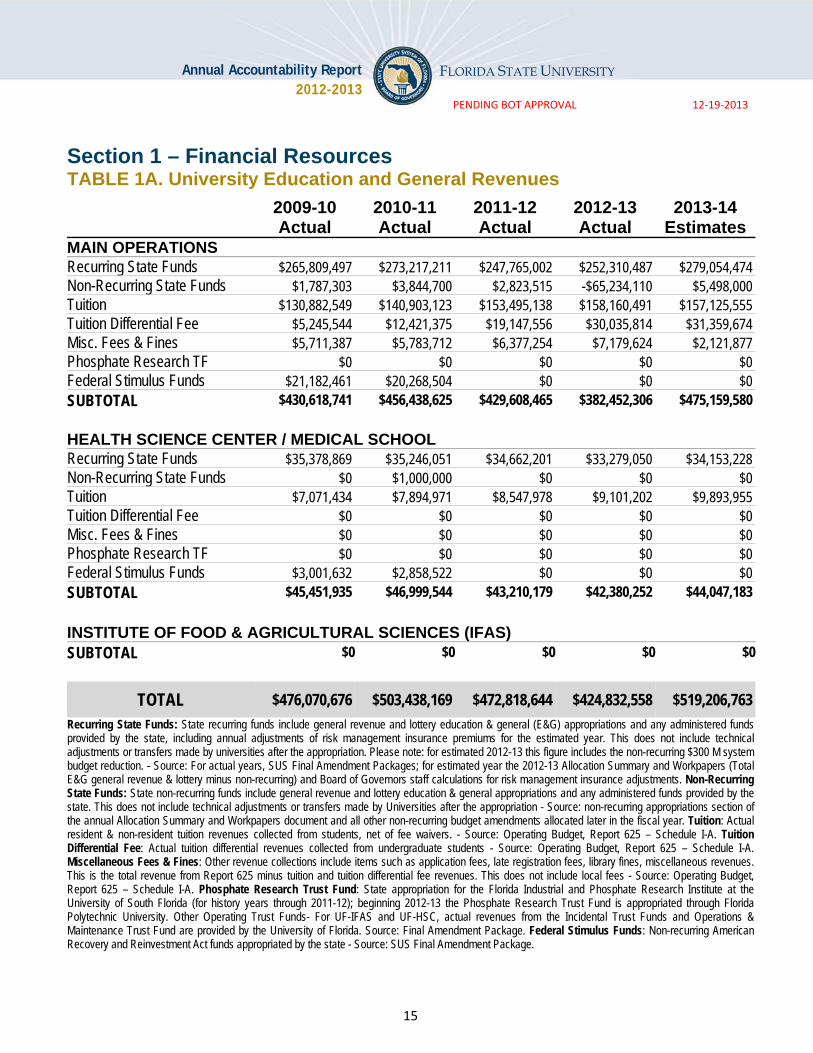
MAIN OPERATIONS Recurring State Funds $265,809,497 $273,217,211 $247,765,002 $252,310,487 $279,054,474 Non-Recurring State Funds $1,787,303 $3,844,700 $2,823,515 -$65,234,110 $5,498,000 Tuition $130,882,549 $140,903,123 $153,495,138 $158,160,491 $157,125,555 Tuition Differential Fee $5,245,544 $12,421,375 $19,147,556 $30,035,814 $31,359,674 Misc. Fees & Fines $5,711,387 $5,783,712 $6,377,254 $7,179,624 $2,121,877 Phosphate Research TF $0 $0 $0 $0 $0 Federal Stimulus Funds $21,182,461 $20,268,504 $0 $0 $0 SUBTOTAL $430,618,741 $456,438,625 $429,608,465 $382,452,306 $475,159,580
HEALTH SCIENCE CENTER / MEDICAL SCHOOL Recurring State Funds $35,378,869 $35,246,051 $34,662,201 $33,279,050 $34,153,228 Non-Recurring State Funds $0 $1,000,000 $0 $0 $0 Tuition $7,071,434 $7,894,971 $8,547,978 $9,101,202 $9,893,955 Tuition Differential Fee $0 $0 $0 $0 $0 Misc. Fees & Fines $0 $0 $0 $0 $0 Phosphate Research TF $0 $0 $0 $0 $0 Federal Stimulus Funds $3,001,632 $2,858,522 $0 $0 $0 SUBTOTAL $45,451,935 $46,999,544 $43,210,179 $42,380,252 $44,047,183
INSTITUTE OF FOOD & AGRICULTURAL SCIENCES (IFAS) SUBTOTAL $0 $0 $0 $0 $0
TOTAL $476,070,676 $503,438,169 $472,818,644 $424,832,558 $519,206,763
Recurring State Funds: State recurring funds include general revenue and lottery education & general (E&G) appropriations and any administered funds provided by the state, including annual adjustments of risk management insurance premiums for the estimated year. This does not include technical adjustments or transfers made by universities after the appropriation. Please note: for estimated 2012-13 this figure includes the non-recurring $300 M system budget reduction. - Source: For actual years, SUS Final Amendment Packages; for estimated year the 2012-13 Allocation Summary and Workpapers (Total E&G general revenue & lottery minus non-recurring) and Board of Governors staff calculations for risk management insurance adjustments. Non-Recurring State Funds: State non-recurring funds include general revenue and lottery education & general appropriations and any administered funds provided by the state. This does not include technical adjustments or transfers made by Universities after the appropriation - Source: non-recurring appropriations section of the annual Allocation Summary and Workpapers document and all other non-recurring budget amendments allocated later in the fiscal year. Tuition: Actual resident & non-resident tuition revenues collected from students, net of fee waivers. - Source: Operating Budget, Report 625 – Schedule I-A. Tuition Differential Fee: Actual tuition differential revenues collected from undergraduate students - Source: Operating Budget, Report 625 – Schedule I-A. Miscellaneous Fees & Fines: Other revenue collections include items such as application fees, late registration fees, library fines, miscellaneous revenues. This is the total revenue from Report 625 minus tuition and tuition differential fee revenues. This does not include local fees - Source: Operating Budget, Report 625 – Schedule I-A. Phosphate Research Trust Fund: State appropriation for the Florida Industrial and Phosphate Research Institute at the University of South Florida (for history years through 2011-12); beginning 2012-13 the Phosphate Research Trust Fund is appropriated through Florida Polytechnic University. Other Operating Trust Funds- For UF-IFAS and UF-HSC, actual revenues from the Incidental Trust Funds and Operations & Maintenance Trust Fund are provided by the University of Florida. Source: Final Amendment Package. Federal Stimulus Funds: Non-recurring American Recovery and Reinvestment Act funds appropriated by the state - Source: SUS Final Amendment Package.
16
Annual Accountability Report 2012-2013
FLORIDA STATE UNIVERSITY
PENDING BOT APPROVAL 12‐19‐2013
Section 1 – Financial Resources (continued) TABLE 1B. University Education and General Expenditures 2009-10 2010-11 2011-12 2012-13 2013-14
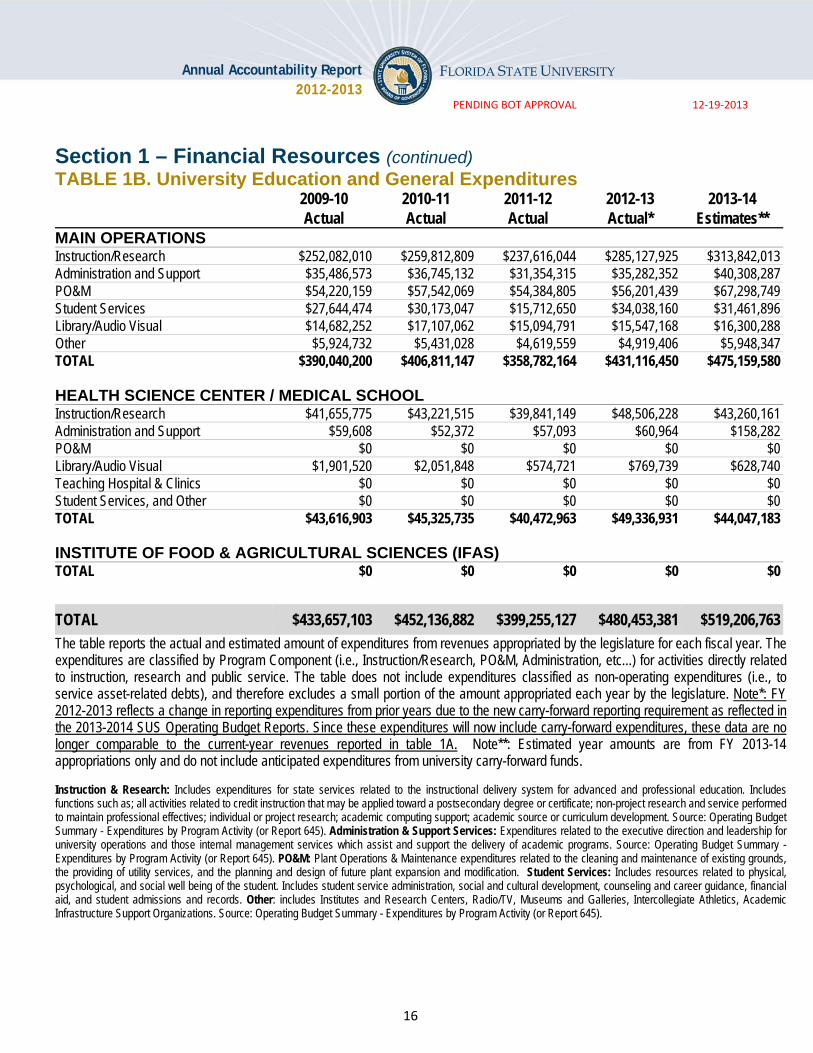
Actual Actual Actual Actual* Estimates** MAIN OPERATIONS Instruction/Research $252,082,010 $259,812,809 $237,616,044 $285,127,925 $313,842,013 Administration and Support $35,486,573 $36,745,132 $31,354,315 $35,282,352 $40,308,287 PO&M $54,220,159 $57,542,069 $54,384,805 $56,201,439 $67,298,749 Student Services $27,644,474 $30,173,047 $15,712,650 $34,038,160 $31,461,896 Library/Audio Visual $14,682,252 $17,107,062 $15,094,791 $15,547,168 $16,300,288 Other $5,924,732 $5,431,028 $4,619,559 $4,919,406 $5,948,347 TOTAL $390,040,200 $406,811,147 $358,782,164 $431,116,450 $475,159,580
HEALTH SCIENCE CENTER / MEDICAL SCHOOL Instruction/Research $41,655,775 $43,221,515 $39,841,149 $48,506,228 $43,260,161 Administration and Support $59,608 $52,372 $57,093 $60,964 $158,282 PO&M $0 $0 $0 $0 $0 Library/Audio Visual $1,901,520 $2,051,848 $574,721 $769,739 $628,740 Teaching Hospital & Clinics $0 $0 $0 $0 $0 Student Services, and Other $0 $0 $0 $0 $0 TOTAL $43,616,903 $45,325,735 $40,472,963 $49,336,931 $44,047,183
INSTITUTE OF FOOD & AGRICULTURAL SCIENCES (IFAS) TOTAL $0 $0 $0 $0 $0
TOTAL $433,657,103 $452,136,882 $399,255,127 $480,453,381 $519,206,763
The table reports the actual and estimated amount of expenditures from revenues appropriated by the legislature for each fiscal year. The expenditures are classified by Program Component (i.e., Instruction/Research, PO&M, Administration, etc...) for activities directly related to instruction, research and public service. The table does not include expenditures classified as non-operating expenditures (i.e., to service asset-related debts), and therefore excludes a small portion of the amount appropriated each year by the legislature. Note*: FY 2012-2013 reflects a change in reporting expenditures from prior years due to the new carry-forward reporting requirement as reflected in the 2013-2014 SUS Operating Budget Reports. Since these expenditures will now include carry-forward expenditures, these data are no longer comparable to the current-year revenues reported in table 1A. Note**: Estimated year amounts are from FY 2013-14 appropriations only and do not include anticipated expenditures from university carry-forward funds. Instruction & Research: Includes expenditures for state services related to the instructional delivery system for advanced and professional education. Includes functions such as; all activities related to credit instruction that may be applied toward a postsecondary degree or certificate; non-project research and service performed to maintain professional effectives; individual or project research; academic computing support; academic source or curriculum development. Source: Operating Budget Summary - Expenditures by Program Activity (or Report 645). Administration & Support Services: Expenditures related to the executive direction and leadership for university operations and those internal management services which assist and support the delivery of academic programs. Source: Operating Budget Summary - Expenditures by Program Activity (or Report 645). PO&M: Plant Operations & Maintenance expenditures related to the cleaning and maintenance of existing grounds, the providing of utility services, and the planning and design of future plant expansion and modification. Student Services: Includes resources related to physical, psychological, and social well being of the student. Includes student service administration, social and cultural development, counseling and career guidance, financial aid, and student admissions and records. Other: includes Institutes and Research Centers, Radio/TV, Museums and Galleries, Intercollegiate Athletics, Academic Infrastructure Support Organizations. Source: Operating Budget Summary - Expenditures by Program Activity (or Report 645).

17
Annual Accountability Report 2012-2013
FLORIDA STATE UNIVERSITY
PENDING BOT APPROVAL 12‐19‐2013
Section 1 – Financial Resources (continued) TABLE 1C. State Funding per Full-Time Equivalent (FTE) Student
2008-09 Actual
2009-10 Actual
2010-11 Actual
2011-12 Actual
2012-13 Actual
Appropriated Funding per FTE General Revenue $8,140 $6,524 $6,597 $5,720 $4,322 Lottery Funds $835 $718 $837 $918 $711 Tuition & Fees $3,785 $4,264 $4,557 $4,940 $5,782 Other Trust Funds $0 $573 $544 $0 $0 TOTAL $12,760 $12,079 $12,534 $11,579 $10,815
Actual Funding per FTE Tuition & Fees $3,505 $3,839 $4,269 $4,742 $5,256 TOTAL $12,480 $11,654 $12,246 $11,381 $10,289 Notes: (1) FTE is based on actual FTE, not funded FTE; (2) does not include Health-Science Center funds or FTE; (3) FTE for these metrics uses the standard IPEDS definition of FTE, equal to 30 credit hours for undergraduates and 24 for graduates; and (4) actual funding per student is based on actual tuition and E&G fees (does not include local fees) collected. Sources: Appropriated totals from the annual Final Amendment Package data. Estimated year data from the Allocation Summary document. Actual Student Fees from the Operating Budget 625 reports. This does not include appropriations for special units (i.e., IFAS, Health Science Centers, and Medical Schools). Tuition and fee revenues include tuition and tuition differential fee and E&G fees (i.e., application, late registration, and library fees/fines). Other local fees that do not support E&G activities are not included here (see Board of Governors Regulation 7.003). This data is not adjusted for inflation.
TABLE 1D. University Other Budget Entities 2009-10
Actual 2010-11 Actual
2011-12 Actual
2012-13 Actual
2013-14 Estimates
Auxiliary Enterprises Revenues $183,987,592 $199,558,734 $206,079,051 $235,018,302 $228,157,579 Expenditures $177,652,697 $180,919,052 $186,556,714 $200,517,708 $250,899,547 Contracts & Grants Revenues $196,076,393 $212,546,825 $208,789,835 $221,442,160 $242,687,123 Expenditures $193,835,991 $195,015,895 $188,083,314 $203,704,258 $225,404,459 Local Funds Revenues $194,234,953 $220,810,551 $229,060,800 $208,220,360 $218,828,014 Expenditures $194,024,673 $215,254,938 $208,904,815 $212,306,365 $241,713,668 Faculty Practice Plans Revenues $5,368,618 $6,303,145 $6,680,295 $9,137,413 $12,231,600 Expenditures $5,375,563 $6,296,128 $6,686,903 $8,919,308 $12,142,208 Notes: Revenues do not include transfers. Expenditures do not include non-operating expenditures. Auxiliary Enterprises are self supported through fees, payments and charges. Examples include housing, food services, bookstores, parking services, health centers. Contract & Grants resources are received from federal, state or private sources for the purposes of conducting research and public service activities. Local Funds are associated with student activity (supported by the student activity fee), student financial aid, concessions, intercollegiate athletics, technology fee, green fee, and student life & services fee. Faculty Practice Plan revenues/receipts are funds generated from faculty practice plan activities. Faculty Practice Plan expenditures include all expenditures relating to the faculty practice plans, including transfers between other funds and/or entities. This may result in double counting in information presented within the annual report. Source: Operating Budget, Report 615.

18
Annual Accountability Report 2012-2013
FLORIDA STATE UNIVERSITY
PENDING BOT APPROVAL 12‐19‐2013
Section 1 – Financial Resources (continued)
TABLE 1E. Voluntary Support of Higher Education
2007-08 2008-09 2009-10 2010-11 2011-12
Endowment Value ($1000s)
$570,730 $409,666 $452,544 $525,260 $497,708
Gifts Received ($1000s)
$57,462 $47,325 $53,946 $50,820 $55,582
Percentage of Alumni Donors
18% 16% 14% 16% 16%
Notes: Endowment value at the end of the fiscal year, as reported in the annual NACUBO Endowment Study. Gifts Received as reported in the Council for Aid to Education’s Voluntary Support of Education (VSE) survey in the section entitled “Gift Income Summary,” this is the sum of the present value of all gifts (including outright and deferred gifts) received for any purpose and from all sources during the fiscal year, excluding pledges and bequests. (There’s a deferred gift calculator at www.cae.org/vse.) The present value of non-cash gifts is defined as the tax deduction to the donor as allowed by the IRS. Percentage of Alumni Donors as reported in the Council for Aid to Education’s Voluntary Support of Education (VSE) survey in the section entitled “Additional Details,” this is the number of alumni donors divided by the total number of alumni, as of the end of the fiscal year. “Alumni,” as defined in this survey, include those holding a degree from the institution as well as those who attended the institution but did not earn a degree.
TABLE 1F. Tuition Differential Fees (TDF)
2010-11 2011-12 2012-13 TDF Revenues Generated $12,421,375 $19,147,556 $30,035,814 Students Receiving TDF Funded Award 2,201 3,385 4,127 Total Value of TDF Funded Financial Aid Awards $1,614 $1,697 $1,688
Florida Student Assistance Grant (FSAG) Eligible Students Number of Eligible Students 8,343 9,669 9,737 Number Receiving a TDF Waiver 0 0 0 Total Value of TDF Waivers $0 $0 0
Note: TDF Revenues Generated refers to actual tuition differential revenues collected from undergraduate students as reported on the Operating Budget, Report 625 – Schedule I-A. Students Receiving TDF Funded Award reports the number of unduplicated students who have received a financial aid award that was funded by tuition differential revenues. Value of TDF Funded Award refers to the average value of financial aid awards funded by the the Tuition Differential Fee funds. Florida Student Assistance Grant (FSAG) Eligible Students: Number of Eligible Students refers to total annual unduplicated count of undergraduates at the institution who are eligible for FSAG in the academic year, whether or not they received FSAG awards. Number Receiving a TDF Waiver refers to annual unduplicated count of FSAG-eligible students receiving a waiver, partial or full, of the tuition differential fees at the institution during the academic year, regardless of the reason for the waiver. Value of TDF Waivers refers to the average value of waivers provided to FSAG-eligible undergraduates at the institution during the academic year, regardless of the reason for the waiver.

19
Annual Accountability Report 2012-2013
FLORIDA STATE UNIVERSITY
PENDING BOT APPROVAL 12‐19‐2013
Section 2 – Personnel
TABLE 2A. Personnel Headcount (in Fall term only)
2008 2009 2010 2011 2012 Full-time Employees
Tenured Faculty 760 778 778 769 783 Tenure-track Faculty 311 296 256 214 238 Non-Tenure Track Faculty 664 647 606 667 695 Instructors Without Faculty Status 0 0 0 0 0 Graduate Assistants/Associates 0 0 0 0 0 Non-Instructional Employees 4,394 4,181 4,171 4,163 4,234
FULL-TIME SUBTOTAL 6,129 5,902 5,811 5,813 5,950
Part-time Employees
Tenured Faculty 1 1 3 3 3 Tenure-track Faculty 4 4 3 3 3 Non-Tenure Track Faculty 460 419 433 445 487 Instructors Without Faculty Status 157 179 198 199 175 Graduate Assistants/Associates 2,812 2,946 2,997 3,033 2982 Non-Instructional Employees 104 95 89 84 107
PART-TIME SUBTOTAL 3,538 3,644 3,723 3,767 3,757
TOTAL 9,667 9,546 9,534 9,580 9,707 Note: This table is based on the annual IPEDS Human Resources Survey, and provides full- and part-time medical and non-medical staff by faculty status and primary function/occupational activity. Tenured and Tenure-Track Faculty include those categorized within instruction, research, or public service. Non-Tenure Track Faculty includes adjunct faculty (on annual and less than annual contracts) and faculty on multi-year contracts categorized within instruction, research, or public service. Instructors Without Faculty Status includes postdoctoral research associates, and individuals hired as a staff member primarily to do research on a 3-year contract without tenure eligibility categorized within instruction, research, or public service. Non-Instructional Employees includes all executive, administrative and managerial positions regardless of faculty status; as well as, other support and service positions regardless of faculty status. Note: The universities vary on how they classify adjuncts – some include them as non-tenure track faculty while others do not consider them faculty and report them as instructors without faculty status.

20
Annual Accountability Report 2012-2013
FLORIDA STATE UNIVERSITY
PENDING BOT APPROVAL 12‐19‐2013
Section 3 – Enrollment
TABLE 3A. Full-Time Equivalent (FTE) Enrollment 2010-11 2011-12 2012-13
State-
Funded Actual
State- Funded
Actual State-
Funded Actual
FLORIDA RESIDENTS
LOWER-DIVISION 9,327 9,837 9,327 10,189 9,327 9,908
UPPER-DIVISION 10,713 11,682 10,713 11,643 10,713 11,658
MASTER’S (GRAD I) 2,536 2,331 2,482 2,269 2,482 2,131
DOCTORAL (GRAD II) 1,743 1,981 1,797 2,009 1,797 1,933
TOTAL 24,319 25,831 24,319 26,109 24,319 25,630
NON-FLORIDA RESIDENTS LOWER-DIVISION . 492 . 511 . 509
UPPER-DIVISION . 461 . 469 . 492
MASTER’S (GRAD I) . 479 . 508 . 518
DOCTORAL (GRAD II) . 692 . 714 . 729
TOTAL 2,483 2,123 2,483 2,202 2,483 2,249
TOTAL FTE LOWER-DIVISION . 10,329 . 10,700 . 10,417
UPPER-DIVISION . 12,143 . 12,112 . 12,150
MASTER’S (GRAD I) . 2,810 . 2,777 . 2,649
DOCTORAL (GRAD II) . 2,673 . 2,723 . 2,662
TOTAL 26,802 27,954 26,802 28,311 26,802 27,879
TOTAL US Definition
35,736 37,272 35,736 37,748 35,736 37,172
Headcount for Medical Doctorates FLORIDA RESIDENTS 480 472 480 470 480 471 NON-RESIDENTS 0 3 0 6 0 5 TOTAL 480 475 480 476 480 476
Notes: Full-time Equivalent (FTE) student is a measure of instructional effort (and student activity) that is based on the number of credit hours that students enroll. FTE is based on the Florida definition, which divides undergraduate credit hours by 40 and graduate credit hours by 32 (US definition based on Undergraduate FTE = 30 and Graduate FTE = 24 credit hours). Funded enrollment as reported in the General Appropriations Act and set by the legislature. Actual enrollment only reports ‘state-fundable’ FTE as reported by Universities to the Board of Governors in the Student Instruction File (SIF). Totals are actual and may not equal sum of reported student levels due to rounding of student level FTE.

21
Annual Accountability Report 2012-2013
FLORIDA STATE UNIVERSITY
PENDING BOT APPROVAL 12‐19‐2013
Section 3 – Enrollment (continued) TABLE 3C. Full-Time Equivalent (FTE) Enrollment by Method of Instruction
2010-11 2011-12 2012-13 TRADITIONAL
LOWER-DIVISION 10,033 10,161 9,584 UPPER-DIVISION 11,675 11,627 11,368 MASTER’S (GRAD I) 2,300 2,373 2,183 DOCTORAL (GRAD II) 2,630 2,684 2,620 TOTAL 26,638 26,845 25,755
HYBRID
LOWER-DIVISION 73 131 215 UPPER-DIVISION 49 51 94 MASTER’S (GRAD I) 166 110 145 DOCTORAL (GRAD II) 6 4 8 TOTAL 294 295 461
DISTANCE LEARNING
LOWER-DIVISION 222 409 618 UPPER-DIVISION 419 434 689 MASTER’S (GRAD I) 345 293 322 DOCTORAL (GRAD II) 37 35 35 TOTAL 1,023 1,171 1,664
TOTAL
LOWER-DIVISION 10,329 10,700 10,417 UPPER-DIVISION 12,143 12,111 12,150 MASTER’S (GRAD I) 2,810 2,777 2,649 DOCTORAL (GRAD II) 2,673 2,723 2,662 TOTAL 27,954 28,311 27,879
Note: Full-time Equivalent (FTE) student is a measure of instructional effort (and student activity) that is based on the number of credit hours that students enroll. FTE is based on the Florida definition, which divides undergraduate credit hours by 40 and graduate credit hours by 32. Distance Learning is a course in which at least 80 percent of the direct instruction of the course is delivered using some form of technology when the student and instructor are separated by time or space, or both (per 1009.24(17), F.S.). Hybrid is a course where 50% to 79% of the instruction is delivered using some form of technology, when the student and instructor are separated by time or space, or both (per SUDS data element 2052). Traditional (and Technology Enhanced) refers to primarily face to face instruction utilizing some form of technology for delivery of supplemental course materials for no more than 49% of instruction (per SUDS data element 2052). Totals are actual and may not equal sum of reported student levels due to rounding of student level FTE. Total FTE are equal in tables 3A, 3B.

22
Annual Accountability Report 2012-2013
FLORIDA STATE UNIVERSITY
PENDING BOT APPROVAL 12‐19‐2013
Section 4 – Undergraduate Education
TABLE 4A. Baccalaureate Degree Program Changes in AY 2012-13
Title of Program
Six-digit
CIP
Code
Degree
Level
Date of
UBOT
Action
Starting
or Ending
Term
Comments
New Programs
Professional Communication 09.0900 B 10/30/2012 Spring 2013
Terminated Programs
International Business Management 52.1101 B 10/30/2012 Spring 2013
Graphic Design 50.0409 B 6/8/2012 Spring 2014
Inactive Programs None
New Programs Considered By University But Not Approved
None
Note: This table does not include new majors or concentrations added under an existing degree program CIP Code. This table reports the new and terminated program changes based on Board action dates between May 5, 2012 and May 4, 2013. New Programs are proposed new degree programs that have been completely through the approval process at the university and, if appropriate, the Board of Governors. Does not include new majors or concentrations added under an existing degree program CIP Code. Terminated Programs are degree programs for which the entire CIP Code has been terminated and removed from the university’s inventory of degree programs. Does not include majors or concentrations terminated under an existing degree program CIP Code if the code is to remain active on the academic degree inventory. Inactive Programs are degree programs for which enrollments have been temporarily suspended for the entire CIP Code, but the program CIP Code has not been terminated. Does not include majors or concentrations suspended under an existing degree program CIP Code if the code is to remain active on the academic degree inventory and new enrollments in any active major will be reported. New Programs Considered by University But Not Approved includes any programs considered by the university board of trustees, or any committee of the board, but not approved for implementation. Also include any programs that were returned prior to board consideration by the university administration for additional development, significant revisions, or re-conceptualization; regardless of whether the proposal was eventually taken to the university board for approval. Count the returns once per program, not multiple times the proposal was returned for revisions, unless there is a total re-conceptualization that brings forward a substantially different program in a different CIP Code.
23
Annual Accountability Report 2012-2013
FLORIDA STATE UNIVERSITY
PENDING BOT APPROVAL 12‐19‐2013
Section 4 – Undergraduate Education (continued)
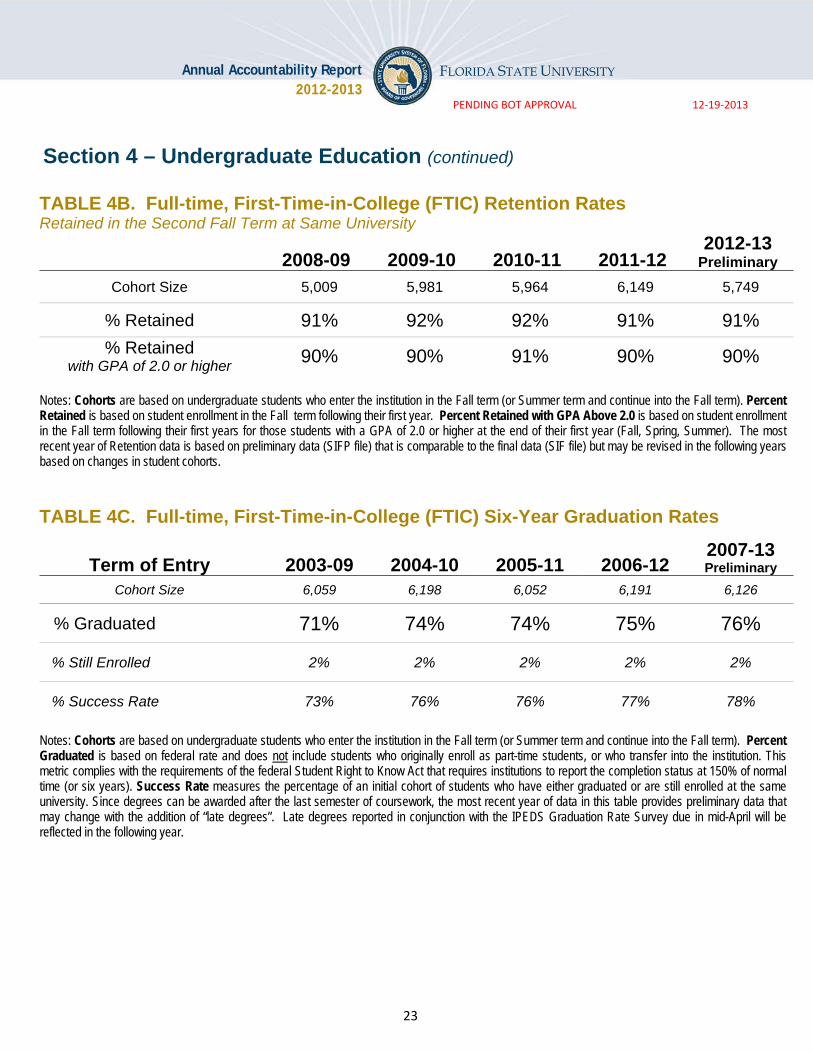
TABLE 4B. Full-time, First-Time-in-College (FTIC) Retention Rates Retained in the Second Fall Term at Same University
2008-09 2009-10 2010-11 2011-12
2012-13 Preliminary
Cohort Size 5,009 5,981 5,964 6,149 5,749
% Retained 91% 92% 92% 91% 91%
% Retained with GPA of 2.0 or higher
90% 90% 91% 90% 90%
Notes: Cohorts are based on undergraduate students who enter the institution in the Fall term (or Summer term and continue into the Fall term). Percent Retained is based on student enrollment in the Fall term following their first year. Percent Retained with GPA Above 2.0 is based on student enrollment in the Fall term following their first years for those students with a GPA of 2.0 or higher at the end of their first year (Fall, Spring, Summer). The most recent year of Retention data is based on preliminary data (SIFP file) that is comparable to the final data (SIF file) but may be revised in the following years based on changes in student cohorts.
TABLE 4C. Full-time, First-Time-in-College (FTIC) Six-Year Graduation Rates
Term of Entry 2003-09 2004-10 2005-11 2006-12 2007-13 Preliminary
Cohort Size 6,059 6,198 6,052 6,191 6,126
% Graduated 71% 74% 74% 75% 76%
% Still Enrolled 2% 2% 2% 2% 2%
% Success Rate 73% 76% 76% 77% 78%
Notes: Cohorts are based on undergraduate students who enter the institution in the Fall term (or Summer term and continue into the Fall term). Percent Graduated is based on federal rate and does not include students who originally enroll as part-time students, or who transfer into the institution. This metric complies with the requirements of the federal Student Right to Know Act that requires institutions to report the completion status at 150% of normal time (or six years). Success Rate measures the percentage of an initial cohort of students who have either graduated or are still enrolled at the same university. Since degrees can be awarded after the last semester of coursework, the most recent year of data in this table provides preliminary data that may change with the addition of “late degrees”. Late degrees reported in conjunction with the IPEDS Graduation Rate Survey due in mid-April will be reflected in the following year.

24
Annual Accountability Report 2012-2013
FLORIDA STATE UNIVERSITY
PENDING BOT APPROVAL 12‐19‐2013
Section 4 – Undergraduate Education (continued) TABLE 4D. FTIC Progression and Graduation Rates (includes Full- and Part-time students)
4 – Year Rates 2005-09 2006-10 2007-11 2008-12
2009-13 Preliminary
Cohort 6,078 6,232 6,184 5,039 5,992
From Same University
% Graduated 49% 53% 56% 61% 61% % Still Enrolled 29% 26% 25% 23% 23%
From Other SUS University
% Graduated 2% 2% 2% 2% 2% % Still Enrolled 5% 4% 4% 3% 3%
From State University System
% Graduated 51% 55% 58% 63% 63% % Still Enrolled 34% 30% 29% 26% 26%
% Success Rate 85% 85% 87% 89% 89%
6 – Year Rates 2003-09 2004-10 2005-11 2006-12
2007-13 Preliminary
Cohort 6,093 6,235 6,078 6,232 6,184
From Same University
% Graduated 71% 73% 74% 75% 76% % Still Enrolled 2% 2% 2% 2% 2%
From Other SUS University
% Graduated 6% 6% 6% 5% 5% % Still Enrolled 2% 2% 2% 2% 1%
From State University System
% Graduated 77% 79% 80% 80% 81% % Still Enrolled 4% 4% 4% 4% 3%
% Success Rate 81% 83% 84% 84% 84%
Notes: First-time-in-college (FTIC) cohort is defined as undergraduates entering in fall term (or summer continuing to fall) with fewer than 12 hours earned since high school graduation. (1) Cohorts are based on undergraduate students who enter the institution in the Fall term (or Summer term and continue into the Fall term). Students of degree programs longer than four years (eg, PharmD) are included in the cohorts. The initial cohorts are revised to remove students, who have allowable exclusions as defined by IPEDS, from the cohort. (2) Success Rate measures the percentage of an initial cohort of students who have either graduated or are still enrolled. (3) Since degrees can be awarded after the last semester of coursework, the most recent year of data in this table provides preliminary graduation rate data that may change with the addition of “late degrees”. Late degrees reported in conjunction with the IPEDS Graduation Rate Survey due in mid-April will be reflected in the following year.
25
Annual Accountability Report 2012-2013
FLORIDA STATE UNIVERSITY
PENDING BOT APPROVAL 12‐19‐2013
Section 4 – Undergraduate Education (continued)
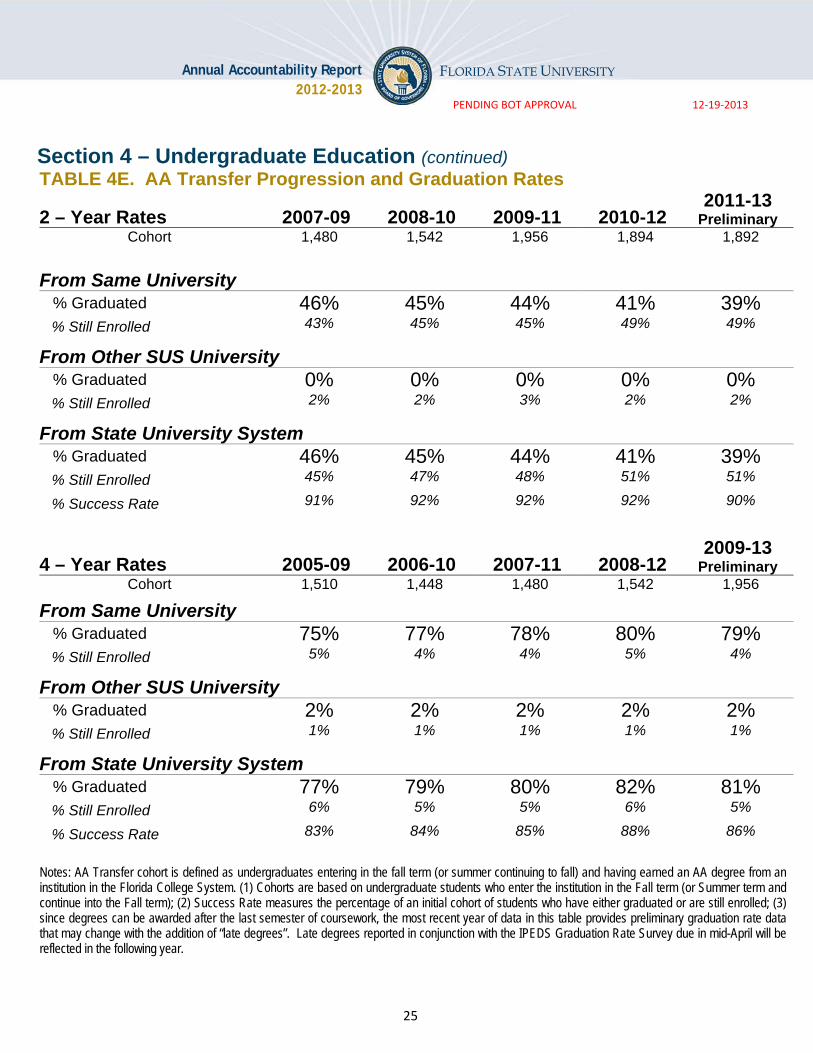
TABLE 4E. AA Transfer Progression and Graduation Rates
2 – Year Rates 2007-09 2008-10 2009-11 2010-12
2011-13 Preliminary
Cohort
1,480 1,542 1,956 1,894 1,892
From Same University
% Graduated 46% 45% 44% 41% 39% % Still Enrolled 43% 45% 45% 49% 49%
From Other SUS University
% Graduated 0% 0% 0% 0% 0% % Still Enrolled 2% 2% 3% 2% 2%
From State University System
% Graduated 46% 45% 44% 41% 39% % Still Enrolled 45% 47% 48% 51% 51%
% Success Rate 91% 92% 92% 92% 90%
4 – Year Rates 2005-09 2006-10 2007-11 2008-12
2009-13 Preliminary
Cohort 1,510 1,448 1,480 1,542 1,956
From Same University
% Graduated 75% 77% 78% 80% 79% % Still Enrolled 5% 4% 4% 5% 4%
From Other SUS University
% Graduated 2% 2% 2% 2% 2% % Still Enrolled 1% 1% 1% 1% 1%
From State University System
% Graduated 77% 79% 80% 82% 81% % Still Enrolled 6% 5% 5% 6% 5%
% Success Rate 83% 84% 85% 88% 86%
Notes: AA Transfer cohort is defined as undergraduates entering in the fall term (or summer continuing to fall) and having earned an AA degree from an institution in the Florida College System. (1) Cohorts are based on undergraduate students who enter the institution in the Fall term (or Summer term and continue into the Fall term); (2) Success Rate measures the percentage of an initial cohort of students who have either graduated or are still enrolled; (3) since degrees can be awarded after the last semester of coursework, the most recent year of data in this table provides preliminary graduation rate data that may change with the addition of “late degrees”. Late degrees reported in conjunction with the IPEDS Graduation Rate Survey due in mid-April will be reflected in the following year.
26
Annual Accountability Report 2012-2013
FLORIDA STATE UNIVERSITY
PENDING BOT APPROVAL 12‐19‐2013
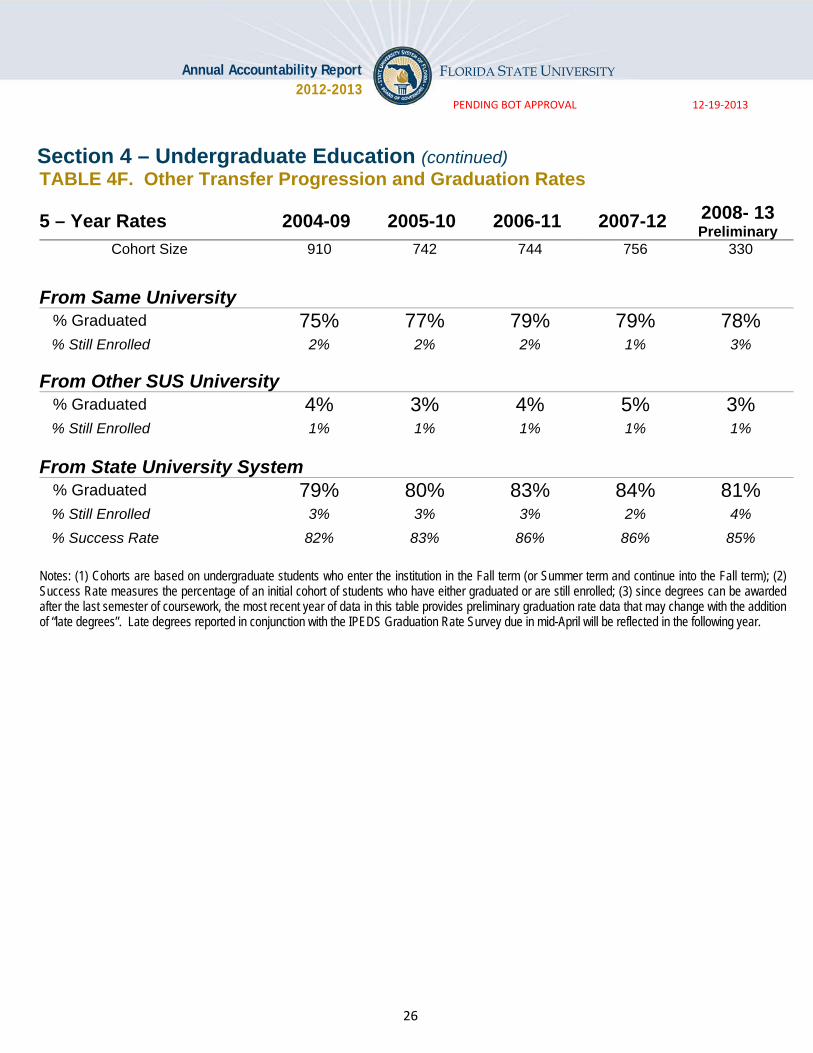
Section 4 – Undergraduate Education (continued) TABLE 4F. Other Transfer Progression and Graduation Rates
5 – Year Rates 2004-09 2005-10 2006-11 2007-12 2008- 13 Preliminary
Cohort Size
910 742 744 756 330
From Same University
% Graduated 75% 77% 79% 79% 78% % Still Enrolled 2% 2% 2% 1% 3%
From Other SUS University
% Graduated 4% 3% 4% 5% 3% % Still Enrolled 1% 1% 1% 1% 1%
From State University System
% Graduated 79% 80% 83% 84% 81% % Still Enrolled 3% 3% 3% 2% 4%
% Success Rate 82% 83% 86% 86% 85%
Notes: (1) Cohorts are based on undergraduate students who enter the institution in the Fall term (or Summer term and continue into the Fall term); (2) Success Rate measures the percentage of an initial cohort of students who have either graduated or are still enrolled; (3) since degrees can be awarded after the last semester of coursework, the most recent year of data in this table provides preliminary graduation rate data that may change with the addition of “late degrees”. Late degrees reported in conjunction with the IPEDS Graduation Rate Survey due in mid-April will be reflected in the following year.
27
Annual Accountability Report 2012-2013
FLORIDA STATE UNIVERSITY
PENDING BOT APPROVAL 12‐19‐2013
Section 4 – Undergraduate Education (continued)
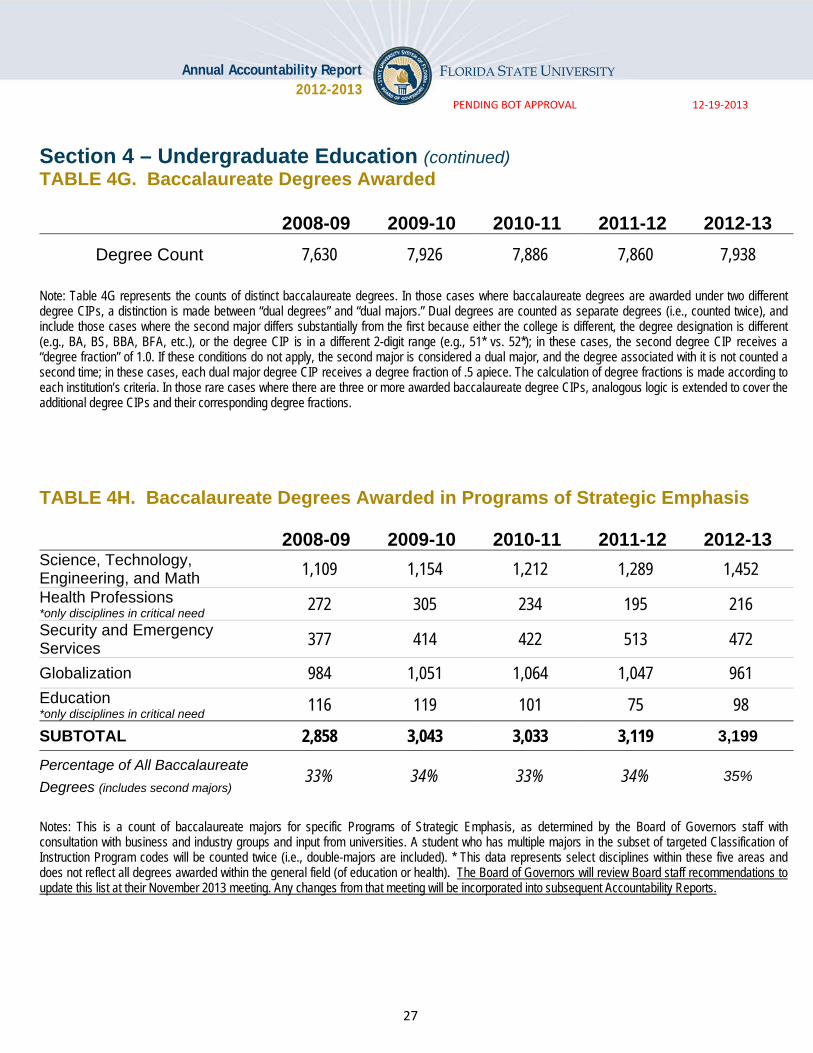
TABLE 4G. Baccalaureate Degrees Awarded
2008-09 2009-10 2010-11 2011-12 2012-13
Degree Count 7,630 7,926 7,886 7,860 7,938
Note: Table 4G represents the counts of distinct baccalaureate degrees. In those cases where baccalaureate degrees are awarded under two different degree CIPs, a distinction is made between “dual degrees” and “dual majors.” Dual degrees are counted as separate degrees (i.e., counted twice), and include those cases where the second major differs substantially from the first because either the college is different, the degree designation is different (e.g., BA, BS, BBA, BFA, etc.), or the degree CIP is in a different 2-digit range (e.g., 51* vs. 52*); in these cases, the second degree CIP receives a “degree fraction” of 1.0. If these conditions do not apply, the second major is considered a dual major, and the degree associated with it is not counted a second time; in these cases, each dual major degree CIP receives a degree fraction of .5 apiece. The calculation of degree fractions is made according to each institution’s criteria. In those rare cases where there are three or more awarded baccalaureate degree CIPs, analogous logic is extended to cover the additional degree CIPs and their corresponding degree fractions.
TABLE 4H. Baccalaureate Degrees Awarded in Programs of Strategic Emphasis
2008-09 2009-10 2010-11 2011-12 2012-13 Science, Technology, Engineering, and Math 1,109 1,154 1,212 1,289 1,452
Health Professions *only disciplines in critical need
272 305 234 195 216
Security and Emergency Services 377 414 422 513 472
Globalization 984 1,051 1,064 1,047 961 Education *only disciplines in critical need 116 119 101 75 98
SUBTOTAL 2,858 3,043 3,033 3,119 3,199
Percentage of All Baccalaureate
Degrees (includes second majors) 33% 34% 33% 34% 35%
Notes: This is a count of baccalaureate majors for specific Programs of Strategic Emphasis, as determined by the Board of Governors staff with consultation with business and industry groups and input from universities. A student who has multiple majors in the subset of targeted Classification of Instruction Program codes will be counted twice (i.e., double-majors are included). * This data represents select disciplines within these five areas and does not reflect all degrees awarded within the general field (of education or health). The Board of Governors will review Board staff recommendations to update this list at their November 2013 meeting. Any changes from that meeting will be incorporated into subsequent Accountability Reports.

28
Annual Accountability Report 2012-2013
FLORIDA STATE UNIVERSITY
PENDING BOT APPROVAL 12‐19‐2013
Section 4 – Undergraduate Education (continued)
TABLE 4I. Baccalaureate Degrees Awarded to Underrepresented Groups
2008-09 2009-10 2010-11 2011-12 2012-13
Non-Hispanic Black
Number of Degrees 862 810 778 788 735
Percentage of Degrees 12% 10% 10% 10% 10%
Hispanic
Number of Degrees 766 893 926 1,020 1,155
Percentage of Degrees 10% 11% 12% 13% 15%
Pell-Grant Recipients
Number of Degrees 2,238 2,409 2,664 2,922 3,194
Percentage of Degrees 30% 31% 34% 38% 41% Note: Non-Hispanic Black and Hispanic do not include students classified as Non-Resident Alien or students with a missing race code. Students who earn two distinct degrees in the same term are counted twice – whether their degrees are from the same six-digit CIP code or different CIP codes. Students who earn only one degree are counted once – even if they completed multiple majors or tracks. Percentage of Degrees is based on the number of baccalaureate degrees awarded to non-Hispanic Black and Hispanic students divided by the total degrees awarded - excluding those awarded to non-resident aliens and unreported. Pell-Grant recipients are defined as those students who have received a Pell grant from any SUS Institution within six years of graduation - excluding those awarded to non-resident aliens, who are only eligible for Pell grants in special circumstances. Percentage of Degrees is based on the number of baccalaureate degrees awarded to Pell recipients, as shown above, divided by the total degrees awarded - excluding those awarded to non-resident aliens. Notes on Trends: In 2007, the US Department of Education re-classified the taxonomy for self-reported race/ethnicity categories and allowed universities a two-year phase-in process before all institutions were required to report based on the new categories for the 2010-11 academic year. This reclassification established Hispanics of any race as a dominant category, and non-Hispanics of various races as secondary categories (including a new category: ‘Two or More Races’). This re-classification may cause students who previously were identified as White or Black to now select Hispanic or ‘Two or More Races’.

29
Annual Accountability Report 2012-2013
FLORIDA STATE UNIVERSITY
PENDING BOT APPROVAL 12‐19‐2013
Section 4 – Undergraduate Education (continued) TABLE 4J. Baccalaureate Degrees Without Excess Credit Hours
2008-09 2009-10 2010-11 2011-12 2012-13* FTIC 74% 77% 77% 76% 76%
AA Transfers 83% 82% 80% 79% 76%
Other Transfers 79% 79% 76% 82% 82%
TOTAL 77% 78% 78% 78% 76% Notes: This table is based on statute 1009.286 (see link), and excludes certain types of student credits (ie, accelerated mechanisms, remedial coursework, non-native credit hours that are not used toward the degree, non-native credit hours from failed, incomplete, withdrawn, or repeated courses, credit hours from internship programs, credit hours up to 10 foreign language credit hours for transfer students in Florida, and credit hours earned in military science courses that are part of the Reserve Officers’ Training Corps (ROTC) program). This metric is not the same as the Excess Hours Surcharge, which has multiple cohorts with varying fee rates. This table reports the percentage of baccalaureate degrees awarded within 110% of the catalog hours required for a degree based on the Board of Governors Academic Program Inventory. This calculation is based on Hours To Degree data submitted by universities to the Board of Governors and excludes recent graduates who have already earned a baccalaureate degree. Note*: 2012-13 data are not comparable to prior year data due to changes made in the data collection process and methodology.
TABLE 4K. Undergraduate Course Offerings
Fall 2008 Fall 2009 Fall 2010 Fall 2011 Fall 2012
Number of Course Sections
3,814 3,847 3,806 3,764 3,836
Percentage of Undergraduate Course Sections by Class Size Fewer than 30 Students 64% 64% 63% 64% 65% 30 to 49 Students 21% 21% 21% 21% 21% 50 to 99 Students 10% 10% 10% 10% 8% 100 or More Students 6% 6% 6% 6% 6%
Notes: This data is based on Common Data Set (CDS) definitions. According to CDS, a “class section is an organized course offered for credit, identified by discipline and number, meeting at a stated time or times in a classroom or similar setting, and not a subsection such as a laboratory or discussion session. Undergraduate class sections are defined as any sections in which at least one degree-seeking undergraduate student is enrolled for credit. Exclude distance learning classes and noncredit classes and individual instruction such as dissertation or thesis research, music instruction, or one-to-one readings. Exclude students in independent study, co-operative programs, internships, foreign language taped tutor sessions, practicums, and all students in one-on-one classes.
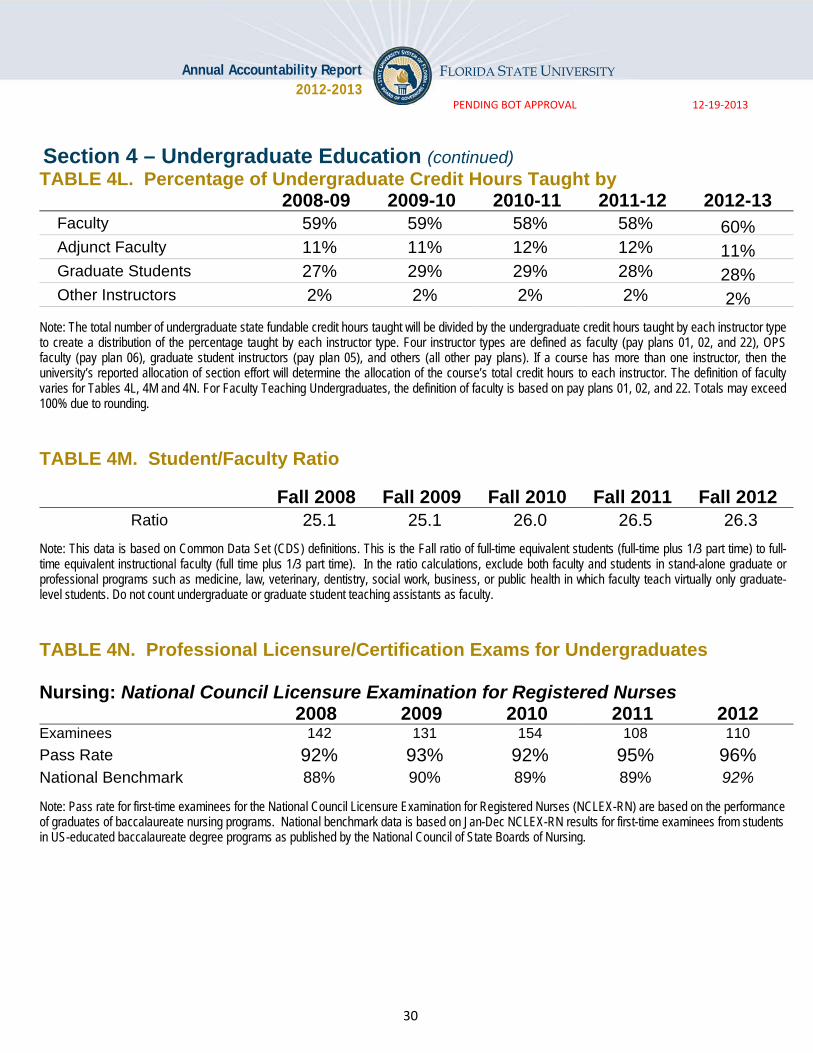
30
Annual Accountability Report 2012-2013
FLORIDA STATE UNIVERSITY
PENDING BOT APPROVAL 12‐19‐2013
Section 4 – Undergraduate Education (continued)
TABLE 4L. Percentage of Undergraduate Credit Hours Taught by 2008-09 2009-10 2010-11 2011-12 2012-13 Faculty 59% 59% 58% 58% 60% Adjunct Faculty 11% 11% 12% 12% 11% Graduate Students 27% 29% 29% 28% 28% Other Instructors 2% 2% 2% 2% 2% Note: The total number of undergraduate state fundable credit hours taught will be divided by the undergraduate credit hours taught by each instructor type to create a distribution of the percentage taught by each instructor type. Four instructor types are defined as faculty (pay plans 01, 02, and 22), OPS faculty (pay plan 06), graduate student instructors (pay plan 05), and others (all other pay plans). If a course has more than one instructor, then the university’s reported allocation of section effort will determine the allocation of the course’s total credit hours to each instructor. The definition of faculty varies for Tables 4L, 4M and 4N. For Faculty Teaching Undergraduates, the definition of faculty is based on pay plans 01, 02, and 22. Totals may exceed 100% due to rounding.
TABLE 4M. Student/Faculty Ratio
Fall 2008 Fall 2009 Fall 2010 Fall 2011 Fall 2012
Ratio 25.1 25.1 26.0 26.5 26.3
Note: This data is based on Common Data Set (CDS) definitions. This is the Fall ratio of full-time equivalent students (full-time plus 1/3 part time) to full-time equivalent instructional faculty (full time plus 1/3 part time). In the ratio calculations, exclude both faculty and students in stand-alone graduate or professional programs such as medicine, law, veterinary, dentistry, social work, business, or public health in which faculty teach virtually only graduate-level students. Do not count undergraduate or graduate student teaching assistants as faculty.
TABLE 4N. Professional Licensure/Certification Exams for Undergraduates
Nursing: National Council Licensure Examination for Registered Nurses
2008 2009 2010 2011 2012 Examinees 142 131 154 108 110
Pass Rate 92% 93% 92% 95% 96% National Benchmark 88% 90% 89% 89% 92%
Note: Pass rate for first-time examinees for the National Council Licensure Examination for Registered Nurses (NCLEX-RN) are based on the performance of graduates of baccalaureate nursing programs. National benchmark data is based on Jan-Dec NCLEX-RN results for first-time examinees from students in US-educated baccalaureate degree programs as published by the National Council of State Boards of Nursing.

31
Annual Accountability Report 2012-2013
FLORIDA STATE UNIVERSITY
PENDING BOT APPROVAL 12‐19‐2013
Section 5 – Graduate Education
TABLE 5A. Graduate Degree Program Changes in AY 2012-13
Title of Program
Six-digit
CIP
Code
Degree
Level
Date of
UBOT
Action
Starting
or Ending
Term
Date of
Board of
Governors Action
Comments
New Programs
Curriculum and Instruction 13.0301 M, S 6/8/2012 Spring 2013
Curriculum and Instruction 13.0301 R 6/8/2012 Spring 2013 6/21/2012
Information Technology 11.0103 M 6/8/2013 Fall 2012
Corporate and Public Communication 9.09 M 10/30/2012 Spring 2013
Terminated Programs
Pre-Elem/Early Childhood Teach Ed 13.1210 M,S 6/8/2012 Spring 2013
Pre-Elem/Early Childhood Teach Ed 13.1210 R 6/8/2012 Spring 2013 6/21/2012
Ed of Blind & Visually Handicapped 13.1009 M,S 6/8/2012 Spring 2013
Elementary Teacher Ed 13.1202 M,S 6/8/2012 Spring 2013
Elementary Teacher Ed 13.1202 R 6/8/2012 Spring 2013 6/21/2012
English Teacher Ed 13.1305 M,S 6/8/2012 Spring 2013
English Teacher Ed 13.1305 R 6/8/2012 Spring 2013 6/21/2012
Foreign Languages Teacher Ed 13.1306 M, S 6/8/2012 Spring 2013
Foreign Languages Teacher Ed 13.1306 R 6/8/2012 Spring 2013 6/21/2012
Mathematics Teacher Ed 13.1311 M, S 6/8/2012 Spring 2013
Mathematics Teacher Ed 13.1311 R 6/8/2012 Spring 2013 6/21/2012
Reading Teacher Ed 13.1315 M, S 6/8/2012 Spring 2013
Reading Teacher Ed 13.1315 R 6/8/2012 Spring 2013 6/21/2012
Recreation 31.0301 M 3/8/2013 Summer 2013
Science Teacher Ed 13.1316 M, S 6/8/2012 Spring 2013
Science Teacher Ed 13.1316 R 6/8/2012 Spring 2013 6/21/2012
Social Sciences Teacher Ed 13.1317 M, S 6/8/2012 Spring 2013
Social Sciences Teacher Ed 13.1317 R 6/8/2012 Spring 2013 6/21/2012
Education of Specific Learning Disabled 13.1001 M 6/8/2012 Spring 2013
Education of Specific Learning Disabled 13.1001 S 6/8/2012 Spring 2013
Education of Specific Learning Disabled 13.1001 R 6/8/2012 Spring 2013 6/21/2012
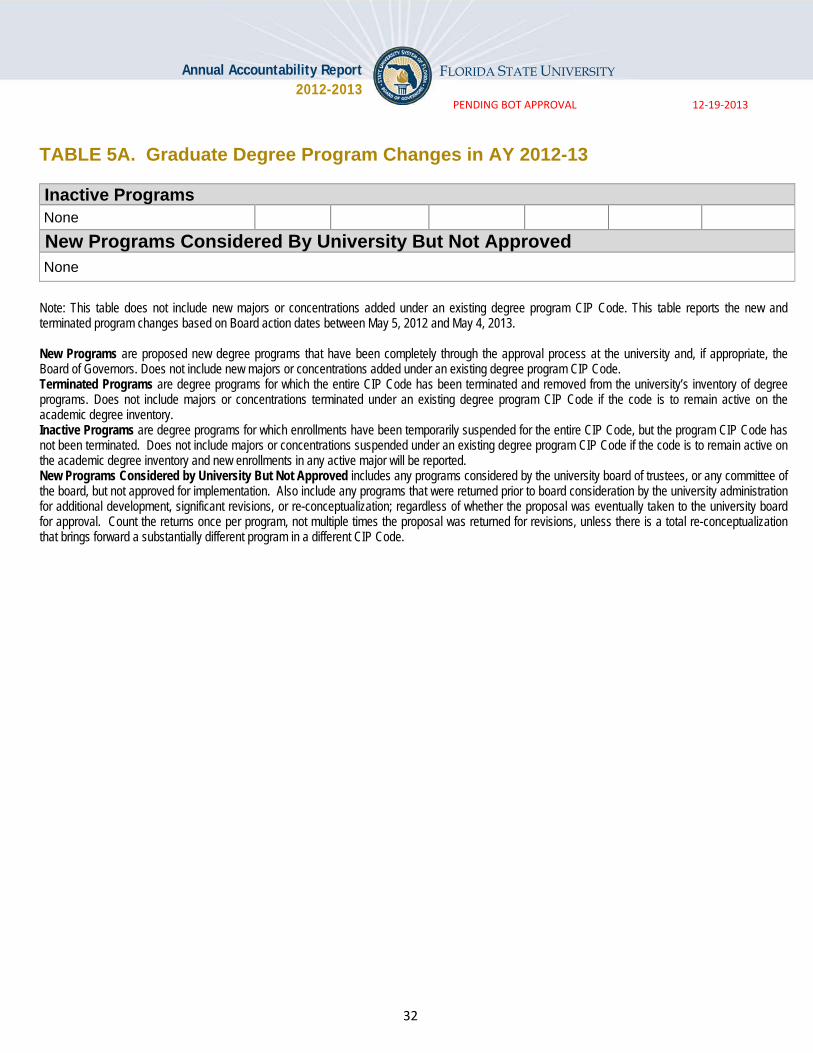
32
Annual Accountability Report 2012-2013
FLORIDA STATE UNIVERSITY
PENDING BOT APPROVAL 12‐19‐2013
TABLE 5A. Graduate Degree Program Changes in AY 2012-13
Inactive Programs
None
New Programs Considered By University But Not Approved
None
Note: This table does not include new majors or concentrations added under an existing degree program CIP Code. This table reports the new and terminated program changes based on Board action dates between May 5, 2012 and May 4, 2013. New Programs are proposed new degree programs that have been completely through the approval process at the university and, if appropriate, the Board of Governors. Does not include new majors or concentrations added under an existing degree program CIP Code. Terminated Programs are degree programs for which the entire CIP Code has been terminated and removed from the university’s inventory of degree programs. Does not include majors or concentrations terminated under an existing degree program CIP Code if the code is to remain active on the academic degree inventory. Inactive Programs are degree programs for which enrollments have been temporarily suspended for the entire CIP Code, but the program CIP Code has not been terminated. Does not include majors or concentrations suspended under an existing degree program CIP Code if the code is to remain active on the academic degree inventory and new enrollments in any active major will be reported. New Programs Considered by University But Not Approved includes any programs considered by the university board of trustees, or any committee of the board, but not approved for implementation. Also include any programs that were returned prior to board consideration by the university administration for additional development, significant revisions, or re-conceptualization; regardless of whether the proposal was eventually taken to the university board for approval. Count the returns once per program, not multiple times the proposal was returned for revisions, unless there is a total re-conceptualization that brings forward a substantially different program in a different CIP Code.
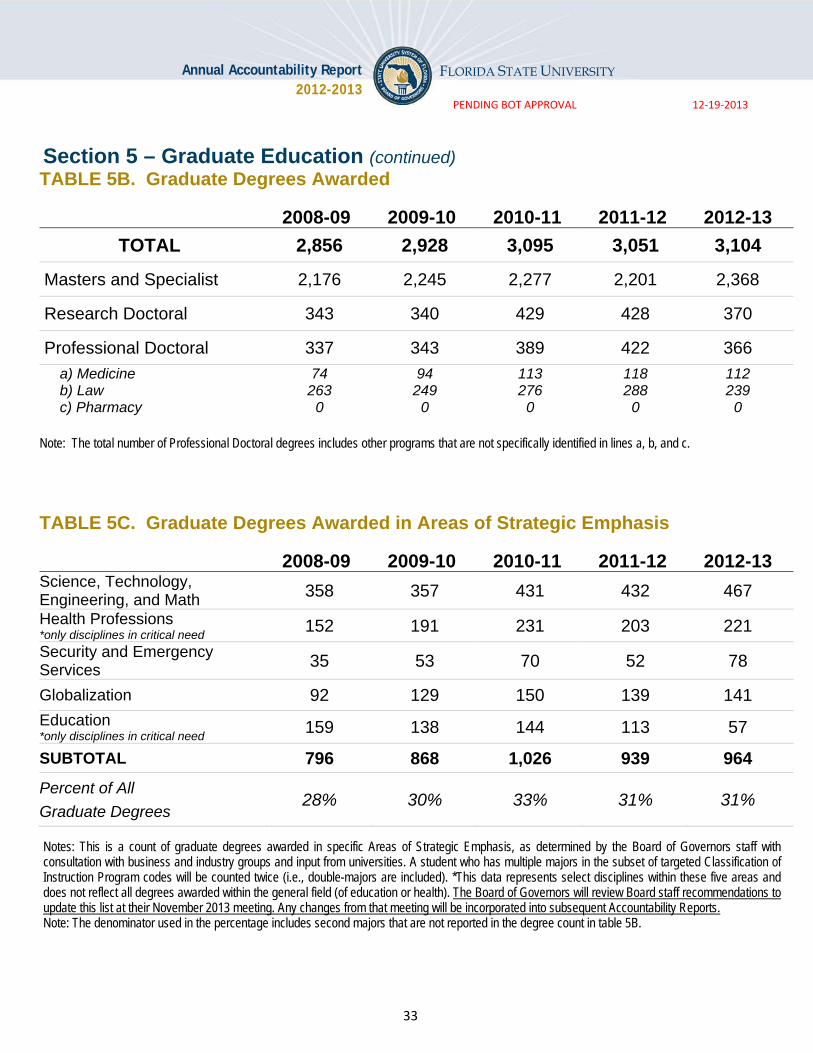
33
Annual Accountability Report 2012-2013
FLORIDA STATE UNIVERSITY
PENDING BOT APPROVAL 12‐19‐2013
Section 5 – Graduate Education (continued) TABLE 5B. Graduate Degrees Awarded
2008-09 2009-10 2010-11 2011-12 2012-13
TOTAL 2,856 2,928 3,095 3,051 3,104
Masters and Specialist 2,176 2,245 2,277 2,201 2,368
Research Doctoral 343 340 429 428 370
Professional Doctoral 337 343 389 422 366
a) Medicine 74 94 113 118 112 b) Law 263 249 276 288 239 c) Pharmacy 0 0 0 0 0 Note: The total number of Professional Doctoral degrees includes other programs that are not specifically identified in lines a, b, and c.
TABLE 5C. Graduate Degrees Awarded in Areas of Strategic Emphasis
2008-09 2009-10 2010-11 2011-12 2012-13
Science, Technology, Engineering, and Math 358 357 431 432 467
Health Professions *only disciplines in critical need 152 191 231 203 221
Security and Emergency Services 35 53 70 52 78
Globalization 92 129 150 139 141
Education *only disciplines in critical need 159 138 144 113 57
SUBTOTAL 796 868 1,026 939 964
Percent of All
Graduate Degrees 28% 30% 33% 31% 31%
Notes: This is a count of graduate degrees awarded in specific Areas of Strategic Emphasis, as determined by the Board of Governors staff with consultation with business and industry groups and input from universities. A student who has multiple majors in the subset of targeted Classification of Instruction Program codes will be counted twice (i.e., double-majors are included). *This data represents select disciplines within these five areas and does not reflect all degrees awarded within the general field (of education or health). The Board of Governors will review Board staff recommendations to update this list at their November 2013 meeting. Any changes from that meeting will be incorporated into subsequent Accountability Reports. Note: The denominator used in the percentage includes second majors that are not reported in the degree count in table 5B.

34
Annual Accountability Report 2012-2013
FLORIDA STATE UNIVERSITY
PENDING BOT APPROVAL 12‐19‐2013
Section 5 – Graduate Education (continued) TABLE 5D. Professional Licensure Exams for Graduate Programs
Law: Florida Bar Exam
2009 2010 2011 2012 2013
Examinees 215 222 237 245 213
Pass Rate 87% 86% 88% 88% 88% State Benchmark* 79% 79% 82% 81% 80% Note*: excludes non-Florida schools.
Medicine: US Medical Licensing Exam - Step 1 (for 2nd year MD students)
2009 2010 2011 2012
2013 Preliminary
Examinees 119 115 118 118 115
Pass Rate 90% 90% 92% 92% 96% National Benchmark 91% 94% 96% 96% 96% Medicine: US Medical Licensing Exam - Step 2 Clinical Knowledge (for 4th year MD students)
2008-09 2009-10 2010-11 2011-12 2012-13
Examinees 78 94 115 117 114
Pass Rate 99% 100% 97% 100% 99% National Benchmark 96% 97% 97% 98% 98% Medicine: US Medical Licensing Exam - Step 2 Clinical Skills (for 4th year MD students)
2008-09 2009-10 2010-11 2011-12 2012-13
Examinees 78 94 115 117 114
Pass Rate 100% 100% 98% 100% 99% National Benchmark 97% 97% 98% 97% 98%

35
Annual Accountability Report 2012-2013
FLORIDA STATE UNIVERSITY
PENDING BOT APPROVAL 12‐19‐2013
Section 6 – Research and Economic Development
TABLE 6A. Research and Development
2007-08 2008-09 2009-10 2010-11 2011-12
R&D Expenditures Total (S&E and non-S&E) ($ 1,000s)
$211,557 $237,794 $227,329 $230,411 $225,378
Federally Funded ($ 1,000s)
$121,901 $127,104 $134,794 $140,850 $140,419
Percent Funded From External Sources 66% 64% 71% 64% 66%
Total R&D Expenditures Per Full-Time, Tenured, Tenure-Earning Faculty Member ($)
$188,890 $222,030 $221,475 $222,835 $229,276
Technology Transfer
Invention Disclosures 45 41 37 60 65
U.S. Patents Issued 11 10 21 36 27
Patents Issued Per 1,000 Full-Time, Tenured and Tenure-Earning Faculty
10 9 20 34 27
Licenses/ Options Executed 12 10 6 10 13
Licensing Income Received ($) $1,257,266 $1,192,448 $1,314,917 $1,467,981 $1,333,065
Number of Start-Up Companies 3 2 2 4 2
Note: R&D Expenditures are based on the National Science Foundation’s annual Survey of R&D Expenditures at Universities and Colleges (data include Science & Engineering and non-Science & Engineering awards). Percent Funded from External Sources is defined as funds from federal, private industry and other sources (non-state and non-institutional funds). Total R&D expenditures are divided by fall, full-time tenured/tenure-track faculty as reported to IPEDS (FGCU includes both tenured/tenure-track and non-tenure/track faculty). The fall faculty year used will align with the beginning of the fiscal year, so that (e.g.) 2007 FY R&D expenditures are divided by fall 2006 faculty. Technology Transfer data are based on the Association of University Technology Managers Annual Licensing Survey. Licensing Income Received refers to license issue fees, payments under options, annual minimums, running royalties, termination payments, amount of equity received when cashed-in, and software and biological material end-user license fees of $1,000 or more, but not research funding, patent expense reimbursement, valuation of equity not cashed-in, software and biological material end-user license fees of less than $1,000, or trademark licensing royalties from university insignia. Number of Start-up Companies that were dependent upon the licensing of University technology for initiation.

36
Annual Accountability Report 2012-2013
FLORIDA STATE UNIVERSITY
PENDING BOT APPROVAL 12‐19‐2013

37
Annual Accountability Report 2012-2013
FLORIDA STATE UNIVERSITY
PENDING BOT APPROVAL 12‐19‐2013
Section 6 – Research and Economic Development (continued) TABLE 6B. Centers of Excellence
Name of Center: Center of Excellence
in Advanced Materials Cumulative
(since inception
to June 2013)
Fiscal Year
2012-13 Year Created: 2007
Research Effectiveness
Only includes data for activities directly associated with the Center. Does not include the non-Center activities for faculty who are associated with the Center.
Number of Competitive Grants Applied For 191 17
Value of Competitive Grants Applied For ($) 188,092,996 $5,527,077
Number of Competitive Grants Received 200 7
Value of Competitive Grants Received ($) $24,927,822 $5,128,765
Total Research Expenditures ($) $19,290,839 $2,473,110
Number of Publications in Refereed Journals From Center Research
127 34
Number of Invention Disclosures 29 6
Number of Licenses/Options Executed 3 1
Licensing Income Received ($) $0 $7,500
Collaboration Effectiveness
Only reports on relationships that include financial or in-kind support.
Collaborations with Other Postsecondary Institutions 27 2
Collaborations with Private Industry 57 3
Collaborations with K-12 Education Systems/Schools 62 12
Undergraduate and Graduate Students Supported with Center Funds
305 51
Economic Development Effectiveness
Number of Start-Up companies with a physical presence, or employees, in Florida
3 0
Jobs Created By Start-Up Companies Associated with the Center
19 2
Specialized Industry Training and Education 16 2 Private-sector Resources Used to Support the Center's Operations
$0 $0
Narrative Comments on next page.

38
Annual Accountability Report 2012-2013
FLORIDA STATE UNIVERSITY
PENDING BOT APPROVAL 12‐19‐2013
Section 6 – Research and Economic Development (continued) TABLE 6B. Centers of Excellence (continued)
Name of Center Center of Excellence in Advanced Materials
Narrative Comments [Most Recent Year]: Despite a continued transition in leadership during the reporting period, the Florida Center of Excellence in Advanced Materials (CEAM) is continuing to grow and develop by leveraging the Center of Excellence award funding and other partnerships. CEAM technologies resulted in 4 patents being awarded during the reporting period: US 8404162-Composite materials and methods for selective placement of nano-particulates within composites, US 8387469-Systems, methods, and apparatus for structural health monitoring, US 8354490- Method for functionalization of nanoscale fibers and nanoscale fiber films, and US 8351220- Electromagnetic interference shielding structure including carbon nanotube or nanofiber films and methods. As previously reported, Bing Energy moved to Tallahassee in large part due to incentives from FSU, the Center and the state. Bing Energy has licensed the Center’s buckypaper technology to manufacture polymer electrolyte membrane fuel cells, which will be more efficient, durable and less expensive. The waiver of licensing fees expired at the end of 2012, so FSU received the first payment in June, which is reported. Another payment was received in October, which will be reflected on the next report. Bing eventually anticipates creating at least 244 jobs, paying an average wage of $41,655. Building on CEAM developments, FSU entered into a partnership with Nanovision, a local start-up company. In this partnership, CEAM personnel were working with Nanovision to construct a prototype of a machine capable of producing 6-inch wide sheets of nanotubes, called buckypaper, at a rate of 5 feet per minute. Due to a problem with one of the subcontractors engaged by Nanovision, the project did not continue; however, Nanovision retains the option to license the buckypaper technology and has hired 2 additional people during the reporting period. Despite this setback, the National Science Foundation awarded FSU a $1,465,477 award to scale-up production of the buckypaper, which will be led by CEAM personnel. This award will be reflected in the next report. During the reporting period, building on CEAM developments, CEAM personnel began a project for the Department of Veterans Affairs for over $4.4M to build more comfortable sockets for amputees. These sockets will have embedded sensors that will provide real time information of potential issues to the wearer and practitioners. For this project, FSU has issued subcontracts to Saint Petersburg College and two small companies in Orlando. Outreach programs are continuing and expanding. CEAM personnel are working with Tallahassee Community College (TCC) in its National Science Foundation sponsored Students in Engineering Technology (SET), which is a project that address employers’ needs by producing highly skilled and educated technicians who are prepared to enter and succeed in the field of Engineering Technology. This involves creating a strong, community-based partnership of education and industry in north Florida. The project has started with working with one rural high school in Wakulla County (Wakulla
39
Annual Accountability Report 2012-2013
FLORIDA STATE UNIVERSITY
PENDING BOT APPROVAL 12‐19‐2013
HS) and a more urban school in Tallahassee (Godby HS).For the sixth consecutive summer, CEAM personnel worked with (TCC) in sponsoring two 1-week Composite Materials Summer Camps for high school students in which 24 students built skateboards, while learning skills involved in composites and manufacturing. During the summer for the third year, CEAM and the College of Engineering through the Challenger Learning Center hosted students from 10 Title I elementary schools to inspire the students to pursue the STEM disciplines. Leveraging resources from CEAM, NSF and AFRL, for the past six years, FSU hosted approximately 14 excellent undergraduate students from throughout the nation in a Research Experience for Undergraduate program to encourage them to pursue engineering graduate degrees at FSU. One of the competitive proposals reported as submitted is to renew NSF funding for this project.
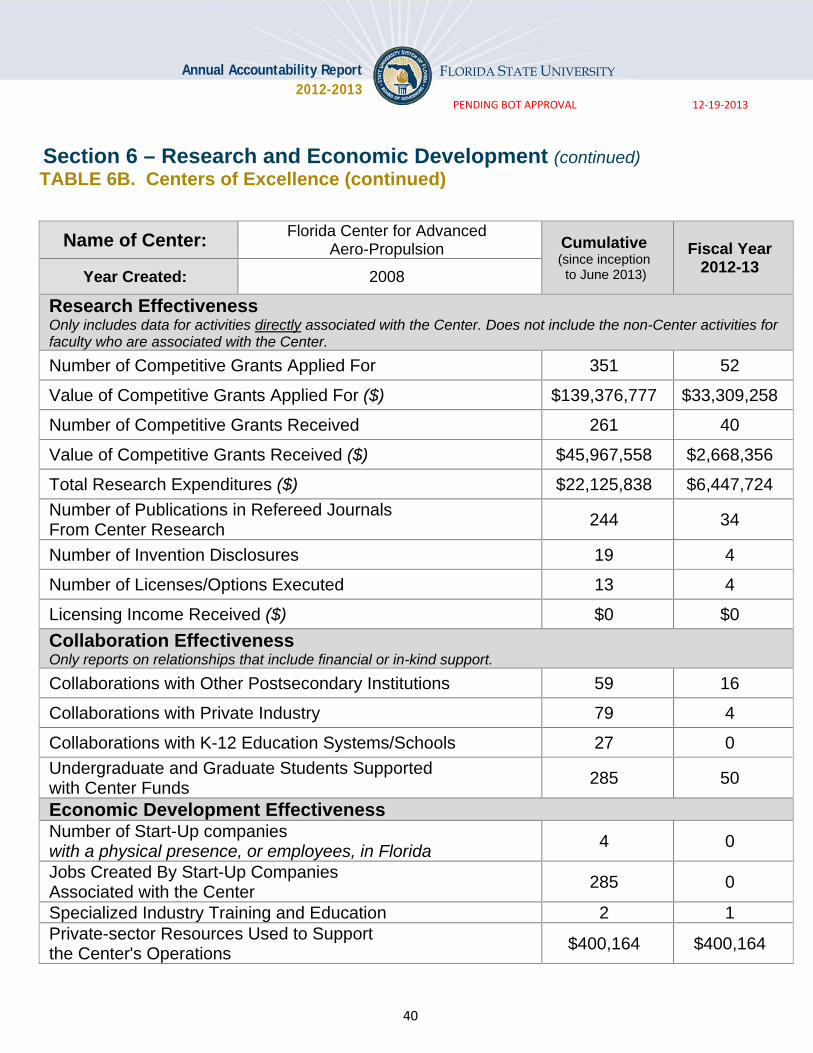
40
Annual Accountability Report 2012-2013
FLORIDA STATE UNIVERSITY
PENDING BOT APPROVAL 12‐19‐2013
Section 6 – Research and Economic Development (continued) TABLE 6B. Centers of Excellence (continued)
Name of Center: Florida Center for Advanced
Aero-Propulsion Cumulative
(since inception
to June 2013)
Fiscal Year
2012-13 Year Created: 2008
Research Effectiveness
Only includes data for activities directly associated with the Center. Does not include the non-Center activities for faculty who are associated with the Center.
Number of Competitive Grants Applied For 351 52
Value of Competitive Grants Applied For ($) $139,376,777 $33,309,258
Number of Competitive Grants Received 261 40
Value of Competitive Grants Received ($) $45,967,558 $2,668,356
Total Research Expenditures ($) $22,125,838 $6,447,724
Number of Publications in Refereed Journals From Center Research
244 34
Number of Invention Disclosures 19 4
Number of Licenses/Options Executed 13 4
Licensing Income Received ($) $0 $0
Collaboration Effectiveness
Only reports on relationships that include financial or in-kind support.
Collaborations with Other Postsecondary Institutions 59 16
Collaborations with Private Industry 79 4
Collaborations with K-12 Education Systems/Schools 27 0
Undergraduate and Graduate Students Supported with Center Funds
285 50
Economic Development Effectiveness
Number of Start-Up companies with a physical presence, or employees, in Florida
4 0
Jobs Created By Start-Up Companies Associated with the Center
285 0
Specialized Industry Training and Education 2 1 Private-sector Resources Used to Support the Center's Operations
$400,164 $400,164
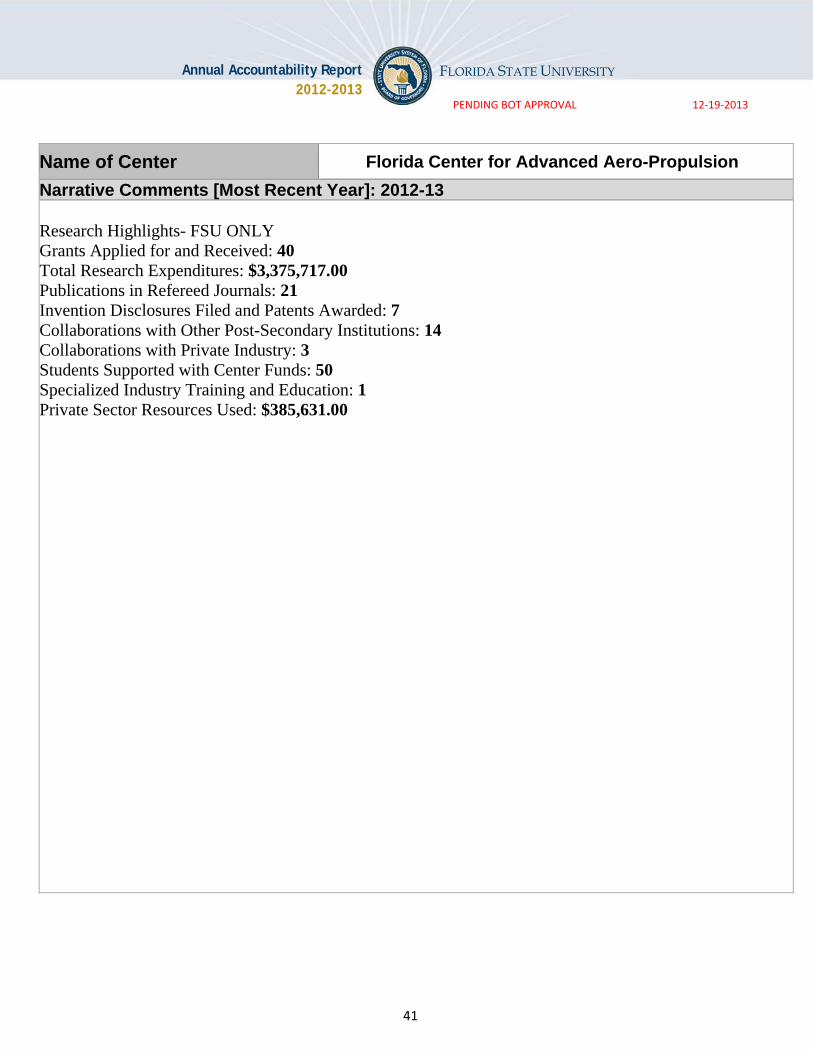
41
Annual Accountability Report 2012-2013
FLORIDA STATE UNIVERSITY
PENDING BOT APPROVAL 12‐19‐2013
Name of Center Florida Center for Advanced Aero-Propulsion
Narrative Comments [Most Recent Year]: 2012-13 Research Highlights- FSU ONLY Grants Applied for and Received: 40 Total Research Expenditures: $3,375,717.00 Publications in Refereed Journals: 21 Invention Disclosures Filed and Patents Awarded: 7 Collaborations with Other Post-Secondary Institutions: 14 Collaborations with Private Industry: 3 Students Supported with Center Funds: 50 Specialized Industry Training and Education: 1 Private Sector Resources Used: $385,631.00