Embed Size (px)
DESCRIPTION
Â
Citation preview

ECONOMIC VIABILITY ASSESSMENT
OF FUTURE
DEVELOPMENT IN CANTERBURY DISTRICT
Report for the consideration of
Canterbury City Council:
This document does not constitute Council Policy
Final Report
December 2012
Adams Integra
St John’s House
St John’s Street
Chichester
West Sussex
PO19 1UU
T: 01243 771304
F: 01243 779993
W: www.adamsintegra.co.uk
Canterbury City Council
Economic Viability Assessment of Future Development in Canterbury District
Ref: 121191 Page|i
C
C
o
o
n
n
t
t
e
e
n
n
t
t
s
s
Executive Summary v
1. Introduction 1
2. Methodology and Assumptions 5
Background 5
Viability in Canterbury and Strategic Housing Land Availability
Assessment 5
Developing Notional Schemes 6
Residual Land Value (RLV) Appraisal Methodology 7
Property Market and Values 11
Gross Development Value (GDV) 15
Developer’s Profit 16
Model Scenarios, Property Types, Size and Mix 17
Affordable Housing Transfer (to RP) – Method of Payment
Calculation and Type of Property Transferred 19
Indicative Site Area, Scheme Density and Resulting Residual Land
Value 21
Other Assumptions 22
Stakeholders and Consultation 25
General Notes and Caveats 26
3. Results and Related Commentary 28
Background 28
Property Values 31
Indicative Value Comparisons 33
Results Trends 35
Schemes of seven or more dwellings 35
Schemes below seven units 36
Approach to Seeking Affordable Housing Financial Contributions 37
Social Housing Grant and other Subsidy 42
Sustainable Design and Construction Standards 43
Implications of the National Planning Policy Framework (NPPF) 44
4. Conclusions & Recommendations 47
Canterbury City Council values and headlines for affordable housing
proportions 47
Canterbury City Council headlines for CIL rates 50
5. Wider Discussion 52
Canterbury City Council
Economic Viability Assessment of Future Development in Canterbury District
Ref: 121191 Page|ii
Figures
Figure 1: Simplified Example of Residual Land Valuation calculation –
Basic structure (for illustration purposes only) 9
Figure 2: Summary of Value Points Adopted (example prices
based on assumed floor areas, but also applicable
to other dwelling types and sizes) 13
Figure 3: Summary of Indicative Sums Payable by RP to
Developer for Completed Affordable Homes 20
Figure 4: New Build Range of Values 31

Canterbury City Council
Economic Viability Assessment of Future Development in Canterbury District
Ref: 121191 Page|iii
Appendices
Appendix 1 - Table of Housing Mixes.
Appendix 2 - Shows a Summary of Residual Land Value (£) Appraisals for All
Value Points; 0%, 25%, 30%, 35% and 40% Affordable Housing; 70% Social
Rent/30% Shared Ownership; CIL Level £0 at Low Density, Medium Density and
High Density. The tables show actual RLVs, RLV as a % of GDV and RLV per
hectare.
Appendix 2a - Is as per Appendix 2 but for schemes of flats only.
Appendix 2b - Is as per Appendix 2 but for schemes of houses only.
Appendix 3 - Shows a Summary of Residual Land Value (£) Appraisals for All
Value Points; 0%, 25%, 30%, 35% and 40% Affordable Housing; 70% Social
Rent/30% Shared Ownership; CIL Level £40 and £60 at Low Density, Medium
Density and High Density. The tables show actual RLVs, RLV as a % of GDV and
RLV per hectare.
Appendix 3i - Shows a Summary of Residual Land Value (£) Appraisals for All
Value Points; 0%, 25%, 30%, 35% and 40% Affordable Housing; 70% Social
Rent/30% Shared Ownership; CIL Level £80 and £100 at Low Density, Medium
Density and High Density. The tables show actual RLVs, RLV as a % of GDV and
RLV per hectare.
Appendix 3a - Is as per Appendix 3 but for schemes of flats only.
Appendix 3a-i - Is as per Appendix 3i but for schemes of flats only.
Appendix 3b - Is as per Appendix 3 but for schemes of houses only.
Appendix 3b-i - Is as per Appendix 3i but for schemes of houses only.
Appendices 4, 4i, 4ii, 4a, 4a-i, 4a-ii, 4b, 4b-i, 4b-ii - Are the same as
Appendix 3 but at Code for Sustainable Homes Level 5.
Appendices 5, 5i, 5ii, 5a, 5a-i, 5a-ii, 5b, 5b-i, 5b-ii - Are the same as
Appendix 3 but at Code for Sustainable Homes Level 6.
Appendices 6, 6i, 6ii, 6a, 6a-i, 6a-ii, 6b, 6b-i, 6b-ii - Are the same as
Appendix 3 but at Code for Sustainable Homes Level 3
Appendix 7 – Shows Commuted Sums Residual Land Value (£) Appraisals for All
Value Points.
Appendix 8 - Contains a summary of our property values and market research.
Canterbury City Council
Economic Viability Assessment of Future Development in Canterbury District
Ref: 121191 Page|iv
Appendix 9 - Details of Stakeholder Consultation.
Appendix 10 - Provides a Glossary of technical terms used throughout this
study.

Canterbury City Council
Economic Viability Assessment of Future Development in Canterbury District
Ref: 121191 Page|v
E
E
X
X
E
E
C
C
U
U
T
T
I
I
V
V
E
E
S
S
U
U
M
M
M
M
A
A
R
R
Y
Y
This summary first seeks to briefly introduce and explain the study. It then
provides a quick overview of the main study findings and goes onto outline the
key recommendations.
For detailed information on the study methodology, results and conclusions it will
be necessary to refer to the full text and appendices that follow this summary.
Background and Introduction
In the process of considering and developing its planning-led affordable housing
policies Canterbury City Council have commissioned Adams Integra to:
a) Inform the Council’s strategy for delivering sufficient new homes by
reviewing the portfolio of sites submitted under the Council’s Strategic
Housing Land Availability Assessment, and advising on the capacity of
the market to deliver housing.
b) Recommend how calibration of policy for negotiating affordable
housing can be optimised, to achieve the objectives of the Canterbury
District Housing Strategy 2012-16.
c) Provide illustrative options-based CIL charges in the form of a draft
charging schedule for housing and other types of development.
1 Government Policy at the time of publication of this work is as set out in the
National Planning Policy Framework (NPPF) (published in March 2012).
2 NPPF requires that Local Planning Authorities should set out their policy on
local standards in the Local Plan, including requirements for affordable
housing. They should assess the likely cumulative impacts on development in
their area of all existing and proposed local standards, supplementary
planning documents and policies that support the development plan, when
added to nationally required standards. In order to be appropriate, the
cumulative impact of these standards and policies should not put
implementation of the plan at serious risk, and should facilitate development
throughout the economic cycle. Evidence supporting the assessment should
be proportionate, using only appropriate available evidence.
3 NPPF states the following “Pursuing sustainable development requires careful
attention to viability and costs in plan-making and decision-taking. Plans
should be deliverable. Therefore, the sites and the scale of development
identified in the plan should not be subject to such a scale of obligations and
policy burdens that their ability to be developed viably is threatened. To
ensure viability, the costs of any requirements likely to be applied to
development, such as requirements for affordable housing, standards,
Canterbury City Council
Economic Viability Assessment of Future Development in Canterbury District
Ref: 121191 Page|vi
infrastructure contributions or other requirements should, when taking
account of the normal cost of development and mitigation, provide
competitive returns to a willing land owner and willing developer to enable the
development to be deliverable.”
4 This report recognises that when assessing Plan Viability it can only provide
high level assurance that the policies within the plan are set in a way that is
compatible with the likely economic viability. It cannot guarantee that every
development in the plan period will be viable, only that the plan policies will
be viable for the sufficient number of sites upon which the plan relies in order
to fulfil its objectively assessed needs.
5 The role of an assessment is to inform the decisions made by local elected
members to enable them to make decisions that will provide for the delivery
of the development upon which the plan is reliant.
6 This study is considered to be fully compatible with the NPPF in the context of
building the evidence base for, and considering the affordable housing content
of, the Core Strategy. It is to be considered as part of, and alongside, the
Council’s developing wider evidence base, including information on the local
housing market and housing needs, and information on the range of site sizes
and types which are likely to come forward. We are aware of the new LGA
guidance on Viability Testing for Local Plans, and the emerging Kent Planning
Officers Group Methodology and consider that this report is broadly
compatible with them.
7 The main objectives of this study are:
A District-wide affordable housing viability assessment for housing delivery
over the lifetime of the Core Strategy.
A viability assessment which supports the affordable housing requirements
that will be set out as policy in the emerging Core Strategy and other
documents that will form part of the Local Plan.
An assessment of potential development scenarios of sites that reflect
viability in the District overall, in terms of scope to deliver the affordable
housing requirements.
An Economic Viability Assessment that takes account of different potential
levels of Community Infrastructure Levy (CIL).
Consideration of specific factors that could impact significantly on the
viability of schemes including residential values, Code for Sustainable
Homes, Lifetime Homes, etc.

Canterbury City Council
Economic Viability Assessment of Future Development in Canterbury District
Ref: 121191 Page|vii
8 Maintaining the viability (in this sense meaning the financial health) of
residential development schemes is crucial to ensuring the release of sites and
thus a continued supply of housing of all types. The study addresses
affordable housing that is required to be provided within market housing
schemes and varying levels of CIL. This is through the existing established
approach of setting site size thresholds (point(s) at which affordable housing
policy is triggered) and proportions (percentages) of affordable housing to be
sought at those points and also different levels of CIL.
9 The Council is intending to seek direct provision of much of the infrastructure
required through the delivery of a series of larger development sites. The
intention is that CIL will be used primarily to fund smaller more diverse,
infrastructure schemes, such as generic transport improvements within the
City, maintenance and improvement of open spaces, etc.
10 The study is based on carrying out a large number of developer-type
appraisals. These use well-established “residual land valuation” techniques to
approximate the sums of money which will be left available for land purchase
once all the development costs, including profit requirements, are met (hence
“land residual”). The appraisals are based on a widely applied calculation
structure, common also to tools such as the Homes and Communities Agency
(HCA) Economic Appraisal Tool.
11 A plan-wide test will only ever provide evidence of policies being ‘broadly
viable’. The assumptions that need to be made in order to carry out a test at
plan level mean that any specific development site may still present a range
of challenges that render it unviable given the policies in the Local Plan, even
if those policies have passed the viability test at the plan level.
12 The basic study methodology is settled and tested, having been used in a
wide range of local authority areas for this purpose. The assumptions, detail
and particular application of calculations are varied to ensure local relevance.
We make an appropriate strategic overview, as fits the Local Plan process, in
a way that is both influenced by, and feeds back out to, the local
characteristics and approach.
13 We vary the affordable housing assumptions across the range of appraisals.
The outcomes inform our judgements on the likely suitability of various policy
positions from a viability viewpoint. Having fixed development costs and profit
requirements, we can see the impact on development viability caused by
variations to the amount and type of affordable housing and differing levels of
CIL. We can also consider the impact of variations to a wide range of other
assumptions, as the study sets out.
14 Two of the key ingredients to ensuring viable development are sufficient land
value created by a development (relative to existing or alternative use values,

Canterbury City Council
Economic Viability Assessment of Future Development in Canterbury District
Ref: 121191 Page|viii
and/or perhaps to an owner’s particular circumstances) and adequate
developer’s profit in terms of risk reward and the profile of a scheme from a
funder’s point of view. Throughout the appraisals we maintain developer’s
profit whilst reviewing the scope to create land value depending on the
affordable housing and other assumptions considered, and as those vary.
15 Affordable housing impacts on development viability mainly because it usually
provides a significantly reduced level of revenue to the developer compared
with market level sales values. Along with CIL it is viewed as a scheme cost
which is largely passed onto the landowner by way of reduced land value. Also
the Council currently expects new development proposals to achieve Code for
Sustainable Homes Level 4 and meet Code Level 6 by 2015 and we assess the
impact of Code Levels 3, 4, 5 and 6 on financial viability. It is these dynamics
that we explore through this study, in considering the implications of a wide
range of factors and costs on market residential development viability and its
ability to provide affordable housing and CIL.
16 In considering all of this, we are looking for suitable policy targets, based on
an appropriate balance between the opposing tensions of affordable housing
need levels, the CIL charging schedule and scheme viability.
Property Market Characteristics and Viability Findings
17 Before commencing work on appraisals, Adams Integra researched the local
residential property market to inform a range of appraisal assumptions, and to
help set the context for considering the outcomes. This research is included
within our Property Values Report, which is to be found at Appendix 8 to the
full study document and includes information from the Hometrack system. It
also includes a market commentary.
18 Through the run up to the study period, relatively poor property market
conditions prevailed off the back of the economic recession triggered in late
2007. Whilst during the study period we have seen more mixed signs, and
increased stability, there is still a significant degree of uncertainty around the
market owing to the continued weak economic backdrop. This market
uncertainty continues at the point of publishing this report.
19 In tune with the strategic overview needed through this study, we have
considered a broad range of open market property sales value levels (house
prices) that could relate to and drive new build housing schemes in The
Canterbury District – as may be seen with varying location and/or through
time with varying market conditions.
20 This exercise led to the formation of 5 ascending Value Points (numbered 1 to
5) in all, to describe the overall range of assumptions on values; i.e. from
£1772/m² (about £164/ft²) to £4,000/m² (about £371ft²).

Canterbury City Council
Economic Viability Assessment of Future Development in Canterbury District
Ref: 121191 Page|ix
21 Value Point 1 shows a level below that which we considered to be at the lower
end of the market in order to allow for any falls in sales prices. Value Point 5
is level above that which we found at the higher end of the market.
22 These Value Points covered the extremes of the range typically seen at the
point of the study.
23 The study acknowledges that local variations in value levels are going to be
key to site specifics, but this approach sets a background for that level of
consideration and is appropriate for strategic policy development.
24 Reviewed alongside the wide range of factors considered and also treated as
variables within the range of study assumptions (for example, including wider
planning obligations, affordable housing mix, Code for Sustainable Homes,
developers profits and land values) overall the results create a mixed picture
of development viability. This includes scenarios where typically strong local
values often produce good viability outcomes, but also where lower values
and/or increased overall burdens on schemes reduce what they are likely to
support by way of planning obligations packages.
25 We consider that in the overall context of the District - with varying values -
and assuming variable market conditions over the Local Plan period a 30%
affordable housing headline would be a sufficiently challenging and
appropriately pitched target generally. A range of other requirements needs to
be considered alongside affordable housing. Beyond this level, any target
would be potentially too ambitious in our view – given the range and direction
of wider planning obligations and other development costs. Adding to this
picture, affordable housing provision needs to be about quality and mix, and
not just numbers.
26 Our resulting focus is around a headline of 30% affordable housing, as a
target level for the majority of sites within the District. To accompany this,
and act as a balancing factor, we consider there to be important scope to firm
up on an approach which seeks affordable housing from a wider range of
schemes through lowered thresholds universally.
27 We also give support to the potential for using carefully judged financial
contributions for affordable housing as an additional enabling tool, particularly
from the very smallest schemes (fewer than 6 units) but also from other
schemes in areas where the Council may consider that a financial contribution
could be better spent to help enable the greater provision of affordable
housing across the District as a whole.
28 In addition, we explore the potential for schemes that fall in the higher value
areas such as in Canterbury and Whitstable to bear an increased proportion of
Canterbury City Council
Economic Viability Assessment of Future Development in Canterbury District
Ref: 121191 Page|x
affordable housing alongside CIL. Alongside this we recognise that schemes
that fall within Value Points 1 and 2 are on the cusp of viability margins.
Overview of Main Recommendations
The SHLAA
29 The Council commissioned the DTZ Report “Canterbury LDF Housing
Options”, which was undertaken for the draft Core Strategy, which
took a higher level approach to the marketing, viability and delivery
issues.
The actual number of units delivered, though, is dependent upon the market
(and this is an area that is difficult to comment on) and may also be
influenced by any policies that may serve to regulate the timing of release of
sites.
30 We have looked at the assessment process, the site survey process and the
assessment of whether and when sites may be developed and find it to be a
sound and robust document.
31 In our opinion the findings of the SHLAA are sound and robust and show that
there is enough land available to more than deliver the required number of
dwellings.
32 With regard to the capacity of the market to deliver these housing numbers
there is evidence of a need for new housing to be built. There is a huge
shortage of new houses nationally and this is the case in the Canterbury
District and Kent as a whole.
33 It is our professional view that the market for flats is experiencing a downturn
and the emphasis currently is on developing houses.
Affordable Housing
34 A headline affordable housing target of 30% to be provided on-site
applicable to schemes of 7 or more dwellings.
35 For schemes of between 1 and 6 inclusive units either on-site
provision or a financial contribution be sought in lieu of providing
affordable housing on-site, and that this be calculated using the
methodology outlined below and will be broadly equivalent to on-site
provision (retaining 30% affordable housing where applicable).
The suggested calculation seeks to equate the financial contribution
to the land value of the relevant dwelling plots (those that would have
been made available for on-site affordable housing).
Canterbury City Council
Economic Viability Assessment of Future Development in Canterbury District
Ref: 121191 Page|xi
It is beyond the remit of this study to comment on the planning policy scope
or wider merits of an approach to seek financial contributions towards meeting
affordable housing needs from the smallest sites, but to inform only on the
development viability aspects. There are potential practical advantages of
requesting financial contributions from the smallest sites rather than adhering
to on-site provision. There can be issues with affordability, integration,
management and the like in relation to providing affordable housing on small
sites. This policy approach could have practical merits with those issues in
mind. If those concerns are removed through the use of financial contributions
in lieu of on-site provision, then dependent on the scale of the payment being
appropriately judged there is unlikely to be a pure financial viability issue –
subject as normal to any existing/alternative use barriers and the normal
negotiation process where necessary.
In our view, the most appropriate route more generally is to look at land
value. In essence this involves calculating how much it would cost to go
elsewhere and replace the land on which the affordable housing would have
been provided on-site. This is the basis we have assumed.
We work through our calculation methodology below, which is based on a
formulaic approach to approximating the land value that needs to be replaced
elsewhere, and then allowing also for the cost of acquiring and servicing that
land. We start by taking the value of the land as if no affordable housing were
required on-site, calculated as a percentage of the market sale value of a
property. This percentage would reflect the pre-affordable housing (0%)
residual land value results, as taken from this study.
For this purpose we have applied a proportion of 20% of the relevant
property or properties Open Market Value (OMV) as the residual land figure.
This was derived from all relevant 0% affordable housing appraisals from sites
in range 2 to 100 units.
An allowance is added for acquisition and (potentially) for servicing costs that
would need to be borne in the case of replacing the land elsewhere in the
market.
In summary, the financial contribution is arrived at by the following steps:
a) Open market value (OMV) of the housing units on-site.
b) Multiply by the residual land value percentage. We have used 20%.
c) Add 15% of the result of a x b to reflect site acquisition and servicing
costs. This gives the per unit sum.
d) Apply to the relevant site number and proportion (in this case 30%).
Canterbury City Council
Economic Viability Assessment of Future Development in Canterbury District
Ref: 121191 Page|xii
Worked example to illustrate the above:
A scheme of 3 No 3-bed houses selling at £190,000 each
Total GDV = 3 x £190,000 = £570,000
x by RLV (£570,000 x 20%) = £114,000
x by 15% for fees (£114,000 x 115%) = £131,100
x 30% affordable housing requirement (£131,100 x 30%)
Financial contribution = £39,330
36 Where appropriate the Council will, in exceptional circumstances,
accept a financial contribution in lieu of providing some or all the
affordable units on-site which will be calculated as set out in the
paragraph above.
37 In areas that may be typically lower value that are shown as Value
Points 1 and 2, in our opinion it would not be appropriate to set lower
rates bearing in mind that those locations may also “host” some
higher value schemes. It is our opinion that individual schemes that
are in these lower value areas should be looked at on a scheme by
scheme basis. Where it can be shown that a residential scheme has
particular viability issues then a case should be put forward by the
developer which should then be independently assessed.
38 The cost of any scheme-specific viability assessment should be funded by the
applicant.
39 In practice, residential values patterns are not well defined. We consider that
a clear, straightforward District-wide approach would be more appropriate
than much more complicated alternatives.
40 The financial contributions approach will be a useful additional
enabling tool for the Council as part of its overall approach – especially
during periods (as at present), of uncertain grant funding (HCA or other
investment).
41 A target affordable housing tenure mix of 70% social rented: 30%
suitable intermediate tenure; not for rigid site-by-site application, but in
terms of setting the overall expectations and guiding delivery. This is
consistent with HCA guidance in recent years and concurs with the East Kent
Strategic Housing Market Assessment (2009) which also recommends that
70% of new affordable homes should be for rent and 30% shared ownership
and this has been included in the current housing strategy. It is a tenure split

Canterbury City Council
Economic Viability Assessment of Future Development in Canterbury District
Ref: 121191 Page|xiii
that has been used widely to help provide mixed communities and mixed
tenure developments.
42 In all cases the policy positions should be set out as clear targets, to
help inform land value expectations and form the basis for a continued
practical, negotiated approach.
43 Policy wording will need to acknowledge the relevance of considering
development viability on case specifics.
44 The Council will need to consider the mathematical subtleties of its
selected approach – for example, how numbers rounding and net/gross
(new dwellings numbers) application affects the working of the policy
positions, particularly for smaller sites where such factors will tend to have a
greater influence on outcomes.
45 The build costs used in the assessments assume that the flats and houses are
built to Code for Sustainable Homes Level 4.
46 The Council have asked that we also consider the impact of Code Levels 5 and
6 on financial viability.
47 Information relating to the cost of achieving the two scenarios above have
been taken from the Communities and Local Government document – “Code
for Sustainable Homes - A Cost Review” – Updated August 2011.
The findings of the report look at many different scenarios but taking average
figures and using a base level costing of Code for Sustainable Homes Level 4
the following extra over build costs should be applied to a typical 3 bed
terraced house at 85 m
2
:
i. Code Level 5 - £180/m
2
ii. Code Level 6 - £290/m
2
The effect of the above costings on viability mean that the overall percentage
can be maintained for Code Level 4. However, the increased costs associated
with Code Level 5 mean that the affordable housing requirement would need
to be reduced to an overall provision of 0% and the CIL would need to be
reduced to zero. For Code Level 6 the same would also apply due to the even
higher build costs.
We also looked at the effect of only building units to Code Level 3. The uplift
from Code Level 3 to Code Level 4 in extra over build costs would be in the
region of £88/m
2
. The decreased costs associated with Code Level 3 would
mean that the affordable housing requirement could be increased to an overall
Canterbury City Council
Economic Viability Assessment of Future Development in Canterbury District
Ref: 121191 Page|xiv
provision of 35% and the CIL could potentially be increased from £40/m
2
to
£60/m
2
.
Lifetime Homes
48 The Council currently expects 20% of affordable homes to be built to Lifetime
Home Standards. We have been asked to appraise the impact of the 20%
requirement and also the impact of constructing all affordable homes to
Lifetime Home Standards on the viability of new affordable homes. In
addition, we have been asked to appraise the impact of requiring 20% of
market housing to be built such standards.
49 There have been a number of studies into the costs and benefits of building to
the Lifetime Homes standard. These have concluded that the costs range from
£545 to £1,615 per dwelling, depending on: the experience of the home
designer and builder; the size of the dwelling (it is easier to design larger
dwellings that incorporate Lifetime Homes standards cost effectively than
smaller ones); whether Lifetime Homes design criteria were designed into
developments from the outset or whether a standard house type is modified
(it is more cost effective to incorporate the standards at the design stage
rather than modify standard designs); and any analysis of costs is a
‘snapshot' in time. The net cost of implementing Lifetime Homes will diminish
as the concept is more widely adopted and as design standards, and market
expectations, rise. The most significant factor when considering costs was
whether the home had been designed to incorporate Lifetime Homes criteria
from the outset or whether a standard design had been modified. In 1997
Sangster[1] looked at costs when incorporating the Lifetime Homes standard
from design stage and found that extra costs could be as low as £90 for a
three-bedroom, five-person social rented house, and £100 for the same size
house in the private sector. The study found that most of the Lifetime Homes
design criteria cost nothing when designed in at the beginning. The inclusion
of a downstairs toilet, with the possibility to incorporate a shower later,
incurred the highest cost. With the exception of the two-bedroom, four-person
house, the extra cost associated with the toilet was £69.
Cyril Sweett, when considering the implications of moving from EcoHomes
Very Good to the draft Code for Sustainable Homes (CfSH), concluded that
Lifetime Homes did not have a significant impact on overall project costs
because the requirements of the revised Part M of Building Regulations now
require many of the same considerations to be addressed as a matter of
course.
It is our recommendation that if the Council chose to have all new housing
built to Lifetime Homes then it would not have a significant negative impact
on scheme viability.
Canterbury City Council
Economic Viability Assessment of Future Development in Canterbury District
Ref: 121191 Page|xv
CIL Requirements
50 Rather than variation by area (locality), in carrying out the research for this
study we developed the view that the key variable characteristics associated
with different types of development require an approach that moves away
from a single CIL rate. Development type rather than locality should be the
key driver.
51 Value Points 1 and 2 produce residual land value (RLV) outcomes which show
no scope for CIL payments. In fact, in most cases the results are in
significantly negative territory indicating scenarios that are not even marginal
in terms of being potentially viable without major adjustment to assumptions.
Residential Findings
52 Value Points 3 and above begin to produce some marginal results. This
indicates primarily the level at which schemes start to become viable. The
various different residential scenarios were tested at different levels of CIL
(£40, £60, £80 and £100 per m
2
) and at each level the schemes in Value
Points 3 and above are shown to be viable at 30% affordable housing when
compared to benchmark land values.
53 The more positive outcomes shown in Value Points 3-6 could quickly be
eroded by increased cost assumptions or abnormal site issues, etc. Increased
costs or a fall in the residential values will also have an effect on viability.
54 In Value Point areas 1 and 2 developments are currently unviable whether or
not CIL is levied. The imposition of CIL will therefore not affect the prospects
of these sites being delivered. Where appropriate schemes can be looked at
on a site-specific basis and re-tested with lower proportions of affordable
housing allowing CIL contributions to be secured.
55 The Government Guidance confirms that the CIL scope should not be pushed
to the limits of viability, but Regulation 14 requires that a charging authority,
in setting CIL rates, ‘must aim to strike what appears to the charging
authority to be an appropriate balance between’ the desirability of funding
infrastructure from CIL and ‘the potential effects (taken as a whole) of the
imposition of CIL on the economic viability of development across its area’.
56 We would therefore suggest a rate of £40 per m
2
to allow an adequate
buffer for site-specific factors and recommend that the Council does not go
beyond this level in considering its draft charging schedule.
57 This relates reasonably well to the Council’s existing largely formulaic basis for
seeking and securing a range of planning obligations and contributions; most
of which may be replaced by the wide-ranging scope of CIL in covering all but
Canterbury City Council
Economic Viability Assessment of Future Development in Canterbury District
Ref: 121191 Page|xvi
very site-specific matters (affordable housing and perhaps particular site-
specific issues such as dedicated highways improvements). A small residual
allowance of £500 per dwelling has been made within our appraisals for any
matters that will not be covered by the CIL and still need to go in to a S106
agreement along with affordable housing obligations (where applicable).
58 There will be lower value schemes and localities where developments struggle
in viability terms, even without any significant CIL contribution. So far as we
can see, no lower level set for CIL could ensure the deliverability of these
schemes on a reliable basis, or make sure that some levels of CIL were always
collectable.
59 In terms of methodology, we adopted standard residual valuation approaches
to make appropriate comparisons and evaluations. However, due to the extent
and range of financial variables involved in residual valuations, they can only
ever serve as a guide. Individual site characteristics (which are unique), mean
that blanket requirements and conclusions must always be tempered by a
level of flexibility in application of policy requirements on a site by site basis.
It is therefore essential that levels of CIL allow a sufficient margin to allow for
these variations.
Sheltered Housing
60 The viability of sheltered housing is largely similar to that of general
residential as sales values reflect local market levels. However, there are two
factors which may adversely affect viability. Firstly, the rate of sale of
sheltered housing schemes is generally slower than for mainstream
residential, due to the more limited market catchments. Developers
consequently incur greater interest costs on land and build costs. Secondly,
sheltered housing schemes include a significantly higher level of communal
space to accommodate social areas and other facilities.
61 We would therefore recommend that the Council has regard to the CIL rates
for general residential and applies a rate of £40 per m
2
to sheltered housing
but is aware that, while this, together with 30% affordable, housing may both
be viable, there may be site-specific viability issues in relation to the
affordable housing element due to these special factors.
Future proofing the findings of the report over the plan period to 2028
62 The Value Points system allows us to understand viability as prices move. For
example, in a rising market the values in Value Point 3 might rise to Value
Point 4, or fall to Value Point 2 in a falling market. The Value Points table can
be kept as a reference tool for this purpose, so that in two years’ time the
Council could undertake a review of prices in the market place and see where
they sit on the table.

Canterbury City Council
Economic Viability Assessment of Future Development in Canterbury District
Ref: 121191 Page|xvii
63 This does not, of course, take into account any movement in build costs, but it
is movements in sales values that will have the greatest bearing on viability,
assuming no additional abnormals.
64 This report is a snapshot in time which based on research will inevitably
become outdated. It is our opinion that a review should be carried out in 2016
of viability to ascertain whether the market has moved significantly (either up
or down) and whether the affordable housing percentage should be adjusted.
Further reviews should be carried out in 2021 and 2026.
Executive Summary ends
Canterbury City Council
Economic Viability Assessment of Future Development in Canterbury District
Ref: 121191 Page|1
1
1
I
I
N
N
T
T
R
R
O
O
D
D
U
U
C
C
T
T
I
I
O
O
N
N
1.1 Background
1.1.1 Canterbury City Council is preparing a District-wide Local Plan. The
notional period of coverage for these documents is to 2028. The notional
period of coverage for the Local Plan will be to 2031.
1.1.2 The Regional Spatial Strategy (the South East Plan (SEP)) sets a nominal
target for East Kent that 30% of new homes should be for affordable
homes. The Core Strategy Options Report (Options Consultation
document) published in January 2010 addressed this level of provision.
1.1.3 Government has since signalled its intention to abolish the SEP and the
Council has commissioned this viability appraisal to inform the Council of
its options regarding affordable housing and CIL.
1.1.4 The Council has commissioned research from Nathaniel Lichfield &
Partners which indicates that the Council may need to make provision for
15,000 dwellings and 100,000sqm of new business floorspace by 2031.
1.1.5 The purpose of this study is therefore to contribute to a robust evidence
base to support the preparation of the Council’s Core Strategy, other Local
Plan documents and any other planning policy documents relating to
affordable housing and CIL. The study assesses the (financial) capacity of
residential development schemes in the District to deliver affordable
housing without their viability being unduly affected. This is in the context
of developing suitable affordable housing policies which aim to strike an
appropriate balance between affordable housing needs and scheme
viability, bearing in mind the need to also maintain overall housing supply.
Government Policy at the time of publication of this work is as set out in
the National Planning Policy Framework (NPPF) (published in March 2012).
The Government’s previous statement on planning for housing was
Planning Policy Statement 3 (PPS3). While this work is consistent with the
NPPF it retains where necessary contextual references to PPS3.
1.1.6 Paragraphs 173-175 of the NPPF in particular, deal with the Government’s
approach to, and key guidance to local authorities on, seeking affordable
housing through the Local Plan. Paragraph 173 is the focus of this in that
to ensure viability, the costs of any requirements likely to be applied to
development, such as requirements for affordable housing, standards,
infrastructure contributions or other requirements should, when taking
account of the normal cost of development and mitigation, provide
competitive returns to a willing landowner and willing developer to enable
the development to be deliverable.
Canterbury City Council
Economic Viability Assessment of Future Development in Canterbury District
Ref: 121191 Page|2
1.1.7 The main objectives of this study are:
A District-wide affordable housing viability assessment for housing delivery
over the lifetime of the Core Strategy DPD.
A viability assessment which supports the affordable housing requirements
that will be set out as policy in the emerging Core Strategy DPD and other
documents that will form part of the Local Plan.
An assessment of potential development scenarios of sites that reflect
viability in the District overall, in terms of scope to deliver the affordable
housing requirements.
A draft options-based CIL charging schedule for housing and other types of
development.
Consideration of specific factors that could impact significantly on the
viability of schemes including residential values, Code for Sustainable
Homes, other planning obligation costs, etc.
1.1.8 The District is located in the East Kent sub-region, sharing boundaries with
5 other local authority areas: Ashford, Swale, Shepway, Dover and
Thanet. Canterbury sits at the centre of this sub-region and its
neighbours, primarily Thanet and Dover, are at the centre of significant
regeneration activity, focused on the coastal towns and former Kent
coalfield villages. Ashford has been identified as a major Growth Area and
will be a focus of significant growth and investment.
1.1.9 Canterbury is an historic city with a national and global reputation that
outweighs its size in both geography and population. The wider Canterbury
District also boasts assets of great potential, including the coastal towns of
Whitstable and Herne Bay, numerous villages that are often of outstanding
historic quality, and a varied and beautiful countryside.
1.1.10 Any policy must balance delivery of affordable housing and planning
obligations with maintaining sufficient incentive (reasonable land value
levels) for landowners to release land – allowing developers to promote
and bring forward schemes.
1.1.11 This study explores the viability impacts from a range of policy options
relating to seeking various levels of affordable housing obligations from
new development including those set out in the Council’s 2010 Preferred
Options consultation document. The study process takes into account
property type, market value levels, tenure mix, wider planning obligations
and associated characteristics of residential development.

Canterbury City Council
Economic Viability Assessment of Future Development in Canterbury District
Ref: 121191 Page|3
1.1.12 Specifically, it investigates and assesses the likely impact on land values,
and therefore on development viability, of a range of affordable housing
policy options being considered for application to private (market sale)
residential schemes across the District. These are considered alongside the
introduction of CIL. The range of testing carried out for this study is
shown at Appendix 1 – Table of Housing Mixes.
1.1.13 In addition to looking at the provision of on-site affordable housing above
the current affordable housing threshold (i.e. provision integrated within
market housing sites), the study includes wider work to investigate the
viability of alternative approaches to reduce the threshold. This includes
the potential introduction of the collection of financial contributions in lieu
of on-site affordable housing provision on smaller sites (those below any
potential on-site threshold) or through a lower proportion of on-site
affordable housing; or possibly a combination of the two. If implemented
by the Council, the financial contributions route would be hinged around a
strategy to direct the monies collected towards funding the provision of
affordable housing on other sites, or perhaps for wider investment in
affordable housing locally. A strategy would need to be developed.
1.1.14 We use the impact of varying affordable housing requirements on Residual
Land Value (RLV) as our measure in putting forward our judgements and
guidelines. This process involves comparing the likely impact of (changes
to RLVs from) a range of potential policy options. So the study examines
the variations in approximate RLVs indicated within the District on this
basis, as we envisage policy changing, and the implications of these
variations are included in the assessment of site viability and deliverability.
1.1.15 Where possible, the study provides parameters and options for the Council
to consider for affordable housing policy development and implementation,
from a viability perspective. The Council will need to consider these
findings alongside wider policy considerations and overall priorities.
1.1.16 It must be recognised that this planning-based tool for securing affordable
housing relies on market-led processes. Throughout the study, an
emphasis is placed on the need for a practical approach to be taken by
Council, bearing in mind development viability – with an emphasis on that
particularly given the current and likely short-term market conditions. By
this we mean the Council being adaptable also to market housing scheme
needs, being prepared to negotiate and consider varying solutions and
being responsive to varying scheme types and circumstances. The various
components of a scheme will need to be considered in market, affordable
and successful integration and tenure mix terms. This will involve
considering local needs, scheme location, type, design, management,
affordability, dwelling mix, tenure, funding, numbers rounding and the like
in formulating the detail from the targets basis – so, taking a view on how
Canterbury City Council
Economic Viability Assessment of Future Development in Canterbury District
Ref: 121191 Page|4
these things come together to impact and benefit schemes, by looking at
what works best to optimise provision in the given circumstances.
1.1.17 In carrying out this assessment from the necessary strategic viewpoint, it
is assumed that there will be a variety of market conditions, including
periods of more stable economic and property market climate. By this we
mean where there is improved access to mortgage and development
finance, on appropriate terms, that will promote demand and re-stimulate
more normal levels of development activity than we have seen while
working in the Canterbury District at the present time. The same applies
to all such studies which look at affordable housing supplied through
market-led schemes.
1.1.18 The methodology and assumptions used are described in Chapter 2; the
results are discussed in Chapter 3; the CIL findings are discussed in
Chapter 4; the conclusions and recommendations are set out in Chapter 4.
Chapter 5 includes wider discussion points in relation to affordable housing
delivery. The tables, graphs and associated information referred to
throughout this study are appended to the rear of the document.

Canterbury City Council
Economic Viability Assessment of Future Development in Canterbury District
Ref: 121191 Page|5
2
2
M
M
E
E
T
T
H
H
O
O
D
D
O
O
L
L
O
O
G
G
Y
Y
A
A
N
N
D
D
A
A
S
S
S
S
U
U
M
M
P
P
T
T
I
I
O
O
N
N
S
S
2.1 Background
2.1.1 A number of factors need to be taken into account when considering
bringing schemes forward that include affordable housing. It is necessary
to determine what effect changes to affordable housing proportions,
variations to tenure mix and other development requirements or costs
may have on the value of a potential development site – and therefore
whether that site may continue to come forward given those requirements.
It is important not to consider affordable housing as the sole source of
declining development viability – as this study discusses, there are a range
of interwoven factors.
2.1.2 This study investigates residential development scenarios across a range
of scheme sizes (from 2 to 500 units in size). The scheme types are set
out in Appendix 1 – Table of Housing Mixes and reasonably reflect a range
of scheme types coming forward now and in the future, though it is
acknowledged that a strategic overview cannot and does not need to cover
the very wide range of potential scenarios that may be seen in practice.
2.1.3 The schemes modelled are notional ones chosen to reflect scenarios that
best match the various policy options to be tested and reflect a range of
scenarios relevant to ongoing housing supply in the District. At certain
scheme sizes, a range of dwelling mixes has been tested. These were
arrived at through discussion with the Council’s officers based on the
range of site types which have and are likely to come forward across the
Canterbury Council area.
2.2 Viability in Canterbury and Strategic Housing Land Availability
Assessment
2.2.1 We have analysed the SHLAA report and our findings can be found in
paragraphs 29-33 of the Executive Summary.
2.2.2 As a starting point, notional scheme information was based on a range of
types taken from the Council’s Strategic Housing Land Availability
Assessment (SHLAA) and past completions records. We note that in
assessing the achievability of sites for its SHLAA process the Council
looked at the influence of market, cost and delivery factors within its
review that was run using a wide-ranging pro-forma for the recording of
achievability ratings. They are themes that we have also continued to
consider through this strategic viability assessment, which we do as a
matter of course.
Canterbury City Council
Economic Viability Assessment of Future Development in Canterbury District
Ref: 121191 Page|6
2.3 Developing Notional Schemes
2.3.1 The scheme types were adapted and altered to enable development
viability to be tested at a range of points with reference to potential
affordable housing policy thresholds and varying dwelling mix, as part of
this strategic overview work. This meant taking features of these schemes
to inform our assumptions and the building of our notional scenarios – so
that those were informed by actual site scenarios as well. The smaller
scheme sizes enable us to test viability at potential lowered thresholds,
whereas the larger notional schemes enable us to test the impact of
varying the proportion of affordable housing on sites that already trigger
the requirement for affordable housing (i.e. developments of 15 or more
dwellings, as per the current approach).
2.3.2 The financial impact, and therefore viability, of collecting carefully judged
financial contributions in lieu of on-site affordable housing provision has
also been tested on sites of 1 to 14 dwellings. This enables us and the
Council to consider a financial contributions approach for potential
application to smaller sites within this size range, if appropriate.
2.3.3 An alternative approach to testing development viability on a strategic
basis could be to investigate the development viability with reference to
actual sites. We have chosen an approach where we have effectively
“notionalised” the sites (created site typologies) for a number of reasons
including:
Our established approach to this viability work, including the use of
notional sites/site typologies, has been tested successfully through the
former Local Plan Inquiry and current Development Plan Examination
processes.
Understandably, there can be difficulties in obtaining sensitive information
from developers and landowners in relation to actual sites. This leads to
appraisals of actual sites becoming heavily assumption-based in any
event.
The use of actual sites affects our ability to compare outcomes ‘like with
like’ to assess the impact of varying affordable housing requirements – the
key viability factor being studied. Affordable housing impacts can become
blurred with, or by, other issues which vary from one site to another when
specifics are examined in detail.
Sensitivities with reporting, information and potential effect on future
negotiations.
Site sizes may not align to studying potential threshold points.
Canterbury City Council
Economic Viability Assessment of Future Development in Canterbury District
Ref: 121191 Page|7
Ultimately, unless extensively applied and still assumption-based, an
actual sites approach does not fit well with taking a strategic overview of
the impact of potential affordable housing polices, when in fact sites vary
so much.
2.3.4 The outcomes of the appraisals based on the range of scenarios tested
provides us with a scale of results (discussed in Chapter 3 and set out in
full in the study Appendices) from which conclusions can be drawn as to
the key factors and trends relevant to the District. This leads to discussion
on how these might be considered in reviewing policy options, and then to
policy recommendations.
2.4 Residual Land Value (RLV) Appraisal Methodology
2.4.1 In order to review the impact of proposed affordable housing policy on the
range of sites appraised and across the scale of values considered for this
strategic overview, it is necessary to determine a common indicator to
ensure that comparisons are made on a like-for-like basis.
2.4.2 The key viability outcome and indicator for this study is the land value that
can be generated where there is a predetermined and fixed level of
developer profit assumed (alongside an allowance for all other
assumptions that have been included and varied in this report). The study
is not based on the notion of fixed land values with developer’s profit
varying as affordable housing or other requirements change. Land value
expectations (and how those will inevitably need to be adjusted over time
with changing markets in addition to changing planning and environmental
requirements) are central to this work and to the ongoing negotiation and
delivery processes. Local authorities and others involved in the process
must recognise that developers need to make appropriate profits, and this
work is not based on a premise that those should be eroded below
reasonable levels. This area is discussed further below, including at 2.7 –
Developer’s Profit.
2.4.3 Assuming a developer reaches the conclusion in principle that a site is
likely to be viable for development and worthy of consideration, an
appraisal is usually carried as part of fine-tuning the feasibility review and
checking what price can be justified for the site purchase.
2.4.4 In this study we have to assume that a negotiation has occurred or is
under way based on knowledge of the current development climate and
planning policy requirements as they will apply to the scheme. To inform
the review of outcomes from a range of potential policy positions (e.g.
increased/decreased affordable housing proportions and site size
thresholds), this study compares the viability results from the current

Canterbury City Council
Economic Viability Assessment of Future Development in Canterbury District
Ref: 121191 Page|8
policy requirements/approach with those likely to result from the potential
variations under consideration.
2.4.5 Ultimately, the land values under review are a product of a series of
calculations that provide a residual valuation based on both the specific
form of development a site can accommodate, and its development costs.
While the market uses a variety of approaches to appraise sites and
schemes (including comparisons between sites – which is particularly
difficult to do in a market of few transactions) in early stages of feasibility,
a more detailed approach is necessary to understand how the value/cost
relationship appears - as used in this study.
2.4.6 The simplest, most effective and widely understood way of checking site
viability in most instances is via a residual land value (RLV) appraisal (see
Appendix 10 – Glossary). We have developed our own spreadsheet tool for
this purpose. In doing so we have made what we feel are reasonable
assumptions but it must be noted that individual developers will have their
own varying approaches, and a developer might also apply a different
approach from one scheme to another.
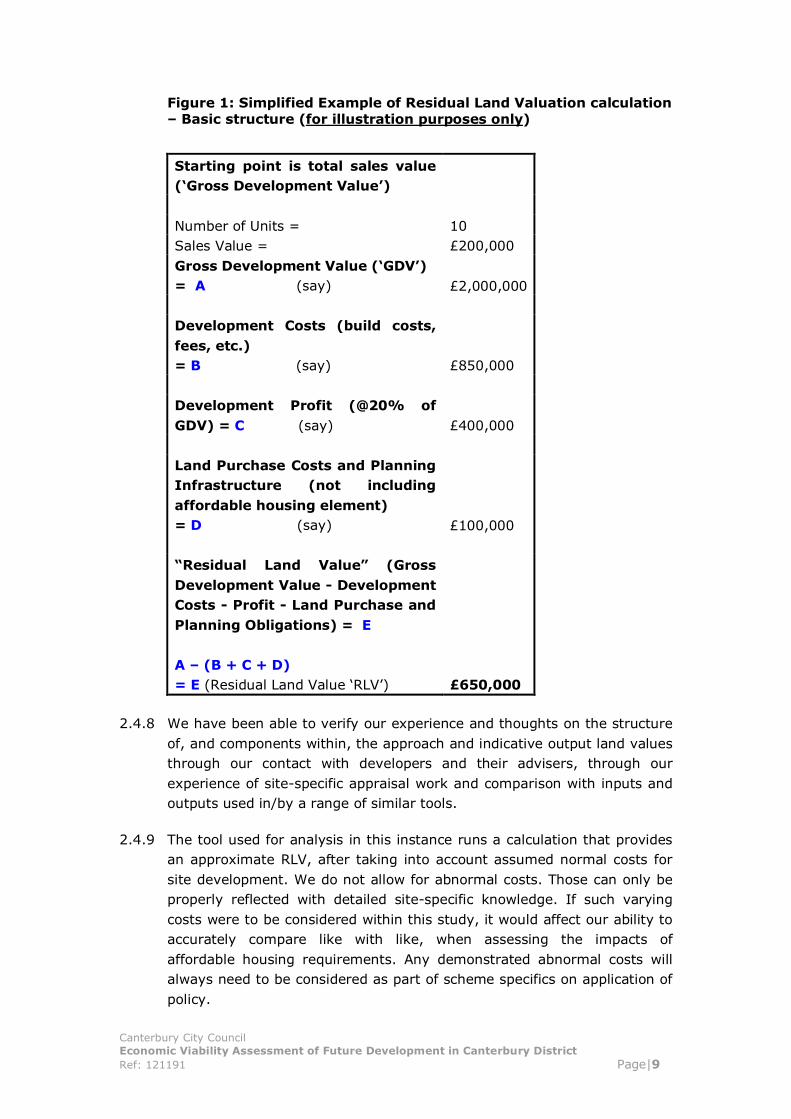
2.4.7 A highly simplified example which groups various cost elements together
and showing only the basic structure of the RLV calculation, is shown in
Figure 1 below. This is an illustrative example only and is not to be relied
upon for calculation purposes. It demonstrates, in outline only, the key
relationship between development values and costs. This is a dynamic
relationship and determines the amount left over (hence ‘residual’) for
land purchase from the total sales value (the ‘gross development value’) of
the site. It can be seen that as values increase but costs remain
unchanged, there is more scope to sustain adequate developer’s profit
levels and crucially, land values sufficient to promote the release of land
for residential development.
Canterbury City Council
Economic Viability Assessment of Future Development in Canterbury District
Ref: 121191 Page|9
Figure 1: Simplified Example of Residual Land Valuation calculation
– Basic structure (for illustration purposes only)
Starting point is total sales value
(‘Gross Development Value’)
Number of Units = 10
Sales Value = £200,000
Gross Development Value (‘GDV’)
= A (say)
£2,000,000
Development Costs (build costs,
fees, etc.)
= B (say) £850,000
Development Profit (@20% of
GDV) = C (say) £400,000
Land Purchase Costs and Planning
Infrastructure (not including
affordable housing element)
= D (say)
£100,000
“Residual Land Value” (Gross
Development Value - Development
Costs - Profit - Land Purchase and
Planning Obligations) = E
A – (B + C + D)
= E (Residual Land Value ‘RLV’) £650,000
2.4.8 We have been able to verify our experience and thoughts on the structure
of, and components within, the approach and indicative output land values
through our contact with developers and their advisers, through our
experience of site-specific appraisal work and comparison with inputs and
outputs used in/by a range of similar tools.
2.4.9 The tool used for analysis in this instance runs a calculation that provides
an approximate RLV, after taking into account assumed normal costs for
site development. We do not allow for abnormal costs. Those can only be
properly reflected with detailed site-specific knowledge. If such varying
costs were to be considered within this study, it would affect our ability to
accurately compare like with like, when assessing the impacts of
affordable housing requirements. Any demonstrated abnormal costs will
always need to be considered as part of scheme specifics on application of
policy.
Canterbury City Council
Economic Viability Assessment of Future Development in Canterbury District
Ref: 121191 Page|10
2.4.10 The inclusion of the affordable housing element of a scheme is accounted
for within this RLV calculation. This assumes that the developer receives a
payment from a Registered Provider (‘RP’) (or other affordable homes
provider) for a number of completed affordable homes provided within a
market housing development. This level of receipt is based on a
predetermined calculation that is not normally at a level comparable with
open market values. Essentially, this reduced level of revenue to the
scheme, relative to market sales receipts (sales values), is where the key
viability impact of the affordable housing comes from. The affordable
housing revenue is based on a 70/30 tenure split of social
rent/shared ownership and assumes that there will be no HCA grant
available.
2.4.11 The modelling also allows for the application of CIL at varying levels. This
study looks at a range of fixed overall costs (per m
2
) to determine the
additional impact that varying CIL costs may have on development. This
fits with the necessary strategic overview approach. We have used CIL
levels of £40 per m
2
, £60 per m
2
, £80 per m
2
and £100 per m
2
.
2.4.12 Assuming that a developer will require a minimum fixed profit margin on
any given site to balance risk and often to underpin funding arrangements,
beyond a certain point it is therefore the land value that will be affected by
the introduction of affordable housing or other infrastructure requirements
and obligations. In this sense (and although there can be positive cash
flow effects similar to those from “off-plan” sales) affordable housing is
viewed as a significant cost element within the developer’s appraisals, in
much the same way as other planning infrastructure requirements
(planning obligations). This cost impact is seen through reduced land value
(RLV) – the usual mode through which, effectively, the cost is passed on
to the landowner. This then potentially affects the point at which a
landowner will be prepared to release a site for residential development in
comparison with other options they may have.
2.4.13 The results of the appraisal calculations show the indicative residual land
values (RLVs) generated (in monetary terms), the RLVs as a percentage of
the gross development value (GDV) and the equivalent value per hectare
(£ per ha). These give us indications of the strength of those RLVs after
the various affordable housing and other assumptions are taken into
account.
2.4.14 The results are compared against a potential existing/alternative land use
values which is a key factor in determining viability outcomes. These
comparisons provide an indicator of likely scheme viability given an
overview of the RLV results from a range of appraisals and therefore help
to inform our judgements and recommendations. This aspect can only be
highly indicative at this strategic overview level. In practice every site will
have specific characteristics and its value will be determined by its type,
Canterbury City Council
Economic Viability Assessment of Future Development in Canterbury District
Ref: 121191 Page|11
location, use, economic lifespan of existing premises, marketability and
development potential, etc; and the cost of creating/realising that
potential use or maintaining an existing/alternative use. Linked to this
there can also be a level of incentive or price paid in excess of a particular
established value level whereby under some circumstances an owner may
require an additional level of incentive in order to release a site. This
scenario will be highly variable and need to be borne in mind at the site-
specific stage which sits beneath this strategic level. The setting of clear
policy by the Council will be a key part of the adjustment and appropriate
guiding of land value expectations over time.
2.4.15 Whilst briefly discussing existing/alternative use values it is worth
mentioning that the commercial property market has been suffering and
seen a greater degree of downturn, even, than the residential market as a
consequence of the financial markets crisis. Although a generalised
statement, demand for commercial property has fallen very dramatically
with severe consequences for values. This factor needs to be borne in
mind where the comparisons that are relevant are likely to change over
time and the relative positions, in viability terms, of alternative proposals
for sites could alter.
2.5 Property Market and Values
2.5.1 In determining the range of modelling to be carried out, we use a scale of
“Value Points” appropriate to the District as a whole, rather than
concentrate on the specifics of neighbourhood areas or centres (across
which values can vary greatly in any event). This fits the strategic
approach needed. It allows a more meaningful review of trends – how
viability varies with values. By taking a Value Points approach effectively
we are considering what the viability of a particular scheme or site
typology might look like if it were moved to a range of locations. The
methodology also enables us to review the impact of changing market
conditions as are likely to affect values over time. The resulting scope of
outcomes therefore means we can see what happens as we move a
particular scheme type around the District and/or expose it to varying
market demand levels as could affect its values. This ensures that the
study is appropriate to long-term policy formulation with the Value Points
providing the flexibility required to determine how viability may be
impacted by changes in residential market conditions.
2.5.2 We undertook research into property prices, across the District as a whole
in June and July 2012, to determine a realistic range of development
values (property sales values) for each of our appraisals. The research was
kept open during the study period – so that we could also consider any
further information that became available in interpreting the results.

Canterbury City Council
Economic Viability Assessment of Future Development in Canterbury District
Ref: 121191 Page|12
2.5.3 We carried out a review of the pricing of all available and “sold subject to
contract” properties (1 and 2-bed flats and 2, 3, 4 and 5-bed houses)
across the area. This was undertaken using internet searches
(www.rightmove.co.uk being the key source) and includes information
from the Hometrack system provided by Canterbury Council. This part of
the exercise helped us to understand and consider, very broadly, how
values vary with location across the District in the context of the Value
Points and whether (and if so what) particular values patterns are seen. It
enables us to provide reasonable average values for the District, and
localities within it, by dwelling type.
2.5.4 Adams Integra acknowledges that there is usually a gap between
marketing and sale price. Under recent more difficult market conditions
this gap has typically grown. It is not possible to make a statement about
the usual gap between the two, as a particular owners’ aspiration and the
saleability of particular properties clearly varies. The research has been
reviewed in the context of this, and the range of value levels assumptions
set accordingly.
2.5.5 The overall (re-sales dominated) market data was then considered
alongside our “on the ground” research. That involved visiting the area,
speaking to estate agents, visiting new build schemes, speaking to
developers’ sales staff and gathering other leads to inform supplementary
desktop research. Where little data was available at the time of the
search, the data has been verified or supplemented by using Land Registry
average sales figures and resale data. Appendix 8, the Property Values
Report, summarises the research and also provides wider regional and
national property market context.
2.5.6 The review of various sources of information on values ranges is preferred
to any single desktop resource, which would be limited to historic data and
tends to be limited in terms of information of property types and sizes.
This process of considering a wide range of values data, overall, informs
our judgements on the range of values that we apply as we conduct the
large number of appraisals.
2.5.7 The results of the property values research, and in particular the new build
values research, led to the formation of 5 Value Points (see Figure 2
below) within which new build housing values in most areas of Canterbury
Council fall. As stated above, most areas see a variety of property values
(even within the same postcode area or down to street level) therefore the
results of this research can be used independently of location where
approximate sales values can be estimated. The overall range covers
values from £1,852/m² to £4,000/ m² with the core part of the range in
the current climate being £2,000/m² to £3,400 as so represented by our
Value Points 2 to 4, as at Figure 2 below.

Canterbury City Council
Economic Viability Assessment of Future Development in Canterbury District
Ref: 121191 Page|13
Figure 2: Summary of Value Points Adopted (example prices based on
assumed floor areas, but also applicable to other dwelling types and
sizes):
Type
Area
sq m
VP1 VP2 VP3 VP4 VP5
1 bed flat 47 £108,000 £112,800 £124,550 £148,144 £165,017
2 bed flat 61 £115,000 £120,000 £140,000 £192,272 £214,171
2 bed house 70 £129,640 £135,940 £160,000 £220,640 £250,000
3 bed house 85 £157,420 £165,070 £185,000 £267,920 £300,000
4 bed house 100 £185,200 £194,200 £220,000 £340,000 £400,000
5 bed house 158 £280,000 £300,000 £340,000 £500,000 £550,000
2.5.8 It must be reiterated that any attempt to define value patterns can only be
highly indicative. This is because values can change over very short
distances dependent on a site’s location and its surroundings, local
amenities, etc. In practice, variations in values are often seen down to a
street-by-street level – and sometimes even between ends or sides of
streets, and within developments depending on the orientation of
dwellings and their outlook, for example.
2.5.9 This study does not attempt to provide comprehensive property valuation
data, but rather identifies the typical range of new build values of various
dwelling types based on the assumed sizes set out. The values research is
carried out to enable us to make judgements about the range of values of
new build properties typically available. It is not a statistical exercise and
inevitably judgements have to be made. The values used in the appraisals
are averaged across properties of varying size and type, and any
settlement could contain a range of property values covering a single
property type. We believe, however, that the information used is
reasonably representative. The key point is to consider the likely range of
typical new build values which will underpin this planning-led delivery of
affordable homes, rather than consider overall resale market Land Registry
type data alone, which can often dilute or disguise the new build market
picture.
2.5.10 Prior to, and during, the study period there has been continued reporting
at all levels of a relatively weak and uncertain property market. As at June
2012 to August 2012 (the research period) these conditions could not be
described as over. However, the long-term trend in house prices is
upwards in real terms with the “norm” for house prices to rise over time.
In the past, schemes have been brought forward and have therefore been
viable at similar or lower value levels. One of the principal concerns with
the market recently has been the volume of sales being achieved rather
than simply the value levels. Sales volume is difficult to reflect in financial
viability terms. It may affect developers’ views on risk levels, and it may
affect development and sales periods, and thus finance periods. These will,
in any event, be site-specific factors. To what extent the depressed levels
Canterbury City Council
Economic Viability Assessment of Future Development in Canterbury District
Ref: 121191 Page|14
of market activity, if prolonged, will ultimately affect value levels with time
remains to be seen.
2.5.11 This is also discussed later in the report and our market review
information is included Appendix 8. There are still wide-ranging views as
to what extent the market is stabilising overall. Examples of characteristic
features of the recent downturn have included:
Mortgage lending levels relatively low. High deposit requirements and
difficulties in obtaining funding widely experienced by prospective
purchasers.
A marked slow-down in the rate of construction of new homes – in
many cases a virtual stalling of new build progress.
Increased reports of developers pulling out of schemes, with delayed
starts or slowing scheme progress/“mothballing” sites.
Some house builders and others involved in the development industry
reducing staff numbers significantly, with some ceasing to trade. Many
house builders have been reporting reduced returns and trading
results.
Incentives being offered fairly typically on new build sites - such as
stamp duty/5% deposit paid/deferred purchase/shared
equity/mortgage payments assistance, and perhaps others –
dependent on a prospective purchaser’s position together with the
developer’s marketing experience and sale potential of particular plots,
etc.
Some use of guide pricing alone, or even no advertised pricing.
Some schemes still selling relatively well but usually with slower sales
where this is so.
Some developers considering offers from RPs for expanded affordable
housing quotas on sites, or even entire schemes for affordable.
Extended development periods in some cases, with a knock-on effect
of impacted sales progress because there is less for purchasers to see.
Purchasers far less likely to purchase off-plan given uncertainty over
values movements. This creates a circular effect with regard to build
progress on some schemes – i.e. some developers taking a view that
build progress needs to be underpinned by firmer sales interest. Others
are, however, proceeding based on prospective purchasers typically
now wanting “to see what they will get”.
Canterbury City Council
Economic Viability Assessment of Future Development in Canterbury District
Ref: 121191 Page|15
Examples of estate agents combining, closing or mothballing offices, or
operating restricted hours. Developers’ sales operations operating
reduced hours/being rationalised.
Fewer investment buyers active.
2.5.12 Despite the recent signs of a more positive market picture, it would be
premature to say that the above effects are now a thing of the past. Some
key commentators consider there to be a strong possibility of a further dip
in the market. This is because house prices have received some protection
through a lack of supply, rather than through significantly increased
confidence levels or significantly improved availability and terms of
mortgage finance. In terms of study methodology, the continued
uncertainties are very difficult to reflect in the detail, beyond considering
varying house price levels as those drive scheme viability. The economic
backdrop remains weak, with unemployment fears still apparent.
2.5.13 Clearly future values cannot be predicted, but our methodology does allow
for potential future review of results in response to changes over time,
perhaps including more established market trends or revised price levels -
as well as sale price variations through site characteristics or location. It
enables us to look more widely at the sensitivity of results to value levels.
2.5.14 In our view, it would be impractical for a local authority to move affordable
housing and perhaps other viability related planning obligations targets
through Core Strategy policy in response to relatively short-term market
conditions and adjustments.
2.5.15 A key message for local authorities in this situation is the need to monitor
the market, housing delivery outcomes and trends locally - and respond to
those through consideration of contingency measures and possible policy
review longer-term. It is also about adopting a practical and flexible
approach to secure delivery of all housing types, especially in the short-
term.
2.6 Gross Development Value (GDV)
2.6.1 In order to further explain the residual valuation principles, we will now
provide further information on the various key inputs and the implications
of those.
2.6.2 Gross Development Value (“GDV”) is the amount the developer ultimately
receives on completion or sale of the scheme, whether through open
market sales alone or a combination of open market sales and the receipt
from a RP for completing the affordable homes on the scheme. Thus the

Canterbury City Council
Economic Viability Assessment of Future Development in Canterbury District
Ref: 121191 Page|16
developer’s profit in each case relates to that scheme-specific sum rather
than to a base level of GDV that assumes no affordable housing. It
assumes that the developer has appraised the site and secured land in the
knowledge of, and reflecting, policy that will apply; i.e. the developer is
aware that a proportion of the receipts will be at a lower level than prior to
any affordable housing policy taking effect. This can be regarded as a
reasonable approach given established local and national policy guidance
on the provision of affordable housing.
2.7 Developer’s Profit
2.7.1 The requirement to place an increased proportion of affordable housing on
a site will inevitably reduce the sales income that a developer can
reasonably expect to receive. As this reduction will not be accompanied by
lower construction costs, the offset must be taken up in a reduced
development profit, a lower land price or a combination of the two.
2.7.2 Developer’s profit and landowner’s sale price are key considerations that
must be taken into account if residential development is to be undertaken.
2.7.3 If profit levels fall below a certain point then developers will not take the
risk of developing a site, nor in many cases will funding organisations
provide the necessary support. Equally, if the price offered by a developer
to a landowner for a site is too low, the landowner may not sell and might
instead continue with, or pursue, an existing or higher value use. There
are also intangibles, for instance some smaller sites may start out as
homes, gardens or small business premises which will not be sold unless
certain aspirations are met. Business and tax considerations, investment
values and costs, and availability and cost of replacement facilities can all
influence decisions to retain or sell sites. A mix of these factors may be
relevant in some cases.
2.7.4 Continued ready access to development finance is likely to be a particular
issue in the current market conditions which have flowed from the recent
economic recession.
2.7.5 At the time of considering the study assumptions, Adams Integra’s
experience of working with a range of developers and of reviewing
appraisals, lead us to suggest that they would need to seek a fixed profit
(margin) of approximately 20% (gross) of GDV.
2.7.6 This study therefore uses a developer’s profit-based assumption fixed at
20% of GDV. Lower and higher profit levels than those we have assumed
may well be appropriate, depending on the nature of the project and
risk/reward scenario – and in this sense also the market conditions. Some
developers will look at alternative profit criteria, for example a higher
Canterbury City Council
Economic Viability Assessment of Future Development in Canterbury District
Ref: 121191 Page|17
percentage (perhaps up to 30%) of capital employed (not of GDV).
Different profit aspirations will also be held by different types of house
building and development companies.
2.7.7 Our experience shows that particularly for smaller and lower risk schemes,
and those often carried out by smaller more local developers (or
contractor developers), a lower level of developer profit may well be an
appropriate assumption. However, given our acknowledgement of varying
profit levels, as above, we have carried out our base appraisals assuming
20% developer’s profit. In this context, development profit can be
regarded as a development cost. In reality, again there will be no
substitute for site-specific consideration of the details – as with other
assumptions that will be reviewed where viability is discussed on sites
coming forward. The assumptions used here are suitable guides and
starting points, but should not be regarded as fixed figures which will
always suit.
2.8 Model Scenarios, Property Types, Size and Mix
2.8.1 The Council required a range of scenarios to be appraised to assess the
viability of the potential approach to thresholds and proportions of
affordable housing alongside other costs that may affect the viability of
residential development (e.g. sustainable construction and design
standards, other planning obligation costs, etc).
2.8.2 In considering on-site provision of affordable homes, the scheme types
modelled range in size from 2 to 500 dwellings to allow the study to
investigate a full range of potential policy options. Information that
becomes available at a later stage will be highly variable and merit site-
specific level review in due course, usually in conjunction with other
DPDs/Area Action Plans/Development briefs or similar; as part of
reviewing and proposals with the site promoters.
2.8.3 The scenarios modelled concentrate on smaller sites, as in our experience
the most sensitive area can be around newly captured sites (which under
adopted policy provide no affordable housing contribution and therefore
which see a large “first time” viability impact if this form of policy were to
be implemented). Variations to the dwelling mix help to consider the
impact of various dwelling types on development viability, within and
between these scenarios.
2.8.4 The schemes were tested using 0% and at 25%, 30%, 35% and 40%
affordable housing. This range of testing allows us to investigate viability
related to a range of potential options for policy development around both
the proportion of affordable housing sought and the threshold position.
These options include potential lower proportions of affordable housing
Canterbury City Council
Economic Viability Assessment of Future Development in Canterbury District
Ref: 121191 Page|18
sought from smaller sites below the current 15 unit threshold - as part of a
sliding scale type approach to affordable housing policy. It is simply not
practical or economic for this type of study to appraise and consider every
conceivable policy option (combination of threshold and proportion). The
volume of results can grow very rapidly without adding very usefully to
how the study can assist policy development. Reviewing of trends is
necessary, and a degree of interpolation of results is also possible.
2.8.5 The indicative dwelling sizes used in the modelling are 47m
2
for 1-bed and
61m
2
for 2-bed flats. For 2, 3 4 and 5-bed houses we have assumed 70m
2
,
85m
2
, 100 m
2
and 158 m
2
respectively. These are gross internal areas
(GIAs). They are reasonably representative of the type of units coming
forward for smaller and average family accommodation, within the scheme
types likely to be seen most frequently providing on-site integrated
affordable housing in both Canterbury and more generally. We are aware
that the Council’s aspirations may include delivering larger homes. We also
note that new build flats for the private market may be below the unit
sizes above. On the basis of our professional opinion, experience and
wider/local research we consider our modelling would be valid for
differently sized units including larger homes. Sizes will vary from scheme
to scheme. It is always necessary to consider the size of new build
accommodation while looking at its price – hence the range of prices
expressed per square metre is the key measure used in considering the
research, working up the range of Value Points and reviewing the results
and this, therefore covers all sizes of unit.
2.8.6 This study assumes that the affordable housing mix will broadly reflect
that of the private housing and so would be transferred to an RP on a
proportional basis to the market mix (or reflect that as closely as possible,
to ensure a range of affordable dwellings coming forward as part of a
wider sustainable approach). Clearly, in practice, the exact private and
affordable housing mixes will vary from site to site, as may the
consistency between them. The intention of this study assumption was to
follow the principle that a mix of affordable housing dwelling types will be
expected wherever that is achievable rather than an assumption of only
smaller dwellings for affordable tenure. In addition, ensuring consistent
unit sizes across the scheme typologies allows us to consider the policy
impacts on viability rather than changes to unit sizes – “like for like”
comparison.
2.8.7 For details of the dwelling mix for each on-site scenario appraised see
Appendix 1 – “Table of Housing Mixes”. It is acknowledged that dwelling
mix will vary from site to site. In practice, there would be a tendency
towards developers needing to maintain the higher value units within a
scheme for private sales whilst also thinking about the relationship of the
private units to the affordable units in terms of location. These are all
Canterbury City Council
Economic Viability Assessment of Future Development in Canterbury District
Ref: 121191 Page|19
factors which in reality (and dependent on the site location and
characteristics) will affect the dwelling and tenure mix as part of the
negotiated approach.
2.9 Affordable Housing Transfer (to RP) – Method of Payment
Calculation and Type of Property Transferred
2.9.1 Officers at Canterbury City Council indicated that the payments developers
receive from RPs for the provision of completed affordable homes are
currently based on a negotiated approach between those two parties.
These are in turn driven by scheme costs and what the RP can afford to
pay based on its business planning and financial assumptions when it
considers the cashflow that will be produced by a scheme.
2.9.2 We have also considered the availability of funding in looking at viability
(in the form of Social Housing Grant (SHG). The grant funding climate is
such that grant funding is not available for Section 106 schemes that
require affordable housing as part of the planning obligations. Consultation
with local Registered Providers has confirmed a general position that the
Homes and Communities Agency are not likely to be funding the affordable
housing (Section 106) elements of developer-led schemes moving forward.
All appraisals were therefore carried out without grant as standard.
2.9.3 The likely payment that an RP would make for a social rented or unit of
intermediate tenure within this modelling was determined through making
judgements on the range of input assumptions following liaison with a
number of locally active RPs where possible. Effectively, the value that
could be paid to a developer for completed affordable homes is usually
related to the mortgage finance the RP could raise based on the rental
income stream (social rent) or capital and rental income stream (in the
case of shared ownership or similar) with management and other costs
deducted.
2.9.4 In practice, the values generated could be dependent on property size and
other factors including the RP’s own development strategies and thus
would vary from case to case when looking at site specifics. The RP may
have access to other sources of funding, such as its own resources or
recycled capital grant from stair-casing receipts, for example, but such
additional funding cannot be regarded as the norm – it is highly scheme
dependent and variable and thus has not been factored in here.
2.9.5 The figures used in the appraisals are shown in Figure 3 below for each
property type, and reflect the sums received per completed affordable
home (for both rent and shared ownership) by the developer in return for
constructing them (usually for an RP to which they are transferred):
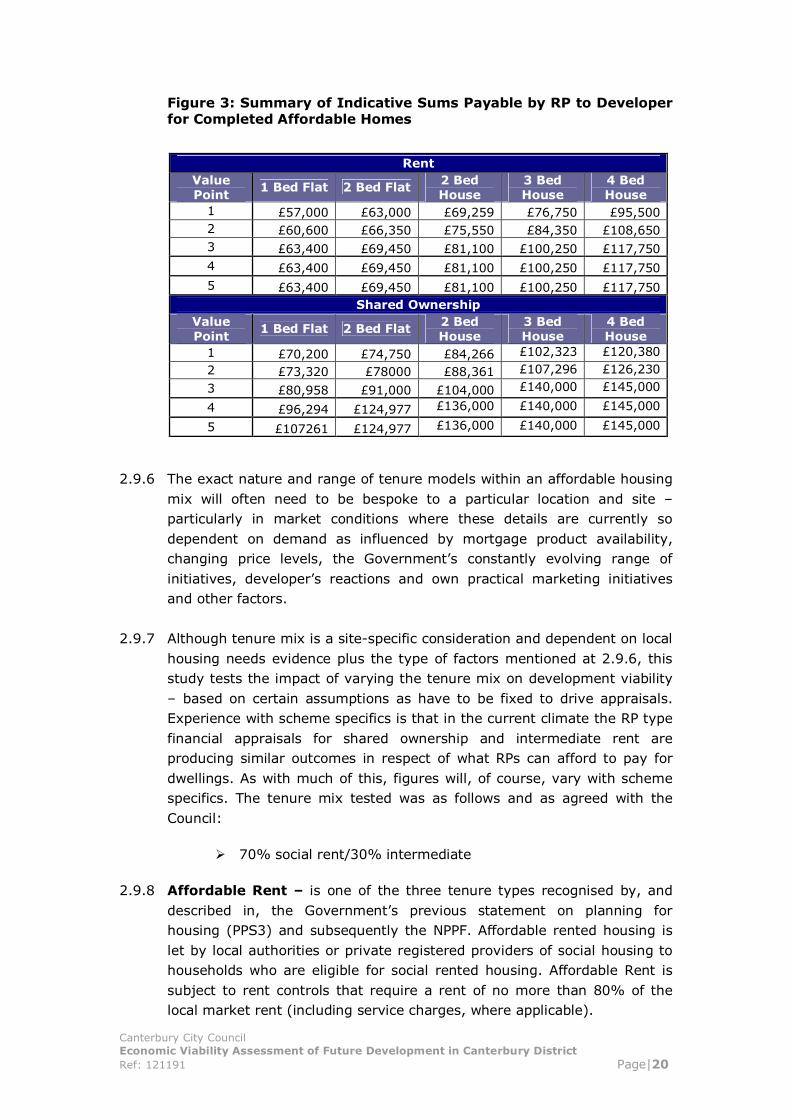
Canterbury City Council
Economic Viability Assessment of Future Development in Canterbury District
Ref: 121191 Page|20
Figure 3: Summary of Indicative Sums Payable by RP to Developer
for Completed Affordable Homes
Rent
Value
Point
1 Bed Flat 2 Bed Flat
2 Bed
House
3 Bed
House
4 Bed
House
1
£57,000 £63,000 £69,259 £76,750 £95,500
2
£60,600 £66,350 £75,550 £84,350 £108,650
3
£63,400 £69,450 £81,100 £100,250 £117,750
4
£63,400 £69,450 £81,100 £100,250 £117,750
5
£63,400 £69,450 £81,100 £100,250 £117,750
Shared Ownership
Value
Point
1 Bed Flat 2 Bed Flat
2 Bed
House
3 Bed
House
4 Bed
House
1
£70,200 £74,750 £84,266
£102,323 £120,380
2
£73,320 £78000 £88,361
£107,296 £126,230
3
£80,958 £91,000 £104,000
£140,000 £145,000
4
£96,294 £124,977
£136,000 £140,000 £145,000
5
£107261 £124,977
£136,000 £140,000 £145,000
2.9.6 The exact nature and range of tenure models within an affordable housing
mix will often need to be bespoke to a particular location and site –
particularly in market conditions where these details are currently so
dependent on demand as influenced by mortgage product availability,
changing price levels, the Government’s constantly evolving range of
initiatives, developer’s reactions and own practical marketing initiatives
and other factors.
2.9.7 Although tenure mix is a site-specific consideration and dependent on local
housing needs evidence plus the type of factors mentioned at 2.9.6, this
study tests the impact of varying the tenure mix on development viability
– based on certain assumptions as have to be fixed to drive appraisals.
Experience with scheme specifics is that in the current climate the RP type
financial appraisals for shared ownership and intermediate rent are
producing similar outcomes in respect of what RPs can afford to pay for
dwellings. As with much of this, figures will, of course, vary with scheme
specifics. The tenure mix tested was as follows and as agreed with the
Council:
70% social rent/30% intermediate
2.9.8 Affordable Rent – is one of the three tenure types recognised by, and
described in, the Government’s previous statement on planning for
housing (PPS3) and subsequently the NPPF. Affordable rented housing is
let by local authorities or private registered providers of social housing to
households who are eligible for social rented housing. Affordable Rent is
subject to rent controls that require a rent of no more than 80% of the
local market rent (including service charges, where applicable).
Canterbury City Council
Economic Viability Assessment of Future Development in Canterbury District
Ref: 121191 Page|21
2.9.9 Affordable rented housing was introduced by the coalition Government to
try to reduce down the overall grant level for affordable housing. The idea
was that there should be a general presumption that there would be no
grant on Section 106 schemes. The amount that an RP can pay a
developer for a social rented unit should be the same as for an affordable
rented unit. However, the increased rent generates more income which is
then used to supplement the overall grant requirement of the RP on their
other “non-S106 schemes”. This is then incorporated into the RPs overall
framework agreement with the HCA.
2.9.10 Affordable rent was never intended to make schemes more viable for
developers. We have therefore ignored affordable rent as a tenure in this
study as its inclusion would have no effect on the overall viability of a
scheme. For the purposes of this economic assessment report the term
affordable rent is therefore embraced within the term social rented
housing.
2.9.11 For shared ownership accommodation our calculations were based on a
50% initial capital sale with 2.5% rent paid by the purchaser on the
retained equity.
2.9.12 Although generally it is expected that housing needs will dictate a bias
towards social rent as a strategic starting point, it is acknowledged here
that there may well be local circumstances where the Council will look to
work with its partners on a different approach to tenure mix in some areas
in order to create mixed and balanced communities.
2.9.13 It should be noted that where we refer to shared ownership in this study -
and that may still be a part of specific site discussions between the Council
on intermediate tenure content, developers and RPs - other tenure options
or models may well now be relevant. The focus will increasingly be on
“intermediate tenure” in an adaptable mix alongside the priority needed
social rented accommodation. Other models, including renting at rates
discounted from market rental costs (“intermediate rent”) may well be
relevant. Those could come into play depending on local specifics such as
need, demand, funding, market factors (especially in the current climate)
and affordability. In most cases, they will produce improved cash-flows
and provide a better viability outcome, compared with social rent without
grant, and be considered as more market friendly by developers as part of
their overall view.
2.10 Indicative Site Area, Scheme Density and Resulting RLV
2.10.1 The results of all the appraisals provide us with data in both absolute value
(£) terms and as a percentage (%) of GDV. To provide broad comparisons
Canterbury City Council
Economic Viability Assessment of Future Development in Canterbury District
Ref: 121191 Page|22
with published Valuation Office Agency (VOA) sourced land value data so
as to provide an additional basis for interpretation of results, the
approximate site area (land take) and density for each development
scenario (site type and size) has been indicated.
2.10.2 Based on the unit sizes assumed in this study, this provides us with
indicative densities of between 40 and 50 dwellings per hectare (dph)
depending on the scheme type and potential location. We can then
calculate the approximate value of each scenario and appraisal variation in
indicative £ per hectare (ha) terms, to enable a comparison with other
published land value data. Again, in practice, densities will be highly
variable. Indicative site sizes are shown within the relevant tables of the
appendices.
2.11 Other Assumptions
2.11.1 The appraisals include a range of other variables that are all taken into
account when calculating an approximate RLV. This is an extensive list and
includes items such as fees, land buying costs, finance, agency costs and
varying levels of CIL.
2.11.2 In some instances these figures are factors of other elements of the
appraisal and, therefore, vary by site size and type.
2.11.3 The percentages and values assumed for the purposes of this exercise are
listed below and are the result of a Building Cost Information Service
(BCIS) overview, Adams Integra’s experience, work with and discussions
with developers, valuers, agents and others:
Base Build Costs (House Schemes) - £1,100/sq m
Base Build Costs (Flatted Schemes) - £1,270/sq m
2.11.4 The above are applied to the Net Internal Area (NIA) of the
accommodation. Base costs for flats are likely to be higher than for a
scheme of houses particularly where sites are constrained and often
difficult to work on (involving materials storage difficulties, craning, etc).
Common areas have to be allowed for, as does the degree of repetition of
costly elements. Cash-flow for flatted development can also be less
favourable as rolling sales are more difficult to deliver. In this study the
£1,270 per sq m figure assumes standard low-rise flats (typically no more
than 3 storeys and allowing standard construction techniques).
2.11.5 Build cost figures have been taken as an indicative level, supported by our
ongoing experience of scheme specifics, whilst also taking into account a
range of information from BCIS data and feedback from developers.
Canterbury City Council
Economic Viability Assessment of Future Development in Canterbury District
Ref: 121191 Page|23
2.11.6 There will always be a range of data and opinions on, and methods of
describing, build costs. In our view, we have made reasonable
assumptions which lie within the range of figures we generally see for
typical new build schemes (rather than high specification or particularly
complex schemes which might require particular construction techniques
or materials). These build costs take account of the requirement for higher
quality homes and reflect the requirements of the Code for Sustainable
Homes Level 3. As with many aspects there is no single appropriate figure
in reality, so a judgement on some form of benchmark is necessary. There
will be instances where other costs are relevant, including in overcoming
abnormal site issues or characteristics.
2.11.7 We are aware that the developer’s base build costs can be lower than our
above base cost figures, and also that the BCIS tends to indicate lower
figures. In contrast, however, there is also much said about costs being
higher than this, often in the context of RPs procuring new housing
through contractors and developers. Build costs are set out in a range of
guises, including in BCIS, whereby items such as external works costs and
fees, etc, are sometimes included, sometimes excluded. It can be difficult
to carry out reliable analysis. So a view needs to be taken, and then
monitored, tested and updated as informed by the experience of site-
specifics, negotiations and (from the affordable housing perspective) in
light of funding availability and affordability for occupants.
2.11.8 Typical scheme-specific additions to these are:
Professional fees & contingencies: 10% of build costs.
Marketing and Sales Fees: 3% of Estimated Total Sales Value
(GDV). There will be instances, dependent on the location and scheme
type, where some of this expense or an additional sum will be directed
to the setting up of a show home. This will, however, not be
appropriate on all schemes hence we have not included for it as a
standard assumption item. We would not expect it to alter the
outcomes fundamentally.
Legal Fees on Sale: £600 per unit.
Finance: 6% - on build costs, fees, etc. No finance arrangement or
related fees have been included for the purposes of this exercise. They
might in practice be applicable, but we would not expect them to alter
the viability equation fundamentally. Scheme funding arrangements
will vary greatly, dependent again on the type of developer and
scheme. As with much of this exercise, this is a snapshot and there are
varying views as to what future trends will hold, and so over time we
Canterbury City Council
Economic Viability Assessment of Future Development in Canterbury District
Ref: 121191 Page|24
would need to see how added costs balanced with changes in sales
values.
During the course of the study, the Bank of England Base Rate has
been maintained at 0.5%. On fixing our assumptions in the early study
stages we decided to leave our finance rate assumptions unchanged.
Due to the continued reduced availability of finance, we considered this
approach to be further validated and therefore to remain appropriate.
The impacts of the low Base Rate have still not been seen in any
notable way, but with further time our interest rate assumption might
begin to look high – it is not possible to tell. Nevertheless, this again
fits with looking at viability reasonably cautiously rather than stripping
out too many cost allowances from appraisals. It also fits with the
strategic view – in terms of trying to settle on assumptions reflective of
a range of potential market conditions. Our understanding is that
house-buying and development finance remains relatively difficult to
access – at least on favourable terms, related to the risks perceived by
the markets and to the fact that lending between institutions is still not
working on terms or to the extent that had underpinned the active
market in preceding years. We have had a climate recently whereby
rate reductions have tended not to be passed on, certainly not to a
significant degree, to borrowers, and where other charges
(arrangement fees, etc) have weighed against any cuts. So far as we
can see, similar applies in a commercial sense. In summary, at the
time of writing, we have no reason to believe that the commercial
lending climate has eased significantly.
Legal Fees on Land Purchase: 0.75% of land value (this will often
produce a low figure when looking at very small or low value sites but
only make a minimal difference to outcome).
Stamp Duty Land Tax: Between 0% and 5% depending on RLV.
CIL: Appraisals carried out assuming £40, £60, £80, £100, £150 and
£200 per m
2
for CIL. They are notional levels. We varied this
assumption so that we and the Council could review the sensitivity of
results to this factor – using similar thinking to the Value Points
methodology rather than looking only at a relatively narrow set of
assumptions. This was done in the context of a range of other areas
which could effectively add costs to schemes from a developer’s and
therefore landowner’s perspective.
CIL is not intended to replace site-specific consideration of planning
obligations levels.
Code for Sustainable Homes: All base appraisals assume compliance
with Level 4 of the Code for Sustainable Homes (for all dwellings –
Canterbury City Council
Economic Viability Assessment of Future Development in Canterbury District
Ref: 121191 Page|25
market and affordable). The Council also requested that the impact on
development viability of achieving CfSH Level 5 and then CfSH Level 6.
The costs of achieving those levels of the Code were based on research
for the Government’s Department for Communities and Local
Government (CLG)
1
.
Lifetime Homes - While this can affect scheme viability in a wider
sense - from the point of view of increasing building footprints and
therefore cost and, potentially, site capacity - it may not necessarily
add significant cost but instead has design implications. Interpretations
and opinions vary widely. Early design input minimises its impacts, and
costs depend on to what degree standards are applied and what other
standards are already to be met. There are overlaps, and even areas
where it can compromise or not fit well with other requirements. It is
an area that needs to be kept under review in terms of practicalities,
costs and impacts – as part of the overall expectations from schemes.
There have been a number of studies into the costs and benefits of
building to the Lifetime Homes standard. These have concluded that
the costs range from £545 to £1,615 per dwelling, depending on: the
experience of the home designer and builder; the size of the dwelling
(it is easier to design larger dwellings that incorporate Lifetime Homes
standards cost effectively than smaller ones); whether Lifetime Homes
design criteria were designed into developments from the outset or
whether a standard house type is modified (it is more cost effective to
incorporate the standards at the design stage rather than modify
standard designs); and any analysis of costs is a ‘snapshot' in time.
It is an area that needs to be kept under review in terms of
practicalities, costs and impacts – as part of the overall expectations
from schemes. The same applies to the Council’s likely approach to
wheelchair adapted housing being incorporated wherever possible
within schemes – specific needs, design implications and impacts will
need to be considered as sites come forward and planning applicants
will need to build this in to their thinking.
2.12 Stakeholders and Consultation
2.12.1 We invariably find that developers are, understandably, more often than
not reluctant to share information on their assumptions. There are
commercial sensitivities to be respected. However, as part of considering a
range of information and informing our judgements for each of our studies
we consult with a range of stakeholders including developers, landowners,
RPs and agents as a matter of course. This is done through the “on the
ground” and web-based/desktop research we have mentioned.
1
DCLG – Code for Sustainable Homes: Cost Review
Canterbury City Council
Economic Viability Assessment of Future Development in Canterbury District
Ref: 121191 Page|26
2.12.2 Adams Integra undertook not to disclose the detail of any of the responses
but these were collated and have helped to inform our progress from that
point. A sample pro-forma issued to stakeholders is shown in Appendix 9.
2.13 General Notes and Caveats
2.13.1 This study requires judgements based on the development values and
changes seen in land values as a result of varying potential policy
positions. This is in the context of seeking to guide policy development and
arrive at clear policy targets. The results cannot be a definitive guide to
how specific sites will be appraised or how outcomes on a site-specific
basis will look. As this is a relative exercise aimed at determining the likely
effect of a range of policy options, the most important factor is consistency
between assumptions used for modelling scenarios. Specific assumptions
and values applied for our schemes are unlikely to be appropriate for all
developments. The same could be said of any set of study assumptions.
We are confident, however, that our assumptions are reasonable in terms
of making this viability overview and informing policy development.
2.13.2 This study is set in the context of setting clear and realistic targets as a
basis for long-term policy but bearing in mind short-term flexibility
required to deal with the current housing market. Development viability
will vary from site to site, and there will be no substitute for the
negotiated approach to provision where necessary (e.g. sites with
abnormal costs, low sales values, etc).
2.13.3 There can be no definite viability cut-off point owing to individual
landowner’s circumstances. It is not appropriate to assume that because a
development appears to produce some land value (or in some cases value
equivalent to an existing/alternative use), the land will change hands and
the development proceed. This principle will in some cases extend to
landowners expecting or requiring the land price to reach a higher level,
perhaps even significantly above that related to an existing or alternative
land use. This might be referred to as a premium, “overbid” or sufficient
level of incentive to sell. In some specific cases, whilst weighing up overall
planning objectives to be achieved, therefore, the proposals may need to
be viewed alongside the owner’s enjoyment/use of the land, and a
potential “overbid” relative to existing use value or perhaps to an
alternative use that the site may be put to. In practice, whether and to
what extent an active market exists for an existing or alternative use will
be a key part of determining whether or how site discussions develop.
2.13.4 These factors will not always come into play or always have very
significant influences on outcomes. For instance, the market for an
existing or alternative use proposal, and therefore the value it produces,
will vary with time, location and economic conditions. They are likely to be
Canterbury City Council
Economic Viability Assessment of Future Development in Canterbury District
Ref: 121191 Page|27
highly variable as to relevance for and impact on particular schemes. In
reality, scheme-specific land values have to be considered alongside
existing or alternative use values and the latter, being very location and
planning use or business dependent, will vary significantly too.
2.13.5 To attempt to make detailed comparisons with existing or alternative uses
in this type of overview work for policy context would, in our view, have
limited meaning. We have, however, attempted to provide examples of,
and comparisons with, an alternative use value. Commercial use values in
particular are highly site-specific. Nonetheless, this study acknowledges
that the level of value created by a residential scheme after making
allowance for affordable housing and other planning obligations
requirements will need to be weighed up against any existing or
alternative use relevant to a particular site.
2.13.6 The use of notional sites/site typologies most effectively enables like-for-
like comparisons to be made, i.e. the testing of impacts of the varying
requirements on the same typical scheme in a range of value locations.
The fact that individual schemes vary makes like-for-like comparison very
difficult when studying those for this purpose of trying to measure policy
impacts, with full reliable and readily comparable information being
critical.
2.13.7 We have not definitively labelled specific locations or areas as higher/lower
value, or similar. This is because in practice we found that values can vary
from street to street and within very small areas. The Value Points
approach used in this study means that viability outcomes can effectively
be transported around the District and a feel for viability gained in relation
to relevant value levels as those might vary by location as well as by
scheme. As noted, this approach of reviewing outcomes from a range of
values also enables the consideration of viability impacts and trends as
values change with regard to market adjustments.

Canterbury City Council
Economic Viability Assessment of Future Development in Canterbury District
Ref: 121191 Page|28
3
3
R
R
E
E
S
S
U
U
L
L
T
T
S
S
A
A
N
N
D
D
R
R
E
E
L
L
A
A
T
T
E
E
D
D
C
C
O
O
M
M
M
M
E
E
N
N
T
T
A
A
R
R
Y
Y
3.1 Background
3.1.1 The residual land value (RLV) modelling carried out for this study looks at
a range of scenarios investigating the impact on development viability in
accordance with the methodology as set out in Chapter 2.
3.1.2 The number of appraisals required rises exponentially with the number of
variables investigated. This is the case with all such studies and it is
important to keep this exercise within practical limits. However, the
modelling still creates a very extensive range of results, especially once all
the variables are considered through additional layers of appraisals. These
are presented by means of a large number of tables and graphs. The
tables and graphs are all appended to the rear of this report should the
reader wish to view them. They are set out in different ways depending on
the particular impact we are seeking to investigate and visualise. The
following results Chapter aims to lift from that large volume of information
a few example results to explain the characteristics, impacts and trends of
various potential policies on development viability. The purpose here is to
help guide the reader in interpreting the results and to illustrate key points
and trends which have led to our conclusions.
3.1.3 The data is shown in tabular and graphical form and shows the indicative
RLV produced by each appraisal, those RLVs shown as a percentage of
gross development value (GDV), and the approximate land value as a
value per hectare.
3.1.4 The Appendices are set out as follows:
Appendix 1 – Table of Housing Mixes
Appendix 2, 2a and 2b
Appendix 2 shows a Summary of Residual Land Value (£) Appraisals
for All Value Points; 0%, 25%, 30%, 35% and 40% Affordable
Housing; 70% Social Rent/30% Shared Ownership; CIL Level £0 at
Low Density, Medium Density and High Density. The tables show
actual RLVs, RLV as a % of GDV and RLV per hectare. Appendix 2a
is as per Appendix 2 but for schemes of flats only. Appendix 2b is as
per Appendix 2 but for schemes of houses only
Appendix 3 shows a Summary of Residual Land Value (£) Appraisals
for All Value Points; 0%, 25%, 30%, 35% and 40% Affordable
Housing; 70% Social Rent/30% Shared Ownership; CIL Level £40
and £60 at Low Density, Medium Density and High Density. The
tables show actual RLVs, RLV as a % of GDV and RLV per hectare.

Canterbury City Council
Economic Viability Assessment of Future Development in Canterbury District
Ref: 121191 Page|29
Appendix 3i shows a Summary of Residual Land Value (£) Appraisals
for All Value Points; 0%, 25%, 30%, 35% and 40% Affordable
Housing; 70% Social Rent/30% Shared Ownership; CIL Level £80
and £100 at Low Density, Medium Density and High Density. The
tables show actual RLVs, RLV as a % of GDV and RLV per hectare.
Appendix 3a is as per Appendix 3 but for schemes of flats only.
Appendix 3a-i is as per Appendix 3i but for schemes of flats only.
Appendix 3b is as per Appendix 3 but for schemes of houses only.
Appendix 3b-i is as per Appendix 3i but for schemes of houses only.
Appendices 4, 4i, 4ii, 4a, 4a-i, 4a-ii, 4b, 4b-i, 4b-ii are the same
as Appendix 3 but at Code for Sustainable Homes Level 5.
Appendices 5, 5i, 5ii, 5a, 5a-i, 5a-ii, 5b, 5b-i, 5b-ii are the same
as Appendix 3 but at Code for Sustainable Homes Level 6.
Appendices 6, 6i, 6ii, 6a, 6a-i, 6a-ii, 6b, 6b-i, 6b-ii are the same
as Appendix 3 but at Code for Sustainable Homes Level 3.
Appendix 7 – shows Commuted Sums Residual Land Value (£)
Appraisals for All Value Points.
Appendix 8 - Contains a summary of our property values and market
research.
Appendix 9 - Details of Stakeholder Consultation.
Appendix 10 - Provides a Glossary of technical terms used
throughout this study.
3.1.5 The results appendices also summarise the RLV results across all scenarios
and site sizes showing the corresponding monetary value in pounds per
hectare (£ per ha) based on assumed indicative site areas (“land take”)
and density for each scenario. This type of data can become outdated
quickly – especially in times of fast-changing markets as we have had
recently. Such comparisons are used within this study only to help
highlight how land value varies as assumptions change, and to show very
generally the type or range of other information that the indicative RLV
results might be compared with when it comes to considering how likely a
scheme is to proceed given other valuation factors. The inclusion of this
information here seeks to help with illustrating how the value (RLV)
created by residential development proposals may look and vary relative

Canterbury City Council
Economic Viability Assessment of Future Development in Canterbury District
Ref: 121191 Page|30
to other example uses only. The key point through these indications is to
build on the emphasis that considering alternative/competing or existing
use values (and potentially additional incentive levels, as has been
discussed) will often be important in site-specific viability and thus delivery
discussions. In practice, as the study notes elsewhere, the values likely to
be attributed to various existing or potential uses of a particular site will
be highly site-specific.
3.1.6 At this strategic level overview for policy development, we are able only to
make broad comparisons. Unfortunately it is simply not possible to provide
the Council with definitive “cut-off” points where a scheme definitely would
proceed, or conversely where viability would be compromised to the
degree that development would not take place. Site specifics will influence
viability on individual sites. Adams Integra sought additional, more
Canterbury-specific, information on land values such as was available at
the time of research. The information search was also kept open during
the study period. This was done through enquiries of local agents who may
be dealing with land sales – sites for commercial and residential
developments. Desktop (web-based) searching for any information was
also carried out. Our study process involves asking agents if they have
dealt with, or are aware of, any specific land sale (or marketing)
information – or, if not, whether through their experience they can offer
any views on local land values. These are typically, but not always,
different agents from those we talk to about residential property sales.
Particularly in the current market, this extra research has typically resulted
in little additional information; however, any that was gathered as the
study progressed is included at Appendix 8.
3.1.7 There may be considerable variance between individual site circumstances
and those modelled when setting an affordable housing target. It is
therefore important that local authorities retain the flexibility that will
enable them to negotiate individual sites. There will need to be a second
stage to the viability process often prior to, or at, the planning application
stage whereby site-specific discussions are necessary – for example, in the
event of landowners or developers needing to demonstrate that affordable
housing targets, or perhaps other planning obligations, cannot be met.
The same might apply where a developer or landowner wished to explore
enhanced (in excess of target levels) or alternative provision of affordable
housing with the Council.
3.1.8 Our comments on existing and alternative use values (for example,
commercial), and how those vary greatly with site specifics, will apply
when the Council considers the viability of mixed use schemes in terms of
the affordable housing and other requirements.
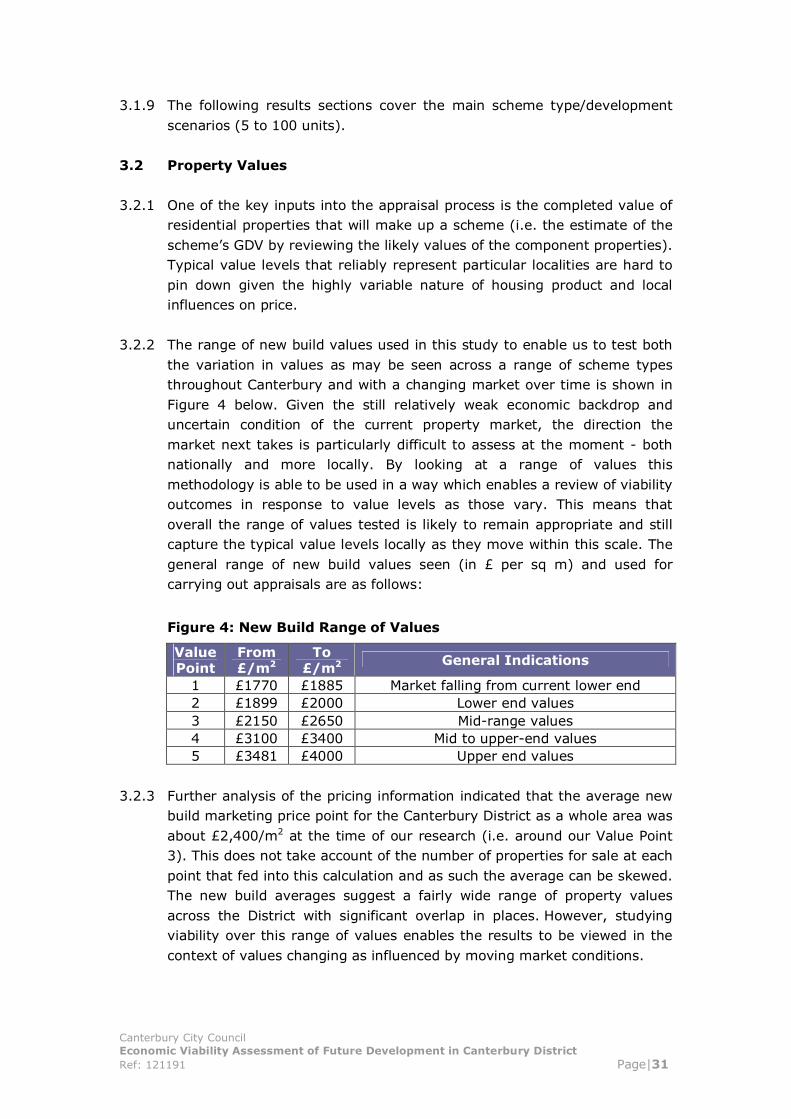
Canterbury City Council
Economic Viability Assessment of Future Development in Canterbury District
Ref: 121191 Page|31
3.1.9 The following results sections cover the main scheme type/development
scenarios (5 to 100 units).
3.2 Property Values
3.2.1 One of the key inputs into the appraisal process is the completed value of
residential properties that will make up a scheme (i.e. the estimate of the
scheme’s GDV by reviewing the likely values of the component properties).
Typical value levels that reliably represent particular localities are hard to
pin down given the highly variable nature of housing product and local
influences on price.
3.2.2 The range of new build values used in this study to enable us to test both
the variation in values as may be seen across a range of scheme types
throughout Canterbury and with a changing market over time is shown in
Figure 4 below. Given the still relatively weak economic backdrop and
uncertain condition of the current property market, the direction the
market next takes is particularly difficult to assess at the moment - both
nationally and more locally. By looking at a range of values this
methodology is able to be used in a way which enables a review of viability
outcomes in response to value levels as those vary. This means that
overall the range of values tested is likely to remain appropriate and still
capture the typical value levels locally as they move within this scale. The
general range of new build values seen (in £ per sq m) and used for
carrying out appraisals are as follows:
Figure 4: New Build Range of Values
Value
Point
From
£/m
2
To
£/m
2
General Indications
1 £1770 £1885 Market falling from current lower end
2 £1899 £2000 Lower end values
3 £2150 £2650 Mid-range values
4 £3100 £3400 Mid to upper-end values
5 £3481 £4000 Upper end values
3.2.3 Further analysis of the pricing information indicated that the average new
build marketing price point for the Canterbury District as a whole area was
about £2,400/m
2
at the time of our research (i.e. around our Value Point
3). This does not take account of the number of properties for sale at each
point that fed into this calculation and as such the average can be skewed.
The new build averages suggest a fairly wide range of property values
across the District with significant overlap in places. However, studying
viability over this range of values enables the results to be viewed in the
context of values changing as influenced by moving market conditions.
Canterbury City Council
Economic Viability Assessment of Future Development in Canterbury District
Ref: 121191 Page|32
3.2.4 It appears that, generally, values in the range of our Value Points 3 to 5
were most common. Given the condition of the current property market,
the direction the market next takes is particularly difficult to assess at the
moment - both nationally and more locally. By looking at this range of
values this methodology is able to be used in a way which enables a
review of viability outcomes in response to value levels as those vary. As
mentioned previously, Value Points 1 and 5 were modelled to allow us to
look at the impact on viability should the property market deteriorate
further or improve from the point at which this research was carried out.
This means that overall the range of values utilised is likely to remain
appropriate for, and will most likely still capture, the typical value levels
locally as they move within this scale.
3.2.5 Adams Integra’s recent research for viability studies suggests in general
that there no longer appears to be a significant premium value attached to
new build properties compared to re-sales of a comparable type (although
care needs to be adopted in analysis because data is not always on a like-
for like basis, i.e. housing types vary considerably). This is due to the
recent and ongoing lack of confidence in the housing market triggered by
the recession. There have been anecdotal reports of mortgage valuation
surveyors down-valuing new builds, and perhaps especially flats. Many
agents have indicated that new build property now has to compete directly
with resale in pricing terms. This is not always the case, however - for
example, where a scheme creates what is considered to be a new or
particularly attractive offer for a given location, something which
developers will strive for.
3.2.6 An important feature of the housing market which was triggered in
Autumn 2007, developed in 2008 and has run through to 2010 (and
appears to be universal) has been the slow-down in the rate of sales
(number of sales being agreed and proceeding). The impact of the vastly
reduced level of market activity (volume of house sales) has been to
significantly affect the level of development activity by increasing
perceptions of uncertainty and risk. It remains to be seen how this will
play out fully in terms of the financial appraisal of schemes and sites and,
as mentioned in Chapter 2, we see a range of reactions to it in terms of
profit levels sought, and other assumptions applied.
3.2.7 We feel there is no doubt that current conditions add up to a negative
financial viability impact when compared with how schemes are viewed
and pursued in a more stable, confident market. Developments in general
will be taking longer to sell (with build progress possibly slowed and costs
outstanding for longer as a result) and varying packages of incentives are
typically being offered. These factors were identified at 2.5.11 and are
recognised in Appendix 8 as well. A key point here, again, is that
affordable housing is not solely responsible for any viability difficulties –
Canterbury City Council
Economic Viability Assessment of Future Development in Canterbury District
Ref: 121191 Page|33
and it should not be regarded in that way. There is often a complex
interaction of influences.
3.3 Indicative Value Comparisons
3.3.1 As a basic premise, development is unlikely to proceed unless there is a
positive residual land value which exceeds both any existing or alternative
use value by a margin considered reasonable under prevailing market
conditions. As mentioned previously, due to highly variable potential
existing and alternative use values of sites, and in some cases particular
“overbid” or incentive requirements, it is not possible to provide the
Council with definitive “cut-off” points where viability will be compromised
to the degree that development may not take place. However, it is
possible to provide likely outcomes at varying levels. The results of this
study are reviewed with reference not only to comparisons with existing
and alternative use values but also through other indicators such as the
ratio between the gross land value and gross revenue (GDV). By way of a
basic example, a residual calculation that provides an output of zero value
(i.e. RLV of 0% of GDV) after testing a particular policy requirement
means that development on this site would not go ahead unless there was
a special business case for pursuing it. Conversely, on a site where the
RLV approaches 20% to 40% of GDV after the application of affordable
housing policy it is likely (although not definitive) that land values are
going to be high enough to absorb the impacts of the new policies. This is
obviously not always the case and very high or very low values can skew
the ratios.
3.3.2 Valuation Office statistics for industrial land in the South East
2
provided
values between £425,000 and £800,000 per ha. The VOA provides no
specific data for Canterbury but more locally industrial land values of
around £600,000 per hectare are being achieved. The VOA data has now
been updated as of January 2011 with a smaller dataset. However, it
comments that industrial land values have remained relatively static since
January 2009 across the country. We can therefore assume that those
values are still valid and for the purposes of this report, we have used the
figure as a level of comparison.
3.3.3 VOA data also suggests that agricultural land value is below £20,000 per
ha (dependent on type). Although this is true for purely agricultural land,
if the case arises in the Canterbury District that true Greenfield land comes
forward for residential development (either through site allocations policy
or other means) there is normally an associated uplift in value. While land
value expectations and payments in those cases are likely to be very much
lower than with many previously developed sites, there may well still be
2
VOA Property Market Report July 2011
Canterbury City Council
Economic Viability Assessment of Future Development in Canterbury District
Ref: 121191 Page|34
varying degrees of incentive required – taking comparative land value
situations up to perhaps £100,000-£400,000 per hectare
3
. Again, this is
necessarily purely indicative but adds a further layer or filter when
comparing the RLVs of our notional site typologies with values created by
alternative uses.
3.3.4 What this broadly indicates on a comparison basis with average data from
the VOA, is that the value of our various housing schemes (at Value Point
3 with 30% affordable housing with £40/m
2
) exceeds typical commercial
land values. At 40% affordable housing, however, we start to see the RLV
drop below the upper indicative value for industrial land. However, were
this to be a Greenfield scheme then our comparison may alter and we may
be looking to see whether the RLV generated could exceed a figure
somewhere in the range £100,000 to £400,000 per ha. In this case, at
Value Point 3 we would see those figures exceeded up to and including
40% affordable housing.
3.3.5 At Value Point 4 we would see the value of the land for all our housing
schemes exceed the range of industrial and upper end commercial use
values at all proportions of affordable housing compared to the values
shown in the VOA data.
3.3.6 We have noted that comparisons with other information such as provided
by the VOA on land values for various uses, is purely indicative. The
purpose is to reinforce the relevance of considering the issue of other land
use values, and that those might impact on what becomes of a site - or on
what a site is able to provide. The values relating to sites (whether for
existing or alternative/potential uses) will be highly specific. Where we
have been able to gather any further information or indications from
agents on land values locally, details have been added to Appendix 8 as
the study has progressed. Looking across a wide range of similar studies,
this has typically been very limited, because the feedback echoes our
points about the site-specific nature of comparisons. Recent and current
market conditions, for residential and commercial property and
development, have meant very low activity and transactions levels and
resulted in such information being hard to come by.
3.3.7 As stated previously, comparisons on this sort of basis are difficult to make
with any real certainty or confidence. Again, there will be no substitute for
consideration of site-specifics where viability issues arise, but we consider
it helpful to make some cross reference between our results and this sort
of information on land values.
3
HCA Area Wide Viability Model Annex 1 “Transparent Viability Assumptions” (August 2010)
Consultation Version suggests a benchmark of between 10 and 20 times agricultural value
Canterbury City Council
Economic Viability Assessment of Future Development in Canterbury District
Ref: 121191 Page|35
3.4 Results Trends
3.4.1 The overall trend of results shows a decrease in RLV for all site sizes and
types in all cases as:
Market property values decrease.
The proportion of affordable housing increases.
Developer’s profit is increased.
Planning obligations/infrastructure requirements are increased,
and
Other costs are added to the scheme (for example, through
increased Code for Sustainable Homes attainment, but
potentially through a wide range of matters).
3.4.2 A reduction in RLV would be seen if any of the costs within the appraisals
are increased or the affordable housing revenue to the developer reduced,
whilst maintaining the same private market sales values. These are all
normal trends encountered in any such study (or indeed site-specific
appraisal). They demonstrate the dynamic nature of the development
process and the fluid nature of any appraisal modelling that endeavours to
understand or demonstrate it.
3.4.3 The above will all have an impact on development viability because the
sums of money remaining to purchase land after all costs are met (i.e. the
RLVs) reduce as development costs increase (including increasing
affordable housing requirements, in the context of this study). The
importance of strong sales values to viability, particularly as development
costs (again including affordable housing) increase, can clearly be seen.
3.4.4 A combination that includes multiple, or all, of the factors which decrease
RLV (as per the examples listed above) will have the greatest impact on
the viability of a scenario.
3.5 Schemes of seven or more dwellings
3.5.1 The impact of affordable housing proportion on development viability has
been tested on all scheme sizes at 25%, 30%, 35% and 40%. This range
of proportions has been tested to enable us to consider options around the
Council’s proposed policy scenarios.
3.5.2 The lowest RLVs occur where the property values are lowest whilst the
affordable housing proportion, and social rented tenure content of that, is
highest. The following is based on our base appraisal assumptions. The
impact of varying tenure, varying profit, higher infrastructure costs, higher
sustainable design and construction standards are discussed later.

Canterbury City Council
Economic Viability Assessment of Future Development in Canterbury District
Ref: 121191 Page|36
3.5.3 We have looked at a variety of sites including schemes with a mix of flats
and houses, flats only and houses only. The density of these schemes has
also been varied depending on the type. In the examples below we have
shown the results at a medium density for the area.
3.5.4 Given the development cost levels and base assumptions as set out
previously, at Value Point 1 and 2 there is little or no residual land value
(RLV) generated on most of the schemes appraised except where we look
at 0% affordable housing, and occasionally with low proportions of
affordable housing (also see Appendices for full results). This means
essentially that, on this basis, there is insufficient value in schemes to
overcome their costs whilst still creating sufficient development profit and
a meaningful land value. As such, it would not be practical to expect such
schemes to deliver affordable housing in any substantial proportions based
on these assumptions, unless they were promoted on inherently low value
sites – or where land did not have to be purchased (e.g. Council/public-
owned land).
3.5.5 By Value Point 3, we start to see residual land values generated that could
exceed industrial/commercial alternative use values and still provide an
element of affordable housing.
3.5.6 By Value Point 4 much stronger RLVs are generated more often. In all
cases we see that with 30% affordable housing, all alternative use values
are exceeded, often significantly so. At 40% affordable housing this
becomes more marginal in relation to alternative industrial/commercial
values at Value Point 4.
3.5.7 By Value Point 5 at the upper end of the range of values most regularly
seen locally, the indicative land values generated by our appraisals reach
levels likely to be in excess of most potential existing/alternative use
values where there is a requirement for 40% affordable housing.
3.5.8 As with all study locations, there will be variations within, and exceptions
to, these types of trends.
3.6 Schemes below seven units
3.6.1 The overall impact of a range of potential affordable housing policies also
needs to be judged with reference to the scheme size (principally number
of dwellings) at which policy requirements could take effect. These scheme
sizes, or trigger points for policy, are known as thresholds.
3.6.2 The wider evidence beyond this study points to lowered thresholds being
necessary and justified to optimise progress towards meeting affordable
housing needs. In the past, small sites have played a major part in
Canterbury City Council
Economic Viability Assessment of Future Development in Canterbury District
Ref: 121191 Page|37
housing supply in Canterbury with a large amount of housing delivery from
sites that do not qualify to make affordable housing contributions (<15).
3.6.3 The study brief therefore extended to cover wider potential options
including the review of a lowered or no threshold (i.e. where a wider range
of smaller sites, or perhaps all sites, would contribute in some way
towards meeting affordable housing needs).
3.6.4 To reflect schemes of fewer dwellings, i.e. falling outside the scope of the
current approach, schemes of 2 units and 5 units were tested with 0%
affordable housing on those smaller sites.
3.6.5 The results show that at Value Point 3 the RLV per hectare easily exceed
the industrial/commercial values.
3.6.6 It also shows that the range of RLVs as a % of GDV is between 20 and
25%
3.6.7 These results show that scheme size is not a determinant of viability in
itself. This is a consistent finding common to all of our studies. There is
nothing within the appraisal maths which suggests that smaller or larger
sites tend to be any more or less viable than each other. It really does
come down to site specifics – the nature of sites and the proposals for
them relative to existing use, specific costs, etc, all as discussed.
3.6.8 On a scheme that would already be “captured” by the policy scope (i.e. 15
or more dwellings or 0.5ha) it must be assumed that there has been, and
is already, a land value expectation adjustment in process. In other words,
there is a growing acceptance more generally of the affordable housing
requirements which affect those sites already within policy scope, and of
the need for those to be factored in to early stages scheme discussions.
3.6.9 However, for sites falling beneath current policy scope, this is not the case
(that expectation has not been in place). We do envisage, therefore, that
there will be many cases initially where the developer/landowner will not
have taken this into account and that there will be an increase in scheme-
specific viability cases being submitted.
3.7 Approach to Seeking Affordable Housing Financial Contributions
3.7.1 The Council required the study to include consideration of the collection of
financial contributions on smaller development sites. The thinking behind
this is the need to optimise overall contributions towards meeting
affordable housing needs by seeking some level of provision from the
numerous smaller sites which typically make up a significant proportion of
the authority’s housing delivery pattern.

Canterbury City Council
Economic Viability Assessment of Future Development in Canterbury District
Ref: 121191 Page|38
3.7.2 In all of our calculations for such studies we find no reason for stating that
smaller sites are more or less financially viable than larger ones. Hence
there is no viability reason why smaller sites should not make an
appropriate, carefully judged, level of contribution towards meeting
affordable housing needs.
3.7.3 The approach could reduce the inevitable abrupt step in requirements once
the on-site affordable housing threshold takes effect. While specific
thresholds are arbitrary, we consider that this type of approach could also
have the potential to respect the practicalities that can sometimes be
experienced in seeking to provide successful small developments that
incorporate on-site affordable housing.
3.7.4 This approach, if implemented, would effectively mean an effective
removal of thresholds but with financial payments being made (in lieu of
on-site affordable housing requirements) from schemes within the size
range of 1 to 6 units.
3.7.5 The range covered in this instance relates to the potential viability of
requesting financial contribution payments for affordable housing from
schemes of fewer than 7 dwellings.
3.7.6 Adams Integra’s approach to financial contributions for affordable housing
(regardless of scheme size) is set out in detail below. This is used to test
the potential for the collection of carefully judged financial contributions
from schemes below any on-site threshold. It does not preclude the use of
any other methodology or calculation.
3.7.7 At the time of writing, Adams Integra is aware that many authorities are
looking at, or pursuing, the idea of all sites making some form of
contribution. Other local authorities, particularly in the South, are
exploring the scope for, and issues with, lower thresholds and/or financial
contributions linked to smaller sites in a similar way.
3.7.8 We are asked to review these areas, in terms of viability, in many of our
studies.
3.7.9 Compared with previous national advice under Circular 6/98 and PPG3
(now rescinded), the Government’s previous statement on planning for
housing (PPS3) gave more scope for the consideration of thresholds,
related to local circumstances “where viable and practicable” and this is
continued in the NPPF.
3.7.10 Ours is by no means the definitive or only approach that could or should
be taken in the collection of financial contributions. As far as establishing
or indicating payment levels is concerned, local authorities adopt a number
Canterbury City Council
Economic Viability Assessment of Future Development in Canterbury District
Ref: 121191 Page|39
of calculation methods. In most cases it means considering a methodology
which either:
Relates to the build cost of the affordable homes, or
Relates to the land cost element – allied to a nil-cost land approach to
on site affordable housing, or
Considers the difference between the open market sale revenue and
the affordable housing revenue for the relevant homes which would
have formed the on-site quota.
3.7.11 Our suggested route is purely a mechanism to allow us to calculate a
reasonable contribution and test the impact on development viability of
collecting those sums of money in lieu of on-site affordable housing
provision. It is an approach that has been applied usefully and successfully
in negotiations, outside of the Canterbury District. We have selected it
because it relates to land value, and so shares thinking with the study
basis. In our experience this also usually makes it better understood by
landowners and developers compared with potentially complex and highly
variable affordable housing funding related mechanisms. A commuted
sums methodology based on land value links well to market reality and
processes, and should be simpler to take account of in the early stages of
site feasibility.
3.7.12 In essence, the methodology involves calculating how much it would cost,
approximately, to go off-site and replace the land on which the affordable
housing would have been provided on-site. This is the basis we have
assumed, and we allow for indicative costs associated with land purchase
and getting the site ready for development (aspects which would usually
be provided or assumed within the arrangements and calculations for on-
site affordable housing).
3.7.13 We are assuming here a straightforward payment being made by the
landowner (who may be the developer) under the terms of a Section 106
agreement in much the same way as occurs with planning obligations for
aspects such as highways/transport, open space, education, etc. The
calculation should not (and this way it does not) look at the benefit to the
developer of moving the affordable housing contribution off-site. The
Government’s previous statement on planning for housing (PPS3) requires
the contribution secured to be “of broadly equivalent value” to that which
would have been secured through on-site provision.
3.7.14 Adams Integra’s suggested route involves a formulaic approach to
approximating the land value that needs to be replaced elsewhere, and
then allowing also for the cost of acquiring and servicing that land – as
above. In practice, the Council might not look to buy another site, but
Canterbury City Council
Economic Viability Assessment of Future Development in Canterbury District
Ref: 121191 Page|40
should have a strategy for monitoring, managing, allocating and
committing these contributions. That strategy could include providing a
variety of more creative affordable housing funding assistance to other
local schemes, addressing priority needs and contributing to sustainable
communities aims - again as envisaged by NPPF.
3.7.15 The methodology used to calculate the financial contributions involves
taking a pre-affordable housing land (plot) value, calculated as a
percentage of the market sale value of a property and taking account of
other planning obligations and development cost assumptions. For this
study this percentage reflects the pre-affordable housing RLV results, as
taken from this study. We take the view that an allowance should be
added to this base sum (bearing in mind that as well as land value there
would be acquisition and (potentially) site preparation and servicing costs
to bear). We are envisaging being able to replace the land elsewhere as
the broadly equivalent benefit being secured.
3.7.16 The financial contribution is calculated via the following steps:
a. Gross development value of each house type.
b. Multiply by the RLV percentage. In Canterbury’s case, we have
used 20%, derived as per 3.7.15 above.
c. Add 15% of the result of [a x b] to reflect (as an estimate) site
acquisition and preparation/servicing costs.
d. Apply to the relevant dwelling numbers and types, and to the
equivalent affordable housing policy proportion – 30%.
3.7.17 To further illustrate the principle, the following is a worked example:
Example – Scheme of 3 x 3 bed houses
1. OMV of 3 bed house at Value Point 3 £185,000
2. Multiply by the RLV percentage (20%) £37,000
3. Add 15% on-costs £42,550
4. Apply affordable housing equivalent proportion
30% = £12,765
5. Multiply by no. of units (3)
6. Financial contribution payable £38,295
Canterbury City Council
Economic Viability Assessment of Future Development in Canterbury District
Ref: 121191 Page|41
3.7.18 The results suggest that seeking to collect financial contributions driven by
these sums in areas or instances that fall within Value Points 1 to 2 will
have a significant impact on viability – again reflective of the on-site
affordable housing results. At Value Point 3 value levels and above, RLVs
improve to the point where, with the normal caveats applying (with regard
to scheme specifics, being allied to a target approach as with on-site
provision, etc), viability should be workable subject to a negotiated
approach. So we see a similar pattern, as would be expected, to the on-
site affordable housing results.
3.7.19 Whilst, as with other results, there can be no single right answer or
definitive cut-off point. The results suggest that a 30% affordable
equivalent based financial contribution could be workable on this basis.
3.7.20 This also has to be viewed in the context of site-specifics. In pure viability
terms, similar considerations apply as with on-site situations. What one
landowner finds acceptable as a payment for their land will be different
from another. This is especially true on small sites where we could be
considering garden plots, etc. In real monetary terms, the residual value
of land may reduce to the point whereby landowners of small plots do not
feel there is sufficient recompense to sell. Equally, where existing
residential units are bought up and demolished to make way for a larger
number of units, viability issues may occur. This is due to the high value of
the existing residential properties that usually needs to be overcome
before the new development can become viable. The approach needs to
respect the market-driven basis that it would be reliant upon, not be too
rigid, and be sensitive to these factors.
3.7.21 Having set out a formulaic approach for schemes below the on-site
provision threshold, we suggest that the same basis could also be applied
for larger sites or schemes in higher value areas where (exceptionally) it is
agreed that the most appropriate solution for meeting balanced
communities and wider planning objectives is through a financial
contributions route. This would promote consistency within the overall
approach. In all cases the relevant per unit (dwelling) sums would be
apportioned depending on the scheme details and relevant affordable
housing equivalent proportion. In any event, it could play a role as an
additional tool for the Council – for example, in moving affordable housing
subsidy to support higher priority schemes, or (if a mix of on-site homes
and part contributions is applied) to cross-subsidise a reduced number of
priority needs affordable rented homes within the same scheme.
3.7.22 Policy development should include this financial contributions aspect if it is
to be pursued, so as to make clear to landowners and developers the
essence of its approach and at least on what general basis calculations
would be made. It is an area of the Council’s potential approach that may
need to be developed in further detail through a separate SPD or DPD.
Canterbury City Council
Economic Viability Assessment of Future Development in Canterbury District
Ref: 121191 Page|42
3.8 Social Housing Grant and other Subsidy
3.8.1 Given the potential viability constraints discussed so far at Value Point 1
and Value Point 2 it is likely that social housing grant or other public
subsidy will need to continue be brought into the District to support
delivery. On lower value schemes, it should be possible for the Council and
its partners to readily demonstrate the “additionality” achieved through
grant input where that is available, in accordance with the type of HCA
principles that have been applied to date.
3.8.2 We have looked generically at the intermediate tenure, since what counts
for financial viability is the level of revenue it produces for the developer.
This reflects the increased likelihood that it will be seen in varied forms
and combinations within schemes. This is purely for the purposes of fixing
assumptions and reviewing financial viability, whereby we are looking at
increased payments to the developer compared with affordable rented
tenure (particularly with no grant). It does not prevent the Council and its
range of partners from considering and perhaps trialling a range of tenure
models, or from varying the assumptions we have applied. Indeed such an
approach is to be encouraged – we expect that there will be a role for a
wider menu of tenure options.
3.8.3 Whilst (in line with the HCA’s “additionality” approach), the Council’s
starting point has to be to consider what affordable housing can be
achieved without grant, our view is that grant or some other form of
subsidy such as money raised from financial contributions is likely to have
an important role to play in balanced housing delivery locally that would
continue to include genuinely affordable housing options including
affordable (social) rented tenure or some other equivalent
package/housing offer. This may well be the case, particularly in
supporting varied and appropriate tenure provision, and perhaps especially
on lower value schemes or in other situations where viability may be more
marginal. We understand that the Council’s general approach will be to
seek a tenure mix of 70%/30%, although as a guide and starting point –
so that site-specifics will prevail. The HCA have been contacted previously
and Adams Integra were provided with the following information and
default position which reflects our understanding:
“The Homes and Communities Agency works on a basis of additionality on
s.106 sites whereby any social housing grant going into a scheme is to
purchase outcomes above and beyond those that can be delivered through
the s.106 agreement itself. The starting position is to assume no grant
goes into an s.106 site as the s.106 itself should be securing affordable
housing outcomes. Grant input would then be required to improve the
affordable housing outputs (e.g. secure a greater percentage of social
rented homes).”

Canterbury City Council
Economic Viability Assessment of Future Development in Canterbury District
Ref: 121191 Page|43
3.8.4 The levels of local needs still point towards a significant bias to social
rented tenure as a target position, or to an alternative offer/package of
measures which continues to offer an equivalent level of affordability.
3.8.5 In our experience, an approximately balanced affordable tenure mix (e.g.
approximately equal proportions of affordable (social/equivalent) rent and
intermediate) can be achieved with little or no grant, providing the overall
affordable housing proportions sought (and other planning obligations
requirements) are not too high. However, as above, we consider that there
is a role for grant or other subsidy which is as a result of financial
contributions.
3.9 Sustainable Design and Construction Standards
3.9.1 Further sensitivity analysis has been carried out on the impact of applying
likely additional development costs to schemes as the requirement to meet
higher sustainable construction and design criteria increases over time.
There are various interpretations of how the requirements will progress
and be laid out at a national level, but it is likely that they will be achieved
through increasing Building Regulations requirements, with the Code
potentially used as a tool or mode for achieving carbon reduction
measures and other criteria. For the purposes of this study we have used
the attainment of varying levels of the Code for Sustainable Homes as our
cost measure. All (base) appraisals have been carried out assuming that
Code Level 4 is achieved. In addition, on a sample of site types we have
also carried out appraisals that assume Code Level 5 and 6 attainment.
3.9.2 The sensitivity analysis has been carried out on all the schemes for all
Value Points. The tables in Appendix 4 show the impact a requirement to
meet Code for Sustainable Homes Level 5 has on RLVs when taking into
account the other base assumptions in this study.
3.9.3 The tables in Appendix 5 show the impact a requirement to meet Code for
Sustainable Homes Level 6 has on RLVs when taking into account the
other base assumptions in this study.
3.9.4 The tables in Appendix 6 show the impact a requirement to meet Code for
Sustainable Homes Level 3 has on RLVs when taking into account the
other base assumptions in this study.
3.9.5 The effect of the above on viability mean that the overall percentage can
be maintained for Code Level 4. However, the increased costs associated
with Code Level 5 mean that the affordable housing requirement would
need to be reduced to an overall provision of around 10% and for Code
Level 6 mean that the affordable housing requirement would need to be
reduced to an overall provision of 0%.
Canterbury City Council
Economic Viability Assessment of Future Development in Canterbury District
Ref: 121191 Page|44
3.9.6 Decreasing the requirement to Code for Sustainable Homes Level 3 would
have a beneficial impact on the overall viability and would be a useful tool
in negotiating with developers that had site-specific viability issues.
3.9.7 There are potentially cost savings to be made over time as the likelihood
of meeting the Code for Sustainable Homes requirements becomes
cheaper (potentially as technologies and their supply improve and cost
savings are made through future innovations in this area). We cannot
assume those and so do not build in any such savings from developments
in this area.
3.9.8 There will be a trade-off that may be required in some instances in order
to meet these requirements and still provide profitable residential
development.
3.10 Implications of the National Planning Policy Framework (NPPF)
3.10.1 This study was mainly carried out when the Government’s previous
statement on planning for housing (PPS3) was extant but following the
recent introduction of the NPPF this work has been reviewed in light of it
and remains relevant.
3.10.2 The extracts below from the NPPF outline the way in which policy and
development management decisions should take account of viability
issues. The critical phrases are outlined for emphasis.
3.10.3 Aims of NPPF - To deliver a wide choice of high quality homes, widen
opportunities for home ownership and create sustainable, inclusive and
mixed communities, Local Planning Authorities should:
Plan for a mix of housing based on current and future demographic
trends, market trends and the needs of different groups in the
community (such as, but not limited to, families with children, older
people, people with disabilities, service families and people wishing
to build their own homes),
Identify the size, type, tenure and range of housing that is required
in particular locations, reflecting local demand; and
Where they have identified that affordable housing is needed, set
policies for meeting this need on-site, unless off-site provision or a
financial contribution of broadly equivalent value can be robustly
justified (for example, to improve or make more effective use of the
existing housing stock) and the agreed approach contributes to the
objective of creating mixed and balanced communities. Such policies

Canterbury City Council
Economic Viability Assessment of Future Development in Canterbury District
Ref: 121191 Page|45
should be sufficiently flexible to take account of changing market
conditions over time.
3.10.4 SHLAA - Authorities should prepare a Strategic Housing Land Availability
Assessment to establish realistic assumptions about the availability,
suitability and the likely economic viability of land to meet the identified
need for housing over the plan period.
3.10.5 The NPPF goes on to indicate that pursuing sustainable development
requires careful attention to viability and costs in plan-making and
decision-taking. Plans should be deliverable. Therefore, the sites and the
scale of development identified in the plan should not be subject to such a
scale of obligations and policy burdens that their ability to be developed
viably is threatened. To ensure viability, the costs of any requirements
likely to be applied to development, such as requirements for affordable
housing, standards, infrastructure contributions or other requirements
should, when taking account of the normal cost of development and
mitigation, provide competitive returns to a willing landowner and willing
developer to enable the development to be deliverable.
3.10.6 The NPPF goes on to indicate that Local Planning Authorities should set out
their policy on local standards in the Local Plan, including requirements for
affordable housing. They should assess the likely cumulative impacts on
development in their area of all existing and proposed local standards,
supplementary planning documents and policies that support the
development plan, when added to nationally required standards. In order
to be appropriate, the cumulative impact of these standards and policies
should not put implementation of the plan at serious risk, and should
facilitate development throughout the economic cycle. Evidence supporting
the assessment should be proportionate, using only appropriate available
evidence.
3.10.7 CIL - Where practical, Community Infrastructure Levy charges should be
worked up and tested alongside the Local Plan. The Community
Infrastructure Levy should support and incentivise new development,
particularly by placing control over a meaningful proportion of the funds
raised with the neighbourhoods where development takes place.
3.10.8 The NPPF goes on to indicate that where safeguards are necessary to
make a particular development acceptable in planning terms (such as
environmental mitigation or compensation), the development should not
be approved if the measures required cannot be secured through
appropriate conditions or agreements. The need for such safeguards
should be clearly justified through discussions with the applicant, and the
options for keeping such costs to a minimum fully explored, so that
development is not inhibited unnecessarily.
Canterbury City Council
Economic Viability Assessment of Future Development in Canterbury District
Ref: 121191 Page|46
3.10.9 The NPPF goes on to indicate that it is equally important to ensure that
there is a reasonable prospect that planned infrastructure is deliverable in
a timely fashion. To facilitate this, it is important that Local Planning
Authorities understand District-wide development costs at the time Local
Plans are drawn up. For this reason, infrastructure and development
policies should be planned at the same time, in the Local Plan. Any
affordable housing or local standards requirements that may be applied to
development should be assessed at the plan-making stage, where
possible, and kept under review.

Canterbury City Council
Economic Viability Assessment of Future Development in Canterbury District
Ref: 121191 Page|47
4
4
C
C
O
O
N
N
C
C
L
L
U
U
S
S
I
I
O
O
N
N
S
S
&
&
R
R
E
E
C
C
O
O
M
M
M
M
E
E
N
N
D
D
A
A
T
T
I
I
O
O
N
N
S
S
4.1 Canterbury City Council values and headlines for affordable
housing proportions.
4.1.1. Typical current new build value levels in Canterbury (and to a degree,
looking ahead at a potentially improving market) are best represented by
our Value Points 2 to 5 from within the wider range we studied given the
strategic context of this work.
4.1.2 Within that part of our overall range of values assumptions, we consider
that Value Points 3 and 4 are most relevant to the District and for the
consideration of policy – not just now, but also looking ahead through
scenario testing (with the acknowledgement that it is impossible to predict
long-term market performance), but also allowing for a wide variety of
scheme and location types. As appropriate to long-term policy formulation,
the methodology employed in this study (whereby a range of value levels
(Value Points) is reviewed and appraised) ensures that the results of the
study cover not just short-term market conditions but also potential
market fluctuations.
4.1.3 It follows that the results represent a wide range of scenarios and a mixed
overall picture of scheme viability for the District, which we must be
mindful of by not underpinning our thinking and recommendations based
on new build value levels which may not be seen frequently enough in the
areas most likely to deliver significant housing numbers in the Canterbury
context.
4.1.4 The following subsection will develop this finding from the key base
appraisal results. We have explored the wider potential options for the
pitching of the headline policy in terms of higher target proportions.
4.1.5
Recommendation 1:
An appropriate headline policy target applicable to Canterbury City
Council would be to seek 30% affordable housing on sites of 7 or
more dwellings.
Aside from the positioning of the policies, we consider there to be a key
role for the Council in monitoring its local property market through
regular/ongoing information reviews, i.e. keeping familiar with local
development activity, pricing and trends; regular capturing of agents’
views, developers’ and RPs’ feedback and the like, Land Registry house
price and other indicator trends and other locally relevant information.
Canterbury City Council
Economic Viability Assessment of Future Development in Canterbury District
Ref: 121191 Page|48
4.1.6 This is the type of information we have gathered and reviewed and could
very usefully be kept “live” and topical. We feel that this would be very
beneficial in providing expanded and local context for, and links with, the
wider monitoring the Council carries out (it could also be related to local
incomes and other economic trends, housing supply data, etc). If this is
kept up-to-date, it will lead to a good base level of familiarity with values
levels and other aspects likely to be relevant for ongoing site-specific
discussions.
4.1.7 The 30% target takes account of the collective impacts on schemes with
regard to the general direction of increasing planning obligations, build
enhancements through increasing Building Regulations/Code for
Sustainable Homes, etc. This study has tested Code Level 4 standards all
the positive recommendations put forward here show the achievability of
reasonable sustainable construction standards alongside market delivery
of affordable housing.
4.1.8 In coming to this recommendation we are also bearing in mind that
affordable housing is not just about numbers, but also about dwelling
types and mix, tenure, affordability, quality and choice.
4.1.9 The above policy scope relates primarily to scenarios of 7 or more
dwellings, rather than any smaller site releases.
4.1.10 The study has also investigated the scope for the Council to consider
lowering the threshold for affordable housing contributions given the high
frequency of schemes of fewer than 7 dwellings. We consider that a
widened scope of affordable housing policy – including a greater range of,
smaller, sites - could have the potential to be a more equitable approach
overall. It is our opinion that the lowering of thresholds District-wide would
be more likely to enhance the planning-led delivery of affordable housing
than looking to increase target proportions (e.g. to 35%) in the two
typically higher Value Point areas.
4.1.11 Given the level of affordable housing need as identified within the Council’s
Strategic Housing Market Assessment (SHMA) we consider that a more
equitable overall approach could well result from a lowered threshold for
seeking affordable housing from market-led housing developments.
4.1.12 We consider that there is a range of mainly practical (integration, design,
affordability and management) and sustainability reasons pointing away
from a requirement for on-site affordable housing on developments of
fewer than 7 dwellings. Our experience with RPs is that do not like to see
less than 2 units on-site.
Canterbury City Council
Economic Viability Assessment of Future Development in Canterbury District
Ref: 121191 Page|49
Recommendation 2:
We consider it to be appropriate for the Council to lower the
affordable housing policy thresholds (retaining 30% affordable
housing) to all new housing. Unless compelling local factors and
evidence point to the workability and sustainability of potentially highly
dispersed single unit affordable homes, our view is that schemes of fewer
than 7 dwellings should not be expected to provide on-site affordable
housing as a general rule but should provide a financial contribution
as per Recommendation 3 below at an amount equivalent to 30%
affordable housing.
4.1.13 In addition to the first-time impact effect on smaller sites, we also
acknowledge the need to bear in mind that the residual land value
produced by a residential development may be increasingly marginal
compared with an existing or alternative use value (in terms of monetary
(£ sum) rather than in £/Ha value).
4.1.14 There may be various workable options open to the Council to consider for
an approach to targets and providing clarity, allied to lowered thresholds –
as per the principles/alternatives indicated in the following
recommendations:
Recommendation 3:
On sites in the range of 1-6 an alternative to on-site affordable
housing provision (for example, the use of a financial contributions
strategy) would be appropriate. Financial contributions can be related
to the exact affordable housing equivalent produced by a calculation –
numbers rounding need not affect their use.
4.1.15 Given the profile of housing needs in the District, in common with many
other areas, the Council will be obliged to seek to optimise the rented
tenure provision in the particular circumstances relevant to specific
schemes.
4.1.16 Intermediate forms of affordable tenure have the capacity to contribute to
improving scheme viability.
Recommendation 4:
The starting point for negotiation will generally be to expect 70%
social rent and 30% intermediate tenure in line with the
recommendations of the Council’s existing policy.
Canterbury City Council
Economic Viability Assessment of Future Development in Canterbury District
Ref: 121191 Page|50
4.1.17 Affordable housing tenure mix should be related to evidenced needs and
high level strategy rather than applied rigidly from site to site; much will
depend on the specific circumstances.
4.1.18 All outcomes will be dependent on site-specifics, notwithstanding the
certainty of expectations that is required alongside an appropriate balance
between affordable housing need and viability.
4.1.19 Some flexibility may well be needed on the application of affordable
housing targets particularly in the short-term (noting the ongoing market
uncertainties) and especially if the collective costs burden on schemes is to
rise significantly.
4.1.20 In all cases the policy positions should be set out as clear targets, to help
inform land value expectations and form the basis for a continued
practical, negotiated approach. Precise wording of policy is an important
aspect, particularly in relation to the terms associated with the targets. It
needs to create clarity.
Recommendation 5:
Policy should be clearly worded so as to set out genuine targets
(but not by reference to ranges, minimums or other variables) with
the approach acknowledging the role of viability and application of
flexibility where required.
4.1.21 Policy wording will need to acknowledge the relevance of considering
development viability on case specifics.
4.1.22 The cost of assessing the validity of a financial viability argument should
be borne by the developer making the application.
Recommendation 6:
Where a developer considers a site has particular viability issues
then the developer should put forward a case which will then be
subject to independent assessment to enable full consideration by
the Council. (The cost of any scheme-specific viability assessment
should be funded by the applicant).
4.2 Canterbury City Council headlines for CIL rates
4.2.1 Given CIL’s nature as a fixed tariff, it is important that the Council selects
rates that are not on the limit of viability. The Council could in principle set
a higher rate for residential schemes as the level of affordable housing
could be adjusted in the case of marginally viable schemes. However, this
approach runs the risk of frustrating one of the Council’s other key
Canterbury City Council
Economic Viability Assessment of Future Development in Canterbury District
Ref: 121191 Page|51
objectives of delivering affordable housing. Consequently, sensitive CIL
rate setting for residential schemes is vital.
4.2.2 Our core recommendations on CIL levels are summarised as follows:
4.2.3 The ability of residential schemes to make CIL contributions varies
significantly depending on size and type of scheme, area and the current
use of the site.
Recommendation 7:
Having regard to these variations, our opinion is that the majority
of residential schemes in the District should be able to absorb a
CIL rate of £40 per m
2
leaving a margin for site-specific factors
that might affect viability. We recommend the Council consider this
rate.

Canterbury City Council
Economic Viability Assessment of Future Development in Canterbury District
Ref: 121191 Page|52
5
5
W
W
I
I
D
D
E
E
R
R
D
D
I
I
S
S
C
C
U
U
S
S
S
S
I
I
O
O
N
N
5.1 The “National indicative minimum” (site size) threshold for affordable
housing is regarded as 15 dwellings, as set out by the Government’s
previous statement on planning for housing (PPS3). It goes on to say,
however, that local authorities can set lower thresholds “where viable and
practicable”. The results discussed in this study show that lower thresholds
could be considered, provided that the affordable housing target
proportion is not viewed in isolation and rigidly and this is continued in the
NPPF.
5.2 Where we have mentioned negotiation, that does not necessarily mean an
overall reduction in affordable housing – it could mean changes to the
tenure mix to provide an element of cross-subsidy into a scheme.
Similarly, there may need to be a compromise position achievable rather
than moving straight to an assumption that leaves a site contributing
nothing to affordable housing needs, but that allows the affordable
housing delivery on particular sites to react to changing viability and
funding circumstances as more certainty is created with scheme
progression.
5.3 If the policy targets cannot be met, then landowners and developers will
need to clearly demonstrate why. In our view the final judgement on
exactly where this element of the policy proposals will settle should be
based on all the factors viewed together, i.e. alongside the viability
outcomes. Included in these will be the key elements of forecasting of
increased affordable housing units delivery based on the size and number
of sites coming forward (site capture), local housing needs and practical
thinking on the consequences of having small numbers of affordable
homes distributed widely across a higher number of schemes.
5.4 Crucially, and regardless of detail, the policies should be worded in clear
terms. They should not be expressed as a minimum level of provision or
be capable of interpretation in an ambiguous way.
5.5 It is important that a flexible and negotiated approach to policy application
is adopted to ensure the continued supply of residential development land,
notwithstanding the very high priority that will be given to addressing
affordable housing need. The policy or supporting text would need to make
this flexible approach clear. The aim is to provide clear and robust targets
for guidance to developers and landowners in appraising and bringing
forward sites.
5.6 As part of providing clarity of expectations and to aid the smooth working
of the approach, the Council will need to be clear about whether any new
policy positions will be applied to the gross (total, irrespective of any
Canterbury City Council
Economic Viability Assessment of Future Development in Canterbury District
Ref: 121191 Page|53
dwellings existing prior to the scheme) number or net (i.e. deducting for
any such dwellings) number of dwellings being provided by a development
scheme.
5.7 It may be particularly relevant to clarify this in respect of the very smallest
schemes including single dwellings, replacement dwellings, conversions,
etc. In our experience, Examination Inspectors have been nervous about
gross policies universally applied – particularly to the smallest schemes,
because there can be such a significant difference in implications
compared with a net new dwellings application.
5.8 We expect that in site-specific viability discussions, where necessary, the
use of a toolkit (including but not limited to the HCA’s “Economic Appraisal
Tool” –or developer’s own workings) will be encouraged. Developers will
be encouraged to work closely with their RP partners, who will increasingly
be using that type of appraisal work to support their decisions and
approaches for social housing grant in conjunction with the Council.
5.9 The key factors influencing policy should be kept under review - including
housing affordability and needs, site supply, economic trends/housing
market and viability. Our recommendations are considered to be sound for
the current stage of policy development, which is set in a strategic
context. Their impact and the delivery resulting from them will need to be
monitored with a view to longer-term future direction.
5.10 Where the Council collects financial contributions in lieu of affordable
housing these monies may be ring-fenced and used to meet the Council’s
affordable housing objectives in partnership with RPs. The contributions
should be used to provide affordable housing locally and within a
predefined timescale (usually within 5 years). The Council will need to
record the contributions collected and where those contributions have
been allocated or spent.
5.11 The Council will expect developers and landowners to come to the table
and be prepared to explain and justify why, in any relevant cases, the
affordable housing targets and/or other planning obligations requirements
cannot be met given other demands on a scheme. The onus will be on
developers to clearly and fully demonstrate the issues, with evidence to
back-up costs associated with abnormal site complexities and the like.
5.12 It is expected that a methodology similar to one we have used will be
appropriate for this process, to explore the relationship between
development costs and values. Again, however, we reiterate that whilst
this methodology is generally accepted, and the assumptions we have
used might guide the Council on starting/indicative parameters, there will

Canterbury City Council
Economic Viability Assessment of Future Development in Canterbury District
Ref: 121191 Page|54
be no substitute for site-specific appraisal work of this type. Such work
would take into account appropriate specific assumptions.
5.13 Issues may arise on those sites which have already changed hands or are
committed through option or similar arrangements, where figures may
simply not work when set against the proposed policy requirements. In
the same way, there will be some previous planning consents capable of
implementation (where previous policy positions would have determined
requirements).
5.14 Similarly, a degree of difficulty with increasing planning-led affordable
housing supply may be experienced during the adjustment process where
there may be issues whilst developers/landowners get accustomed to the
new policies and expectations are modified.
5.15 Good practice points to bringing to life through appropriate Supplementary
Planning Documents and/or Development Plan Documents the type of
negotiated approach envisaged and supported by Government guidance.
5.16 This study has considered planning-led affordable housing in the context of
integrated provision within market-led schemes, secured through planning
obligations usually embodied in a Section 106 agreement. The Council,
along with its partners, should also continue to consider the wider routes
to affordable housing provision.
5.17 Housing Association or contractor/developer-led schemes can be
successful in significantly bolstering local provision – sometimes on lower
value, more difficult sites, for example as a part of removing non-
conforming uses from older residential areas, recycling unviable former
commercial land or making better use of existing estates.
5.18 The various supply sources of affordable housing need to be considered
and encouraged. The use and role of local authority or other publicly
owned land might also be very valuable in this sense. Affordable housing
proportions and provision details sought on any Council-owned land could
well be different to the headlines proposed in this study – using the
landowner’s right to control the bidding and disposal terms. There is also
an emerging role for local authorities as key developers of housing again.
5.19 In addition, the role of exception to policy sites and specific allocations
processes could be considered for rural affordable housing provision – as
distinct extra tools.
Canterbury City Council
Economic Viability Assessment of Future Development in Canterbury District
Ref: 121191 Page|55
5.20 RPs and others should be encouraged to be proactive in these areas, and
supported by the Council where possible.
End of main – Final Report Study Text
Appendices follow
December 2012

Canterbury City Council
Economic Viability Assessment of Future Development in Canterbury District
Ref: 121191 Page|56
A
A
p
p
p
p
e
e
n
n
d
d
i
i
c
c
e
e
s
s
Appendix 1 - Table of Housing Mixes.
Appendix 2 - Shows a Summary of Residual Land Value (£) Appraisals for All
Value Points; 0%, 25%, 30%, 35% and 40% Affordable Housing; 70% Social
Rent/30% Shared Ownership; CIL Level £0 at Low Density, Medium Density and
High Density. The tables show actual RLVs, RLV as a % of GDV and RLV per
hectare.
Appendix 2a - Is as per Appendix 2 but for schemes of flats only.
Appendix 2b - Is as per Appendix 2 but for schemes of houses only.
Appendix 3 - Shows a Summary of Residual Land Value (£) Appraisals for All
Value Points; 0%, 25%, 30%, 35% and 40% Affordable Housing; 70% Social
Rent/30% Shared Ownership; CIL Level £40 and £60 at Low Density, Medium
Density and High Density. The tables show actual RLVs, RLV as a % of GDV and
RLV per hectare.
Appendix 3i - Shows a Summary of Residual Land Value (£) Appraisals for All
Value Points; 0%, 25%, 30%, 35% and 40% Affordable Housing; 70% Social
Rent/30% Shared Ownership; CIL Level £80 and £100 at Low Density, Medium
Density and High Density. The tables show actual RLVs, RLV as a % of GDV and
RLV per hectare.
Appendix 3a - Is as per Appendix 3 but for schemes of flats only.
Appendix 3a-i - Is as per Appendix 3i but for schemes of flats only.
Appendix 3b - Is as per Appendix 3 but for schemes of houses only.
Appendix 3b-i - Is as per Appendix 3i but for schemes of houses only.
Appendices 4, 4i, 4ii, 4a, 4a-i, 4aii, 4b, 4b-i, 4b-ii - Are the same as
Appendix 3 but at Code for Sustainable Homes Level 5.
Appendices 5, 5i, 5ii, 5a, 5a-i, 5a-ii, 5b, 5b-i, 5b-ii - Are the same as
Appendix 3 but at Code for Sustainable Homes Level 6.
Appendices 6, 6i, 6ii, 6a, 6a-i, 6a-ii, 6b, 6b-i, 6b-ii - Are the same as
Appendix 3 but at Code for Sustainable Homes Level 3.
Appendix 7 – Shows Commuted Sums Residual Land Value (£) Appraisals for All
Value Points.
Appendix 8 - Contains a summary of our property values and market research.
Canterbury City Council
Economic Viability Assessment of Future Development in Canterbury District
Ref: 121191 Page|57
Appendix 9 - Details of Stakeholder Consultation.
Appendix 10 - Provides a Glossary of technical terms used throughout this
study.

Appendix 1
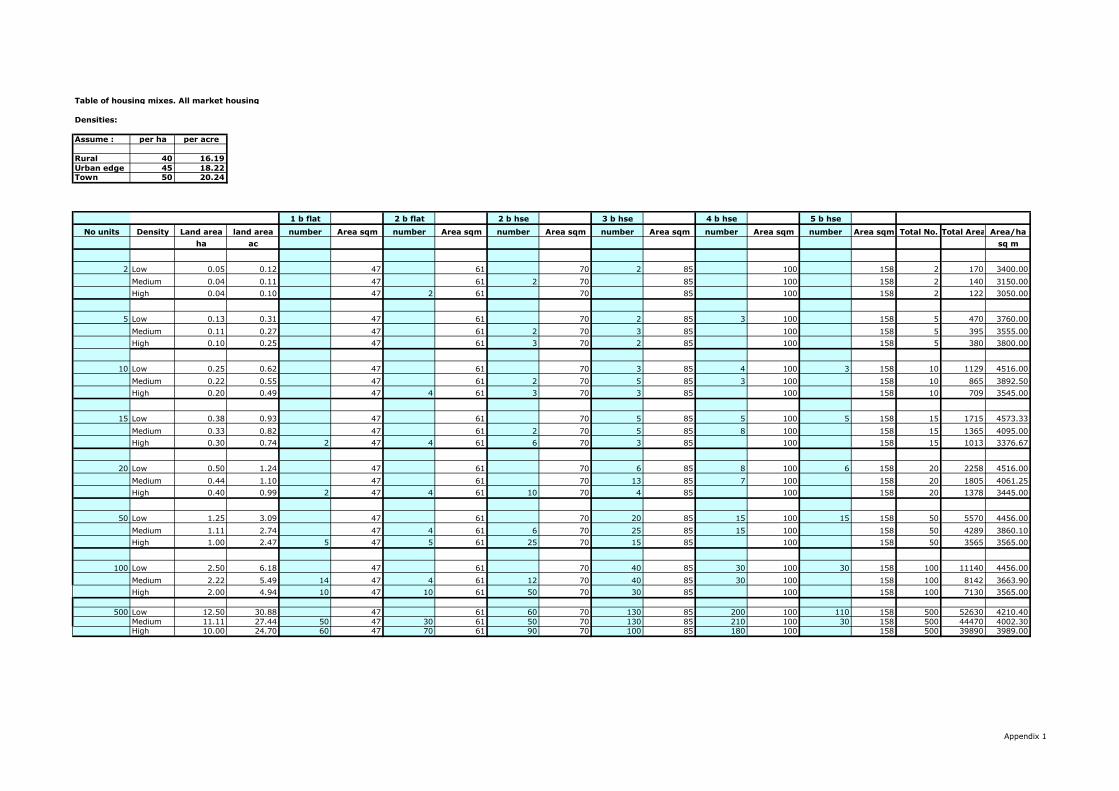
Table of housing mixes. All market housing
Densities:
Assume : per ha per acre
Rural 40 16.19
Urban edge 45 18.22
Town 50 20.24
1 b flat 2 b flat 2 b hse 3 b hse 4 b hse 5 b hse
No units Density Land area land area number Area sqm number Area sqm number Area sqm number Area sqm number Area sqm number Area sqm Total No. Total Area Area/ha
ha ac sq m
2 Low 0.05 0.12 47 61 70 2 85 100 158 2 170 3400.00
Medium 0.04 0.11 47 61 2 70 85 100 158 2 140 3150.00
High 0.04 0.10 47 2 61 70 85 100 158 2 122 3050.00
5 Low 0.13 0.31 47 61 70 2 85 3 100 158 5 470 3760.00
Medium 0.11 0.27 47 61 2 70 3 85 100 158 5 395 3555.00
High 0.10 0.25 47 61 3 70 2 85 100 158 5 380 3800.00
10 Low 0.25 0.62 47 61 70 3 85 4 100 3 158 10 1129 4516.00
Medium 0.22 0.55 47 61 2 70 5 85 3 100 158 10 865 3892.50
High 0.20 0.49 47 4 61 3 70 3 85 100 158 10 709 3545.00
15 Low 0.38 0.93 47 61 70 5 85 5 100 5 158 15 1715 4573.33
Medium 0.33 0.82 47 61 2 70 5 85 8 100 158 15 1365 4095.00
High 0.30 0.74 2 47 4 61 6 70 3 85 100 158 15 1013 3376.67
20 Low 0.50 1.24 47 61 70 6 85 8 100 6 158 20 2258 4516.00
Medium 0.44 1.10 47 61 70 13 85 7 100 158 20 1805 4061.25
High 0.40 0.99 2 47 4 61 10 70 4 85 100 158 20 1378 3445.00
50 Low 1.25 3.09 47 61 70 20 85 15 100 15 158 50 5570 4456.00
Medium 1.11 2.74 47 4 61 6 70 25 85 15 100 158 50 4289 3860.10
High 1.00 2.47 5 47 5 61 25 70 15 85 100 158 50 3565 3565.00
100 Low 2.50 6.18 47 61 70 40 85 30 100 30 158 100 11140 4456.00
Medium 2.22 5.49 14 47 4 61 12 70 40 85 30 100 158 100 8142 3663.90
High 2.00 4.94 10 47 10 61 50 70 30 85 100 158 100 7130 3565.00
500 Low 12.50 30.88 47 61 60 70 130 85 200 100 110 158 500 52630 4210.40
Medium 11.11 27.44 50 47 30 61 50 70 130 85 210 100 30 158 500 44470 4002.30
High 10.00 24.70 60 47 70 61 90 70 100 85 180 100 158 500 39890 3989.00
Appendix 1
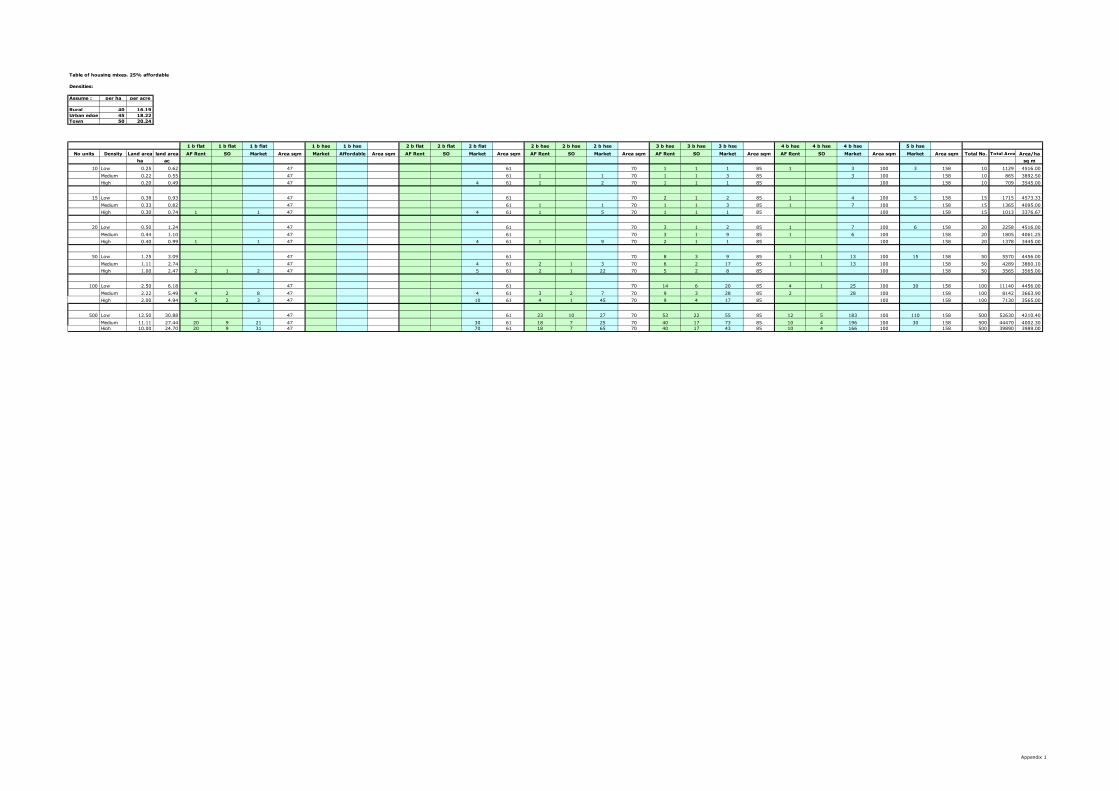
Table of housing mixes. 25% affordable
Densities:
Assume : per ha per acre
Rural 40 16.19
Urban edge 45 18.22
Town 50 20.24
1 b flat 1 b flat 1 b flat 1 b hse 1 b hse 2 b flat 2 b flat 2 b flat 2 b hse 2 b hse 2 b hse 3 b hse 3 b hse 3 b hse 4 b hse 4 b hse 4 b hse 5 b hse
No units Density Land area land area AF Rent SO Market Area sqm Market Affordable Area sqm AF Rent SO Market Area sqm AF Rent SO Market Area sqm AF Rent SO Market Area sqm AF Rent SO Market Area sqm Market Area sqm Total No. Total Area Area/ha
ha ac sq m
10 Low 0.25 0.62 47 61 70 1 1 1 85 1 3 100 3 158 10 1129 4516.00
Medium 0.22 0.55 47 61 1 1 70 1 1 3 85 3 100 158 10 865 3892.50
High 0.20 0.49 47 4 61 1 2 70 1 1 1 85 100 158 10 709 3545.00
15 Low 0.38 0.93 47 61 70 2 1 2 85 1 4 100 5 158 15 1715 4573.33
Medium 0.33 0.82 47 61 1 1 70 1 1 3 85 1 7 100 158 15 1365 4095.00
High 0.30 0.74 1 1 47 4 61 1 5 70 1 1 1 85 100 158 15 1013 3376.67
20 Low 0.50 1.24 47 61 70 3 1 2 85 1 7 100 6 158 20 2258 4516.00
Medium 0.44 1.10 47 61 70 3 1 9 85 1 6 100 158 20 1805 4061.25
High 0.40 0.99 1 1 47 4 61 1 9 70 2 1 1 85 100 158 20 1378 3445.00
50 Low 1.25 3.09 47 61 70 8 3 9 85 1 1 13 100 15 158 50 5570 4456.00
Medium 1.11 2.74 47 4 61 2 1 3 70 6 2 17 85 1 1 13 100 158 50 4289 3860.10
High 1.00 2.47 2 1 2 47 5 61 2 1 22 70 5 2 8 85 100 158 50 3565 3565.00
100 Low 2.50 6.18 47 61 70 14 6 20 85 4 1 25 100 30 158 100 11140 4456.00
Medium 2.22 5.49 4 2 8 47 4 61 3 2 7 70 9 3 28 85 2 28 100 158 100 8142 3663.90
High 2.00 4.94 5 2 3 47 10 61 4 1 45 70 9 4 17 85 100 158 100 7130 3565.00
500 Low 12.50 30.88 47 61 23 10 27 70 53 22 55 85 12 5 183 100 110 158 500 52630 4210.40
Medium 11.11 27.44 20 9 21 47 30 61 18 7 25 70 40 17 73 85 10 4 196 100 30 158 500 44470 4002.30
High 10.00 24.70 20 9 31 47 70 61 18 7 65 70 40 17 43 85 10 4 166 100 158 500 39890 3989.00
Appendix 1
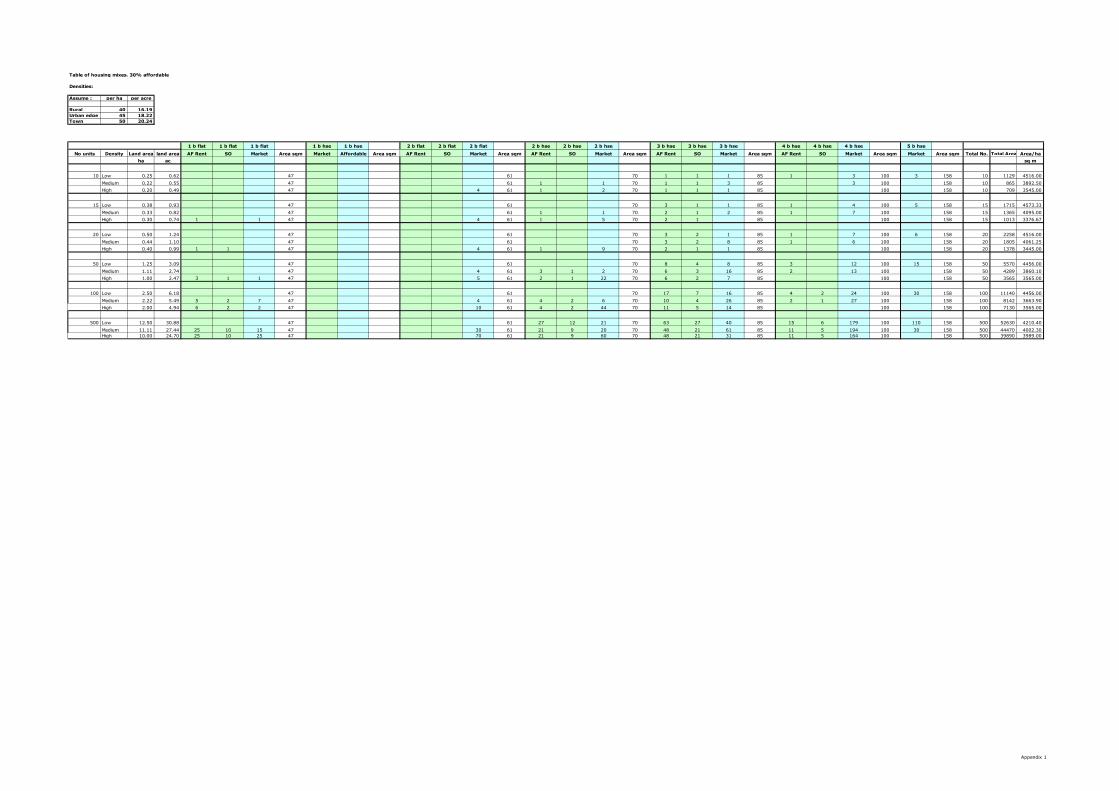
Table of housing mixes. 30% affordable
Densities:
Assume : per ha per acre
Rural 40 16.19
Urban edge 45 18.22
Town 50 20.24
1 b flat 1 b flat 1 b flat 1 b hse 1 b hse 2 b flat 2 b flat 2 b flat 2 b hse 2 b hse 2 b hse 3 b hse 3 b hse 3 b hse 4 b hse 4 b hse 4 b hse 5 b hse
No units Density Land area land area AF Rent SO Market Area sqm Market Affordable Area sqm AF Rent SO Market Area sqm AF Rent SO Market Area sqm AF Rent SO Market Area sqm AF Rent SO Market Area sqm Market Area sqm Total No. Total Area Area/ha
ha ac sq m
10 Low 0.25 0.62 47 61 70 1 1 1 85 1 3 100 3 158 10 1129 4516.00
Medium 0.22 0.55 47 61 1 1 70 1 1 3 85 3 100 158 10 865 3892.50
High 0.20 0.49 47 4 61 1 2 70 1 1 1 85 100 158 10 709 3545.00
15 Low 0.38 0.93 47 61 70 3 1 1 85 1 4 100 5 158 15 1715 4573.33
Medium 0.33 0.82 47 61 1 1 70 2 1 2 85 1 7 100 158 15 1365 4095.00
High 0.30 0.74 1 1 47 4 61 1 5 70 2 1 85 100 158 15 1013 3376.67
20 Low 0.50 1.24 47 61 70 3 2 1 85 1 7 100 6 158 20 2258 4516.00
Medium 0.44 1.10 47 61 70 3 2 8 85 1 6 100 158 20 1805 4061.25
High 0.40 0.99 1 1 47 4 61 1 9 70 2 1 1 85 100 158 20 1378 3445.00
50 Low 1.25 3.09 47 61 70 8 4 8 85 3 12 100 15 158 50 5570 4456.00
Medium 1.11 2.74 47 4 61 3 1 2 70 6 3 16 85 2 13 100 158 50 4289 3860.10
High 1.00 2.47 3 1 1 47 5 61 2 1 22 70 6 2 7 85 100 158 50 3565 3565.00
100 Low 2.50 6.18 47 61 70 17 7 16 85 4 2 24 100 30 158 100 11140 4456.00
Medium 2.22 5.49 5 2 7 47 4 61 4 2 6 70 10 4 26 85 2 1 27 100 158 100 8142 3663.90
High 2.00 4.94 6 2 2 47 10 61 4 2 44 70 11 5 14 85 100 158 100 7130 3565.00
500 Low 12.50 30.88 47 61 27 12 21 70 63 27 40 85 15 6 179 100 110 158 500 52630 4210.40
Medium 11.11 27.44 25 10 15 47 30 61 21 9 20 70 48 21 61 85 11 5 194 100 30 158 500 44470 4002.30
High 10.00 24.70 25 10 25 47 70 61 21 9 60 70 48 21 31 85 11 5 164 100 158 500 39890 3989.00
Appendix 1
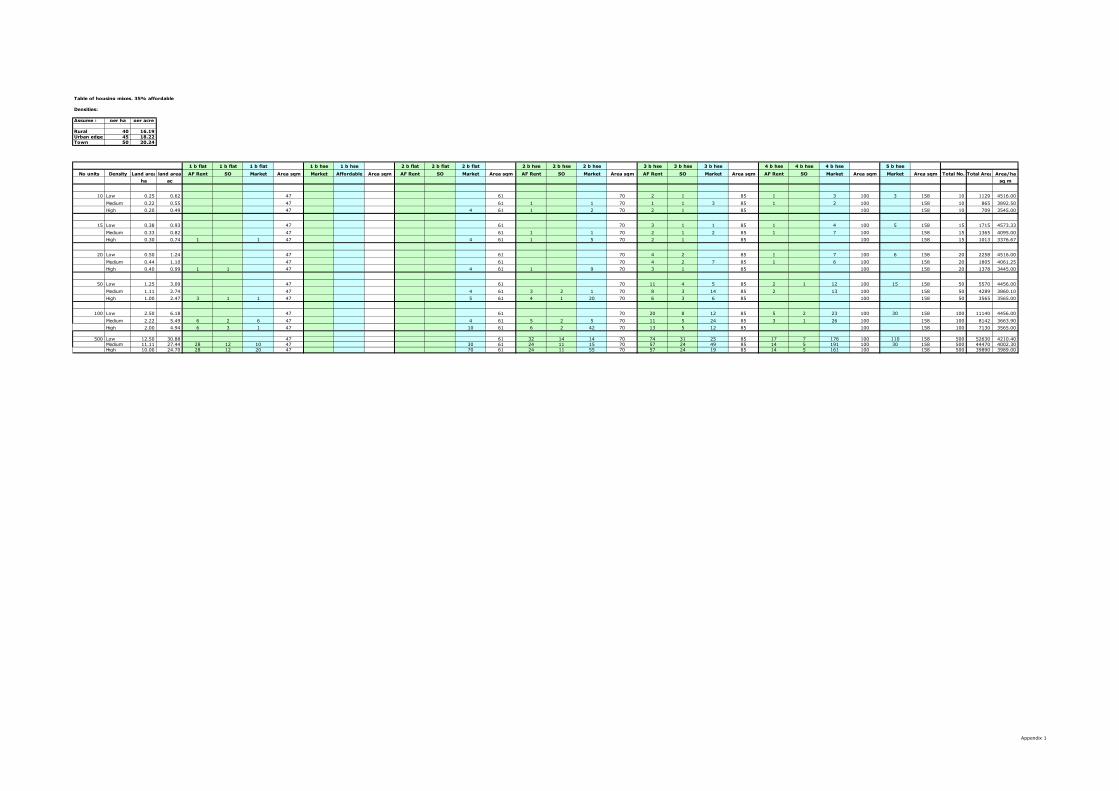
Table of housing mixes. 35% affordable
Densities:
Assume : per ha per acre
Rural 40 16.19
Urban edge 45 18.22
Town 50 20.24
1 b flat 1 b flat 1 b flat 1 b hse 1 b hse 2 b flat 2 b flat 2 b flat 2 b hse 2 b hse 2 b hse 3 b hse 3 b hse 3 b hse 4 b hse 4 b hse 4 b hse 5 b hse
No units Density Land area land area AF Rent SO Market Area sqm Market Affordable Area sqm AF Rent SO Market Area sqm AF Rent SO Market Area sqm AF Rent SO Market Area sqm AF Rent SO Market Area sqm Market Area sqm Total No. Total Area Area/ha
ha ac sq m
10 Low 0.25 0.62 47 61 70 2 1 85 1 3 100 3 158 10 1129 4516.00
Medium 0.22 0.55 47 61 1 1 70 1 1 3 85 1 2 100 158 10 865 3892.50
High 0.20 0.49 47 4 61 1 2 70 2 1 85 100 158 10 709 3545.00
15 Low 0.38 0.93 47 61 70 3 1 1 85 1 4 100 5 158 15 1715 4573.33
Medium 0.33 0.82 47 61 1 1 70 2 1 2 85 1 7 100 158 15 1365 4095.00
High 0.30 0.74 1 1 47 4 61 1 5 70 2 1 85 100 158 15 1013 3376.67
20 Low 0.50 1.24 47 61 70 4 2 85 1 7 100 6 158 20 2258 4516.00
Medium 0.44 1.10 47 61 70 4 2 7 85 1 6 100 158 20 1805 4061.25
High 0.40 0.99 1 1 47 4 61 1 9 70 3 1 85 100 158 20 1378 3445.00
50 Low 1.25 3.09 47 61 70 11 4 5 85 2 1 12 100 15 158 50 5570 4456.00
Medium 1.11 2.74 47 4 61 3 2 1 70 8 3 14 85 2 13 100 158 50 4289 3860.10
High 1.00 2.47 3 1 1 47 5 61 4 1 20 70 6 3 6 85 100 158 50 3565 3565.00
100 Low 2.50 6.18 47 61 70 20 8 12 85 5 2 23 100 30 158 100 11140 4456.00
Medium 2.22 5.49 6 2 6 47 4 61 5 2 5 70 11 5 24 85 3 1 26 100 158 100 8142 3663.90
High 2.00 4.94 6 3 1 47 10 61 6 2 42 70 13 5 12 85 100 158 100 7130 3565.00
500 Low 12.50 30.88 47 61 32 14 14 70 74 31 25 85 17 7 176 100 110 158 500 52630 4210.40
Medium 11.11 27.44 28 12 10 47 30 61 24 11 15 70 57 24 49 85 14 5 191 100 30 158 500 44470 4002.30
High 10.00 24.70 28 12 20 47 70 61 24 11 55 70 57 24 19 85 14 5 161 100 158 500 39890 3989.00
Appendix 1

Table of housing mixes. 40% affordable
Densities:
Assume : per ha per acre
Rural 40 16.19
Urban edge 45 18.22
Town 50 20.24
1 b flat 1 b flat 1 b flat 1 b hse 1 b hse 2 b flat 2 b flat 2 b flat 2 b hse 2 b hse 2 b hse 3 b hse 3 b hse 3 b hse 4 b hse 4 b hse 4 b hse 5 b hse
No units Density Land area land area AF Rent SO Market Area sqm Market Affordable Area sqm AF Rent SO Market Area sqm AF Rent SO Market Area sqm AF Rent SO Market Area sqm AF Rent SO Market Area sqm Market Area sqm Total No.Total AreaArea/ha
ha ac sq m
10 Low 0.25 0.62 47 61 70 2 1 85 1 3 100 3 158 10 1129 4516.00
Medium 0.22 0.55 47 61 1 1 70 1 1 3 85 1 2 100 158 10 865 3892.50
High 0.20 0.49 47 4 61 1 2 70 2 1 85 100 158 10 709 3545.00
15 Low 0.38 0.93 47 61 70 3 2 85 1 4 100 5 158 15 1715 4573.33
Medium 0.33 0.82 47 61 1 1 70 2 2 1 85 1 7 100 158 15 1365 4095.00
High 0.30 0.74 1 1 47 4 61 1 5 70 2 1 85 100 158 15 1013 3376.67
20 Low 0.50 1.24 47 61 70 4 2 85 2 6 100 6 158 20 2258 4516
Medium 0.44 1.10 47 61 70 4 2 7 85 2 5 100 158 20 1805 4061
High 0.40 0.99 1 1 47 4 61 2 8 70 3 1 85 100 158 20 1378 3445
50 Low 1.25 3.09 47 61 70 11 5 4 85 3 1 11 100 15 158 50 5570 4456
Medium 1.11 2.74 47 4 61 3 2 1 70 8 4 13 85 3 12 100 158 50 4289 3860
High 1.00 2.47 2 3 47 5 61 3 1 21 70 8 3 4 85 100 158 50 3565 3565
100 Low 2.50 6.18 47 61 70 22 10 8 85 6 2 22 100 30 158 100 11140 4456
Medium 2.22 5.49 6 3 5 47 4 61 6 2 4 70 13 6 21 85 3 1 26 100 158 100 8142 3664
High 2.00 4.94 3 7 47 10 61 6 3 41 70 15 6 9 85 100 158 100 7130 3565
500 Low 12.50 30.88 47 61 36 16 8 70 84 36 10 85 20 8 172 100 110 158 500 52630 4210.40
Medium 11.11 27.44 32 14 4 47 30 61 28 12 10 70 64 28 38 85 16 6 188 100 30 158 500 44470 4002.30
High 10.00 24.70 32 14 14 47 70 61 28 12 50 70 64 28 8 85 16 6 158 100 158 500 39890 3989.00
Appendix 1
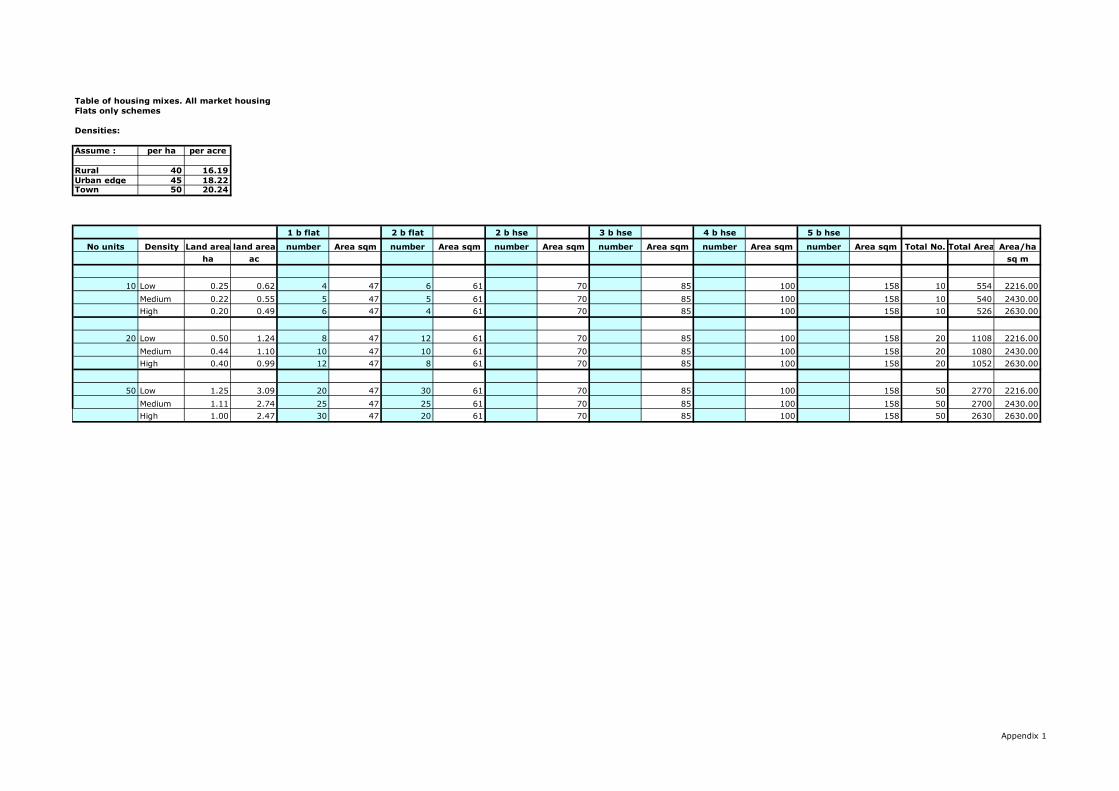
Table of housing mixes. All market housing
Flats only schemes
Densities:
Assume : per ha per acre
Rural 40 16.19
Urban edge 45 18.22
Town 50 20.24
1 b flat 2 b flat 2 b hse 3 b hse 4 b hse 5 b hse
No units Density Land area land area number Area sqm number Area sqm number Area sqm number Area sqm number Area sqm number Area sqm Total No. Total Area Area/ha
ha ac sq m
10 Low 0.25 0.62 4 47 6 61 70 85 100 158 10 554 2216.00
Medium 0.22 0.55 5 47 5 61 70 85 100 158 10 540 2430.00
High 0.20 0.49 6 47 4 61 70 85 100 158 10 526 2630.00
20 Low 0.50 1.24 8 47 12 61 70 85 100 158 20 1108 2216.00
Medium 0.44 1.10 10 47 10 61 70 85 100 158 20 1080 2430.00
High 0.40 0.99 12 47 8 61 70 85 100 158 20 1052 2630.00
50 Low 1.25 3.09 20 47 30 61 70 85 100 158 50 2770 2216.00
Medium 1.11 2.74 25 47 25 61 70 85 100 158 50 2700 2430.00
High 1.00 2.47 30 47 20 61 70 85 100 158 50 2630 2630.00
Appendix 1

Table of housing mixes. 25% affordable
Flats only schemes
Densities:
Assume : per ha per acre
Rural 40 16.19
Urban edge 45 18.22
Town 50 20.24
1 b flat 1 b flat 1 b flat 1 b hse 1 b hse 2 b flat 2 b flat 2 b flat 2 b hse 2 b hse 2 b hse 3 b hse 3 b hse 3 b hse 4 b hse 4 b hse 4 b hse 5 b hse
No units Density Land area land area AF Rent SO Market Area sqm Market Affordable Area sqm AF Rent SO Market Area sqm AF Rent SO Market Area sqm AF Rent SO Market Area sqm AF Rent SO Market Area sqm Market Area sqm Total No. Total Area Area/ha
ha ac sq m
10 Low 0.25 0.62 2 1 1 47 6 61 70 85 100 158 10 554 2216.00
Medium 0.22 0.55 2 1 2 47 5 61 70 85 100 158 10 540 2430.00
High 0.20 0.49 2 1 3 47 4 61 70 85 100 158 10 526 2630.00
20 Low 0.50 1.24 4 1 3 47 12 61 70 85 100 158 20 1108 2216.00
Medium 0.44 1.10 4 1 5 47 10 61 70 85 100 158 20 1080 2430.00
High 0.40 0.99 4 1 7 47 8 61 70 85 100 158 20 1052 2630.00
50 Low 1.25 3.09 9 4 7 47 30 61 70 85 100 158 50 2770 2216.00
Medium 1.11 2.74 9 4 12 47 25 61 70 85 100 158 50 2700 2430.00
High 1.00 2.47 9 4 17 47 20 61 70 85 100 158 50 2630 2630.00
Appendix 1

Table of housing mixes. 30% affordable
Flats only schemes
Densities:
Assume : per ha per acre
Rural 40 16.19
Urban edge 45 18.22
Town 50 20.24
1 b flat 1 b flat 1 b flat 1 b hse 1 b hse 2 b flat 2 b flat 2 b flat 2 b hse 2 b hse 2 b hse 3 b hse 3 b hse 3 b hse 4 b hse 4 b hse 4 b hse 5 b hse
No units Density Land area land area AF Rent SO Market Area sqm Market Affordable Area sqm AF Rent SO Market Area sqm AF Rent SO Market Area sqm AF Rent SO Market Area sqm AF Rent SO Market Area sqm Market Area sqm Total No. Total Area Area/ha
ha ac sq m
10 Low 0.25 0.62 2 1 1 47 6 61 70 85 100 158 10 554 2216.00
Medium 0.22 0.55 2 1 2 47 5 61 70 85 100 158 10 540 2430.00
High 0.20 0.49 2 1 3 47 4 61 70 85 100 158 10 526 2630.00
20 Low 0.50 1.24 4 2 2 47 12 61 70 85 100 158 20 1108 2216.00
Medium 0.44 1.10 4 2 4 47 10 61 70 85 100 158 20 1080 2430.00
High 0.40 0.99 4 2 6 47 8 61 70 85 100 158 20 1052 2630.00
50 Low 1.25 3.09 11 4 5 47 30 61 70 85 100 158 50 2770 2216.00
Medium 1.11 2.74 11 4 10 47 25 61 70 85 100 158 50 2700 2430.00
High 1.00 2.47 11 4 15 47 20 61 70 85 100 158 50 2630 2630.00
Appendix 1
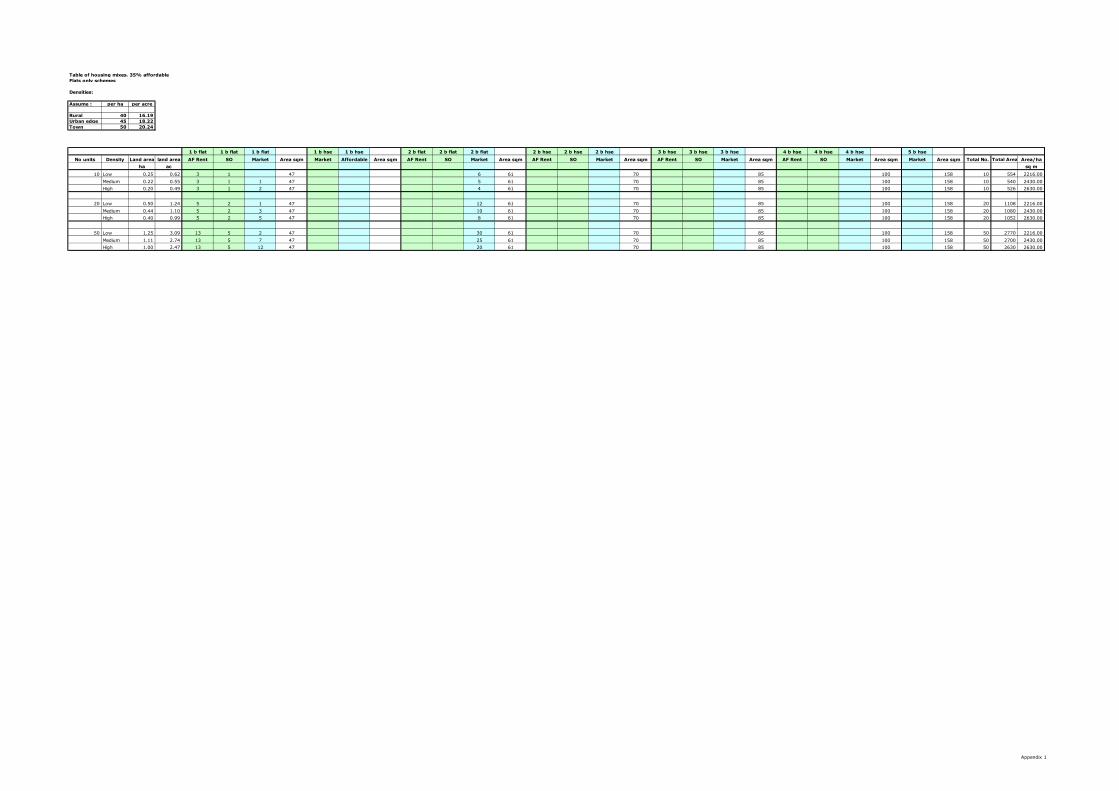
Table of housing mixes. 35% affordable
Flats only schemes
Densities:
Assume : per ha per acre
Rural 40 16.19
Urban edge 45 18.22
Town 50 20.24
1 b flat 1 b flat 1 b flat 1 b hse 1 b hse 2 b flat 2 b flat 2 b flat 2 b hse 2 b hse 2 b hse 3 b hse 3 b hse 3 b hse 4 b hse 4 b hse 4 b hse 5 b hse
No units Density Land area land area AF Rent SO Market Area sqm Market Affordable Area sqm AF Rent SO Market Area sqm AF Rent SO Market Area sqm AF Rent SO Market Area sqm AF Rent SO Market Area sqm Market Area sqm Total No. Total Area Area/ha
ha ac sq m
10 Low 0.25 0.62 3 1 47 6 61 70 85 100 158 10 554 2216.00
Medium 0.22 0.55 3 1 1 47 5 61 70 85 100 158 10 540 2430.00
High 0.20 0.49 3 1 2 47 4 61 70 85 100 158 10 526 2630.00
20 Low 0.50 1.24 5 2 1 47 12 61 70 85 100 158 20 1108 2216.00
Medium 0.44 1.10 5 2 3 47 10 61 70 85 100 158 20 1080 2430.00
High 0.40 0.99 5 2 5 47 8 61 70 85 100 158 20 1052 2630.00
50 Low 1.25 3.09 13 5 2 47 30 61 70 85 100 158 50 2770 2216.00
Medium 1.11 2.74 13 5 7 47 25 61 70 85 100 158 50 2700 2430.00
High 1.00 2.47 13 5 12 47 20 61 70 85 100 158 50 2630 2630.00
Appendix 1

Table of housing mixes. 40% affordable
Flats only schemes
Densities:
Assume : per ha per acre
Rural 40 16.19
Urban edge 45 18.22
Town 50 20.24
1 b flat 1 b flat 1 b flat 1 b hse 1 b hse 2 b flat 2 b flat 2 b flat 2 b hse 2 b hse 2 b hse 3 b hse 3 b hse 3 b hse 4 b hse 4 b hse 4 b hse 5 b hse
No units Density Land area land area AF Rent SO Market Area sqm Market Affordable Area sqm AF Rent SO Market Area sqm AF Rent SO Market Area sqm AF Rent SO Market Area sqm AF Rent SO Market Area sqm Market Area sqm Total No. Total Area Area/ha
ha ac sq m
10 Low 0.25 0.62 3 1 47 6 61 70 85 100 158 10 554 2216.00
Medium 0.22 0.55 3 1 1 47 5 61 70 85 100 158 10 540 2430.00
High 0.20 0.49 3 1 2 47 4 61 70 85 100 158 10 526 2630.00
20 Low 0.50 1.24 6 2 47 12 61 70 85 100 158 20 1108 2216.00
Medium 0.44 1.10 6 2 2 47 10 61 70 85 100 158 20 1080 2430.00
High 0.40 0.99 6 2 4 47 8 61 70 85 100 158 20 1052 2630.00
50 Low 1.25 3.09 14 6 47 30 61 70 85 100 158 50 2770 2216.00
Medium 1.11 2.74 14 6 5 47 25 61 70 85 100 158 50 2700 2430.00
High 1.00 2.47 14 6 10 47 20 61 70 85 100 158 50 2630 2630.00
Appendix 1
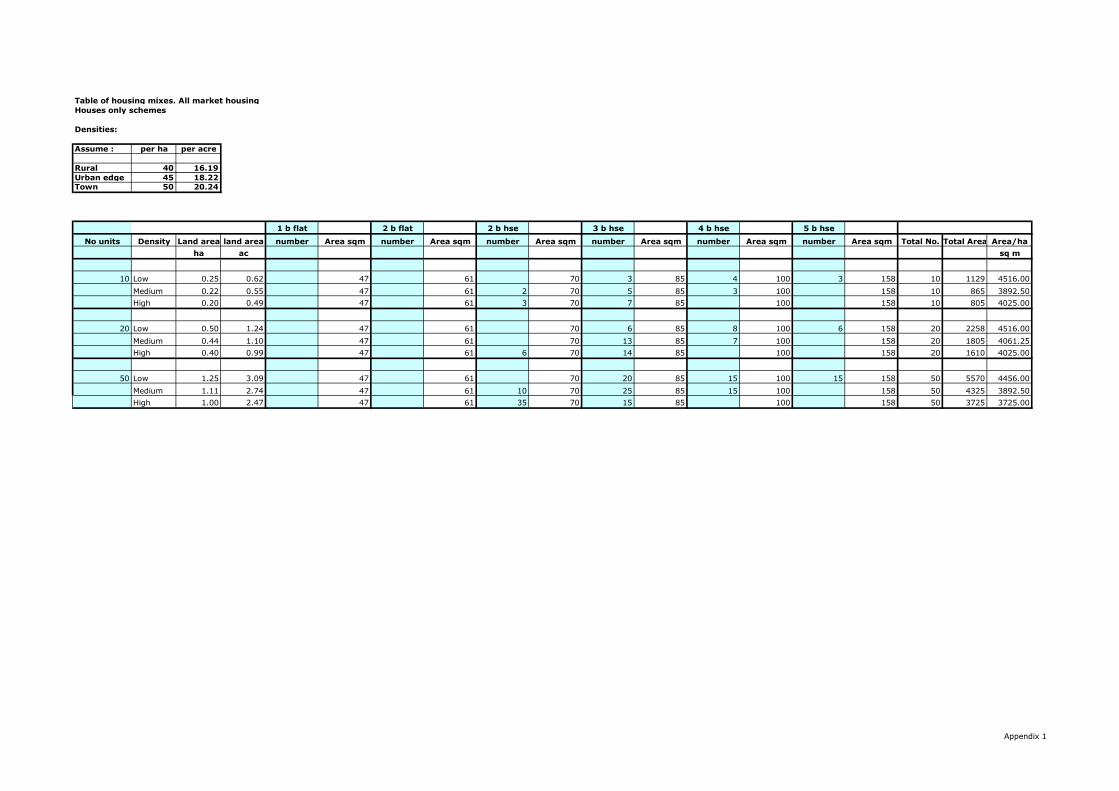
Table of housing mixes. All market housing
Houses only schemes
Densities:
Assume : per ha per acre
Rural 40 16.19
Urban edge 45 18.22
Town 50 20.24
1 b flat 2 b flat 2 b hse 3 b hse 4 b hse 5 b hse
No units Density Land area land area number Area sqm number Area sqm number Area sqm number Area sqm number Area sqm number Area sqm Total No. Total Area Area/ha
ha ac sq m
10 Low 0.25 0.62 47 61 70 3 85 4 100 3 158 10 1129 4516.00
Medium 0.22 0.55 47 61 2 70 5 85 3 100 158 10 865 3892.50
High 0.20 0.49 47 61 3 70 7 85 100 158 10 805 4025.00
20 Low 0.50 1.24 47 61 70 6 85 8 100 6 158 20 2258 4516.00
Medium 0.44 1.10 47 61 70 13 85 7 100 158 20 1805 4061.25
High 0.40 0.99 47 61 6 70 14 85 100 158 20 1610 4025.00
50 Low 1.25 3.09 47 61 70 20 85 15 100 15 158 50 5570 4456.00
Medium 1.11 2.74 47 61 10 70 25 85 15 100 158 50 4325 3892.50
High 1.00 2.47 47 61 35 70 15 85 100 158 50 3725 3725.00
Appendix 1

Table of housing mixes. 25% affordable
Houses only schemes
Densities:
Assume : per ha per acre
Rural 40 16.19
Urban edge 45 18.22
Town 50 20.24
1 b flat 1 b flat 1 b flat 1 b hse 1 b hse 2 b flat 2 b flat 2 b flat 2 b hse 2 b hse 2 b hse 3 b hse 3 b hse 3 b hse 4 b hse 4 b hse 4 b hse 5 b hse
No units Density Land area land area AF Rent SO Market Area sqm Market Affordable Area sqm AF Rent SO Market Area sqm AF Rent SO Market Area sqm AF Rent SO Market Area sqm AF Rent SO Market Area sqm Market Area sqm Total No. Total Area Area/ha
ha ac sq m
10 Low 0.25 0.62 47 61 70 1 1 1 85 1 3 100 3 158 10 1129 4516.00
Medium 0.22 0.55 47 61 1 1 70 1 1 3 85 3 100 158 10 865 3892.50
High 0.20 0.49 47 61 1 2 70 1 1 5 85 100 158 10 805 4025.00
20 Low 0.50 1.24 47 61 70 3 1 2 85 1 7 100 6 158 20 2258 4516.00
Medium 0.44 1.10 47 61 70 3 1 9 85 1 6 100 158 20 1805 4061.25
High 0.40 0.99 47 61 1 5 70 3 1 10 85 100 158 20 1610 4025.00
50 Low 1.25 3.09 47 61 70 8 3 9 85 1 1 13 100 15 158 50 5570 4456.00
Medium 1.11 2.74 47 61 2 1 7 70 6 2 17 85 1 1 13 100 158 50 4325 3892.50
High 1.00 2.47 47 61 3 1 31 70 6 3 6 85 100 158 50 3725 3725.00
Appendix 1

Table of housing mixes. 30% affordable
Houses only schemes
Densities:
Assume : per ha per acre
Rural 40 16.19
Urban edge 45 18.22
Town 50 20.24
1 b flat 1 b flat 1 b flat 1 b hse 1 b hse 2 b flat 2 b flat 2 b flat 2 b hse 2 b hse 2 b hse 3 b hse 3 b hse 3 b hse 4 b hse 4 b hse 4 b hse 5 b hse
No units Density Land area land area AF Rent SO Market Area sqm Market Affordable Area sqm AF Rent SO Market Area sqm AF Rent SO Market Area sqm AF Rent SO Market Area sqm AF Rent SO Market Area sqm Market Area sqm Total No. Total Area Area/ha
ha ac sq m
10 Low 0.25 0.62 47 61 70 1 1 1 85 1 3 100 3 158 10 1129 4516.00
Medium 0.22 0.55 47 61 1 1 70 1 1 3 85 3 100 158 10 865 3892.50
High 0.20 0.49 47 61 1 2 70 1 1 5 85 100 158 10 805 4025.00
20 Low 0.50 1.24 47 61 70 3 2 1 85 1 7 100 6 158 20 2258 4516.00
Medium 0.44 1.10 47 61 70 3 2 8 85 1 6 100 158 20 1805 4061.25
High 0.40 0.99 47 61 1 1 4 70 3 1 10 85 100 158 20 1610 4025.00
50 Low 1.25 3.09 47 61 70 8 4 8 85 3 12 100 15 158 50 5570 4456.00
Medium 1.11 2.74 47 61 3 1 6 70 6 3 16 85 2 13 100 158 50 4325 3892.50
High 1.00 2.47 47 61 3 1 31 70 8 3 4 85 100 158 50 3725 3725.00
Appendix 1

Table of housing mixes. 35% affordable
Houses only schemes
Densities:
Assume : per ha per acre
Rural 40 16.19
Urban edge 45 18.22
Town 50 20.24
1 b flat 1 b flat 1 b flat 1 b hse 1 b hse 2 b flat 2 b flat 2 b flat 2 b hse 2 b hse 2 b hse 3 b hse 3 b hse 3 b hse 4 b hse 4 b hse 4 b hse 5 b hse
No units Density Land area land area AF Rent SO Market Area sqm Market Affordable Area sqm AF Rent SO Market Area sqm AF Rent SO Market Area sqm AF Rent SO Market Area sqm AF Rent SO Market Area sqm Market Area sqm Total No. Total Area Area/ha
ha ac sq m
10 Low 0.25 0.62 47 61 70 2 1 85 1 3 100 3 158 10 1129 4516.00
Medium 0.22 0.55 47 61 1 1 70 1 1 3 85 1 2 100 158 10 865 3892.50
High 0.20 0.49 47 61 1 2 70 2 1 4 85 100 158 10 805 4025.00
20 Low 0.50 1.24 47 61 70 4 2 85 1 7 100 6 158 20 2258 4516.00
Medium 0.44 1.10 47 61 70 4 2 7 85 1 6 100 158 20 1805 4061.25
High 0.40 0.99 47 61 2 4 70 3 2 9 85 100 158 20 1610 4025.00
50 Low 1.25 3.09 47 61 70 11 4 5 85 2 1 12 100 15 158 50 5570 4456.00
Medium 1.11 2.74 47 61 3 2 5 70 8 3 14 85 2 13 100 158 50 4325 3892.50
High 1.00 2.47 47 61 4 1 30 70 9 4 2 85 100 158 50 3725 3725.00
Appendix 1
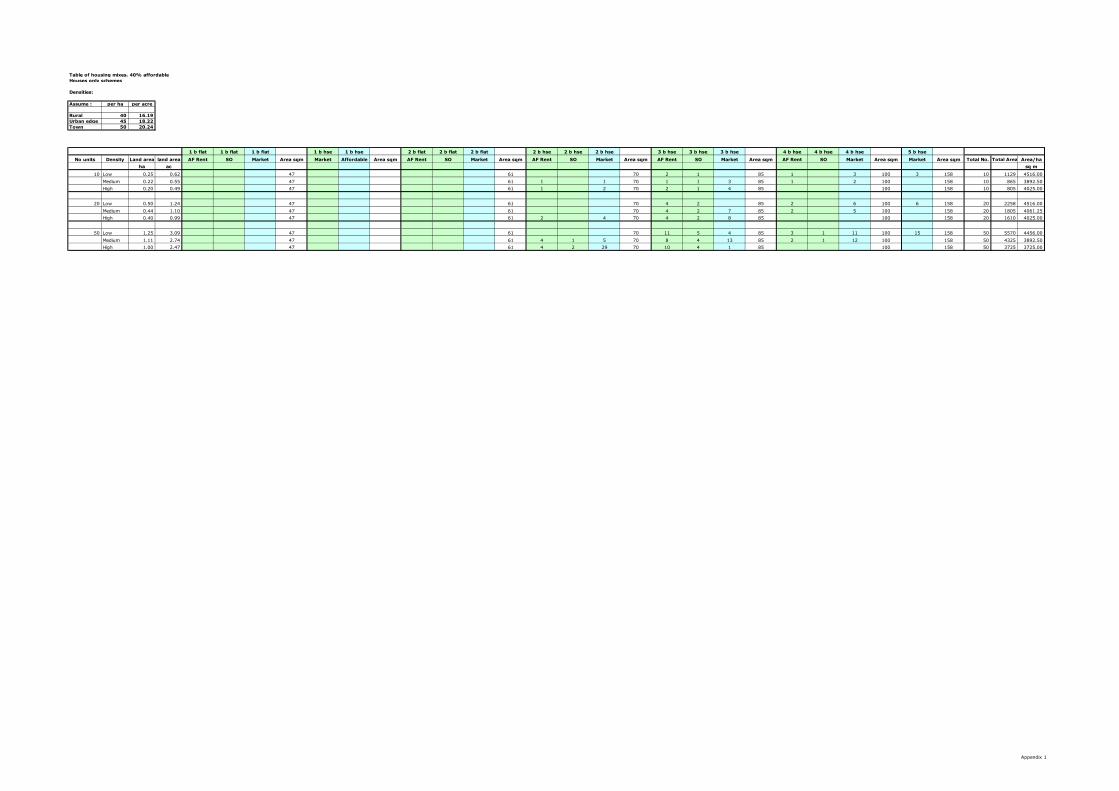
Table of housing mixes. 40% affordable
Houses only schemes
Densities:
Assume : per ha per acre
Rural 40 16.19
Urban edge 45 18.22
Town 50 20.24
1 b flat 1 b flat 1 b flat 1 b hse 1 b hse 2 b flat 2 b flat 2 b flat 2 b hse 2 b hse 2 b hse 3 b hse 3 b hse 3 b hse 4 b hse 4 b hse 4 b hse 5 b hse
No units Density Land area land area AF Rent SO Market Area sqm Market Affordable Area sqm AF Rent SO Market Area sqm AF Rent SO Market Area sqm AF Rent SO Market Area sqm AF Rent SO Market Area sqm Market Area sqm Total No. Total Area Area/ha
ha ac sq m
10 Low 0.25 0.62 47 61 70 2 1 85 1 3 100 3 158 10 1129 4516.00
Medium 0.22 0.55 47 61 1 1 70 1 1 3 85 1 2 100 158 10 865 3892.50
High 0.20 0.49 47 61 1 2 70 2 1 4 85 100 158 10 805 4025.00
20 Low 0.50 1.24 47 61 70 4 2 85 2 6 100 6 158 20 2258 4516.00
Medium 0.44 1.10 47 61 70 4 2 7 85 2 5 100 158 20 1805 4061.25
High 0.40 0.99 47 61 2 4 70 4 2 8 85 100 158 20 1610 4025.00
50 Low 1.25 3.09 47 61 70 11 5 4 85 3 1 11 100 15 158 50 5570 4456.00
Medium 1.11 2.74 47 61 4 1 5 70 8 4 13 85 2 1 12 100 158 50 4325 3892.50
High 1.00 2.47 47 61 4 2 29 70 10 4 1 85 100 158 50 3725 3725.00
Appendix 1

Appendix 2
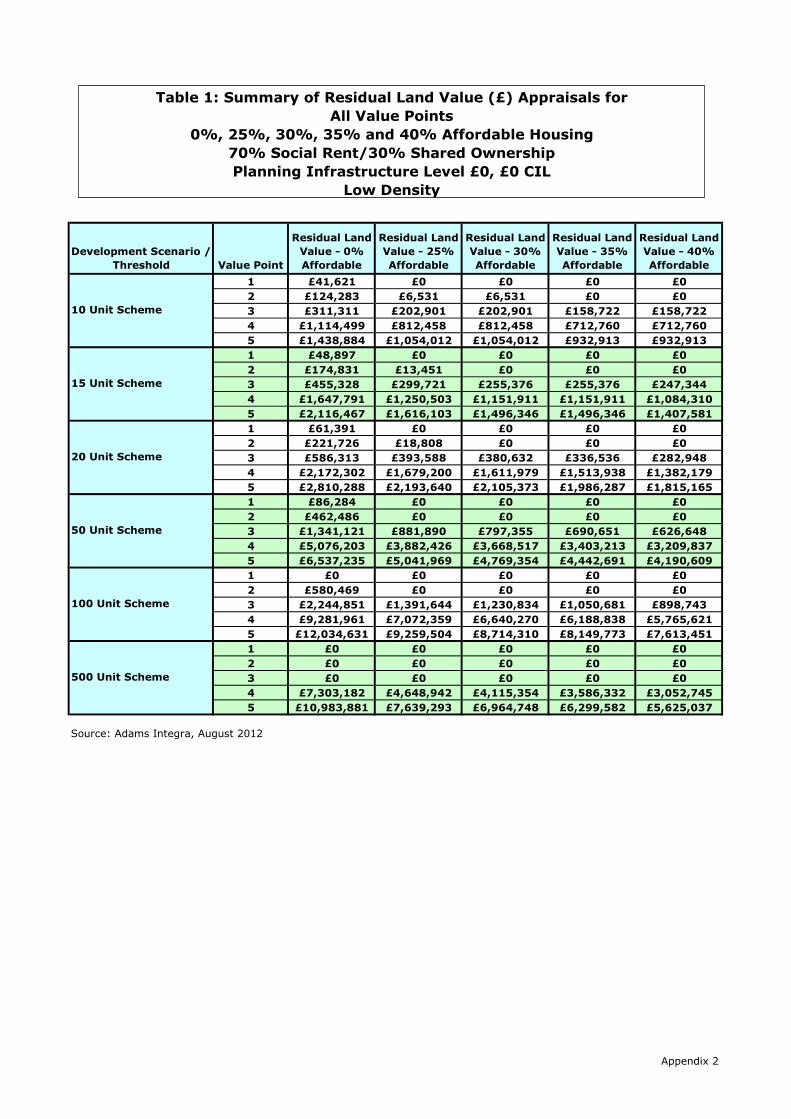
Development Scenario /
Threshold Value Point
Residual Land
Value - 0%
Affordable
Residual Land
Value - 25%
Affordable
Residual Land
Value - 30%
Affordable
Residual Land
Value - 35%
Affordable
Residual Land
Value - 40%
Affordable
1 £41,621 £0 £0 £0 £0
2 £124,283 £6,531 £6,531 £0 £0
3 £311,311 £202,901 £202,901 £158,722 £158,722
4 £1,114,499 £812,458 £812,458 £712,760 £712,760
5 £1,438,884 £1,054,012 £1,054,012 £932,913 £932,913
1 £48,897 £0 £0 £0 £0
2 £174,831 £13,451 £0 £0 £0
3 £455,328 £299,721 £255,376 £255,376 £247,344
4 £1,647,791 £1,250,503 £1,151,911 £1,151,911 £1,084,310
5 £2,116,467 £1,616,103 £1,496,346 £1,496,346 £1,407,581
1 £61,391 £0 £0 £0 £0
2 £221,726 £18,808 £0 £0 £0
3 £586,313 £393,588 £380,632 £336,536 £282,948
4 £2,172,302 £1,679,200 £1,611,979 £1,513,938 £1,382,179
5 £2,810,288 £2,193,640 £2,105,373 £1,986,287 £1,815,165
1 £86,284 £0 £0 £0 £0
2 £462,486 £0 £0 £0 £0
3 £1,341,121 £881,890 £797,355 £690,651 £626,648
4 £5,076,203 £3,882,426 £3,668,517 £3,403,213 £3,209,837
5 £6,537,235 £5,041,969 £4,769,354 £4,442,691 £4,190,609
1 £0 £0 £0 £0 £0
2 £580,469 £0 £0 £0 £0
3 £2,244,851 £1,391,644 £1,230,834 £1,050,681 £898,743
4 £9,281,961 £7,072,359 £6,640,270 £6,188,838 £5,765,621
5 £12,034,631 £9,259,504 £8,714,310 £8,149,773 £7,613,451
1 £0 £0 £0 £0 £0
2 £0 £0 £0 £0 £0
3 £0 £0 £0 £0 £0
4 £7,303,182 £4,648,942 £4,115,354 £3,586,332 £3,052,745
5 £10,983,881 £7,639,293 £6,964,748 £6,299,582 £5,625,037
Source: Adams Integra, August 2012
100 Unit Scheme
500 Unit Scheme
10 Unit Scheme
15 Unit Scheme
20 Unit Scheme
50 Unit Scheme
Table 1: Summary of Residual Land Value (£) Appraisals for
All Value Points
0%, 25%, 30%, 35% and 40% Affordable Housing
70% Social Rent/30% Shared Ownership
Planning Infrastructure Level £0, £0 CIL
Low Density
Appendix 2
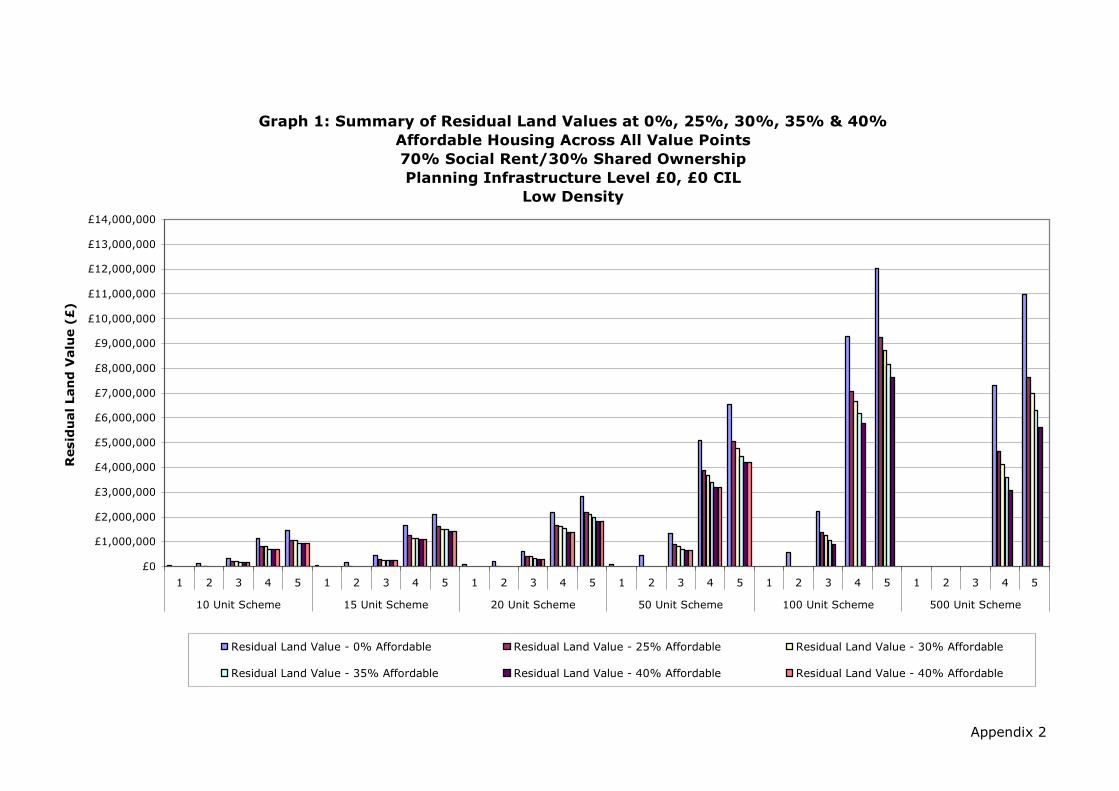
Appendix 2
Graph 1: Summary of Residual Land Values at 0%, 25%, 30%, 35% & 40%
Affordable Housing Across All Value Points
70% Social Rent/30% Shared Ownership
Planning Infrastructure Level £0, £0 CIL
Low Density
£0
£1,000,000
£2,000,000
£3,000,000
£4,000,000
£5,000,000
£6,000,000
£7,000,000
£8,000,000
£9,000,000
£10,000,000
£11,000,000
£12,000,000
£13,000,000
£14,000,000
1 2 3 4 5 1 2 3 4 5 1 2 3 4 5 1 2 3 4 5 1 2 3 4 5 1 2 3 4 5
10 Unit Scheme 15 Unit Scheme 20 Unit Scheme 50 Unit Scheme 100 Unit Scheme 500 Unit Scheme
Resid
ual Lan
d V
alu
e (£
)
Residual Land Value - 0% Affordable Residual Land Value - 25% Affordable Residual Land Value - 30% Affordable
Residual Land Value - 35% Affordable Residual Land Value - 40% Affordable Residual Land Value - 40% Affordable

Development Scenario /
Threshold Value Point
Residual Land
Value - 0%
Affordable
Residual Land
Value - 25%
Affordable
Residual Land
Value - 30%
Affordable
Residual Land
Value - 35%
Affordable
Residual Land
Value - 40%
Affordable
1 2.0% 0.0% 0.0% 0.0% 0.0%
2 5.7% 0.3% 0.3% 0.0% 0.0%
3 12.7% 9.1% 9.1% 7.4% 7.4%
4 30.4% 25.8% 25.8% 23.9% 23.9%
5 34.7% 30.0% 30.0% 28.2% 28.2%
1 1.6% 0.0% 0.0% 0.0% 0.0%
2 5.3% 0.4% 0.0% 0.0% 0.0%
3 12.2% 8.8% 7.7% 7.7% 7.5%
4 29.7% 25.8% 24.6% 24.6% 23.8%
5 33.9% 29.9% 28.7% 28.7% 27.9%
1 1.5% 0.0% 0.0% 0.0% 0.0%
2 5.1% 0.5% 0.0% 0.0% 0.0%
3 11.9% 8.7% 8.5% 7.7% 6.6%
4 29.6% 25.9% 25.4% 24.5% 23.2%
5 33.9% 30.2% 29.7% 28.8% 27.4%
1 0.9% 0.0% 0.0% 0.0% 0.0%
2 4.3% 0.0% 0.0% 0.0% 0.0%
3 11.1% 7.9% 7.3% 6.4% 5.9%
4 28.3% 24.5% 23.8% 22.7% 22.0%
5 32.3% 28.6% 27.8% 26.8% 25.9%
1 0.0% 0.0% 0.0% 0.0% 0.0%
2 2.7% 0.0% 0.0% 0.0% 0.0%
3 9.3% 6.3% 5.6% 4.9% 4.3%
4 25.8% 22.3% 21.5% 20.6% 19.7%
5 29.7% 26.2% 25.4% 24.5% 23.6%
1 0.0% 0.0% 0.0% 0.0% 0.0%
2 0.0% 0.0% 0.0% 0.0% 0.0%
3 0.0% 0.0% 0.0% 0.0% 0.0%
4 4.3% 3.1% 2.8% 2.5% 2.2%
5 5.6% 4.5% 4.2% 3.9% 3.6%
Source: Adams Integra, August 2012
100 Unit Scheme
500 Unit Scheme
10 Unit Scheme
15 Unit Scheme
20 Unit Scheme
50 Unit Scheme
Table 1a: Summary of Residual Land Value (as % of GDV) Appraisals for
All Value Points
0%, 25%, 30%, 35% and 40% Affordable Housing
70% Social Rent/30% Shared Ownership
Planning Infrastructure Level £0, £0 CIL
Low Density
Appendix 2

Appendix 2
Graph 1a: Summary of Residual Land Values (as % of GDV) at 0%, 25%, 30%, 35% & 40%
Affordable Housing Across all Value Points
70% Social Rent/30% Shared Ownership
Planning Infrastructure Level £0, £0 CIL
Low Density
0.0%
5.0%
10.0%
15.0%
20.0%
25.0%
30.0%
35.0%
40.0%
1 2 3 4 5 1 2 3 4 5 1 2 3 4 5 1 2 3 4 5 1 2 3 4 5 1 2 3 4 5
10 Unit Scheme 15 Unit Scheme 20 Unit Scheme 50 Unit Scheme 100 Unit Scheme 500 Unit Scheme
Resid
ual Lan
d V
alu
e (%
o
f G
DV
)
Residual Land Value - 0% Affordable Residual Land Value - 25% Affordable Residual Land Value - 30% Affordable
Residual Land Value - 35% Affordable Residual Land Value - 40% Affordable

Development Scenario /
Threshold Value Point
Residual Land
Value - 0%
Affordable
Residual Land
Value - 25%
Affordable
Residual Land
Value - 30%
Affordable
Residual Land
Value - 35%
Affordable
Residual Land
Value - 40%
Affordable
1 £166,485 £0 £0 £0 £0
2 £497,130 £26,125 £26,125 £0 £0
3 £1,245,245 £811,602 £811,602 £634,887 £634,887
4 £4,457,998 £3,249,831 £3,249,831 £2,851,042 £2,851,042
5 £5,755,535 £4,216,046 £4,216,046 £3,731,651 £3,731,651
1 £130,393 £0 £0 £0 £0
2 £466,217 £35,871 £0 £0 £0
3 £1,214,208 £799,255 £681,002 £681,002 £659,583
4 £4,394,109 £3,334,676 £3,071,762 £3,071,762 £2,891,494
5 £5,643,913 £4,309,607 £3,990,255 £3,990,255 £3,753,550
1 £122,782 £0 £0 £0 £0
2 £443,452 £37,617 £0 £0 £0
3 £1,172,625 £787,176 £761,264 £673,071 £565,897
4 £4,344,605 £3,358,400 £3,223,957 £3,027,876 £2,764,357
5 £5,620,576 £4,387,281 £4,210,746 £3,972,574 £3,630,330
1 £69,027 £0 £0 £0 £0
2 £369,989 £0 £0 £0 £0
3 £1,072,897 £705,512 £637,884 £552,521 £501,319
4 £4,060,962 £3,105,940 £2,934,814 £2,722,571 £2,567,870
5 £5,229,788 £4,033,575 £3,815,483 £3,554,153 £3,352,487
1 £0 £0 £0 £0 £0
2 £232,187 £0 £0 £0 £0
3 £897,941 £556,658 £492,333 £420,272 £359,497
4 £3,712,785 £2,828,944 £2,656,108 £2,475,535 £2,306,248
5 £4,813,853 £3,703,802 £3,485,724 £3,259,909 £3,045,380
1 £0 £0 £0 £0 £0
2 £0 £0 £0 £0 £0
3 £0 £0 £0 £0 £0
4 £584,255 £371,915 £329,228 £286,907 £244,220
5 £878,710 £611,143 £557,180 £503,967 £450,003
Source: Adams Integra, August 2012
100 Unit Scheme
500 Unit Scheme
10 Unit Scheme
15 Unit Scheme
20 Unit Scheme
50 Unit Scheme
Table 1b: Summary of Residual Land Value (value per Hectare) Appraisals for
All Value Points
0%, 25%, 30%, 35% and 40% Affordable Housing
70% Social Rent/30% Shared Ownership
Planning Infrastructure Level £0, £0 CIL
Low Density
Appendix 2

Appendix 2
Graph 1b: Summary of Residual Land Values (value per Hectare) at 0%, 25%, 30%, 35% &
40% Affordable Housing Across all Value Points
70% Social Rent/30% Shared Ownership
Planning Infrastructure Level £0, £0 CIL
Low Density
£0
£500,000
£1,000,000
£1,500,000
£2,000,000
£2,500,000
£3,000,000
£3,500,000
£4,000,000
£4,500,000
£5,000,000
£5,500,000
£6,000,000
1 2 3 4 5 1 2 3 4 5 1 2 3 4 5 1 2 3 4 5 1 2 3 4 5 1 2 3 4 5
10 Unit Scheme 15 Unit Scheme 20 Unit Scheme 50 Unit Scheme 100 Unit Scheme 500 Unit Scheme
Resid
ual Lan
d V
alu
e (%
o
f G
DV
)
Residual Land Value - 0% Affordable Residual Land Value - 25% Affordable Residual Land Value - 30% Affordable
Residual Land Value - 35% Affordable Residual Land Value - 40% Affordable

Development Scenario /
Threshold Value Point
Residual Land
Value - 0%
Affordable
Residual Land
Value - 25%
Affordable
Residual Land
Value - 30%
Affordable
Residual Land
Value - 35%
Affordable
Residual Land
Value - 40%
Affordable
1 £44,240 £0 £0 £0 £0
2 £98,340 £0 £0 £0 £0
3 £247,171 £150,422 £150,422 £94,244 £94,244
4 £842,290 £590,981 £590,981 £461,755 £461,755
5 £1,108,554 £794,855 £794,855 £620,841 £620,841
1 £63,209 £0 £0 £0 £0
2 £147,635 £0 £0 £0 £0
3 £379,298 £229,914 £184,655 £184,655 £173,088
4 £1,362,274 £981,248 £882,655 £882,655 £815,055
5 £1,823,509 £1,341,200 £1,221,443 £1,221,443 £1,132,678
1 £77,041 £0 £0 £0 £0
2 £186,174 £0 £0 £0 £0
3 £473,872 £275,040 £262,084 £222,483 £169,485
4 £1,727,245 £1,234,143 £1,166,922 £1,068,881 £937,122
5 £2,276,377 £1,659,729 £1,571,462 £1,452,376 £1,281,254
1 £97,871 £0 £0 £0 £0
2 £342,340 £0 £0 £0 £0
3 £1,046,254 £578,856 £504,960 £400,618 £335,949
4 £3,880,800 £2,745,582 £2,580,158 £2,351,402 £2,158,026
5 £5,134,087 £3,702,582 £3,497,986 £3,209,606 £2,957,524
1 £57,485 £0 £0 £0 £0
2 £498,908 £0 £0 £0 £0
3 £1,762,823 £956,876 £807,638 £639,057 £491,539
4 £6,678,064 £4,930,424 £4,558,920 £4,168,073 £3,831,444
5 £8,935,922 £6,751,601 £6,277,758 £5,784,574 £5,370,160
1 £0 £0 £0 £0 £0
2 £0 £0 £0 £0 £0
3 £0 £0 £0 £0 £0
4 £6,022,881 £3,691,550 £3,240,807 £2,763,685 £2,300,782
5 £9,359,107 £6,434,763 £5,867,774 £5,269,668 £4,688,171
Source: Adams Integra, August 2012
100 Unit Scheme
500 Unit Scheme
10 Unit Scheme
15 Unit Scheme
20 Unit Scheme
50 Unit Scheme
Table 2: Summary of Residual Land Value (£) Appraisals for
All Value Points
0%, 25%, 30%, 35% and 40% Affordable Housing
70% Social Rent/30% Shared Ownership
Planning Infrastructure Level £0, £0 CIL
Medium Density
Appendix 2
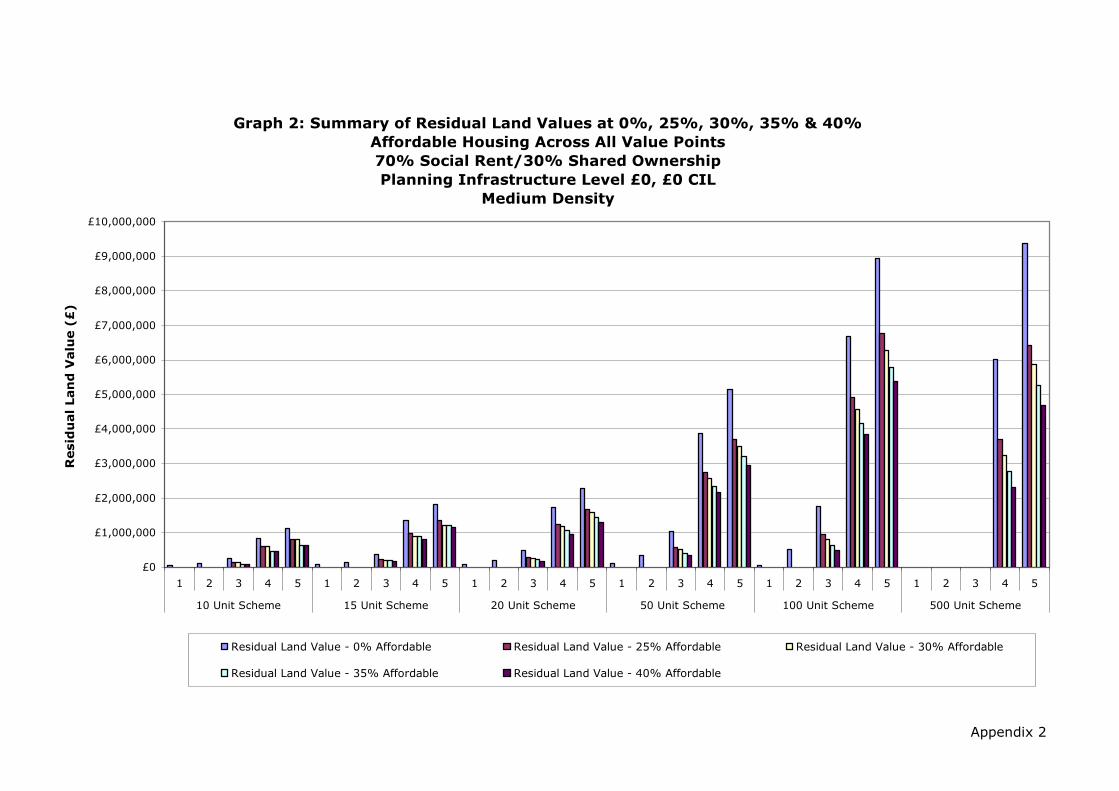
Appendix 2
Graph 2: Summary of Residual Land Values at 0%, 25%, 30%, 35% & 40%
Affordable Housing Across All Value Points
70% Social Rent/30% Shared Ownership
Planning Infrastructure Level £0, £0 CIL
Medium Density
£0
£1,000,000
£2,000,000
£3,000,000
£4,000,000
£5,000,000
£6,000,000
£7,000,000
£8,000,000
£9,000,000
£10,000,000
1 2 3 4 5 1 2 3 4 5 1 2 3 4 5 1 2 3 4 5 1 2 3 4 5 1 2 3 4 5
10 Unit Scheme 15 Unit Scheme 20 Unit Scheme 50 Unit Scheme 100 Unit Scheme 500 Unit Scheme
Resid
ual Lan
d V
alu
e (£
)
Residual Land Value - 0% Affordable Residual Land Value - 25% Affordable Residual Land Value - 30% Affordable
Residual Land Value - 35% Affordable Residual Land Value - 40% Affordable
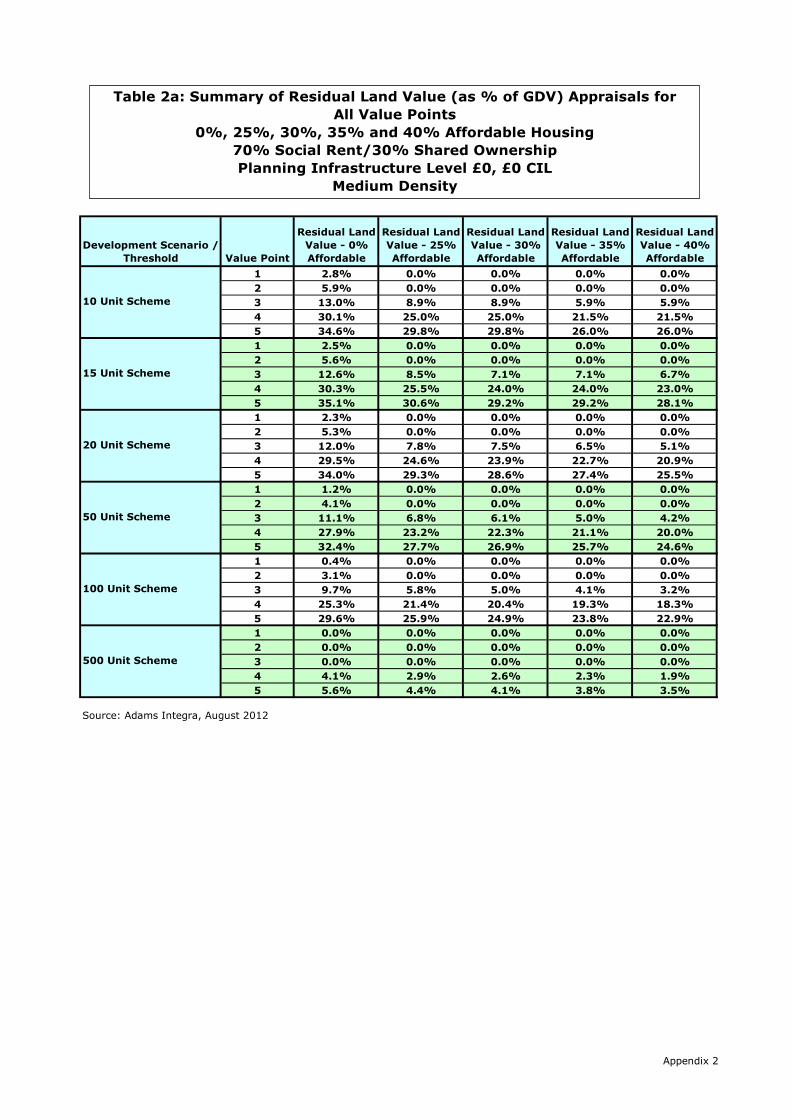
Development Scenario /
Threshold Value Point
Residual Land
Value - 0%
Affordable
Residual Land
Value - 25%
Affordable
Residual Land
Value - 30%
Affordable
Residual Land
Value - 35%
Affordable
Residual Land
Value - 40%
Affordable
1 2.8% 0.0% 0.0% 0.0% 0.0%
2 5.9% 0.0% 0.0% 0.0% 0.0%
3 13.0% 8.9% 8.9% 5.9% 5.9%
4 30.1% 25.0% 25.0% 21.5% 21.5%
5 34.6% 29.8% 29.8% 26.0% 26.0%
1 2.5% 0.0% 0.0% 0.0% 0.0%
2 5.6% 0.0% 0.0% 0.0% 0.0%
3 12.6% 8.5% 7.1% 7.1% 6.7%
4 30.3% 25.5% 24.0% 24.0% 23.0%
5 35.1% 30.6% 29.2% 29.2% 28.1%
1 2.3% 0.0% 0.0% 0.0% 0.0%
2 5.3% 0.0% 0.0% 0.0% 0.0%
3 12.0% 7.8% 7.5% 6.5% 5.1%
4 29.5% 24.6% 23.9% 22.7% 20.9%
5 34.0% 29.3% 28.6% 27.4% 25.5%
1 1.2% 0.0% 0.0% 0.0% 0.0%
2 4.1% 0.0% 0.0% 0.0% 0.0%
3 11.1% 6.8% 6.1% 5.0% 4.2%
4 27.9% 23.2% 22.3% 21.1% 20.0%
5 32.4% 27.7% 26.9% 25.7% 24.6%
1 0.4% 0.0% 0.0% 0.0% 0.0%
2 3.1% 0.0% 0.0% 0.0% 0.0%
3 9.7% 5.8% 5.0% 4.1% 3.2%
4 25.3% 21.4% 20.4% 19.3% 18.3%
5 29.6% 25.9% 24.9% 23.8% 22.9%
1 0.0% 0.0% 0.0% 0.0% 0.0%
2 0.0% 0.0% 0.0% 0.0% 0.0%
3 0.0% 0.0% 0.0% 0.0% 0.0%
4 4.1% 2.9% 2.6% 2.3% 1.9%
5 5.6% 4.4% 4.1% 3.8% 3.5%
Source: Adams Integra, August 2012
100 Unit Scheme
500 Unit Scheme
10 Unit Scheme
15 Unit Scheme
20 Unit Scheme
50 Unit Scheme
Table 2a: Summary of Residual Land Value (as % of GDV) Appraisals for
All Value Points
0%, 25%, 30%, 35% and 40% Affordable Housing
70% Social Rent/30% Shared Ownership
Planning Infrastructure Level £0, £0 CIL
Medium Density
Appendix 2
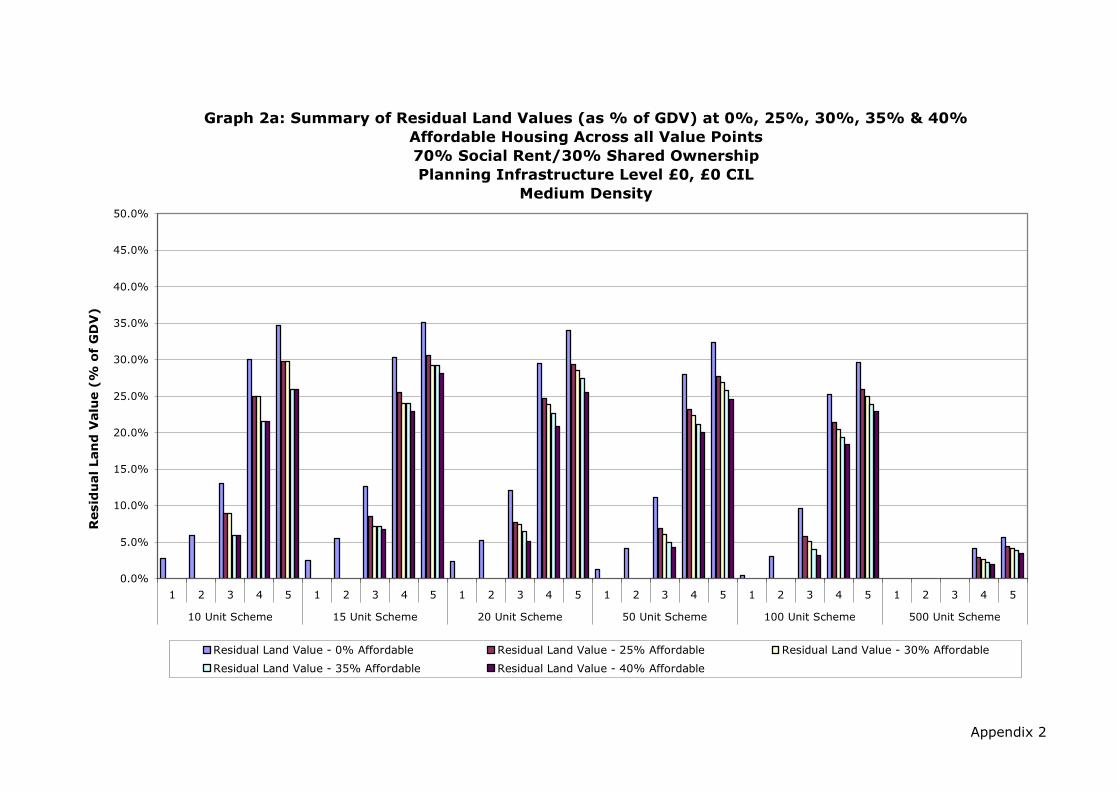
Appendix 2
Graph 2a: Summary of Residual Land Values (as % of GDV) at 0%, 25%, 30%, 35% & 40%
Affordable Housing Across all Value Points
70% Social Rent/30% Shared Ownership
Planning Infrastructure Level £0, £0 CIL
Medium Density
0.0%
5.0%
10.0%
15.0%
20.0%
25.0%
30.0%
35.0%
40.0%
45.0%
50.0%
1 2 3 4 5 1 2 3 4 5 1 2 3 4 5 1 2 3 4 5 1 2 3 4 5 1 2 3 4 5
10 Unit Scheme 15 Unit Scheme 20 Unit Scheme 50 Unit Scheme 100 Unit Scheme 500 Unit Scheme
Resid
ual Lan
d V
alu
e (%
o
f G
DV
)
Residual Land Value - 0% Affordable Residual Land Value - 25% Affordable Residual Land Value - 30% Affordable
Residual Land Value - 35% Affordable Residual Land Value - 40% Affordable

Development Scenario /
Threshold Value Point
Residual Land
Value - 0%
Affordable
Residual Land
Value - 25%
Affordable
Residual Land
Value - 30%
Affordable
Residual Land
Value - 35%
Affordable
Residual Land
Value - 40%
Affordable
1 £199,079 £0 £0 £0 £0
2 £442,528 £0 £0 £0 £0
3 £1,112,271 £676,901 £676,901 £424,098 £424,098
4 £3,790,305 £2,659,414 £2,659,414 £2,077,896 £2,077,896
5 £4,988,493 £3,576,849 £3,576,849 £2,793,785 £2,793,785
1 £189,628 £0 £0 £0 £0
2 £442,904 £0 £0 £0 £0
3 £1,137,895 £689,743 £553,966 £553,966 £519,265
4 £4,086,822 £2,943,743 £2,647,965 £2,647,965 £2,445,164
5 £5,470,526 £4,023,599 £3,664,328 £3,664,328 £3,398,034
1 £173,342 £0 £0 £0 £0
2 £418,892 £0 £0 £0 £0
3 £1,066,213 £618,841 £589,689 £500,586 £381,342
4 £3,886,302 £2,776,822 £2,625,574 £2,404,983 £2,108,524
5 £5,121,849 £3,734,391 £3,535,790 £3,267,846 £2,882,821
1 £88,084 £0 £0 £0 £0
2 £308,106 £0 £0 £0 £0
3 £941,628 £520,970 £454,464 £360,556 £302,354
4 £3,492,720 £2,471,024 £2,322,142 £2,116,262 £1,942,224
5 £4,620,678 £3,332,324 £3,148,188 £2,888,646 £2,661,772
1 £25,868 £0 £0 £0 £0
2 £224,509 £0 £0 £0 £0
3 £793,270 £430,594 £363,437 £287,576 £221,193
4 £3,005,129 £2,218,691 £2,051,514 £1,875,633 £1,724,150
5 £4,021,165 £3,038,220 £2,824,991 £2,603,058 £2,416,572
1 £0 £0 £0 £0 £0
2 £0 £0 £0 £0 £0
3 £0 £0 £0 £0 £0
4 £542,059 £332,240 £291,673 £248,732 £207,070
5 £842,320 £579,129 £528,100 £474,270 £421,935
Source: Adams Integra, August 2012
100 Unit Scheme
500 Unit Scheme
10 Unit Scheme
15 Unit Scheme
20 Unit Scheme
50 Unit Scheme
Table 2b: Summary of Residual Land Value (value per Hectare) Appraisals for
All Value Points
0%, 25%, 30%, 35% and 40% Affordable Housing
70% Social Rent/30% Shared Ownership
Planning Infrastructure Level £0, £0 CIL
Medium Density
Appendix 2

Appendix 2
Graph 2b: Summary of Residual Land Values (value per Hectare) at 0%, 25%, 30%, 35% &
40% Affordable Housing Across all Value Points
70% Social Rent/30% Shared Ownership
Planning Infrastructure Level £0, £0 CIL
Medium Density
£0
£500,000
£1,000,000
£1,500,000
£2,000,000
£2,500,000
£3,000,000
£3,500,000
£4,000,000
£4,500,000
£5,000,000
£5,500,000
£6,000,000
1 2 3 4 5 1 2 3 4 5 1 2 3 4 5 1 2 3 4 5 1 2 3 4 5 1 2 3 4 5
10 Unit Scheme 15 Unit Scheme 20 Unit Scheme 50 Unit Scheme 100 Unit Scheme 500 Unit Scheme
Resid
ual Lan
d V
alu
e (%
o
f G
DV
)
Residual Land Value - 0% Affordable Residual Land Value - 25% Affordable Residual Land Value - 30% Affordable
Residual Land Value - 35% Affordable Residual Land Value - 40% Affordable
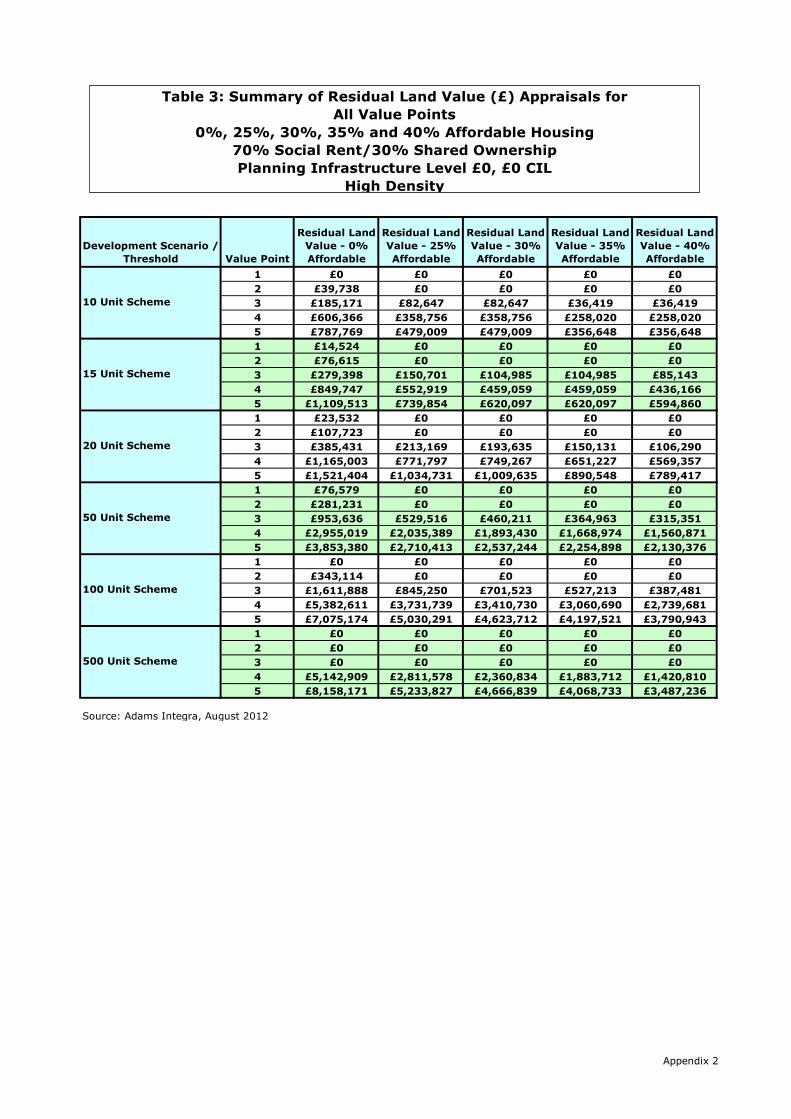
Development Scenario /
Threshold Value Point
Residual Land
Value - 0%
Affordable
Residual Land
Value - 25%
Affordable
Residual Land
Value - 30%
Affordable
Residual Land
Value - 35%
Affordable
Residual Land
Value - 40%
Affordable
1 £0 £0 £0 £0 £0
2 £39,738 £0 £0 £0 £0
3 £185,171 £82,647 £82,647 £36,419 £36,419
4 £606,366 £358,756 £358,756 £258,020 £258,020
5 £787,769 £479,009 £479,009 £356,648 £356,648
1 £14,524 £0 £0 £0 £0
2 £76,615 £0 £0 £0 £0
3 £279,398 £150,701 £104,985 £104,985 £85,143
4 £849,747 £552,919 £459,059 £459,059 £436,166
5 £1,109,513 £739,854 £620,097 £620,097 £594,860
1 £23,532 £0 £0 £0 £0
2 £107,723 £0 £0 £0 £0
3 £385,431 £213,169 £193,635 £150,131 £106,290
4 £1,165,003 £771,797 £749,267 £651,227 £569,357
5 £1,521,404 £1,034,731 £1,009,635 £890,548 £789,417
1 £76,579 £0 £0 £0 £0
2 £281,231 £0 £0 £0 £0
3 £953,636 £529,516 £460,211 £364,963 £315,351
4 £2,955,019 £2,035,389 £1,893,430 £1,668,974 £1,560,871
5 £3,853,380 £2,710,413 £2,537,244 £2,254,898 £2,130,376
1 £0 £0 £0 £0 £0
2 £343,114 £0 £0 £0 £0
3 £1,611,888 £845,250 £701,523 £527,213 £387,481
4 £5,382,611 £3,731,739 £3,410,730 £3,060,690 £2,739,681
5 £7,075,174 £5,030,291 £4,623,712 £4,197,521 £3,790,943
1 £0 £0 £0 £0 £0
2 £0 £0 £0 £0 £0
3 £0 £0 £0 £0 £0
4 £5,142,909 £2,811,578 £2,360,834 £1,883,712 £1,420,810
5 £8,158,171 £5,233,827 £4,666,839 £4,068,733 £3,487,236
Source: Adams Integra, August 2012
100 Unit Scheme
500 Unit Scheme
10 Unit Scheme
15 Unit Scheme
20 Unit Scheme
50 Unit Scheme
Table 3: Summary of Residual Land Value (£) Appraisals for
All Value Points
0%, 25%, 30%, 35% and 40% Affordable Housing
70% Social Rent/30% Shared Ownership
Planning Infrastructure Level £0, £0 CIL
High Density
Appendix 2
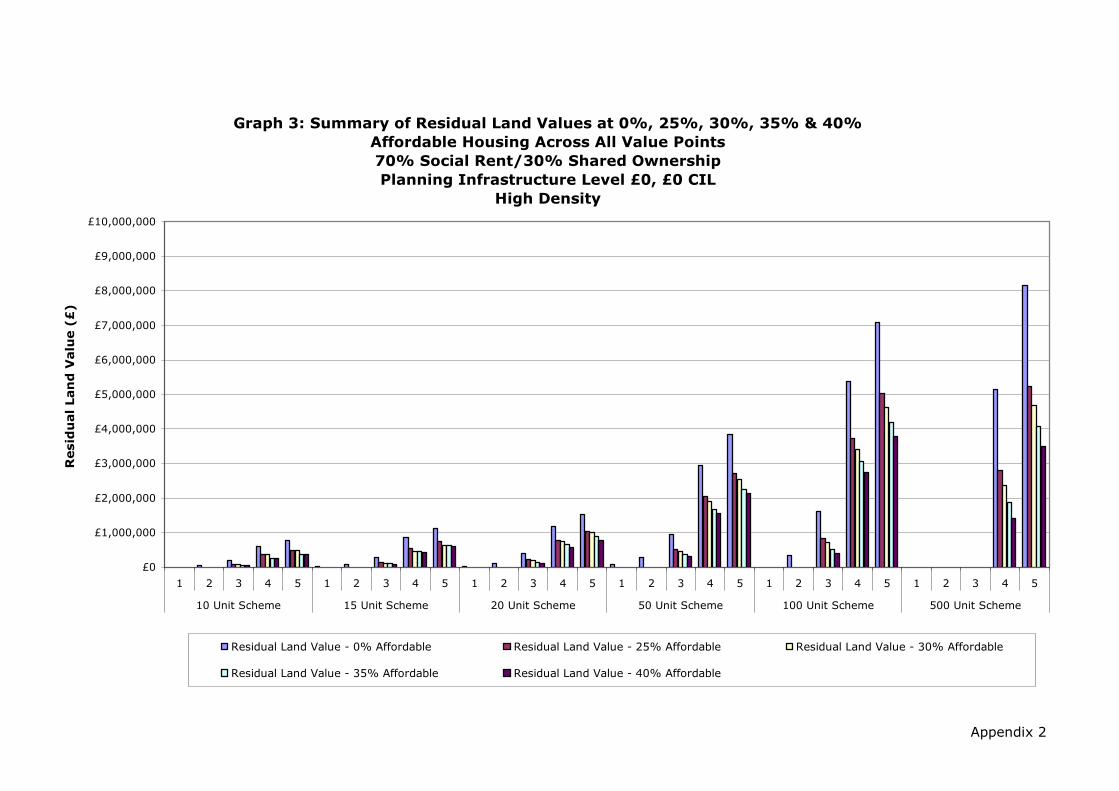
Appendix 2
Graph 3: Summary of Residual Land Values at 0%, 25%, 30%, 35% & 40%
Affordable Housing Across All Value Points
70% Social Rent/30% Shared Ownership
Planning Infrastructure Level £0, £0 CIL
High Density
£0
£1,000,000
£2,000,000
£3,000,000
£4,000,000
£5,000,000
£6,000,000
£7,000,000
£8,000,000
£9,000,000
£10,000,000
1 2 3 4 5 1 2 3 4 5 1 2 3 4 5 1 2 3 4 5 1 2 3 4 5 1 2 3 4 5
10 Unit Scheme 15 Unit Scheme 20 Unit Scheme 50 Unit Scheme 100 Unit Scheme 500 Unit Scheme
Resid
ual Lan
d V
alu
e (£
)
Residual Land Value - 0% Affordable Residual Land Value - 25% Affordable Residual Land Value - 30% Affordable
Residual Land Value - 35% Affordable Residual Land Value - 40% Affordable

Development Scenario /
Threshold Value Point
Residual Land
Value - 0%
Affordable
Residual Land
Value - 25%
Affordable
Residual Land
Value - 30%
Affordable
Residual Land
Value - 35%
Affordable
Residual Land
Value - 40%
Affordable
1 0.0% 0.0% 0.0% 0.0% 0.0%
2 2.9% 0.0% 0.0% 0.0% 0.0%
3 11.6% 6.0% 6.0% 2.8% 2.8%
4 27.1% 19.9% 19.9% 15.8% 15.8%
5 31.4% 24.2% 24.2% 20.1% 20.1%
1 0.8% 0.0% 0.0% 0.0% 0.0%
2 3.8% 0.0% 0.0% 0.0% 0.0%
3 12.0% 7.3% 5.3% 5.3% 4.4%
4 26.6% 20.7% 18.3% 18.3% 17.8%
5 30.9% 25.0% 22.5% 22.5% 22.0%
1 0.9% 0.0% 0.0% 0.0% 0.0%
2 4.0% 0.0% 0.0% 0.0% 0.0%
3 12.2% 7.6% 7.0% 5.6% 4.1%
4 26.8% 21.1% 20.8% 19.0% 17.3%
5 31.1% 25.5% 25.2% 23.4% 21.7%
1 1.1% 0.0% 0.0% 0.0% 0.0%
2 4.0% 0.0% 0.0% 0.0% 0.0%
3 11.8% 7.3% 6.5% 5.3% 4.7%
4 26.3% 21.3% 20.3% 18.8% 18.0%
5 30.5% 25.5% 24.6% 23.0% 22.3%
1 0.0% 0.0% 0.0% 0.0% 0.0%
2 2.4% 0.0% 0.0% 0.0% 0.0%
3 10.0% 5.8% 5.0% 3.8% 2.9%
4 24.0% 19.4% 18.3% 17.0% 15.8%
5 28.0% 23.5% 22.4% 21.1% 19.9%
1 0.0% 0.0% 0.0% 0.0% 0.0%
2 0.0% 0.0% 0.0% 0.0% 0.0%
3 0.0% 0.0% 0.0% 0.0% 0.0%
4 4.0% 2.5% 2.2% 1.8% 1.4%
5 5.5% 4.1% 3.8% 3.4% 3.0%
Source: Adams Integra, August 2012
100 Unit Scheme
500 Unit Scheme
10 Unit Scheme
15 Unit Scheme
20 Unit Scheme
50 Unit Scheme
Table 3a: Summary of Residual Land Value (as % of GDV) Appraisals for
All Value Points
0%, 25%, 30%, 35% and 40% Affordable Housing
70% Social Rent/30% Shared Ownership
Planning Infrastructure Level £0, £0 CIL
High Density
Appendix 2
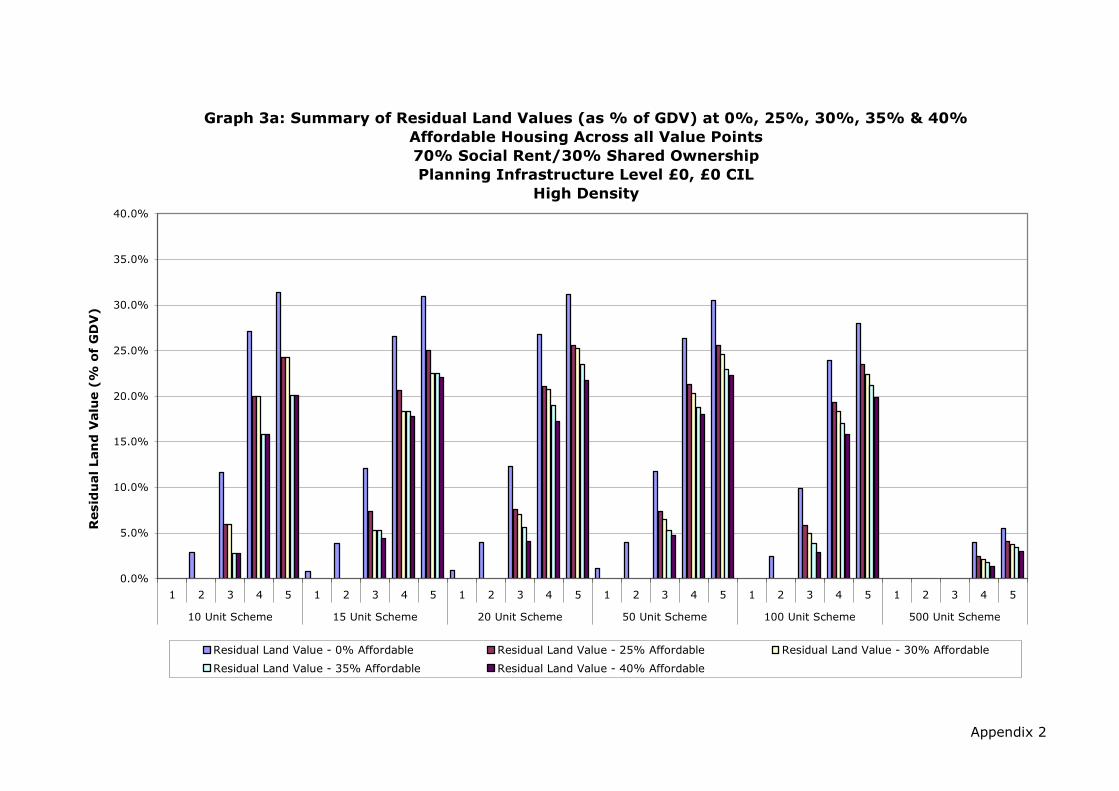
Appendix 2
Graph 3a: Summary of Residual Land Values (as % of GDV) at 0%, 25%, 30%, 35% & 40%
Affordable Housing Across all Value Points
70% Social Rent/30% Shared Ownership
Planning Infrastructure Level £0, £0 CIL
High Density
0.0%
5.0%
10.0%
15.0%
20.0%
25.0%
30.0%
35.0%
40.0%
1 2 3 4 5 1 2 3 4 5 1 2 3 4 5 1 2 3 4 5 1 2 3 4 5 1 2 3 4 5
10 Unit Scheme 15 Unit Scheme 20 Unit Scheme 50 Unit Scheme 100 Unit Scheme 500 Unit Scheme
Resid
ual Lan
d V
alu
e (%
o
f G
DV
)
Residual Land Value - 0% Affordable Residual Land Value - 25% Affordable Residual Land Value - 30% Affordable
Residual Land Value - 35% Affordable Residual Land Value - 40% Affordable

Development Scenario /
Threshold Value Point
Residual Land
Value - 0%
Affordable
Residual Land
Value - 25%
Affordable
Residual Land
Value - 30%
Affordable
Residual Land
Value - 35%
Affordable
Residual Land
Value - 40%
Affordable
1 £0 £0 £0 £0 £0
2 £198,689 £0 £0 £0 £0
3 £925,853 £413,237 £413,237 £182,096 £182,096
4 £3,031,832 £1,793,780 £1,793,780 £1,290,101 £1,290,101
5 £3,938,846 £2,395,044 £2,395,044 £1,783,242 £1,783,242
1 £48,414 £0 £0 £0 £0
2 £255,383 £0 £0 £0 £0
3 £931,328 £502,336 £349,949 £349,949 £283,810
4 £2,832,490 £1,843,063 £1,530,195 £1,530,195 £1,453,887
5 £3,698,375 £2,466,181 £2,066,991 £2,066,991 £1,982,866
1 £58,829 £0 £0 £0 £0
2 £269,308 £0 £0 £0 £0
3 £963,577 £532,922 £484,089 £375,329 £265,724
4 £2,912,507 £1,929,493 £1,873,168 £1,628,067 £1,423,392
5 £3,803,511 £2,586,827 £2,524,086 £2,226,371 £1,973,542
1 £76,579 £0 £0 £0 £0
2 £281,231 £0 £0 £0 £0
3 £953,636 £529,516 £460,211 £364,963 £315,351
4 £2,955,019 £2,035,389 £1,893,430 £1,668,974 £1,560,871
5 £3,853,380 £2,710,413 £2,537,244 £2,254,898 £2,130,376
1 £0 £0 £0 £0 £0
2 £171,557 £0 £0 £0 £0
3 £805,944 £422,625 £350,762 £263,607 £193,741
4 £2,691,305 £1,865,869 £1,705,365 £1,530,345 £1,369,841
5 £3,537,587 £2,515,145 £2,311,856 £2,098,761 £1,895,472
1 £0 £0 £0 £0 £0
2 £0 £0 £0 £0 £0
3 £0 £0 £0 £0 £0
4 £514,291 £281,158 £236,083 £188,371 £142,081
5 £815,817 £523,383 £466,684 £406,873 £348,724
Source: Adams Integra, August 2012
100 Unit Scheme
500 Unit Scheme
10 Unit Scheme
15 Unit Scheme
20 Unit Scheme
50 Unit Scheme
Table 3b: Summary of Residual Land Value (value per Hectare) Appraisals for
All Value Points
0%, 25%, 30%, 35% and 40% Affordable Housing
70% Social Rent/30% Shared Ownership
Planning Infrastructure Level £0, £0 CIL
High Density
Appendix 2
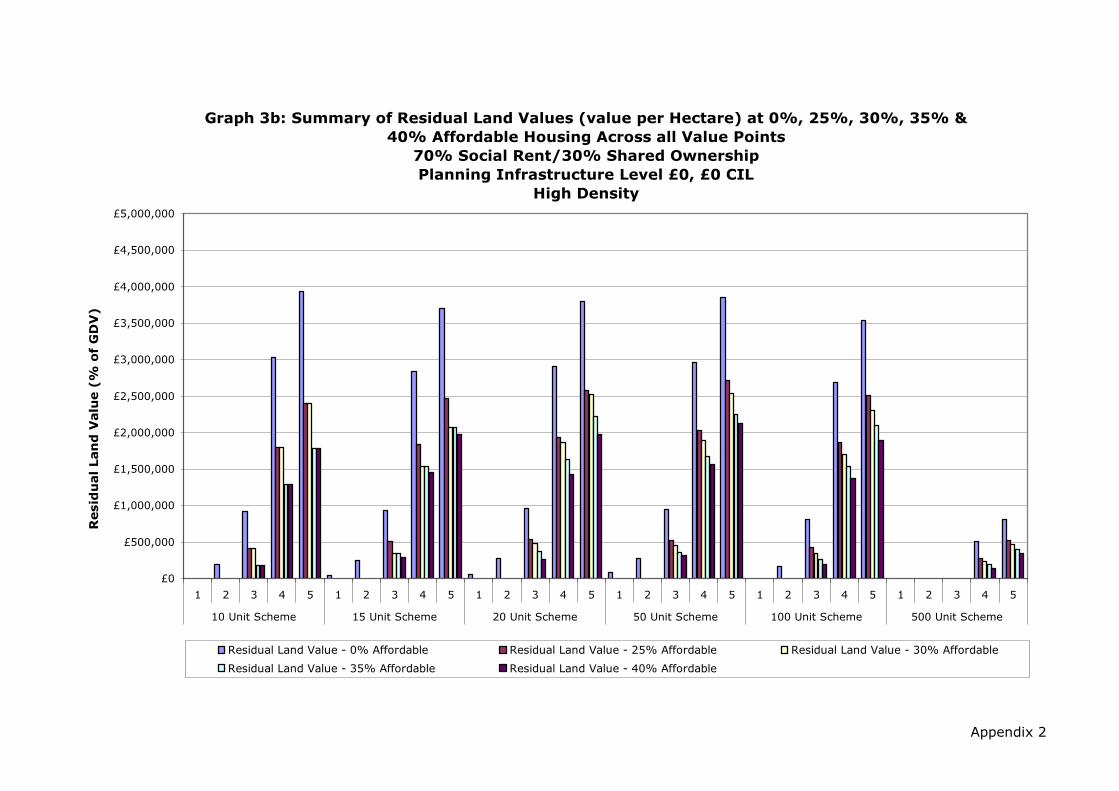
Appendix 2
Graph 3b: Summary of Residual Land Values (value per Hectare) at 0%, 25%, 30%, 35% &
40% Affordable Housing Across all Value Points
70% Social Rent/30% Shared Ownership
Planning Infrastructure Level £0, £0 CIL
High Density
£0
£500,000
£1,000,000
£1,500,000
£2,000,000
£2,500,000
£3,000,000
£3,500,000
£4,000,000
£4,500,000
£5,000,000
1 2 3 4 5 1 2 3 4 5 1 2 3 4 5 1 2 3 4 5 1 2 3 4 5 1 2 3 4 5
10 Unit Scheme 15 Unit Scheme 20 Unit Scheme 50 Unit Scheme 100 Unit Scheme 500 Unit Scheme
Resid
ual Lan
d V
alu
e (%
o
f G
DV
)
Residual Land Value - 0% Affordable Residual Land Value - 25% Affordable Residual Land Value - 30% Affordable
Residual Land Value - 35% Affordable Residual Land Value - 40% Affordable

Appendix 2a
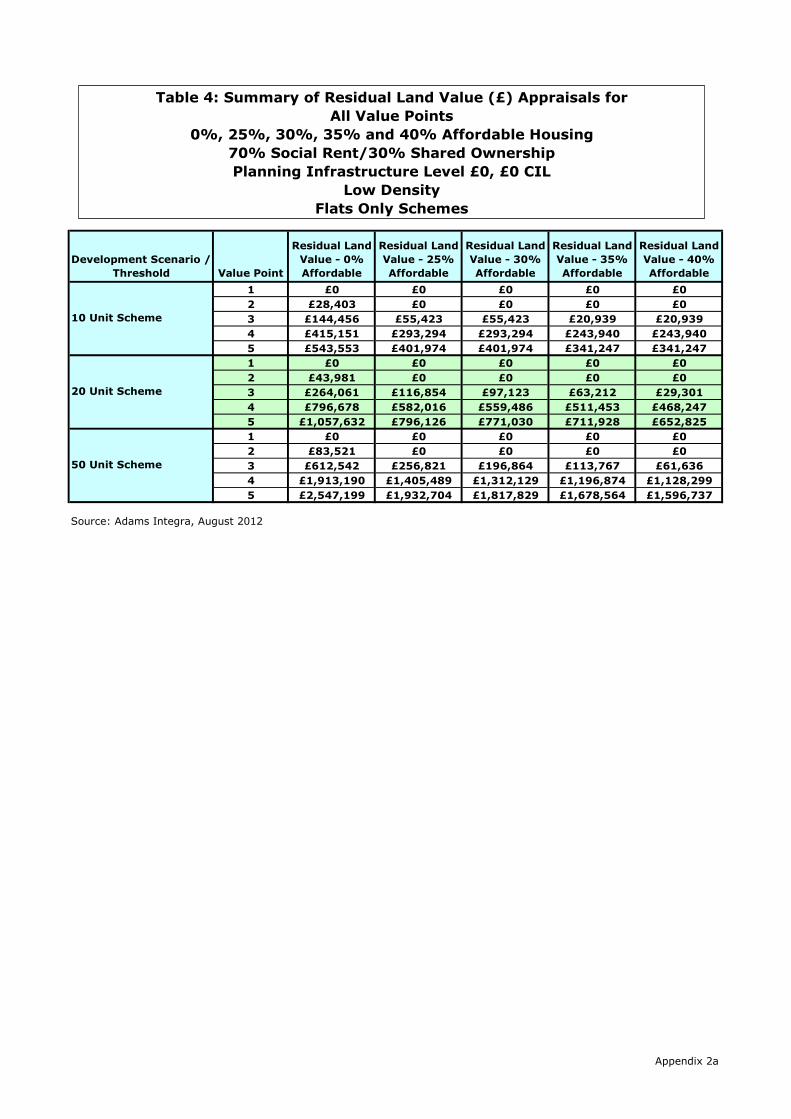
Development Scenario /
Threshold Value Point
Residual Land
Value - 0%
Affordable
Residual Land
Value - 25%
Affordable
Residual Land
Value - 30%
Affordable
Residual Land
Value - 35%
Affordable
Residual Land
Value - 40%
Affordable
1 £0 £0 £0 £0 £0
2 £28,403 £0 £0 £0 £0
3 £144,456 £55,423 £55,423 £20,939 £20,939
4 £415,151 £293,294 £293,294 £243,940 £243,940
5 £543,553 £401,974 £401,974 £341,247 £341,247
1 £0 £0 £0 £0 £0
2 £43,981 £0 £0 £0 £0
3 £264,061 £116,854 £97,123 £63,212 £29,301
4 £796,678 £582,016 £559,486 £511,453 £468,247
5 £1,057,632 £796,126 £771,030 £711,928 £652,825
1 £0 £0 £0 £0 £0
2 £83,521 £0 £0 £0 £0
3 £612,542 £256,821 £196,864 £113,767 £61,636
4 £1,913,190 £1,405,489 £1,312,129 £1,196,874 £1,128,299
5 £2,547,199 £1,932,704 £1,817,829 £1,678,564 £1,596,737
Source: Adams Integra, August 2012
10 Unit Scheme
20 Unit Scheme
50 Unit Scheme
Table 4: Summary of Residual Land Value (£) Appraisals for
All Value Points
0%, 25%, 30%, 35% and 40% Affordable Housing
70% Social Rent/30% Shared Ownership
Planning Infrastructure Level £0, £0 CIL
Low Density
Flats Only Schemes
Appendix 2a

Appendix 2a
Graph 4: Summary of Residual Land Values at 0%, 25%, 30%, 35% & 40%
Affordable Housing Across All Value Points
70% Social Rent/30% Shared Ownership
Planning Infrastructure Level £0, £0 CIL
Low Density
Flats Only Schemes
£0
£250,000
£500,000
£750,000
£1,000,000
£1,250,000
£1,500,000
£1,750,000
£2,000,000
£2,250,000
£2,500,000
£2,750,000
£3,000,000
1 2 3 4 5 1 2 3 4 5 1 2 3 4 5
10 Unit Scheme 20 Unit Scheme 50 Unit Scheme
Resid
ual Lan
d V
alu
e (£
)
Residual Land Value - 0% Affordable Residual Land Value - 25% Affordable Residual Land Value - 30% Affordable
Residual Land Value - 35% Affordable Residual Land Value - 40% Affordable Residual Land Value - 40% Affordable

Development Scenario /
Threshold Value Point
Residual Land
Value - 0%
Affordable
Residual Land
Value - 25%
Affordable
Residual Land
Value - 30%
Affordable
Residual Land
Value - 35%
Affordable
Residual Land
Value - 40%
Affordable
1 0.0% 0.0% 0.0% 0.0% 0.0%
2 2.4% 0.0% 0.0% 0.0% 0.0%
3 10.8% 4.7% 4.7% 1.9% 1.9%
4 23.8% 19.2% 19.2% 16.9% 16.9%
5 27.9% 23.9% 23.9% 21.6% 21.6%
1 0.0% 0.0% 0.0% 0.0% 0.0%
2 1.9% 0.0% 0.0% 0.0% 0.0%
3 9.9% 4.9% 4.1% 2.8% 1.3%
4 22.8% 18.8% 18.3% 17.2% 16.3%
5 27.2% 23.2% 22.9% 21.8% 20.6%
1 0.0% 0.0% 0.0% 0.0% 0.0%
2 1.4% 0.0% 0.0% 0.0% 0.0%
3 9.2% 4.3% 3.4% 2.0% 1.1%
4 21.9% 18.1% 17.3% 16.2% 15.6%
5 26.2% 22.5% 21.7% 20.7% 20.1%
Source: Adams Integra, August 2012
10 Unit Scheme
20 Unit Scheme
50 Unit Scheme
Table 4a: Summary of Residual Land Value (as % of GDV) Appraisals for
All Value Points
0%, 25%, 30%, 35% and 40% Affordable Housing
70% Social Rent/30% Shared Ownership
Planning Infrastructure Level £0, £0 CIL
Low Density
Flats Only Schemes
Appendix 2a

Appendix 2a
Graph 4a: Summary of Residual Land Values (as % of GDV) at 0%, 25%, 30%, 35% & 40%
Affordable Housing Across all Value Points
70% Social Rent/30% Shared Ownership
Planning Infrastructure Level £0, £0 CIL
Low Density
Flats Only Schemes
0.0%
5.0%
10.0%
15.0%
20.0%
25.0%
30.0%
35.0%
40.0%
1 2 3 4 5 1 2 3 4 5 1 2 3 4 5
10 Unit Scheme 20 Unit Scheme 50 Unit Scheme
Resid
ual Lan
d V
alu
e (%
o
f G
DV
)
Residual Land Value - 0% Affordable Residual Land Value - 25% Affordable Residual Land Value - 30% Affordable
Residual Land Value - 35% Affordable Residual Land Value - 40% Affordable

Development Scenario /
Threshold Value Point
Residual Land
Value - 0%
Affordable
Residual Land
Value - 25%
Affordable
Residual Land
Value - 30%
Affordable
Residual Land
Value - 35%
Affordable
Residual Land
Value - 40%
Affordable
1 £0 £0 £0 £0 £0
2 £113,612 £0 £0 £0 £0
3 £577,822 £221,693 £221,693 £83,757 £83,757
4 £1,660,603 £1,173,177 £1,173,177 £975,762 £975,762
5 £2,174,213 £1,607,897 £1,607,897 £1,364,988 £1,364,988
1 £0 £0 £0 £0 £0
2 £87,962 £0 £0 £0 £0
3 £528,123 £233,708 £194,246 £126,424 £58,602
4 £1,593,356 £1,164,032 £1,118,973 £1,022,906 £936,495
5 £2,115,265 £1,592,253 £1,542,061 £1,423,856 £1,305,651
1 £0 £0 £0 £0 £0
2 £66,816 £0 £0 £0 £0
3 £490,034 £205,457 £157,491 £91,013 £49,309
4 £1,530,552 £1,124,392 £1,049,703 £957,499 £902,639
5 £2,037,759 £1,546,163 £1,454,263 £1,342,851 £1,277,390
Source: Adams Integra, August 2012
10 Unit Scheme
20 Unit Scheme
50 Unit Scheme
Table 4b: Summary of Residual Land Value (value per Hectare) Appraisals for
All Value Points
0%, 25%, 30%, 35% and 40% Affordable Housing
70% Social Rent/30% Shared Ownership
Planning Infrastructure Level £0, £0 CIL
Low Density
Flats Only Schemes
Appendix 2a

Appendix 2a
Graph 4b: Summary of Residual Land Values (value per Hectare) at 0%, 25%, 30%, 35% &
40% Affordable Housing Across all Value Points
70% Social Rent/30% Shared Ownership
Planning Infrastructure Level £0, £0 CIL
Low Density
Flats Only Schemes
£0
£250,000
£500,000
£750,000
£1,000,000
£1,250,000
£1,500,000
£1,750,000
£2,000,000
£2,250,000
£2,500,000
£2,750,000
£3,000,000
1 2 3 4 5 1 2 3 4 5 1 2 3 4 5
10 Unit Scheme 20 Unit Scheme 50 Unit Scheme
Resid
ual Lan
d V
alu
e (%
o
f G
DV
)
Residual Land Value - 0% Affordable Residual Land Value - 25% Affordable Residual Land Value - 30% Affordable
Residual Land Value - 35% Affordable Residual Land Value - 40% Affordable

Development Scenario /
Threshold Value Point
Residual Land
Value - 0%
Affordable
Residual Land
Value - 25%
Affordable
Residual Land
Value - 30%
Affordable
Residual Land
Value - 35%
Affordable
Residual Land
Value - 40%
Affordable
1 £8,355 £0 £0 £0 £0
2 £42,407 £0 £0 £0 £0
3 £152,726 £63,694 £63,694 £29,210 £29,210
4 £403,842 £281,985 £281,985 £237,428 £237,428
5 £529,008 £387,278 £387,278 £326,550 £326,550
1 £4,824 £0 £0 £0 £0
2 £71,795 £0 £0 £0 £0
3 £280,103 £133,392 £113,661 £79,750 £45,839
4 £774,927 £560,265 £537,735 £489,702 £446,270
5 £1,029,287 £767,781 £742,685 £683,582 £624,480
1 £0 £0 £0 £0 £0
2 £152,199 £0 £0 £0 £0
3 £652,174 £296,866 £237,734 £155,050 £102,919
4 £1,861,402 £1,353,701 £1,260,341 £1,145,086 £1,076,511
5 £2,479,389 £1,864,894 £1,750,018 £1,610,754 £1,528,927
Source: Adams Integra, August 2012
10 Unit Scheme
20 Unit Scheme
50 Unit Scheme
Table 5: Summary of Residual Land Value (£) Appraisals for
All Value Points
0%, 25%, 30%, 35% and 40% Affordable Housing
70% Social Rent/30% Shared Ownership
Planning Infrastructure Level £0, £0 CIL
Medium Density
Flats Only Schemes
Appendix 2a

Appendix 2a
Graph 5: Summary of Residual Land Values at 0%, 25%, 30%, 35% & 40%
Affordable Housing Across All Value Points
70% Social Rent/30% Shared Ownership
Planning Infrastructure Level £0, £0 CIL
Medium Density
Flats Only Schemes
£0
£250,000
£500,000
£750,000
£1,000,000
£1,250,000
£1,500,000
£1,750,000
£2,000,000
£2,250,000
£2,500,000
£2,750,000
£3,000,000
1 2 3 4 5 1 2 3 4 5 1 2 3 4 5
10 Unit Scheme 20 Unit Scheme 50 Unit Scheme
Resid
ual Lan
d V
alu
e (£
)
Residual Land Value - 0% Affordable Residual Land Value - 25% Affordable Residual Land Value - 30% Affordable
Residual Land Value - 35% Affordable Residual Land Value - 40% Affordable

Development Scenario /
Threshold Value Point
Residual Land
Value - 0%
Affordable
Residual Land
Value - 25%
Affordable
Residual Land
Value - 30%
Affordable
Residual Land
Value - 35%
Affordable
Residual Land
Value - 40%
Affordable
1 0.7% 0.0% 0.0% 0.0% 0.0%
2 3.6% 0.0% 0.0% 0.0% 0.0%
3 11.5% 5.5% 5.5% 2.7% 2.7%
4 23.7% 19.0% 19.0% 17.0% 17.0%
5 27.9% 23.7% 23.7% 21.3% 21.3%
1 0.2% 0.0% 0.0% 0.0% 0.0%
2 3.1% 0.0% 0.0% 0.0% 0.0%
3 10.6% 5.7% 4.9% 3.5% 2.1%
4 22.8% 18.6% 18.2% 17.0% 16.0%
5 27.1% 23.1% 22.7% 21.6% 20.4%
1 0.0% 0.0% 0.0% 0.0% 0.0%
2 2.6% 0.0% 0.0% 0.0% 0.0%
3 9.9% 5.0% 4.1% 2.8% 1.9%
4 21.9% 18.0% 17.1% 16.0% 15.4%
5 26.2% 22.4% 21.5% 20.5% 19.8%
Source: Adams Integra, August 2012
10 Unit Scheme
20 Unit Scheme
50 Unit Scheme
Table 5a: Summary of Residual Land Value (as % of GDV) Appraisals for
All Value Points
0%, 25%, 30%, 35% and 40% Affordable Housing
70% Social Rent/30% Shared Ownership
Planning Infrastructure Level £0, £0 CIL
Medium Density
Flats Only Schemes
Appendix 2a

Appendix 2a
Graph 5a: Summary of Residual Land Values (as % of GDV) at 0%, 25%, 30%, 35% & 40%
Affordable Housing Across all Value Points
70% Social Rent/30% Shared Ownership
Planning Infrastructure Level £0, £0 CIL
Medium Density
Flats Only Schemes
0.0%
5.0%
10.0%
15.0%
20.0%
25.0%
30.0%
35.0%
40.0%
45.0%
50.0%
1 2 3 4 5 1 2 3 4 5 1 2 3 4 5
10 Unit Scheme 20 Unit Scheme 50 Unit Scheme
Resid
ual Lan
d V
alu
e (%
o
f G
DV
)
Residual Land Value - 0% Affordable Residual Land Value - 25% Affordable Residual Land Value - 30% Affordable
Residual Land Value - 35% Affordable Residual Land Value - 40% Affordable
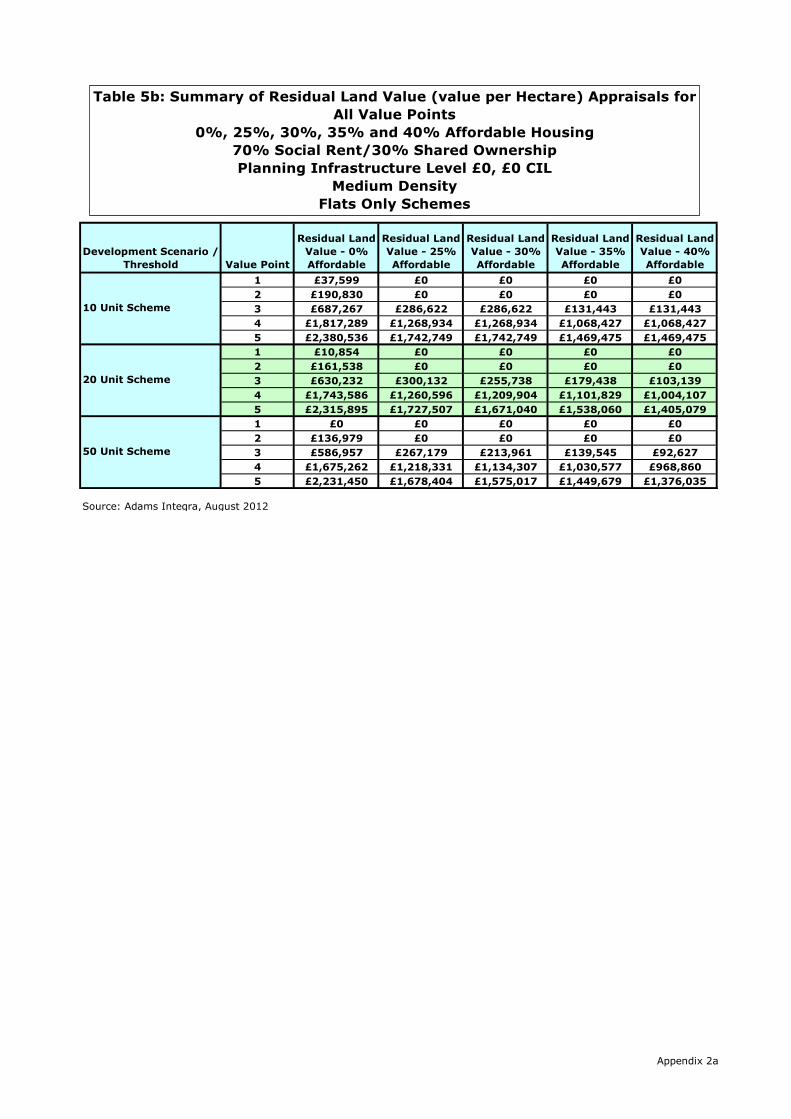
Development Scenario /
Threshold Value Point
Residual Land
Value - 0%
Affordable
Residual Land
Value - 25%
Affordable
Residual Land
Value - 30%
Affordable
Residual Land
Value - 35%
Affordable
Residual Land
Value - 40%
Affordable
1 £37,599 £0 £0 £0 £0
2 £190,830 £0 £0 £0 £0
3 £687,267 £286,622 £286,622 £131,443 £131,443
4 £1,817,289 £1,268,934 £1,268,934 £1,068,427 £1,068,427
5 £2,380,536 £1,742,749 £1,742,749 £1,469,475 £1,469,475
1 £10,854 £0 £0 £0 £0
2 £161,538 £0 £0 £0 £0
3 £630,232 £300,132 £255,738 £179,438 £103,139
4 £1,743,586 £1,260,596 £1,209,904 £1,101,829 £1,004,107
5 £2,315,895 £1,727,507 £1,671,040 £1,538,060 £1,405,079
1 £0 £0 £0 £0 £0
2 £136,979 £0 £0 £0 £0
3 £586,957 £267,179 £213,961 £139,545 £92,627
4 £1,675,262 £1,218,331 £1,134,307 £1,030,577 £968,860
5 £2,231,450 £1,678,404 £1,575,017 £1,449,679 £1,376,035
Source: Adams Integra, August 2012
10 Unit Scheme
20 Unit Scheme
50 Unit Scheme
Table 5b: Summary of Residual Land Value (value per Hectare) Appraisals for
All Value Points
0%, 25%, 30%, 35% and 40% Affordable Housing
70% Social Rent/30% Shared Ownership
Planning Infrastructure Level £0, £0 CIL
Medium Density
Flats Only Schemes
Appendix 2a

Appendix 2a
Graph 5b: Summary of Residual Land Values (value per Hectare) at 0%, 25%, 30%, 35% &
40% Affordable Housing Across all Value Points
70% Social Rent/30% Shared Ownership
Planning Infrastructure Level £0, £0 CIL
Medium Density
Flats Only Schemes
£0
£250,000
£500,000
£750,000
£1,000,000
£1,250,000
£1,500,000
£1,750,000
£2,000,000
£2,250,000
£2,500,000
£2,750,000
£3,000,000
1 2 3 4 5 1 2 3 4 5 1 2 3 4 5
10 Unit Scheme 20 Unit Scheme 50 Unit Scheme
Resid
ual Lan
d V
alu
e (%
o
f G
DV
)
Residual Land Value - 0% Affordable Residual Land Value - 25% Affordable Residual Land Value - 30% Affordable
Residual Land Value - 35% Affordable Residual Land Value - 40% Affordable

Development Scenario /
Threshold Value Point
Residual Land
Value - 0%
Affordable
Residual Land
Value - 25%
Affordable
Residual Land
Value - 30%
Affordable
Residual Land
Value - 35%
Affordable
Residual Land
Value - 40%
Affordable
1 £22,498 £0 £0 £0 £0
2 £56,410 £0 £0 £0 £0
3 £160,996 £71,964 £71,964 £37,480 £37,480
4 £392,533 £270,676 £270,676 £225,886 £225,886
5 £514,463 £372,581 £372,581 £311,853 £311,853
1 £32,911 £0 £0 £0 £0
2 £99,609 £0 £0 £0 £0
3 £296,145 £149,930 £130,199 £96,288 £62,378
4 £753,176 £538,514 £515,984 £472,825 £424,292
5 £1,000,941 £739,435 £714,339 £655,236 £596,134
1 £58,830 £0 £0 £0 £0
2 £218,668 £0 £0 £0 £0
3 £691,806 £336,910 £272,976 £194,369 £144,202
4 £1,809,614 £1,301,913 £1,208,553 £1,093,298 £1,024,723
5 £2,411,579 £1,797,084 £1,682,208 £1,542,944 £1,461,117
Source: Adams Integra, August 2012
10 Unit Scheme
20 Unit Scheme
50 Unit Scheme
Table 6: Summary of Residual Land Value (£) Appraisals for
All Value Points
0%, 25%, 30%, 35% and 40% Affordable Housing
70% Social Rent/30% Shared Ownership
Planning Infrastructure Level £0, £0 CIL
High Density
Flats Only Schemes
Appendix 2a
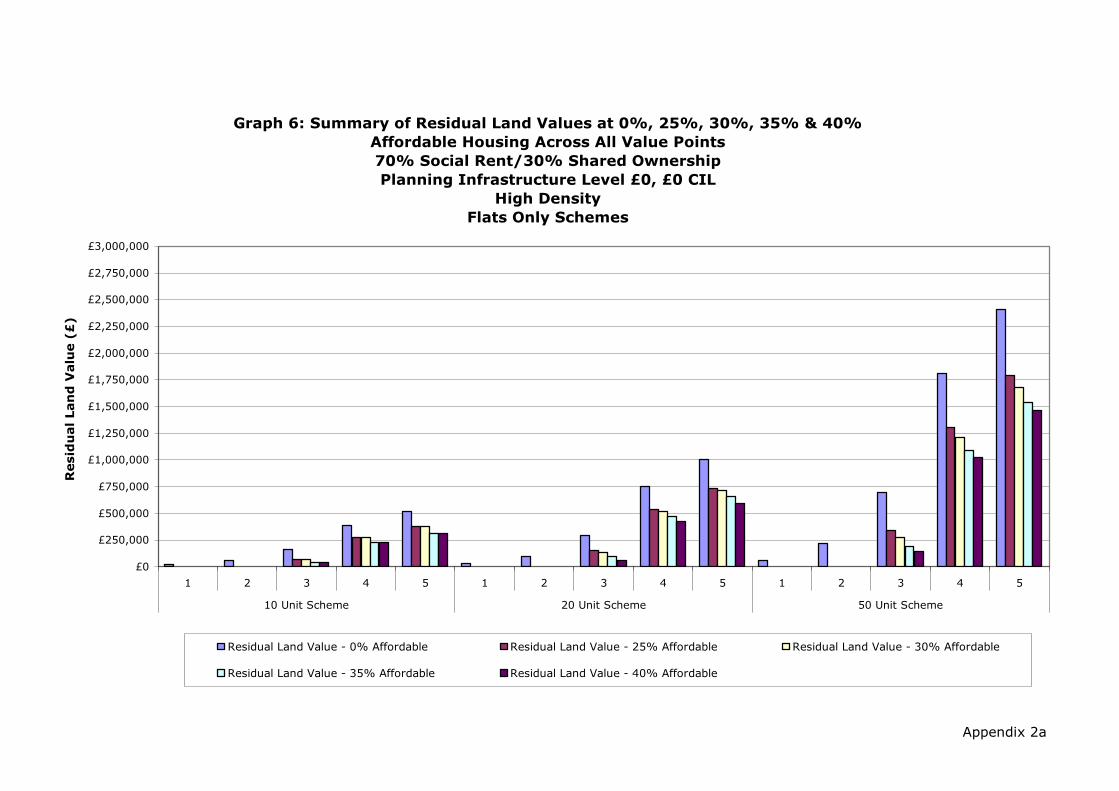
Appendix 2a
Graph 6: Summary of Residual Land Values at 0%, 25%, 30%, 35% & 40%
Affordable Housing Across All Value Points
70% Social Rent/30% Shared Ownership
Planning Infrastructure Level £0, £0 CIL
High Density
Flats Only Schemes
£0
£250,000
£500,000
£750,000
£1,000,000
£1,250,000
£1,500,000
£1,750,000
£2,000,000
£2,250,000
£2,500,000
£2,750,000
£3,000,000
1 2 3 4 5 1 2 3 4 5 1 2 3 4 5
10 Unit Scheme 20 Unit Scheme 50 Unit Scheme
Resid
ual Lan
d V
alu
e (£
)
Residual Land Value - 0% Affordable Residual Land Value - 25% Affordable Residual Land Value - 30% Affordable
Residual Land Value - 35% Affordable Residual Land Value - 40% Affordable

Development Scenario /
Threshold Value Point
Residual Land
Value - 0%
Affordable
Residual Land
Value - 25%
Affordable
Residual Land
Value - 30%
Affordable
Residual Land
Value - 35%
Affordable
Residual Land
Value - 40%
Affordable
1 2.0% 0.0% 0.0% 0.0% 0.0%
2 4.9% 0.0% 0.0% 0.0% 0.0%
3 12.3% 6.3% 6.3% 3.5% 3.5%
4 23.7% 18.8% 18.8% 16.7% 16.7%
5 27.9% 23.5% 23.5% 21.0% 21.0%
1 1.5% 0.0% 0.0% 0.0% 0.0%
2 4.3% 0.0% 0.0% 0.0% 0.0%
3 11.3% 6.4% 5.7% 4.3% 2.9%
4 22.7% 18.4% 18.0% 17.0% 15.7%
5 27.1% 22.9% 22.5% 21.3% 20.1%
1 1.1% 0.0% 0.0% 0.0% 0.0%
2 3.8% 0.0% 0.0% 0.0% 0.0%
3 10.6% 5.8% 4.8% 3.5% 2.7%
4 21.8% 17.8% 16.9% 15.8% 15.1%
5 26.1% 22.2% 21.3% 20.2% 19.6%
Source: Adams Integra, August 2012
10 Unit Scheme
20 Unit Scheme
50 Unit Scheme
Table 6a: Summary of Residual Land Value (as % of GDV) Appraisals for
All Value Points
0%, 25%, 30%, 35% and 40% Affordable Housing
70% Social Rent/30% Shared Ownership
Planning Infrastructure Level £0, £0 CIL
High Density
Flats Only Schemes
Appendix 2a
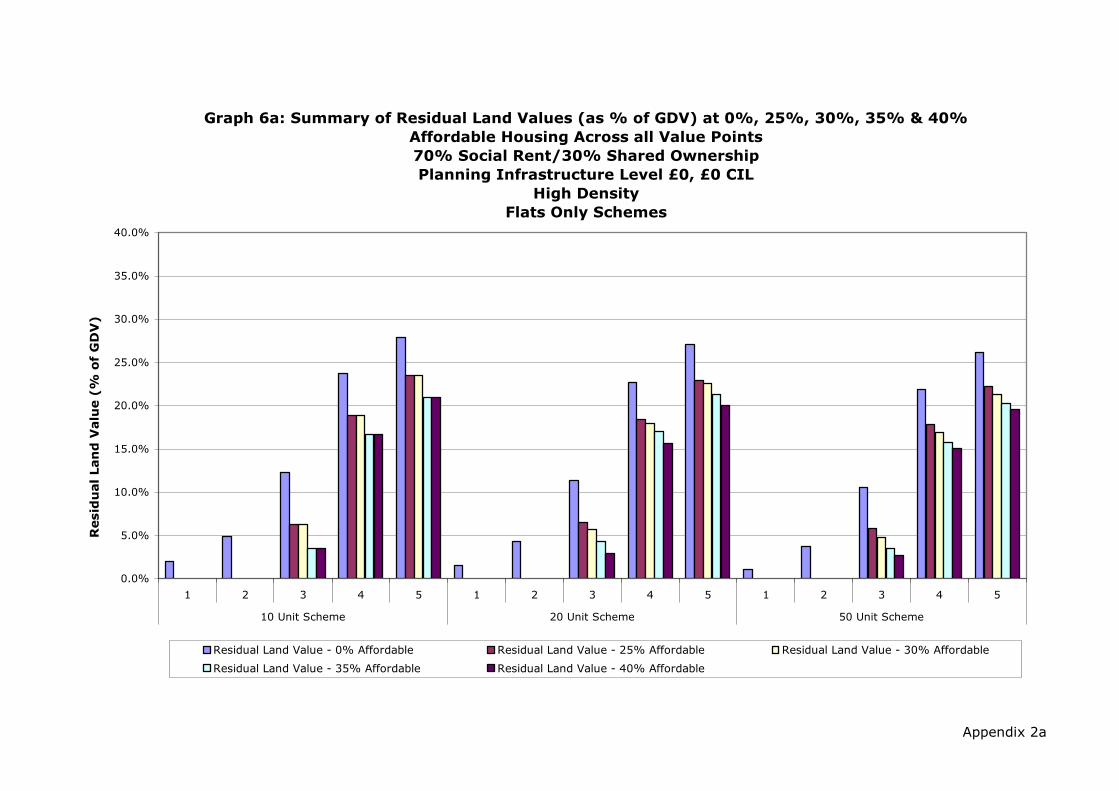
Appendix 2a
Graph 6a: Summary of Residual Land Values (as % of GDV) at 0%, 25%, 30%, 35% & 40%
Affordable Housing Across all Value Points
70% Social Rent/30% Shared Ownership
Planning Infrastructure Level £0, £0 CIL
High Density
Flats Only Schemes
0.0%
5.0%
10.0%
15.0%
20.0%
25.0%
30.0%
35.0%
40.0%
1 2 3 4 5 1 2 3 4 5 1 2 3 4 5
10 Unit Scheme 20 Unit Scheme 50 Unit Scheme
Resid
ual Lan
d V
alu
e (%
o
f G
DV
)
Residual Land Value - 0% Affordable Residual Land Value - 25% Affordable Residual Land Value - 30% Affordable
Residual Land Value - 35% Affordable Residual Land Value - 40% Affordable

Development Scenario /
Threshold Value Point
Residual Land
Value - 0%
Affordable
Residual Land
Value - 25%
Affordable
Residual Land
Value - 30%
Affordable
Residual Land
Value - 35%
Affordable
Residual Land
Value - 40%
Affordable
1 £112,489 £0 £0 £0 £0
2 £282,051 £0 £0 £0 £0
3 £804,982 £359,821 £359,821 £187,400 £187,400
4 £1,962,665 £1,353,382 £1,353,382 £1,129,430 £1,129,430
5 £2,572,314 £1,862,904 £1,862,904 £1,559,267 £1,559,267
1 £82,278 £0 £0 £0 £0
2 £249,021 £0 £0 £0 £0
3 £740,363 £374,825 £325,498 £240,721 £155,944
4 £1,882,939 £1,346,284 £1,289,960 £1,182,063 £1,060,729
5 £2,502,353 £1,848,588 £1,785,847 £1,638,091 £1,490,335
1 £58,830 £0 £0 £0 £0
2 £218,668 £0 £0 £0 £0
3 £691,806 £336,910 £272,976 £194,369 £144,202
4 £1,809,614 £1,301,913 £1,208,553 £1,093,298 £1,024,723
5 £2,411,579 £1,797,084 £1,682,208 £1,542,944 £1,461,117
Source: Adams Integra, August 2012
10 Unit Scheme
20 Unit Scheme
50 Unit Scheme
Table 6b: Summary of Residual Land Value (value per Hectare) Appraisals for
All Value Points
0%, 25%, 30%, 35% and 40% Affordable Housing
70% Social Rent/30% Shared Ownership
Planning Infrastructure Level £0, £0 CIL
High Density
Flats Only Schemes
Appendix 2a

Appendix 2a
Graph 6b: Summary of Residual Land Values (value per Hectare) at 0%, 25%, 30%, 35% &
40% Affordable Housing Across all Value Points
70% Social Rent/30% Shared Ownership
Planning Infrastructure Level £0, £0 CIL
High Density
Flats Only Schemes
£0
£250,000
£500,000
£750,000
£1,000,000
£1,250,000
£1,500,000
£1,750,000
£2,000,000
£2,250,000
£2,500,000
£2,750,000
£3,000,000
1 2 3 4 5 1 2 3 4 5 1 2 3 4 5
10 Unit Scheme 20 Unit Scheme 50 Unit Scheme
Resid
ual Lan
d V
alu
e (%
o
f G
DV
)
Residual Land Value - 0% Affordable Residual Land Value - 25% Affordable Residual Land Value - 30% Affordable
Residual Land Value - 35% Affordable Residual Land Value - 40% Affordable

Appendix 2b
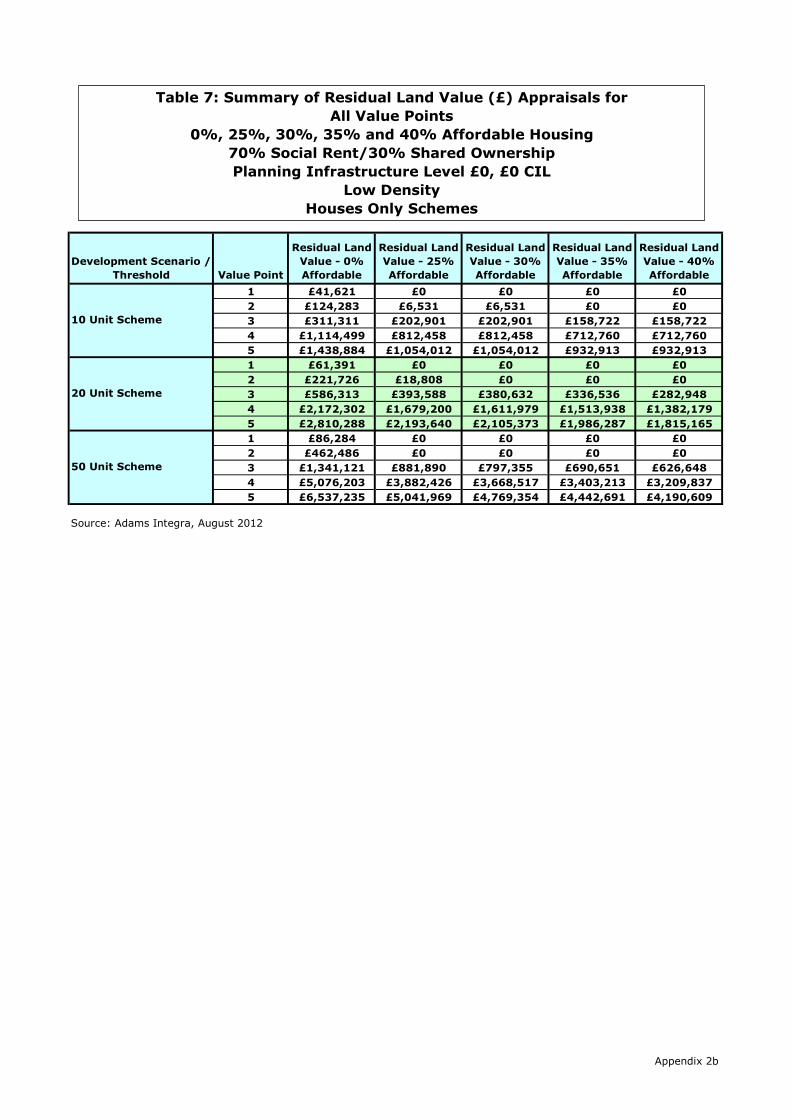
Development Scenario /
Threshold Value Point
Residual Land
Value - 0%
Affordable
Residual Land
Value - 25%
Affordable
Residual Land
Value - 30%
Affordable
Residual Land
Value - 35%
Affordable
Residual Land
Value - 40%
Affordable
1 £41,621 £0 £0 £0 £0
2 £124,283 £6,531 £6,531 £0 £0
3 £311,311 £202,901 £202,901 £158,722 £158,722
4 £1,114,499 £812,458 £812,458 £712,760 £712,760
5 £1,438,884 £1,054,012 £1,054,012 £932,913 £932,913
1 £61,391 £0 £0 £0 £0
2 £221,726 £18,808 £0 £0 £0
3 £586,313 £393,588 £380,632 £336,536 £282,948
4 £2,172,302 £1,679,200 £1,611,979 £1,513,938 £1,382,179
5 £2,810,288 £2,193,640 £2,105,373 £1,986,287 £1,815,165
1 £86,284 £0 £0 £0 £0
2 £462,486 £0 £0 £0 £0
3 £1,341,121 £881,890 £797,355 £690,651 £626,648
4 £5,076,203 £3,882,426 £3,668,517 £3,403,213 £3,209,837
5 £6,537,235 £5,041,969 £4,769,354 £4,442,691 £4,190,609
Source: Adams Integra, August 2012
10 Unit Scheme
20 Unit Scheme
50 Unit Scheme
Table 7: Summary of Residual Land Value (£) Appraisals for
All Value Points
0%, 25%, 30%, 35% and 40% Affordable Housing
70% Social Rent/30% Shared Ownership
Planning Infrastructure Level £0, £0 CIL
Low Density
Houses Only Schemes
Appendix 2b

Appendix 2b
Graph 7: Summary of Residual Land Values at 0%, 25%, 30%, 35% & 40%
Affordable Housing Across All Value Points
70% Social Rent/30% Shared Ownership
Planning Infrastructure Level £0, £0 CIL
Low Density
Houses Only Schemes
£0
£500,000
£1,000,000
£1,500,000
£2,000,000
£2,500,000
£3,000,000
£3,500,000
£4,000,000
£4,500,000
£5,000,000
£5,500,000
£6,000,000
£6,500,000
£7,000,000
£7,500,000
1 2 3 4 5 1 2 3 4 5 1 2 3 4 5
10 Unit Scheme 20 Unit Scheme 50 Unit Scheme
Resid
ual Lan
d V
alu
e (£
)
Residual Land Value - 0% Affordable Residual Land Value - 25% Affordable Residual Land Value - 30% Affordable
Residual Land Value - 35% Affordable Residual Land Value - 40% Affordable Residual Land Value - 40% Affordable

Development Scenario /
Threshold Value Point
Residual Land
Value - 0%
Affordable
Residual Land
Value - 25%
Affordable
Residual Land
Value - 30%
Affordable
Residual Land
Value - 35%
Affordable
Residual Land
Value - 40%
Affordable
1 2.0% 0.0% 0.0% 0.0% 0.0%
2 5.7% 0.3% 0.3% 0.0% 0.0%
3 12.7% 9.1% 9.1% 7.4% 7.4%
4 30.4% 25.8% 25.8% 23.9% 23.9%
5 34.7% 30.0% 30.0% 28.2% 28.2%
1 1.5% 0.0% 0.0% 0.0% 0.0%
2 5.1% 0.5% 0.0% 0.0% 0.0%
3 11.9% 8.7% 8.5% 7.7% 6.6%
4 29.6% 25.9% 25.4% 24.5% 23.2%
5 33.9% 30.2% 29.7% 28.8% 27.4%
1 0.9% 0.0% 0.0% 0.0% 0.0%
2 4.3% 0.0% 0.0% 0.0% 0.0%
3 11.1% 7.9% 7.3% 6.4% 5.9%
4 28.3% 24.5% 23.8% 22.7% 22.0%
5 32.3% 28.6% 27.8% 26.8% 25.9%
Source: Adams Integra, August 2012
10 Unit Scheme
20 Unit Scheme
50 Unit Scheme
Table 7a: Summary of Residual Land Value (as % of GDV) Appraisals for
All Value Points
0%, 25%, 30%, 35% and 40% Affordable Housing
70% Social Rent/30% Shared Ownership
Planning Infrastructure Level £0, £0 CIL
Low Density
Houses Only Schemes
Appendix 2b

Appendix 2b
Graph 7a: Summary of Residual Land Values (as % of GDV) at 0%, 25%, 30%, 35% & 40%
Affordable Housing Across all Value Points
70% Social Rent/30% Shared Ownership
Planning Infrastructure Level £0, £0 CIL
Low Density
Houses Only Schemes
0.0%
5.0%
10.0%
15.0%
20.0%
25.0%
30.0%
35.0%
40.0%
1 2 3 4 5 1 2 3 4 5 1 2 3 4 5
10 Unit Scheme 20 Unit Scheme 50 Unit Scheme
Resid
ual Lan
d V
alu
e (%
o
f G
DV
)
Residual Land Value - 0% Affordable Residual Land Value - 25% Affordable Residual Land Value - 30% Affordable
Residual Land Value - 35% Affordable Residual Land Value - 40% Affordable

Development Scenario /
Threshold Value Point
Residual Land
Value - 0%
Affordable
Residual Land
Value - 25%
Affordable
Residual Land
Value - 30%
Affordable
Residual Land
Value - 35%
Affordable
Residual Land
Value - 40%
Affordable
1 £166,485 £0 £0 £0 £0
2 £497,130 £26,125 £26,125 £0 £0
3 £1,245,245 £811,602 £811,602 £634,887 £634,887
4 £4,457,998 £3,249,831 £3,249,831 £2,851,042 £2,851,042
5 £5,755,535 £4,216,046 £4,216,046 £3,731,651 £3,731,651
1 £122,782 £0 £0 £0 £0
2 £443,452 £37,617 £0 £0 £0
3 £1,172,625 £787,176 £761,264 £673,071 £565,897
4 £4,344,605 £3,358,400 £3,223,957 £3,027,876 £2,764,357
5 £5,620,576 £4,387,281 £4,210,746 £3,972,574 £3,630,330
1 £69,027 £0 £0 £0 £0
2 £369,989 £0 £0 £0 £0
3 £1,072,897 £705,512 £637,884 £552,521 £501,319
4 £4,060,962 £3,105,940 £2,934,814 £2,722,571 £2,567,870
5 £5,229,788 £4,033,575 £3,815,483 £3,554,153 £3,352,487
Source: Adams Integra, August 2012
10 Unit Scheme
20 Unit Scheme
50 Unit Scheme
Table 7b: Summary of Residual Land Value (value per Hectare) Appraisals for
All Value Points
0%, 25%, 30%, 35% and 40% Affordable Housing
70% Social Rent/30% Shared Ownership
Planning Infrastructure Level £0, £0 CIL
Low Density
Houses Only Schemes
Appendix 2b

Appendix 2b
Graph 7b: Summary of Residual Land Values (value per Hectare) at 0%, 25%, 30%, 35% &
40% Affordable Housing Across all Value Points
70% Social Rent/30% Shared Ownership
Planning Infrastructure Level £0, £0 CIL
Low Density
Houses Only Schemes
£0
£500,000
£1,000,000
£1,500,000
£2,000,000
£2,500,000
£3,000,000
£3,500,000
£4,000,000
£4,500,000
£5,000,000
£5,500,000
£6,000,000
1 2 3 4 5 1 2 3 4 5 1 2 3 4 5
10 Unit Scheme 20 Unit Scheme 50 Unit Scheme
Resid
ual Lan
d V
alu
e (%
o
f G
DV
)
Residual Land Value - 0% Affordable Residual Land Value - 25% Affordable Residual Land Value - 30% Affordable
Residual Land Value - 35% Affordable Residual Land Value - 40% Affordable
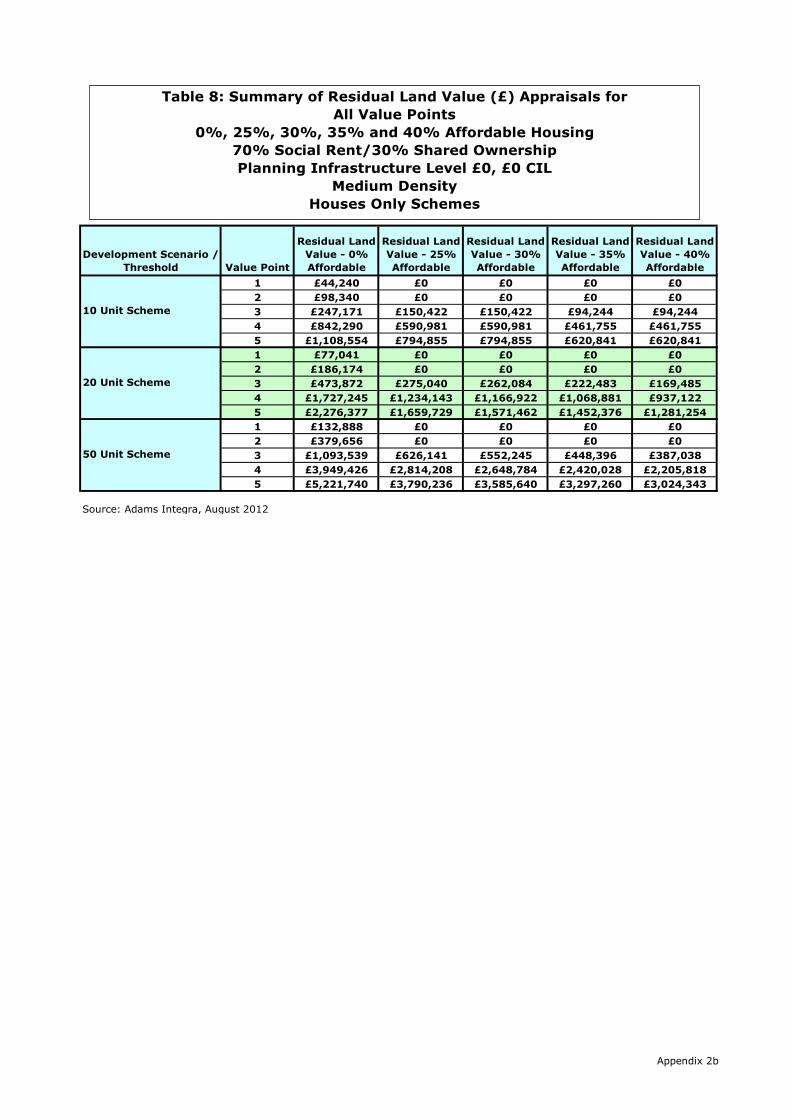
Development Scenario /
Threshold Value Point
Residual Land
Value - 0%
Affordable
Residual Land
Value - 25%
Affordable
Residual Land
Value - 30%
Affordable
Residual Land
Value - 35%
Affordable
Residual Land
Value - 40%
Affordable
1 £44,240 £0 £0 £0 £0
2 £98,340 £0 £0 £0 £0
3 £247,171 £150,422 £150,422 £94,244 £94,244
4 £842,290 £590,981 £590,981 £461,755 £461,755
5 £1,108,554 £794,855 £794,855 £620,841 £620,841
1 £77,041 £0 £0 £0 £0
2 £186,174 £0 £0 £0 £0
3 £473,872 £275,040 £262,084 £222,483 £169,485
4 £1,727,245 £1,234,143 £1,166,922 £1,068,881 £937,122
5 £2,276,377 £1,659,729 £1,571,462 £1,452,376 £1,281,254
1 £132,888 £0 £0 £0 £0
2 £379,656 £0 £0 £0 £0
3 £1,093,539 £626,141 £552,245 £448,396 £387,038
4 £3,949,426 £2,814,208 £2,648,784 £2,420,028 £2,205,818
5 £5,221,740 £3,790,236 £3,585,640 £3,297,260 £3,024,343
Source: Adams Integra, August 2012
10 Unit Scheme
20 Unit Scheme
50 Unit Scheme
Table 8: Summary of Residual Land Value (£) Appraisals for
All Value Points
0%, 25%, 30%, 35% and 40% Affordable Housing
70% Social Rent/30% Shared Ownership
Planning Infrastructure Level £0, £0 CIL
Medium Density
Houses Only Schemes
Appendix 2b

Appendix 2b
Graph 8: Summary of Residual Land Values at 0%, 25%, 30%, 35% & 40%
Affordable Housing Across All Value Points
70% Social Rent/30% Shared Ownership
Planning Infrastructure Level £0, £0 CIL
Medium Density
Houses Only Schemes
£0
£500,000
£1,000,000
£1,500,000
£2,000,000
£2,500,000
£3,000,000
£3,500,000
£4,000,000
£4,500,000
£5,000,000
£5,500,000
£6,000,000
1 2 3 4 5 1 2 3 4 5 1 2 3 4 5
10 Unit Scheme 20 Unit Scheme 50 Unit Scheme
Resid
ual Lan
d V
alu
e (£
)
Residual Land Value - 0% Affordable Residual Land Value - 25% Affordable Residual Land Value - 30% Affordable
Residual Land Value - 35% Affordable Residual Land Value - 40% Affordable

Development Scenario /
Threshold Value Point
Residual Land
Value - 0%
Affordable
Residual Land
Value - 25%
Affordable
Residual Land
Value - 30%
Affordable
Residual Land
Value - 35%
Affordable
Residual Land
Value - 40%
Affordable
1 2.8% 0.0% 0.0% 0.0% 0.0%
2 5.9% 0.0% 0.0% 0.0% 0.0%
3 13.0% 8.9% 8.9% 5.9% 5.9%
4 30.1% 25.0% 25.0% 21.5% 21.5%
5 34.6% 29.8% 29.8% 26.0% 26.0%
1 2.3% 0.0% 0.0% 0.0% 0.0%
2 5.3% 0.0% 0.0% 0.0% 0.0%
3 12.0% 7.8% 7.5% 6.5% 5.1%
4 29.5% 24.6% 23.9% 22.7% 20.9%
5 34.0% 29.3% 28.6% 27.4% 25.5%
1 1.7% 0.0% 0.0% 0.0% 0.0%
2 4.5% 0.0% 0.0% 0.0% 0.0%
3 11.5% 7.3% 6.6% 5.5% 4.8%
4 28.2% 23.5% 22.7% 21.5% 20.3%
5 32.6% 28.1% 27.3% 26.1% 24.9%
Source: Adams Integra, August 2012
10 Unit Scheme
20 Unit Scheme
50 Unit Scheme
Table 8a: Summary of Residual Land Value (as % of GDV) Appraisals for
All Value Points
0%, 25%, 30%, 35% and 40% Affordable Housing
70% Social Rent/30% Shared Ownership
Planning Infrastructure Level £0, £0 CIL
Medium Density
Houses Only Schemes
Appendix 2b

Appendix 2b
Graph 8a: Summary of Residual Land Values (as % of GDV) at 0%, 25%, 30%, 35% & 40%
Affordable Housing Across all Value Points
70% Social Rent/30% Shared Ownership
Planning Infrastructure Level £0, £0 CIL
Medium Density
Houses Only Schemes
0.0%
5.0%
10.0%
15.0%
20.0%
25.0%
30.0%
35.0%
40.0%
45.0%
50.0%
1 2 3 4 5 1 2 3 4 5 1 2 3 4 5
10 Unit Scheme 20 Unit Scheme 50 Unit Scheme
Resid
ual Lan
d V
alu
e (%
o
f G
DV
)
Residual Land Value - 0% Affordable Residual Land Value - 25% Affordable Residual Land Value - 30% Affordable
Residual Land Value - 35% Affordable Residual Land Value - 40% Affordable

Development Scenario /
Threshold Value Point
Residual Land
Value - 0%
Affordable
Residual Land
Value - 25%
Affordable
Residual Land
Value - 30%
Affordable
Residual Land
Value - 35%
Affordable
Residual Land
Value - 40%
Affordable
1 £199,079 £0 £0 £0 £0
2 £442,528 £0 £0 £0 £0
3 £1,112,271 £676,901 £676,901 £424,098 £424,098
4 £3,790,305 £2,659,414 £2,659,414 £2,077,896 £2,077,896
5 £4,988,493 £3,576,849 £3,576,849 £2,793,785 £2,793,785
1 £173,342 £0 £0 £0 £0
2 £418,892 £0 £0 £0 £0
3 £1,066,213 £618,841 £589,689 £500,586 £381,342
4 £3,886,302 £2,776,822 £2,625,574 £2,404,983 £2,108,524
5 £5,121,849 £3,734,391 £3,535,790 £3,267,846 £2,882,821
1 £119,599 £0 £0 £0 £0
2 £341,691 £0 £0 £0 £0
3 £984,185 £563,527 £497,021 £403,556 £348,335
4 £3,554,483 £2,532,787 £2,383,905 £2,178,025 £1,985,237
5 £4,699,566 £3,411,212 £3,227,076 £2,967,534 £2,721,909
Source: Adams Integra, August 2012
10 Unit Scheme
20 Unit Scheme
50 Unit Scheme
Table 8b: Summary of Residual Land Value (value per Hectare) Appraisals for
All Value Points
0%, 25%, 30%, 35% and 40% Affordable Housing
70% Social Rent/30% Shared Ownership
Planning Infrastructure Level £0, £0 CIL
Medium Density
Houses Only Schemes
Appendix 2b

Appendix 2b
Graph 8b: Summary of Residual Land Values (value per Hectare) at 0%, 25%, 30%, 35% &
40% Affordable Housing Across all Value Points
70% Social Rent/30% Shared Ownership
Planning Infrastructure Level £0, £0 CIL
Medium Density
Houses Only Schemes
£0
£500,000
£1,000,000
£1,500,000
£2,000,000
£2,500,000
£3,000,000
£3,500,000
£4,000,000
£4,500,000
£5,000,000
£5,500,000
£6,000,000
1 2 3 4 5 1 2 3 4 5 1 2 3 4 5
10 Unit Scheme 20 Unit Scheme 50 Unit Scheme
Resid
ual Lan
d V
alu
e (%
o
f G
DV
)
Residual Land Value - 0% Affordable Residual Land Value - 25% Affordable Residual Land Value - 30% Affordable
Residual Land Value - 35% Affordable Residual Land Value - 40% Affordable

Development Scenario /
Threshold Value Point
Residual Land
Value - 0%
Affordable
Residual Land
Value - 25%
Affordable
Residual Land
Value - 30%
Affordable
Residual Land
Value - 35%
Affordable
Residual Land
Value - 40%
Affordable
1 £38,857 £0 £0 £0 £0
2 £89,205 £0 £0 £0 £0
3 £233,950 £131,920 £131,920 £85,691 £85,691
4 £735,452 £484,143 £484,143 £388,451 £388,451
5 £944,023 £630,325 £630,325 £509,226 £509,226
1 £61,510 £0 £0 £0 £0
2 £160,531 £0 £0 £0 £0
3 £436,363 £248,592 £228,624 £197,091 £153,622
4 £1,432,141 £988,929 £949,623 £839,837 £741,796
5 £1,842,350 £1,295,693 £1,237,126 £1,106,294 £987,208
1 £94,779 £0 £0 £0 £0
2 £307,904 £0 £0 £0 £0
3 £1,032,218 £594,005 £509,181 £417,711 £350,963
4 £3,178,372 £2,133,826 £1,943,269 £1,703,098 £1,569,622
5 £4,140,323 £2,836,825 £2,605,362 £2,305,567 £2,132,919
Source: Adams Integra, August 2012
10 Unit Scheme
20 Unit Scheme
50 Unit Scheme
Table 9: Summary of Residual Land Value (£) Appraisals for
All Value Points
0%, 25%, 30%, 35% and 40% Affordable Housing
70% Social Rent/30% Shared Ownership
Planning Infrastructure Level £0, £0 CIL
High Density
Houses Only Schemes
Appendix 2b
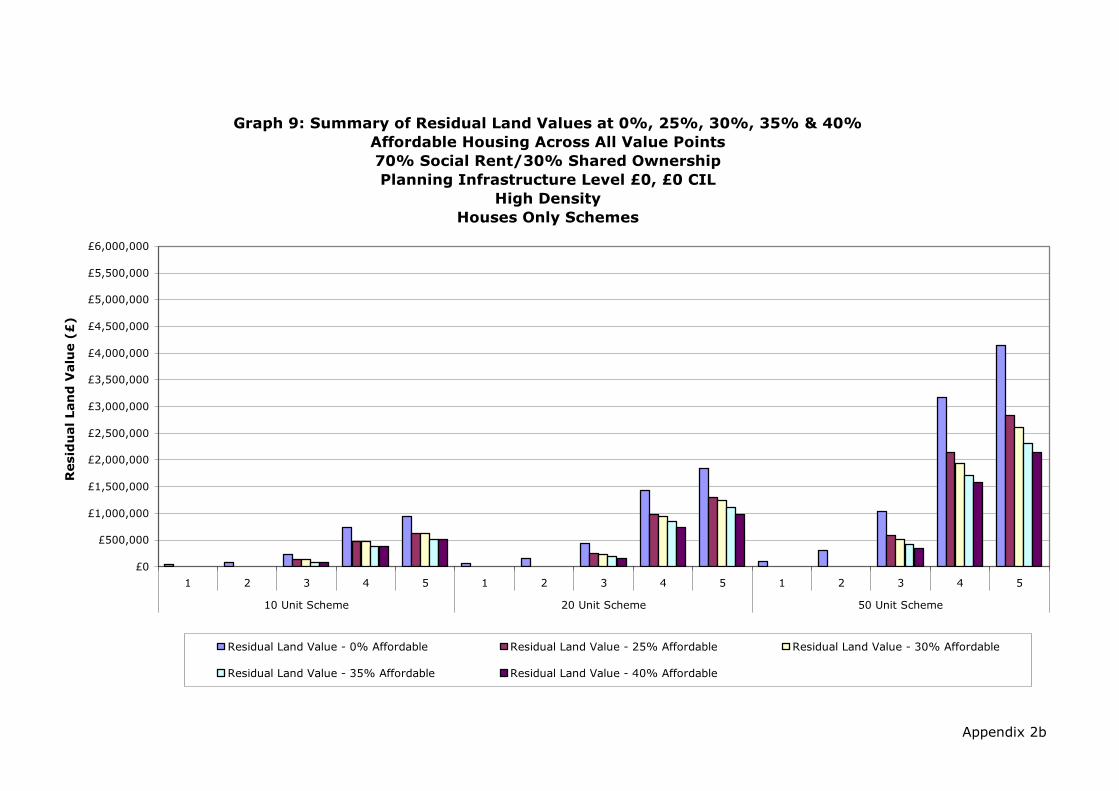
Appendix 2b
Graph 9: Summary of Residual Land Values at 0%, 25%, 30%, 35% & 40%
Affordable Housing Across All Value Points
70% Social Rent/30% Shared Ownership
Planning Infrastructure Level £0, £0 CIL
High Density
Houses Only Schemes
£0
£500,000
£1,000,000
£1,500,000
£2,000,000
£2,500,000
£3,000,000
£3,500,000
£4,000,000
£4,500,000
£5,000,000
£5,500,000
£6,000,000
1 2 3 4 5 1 2 3 4 5 1 2 3 4 5
10 Unit Scheme 20 Unit Scheme 50 Unit Scheme
Resid
ual Lan
d V
alu
e (£
)
Residual Land Value - 0% Affordable Residual Land Value - 25% Affordable Residual Land Value - 30% Affordable
Residual Land Value - 35% Affordable Residual Land Value - 40% Affordable
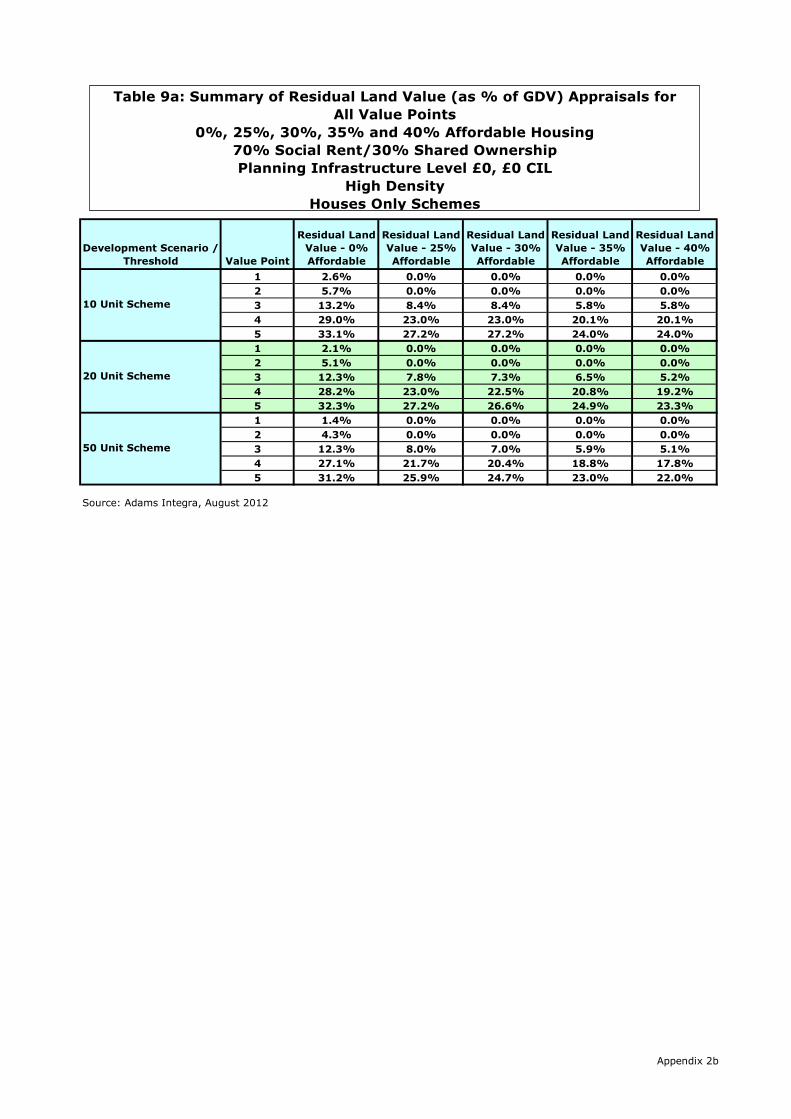
Development Scenario /
Threshold Value Point
Residual Land
Value - 0%
Affordable
Residual Land
Value - 25%
Affordable
Residual Land
Value - 30%
Affordable
Residual Land
Value - 35%
Affordable
Residual Land
Value - 40%
Affordable
1 2.6% 0.0% 0.0% 0.0% 0.0%
2 5.7% 0.0% 0.0% 0.0% 0.0%
3 13.2% 8.4% 8.4% 5.8% 5.8%
4 29.0% 23.0% 23.0% 20.1% 20.1%
5 33.1% 27.2% 27.2% 24.0% 24.0%
1 2.1% 0.0% 0.0% 0.0% 0.0%
2 5.1% 0.0% 0.0% 0.0% 0.0%
3 12.3% 7.8% 7.3% 6.5% 5.2%
4 28.2% 23.0% 22.5% 20.8% 19.2%
5 32.3% 27.2% 26.6% 24.9% 23.3%
1 1.4% 0.0% 0.0% 0.0% 0.0%
2 4.3% 0.0% 0.0% 0.0% 0.0%
3 12.3% 8.0% 7.0% 5.9% 5.1%
4 27.1% 21.7% 20.4% 18.8% 17.8%
5 31.2% 25.9% 24.7% 23.0% 22.0%
Source: Adams Integra, August 2012
10 Unit Scheme
20 Unit Scheme
50 Unit Scheme
Table 9a: Summary of Residual Land Value (as % of GDV) Appraisals for
All Value Points
0%, 25%, 30%, 35% and 40% Affordable Housing
70% Social Rent/30% Shared Ownership
Planning Infrastructure Level £0, £0 CIL
High Density
Houses Only Schemes
Appendix 2b
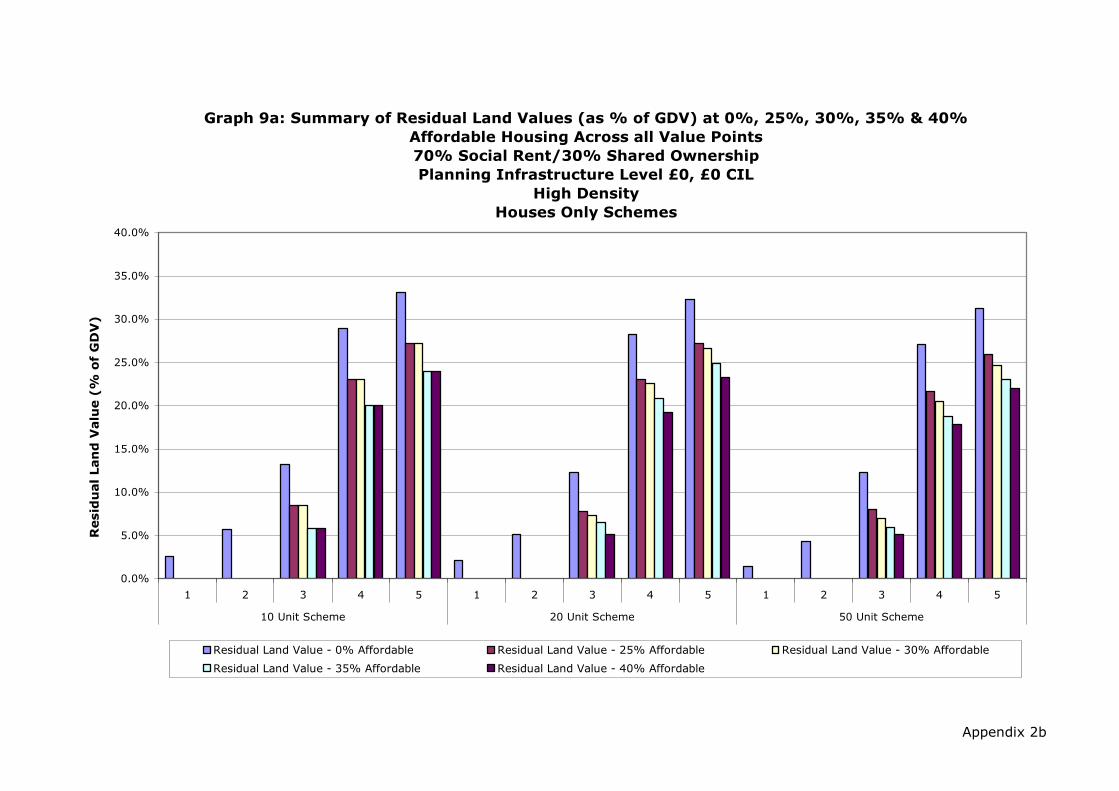
Appendix 2b
Graph 9a: Summary of Residual Land Values (as % of GDV) at 0%, 25%, 30%, 35% & 40%
Affordable Housing Across all Value Points
70% Social Rent/30% Shared Ownership
Planning Infrastructure Level £0, £0 CIL
High Density
Houses Only Schemes
0.0%
5.0%
10.0%
15.0%
20.0%
25.0%
30.0%
35.0%
40.0%
1 2 3 4 5 1 2 3 4 5 1 2 3 4 5
10 Unit Scheme 20 Unit Scheme 50 Unit Scheme
Resid
ual Lan
d V
alu
e (%
o
f G
DV
)
Residual Land Value - 0% Affordable Residual Land Value - 25% Affordable Residual Land Value - 30% Affordable
Residual Land Value - 35% Affordable Residual Land Value - 40% Affordable

Development Scenario /
Threshold Value Point
Residual Land
Value - 0%
Affordable
Residual Land
Value - 25%
Affordable
Residual Land
Value - 30%
Affordable
Residual Land
Value - 35%
Affordable
Residual Land
Value - 40%
Affordable
1 £194,286 £0 £0 £0 £0
2 £446,023 £0 £0 £0 £0
3 £1,169,750 £659,598 £659,598 £428,457 £428,457
4 £3,677,262 £2,420,717 £2,420,717 £1,942,253 £1,942,253
5 £4,720,116 £3,151,623 £3,151,623 £2,546,128 £2,546,128
1 £153,775 £0 £0 £0 £0
2 £401,328 £0 £0 £0 £0
3 £1,090,907 £621,479 £571,559 £492,727 £384,054
4 £3,580,353 £2,472,321 £2,374,058 £2,099,592 £1,854,491
5 £4,605,875 £3,239,232 £3,092,816 £2,765,735 £2,468,020
1 £94,779 £0 £0 £0 £0
2 £307,904 £0 £0 £0 £0
3 £1,032,218 £594,005 £509,181 £417,711 £350,963
4 £3,178,372 £2,133,826 £1,943,269 £1,703,098 £1,569,622
5 £4,140,323 £2,836,825 £2,605,362 £2,305,567 £2,132,919
Source: Adams Integra, August 2012
10 Unit Scheme
20 Unit Scheme
50 Unit Scheme
Table 9b: Summary of Residual Land Value (value per Hectare) Appraisals for
All Value Points
0%, 25%, 30%, 35% and 40% Affordable Housing
70% Social Rent/30% Shared Ownership
Planning Infrastructure Level £0, £0 CIL
High Density
Houses Only Schemes
Appendix 2b

Appendix 2b
Graph 9b: Summary of Residual Land Values (value per Hectare) at 0%, 25%, 30%, 35% &
40% Affordable Housing Across all Value Points
70% Social Rent/30% Shared Ownership
Planning Infrastructure Level £0, £0 CIL
High Density
Houses Only Schemes
£0
£500,000
£1,000,000
£1,500,000
£2,000,000
£2,500,000
£3,000,000
£3,500,000
£4,000,000
£4,500,000
£5,000,000
£5,500,000
£6,000,000
1 2 3 4 5 1 2 3 4 5 1 2 3 4 5
10 Unit Scheme 20 Unit Scheme 50 Unit Scheme
Resid
ual Lan
d V
alu
e (%
o
f G
DV
)
Residual Land Value - 0% Affordable Residual Land Value - 25% Affordable Residual Land Value - 30% Affordable
Residual Land Value - 35% Affordable Residual Land Value - 40% Affordable

Appendix 3

Development Scenario /
Threshold Value Point
Residual Land
Value - 0%
Affordable
Residual Land
Value - 25%
Affordable
Residual Land
Value - 30%
Affordable
Residual Land
Value - 35%
Affordable
Residual Land
Value - 40%
Affordable
1 £864 £0 £0 £0 £0
2 £83,526 £0 £0 £0 £0
3 £271,777 £164,193 £164,193 £117,965 £117,965
4 £1,075,373 £773,331 £773,331 £673,634 £673,634
5 £1,399,757 £1,014,885 £1,014,885 £893,786 £893,786
1 £0 £0 £0 £0 £0
2 £113,606 £0 £0 £0 £0
3 £395,939 £245,287 £200,028 £200,028 £186,730
4 £1,589,014 £1,191,727 £1,093,134 £1,093,134 £1,025,534
5 £2,057,691 £1,557,326 £1,437,569 £1,437,569 £1,348,805
1 £0 £0 £0 £0 £0
2 £143,807 £0 £0 £0 £0
3 £509,360 £315,834 £302,878 £258,781 £209,425
4 £2,095,350 £1,602,247 £1,535,026 £1,436,986 £1,305,226
5 £2,733,336 £2,116,688 £2,028,421 £1,909,334 £1,738,212
1 £0 £0 £0 £0 £0
2 £276,086 £0 £0 £0 £0
3 £1,156,643 £697,411 £612,877 £506,172 £446,776
4 £4,891,724 £3,697,947 £3,484,039 £3,218,735 £3,025,359
5 £6,352,757 £4,857,490 £4,584,875 £4,258,213 £4,006,130
1 £0 £0 £0 £0 £8
2 £240,179 £0 £0 £0 £0
3 £1,897,283 £1,044,076 £883,266 £703,113 £551,175
4 £8,934,393 £6,724,791 £6,292,702 £5,841,270 £5,418,053
5 £11,687,063 £8,911,936 £8,366,742 £7,802,205 £7,265,883
1 £0 £0 £0 £0 £0
2 £0 £0 £0 £0 £0
3 £0 £0 £0 £0 £0
4 £6,873,721 £4,219,481 £3,685,893 £3,156,872 £2,623,284
5 £10,554,420 £7,209,832 £6,535,287 £5,870,121 £5,195,576
Source: Adams Integra, August 2012
100 Unit Scheme
500 Unit Scheme
10 Unit Scheme
15 Unit Scheme
20 Unit Scheme
50 Unit Scheme
Table 10: Summary of Residual Land Value (£) Appraisals for
All Value Points
0%, 25%, 30%, 35% and 40% Affordable Housing
70% Social Rent/30% Shared Ownership
Planning Infrastructure Level £0, £40 CIL
Low Density
Appendix 3
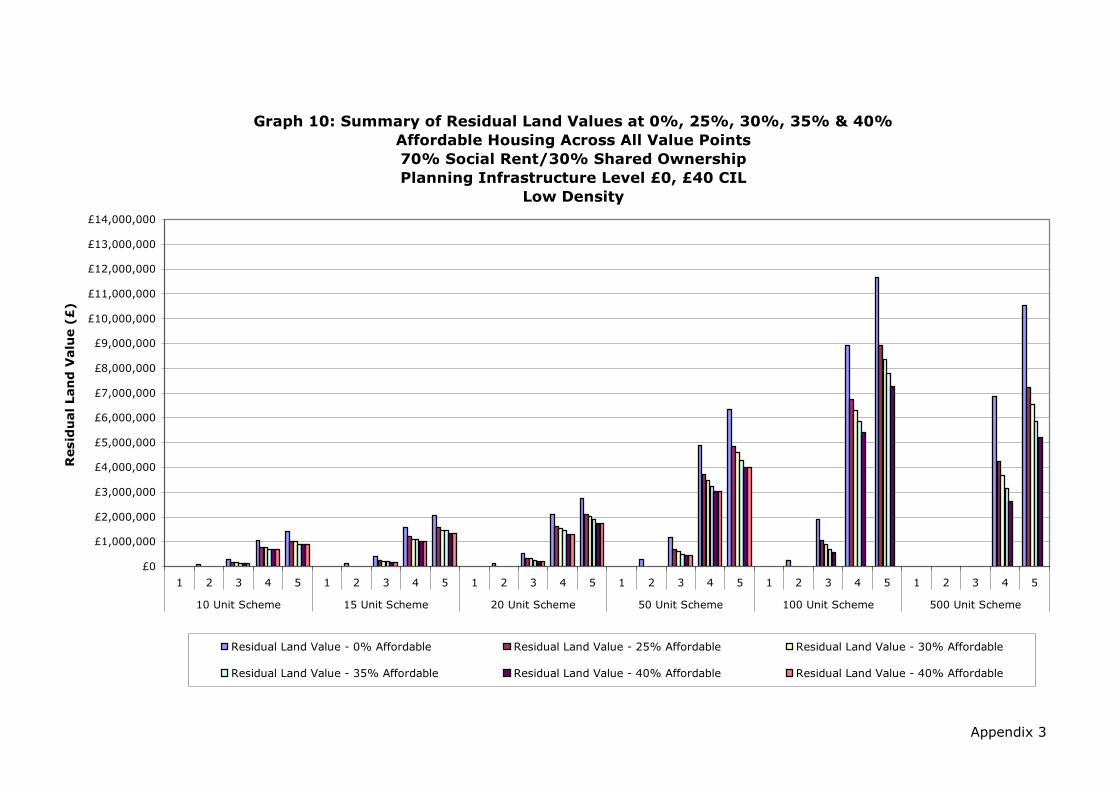
Appendix 3
Graph 10: Summary of Residual Land Values at 0%, 25%, 30%, 35% & 40%
Affordable Housing Across All Value Points
70% Social Rent/30% Shared Ownership
Planning Infrastructure Level £0, £40 CIL
Low Density
£0
£1,000,000
£2,000,000
£3,000,000
£4,000,000
£5,000,000
£6,000,000
£7,000,000
£8,000,000
£9,000,000
£10,000,000
£11,000,000
£12,000,000
£13,000,000
£14,000,000
1 2 3 4 5 1 2 3 4 5 1 2 3 4 5 1 2 3 4 5 1 2 3 4 5 1 2 3 4 5
10 Unit Scheme 15 Unit Scheme 20 Unit Scheme 50 Unit Scheme 100 Unit Scheme 500 Unit Scheme
Resid
ual Lan
d V
alu
e (£
)
Residual Land Value - 0% Affordable Residual Land Value - 25% Affordable Residual Land Value - 30% Affordable
Residual Land Value - 35% Affordable Residual Land Value - 40% Affordable Residual Land Value - 40% Affordable

Development Scenario /
Threshold Value Point
Residual Land
Value - 0%
Affordable
Residual Land
Value - 25%
Affordable
Residual Land
Value - 30%
Affordable
Residual Land
Value - 35%
Affordable
Residual Land
Value - 40%
Affordable
1 0.0% 0.0% 0.0% 0.0% 0.0%
2 3.8% 0.0% 0.0% 0.0% 0.0%
3 11.1% 7.4% 7.4% 5.5% 5.5%
4 29.4% 24.6% 24.6% 22.6% 22.6%
5 33.7% 28.9% 28.9% 27.0% 27.0%
1 0.0% 0.0% 0.0% 0.0% 0.0%
2 3.4% 0.0% 0.0% 0.0% 0.0%
3 10.6% 7.2% 6.0% 6.0% 5.7%
4 28.7% 24.6% 23.3% 23.3% 22.5%
5 32.9% 28.8% 27.6% 27.6% 26.7%
1 0.0% 0.0% 0.0% 0.0% 0.0%
2 3.3% 0.0% 0.0% 0.0% 0.0%
3 10.4% 7.0% 6.8% 5.9% 4.9%
4 28.6% 24.7% 24.2% 23.3% 21.9%
5 32.9% 29.2% 28.6% 27.7% 26.3%
1 0.0% 0.0% 0.0% 0.0% 0.0%
2 2.6% 0.0% 0.0% 0.0% 0.0%
3 9.6% 6.3% 5.6% 4.7% 4.2%
4 27.2% 23.4% 22.6% 21.5% 20.7%
5 31.4% 27.5% 26.7% 25.7% 24.8%
1 0.0% 0.0% 0.0% 0.0% 0.0%
2 1.1% 0.0% 0.0% 0.0% 0.0%
3 7.8% 4.7% 4.0% 3.3% 2.6%
4 24.9% 21.2% 20.4% 19.4% 18.5%
5 28.9% 25.2% 24.4% 23.4% 22.5%
1 0.0% 0.0% 0.0% 0.0% 0.0%
2 0.0% 0.0% 0.0% 0.0% 0.0%
3 0.0% 0.0% 0.0% 0.0% 0.0%
4 4.0% 2.8% 2.5% 2.2% 1.9%
5 5.4% 4.2% 3.9% 3.6% 3.3%
Source: Adams Integra, August 2012
100 Unit Scheme
500 Unit Scheme
10 Unit Scheme
15 Unit Scheme
20 Unit Scheme
50 Unit Scheme
Table 10a: Summary of Residual Land Value (as % of GDV) Appraisals for
All Value Points
0%, 25%, 30%, 35% and 40% Affordable Housing
70% Social Rent/30% Shared Ownership
Planning Infrastructure Level £0, £40 CIL
Low Density
Appendix 3
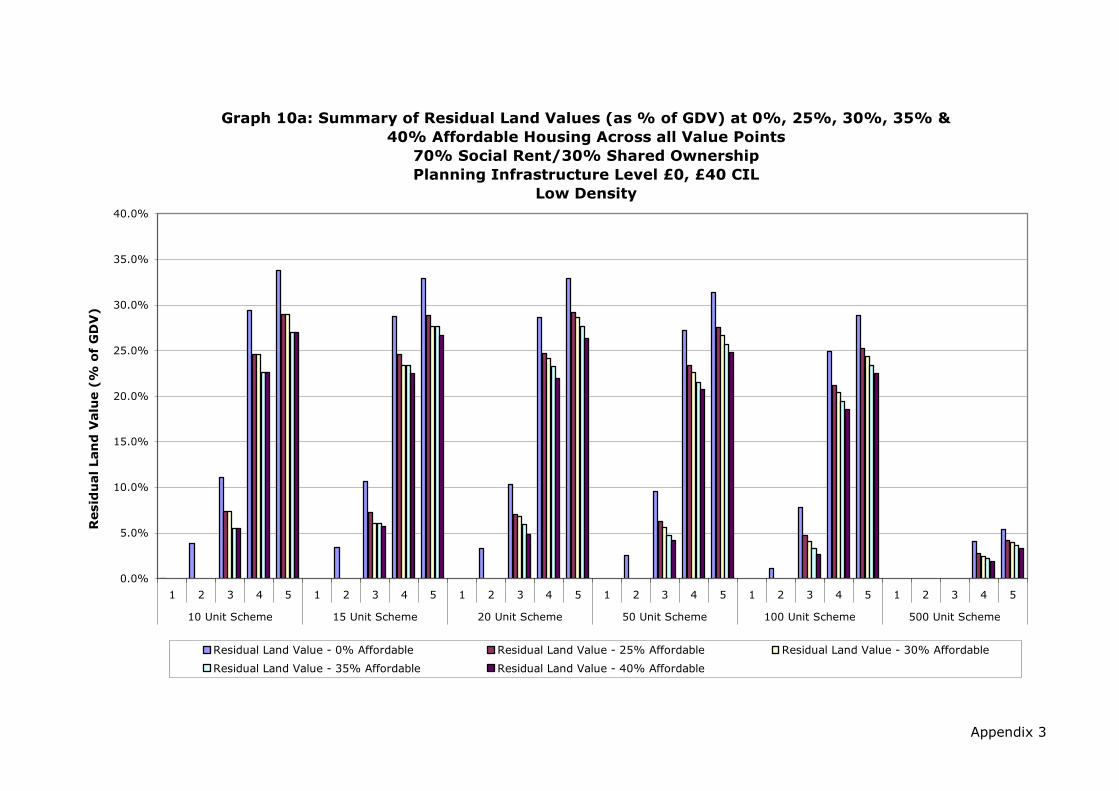
Appendix 3
Graph 10a: Summary of Residual Land Values (as % of GDV) at 0%, 25%, 30%, 35% &
40% Affordable Housing Across all Value Points
70% Social Rent/30% Shared Ownership
Planning Infrastructure Level £0, £40 CIL
Low Density
0.0%
5.0%
10.0%
15.0%
20.0%
25.0%
30.0%
35.0%
40.0%
1 2 3 4 5 1 2 3 4 5 1 2 3 4 5 1 2 3 4 5 1 2 3 4 5 1 2 3 4 5
10 Unit Scheme 15 Unit Scheme 20 Unit Scheme 50 Unit Scheme 100 Unit Scheme 500 Unit Scheme
Resid
ual Lan
d V
alu
e (%
o
f G
DV
)
Residual Land Value - 0% Affordable Residual Land Value - 25% Affordable Residual Land Value - 30% Affordable
Residual Land Value - 35% Affordable Residual Land Value - 40% Affordable
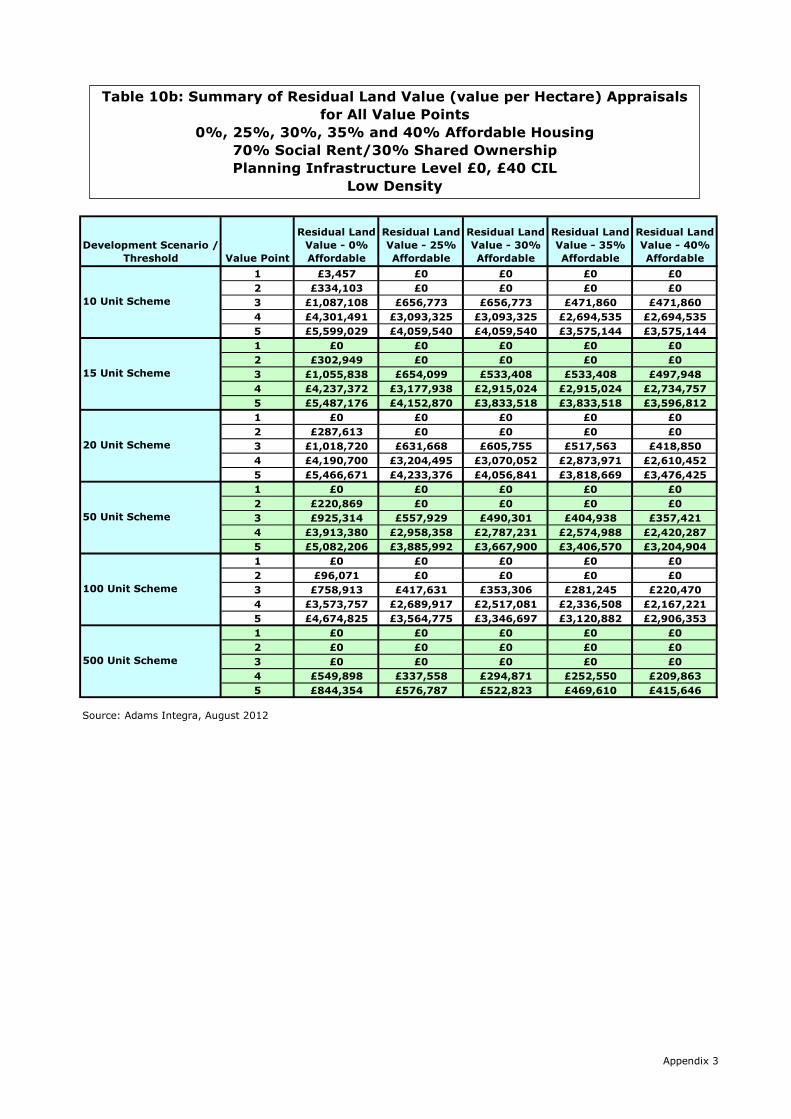
Development Scenario /
Threshold Value Point
Residual Land
Value - 0%
Affordable
Residual Land
Value - 25%
Affordable
Residual Land
Value - 30%
Affordable
Residual Land
Value - 35%
Affordable
Residual Land
Value - 40%
Affordable
1 £3,457 £0 £0 £0 £0
2 £334,103 £0 £0 £0 £0
3 £1,087,108 £656,773 £656,773 £471,860 £471,860
4 £4,301,491 £3,093,325 £3,093,325 £2,694,535 £2,694,535
5 £5,599,029 £4,059,540 £4,059,540 £3,575,144 £3,575,144
1 £0 £0 £0 £0 £0
2 £302,949 £0 £0 £0 £0
3 £1,055,838 £654,099 £533,408 £533,408 £497,948
4 £4,237,372 £3,177,938 £2,915,024 £2,915,024 £2,734,757
5 £5,487,176 £4,152,870 £3,833,518 £3,833,518 £3,596,812
1 £0 £0 £0 £0 £0
2 £287,613 £0 £0 £0 £0
3 £1,018,720 £631,668 £605,755 £517,563 £418,850
4 £4,190,700 £3,204,495 £3,070,052 £2,873,971 £2,610,452
5 £5,466,671 £4,233,376 £4,056,841 £3,818,669 £3,476,425
1 £0 £0 £0 £0 £0
2 £220,869 £0 £0 £0 £0
3 £925,314 £557,929 £490,301 £404,938 £357,421
4 £3,913,380 £2,958,358 £2,787,231 £2,574,988 £2,420,287
5 £5,082,206 £3,885,992 £3,667,900 £3,406,570 £3,204,904
1 £0 £0 £0 £0 £0
2 £96,071 £0 £0 £0 £0
3 £758,913 £417,631 £353,306 £281,245 £220,470
4 £3,573,757 £2,689,917 £2,517,081 £2,336,508 £2,167,221
5 £4,674,825 £3,564,775 £3,346,697 £3,120,882 £2,906,353
1 £0 £0 £0 £0 £0
2 £0 £0 £0 £0 £0
3 £0 £0 £0 £0 £0
4 £549,898 £337,558 £294,871 £252,550 £209,863
5 £844,354 £576,787 £522,823 £469,610 £415,646
Source: Adams Integra, August 2012
100 Unit Scheme
500 Unit Scheme
10 Unit Scheme
15 Unit Scheme
20 Unit Scheme
50 Unit Scheme
Table 10b: Summary of Residual Land Value (value per Hectare) Appraisals
for All Value Points
0%, 25%, 30%, 35% and 40% Affordable Housing
70% Social Rent/30% Shared Ownership
Planning Infrastructure Level £0, £40 CIL
Low Density
Appendix 3
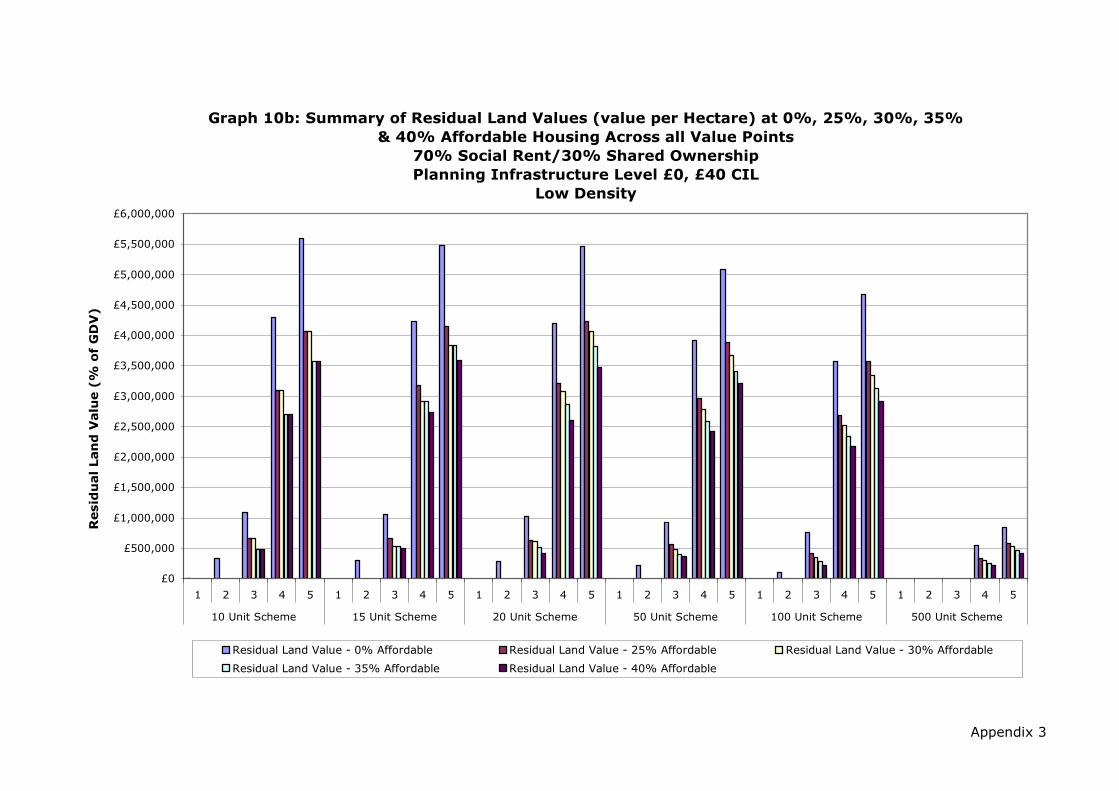
Appendix 3
Graph 10b: Summary of Residual Land Values (value per Hectare) at 0%, 25%, 30%, 35%
& 40% Affordable Housing Across all Value Points
70% Social Rent/30% Shared Ownership
Planning Infrastructure Level £0, £40 CIL
Low Density
£0
£500,000
£1,000,000
£1,500,000
£2,000,000
£2,500,000
£3,000,000
£3,500,000
£4,000,000
£4,500,000
£5,000,000
£5,500,000
£6,000,000
1 2 3 4 5 1 2 3 4 5 1 2 3 4 5 1 2 3 4 5 1 2 3 4 5 1 2 3 4 5
10 Unit Scheme 15 Unit Scheme 20 Unit Scheme 50 Unit Scheme 100 Unit Scheme 500 Unit Scheme
Resid
ual Lan
d V
alu
e (%
o
f G
DV
)
Residual Land Value - 0% Affordable Residual Land Value - 25% Affordable Residual Land Value - 30% Affordable
Residual Land Value - 35% Affordable Residual Land Value - 40% Affordable

Development Scenario /
Threshold Value Point
Residual Land
Value - 0%
Affordable
Residual Land
Value - 25%
Affordable
Residual Land
Value - 30%
Affordable
Residual Land
Value - 35%
Affordable
Residual Land
Value - 40%
Affordable
1 £13,013 £0 £0 £0 £0
2 £67,113 £0 £0 £0 £0
3 £221,354 £119,196 £119,196 £63,018 £63,018
4 £812,312 £561,004 £561,004 £431,465 £431,465
5 £1,078,577 £764,878 £764,878 £590,864 £590,864
1 £14,479 £0 £0 £0 £0
2 £98,904 £0 £0 £0 £0
3 £332,030 £181,671 £137,790 £137,790 £124,358
4 £1,315,493 £934,466 £835,874 £835,874 £768,273
5 £1,776,727 £1,294,418 £1,174,661 £1,174,661 £1,085,897
1 £12,963 £0 £0 £0 £0
2 £123,977 £0 £0 £0 £0
3 £411,717 £217,274 £204,051 £160,652 £105,408
4 £1,665,731 £1,172,629 £1,105,407 £1,007,367 £875,607
5 £2,214,863 £1,598,215 £1,509,948 £1,390,862 £1,219,740
1 £0 £0 £0 £0 £0
2 £202,908 £0 £0 £0 £0
3 £904,202 £441,354 £366,688 £257,086 £196,385
4 £3,738,748 £2,603,530 £2,438,106 £2,209,351 £2,015,975
5 £4,992,035 £3,560,531 £3,355,935 £3,067,555 £2,815,472
1 £0 £0 £0 £0 £0
2 £247,429 £0 £0 £0 £0
3 £1,508,793 £702,845 £553,607 £389,038 £244,931
4 £6,424,033 £4,676,394 £4,304,889 £3,914,043 £3,577,414
5 £8,681,892 £6,497,570 £6,023,728 £5,530,543 £5,116,129
1 £0 £0 £0 £0 £0
2 £0 £0 £0 £0 £0
3 £0 £0 £0 £0 £0
4 £5,660,006 £3,328,675 £2,877,931 £2,400,809 £1,937,907
5 £8,996,231 £6,071,887 £5,504,899 £4,906,793 £4,325,296
Source: Adams Integra, August 2012
100 Unit Scheme
500 Unit Scheme
10 Unit Scheme
15 Unit Scheme
20 Unit Scheme
50 Unit Scheme
Table 11: Summary of Residual Land Value (£) Appraisals for
All Value Points
0%, 25%, 30%, 35% and 40% Affordable Housing
70% Social Rent/30% Shared Ownership
Planning Infrastructure Level £0, £40 CIL
Medium Density
Appendix 3
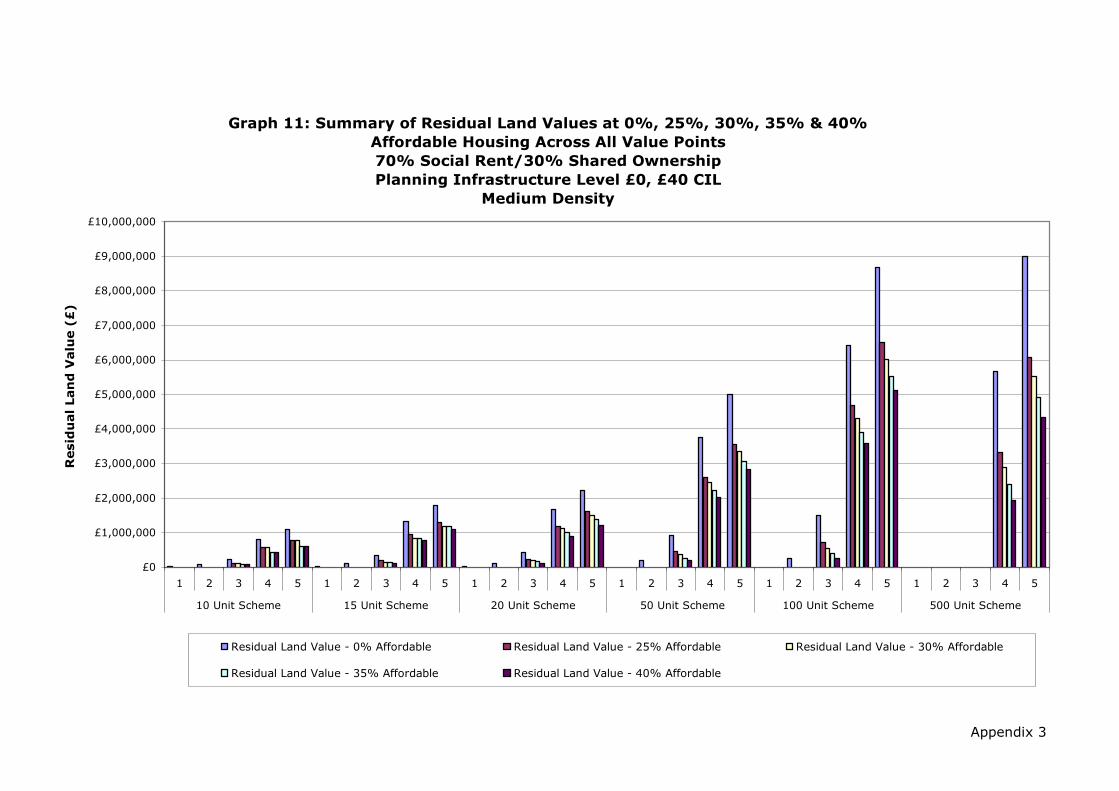
Appendix 3
Graph 11: Summary of Residual Land Values at 0%, 25%, 30%, 35% & 40%
Affordable Housing Across All Value Points
70% Social Rent/30% Shared Ownership
Planning Infrastructure Level £0, £40 CIL
Medium Density
£0
£1,000,000
£2,000,000
£3,000,000
£4,000,000
£5,000,000
£6,000,000
£7,000,000
£8,000,000
£9,000,000
£10,000,000
1 2 3 4 5 1 2 3 4 5 1 2 3 4 5 1 2 3 4 5 1 2 3 4 5 1 2 3 4 5
10 Unit Scheme 15 Unit Scheme 20 Unit Scheme 50 Unit Scheme 100 Unit Scheme 500 Unit Scheme
Resid
ual Lan
d V
alu
e (£
)
Residual Land Value - 0% Affordable Residual Land Value - 25% Affordable Residual Land Value - 30% Affordable
Residual Land Value - 35% Affordable Residual Land Value - 40% Affordable

Development Scenario /
Threshold Value Point
Residual Land
Value - 0%
Affordable
Residual Land
Value - 25%
Affordable
Residual Land
Value - 30%
Affordable
Residual Land
Value - 35%
Affordable
Residual Land
Value - 40%
Affordable
1 0.8% 0.0% 0.0% 0.0% 0.0%
2 4.0% 0.0% 0.0% 0.0% 0.0%
3 11.6% 7.0% 7.0% 4.0% 4.0%
4 29.0% 23.7% 23.7% 20.1% 20.1%
5 33.7% 28.6% 28.6% 24.7% 24.7%
1 0.6% 0.0% 0.0% 0.0% 0.0%
2 3.7% 0.0% 0.0% 0.0% 0.0%
3 11.0% 6.7% 5.3% 5.3% 4.8%
4 29.2% 24.3% 22.7% 22.7% 21.7%
5 34.2% 29.5% 28.0% 28.0% 26.9%
1 0.4% 0.0% 0.0% 0.0% 0.0%
2 3.5% 0.0% 0.0% 0.0% 0.0%
3 10.4% 6.1% 5.8% 4.7% 3.2%
4 28.4% 23.4% 22.6% 21.4% 19.5%
5 33.1% 28.2% 27.5% 26.2% 24.3%
1 0.0% 0.0% 0.0% 0.0% 0.0%
2 2.4% 0.0% 0.0% 0.0% 0.0%
3 9.6% 5.2% 4.4% 3.2% 2.5%
4 26.9% 22.0% 21.1% 19.8% 18.7%
5 31.5% 26.7% 25.8% 24.6% 23.4%
1 0.0% 0.0% 0.0% 0.0% 0.0%
2 1.5% 0.0% 0.0% 0.0% 0.0%
3 8.3% 4.3% 3.4% 2.5% 1.6%
4 24.3% 20.3% 19.3% 18.1% 17.1%
5 28.8% 24.9% 23.9% 22.8% 21.8%
1 0.0% 0.0% 0.0% 0.0% 0.0%
2 0.0% 0.0% 0.0% 0.0% 0.0%
3 0.0% 0.0% 0.0% 0.0% 0.0%
4 3.9% 2.6% 2.3% 2.0% 1.6%
5 5.4% 4.2% 3.9% 3.6% 3.2%
Source: Adams Integra, August 2012
100 Unit Scheme
500 Unit Scheme
10 Unit Scheme
15 Unit Scheme
20 Unit Scheme
50 Unit Scheme
Table 11a: Summary of Residual Land Value (as % of GDV) Appraisals for
All Value Points
0%, 25%, 30%, 35% and 40% Affordable Housing
70% Social Rent/30% Shared Ownership
Planning Infrastructure Level £0, £40 CIL
Medium Density
Appendix 3

Appendix 3
Graph 11a: Summary of Residual Land Values (as % of GDV) at 0%, 25%, 30%, 35% &
40% Affordable Housing Across all Value Points
70% Social Rent/30% Shared Ownership
Planning Infrastructure Level £0, £40 CIL
Medium Density
0.0%
5.0%
10.0%
15.0%
20.0%
25.0%
30.0%
35.0%
40.0%
45.0%
50.0%
1 2 3 4 5 1 2 3 4 5 1 2 3 4 5 1 2 3 4 5 1 2 3 4 5 1 2 3 4 5
10 Unit Scheme 15 Unit Scheme 20 Unit Scheme 50 Unit Scheme 100 Unit Scheme 500 Unit Scheme
Resid
ual Lan
d V
alu
e (%
o
f G
DV
)
Residual Land Value - 0% Affordable Residual Land Value - 25% Affordable Residual Land Value - 30% Affordable
Residual Land Value - 35% Affordable Residual Land Value - 40% Affordable
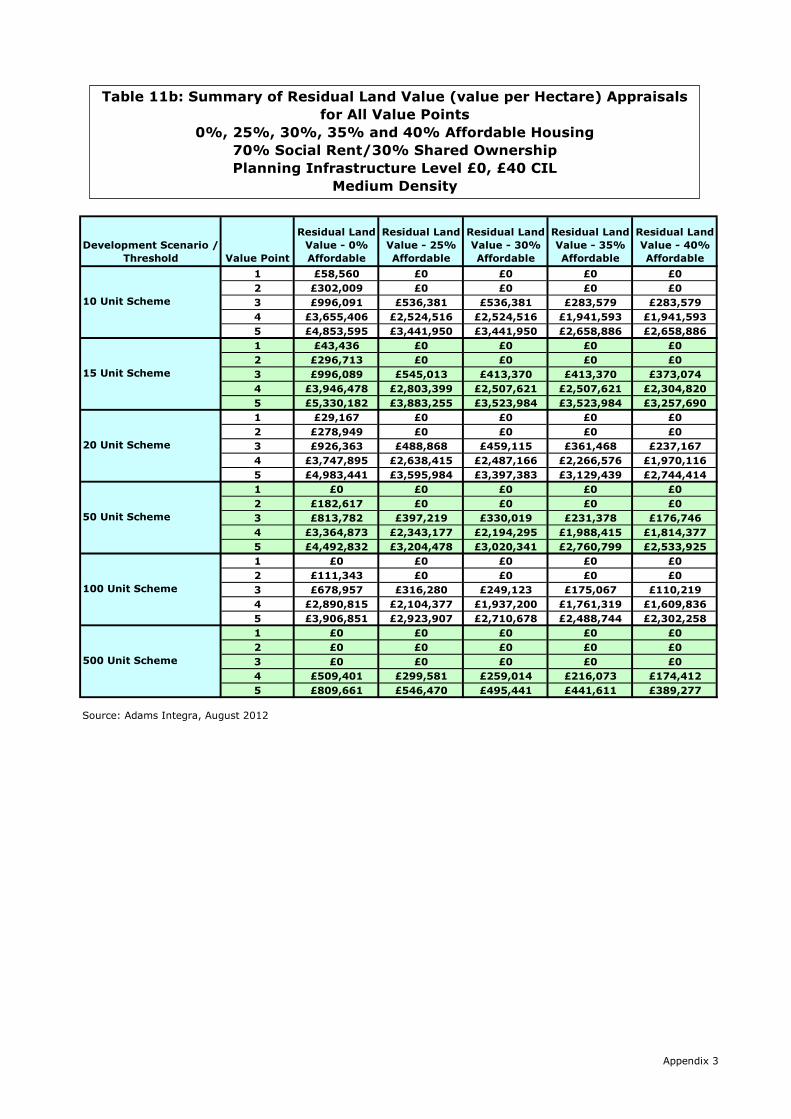
Development Scenario /
Threshold Value Point
Residual Land
Value - 0%
Affordable
Residual Land
Value - 25%
Affordable
Residual Land
Value - 30%
Affordable
Residual Land
Value - 35%
Affordable
Residual Land
Value - 40%
Affordable
1 £58,560 £0 £0 £0 £0
2 £302,009 £0 £0 £0 £0
3 £996,091 £536,381 £536,381 £283,579 £283,579
4 £3,655,406 £2,524,516 £2,524,516 £1,941,593 £1,941,593
5 £4,853,595 £3,441,950 £3,441,950 £2,658,886 £2,658,886
1 £43,436 £0 £0 £0 £0
2 £296,713 £0 £0 £0 £0
3 £996,089 £545,013 £413,370 £413,370 £373,074
4 £3,946,478 £2,803,399 £2,507,621 £2,507,621 £2,304,820
5 £5,330,182 £3,883,255 £3,523,984 £3,523,984 £3,257,690
1 £29,167 £0 £0 £0 £0
2 £278,949 £0 £0 £0 £0
3 £926,363 £488,868 £459,115 £361,468 £237,167
4 £3,747,895 £2,638,415 £2,487,166 £2,266,576 £1,970,116
5 £4,983,441 £3,595,984 £3,397,383 £3,129,439 £2,744,414
1 £0 £0 £0 £0 £0
2 £182,617 £0 £0 £0 £0
3 £813,782 £397,219 £330,019 £231,378 £176,746
4 £3,364,873 £2,343,177 £2,194,295 £1,988,415 £1,814,377
5 £4,492,832 £3,204,478 £3,020,341 £2,760,799 £2,533,925
1 £0 £0 £0 £0 £0
2 £111,343 £0 £0 £0 £0
3 £678,957 £316,280 £249,123 £175,067 £110,219
4 £2,890,815 £2,104,377 £1,937,200 £1,761,319 £1,609,836
5 £3,906,851 £2,923,907 £2,710,678 £2,488,744 £2,302,258
1 £0 £0 £0 £0 £0
2 £0 £0 £0 £0 £0
3 £0 £0 £0 £0 £0
4 £509,401 £299,581 £259,014 £216,073 £174,412
5 £809,661 £546,470 £495,441 £441,611 £389,277
Source: Adams Integra, August 2012
100 Unit Scheme
500 Unit Scheme
10 Unit Scheme
15 Unit Scheme
20 Unit Scheme
50 Unit Scheme
Table 11b: Summary of Residual Land Value (value per Hectare) Appraisals
for All Value Points
0%, 25%, 30%, 35% and 40% Affordable Housing
70% Social Rent/30% Shared Ownership
Planning Infrastructure Level £0, £40 CIL
Medium Density
Appendix 3

Appendix 3
Graph 11b: Summary of Residual Land Values (value per Hectare) at 0%, 25%, 30%, 35%
& 40% Affordable Housing Across all Value Points
70% Social Rent/30% Shared Ownership
Planning Infrastructure Level £0, £40 CIL
Medium Density
£0
£500,000
£1,000,000
£1,500,000
£2,000,000
£2,500,000
£3,000,000
£3,500,000
£4,000,000
£4,500,000
£5,000,000
£5,500,000
£6,000,000
1 2 3 4 5 1 2 3 4 5 1 2 3 4 5 1 2 3 4 5 1 2 3 4 5 1 2 3 4 5
10 Unit Scheme 15 Unit Scheme 20 Unit Scheme 50 Unit Scheme 100 Unit Scheme 500 Unit Scheme
Resid
ual Lan
d V
alu
e (%
o
f G
DV
)
Residual Land Value - 0% Affordable Residual Land Value - 25% Affordable Residual Land Value - 30% Affordable
Residual Land Value - 35% Affordable Residual Land Value - 40% Affordable
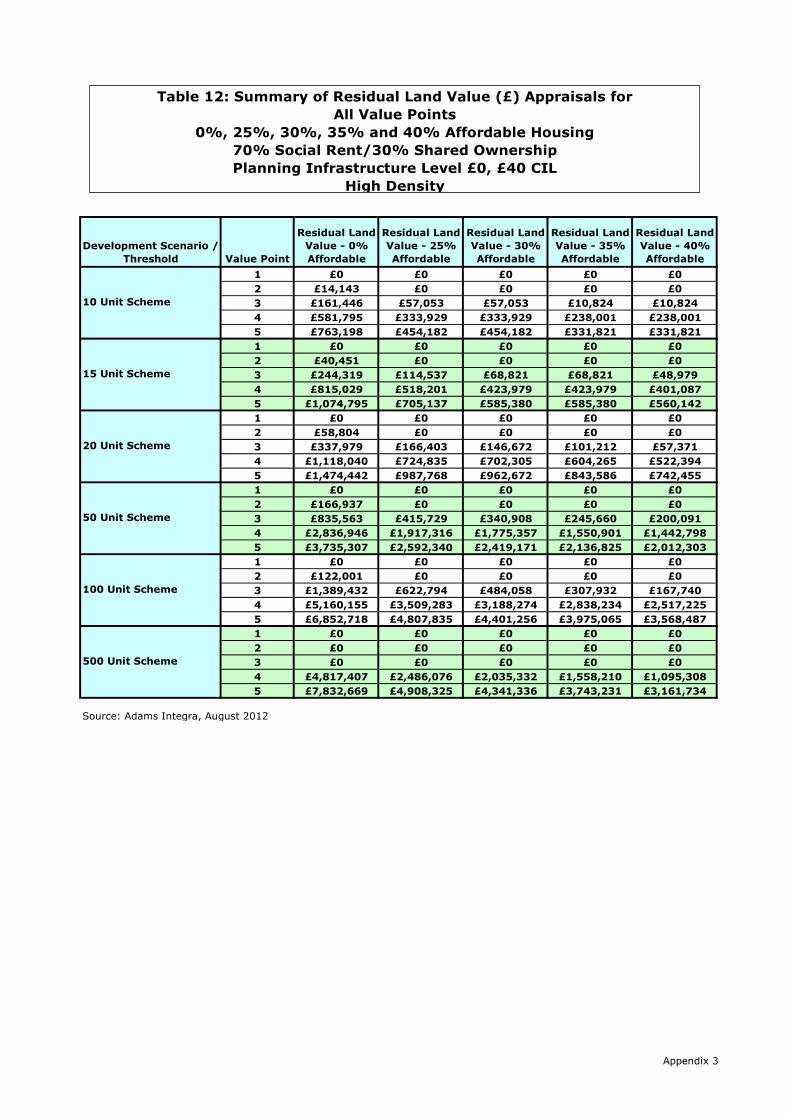
Development Scenario /
Threshold Value Point
Residual Land
Value - 0%
Affordable
Residual Land
Value - 25%
Affordable
Residual Land
Value - 30%
Affordable
Residual Land
Value - 35%
Affordable
Residual Land
Value - 40%
Affordable
1 £0 £0 £0 £0 £0
2 £14,143 £0 £0 £0 £0
3 £161,446 £57,053 £57,053 £10,824 £10,824
4 £581,795 £333,929 £333,929 £238,001 £238,001
5 £763,198 £454,182 £454,182 £331,821 £331,821
1 £0 £0 £0 £0 £0
2 £40,451 £0 £0 £0 £0
3 £244,319 £114,537 £68,821 £68,821 £48,979
4 £815,029 £518,201 £423,979 £423,979 £401,087
5 £1,074,795 £705,137 £585,380 £585,380 £560,142
1 £0 £0 £0 £0 £0
2 £58,804 £0 £0 £0 £0
3 £337,979 £166,403 £146,672 £101,212 £57,371
4 £1,118,040 £724,835 £702,305 £604,265 £522,394
5 £1,474,442 £987,768 £962,672 £843,586 £742,455
1 £0 £0 £0 £0 £0
2 £166,937 £0 £0 £0 £0
3 £835,563 £415,729 £340,908 £245,660 £200,091
4 £2,836,946 £1,917,316 £1,775,357 £1,550,901 £1,442,798
5 £3,735,307 £2,592,340 £2,419,171 £2,136,825 £2,012,303
1 £0 £0 £0 £0 £0
2 £122,001 £0 £0 £0 £0
3 £1,389,432 £622,794 £484,058 £307,932 £167,740
4 £5,160,155 £3,509,283 £3,188,274 £2,838,234 £2,517,225
5 £6,852,718 £4,807,835 £4,401,256 £3,975,065 £3,568,487
1 £0 £0 £0 £0 £0
2 £0 £0 £0 £0 £0
3 £0 £0 £0 £0 £0
4 £4,817,407 £2,486,076 £2,035,332 £1,558,210 £1,095,308
5 £7,832,669 £4,908,325 £4,341,336 £3,743,231 £3,161,734
Source: Adams Integra, August 2012
100 Unit Scheme
500 Unit Scheme
10 Unit Scheme
15 Unit Scheme
20 Unit Scheme
50 Unit Scheme
Table 12: Summary of Residual Land Value (£) Appraisals for
All Value Points
0%, 25%, 30%, 35% and 40% Affordable Housing
70% Social Rent/30% Shared Ownership
Planning Infrastructure Level £0, £40 CIL
High Density
Appendix 3
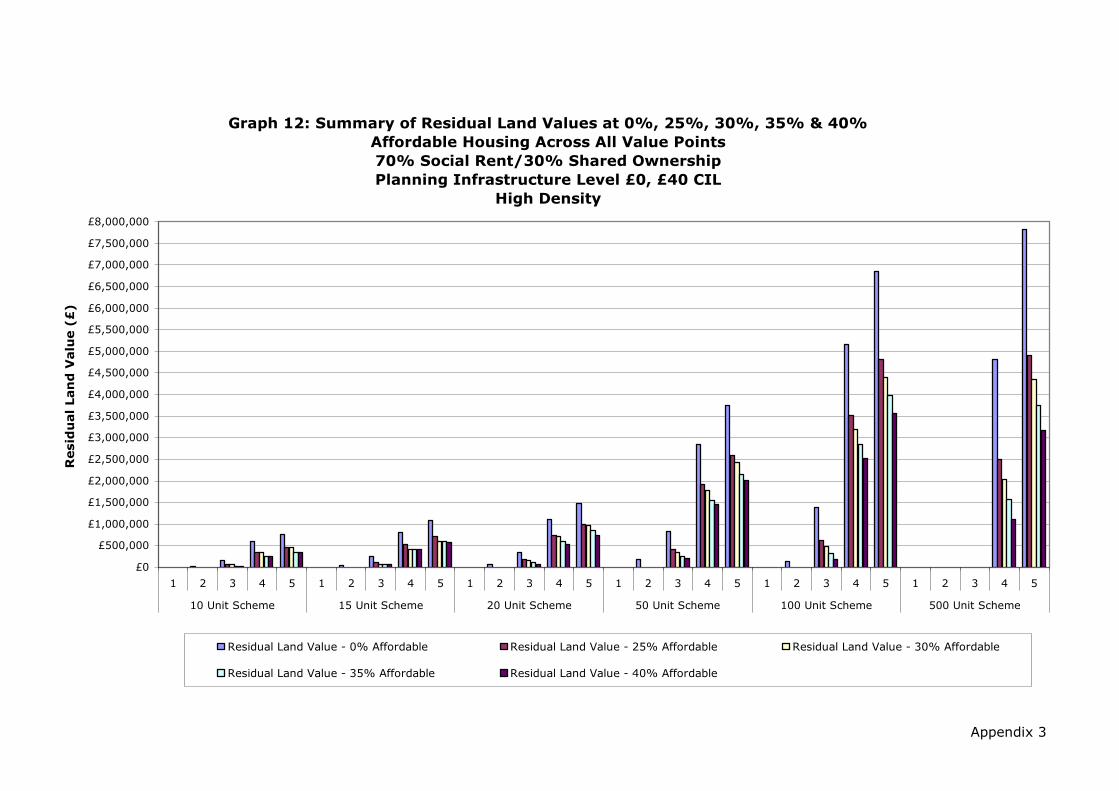
Appendix 3
Graph 12: Summary of Residual Land Values at 0%, 25%, 30%, 35% & 40%
Affordable Housing Across All Value Points
70% Social Rent/30% Shared Ownership
Planning Infrastructure Level £0, £40 CIL
High Density
£0
£500,000
£1,000,000
£1,500,000
£2,000,000
£2,500,000
£3,000,000
£3,500,000
£4,000,000
£4,500,000
£5,000,000
£5,500,000
£6,000,000
£6,500,000
£7,000,000
£7,500,000
£8,000,000
1 2 3 4 5 1 2 3 4 5 1 2 3 4 5 1 2 3 4 5 1 2 3 4 5 1 2 3 4 5
10 Unit Scheme 15 Unit Scheme 20 Unit Scheme 50 Unit Scheme 100 Unit Scheme 500 Unit Scheme
Resid
ual Lan
d V
alu
e (£
)
Residual Land Value - 0% Affordable Residual Land Value - 25% Affordable Residual Land Value - 30% Affordable
Residual Land Value - 35% Affordable Residual Land Value - 40% Affordable

Development Scenario /
Threshold Value Point
Residual Land
Value - 0%
Affordable
Residual Land
Value - 25%
Affordable
Residual Land
Value - 30%
Affordable
Residual Land
Value - 35%
Affordable
Residual Land
Value - 40%
Affordable
1 0.0% 0.0% 0.0% 0.0% 0.0%
2 1.0% 0.0% 0.0% 0.0% 0.0%
3 10.1% 4.1% 4.1% 0.8% 0.8%
4 26.0% 18.6% 18.6% 14.6% 14.6%
5 30.4% 23.0% 23.0% 18.7% 18.7%
1 0.0% 0.0% 0.0% 0.0% 0.0%
2 2.0% 0.0% 0.0% 0.0% 0.0%
3 10.5% 5.6% 3.5% 3.5% 2.5%
4 25.5% 19.4% 16.9% 16.9% 16.3%
5 30.0% 23.9% 21.2% 21.2% 20.8%
1 0.0% 0.0% 0.0% 0.0% 0.0%
2 2.2% 0.0% 0.0% 0.0% 0.0%
3 10.7% 6.0% 5.3% 3.8% 2.2%
4 25.7% 19.8% 19.5% 17.6% 15.8%
5 30.2% 24.3% 24.1% 22.2% 20.5%
1 0.0% 0.0% 0.0% 0.0% 0.0%
2 2.4% 0.0% 0.0% 0.0% 0.0%
3 10.3% 5.8% 4.8% 3.6% 3.0%
4 25.2% 20.1% 19.1% 17.4% 16.6%
5 29.5% 24.4% 23.5% 21.8% 21.0%
1 0.0% 0.0% 0.0% 0.0% 0.0%
2 0.9% 0.0% 0.0% 0.0% 0.0%
3 8.6% 4.3% 3.4% 2.2% 1.2%
4 23.0% 18.2% 17.1% 15.8% 14.5%
5 27.1% 22.4% 21.3% 20.0% 18.7%
1 0.0% 0.0% 0.0% 0.0% 0.0%
2 0.0% 0.0% 0.0% 0.0% 0.0%
3 0.0% 0.0% 0.0% 0.0% 0.0%
4 3.7% 2.2% 1.9% 1.5% 1.1%
5 5.2% 3.8% 3.5% 3.1% 2.7%
Source: Adams Integra, August 2012
100 Unit Scheme
500 Unit Scheme
10 Unit Scheme
15 Unit Scheme
20 Unit Scheme
50 Unit Scheme
Table 12a: Summary of Residual Land Value (as % of GDV) Appraisals for
All Value Points
0%, 25%, 30%, 35% and 40% Affordable Housing
70% Social Rent/30% Shared Ownership
Planning Infrastructure Level £0, £40 CIL
High Density
Appendix 3

Appendix 3
Graph 12a: Summary of Residual Land Values (as % of GDV) at 0%, 25%, 30%, 35% &
40% Affordable Housing Across all Value Points
70% Social Rent/30% Shared Ownership
Planning Infrastructure Level £0, £40 CIL
High Density
0.0%
5.0%
10.0%
15.0%
20.0%
25.0%
30.0%
35.0%
40.0%
1 2 3 4 5 1 2 3 4 5 1 2 3 4 5 1 2 3 4 5 1 2 3 4 5 1 2 3 4 5
10 Unit Scheme 15 Unit Scheme 20 Unit Scheme 50 Unit Scheme 100 Unit Scheme 500 Unit Scheme
Resid
ual Lan
d V
alu
e (%
o
f G
DV
)
Residual Land Value - 0% Affordable Residual Land Value - 25% Affordable Residual Land Value - 30% Affordable
Residual Land Value - 35% Affordable Residual Land Value - 40% Affordable
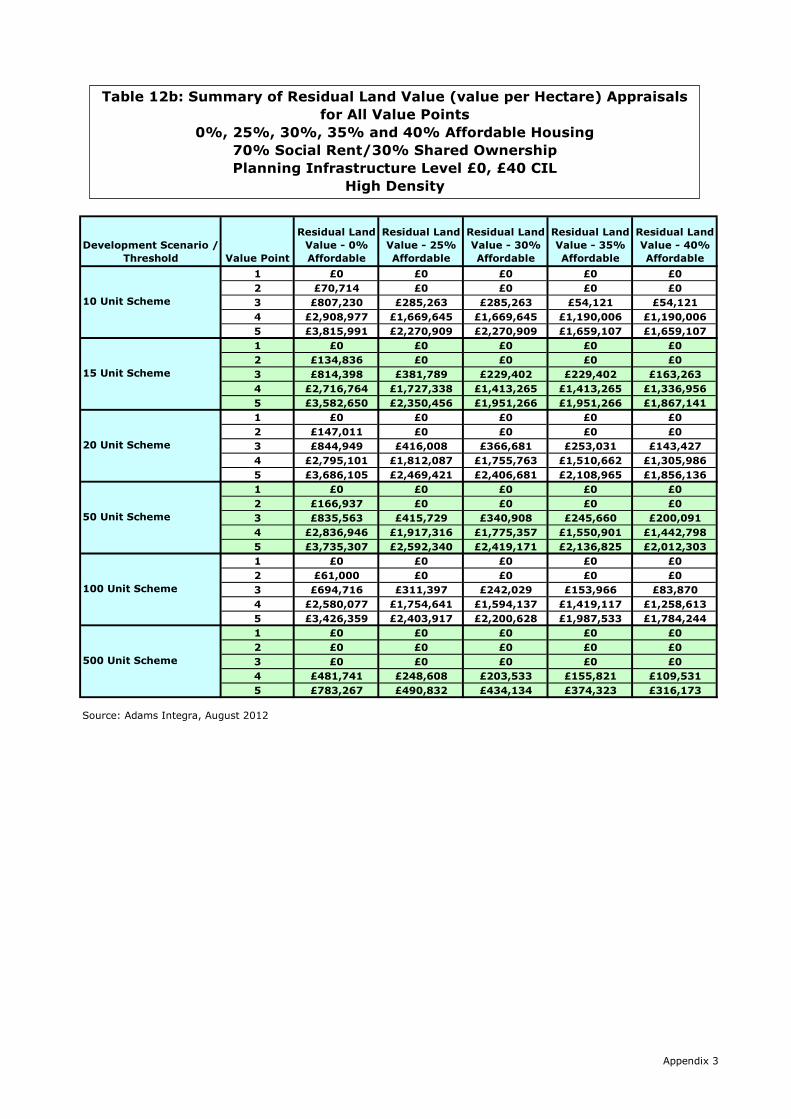
Development Scenario /
Threshold Value Point
Residual Land
Value - 0%
Affordable
Residual Land
Value - 25%
Affordable
Residual Land
Value - 30%
Affordable
Residual Land
Value - 35%
Affordable
Residual Land
Value - 40%
Affordable
1 £0 £0 £0 £0 £0
2 £70,714 £0 £0 £0 £0
3 £807,230 £285,263 £285,263 £54,121 £54,121
4 £2,908,977 £1,669,645 £1,669,645 £1,190,006 £1,190,006
5 £3,815,991 £2,270,909 £2,270,909 £1,659,107 £1,659,107
1 £0 £0 £0 £0 £0
2 £134,836 £0 £0 £0 £0
3 £814,398 £381,789 £229,402 £229,402 £163,263
4 £2,716,764 £1,727,338 £1,413,265 £1,413,265 £1,336,956
5 £3,582,650 £2,350,456 £1,951,266 £1,951,266 £1,867,141
1 £0 £0 £0 £0 £0
2 £147,011 £0 £0 £0 £0
3 £844,949 £416,008 £366,681 £253,031 £143,427
4 £2,795,101 £1,812,087 £1,755,763 £1,510,662 £1,305,986
5 £3,686,105 £2,469,421 £2,406,681 £2,108,965 £1,856,136
1 £0 £0 £0 £0 £0
2 £166,937 £0 £0 £0 £0
3 £835,563 £415,729 £340,908 £245,660 £200,091
4 £2,836,946 £1,917,316 £1,775,357 £1,550,901 £1,442,798
5 £3,735,307 £2,592,340 £2,419,171 £2,136,825 £2,012,303
1 £0 £0 £0 £0 £0
2 £61,000 £0 £0 £0 £0
3 £694,716 £311,397 £242,029 £153,966 £83,870
4 £2,580,077 £1,754,641 £1,594,137 £1,419,117 £1,258,613
5 £3,426,359 £2,403,917 £2,200,628 £1,987,533 £1,784,244
1 £0 £0 £0 £0 £0
2 £0 £0 £0 £0 £0
3 £0 £0 £0 £0 £0
4 £481,741 £248,608 £203,533 £155,821 £109,531
5 £783,267 £490,832 £434,134 £374,323 £316,173
Source: Adams Integra, August 2012
100 Unit Scheme
500 Unit Scheme
10 Unit Scheme
15 Unit Scheme
20 Unit Scheme
50 Unit Scheme
Table 12b: Summary of Residual Land Value (value per Hectare) Appraisals
for All Value Points
0%, 25%, 30%, 35% and 40% Affordable Housing
70% Social Rent/30% Shared Ownership
Planning Infrastructure Level £0, £40 CIL
High Density
Appendix 3
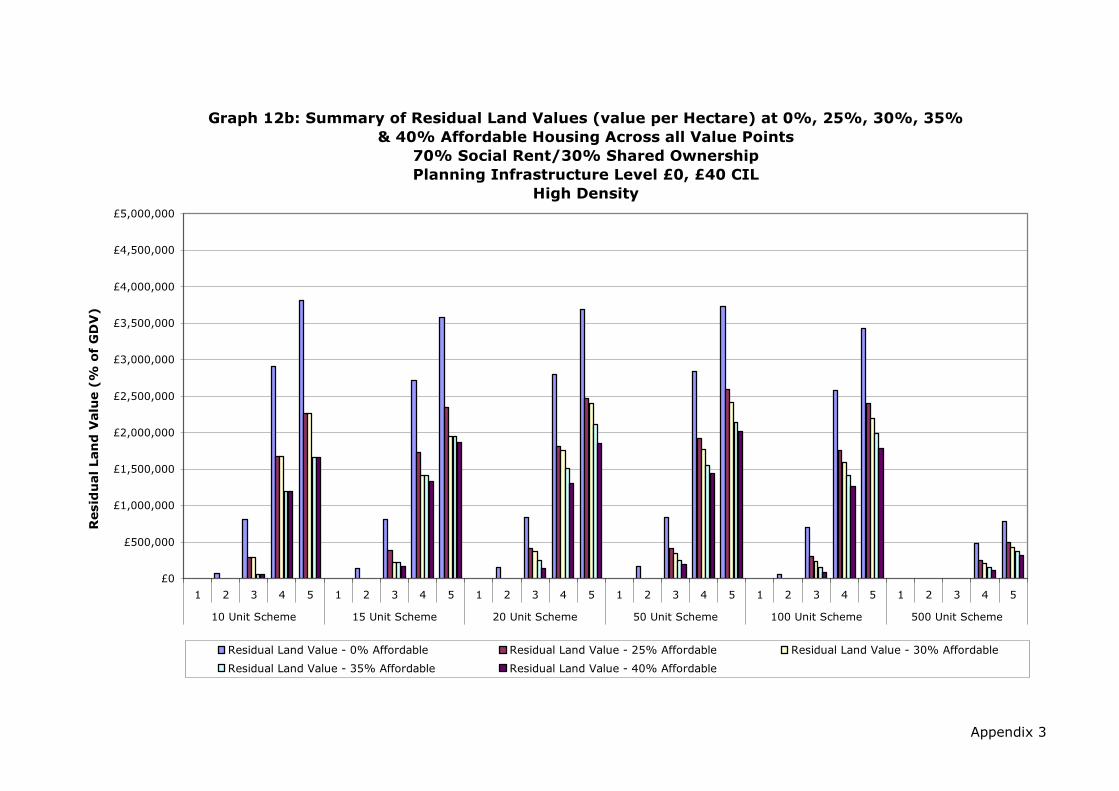
Appendix 3
Graph 12b: Summary of Residual Land Values (value per Hectare) at 0%, 25%, 30%, 35%
& 40% Affordable Housing Across all Value Points
70% Social Rent/30% Shared Ownership
Planning Infrastructure Level £0, £40 CIL
High Density
£0
£500,000
£1,000,000
£1,500,000
£2,000,000
£2,500,000
£3,000,000
£3,500,000
£4,000,000
£4,500,000
£5,000,000
1 2 3 4 5 1 2 3 4 5 1 2 3 4 5 1 2 3 4 5 1 2 3 4 5 1 2 3 4 5
10 Unit Scheme 15 Unit Scheme 20 Unit Scheme 50 Unit Scheme 100 Unit Scheme 500 Unit Scheme
Resid
ual Lan
d V
alu
e (%
o
f G
DV
)
Residual Land Value - 0% Affordable Residual Land Value - 25% Affordable Residual Land Value - 30% Affordable
Residual Land Value - 35% Affordable Residual Land Value - 40% Affordable

Development Scenario /
Threshold Value Point
Residual Land
Value - 0%
Affordable
Residual Land
Value - 25%
Affordable
Residual Land
Value - 30%
Affordable
Residual Land
Value - 35%
Affordable
Residual Land
Value - 40%
Affordable
1 £0 £0 £0 £0 £0
2 £63,147 £0 £0 £0 £0
3 £252,010 £143,815 £143,815 £97,586 £97,586
4 £1,055,810 £753,768 £753,768 £654,071 £654,071
5 £1,380,194 £995,322 £995,322 £874,223 £874,223
1 £0 £0 £0 £0 £0
2 £82,993 £0 £0 £0 £0
3 £366,245 £214,980 £171,436 £171,436 £158,004
4 £1,559,626 £1,162,339 £1,063,746 £1,063,746 £996,146
5 £2,028,303 £1,527,938 £1,408,181 £1,408,181 £1,319,416
1 £0 £0 £0 £0 £0
2 £103,727 £0 £0 £0 £0
3 £475,789 £276,957 £264,000 £224,438 £171,461
4 £2,056,873 £1,563,771 £1,496,550 £1,398,509 £1,266,750
5 £2,694,859 £2,078,211 £1,989,944 £1,870,858 £1,699,736
1 £0 £0 £0 £0 £0
2 £186,657 £0 £0 £0 £0
3 £1,064,404 £605,172 £520,637 £418,245 £353,576
4 £4,799,485 £3,605,708 £3,391,800 £3,126,496 £2,933,120
5 £6,260,518 £4,765,251 £4,492,636 £4,165,974 £3,913,891
1 £0 £0 £0 £0 £0
2 £61,580 £0 £0 £0 £0
3 £1,723,499 £870,292 £709,482 £529,329 £381,322
4 £8,760,609 £6,551,007 £6,118,918 £5,667,486 £5,244,269
5 £11,513,279 £8,738,152 £8,192,958 £7,628,421 £7,092,099
1 £0 £0 £0 £0 £0
2 £0 £0 £0 £0 £0
3 £0 £0 £0 £0 £0
4 £6,658,991 £4,004,751 £3,471,163 £2,942,141 £2,408,553
5 £10,339,689 £6,995,101 £6,320,556 £5,655,390 £4,980,845
Source: Adams Integra, August 2012
100 Unit Scheme
500 Unit Scheme
10 Unit Scheme
15 Unit Scheme
20 Unit Scheme
50 Unit Scheme
Table 13: Summary of Residual Land Value (£) Appraisals for
All Value Points
0%, 25%, 30%, 35% and 40% Affordable Housing
70% Social Rent/30% Shared Ownership
Planning Infrastructure Level £0, £60 CIL
Low Density
Appendix 3

Appendix 3
Graph 13: Summary of Residual Land Values at 0%, 25%, 30%, 35% & 40%
Affordable Housing Across All Value Points
70% Social Rent/30% Shared Ownership
Planning Infrastructure Level £0, £60 CIL
Low Density
£0
£1,000,000
£2,000,000
£3,000,000
£4,000,000
£5,000,000
£6,000,000
£7,000,000
£8,000,000
£9,000,000
£10,000,000
£11,000,000
£12,000,000
1 2 3 4 5 1 2 3 4 5 1 2 3 4 5 1 2 3 4 5 1 2 3 4 5 1 2 3 4 5
10 Unit Scheme 15 Unit Scheme 20 Unit Scheme 50 Unit Scheme 100 Unit Scheme 500 Unit Scheme
Resid
ual Lan
d V
alu
e (£
)
Residual Land Value - 0% Affordable Residual Land Value - 25% Affordable Residual Land Value - 30% Affordable
Residual Land Value - 35% Affordable Residual Land Value - 40% Affordable

Development Scenario /
Threshold Value Point
Residual Land
Value - 0%
Affordable
Residual Land
Value - 25%
Affordable
Residual Land
Value - 30%
Affordable
Residual Land
Value - 35%
Affordable
Residual Land
Value - 40%
Affordable
1 0.0% 0.0% 0.0% 0.0% 0.0%
2 2.9% 0.0% 0.0% 0.0% 0.0%
3 10.3% 6.5% 6.5% 4.6% 4.6%
4 28.8% 24.0% 24.0% 22.0% 22.0%
5 33.3% 28.4% 28.4% 26.4% 26.4%
1 0.0% 0.0% 0.0% 0.0% 0.0%
2 2.5% 0.0% 0.0% 0.0% 0.0%
3 9.8% 6.3% 5.2% 5.2% 4.8%
4 28.2% 23.9% 22.7% 22.7% 21.9%
5 32.5% 28.3% 27.0% 27.0% 26.1%
1 0.0% 0.0% 0.0% 0.0% 0.0%
2 2.4% 0.0% 0.0% 0.0% 0.0%
3 9.7% 6.1% 5.9% 5.1% 4.0%
4 28.1% 24.2% 23.6% 22.6% 21.3%
5 32.5% 28.6% 28.0% 27.1% 25.7%
1 0.0% 0.0% 0.0% 0.0% 0.0%
2 1.7% 0.0% 0.0% 0.0% 0.0%
3 8.8% 5.4% 4.8% 3.9% 3.3%
4 26.7% 22.8% 22.0% 20.9% 20.1%
5 30.9% 27.0% 26.2% 25.1% 24.2%
1 0.0% 0.0% 0.0% 0.0% 0.0%
2 0.3% 0.0% 0.0% 0.0% 0.0%
3 7.1% 3.9% 3.2% 2.5% 1.8%
4 24.4% 20.7% 19.8% 18.9% 17.9%
5 28.4% 24.7% 23.9% 22.9% 22.0%
1 0.0% 0.0% 0.0% 0.0% 0.0%
2 0.0% 0.0% 0.0% 0.0% 0.0%
3 0.0% 0.0% 0.0% 0.0% 0.0%
4 3.9% 2.6% 2.3% 2.0% 1.7%
5 5.3% 4.1% 3.8% 3.5% 3.2%
Source: Adams Integra, August 2012
100 Unit Scheme
500 Unit Scheme
10 Unit Scheme
15 Unit Scheme
20 Unit Scheme
50 Unit Scheme
Table 13a: Summary of Residual Land Value (as % of GDV) Appraisals for
All Value Points
0%, 25%, 30%, 35% and 40% Affordable Housing
70% Social Rent/30% Shared Ownership
Planning Infrastructure Level £0, £60 CIL
Low Density
Appendix 3
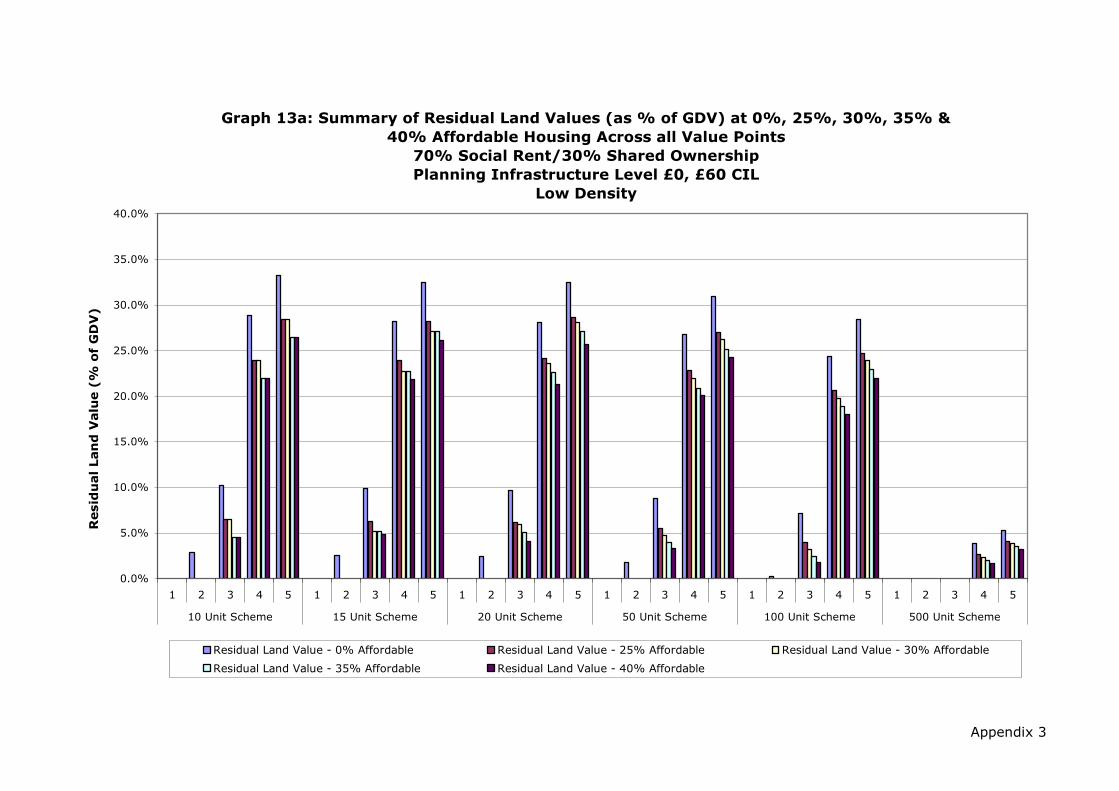
Appendix 3
Graph 13a: Summary of Residual Land Values (as % of GDV) at 0%, 25%, 30%, 35% &
40% Affordable Housing Across all Value Points
70% Social Rent/30% Shared Ownership
Planning Infrastructure Level £0, £60 CIL
Low Density
0.0%
5.0%
10.0%
15.0%
20.0%
25.0%
30.0%
35.0%
40.0%
1 2 3 4 5 1 2 3 4 5 1 2 3 4 5 1 2 3 4 5 1 2 3 4 5 1 2 3 4 5
10 Unit Scheme 15 Unit Scheme 20 Unit Scheme 50 Unit Scheme 100 Unit Scheme 500 Unit Scheme
Resid
ual Lan
d V
alu
e (%
o
f G
DV
)
Residual Land Value - 0% Affordable Residual Land Value - 25% Affordable Residual Land Value - 30% Affordable
Residual Land Value - 35% Affordable Residual Land Value - 40% Affordable

Development Scenario /
Threshold Value Point
Residual Land
Value - 0%
Affordable
Residual Land
Value - 25%
Affordable
Residual Land
Value - 30%
Affordable
Residual Land
Value - 35%
Affordable
Residual Land
Value - 40%
Affordable
1 £0 £0 £0 £0 £0
2 £252,589 £0 £0 £0 £0
3 £1,008,040 £575,259 £575,259 £390,346 £390,346
4 £4,223,238 £3,015,072 £3,015,072 £2,616,282 £2,616,282
5 £5,520,775 £3,981,287 £3,981,287 £3,496,891 £3,496,891
1 £0 £0 £0 £0 £0
2 £221,315 £0 £0 £0 £0
3 £976,653 £573,281 £457,162 £457,162 £421,343
4 £4,159,003 £3,099,570 £2,836,656 £2,836,656 £2,656,389
5 £5,408,807 £4,074,501 £3,755,149 £3,755,149 £3,518,444
1 £0 £0 £0 £0 £0
2 £207,454 £0 £0 £0 £0
3 £951,577 £553,913 £528,001 £448,877 £342,922
4 £4,113,747 £3,127,542 £2,993,099 £2,797,019 £2,533,499
5 £5,389,718 £4,156,423 £3,979,888 £3,741,716 £3,399,472
1 £0 £0 £0 £0 £0
2 £149,325 £0 £0 £0 £0
3 £851,523 £484,138 £416,510 £334,596 £282,861
4 £3,839,588 £2,884,566 £2,713,440 £2,501,197 £2,346,496
5 £5,008,414 £3,812,201 £3,594,109 £3,332,779 £3,131,113
1 £0 £0 £0 £0 £0
2 £24,632 £0 £0 £0 £0
3 £689,400 £348,117 £283,793 £211,732 £152,529
4 £3,504,244 £2,620,403 £2,447,567 £2,266,994 £2,097,708
5 £4,605,312 £3,495,261 £3,277,183 £3,051,368 £2,836,840
1 £0 £0 £0 £0 £0
2 £0 £0 £0 £0 £0
3 £0 £0 £0 £0 £0
4 £532,719 £320,380 £277,693 £235,371 £192,684
5 £827,175 £559,608 £505,645 £452,431 £398,468
Source: Adams Integra, August 2012
100 Unit Scheme
500 Unit Scheme
10 Unit Scheme
15 Unit Scheme
20 Unit Scheme
50 Unit Scheme
Table 13b: Summary of Residual Land Value (value per Hectare) Appraisals
for All Value Points
0%, 25%, 30%, 35% and 40% Affordable Housing
70% Social Rent/30% Shared Ownership
Planning Infrastructure Level £0, £60 CIL
Low Density
Appendix 3

Appendix 3
Graph 13b: Summary of Residual Land Values (value per Hectare) at 0%, 25%, 30%, 35%
& 40% Affordable Housing Across all Value Points
70% Social Rent/30% Shared Ownership
Planning Infrastructure Level £0, £60 CIL
Low Density
£0
£500,000
£1,000,000
£1,500,000
£2,000,000
£2,500,000
£3,000,000
£3,500,000
£4,000,000
£4,500,000
£5,000,000
£5,500,000
£6,000,000
1 2 3 4 5 1 2 3 4 5 1 2 3 4 5 1 2 3 4 5 1 2 3 4 5 1 2 3 4 5
10 Unit Scheme 15 Unit Scheme 20 Unit Scheme 50 Unit Scheme 100 Unit Scheme 500 Unit Scheme
Resid
ual Lan
d V
alu
e (%
o
f G
DV
)
Residual Land Value - 0% Affordable Residual Land Value - 25% Affordable Residual Land Value - 30% Affordable
Residual Land Value - 35% Affordable Residual Land Value - 40% Affordable
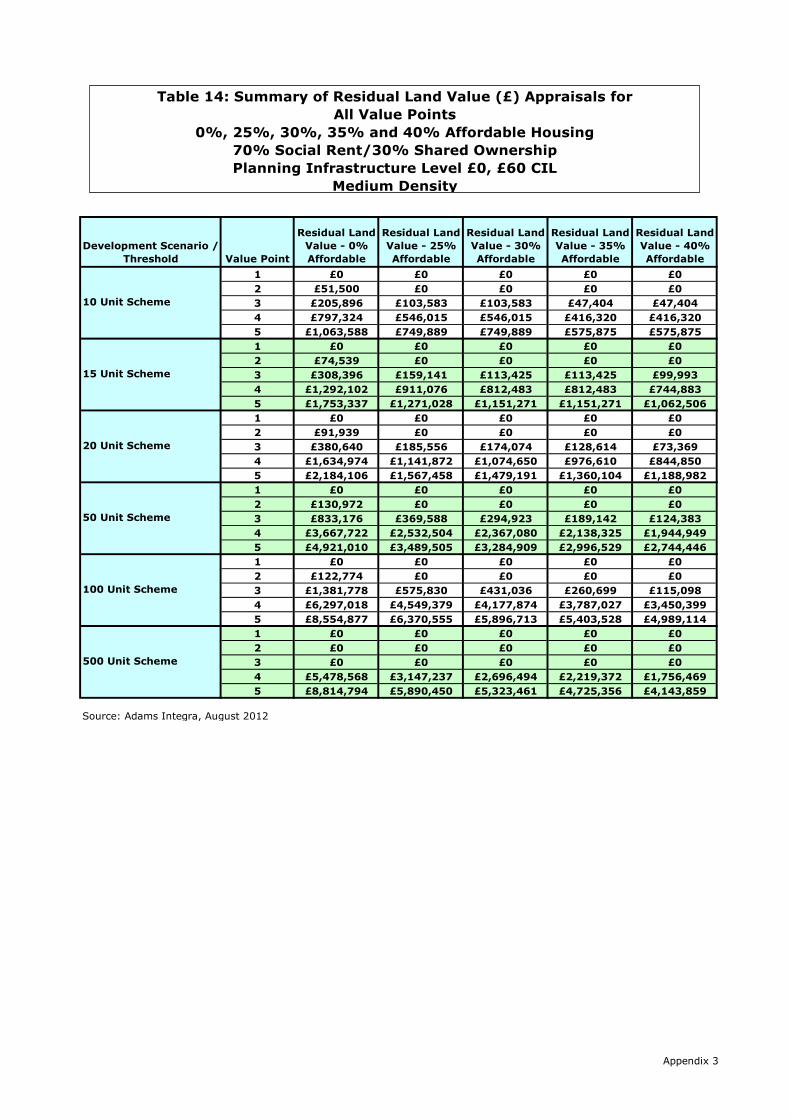
Development Scenario /
Threshold Value Point
Residual Land
Value - 0%
Affordable
Residual Land
Value - 25%
Affordable
Residual Land
Value - 30%
Affordable
Residual Land
Value - 35%
Affordable
Residual Land
Value - 40%
Affordable
1 £0 £0 £0 £0 £0
2 £51,500 £0 £0 £0 £0
3 £205,896 £103,583 £103,583 £47,404 £47,404
4 £797,324 £546,015 £546,015 £416,320 £416,320
5 £1,063,588 £749,889 £749,889 £575,875 £575,875
1 £0 £0 £0 £0 £0
2 £74,539 £0 £0 £0 £0
3 £308,396 £159,141 £113,425 £113,425 £99,993
4 £1,292,102 £911,076 £812,483 £812,483 £744,883
5 £1,753,337 £1,271,028 £1,151,271 £1,151,271 £1,062,506
1 £0 £0 £0 £0 £0
2 £91,939 £0 £0 £0 £0
3 £380,640 £185,556 £174,074 £128,614 £73,369
4 £1,634,974 £1,141,872 £1,074,650 £976,610 £844,850
5 £2,184,106 £1,567,458 £1,479,191 £1,360,104 £1,188,982
1 £0 £0 £0 £0 £0
2 £130,972 £0 £0 £0 £0
3 £833,176 £369,588 £294,923 £189,142 £124,383
4 £3,667,722 £2,532,504 £2,367,080 £2,138,325 £1,944,949
5 £4,921,010 £3,489,505 £3,284,909 £2,996,529 £2,744,446
1 £0 £0 £0 £0 £0
2 £122,774 £0 £0 £0 £0
3 £1,381,778 £575,830 £431,036 £260,699 £115,098
4 £6,297,018 £4,549,379 £4,177,874 £3,787,027 £3,450,399
5 £8,554,877 £6,370,555 £5,896,713 £5,403,528 £4,989,114
1 £0 £0 £0 £0 £0
2 £0 £0 £0 £0 £0
3 £0 £0 £0 £0 £0
4 £5,478,568 £3,147,237 £2,696,494 £2,219,372 £1,756,469
5 £8,814,794 £5,890,450 £5,323,461 £4,725,356 £4,143,859
Source: Adams Integra, August 2012
100 Unit Scheme
500 Unit Scheme
10 Unit Scheme
15 Unit Scheme
20 Unit Scheme
50 Unit Scheme
Table 14: Summary of Residual Land Value (£) Appraisals for
All Value Points
0%, 25%, 30%, 35% and 40% Affordable Housing
70% Social Rent/30% Shared Ownership
Planning Infrastructure Level £0, £60 CIL
Medium Density
Appendix 3
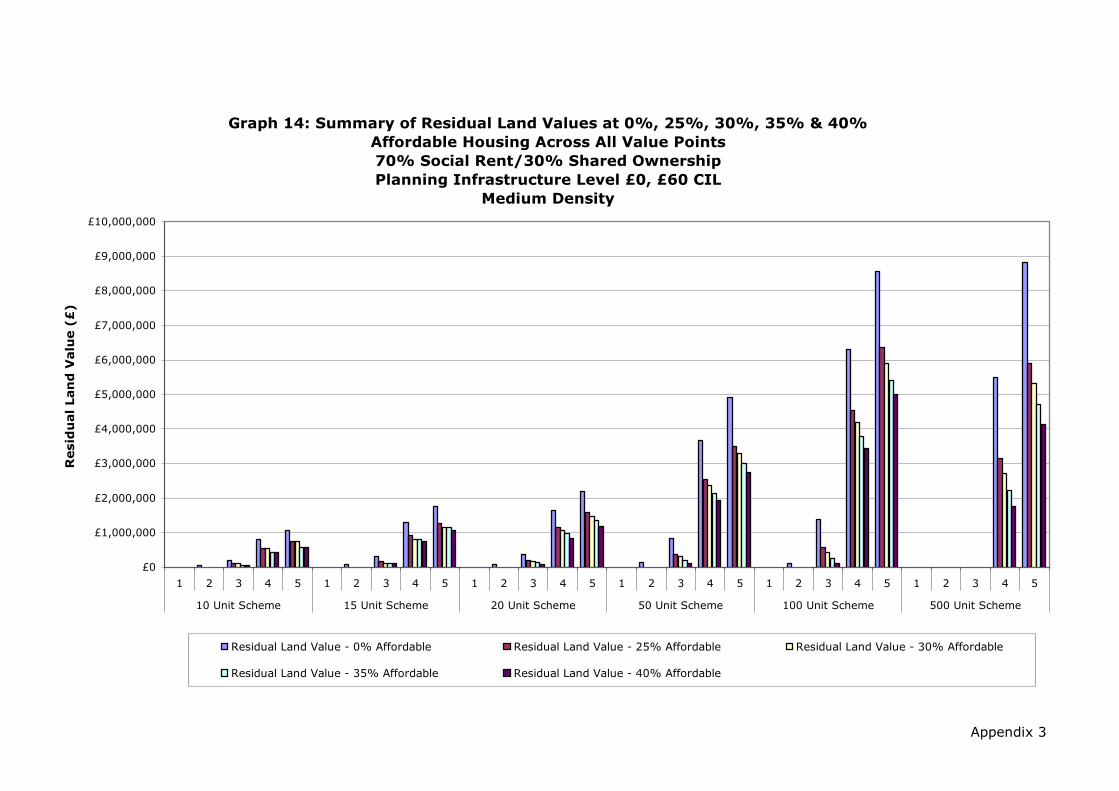
Appendix 3
Graph 14: Summary of Residual Land Values at 0%, 25%, 30%, 35% & 40%
Affordable Housing Across All Value Points
70% Social Rent/30% Shared Ownership
Planning Infrastructure Level £0, £60 CIL
Medium Density
£0
£1,000,000
£2,000,000
£3,000,000
£4,000,000
£5,000,000
£6,000,000
£7,000,000
£8,000,000
£9,000,000
£10,000,000
1 2 3 4 5 1 2 3 4 5 1 2 3 4 5 1 2 3 4 5 1 2 3 4 5 1 2 3 4 5
10 Unit Scheme 15 Unit Scheme 20 Unit Scheme 50 Unit Scheme 100 Unit Scheme 500 Unit Scheme
Resid
ual Lan
d V
alu
e (£
)
Residual Land Value - 0% Affordable Residual Land Value - 25% Affordable Residual Land Value - 30% Affordable
Residual Land Value - 35% Affordable Residual Land Value - 40% Affordable

Development Scenario /
Threshold Value Point
Residual Land
Value - 0%
Affordable
Residual Land
Value - 25%
Affordable
Residual Land
Value - 30%
Affordable
Residual Land
Value - 35%
Affordable
Residual Land
Value - 40%
Affordable
1 0.0% 0.0% 0.0% 0.0% 0.0%
2 3.1% 0.0% 0.0% 0.0% 0.0%
3 10.8% 6.1% 6.1% 3.0% 3.0%
4 28.5% 23.1% 23.1% 19.4% 19.4%
5 33.2% 28.1% 28.1% 24.1% 24.1%
1 0.0% 0.0% 0.0% 0.0% 0.0%
2 2.8% 0.0% 0.0% 0.0% 0.0%
3 10.3% 5.9% 4.3% 4.3% 3.9%
4 28.7% 23.7% 22.1% 22.1% 21.0%
5 33.7% 29.0% 27.5% 27.5% 26.4%
1 0.0% 0.0% 0.0% 0.0% 0.0%
2 2.6% 0.0% 0.0% 0.0% 0.0%
3 9.6% 5.2% 5.0% 3.8% 2.2%
4 27.9% 22.8% 22.0% 20.7% 18.8%
5 32.6% 27.7% 26.9% 25.7% 23.7%
1 0.0% 0.0% 0.0% 0.0% 0.0%
2 1.6% 0.0% 0.0% 0.0% 0.0%
3 8.8% 4.4% 3.6% 2.3% 1.6%
4 26.4% 21.4% 20.5% 19.2% 18.0%
5 31.0% 26.1% 25.3% 24.0% 22.8%
1 0.0% 0.0% 0.0% 0.0% 0.0%
2 0.8% 0.0% 0.0% 0.0% 0.0%
3 7.6% 3.5% 2.7% 1.7% 0.7%
4 23.8% 19.7% 18.7% 17.5% 16.5%
5 28.4% 24.4% 23.4% 22.3% 21.2%
1 0.0% 0.0% 0.0% 0.0% 0.0%
2 0.0% 0.0% 0.0% 0.0% 0.0%
3 0.0% 0.0% 0.0% 0.0% 0.0%
4 3.8% 2.5% 2.2% 1.8% 1.5%
5 5.3% 4.0% 3.8% 3.4% 3.1%
Source: Adams Integra, August 2012
100 Unit Scheme
500 Unit Scheme
10 Unit Scheme
15 Unit Scheme
20 Unit Scheme
50 Unit Scheme
Table 14a: Summary of Residual Land Value (as % of GDV) Appraisals for
All Value Points
0%, 25%, 30%, 35% and 40% Affordable Housing
70% Social Rent/30% Shared Ownership
Planning Infrastructure Level £0, £60 CIL
Medium Density
Appendix 3
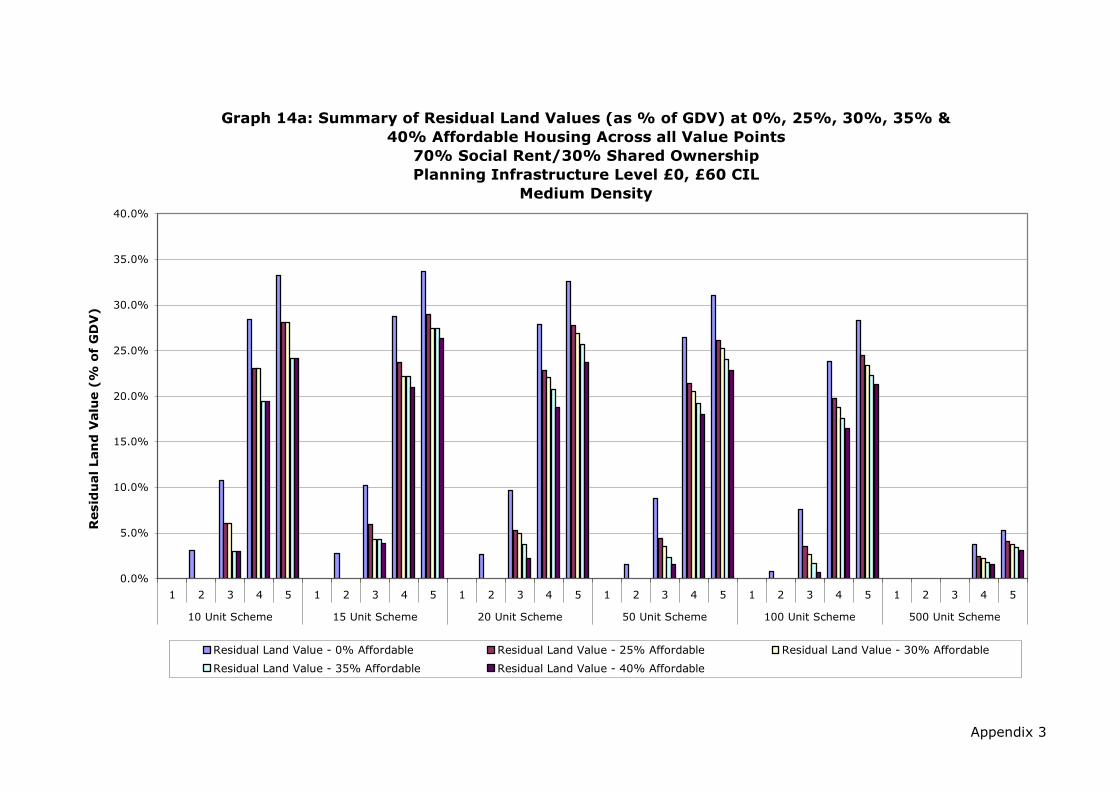
Appendix 3
Graph 14a: Summary of Residual Land Values (as % of GDV) at 0%, 25%, 30%, 35% &
40% Affordable Housing Across all Value Points
70% Social Rent/30% Shared Ownership
Planning Infrastructure Level £0, £60 CIL
Medium Density
0.0%
5.0%
10.0%
15.0%
20.0%
25.0%
30.0%
35.0%
40.0%
1 2 3 4 5 1 2 3 4 5 1 2 3 4 5 1 2 3 4 5 1 2 3 4 5 1 2 3 4 5
10 Unit Scheme 15 Unit Scheme 20 Unit Scheme 50 Unit Scheme 100 Unit Scheme 500 Unit Scheme
Resid
ual Lan
d V
alu
e (%
o
f G
DV
)
Residual Land Value - 0% Affordable Residual Land Value - 25% Affordable Residual Land Value - 30% Affordable
Residual Land Value - 35% Affordable Residual Land Value - 40% Affordable

Development Scenario /
Threshold Value Point
Residual Land
Value - 0%
Affordable
Residual Land
Value - 25%
Affordable
Residual Land
Value - 30%
Affordable
Residual Land
Value - 35%
Affordable
Residual Land
Value - 40%
Affordable
1 £0 £0 £0 £0 £0
2 £231,749 £0 £0 £0 £0
3 £926,534 £466,122 £466,122 £213,319 £213,319
4 £3,587,957 £2,457,067 £2,457,067 £1,873,441 £1,873,441
5 £4,786,145 £3,374,501 £3,374,501 £2,591,437 £2,591,437
1 £0 £0 £0 £0 £0
2 £223,617 £0 £0 £0 £0
3 £925,187 £477,422 £340,274 £340,274 £299,978
4 £3,876,306 £2,733,227 £2,437,449 £2,437,449 £2,234,649
5 £5,260,010 £3,813,083 £3,453,812 £3,453,812 £3,187,518
1 £0 £0 £0 £0 £0
2 £206,862 £0 £0 £0 £0
3 £856,439 £417,501 £391,665 £289,381 £165,080
4 £3,678,691 £2,569,211 £2,417,963 £2,197,372 £1,900,913
5 £4,914,238 £3,526,780 £3,328,179 £3,060,235 £2,675,210
1 £0 £0 £0 £0 £0
2 £117,875 £0 £0 £0 £0
3 £749,859 £332,630 £265,430 £170,227 £111,945
4 £3,300,950 £2,279,254 £2,130,372 £1,924,492 £1,750,454
5 £4,428,909 £3,140,554 £2,956,418 £2,696,876 £2,470,002
1 £0 £0 £0 £0 £0
2 £55,248 £0 £0 £0 £0
3 £621,800 £259,124 £193,966 £117,315 £51,794
4 £2,833,658 £2,047,220 £1,880,043 £1,704,162 £1,552,679
5 £3,849,694 £2,866,750 £2,653,521 £2,431,588 £2,245,101
1 £0 £0 £0 £0 £0
2 £0 £0 £0 £0 £0
3 £0 £0 £0 £0 £0
4 £493,071 £283,251 £242,684 £199,743 £158,082
5 £793,331 £530,140 £479,112 £425,282 £372,947
Source: Adams Integra, August 2012
100 Unit Scheme
500 Unit Scheme
10 Unit Scheme
15 Unit Scheme
20 Unit Scheme
50 Unit Scheme
Table 14b: Summary of Residual Land Value (value per Hectare) Appraisals
for All Value Points
0%, 25%, 30%, 35% and 40% Affordable Housing
70% Social Rent/30% Shared Ownership
Planning Infrastructure Level £0, £60 CIL
Medium Density
Appendix 3
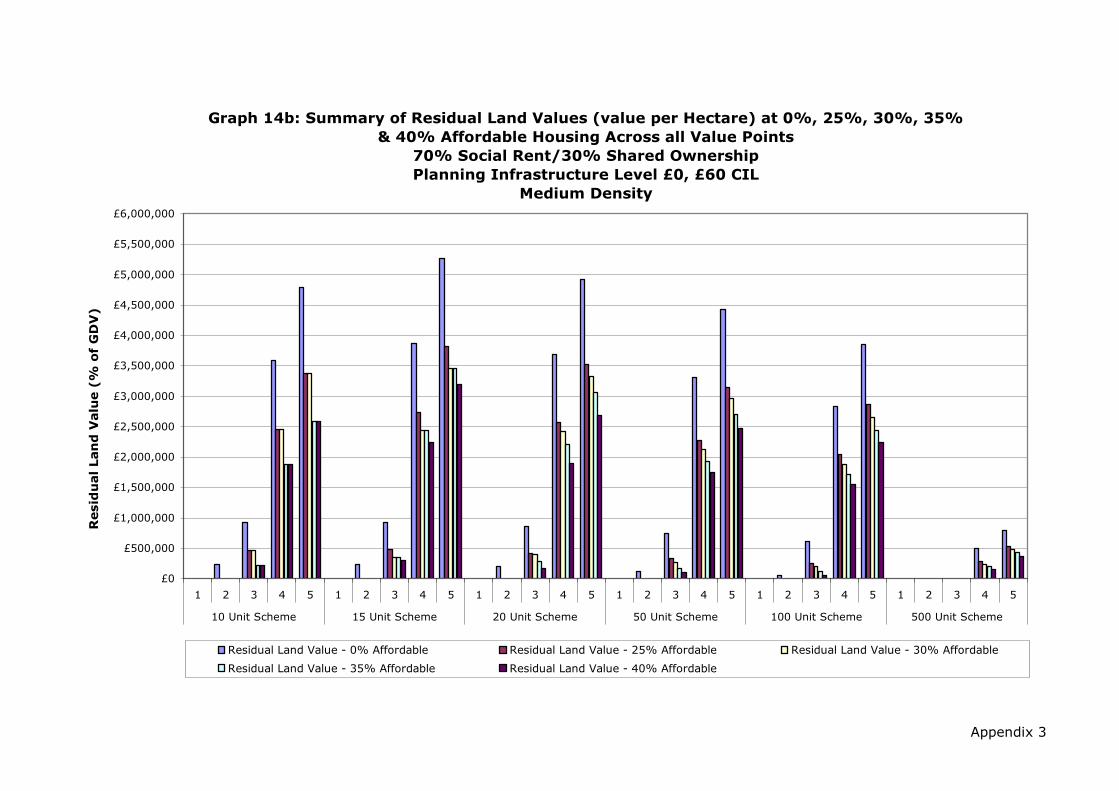
Appendix 3
Graph 14b: Summary of Residual Land Values (value per Hectare) at 0%, 25%, 30%, 35%
& 40% Affordable Housing Across all Value Points
70% Social Rent/30% Shared Ownership
Planning Infrastructure Level £0, £60 CIL
Medium Density
£0
£500,000
£1,000,000
£1,500,000
£2,000,000
£2,500,000
£3,000,000
£3,500,000
£4,000,000
£4,500,000
£5,000,000
£5,500,000
£6,000,000
1 2 3 4 5 1 2 3 4 5 1 2 3 4 5 1 2 3 4 5 1 2 3 4 5 1 2 3 4 5
10 Unit Scheme 15 Unit Scheme 20 Unit Scheme 50 Unit Scheme 100 Unit Scheme 500 Unit Scheme
Resid
ual Lan
d V
alu
e (%
o
f G
DV
)
Residual Land Value - 0% Affordable Residual Land Value - 25% Affordable Residual Land Value - 30% Affordable
Residual Land Value - 35% Affordable Residual Land Value - 40% Affordable

Development Scenario /
Threshold Value Point
Residual Land
Value - 0%
Affordable
Residual Land
Value - 25%
Affordable
Residual Land
Value - 30%
Affordable
Residual Land
Value - 35%
Affordable
Residual Land
Value - 40%
Affordable
1 £0 £0 £0 £0 £0
2 £1,345 £0 £0 £0 £0
3 £148,649 £44,255 £44,255 £0 £0
4 £569,510 £321,515 £321,515 £225,332 £225,332
5 £750,913 £441,768 £441,768 £319,408 £319,408
1 £0 £0 £0 £0 £0
2 £22,369 £0 £0 £0 £0
3 £231,456 £96,455 £50,739 £50,739 £30,897
4 £797,671 £500,843 £406,440 £406,440 £383,547
5 £1,057,436 £687,778 £568,021 £568,021 £542,783
1 £0 £0 £0 £0 £0
2 £34,345 £0 £0 £0 £0
3 £314,254 £141,944 £122,213 £76,753 £32,911
4 £1,094,559 £701,354 £678,824 £580,784 £498,913
5 £1,450,961 £964,287 £939,191 £820,105 £718,973
1 £0 £0 £0 £0 £0
2 £105,440 £0 £0 £0 £0
3 £776,526 £356,078 £281,257 £189,844 £140,616
4 £2,777,910 £1,858,280 £1,716,321 £1,491,865 £1,383,761
5 £3,676,270 £2,533,304 £2,360,135 £2,077,788 £1,953,267
1 £0 £0 £0 £0 £0
2 £6,138 £0 £0 £0 £0
3 £1,278,204 £511,566 £371,671 £199,577 £51,878
4 £5,048,927 £3,398,055 £3,077,046 £2,727,006 £2,405,997
5 £6,741,490 £4,696,607 £4,290,028 £3,863,837 £3,457,259
1 £0 £0 £0 £0 £0
2 £0 £0 £0 £0 £0
3 £0 £0 £0 £0 £0
4 £4,654,655 £2,323,324 £1,872,581 £1,395,459 £932,556
5 £7,669,918 £4,745,574 £4,178,585 £3,580,480 £2,998,982
Source: Adams Integra, August 2012
100 Unit Scheme
500 Unit Scheme
10 Unit Scheme
15 Unit Scheme
20 Unit Scheme
50 Unit Scheme
Table 15: Summary of Residual Land Value (£) Appraisals for
All Value Points
0%, 25%, 30%, 35% and 40% Affordable Housing
70% Social Rent/30% Shared Ownership
Planning Infrastructure Level £0, £60 CIL
High Density
Appendix 3
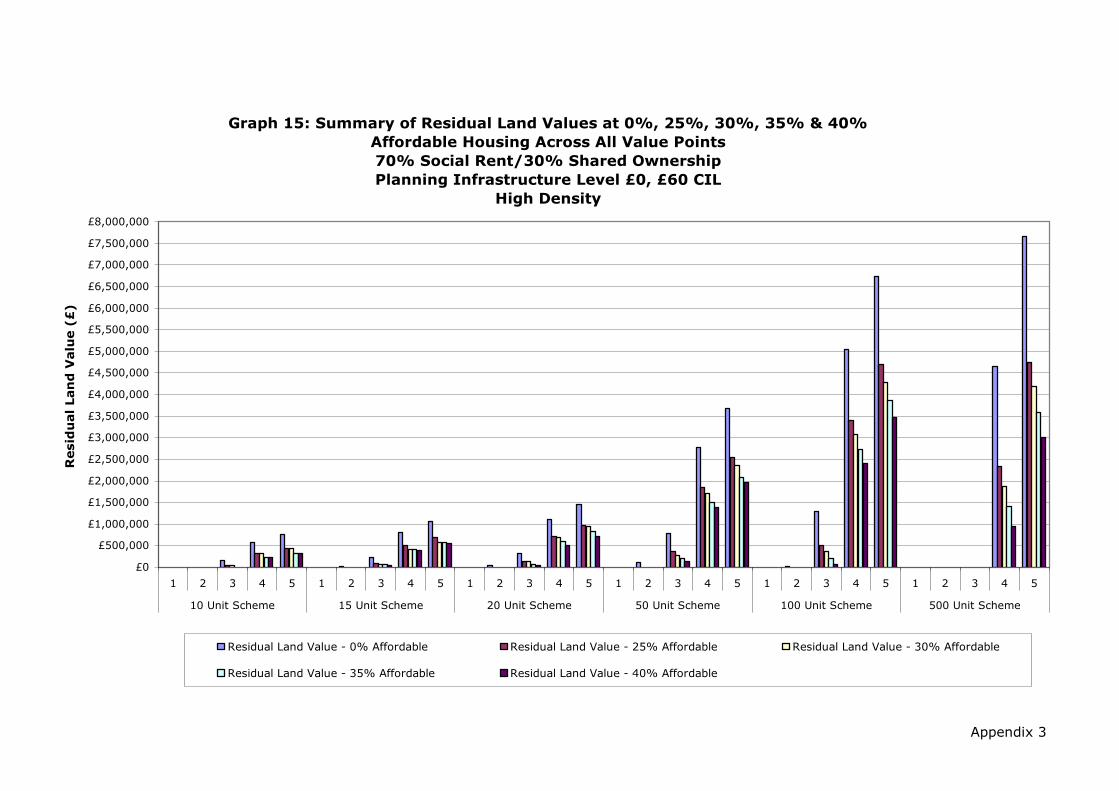
Appendix 3
Graph 15: Summary of Residual Land Values at 0%, 25%, 30%, 35% & 40%
Affordable Housing Across All Value Points
70% Social Rent/30% Shared Ownership
Planning Infrastructure Level £0, £60 CIL
High Density
£0
£500,000
£1,000,000
£1,500,000
£2,000,000
£2,500,000
£3,000,000
£3,500,000
£4,000,000
£4,500,000
£5,000,000
£5,500,000
£6,000,000
£6,500,000
£7,000,000
£7,500,000
£8,000,000
1 2 3 4 5 1 2 3 4 5 1 2 3 4 5 1 2 3 4 5 1 2 3 4 5 1 2 3 4 5
10 Unit Scheme 15 Unit Scheme 20 Unit Scheme 50 Unit Scheme 100 Unit Scheme 500 Unit Scheme
Resid
ual Lan
d V
alu
e (£
)
Residual Land Value - 0% Affordable Residual Land Value - 25% Affordable Residual Land Value - 30% Affordable
Residual Land Value - 35% Affordable Residual Land Value - 40% Affordable

Development Scenario /
Threshold Value Point
Residual Land
Value - 0%
Affordable
Residual Land
Value - 25%
Affordable
Residual Land
Value - 30%
Affordable
Residual Land
Value - 35%
Affordable
Residual Land
Value - 40%
Affordable
1 0.0% 0.0% 0.0% 0.0% 0.0%
2 0.1% 0.0% 0.0% 0.0% 0.0%
3 9.3% 3.2% 3.2% 0.0% 0.0%
4 25.5% 17.9% 17.9% 13.8% 13.8%
5 30.0% 22.3% 22.3% 18.0% 18.0%
1 0.0% 0.0% 0.0% 0.0% 0.0%
2 1.1% 0.0% 0.0% 0.0% 0.0%
3 10.0% 4.7% 2.6% 2.6% 1.6%
4 25.0% 18.7% 16.2% 16.2% 15.6%
5 29.5% 23.3% 20.6% 20.6% 20.1%
1 0.0% 0.0% 0.0% 0.0% 0.0%
2 1.3% 0.0% 0.0% 0.0% 0.0%
3 10.0% 5.1% 4.4% 2.9% 1.3%
4 25.2% 19.2% 18.8% 16.9% 15.1%
5 29.7% 23.8% 23.5% 21.6% 19.8%
1 0.0% 0.0% 0.0% 0.0% 0.0%
2 1.5% 0.0% 0.0% 0.0% 0.0%
3 9.6% 4.9% 4.0% 2.8% 2.1%
4 24.7% 19.4% 18.4% 16.8% 15.9%
5 29.1% 23.9% 22.9% 21.2% 20.4%
1 0.0% 0.0% 0.0% 0.0% 0.0%
2 0.0% 0.0% 0.0% 0.0% 0.0%
3 7.9% 3.5% 2.6% 1.4% 0.4%
4 22.5% 17.6% 16.5% 15.2% 13.9%
5 26.7% 21.9% 20.8% 19.4% 18.1%
1 0.0% 0.0% 0.0% 0.0% 0.0%
2 0.0% 0.0% 0.0% 0.0% 0.0%
3 0.0% 0.0% 0.0% 0.0% 0.0%
4 3.6% 2.1% 1.7% 1.3% 0.9%
5 5.1% 3.7% 3.4% 3.0% 2.6%
Source: Adams Integra, August 2012
100 Unit Scheme
500 Unit Scheme
10 Unit Scheme
15 Unit Scheme
20 Unit Scheme
50 Unit Scheme
Table 15a: Summary of Residual Land Value (as % of GDV) Appraisals for
All Value Points
0%, 25%, 30%, 35% and 40% Affordable Housing
70% Social Rent/30% Shared Ownership
Planning Infrastructure Level £0, £60 CIL
High Density
Appendix 3

Appendix 3
Graph 15a: Summary of Residual Land Values (as % of GDV) at 0%, 25%, 30%, 35% &
40% Affordable Housing Across all Value Points
70% Social Rent/30% Shared Ownership
Planning Infrastructure Level £0, £60 CIL
High Density
0.0%
5.0%
10.0%
15.0%
20.0%
25.0%
30.0%
35.0%
40.0%
1 2 3 4 5 1 2 3 4 5 1 2 3 4 5 1 2 3 4 5 1 2 3 4 5 1 2 3 4 5
10 Unit Scheme 15 Unit Scheme 20 Unit Scheme 50 Unit Scheme 100 Unit Scheme 500 Unit Scheme
Resid
ual Lan
d V
alu
e (%
o
f G
DV
)
Residual Land Value - 0% Affordable Residual Land Value - 25% Affordable Residual Land Value - 30% Affordable
Residual Land Value - 35% Affordable Residual Land Value - 40% Affordable

Development Scenario /
Threshold Value Point
Residual Land
Value - 0%
Affordable
Residual Land
Value - 25%
Affordable
Residual Land
Value - 30%
Affordable
Residual Land
Value - 35%
Affordable
Residual Land
Value - 40%
Affordable
1 £0 £0 £0 £0 £0
2 £6,727 £0 £0 £0 £0
3 £743,243 £221,276 £221,276 £0 £0
4 £2,847,549 £1,607,577 £1,607,577 £1,126,659 £1,126,659
5 £3,754,563 £2,208,841 £2,208,841 £1,597,039 £1,597,039
1 £0 £0 £0 £0 £0
2 £74,563 £0 £0 £0 £0
3 £771,519 £321,516 £169,129 £169,129 £102,989
4 £2,658,902 £1,669,475 £1,354,800 £1,354,800 £1,278,491
5 £3,524,788 £2,292,593 £1,893,403 £1,893,403 £1,809,278
1 £0 £0 £0 £0 £0
2 £85,862 £0 £0 £0 £0
3 £785,634 £354,859 £305,532 £191,882 £82,278
4 £2,736,398 £1,753,384 £1,697,060 £1,451,959 £1,247,283
5 £3,627,402 £2,410,718 £2,347,978 £2,050,263 £1,797,434
1 £0 £0 £0 £0 £0
2 £105,440 £0 £0 £0 £0
3 £776,526 £356,078 £281,257 £189,844 £140,616
4 £2,777,910 £1,858,280 £1,716,321 £1,491,865 £1,383,761
5 £3,676,270 £2,533,304 £2,360,135 £2,077,788 £1,953,267
1 £0 £0 £0 £0 £0
2 £3,069 £0 £0 £0 £0
3 £639,102 £255,783 £185,836 £99,788 £25,939
4 £2,524,463 £1,699,027 £1,538,523 £1,363,503 £1,202,999
5 £3,370,745 £2,348,303 £2,145,014 £1,931,919 £1,728,630
1 £0 £0 £0 £0 £0
2 £0 £0 £0 £0 £0
3 £0 £0 £0 £0 £0
4 £465,466 £232,332 £187,258 £139,546 £93,256
5 £766,992 £474,557 £417,859 £358,048 £299,898
Source: Adams Integra, August 2012
100 Unit Scheme
500 Unit Scheme
10 Unit Scheme
15 Unit Scheme
20 Unit Scheme
50 Unit Scheme
Table 15b: Summary of Residual Land Value (value per Hectare) Appraisals
for All Value Points
0%, 25%, 30%, 35% and 40% Affordable Housing
70% Social Rent/30% Shared Ownership
Planning Infrastructure Level £0, £60 CIL
High Density
Appendix 3

Appendix 3
Graph 15b: Summary of Residual Land Values (value per Hectare) at 0%, 25%, 30%, 35%
& 40% Affordable Housing Across all Value Points
70% Social Rent/30% Shared Ownership
Planning Infrastructure Level £0, £60 CIL
High Density
£0
£250,000
£500,000
£750,000
£1,000,000
£1,250,000
£1,500,000
£1,750,000
£2,000,000
£2,250,000
£2,500,000
£2,750,000
£3,000,000
£3,250,000
£3,500,000
£3,750,000
£4,000,000
1 2 3 4 5 1 2 3 4 5 1 2 3 4 5 1 2 3 4 5 1 2 3 4 5 1 2 3 4 5
10 Unit Scheme 15 Unit Scheme 20 Unit Scheme 50 Unit Scheme 100 Unit Scheme 500 Unit Scheme
Resid
ual Lan
d V
alu
e (%
o
f G
DV
)
Residual Land Value - 0% Affordable Residual Land Value - 25% Affordable Residual Land Value - 30% Affordable
Residual Land Value - 35% Affordable Residual Land Value - 40% Affordable

Appendix 3i
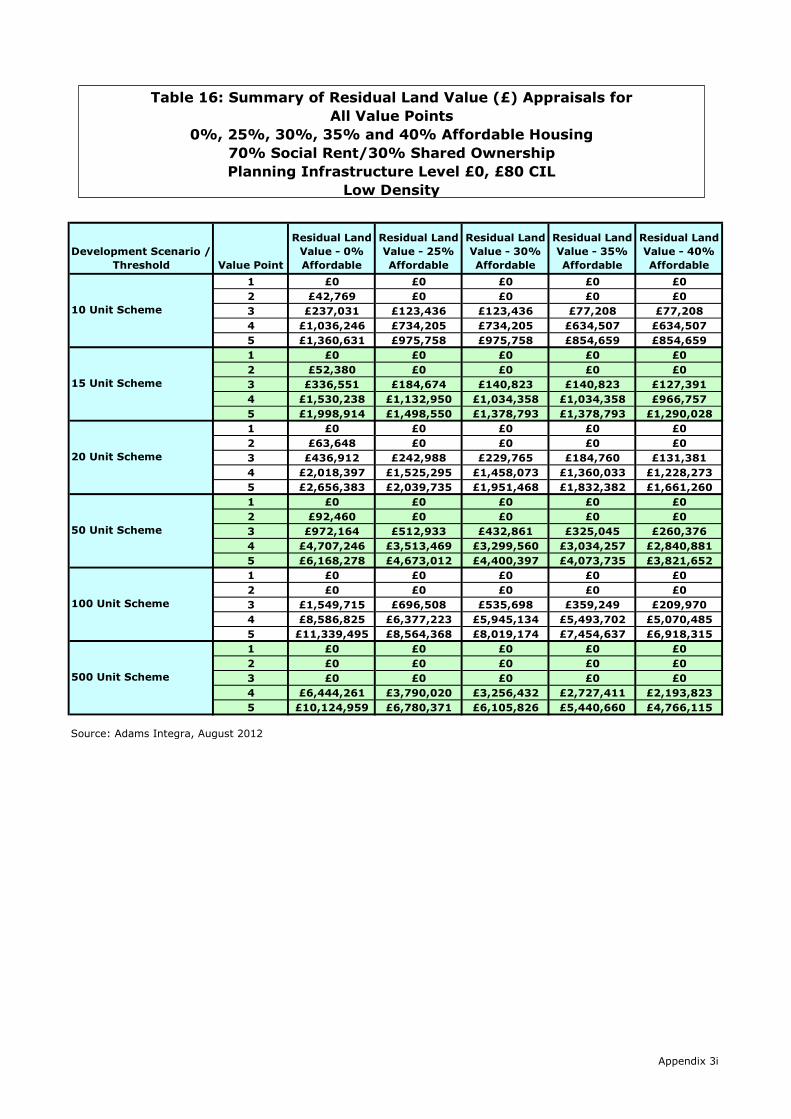
Development Scenario /
Threshold Value Point
Residual Land
Value - 0%
Affordable
Residual Land
Value - 25%
Affordable
Residual Land
Value - 30%
Affordable
Residual Land
Value - 35%
Affordable
Residual Land
Value - 40%
Affordable
1 £0 £0 £0 £0 £0
2 £42,769 £0 £0 £0 £0
3 £237,031 £123,436 £123,436 £77,208 £77,208
4 £1,036,246 £734,205 £734,205 £634,507 £634,507
5 £1,360,631 £975,758 £975,758 £854,659 £854,659
1 £0 £0 £0 £0 £0
2 £52,380 £0 £0 £0 £0
3 £336,551 £184,674 £140,823 £140,823 £127,391
4 £1,530,238 £1,132,950 £1,034,358 £1,034,358 £966,757
5 £1,998,914 £1,498,550 £1,378,793 £1,378,793 £1,290,028
1 £0 £0 £0 £0 £0
2 £63,648 £0 £0 £0 £0
3 £436,912 £242,988 £229,765 £184,760 £131,381
4 £2,018,397 £1,525,295 £1,458,073 £1,360,033 £1,228,273
5 £2,656,383 £2,039,735 £1,951,468 £1,832,382 £1,661,260
1 £0 £0 £0 £0 £0
2 £92,460 £0 £0 £0 £0
3 £972,164 £512,933 £432,861 £325,045 £260,376
4 £4,707,246 £3,513,469 £3,299,560 £3,034,257 £2,840,881
5 £6,168,278 £4,673,012 £4,400,397 £4,073,735 £3,821,652
1 £0 £0 £0 £0 £0
2 £0 £0 £0 £0 £0
3 £1,549,715 £696,508 £535,698 £359,249 £209,970
4 £8,586,825 £6,377,223 £5,945,134 £5,493,702 £5,070,485
5 £11,339,495 £8,564,368 £8,019,174 £7,454,637 £6,918,315
1 £0 £0 £0 £0 £0
2 £0 £0 £0 £0 £0
3 £0 £0 £0 £0 £0
4 £6,444,261 £3,790,020 £3,256,432 £2,727,411 £2,193,823
5 £10,124,959 £6,780,371 £6,105,826 £5,440,660 £4,766,115
Source: Adams Integra, August 2012
100 Unit Scheme
500 Unit Scheme
10 Unit Scheme
15 Unit Scheme
20 Unit Scheme
50 Unit Scheme
Table 16: Summary of Residual Land Value (£) Appraisals for
All Value Points
0%, 25%, 30%, 35% and 40% Affordable Housing
70% Social Rent/30% Shared Ownership
Planning Infrastructure Level £0, £80 CIL
Low Density
Appendix 3i
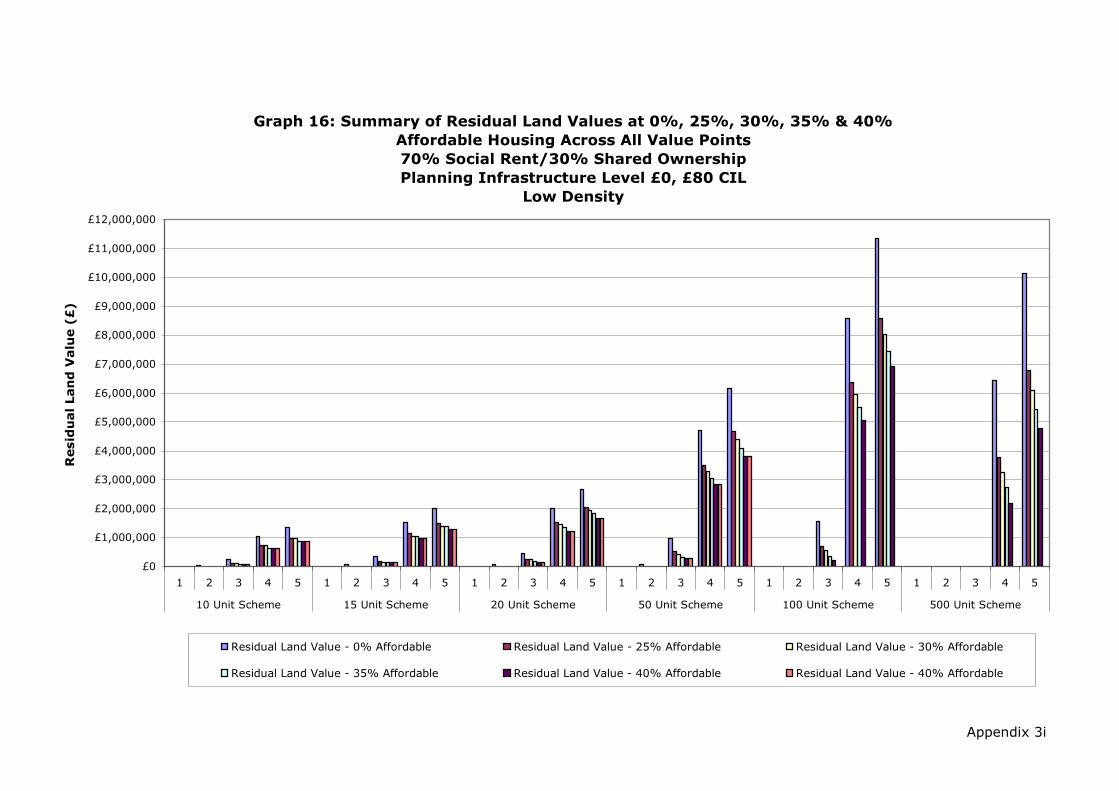
Appendix 3i
Graph 16: Summary of Residual Land Values at 0%, 25%, 30%, 35% & 40%
Affordable Housing Across All Value Points
70% Social Rent/30% Shared Ownership
Planning Infrastructure Level £0, £80 CIL
Low Density
£0
£1,000,000
£2,000,000
£3,000,000
£4,000,000
£5,000,000
£6,000,000
£7,000,000
£8,000,000
£9,000,000
£10,000,000
£11,000,000
£12,000,000
1 2 3 4 5 1 2 3 4 5 1 2 3 4 5 1 2 3 4 5 1 2 3 4 5 1 2 3 4 5
10 Unit Scheme 15 Unit Scheme 20 Unit Scheme 50 Unit Scheme 100 Unit Scheme 500 Unit Scheme
Resid
ual Lan
d V
alu
e (£
)
Residual Land Value - 0% Affordable Residual Land Value - 25% Affordable Residual Land Value - 30% Affordable
Residual Land Value - 35% Affordable Residual Land Value - 40% Affordable Residual Land Value - 40% Affordable

Development Scenario /
Threshold Value Point
Residual Land
Value - 0%
Affordable
Residual Land
Value - 25%
Affordable
Residual Land
Value - 30%
Affordable
Residual Land
Value - 35%
Affordable
Residual Land
Value - 40%
Affordable
1 0.0% 0.0% 0.0% 0.0% 0.0%
2 2.0% 0.0% 0.0% 0.0% 0.0%
3 9.7% 5.6% 5.6% 3.6% 3.6%
4 28.3% 23.3% 23.3% 21.3% 21.3%
5 32.8% 27.8% 27.8% 25.8% 25.8%
1 0.0% 0.0% 0.0% 0.0% 0.0%
2 1.6% 0.0% 0.0% 0.0% 0.0%
3 9.0% 5.4% 4.2% 4.2% 3.9%
4 27.6% 23.3% 22.1% 22.1% 21.2%
5 32.0% 27.7% 26.5% 26.5% 25.6%
1 0.0% 0.0% 0.0% 0.0% 0.0%
2 1.5% 0.0% 0.0% 0.0% 0.0%
3 8.9% 5.4% 5.1% 4.2% 3.1%
4 27.5% 23.6% 23.0% 22.0% 20.6%
5 32.0% 28.1% 27.5% 26.6% 25.1%
1 0.0% 0.0% 0.0% 0.0% 0.0%
2 0.9% 0.0% 0.0% 0.0% 0.0%
3 8.0% 4.6% 4.0% 3.0% 2.5%
4 26.2% 22.2% 21.4% 20.3% 19.4%
5 30.5% 26.5% 25.6% 24.6% 23.7%
1 0.0% 0.0% 0.0% 0.0% 0.0%
2 0.0% 0.0% 0.0% 0.0% 0.0%
3 6.4% 3.1% 2.4% 1.7% 1.0%
4 23.9% 20.1% 19.2% 18.3% 17.3%
5 28.0% 24.2% 23.3% 22.4% 21.4%
1 0.0% 0.0% 0.0% 0.0% 0.0%
2 0.0% 0.0% 0.0% 0.0% 0.0%
3 0.0% 0.0% 0.0% 0.0% 0.0%
4 3.8% 2.5% 2.2% 1.9% 1.6%
5 5.2% 4.0% 3.7% 3.4% 3.0%
Source: Adams Integra, August 2012
100 Unit Scheme
500 Unit Scheme
10 Unit Scheme
15 Unit Scheme
20 Unit Scheme
50 Unit Scheme
Table 16a: Summary of Residual Land Value (as % of GDV) Appraisals for
All Value Points
0%, 25%, 30%, 35% and 40% Affordable Housing
70% Social Rent/30% Shared Ownership
Planning Infrastructure Level £0, £80 CIL
Low Density
Appendix 3i
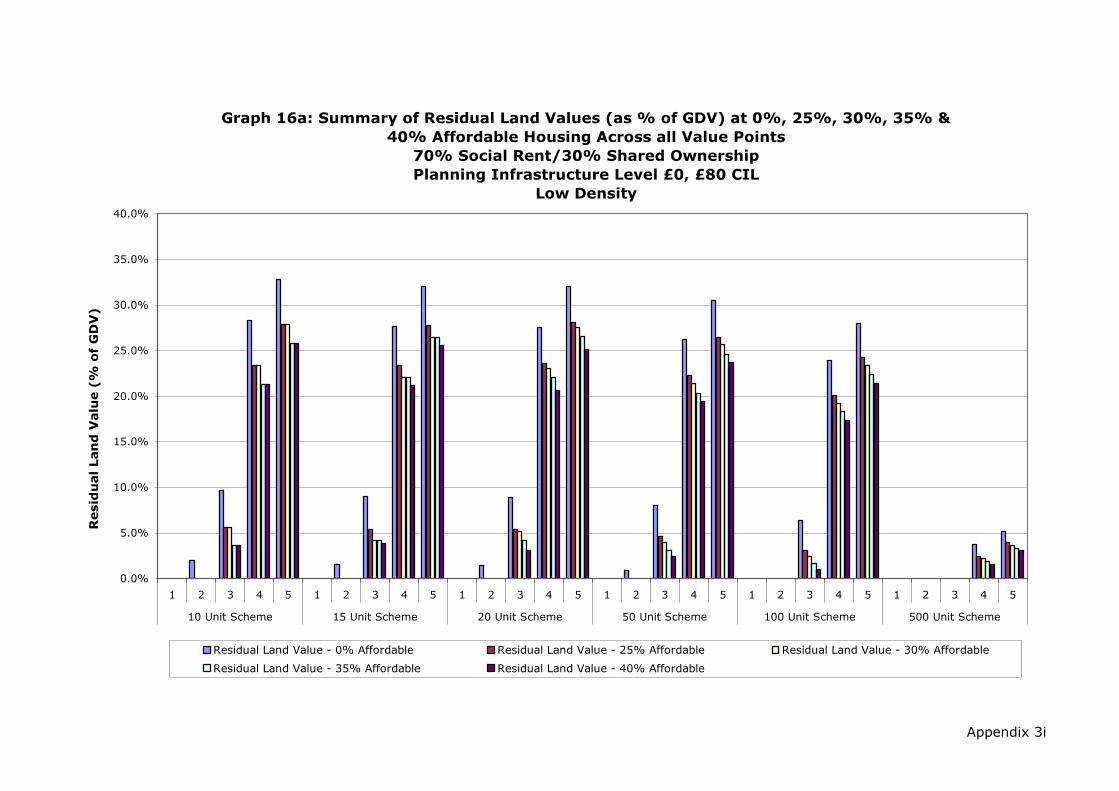
Appendix 3i
Graph 16a: Summary of Residual Land Values (as % of GDV) at 0%, 25%, 30%, 35% &
40% Affordable Housing Across all Value Points
70% Social Rent/30% Shared Ownership
Planning Infrastructure Level £0, £80 CIL
Low Density
0.0%
5.0%
10.0%
15.0%
20.0%
25.0%
30.0%
35.0%
40.0%
1 2 3 4 5 1 2 3 4 5 1 2 3 4 5 1 2 3 4 5 1 2 3 4 5 1 2 3 4 5
10 Unit Scheme 15 Unit Scheme 20 Unit Scheme 50 Unit Scheme 100 Unit Scheme 500 Unit Scheme
Resid
ual Lan
d V
alu
e (%
o
f G
DV
)
Residual Land Value - 0% Affordable Residual Land Value - 25% Affordable Residual Land Value - 30% Affordable
Residual Land Value - 35% Affordable Residual Land Value - 40% Affordable

Development Scenario /
Threshold Value Point
Residual Land
Value - 0%
Affordable
Residual Land
Value - 25%
Affordable
Residual Land
Value - 30%
Affordable
Residual Land
Value - 35%
Affordable
Residual Land
Value - 40%
Affordable
1 £0 £0 £0 £0 £0
2 £171,075 £0 £0 £0 £0
3 £948,125 £493,745 £493,745 £308,832 £308,832
4 £4,144,985 £2,936,819 £2,936,819 £2,538,029 £2,538,029
5 £5,442,522 £3,903,033 £3,903,033 £3,418,638 £3,418,638
1 £0 £0 £0 £0 £0
2 £139,681 £0 £0 £0 £0
3 £897,468 £492,464 £375,528 £375,528 £339,709
4 £4,080,635 £3,021,201 £2,758,287 £2,758,287 £2,578,020
5 £5,330,439 £3,996,132 £3,676,780 £3,676,780 £3,440,075
1 £0 £0 £0 £0 £0
2 £127,295 £0 £0 £0 £0
3 £873,823 £485,977 £459,530 £369,519 £262,763
4 £4,036,794 £3,050,590 £2,916,147 £2,720,066 £2,456,547
5 £5,312,766 £4,079,470 £3,902,936 £3,664,763 £3,322,519
1 £0 £0 £0 £0 £0
2 £73,968 £0 £0 £0 £0
3 £777,732 £410,346 £346,289 £260,036 £208,301
4 £3,765,797 £2,810,775 £2,639,648 £2,427,405 £2,272,705
5 £4,934,623 £3,738,410 £3,520,318 £3,258,988 £3,057,322
1 £0 £0 £0 £0 £0
2 £0 £0 £0 £0 £0
3 £619,886 £278,603 £214,279 £143,699 £83,988
4 £3,434,730 £2,550,889 £2,378,054 £2,197,481 £2,028,194
5 £4,535,798 £3,425,747 £3,207,669 £2,981,855 £2,767,326
1 £0 £0 £0 £0 £0
2 £0 £0 £0 £0 £0
3 £0 £0 £0 £0 £0
4 £515,541 £303,202 £260,515 £218,193 £175,506
5 £809,997 £542,430 £488,466 £435,253 £381,289
Source: Adams Integra, August 2012
100 Unit Scheme
500 Unit Scheme
10 Unit Scheme
15 Unit Scheme
20 Unit Scheme
50 Unit Scheme
Table 16b: Summary of Residual Land Value (value per Hectare) Appraisals
for All Value Points
0%, 25%, 30%, 35% and 40% Affordable Housing
70% Social Rent/30% Shared Ownership
Planning Infrastructure Level £0, £80 CIL
Low Density
Appendix 3i
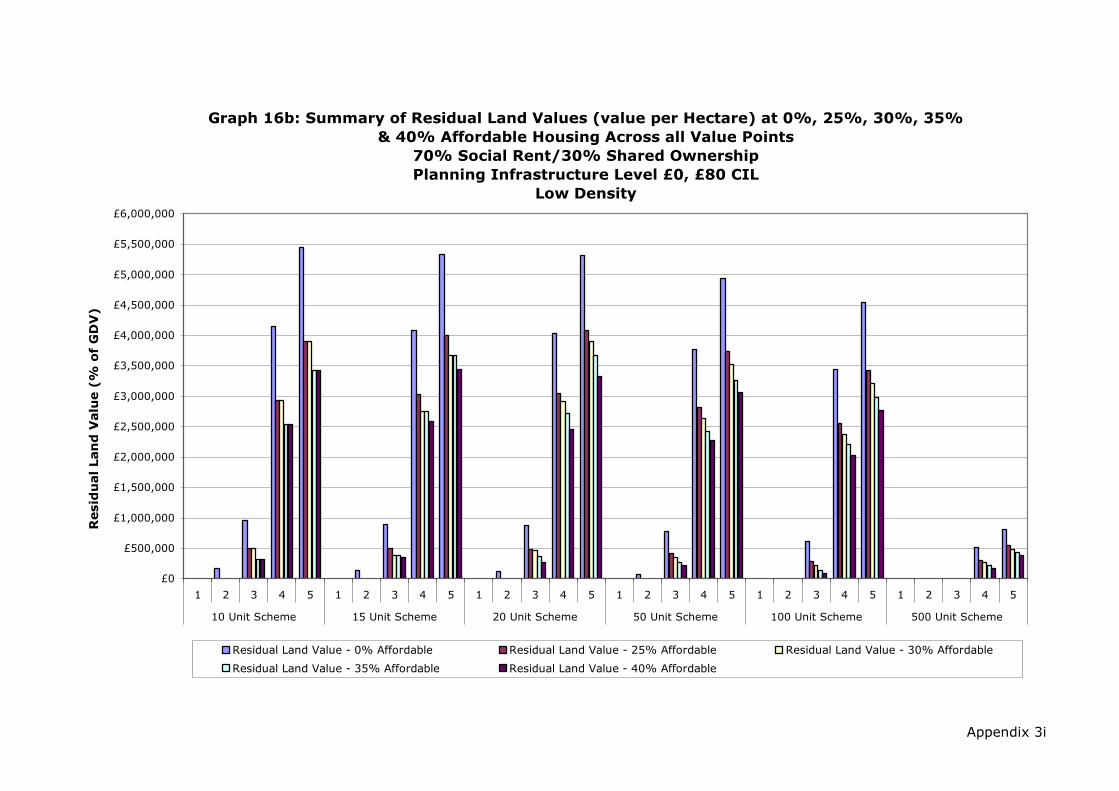
Appendix 3i
Graph 16b: Summary of Residual Land Values (value per Hectare) at 0%, 25%, 30%, 35%
& 40% Affordable Housing Across all Value Points
70% Social Rent/30% Shared Ownership
Planning Infrastructure Level £0, £80 CIL
Low Density
£0
£500,000
£1,000,000
£1,500,000
£2,000,000
£2,500,000
£3,000,000
£3,500,000
£4,000,000
£4,500,000
£5,000,000
£5,500,000
£6,000,000
1 2 3 4 5 1 2 3 4 5 1 2 3 4 5 1 2 3 4 5 1 2 3 4 5 1 2 3 4 5
10 Unit Scheme 15 Unit Scheme 20 Unit Scheme 50 Unit Scheme 100 Unit Scheme 500 Unit Scheme
Resid
ual Lan
d V
alu
e (%
o
f G
DV
)
Residual Land Value - 0% Affordable Residual Land Value - 25% Affordable Residual Land Value - 30% Affordable
Residual Land Value - 35% Affordable Residual Land Value - 40% Affordable
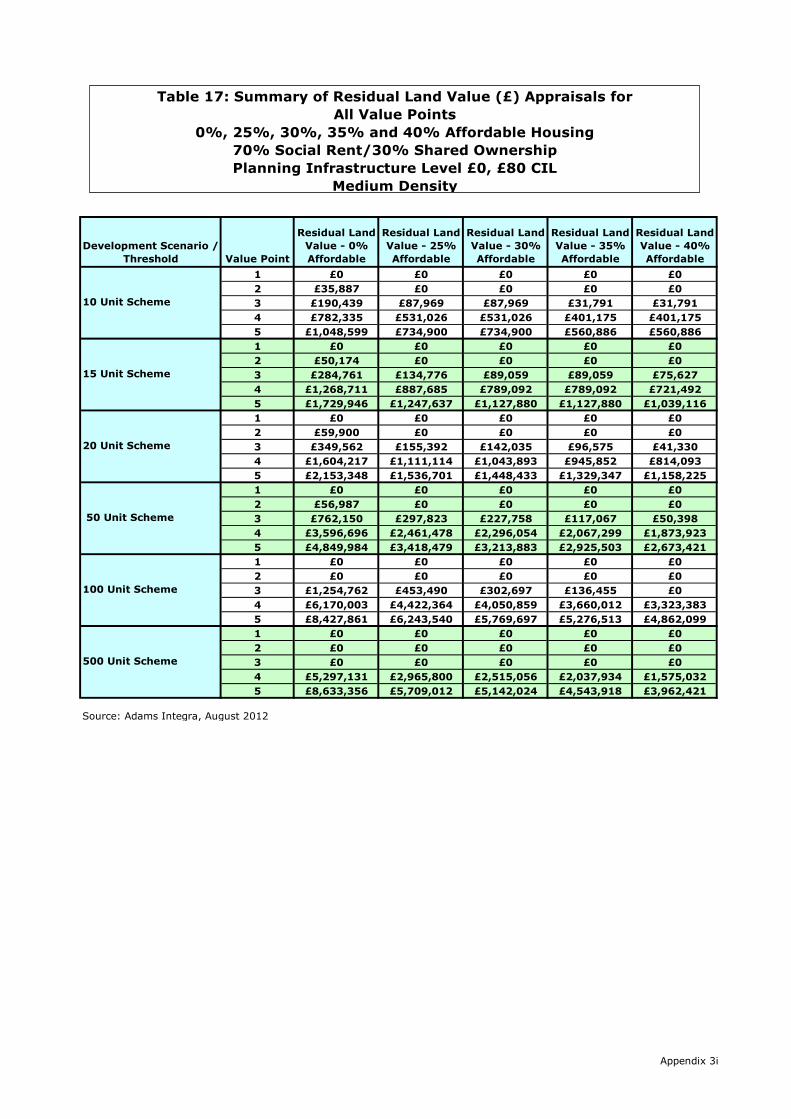
Development Scenario /
Threshold Value Point
Residual Land
Value - 0%
Affordable
Residual Land
Value - 25%
Affordable
Residual Land
Value - 30%
Affordable
Residual Land
Value - 35%
Affordable
Residual Land
Value - 40%
Affordable
1 £0 £0 £0 £0 £0
2 £35,887 £0 £0 £0 £0
3 £190,439 £87,969 £87,969 £31,791 £31,791
4 £782,335 £531,026 £531,026 £401,175 £401,175
5 £1,048,599 £734,900 £734,900 £560,886 £560,886
1 £0 £0 £0 £0 £0
2 £50,174 £0 £0 £0 £0
3 £284,761 £134,776 £89,059 £89,059 £75,627
4 £1,268,711 £887,685 £789,092 £789,092 £721,492
5 £1,729,946 £1,247,637 £1,127,880 £1,127,880 £1,039,116
1 £0 £0 £0 £0 £0
2 £59,900 £0 £0 £0 £0
3 £349,562 £155,392 £142,035 £96,575 £41,330
4 £1,604,217 £1,111,114 £1,043,893 £945,852 £814,093
5 £2,153,348 £1,536,701 £1,448,433 £1,329,347 £1,158,225
1 £0 £0 £0 £0 £0
2 £56,987 £0 £0 £0 £0
3 £762,150 £297,823 £227,758 £117,067 £50,398
4 £3,596,696 £2,461,478 £2,296,054 £2,067,299 £1,873,923
5 £4,849,984 £3,418,479 £3,213,883 £2,925,503 £2,673,421
1 £0 £0 £0 £0 £0
2 £0 £0 £0 £0 £0
3 £1,254,762 £453,490 £302,697 £136,455 £0
4 £6,170,003 £4,422,364 £4,050,859 £3,660,012 £3,323,383
5 £8,427,861 £6,243,540 £5,769,697 £5,276,513 £4,862,099
1 £0 £0 £0 £0 £0
2 £0 £0 £0 £0 £0
3 £0 £0 £0 £0 £0
4 £5,297,131 £2,965,800 £2,515,056 £2,037,934 £1,575,032
5 £8,633,356 £5,709,012 £5,142,024 £4,543,918 £3,962,421
Source: Adams Integra, August 2012
100 Unit Scheme
500 Unit Scheme
10 Unit Scheme
15 Unit Scheme
20 Unit Scheme
50 Unit Scheme
Table 17: Summary of Residual Land Value (£) Appraisals for
All Value Points
0%, 25%, 30%, 35% and 40% Affordable Housing
70% Social Rent/30% Shared Ownership
Planning Infrastructure Level £0, £80 CIL
Medium Density
Appendix 3i

Appendix 3i
Graph 17: Summary of Residual Land Values at 0%, 25%, 30%, 35% & 40%
Affordable Housing Across All Value Points
70% Social Rent/30% Shared Ownership
Planning Infrastructure Level £0, £80 CIL
Medium Density
£0
£1,000,000
£2,000,000
£3,000,000
£4,000,000
£5,000,000
£6,000,000
£7,000,000
£8,000,000
£9,000,000
£10,000,000
1 2 3 4 5 1 2 3 4 5 1 2 3 4 5 1 2 3 4 5 1 2 3 4 5 1 2 3 4 5
10 Unit Scheme 15 Unit Scheme 20 Unit Scheme 50 Unit Scheme 100 Unit Scheme 500 Unit Scheme
Resid
ual Lan
d V
alu
e (£
)
Residual Land Value - 0% Affordable Residual Land Value - 25% Affordable Residual Land Value - 30% Affordable
Residual Land Value - 35% Affordable Residual Land Value - 40% Affordable
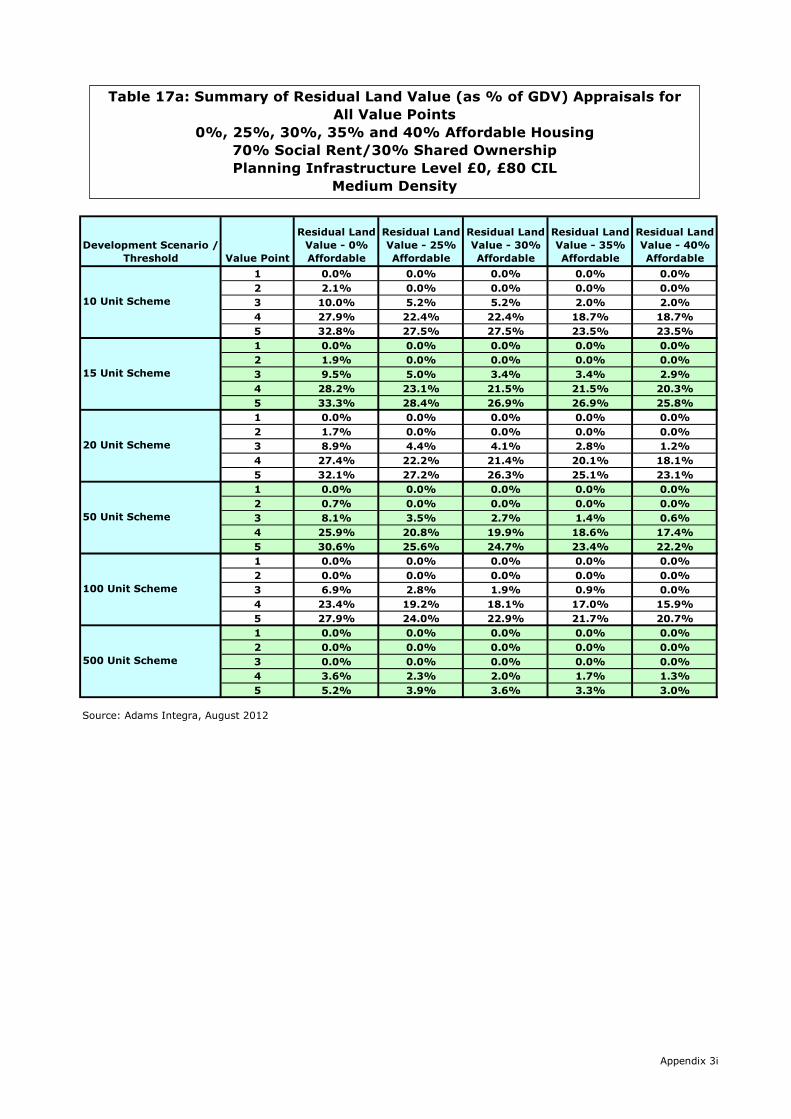
Development Scenario /
Threshold Value Point
Residual Land
Value - 0%
Affordable
Residual Land
Value - 25%
Affordable
Residual Land
Value - 30%
Affordable
Residual Land
Value - 35%
Affordable
Residual Land
Value - 40%
Affordable
1 0.0% 0.0% 0.0% 0.0% 0.0%
2 2.1% 0.0% 0.0% 0.0% 0.0%
3 10.0% 5.2% 5.2% 2.0% 2.0%
4 27.9% 22.4% 22.4% 18.7% 18.7%
5 32.8% 27.5% 27.5% 23.5% 23.5%
1 0.0% 0.0% 0.0% 0.0% 0.0%
2 1.9% 0.0% 0.0% 0.0% 0.0%
3 9.5% 5.0% 3.4% 3.4% 2.9%
4 28.2% 23.1% 21.5% 21.5% 20.3%
5 33.3% 28.4% 26.9% 26.9% 25.8%
1 0.0% 0.0% 0.0% 0.0% 0.0%
2 1.7% 0.0% 0.0% 0.0% 0.0%
3 8.9% 4.4% 4.1% 2.8% 1.2%
4 27.4% 22.2% 21.4% 20.1% 18.1%
5 32.1% 27.2% 26.3% 25.1% 23.1%
1 0.0% 0.0% 0.0% 0.0% 0.0%
2 0.7% 0.0% 0.0% 0.0% 0.0%
3 8.1% 3.5% 2.7% 1.4% 0.6%
4 25.9% 20.8% 19.9% 18.6% 17.4%
5 30.6% 25.6% 24.7% 23.4% 22.2%
1 0.0% 0.0% 0.0% 0.0% 0.0%
2 0.0% 0.0% 0.0% 0.0% 0.0%
3 6.9% 2.8% 1.9% 0.9% 0.0%
4 23.4% 19.2% 18.1% 17.0% 15.9%
5 27.9% 24.0% 22.9% 21.7% 20.7%
1 0.0% 0.0% 0.0% 0.0% 0.0%
2 0.0% 0.0% 0.0% 0.0% 0.0%
3 0.0% 0.0% 0.0% 0.0% 0.0%
4 3.6% 2.3% 2.0% 1.7% 1.3%
5 5.2% 3.9% 3.6% 3.3% 3.0%
Source: Adams Integra, August 2012
100 Unit Scheme
500 Unit Scheme
10 Unit Scheme
15 Unit Scheme
20 Unit Scheme
50 Unit Scheme
Table 17a: Summary of Residual Land Value (as % of GDV) Appraisals for
All Value Points
0%, 25%, 30%, 35% and 40% Affordable Housing
70% Social Rent/30% Shared Ownership
Planning Infrastructure Level £0, £80 CIL
Medium Density
Appendix 3i
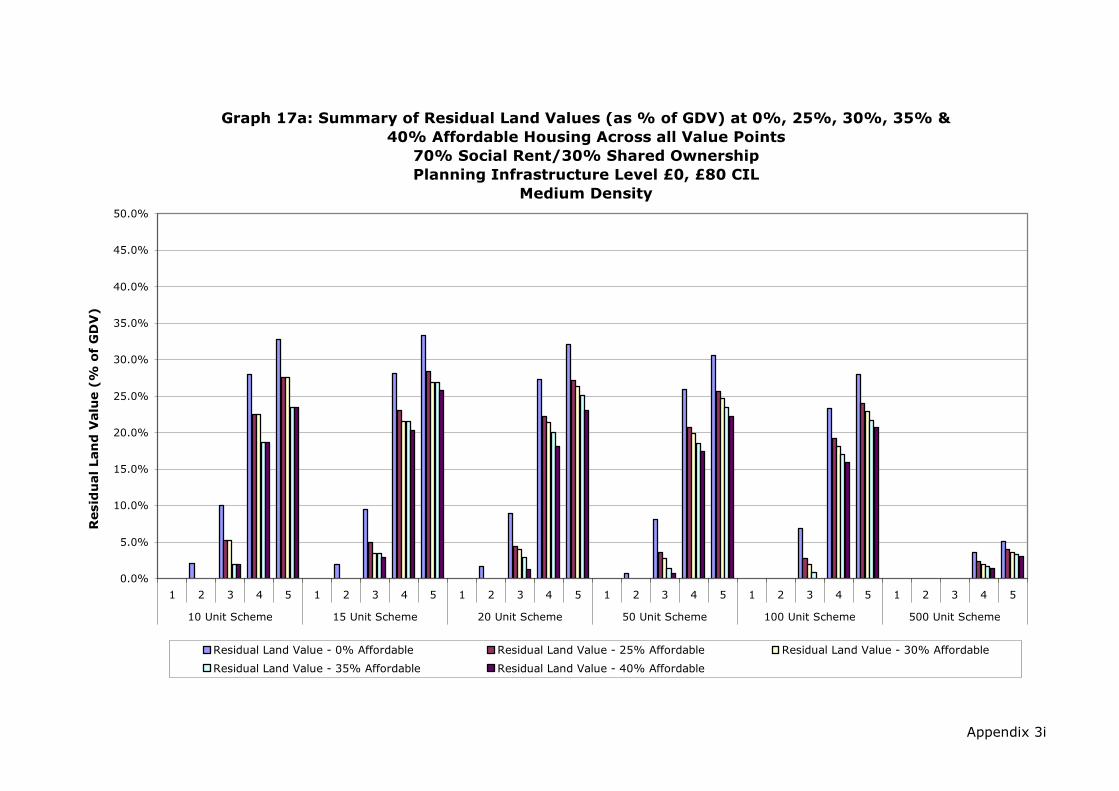
Appendix 3i
Graph 17a: Summary of Residual Land Values (as % of GDV) at 0%, 25%, 30%, 35% &
40% Affordable Housing Across all Value Points
70% Social Rent/30% Shared Ownership
Planning Infrastructure Level £0, £80 CIL
Medium Density
0.0%
5.0%
10.0%
15.0%
20.0%
25.0%
30.0%
35.0%
40.0%
45.0%
50.0%
1 2 3 4 5 1 2 3 4 5 1 2 3 4 5 1 2 3 4 5 1 2 3 4 5 1 2 3 4 5
10 Unit Scheme 15 Unit Scheme 20 Unit Scheme 50 Unit Scheme 100 Unit Scheme 500 Unit Scheme
Resid
ual Lan
d V
alu
e (%
o
f G
DV
)
Residual Land Value - 0% Affordable Residual Land Value - 25% Affordable Residual Land Value - 30% Affordable
Residual Land Value - 35% Affordable Residual Land Value - 40% Affordable

Development Scenario /
Threshold Value Point
Residual Land
Value - 0%
Affordable
Residual Land
Value - 25%
Affordable
Residual Land
Value - 30%
Affordable
Residual Land
Value - 35%
Affordable
Residual Land
Value - 40%
Affordable
1 £0 £0 £0 £0 £0
2 £161,490 £0 £0 £0 £0
3 £856,977 £395,862 £395,862 £143,060 £143,060
4 £3,520,508 £2,389,617 £2,389,617 £1,805,289 £1,805,289
5 £4,718,696 £3,307,052 £3,307,052 £2,523,988 £2,523,988
1 £0 £0 £0 £0 £0
2 £150,521 £0 £0 £0 £0
3 £854,284 £404,327 £267,178 £267,178 £226,882
4 £3,806,134 £2,663,055 £2,367,277 £2,367,277 £2,164,477
5 £5,189,838 £3,742,911 £3,383,640 £3,383,640 £3,117,347
1 £0 £0 £0 £0 £0
2 £134,775 £0 £0 £0 £0
3 £786,514 £349,631 £319,578 £217,293 £92,993
4 £3,609,487 £2,500,007 £2,348,759 £2,128,168 £1,831,709
5 £4,845,034 £3,457,576 £3,258,975 £2,991,031 £2,606,007
1 £0 £0 £0 £0 £0
2 £51,288 £0 £0 £0 £0
3 £685,935 £268,040 £204,982 £105,360 £45,358
4 £3,237,027 £2,215,331 £2,066,449 £1,860,569 £1,686,531
5 £4,364,985 £3,076,631 £2,892,495 £2,632,953 £2,406,079
1 £0 £0 £0 £0 £0
2 £0 £0 £0 £0 £0
3 £564,643 £204,071 £136,214 £61,405 £0
4 £2,776,501 £1,990,064 £1,822,887 £1,647,005 £1,495,523
5 £3,792,538 £2,809,593 £2,596,364 £2,374,431 £2,187,945
1 £0 £0 £0 £0 £0
2 £0 £0 £0 £0 £0
3 £0 £0 £0 £0 £0
4 £476,742 £266,922 £226,355 £183,414 £141,753
5 £777,002 £513,811 £462,782 £408,953 £356,618
Source: Adams Integra, August 2012
100 Unit Scheme
500 Unit Scheme
10 Unit Scheme
15 Unit Scheme
20 Unit Scheme
50 Unit Scheme
Table 17b: Summary of Residual Land Value (value per Hectare) Appraisals
for All Value Points
0%, 25%, 30%, 35% and 40% Affordable Housing
70% Social Rent/30% Shared Ownership
Planning Infrastructure Level £0, £80 CIL
Medium Density
Appendix 3i

Appendix 3i
Graph 17b: Summary of Residual Land Values (value per Hectare) at 0%, 25%, 30%, 35%
& 40% Affordable Housing Across all Value Points
70% Social Rent/30% Shared Ownership
Planning Infrastructure Level £0, £80 CIL
Medium Density
£0
£500,000
£1,000,000
£1,500,000
£2,000,000
£2,500,000
£3,000,000
£3,500,000
£4,000,000
£4,500,000
£5,000,000
£5,500,000
£6,000,000
1 2 3 4 5 1 2 3 4 5 1 2 3 4 5 1 2 3 4 5 1 2 3 4 5 1 2 3 4 5
10 Unit Scheme 15 Unit Scheme 20 Unit Scheme 50 Unit Scheme 100 Unit Scheme 500 Unit Scheme
Resid
ual Lan
d V
alu
e (%
o
f G
DV
)
Residual Land Value - 0% Affordable Residual Land Value - 25% Affordable Residual Land Value - 30% Affordable
Residual Land Value - 35% Affordable Residual Land Value - 40% Affordable

Development Scenario /
Threshold Value Point
Residual Land
Value - 0%
Affordable
Residual Land
Value - 25%
Affordable
Residual Land
Value - 30%
Affordable
Residual Land
Value - 35%
Affordable
Residual Land
Value - 40%
Affordable
1 £0 £0 £0 £0 £0
2 £0 £0 £0 £0 £0
3 £135,851 £31,458 £31,458 £0 £0
4 £557,224 £309,102 £309,102 £212,662 £212,662
5 £738,627 £429,355 £429,355 £306,994 £306,994
1 £0 £0 £0 £0 £0
2 £4,287 £0 £0 £0 £0
3 £213,554 £78,373 £32,657 £32,657 £12,815
4 £780,312 £483,484 £388,900 £388,900 £366,008
5 £1,040,078 £670,419 £550,662 £550,662 £525,425
1 £0 £0 £0 £0 £0
2 £9,885 £0 £0 £0 £0
3 £290,528 £117,484 £97,753 £52,293 £8,452
4 £1,071,078 £677,873 £655,343 £557,302 £480,385
5 £1,427,480 £940,806 £915,710 £796,624 £695,492
1 £0 £0 £0 £0 £0
2 £43,944 £0 £0 £0 £0
3 £717,490 £296,427 £226,175 £130,266 £79,119
4 £2,718,874 £1,799,243 £1,657,284 £1,432,829 £1,324,725
5 £3,617,234 £2,474,267 £2,301,098 £2,018,752 £1,894,231
1 £0 £0 £0 £0 £0
2 £0 £0 £0 £0 £0
3 £1,166,976 £404,508 £259,284 £85,730 £0
4 £4,937,699 £3,286,827 £2,965,818 £2,615,778 £2,294,769
5 £6,630,262 £4,585,379 £4,178,800 £3,752,609 £3,346,031
1 £0 £0 £0 £0 £0
2 £0 £0 £0 £0 £0
3 £0 £0 £0 £0 £0
4 £4,491,904 £2,160,573 £1,709,830 £1,232,708 £769,805
5 £7,507,166 £4,582,823 £4,015,834 £3,417,728 £2,836,231
Source: Adams Integra, August 2012
100 Unit Scheme
500 Unit Scheme
10 Unit Scheme
15 Unit Scheme
20 Unit Scheme
50 Unit Scheme
Table 18: Summary of Residual Land Value (£) Appraisals for
All Value Points
0%, 25%, 30%, 35% and 40% Affordable Housing
70% Social Rent/30% Shared Ownership
Planning Infrastructure Level £0, £80 CIL
High Density
Appendix 3i

Appendix 3i
Graph 18: Summary of Residual Land Values at 0%, 25%, 30%, 35% & 40%
Affordable Housing Across All Value Points
70% Social Rent/30% Shared Ownership
Planning Infrastructure Level £0, £80 CIL
High Density
£0
£500,000
£1,000,000
£1,500,000
£2,000,000
£2,500,000
£3,000,000
£3,500,000
£4,000,000
£4,500,000
£5,000,000
£5,500,000
£6,000,000
£6,500,000
£7,000,000
£7,500,000
£8,000,000
1 2 3 4 5 1 2 3 4 5 1 2 3 4 5 1 2 3 4 5 1 2 3 4 5 1 2 3 4 5
10 Unit Scheme 15 Unit Scheme 20 Unit Scheme 50 Unit Scheme 100 Unit Scheme 500 Unit Scheme
Resid
ual Lan
d V
alu
e (£
)
Residual Land Value - 0% Affordable Residual Land Value - 25% Affordable Residual Land Value - 30% Affordable
Residual Land Value - 35% Affordable Residual Land Value - 40% Affordable

Development Scenario /
Threshold Value Point
Residual Land
Value - 0%
Affordable
Residual Land
Value - 25%
Affordable
Residual Land
Value - 30%
Affordable
Residual Land
Value - 35%
Affordable
Residual Land
Value - 40%
Affordable
1 0.0% 0.0% 0.0% 0.0% 0.0%
2 0.0% 0.0% 0.0% 0.0% 0.0%
3 8.5% 2.3% 2.3% 0.0% 0.0%
4 24.9% 17.2% 17.2% 13.0% 13.0%
5 29.5% 21.7% 21.7% 17.3% 17.3%
1 0.0% 0.0% 0.0% 0.0% 0.0%
2 0.2% 0.0% 0.0% 0.0% 0.0%
3 9.2% 3.8% 1.7% 1.7% 0.7%
4 24.4% 18.1% 15.5% 15.5% 14.9%
5 29.0% 22.7% 20.0% 20.0% 19.5%
1 0.0% 0.0% 0.0% 0.0% 0.0%
2 0.4% 0.0% 0.0% 0.0% 0.0%
3 9.2% 4.2% 3.6% 2.0% 0.3%
4 24.7% 18.5% 18.2% 16.2% 14.6%
5 29.2% 23.2% 22.9% 21.0% 19.2%
1 0.0% 0.0% 0.0% 0.0% 0.0%
2 0.6% 0.0% 0.0% 0.0% 0.0%
3 8.9% 4.1% 3.2% 1.9% 1.2%
4 24.2% 18.8% 17.8% 16.1% 15.3%
5 28.6% 23.3% 22.3% 20.6% 19.8%
1 0.0% 0.0% 0.0% 0.0% 0.0%
2 0.0% 0.0% 0.0% 0.0% 0.0%
3 7.2% 2.8% 1.8% 0.6% 0.0%
4 22.0% 17.0% 15.9% 14.5% 13.2%
5 26.2% 21.4% 20.2% 18.9% 17.5%
1 0.0% 0.0% 0.0% 0.0% 0.0%
2 0.0% 0.0% 0.0% 0.0% 0.0%
3 0.0% 0.0% 0.0% 0.0% 0.0%
4 3.5% 1.9% 1.6% 1.2% 0.7%
5 5.0% 3.6% 3.2% 2.8% 2.4%
Source: Adams Integra, August 2012
100 Unit Scheme
500 Unit Scheme
10 Unit Scheme
15 Unit Scheme
20 Unit Scheme
50 Unit Scheme
Table 18a: Summary of Residual Land Value (as % of GDV) Appraisals for
All Value Points
0%, 25%, 30%, 35% and 40% Affordable Housing
70% Social Rent/30% Shared Ownership
Planning Infrastructure Level £0, £80 CIL
High Density
Appendix 3i
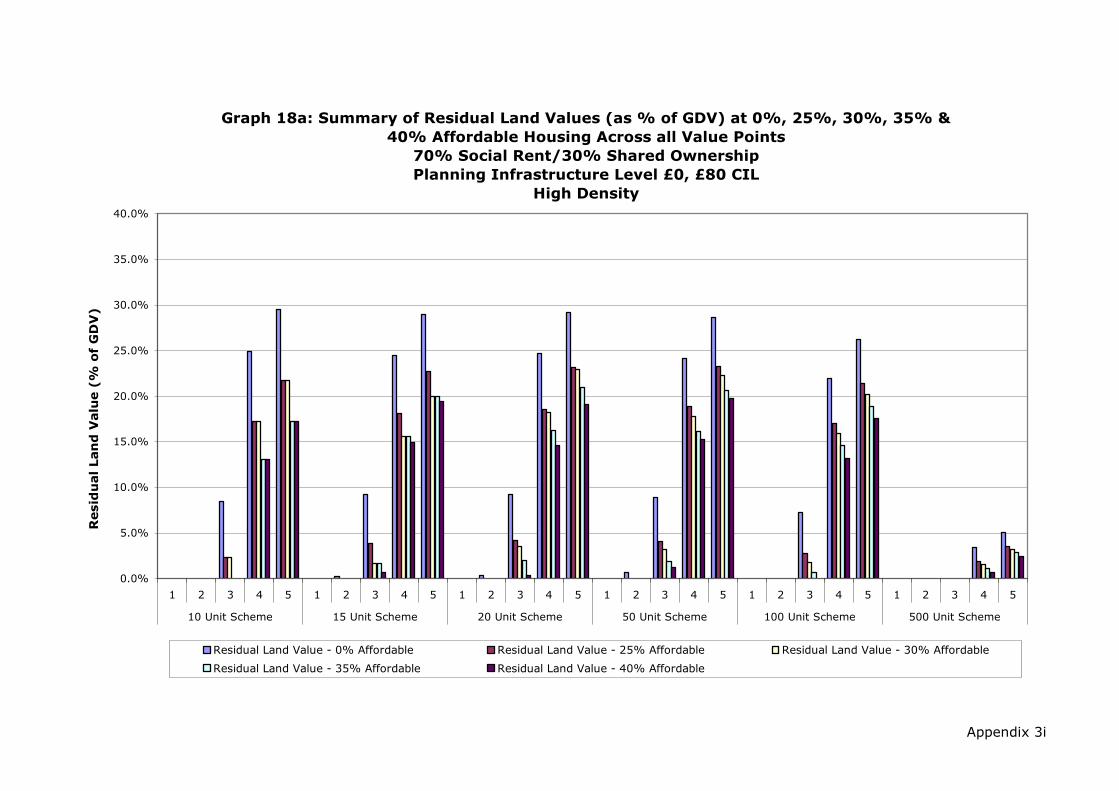
Appendix 3i
Graph 18a: Summary of Residual Land Values (as % of GDV) at 0%, 25%, 30%, 35% &
40% Affordable Housing Across all Value Points
70% Social Rent/30% Shared Ownership
Planning Infrastructure Level £0, £80 CIL
High Density
0.0%
5.0%
10.0%
15.0%
20.0%
25.0%
30.0%
35.0%
40.0%
1 2 3 4 5 1 2 3 4 5 1 2 3 4 5 1 2 3 4 5 1 2 3 4 5 1 2 3 4 5
10 Unit Scheme 15 Unit Scheme 20 Unit Scheme 50 Unit Scheme 100 Unit Scheme 500 Unit Scheme
Resid
ual Lan
d V
alu
e (%
o
f G
DV
)
Residual Land Value - 0% Affordable Residual Land Value - 25% Affordable Residual Land Value - 30% Affordable
Residual Land Value - 35% Affordable Residual Land Value - 40% Affordable

Development Scenario /
Threshold Value Point
Residual Land
Value - 0%
Affordable
Residual Land
Value - 25%
Affordable
Residual Land
Value - 30%
Affordable
Residual Land
Value - 35%
Affordable
Residual Land
Value - 40%
Affordable
1 £0 £0 £0 £0 £0
2 £0 £0 £0 £0 £0
3 £679,256 £157,288 £157,288 £0 £0
4 £2,786,121 £1,545,510 £1,545,510 £1,063,311 £1,063,311
5 £3,693,135 £2,146,773 £2,146,773 £1,534,972 £1,534,972
1 £0 £0 £0 £0 £0
2 £14,289 £0 £0 £0 £0
3 £711,848 £261,242 £108,855 £108,855 £42,716
4 £2,601,039 £1,611,612 £1,296,334 £1,296,334 £1,220,025
5 £3,466,925 £2,234,731 £1,835,541 £1,835,541 £1,751,416
1 £0 £0 £0 £0 £0
2 £24,713 £0 £0 £0 £0
3 £726,320 £293,710 £244,383 £130,734 £21,129
4 £2,677,695 £1,694,681 £1,638,357 £1,393,256 £1,200,962
5 £3,568,699 £2,352,016 £2,289,275 £1,991,560 £1,738,731
1 £0 £0 £0 £0 £0
2 £43,944 £0 £0 £0 £0
3 £717,490 £296,427 £226,175 £130,266 £79,119
4 £2,718,874 £1,799,243 £1,657,284 £1,432,829 £1,324,725
5 £3,617,234 £2,474,267 £2,301,098 £2,018,752 £1,894,231
1 £0 £0 £0 £0 £0
2 £0 £0 £0 £0 £0
3 £583,488 £202,254 £129,642 £42,865 £0
4 £2,468,849 £1,643,413 £1,482,909 £1,307,889 £1,147,385
5 £3,315,131 £2,292,689 £2,089,400 £1,876,305 £1,673,016
1 £0 £0 £0 £0 £0
2 £0 £0 £0 £0 £0
3 £0 £0 £0 £0 £0
4 £449,190 £216,057 £170,983 £123,271 £76,981
5 £750,717 £458,282 £401,583 £341,773 £283,623
Source: Adams Integra, August 2012
100 Unit Scheme
500 Unit Scheme
10 Unit Scheme
15 Unit Scheme
20 Unit Scheme
50 Unit Scheme
Table 18b: Summary of Residual Land Value (value per Hectare) Appraisals
for All Value Points
0%, 25%, 30%, 35% and 40% Affordable Housing
70% Social Rent/30% Shared Ownership
Planning Infrastructure Level £0, £80 CIL
High Density
Appendix 3i

Appendix 3i
Graph 18b: Summary of Residual Land Values (value per Hectare) at 0%, 25%, 30%, 35%
& 40% Affordable Housing Across all Value Points
70% Social Rent/30% Shared Ownership
Planning Infrastructure Level £0, £80 CIL
High Density
£0
£500,000
£1,000,000
£1,500,000
£2,000,000
£2,500,000
£3,000,000
£3,500,000
£4,000,000
£4,500,000
£5,000,000
1 2 3 4 5 1 2 3 4 5 1 2 3 4 5 1 2 3 4 5 1 2 3 4 5 1 2 3 4 5
10 Unit Scheme 15 Unit Scheme 20 Unit Scheme 50 Unit Scheme 100 Unit Scheme 500 Unit Scheme
Resid
ual Lan
d V
alu
e (%
o
f G
DV
)
Residual Land Value - 0% Affordable Residual Land Value - 25% Affordable Residual Land Value - 30% Affordable
Residual Land Value - 35% Affordable Residual Land Value - 40% Affordable

Development Scenario /
Threshold Value Point
Residual Land
Value - 0%
Affordable
Residual Land
Value - 25%
Affordable
Residual Land
Value - 30%
Affordable
Residual Land
Value - 35%
Affordable
Residual Land
Value - 40%
Affordable
1 £0 £0 £0 £0 £0
2 £22,390 £0 £0 £0 £0
3 £216,857 £103,058 £103,058 £56,830 £56,830
4 £1,016,683 £714,641 £714,641 £614,944 £614,944
5 £1,341,067 £956,195 £956,195 £835,096 £835,096
1 £0 £0 £0 £0 £0
2 £21,768 £0 £0 £0 £0
3 £306,856 £155,926 £110,210 £110,210 £96,778
4 £1,500,850 £1,103,562 £1,004,969 £1,004,969 £937,369
5 £1,969,526 £1,469,161 £1,349,404 £1,349,404 £1,260,640
1 £0 £0 £0 £0 £0
2 £23,568 £0 £0 £0 £0
3 £398,034 £203,310 £190,086 £146,546 £91,302
4 £1,979,921 £1,486,818 £1,419,597 £1,321,557 £1,189,797
5 £2,617,907 £2,001,259 £1,912,992 £1,793,905 £1,622,783
1 £0 £0 £0 £0 £0
2 £0 £0 £0 £0 £0
3 £879,925 £425,076 £339,661 £236,625 £172,346
4 £4,615,007 £3,421,230 £3,207,321 £2,942,017 £2,748,641
5 £6,076,039 £4,580,773 £4,308,158 £3,981,495 £3,729,413
1 £0 £0 £0 £0 £0
2 £0 £0 £0 £0 £0
3 £1,375,931 £522,724 £365,684 £187,441 £31,066
4 £8,413,041 £6,203,439 £5,771,350 £5,319,918 £4,896,701
5 £11,165,711 £8,390,584 £7,845,390 £7,280,853 £6,744,531
1 £0 £0 £0 £0 £0
2 £0 £0 £0 £0 £0
3 £0 £0 £0 £0 £0
4 £6,229,530 £3,575,290 £3,041,702 £2,512,680 £1,979,093
5 £9,910,229 £6,565,641 £5,891,096 £5,225,930 £4,551,385
Source: Adams Integra, August 2012
100 Unit Scheme
500 Unit Scheme
10 Unit Scheme
15 Unit Scheme
20 Unit Scheme
50 Unit Scheme
Table 19: Summary of Residual Land Value (£) Appraisals for
All Value Points
0%, 25%, 30%, 35% and 40% Affordable Housing
70% Social Rent/30% Shared Ownership
Planning Infrastructure Level £0, £100 CIL
Low Density
Appendix 3i
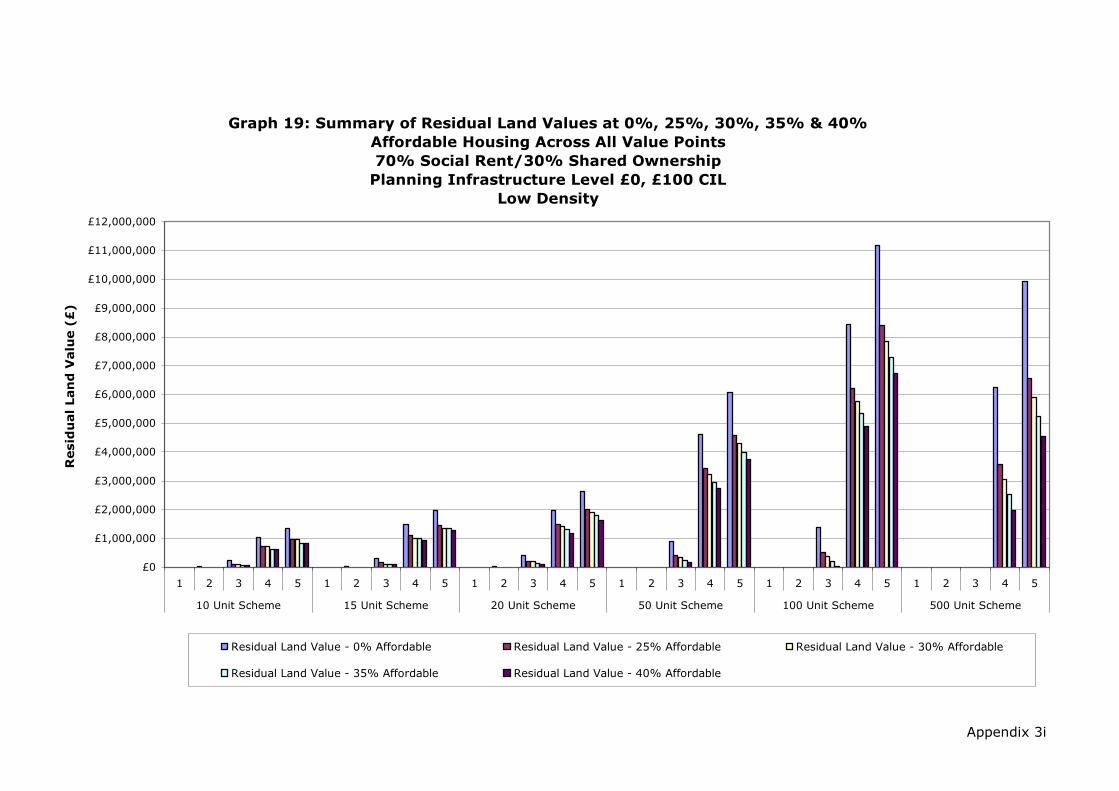
Appendix 3i
Graph 19: Summary of Residual Land Values at 0%, 25%, 30%, 35% & 40%
Affordable Housing Across All Value Points
70% Social Rent/30% Shared Ownership
Planning Infrastructure Level £0, £100 CIL
Low Density
£0
£1,000,000
£2,000,000
£3,000,000
£4,000,000
£5,000,000
£6,000,000
£7,000,000
£8,000,000
£9,000,000
£10,000,000
£11,000,000
£12,000,000
1 2 3 4 5 1 2 3 4 5 1 2 3 4 5 1 2 3 4 5 1 2 3 4 5 1 2 3 4 5
10 Unit Scheme 15 Unit Scheme 20 Unit Scheme 50 Unit Scheme 100 Unit Scheme 500 Unit Scheme
Resid
ual Lan
d V
alu
e (£
)
Residual Land Value - 0% Affordable Residual Land Value - 25% Affordable Residual Land Value - 30% Affordable
Residual Land Value - 35% Affordable Residual Land Value - 40% Affordable

Development Scenario /
Threshold Value Point
Residual Land
Value - 0%
Affordable
Residual Land
Value - 25%
Affordable
Residual Land
Value - 30%
Affordable
Residual Land
Value - 35%
Affordable
Residual Land
Value - 40%
Affordable
1 0.0% 0.0% 0.0% 0.0% 0.0%
2 1.0% 0.0% 0.0% 0.0% 0.0%
3 8.8% 4.6% 4.6% 2.7% 2.7%
4 27.7% 22.7% 22.7% 20.6% 20.6%
5 32.3% 27.3% 27.3% 25.2% 25.2%
1 0.0% 0.0% 0.0% 0.0% 0.0%
2 0.7% 0.0% 0.0% 0.0% 0.0%
3 8.2% 4.6% 3.3% 3.3% 3.0%
4 27.1% 22.7% 21.4% 21.4% 20.6%
5 31.5% 27.2% 25.9% 25.9% 25.0%
1 0.0% 0.0% 0.0% 0.0% 0.0%
2 0.5% 0.0% 0.0% 0.0% 0.0%
3 8.1% 4.5% 4.3% 3.3% 2.1%
4 27.0% 23.0% 22.4% 21.4% 20.0%
5 31.5% 27.6% 26.9% 26.0% 24.5%
1 0.0% 0.0% 0.0% 0.0% 0.0%
2 0.0% 0.0% 0.0% 0.0% 0.0%
3 7.3% 3.8% 3.1% 2.2% 1.6%
4 25.7% 21.6% 20.8% 19.7% 18.8%
5 30.0% 26.0% 25.1% 24.0% 23.1%
1 0.0% 0.0% 0.0% 0.0% 0.0%
2 0.0% 0.0% 0.0% 0.0% 0.0%
3 5.7% 2.3% 1.7% 0.9% 0.1%
4 23.4% 19.6% 18.7% 17.7% 16.8%
5 27.6% 23.7% 22.8% 21.9% 20.9%
1 0.0% 0.0% 0.0% 0.0% 0.0%
2 0.0% 0.0% 0.0% 0.0% 0.0%
3 0.0% 0.0% 0.0% 0.0% 0.0%
4 3.6% 2.4% 2.1% 1.7% 1.4%
5 5.1% 3.8% 3.6% 3.2% 2.9%
Source: Adams Integra, August 2012
100 Unit Scheme
500 Unit Scheme
10 Unit Scheme
15 Unit Scheme
20 Unit Scheme
50 Unit Scheme
Table 19a: Summary of Residual Land Value (as % of GDV) Appraisals for
All Value Points
0%, 25%, 30%, 35% and 40% Affordable Housing
70% Social Rent/30% Shared Ownership
Planning Infrastructure Level £0, £100 CIL
Low Density
Appendix 3i

Appendix 3i
Graph 19a: Summary of Residual Land Values (as % of GDV) at 0%, 25%, 30%, 35% &
40% Affordable Housing Across all Value Points
70% Social Rent/30% Shared Ownership
Planning Infrastructure Level £0, £100 CIL
Low Density
0.0%
5.0%
10.0%
15.0%
20.0%
25.0%
30.0%
35.0%
40.0%
1 2 3 4 5 1 2 3 4 5 1 2 3 4 5 1 2 3 4 5 1 2 3 4 5 1 2 3 4 5
10 Unit Scheme 15 Unit Scheme 20 Unit Scheme 50 Unit Scheme 100 Unit Scheme 500 Unit Scheme
Resid
ual Lan
d V
alu
e (%
o
f G
DV
)
Residual Land Value - 0% Affordable Residual Land Value - 25% Affordable Residual Land Value - 30% Affordable
Residual Land Value - 35% Affordable Residual Land Value - 40% Affordable
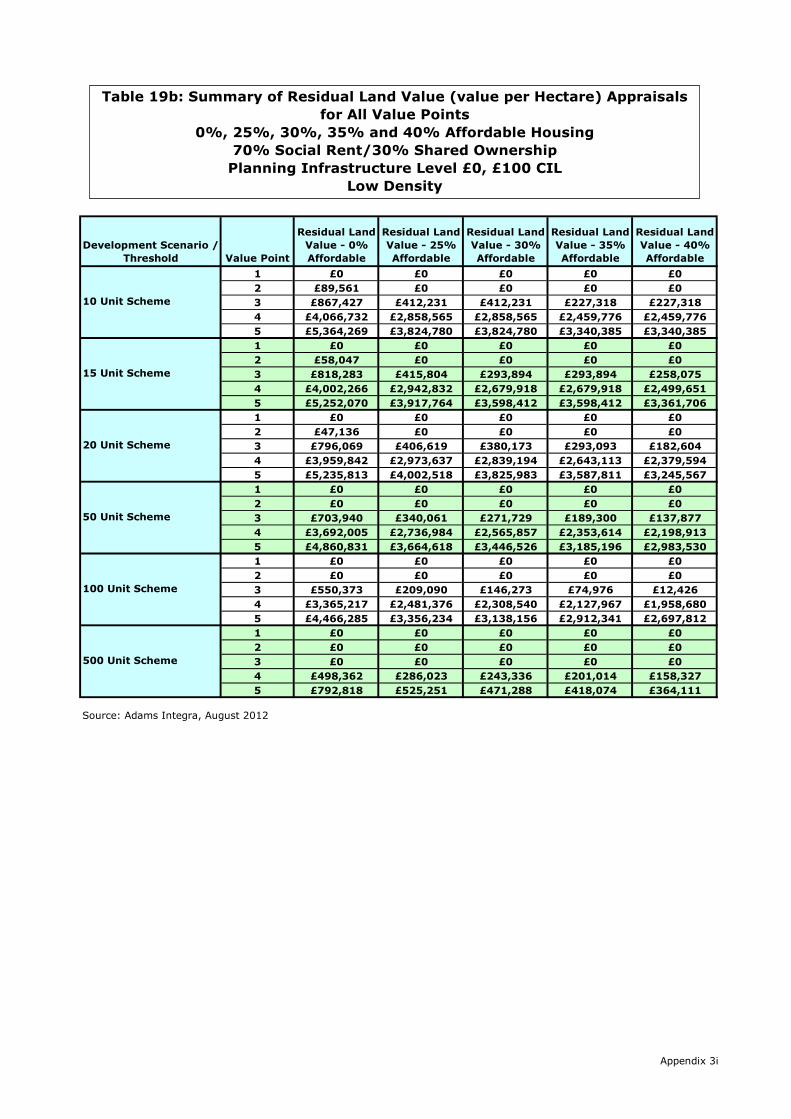
Development Scenario /
Threshold Value Point
Residual Land
Value - 0%
Affordable
Residual Land
Value - 25%
Affordable
Residual Land
Value - 30%
Affordable
Residual Land
Value - 35%
Affordable
Residual Land
Value - 40%
Affordable
1 £0 £0 £0 £0 £0
2 £89,561 £0 £0 £0 £0
3 £867,427 £412,231 £412,231 £227,318 £227,318
4 £4,066,732 £2,858,565 £2,858,565 £2,459,776 £2,459,776
5 £5,364,269 £3,824,780 £3,824,780 £3,340,385 £3,340,385
1 £0 £0 £0 £0 £0
2 £58,047 £0 £0 £0 £0
3 £818,283 £415,804 £293,894 £293,894 £258,075
4 £4,002,266 £2,942,832 £2,679,918 £2,679,918 £2,499,651
5 £5,252,070 £3,917,764 £3,598,412 £3,598,412 £3,361,706
1 £0 £0 £0 £0 £0
2 £47,136 £0 £0 £0 £0
3 £796,069 £406,619 £380,173 £293,093 £182,604
4 £3,959,842 £2,973,637 £2,839,194 £2,643,113 £2,379,594
5 £5,235,813 £4,002,518 £3,825,983 £3,587,811 £3,245,567
1 £0 £0 £0 £0 £0
2 £0 £0 £0 £0 £0
3 £703,940 £340,061 £271,729 £189,300 £137,877
4 £3,692,005 £2,736,984 £2,565,857 £2,353,614 £2,198,913
5 £4,860,831 £3,664,618 £3,446,526 £3,185,196 £2,983,530
1 £0 £0 £0 £0 £0
2 £0 £0 £0 £0 £0
3 £550,373 £209,090 £146,273 £74,976 £12,426
4 £3,365,217 £2,481,376 £2,308,540 £2,127,967 £1,958,680
5 £4,466,285 £3,356,234 £3,138,156 £2,912,341 £2,697,812
1 £0 £0 £0 £0 £0
2 £0 £0 £0 £0 £0
3 £0 £0 £0 £0 £0
4 £498,362 £286,023 £243,336 £201,014 £158,327
5 £792,818 £525,251 £471,288 £418,074 £364,111
Source: Adams Integra, August 2012
100 Unit Scheme
500 Unit Scheme
10 Unit Scheme
15 Unit Scheme
20 Unit Scheme
50 Unit Scheme
Table 19b: Summary of Residual Land Value (value per Hectare) Appraisals
for All Value Points
0%, 25%, 30%, 35% and 40% Affordable Housing
70% Social Rent/30% Shared Ownership
Planning Infrastructure Level £0, £100 CIL
Low Density
Appendix 3i
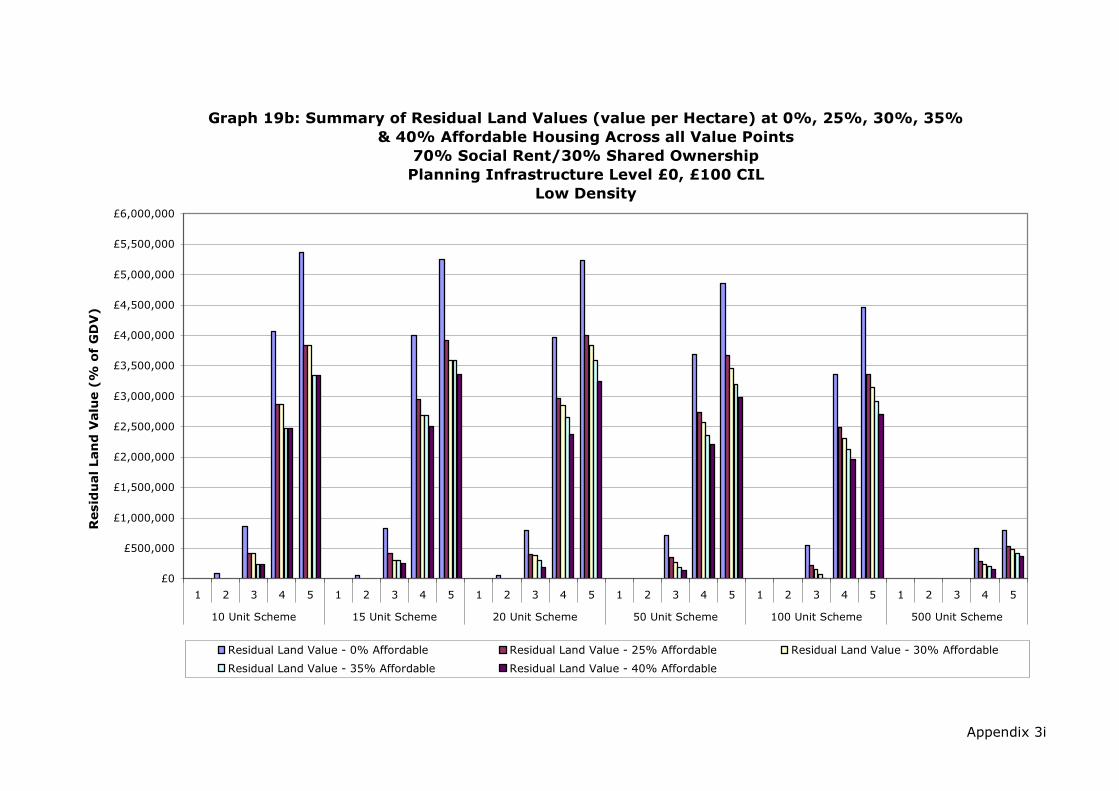
Appendix 3i
Graph 19b: Summary of Residual Land Values (value per Hectare) at 0%, 25%, 30%, 35%
& 40% Affordable Housing Across all Value Points
70% Social Rent/30% Shared Ownership
Planning Infrastructure Level £0, £100 CIL
Low Density
£0
£500,000
£1,000,000
£1,500,000
£2,000,000
£2,500,000
£3,000,000
£3,500,000
£4,000,000
£4,500,000
£5,000,000
£5,500,000
£6,000,000
1 2 3 4 5 1 2 3 4 5 1 2 3 4 5 1 2 3 4 5 1 2 3 4 5 1 2 3 4 5
10 Unit Scheme 15 Unit Scheme 20 Unit Scheme 50 Unit Scheme 100 Unit Scheme 500 Unit Scheme
Resid
ual Lan
d V
alu
e (%
o
f G
DV
)
Residual Land Value - 0% Affordable Residual Land Value - 25% Affordable Residual Land Value - 30% Affordable
Residual Land Value - 35% Affordable Residual Land Value - 40% Affordable

Development Scenario /
Threshold Value Point
Residual Land
Value - 0%
Affordable
Residual Land
Value - 25%
Affordable
Residual Land
Value - 30%
Affordable
Residual Land
Value - 35%
Affordable
Residual Land
Value - 40%
Affordable
1 £0 £0 £0 £0 £0
2 £20,273 £0 £0 £0 £0
3 £174,982 £72,356 £72,356 £16,178 £16,178
4 £767,346 £516,037 £516,037 £386,030 £386,030
5 £1,033,610 £719,912 £719,912 £545,897 £545,897
1 £0 £0 £0 £0 £0
2 £25,809 £0 £0 £0 £0
3 £261,127 £110,410 £64,694 £64,694 £51,262
4 £1,245,321 £864,294 £765,702 £765,702 £698,102
5 £1,706,555 £1,224,246 £1,104,489 £1,104,489 £1,015,725
1 £0 £0 £0 £0 £0
2 £27,861 £0 £0 £0 £0
3 £318,484 £123,353 £109,996 £64,536 £9,291
4 £1,573,459 £1,080,357 £1,013,136 £915,095 £783,336
5 £2,122,591 £1,505,943 £1,417,676 £1,298,590 £1,127,468
1 £0 £0 £0 £0 £0
2 £0 £0 £0 £0 £0
3 £691,125 £230,718 £156,073 £43,082 £0
4 £3,525,671 £2,390,453 £2,225,028 £1,996,273 £1,802,897
5 £4,778,958 £3,347,453 £3,142,857 £2,854,477 £2,602,395
1 £0 £0 £0 £0 £0
2 £0 £0 £0 £0 £0
3 £1,127,747 £325,152 £177,954 £4,147 £0
4 £6,042,988 £4,295,348 £3,923,844 £3,532,997 £3,196,368
5 £8,300,846 £6,116,525 £5,642,682 £5,149,498 £4,735,084
1 £0 £0 £0 £0 £0
2 £0 £0 £0 £0 £0
3 £0 £0 £0 £0 £0
4 £5,115,693 £2,784,362 £2,333,619 £1,856,497 £1,393,594
5 £8,451,919 £5,527,575 £4,960,586 £4,362,480 £3,780,983
Source: Adams Integra, August 2012
100 Unit Scheme
500 Unit Scheme
10 Unit Scheme
15 Unit Scheme
20 Unit Scheme
50 Unit Scheme
Table 20: Summary of Residual Land Value (£) Appraisals for
All Value Points
0%, 25%, 30%, 35% and 40% Affordable Housing
70% Social Rent/30% Shared Ownership
Planning Infrastructure Level £0, £100 CIL
Medium Density
Appendix 3i
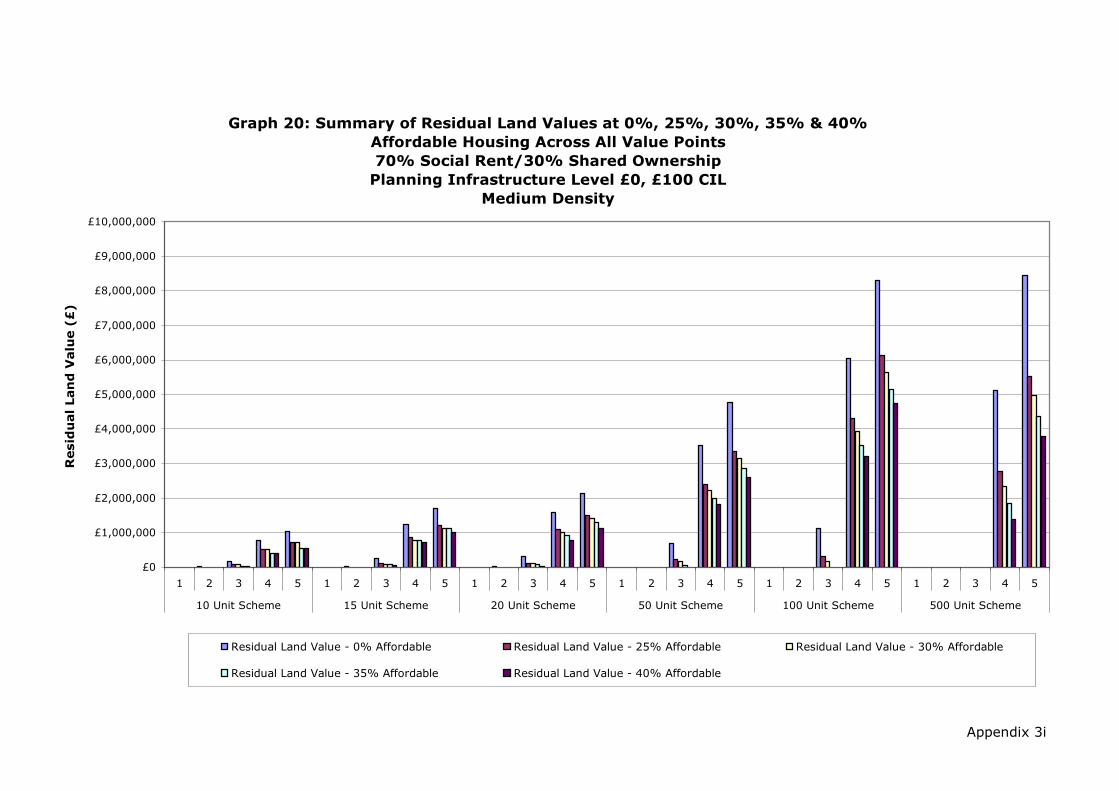
Appendix 3i
Graph 20: Summary of Residual Land Values at 0%, 25%, 30%, 35% & 40%
Affordable Housing Across All Value Points
70% Social Rent/30% Shared Ownership
Planning Infrastructure Level £0, £100 CIL
Medium Density
£0
£1,000,000
£2,000,000
£3,000,000
£4,000,000
£5,000,000
£6,000,000
£7,000,000
£8,000,000
£9,000,000
£10,000,000
1 2 3 4 5 1 2 3 4 5 1 2 3 4 5 1 2 3 4 5 1 2 3 4 5 1 2 3 4 5
10 Unit Scheme 15 Unit Scheme 20 Unit Scheme 50 Unit Scheme 100 Unit Scheme 500 Unit Scheme
Resid
ual Lan
d V
alu
e (£
)
Residual Land Value - 0% Affordable Residual Land Value - 25% Affordable Residual Land Value - 30% Affordable
Residual Land Value - 35% Affordable Residual Land Value - 40% Affordable

Development Scenario /
Threshold Value Point
Residual Land
Value - 0%
Affordable
Residual Land
Value - 25%
Affordable
Residual Land
Value - 30%
Affordable
Residual Land
Value - 35%
Affordable
Residual Land
Value - 40%
Affordable
1 0.0% 0.0% 0.0% 0.0% 0.0%
2 1.2% 0.0% 0.0% 0.0% 0.0%
3 9.2% 4.3% 4.3% 1.0% 1.0%
4 27.4% 21.8% 21.8% 18.0% 18.0%
5 32.3% 26.9% 26.9% 22.8% 22.8%
1 0.0% 0.0% 0.0% 0.0% 0.0%
2 1.0% 0.0% 0.0% 0.0% 0.0%
3 8.7% 4.1% 2.5% 2.5% 2.0%
4 27.7% 22.5% 20.8% 20.8% 19.7%
5 32.8% 27.9% 26.4% 26.4% 25.2%
1 0.0% 0.0% 0.0% 0.0% 0.0%
2 0.8% 0.0% 0.0% 0.0% 0.0%
3 8.1% 3.5% 3.1% 1.9% 0.3%
4 26.8% 21.6% 20.8% 19.4% 17.4%
5 31.7% 26.6% 25.8% 24.5% 22.5%
1 0.0% 0.0% 0.0% 0.0% 0.0%
2 0.0% 0.0% 0.0% 0.0% 0.0%
3 7.3% 2.7% 1.9% 0.5% 0.0%
4 25.4% 20.2% 19.3% 17.9% 16.7%
5 30.1% 25.1% 24.2% 22.9% 21.6%
1 0.0% 0.0% 0.0% 0.0% 0.0%
2 0.0% 0.0% 0.0% 0.0% 0.0%
3 6.2% 2.0% 1.1% 0.0% 0.0%
4 22.9% 18.6% 17.6% 16.4% 15.3%
5 27.5% 23.5% 22.4% 21.2% 20.2%
1 0.0% 0.0% 0.0% 0.0% 0.0%
2 0.0% 0.0% 0.0% 0.0% 0.0%
3 0.0% 0.0% 0.0% 0.0% 0.0%
4 3.5% 2.2% 1.9% 1.5% 1.2%
5 5.1% 3.8% 3.5% 3.2% 2.8%
Source: Adams Integra, August 2012
100 Unit Scheme
500 Unit Scheme
10 Unit Scheme
15 Unit Scheme
20 Unit Scheme
50 Unit Scheme
Table 20a: Summary of Residual Land Value (as % of GDV) Appraisals for
All Value Points
0%, 25%, 30%, 35% and 40% Affordable Housing
70% Social Rent/30% Shared Ownership
Planning Infrastructure Level £0, £100 CIL
Medium Density
Appendix 3i
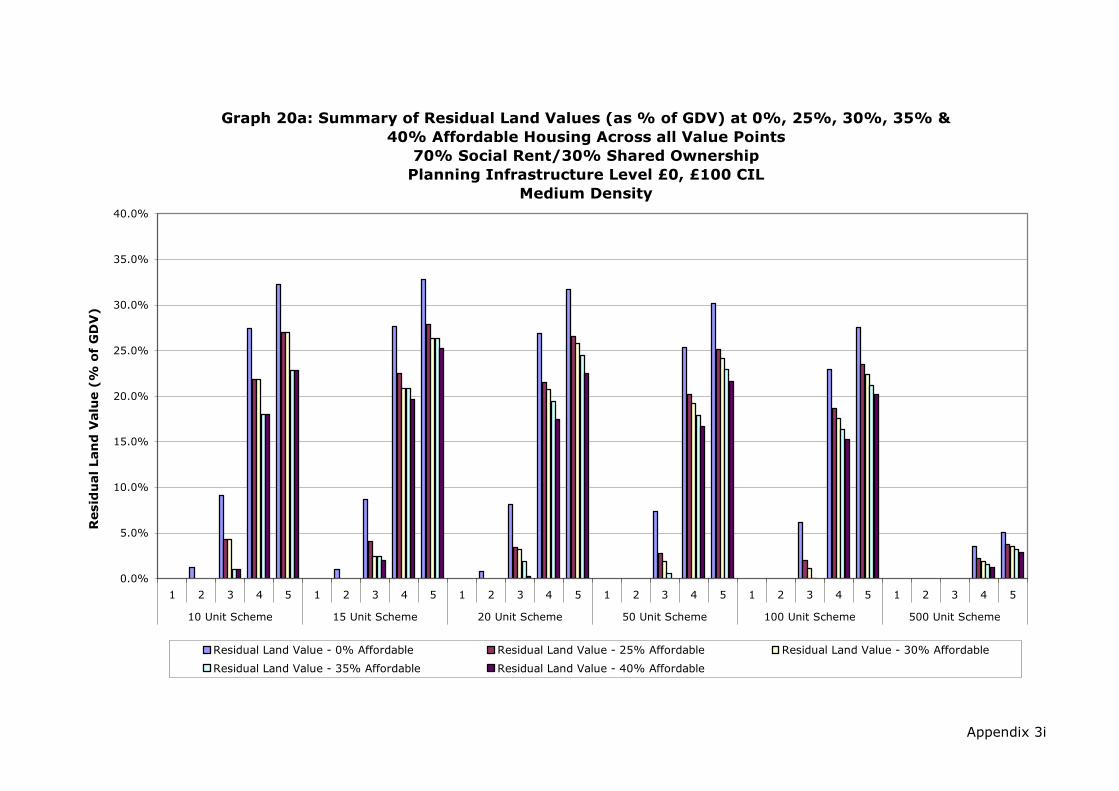
Appendix 3i
Graph 20a: Summary of Residual Land Values (as % of GDV) at 0%, 25%, 30%, 35% &
40% Affordable Housing Across all Value Points
70% Social Rent/30% Shared Ownership
Planning Infrastructure Level £0, £100 CIL
Medium Density
0.0%
5.0%
10.0%
15.0%
20.0%
25.0%
30.0%
35.0%
40.0%
1 2 3 4 5 1 2 3 4 5 1 2 3 4 5 1 2 3 4 5 1 2 3 4 5 1 2 3 4 5
10 Unit Scheme 15 Unit Scheme 20 Unit Scheme 50 Unit Scheme 100 Unit Scheme 500 Unit Scheme
Resid
ual Lan
d V
alu
e (%
o
f G
DV
)
Residual Land Value - 0% Affordable Residual Land Value - 25% Affordable Residual Land Value - 30% Affordable
Residual Land Value - 35% Affordable Residual Land Value - 40% Affordable

Development Scenario /
Threshold Value Point
Residual Land
Value - 0%
Affordable
Residual Land
Value - 25%
Affordable
Residual Land
Value - 30%
Affordable
Residual Land
Value - 35%
Affordable
Residual Land
Value - 40%
Affordable
1 £0 £0 £0 £0 £0
2 £91,230 £0 £0 £0 £0
3 £787,420 £325,603 £325,603 £72,800 £72,800
4 £3,453,058 £2,322,168 £2,322,168 £1,737,137 £1,737,137
5 £4,651,247 £3,239,603 £3,239,603 £2,456,538 £2,456,538
1 £0 £0 £0 £0 £0
2 £77,426 £0 £0 £0 £0
3 £783,381 £331,231 £194,083 £194,083 £153,786
4 £3,735,962 £2,592,883 £2,297,105 £2,297,105 £2,094,305
5 £5,119,666 £3,672,739 £3,313,468 £3,313,468 £3,047,175
1 £0 £0 £0 £0 £0
2 £62,688 £0 £0 £0 £0
3 £716,590 £277,544 £247,491 £145,206 £20,906
4 £3,540,284 £2,430,804 £2,279,555 £2,058,964 £1,762,505
5 £4,775,830 £3,388,373 £3,189,771 £2,921,828 £2,536,803
1 £0 £0 £0 £0 £0
2 £0 £0 £0 £0 £0
3 £622,012 £207,646 £140,466 £38,773 £0
4 £3,173,103 £2,151,407 £2,002,526 £1,796,646 £1,622,607
5 £4,301,062 £3,012,708 £2,828,572 £2,569,030 £2,342,155
1 £0 £0 £0 £0 £0
2 £0 £0 £0 £0 £0
3 £507,486 £146,318 £80,079 £1,866 £0
4 £2,719,345 £1,932,907 £1,765,730 £1,589,849 £1,438,366
5 £3,735,381 £2,752,436 £2,539,207 £2,317,274 £2,130,788
1 £0 £0 £0 £0 £0
2 £0 £0 £0 £0 £0
3 £0 £0 £0 £0 £0
4 £460,412 £250,593 £210,026 £167,085 £125,423
5 £760,673 £497,482 £446,453 £392,623 £340,289
Source: Adams Integra, August 2012
100 Unit Scheme
500 Unit Scheme
10 Unit Scheme
15 Unit Scheme
20 Unit Scheme
50 Unit Scheme
Table 20b: Summary of Residual Land Value (value per Hectare) Appraisals
for All Value Points
0%, 25%, 30%, 35% and 40% Affordable Housing
70% Social Rent/30% Shared Ownership
Planning Infrastructure Level £0, £100 CIL
Medium Density
Appendix 3i
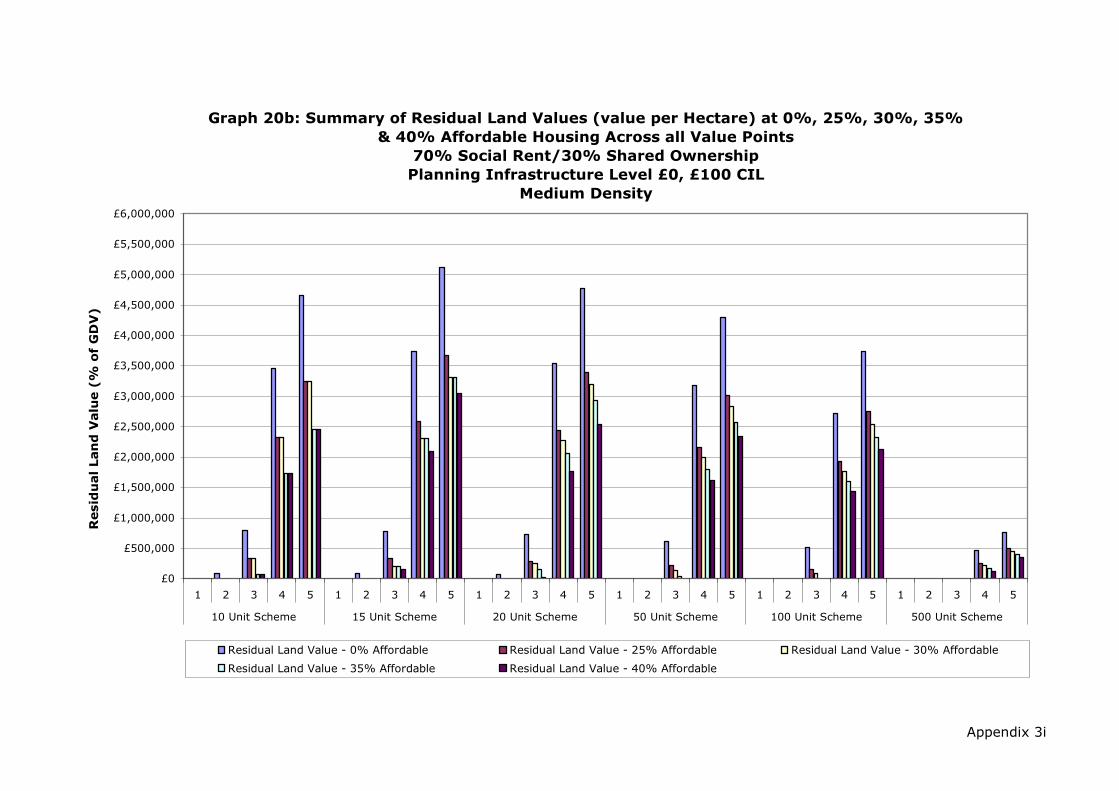
Appendix 3i
Graph 20b: Summary of Residual Land Values (value per Hectare) at 0%, 25%, 30%, 35%
& 40% Affordable Housing Across all Value Points
70% Social Rent/30% Shared Ownership
Planning Infrastructure Level £0, £100 CIL
Medium Density
£0
£500,000
£1,000,000
£1,500,000
£2,000,000
£2,500,000
£3,000,000
£3,500,000
£4,000,000
£4,500,000
£5,000,000
£5,500,000
£6,000,000
1 2 3 4 5 1 2 3 4 5 1 2 3 4 5 1 2 3 4 5 1 2 3 4 5 1 2 3 4 5
10 Unit Scheme 15 Unit Scheme 20 Unit Scheme 50 Unit Scheme 100 Unit Scheme 500 Unit Scheme
Resid
ual Lan
d V
alu
e (%
o
f G
DV
)
Residual Land Value - 0% Affordable Residual Land Value - 25% Affordable Residual Land Value - 30% Affordable
Residual Land Value - 35% Affordable Residual Land Value - 40% Affordable

Development Scenario /
Threshold Value Point
Residual Land
Value - 0%
Affordable
Residual Land
Value - 25%
Affordable
Residual Land
Value - 30%
Affordable
Residual Land
Value - 35%
Affordable
Residual Land
Value - 40%
Affordable
1 £0 £0 £0 £0 £0
2 £0 £0 £0 £0 £0
3 £123,054 £18,660 £18,660 £0 £0
4 £544,939 £296,688 £296,688 £199,993 £199,993
5 £726,342 £416,941 £416,941 £294,581 £294,581
1 £0 £0 £0 £0 £0
2 £0 £0 £0 £0 £0
3 £195,653 £60,291 £14,575 £14,575 £0
4 £762,953 £470,980 £371,361 £371,361 £348,468
5 £1,022,719 £653,061 £533,303 £533,303 £508,066
1 £0 £0 £0 £0 £0
2 £0 £0 £0 £0 £0
3 £266,802 £93,025 £73,294 £27,834 £0
4 £1,047,597 £654,391 £631,862 £533,821 £456,659
5 £1,403,999 £917,325 £892,229 £773,143 £672,011
1 £0 £0 £0 £0 £0
2 £0 £0 £0 £0 £0
3 £658,454 £241,657 £166,963 £68,769 £17,623
4 £2,659,837 £1,740,207 £1,598,248 £1,373,792 £1,265,689
5 £3,558,198 £2,415,231 £2,242,062 £1,959,716 £1,835,194
1 £0 £0 £0 £0 £0
2 £0 £0 £0 £0 £0
3 £1,055,748 £292,121 £151,441 £0 £0
4 £4,826,471 £3,175,599 £2,854,590 £2,504,550 £2,183,541
5 £6,519,034 £4,474,151 £4,067,572 £3,641,381 £3,234,803
1 £0 £0 £0 £0 £0
2 £0 £0 £0 £0 £0
3 £0 £0 £0 £0 £0
4 £4,329,153 £1,997,822 £1,547,078 £1,069,956 £607,054
5 £7,344,415 £4,420,071 £3,853,083 £3,254,977 £2,673,480
Source: Adams Integra, August 2012
100 Unit Scheme
500 Unit Scheme
10 Unit Scheme
15 Unit Scheme
20 Unit Scheme
50 Unit Scheme
Table 21: Summary of Residual Land Value (£) Appraisals for
All Value Points
0%, 25%, 30%, 35% and 40% Affordable Housing
70% Social Rent/30% Shared Ownership
Planning Infrastructure Level £0, £100 CIL
High Density
Appendix 3i
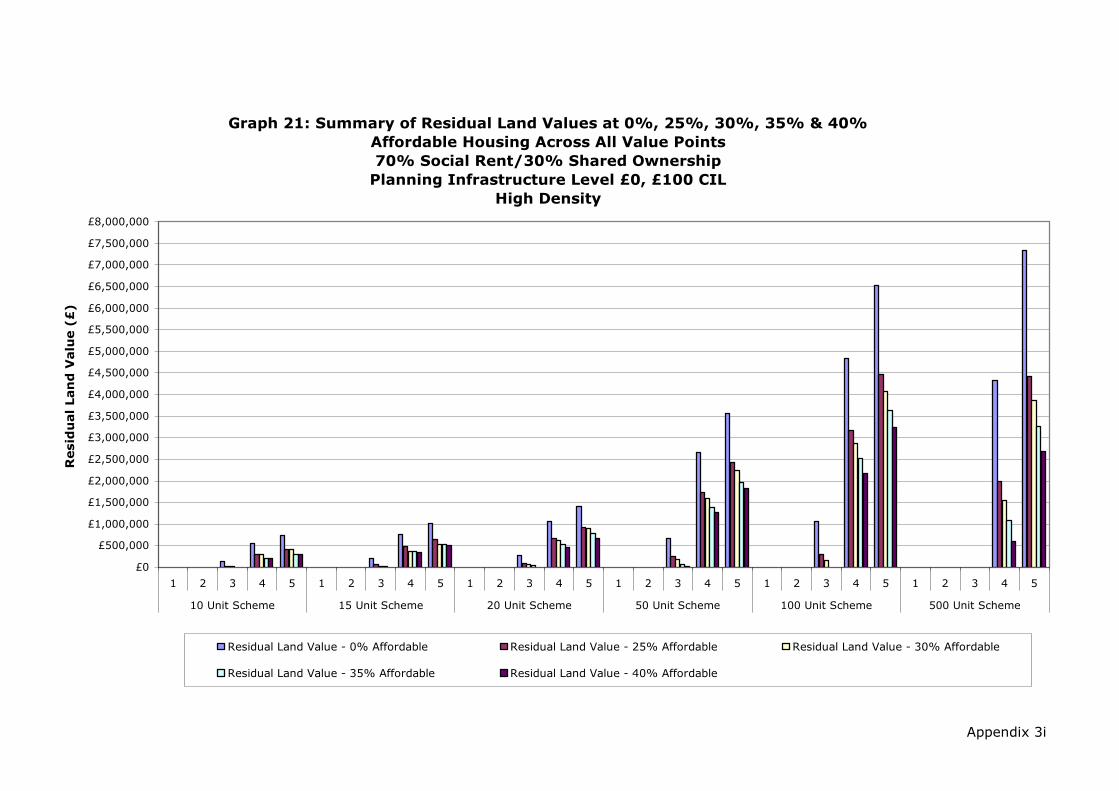
Appendix 3i
Graph 21: Summary of Residual Land Values at 0%, 25%, 30%, 35% & 40%
Affordable Housing Across All Value Points
70% Social Rent/30% Shared Ownership
Planning Infrastructure Level £0, £100 CIL
High Density
£0
£500,000
£1,000,000
£1,500,000
£2,000,000
£2,500,000
£3,000,000
£3,500,000
£4,000,000
£4,500,000
£5,000,000
£5,500,000
£6,000,000
£6,500,000
£7,000,000
£7,500,000
£8,000,000
1 2 3 4 5 1 2 3 4 5 1 2 3 4 5 1 2 3 4 5 1 2 3 4 5 1 2 3 4 5
10 Unit Scheme 15 Unit Scheme 20 Unit Scheme 50 Unit Scheme 100 Unit Scheme 500 Unit Scheme
Resid
ual Lan
d V
alu
e (£
)
Residual Land Value - 0% Affordable Residual Land Value - 25% Affordable Residual Land Value - 30% Affordable
Residual Land Value - 35% Affordable Residual Land Value - 40% Affordable

Development Scenario /
Threshold Value Point
Residual Land
Value - 0%
Affordable
Residual Land
Value - 25%
Affordable
Residual Land
Value - 30%
Affordable
Residual Land
Value - 35%
Affordable
Residual Land
Value - 40%
Affordable
1 0.0% 0.0% 0.0% 0.0% 0.0%
2 0.0% 0.0% 0.0% 0.0% 0.0%
3 7.7% 1.3% 1.3% 0.0% 0.0%
4 24.4% 16.5% 16.5% 12.3% 12.3%
5 29.0% 21.1% 21.1% 16.6% 16.6%
1 0.0% 0.0% 0.0% 0.0% 0.0%
2 0.0% 0.0% 0.0% 0.0% 0.0%
3 8.4% 2.9% 0.7% 0.7% 0.0%
4 23.9% 17.6% 14.8% 14.8% 14.2%
5 28.5% 22.1% 19.3% 19.3% 18.8%
1 0.0% 0.0% 0.0% 0.0% 0.0%
2 0.0% 0.0% 0.0% 0.0% 0.0%
3 8.5% 3.3% 2.7% 1.0% 0.0%
4 24.1% 17.9% 17.5% 15.5% 13.9%
5 28.7% 22.6% 22.3% 20.4% 18.5%
1 0.0% 0.0% 0.0% 0.0% 0.0%
2 0.0% 0.0% 0.0% 0.0% 0.0%
3 8.1% 3.4% 2.4% 1.0% 0.3%
4 23.7% 18.2% 17.2% 15.4% 14.6%
5 28.1% 22.8% 21.7% 20.0% 19.2%
1 0.0% 0.0% 0.0% 0.0% 0.0%
2 0.0% 0.0% 0.0% 0.0% 0.0%
3 6.5% 2.0% 1.1% 0.0% 0.0%
4 21.5% 16.5% 15.3% 13.9% 12.6%
5 25.8% 20.9% 19.7% 18.3% 16.9%
1 0.0% 0.0% 0.0% 0.0% 0.0%
2 0.0% 0.0% 0.0% 0.0% 0.0%
3 0.0% 0.0% 0.0% 0.0% 0.0%
4 3.3% 1.8% 1.4% 1.0% 0.6%
5 4.9% 3.4% 3.1% 2.7% 2.3%
Source: Adams Integra, August 2012
100 Unit Scheme
500 Unit Scheme
10 Unit Scheme
15 Unit Scheme
20 Unit Scheme
50 Unit Scheme
Table 21a: Summary of Residual Land Value (as % of GDV) Appraisals for
All Value Points
0%, 25%, 30%, 35% and 40% Affordable Housing
70% Social Rent/30% Shared Ownership
Planning Infrastructure Level £0, £100 CIL
High Density
Appendix 3i

Appendix 3i
Graph 21a: Summary of Residual Land Values (as % of GDV) at 0%, 25%, 30%, 35% &
40% Affordable Housing Across all Value Points
70% Social Rent/30% Shared Ownership
Planning Infrastructure Level £0, £100 CIL
High Density
0.0%
5.0%
10.0%
15.0%
20.0%
25.0%
30.0%
35.0%
40.0%
1 2 3 4 5 1 2 3 4 5 1 2 3 4 5 1 2 3 4 5 1 2 3 4 5 1 2 3 4 5
10 Unit Scheme 15 Unit Scheme 20 Unit Scheme 50 Unit Scheme 100 Unit Scheme 500 Unit Scheme
Resid
ual Lan
d V
alu
e (%
o
f G
DV
)
Residual Land Value - 0% Affordable Residual Land Value - 25% Affordable Residual Land Value - 30% Affordable
Residual Land Value - 35% Affordable Residual Land Value - 40% Affordable
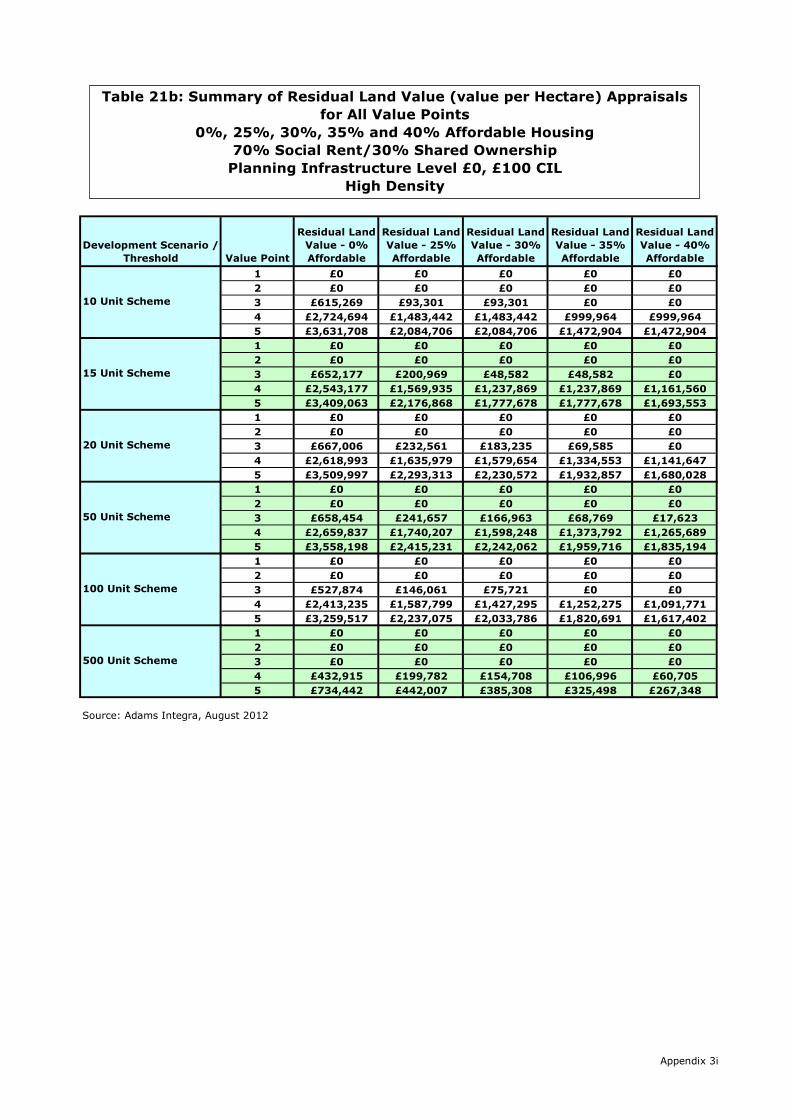
Development Scenario /
Threshold Value Point
Residual Land
Value - 0%
Affordable
Residual Land
Value - 25%
Affordable
Residual Land
Value - 30%
Affordable
Residual Land
Value - 35%
Affordable
Residual Land
Value - 40%
Affordable
1 £0 £0 £0 £0 £0
2 £0 £0 £0 £0 £0
3 £615,269 £93,301 £93,301 £0 £0
4 £2,724,694 £1,483,442 £1,483,442 £999,964 £999,964
5 £3,631,708 £2,084,706 £2,084,706 £1,472,904 £1,472,904
1 £0 £0 £0 £0 £0
2 £0 £0 £0 £0 £0
3 £652,177 £200,969 £48,582 £48,582 £0
4 £2,543,177 £1,569,935 £1,237,869 £1,237,869 £1,161,560
5 £3,409,063 £2,176,868 £1,777,678 £1,777,678 £1,693,553
1 £0 £0 £0 £0 £0
2 £0 £0 £0 £0 £0
3 £667,006 £232,561 £183,235 £69,585 £0
4 £2,618,993 £1,635,979 £1,579,654 £1,334,553 £1,141,647
5 £3,509,997 £2,293,313 £2,230,572 £1,932,857 £1,680,028
1 £0 £0 £0 £0 £0
2 £0 £0 £0 £0 £0
3 £658,454 £241,657 £166,963 £68,769 £17,623
4 £2,659,837 £1,740,207 £1,598,248 £1,373,792 £1,265,689
5 £3,558,198 £2,415,231 £2,242,062 £1,959,716 £1,835,194
1 £0 £0 £0 £0 £0
2 £0 £0 £0 £0 £0
3 £527,874 £146,061 £75,721 £0 £0
4 £2,413,235 £1,587,799 £1,427,295 £1,252,275 £1,091,771
5 £3,259,517 £2,237,075 £2,033,786 £1,820,691 £1,617,402
1 £0 £0 £0 £0 £0
2 £0 £0 £0 £0 £0
3 £0 £0 £0 £0 £0
4 £432,915 £199,782 £154,708 £106,996 £60,705
5 £734,442 £442,007 £385,308 £325,498 £267,348
Source: Adams Integra, August 2012
100 Unit Scheme
500 Unit Scheme
10 Unit Scheme
15 Unit Scheme
20 Unit Scheme
50 Unit Scheme
Table 21b: Summary of Residual Land Value (value per Hectare) Appraisals
for All Value Points
0%, 25%, 30%, 35% and 40% Affordable Housing
70% Social Rent/30% Shared Ownership
Planning Infrastructure Level £0, £100 CIL
High Density
Appendix 3i
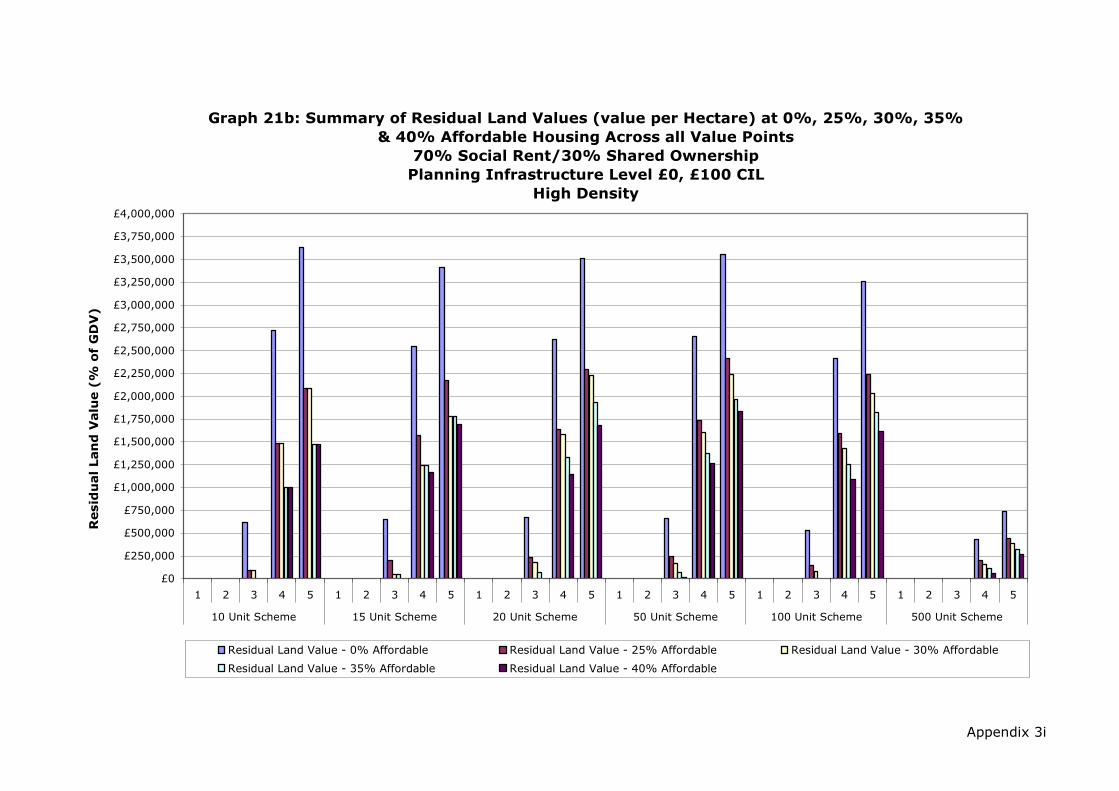
Appendix 3i
Graph 21b: Summary of Residual Land Values (value per Hectare) at 0%, 25%, 30%, 35%
& 40% Affordable Housing Across all Value Points
70% Social Rent/30% Shared Ownership
Planning Infrastructure Level £0, £100 CIL
High Density
£0
£250,000
£500,000
£750,000
£1,000,000
£1,250,000
£1,500,000
£1,750,000
£2,000,000
£2,250,000
£2,500,000
£2,750,000
£3,000,000
£3,250,000
£3,500,000
£3,750,000
£4,000,000
1 2 3 4 5 1 2 3 4 5 1 2 3 4 5 1 2 3 4 5 1 2 3 4 5 1 2 3 4 5
10 Unit Scheme 15 Unit Scheme 20 Unit Scheme 50 Unit Scheme 100 Unit Scheme 500 Unit Scheme
Resid
ual Lan
d V
alu
e (%
o
f G
DV
)
Residual Land Value - 0% Affordable Residual Land Value - 25% Affordable Residual Land Value - 30% Affordable
Residual Land Value - 35% Affordable Residual Land Value - 40% Affordable

Appendix 3a
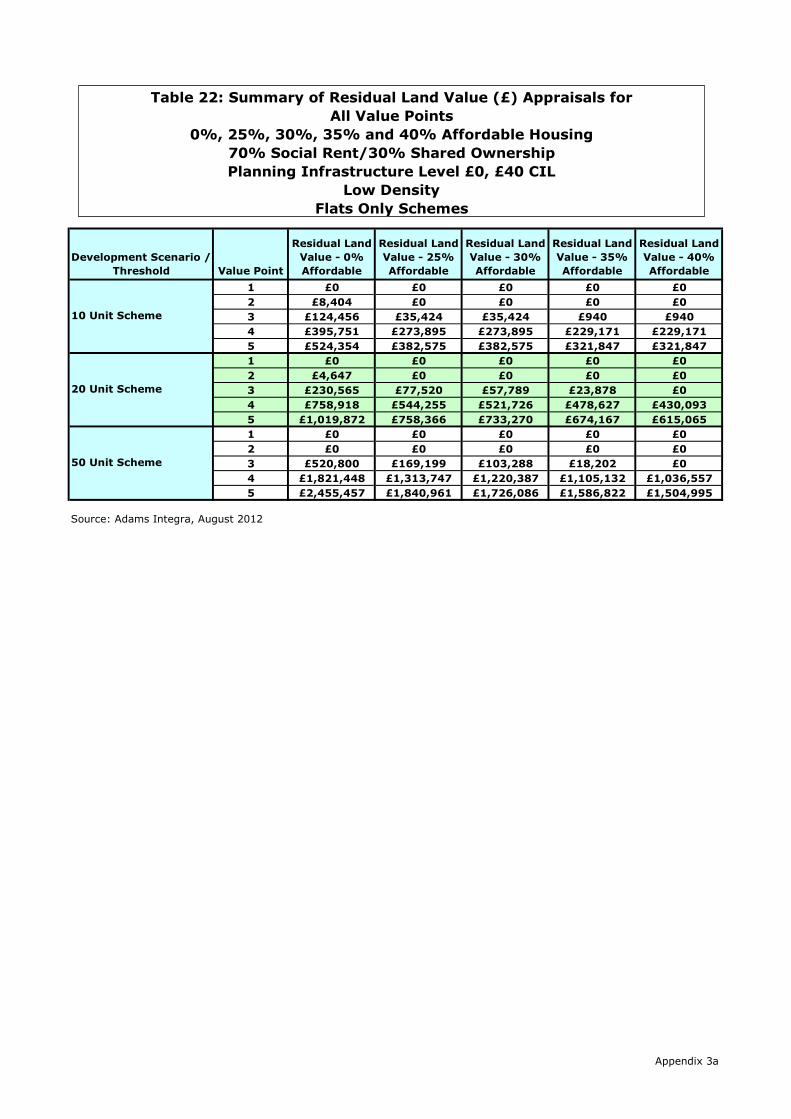
Development Scenario /
Threshold Value Point
Residual Land
Value - 0%
Affordable
Residual Land
Value - 25%
Affordable
Residual Land
Value - 30%
Affordable
Residual Land
Value - 35%
Affordable
Residual Land
Value - 40%
Affordable
1 £0 £0 £0 £0 £0
2 £8,404 £0 £0 £0 £0
3 £124,456 £35,424 £35,424 £940 £940
4 £395,751 £273,895 £273,895 £229,171 £229,171
5 £524,354 £382,575 £382,575 £321,847 £321,847
1 £0 £0 £0 £0 £0
2 £4,647 £0 £0 £0 £0
3 £230,565 £77,520 £57,789 £23,878 £0
4 £758,918 £544,255 £521,726 £478,627 £430,093
5 £1,019,872 £758,366 £733,270 £674,167 £615,065
1 £0 £0 £0 £0 £0
2 £0 £0 £0 £0 £0
3 £520,800 £169,199 £103,288 £18,202 £0
4 £1,821,448 £1,313,747 £1,220,387 £1,105,132 £1,036,557
5 £2,455,457 £1,840,961 £1,726,086 £1,586,822 £1,504,995
Source: Adams Integra, August 2012
10 Unit Scheme
20 Unit Scheme
50 Unit Scheme
Table 22: Summary of Residual Land Value (£) Appraisals for
All Value Points
0%, 25%, 30%, 35% and 40% Affordable Housing
70% Social Rent/30% Shared Ownership
Planning Infrastructure Level £0, £40 CIL
Low Density
Flats Only Schemes
Appendix 3a

Appendix 3a
Graph 22: Summary of Residual Land Values at 0%, 25%, 30%, 35% & 40%
Affordable Housing Across All Value Points
70% Social Rent/30% Shared Ownership
Planning Infrastructure Level £0, £40 CIL
Low Density
Flats Only Schemes
£0
£250,000
£500,000
£750,000
£1,000,000
£1,250,000
£1,500,000
£1,750,000
£2,000,000
£2,250,000
£2,500,000
£2,750,000
£3,000,000
1 2 3 4 5 1 2 3 4 5 1 2 3 4 5
10 Unit Scheme 20 Unit Scheme 50 Unit Scheme
Resid
ual Lan
d V
alu
e (£
)
Residual Land Value - 0% Affordable Residual Land Value - 25% Affordable Residual Land Value - 30% Affordable
Residual Land Value - 35% Affordable Residual Land Value - 40% Affordable Residual Land Value - 40% Affordable

Development Scenario /
Threshold Value Point
Residual Land
Value - 0%
Affordable
Residual Land
Value - 25%
Affordable
Residual Land
Value - 30%
Affordable
Residual Land
Value - 35%
Affordable
Residual Land
Value - 40%
Affordable
1 0.0% 0.0% 0.0% 0.0% 0.0%
2 0.7% 0.0% 0.0% 0.0% 0.0%
3 9.3% 3.0% 3.0% 0.1% 0.1%
4 22.7% 18.0% 18.0% 15.9% 15.9%
5 27.0% 22.7% 22.7% 20.3% 20.3%
1 0.0% 0.0% 0.0% 0.0% 0.0%
2 0.2% 0.0% 0.0% 0.0% 0.0%
3 8.6% 3.2% 2.5% 1.0% 0.0%
4 21.7% 17.5% 17.1% 16.1% 14.9%
5 26.2% 22.1% 21.8% 20.6% 19.4%
1 0.0% 0.0% 0.0% 0.0% 0.0%
2 0.0% 0.0% 0.0% 0.0% 0.0%
3 7.8% 2.8% 1.8% 0.3% 0.0%
4 20.9% 16.9% 16.1% 15.0% 14.3%
5 25.2% 21.5% 20.6% 19.6% 18.9%
Source: Adams Integra, August 2012
10 Unit Scheme
20 Unit Scheme
50 Unit Scheme
Table 22a: Summary of Residual Land Value (as % of GDV) Appraisals for
All Value Points
0%, 25%, 30%, 35% and 40% Affordable Housing
70% Social Rent/30% Shared Ownership
Planning Infrastructure Level £0, £40 CIL
Low Density
Flats Only Schemes
Appendix 3a

Appendix 3a
Graph 22a: Summary of Residual Land Values (as % of GDV) at 0%, 25%, 30%, 35% &
40% Affordable Housing Across all Value Points
70% Social Rent/30% Shared Ownership
Planning Infrastructure Level £0, £40 CIL
Low Density
Flats Only Schemes
0.0%
5.0%
10.0%
15.0%
20.0%
25.0%
30.0%
35.0%
40.0%
1 2 3 4 5 1 2 3 4 5 1 2 3 4 5
10 Unit Scheme 20 Unit Scheme 50 Unit Scheme
Resid
ual Lan
d V
alu
e (%
o
f G
DV
)
Residual Land Value - 0% Affordable Residual Land Value - 25% Affordable Residual Land Value - 30% Affordable
Residual Land Value - 35% Affordable Residual Land Value - 40% Affordable

Development Scenario /
Threshold Value Point
Residual Land
Value - 0%
Affordable
Residual Land
Value - 25%
Affordable
Residual Land
Value - 30%
Affordable
Residual Land
Value - 35%
Affordable
Residual Land
Value - 40%
Affordable
1 £0 £0 £0 £0 £0
2 £33,615 £0 £0 £0 £0
3 £497,825 £141,696 £141,696 £3,759 £3,759
4 £1,583,006 £1,095,579 £1,095,579 £916,683 £916,683
5 £2,097,416 £1,530,300 £1,530,300 £1,287,390 £1,287,390
1 £0 £0 £0 £0 £0
2 £9,294 £0 £0 £0 £0
3 £461,130 £155,040 £115,578 £47,756 £0
4 £1,517,835 £1,088,511 £1,043,451 £957,254 £860,187
5 £2,039,744 £1,516,732 £1,466,539 £1,348,334 £1,230,130
1 £0 £0 £0 £0 £0
2 £0 £0 £0 £0 £0
3 £416,640 £135,359 £82,630 £14,561 £0
4 £1,457,158 £1,050,998 £976,310 £884,105 £829,245
5 £1,964,365 £1,472,769 £1,380,869 £1,269,457 £1,203,996
Source: Adams Integra, August 2012
10 Unit Scheme
20 Unit Scheme
50 Unit Scheme
Table 22b: Summary of Residual Land Value (value per Hectare) Appraisals
for All Value Points
0%, 25%, 30%, 35% and 40% Affordable Housing
70% Social Rent/30% Shared Ownership
Planning Infrastructure Level £0, £40 CIL
Low Density
Flats Only Schemes
Appendix 3a

Appendix 3a
Graph 22b: Summary of Residual Land Values (value per Hectare) at 0%, 25%, 30%, 35%
& 40% Affordable Housing Across all Value Points
70% Social Rent/30% Shared Ownership
Planning Infrastructure Level £0, £40 CIL
Low Density
Flats Only Schemes
£0
£250,000
£500,000
£750,000
£1,000,000
£1,250,000
£1,500,000
£1,750,000
£2,000,000
£2,250,000
£2,500,000
£2,750,000
£3,000,000
1 2 3 4 5 1 2 3 4 5 1 2 3 4 5
10 Unit Scheme 20 Unit Scheme 50 Unit Scheme
Resid
ual Lan
d V
alu
e (%
o
f G
DV
)
Residual Land Value - 0% Affordable Residual Land Value - 25% Affordable Residual Land Value - 30% Affordable
Residual Land Value - 35% Affordable Residual Land Value - 40% Affordable

Development Scenario /
Threshold Value Point
Residual Land
Value - 0%
Affordable
Residual Land
Value - 25%
Affordable
Residual Land
Value - 30%
Affordable
Residual Land
Value - 35%
Affordable
Residual Land
Value - 40%
Affordable
1 £0 £0 £0 £0 £0
2 £22,913 £0 £0 £0 £0
3 £133,232 £44,200 £44,200 £9,716 £9,716
4 £384,933 £263,076 £263,076 £218,129 £218,129
5 £510,294 £368,368 £368,368 £307,641 £307,641
1 £0 £0 £0 £0 £0
2 £33,455 £0 £0 £0 £0
3 £242,913 £95,052 £75,321 £41,410 £7,499
4 £738,121 £523,458 £500,929 £457,613 £409,080
5 £992,480 £730,974 £705,878 £646,776 £587,673
1 £0 £0 £0 £0 £0
2 £59,049 £0 £0 £0 £0
3 £562,750 £210,768 £146,986 £61,900 £9,769
4 £1,771,978 £1,264,277 £1,170,917 £1,055,662 £987,087
5 £2,389,965 £1,775,470 £1,660,594 £1,521,330 £1,439,503
Source: Adams Integra, August 2012
10 Unit Scheme
20 Unit Scheme
50 Unit Scheme
Table 23: Summary of Residual Land Value (£) Appraisals for
All Value Points
0%, 25%, 30%, 35% and 40% Affordable Housing
70% Social Rent/30% Shared Ownership
Planning Infrastructure Level £0, £40 CIL
Medium Density
Flats Only Schemes
Appendix 3a
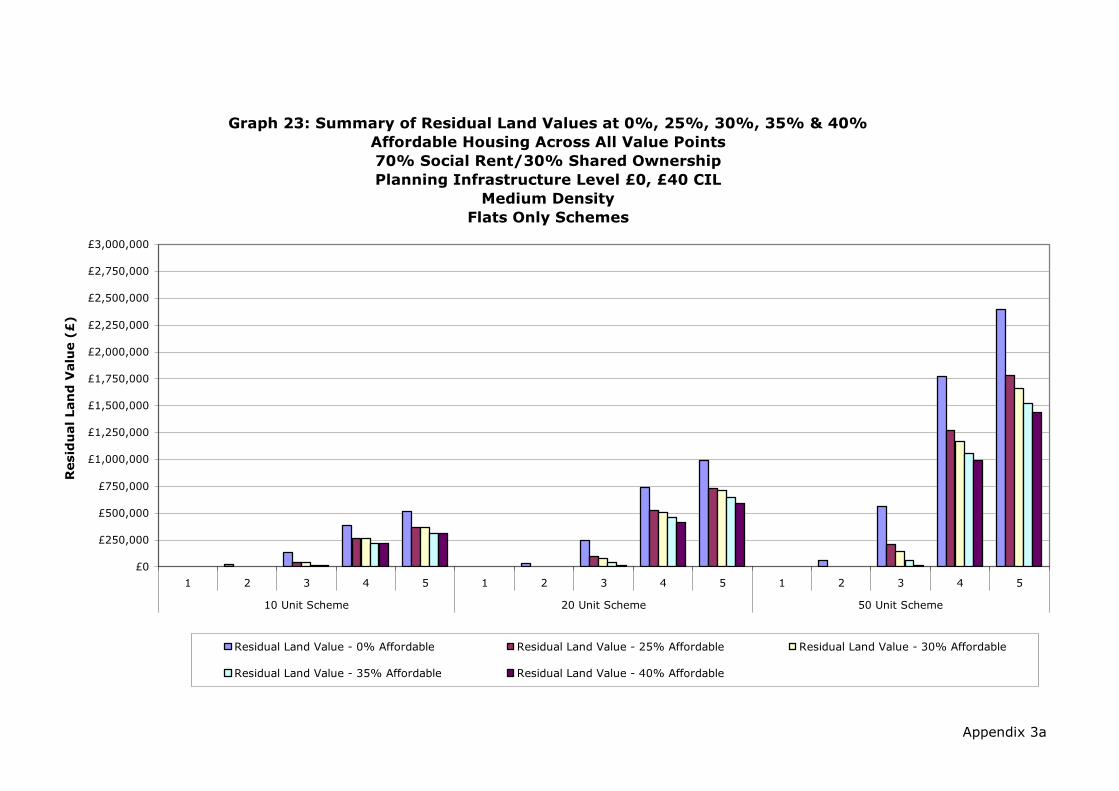
Appendix 3a
Graph 23: Summary of Residual Land Values at 0%, 25%, 30%, 35% & 40%
Affordable Housing Across All Value Points
70% Social Rent/30% Shared Ownership
Planning Infrastructure Level £0, £40 CIL
Medium Density
Flats Only Schemes
£0
£250,000
£500,000
£750,000
£1,000,000
£1,250,000
£1,500,000
£1,750,000
£2,000,000
£2,250,000
£2,500,000
£2,750,000
£3,000,000
1 2 3 4 5 1 2 3 4 5 1 2 3 4 5
10 Unit Scheme 20 Unit Scheme 50 Unit Scheme
Resid
ual Lan
d V
alu
e (£
)
Residual Land Value - 0% Affordable Residual Land Value - 25% Affordable Residual Land Value - 30% Affordable
Residual Land Value - 35% Affordable Residual Land Value - 40% Affordable

Development Scenario /
Threshold Value Point
Residual Land
Value - 0%
Affordable
Residual Land
Value - 25%
Affordable
Residual Land
Value - 30%
Affordable
Residual Land
Value - 35%
Affordable
Residual Land
Value - 40%
Affordable
1 0.0% 0.0% 0.0% 0.0% 0.0%
2 2.0% 0.0% 0.0% 0.0% 0.0%
3 10.1% 3.8% 3.8% 0.9% 0.9%
4 22.6% 17.8% 17.8% 15.6% 15.6%
5 26.9% 22.5% 22.5% 20.1% 20.1%
1 0.0% 0.0% 0.0% 0.0% 0.0%
2 1.4% 0.0% 0.0% 0.0% 0.0%
3 9.2% 4.0% 3.3% 1.8% 0.3%
4 21.7% 17.4% 16.9% 15.9% 14.7%
5 26.2% 22.0% 21.6% 20.4% 19.2%
1 0.0% 0.0% 0.0% 0.0% 0.0%
2 1.0% 0.0% 0.0% 0.0% 0.0%
3 8.5% 3.6% 2.5% 1.1% 0.2%
4 20.8% 16.8% 15.9% 14.8% 14.1%
5 25.2% 21.3% 20.4% 19.3% 18.7%
Source: Adams Integra, August 2012
10 Unit Scheme
20 Unit Scheme
50 Unit Scheme
Table 23a: Summary of Residual Land Value (as % of GDV) Appraisals for
All Value Points
0%, 25%, 30%, 35% and 40% Affordable Housing
70% Social Rent/30% Shared Ownership
Planning Infrastructure Level £0, £40 CIL
Medium Density
Flats Only Schemes
Appendix 3a

Appendix 3a
Graph 23a: Summary of Residual Land Values (as % of GDV) at 0%, 25%, 30%, 35% &
40% Affordable Housing Across all Value Points
70% Social Rent/30% Shared Ownership
Planning Infrastructure Level £0, £40 CIL
Medium Density
Flats Only Schemes
0.0%
5.0%
10.0%
15.0%
20.0%
25.0%
30.0%
35.0%
40.0%
45.0%
50.0%
1 2 3 4 5 1 2 3 4 5 1 2 3 4 5
10 Unit Scheme 20 Unit Scheme 50 Unit Scheme
Resid
ual Lan
d V
alu
e (%
o
f G
DV
)
Residual Land Value - 0% Affordable Residual Land Value - 25% Affordable Residual Land Value - 30% Affordable
Residual Land Value - 35% Affordable Residual Land Value - 40% Affordable

Development Scenario /
Threshold Value Point
Residual Land
Value - 0%
Affordable
Residual Land
Value - 25%
Affordable
Residual Land
Value - 30%
Affordable
Residual Land
Value - 35%
Affordable
Residual Land
Value - 40%
Affordable
1 £0 £0 £0 £0 £0
2 £103,107 £0 £0 £0 £0
3 £599,544 £198,899 £198,899 £43,720 £43,720
4 £1,732,197 £1,183,843 £1,183,843 £981,581 £981,581
5 £2,296,322 £1,657,658 £1,657,658 £1,384,384 £1,384,384
1 £0 £0 £0 £0 £0
2 £75,273 £0 £0 £0 £0
3 £546,555 £213,867 £169,473 £93,173 £16,874
4 £1,660,771 £1,177,781 £1,127,090 £1,029,630 £920,430
5 £2,233,081 £1,644,692 £1,588,226 £1,455,245 £1,322,265
1 £0 £0 £0 £0 £0
2 £53,144 £0 £0 £0 £0
3 £506,475 £189,691 £132,287 £55,710 £8,792
4 £1,594,780 £1,137,850 £1,053,825 £950,096 £888,378
5 £2,150,969 £1,597,923 £1,494,535 £1,369,197 £1,295,553
Source: Adams Integra, August 2012
10 Unit Scheme
20 Unit Scheme
50 Unit Scheme
Table 23b: Summary of Residual Land Value (value per Hectare) Appraisals
for All Value Points
0%, 25%, 30%, 35% and 40% Affordable Housing
70% Social Rent/30% Shared Ownership
Planning Infrastructure Level £0, £40 CIL
Medium Density
Flats Only Schemes
Appendix 3a

Appendix 3a
Graph 23b: Summary of Residual Land Values (value per Hectare) at 0%, 25%, 30%, 35%
& 40% Affordable Housing Across all Value Points
70% Social Rent/30% Shared Ownership
Planning Infrastructure Level £0, £40 CIL
Medium Density
Flats Only Schemes
£0
£250,000
£500,000
£750,000
£1,000,000
£1,250,000
£1,500,000
£1,750,000
£2,000,000
£2,250,000
£2,500,000
£2,750,000
£3,000,000
1 2 3 4 5 1 2 3 4 5 1 2 3 4 5
10 Unit Scheme 20 Unit Scheme 50 Unit Scheme
Resid
ual Lan
d V
alu
e (%
o
f G
DV
)
Residual Land Value - 0% Affordable Residual Land Value - 25% Affordable Residual Land Value - 30% Affordable
Residual Land Value - 35% Affordable Residual Land Value - 40% Affordable

Development Scenario /
Threshold Value Point
Residual Land
Value - 0%
Affordable
Residual Land
Value - 25%
Affordable
Residual Land
Value - 30%
Affordable
Residual Land
Value - 35%
Affordable
Residual Land
Value - 40%
Affordable
1 £3,509 £0 £0 £0 £0
2 £37,422 £0 £0 £0 £0
3 £142,008 £52,976 £52,976 £18,491 £18,491
4 £374,114 £252,258 £252,258 £207,087 £207,087
5 £496,234 £354,162 £354,162 £293,434 £293,434
1 £0 £0 £0 £0 £0
2 £62,263 £0 £0 £0 £0
3 £259,920 £112,584 £92,853 £58,942 £25,032
4 £717,324 £502,661 £480,132 £436,600 £388,066
5 £965,089 £703,583 £678,487 £619,384 £560,282
1 £0 £0 £0 £0 £0
2 £130,142 £0 £0 £0 £0
3 £604,700 £248,897 £188,777 £105,597 £53,467
4 £1,722,508 £1,214,808 £1,121,447 £1,006,192 £937,617
5 £2,324,473 £1,709,978 £1,595,103 £1,455,838 £1,374,012
Source: Adams Integra, August 2012
10 Unit Scheme
20 Unit Scheme
50 Unit Scheme
Table 24: Summary of Residual Land Value (£) Appraisals for
All Value Points
0%, 25%, 30%, 35% and 40% Affordable Housing
70% Social Rent/30% Shared Ownership
Planning Infrastructure Level £0, £40 CIL
High Density
Flats Only Schemes
Appendix 3a
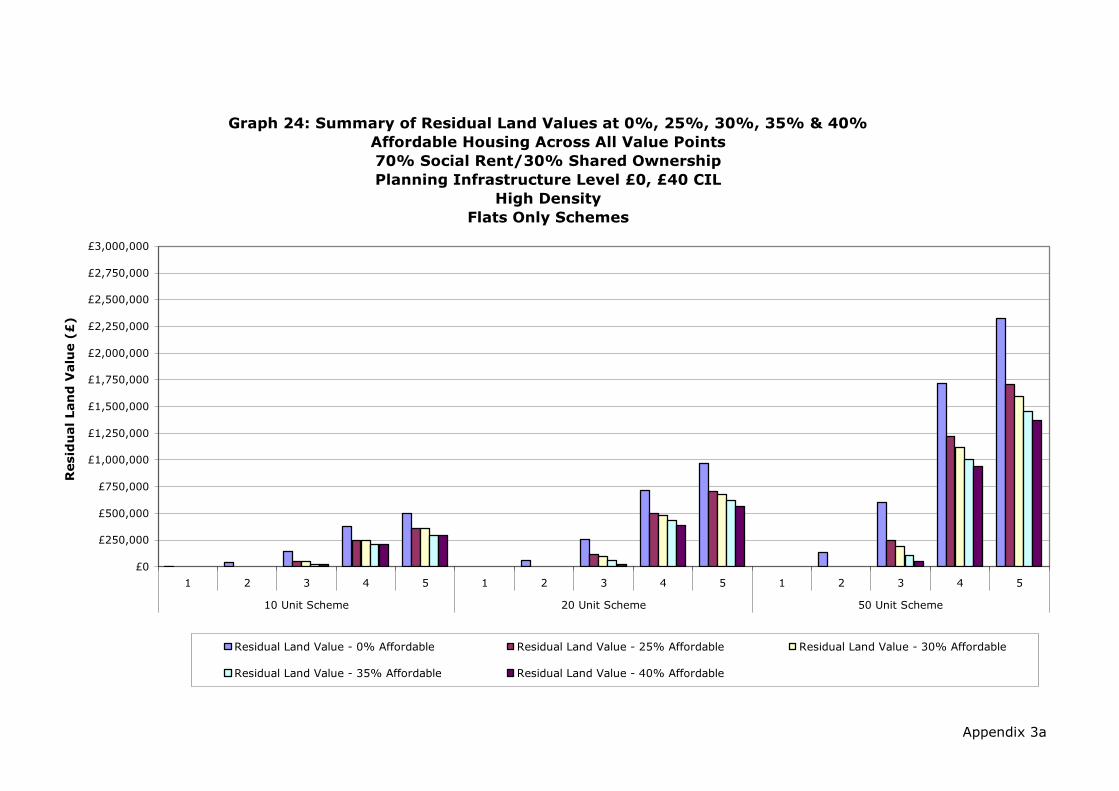
Appendix 3a
Graph 24: Summary of Residual Land Values at 0%, 25%, 30%, 35% & 40%
Affordable Housing Across All Value Points
70% Social Rent/30% Shared Ownership
Planning Infrastructure Level £0, £40 CIL
High Density
Flats Only Schemes
£0
£250,000
£500,000
£750,000
£1,000,000
£1,250,000
£1,500,000
£1,750,000
£2,000,000
£2,250,000
£2,500,000
£2,750,000
£3,000,000
1 2 3 4 5 1 2 3 4 5 1 2 3 4 5
10 Unit Scheme 20 Unit Scheme 50 Unit Scheme
Resid
ual Lan
d V
alu
e (£
)
Residual Land Value - 0% Affordable Residual Land Value - 25% Affordable Residual Land Value - 30% Affordable
Residual Land Value - 35% Affordable Residual Land Value - 40% Affordable

Development Scenario /
Threshold Value Point
Residual Land
Value - 0%
Affordable
Residual Land
Value - 25%
Affordable
Residual Land
Value - 30%
Affordable
Residual Land
Value - 35%
Affordable
Residual Land
Value - 40%
Affordable
1 0.3% 0.0% 0.0% 0.0% 0.0%
2 3.2% 0.0% 0.0% 0.0% 0.0%
3 10.9% 4.6% 4.6% 1.7% 1.7%
4 22.6% 17.6% 17.6% 15.3% 15.3%
5 26.9% 22.3% 22.3% 19.8% 19.8%
1 0.0% 0.0% 0.0% 0.0% 0.0%
2 2.7% 0.0% 0.0% 0.0% 0.0%
3 9.9% 4.8% 4.1% 2.7% 1.2%
4 21.6% 17.2% 16.7% 15.7% 14.4%
5 26.1% 21.8% 21.4% 20.2% 18.9%
1 0.0% 0.0% 0.0% 0.0% 0.0%
2 2.3% 0.0% 0.0% 0.0% 0.0%
3 9.3% 4.3% 3.3% 1.9% 1.0%
4 20.8% 16.6% 15.7% 14.5% 13.8%
5 25.2% 21.1% 20.2% 19.1% 18.4%
Source: Adams Integra, August 2012
10 Unit Scheme
20 Unit Scheme
50 Unit Scheme
Table 24a: Summary of Residual Land Value (as % of GDV) Appraisals for
All Value Points
0%, 25%, 30%, 35% and 40% Affordable Housing
70% Social Rent/30% Shared Ownership
Planning Infrastructure Level £0, £40 CIL
High Density
Flats Only Schemes
Appendix 3a

Appendix 3a
Graph 24a: Summary of Residual Land Values (as % of GDV) at 0%, 25%, 30%, 35% &
40% Affordable Housing Across all Value Points
70% Social Rent/30% Shared Ownership
Planning Infrastructure Level £0, £40 CIL
High Density
Flats Only Schemes
0.0%
5.0%
10.0%
15.0%
20.0%
25.0%
30.0%
35.0%
40.0%
1 2 3 4 5 1 2 3 4 5 1 2 3 4 5
10 Unit Scheme 20 Unit Scheme 50 Unit Scheme
Resid
ual Lan
d V
alu
e (%
o
f G
DV
)
Residual Land Value - 0% Affordable Residual Land Value - 25% Affordable Residual Land Value - 30% Affordable
Residual Land Value - 35% Affordable Residual Land Value - 40% Affordable

Development Scenario /
Threshold Value Point
Residual Land
Value - 0%
Affordable
Residual Land
Value - 25%
Affordable
Residual Land
Value - 30%
Affordable
Residual Land
Value - 35%
Affordable
Residual Land
Value - 40%
Affordable
1 £17,546 £0 £0 £0 £0
2 £187,108 £0 £0 £0 £0
3 £710,039 £264,878 £264,878 £92,457 £92,457
4 £1,870,571 £1,261,288 £1,261,288 £1,035,437 £1,035,437
5 £2,481,169 £1,770,809 £1,770,809 £1,467,172 £1,467,172
1 £0 £0 £0 £0 £0
2 £155,656 £0 £0 £0 £0
3 £649,799 £281,460 £232,133 £147,356 £62,579
4 £1,793,309 £1,256,654 £1,200,329 £1,091,499 £970,165
5 £2,412,722 £1,758,957 £1,696,217 £1,548,461 £1,400,704
1 £0 £0 £0 £0 £0
2 £130,142 £0 £0 £0 £0
3 £604,700 £248,897 £188,777 £105,597 £53,467
4 £1,722,508 £1,214,808 £1,121,447 £1,006,192 £937,617
5 £2,324,473 £1,709,978 £1,595,103 £1,455,838 £1,374,012
Source: Adams Integra, August 2012
10 Unit Scheme
20 Unit Scheme
50 Unit Scheme
Table 24b: Summary of Residual Land Value (value per Hectare) Appraisals
for All Value Points
0%, 25%, 30%, 35% and 40% Affordable Housing
70% Social Rent/30% Shared Ownership
Planning Infrastructure Level £0, £40 CIL
High Density
Flats Only Schemes
Appendix 3a

Appendix 3a
Graph 24b: Summary of Residual Land Values (value per Hectare) at 0%, 25%, 30%, 35%
& 40% Affordable Housing Across all Value Points
70% Social Rent/30% Shared Ownership
Planning Infrastructure Level £0, £40 CIL
High Density
Flats Only Schemes
£0
£250,000
£500,000
£750,000
£1,000,000
£1,250,000
£1,500,000
£1,750,000
£2,000,000
£2,250,000
£2,500,000
£2,750,000
£3,000,000
1 2 3 4 5 1 2 3 4 5 1 2 3 4 5
10 Unit Scheme 20 Unit Scheme 50 Unit Scheme
Resid
ual Lan
d V
alu
e (%
o
f G
DV
)
Residual Land Value - 0% Affordable Residual Land Value - 25% Affordable Residual Land Value - 30% Affordable
Residual Land Value - 35% Affordable Residual Land Value - 40% Affordable

Development Scenario /
Threshold Value Point
Residual Land
Value - 0%
Affordable
Residual Land
Value - 25%
Affordable
Residual Land
Value - 30%
Affordable
Residual Land
Value - 35%
Affordable
Residual Land
Value - 40%
Affordable
1 £0 £0 £0 £0 £0
2 £0 £0 £0 £0 £0
3 £114,456 £25,424 £25,424 £0 £0
4 £386,052 £264,195 £264,195 £219,271 £219,271
5 £514,754 £372,875 £372,875 £312,148 £312,148
1 £0 £0 £0 £0 £0
2 £0 £0 £0 £0 £0
3 £211,095 £57,853 £38,122 £4,211 £0
4 £740,037 £525,375 £502,845 £459,550 £411,016
5 £1,000,992 £739,486 £714,389 £655,287 £596,184
1 £0 £0 £0 £0 £0
2 £0 £0 £0 £0 £0
3 £479,876 £121,417 £55,505 £0 £0
4 £1,775,577 £1,267,876 £1,174,516 £1,059,260 £990,685
5 £2,409,585 £1,795,090 £1,680,215 £1,540,950 £1,459,124
Source: Adams Integra, August 2012
10 Unit Scheme
20 Unit Scheme
50 Unit Scheme
Table 25: Summary of Residual Land Value (£) Appraisals for
All Value Points
0%, 25%, 30%, 35% and 40% Affordable Housing
70% Social Rent/30% Shared Ownership
Planning Infrastructure Level £0, £60 CIL
Low Density
Flats Only Schemes
Appendix 3a

Appendix 3a
Graph 25: Summary of Residual Land Values at 0%, 25%, 30%, 35% & 40%
Affordable Housing Across All Value Points
70% Social Rent/30% Shared Ownership
Planning Infrastructure Level £0, £60 CIL
Low Density
Flats Only Schemes
£0
£250,000
£500,000
£750,000
£1,000,000
£1,250,000
£1,500,000
£1,750,000
£2,000,000
£2,250,000
£2,500,000
£2,750,000
£3,000,000
1 2 3 4 5 1 2 3 4 5 1 2 3 4 5
10 Unit Scheme 20 Unit Scheme 50 Unit Scheme
Resid
ual Lan
d V
alu
e (£
)
Residual Land Value - 0% Affordable Residual Land Value - 25% Affordable Residual Land Value - 30% Affordable
Residual Land Value - 35% Affordable Residual Land Value - 40% Affordable Residual Land Value - 40% Affordable

Development Scenario /
Threshold Value Point
Residual Land
Value - 0%
Affordable
Residual Land
Value - 25%
Affordable
Residual Land
Value - 30%
Affordable
Residual Land
Value - 35%
Affordable
Residual Land
Value - 40%
Affordable
1 0.0% 0.0% 0.0% 0.0% 0.0%
2 0.0% 0.0% 0.0% 0.0% 0.0%
3 8.6% 2.2% 2.2% 0.0% 0.0%
4 22.1% 17.3% 17.3% 15.2% 15.2%
5 26.5% 22.1% 22.1% 19.7% 19.7%
1 0.0% 0.0% 0.0% 0.0% 0.0%
2 0.0% 0.0% 0.0% 0.0% 0.0%
3 7.9% 2.4% 1.6% 0.2% 0.0%
4 21.2% 16.9% 16.5% 15.5% 14.3%
5 25.7% 21.6% 21.2% 20.1% 18.8%
1 0.0% 0.0% 0.0% 0.0% 0.0%
2 0.0% 0.0% 0.0% 0.0% 0.0%
3 7.2% 2.0% 0.9% 0.0% 0.0%
4 20.3% 16.3% 15.5% 14.4% 13.7%
5 24.8% 20.9% 20.1% 19.0% 18.3%
Source: Adams Integra, August 2012
10 Unit Scheme
20 Unit Scheme
50 Unit Scheme
Table 25a: Summary of Residual Land Value (as % of GDV) Appraisals for
All Value Points
0%, 25%, 30%, 35% and 40% Affordable Housing
70% Social Rent/30% Shared Ownership
Planning Infrastructure Level £0, £60 CIL
Low Density
Flats Only Schemes
Appendix 3a

Appendix 3a
Graph 25a: Summary of Residual Land Values (as % of GDV) at 0%, 25%, 30%, 35% &
40% Affordable Housing Across all Value Points
70% Social Rent/30% Shared Ownership
Planning Infrastructure Level £0, £60 CIL
Low Density
Flats Only Schemes
0.0%
5.0%
10.0%
15.0%
20.0%
25.0%
30.0%
35.0%
40.0%
1 2 3 4 5 1 2 3 4 5 1 2 3 4 5
10 Unit Scheme 20 Unit Scheme 50 Unit Scheme
Resid
ual Lan
d V
alu
e (%
o
f G
DV
)
Residual Land Value - 0% Affordable Residual Land Value - 25% Affordable Residual Land Value - 30% Affordable
Residual Land Value - 35% Affordable Residual Land Value - 40% Affordable

Development Scenario /
Threshold Value Point
Residual Land
Value - 0%
Affordable
Residual Land
Value - 25%
Affordable
Residual Land
Value - 30%
Affordable
Residual Land
Value - 35%
Affordable
Residual Land
Value - 40%
Affordable
1 £0 £0 £0 £0 £0
2 £0 £0 £0 £0 £0
3 £457,826 £101,697 £101,697 £0 £0
4 £1,544,207 £1,056,780 £1,056,780 £877,084 £877,084
5 £2,059,017 £1,491,501 £1,491,501 £1,248,591 £1,248,591
1 £0 £0 £0 £0 £0
2 £0 £0 £0 £0 £0
3 £422,190 £115,706 £76,244 £8,422 £0
4 £1,480,074 £1,050,750 £1,005,691 £919,100 £822,033
5 £2,001,983 £1,478,971 £1,428,779 £1,310,574 £1,192,369
1 £0 £0 £0 £0 £0
2 £0 £0 £0 £0 £0
3 £383,901 £97,133 £44,404 £0 £0
4 £1,420,461 £1,014,301 £939,613 £847,408 £792,548
5 £1,927,668 £1,436,072 £1,344,172 £1,232,760 £1,167,299
Source: Adams Integra, August 2012
10 Unit Scheme
20 Unit Scheme
50 Unit Scheme
Table 25b: Summary of Residual Land Value (value per Hectare) Appraisals
for All Value Points
0%, 25%, 30%, 35% and 40% Affordable Housing
70% Social Rent/30% Shared Ownership
Planning Infrastructure Level £0, £60 CIL
Low Density
Flats Only Schemes
Appendix 3a

Appendix 3a
Graph 25b: Summary of Residual Land Values (value per Hectare) at 0%, 25%, 30%, 35%
& 40% Affordable Housing Across all Value Points
70% Social Rent/30% Shared Ownership
Planning Infrastructure Level £0, £60 CIL
Low Density
Flats Only Schemes
£0
£250,000
£500,000
£750,000
£1,000,000
£1,250,000
£1,500,000
£1,750,000
£2,000,000
£2,250,000
£2,500,000
£2,750,000
£3,000,000
1 2 3 4 5 1 2 3 4 5 1 2 3 4 5
10 Unit Scheme 20 Unit Scheme 50 Unit Scheme
Resid
ual Lan
d V
alu
e (%
o
f G
DV
)
Residual Land Value - 0% Affordable Residual Land Value - 25% Affordable Residual Land Value - 30% Affordable
Residual Land Value - 35% Affordable Residual Land Value - 40% Affordable
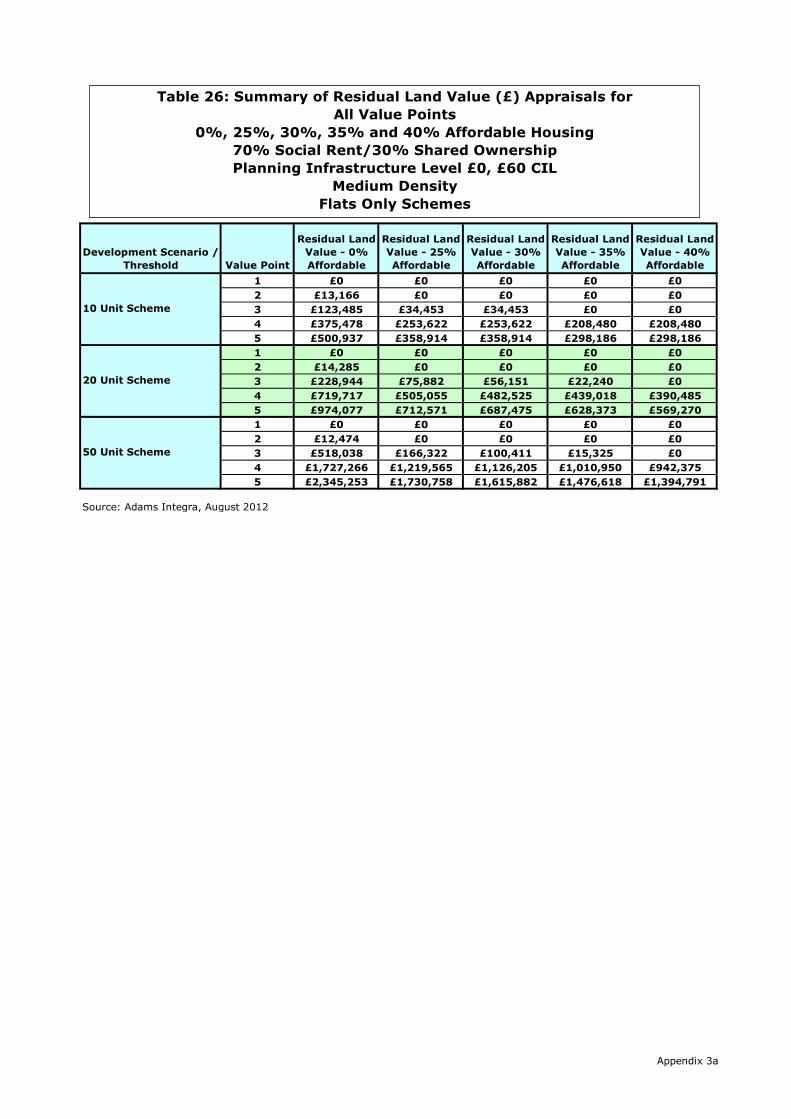
Development Scenario /
Threshold Value Point
Residual Land
Value - 0%
Affordable
Residual Land
Value - 25%
Affordable
Residual Land
Value - 30%
Affordable
Residual Land
Value - 35%
Affordable
Residual Land
Value - 40%
Affordable
1 £0 £0 £0 £0 £0
2 £13,166 £0 £0 £0 £0
3 £123,485 £34,453 £34,453 £0 £0
4 £375,478 £253,622 £253,622 £208,480 £208,480
5 £500,937 £358,914 £358,914 £298,186 £298,186
1 £0 £0 £0 £0 £0
2 £14,285 £0 £0 £0 £0
3 £228,944 £75,882 £56,151 £22,240 £0
4 £719,717 £505,055 £482,525 £439,018 £390,485
5 £974,077 £712,571 £687,475 £628,373 £569,270
1 £0 £0 £0 £0 £0
2 £12,474 £0 £0 £0 £0
3 £518,038 £166,322 £100,411 £15,325 £0
4 £1,727,266 £1,219,565 £1,126,205 £1,010,950 £942,375
5 £2,345,253 £1,730,758 £1,615,882 £1,476,618 £1,394,791
Source: Adams Integra, August 2012
10 Unit Scheme
20 Unit Scheme
50 Unit Scheme
Table 26: Summary of Residual Land Value (£) Appraisals for
All Value Points
0%, 25%, 30%, 35% and 40% Affordable Housing
70% Social Rent/30% Shared Ownership
Planning Infrastructure Level £0, £60 CIL
Medium Density
Flats Only Schemes
Appendix 3a

Appendix 3a
Graph 26: Summary of Residual Land Values at 0%, 25%, 30%, 35% & 40%
Affordable Housing Across All Value Points
70% Social Rent/30% Shared Ownership
Planning Infrastructure Level £0, £60 CIL
Medium Density
Flats Only Schemes
£0
£250,000
£500,000
£750,000
£1,000,000
£1,250,000
£1,500,000
£1,750,000
£2,000,000
£2,250,000
£2,500,000
£2,750,000
£3,000,000
1 2 3 4 5 1 2 3 4 5 1 2 3 4 5
10 Unit Scheme 20 Unit Scheme 50 Unit Scheme
Resid
ual Lan
d V
alu
e (£
)
Residual Land Value - 0% Affordable Residual Land Value - 25% Affordable Residual Land Value - 30% Affordable
Residual Land Value - 35% Affordable Residual Land Value - 40% Affordable

Development Scenario /
Threshold Value Point
Residual Land
Value - 0%
Affordable
Residual Land
Value - 25%
Affordable
Residual Land
Value - 30%
Affordable
Residual Land
Value - 35%
Affordable
Residual Land
Value - 40%
Affordable
1 0.0% 0.0% 0.0% 0.0% 0.0%
2 1.1% 0.0% 0.0% 0.0% 0.0%
3 9.3% 3.0% 3.0% 0.0% 0.0%
4 22.1% 17.1% 17.1% 14.9% 14.9%
5 26.4% 22.0% 22.0% 19.4% 19.4%
1 0.0% 0.0% 0.0% 0.0% 0.0%
2 0.6% 0.0% 0.0% 0.0% 0.0%
3 8.7% 3.2% 2.4% 1.0% 0.0%
4 21.1% 16.8% 16.3% 15.3% 14.0%
5 25.7% 21.4% 21.0% 19.8% 18.6%
1 0.0% 0.0% 0.0% 0.0% 0.0%
2 0.2% 0.0% 0.0% 0.0% 0.0%
3 7.8% 2.8% 1.7% 0.3% 0.0%
4 20.3% 16.2% 15.3% 14.1% 13.4%
5 24.7% 20.8% 19.9% 18.8% 18.1%
Source: Adams Integra, August 2012
10 Unit Scheme
20 Unit Scheme
50 Unit Scheme
Table 26a: Summary of Residual Land Value (as % of GDV) Appraisals for
All Value Points
0%, 25%, 30%, 35% and 40% Affordable Housing
70% Social Rent/30% Shared Ownership
Planning Infrastructure Level £0, £60 CIL
Medium Density
Flats Only Schemes
Appendix 3a
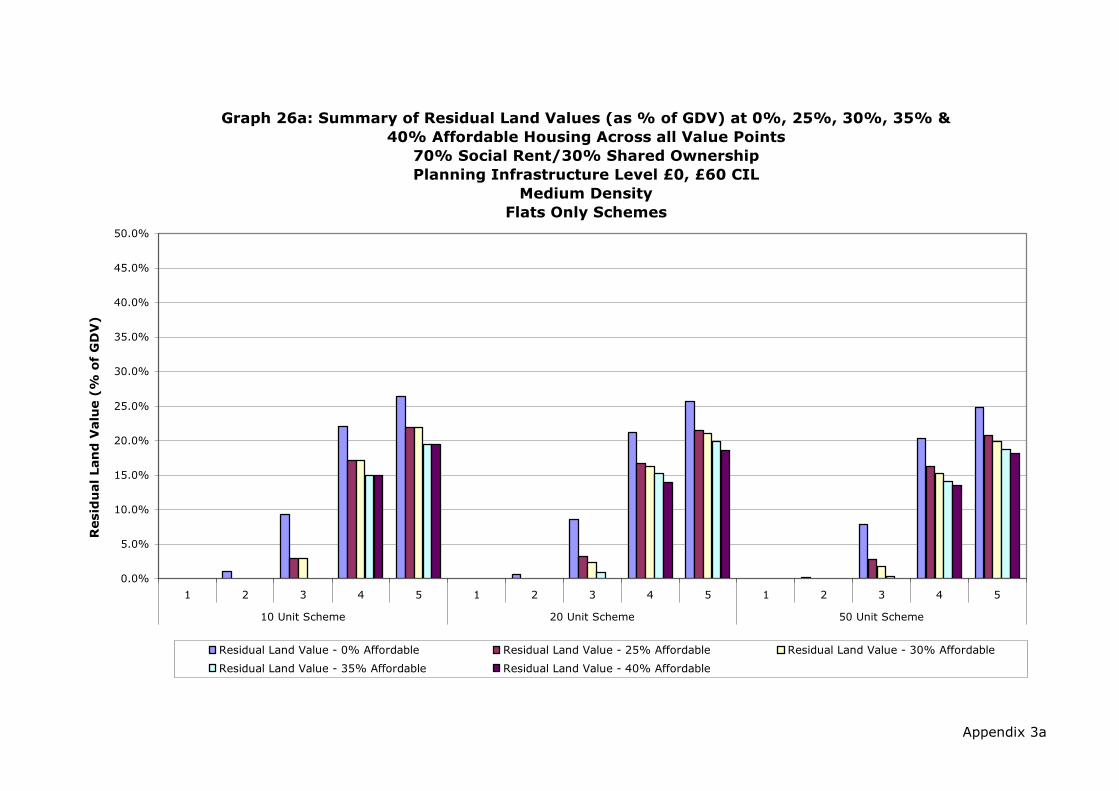
Appendix 3a
Graph 26a: Summary of Residual Land Values (as % of GDV) at 0%, 25%, 30%, 35% &
40% Affordable Housing Across all Value Points
70% Social Rent/30% Shared Ownership
Planning Infrastructure Level £0, £60 CIL
Medium Density
Flats Only Schemes
0.0%
5.0%
10.0%
15.0%
20.0%
25.0%
30.0%
35.0%
40.0%
45.0%
50.0%
1 2 3 4 5 1 2 3 4 5 1 2 3 4 5
10 Unit Scheme 20 Unit Scheme 50 Unit Scheme
Resid
ual Lan
d V
alu
e (%
o
f G
DV
)
Residual Land Value - 0% Affordable Residual Land Value - 25% Affordable Residual Land Value - 30% Affordable
Residual Land Value - 35% Affordable Residual Land Value - 40% Affordable

Development Scenario /
Threshold Value Point
Residual Land
Value - 0%
Affordable
Residual Land
Value - 25%
Affordable
Residual Land
Value - 30%
Affordable
Residual Land
Value - 35%
Affordable
Residual Land
Value - 40%
Affordable
1 £0 £0 £0 £0 £0
2 £59,245 £0 £0 £0 £0
3 £555,683 £155,037 £155,037 £0 £0
4 £1,689,652 £1,141,297 £1,141,297 £938,158 £938,158
5 £2,254,215 £1,615,112 £1,615,112 £1,341,839 £1,341,839
1 £0 £0 £0 £0 £0
2 £32,141 £0 £0 £0 £0
3 £515,123 £170,734 £126,340 £50,041 £0
4 £1,619,364 £1,136,374 £1,085,682 £987,791 £878,591
5 £2,191,674 £1,603,285 £1,546,819 £1,413,838 £1,280,858
1 £0 £0 £0 £0 £0
2 £11,226 £0 £0 £0 £0
3 £466,234 £149,690 £90,370 £13,792 £0
4 £1,554,540 £1,097,609 £1,013,585 £909,855 £848,137
5 £2,110,728 £1,557,682 £1,454,294 £1,328,956 £1,255,312
Source: Adams Integra, August 2012
10 Unit Scheme
20 Unit Scheme
50 Unit Scheme
Table 26b: Summary of Residual Land Value (value per Hectare) Appraisals
for All Value Points
0%, 25%, 30%, 35% and 40% Affordable Housing
70% Social Rent/30% Shared Ownership
Planning Infrastructure Level £0, £60 CIL
Medium Density
Flats Only Schemes
Appendix 3a

Appendix 3a
Graph 26b: Summary of Residual Land Values (value per Hectare) at 0%, 25%, 30%, 35%
& 40% Affordable Housing Across all Value Points
70% Social Rent/30% Shared Ownership
Planning Infrastructure Level £0, £60 CIL
Medium Density
Flats Only Schemes
£0
£250,000
£500,000
£750,000
£1,000,000
£1,250,000
£1,500,000
£1,750,000
£2,000,000
£2,250,000
£2,500,000
£2,750,000
£3,000,000
1 2 3 4 5 1 2 3 4 5 1 2 3 4 5
10 Unit Scheme 20 Unit Scheme 50 Unit Scheme
Resid
ual Lan
d V
alu
e (%
o
f G
DV
)
Residual Land Value - 0% Affordable Residual Land Value - 25% Affordable Residual Land Value - 30% Affordable
Residual Land Value - 35% Affordable Residual Land Value - 40% Affordable
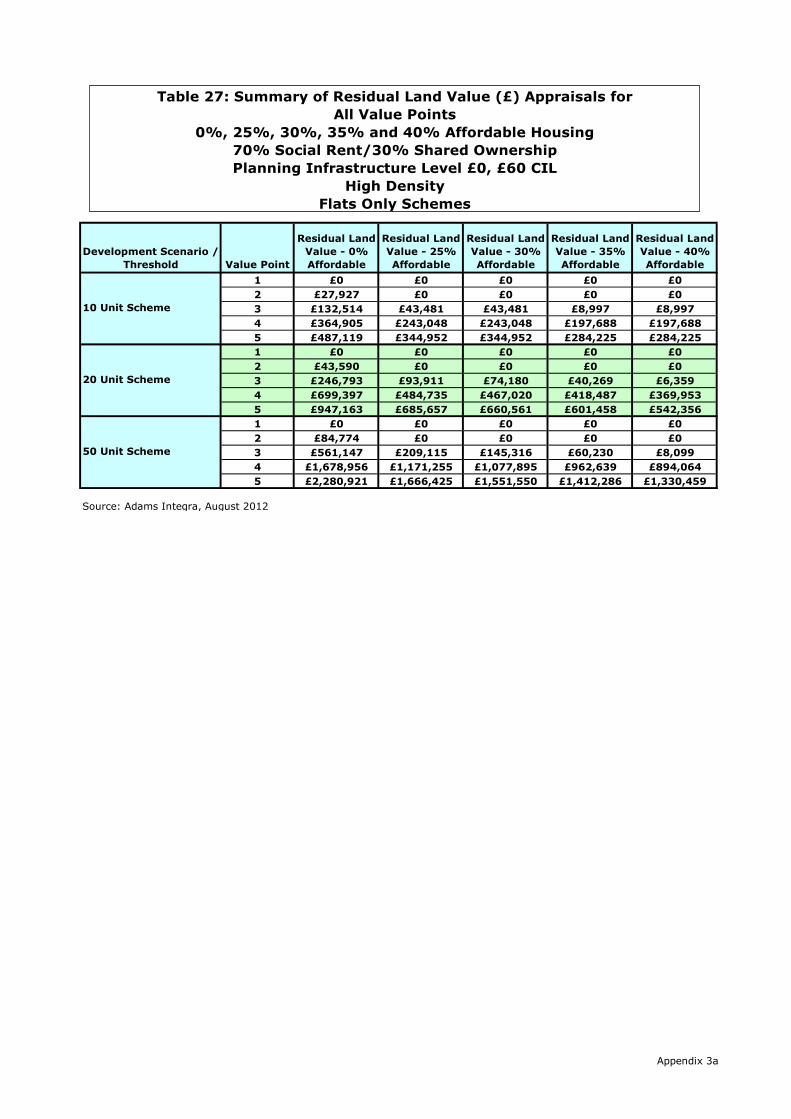
Development Scenario /
Threshold Value Point
Residual Land
Value - 0%
Affordable
Residual Land
Value - 25%
Affordable
Residual Land
Value - 30%
Affordable
Residual Land
Value - 35%
Affordable
Residual Land
Value - 40%
Affordable
1 £0 £0 £0 £0 £0
2 £27,927 £0 £0 £0 £0
3 £132,514 £43,481 £43,481 £8,997 £8,997
4 £364,905 £243,048 £243,048 £197,688 £197,688
5 £487,119 £344,952 £344,952 £284,225 £284,225
1 £0 £0 £0 £0 £0
2 £43,590 £0 £0 £0 £0
3 £246,793 £93,911 £74,180 £40,269 £6,359
4 £699,397 £484,735 £467,020 £418,487 £369,953
5 £947,163 £685,657 £660,561 £601,458 £542,356
1 £0 £0 £0 £0 £0
2 £84,774 £0 £0 £0 £0
3 £561,147 £209,115 £145,316 £60,230 £8,099
4 £1,678,956 £1,171,255 £1,077,895 £962,639 £894,064
5 £2,280,921 £1,666,425 £1,551,550 £1,412,286 £1,330,459
Source: Adams Integra, August 2012
10 Unit Scheme
20 Unit Scheme
50 Unit Scheme
Table 27: Summary of Residual Land Value (£) Appraisals for
All Value Points
0%, 25%, 30%, 35% and 40% Affordable Housing
70% Social Rent/30% Shared Ownership
Planning Infrastructure Level £0, £60 CIL
High Density
Flats Only Schemes
Appendix 3a

Appendix 3a
Graph 27: Summary of Residual Land Values at 0%, 25%, 30%, 35% & 40%
Affordable Housing Across All Value Points
70% Social Rent/30% Shared Ownership
Planning Infrastructure Level £0, £60 CIL
High Density
Flats Only Schemes
£0
£250,000
£500,000
£750,000
£1,000,000
£1,250,000
£1,500,000
£1,750,000
£2,000,000
£2,250,000
£2,500,000
£2,750,000
£3,000,000
1 2 3 4 5 1 2 3 4 5 1 2 3 4 5
10 Unit Scheme 20 Unit Scheme 50 Unit Scheme
Resid
ual Lan
d V
alu
e (£
)
Residual Land Value - 0% Affordable Residual Land Value - 25% Affordable Residual Land Value - 30% Affordable
Residual Land Value - 35% Affordable Residual Land Value - 40% Affordable

Development Scenario /
Threshold Value Point
Residual Land
Value - 0%
Affordable
Residual Land
Value - 25%
Affordable
Residual Land
Value - 30%
Affordable
Residual Land
Value - 35%
Affordable
Residual Land
Value - 40%
Affordable
1 0.0% 0.0% 0.0% 0.0% 0.0%
2 2.4% 0.0% 0.0% 0.0% 0.0%
3 10.1% 3.8% 3.8% 0.8% 0.8%
4 22.0% 16.9% 16.9% 14.6% 14.6%
5 26.4% 21.8% 21.8% 19.2% 19.2%
1 0.0% 0.0% 0.0% 0.0% 0.0%
2 1.9% 0.0% 0.0% 0.0% 0.0%
3 9.4% 4.0% 3.2% 1.8% 0.3%
4 21.1% 16.6% 16.3% 15.0% 13.7%
5 25.6% 21.2% 20.8% 19.6% 18.3%
1 0.0% 0.0% 0.0% 0.0% 0.0%
2 1.5% 0.0% 0.0% 0.0% 0.0%
3 8.6% 3.6% 2.6% 1.1% 0.1%
4 20.3% 16.0% 15.1% 13.9% 13.2%
5 24.7% 20.6% 19.7% 18.5% 17.8%
Source: Adams Integra, August 2012
10 Unit Scheme
20 Unit Scheme
50 Unit Scheme
Table 27a: Summary of Residual Land Value (as % of GDV) Appraisals for
All Value Points
0%, 25%, 30%, 35% and 40% Affordable Housing
70% Social Rent/30% Shared Ownership
Planning Infrastructure Level £0, £60 CIL
High Density
Flats Only Schemes
Appendix 3a

Appendix 3a
Graph 27a: Summary of Residual Land Values (as % of GDV) at 0%, 25%, 30%, 35% &
40% Affordable Housing Across all Value Points
70% Social Rent/30% Shared Ownership
Planning Infrastructure Level £0, £60 CIL
High Density
Flats Only Schemes
0.0%
5.0%
10.0%
15.0%
20.0%
25.0%
30.0%
35.0%
40.0%
1 2 3 4 5 1 2 3 4 5 1 2 3 4 5
10 Unit Scheme 20 Unit Scheme 50 Unit Scheme
Resid
ual Lan
d V
alu
e (%
o
f G
DV
)
Residual Land Value - 0% Affordable Residual Land Value - 25% Affordable Residual Land Value - 30% Affordable
Residual Land Value - 35% Affordable Residual Land Value - 40% Affordable

Development Scenario /
Threshold Value Point
Residual Land
Value - 0%
Affordable
Residual Land
Value - 25%
Affordable
Residual Land
Value - 30%
Affordable
Residual Land
Value - 35%
Affordable
Residual Land
Value - 40%
Affordable
1 £0 £0 £0 £0 £0
2 £139,637 £0 £0 £0 £0
3 £662,568 £217,406 £217,406 £44,986 £44,986
4 £1,824,523 £1,215,240 £1,215,240 £988,440 £988,440
5 £2,435,596 £1,724,762 £1,724,762 £1,421,125 £1,421,125
1 £0 £0 £0 £0 £0
2 £108,974 £0 £0 £0 £0
3 £616,981 £234,778 £185,451 £100,674 £15,896
4 £1,748,494 £1,211,838 £1,167,551 £1,046,217 £924,883
5 £2,367,907 £1,714,142 £1,651,402 £1,503,645 £1,355,889
1 £0 £0 £0 £0 £0
2 £84,774 £0 £0 £0 £0
3 £561,147 £209,115 £145,316 £60,230 £8,099
4 £1,678,956 £1,171,255 £1,077,895 £962,639 £894,064
5 £2,280,921 £1,666,425 £1,551,550 £1,412,286 £1,330,459
Source: Adams Integra, August 2012
10 Unit Scheme
20 Unit Scheme
50 Unit Scheme
Table 27b: Summary of Residual Land Value (value per Hectare) Appraisals
for All Value Points
0%, 25%, 30%, 35% and 40% Affordable Housing
70% Social Rent/30% Shared Ownership
Planning Infrastructure Level £0, £60 CIL
High Density
Flats Only Schemes
Appendix 3a
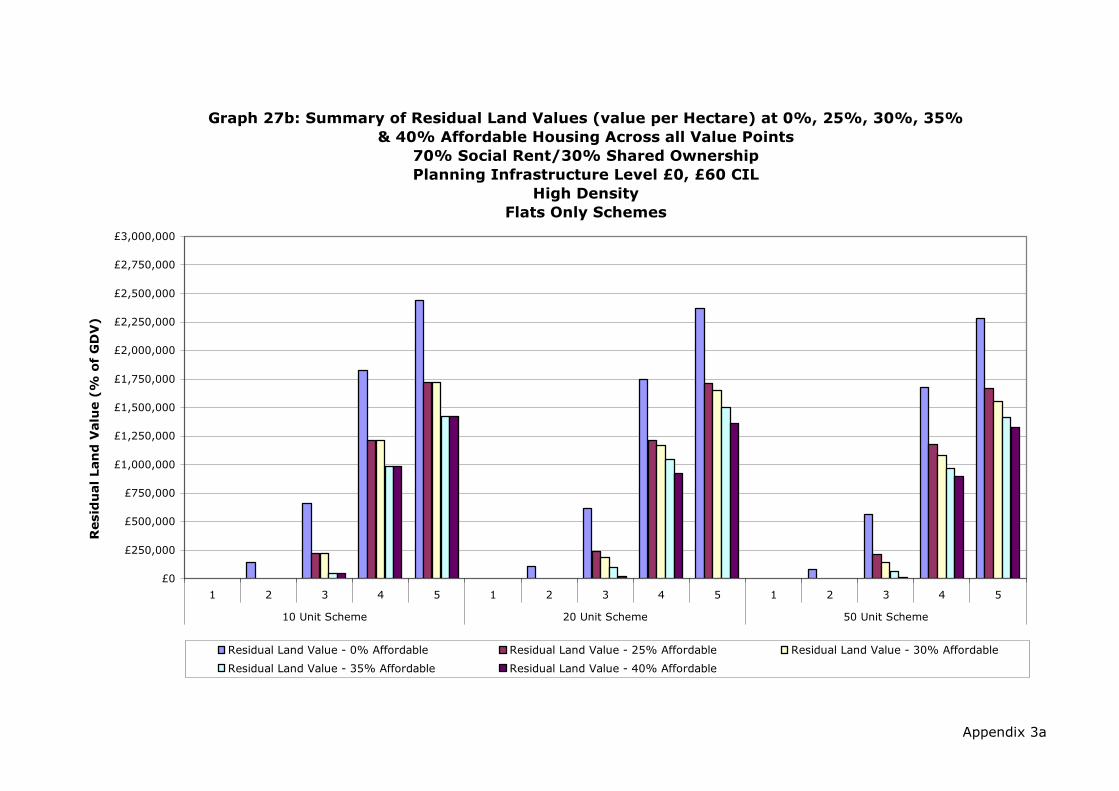
Appendix 3a
Graph 27b: Summary of Residual Land Values (value per Hectare) at 0%, 25%, 30%, 35%
& 40% Affordable Housing Across all Value Points
70% Social Rent/30% Shared Ownership
Planning Infrastructure Level £0, £60 CIL
High Density
Flats Only Schemes
£0
£250,000
£500,000
£750,000
£1,000,000
£1,250,000
£1,500,000
£1,750,000
£2,000,000
£2,250,000
£2,500,000
£2,750,000
£3,000,000
1 2 3 4 5 1 2 3 4 5 1 2 3 4 5
10 Unit Scheme 20 Unit Scheme 50 Unit Scheme
Resid
ual Lan
d V
alu
e (%
o
f G
DV
)
Residual Land Value - 0% Affordable Residual Land Value - 25% Affordable Residual Land Value - 30% Affordable
Residual Land Value - 35% Affordable Residual Land Value - 40% Affordable

Appendix 3a-i

Development Scenario /
Threshold Value Point
Residual Land
Value - 0%
Affordable
Residual Land
Value - 25%
Affordable
Residual Land
Value - 30%
Affordable
Residual Land
Value - 35%
Affordable
Residual Land
Value - 40%
Affordable
1 £0 £0 £0 £0 £0
2 £0 £0 £0 £0 £0
3 £104,457 £15,424 £15,424 £0 £0
4 £376,352 £254,495 £254,495 £209,371 £209,371
5 £505,154 £363,175 £363,175 £302,448 £302,448
1 £0 £0 £0 £0 £0
2 £0 £0 £0 £0 £0
3 £191,625 £38,186 £18,455 £0 £0
4 £721,157 £506,495 £483,965 £440,473 £391,939
5 £982,111 £720,605 £695,509 £636,407 £577,304
1 £0 £0 £0 £0 £0
2 £0 £0 £0 £0 £0
3 £433,527 £73,634 £7,723 £0 £0
4 £1,729,705 £1,222,005 £1,128,644 £1,013,389 £944,814
5 £2,363,714 £1,749,219 £1,634,344 £1,495,079 £1,413,252
Source: Adams Integra, August 2012
10 Unit Scheme
20 Unit Scheme
50 Unit Scheme
Table 28: Summary of Residual Land Value (£) Appraisals for
All Value Points
0%, 25%, 30%, 35% and 40% Affordable Housing
70% Social Rent/30% Shared Ownership
Planning Infrastructure Level £0, £80 CIL
Low Density
Flats Only Schemes
Appendix 3a-i

Appendix 3a-i
Graph 28: Summary of Residual Land Values at 0%, 25%, 30%, 35% & 40%
Affordable Housing Across All Value Points
70% Social Rent/30% Shared Ownership
Planning Infrastructure Level £0, £80 CIL
Low Density
Flats Only Schemes
£0
£250,000
£500,000
£750,000
£1,000,000
£1,250,000
£1,500,000
£1,750,000
£2,000,000
£2,250,000
£2,500,000
£2,750,000
£3,000,000
1 2 3 4 5 1 2 3 4 5 1 2 3 4 5
10 Unit Scheme 20 Unit Scheme 50 Unit Scheme
Resid
ual Lan
d V
alu
e (£
)
Residual Land Value - 0% Affordable Residual Land Value - 25% Affordable Residual Land Value - 30% Affordable
Residual Land Value - 35% Affordable Residual Land Value - 40% Affordable Residual Land Value - 40% Affordable
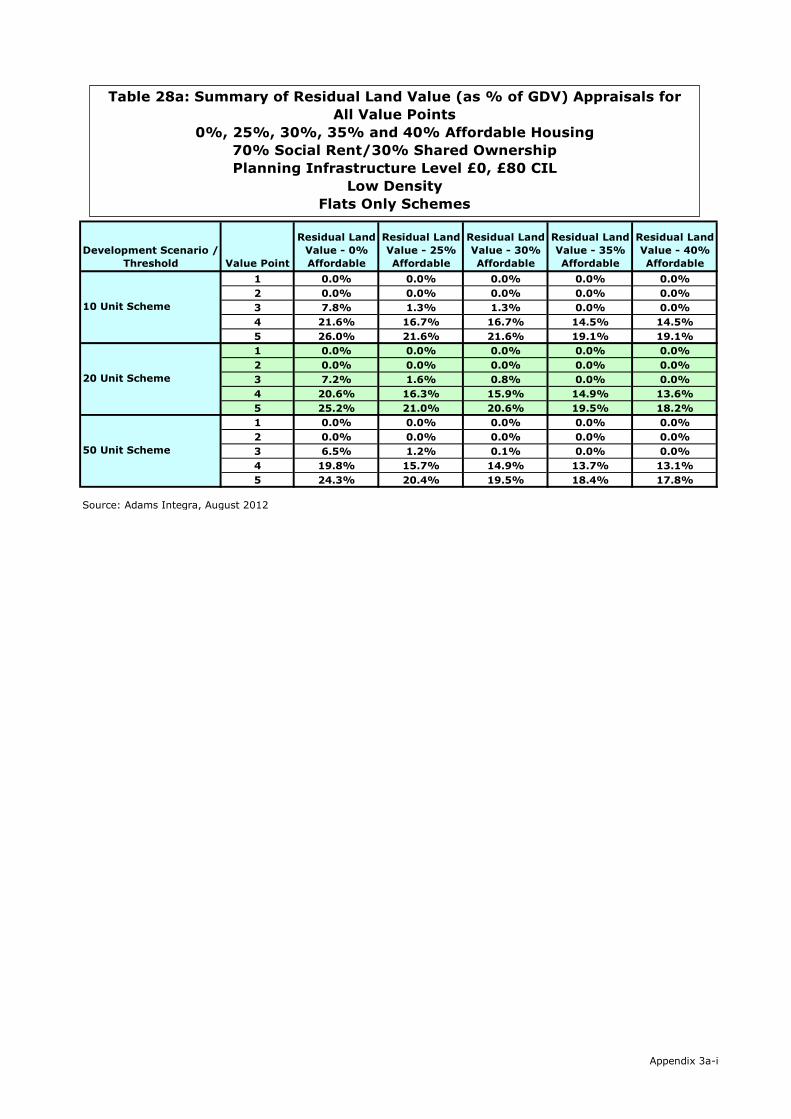
Development Scenario /
Threshold Value Point
Residual Land
Value - 0%
Affordable
Residual Land
Value - 25%
Affordable
Residual Land
Value - 30%
Affordable
Residual Land
Value - 35%
Affordable
Residual Land
Value - 40%
Affordable
1 0.0% 0.0% 0.0% 0.0% 0.0%
2 0.0% 0.0% 0.0% 0.0% 0.0%
3 7.8% 1.3% 1.3% 0.0% 0.0%
4 21.6% 16.7% 16.7% 14.5% 14.5%
5 26.0% 21.6% 21.6% 19.1% 19.1%
1 0.0% 0.0% 0.0% 0.0% 0.0%
2 0.0% 0.0% 0.0% 0.0% 0.0%
3 7.2% 1.6% 0.8% 0.0% 0.0%
4 20.6% 16.3% 15.9% 14.9% 13.6%
5 25.2% 21.0% 20.6% 19.5% 18.2%
1 0.0% 0.0% 0.0% 0.0% 0.0%
2 0.0% 0.0% 0.0% 0.0% 0.0%
3 6.5% 1.2% 0.1% 0.0% 0.0%
4 19.8% 15.7% 14.9% 13.7% 13.1%
5 24.3% 20.4% 19.5% 18.4% 17.8%
Source: Adams Integra, August 2012
10 Unit Scheme
20 Unit Scheme
50 Unit Scheme
Table 28a: Summary of Residual Land Value (as % of GDV) Appraisals for
All Value Points
0%, 25%, 30%, 35% and 40% Affordable Housing
70% Social Rent/30% Shared Ownership
Planning Infrastructure Level £0, £80 CIL
Low Density
Flats Only Schemes
Appendix 3a-i

Appendix 3a-i
Graph 28a: Summary of Residual Land Values (as % of GDV) at 0%, 25%, 30%, 35% &
40% Affordable Housing Across all Value Points
70% Social Rent/30% Shared Ownership
Planning Infrastructure Level £0, £80 CIL
Low Density
Flats Only Schemes
0.0%
5.0%
10.0%
15.0%
20.0%
25.0%
30.0%
35.0%
40.0%
1 2 3 4 5 1 2 3 4 5 1 2 3 4 5
10 Unit Scheme 20 Unit Scheme 50 Unit Scheme
Resid
ual Lan
d V
alu
e (%
o
f G
DV
)
Residual Land Value - 0% Affordable Residual Land Value - 25% Affordable Residual Land Value - 30% Affordable
Residual Land Value - 35% Affordable Residual Land Value - 40% Affordable

Development Scenario /
Threshold Value Point
Residual Land
Value - 0%
Affordable
Residual Land
Value - 25%
Affordable
Residual Land
Value - 30%
Affordable
Residual Land
Value - 35%
Affordable
Residual Land
Value - 40%
Affordable
1 £0 £0 £0 £0 £0
2 £0 £0 £0 £0 £0
3 £417,827 £61,698 £61,698 £0 £0
4 £1,505,408 £1,017,981 £1,017,981 £837,485 £837,485
5 £2,020,618 £1,452,702 £1,452,702 £1,209,792 £1,209,792
1 £0 £0 £0 £0 £0
2 £0 £0 £0 £0 £0
3 £383,249 £76,372 £36,910 £0 £0
4 £1,442,314 £1,012,989 £967,930 £880,946 £783,879
5 £1,964,222 £1,441,210 £1,391,018 £1,272,813 £1,154,608
1 £0 £0 £0 £0 £0
2 £0 £0 £0 £0 £0
3 £346,822 £58,907 £6,178 £0 £0
4 £1,383,764 £977,604 £902,916 £810,711 £755,851
5 £1,890,971 £1,399,375 £1,307,475 £1,196,063 £1,130,602
Source: Adams Integra, August 2012
10 Unit Scheme
20 Unit Scheme
50 Unit Scheme
Table 28b: Summary of Residual Land Value (value per Hectare) Appraisals
for All Value Points
0%, 25%, 30%, 35% and 40% Affordable Housing
70% Social Rent/30% Shared Ownership
Planning Infrastructure Level £0, £80 CIL
Low Density
Flats Only Schemes
Appendix 3a-i

Appendix 3a-i
Graph 28b: Summary of Residual Land Values (value per Hectare) at 0%, 25%, 30%, 35%
& 40% Affordable Housing Across all Value Points
70% Social Rent/30% Shared Ownership
Planning Infrastructure Level £0, £80 CIL
Low Density
Flats Only Schemes
£0
£250,000
£500,000
£750,000
£1,000,000
£1,250,000
£1,500,000
£1,750,000
£2,000,000
£2,250,000
£2,500,000
£2,750,000
£3,000,000
1 2 3 4 5 1 2 3 4 5 1 2 3 4 5
10 Unit Scheme 20 Unit Scheme 50 Unit Scheme
Resid
ual Lan
d V
alu
e (%
o
f G
DV
)
Residual Land Value - 0% Affordable Residual Land Value - 25% Affordable Residual Land Value - 30% Affordable
Residual Land Value - 35% Affordable Residual Land Value - 40% Affordable
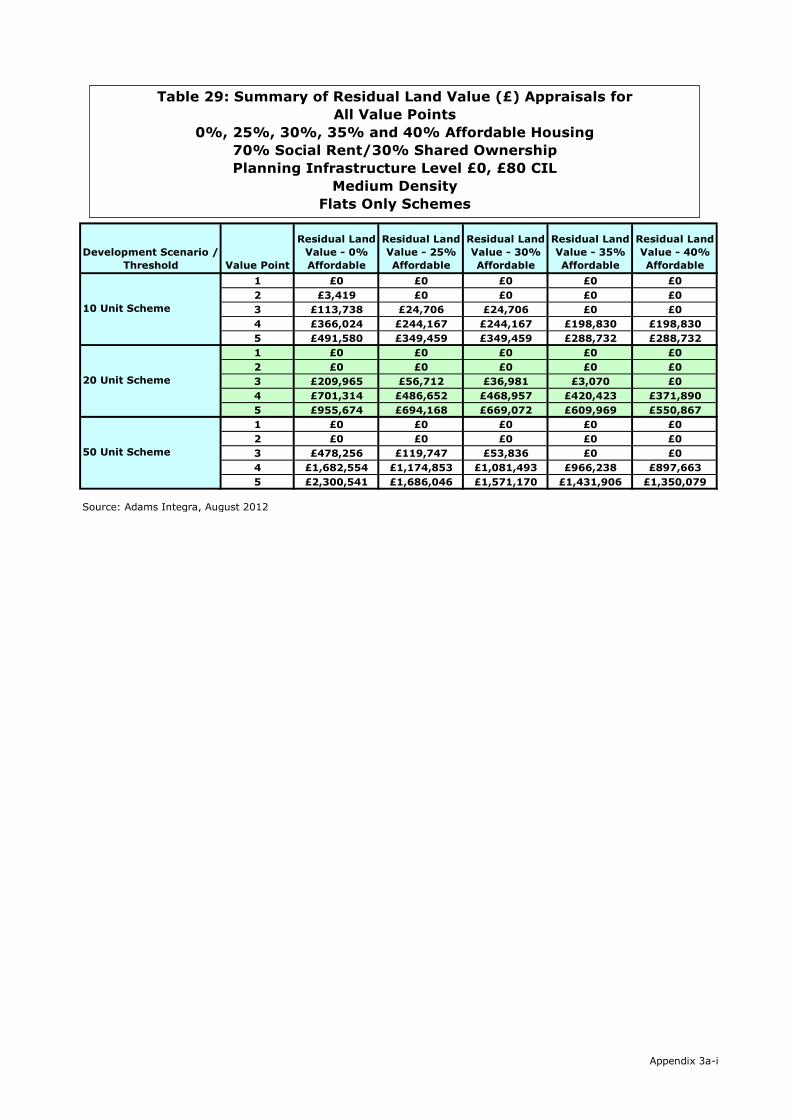
Development Scenario /
Threshold Value Point
Residual Land
Value - 0%
Affordable
Residual Land
Value - 25%
Affordable
Residual Land
Value - 30%
Affordable
Residual Land
Value - 35%
Affordable
Residual Land
Value - 40%
Affordable
1 £0 £0 £0 £0 £0
2 £3,419 £0 £0 £0 £0
3 £113,738 £24,706 £24,706 £0 £0
4 £366,024 £244,167 £244,167 £198,830 £198,830
5 £491,580 £349,459 £349,459 £288,732 £288,732
1 £0 £0 £0 £0 £0
2 £0 £0 £0 £0 £0
3 £209,965 £56,712 £36,981 £3,070 £0
4 £701,314 £486,652 £468,957 £420,423 £371,890
5 £955,674 £694,168 £669,072 £609,969 £550,867
1 £0 £0 £0 £0 £0
2 £0 £0 £0 £0 £0
3 £478,256 £119,747 £53,836 £0 £0
4 £1,682,554 £1,174,853 £1,081,493 £966,238 £897,663
5 £2,300,541 £1,686,046 £1,571,170 £1,431,906 £1,350,079
Source: Adams Integra, August 2012
10 Unit Scheme
20 Unit Scheme
50 Unit Scheme
Table 29: Summary of Residual Land Value (£) Appraisals for
All Value Points
0%, 25%, 30%, 35% and 40% Affordable Housing
70% Social Rent/30% Shared Ownership
Planning Infrastructure Level £0, £80 CIL
Medium Density
Flats Only Schemes
Appendix 3a-i
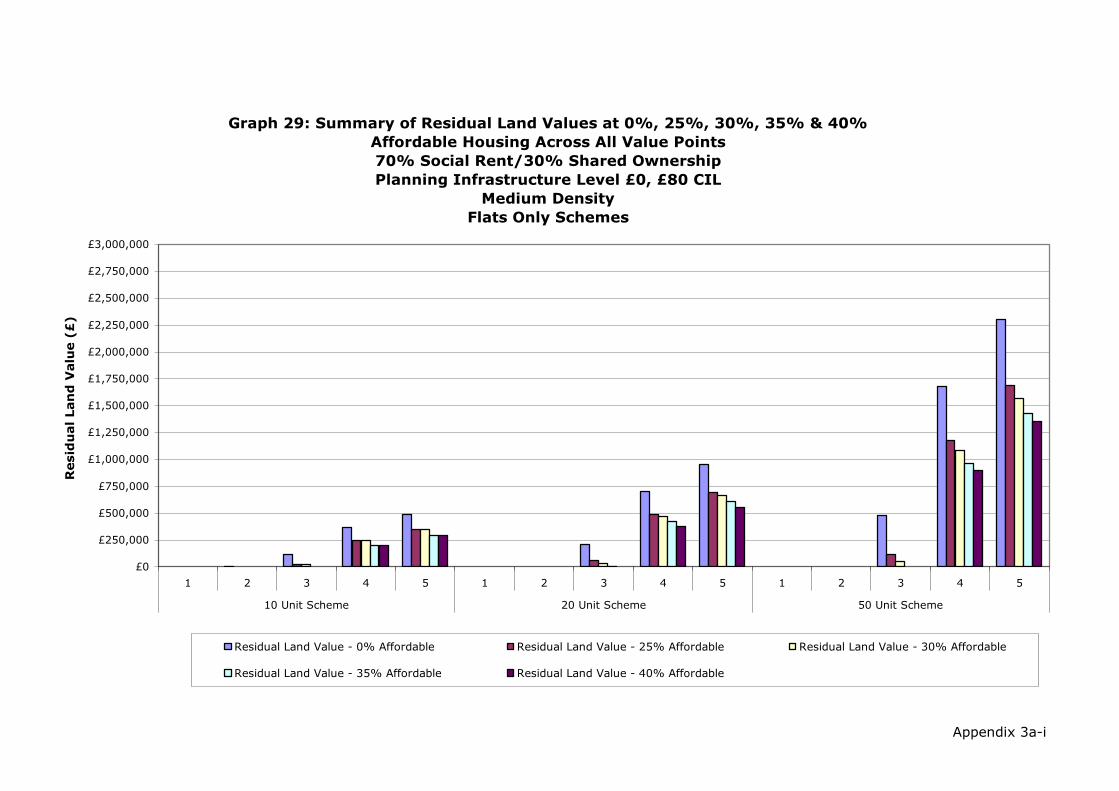
Appendix 3a-i
Graph 29: Summary of Residual Land Values at 0%, 25%, 30%, 35% & 40%
Affordable Housing Across All Value Points
70% Social Rent/30% Shared Ownership
Planning Infrastructure Level £0, £80 CIL
Medium Density
Flats Only Schemes
£0
£250,000
£500,000
£750,000
£1,000,000
£1,250,000
£1,500,000
£1,750,000
£2,000,000
£2,250,000
£2,500,000
£2,750,000
£3,000,000
1 2 3 4 5 1 2 3 4 5 1 2 3 4 5
10 Unit Scheme 20 Unit Scheme 50 Unit Scheme
Resid
ual Lan
d V
alu
e (£
)
Residual Land Value - 0% Affordable Residual Land Value - 25% Affordable Residual Land Value - 30% Affordable
Residual Land Value - 35% Affordable Residual Land Value - 40% Affordable

Development Scenario /
Threshold Value Point
Residual Land
Value - 0%
Affordable
Residual Land
Value - 25%
Affordable
Residual Land
Value - 30%
Affordable
Residual Land
Value - 35%
Affordable
Residual Land
Value - 40%
Affordable
1 0.0% 0.0% 0.0% 0.0% 0.0%
2 0.3% 0.0% 0.0% 0.0% 0.0%
3 8.6% 2.1% 2.1% 0.0% 0.0%
4 21.5% 16.5% 16.5% 14.2% 14.2%
5 25.9% 21.4% 21.4% 18.8% 18.8%
1 0.0% 0.0% 0.0% 0.0% 0.0%
2 0.0% 0.0% 0.0% 0.0% 0.0%
3 7.9% 2.4% 1.6% 0.1% 0.0%
4 20.6% 16.1% 15.8% 14.6% 13.3%
5 25.2% 20.9% 20.5% 19.3% 18.0%
1 0.0% 0.0% 0.0% 0.0% 0.0%
2 0.0% 0.0% 0.0% 0.0% 0.0%
3 7.2% 2.0% 0.9% 0.0% 0.0%
4 19.8% 15.6% 14.7% 13.5% 12.8%
5 24.3% 20.2% 19.3% 18.2% 17.5%
Source: Adams Integra, August 2012
10 Unit Scheme
20 Unit Scheme
50 Unit Scheme
Table 29a: Summary of Residual Land Value (as % of GDV) Appraisals for
All Value Points
0%, 25%, 30%, 35% and 40% Affordable Housing
70% Social Rent/30% Shared Ownership
Planning Infrastructure Level £0, £80 CIL
Medium Density
Flats Only Schemes
Appendix 3a-i

Appendix 3a-i
Graph 29a: Summary of Residual Land Values (as % of GDV) at 0%, 25%, 30%, 35% &
40% Affordable Housing Across all Value Points
70% Social Rent/30% Shared Ownership
Planning Infrastructure Level £0, £80 CIL
Medium Density
Flats Only Schemes
0.0%
5.0%
10.0%
15.0%
20.0%
25.0%
30.0%
35.0%
40.0%
45.0%
50.0%
1 2 3 4 5 1 2 3 4 5 1 2 3 4 5
10 Unit Scheme 20 Unit Scheme 50 Unit Scheme
Resid
ual Lan
d V
alu
e (%
o
f G
DV
)
Residual Land Value - 0% Affordable Residual Land Value - 25% Affordable Residual Land Value - 30% Affordable
Residual Land Value - 35% Affordable Residual Land Value - 40% Affordable

Development Scenario /
Threshold Value Point
Residual Land
Value - 0%
Affordable
Residual Land
Value - 25%
Affordable
Residual Land
Value - 30%
Affordable
Residual Land
Value - 35%
Affordable
Residual Land
Value - 40%
Affordable
1 £0 £0 £0 £0 £0
2 £15,384 £0 £0 £0 £0
3 £511,821 £111,176 £111,176 £0 £0
4 £1,647,106 £1,098,751 £1,098,751 £894,735 £894,735
5 £2,212,108 £1,572,566 £1,572,566 £1,299,293 £1,299,293
1 £0 £0 £0 £0 £0
2 £0 £0 £0 £0 £0
3 £472,422 £127,602 £83,208 £6,908 £0
4 £1,577,957 £1,094,967 £1,055,153 £945,953 £836,752
5 £2,150,266 £1,561,878 £1,505,412 £1,372,431 £1,239,450
1 £0 £0 £0 £0 £0
2 £0 £0 £0 £0 £0
3 £430,431 £107,772 £48,452 £0 £0
4 £1,514,299 £1,057,368 £973,344 £869,614 £807,897
5 £2,070,487 £1,517,441 £1,414,053 £1,288,715 £1,215,071
Source: Adams Integra, August 2012
10 Unit Scheme
20 Unit Scheme
50 Unit Scheme
Table 29b: Summary of Residual Land Value (value per Hectare) Appraisals
for All Value Points
0%, 25%, 30%, 35% and 40% Affordable Housing
70% Social Rent/30% Shared Ownership
Planning Infrastructure Level £0, £80 CIL
Medium Density
Flats Only Schemes
Appendix 3a-i

Appendix 3a-i
Graph 29b: Summary of Residual Land Values (value per Hectare) at 0%, 25%, 30%, 35%
& 40% Affordable Housing Across all Value Points
70% Social Rent/30% Shared Ownership
Planning Infrastructure Level £0, £80 CIL
Medium Density
Flats Only Schemes
£0
£250,000
£500,000
£750,000
£1,000,000
£1,250,000
£1,500,000
£1,750,000
£2,000,000
£2,250,000
£2,500,000
£2,750,000
£3,000,000
1 2 3 4 5 1 2 3 4 5 1 2 3 4 5
10 Unit Scheme 20 Unit Scheme 50 Unit Scheme
Resid
ual Lan
d V
alu
e (%
o
f G
DV
)
Residual Land Value - 0% Affordable Residual Land Value - 25% Affordable Residual Land Value - 30% Affordable
Residual Land Value - 35% Affordable Residual Land Value - 40% Affordable

Development Scenario /
Threshold Value Point
Residual Land
Value - 0%
Affordable
Residual Land
Value - 25%
Affordable
Residual Land
Value - 30%
Affordable
Residual Land
Value - 35%
Affordable
Residual Land
Value - 40%
Affordable
1 £0 £0 £0 £0 £0
2 £18,433 £0 £0 £0 £0
3 £123,019 £33,987 £33,987 £0 £0
4 £355,695 £238,660 £238,660 £188,289 £188,289
5 £482,984 £335,743 £335,743 £275,015 £275,015
1 £0 £0 £0 £0 £0
2 £24,917 £0 £0 £0 £0
3 £228,306 £75,238 £55,507 £21,596 £0
4 £681,471 £471,672 £448,907 £400,374 £351,841
5 £929,237 £667,731 £642,635 £583,532 £524,430
1 £0 £0 £0 £0 £0
2 £39,407 £0 £0 £0 £0
3 £517,594 £165,860 £99,949 £14,862 £0
4 £1,635,403 £1,127,702 £1,034,342 £919,087 £850,511
5 £2,237,368 £1,622,872 £1,507,997 £1,368,733 £1,286,906
Source: Adams Integra, August 2012
10 Unit Scheme
20 Unit Scheme
50 Unit Scheme
Table 30: Summary of Residual Land Value (£) Appraisals for
All Value Points
0%, 25%, 30%, 35% and 40% Affordable Housing
70% Social Rent/30% Shared Ownership
Planning Infrastructure Level £0, £80 CIL
High Density
Flats Only Schemes
Appendix 3a-i
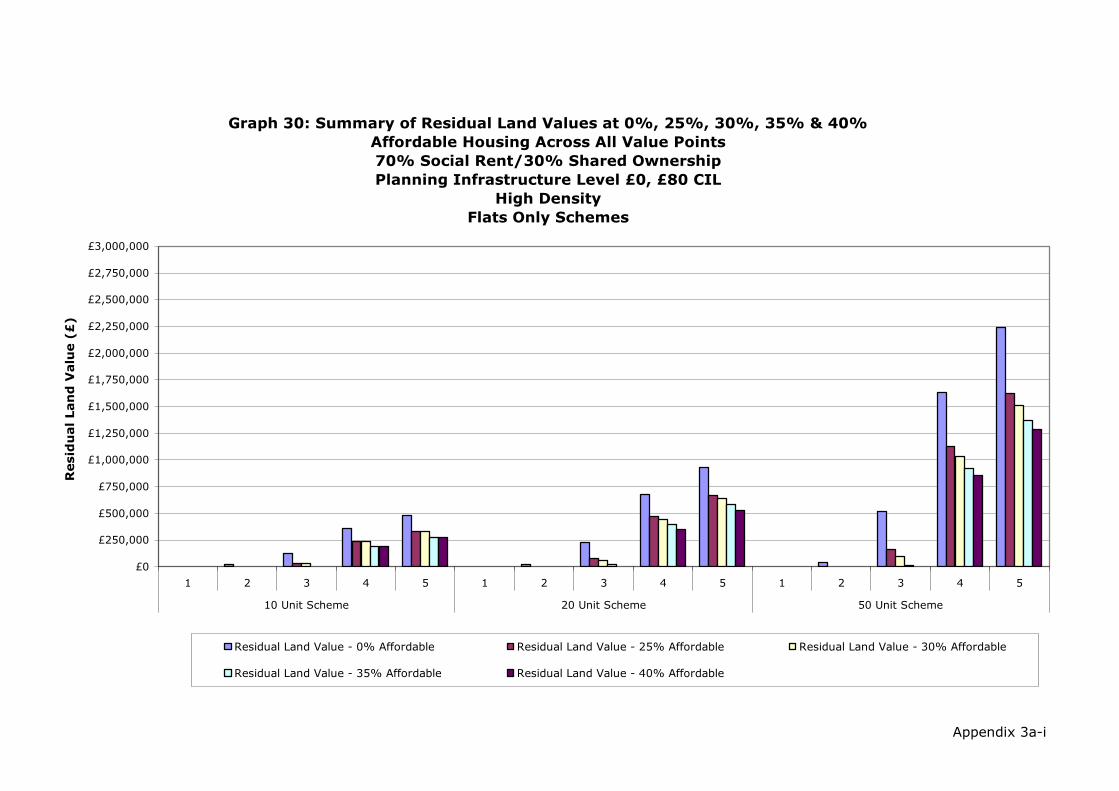
Appendix 3a-i
Graph 30: Summary of Residual Land Values at 0%, 25%, 30%, 35% & 40%
Affordable Housing Across All Value Points
70% Social Rent/30% Shared Ownership
Planning Infrastructure Level £0, £80 CIL
High Density
Flats Only Schemes
£0
£250,000
£500,000
£750,000
£1,000,000
£1,250,000
£1,500,000
£1,750,000
£2,000,000
£2,250,000
£2,500,000
£2,750,000
£3,000,000
1 2 3 4 5 1 2 3 4 5 1 2 3 4 5
10 Unit Scheme 20 Unit Scheme 50 Unit Scheme
Resid
ual Lan
d V
alu
e (£
)
Residual Land Value - 0% Affordable Residual Land Value - 25% Affordable Residual Land Value - 30% Affordable
Residual Land Value - 35% Affordable Residual Land Value - 40% Affordable

Development Scenario /
Threshold Value Point
Residual Land
Value - 0%
Affordable
Residual Land
Value - 25%
Affordable
Residual Land
Value - 30%
Affordable
Residual Land
Value - 35%
Affordable
Residual Land
Value - 40%
Affordable
1 0.0% 0.0% 0.0% 0.0% 0.0%
2 1.6% 0.0% 0.0% 0.0% 0.0%
3 9.4% 3.0% 3.0% 0.0% 0.0%
4 21.5% 16.6% 16.6% 13.9% 13.9%
5 26.2% 21.2% 21.2% 18.5% 18.5%
1 0.0% 0.0% 0.0% 0.0% 0.0%
2 1.1% 0.0% 0.0% 0.0% 0.0%
3 8.7% 3.2% 2.4% 1.0% 0.0%
4 20.6% 16.1% 15.6% 14.4% 13.0%
5 25.2% 20.7% 20.3% 19.0% 17.7%
1 0.0% 0.0% 0.0% 0.0% 0.0%
2 0.7% 0.0% 0.0% 0.0% 0.0%
3 7.9% 2.9% 1.8% 0.3% 0.0%
4 19.7% 15.4% 14.5% 13.3% 12.5%
5 24.2% 20.1% 19.1% 18.0% 17.2%
Source: Adams Integra, August 2012
10 Unit Scheme
20 Unit Scheme
50 Unit Scheme
Table 30a: Summary of Residual Land Value (as % of GDV) Appraisals for
All Value Points
0%, 25%, 30%, 35% and 40% Affordable Housing
70% Social Rent/30% Shared Ownership
Planning Infrastructure Level £0, £80 CIL
High Density
Flats Only Schemes
Appendix 3a-i
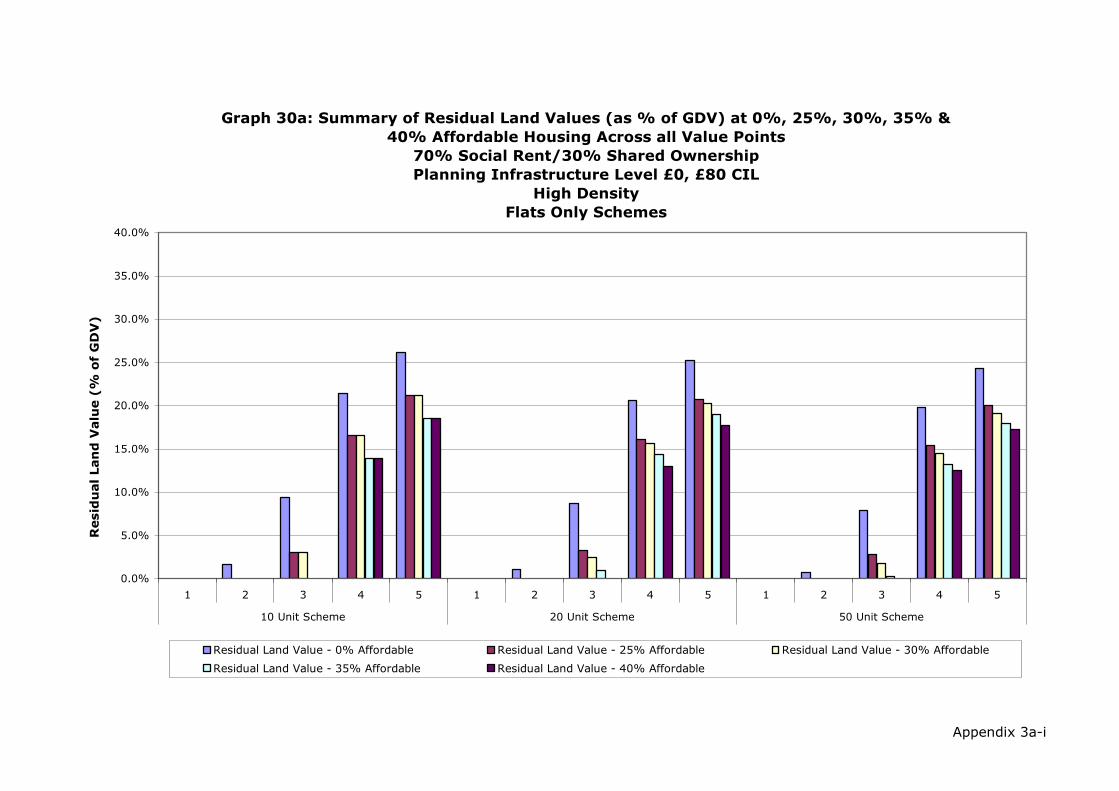
Appendix 3a-i
Graph 30a: Summary of Residual Land Values (as % of GDV) at 0%, 25%, 30%, 35% &
40% Affordable Housing Across all Value Points
70% Social Rent/30% Shared Ownership
Planning Infrastructure Level £0, £80 CIL
High Density
Flats Only Schemes
0.0%
5.0%
10.0%
15.0%
20.0%
25.0%
30.0%
35.0%
40.0%
1 2 3 4 5 1 2 3 4 5 1 2 3 4 5
10 Unit Scheme 20 Unit Scheme 50 Unit Scheme
Resid
ual Lan
d V
alu
e (%
o
f G
DV
)
Residual Land Value - 0% Affordable Residual Land Value - 25% Affordable Residual Land Value - 30% Affordable
Residual Land Value - 35% Affordable Residual Land Value - 40% Affordable

Development Scenario /
Threshold Value Point
Residual Land
Value - 0%
Affordable
Residual Land
Value - 25%
Affordable
Residual Land
Value - 30%
Affordable
Residual Land
Value - 35%
Affordable
Residual Land
Value - 40%
Affordable
1 £0 £0 £0 £0 £0
2 £92,165 £0 £0 £0 £0
3 £615,096 £169,935 £169,935 £0 £0
4 £1,778,476 £1,193,300 £1,193,300 £941,443 £941,443
5 £2,414,919 £1,678,714 £1,678,714 £1,375,077 £1,375,077
1 £0 £0 £0 £0 £0
2 £62,291 £0 £0 £0 £0
3 £570,766 £188,095 £138,768 £53,991 £0
4 £1,703,678 £1,179,180 £1,122,269 £1,000,935 £879,601
5 £2,323,092 £1,669,327 £1,606,586 £1,458,830 £1,311,074
1 £0 £0 £0 £0 £0
2 £39,407 £0 £0 £0 £0
3 £517,594 £165,860 £99,949 £14,862 £0
4 £1,635,403 £1,127,702 £1,034,342 £919,087 £850,511
5 £2,237,368 £1,622,872 £1,507,997 £1,368,733 £1,286,906
Source: Adams Integra, August 2012
10 Unit Scheme
20 Unit Scheme
50 Unit Scheme
Table 30b: Summary of Residual Land Value (value per Hectare) Appraisals
for All Value Points
0%, 25%, 30%, 35% and 40% Affordable Housing
70% Social Rent/30% Shared Ownership
Planning Infrastructure Level £0, £80 CIL
High Density
Flats Only Schemes
Appendix 3a-i

Appendix 3a-i
Graph 30b: Summary of Residual Land Values (value per Hectare) at 0%, 25%, 30%, 35%
& 40% Affordable Housing Across all Value Points
70% Social Rent/30% Shared Ownership
Planning Infrastructure Level £0, £80 CIL
High Density
Flats Only Schemes
£0
£250,000
£500,000
£750,000
£1,000,000
£1,250,000
£1,500,000
£1,750,000
£2,000,000
£2,250,000
£2,500,000
£2,750,000
£3,000,000
1 2 3 4 5 1 2 3 4 5 1 2 3 4 5
10 Unit Scheme 20 Unit Scheme 50 Unit Scheme
Resid
ual Lan
d V
alu
e (%
o
f G
DV
)
Residual Land Value - 0% Affordable Residual Land Value - 25% Affordable Residual Land Value - 30% Affordable
Residual Land Value - 35% Affordable Residual Land Value - 40% Affordable

Development Scenario /
Threshold Value Point
Residual Land
Value - 0%
Affordable
Residual Land
Value - 25%
Affordable
Residual Land
Value - 30%
Affordable
Residual Land
Value - 35%
Affordable
Residual Land
Value - 40%
Affordable
1 £0 £0 £0 £0 £0
2 £0 £0 £0 £0 £0
3 £94,457 £5,425 £5,425 £0 £0
4 £366,652 £244,796 £244,796 £199,472 £199,472
5 £495,555 £353,476 £353,476 £292,748 £292,748
1 £0 £0 £0 £0 £0
2 £0 £0 £0 £0 £0
3 £173,893 £18,519 £0 £0 £0
4 £702,277 £487,614 £469,929 £421,396 £372,862
5 £963,231 £701,725 £676,629 £617,526 £558,424
1 £0 £0 £0 £0 £0
2 £0 £0 £0 £0 £0
3 £387,178 £25,852 £0 £0 £0
4 £1,683,834 £1,176,133 £1,082,773 £967,518 £898,943
5 £2,317,843 £1,703,348 £1,588,473 £1,449,208 £1,367,381
Source: Adams Integra, August 2012
10 Unit Scheme
20 Unit Scheme
50 Unit Scheme
Table 31: Summary of Residual Land Value (£) Appraisals for
All Value Points
0%, 25%, 30%, 35% and 40% Affordable Housing
70% Social Rent/30% Shared Ownership
Planning Infrastructure Level £0, £100 CIL
Low Density
Flats Only Schemes
Appendix 3a-i

Appendix 3a-i
Graph 31: Summary of Residual Land Values at 0%, 25%, 30%, 35% & 40%
Affordable Housing Across All Value Points
70% Social Rent/30% Shared Ownership
Planning Infrastructure Level £0, £100 CIL
Low Density
Flats Only Schemes
£0
£250,000
£500,000
£750,000
£1,000,000
£1,250,000
£1,500,000
£1,750,000
£2,000,000
£2,250,000
£2,500,000
£2,750,000
£3,000,000
1 2 3 4 5 1 2 3 4 5 1 2 3 4 5
10 Unit Scheme 20 Unit Scheme 50 Unit Scheme
Resid
ual Lan
d V
alu
e (£
)
Residual Land Value - 0% Affordable Residual Land Value - 25% Affordable Residual Land Value - 30% Affordable
Residual Land Value - 35% Affordable Residual Land Value - 40% Affordable Residual Land Value - 40% Affordable

Development Scenario /
Threshold Value Point
Residual Land
Value - 0%
Affordable
Residual Land
Value - 25%
Affordable
Residual Land
Value - 30%
Affordable
Residual Land
Value - 35%
Affordable
Residual Land
Value - 40%
Affordable
1 0.0% 0.0% 0.0% 0.0% 0.0%
2 0.0% 0.0% 0.0% 0.0% 0.0%
3 7.1% 0.5% 0.5% 0.0% 0.0%
4 21.0% 16.1% 16.1% 13.9% 13.9%
5 25.5% 21.0% 21.0% 18.5% 18.5%
1 0.0% 0.0% 0.0% 0.0% 0.0%
2 0.0% 0.0% 0.0% 0.0% 0.0%
3 6.5% 0.8% 0.0% 0.0% 0.0%
4 20.1% 15.7% 15.4% 14.2% 12.9%
5 24.8% 20.5% 20.1% 18.9% 17.6%
1 0.0% 0.0% 0.0% 0.0% 0.0%
2 0.0% 0.0% 0.0% 0.0% 0.0%
3 5.8% 0.4% 0.0% 0.0% 0.0%
4 19.3% 15.2% 14.3% 13.1% 12.4%
5 23.8% 19.9% 19.0% 17.9% 17.2%
Source: Adams Integra, August 2012
10 Unit Scheme
20 Unit Scheme
50 Unit Scheme
Table 31a: Summary of Residual Land Value (as % of GDV) Appraisals for
All Value Points
0%, 25%, 30%, 35% and 40% Affordable Housing
70% Social Rent/30% Shared Ownership
Planning Infrastructure Level £0, £100 CIL
Low Density
Flats Only Schemes
Appendix 3a-i
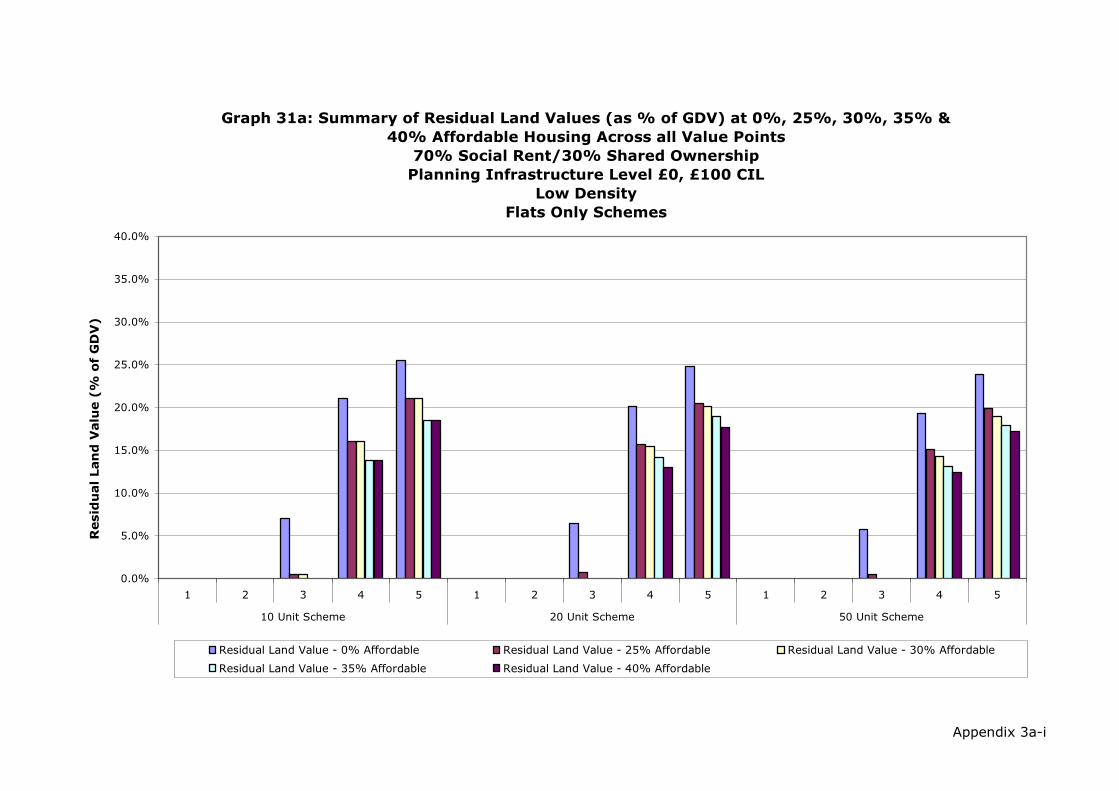
Appendix 3a-i
Graph 31a: Summary of Residual Land Values (as % of GDV) at 0%, 25%, 30%, 35% &
40% Affordable Housing Across all Value Points
70% Social Rent/30% Shared Ownership
Planning Infrastructure Level £0, £100 CIL
Low Density
Flats Only Schemes
0.0%
5.0%
10.0%
15.0%
20.0%
25.0%
30.0%
35.0%
40.0%
1 2 3 4 5 1 2 3 4 5 1 2 3 4 5
10 Unit Scheme 20 Unit Scheme 50 Unit Scheme
Resid
ual Lan
d V
alu
e (%
o
f G
DV
)
Residual Land Value - 0% Affordable Residual Land Value - 25% Affordable Residual Land Value - 30% Affordable
Residual Land Value - 35% Affordable Residual Land Value - 40% Affordable

Development Scenario /
Threshold Value Point
Residual Land
Value - 0%
Affordable
Residual Land
Value - 25%
Affordable
Residual Land
Value - 30%
Affordable
Residual Land
Value - 35%
Affordable
Residual Land
Value - 40%
Affordable
1 £0 £0 £0 £0 £0
2 £0 £0 £0 £0 £0
3 £377,828 £21,699 £21,699 £0 £0
4 £1,466,609 £979,183 £979,183 £797,887 £797,887
5 £1,982,219 £1,413,903 £1,413,903 £1,170,993 £1,170,993
1 £0 £0 £0 £0 £0
2 £0 £0 £0 £0 £0
3 £347,786 £37,038 £0 £0 £0
4 £1,404,553 £975,229 £939,859 £842,792 £745,725
5 £1,926,462 £1,403,450 £1,353,257 £1,235,053 £1,116,848
1 £0 £0 £0 £0 £0
2 £0 £0 £0 £0 £0
3 £309,742 £20,681 £0 £0 £0
4 £1,347,067 £940,907 £866,219 £774,014 £719,154
5 £1,854,274 £1,362,678 £1,270,778 £1,159,366 £1,093,905
Source: Adams Integra, August 2012
10 Unit Scheme
20 Unit Scheme
50 Unit Scheme
Table 31b: Summary of Residual Land Value (value per Hectare) Appraisals
for All Value Points
0%, 25%, 30%, 35% and 40% Affordable Housing
70% Social Rent/30% Shared Ownership
Planning Infrastructure Level £0, £100 CIL
Low Density
Flats Only Schemes
Appendix 3a-i
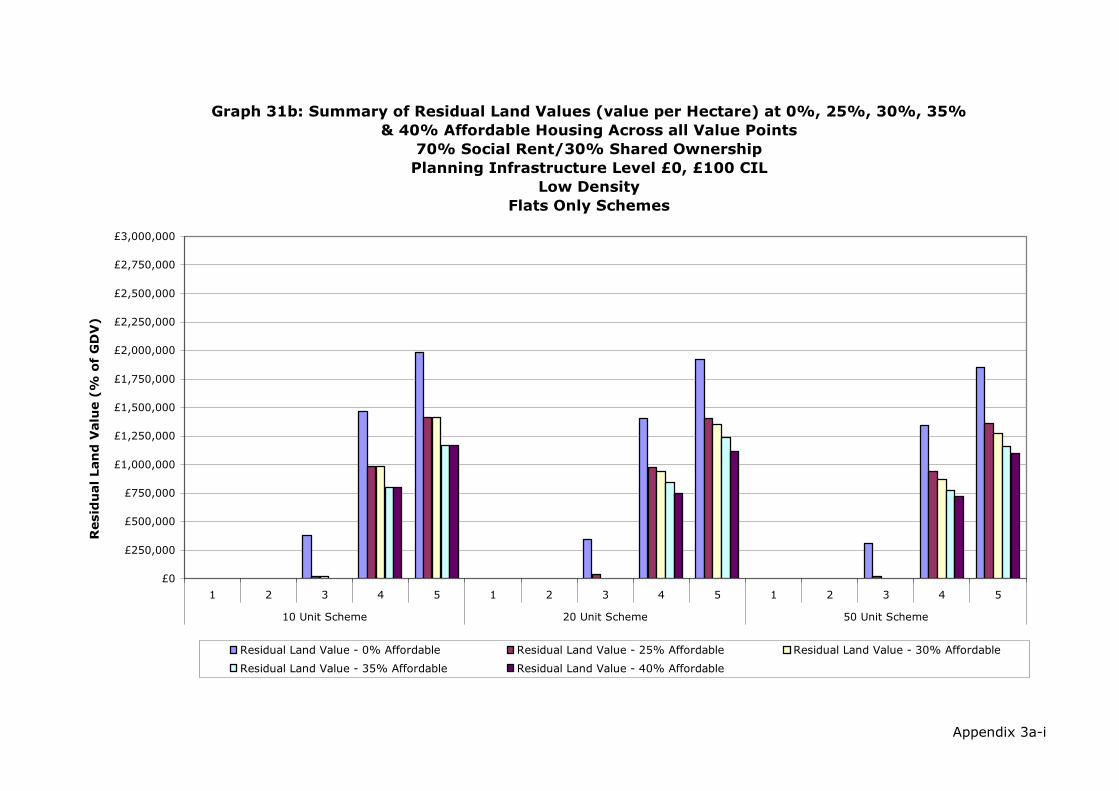
Appendix 3a-i
Graph 31b: Summary of Residual Land Values (value per Hectare) at 0%, 25%, 30%, 35%
& 40% Affordable Housing Across all Value Points
70% Social Rent/30% Shared Ownership
Planning Infrastructure Level £0, £100 CIL
Low Density
Flats Only Schemes
£0
£250,000
£500,000
£750,000
£1,000,000
£1,250,000
£1,500,000
£1,750,000
£2,000,000
£2,250,000
£2,500,000
£2,750,000
£3,000,000
1 2 3 4 5 1 2 3 4 5 1 2 3 4 5
10 Unit Scheme 20 Unit Scheme 50 Unit Scheme
Resid
ual Lan
d V
alu
e (%
o
f G
DV
)
Residual Land Value - 0% Affordable Residual Land Value - 25% Affordable Residual Land Value - 30% Affordable
Residual Land Value - 35% Affordable Residual Land Value - 40% Affordable

Development Scenario /
Threshold Value Point
Residual Land
Value - 0%
Affordable
Residual Land
Value - 25%
Affordable
Residual Land
Value - 30%
Affordable
Residual Land
Value - 35%
Affordable
Residual Land
Value - 40%
Affordable
1 £0 £0 £0 £0 £0
2 £0 £0 £0 £0 £0
3 £103,991 £14,959 £14,959 £0 £0
4 £356,569 £239,552 £239,552 £189,180 £189,180
5 £482,222 £340,005 £340,005 £279,277 £279,277
1 £0 £0 £0 £0 £0
2 £0 £0 £0 £0 £0
3 £190,987 £37,542 £17,811 £0 £0
4 £682,911 £473,126 £450,362 £401,829 £353,295
5 £937,271 £675,765 £650,669 £591,566 £532,464
1 £0 £0 £0 £0 £0
2 £0 £0 £0 £0 £0
3 £433,079 £73,172 £7,261 £0 £0
4 £1,637,842 £1,130,141 £1,036,781 £921,526 £852,951
5 £2,255,829 £1,641,334 £1,526,458 £1,387,194 £1,305,367
Source: Adams Integra, August 2012
10 Unit Scheme
20 Unit Scheme
50 Unit Scheme
Table 32: Summary of Residual Land Value (£) Appraisals for
All Value Points
0%, 25%, 30%, 35% and 40% Affordable Housing
70% Social Rent/30% Shared Ownership
Planning Infrastructure Level £0, £100 CIL
Medium Density
Flats Only Schemes
Appendix 3a-i

Appendix 3a-i
Graph 32: Summary of Residual Land Values at 0%, 25%, 30%, 35% & 40%
Affordable Housing Across All Value Points
70% Social Rent/30% Shared Ownership
Planning Infrastructure Level £0, £100 CIL
Medium Density
Flats Only Schemes
£0
£250,000
£500,000
£750,000
£1,000,000
£1,250,000
£1,500,000
£1,750,000
£2,000,000
£2,250,000
£2,500,000
£2,750,000
£3,000,000
1 2 3 4 5 1 2 3 4 5 1 2 3 4 5
10 Unit Scheme 20 Unit Scheme 50 Unit Scheme
Resid
ual Lan
d V
alu
e (£
)
Residual Land Value - 0% Affordable Residual Land Value - 25% Affordable Residual Land Value - 30% Affordable
Residual Land Value - 35% Affordable Residual Land Value - 40% Affordable
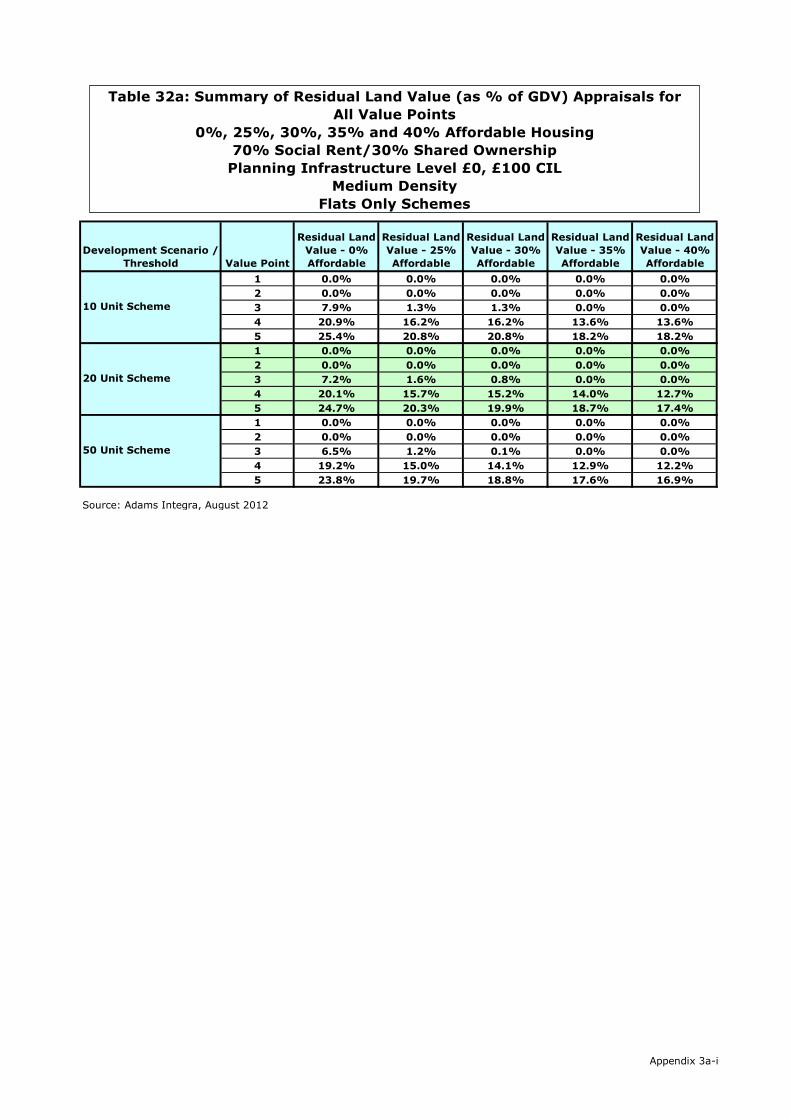
Development Scenario /
Threshold Value Point
Residual Land
Value - 0%
Affordable
Residual Land
Value - 25%
Affordable
Residual Land
Value - 30%
Affordable
Residual Land
Value - 35%
Affordable
Residual Land
Value - 40%
Affordable
1 0.0% 0.0% 0.0% 0.0% 0.0%
2 0.0% 0.0% 0.0% 0.0% 0.0%
3 7.9% 1.3% 1.3% 0.0% 0.0%
4 20.9% 16.2% 16.2% 13.6% 13.6%
5 25.4% 20.8% 20.8% 18.2% 18.2%
1 0.0% 0.0% 0.0% 0.0% 0.0%
2 0.0% 0.0% 0.0% 0.0% 0.0%
3 7.2% 1.6% 0.8% 0.0% 0.0%
4 20.1% 15.7% 15.2% 14.0% 12.7%
5 24.7% 20.3% 19.9% 18.7% 17.4%
1 0.0% 0.0% 0.0% 0.0% 0.0%
2 0.0% 0.0% 0.0% 0.0% 0.0%
3 6.5% 1.2% 0.1% 0.0% 0.0%
4 19.2% 15.0% 14.1% 12.9% 12.2%
5 23.8% 19.7% 18.8% 17.6% 16.9%
Source: Adams Integra, August 2012
10 Unit Scheme
20 Unit Scheme
50 Unit Scheme
Table 32a: Summary of Residual Land Value (as % of GDV) Appraisals for
All Value Points
0%, 25%, 30%, 35% and 40% Affordable Housing
70% Social Rent/30% Shared Ownership
Planning Infrastructure Level £0, £100 CIL
Medium Density
Flats Only Schemes
Appendix 3a-i
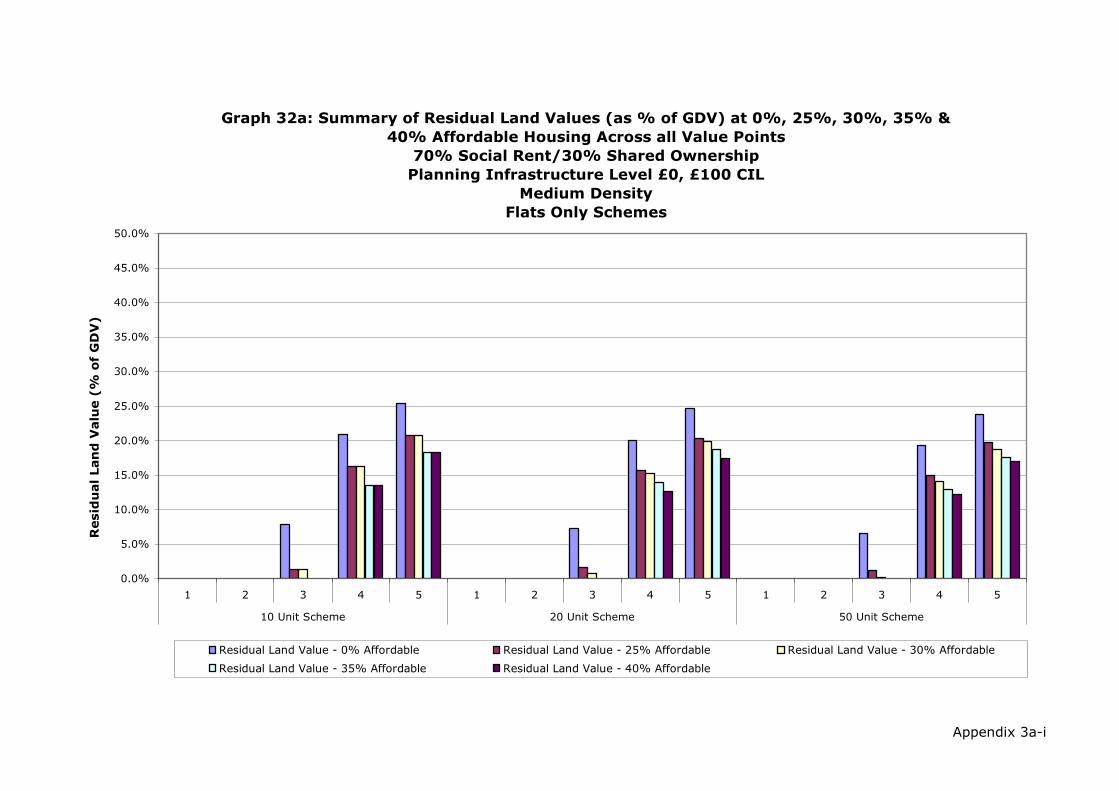
Appendix 3a-i
Graph 32a: Summary of Residual Land Values (as % of GDV) at 0%, 25%, 30%, 35% &
40% Affordable Housing Across all Value Points
70% Social Rent/30% Shared Ownership
Planning Infrastructure Level £0, £100 CIL
Medium Density
Flats Only Schemes
0.0%
5.0%
10.0%
15.0%
20.0%
25.0%
30.0%
35.0%
40.0%
45.0%
50.0%
1 2 3 4 5 1 2 3 4 5 1 2 3 4 5
10 Unit Scheme 20 Unit Scheme 50 Unit Scheme
Resid
ual Lan
d V
alu
e (%
o
f G
DV
)
Residual Land Value - 0% Affordable Residual Land Value - 25% Affordable Residual Land Value - 30% Affordable
Residual Land Value - 35% Affordable Residual Land Value - 40% Affordable

Development Scenario /
Threshold Value Point
Residual Land
Value - 0%
Affordable
Residual Land
Value - 25%
Affordable
Residual Land
Value - 30%
Affordable
Residual Land
Value - 35%
Affordable
Residual Land
Value - 40%
Affordable
1 £0 £0 £0 £0 £0
2 £0 £0 £0 £0 £0
3 £467,960 £67,314 £67,314 £0 £0
4 £1,604,560 £1,077,983 £1,077,983 £851,312 £851,312
5 £2,170,001 £1,530,021 £1,530,021 £1,256,747 £1,256,747
1 £0 £0 £0 £0 £0
2 £0 £0 £0 £0 £0
3 £429,721 £84,469 £40,075 £0 £0
4 £1,536,550 £1,064,534 £1,013,314 £904,114 £794,914
5 £2,108,859 £1,520,471 £1,464,004 £1,331,024 £1,198,043
1 £0 £0 £0 £0 £0
2 £0 £0 £0 £0 £0
3 £389,771 £65,855 £6,535 £0 £0
4 £1,474,058 £1,017,127 £933,103 £829,373 £767,656
5 £2,030,246 £1,477,200 £1,373,813 £1,248,475 £1,174,831
Source: Adams Integra, August 2012
10 Unit Scheme
20 Unit Scheme
50 Unit Scheme
Table 32b: Summary of Residual Land Value (value per Hectare) Appraisals
for All Value Points
0%, 25%, 30%, 35% and 40% Affordable Housing
70% Social Rent/30% Shared Ownership
Planning Infrastructure Level £0, £100 CIL
Medium Density
Flats Only Schemes
Appendix 3a-i

Appendix 3a-i
Graph 32b: Summary of Residual Land Values (value per Hectare) at 0%, 25%, 30%, 35%
& 40% Affordable Housing Across all Value Points
70% Social Rent/30% Shared Ownership
Planning Infrastructure Level £0, £100 CIL
Medium Density
Flats Only Schemes
£0
£250,000
£500,000
£750,000
£1,000,000
£1,250,000
£1,500,000
£1,750,000
£2,000,000
£2,250,000
£2,500,000
£2,750,000
£3,000,000
1 2 3 4 5 1 2 3 4 5 1 2 3 4 5
10 Unit Scheme 20 Unit Scheme 50 Unit Scheme
Resid
ual Lan
d V
alu
e (%
o
f G
DV
)
Residual Land Value - 0% Affordable Residual Land Value - 25% Affordable Residual Land Value - 30% Affordable
Residual Land Value - 35% Affordable Residual Land Value - 40% Affordable

Development Scenario /
Threshold Value Point
Residual Land
Value - 0%
Affordable
Residual Land
Value - 25%
Affordable
Residual Land
Value - 30%
Affordable
Residual Land
Value - 35%
Affordable
Residual Land
Value - 40%
Affordable
1 £0 £0 £0 £0 £0
2 £8,939 £0 £0 £0 £0
3 £113,525 £24,493 £24,493 £0 £0
4 £346,486 £229,261 £229,261 £178,889 £178,889
5 £473,774 £326,533 £326,533 £265,806 £265,806
1 £0 £0 £0 £0 £0
2 £6,244 £0 £0 £0 £0
3 £209,820 £56,565 £36,834 £2,923 £0
4 £663,545 £453,559 £430,795 £382,261 £333,728
5 £911,311 £649,805 £624,708 £565,606 £506,504
1 £0 £0 £0 £0 £0
2 £0 £0 £0 £0 £0
3 £478,979 £120,493 £54,581 £0 £0
4 £1,591,850 £1,084,149 £990,789 £875,534 £806,959
5 £2,193,815 £1,579,320 £1,464,444 £1,325,180 £1,243,353
Source: Adams Integra, August 2012
10 Unit Scheme
20 Unit Scheme
50 Unit Scheme
Table 33: Summary of Residual Land Value (£) Appraisals for
All Value Points
0%, 25%, 30%, 35% and 40% Affordable Housing
70% Social Rent/30% Shared Ownership
Planning Infrastructure Level £0, £100 CIL
High Density
Flats Only Schemes
Appendix 3a-i
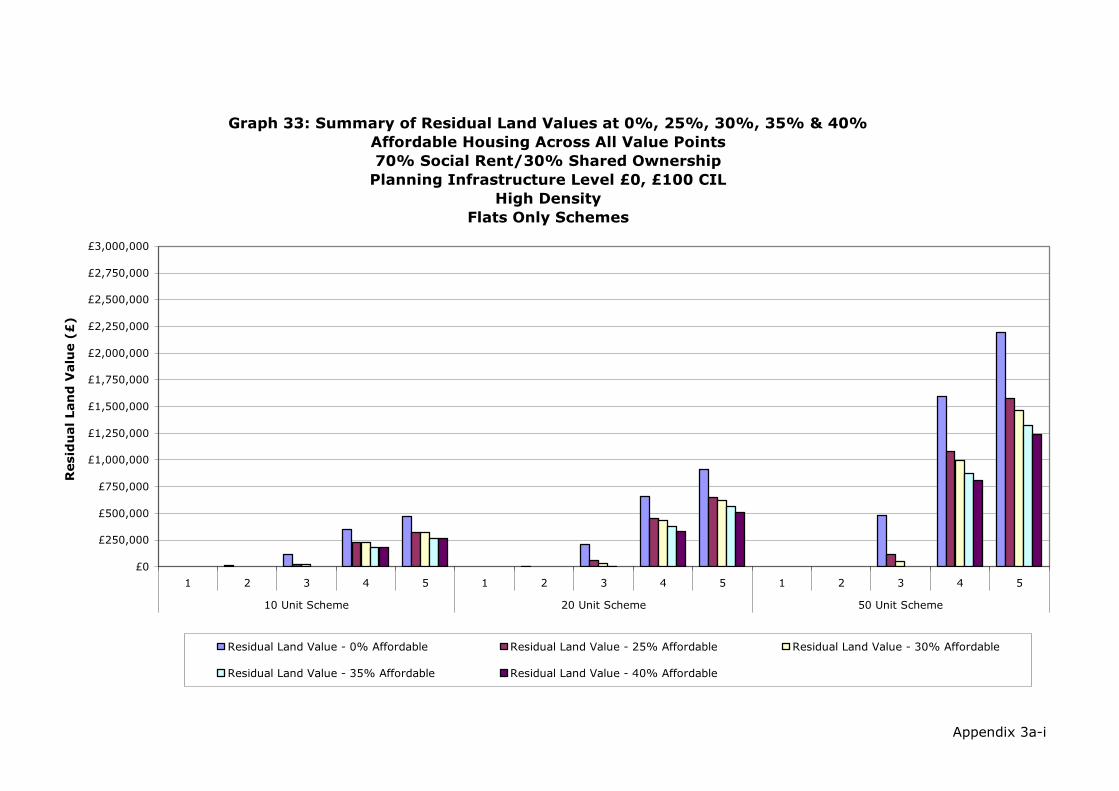
Appendix 3a-i
Graph 33: Summary of Residual Land Values at 0%, 25%, 30%, 35% & 40%
Affordable Housing Across All Value Points
70% Social Rent/30% Shared Ownership
Planning Infrastructure Level £0, £100 CIL
High Density
Flats Only Schemes
£0
£250,000
£500,000
£750,000
£1,000,000
£1,250,000
£1,500,000
£1,750,000
£2,000,000
£2,250,000
£2,500,000
£2,750,000
£3,000,000
1 2 3 4 5 1 2 3 4 5 1 2 3 4 5
10 Unit Scheme 20 Unit Scheme 50 Unit Scheme
Resid
ual Lan
d V
alu
e (£
)
Residual Land Value - 0% Affordable Residual Land Value - 25% Affordable Residual Land Value - 30% Affordable
Residual Land Value - 35% Affordable Residual Land Value - 40% Affordable

Development Scenario /
Threshold Value Point
Residual Land
Value - 0%
Affordable
Residual Land
Value - 25%
Affordable
Residual Land
Value - 30%
Affordable
Residual Land
Value - 35%
Affordable
Residual Land
Value - 40%
Affordable
1 0.0% 0.0% 0.0% 0.0% 0.0%
2 0.8% 0.0% 0.0% 0.0% 0.0%
3 8.7% 2.1% 2.1% 0.0% 0.0%
4 20.9% 16.0% 16.0% 13.2% 13.2%
5 25.7% 20.6% 20.6% 17.9% 17.9%
1 0.0% 0.0% 0.0% 0.0% 0.0%
2 0.3% 0.0% 0.0% 0.0% 0.0%
3 8.0% 2.4% 1.6% 0.1% 0.0%
4 20.0% 15.5% 15.0% 13.7% 12.3%
5 24.7% 20.1% 19.7% 18.4% 17.1%
1 0.0% 0.0% 0.0% 0.0% 0.0%
2 0.0% 0.0% 0.0% 0.0% 0.0%
3 7.3% 2.1% 1.0% 0.0% 0.0%
4 19.2% 14.8% 13.9% 12.6% 11.9%
5 23.8% 19.5% 18.6% 17.4% 16.7%
Source: Adams Integra, August 2012
10 Unit Scheme
20 Unit Scheme
50 Unit Scheme
Table 33a: Summary of Residual Land Value (as % of GDV) Appraisals for
All Value Points
0%, 25%, 30%, 35% and 40% Affordable Housing
70% Social Rent/30% Shared Ownership
Planning Infrastructure Level £0, £100 CIL
High Density
Flats Only Schemes
Appendix 3a-i

Appendix 3a-i
Graph 33a: Summary of Residual Land Values (as % of GDV) at 0%, 25%, 30%, 35% &
40% Affordable Housing Across all Value Points
70% Social Rent/30% Shared Ownership
Planning Infrastructure Level £0, £100 CIL
High Density
Flats Only Schemes
0.0%
5.0%
10.0%
15.0%
20.0%
25.0%
30.0%
35.0%
40.0%
1 2 3 4 5 1 2 3 4 5 1 2 3 4 5
10 Unit Scheme 20 Unit Scheme 50 Unit Scheme
Resid
ual Lan
d V
alu
e (%
o
f G
DV
)
Residual Land Value - 0% Affordable Residual Land Value - 25% Affordable Residual Land Value - 30% Affordable
Residual Land Value - 35% Affordable Residual Land Value - 40% Affordable

Development Scenario /
Threshold Value Point
Residual Land
Value - 0%
Affordable
Residual Land
Value - 25%
Affordable
Residual Land
Value - 30%
Affordable
Residual Land
Value - 35%
Affordable
Residual Land
Value - 40%
Affordable
1 £0 £0 £0 £0 £0
2 £44,694 £0 £0 £0 £0
3 £567,625 £122,463 £122,463 £0 £0
4 £1,732,429 £1,146,303 £1,146,303 £894,446 £894,446
5 £2,368,872 £1,632,667 £1,632,667 £1,329,030 £1,329,030
1 £0 £0 £0 £0 £0
2 £15,609 £0 £0 £0 £0
3 £524,550 £141,413 £92,086 £7,309 £0
4 £1,658,863 £1,133,898 £1,076,987 £955,653 £834,319
5 £2,278,277 £1,624,512 £1,561,771 £1,414,015 £1,266,259
1 £0 £0 £0 £0 £0
2 £0 £0 £0 £0 £0
3 £478,979 £120,493 £54,581 £0 £0
4 £1,591,850 £1,084,149 £990,789 £875,534 £806,959
5 £2,193,815 £1,579,320 £1,464,444 £1,325,180 £1,243,353
Source: Adams Integra, August 2012
10 Unit Scheme
20 Unit Scheme
50 Unit Scheme
Table 33b: Summary of Residual Land Value (value per Hectare) Appraisals
for All Value Points
0%, 25%, 30%, 35% and 40% Affordable Housing
70% Social Rent/30% Shared Ownership
Planning Infrastructure Level £0, £100 CIL
High Density
Flats Only Schemes
Appendix 3a-i

Appendix 3a-i
Graph 33b: Summary of Residual Land Values (value per Hectare) at 0%, 25%, 30%, 35%
& 40% Affordable Housing Across all Value Points
70% Social Rent/30% Shared Ownership
Planning Infrastructure Level £0, £100 CIL
High Density
Flats Only Schemes
£0
£250,000
£500,000
£750,000
£1,000,000
£1,250,000
£1,500,000
£1,750,000
£2,000,000
£2,250,000
£2,500,000
£2,750,000
£3,000,000
1 2 3 4 5 1 2 3 4 5 1 2 3 4 5
10 Unit Scheme 20 Unit Scheme 50 Unit Scheme
Resid
ual Lan
d V
alu
e (%
o
f G
DV
)
Residual Land Value - 0% Affordable Residual Land Value - 25% Affordable Residual Land Value - 30% Affordable
Residual Land Value - 35% Affordable Residual Land Value - 40% Affordable

Appendix 3b
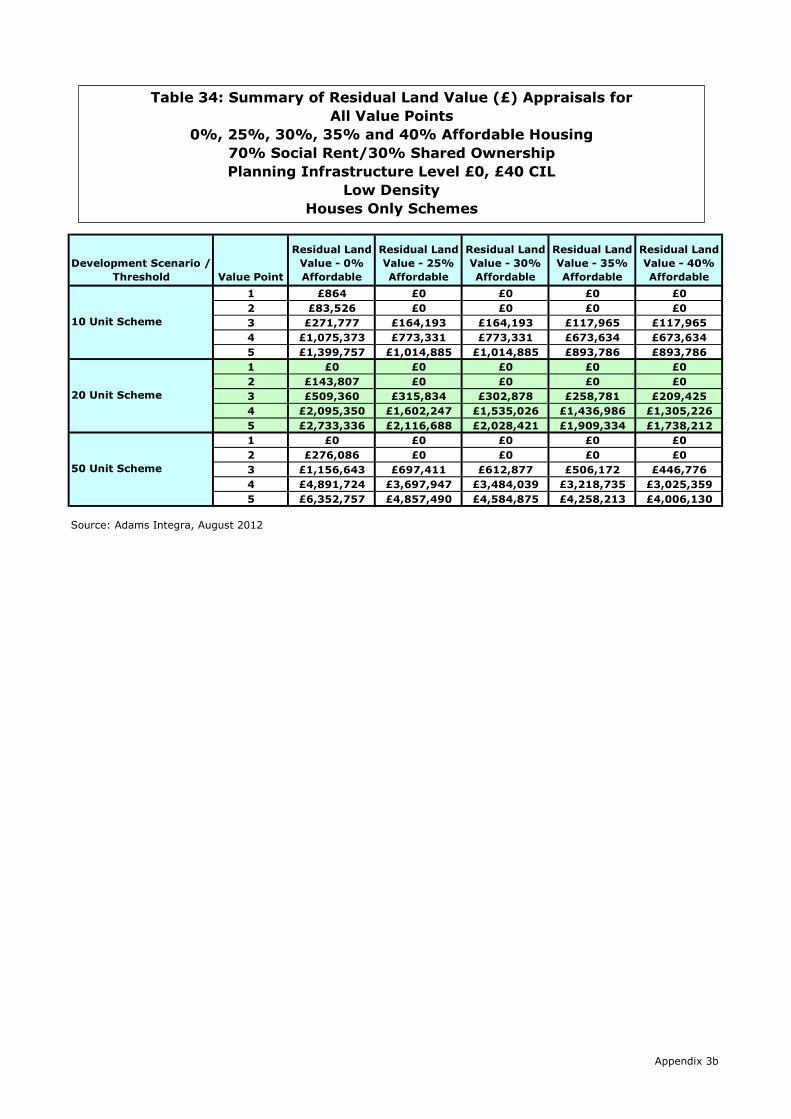
Development Scenario /
Threshold Value Point
Residual Land
Value - 0%
Affordable
Residual Land
Value - 25%
Affordable
Residual Land
Value - 30%
Affordable
Residual Land
Value - 35%
Affordable
Residual Land
Value - 40%
Affordable
1 £864 £0 £0 £0 £0
2 £83,526 £0 £0 £0 £0
3 £271,777 £164,193 £164,193 £117,965 £117,965
4 £1,075,373 £773,331 £773,331 £673,634 £673,634
5 £1,399,757 £1,014,885 £1,014,885 £893,786 £893,786
1 £0 £0 £0 £0 £0
2 £143,807 £0 £0 £0 £0
3 £509,360 £315,834 £302,878 £258,781 £209,425
4 £2,095,350 £1,602,247 £1,535,026 £1,436,986 £1,305,226
5 £2,733,336 £2,116,688 £2,028,421 £1,909,334 £1,738,212
1 £0 £0 £0 £0 £0
2 £276,086 £0 £0 £0 £0
3 £1,156,643 £697,411 £612,877 £506,172 £446,776
4 £4,891,724 £3,697,947 £3,484,039 £3,218,735 £3,025,359
5 £6,352,757 £4,857,490 £4,584,875 £4,258,213 £4,006,130
Source: Adams Integra, August 2012
10 Unit Scheme
20 Unit Scheme
50 Unit Scheme
Table 34: Summary of Residual Land Value (£) Appraisals for
All Value Points
0%, 25%, 30%, 35% and 40% Affordable Housing
70% Social Rent/30% Shared Ownership
Planning Infrastructure Level £0, £40 CIL
Low Density
Houses Only Schemes
Appendix 3b

Appendix 3b
Graph 34: Summary of Residual Land Values at 0%, 25%, 30%, 35% & 40%
Affordable Housing Across All Value Points
70% Social Rent/30% Shared Ownership
Planning Infrastructure Level £0, £40 CIL
Low Density
Houses Only Schemes
£0
£500,000
£1,000,000
£1,500,000
£2,000,000
£2,500,000
£3,000,000
£3,500,000
£4,000,000
£4,500,000
£5,000,000
£5,500,000
£6,000,000
£6,500,000
£7,000,000
£7,500,000
1 2 3 4 5 1 2 3 4 5 1 2 3 4 5
10 Unit Scheme 20 Unit Scheme 50 Unit Scheme
Resid
ual Lan
d V
alu
e (£
)
Residual Land Value - 0% Affordable Residual Land Value - 25% Affordable Residual Land Value - 30% Affordable
Residual Land Value - 35% Affordable Residual Land Value - 40% Affordable Residual Land Value - 40% Affordable
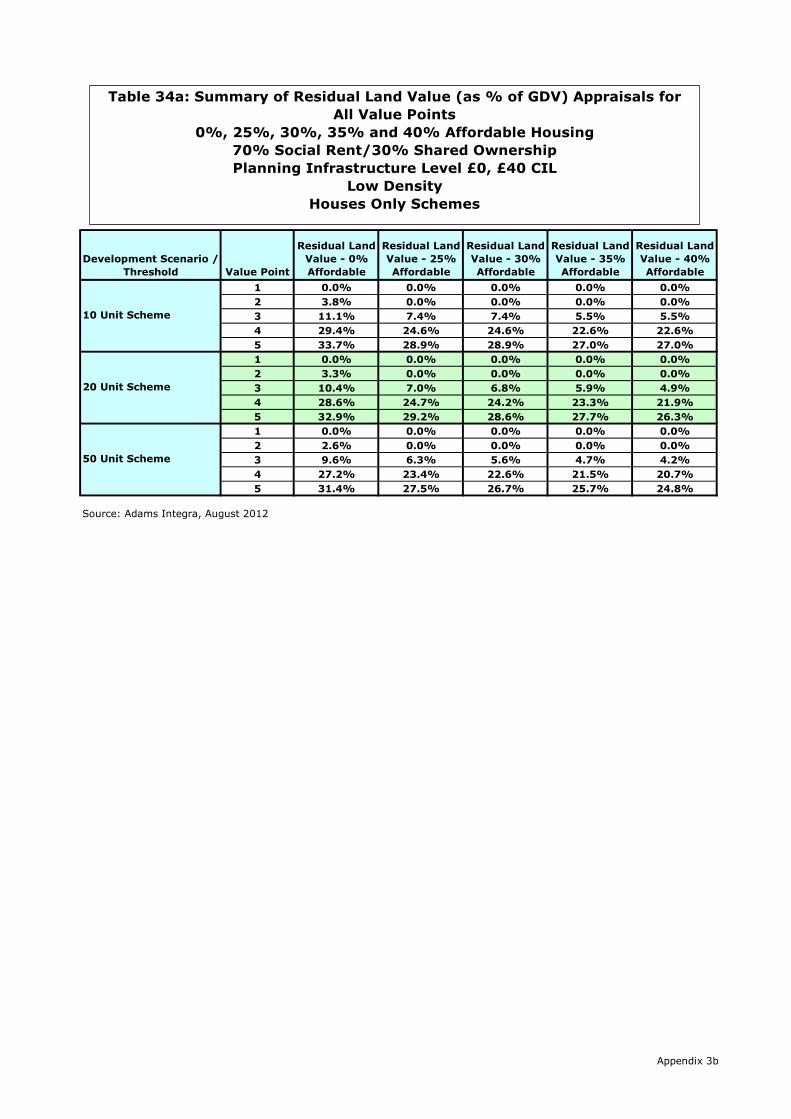
Development Scenario /
Threshold Value Point
Residual Land
Value - 0%
Affordable
Residual Land
Value - 25%
Affordable
Residual Land
Value - 30%
Affordable
Residual Land
Value - 35%
Affordable
Residual Land
Value - 40%
Affordable
1 0.0% 0.0% 0.0% 0.0% 0.0%
2 3.8% 0.0% 0.0% 0.0% 0.0%
3 11.1% 7.4% 7.4% 5.5% 5.5%
4 29.4% 24.6% 24.6% 22.6% 22.6%
5 33.7% 28.9% 28.9% 27.0% 27.0%
1 0.0% 0.0% 0.0% 0.0% 0.0%
2 3.3% 0.0% 0.0% 0.0% 0.0%
3 10.4% 7.0% 6.8% 5.9% 4.9%
4 28.6% 24.7% 24.2% 23.3% 21.9%
5 32.9% 29.2% 28.6% 27.7% 26.3%
1 0.0% 0.0% 0.0% 0.0% 0.0%
2 2.6% 0.0% 0.0% 0.0% 0.0%
3 9.6% 6.3% 5.6% 4.7% 4.2%
4 27.2% 23.4% 22.6% 21.5% 20.7%
5 31.4% 27.5% 26.7% 25.7% 24.8%
Source: Adams Integra, August 2012
10 Unit Scheme
20 Unit Scheme
50 Unit Scheme
Table 34a: Summary of Residual Land Value (as % of GDV) Appraisals for
All Value Points
0%, 25%, 30%, 35% and 40% Affordable Housing
70% Social Rent/30% Shared Ownership
Planning Infrastructure Level £0, £40 CIL
Low Density
Houses Only Schemes
Appendix 3b

Appendix 3b
Graph 34a: Summary of Residual Land Values (as % of GDV) at 0%, 25%, 30%, 35% &
40% Affordable Housing Across all Value Points
70% Social Rent/30% Shared Ownership
Planning Infrastructure Level £0, £40 CIL
Low Density
Houses Only Schemes
0.0%
5.0%
10.0%
15.0%
20.0%
25.0%
30.0%
35.0%
40.0%
1 2 3 4 5 1 2 3 4 5 1 2 3 4 5
10 Unit Scheme 20 Unit Scheme 50 Unit Scheme
Resid
ual Lan
d V
alu
e (%
o
f G
DV
)
Residual Land Value - 0% Affordable Residual Land Value - 25% Affordable Residual Land Value - 30% Affordable
Residual Land Value - 35% Affordable Residual Land Value - 40% Affordable

Development Scenario /
Threshold Value Point
Residual Land
Value - 0%
Affordable
Residual Land
Value - 25%
Affordable
Residual Land
Value - 30%
Affordable
Residual Land
Value - 35%
Affordable
Residual Land
Value - 40%
Affordable
1 £3,457 £0 £0 £0 £0
2 £334,103 £0 £0 £0 £0
3 £1,087,108 £656,773 £656,773 £471,860 £471,860
4 £4,301,491 £3,093,325 £3,093,325 £2,694,535 £2,694,535
5 £5,599,029 £4,059,540 £4,059,540 £3,575,144 £3,575,144
1 £0 £0 £0 £0 £0
2 £287,613 £0 £0 £0 £0
3 £1,018,720 £631,668 £605,755 £517,563 £418,850
4 £4,190,700 £3,204,495 £3,070,052 £2,873,971 £2,610,452
5 £5,466,671 £4,233,376 £4,056,841 £3,818,669 £3,476,425
1 £0 £0 £0 £0 £0
2 £220,869 £0 £0 £0 £0
3 £925,314 £557,929 £490,301 £404,938 £357,421
4 £3,913,380 £2,958,358 £2,787,231 £2,574,988 £2,420,287
5 £5,082,206 £3,885,992 £3,667,900 £3,406,570 £3,204,904
Source: Adams Integra, August 2012
10 Unit Scheme
20 Unit Scheme
50 Unit Scheme
Table 34b: Summary of Residual Land Value (value per Hectare) Appraisals
for All Value Points
0%, 25%, 30%, 35% and 40% Affordable Housing
70% Social Rent/30% Shared Ownership
Planning Infrastructure Level £0, £40 CIL
Low Density
Houses Only Schemes
Appendix 3b

Appendix 3b
Graph 34b: Summary of Residual Land Values (value per Hectare) at 0%, 25%, 30%, 35%
& 40% Affordable Housing Across all Value Points
70% Social Rent/30% Shared Ownership
Planning Infrastructure Level £0, £40 CIL
Low Density
Houses Only Schemes
£0
£500,000
£1,000,000
£1,500,000
£2,000,000
£2,500,000
£3,000,000
£3,500,000
£4,000,000
£4,500,000
£5,000,000
£5,500,000
£6,000,000
1 2 3 4 5 1 2 3 4 5 1 2 3 4 5
10 Unit Scheme 20 Unit Scheme 50 Unit Scheme
Resid
ual Lan
d V
alu
e (%
o
f G
DV
)
Residual Land Value - 0% Affordable Residual Land Value - 25% Affordable Residual Land Value - 30% Affordable
Residual Land Value - 35% Affordable Residual Land Value - 40% Affordable
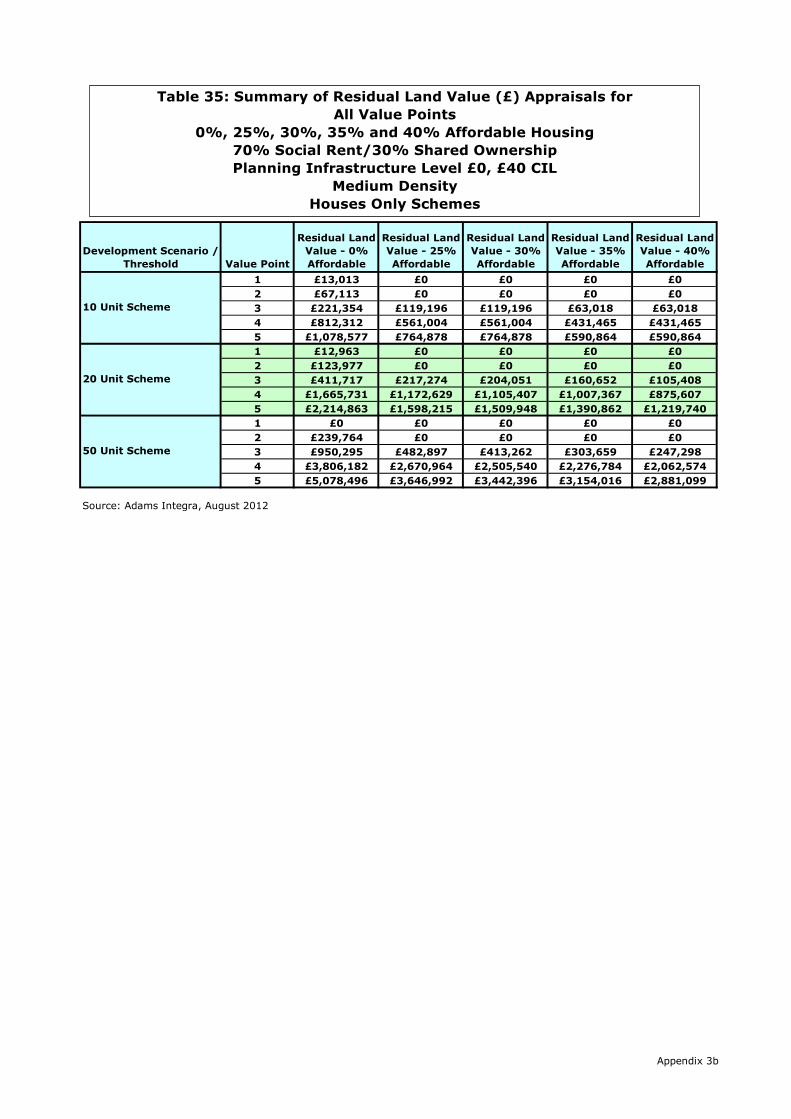
Development Scenario /
Threshold Value Point
Residual Land
Value - 0%
Affordable
Residual Land
Value - 25%
Affordable
Residual Land
Value - 30%
Affordable
Residual Land
Value - 35%
Affordable
Residual Land
Value - 40%
Affordable
1 £13,013 £0 £0 £0 £0
2 £67,113 £0 £0 £0 £0
3 £221,354 £119,196 £119,196 £63,018 £63,018
4 £812,312 £561,004 £561,004 £431,465 £431,465
5 £1,078,577 £764,878 £764,878 £590,864 £590,864
1 £12,963 £0 £0 £0 £0
2 £123,977 £0 £0 £0 £0
3 £411,717 £217,274 £204,051 £160,652 £105,408
4 £1,665,731 £1,172,629 £1,105,407 £1,007,367 £875,607
5 £2,214,863 £1,598,215 £1,509,948 £1,390,862 £1,219,740
1 £0 £0 £0 £0 £0
2 £239,764 £0 £0 £0 £0
3 £950,295 £482,897 £413,262 £303,659 £247,298
4 £3,806,182 £2,670,964 £2,505,540 £2,276,784 £2,062,574
5 £5,078,496 £3,646,992 £3,442,396 £3,154,016 £2,881,099
Source: Adams Integra, August 2012
10 Unit Scheme
20 Unit Scheme
50 Unit Scheme
Table 35: Summary of Residual Land Value (£) Appraisals for
All Value Points
0%, 25%, 30%, 35% and 40% Affordable Housing
70% Social Rent/30% Shared Ownership
Planning Infrastructure Level £0, £40 CIL
Medium Density
Houses Only Schemes
Appendix 3b

Appendix 3b
Graph 35: Summary of Residual Land Values at 0%, 25%, 30%, 35% & 40%
Affordable Housing Across All Value Points
70% Social Rent/30% Shared Ownership
Planning Infrastructure Level £0, £40 CIL
Medium Density
Houses Only Schemes
£0
£500,000
£1,000,000
£1,500,000
£2,000,000
£2,500,000
£3,000,000
£3,500,000
£4,000,000
£4,500,000
£5,000,000
£5,500,000
£6,000,000
1 2 3 4 5 1 2 3 4 5 1 2 3 4 5
10 Unit Scheme 20 Unit Scheme 50 Unit Scheme
Resid
ual Lan
d V
alu
e (£
)
Residual Land Value - 0% Affordable Residual Land Value - 25% Affordable Residual Land Value - 30% Affordable
Residual Land Value - 35% Affordable Residual Land Value - 40% Affordable
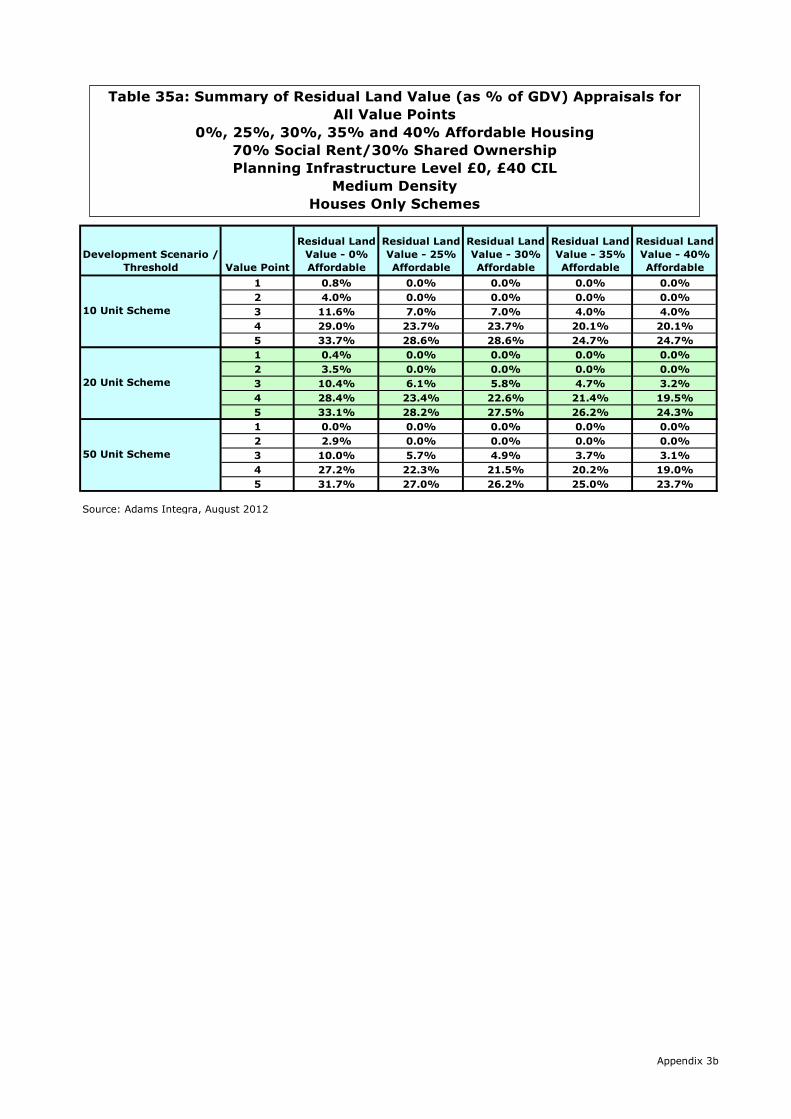
Development Scenario /
Threshold Value Point
Residual Land
Value - 0%
Affordable
Residual Land
Value - 25%
Affordable
Residual Land
Value - 30%
Affordable
Residual Land
Value - 35%
Affordable
Residual Land
Value - 40%
Affordable
1 0.8% 0.0% 0.0% 0.0% 0.0%
2 4.0% 0.0% 0.0% 0.0% 0.0%
3 11.6% 7.0% 7.0% 4.0% 4.0%
4 29.0% 23.7% 23.7% 20.1% 20.1%
5 33.7% 28.6% 28.6% 24.7% 24.7%
1 0.4% 0.0% 0.0% 0.0% 0.0%
2 3.5% 0.0% 0.0% 0.0% 0.0%
3 10.4% 6.1% 5.8% 4.7% 3.2%
4 28.4% 23.4% 22.6% 21.4% 19.5%
5 33.1% 28.2% 27.5% 26.2% 24.3%
1 0.0% 0.0% 0.0% 0.0% 0.0%
2 2.9% 0.0% 0.0% 0.0% 0.0%
3 10.0% 5.7% 4.9% 3.7% 3.1%
4 27.2% 22.3% 21.5% 20.2% 19.0%
5 31.7% 27.0% 26.2% 25.0% 23.7%
Source: Adams Integra, August 2012
10 Unit Scheme
20 Unit Scheme
50 Unit Scheme
Table 35a: Summary of Residual Land Value (as % of GDV) Appraisals for
All Value Points
0%, 25%, 30%, 35% and 40% Affordable Housing
70% Social Rent/30% Shared Ownership
Planning Infrastructure Level £0, £40 CIL
Medium Density
Houses Only Schemes
Appendix 3b
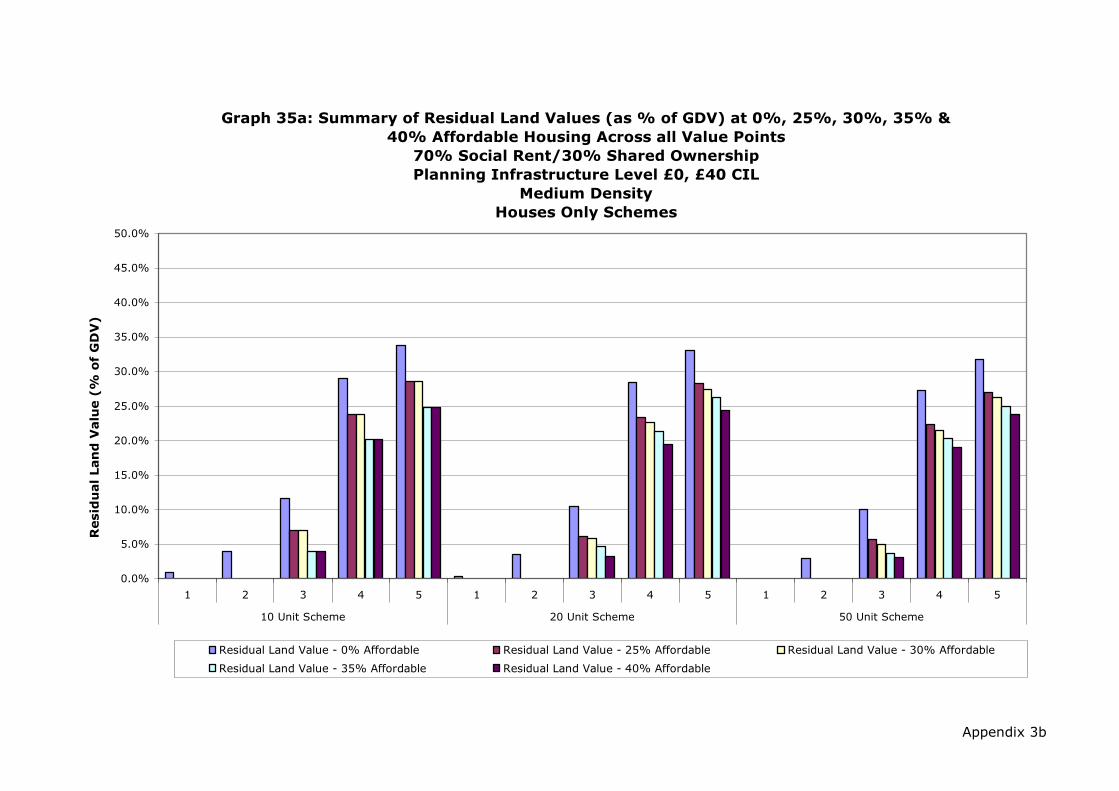
Appendix 3b
Graph 35a: Summary of Residual Land Values (as % of GDV) at 0%, 25%, 30%, 35% &
40% Affordable Housing Across all Value Points
70% Social Rent/30% Shared Ownership
Planning Infrastructure Level £0, £40 CIL
Medium Density
Houses Only Schemes
0.0%
5.0%
10.0%
15.0%
20.0%
25.0%
30.0%
35.0%
40.0%
45.0%
50.0%
1 2 3 4 5 1 2 3 4 5 1 2 3 4 5
10 Unit Scheme 20 Unit Scheme 50 Unit Scheme
Resid
ual Lan
d V
alu
e (%
o
f G
DV
)
Residual Land Value - 0% Affordable Residual Land Value - 25% Affordable Residual Land Value - 30% Affordable
Residual Land Value - 35% Affordable Residual Land Value - 40% Affordable

Development Scenario /
Threshold Value Point
Residual Land
Value - 0%
Affordable
Residual Land
Value - 25%
Affordable
Residual Land
Value - 30%
Affordable
Residual Land
Value - 35%
Affordable
Residual Land
Value - 40%
Affordable
1 £58,560 £0 £0 £0 £0
2 £302,009 £0 £0 £0 £0
3 £996,091 £536,381 £536,381 £283,579 £283,579
4 £3,655,406 £2,524,516 £2,524,516 £1,941,593 £1,941,593
5 £4,853,595 £3,441,950 £3,441,950 £2,658,886 £2,658,886
1 £29,167 £0 £0 £0 £0
2 £278,949 £0 £0 £0 £0
3 £926,363 £488,868 £459,115 £361,468 £237,167
4 £3,747,895 £2,638,415 £2,487,166 £2,266,576 £1,970,116
5 £4,983,441 £3,595,984 £3,397,383 £3,129,439 £2,744,414
1 £0 £0 £0 £0 £0
2 £215,788 £0 £0 £0 £0
3 £855,266 £434,608 £371,935 £273,294 £222,568
4 £3,425,563 £2,403,867 £2,254,986 £2,049,106 £1,856,317
5 £4,570,647 £3,282,292 £3,098,156 £2,838,614 £2,592,990
Source: Adams Integra, August 2012
10 Unit Scheme
20 Unit Scheme
50 Unit Scheme
Table 35b: Summary of Residual Land Value (value per Hectare) Appraisals
for All Value Points
0%, 25%, 30%, 35% and 40% Affordable Housing
70% Social Rent/30% Shared Ownership
Planning Infrastructure Level £0, £40 CIL
Medium Density
Houses Only Schemes
Appendix 3b

Appendix 3b
Graph 35b: Summary of Residual Land Values (value per Hectare) at 0%, 25%, 30%, 35%
& 40% Affordable Housing Across all Value Points
70% Social Rent/30% Shared Ownership
Planning Infrastructure Level £0, £40 CIL
Medium Density
Houses Only Schemes
£0
£500,000
£1,000,000
£1,500,000
£2,000,000
£2,500,000
£3,000,000
£3,500,000
£4,000,000
£4,500,000
£5,000,000
£5,500,000
£6,000,000
1 2 3 4 5 1 2 3 4 5 1 2 3 4 5
10 Unit Scheme 20 Unit Scheme 50 Unit Scheme
Resid
ual Lan
d V
alu
e (%
o
f G
DV
)
Residual Land Value - 0% Affordable Residual Land Value - 25% Affordable Residual Land Value - 30% Affordable
Residual Land Value - 35% Affordable Residual Land Value - 40% Affordable

Development Scenario /
Threshold Value Point
Residual Land
Value - 0%
Affordable
Residual Land
Value - 25%
Affordable
Residual Land
Value - 30%
Affordable
Residual Land
Value - 35%
Affordable
Residual Land
Value - 40%
Affordable
1 £9,797 £0 £0 £0 £0
2 £60,144 £0 £0 £0 £0
3 £205,180 £102,859 £102,859 £56,631 £56,631
4 £707,554 £460,998 £460,998 £360,262 £360,262
5 £916,125 £602,426 £602,426 £481,328 £481,328
1 £4,355 £0 £0 £0 £0
2 £103,376 £0 £0 £0 £0
3 £380,922 £197,134 £173,778 £141,927 £96,467
4 £1,377,273 £934,060 £894,755 £784,968 £686,928
5 £1,787,481 £1,240,824 £1,182,258 £1,051,425 £932,339
1 £0 £0 £0 £0 £0
2 £187,025 £0 £0 £0 £0
3 £908,846 £475,536 £389,828 £293,054 £230,972
4 £3,055,000 £2,010,454 £1,819,897 £1,579,726 £1,446,250
5 £4,016,951 £2,713,453 £2,481,990 £2,182,195 £2,009,547
Source: Adams Integra, August 2012
10 Unit Scheme
20 Unit Scheme
50 Unit Scheme
Table 36: Summary of Residual Land Value (£) Appraisals for
All Value Points
0%, 25%, 30%, 35% and 40% Affordable Housing
70% Social Rent/30% Shared Ownership
Planning Infrastructure Level £0, £40 CIL
High Density
Houses Only Schemes
Appendix 3b
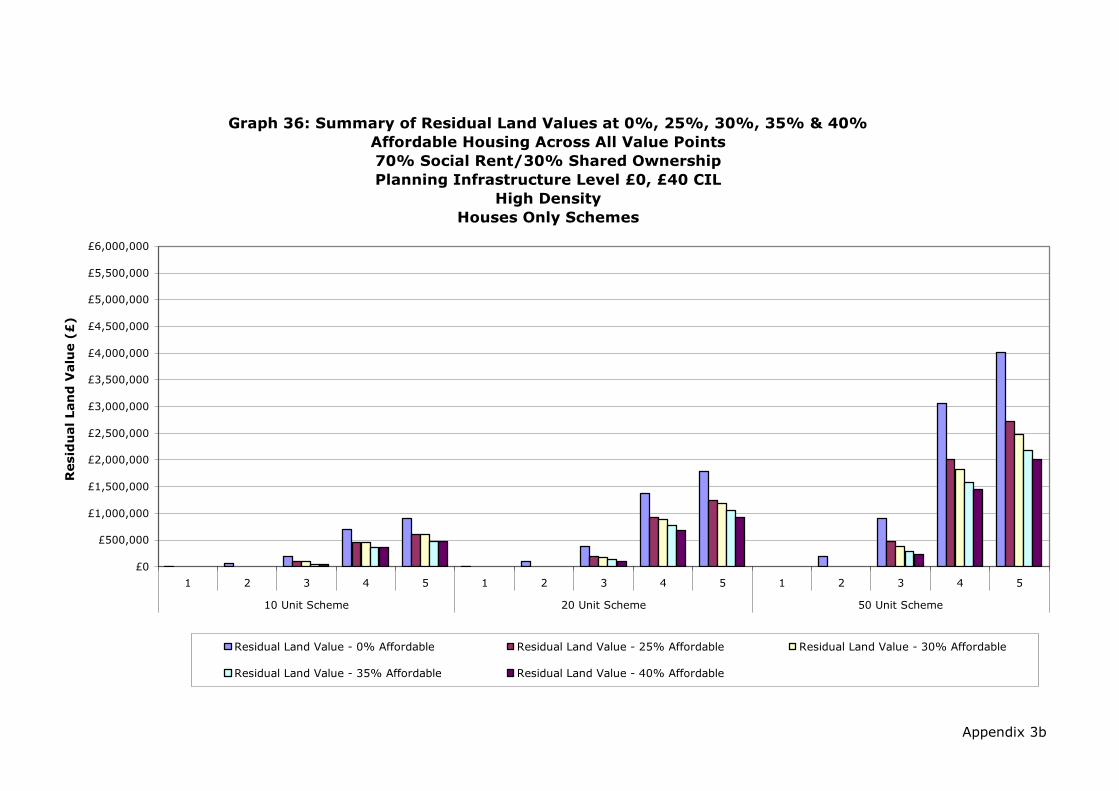
Appendix 3b
Graph 36: Summary of Residual Land Values at 0%, 25%, 30%, 35% & 40%
Affordable Housing Across All Value Points
70% Social Rent/30% Shared Ownership
Planning Infrastructure Level £0, £40 CIL
High Density
Houses Only Schemes
£0
£500,000
£1,000,000
£1,500,000
£2,000,000
£2,500,000
£3,000,000
£3,500,000
£4,000,000
£4,500,000
£5,000,000
£5,500,000
£6,000,000
1 2 3 4 5 1 2 3 4 5 1 2 3 4 5
10 Unit Scheme 20 Unit Scheme 50 Unit Scheme
Resid
ual Lan
d V
alu
e (£
)
Residual Land Value - 0% Affordable Residual Land Value - 25% Affordable Residual Land Value - 30% Affordable
Residual Land Value - 35% Affordable Residual Land Value - 40% Affordable

Development Scenario /
Threshold Value Point
Residual Land
Value - 0%
Affordable
Residual Land
Value - 25%
Affordable
Residual Land
Value - 30%
Affordable
Residual Land
Value - 35%
Affordable
Residual Land
Value - 40%
Affordable
1 0.7% 0.0% 0.0% 0.0% 0.0%
2 3.8% 0.0% 0.0% 0.0% 0.0%
3 11.6% 6.6% 6.6% 3.8% 3.8%
4 27.9% 21.9% 21.9% 18.6% 18.6%
5 32.1% 26.0% 26.0% 22.7% 22.7%
1 0.1% 0.0% 0.0% 0.0% 0.0%
2 3.3% 0.0% 0.0% 0.0% 0.0%
3 10.7% 6.2% 5.6% 4.7% 3.3%
4 27.1% 21.7% 21.2% 19.4% 17.8%
5 31.4% 26.0% 25.4% 23.7% 22.0%
1 0.0% 0.0% 0.0% 0.0% 0.0%
2 2.6% 0.0% 0.0% 0.0% 0.0%
3 10.9% 6.4% 5.4% 4.2% 3.3%
4 26.0% 20.4% 19.1% 17.4% 16.4%
5 30.3% 24.8% 23.5% 21.8% 20.7%
Source: Adams Integra, August 2012
10 Unit Scheme
20 Unit Scheme
50 Unit Scheme
Table 36a: Summary of Residual Land Value (as % of GDV) Appraisals for
All Value Points
0%, 25%, 30%, 35% and 40% Affordable Housing
70% Social Rent/30% Shared Ownership
Planning Infrastructure Level £0, £40 CIL
High Density
Houses Only Schemes
Appendix 3b
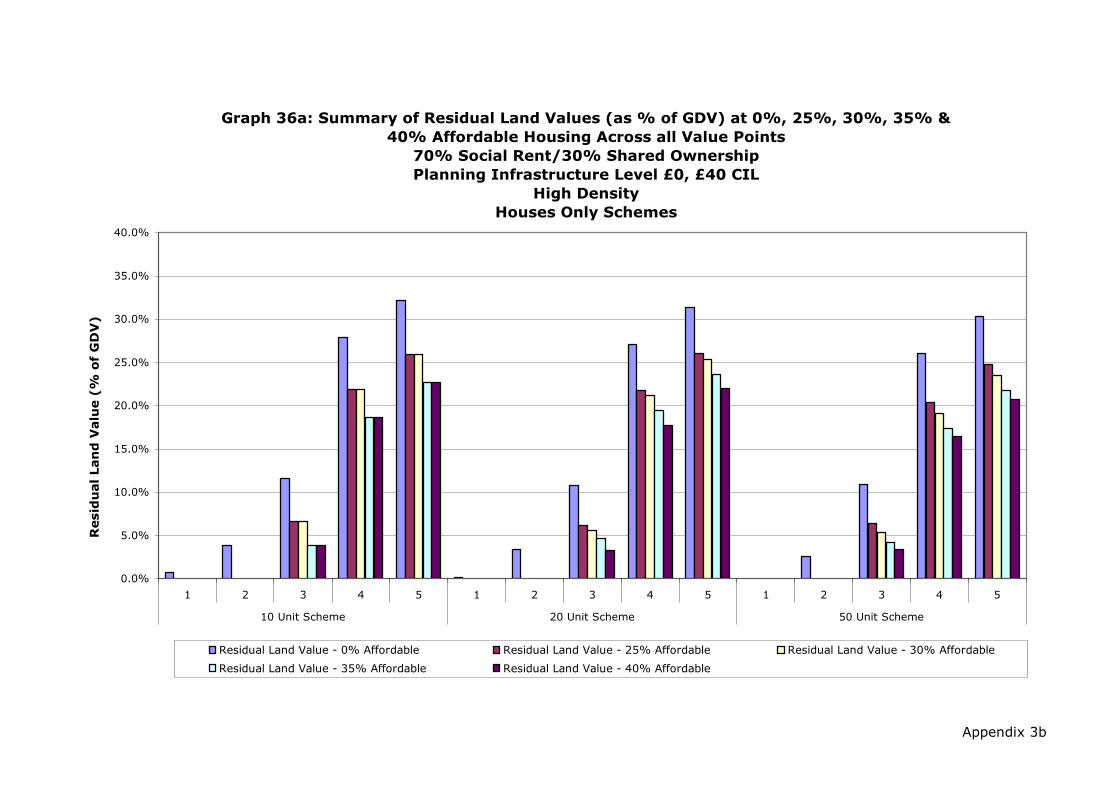
Appendix 3b
Graph 36a: Summary of Residual Land Values (as % of GDV) at 0%, 25%, 30%, 35% &
40% Affordable Housing Across all Value Points
70% Social Rent/30% Shared Ownership
Planning Infrastructure Level £0, £40 CIL
High Density
Houses Only Schemes
0.0%
5.0%
10.0%
15.0%
20.0%
25.0%
30.0%
35.0%
40.0%
1 2 3 4 5 1 2 3 4 5 1 2 3 4 5
10 Unit Scheme 20 Unit Scheme 50 Unit Scheme
Resid
ual Lan
d V
alu
e (%
o
f G
DV
)
Residual Land Value - 0% Affordable Residual Land Value - 25% Affordable Residual Land Value - 30% Affordable
Residual Land Value - 35% Affordable Residual Land Value - 40% Affordable

Development Scenario /
Threshold Value Point
Residual Land
Value - 0%
Affordable
Residual Land
Value - 25%
Affordable
Residual Land
Value - 30%
Affordable
Residual Land
Value - 35%
Affordable
Residual Land
Value - 40%
Affordable
1 £48,984 £0 £0 £0 £0
2 £300,720 £0 £0 £0 £0
3 £1,025,901 £514,296 £514,296 £283,154 £283,154
4 £3,537,772 £2,304,990 £2,304,990 £1,801,310 £1,801,310
5 £4,580,626 £3,012,132 £3,012,132 £2,406,638 £2,406,638
1 £10,888 £0 £0 £0 £0
2 £258,440 £0 £0 £0 £0
3 £952,306 £492,834 £434,445 £354,816 £241,166
4 £3,443,181 £2,335,149 £2,236,886 £1,962,420 £1,717,319
5 £4,468,703 £3,102,060 £2,955,644 £2,628,563 £2,330,848
1 £0 £0 £0 £0 £0
2 £187,025 £0 £0 £0 £0
3 £908,846 £475,536 £389,828 £293,054 £230,972
4 £3,055,000 £2,010,454 £1,819,897 £1,579,726 £1,446,250
5 £4,016,951 £2,713,453 £2,481,990 £2,182,195 £2,009,547
Source: Adams Integra, August 2012
10 Unit Scheme
20 Unit Scheme
50 Unit Scheme
Table 36b: Summary of Residual Land Value (value per Hectare) Appraisals
for All Value Points
0%, 25%, 30%, 35% and 40% Affordable Housing
70% Social Rent/30% Shared Ownership
Planning Infrastructure Level £0, £40 CIL
High Density
Houses Only Schemes
Appendix 3b
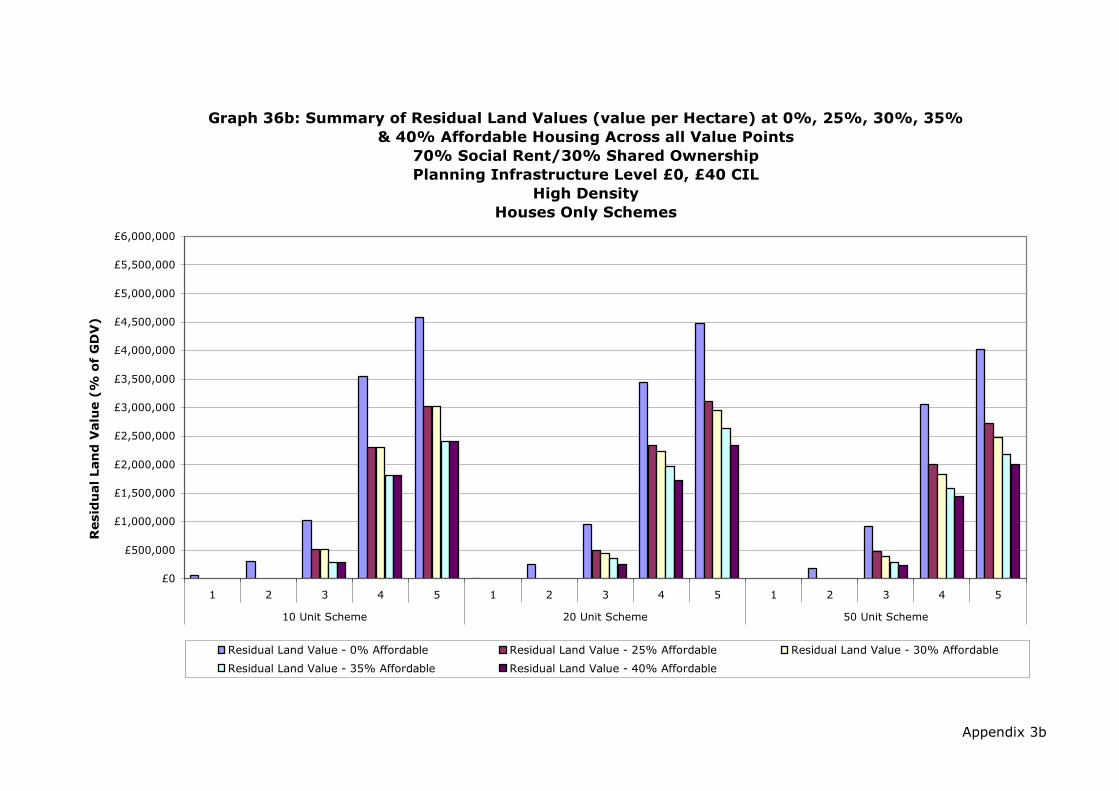
Appendix 3b
Graph 36b: Summary of Residual Land Values (value per Hectare) at 0%, 25%, 30%, 35%
& 40% Affordable Housing Across all Value Points
70% Social Rent/30% Shared Ownership
Planning Infrastructure Level £0, £40 CIL
High Density
Houses Only Schemes
£0
£500,000
£1,000,000
£1,500,000
£2,000,000
£2,500,000
£3,000,000
£3,500,000
£4,000,000
£4,500,000
£5,000,000
£5,500,000
£6,000,000
1 2 3 4 5 1 2 3 4 5 1 2 3 4 5
10 Unit Scheme 20 Unit Scheme 50 Unit Scheme
Resid
ual Lan
d V
alu
e (%
o
f G
DV
)
Residual Land Value - 0% Affordable Residual Land Value - 25% Affordable Residual Land Value - 30% Affordable
Residual Land Value - 35% Affordable Residual Land Value - 40% Affordable

Development Scenario /
Threshold Value Point
Residual Land
Value - 0%
Affordable
Residual Land
Value - 25%
Affordable
Residual Land
Value - 30%
Affordable
Residual Land
Value - 35%
Affordable
Residual Land
Value - 40%
Affordable
1 £0 £0 £0 £0 £0
2 £63,147 £0 £0 £0 £0
3 £252,010 £143,815 £143,815 £97,586 £97,586
4 £1,055,810 £753,768 £753,768 £654,071 £654,071
5 £1,380,194 £995,322 £995,322 £874,223 £874,223
1 £0 £0 £0 £0 £0
2 £103,727 £0 £0 £0 £0
3 £475,789 £276,957 £264,000 £224,438 £171,461
4 £2,056,873 £1,563,771 £1,496,550 £1,398,509 £1,266,750
5 £2,694,859 £2,078,211 £1,989,944 £1,870,858 £1,699,736
1 £0 £0 £0 £0 £0
2 £186,657 £0 £0 £0 £0
3 £1,064,404 £605,172 £520,637 £418,245 £353,576
4 £4,799,485 £3,605,708 £3,391,800 £3,126,496 £2,933,120
5 £6,260,518 £4,765,251 £4,492,636 £4,165,974 £3,913,891
Source: Adams Integra, August 2012
10 Unit Scheme
20 Unit Scheme
50 Unit Scheme
Table 37: Summary of Residual Land Value (£) Appraisals for
All Value Points
0%, 25%, 30%, 35% and 40% Affordable Housing
70% Social Rent/30% Shared Ownership
Planning Infrastructure Level £0, £60 CIL
Low Density
Houses Only Schemes
Appendix 3b

Appendix 3b
Graph 37: Summary of Residual Land Values at 0%, 25%, 30%, 35% & 40%
Affordable Housing Across All Value Points
70% Social Rent/30% Shared Ownership
Planning Infrastructure Level £0, £60 CIL
Low Density
Houses Only Schemes
£0
£500,000
£1,000,000
£1,500,000
£2,000,000
£2,500,000
£3,000,000
£3,500,000
£4,000,000
£4,500,000
£5,000,000
£5,500,000
£6,000,000
£6,500,000
£7,000,000
£7,500,000
1 2 3 4 5 1 2 3 4 5 1 2 3 4 5
10 Unit Scheme 20 Unit Scheme 50 Unit Scheme
Resid
ual Lan
d V
alu
e (£
)
Residual Land Value - 0% Affordable Residual Land Value - 25% Affordable Residual Land Value - 30% Affordable
Residual Land Value - 35% Affordable Residual Land Value - 40% Affordable Residual Land Value - 40% Affordable
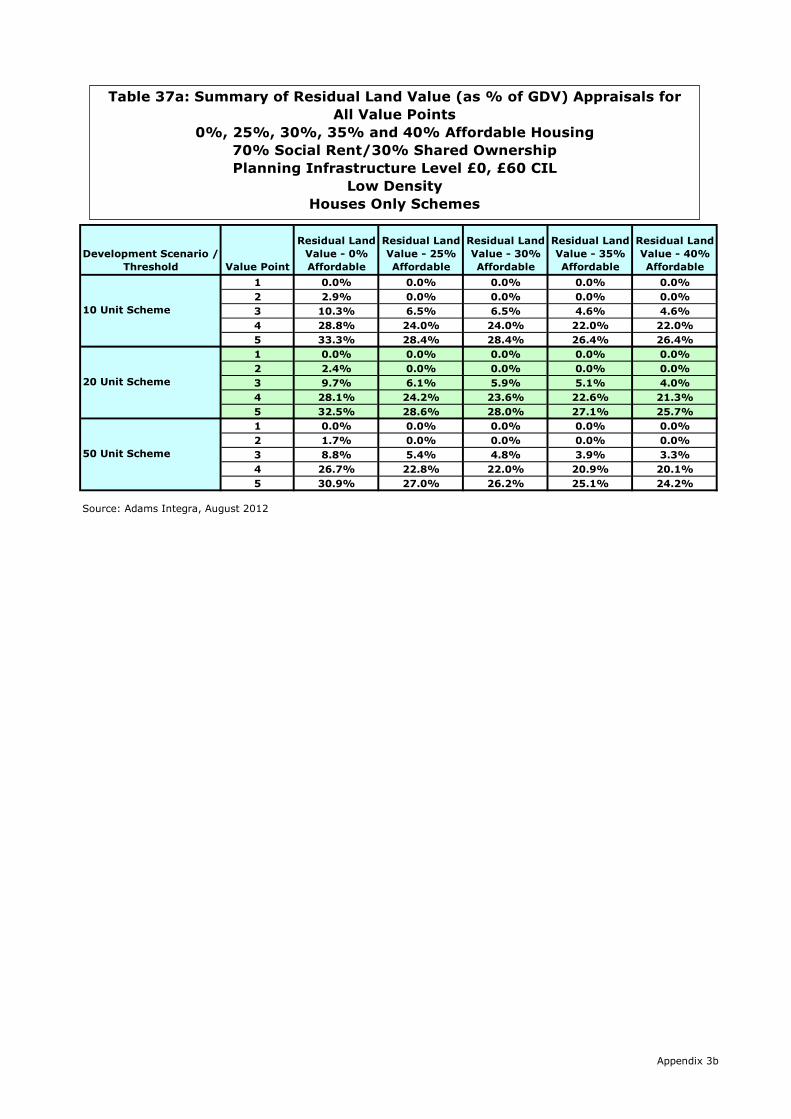
Development Scenario /
Threshold Value Point
Residual Land
Value - 0%
Affordable
Residual Land
Value - 25%
Affordable
Residual Land
Value - 30%
Affordable
Residual Land
Value - 35%
Affordable
Residual Land
Value - 40%
Affordable
1 0.0% 0.0% 0.0% 0.0% 0.0%
2 2.9% 0.0% 0.0% 0.0% 0.0%
3 10.3% 6.5% 6.5% 4.6% 4.6%
4 28.8% 24.0% 24.0% 22.0% 22.0%
5 33.3% 28.4% 28.4% 26.4% 26.4%
1 0.0% 0.0% 0.0% 0.0% 0.0%
2 2.4% 0.0% 0.0% 0.0% 0.0%
3 9.7% 6.1% 5.9% 5.1% 4.0%
4 28.1% 24.2% 23.6% 22.6% 21.3%
5 32.5% 28.6% 28.0% 27.1% 25.7%
1 0.0% 0.0% 0.0% 0.0% 0.0%
2 1.7% 0.0% 0.0% 0.0% 0.0%
3 8.8% 5.4% 4.8% 3.9% 3.3%
4 26.7% 22.8% 22.0% 20.9% 20.1%
5 30.9% 27.0% 26.2% 25.1% 24.2%
Source: Adams Integra, August 2012
10 Unit Scheme
20 Unit Scheme
50 Unit Scheme
Table 37a: Summary of Residual Land Value (as % of GDV) Appraisals for
All Value Points
0%, 25%, 30%, 35% and 40% Affordable Housing
70% Social Rent/30% Shared Ownership
Planning Infrastructure Level £0, £60 CIL
Low Density
Houses Only Schemes
Appendix 3b
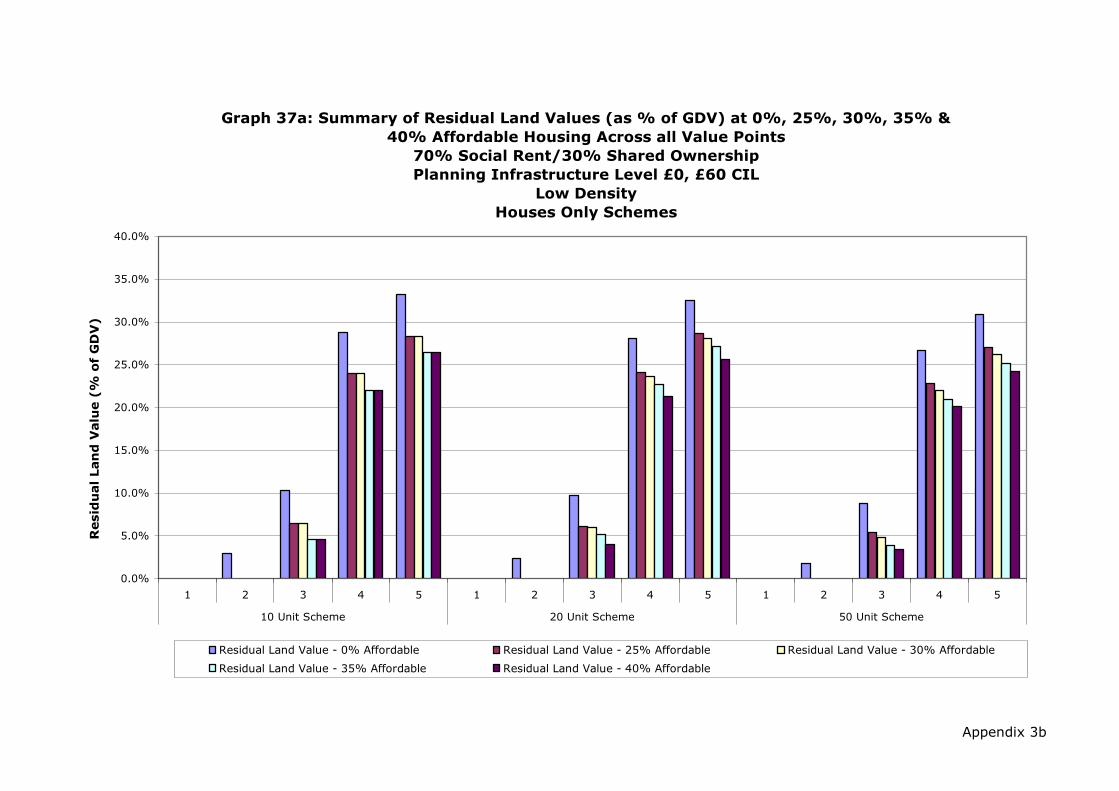
Appendix 3b
Graph 37a: Summary of Residual Land Values (as % of GDV) at 0%, 25%, 30%, 35% &
40% Affordable Housing Across all Value Points
70% Social Rent/30% Shared Ownership
Planning Infrastructure Level £0, £60 CIL
Low Density
Houses Only Schemes
0.0%
5.0%
10.0%
15.0%
20.0%
25.0%
30.0%
35.0%
40.0%
1 2 3 4 5 1 2 3 4 5 1 2 3 4 5
10 Unit Scheme 20 Unit Scheme 50 Unit Scheme
Resid
ual Lan
d V
alu
e (%
o
f G
DV
)
Residual Land Value - 0% Affordable Residual Land Value - 25% Affordable Residual Land Value - 30% Affordable
Residual Land Value - 35% Affordable Residual Land Value - 40% Affordable

Development Scenario /
Threshold Value Point
Residual Land
Value - 0%
Affordable
Residual Land
Value - 25%
Affordable
Residual Land
Value - 30%
Affordable
Residual Land
Value - 35%
Affordable
Residual Land
Value - 40%
Affordable
1 £0 £0 £0 £0 £0
2 £252,589 £0 £0 £0 £0
3 £1,008,040 £575,259 £575,259 £390,346 £390,346
4 £4,223,238 £3,015,072 £3,015,072 £2,616,282 £2,616,282
5 £5,520,775 £3,981,287 £3,981,287 £3,496,891 £3,496,891
1 £0 £0 £0 £0 £0
2 £207,454 £0 £0 £0 £0
3 £951,577 £553,913 £528,001 £448,877 £342,922
4 £4,113,747 £3,127,542 £2,993,099 £2,797,019 £2,533,499
5 £5,389,718 £4,156,423 £3,979,888 £3,741,716 £3,399,472
1 £0 £0 £0 £0 £0
2 £149,325 £0 £0 £0 £0
3 £851,523 £484,138 £416,510 £334,596 £282,861
4 £3,839,588 £2,884,566 £2,713,440 £2,501,197 £2,346,496
5 £5,008,414 £3,812,201 £3,594,109 £3,332,779 £3,131,113
Source: Adams Integra, August 2012
10 Unit Scheme
20 Unit Scheme
50 Unit Scheme
Table 37b: Summary of Residual Land Value (value per Hectare) Appraisals
for All Value Points
0%, 25%, 30%, 35% and 40% Affordable Housing
70% Social Rent/30% Shared Ownership
Planning Infrastructure Level £0, £60 CIL
Low Density
Houses Only Schemes
Appendix 3b

Appendix 3b
Graph 37b: Summary of Residual Land Values (value per Hectare) at 0%, 25%, 30%, 35%
& 40% Affordable Housing Across all Value Points
70% Social Rent/30% Shared Ownership
Planning Infrastructure Level £0, £60 CIL
Low Density
Houses Only Schemes
£0
£500,000
£1,000,000
£1,500,000
£2,000,000
£2,500,000
£3,000,000
£3,500,000
£4,000,000
£4,500,000
£5,000,000
£5,500,000
£6,000,000
1 2 3 4 5 1 2 3 4 5 1 2 3 4 5
10 Unit Scheme 20 Unit Scheme 50 Unit Scheme
Resid
ual Lan
d V
alu
e (%
o
f G
DV
)
Residual Land Value - 0% Affordable Residual Land Value - 25% Affordable Residual Land Value - 30% Affordable
Residual Land Value - 35% Affordable Residual Land Value - 40% Affordable

Development Scenario /
Threshold Value Point
Residual Land
Value - 0%
Affordable
Residual Land
Value - 25%
Affordable
Residual Land
Value - 30%
Affordable
Residual Land
Value - 35%
Affordable
Residual Land
Value - 40%
Affordable
1 £0 £0 £0 £0 £0
2 £51,500 £0 £0 £0 £0
3 £205,896 £103,583 £103,583 £47,404 £47,404
4 £797,324 £546,015 £546,015 £416,320 £416,320
5 £1,063,588 £749,889 £749,889 £575,875 £575,875
1 £0 £0 £0 £0 £0
2 £91,939 £0 £0 £0 £0
3 £380,640 £185,556 £174,074 £128,614 £73,369
4 £1,634,974 £1,141,872 £1,074,650 £976,610 £844,850
5 £2,184,106 £1,567,458 £1,479,191 £1,360,104 £1,188,982
1 £0 £0 £0 £0 £0
2 £167,580 £0 £0 £0 £0
3 £878,673 £415,559 £340,893 £236,060 £173,438
4 £3,734,560 £2,599,342 £2,433,918 £2,205,162 £1,990,952
5 £5,006,874 £3,575,370 £3,370,774 £3,082,394 £2,809,477
Source: Adams Integra, August 2012
10 Unit Scheme
20 Unit Scheme
50 Unit Scheme
Table 38: Summary of Residual Land Value (£) Appraisals for
All Value Points
0%, 25%, 30%, 35% and 40% Affordable Housing
70% Social Rent/30% Shared Ownership
Planning Infrastructure Level £0, £60 CIL
Medium Density
Houses Only Schemes
Appendix 3b

Appendix 3b
Graph 38: Summary of Residual Land Values at 0%, 25%, 30%, 35% & 40%
Affordable Housing Across All Value Points
70% Social Rent/30% Shared Ownership
Planning Infrastructure Level £0, £60 CIL
Medium Density
Houses Only Schemes
£0
£500,000
£1,000,000
£1,500,000
£2,000,000
£2,500,000
£3,000,000
£3,500,000
£4,000,000
£4,500,000
£5,000,000
£5,500,000
£6,000,000
1 2 3 4 5 1 2 3 4 5 1 2 3 4 5
10 Unit Scheme 20 Unit Scheme 50 Unit Scheme
Resid
ual Lan
d V
alu
e (£
)
Residual Land Value - 0% Affordable Residual Land Value - 25% Affordable Residual Land Value - 30% Affordable
Residual Land Value - 35% Affordable Residual Land Value - 40% Affordable

Development Scenario /
Threshold Value Point
Residual Land
Value - 0%
Affordable
Residual Land
Value - 25%
Affordable
Residual Land
Value - 30%
Affordable
Residual Land
Value - 35%
Affordable
Residual Land
Value - 40%
Affordable
1 0.0% 0.0% 0.0% 0.0% 0.0%
2 3.1% 0.0% 0.0% 0.0% 0.0%
3 10.8% 6.1% 6.1% 3.0% 3.0%
4 28.5% 23.1% 23.1% 19.4% 19.4%
5 33.2% 28.1% 28.1% 24.1% 24.1%
1 0.0% 0.0% 0.0% 0.0% 0.0%
2 2.6% 0.0% 0.0% 0.0% 0.0%
3 9.6% 5.2% 5.0% 3.8% 2.2%
4 27.9% 22.8% 22.0% 20.7% 18.8%
5 32.6% 27.7% 26.9% 25.7% 23.7%
1 0.0% 0.0% 0.0% 0.0% 0.0%
2 2.0% 0.0% 0.0% 0.0% 0.0%
3 9.2% 4.9% 4.1% 2.9% 2.2%
4 26.7% 21.7% 20.9% 19.6% 18.3%
5 31.3% 26.5% 25.7% 24.4% 23.1%
Source: Adams Integra, August 2012
10 Unit Scheme
20 Unit Scheme
50 Unit Scheme
Table 38a: Summary of Residual Land Value (as % of GDV) Appraisals for
All Value Points
0%, 25%, 30%, 35% and 40% Affordable Housing
70% Social Rent/30% Shared Ownership
Planning Infrastructure Level £0, £60 CIL
Medium Density
Houses Only Schemes
Appendix 3b

Appendix 3b
Graph 38a: Summary of Residual Land Values (as % of GDV) at 0%, 25%, 30%, 35% &
40% Affordable Housing Across all Value Points
70% Social Rent/30% Shared Ownership
Planning Infrastructure Level £0, £60 CIL
Medium Density
Houses Only Schemes
0.0%
5.0%
10.0%
15.0%
20.0%
25.0%
30.0%
35.0%
40.0%
45.0%
50.0%
1 2 3 4 5 1 2 3 4 5 1 2 3 4 5
10 Unit Scheme 20 Unit Scheme 50 Unit Scheme
Resid
ual Lan
d V
alu
e (%
o
f G
DV
)
Residual Land Value - 0% Affordable Residual Land Value - 25% Affordable Residual Land Value - 30% Affordable
Residual Land Value - 35% Affordable Residual Land Value - 40% Affordable

Development Scenario /
Threshold Value Point
Residual Land
Value - 0%
Affordable
Residual Land
Value - 25%
Affordable
Residual Land
Value - 30%
Affordable
Residual Land
Value - 35%
Affordable
Residual Land
Value - 40%
Affordable
1 £0 £0 £0 £0 £0
2 £231,749 £0 £0 £0 £0
3 £926,534 £466,122 £466,122 £213,319 £213,319
4 £3,587,957 £2,457,067 £2,457,067 £1,873,441 £1,873,441
5 £4,786,145 £3,374,501 £3,374,501 £2,591,437 £2,591,437
1 £0 £0 £0 £0 £0
2 £206,862 £0 £0 £0 £0
3 £856,439 £417,501 £391,665 £289,381 £165,080
4 £3,678,691 £2,569,211 £2,417,963 £2,197,372 £1,900,913
5 £4,914,238 £3,526,780 £3,328,179 £3,060,235 £2,675,210
1 £0 £0 £0 £0 £0
2 £150,822 £0 £0 £0 £0
3 £790,806 £374,003 £306,804 £212,454 £156,094
4 £3,361,104 £2,339,408 £2,190,526 £1,984,646 £1,791,857
5 £4,506,187 £3,217,833 £3,033,696 £2,774,154 £2,528,530
Source: Adams Integra, August 2012
10 Unit Scheme
20 Unit Scheme
50 Unit Scheme
Table 38b: Summary of Residual Land Value (value per Hectare) Appraisals
for All Value Points
0%, 25%, 30%, 35% and 40% Affordable Housing
70% Social Rent/30% Shared Ownership
Planning Infrastructure Level £0, £60 CIL
Medium Density
Houses Only Schemes
Appendix 3b

Appendix 3b
Graph 38b: Summary of Residual Land Values (value per Hectare) at 0%, 25%, 30%, 35%
& 40% Affordable Housing Across all Value Points
70% Social Rent/30% Shared Ownership
Planning Infrastructure Level £0, £60 CIL
Medium Density
Houses Only Schemes
£0
£500,000
£1,000,000
£1,500,000
£2,000,000
£2,500,000
£3,000,000
£3,500,000
£4,000,000
£4,500,000
£5,000,000
£5,500,000
£6,000,000
1 2 3 4 5 1 2 3 4 5 1 2 3 4 5
10 Unit Scheme 20 Unit Scheme 50 Unit Scheme
Resid
ual Lan
d V
alu
e (%
o
f G
DV
)
Residual Land Value - 0% Affordable Residual Land Value - 25% Affordable Residual Land Value - 30% Affordable
Residual Land Value - 35% Affordable Residual Land Value - 40% Affordable

Development Scenario /
Threshold Value Point
Residual Land
Value - 0%
Affordable
Residual Land
Value - 25%
Affordable
Residual Land
Value - 30%
Affordable
Residual Land
Value - 35%
Affordable
Residual Land
Value - 40%
Affordable
1 £0 £0 £0 £0 £0
2 £45,614 £0 £0 £0 £0
3 £190,795 £88,329 £88,329 £42,101 £42,101
4 £693,605 £446,904 £446,904 £346,168 £346,168
5 £902,176 £588,477 £588,477 £472,247 £472,247
1 £0 £0 £0 £0 £0
2 £74,799 £0 £0 £0 £0
3 £353,202 £170,548 £145,201 £113,349 £67,889
4 £1,349,838 £906,625 £867,320 £757,534 £659,493
5 £1,760,047 £1,213,390 £1,154,823 £1,023,991 £904,905
1 £0 £0 £0 £0 £0
2 £124,658 £0 £0 £0 £0
3 £847,160 £413,207 £327,499 £235,483 £169,049
4 £2,993,314 £1,948,768 £1,758,211 £1,518,040 £1,384,564
5 £3,955,265 £2,651,767 £2,420,304 £2,120,509 £1,947,861
Source: Adams Integra, August 2012
10 Unit Scheme
20 Unit Scheme
50 Unit Scheme
Table 39: Summary of Residual Land Value (£) Appraisals for
All Value Points
0%, 25%, 30%, 35% and 40% Affordable Housing
70% Social Rent/30% Shared Ownership
Planning Infrastructure Level £0, £60 CIL
High Density
Houses Only Schemes
Appendix 3b

Appendix 3b
Graph 39: Summary of Residual Land Values at 0%, 25%, 30%, 35% & 40%
Affordable Housing Across All Value Points
70% Social Rent/30% Shared Ownership
Planning Infrastructure Level £0, £60 CIL
High Density
Houses Only Schemes
£0
£500,000
£1,000,000
£1,500,000
£2,000,000
£2,500,000
£3,000,000
£3,500,000
£4,000,000
£4,500,000
£5,000,000
£5,500,000
£6,000,000
1 2 3 4 5 1 2 3 4 5 1 2 3 4 5
10 Unit Scheme 20 Unit Scheme 50 Unit Scheme
Resid
ual Lan
d V
alu
e (£
)
Residual Land Value - 0% Affordable Residual Land Value - 25% Affordable Residual Land Value - 30% Affordable
Residual Land Value - 35% Affordable Residual Land Value - 40% Affordable

Development Scenario /
Threshold Value Point
Residual Land
Value - 0%
Affordable
Residual Land
Value - 25%
Affordable
Residual Land
Value - 30%
Affordable
Residual Land
Value - 35%
Affordable
Residual Land
Value - 40%
Affordable
1 0.0% 0.0% 0.0% 0.0% 0.0%
2 2.9% 0.0% 0.0% 0.0% 0.0%
3 10.7% 5.6% 5.6% 2.8% 2.8%
4 27.3% 21.3% 21.3% 17.9% 17.9%
5 31.7% 25.4% 25.4% 22.3% 22.3%
1 0.0% 0.0% 0.0% 0.0% 0.0%
2 2.4% 0.0% 0.0% 0.0% 0.0%
3 9.9% 5.4% 4.7% 3.7% 2.3%
4 26.6% 21.1% 20.6% 18.8% 17.0%
5 30.9% 25.4% 24.8% 23.0% 21.3%
1 0.0% 0.0% 0.0% 0.0% 0.0%
2 1.7% 0.0% 0.0% 0.0% 0.0%
3 10.1% 5.6% 4.5% 3.3% 2.4%
4 25.5% 19.8% 18.5% 16.7% 15.7%
5 29.9% 24.2% 22.9% 21.2% 20.1%
Source: Adams Integra, August 2012
10 Unit Scheme
20 Unit Scheme
50 Unit Scheme
Table 39a: Summary of Residual Land Value (as % of GDV) Appraisals for
All Value Points
0%, 25%, 30%, 35% and 40% Affordable Housing
70% Social Rent/30% Shared Ownership
Planning Infrastructure Level £0, £60 CIL
High Density
Houses Only Schemes
Appendix 3b

Appendix 3b
Graph 39a: Summary of Residual Land Values (as % of GDV) at 0%, 25%, 30%, 35% &
40% Affordable Housing Across all Value Points
70% Social Rent/30% Shared Ownership
Planning Infrastructure Level £0, £60 CIL
High Density
Houses Only Schemes
0.0%
5.0%
10.0%
15.0%
20.0%
25.0%
30.0%
35.0%
40.0%
1 2 3 4 5 1 2 3 4 5 1 2 3 4 5
10 Unit Scheme 20 Unit Scheme 50 Unit Scheme
Resid
ual Lan
d V
alu
e (%
o
f G
DV
)
Residual Land Value - 0% Affordable Residual Land Value - 25% Affordable Residual Land Value - 30% Affordable
Residual Land Value - 35% Affordable Residual Land Value - 40% Affordable

Development Scenario /
Threshold Value Point
Residual Land
Value - 0%
Affordable
Residual Land
Value - 25%
Affordable
Residual Land
Value - 30%
Affordable
Residual Land
Value - 35%
Affordable
Residual Land
Value - 40%
Affordable
1 £0 £0 £0 £0 £0
2 £228,069 £0 £0 £0 £0
3 £953,976 £441,645 £441,645 £210,503 £210,503
4 £3,468,026 £2,234,518 £2,234,518 £1,730,838 £1,730,838
5 £4,510,881 £2,942,387 £2,942,387 £2,361,235 £2,361,235
1 £0 £0 £0 £0 £0
2 £186,996 £0 £0 £0 £0
3 £883,005 £426,369 £363,001 £283,373 £169,723
4 £3,374,595 £2,266,563 £2,168,300 £1,893,834 £1,648,733
5 £4,400,117 £3,033,474 £2,887,058 £2,559,977 £2,262,262
1 £0 £0 £0 £0 £0
2 £124,658 £0 £0 £0 £0
3 £847,160 £413,207 £327,499 £235,483 £169,049
4 £2,993,314 £1,948,768 £1,758,211 £1,518,040 £1,384,564
5 £3,955,265 £2,651,767 £2,420,304 £2,120,509 £1,947,861
Source: Adams Integra, August 2012
10 Unit Scheme
20 Unit Scheme
50 Unit Scheme
Table 39b: Summary of Residual Land Value (value per Hectare) Appraisals
for All Value Points
0%, 25%, 30%, 35% and 40% Affordable Housing
70% Social Rent/30% Shared Ownership
Planning Infrastructure Level £0, £60 CIL
High Density
Houses Only Schemes
Appendix 3b

Appendix 3b
Graph 39b: Summary of Residual Land Values (value per Hectare) at 0%, 25%, 30%, 35%
& 40% Affordable Housing Across all Value Points
70% Social Rent/30% Shared Ownership
Planning Infrastructure Level £0, £60 CIL
High Density
Houses Only Schemes
£0
£500,000
£1,000,000
£1,500,000
£2,000,000
£2,500,000
£3,000,000
£3,500,000
£4,000,000
£4,500,000
£5,000,000
£5,500,000
£6,000,000
1 2 3 4 5 1 2 3 4 5 1 2 3 4 5
10 Unit Scheme 20 Unit Scheme 50 Unit Scheme
Resid
ual Lan
d V
alu
e (%
o
f G
DV
)
Residual Land Value - 0% Affordable Residual Land Value - 25% Affordable Residual Land Value - 30% Affordable
Residual Land Value - 35% Affordable Residual Land Value - 40% Affordable

Appendix 3b-i

Development Scenario /
Threshold Value Point
Residual Land
Value - 0%
Affordable
Residual Land
Value - 25%
Affordable
Residual Land
Value - 30%
Affordable
Residual Land
Value - 35%
Affordable
Residual Land
Value - 40%
Affordable
1 £0 £0 £0 £0 £0
2 £42,769 £0 £0 £0 £0
3 £237,031 £123,436 £123,436 £77,208 £77,208
4 £1,036,246 £734,205 £734,205 £634,507 £634,507
5 £1,360,631 £975,758 £975,758 £854,659 £854,659
1 £0 £0 £0 £0 £0
2 £63,648 £0 £0 £0 £0
3 £436,912 £242,988 £229,765 £184,760 £131,381
4 £2,018,397 £1,525,295 £1,458,073 £1,360,033 £1,228,273
5 £2,656,383 £2,039,735 £1,951,468 £1,832,382 £1,661,260
1 £0 £0 £0 £0 £0
2 £92,460 £0 £0 £0 £0
3 £972,164 £512,933 £432,861 £325,045 £260,376
4 £4,707,246 £3,513,469 £3,299,560 £3,034,257 £2,840,881
5 £6,168,278 £4,673,012 £4,400,397 £4,073,735 £3,821,652
Source: Adams Integra, August 2012
10 Unit Scheme
20 Unit Scheme
50 Unit Scheme
Table 40: Summary of Residual Land Value (£) Appraisals for
All Value Points
0%, 25%, 30%, 35% and 40% Affordable Housing
70% Social Rent/30% Shared Ownership
Planning Infrastructure Level £0, £80 CIL
Low Density
Houses Only Schemes
Appendix 3b-i
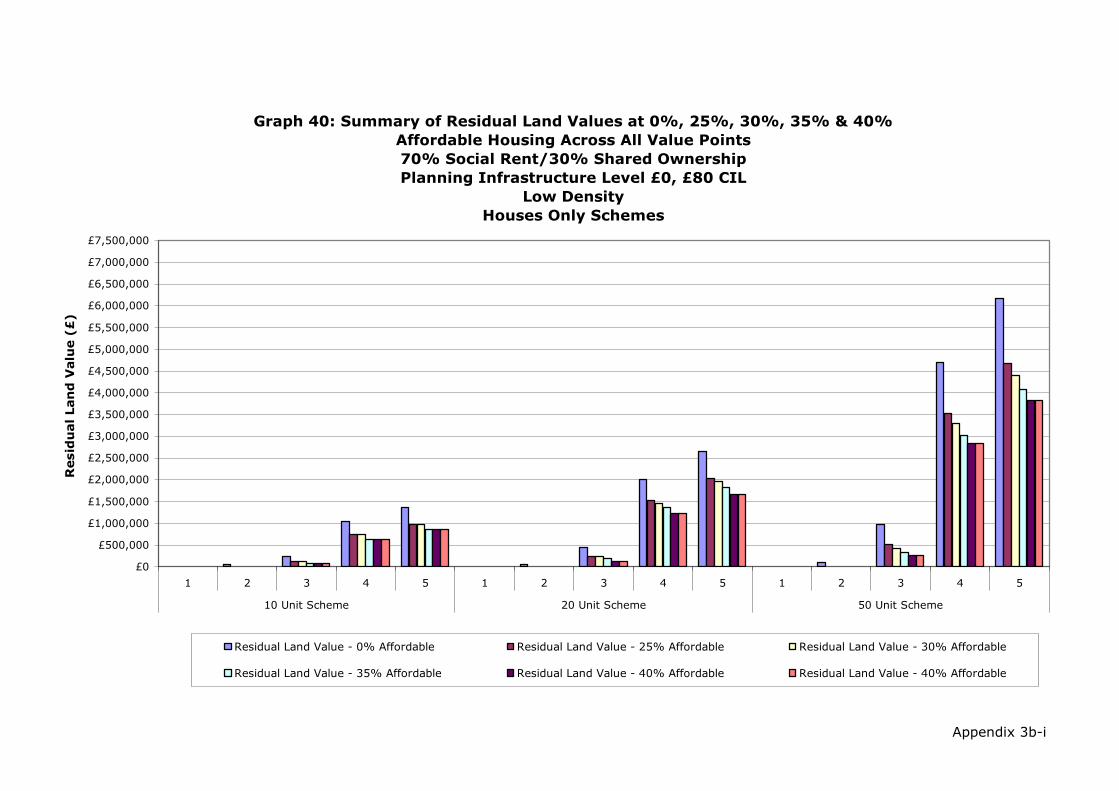
Appendix 3b-i
Graph 40: Summary of Residual Land Values at 0%, 25%, 30%, 35% & 40%
Affordable Housing Across All Value Points
70% Social Rent/30% Shared Ownership
Planning Infrastructure Level £0, £80 CIL
Low Density
Houses Only Schemes
£0
£500,000
£1,000,000
£1,500,000
£2,000,000
£2,500,000
£3,000,000
£3,500,000
£4,000,000
£4,500,000
£5,000,000
£5,500,000
£6,000,000
£6,500,000
£7,000,000
£7,500,000
1 2 3 4 5 1 2 3 4 5 1 2 3 4 5
10 Unit Scheme 20 Unit Scheme 50 Unit Scheme
Resid
ual Lan
d V
alu
e (£
)
Residual Land Value - 0% Affordable Residual Land Value - 25% Affordable Residual Land Value - 30% Affordable
Residual Land Value - 35% Affordable Residual Land Value - 40% Affordable Residual Land Value - 40% Affordable

Development Scenario /
Threshold Value Point
Residual Land
Value - 0%
Affordable
Residual Land
Value - 25%
Affordable
Residual Land
Value - 30%
Affordable
Residual Land
Value - 35%
Affordable
Residual Land
Value - 40%
Affordable
1 0.0% 0.0% 0.0% 0.0% 0.0%
2 2.0% 0.0% 0.0% 0.0% 0.0%
3 9.7% 5.6% 5.6% 3.6% 3.6%
4 28.3% 23.3% 23.3% 21.3% 21.3%
5 32.8% 27.8% 27.8% 25.8% 25.8%
1 0.0% 0.0% 0.0% 0.0% 0.0%
2 1.5% 0.0% 0.0% 0.0% 0.0%
3 8.9% 5.4% 5.1% 4.2% 3.1%
4 27.5% 23.6% 23.0% 22.0% 20.6%
5 32.0% 28.1% 27.5% 26.6% 25.1%
1 0.0% 0.0% 0.0% 0.0% 0.0%
2 0.9% 0.0% 0.0% 0.0% 0.0%
3 8.0% 4.6% 4.0% 3.0% 2.5%
4 26.2% 22.2% 21.4% 20.3% 19.4%
5 30.5% 26.5% 25.6% 24.6% 23.7%
Source: Adams Integra, August 2012
10 Unit Scheme
20 Unit Scheme
50 Unit Scheme
Table 40a: Summary of Residual Land Value (as % of GDV) Appraisals for
All Value Points
0%, 25%, 30%, 35% and 40% Affordable Housing
70% Social Rent/30% Shared Ownership
Planning Infrastructure Level £0, £80 CIL
Low Density
Houses Only Schemes
Appendix 3b-i

Appendix 3b-i
Graph 40a: Summary of Residual Land Values (as % of GDV) at 0%, 25%, 30%, 35% &
40% Affordable Housing Across all Value Points
70% Social Rent/30% Shared Ownership
Planning Infrastructure Level £0, £80 CIL
Low Density
Houses Only Schemes
0.0%
5.0%
10.0%
15.0%
20.0%
25.0%
30.0%
35.0%
40.0%
1 2 3 4 5 1 2 3 4 5 1 2 3 4 5
10 Unit Scheme 20 Unit Scheme 50 Unit Scheme
Resid
ual Lan
d V
alu
e (%
o
f G
DV
)
Residual Land Value - 0% Affordable Residual Land Value - 25% Affordable Residual Land Value - 30% Affordable
Residual Land Value - 35% Affordable Residual Land Value - 40% Affordable

Development Scenario /
Threshold Value Point
Residual Land
Value - 0%
Affordable
Residual Land
Value - 25%
Affordable
Residual Land
Value - 30%
Affordable
Residual Land
Value - 35%
Affordable
Residual Land
Value - 40%
Affordable
1 £0 £0 £0 £0 £0
2 £171,075 £0 £0 £0 £0
3 £948,125 £493,745 £493,745 £308,832 £308,832
4 £4,144,985 £2,936,819 £2,936,819 £2,538,029 £2,538,029
5 £5,442,522 £3,903,033 £3,903,033 £3,418,638 £3,418,638
1 £0 £0 £0 £0 £0
2 £127,295 £0 £0 £0 £0
3 £873,823 £485,977 £459,530 £369,519 £262,763
4 £4,036,794 £3,050,590 £2,916,147 £2,720,066 £2,456,547
5 £5,312,766 £4,079,470 £3,902,936 £3,664,763 £3,322,519
1 £0 £0 £0 £0 £0
2 £73,968 £0 £0 £0 £0
3 £777,732 £410,346 £346,289 £260,036 £208,301
4 £3,765,797 £2,810,775 £2,639,648 £2,427,405 £2,272,705
5 £4,934,623 £3,738,410 £3,520,318 £3,258,988 £3,057,322
Source: Adams Integra, August 2012
10 Unit Scheme
20 Unit Scheme
50 Unit Scheme
Table 40b: Summary of Residual Land Value (value per Hectare) Appraisals
for All Value Points
0%, 25%, 30%, 35% and 40% Affordable Housing
70% Social Rent/30% Shared Ownership
Planning Infrastructure Level £0, £80 CIL
Low Density
Houses Only Schemes
Appendix 3b-i

Appendix 3b-i
Graph 40b: Summary of Residual Land Values (value per Hectare) at 0%, 25%, 30%, 35%
& 40% Affordable Housing Across all Value Points
70% Social Rent/30% Shared Ownership
Planning Infrastructure Level £0, £80 CIL
Low Density
Houses Only Schemes
£0
£500,000
£1,000,000
£1,500,000
£2,000,000
£2,500,000
£3,000,000
£3,500,000
£4,000,000
£4,500,000
£5,000,000
£5,500,000
£6,000,000
1 2 3 4 5 1 2 3 4 5 1 2 3 4 5
10 Unit Scheme 20 Unit Scheme 50 Unit Scheme
Resid
ual Lan
d V
alu
e (%
o
f G
DV
)
Residual Land Value - 0% Affordable Residual Land Value - 25% Affordable Residual Land Value - 30% Affordable
Residual Land Value - 35% Affordable Residual Land Value - 40% Affordable

Development Scenario /
Threshold Value Point
Residual Land
Value - 0%
Affordable
Residual Land
Value - 25%
Affordable
Residual Land
Value - 30%
Affordable
Residual Land
Value - 35%
Affordable
Residual Land
Value - 40%
Affordable
1 £0 £0 £0 £0 £0
2 £35,887 £0 £0 £0 £0
3 £190,439 £87,969 £87,969 £31,791 £31,791
4 £782,335 £531,026 £531,026 £401,175 £401,175
5 £1,048,599 £734,900 £734,900 £560,886 £560,886
1 £0 £0 £0 £0 £0
2 £59,900 £0 £0 £0 £0
3 £349,562 £155,392 £142,035 £96,575 £41,330
4 £1,604,217 £1,111,114 £1,043,893 £945,852 £814,093
5 £2,153,348 £1,536,701 £1,448,433 £1,329,347 £1,158,225
1 £0 £0 £0 £0 £0
2 £92,973 £0 £0 £0 £0
3 £807,051 £343,191 £268,525 £163,839 £100,584
4 £3,662,938 £2,527,720 £2,362,296 £2,133,540 £1,919,330
5 £4,935,252 £3,503,748 £3,299,152 £3,010,772 £2,737,855
Source: Adams Integra, August 2012
10 Unit Scheme
20 Unit Scheme
50 Unit Scheme
Table 41: Summary of Residual Land Value (£) Appraisals for
All Value Points
0%, 25%, 30%, 35% and 40% Affordable Housing
70% Social Rent/30% Shared Ownership
Planning Infrastructure Level £0, £80 CIL
Medium Density
Houses Only Schemes
Appendix 3b-i

Appendix 3b-i
Graph 41: Summary of Residual Land Values at 0%, 25%, 30%, 35% & 40%
Affordable Housing Across All Value Points
70% Social Rent/30% Shared Ownership
Planning Infrastructure Level £0, £80 CIL
Medium Density
Houses Only Schemes
£0
£500,000
£1,000,000
£1,500,000
£2,000,000
£2,500,000
£3,000,000
£3,500,000
£4,000,000
£4,500,000
£5,000,000
£5,500,000
£6,000,000
1 2 3 4 5 1 2 3 4 5 1 2 3 4 5
10 Unit Scheme 20 Unit Scheme 50 Unit Scheme
Resid
ual Lan
d V
alu
e (£
)
Residual Land Value - 0% Affordable Residual Land Value - 25% Affordable Residual Land Value - 30% Affordable
Residual Land Value - 35% Affordable Residual Land Value - 40% Affordable

Development Scenario /
Threshold Value Point
Residual Land
Value - 0%
Affordable
Residual Land
Value - 25%
Affordable
Residual Land
Value - 30%
Affordable
Residual Land
Value - 35%
Affordable
Residual Land
Value - 40%
Affordable
1 0.0% 0.0% 0.0% 0.0% 0.0%
2 2.1% 0.0% 0.0% 0.0% 0.0%
3 10.0% 5.2% 5.2% 2.0% 2.0%
4 27.9% 22.4% 22.4% 18.7% 18.7%
5 32.8% 27.5% 27.5% 23.5% 23.5%
1 0.0% 0.0% 0.0% 0.0% 0.0%
2 1.7% 0.0% 0.0% 0.0% 0.0%
3 8.9% 4.4% 4.1% 2.8% 1.2%
4 27.4% 22.2% 21.4% 20.1% 18.1%
5 32.1% 27.2% 26.3% 25.1% 23.1%
1 0.0% 0.0% 0.0% 0.0% 0.0%
2 1.1% 0.0% 0.0% 0.0% 0.0%
3 8.5% 4.0% 3.2% 2.0% 1.3%
4 26.2% 21.1% 20.2% 19.0% 17.7%
5 30.8% 26.0% 25.1% 23.9% 22.5%
Source: Adams Integra, August 2012
10 Unit Scheme
20 Unit Scheme
50 Unit Scheme
Table 41a: Summary of Residual Land Value (as % of GDV) Appraisals for
All Value Points
0%, 25%, 30%, 35% and 40% Affordable Housing
70% Social Rent/30% Shared Ownership
Planning Infrastructure Level £0, £80 CIL
Medium Density
Houses Only Schemes
Appendix 3b-i
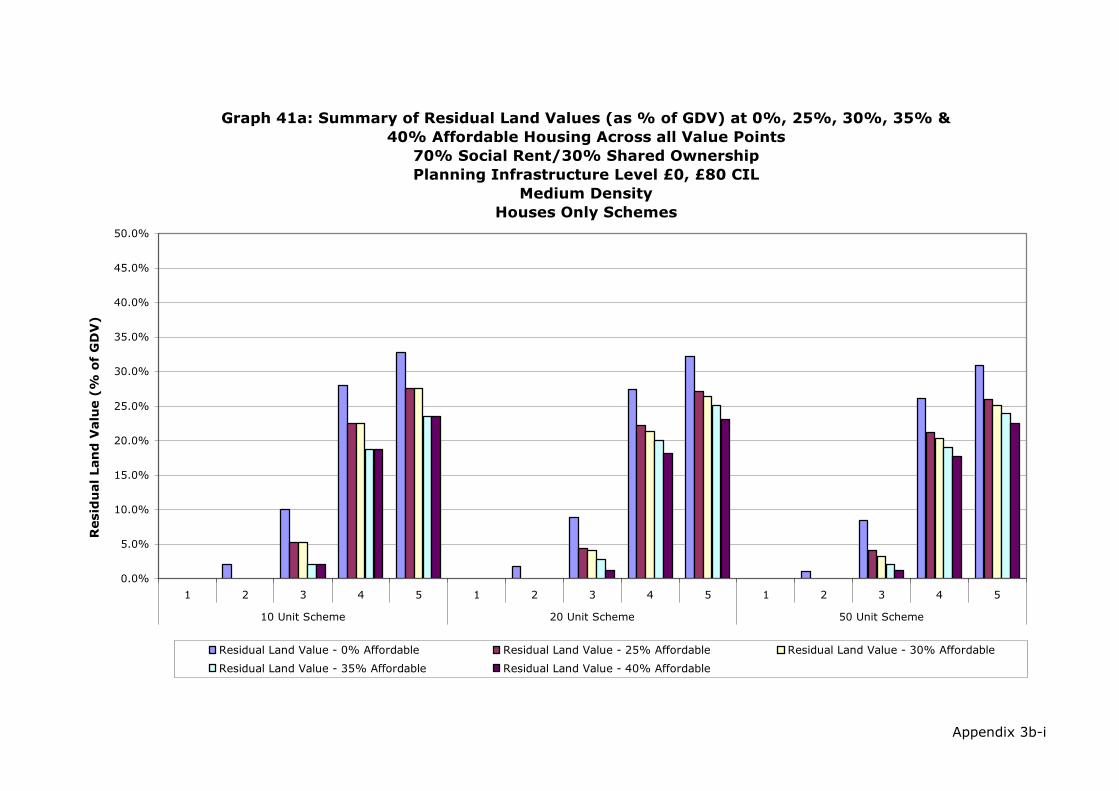
Appendix 3b-i
Graph 41a: Summary of Residual Land Values (as % of GDV) at 0%, 25%, 30%, 35% &
40% Affordable Housing Across all Value Points
70% Social Rent/30% Shared Ownership
Planning Infrastructure Level £0, £80 CIL
Medium Density
Houses Only Schemes
0.0%
5.0%
10.0%
15.0%
20.0%
25.0%
30.0%
35.0%
40.0%
45.0%
50.0%
1 2 3 4 5 1 2 3 4 5 1 2 3 4 5
10 Unit Scheme 20 Unit Scheme 50 Unit Scheme
Resid
ual Lan
d V
alu
e (%
o
f G
DV
)
Residual Land Value - 0% Affordable Residual Land Value - 25% Affordable Residual Land Value - 30% Affordable
Residual Land Value - 35% Affordable Residual Land Value - 40% Affordable

Development Scenario /
Threshold Value Point
Residual Land
Value - 0%
Affordable
Residual Land
Value - 25%
Affordable
Residual Land
Value - 30%
Affordable
Residual Land
Value - 35%
Affordable
Residual Land
Value - 40%
Affordable
1 £0 £0 £0 £0 £0
2 £161,490 £0 £0 £0 £0
3 £856,977 £395,862 £395,862 £143,060 £143,060
4 £3,520,508 £2,389,617 £2,389,617 £1,805,289 £1,805,289
5 £4,718,696 £3,307,052 £3,307,052 £2,523,988 £2,523,988
1 £0 £0 £0 £0 £0
2 £134,775 £0 £0 £0 £0
3 £786,514 £349,631 £319,578 £217,293 £92,993
4 £3,609,487 £2,500,007 £2,348,759 £2,128,168 £1,831,709
5 £4,845,034 £3,457,576 £3,258,975 £2,991,031 £2,606,007
1 £0 £0 £0 £0 £0
2 £83,676 £0 £0 £0 £0
3 £726,346 £308,872 £241,673 £147,455 £90,525
4 £3,296,644 £2,274,948 £2,126,066 £1,920,186 £1,727,397
5 £4,441,727 £3,153,373 £2,969,237 £2,709,695 £2,464,070
Source: Adams Integra, August 2012
10 Unit Scheme
20 Unit Scheme
50 Unit Scheme
Table 41b: Summary of Residual Land Value (value per Hectare) Appraisals
for All Value Points
0%, 25%, 30%, 35% and 40% Affordable Housing
70% Social Rent/30% Shared Ownership
Planning Infrastructure Level £0, £80 CIL
Medium Density
Houses Only Schemes
Appendix 3b-i

Appendix 3b-i
Graph 41b: Summary of Residual Land Values (value per Hectare) at 0%, 25%, 30%, 35%
& 40% Affordable Housing Across all Value Points
70% Social Rent/30% Shared Ownership
Planning Infrastructure Level £0, £80 CIL
Medium Density
Houses Only Schemes
£0
£500,000
£1,000,000
£1,500,000
£2,000,000
£2,500,000
£3,000,000
£3,500,000
£4,000,000
£4,500,000
£5,000,000
£5,500,000
£6,000,000
1 2 3 4 5 1 2 3 4 5 1 2 3 4 5
10 Unit Scheme 20 Unit Scheme 50 Unit Scheme
Resid
ual Lan
d V
alu
e (%
o
f G
DV
)
Residual Land Value - 0% Affordable Residual Land Value - 25% Affordable Residual Land Value - 30% Affordable
Residual Land Value - 35% Affordable Residual Land Value - 40% Affordable

Development Scenario /
Threshold Value Point
Residual Land
Value - 0%
Affordable
Residual Land
Value - 25%
Affordable
Residual Land
Value - 30%
Affordable
Residual Land
Value - 35%
Affordable
Residual Land
Value - 40%
Affordable
1 £0 £0 £0 £0 £0
2 £31,084 £0 £0 £0 £0
3 £176,410 £73,799 £73,799 £27,570 £27,570
4 £679,656 £432,809 £432,809 £332,073 £332,073
5 £888,227 £574,528 £574,528 £458,153 £458,153
1 £0 £0 £0 £0 £0
2 £46,221 £0 £0 £0 £0
3 £325,482 £141,970 £116,623 £84,772 £39,312
4 £1,322,404 £879,191 £839,886 £730,099 £632,059
5 £1,732,612 £1,185,955 £1,127,389 £996,556 £877,470
1 £0 £0 £0 £0 £0
2 £60,402 £0 £0 £0 £0
3 £785,474 £350,879 £265,171 £173,605 £104,793
4 £2,931,628 £1,887,082 £1,696,525 £1,456,354 £1,322,878
5 £3,893,579 £2,590,081 £2,358,618 £2,058,823 £1,886,175
Source: Adams Integra, August 2012
10 Unit Scheme
20 Unit Scheme
50 Unit Scheme
Table 42: Summary of Residual Land Value (£) Appraisals for
All Value Points
0%, 25%, 30%, 35% and 40% Affordable Housing
70% Social Rent/30% Shared Ownership
Planning Infrastructure Level £0, £80 CIL
High Density
Houses Only Schemes
Appendix 3b-i
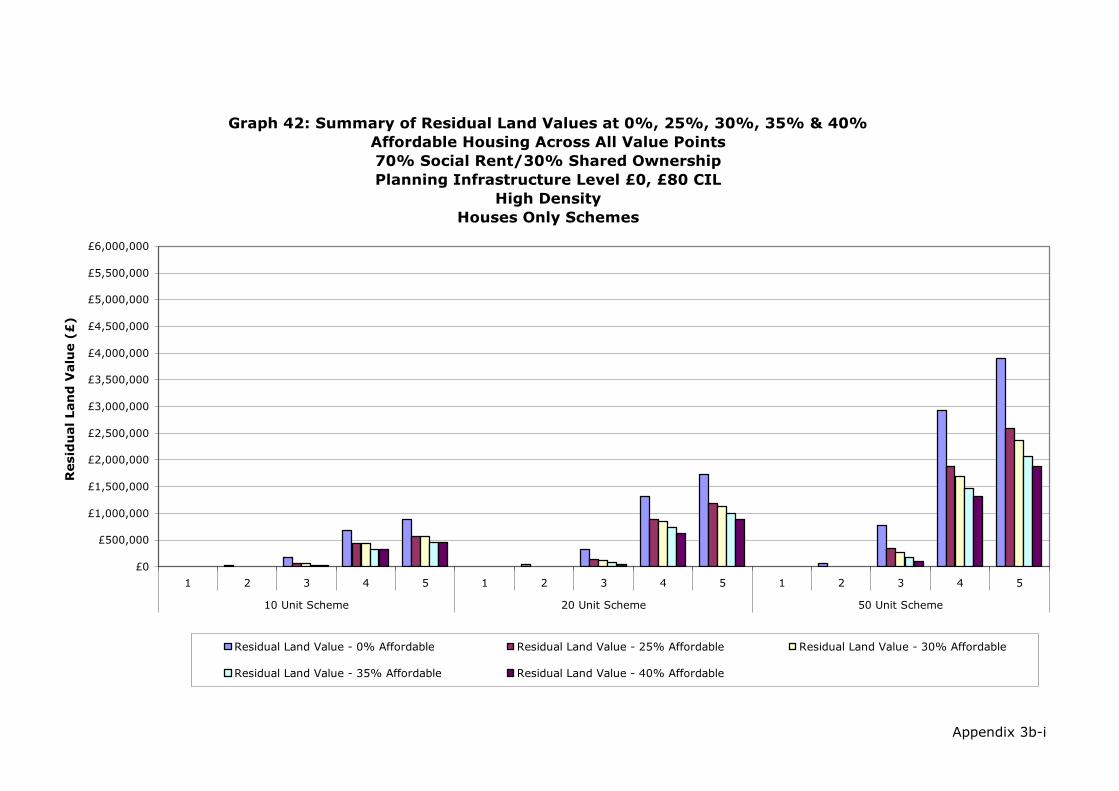
Appendix 3b-i
Graph 42: Summary of Residual Land Values at 0%, 25%, 30%, 35% & 40%
Affordable Housing Across All Value Points
70% Social Rent/30% Shared Ownership
Planning Infrastructure Level £0, £80 CIL
High Density
Houses Only Schemes
£0
£500,000
£1,000,000
£1,500,000
£2,000,000
£2,500,000
£3,000,000
£3,500,000
£4,000,000
£4,500,000
£5,000,000
£5,500,000
£6,000,000
1 2 3 4 5 1 2 3 4 5 1 2 3 4 5
10 Unit Scheme 20 Unit Scheme 50 Unit Scheme
Resid
ual Lan
d V
alu
e (£
)
Residual Land Value - 0% Affordable Residual Land Value - 25% Affordable Residual Land Value - 30% Affordable
Residual Land Value - 35% Affordable Residual Land Value - 40% Affordable

Development Scenario /
Threshold Value Point
Residual Land
Value - 0%
Affordable
Residual Land
Value - 25%
Affordable
Residual Land
Value - 30%
Affordable
Residual Land
Value - 35%
Affordable
Residual Land
Value - 40%
Affordable
1 0.0% 0.0% 0.0% 0.0% 0.0%
2 2.0% 0.0% 0.0% 0.0% 0.0%
3 9.9% 4.7% 4.7% 1.9% 1.9%
4 26.8% 20.6% 20.6% 17.2% 17.2%
5 31.2% 24.7% 24.7% 21.6% 21.6%
1 0.0% 0.0% 0.0% 0.0% 0.0%
2 1.5% 0.0% 0.0% 0.0% 0.0%
3 9.2% 4.5% 3.7% 2.8% 1.3%
4 26.1% 20.4% 19.9% 18.1% 16.3%
5 30.4% 24.9% 24.2% 22.4% 20.7%
1 0.0% 0.0% 0.0% 0.0% 0.0%
2 0.8% 0.0% 0.0% 0.0% 0.0%
3 9.4% 4.7% 3.6% 2.5% 1.5%
4 25.0% 19.2% 17.8% 16.0% 15.0%
5 29.4% 23.7% 22.4% 20.5% 19.4%
Source: Adams Integra, August 2012
10 Unit Scheme
20 Unit Scheme
50 Unit Scheme
Table 42a: Summary of Residual Land Value (as % of GDV) Appraisals for
All Value Points
0%, 25%, 30%, 35% and 40% Affordable Housing
70% Social Rent/30% Shared Ownership
Planning Infrastructure Level £0, £80 CIL
High Density
Houses Only Schemes
Appendix 3b-i
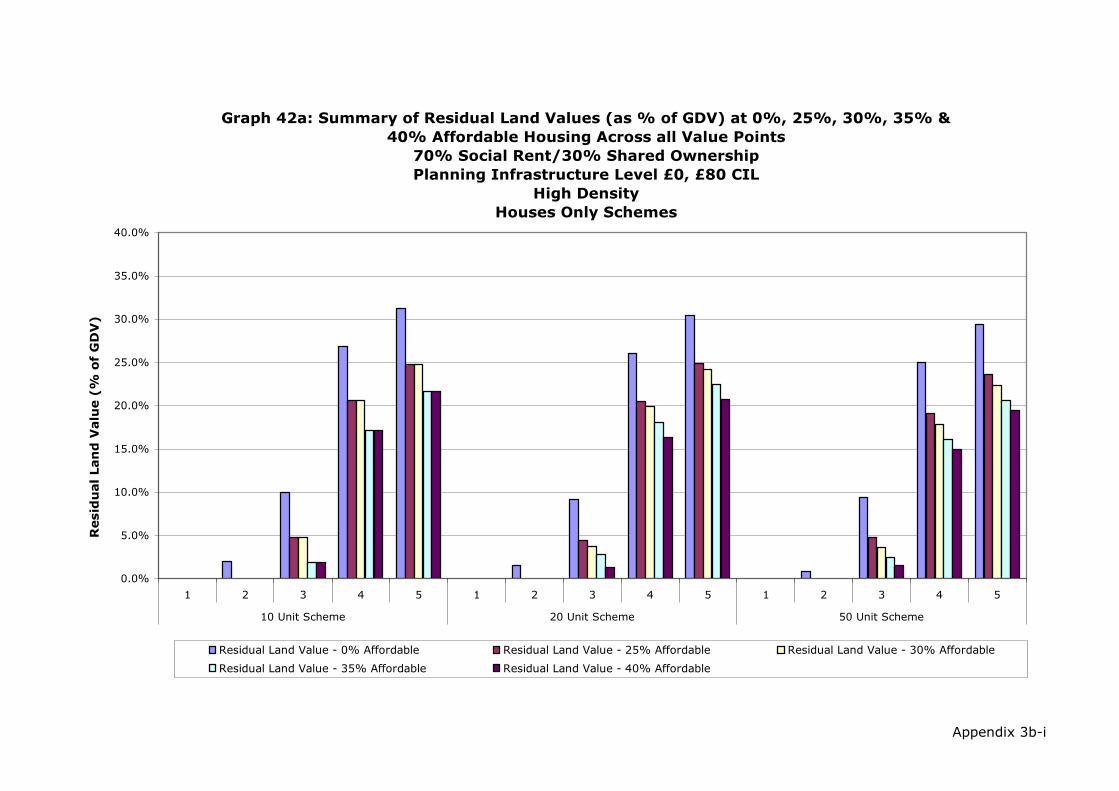
Appendix 3b-i
Graph 42a: Summary of Residual Land Values (as % of GDV) at 0%, 25%, 30%, 35% &
40% Affordable Housing Across all Value Points
70% Social Rent/30% Shared Ownership
Planning Infrastructure Level £0, £80 CIL
High Density
Houses Only Schemes
0.0%
5.0%
10.0%
15.0%
20.0%
25.0%
30.0%
35.0%
40.0%
1 2 3 4 5 1 2 3 4 5 1 2 3 4 5
10 Unit Scheme 20 Unit Scheme 50 Unit Scheme
Resid
ual Lan
d V
alu
e (%
o
f G
DV
)
Residual Land Value - 0% Affordable Residual Land Value - 25% Affordable Residual Land Value - 30% Affordable
Residual Land Value - 35% Affordable Residual Land Value - 40% Affordable

Development Scenario /
Threshold Value Point
Residual Land
Value - 0%
Affordable
Residual Land
Value - 25%
Affordable
Residual Land
Value - 30%
Affordable
Residual Land
Value - 35%
Affordable
Residual Land
Value - 40%
Affordable
1 £0 £0 £0 £0 £0
2 £155,418 £0 £0 £0 £0
3 £882,051 £368,993 £368,993 £137,852 £137,852
4 £3,398,281 £2,164,046 £2,164,046 £1,660,366 £1,660,366
5 £4,441,136 £2,872,642 £2,872,642 £2,290,764 £2,290,764
1 £0 £0 £0 £0 £0
2 £115,553 £0 £0 £0 £0
3 £813,705 £354,925 £291,558 £211,929 £98,279
4 £3,306,009 £2,197,977 £2,099,714 £1,825,248 £1,580,147
5 £4,331,531 £2,964,888 £2,818,472 £2,491,391 £2,193,676
1 £0 £0 £0 £0 £0
2 £60,402 £0 £0 £0 £0
3 £785,474 £350,879 £265,171 £173,605 £104,793
4 £2,931,628 £1,887,082 £1,696,525 £1,456,354 £1,322,878
5 £3,893,579 £2,590,081 £2,358,618 £2,058,823 £1,886,175
Source: Adams Integra, August 2012
10 Unit Scheme
20 Unit Scheme
50 Unit Scheme
Table 42b: Summary of Residual Land Value (value per Hectare) Appraisals
for All Value Points
0%, 25%, 30%, 35% and 40% Affordable Housing
70% Social Rent/30% Shared Ownership
Planning Infrastructure Level £0, £80 CIL
High Density
Houses Only Schemes
Appendix 3b-i

Appendix 3b-i
Graph 42b: Summary of Residual Land Values (value per Hectare) at 0%, 25%, 30%, 35%
& 40% Affordable Housing Across all Value Points
70% Social Rent/30% Shared Ownership
Planning Infrastructure Level £0, £80 CIL
High Density
Houses Only Schemes
£0
£500,000
£1,000,000
£1,500,000
£2,000,000
£2,500,000
£3,000,000
£3,500,000
£4,000,000
£4,500,000
£5,000,000
£5,500,000
£6,000,000
1 2 3 4 5 1 2 3 4 5 1 2 3 4 5
10 Unit Scheme 20 Unit Scheme 50 Unit Scheme
Resid
ual Lan
d V
alu
e (%
o
f G
DV
)
Residual Land Value - 0% Affordable Residual Land Value - 25% Affordable Residual Land Value - 30% Affordable
Residual Land Value - 35% Affordable Residual Land Value - 40% Affordable
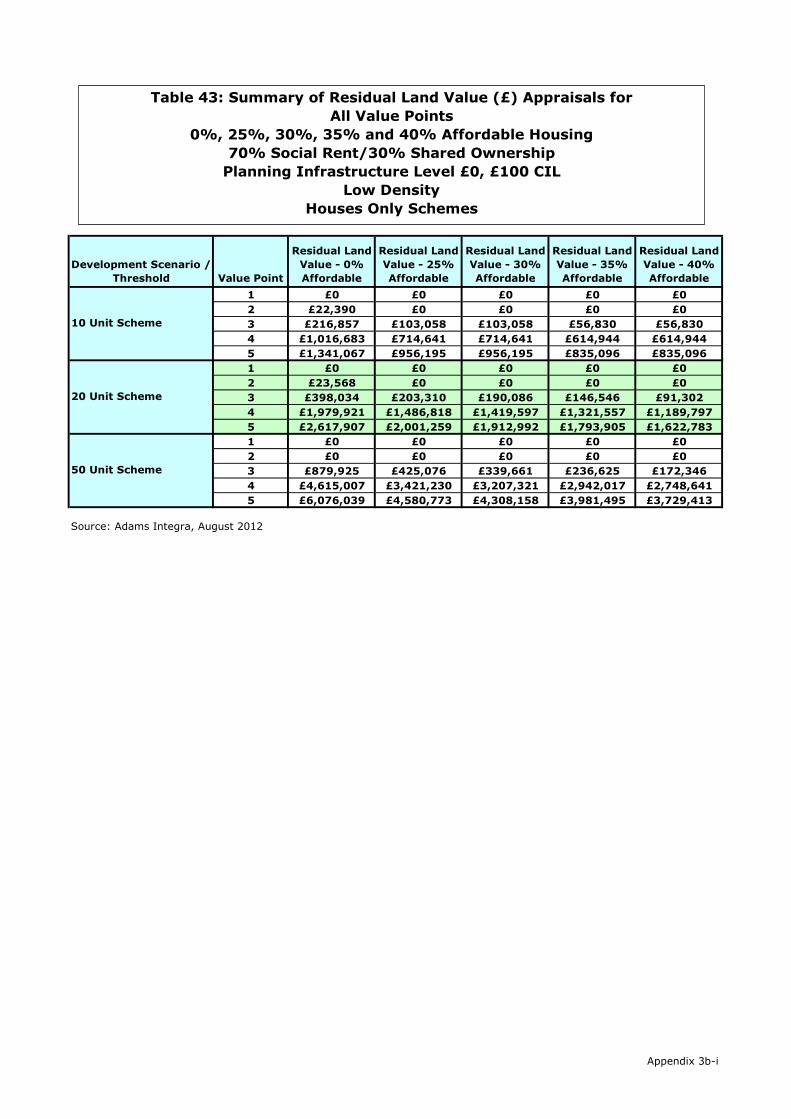
Development Scenario /
Threshold Value Point
Residual Land
Value - 0%
Affordable
Residual Land
Value - 25%
Affordable
Residual Land
Value - 30%
Affordable
Residual Land
Value - 35%
Affordable
Residual Land
Value - 40%
Affordable
1 £0 £0 £0 £0 £0
2 £22,390 £0 £0 £0 £0
3 £216,857 £103,058 £103,058 £56,830 £56,830
4 £1,016,683 £714,641 £714,641 £614,944 £614,944
5 £1,341,067 £956,195 £956,195 £835,096 £835,096
1 £0 £0 £0 £0 £0
2 £23,568 £0 £0 £0 £0
3 £398,034 £203,310 £190,086 £146,546 £91,302
4 £1,979,921 £1,486,818 £1,419,597 £1,321,557 £1,189,797
5 £2,617,907 £2,001,259 £1,912,992 £1,793,905 £1,622,783
1 £0 £0 £0 £0 £0
2 £0 £0 £0 £0 £0
3 £879,925 £425,076 £339,661 £236,625 £172,346
4 £4,615,007 £3,421,230 £3,207,321 £2,942,017 £2,748,641
5 £6,076,039 £4,580,773 £4,308,158 £3,981,495 £3,729,413
Source: Adams Integra, August 2012
10 Unit Scheme
20 Unit Scheme
50 Unit Scheme
Table 43: Summary of Residual Land Value (£) Appraisals for
All Value Points
0%, 25%, 30%, 35% and 40% Affordable Housing
70% Social Rent/30% Shared Ownership
Planning Infrastructure Level £0, £100 CIL
Low Density
Houses Only Schemes
Appendix 3b-i

Appendix 3b-i
Graph 43: Summary of Residual Land Values at 0%, 25%, 30%, 35% & 40%
Affordable Housing Across All Value Points
70% Social Rent/30% Shared Ownership
Planning Infrastructure Level £0, £100 CIL
Low Density
Houses Only Schemes
£0
£500,000
£1,000,000
£1,500,000
£2,000,000
£2,500,000
£3,000,000
£3,500,000
£4,000,000
£4,500,000
£5,000,000
£5,500,000
£6,000,000
£6,500,000
£7,000,000
£7,500,000
1 2 3 4 5 1 2 3 4 5 1 2 3 4 5
10 Unit Scheme 20 Unit Scheme 50 Unit Scheme
Resid
ual Lan
d V
alu
e (£
)
Residual Land Value - 0% Affordable Residual Land Value - 25% Affordable Residual Land Value - 30% Affordable
Residual Land Value - 35% Affordable Residual Land Value - 40% Affordable Residual Land Value - 40% Affordable
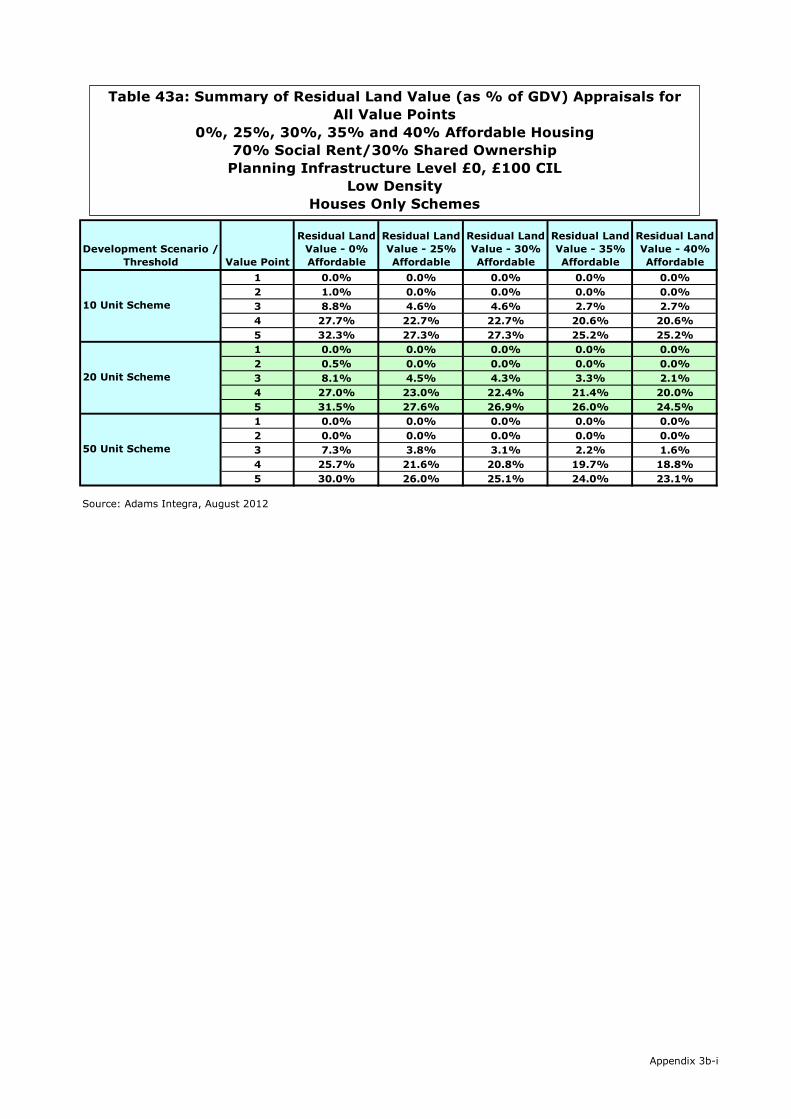
Development Scenario /
Threshold Value Point
Residual Land
Value - 0%
Affordable
Residual Land
Value - 25%
Affordable
Residual Land
Value - 30%
Affordable
Residual Land
Value - 35%
Affordable
Residual Land
Value - 40%
Affordable
1 0.0% 0.0% 0.0% 0.0% 0.0%
2 1.0% 0.0% 0.0% 0.0% 0.0%
3 8.8% 4.6% 4.6% 2.7% 2.7%
4 27.7% 22.7% 22.7% 20.6% 20.6%
5 32.3% 27.3% 27.3% 25.2% 25.2%
1 0.0% 0.0% 0.0% 0.0% 0.0%
2 0.5% 0.0% 0.0% 0.0% 0.0%
3 8.1% 4.5% 4.3% 3.3% 2.1%
4 27.0% 23.0% 22.4% 21.4% 20.0%
5 31.5% 27.6% 26.9% 26.0% 24.5%
1 0.0% 0.0% 0.0% 0.0% 0.0%
2 0.0% 0.0% 0.0% 0.0% 0.0%
3 7.3% 3.8% 3.1% 2.2% 1.6%
4 25.7% 21.6% 20.8% 19.7% 18.8%
5 30.0% 26.0% 25.1% 24.0% 23.1%
Source: Adams Integra, August 2012
10 Unit Scheme
20 Unit Scheme
50 Unit Scheme
Table 43a: Summary of Residual Land Value (as % of GDV) Appraisals for
All Value Points
0%, 25%, 30%, 35% and 40% Affordable Housing
70% Social Rent/30% Shared Ownership
Planning Infrastructure Level £0, £100 CIL
Low Density
Houses Only Schemes
Appendix 3b-i
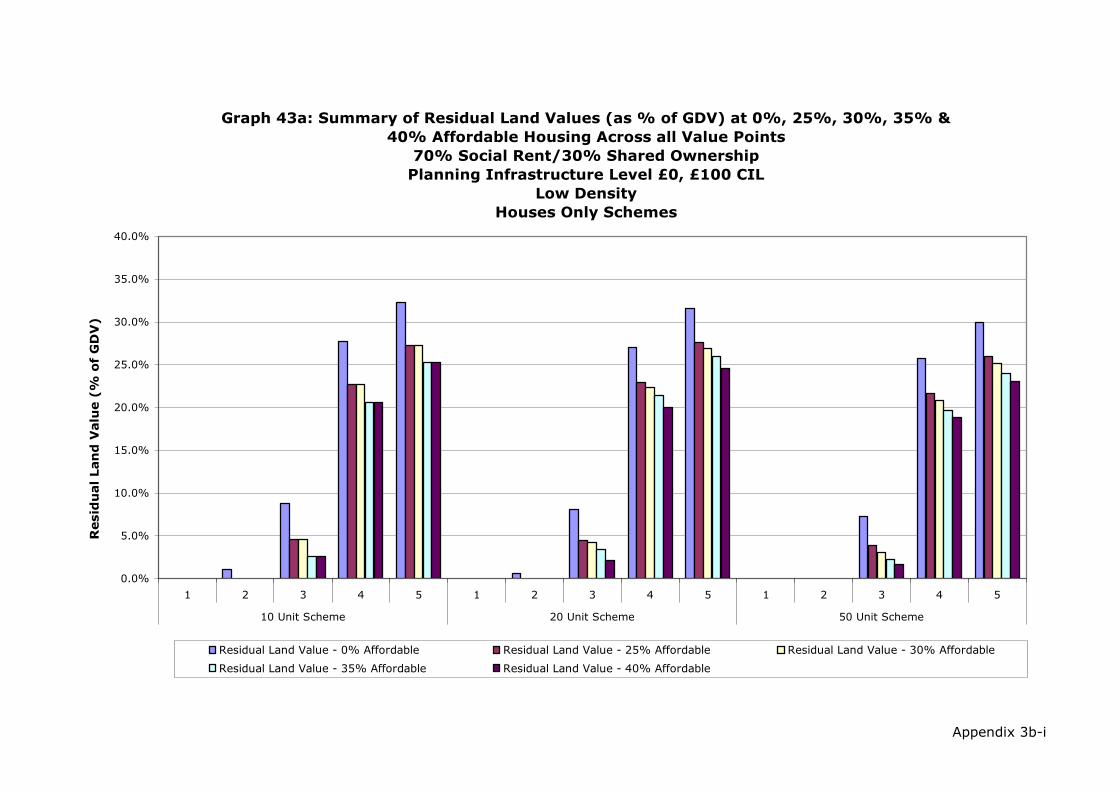
Appendix 3b-i
Graph 43a: Summary of Residual Land Values (as % of GDV) at 0%, 25%, 30%, 35% &
40% Affordable Housing Across all Value Points
70% Social Rent/30% Shared Ownership
Planning Infrastructure Level £0, £100 CIL
Low Density
Houses Only Schemes
0.0%
5.0%
10.0%
15.0%
20.0%
25.0%
30.0%
35.0%
40.0%
1 2 3 4 5 1 2 3 4 5 1 2 3 4 5
10 Unit Scheme 20 Unit Scheme 50 Unit Scheme
Resid
ual Lan
d V
alu
e (%
o
f G
DV
)
Residual Land Value - 0% Affordable Residual Land Value - 25% Affordable Residual Land Value - 30% Affordable
Residual Land Value - 35% Affordable Residual Land Value - 40% Affordable
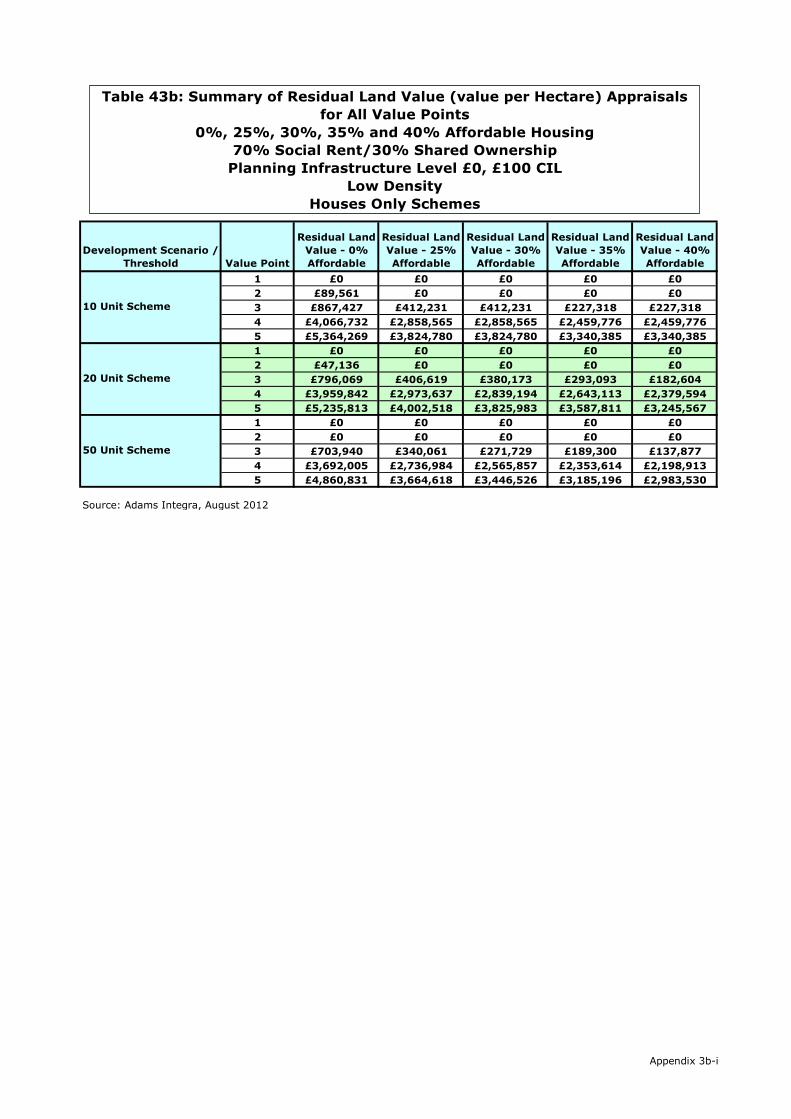
Development Scenario /
Threshold Value Point
Residual Land
Value - 0%
Affordable
Residual Land
Value - 25%
Affordable
Residual Land
Value - 30%
Affordable
Residual Land
Value - 35%
Affordable
Residual Land
Value - 40%
Affordable
1 £0 £0 £0 £0 £0
2 £89,561 £0 £0 £0 £0
3 £867,427 £412,231 £412,231 £227,318 £227,318
4 £4,066,732 £2,858,565 £2,858,565 £2,459,776 £2,459,776
5 £5,364,269 £3,824,780 £3,824,780 £3,340,385 £3,340,385
1 £0 £0 £0 £0 £0
2 £47,136 £0 £0 £0 £0
3 £796,069 £406,619 £380,173 £293,093 £182,604
4 £3,959,842 £2,973,637 £2,839,194 £2,643,113 £2,379,594
5 £5,235,813 £4,002,518 £3,825,983 £3,587,811 £3,245,567
1 £0 £0 £0 £0 £0
2 £0 £0 £0 £0 £0
3 £703,940 £340,061 £271,729 £189,300 £137,877
4 £3,692,005 £2,736,984 £2,565,857 £2,353,614 £2,198,913
5 £4,860,831 £3,664,618 £3,446,526 £3,185,196 £2,983,530
Source: Adams Integra, August 2012
10 Unit Scheme
20 Unit Scheme
50 Unit Scheme
Table 43b: Summary of Residual Land Value (value per Hectare) Appraisals
for All Value Points
0%, 25%, 30%, 35% and 40% Affordable Housing
70% Social Rent/30% Shared Ownership
Planning Infrastructure Level £0, £100 CIL
Low Density
Houses Only Schemes
Appendix 3b-i
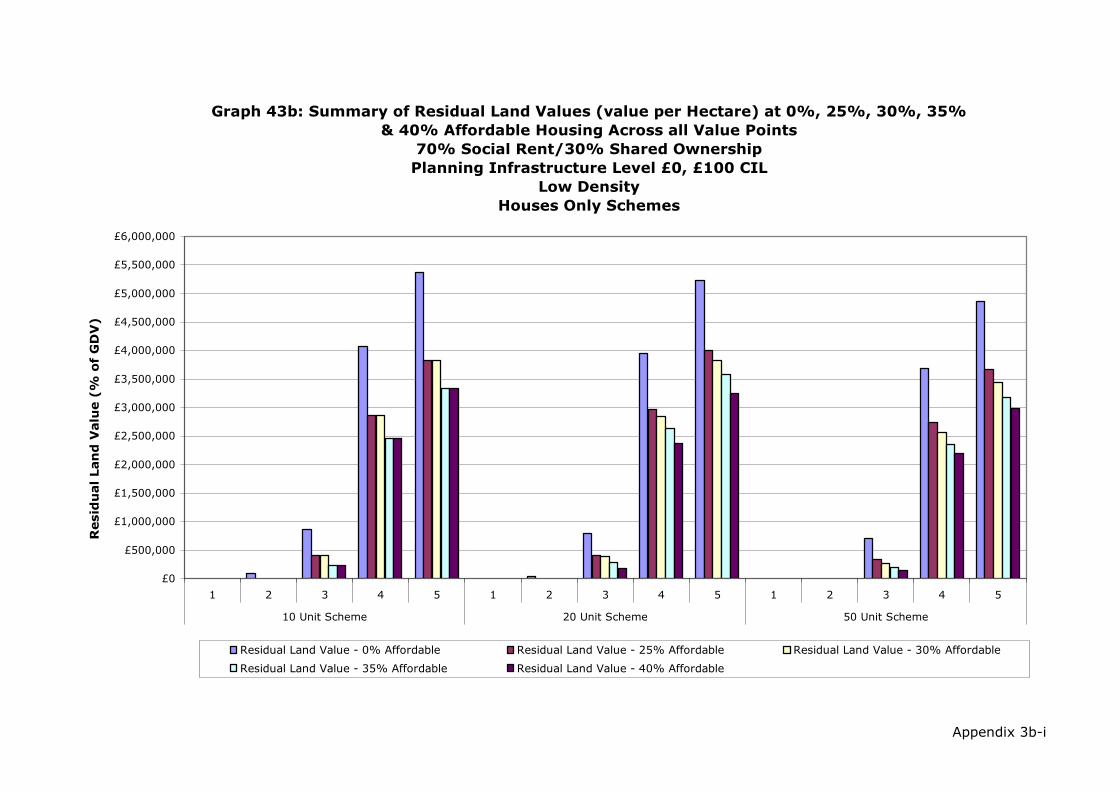
Appendix 3b-i
Graph 43b: Summary of Residual Land Values (value per Hectare) at 0%, 25%, 30%, 35%
& 40% Affordable Housing Across all Value Points
70% Social Rent/30% Shared Ownership
Planning Infrastructure Level £0, £100 CIL
Low Density
Houses Only Schemes
£0
£500,000
£1,000,000
£1,500,000
£2,000,000
£2,500,000
£3,000,000
£3,500,000
£4,000,000
£4,500,000
£5,000,000
£5,500,000
£6,000,000
1 2 3 4 5 1 2 3 4 5 1 2 3 4 5
10 Unit Scheme 20 Unit Scheme 50 Unit Scheme
Resid
ual Lan
d V
alu
e (%
o
f G
DV
)
Residual Land Value - 0% Affordable Residual Land Value - 25% Affordable Residual Land Value - 30% Affordable
Residual Land Value - 35% Affordable Residual Land Value - 40% Affordable

Development Scenario /
Threshold Value Point
Residual Land
Value - 0%
Affordable
Residual Land
Value - 25%
Affordable
Residual Land
Value - 30%
Affordable
Residual Land
Value - 35%
Affordable
Residual Land
Value - 40%
Affordable
1 £0 £0 £0 £0 £0
2 £20,273 £0 £0 £0 £0
3 £174,982 £72,356 £72,356 £16,178 £16,178
4 £767,346 £516,037 £516,037 £386,030 £386,030
5 £1,033,610 £719,912 £719,912 £545,897 £545,897
1 £0 £0 £0 £0 £0
2 £27,861 £0 £0 £0 £0
3 £318,484 £123,353 £109,996 £64,536 £9,291
4 £1,573,459 £1,080,357 £1,013,136 £915,095 £783,336
5 £2,122,591 £1,505,943 £1,417,676 £1,298,590 £1,127,468
1 £0 £0 £0 £0 £0
2 £18,367 £0 £0 £0 £0
3 £735,429 £270,823 £200,202 £89,232 £25,977
4 £3,591,316 £2,456,098 £2,290,674 £2,061,918 £1,847,708
5 £4,863,630 £3,432,126 £3,227,530 £2,939,150 £2,666,233
Source: Adams Integra, August 2012
10 Unit Scheme
20 Unit Scheme
50 Unit Scheme
Table 44: Summary of Residual Land Value (£) Appraisals for
All Value Points
0%, 25%, 30%, 35% and 40% Affordable Housing
70% Social Rent/30% Shared Ownership
Planning Infrastructure Level £0, £100 CIL
Medium Density
Houses Only Schemes
Appendix 3b-i
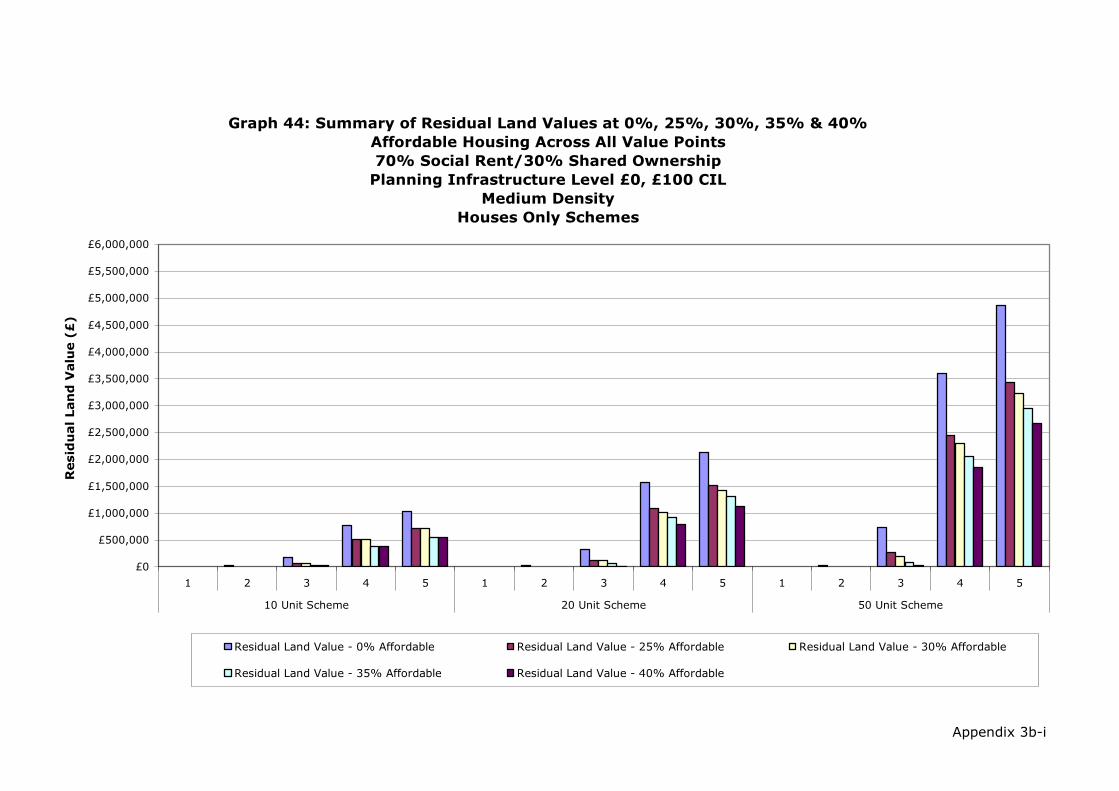
Appendix 3b-i
Graph 44: Summary of Residual Land Values at 0%, 25%, 30%, 35% & 40%
Affordable Housing Across All Value Points
70% Social Rent/30% Shared Ownership
Planning Infrastructure Level £0, £100 CIL
Medium Density
Houses Only Schemes
£0
£500,000
£1,000,000
£1,500,000
£2,000,000
£2,500,000
£3,000,000
£3,500,000
£4,000,000
£4,500,000
£5,000,000
£5,500,000
£6,000,000
1 2 3 4 5 1 2 3 4 5 1 2 3 4 5
10 Unit Scheme 20 Unit Scheme 50 Unit Scheme
Resid
ual Lan
d V
alu
e (£
)
Residual Land Value - 0% Affordable Residual Land Value - 25% Affordable Residual Land Value - 30% Affordable
Residual Land Value - 35% Affordable Residual Land Value - 40% Affordable

Development Scenario /
Threshold Value Point
Residual Land
Value - 0%
Affordable
Residual Land
Value - 25%
Affordable
Residual Land
Value - 30%
Affordable
Residual Land
Value - 35%
Affordable
Residual Land
Value - 40%
Affordable
1 0.0% 0.0% 0.0% 0.0% 0.0%
2 1.2% 0.0% 0.0% 0.0% 0.0%
3 9.2% 4.3% 4.3% 1.0% 1.0%
4 27.4% 21.8% 21.8% 18.0% 18.0%
5 32.3% 26.9% 26.9% 22.8% 22.8%
1 0.0% 0.0% 0.0% 0.0% 0.0%
2 0.8% 0.0% 0.0% 0.0% 0.0%
3 8.1% 3.5% 3.1% 1.9% 0.3%
4 26.8% 21.6% 20.8% 19.4% 17.4%
5 31.7% 26.6% 25.8% 24.5% 22.5%
1 0.0% 0.0% 0.0% 0.0% 0.0%
2 0.2% 0.0% 0.0% 0.0% 0.0%
3 7.7% 3.2% 2.4% 1.1% 0.3%
4 25.6% 20.5% 19.6% 18.3% 17.0%
5 30.4% 25.4% 24.6% 23.3% 21.9%
Source: Adams Integra, August 2012
10 Unit Scheme
20 Unit Scheme
50 Unit Scheme
Table 44a: Summary of Residual Land Value (as % of GDV) Appraisals for
All Value Points
0%, 25%, 30%, 35% and 40% Affordable Housing
70% Social Rent/30% Shared Ownership
Planning Infrastructure Level £0, £100 CIL
Medium Density
Houses Only Schemes
Appendix 3b-i

Appendix 3b-i
Graph 44a: Summary of Residual Land Values (as % of GDV) at 0%, 25%, 30%, 35% &
40% Affordable Housing Across all Value Points
70% Social Rent/30% Shared Ownership
Planning Infrastructure Level £0, £100 CIL
Medium Density
Houses Only Schemes
0.0%
5.0%
10.0%
15.0%
20.0%
25.0%
30.0%
35.0%
40.0%
45.0%
50.0%
1 2 3 4 5 1 2 3 4 5 1 2 3 4 5
10 Unit Scheme 20 Unit Scheme 50 Unit Scheme
Resid
ual Lan
d V
alu
e (%
o
f G
DV
)
Residual Land Value - 0% Affordable Residual Land Value - 25% Affordable Residual Land Value - 30% Affordable
Residual Land Value - 35% Affordable Residual Land Value - 40% Affordable

Development Scenario /
Threshold Value Point
Residual Land
Value - 0%
Affordable
Residual Land
Value - 25%
Affordable
Residual Land
Value - 30%
Affordable
Residual Land
Value - 35%
Affordable
Residual Land
Value - 40%
Affordable
1 £0 £0 £0 £0 £0
2 £91,230 £0 £0 £0 £0
3 £787,420 £325,603 £325,603 £72,800 £72,800
4 £3,453,058 £2,322,168 £2,322,168 £1,737,137 £1,737,137
5 £4,651,247 £3,239,603 £3,239,603 £2,456,538 £2,456,538
1 £0 £0 £0 £0 £0
2 £62,688 £0 £0 £0 £0
3 £716,590 £277,544 £247,491 £145,206 £20,906
4 £3,540,284 £2,430,804 £2,279,555 £2,058,964 £1,762,505
5 £4,775,830 £3,388,373 £3,189,771 £2,921,828 £2,536,803
1 £0 £0 £0 £0 £0
2 £16,530 £0 £0 £0 £0
3 £661,886 £243,741 £180,182 £80,309 £23,380
4 £3,232,184 £2,210,488 £2,061,606 £1,855,726 £1,662,938
5 £4,377,267 £3,088,913 £2,904,777 £2,645,235 £2,399,610
Source: Adams Integra, August 2012
10 Unit Scheme
20 Unit Scheme
50 Unit Scheme
Table 44b: Summary of Residual Land Value (value per Hectare) Appraisals
for All Value Points
0%, 25%, 30%, 35% and 40% Affordable Housing
70% Social Rent/30% Shared Ownership
Planning Infrastructure Level £0, £100 CIL
Medium Density
Houses Only Schemes
Appendix 3b-i

Appendix 3b-i
Graph 44b: Summary of Residual Land Values (value per Hectare) at 0%, 25%, 30%, 35%
& 40% Affordable Housing Across all Value Points
70% Social Rent/30% Shared Ownership
Planning Infrastructure Level £0, £100 CIL
Medium Density
Houses Only Schemes
£0
£500,000
£1,000,000
£1,500,000
£2,000,000
£2,500,000
£3,000,000
£3,500,000
£4,000,000
£4,500,000
£5,000,000
£5,500,000
£6,000,000
1 2 3 4 5 1 2 3 4 5 1 2 3 4 5
10 Unit Scheme 20 Unit Scheme 50 Unit Scheme
Resid
ual Lan
d V
alu
e (%
o
f G
DV
)
Residual Land Value - 0% Affordable Residual Land Value - 25% Affordable Residual Land Value - 30% Affordable
Residual Land Value - 35% Affordable Residual Land Value - 40% Affordable

Development Scenario /
Threshold Value Point
Residual Land
Value - 0%
Affordable
Residual Land
Value - 25%
Affordable
Residual Land
Value - 30%
Affordable
Residual Land
Value - 35%
Affordable
Residual Land
Value - 40%
Affordable
1 £0 £0 £0 £0 £0
2 £16,553 £0 £0 £0 £0
3 £163,662 £59,268 £59,268 £13,040 £13,040
4 £665,707 £418,715 £418,715 £317,979 £317,979
5 £874,278 £560,579 £560,579 £444,058 £444,058
1 £0 £0 £0 £0 £0
2 £17,644 £0 £0 £0 £0
3 £297,762 £113,393 £88,046 £56,194 £10,734
4 £1,294,969 £851,757 £812,451 £702,665 £604,624
5 £1,705,178 £1,158,521 £1,099,954 £969,122 £850,036
1 £0 £0 £0 £0 £0
2 £0 £0 £0 £0 £0
3 £723,788 £288,550 £207,024 £109,349 £40,536
4 £2,869,942 £1,825,396 £1,634,839 £1,394,668 £1,261,192
5 £3,831,893 £2,528,395 £2,296,932 £1,997,137 £1,824,489
Source: Adams Integra, August 2012
10 Unit Scheme
20 Unit Scheme
50 Unit Scheme
Table 45: Summary of Residual Land Value (£) Appraisals for
All Value Points
0%, 25%, 30%, 35% and 40% Affordable Housing
70% Social Rent/30% Shared Ownership
Planning Infrastructure Level £0, £100 CIL
High Density
Houses Only Schemes
Appendix 3b-i

Appendix 3b-i
Graph 45: Summary of Residual Land Values at 0%, 25%, 30%, 35% & 40%
Affordable Housing Across All Value Points
70% Social Rent/30% Shared Ownership
Planning Infrastructure Level £0, £100 CIL
High Density
Houses Only Schemes
£0
£500,000
£1,000,000
£1,500,000
£2,000,000
£2,500,000
£3,000,000
£3,500,000
£4,000,000
£4,500,000
£5,000,000
£5,500,000
£6,000,000
1 2 3 4 5 1 2 3 4 5 1 2 3 4 5
10 Unit Scheme 20 Unit Scheme 50 Unit Scheme
Resid
ual Lan
d V
alu
e (£
)
Residual Land Value - 0% Affordable Residual Land Value - 25% Affordable Residual Land Value - 30% Affordable
Residual Land Value - 35% Affordable Residual Land Value - 40% Affordable

Development Scenario /
Threshold Value Point
Residual Land
Value - 0%
Affordable
Residual Land
Value - 25%
Affordable
Residual Land
Value - 30%
Affordable
Residual Land
Value - 35%
Affordable
Residual Land
Value - 40%
Affordable
1 0.0% 0.0% 0.0% 0.0% 0.0%
2 1.1% 0.0% 0.0% 0.0% 0.0%
3 9.2% 3.8% 3.8% 0.9% 0.9%
4 26.2% 19.9% 19.9% 16.4% 16.4%
5 30.7% 24.1% 24.1% 20.9% 20.9%
1 0.0% 0.0% 0.0% 0.0% 0.0%
2 0.6% 0.0% 0.0% 0.0% 0.0%
3 8.4% 3.6% 2.8% 1.8% 0.4%
4 25.5% 19.8% 19.3% 17.4% 15.6%
5 29.9% 24.3% 23.6% 21.8% 20.0%
1 0.0% 0.0% 0.0% 0.0% 0.0%
2 0.0% 0.0% 0.0% 0.0% 0.0%
3 8.6% 3.9% 2.8% 1.5% 0.6%
4 24.4% 18.5% 17.2% 15.4% 14.3%
5 28.9% 23.1% 21.8% 19.9% 18.8%
Source: Adams Integra, August 2012
10 Unit Scheme
20 Unit Scheme
50 Unit Scheme
Table 45a: Summary of Residual Land Value (as % of GDV) Appraisals for
All Value Points
0%, 25%, 30%, 35% and 40% Affordable Housing
70% Social Rent/30% Shared Ownership
Planning Infrastructure Level £0, £100 CIL
High Density
Houses Only Schemes
Appendix 3b-i
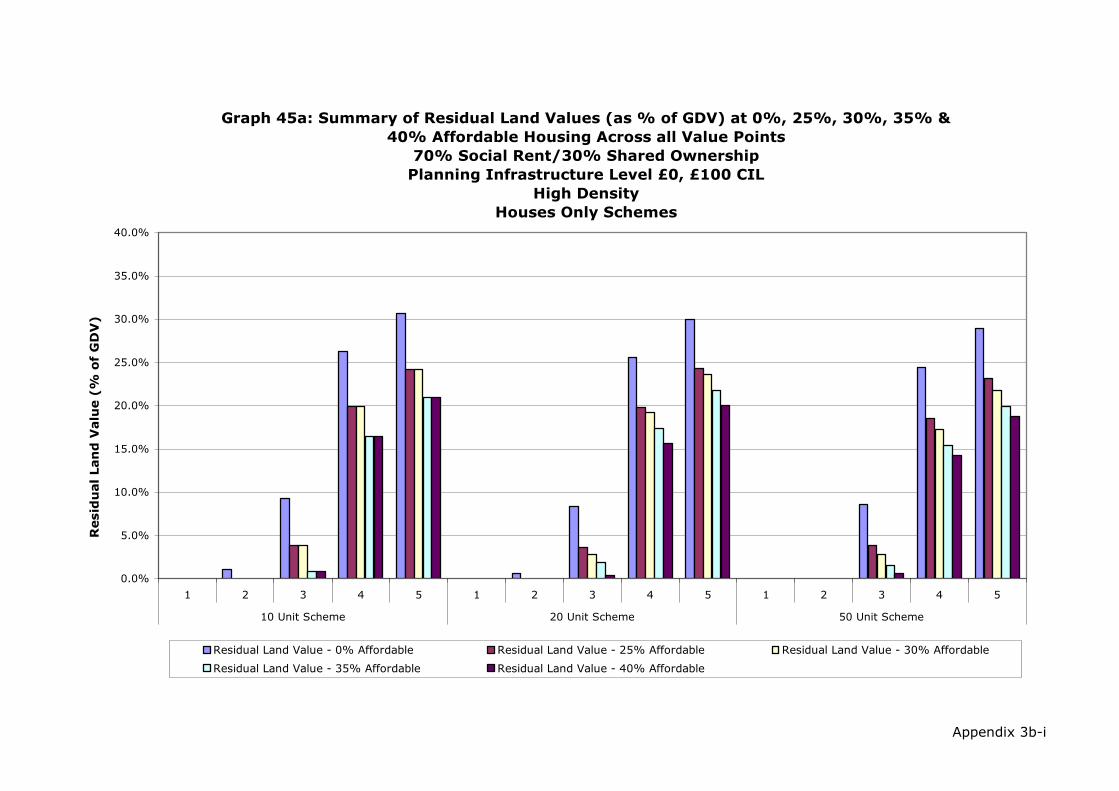
Appendix 3b-i
Graph 45a: Summary of Residual Land Values (as % of GDV) at 0%, 25%, 30%, 35% &
40% Affordable Housing Across all Value Points
70% Social Rent/30% Shared Ownership
Planning Infrastructure Level £0, £100 CIL
High Density
Houses Only Schemes
0.0%
5.0%
10.0%
15.0%
20.0%
25.0%
30.0%
35.0%
40.0%
1 2 3 4 5 1 2 3 4 5 1 2 3 4 5
10 Unit Scheme 20 Unit Scheme 50 Unit Scheme
Resid
ual Lan
d V
alu
e (%
o
f G
DV
)
Residual Land Value - 0% Affordable Residual Land Value - 25% Affordable Residual Land Value - 30% Affordable
Residual Land Value - 35% Affordable Residual Land Value - 40% Affordable

Development Scenario /
Threshold Value Point
Residual Land
Value - 0%
Affordable
Residual Land
Value - 25%
Affordable
Residual Land
Value - 30%
Affordable
Residual Land
Value - 35%
Affordable
Residual Land
Value - 40%
Affordable
1 £0 £0 £0 £0 £0
2 £82,766 £0 £0 £0 £0
3 £818,310 £296,342 £296,342 £65,201 £65,201
4 £3,328,536 £2,093,574 £2,093,574 £1,589,895 £1,589,895
5 £4,371,390 £2,802,897 £2,802,897 £2,220,292 £2,220,292
1 £0 £0 £0 £0 £0
2 £44,109 £0 £0 £0 £0
3 £744,404 £283,481 £220,114 £140,485 £26,835
4 £3,237,423 £2,129,391 £2,031,128 £1,756,662 £1,511,561
5 £4,262,945 £2,896,302 £2,749,886 £2,422,805 £2,125,090
1 £0 £0 £0 £0 £0
2 £0 £0 £0 £0 £0
3 £723,788 £288,550 £207,024 £109,349 £40,536
4 £2,869,942 £1,825,396 £1,634,839 £1,394,668 £1,261,192
5 £3,831,893 £2,528,395 £2,296,932 £1,997,137 £1,824,489
Source: Adams Integra, August 2012
10 Unit Scheme
20 Unit Scheme
50 Unit Scheme
Table 45b: Summary of Residual Land Value (value per Hectare) Appraisals
for All Value Points
0%, 25%, 30%, 35% and 40% Affordable Housing
70% Social Rent/30% Shared Ownership
Planning Infrastructure Level £0, £100 CIL
High Density
Houses Only Schemes
Appendix 3b-i

Appendix 3b-i
Graph 45b: Summary of Residual Land Values (value per Hectare) at 0%, 25%, 30%, 35%
& 40% Affordable Housing Across all Value Points
70% Social Rent/30% Shared Ownership
Planning Infrastructure Level £0, £100 CIL
High Density
Houses Only Schemes
£0
£500,000
£1,000,000
£1,500,000
£2,000,000
£2,500,000
£3,000,000
£3,500,000
£4,000,000
£4,500,000
£5,000,000
£5,500,000
£6,000,000
1 2 3 4 5 1 2 3 4 5 1 2 3 4 5
10 Unit Scheme 20 Unit Scheme 50 Unit Scheme
Resid
ual Lan
d V
alu
e (%
o
f G
DV
)
Residual Land Value - 0% Affordable Residual Land Value - 25% Affordable Residual Land Value - 30% Affordable
Residual Land Value - 35% Affordable Residual Land Value - 40% Affordable

Appendix 4

Development Scenario /
Threshold Value Point
Residual Land
Value - 0%
Affordable
Residual Land
Value - 25%
Affordable
Residual Land
Value - 30%
Affordable
Residual Land
Value - 35%
Affordable
Residual Land
Value - 40%
Affordable
1 £0 £0 £0 £0 £0
2 £0 £0 £0 £0 £0
3 £103,695 £0 £0 £0 £0
4 £905,945 £603,903 £603,903 £504,206 £504,206
5 £1,230,329 £845,457 £845,457 £724,358 £724,358
1 £0 £0 £0 £0 £0
2 £0 £0 £0 £0 £0
3 £141,479 £0 £0 £0 £0
4 £1,332,977 £935,689 £837,096 £837,096 £769,496
5 £1,801,653 £1,301,288 £1,181,531 £1,181,531 £1,092,767
1 £0 £0 £0 £0 £0
2 £0 £0 £0 £0 £0
3 £178,560 £0 £0 £0 £0
4 £1,759,139 £1,266,037 £1,198,815 £1,100,775 £969,015
5 £2,397,125 £1,780,477 £1,692,210 £1,573,123 £1,402,001
1 £0 £0 £0 £0 £0
2 £0 £0 £0 £0 £0
3 £342,240 £0 £0 £0 £0
4 £4,073,793 £2,880,016 £2,666,108 £2,400,804 £2,207,428
5 £5,534,826 £4,039,559 £3,766,944 £3,440,282 £3,188,199
1 £0 £0 £0 £0 £0
2 £0 £0 £0 £0 £0
3 £314,530 £0 £0 £0 £0
4 £7,348,397 £5,138,795 £4,706,706 £4,255,274 £3,832,057
5 £10,101,067 £7,325,940 £6,780,746 £6,216,209 £5,679,887
1 £0 £0 £0 £0 £0
2 £0 £0 £0 £0 £0
3 £0 £0 £0 £0 £0
4 £4,247,300 £1,593,060 £1,059,472 £530,450 £0
5 £7,927,999 £4,583,411 £3,908,866 £3,243,700 £2,569,154
Source: Adams Integra, August 2012
100 Unit Scheme
500 Unit Scheme
10 Unit Scheme
15 Unit Scheme
20 Unit Scheme
50 Unit Scheme
Table 46: Summary of Residual Land Value (£) Appraisals for
All Value Points
0%, 25%, 30%, 35% and 40% Affordable Housing
70% Social Rent/30% Shared Ownership
Planning Infrastructure Level £0, £0 CIL
Code for Sustainable Homes Level 5
Low Density
Appendix 4

Appendix 4
Graph 46: Summary of Residual Land Values at 0%, 25%, 30%, 35% & 40%
Affordable Housing Across All Value Points
70% Social Rent/30% Shared Ownership
Planning Infrastructure Level £0, £0 CIL
CfSH Level 5
Low Density
£0
£1,000,000
£2,000,000
£3,000,000
£4,000,000
£5,000,000
£6,000,000
£7,000,000
£8,000,000
£9,000,000
£10,000,000
£11,000,000
1 2 3 4 5 1 2 3 4 5 1 2 3 4 5 1 2 3 4 5 1 2 3 4 5 1 2 3 4 5
10 Unit Scheme 15 Unit Scheme 20 Unit Scheme 50 Unit Scheme 100 Unit Scheme 500 Unit Scheme
Resid
ual Lan
d V
alu
e (£
)
Residual Land Value - 0% Affordable Residual Land Value - 25% Affordable Residual Land Value - 30% Affordable
Residual Land Value - 35% Affordable Residual Land Value - 40% Affordable Residual Land Value - 40% Affordable

Development Scenario /
Threshold Value Point
Residual Land
Value - 0%
Affordable
Residual Land
Value - 25%
Affordable
Residual Land
Value - 30%
Affordable
Residual Land
Value - 35%
Affordable
Residual Land
Value - 40%
Affordable
1 0.0% 0.0% 0.0% 0.0% 0.0%
2 0.0% 0.0% 0.0% 0.0% 0.0%
3 4.2% 0.0% 0.0% 0.0% 0.0%
4 24.7% 19.2% 19.2% 16.9% 16.9%
5 29.6% 24.1% 24.1% 21.9% 21.9%
1 0.0% 0.0% 0.0% 0.0% 0.0%
2 0.0% 0.0% 0.0% 0.0% 0.0%
3 3.8% 0.0% 0.0% 0.0% 0.0%
4 24.1% 19.3% 17.9% 17.9% 16.9%
5 28.8% 24.1% 22.7% 22.7% 21.6%
1 0.0% 0.0% 0.0% 0.0% 0.0%
2 0.0% 0.0% 0.0% 0.0% 0.0%
3 3.6% 0.0% 0.0% 0.0% 0.0%
4 24.0% 19.6% 18.9% 17.8% 16.3%
5 28.9% 24.5% 23.8% 22.8% 21.2%
1 0.0% 0.0% 0.0% 0.0% 0.0%
2 0.0% 0.0% 0.0% 0.0% 0.0%
3 2.8% 0.0% 0.0% 0.0% 0.0%
4 22.7% 18.2% 17.3% 16.0% 15.1%
5 27.3% 22.9% 21.9% 20.7% 19.7%
1 0.0% 0.0% 0.0% 0.0% 0.0%
2 0.0% 0.0% 0.0% 0.0% 0.0%
3 1.3% 0.0% 0.0% 0.0% 0.0%
4 20.5% 16.2% 15.2% 14.2% 13.1%
5 24.9% 20.7% 19.7% 18.7% 17.6%
1 0.0% 0.0% 0.0% 0.0% 0.0%
2 0.0% 0.0% 0.0% 0.0% 0.0%
3 0.0% 0.0% 0.0% 0.0% 0.0%
4 2.5% 1.1% 0.7% 0.4% 0.0%
5 4.1% 2.7% 2.4% 2.0% 1.6%
Source: Adams Integra, August 2012
100 Unit Scheme
500 Unit Scheme
10 Unit Scheme
15 Unit Scheme
20 Unit Scheme
50 Unit Scheme
Table 46a: Summary of Residual Land Value (as % of GDV) Appraisals for
All Value Points
0%, 25%, 30%, 35% and 40% Affordable Housing
70% Social Rent/30% Shared Ownership
Planning Infrastructure Level £0, £0 CIL
Code for Sustainable Homes Level 5
Low Density
Appendix 4
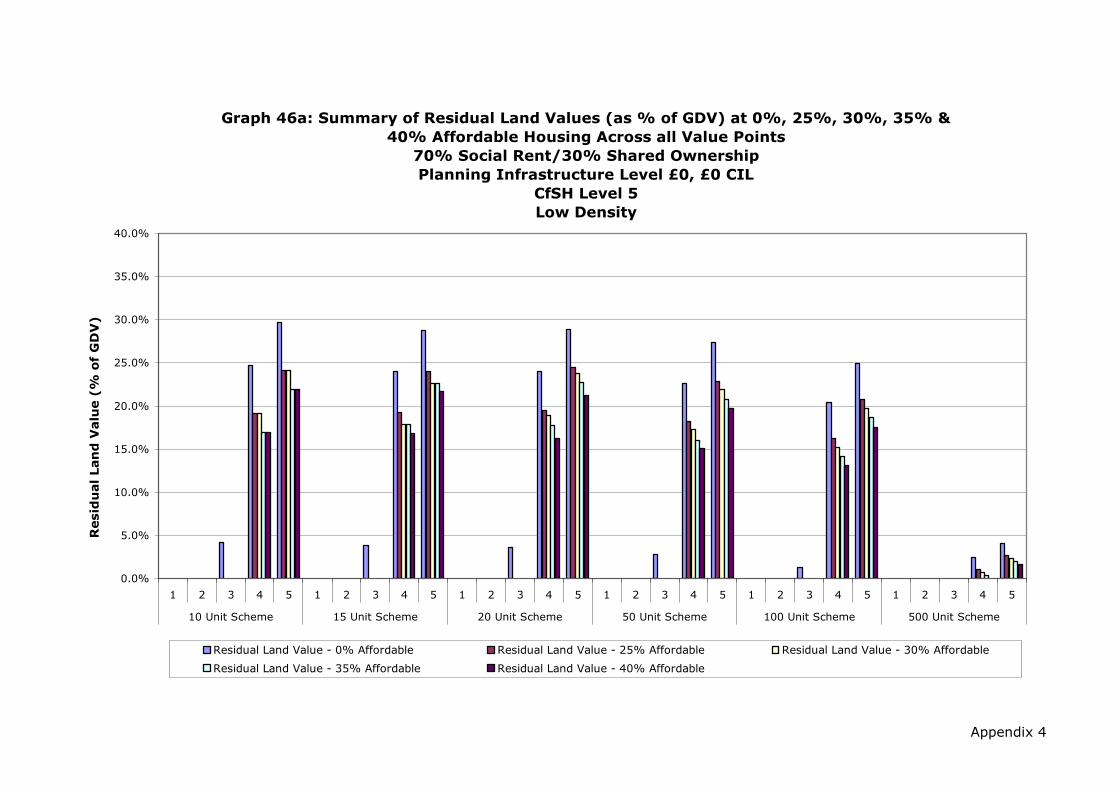
Appendix 4
Graph 46a: Summary of Residual Land Values (as % of GDV) at 0%, 25%, 30%, 35% &
40% Affordable Housing Across all Value Points
70% Social Rent/30% Shared Ownership
Planning Infrastructure Level £0, £0 CIL
CfSH Level 5
Low Density
0.0%
5.0%
10.0%
15.0%
20.0%
25.0%
30.0%
35.0%
40.0%
1 2 3 4 5 1 2 3 4 5 1 2 3 4 5 1 2 3 4 5 1 2 3 4 5 1 2 3 4 5
10 Unit Scheme 15 Unit Scheme 20 Unit Scheme 50 Unit Scheme 100 Unit Scheme 500 Unit Scheme
Resid
ual Lan
d V
alu
e (%
o
f G
DV
)
Residual Land Value - 0% Affordable Residual Land Value - 25% Affordable Residual Land Value - 30% Affordable
Residual Land Value - 35% Affordable Residual Land Value - 40% Affordable
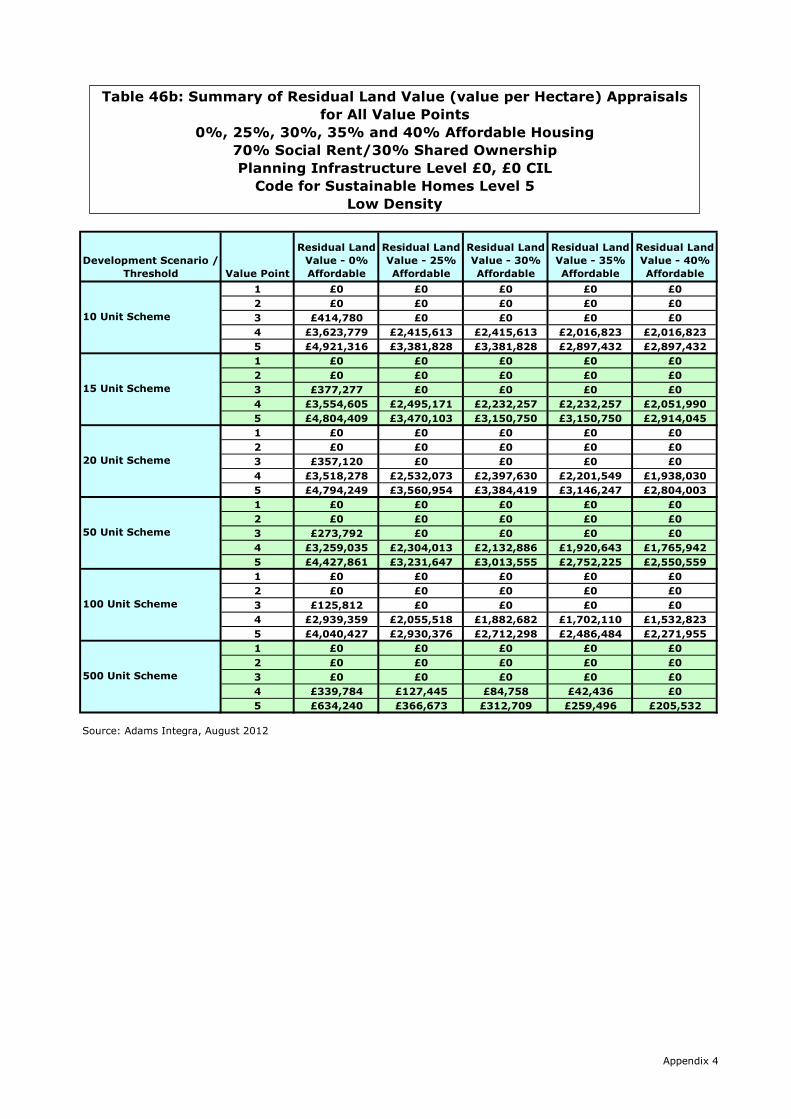
Development Scenario /
Threshold Value Point
Residual Land
Value - 0%
Affordable
Residual Land
Value - 25%
Affordable
Residual Land
Value - 30%
Affordable
Residual Land
Value - 35%
Affordable
Residual Land
Value - 40%
Affordable
1 £0 £0 £0 £0 £0
2 £0 £0 £0 £0 £0
3 £414,780 £0 £0 £0 £0
4 £3,623,779 £2,415,613 £2,415,613 £2,016,823 £2,016,823
5 £4,921,316 £3,381,828 £3,381,828 £2,897,432 £2,897,432
1 £0 £0 £0 £0 £0
2 £0 £0 £0 £0 £0
3 £377,277 £0 £0 £0 £0
4 £3,554,605 £2,495,171 £2,232,257 £2,232,257 £2,051,990
5 £4,804,409 £3,470,103 £3,150,750 £3,150,750 £2,914,045
1 £0 £0 £0 £0 £0
2 £0 £0 £0 £0 £0
3 £357,120 £0 £0 £0 £0
4 £3,518,278 £2,532,073 £2,397,630 £2,201,549 £1,938,030
5 £4,794,249 £3,560,954 £3,384,419 £3,146,247 £2,804,003
1 £0 £0 £0 £0 £0
2 £0 £0 £0 £0 £0
3 £273,792 £0 £0 £0 £0
4 £3,259,035 £2,304,013 £2,132,886 £1,920,643 £1,765,942
5 £4,427,861 £3,231,647 £3,013,555 £2,752,225 £2,550,559
1 £0 £0 £0 £0 £0
2 £0 £0 £0 £0 £0
3 £125,812 £0 £0 £0 £0
4 £2,939,359 £2,055,518 £1,882,682 £1,702,110 £1,532,823
5 £4,040,427 £2,930,376 £2,712,298 £2,486,484 £2,271,955
1 £0 £0 £0 £0 £0
2 £0 £0 £0 £0 £0
3 £0 £0 £0 £0 £0
4 £339,784 £127,445 £84,758 £42,436 £0
5 £634,240 £366,673 £312,709 £259,496 £205,532
Source: Adams Integra, August 2012
100 Unit Scheme
500 Unit Scheme
10 Unit Scheme
15 Unit Scheme
20 Unit Scheme
50 Unit Scheme
Table 46b: Summary of Residual Land Value (value per Hectare) Appraisals
for All Value Points
0%, 25%, 30%, 35% and 40% Affordable Housing
70% Social Rent/30% Shared Ownership
Planning Infrastructure Level £0, £0 CIL
Code for Sustainable Homes Level 5
Low Density
Appendix 4
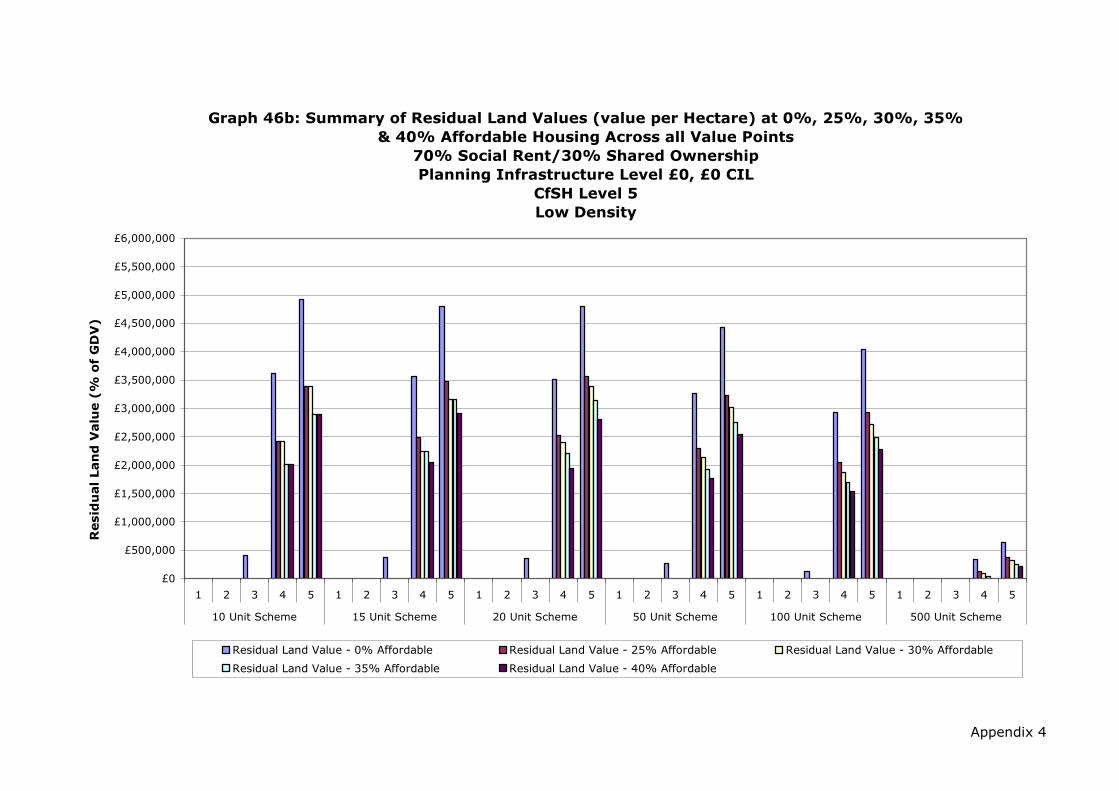
Appendix 4
Graph 46b: Summary of Residual Land Values (value per Hectare) at 0%, 25%, 30%, 35%
& 40% Affordable Housing Across all Value Points
70% Social Rent/30% Shared Ownership
Planning Infrastructure Level £0, £0 CIL
CfSH Level 5
Low Density
£0
£500,000
£1,000,000
£1,500,000
£2,000,000
£2,500,000
£3,000,000
£3,500,000
£4,000,000
£4,500,000
£5,000,000
£5,500,000
£6,000,000
1 2 3 4 5 1 2 3 4 5 1 2 3 4 5 1 2 3 4 5 1 2 3 4 5 1 2 3 4 5
10 Unit Scheme 15 Unit Scheme 20 Unit Scheme 50 Unit Scheme 100 Unit Scheme 500 Unit Scheme
Resid
ual Lan
d V
alu
e (%
o
f G
DV
)
Residual Land Value - 0% Affordable Residual Land Value - 25% Affordable Residual Land Value - 30% Affordable
Residual Land Value - 35% Affordable Residual Land Value - 40% Affordable
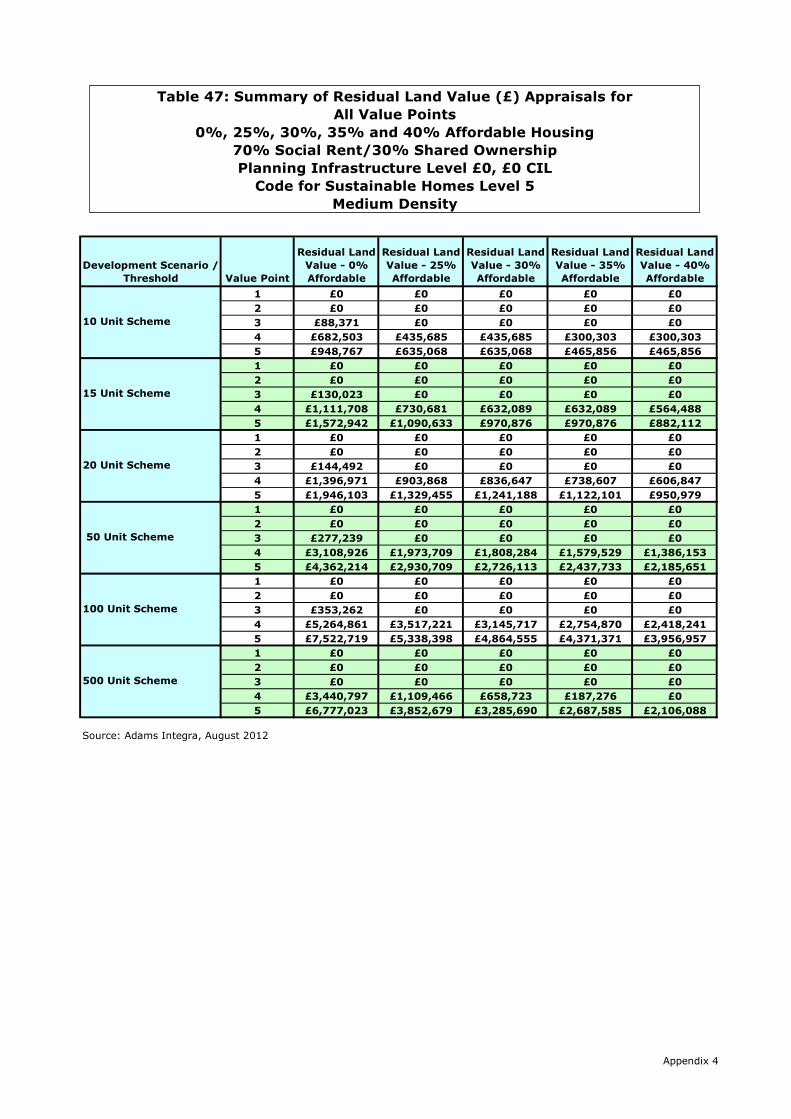
Development Scenario /
Threshold Value Point
Residual Land
Value - 0%
Affordable
Residual Land
Value - 25%
Affordable
Residual Land
Value - 30%
Affordable
Residual Land
Value - 35%
Affordable
Residual Land
Value - 40%
Affordable
1 £0 £0 £0 £0 £0
2 £0 £0 £0 £0 £0
3 £88,371 £0 £0 £0 £0
4 £682,503 £435,685 £435,685 £300,303 £300,303
5 £948,767 £635,068 £635,068 £465,856 £465,856
1 £0 £0 £0 £0 £0
2 £0 £0 £0 £0 £0
3 £130,023 £0 £0 £0 £0
4 £1,111,708 £730,681 £632,089 £632,089 £564,488
5 £1,572,942 £1,090,633 £970,876 £970,876 £882,112
1 £0 £0 £0 £0 £0
2 £0 £0 £0 £0 £0
3 £144,492 £0 £0 £0 £0
4 £1,396,971 £903,868 £836,647 £738,607 £606,847
5 £1,946,103 £1,329,455 £1,241,188 £1,122,101 £950,979
1 £0 £0 £0 £0 £0
2 £0 £0 £0 £0 £0
3 £277,239 £0 £0 £0 £0
4 £3,108,926 £1,973,709 £1,808,284 £1,579,529 £1,386,153
5 £4,362,214 £2,930,709 £2,726,113 £2,437,733 £2,185,651
1 £0 £0 £0 £0 £0
2 £0 £0 £0 £0 £0
3 £353,262 £0 £0 £0 £0
4 £5,264,861 £3,517,221 £3,145,717 £2,754,870 £2,418,241
5 £7,522,719 £5,338,398 £4,864,555 £4,371,371 £3,956,957
1 £0 £0 £0 £0 £0
2 £0 £0 £0 £0 £0
3 £0 £0 £0 £0 £0
4 £3,440,797 £1,109,466 £658,723 £187,276 £0
5 £6,777,023 £3,852,679 £3,285,690 £2,687,585 £2,106,088
Source: Adams Integra, August 2012
100 Unit Scheme
500 Unit Scheme
10 Unit Scheme
15 Unit Scheme
20 Unit Scheme
50 Unit Scheme
Table 47: Summary of Residual Land Value (£) Appraisals for
All Value Points
0%, 25%, 30%, 35% and 40% Affordable Housing
70% Social Rent/30% Shared Ownership
Planning Infrastructure Level £0, £0 CIL
Code for Sustainable Homes Level 5
Medium Density
Appendix 4

Appendix 4
Graph 47: Summary of Residual Land Values at 0%, 25%, 30%, 35% & 40%
Affordable Housing Across All Value Points
70% Social Rent/30% Shared Ownership
Planning Infrastructure Level £0, £0 CIL
CfSH Level 5
Medium Density
£0
£500,000
£1,000,000
£1,500,000
£2,000,000
£2,500,000
£3,000,000
£3,500,000
£4,000,000
£4,500,000
£5,000,000
£5,500,000
£6,000,000
£6,500,000
£7,000,000
£7,500,000
£8,000,000
1 2 3 4 5 1 2 3 4 5 1 2 3 4 5 1 2 3 4 5 1 2 3 4 5 1 2 3 4 5
10 Unit Scheme 15 Unit Scheme 20 Unit Scheme 50 Unit Scheme 100 Unit Scheme 500 Unit Scheme
Resid
ual Lan
d V
alu
e (£
)
Residual Land Value - 0% Affordable Residual Land Value - 25% Affordable Residual Land Value - 30% Affordable
Residual Land Value - 35% Affordable Residual Land Value - 40% Affordable

Development Scenario /
Threshold Value Point
Residual Land
Value - 0%
Affordable
Residual Land
Value - 25%
Affordable
Residual Land
Value - 30%
Affordable
Residual Land
Value - 35%
Affordable
Residual Land
Value - 40%
Affordable
1 0.0% 0.0% 0.0% 0.0% 0.0%
2 0.0% 0.0% 0.0% 0.0% 0.0%
3 4.6% 0.0% 0.0% 0.0% 0.0%
4 24.4% 18.4% 18.4% 14.0% 14.0%
5 29.6% 23.8% 23.8% 19.5% 19.5%
1 0.0% 0.0% 0.0% 0.0% 0.0%
2 0.0% 0.0% 0.0% 0.0% 0.0%
3 4.3% 0.0% 0.0% 0.0% 0.0%
4 24.7% 19.0% 17.2% 17.2% 15.9%
5 30.2% 24.8% 23.2% 23.2% 21.9%
1 0.0% 0.0% 0.0% 0.0% 0.0%
2 0.0% 0.0% 0.0% 0.0% 0.0%
3 3.7% 0.0% 0.0% 0.0% 0.0%
4 23.8% 18.0% 17.1% 15.7% 13.5%
5 29.0% 23.5% 22.6% 21.2% 19.0%
1 0.0% 0.0% 0.0% 0.0% 0.0%
2 0.0% 0.0% 0.0% 0.0% 0.0%
3 2.9% 0.0% 0.0% 0.0% 0.0%
4 22.4% 16.7% 15.7% 14.2% 12.9%
5 27.5% 22.0% 21.0% 19.5% 18.2%
1 0.0% 0.0% 0.0% 0.0% 0.0%
2 0.0% 0.0% 0.0% 0.0% 0.0%
3 1.9% 0.0% 0.0% 0.0% 0.0%
4 19.9% 15.3% 14.1% 12.8% 11.6%
5 24.9% 20.5% 19.3% 18.0% 16.8%
1 0.0% 0.0% 0.0% 0.0% 0.0%
2 0.0% 0.0% 0.0% 0.0% 0.0%
3 0.0% 0.0% 0.0% 0.0% 0.0%
4 2.4% 0.9% 0.5% 0.2% 0.0%
5 4.1% 2.6% 2.3% 2.0% 1.6%
Source: Adams Integra, August 2012
100 Unit Scheme
500 Unit Scheme
10 Unit Scheme
15 Unit Scheme
20 Unit Scheme
50 Unit Scheme
Table 47a: Summary of Residual Land Value (as % of GDV) Appraisals for
All Value Points
0%, 25%, 30%, 35% and 40% Affordable Housing
70% Social Rent/30% Shared Ownership
Planning Infrastructure Level £0, £0 CIL
Code for Sustainable Homes Level 5
Medium Density
Appendix 4
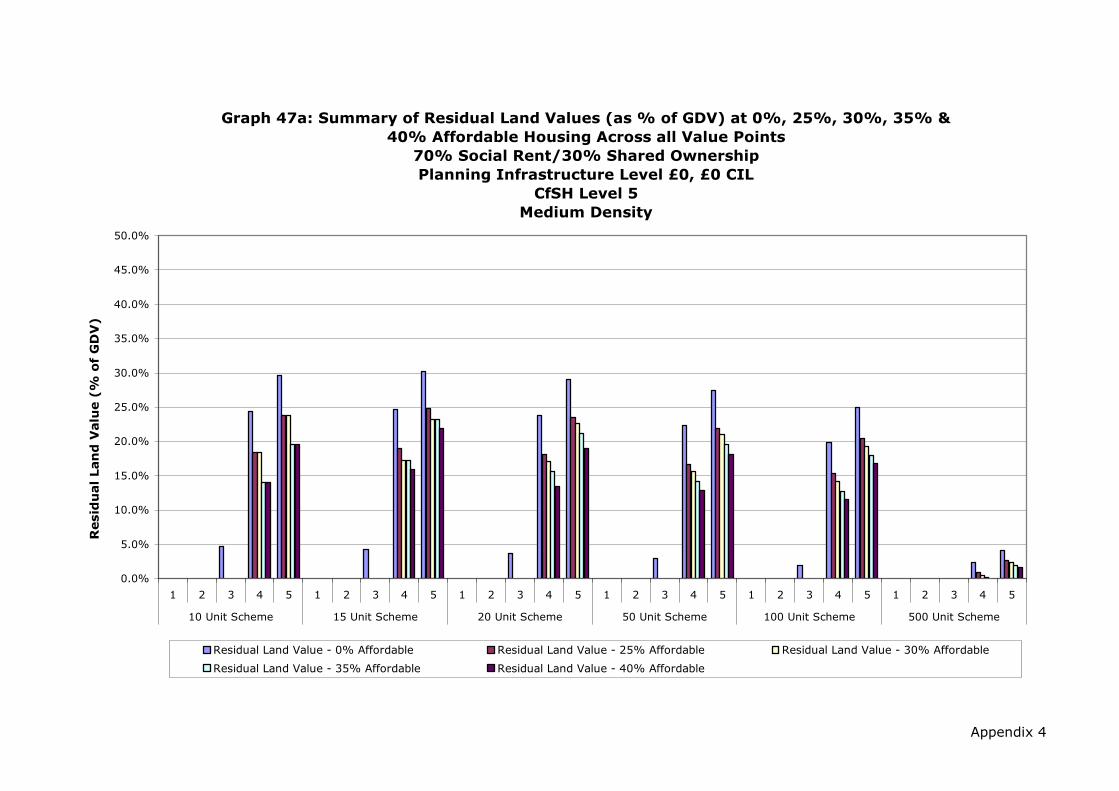
Appendix 4
Graph 47a: Summary of Residual Land Values (as % of GDV) at 0%, 25%, 30%, 35% &
40% Affordable Housing Across all Value Points
70% Social Rent/30% Shared Ownership
Planning Infrastructure Level £0, £0 CIL
CfSH Level 5
Medium Density
0.0%
5.0%
10.0%
15.0%
20.0%
25.0%
30.0%
35.0%
40.0%
45.0%
50.0%
1 2 3 4 5 1 2 3 4 5 1 2 3 4 5 1 2 3 4 5 1 2 3 4 5 1 2 3 4 5
10 Unit Scheme 15 Unit Scheme 20 Unit Scheme 50 Unit Scheme 100 Unit Scheme 500 Unit Scheme
Resid
ual Lan
d V
alu
e (%
o
f G
DV
)
Residual Land Value - 0% Affordable Residual Land Value - 25% Affordable Residual Land Value - 30% Affordable
Residual Land Value - 35% Affordable Residual Land Value - 40% Affordable
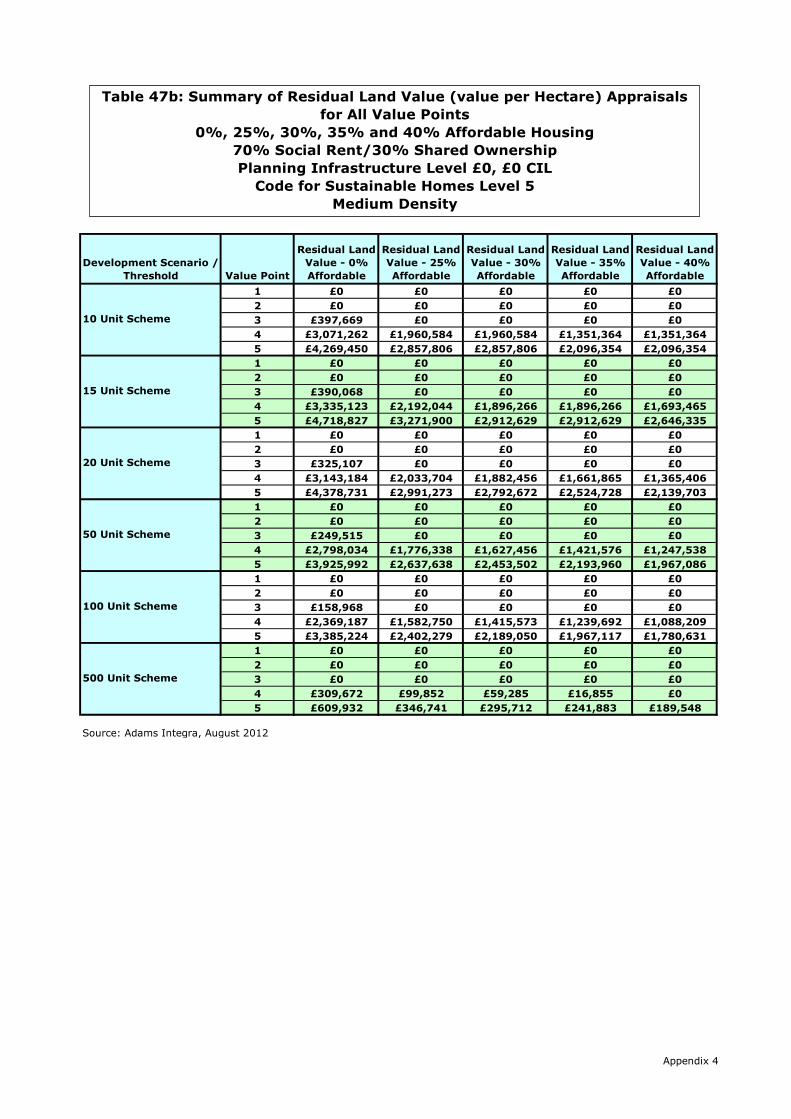
Development Scenario /
Threshold Value Point
Residual Land
Value - 0%
Affordable
Residual Land
Value - 25%
Affordable
Residual Land
Value - 30%
Affordable
Residual Land
Value - 35%
Affordable
Residual Land
Value - 40%
Affordable
1 £0 £0 £0 £0 £0
2 £0 £0 £0 £0 £0
3 £397,669 £0 £0 £0 £0
4 £3,071,262 £1,960,584 £1,960,584 £1,351,364 £1,351,364
5 £4,269,450 £2,857,806 £2,857,806 £2,096,354 £2,096,354
1 £0 £0 £0 £0 £0
2 £0 £0 £0 £0 £0
3 £390,068 £0 £0 £0 £0
4 £3,335,123 £2,192,044 £1,896,266 £1,896,266 £1,693,465
5 £4,718,827 £3,271,900 £2,912,629 £2,912,629 £2,646,335
1 £0 £0 £0 £0 £0
2 £0 £0 £0 £0 £0
3 £325,107 £0 £0 £0 £0
4 £3,143,184 £2,033,704 £1,882,456 £1,661,865 £1,365,406
5 £4,378,731 £2,991,273 £2,792,672 £2,524,728 £2,139,703
1 £0 £0 £0 £0 £0
2 £0 £0 £0 £0 £0
3 £249,515 £0 £0 £0 £0
4 £2,798,034 £1,776,338 £1,627,456 £1,421,576 £1,247,538
5 £3,925,992 £2,637,638 £2,453,502 £2,193,960 £1,967,086
1 £0 £0 £0 £0 £0
2 £0 £0 £0 £0 £0
3 £158,968 £0 £0 £0 £0
4 £2,369,187 £1,582,750 £1,415,573 £1,239,692 £1,088,209
5 £3,385,224 £2,402,279 £2,189,050 £1,967,117 £1,780,631
1 £0 £0 £0 £0 £0
2 £0 £0 £0 £0 £0
3 £0 £0 £0 £0 £0
4 £309,672 £99,852 £59,285 £16,855 £0
5 £609,932 £346,741 £295,712 £241,883 £189,548
Source: Adams Integra, August 2012
100 Unit Scheme
500 Unit Scheme
10 Unit Scheme
15 Unit Scheme
20 Unit Scheme
50 Unit Scheme
Table 47b: Summary of Residual Land Value (value per Hectare) Appraisals
for All Value Points
0%, 25%, 30%, 35% and 40% Affordable Housing
70% Social Rent/30% Shared Ownership
Planning Infrastructure Level £0, £0 CIL
Code for Sustainable Homes Level 5
Medium Density
Appendix 4

Appendix 4
Graph 47b: Summary of Residual Land Values (value per Hectare) at 0%, 25%, 30%, 35%
& 40% Affordable Housing Across all Value Points
70% Social Rent/30% Shared Ownership
Planning Infrastructure Level £0, £0 CIL
CfSH Level 5
Medium Density
£0
£500,000
£1,000,000
£1,500,000
£2,000,000
£2,500,000
£3,000,000
£3,500,000
£4,000,000
£4,500,000
£5,000,000
£5,500,000
£6,000,000
1 2 3 4 5 1 2 3 4 5 1 2 3 4 5 1 2 3 4 5 1 2 3 4 5 1 2 3 4 5
10 Unit Scheme 15 Unit Scheme 20 Unit Scheme 50 Unit Scheme 100 Unit Scheme 500 Unit Scheme
Resid
ual Lan
d V
alu
e (%
o
f G
DV
)
Residual Land Value - 0% Affordable Residual Land Value - 25% Affordable Residual Land Value - 30% Affordable
Residual Land Value - 35% Affordable Residual Land Value - 40% Affordable

Development Scenario /
Threshold Value Point
Residual Land
Value - 0%
Affordable
Residual Land
Value - 25%
Affordable
Residual Land
Value - 30%
Affordable
Residual Land
Value - 35%
Affordable
Residual Land
Value - 40%
Affordable
1 £0 £0 £0 £0 £0
2 £0 £0 £0 £0 £0
3 £50,614 £0 £0 £0 £0
4 £480,348 £231,090 £231,090 £129,573 £129,573
5 £656,799 £346,674 £346,674 £228,939 £228,939
1 £0 £0 £0 £0 £0
2 £0 £0 £0 £0 £0
3 £94,340 £0 £0 £0 £0
4 £663,795 £370,790 £271,170 £271,170 £248,278
5 £923,561 £553,903 £438,668 £438,668 £413,168
1 £0 £0 £0 £0 £0
2 £0 £0 £0 £0 £0
3 £134,702 £0 £0 £0 £0
4 £912,859 £519,654 £497,124 £403,241 £320,518
5 £1,269,261 £782,587 £757,491 £638,405 £537,274
1 £0 £0 £0 £0 £0
2 £0 £0 £0 £0 £0
3 £315,308 £0 £0 £0 £0
4 £2,313,441 £1,393,811 £1,251,852 £1,027,396 £919,293
5 £3,211,801 £2,068,835 £1,895,666 £1,613,319 £1,488,798
1 £0 £0 £0 £0 £0
2 £0 £0 £0 £0 £0
3 £378,237 £0 £0 £0 £0
4 £4,145,060 £2,494,188 £2,173,179 £1,823,140 £1,502,131
5 £5,837,623 £3,792,740 £3,386,162 £2,959,971 £2,553,393
1 £0 £0 £0 £0 £0
2 £0 £0 £0 £0 £0
3 £0 £0 £0 £0 £0
4 £2,826,756 £495,425 £46,543 £0 £0
5 £5,842,018 £2,917,674 £2,350,686 £1,752,580 £1,171,083
Source: Adams Integra, August 2012
100 Unit Scheme
500 Unit Scheme
10 Unit Scheme
15 Unit Scheme
20 Unit Scheme
50 Unit Scheme
Table 48: Summary of Residual Land Value (£) Appraisals for
All Value Points
0%, 25%, 30%, 35% and 40% Affordable Housing
70% Social Rent/30% Shared Ownership
Planning Infrastructure Level £0, £0 CIL
Code for Sustainable Homes Level 5
High Density
Appendix 4
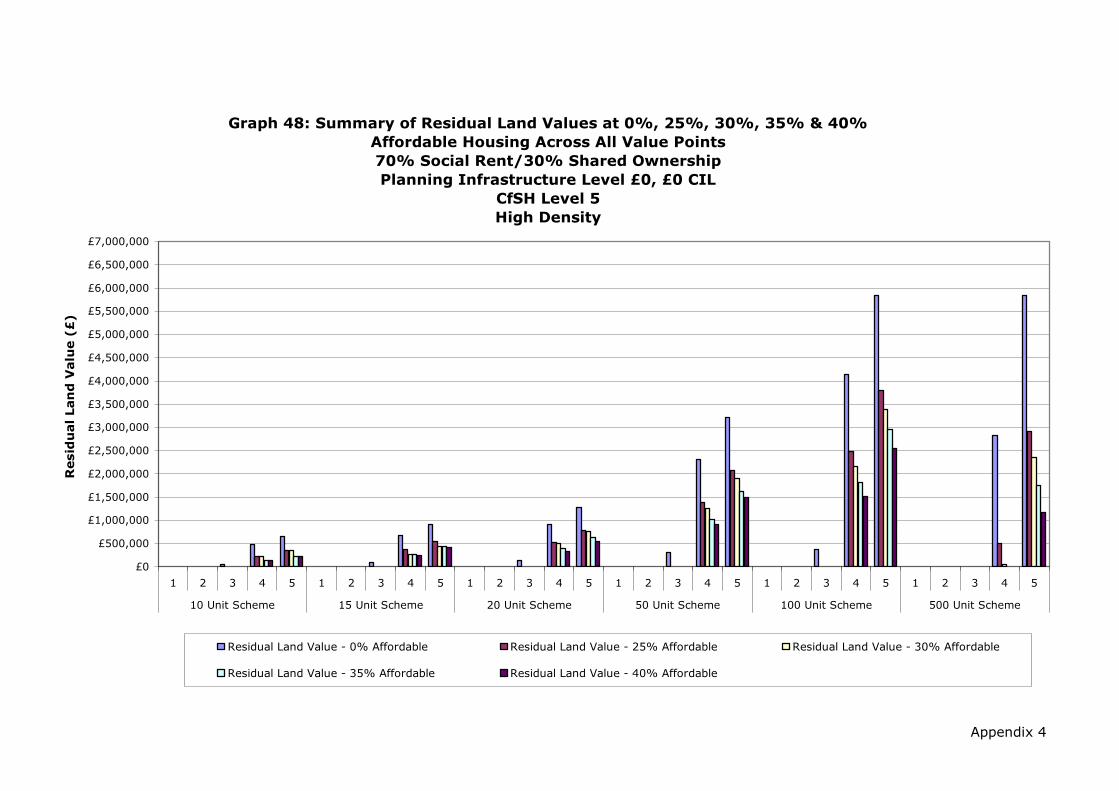
Appendix 4
Graph 48: Summary of Residual Land Values at 0%, 25%, 30%, 35% & 40%
Affordable Housing Across All Value Points
70% Social Rent/30% Shared Ownership
Planning Infrastructure Level £0, £0 CIL
CfSH Level 5
High Density
£0
£500,000
£1,000,000
£1,500,000
£2,000,000
£2,500,000
£3,000,000
£3,500,000
£4,000,000
£4,500,000
£5,000,000
£5,500,000
£6,000,000
£6,500,000
£7,000,000
1 2 3 4 5 1 2 3 4 5 1 2 3 4 5 1 2 3 4 5 1 2 3 4 5 1 2 3 4 5
10 Unit Scheme 15 Unit Scheme 20 Unit Scheme 50 Unit Scheme 100 Unit Scheme 500 Unit Scheme
Resid
ual Lan
d V
alu
e (£
)
Residual Land Value - 0% Affordable Residual Land Value - 25% Affordable Residual Land Value - 30% Affordable
Residual Land Value - 35% Affordable Residual Land Value - 40% Affordable
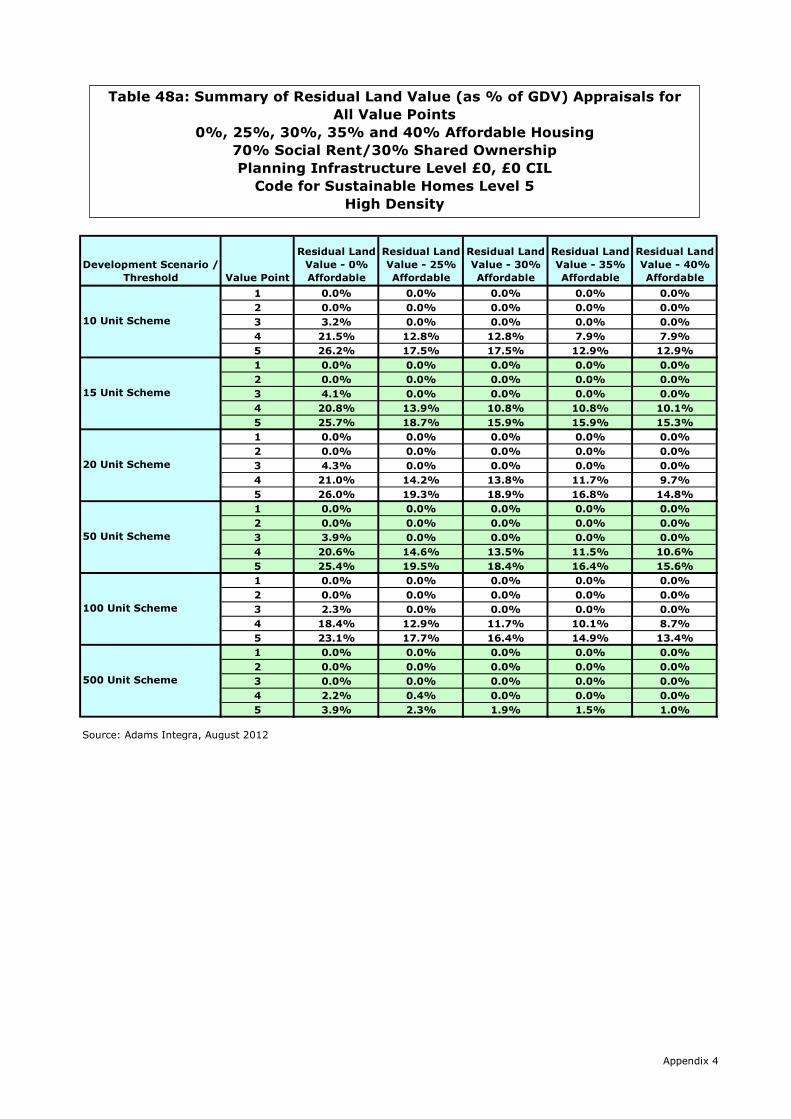
Development Scenario /
Threshold Value Point
Residual Land
Value - 0%
Affordable
Residual Land
Value - 25%
Affordable
Residual Land
Value - 30%
Affordable
Residual Land
Value - 35%
Affordable
Residual Land
Value - 40%
Affordable
1 0.0% 0.0% 0.0% 0.0% 0.0%
2 0.0% 0.0% 0.0% 0.0% 0.0%
3 3.2% 0.0% 0.0% 0.0% 0.0%
4 21.5% 12.8% 12.8% 7.9% 7.9%
5 26.2% 17.5% 17.5% 12.9% 12.9%
1 0.0% 0.0% 0.0% 0.0% 0.0%
2 0.0% 0.0% 0.0% 0.0% 0.0%
3 4.1% 0.0% 0.0% 0.0% 0.0%
4 20.8% 13.9% 10.8% 10.8% 10.1%
5 25.7% 18.7% 15.9% 15.9% 15.3%
1 0.0% 0.0% 0.0% 0.0% 0.0%
2 0.0% 0.0% 0.0% 0.0% 0.0%
3 4.3% 0.0% 0.0% 0.0% 0.0%
4 21.0% 14.2% 13.8% 11.7% 9.7%
5 26.0% 19.3% 18.9% 16.8% 14.8%
1 0.0% 0.0% 0.0% 0.0% 0.0%
2 0.0% 0.0% 0.0% 0.0% 0.0%
3 3.9% 0.0% 0.0% 0.0% 0.0%
4 20.6% 14.6% 13.5% 11.5% 10.6%
5 25.4% 19.5% 18.4% 16.4% 15.6%
1 0.0% 0.0% 0.0% 0.0% 0.0%
2 0.0% 0.0% 0.0% 0.0% 0.0%
3 2.3% 0.0% 0.0% 0.0% 0.0%
4 18.4% 12.9% 11.7% 10.1% 8.7%
5 23.1% 17.7% 16.4% 14.9% 13.4%
1 0.0% 0.0% 0.0% 0.0% 0.0%
2 0.0% 0.0% 0.0% 0.0% 0.0%
3 0.0% 0.0% 0.0% 0.0% 0.0%
4 2.2% 0.4% 0.0% 0.0% 0.0%
5 3.9% 2.3% 1.9% 1.5% 1.0%
Source: Adams Integra, August 2012
100 Unit Scheme
500 Unit Scheme
10 Unit Scheme
15 Unit Scheme
20 Unit Scheme
50 Unit Scheme
Table 48a: Summary of Residual Land Value (as % of GDV) Appraisals for
All Value Points
0%, 25%, 30%, 35% and 40% Affordable Housing
70% Social Rent/30% Shared Ownership
Planning Infrastructure Level £0, £0 CIL
Code for Sustainable Homes Level 5
High Density
Appendix 4
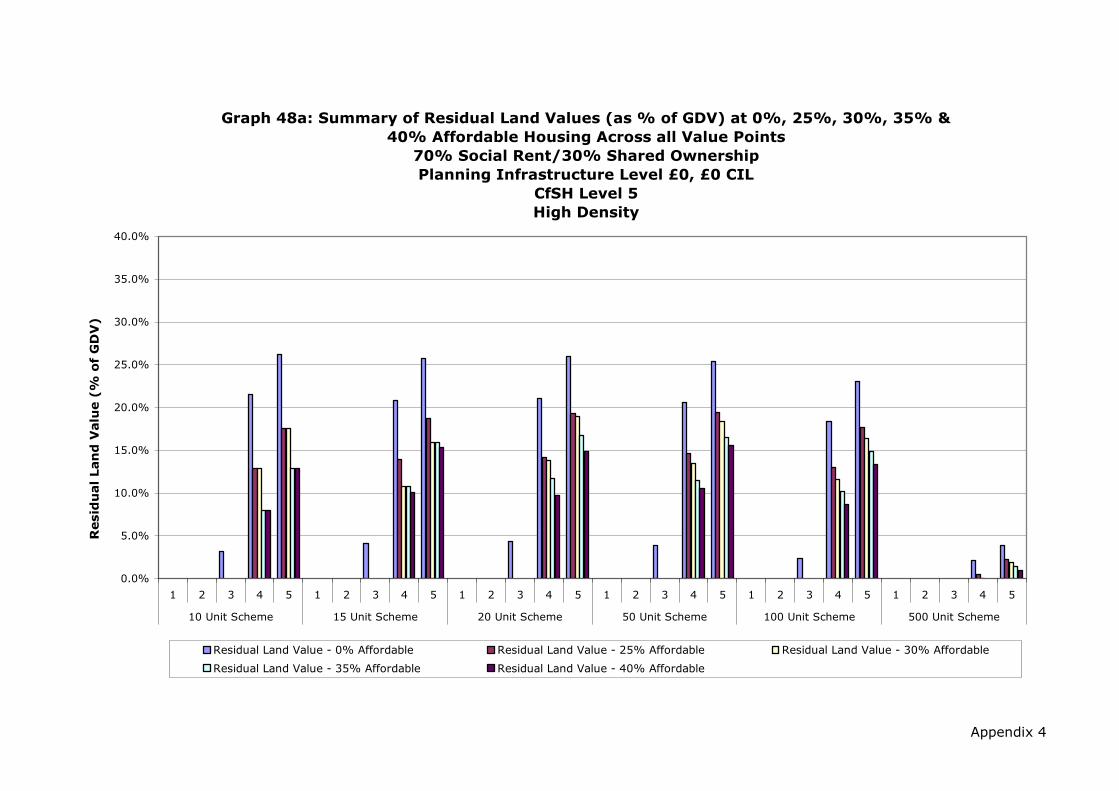
Appendix 4
Graph 48a: Summary of Residual Land Values (as % of GDV) at 0%, 25%, 30%, 35% &
40% Affordable Housing Across all Value Points
70% Social Rent/30% Shared Ownership
Planning Infrastructure Level £0, £0 CIL
CfSH Level 5
High Density
0.0%
5.0%
10.0%
15.0%
20.0%
25.0%
30.0%
35.0%
40.0%
1 2 3 4 5 1 2 3 4 5 1 2 3 4 5 1 2 3 4 5 1 2 3 4 5 1 2 3 4 5
10 Unit Scheme 15 Unit Scheme 20 Unit Scheme 50 Unit Scheme 100 Unit Scheme 500 Unit Scheme
Resid
ual Lan
d V
alu
e (%
o
f G
DV
)
Residual Land Value - 0% Affordable Residual Land Value - 25% Affordable Residual Land Value - 30% Affordable
Residual Land Value - 35% Affordable Residual Land Value - 40% Affordable
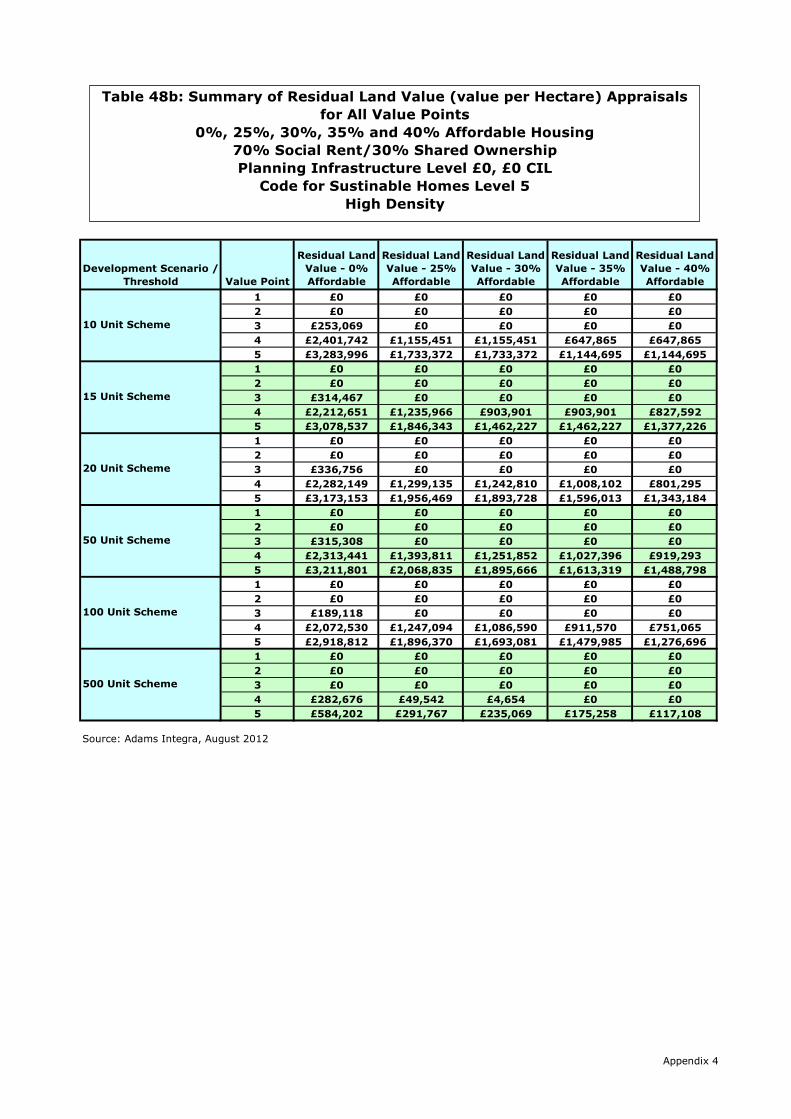
Development Scenario /
Threshold Value Point
Residual Land
Value - 0%
Affordable
Residual Land
Value - 25%
Affordable
Residual Land
Value - 30%
Affordable
Residual Land
Value - 35%
Affordable
Residual Land
Value - 40%
Affordable
1 £0 £0 £0 £0 £0
2 £0 £0 £0 £0 £0
3 £253,069 £0 £0 £0 £0
4 £2,401,742 £1,155,451 £1,155,451 £647,865 £647,865
5 £3,283,996 £1,733,372 £1,733,372 £1,144,695 £1,144,695
1 £0 £0 £0 £0 £0
2 £0 £0 £0 £0 £0
3 £314,467 £0 £0 £0 £0
4 £2,212,651 £1,235,966 £903,901 £903,901 £827,592
5 £3,078,537 £1,846,343 £1,462,227 £1,462,227 £1,377,226
1 £0 £0 £0 £0 £0
2 £0 £0 £0 £0 £0
3 £336,756 £0 £0 £0 £0
4 £2,282,149 £1,299,135 £1,242,810 £1,008,102 £801,295
5 £3,173,153 £1,956,469 £1,893,728 £1,596,013 £1,343,184
1 £0 £0 £0 £0 £0
2 £0 £0 £0 £0 £0
3 £315,308 £0 £0 £0 £0
4 £2,313,441 £1,393,811 £1,251,852 £1,027,396 £919,293
5 £3,211,801 £2,068,835 £1,895,666 £1,613,319 £1,488,798
1 £0 £0 £0 £0 £0
2 £0 £0 £0 £0 £0
3 £189,118 £0 £0 £0 £0
4 £2,072,530 £1,247,094 £1,086,590 £911,570 £751,065
5 £2,918,812 £1,896,370 £1,693,081 £1,479,985 £1,276,696
1 £0 £0 £0 £0 £0
2 £0 £0 £0 £0 £0
3 £0 £0 £0 £0 £0
4 £282,676 £49,542 £4,654 £0 £0
5 £584,202 £291,767 £235,069 £175,258 £117,108
Source: Adams Integra, August 2012
100 Unit Scheme
500 Unit Scheme
10 Unit Scheme
15 Unit Scheme
20 Unit Scheme
50 Unit Scheme
Table 48b: Summary of Residual Land Value (value per Hectare) Appraisals
for All Value Points
0%, 25%, 30%, 35% and 40% Affordable Housing
70% Social Rent/30% Shared Ownership
Planning Infrastructure Level £0, £0 CIL
Code for Sustinable Homes Level 5
High Density
Appendix 4

Appendix 4
Graph 48b: Summary of Residual Land Values (value per Hectare) at 0%, 25%, 30%, 35%
& 40% Affordable Housing Across all Value Points
70% Social Rent/30% Shared Ownership
Planning Infrastructure Level £0, £0 CIL
CfSH Level 5
High Density
£0
£500,000
£1,000,000
£1,500,000
£2,000,000
£2,500,000
£3,000,000
£3,500,000
£4,000,000
£4,500,000
£5,000,000
1 2 3 4 5 1 2 3 4 5 1 2 3 4 5 1 2 3 4 5 1 2 3 4 5 1 2 3 4 5
10 Unit Scheme 15 Unit Scheme 20 Unit Scheme 50 Unit Scheme 100 Unit Scheme 500 Unit Scheme
Resid
ual Lan
d V
alu
e (%
o
f G
DV
)
Residual Land Value - 0% Affordable Residual Land Value - 25% Affordable Residual Land Value - 30% Affordable
Residual Land Value - 35% Affordable Residual Land Value - 40% Affordable

Appendix 4i
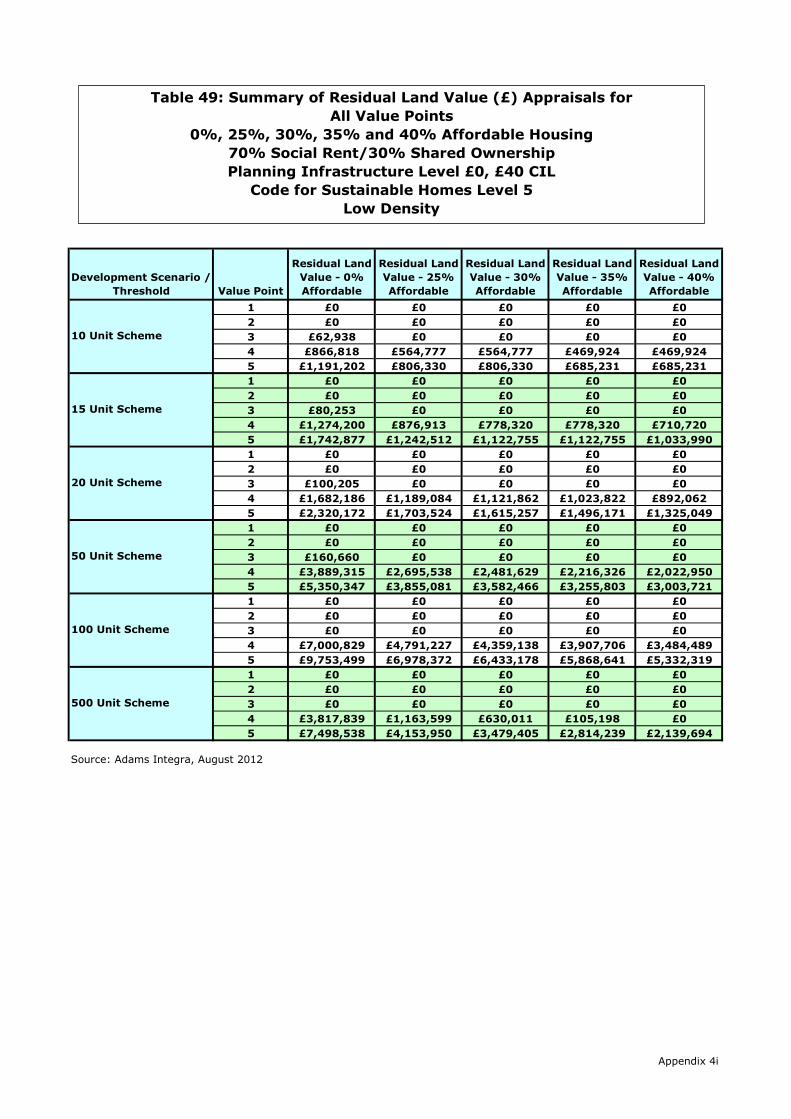
Development Scenario /
Threshold Value Point
Residual Land
Value - 0%
Affordable
Residual Land
Value - 25%
Affordable
Residual Land
Value - 30%
Affordable
Residual Land
Value - 35%
Affordable
Residual Land
Value - 40%
Affordable
1 £0 £0 £0 £0 £0
2 £0 £0 £0 £0 £0
3 £62,938 £0 £0 £0 £0
4 £866,818 £564,777 £564,777 £469,924 £469,924
5 £1,191,202 £806,330 £806,330 £685,231 £685,231
1 £0 £0 £0 £0 £0
2 £0 £0 £0 £0 £0
3 £80,253 £0 £0 £0 £0
4 £1,274,200 £876,913 £778,320 £778,320 £710,720
5 £1,742,877 £1,242,512 £1,122,755 £1,122,755 £1,033,990
1 £0 £0 £0 £0 £0
2 £0 £0 £0 £0 £0
3 £100,205 £0 £0 £0 £0
4 £1,682,186 £1,189,084 £1,121,862 £1,023,822 £892,062
5 £2,320,172 £1,703,524 £1,615,257 £1,496,171 £1,325,049
1 £0 £0 £0 £0 £0
2 £0 £0 £0 £0 £0
3 £160,660 £0 £0 £0 £0
4 £3,889,315 £2,695,538 £2,481,629 £2,216,326 £2,022,950
5 £5,350,347 £3,855,081 £3,582,466 £3,255,803 £3,003,721
1 £0 £0 £0 £0 £0
2 £0 £0 £0 £0 £0
3 £0 £0 £0 £0 £0
4 £7,000,829 £4,791,227 £4,359,138 £3,907,706 £3,484,489
5 £9,753,499 £6,978,372 £6,433,178 £5,868,641 £5,332,319
1 £0 £0 £0 £0 £0
2 £0 £0 £0 £0 £0
3 £0 £0 £0 £0 £0
4 £3,817,839 £1,163,599 £630,011 £105,198 £0
5 £7,498,538 £4,153,950 £3,479,405 £2,814,239 £2,139,694
Source: Adams Integra, August 2012
100 Unit Scheme
500 Unit Scheme
10 Unit Scheme
15 Unit Scheme
20 Unit Scheme
50 Unit Scheme
Table 49: Summary of Residual Land Value (£) Appraisals for
All Value Points
0%, 25%, 30%, 35% and 40% Affordable Housing
70% Social Rent/30% Shared Ownership
Planning Infrastructure Level £0, £40 CIL
Code for Sustainable Homes Level 5
Low Density
Appendix 4i

Appendix 4i
Graph 49: Summary of Residual Land Values at 0%, 25%, 30%, 35% & 40%
Affordable Housing Across All Value Points
70% Social Rent/30% Shared Ownership
Planning Infrastructure Level £0, £40 CIL
CfSH Level 5
Low Density
£0
£1,000,000
£2,000,000
£3,000,000
£4,000,000
£5,000,000
£6,000,000
£7,000,000
£8,000,000
£9,000,000
£10,000,000
1 2 3 4 5 1 2 3 4 5 1 2 3 4 5 1 2 3 4 5 1 2 3 4 5 1 2 3 4 5
10 Unit Scheme 15 Unit Scheme 20 Unit Scheme 50 Unit Scheme 100 Unit Scheme 500 Unit Scheme
Resid
ual Lan
d V
alu
e (£
)
Residual Land Value - 0% Affordable Residual Land Value - 25% Affordable Residual Land Value - 30% Affordable
Residual Land Value - 35% Affordable Residual Land Value - 40% Affordable Residual Land Value - 40% Affordable

Development Scenario /
Threshold Value Point
Residual Land
Value - 0%
Affordable
Residual Land
Value - 25%
Affordable
Residual Land
Value - 30%
Affordable
Residual Land
Value - 35%
Affordable
Residual Land
Value - 40%
Affordable
1 0.0% 0.0% 0.0% 0.0% 0.0%
2 0.0% 0.0% 0.0% 0.0% 0.0%
3 2.6% 0.0% 0.0% 0.0% 0.0%
4 23.7% 18.0% 18.0% 15.8% 15.8%
5 28.7% 23.0% 23.0% 20.7% 20.7%
1 0.0% 0.0% 0.0% 0.0% 0.0%
2 0.0% 0.0% 0.0% 0.0% 0.0%
3 2.2% 0.0% 0.0% 0.0% 0.0%
4 23.0% 18.1% 16.6% 16.6% 15.6%
5 27.9% 23.0% 21.6% 21.6% 20.5%
1 0.0% 0.0% 0.0% 0.0% 0.0%
2 0.0% 0.0% 0.0% 0.0% 0.0%
3 2.0% 0.0% 0.0% 0.0% 0.0%
4 23.0% 18.4% 17.7% 16.6% 15.0%
5 28.0% 23.5% 22.8% 21.7% 20.0%
1 0.0% 0.0% 0.0% 0.0% 0.0%
2 0.0% 0.0% 0.0% 0.0% 0.0%
3 1.3% 0.0% 0.0% 0.0% 0.0%
4 21.7% 17.0% 16.1% 14.8% 13.8%
5 26.4% 21.9% 20.9% 19.6% 18.6%
1 0.0% 0.0% 0.0% 0.0% 0.0%
2 0.0% 0.0% 0.0% 0.0% 0.0%
3 0.0% 0.0% 0.0% 0.0% 0.0%
4 19.5% 15.1% 14.1% 13.0% 11.9%
5 24.1% 19.7% 18.7% 17.6% 16.5%
1 0.0% 0.0% 0.0% 0.0% 0.0%
2 0.0% 0.0% 0.0% 0.0% 0.0%
3 0.0% 0.0% 0.0% 0.0% 0.0%
4 2.2% 0.8% 0.4% 0.1% 0.0%
5 3.9% 2.4% 2.1% 1.7% 1.4%
Source: Adams Integra, August 2012
100 Unit Scheme
500 Unit Scheme
10 Unit Scheme
15 Unit Scheme
20 Unit Scheme
50 Unit Scheme
Table 49a: Summary of Residual Land Value (as % of GDV) Appraisals for
All Value Points
0%, 25%, 30%, 35% and 40% Affordable Housing
70% Social Rent/30% Shared Ownership
Planning Infrastructure Level £0, £40 CIL
Code for Sustainable Homes Level 5
Low Density
Appendix 4i

Appendix 4i
Graph 49a: Summary of Residual Land Values (as % of GDV) at 0%, 25%, 30%, 35% &
40% Affordable Housing Across all Value Points
70% Social Rent/30% Shared Ownership
Planning Infrastructure Level £0, £40 CIL
CfSH Level 5
Low Density
0.0%
5.0%
10.0%
15.0%
20.0%
25.0%
30.0%
35.0%
40.0%
1 2 3 4 5 1 2 3 4 5 1 2 3 4 5 1 2 3 4 5 1 2 3 4 5 1 2 3 4 5
10 Unit Scheme 15 Unit Scheme 20 Unit Scheme 50 Unit Scheme 100 Unit Scheme 500 Unit Scheme
Resid
ual Lan
d V
alu
e (%
o
f G
DV
)
Residual Land Value - 0% Affordable Residual Land Value - 25% Affordable Residual Land Value - 30% Affordable
Residual Land Value - 35% Affordable Residual Land Value - 40% Affordable

Development Scenario /
Threshold Value Point
Residual Land
Value - 0%
Affordable
Residual Land
Value - 25%
Affordable
Residual Land
Value - 30%
Affordable
Residual Land
Value - 35%
Affordable
Residual Land
Value - 40%
Affordable
1 £0 £0 £0 £0 £0
2 £0 £0 £0 £0 £0
3 £251,752 £0 £0 £0 £0
4 £3,467,273 £2,259,106 £2,259,106 £1,879,695 £1,879,695
5 £4,764,810 £3,225,321 £3,225,321 £2,740,925 £2,740,925
1 £0 £0 £0 £0 £0
2 £0 £0 £0 £0 £0
3 £214,009 £0 £0 £0 £0
4 £3,397,867 £2,338,434 £2,075,520 £2,075,520 £1,895,253
5 £4,647,671 £3,313,365 £2,994,013 £2,994,013 £2,757,308
1 £0 £0 £0 £0 £0
2 £0 £0 £0 £0 £0
3 £200,409 £0 £0 £0 £0
4 £3,364,372 £2,378,168 £2,243,725 £2,047,644 £1,784,125
5 £4,640,344 £3,407,048 £3,230,514 £2,992,342 £2,650,098
1 £0 £0 £0 £0 £0
2 £0 £0 £0 £0 £0
3 £128,528 £0 £0 £0 £0
4 £3,111,452 £2,156,430 £1,985,303 £1,773,060 £1,618,360
5 £4,280,278 £3,084,065 £2,865,973 £2,604,643 £2,402,977
1 £0 £0 £0 £0 £0
2 £0 £0 £0 £0 £0
3 £0 £0 £0 £0 £0
4 £2,800,332 £1,916,491 £1,743,655 £1,563,082 £1,393,795
5 £3,901,400 £2,791,349 £2,573,271 £2,347,456 £2,132,927
1 £0 £0 £0 £0 £0
2 £0 £0 £0 £0 £0
3 £0 £0 £0 £0 £0
4 £305,427 £93,088 £50,401 £8,416 £0
5 £599,883 £332,316 £278,352 £225,139 £171,175
Source: Adams Integra, August 2012
100 Unit Scheme
500 Unit Scheme
10 Unit Scheme
15 Unit Scheme
20 Unit Scheme
50 Unit Scheme
Table 49b: Summary of Residual Land Value (value per Hectare) Appraisals
for All Value Points
0%, 25%, 30%, 35% and 40% Affordable Housing
70% Social Rent/30% Shared Ownership
Planning Infrastructure Level £0, £40 CIL
Code for Sustainable Homes Level 5
Low Density
Appendix 4i
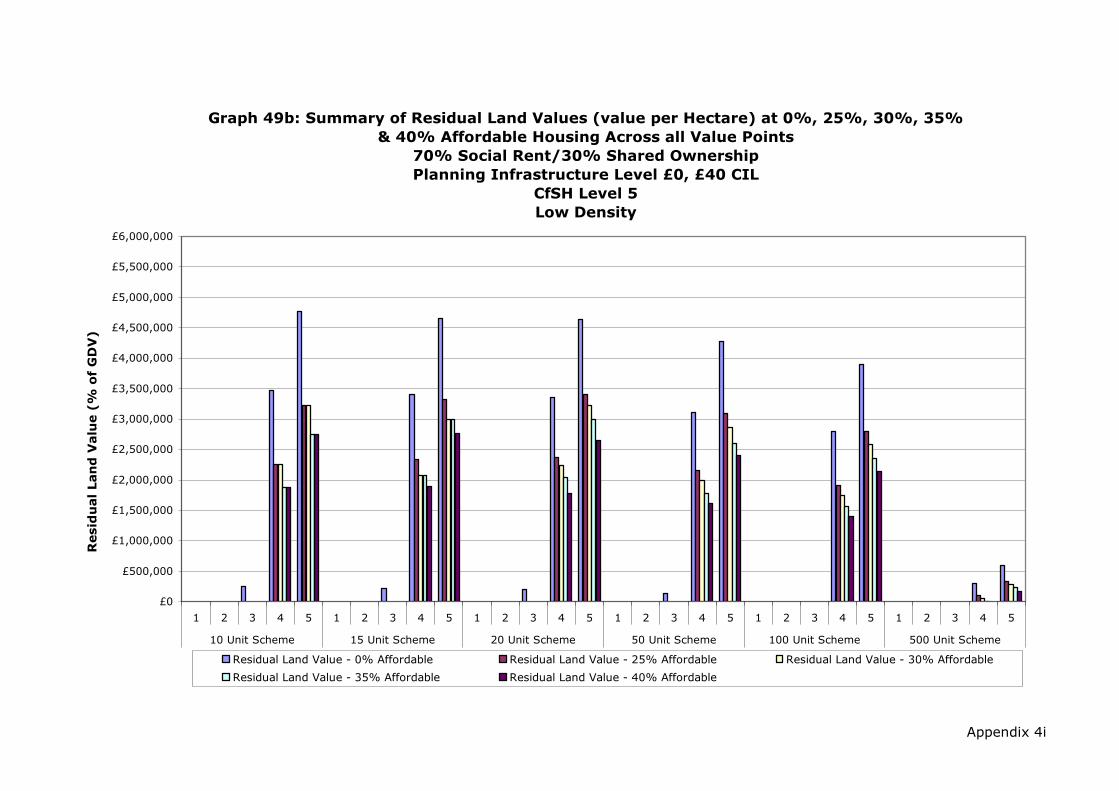
Appendix 4i
Graph 49b: Summary of Residual Land Values (value per Hectare) at 0%, 25%, 30%, 35%
& 40% Affordable Housing Across all Value Points
70% Social Rent/30% Shared Ownership
Planning Infrastructure Level £0, £40 CIL
CfSH Level 5
Low Density
£0
£500,000
£1,000,000
£1,500,000
£2,000,000
£2,500,000
£3,000,000
£3,500,000
£4,000,000
£4,500,000
£5,000,000
£5,500,000
£6,000,000
1 2 3 4 5 1 2 3 4 5 1 2 3 4 5 1 2 3 4 5 1 2 3 4 5 1 2 3 4 5
10 Unit Scheme 15 Unit Scheme 20 Unit Scheme 50 Unit Scheme 100 Unit Scheme 500 Unit Scheme
Resid
ual Lan
d V
alu
e (%
o
f G
DV
)
Residual Land Value - 0% Affordable Residual Land Value - 25% Affordable Residual Land Value - 30% Affordable
Residual Land Value - 35% Affordable Residual Land Value - 40% Affordable

Development Scenario /
Threshold Value Point
Residual Land
Value - 0%
Affordable
Residual Land
Value - 25%
Affordable
Residual Land
Value - 30%
Affordable
Residual Land
Value - 35%
Affordable
Residual Land
Value - 40%
Affordable
1 £0 £0 £0 £0 £0
2 £0 £0 £0 £0 £0
3 £57,144 £0 £0 £0 £0
4 £652,525 £405,396 £405,396 £270,013 £270,013
5 £918,789 £605,091 £605,091 £435,567 £435,567
1 £0 £0 £0 £0 £0
2 £0 £0 £0 £0 £0
3 £81,292 £0 £0 £0 £0
4 £1,064,926 £683,900 £585,307 £585,307 £517,707
5 £1,526,161 £1,043,852 £924,095 £924,095 £835,330
1 £0 £0 £0 £0 £0
2 £0 £0 £0 £0 £0
3 £80,415 £0 £0 £0 £0
4 £1,335,456 £842,354 £775,133 £677,092 £545,333
5 £1,884,588 £1,267,940 £1,179,673 £1,060,587 £889,465
1 £0 £0 £0 £0 £0
2 £0 £0 £0 £0 £0
3 £137,843 £0 £0 £0 £0
4 £2,966,875 £1,831,657 £1,666,233 £1,437,477 £1,244,101
5 £4,220,162 £2,788,657 £2,584,061 £2,295,681 £2,043,599
1 £0 £0 £0 £0 £0
2 £0 £0 £0 £0 £0
3 £99,573 £0 £0 £0 £0
4 £5,010,831 £3,263,191 £2,891,686 £2,500,840 £2,164,211
5 £7,268,689 £5,084,368 £4,610,525 £4,117,340 £3,702,927
1 £0 £0 £0 £0 £0
2 £0 £0 £0 £0 £0
3 £0 £0 £0 £0 £0
4 £3,077,922 £746,591 £298,929 £0 £0
5 £6,414,147 £3,489,804 £2,922,815 £2,324,709 £1,743,212
Source: Adams Integra, August 2012
100 Unit Scheme
500 Unit Scheme
10 Unit Scheme
15 Unit Scheme
20 Unit Scheme
50 Unit Scheme
Table 50: Summary of Residual Land Value (£) Appraisals for
All Value Points
0%, 25%, 30%, 35% and 40% Affordable Housing
70% Social Rent/30% Shared Ownership
Planning Infrastructure Level £0, £40 CIL
Code for Sustainable Homes Level 5
Medium Density
Appendix 4i

Appendix 4i
Graph 50: Summary of Residual Land Values at 0%, 25%, 30%, 35% & 40%
Affordable Housing Across All Value Points
70% Social Rent/30% Shared Ownership
Planning Infrastructure Level £0, £40 CIL
CfSH Level 5
Medium Density
£0
£1,000,000
£2,000,000
£3,000,000
£4,000,000
£5,000,000
£6,000,000
£7,000,000
£8,000,000
£9,000,000
£10,000,000
1 2 3 4 5 1 2 3 4 5 1 2 3 4 5 1 2 3 4 5 1 2 3 4 5 1 2 3 4 5
10 Unit Scheme 15 Unit Scheme 20 Unit Scheme 50 Unit Scheme 100 Unit Scheme 500 Unit Scheme
Resid
ual Lan
d V
alu
e (£
)
Residual Land Value - 0% Affordable Residual Land Value - 25% Affordable Residual Land Value - 30% Affordable
Residual Land Value - 35% Affordable Residual Land Value - 40% Affordable

Development Scenario /
Threshold Value Point
Residual Land
Value - 0%
Affordable
Residual Land
Value - 25%
Affordable
Residual Land
Value - 30%
Affordable
Residual Land
Value - 35%
Affordable
Residual Land
Value - 40%
Affordable
1 0.0% 0.0% 0.0% 0.0% 0.0%
2 0.0% 0.0% 0.0% 0.0% 0.0%
3 3.0% 0.0% 0.0% 0.0% 0.0%
4 23.3% 17.1% 17.1% 12.6% 12.6%
5 28.7% 22.7% 22.7% 18.2% 18.2%
1 0.0% 0.0% 0.0% 0.0% 0.0%
2 0.0% 0.0% 0.0% 0.0% 0.0%
3 2.7% 0.0% 0.0% 0.0% 0.0%
4 23.7% 17.8% 15.9% 15.9% 14.6%
5 29.3% 23.8% 22.1% 22.1% 20.7%
1 0.0% 0.0% 0.0% 0.0% 0.0%
2 0.0% 0.0% 0.0% 0.0% 0.0%
3 2.0% 0.0% 0.0% 0.0% 0.0%
4 22.8% 16.8% 15.9% 14.4% 12.1%
5 28.1% 22.4% 21.5% 20.0% 17.7%
1 0.0% 0.0% 0.0% 0.0% 0.0%
2 0.0% 0.0% 0.0% 0.0% 0.0%
3 1.5% 0.0% 0.0% 0.0% 0.0%
4 21.4% 15.5% 14.4% 12.9% 11.5%
5 26.6% 20.9% 19.9% 18.4% 17.0%
1 0.0% 0.0% 0.0% 0.0% 0.0%
2 0.0% 0.0% 0.0% 0.0% 0.0%
3 0.5% 0.0% 0.0% 0.0% 0.0%
4 19.0% 14.2% 13.0% 11.6% 10.3%
5 24.1% 19.5% 18.3% 17.0% 15.8%
1 0.0% 0.0% 0.0% 0.0% 0.0%
2 0.0% 0.0% 0.0% 0.0% 0.0%
3 0.0% 0.0% 0.0% 0.0% 0.0%
4 2.1% 0.6% 0.2% 0.0% 0.0%
5 3.8% 2.4% 2.1% 1.7% 1.3%
Source: Adams Integra, August 2012
100 Unit Scheme
500 Unit Scheme
10 Unit Scheme
15 Unit Scheme
20 Unit Scheme
50 Unit Scheme
Table 50a: Summary of Residual Land Value (as % of GDV) Appraisals for
All Value Points
0%, 25%, 30%, 35% and 40% Affordable Housing
70% Social Rent/30% Shared Ownership
Planning Infrastructure Level £0, £40 CIL
Code for Sustainable Homes Level 5
Medium Density
Appendix 4i
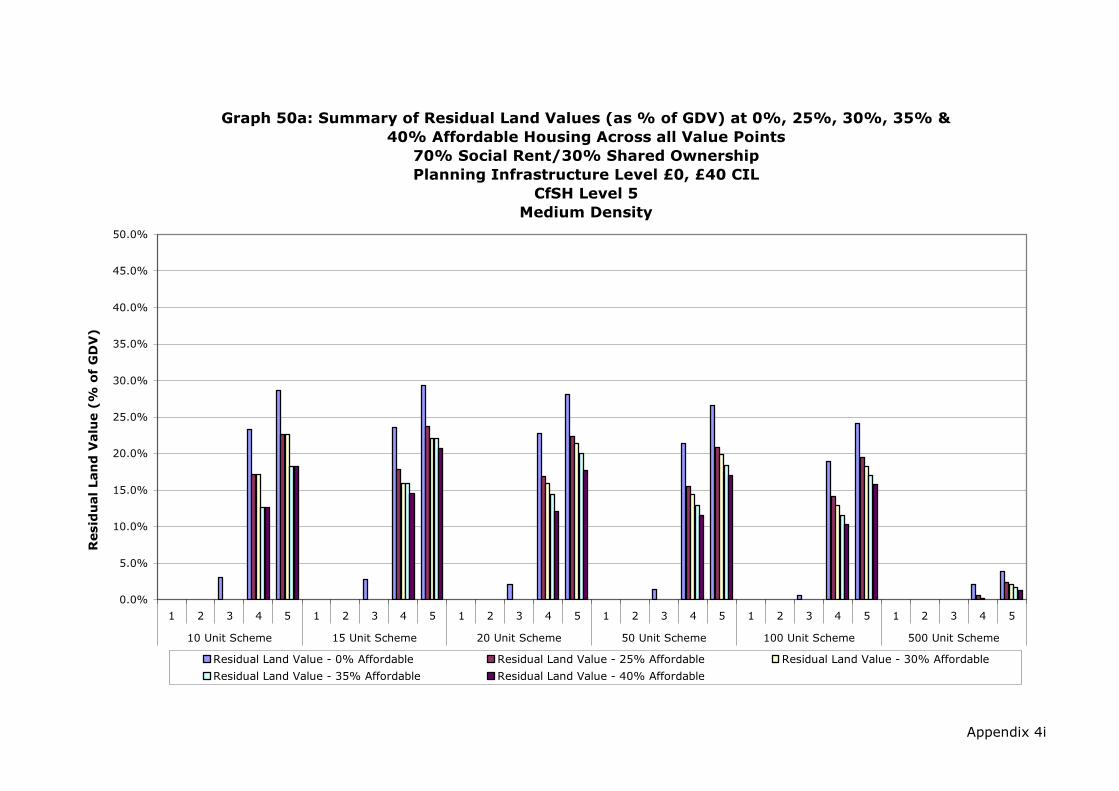
Appendix 4i
Graph 50a: Summary of Residual Land Values (as % of GDV) at 0%, 25%, 30%, 35% &
40% Affordable Housing Across all Value Points
70% Social Rent/30% Shared Ownership
Planning Infrastructure Level £0, £40 CIL
CfSH Level 5
Medium Density
0.0%
5.0%
10.0%
15.0%
20.0%
25.0%
30.0%
35.0%
40.0%
45.0%
50.0%
1 2 3 4 5 1 2 3 4 5 1 2 3 4 5 1 2 3 4 5 1 2 3 4 5 1 2 3 4 5
10 Unit Scheme 15 Unit Scheme 20 Unit Scheme 50 Unit Scheme 100 Unit Scheme 500 Unit Scheme
Resid
ual Lan
d V
alu
e (%
o
f G
DV
)
Residual Land Value - 0% Affordable Residual Land Value - 25% Affordable Residual Land Value - 30% Affordable
Residual Land Value - 35% Affordable Residual Land Value - 40% Affordable
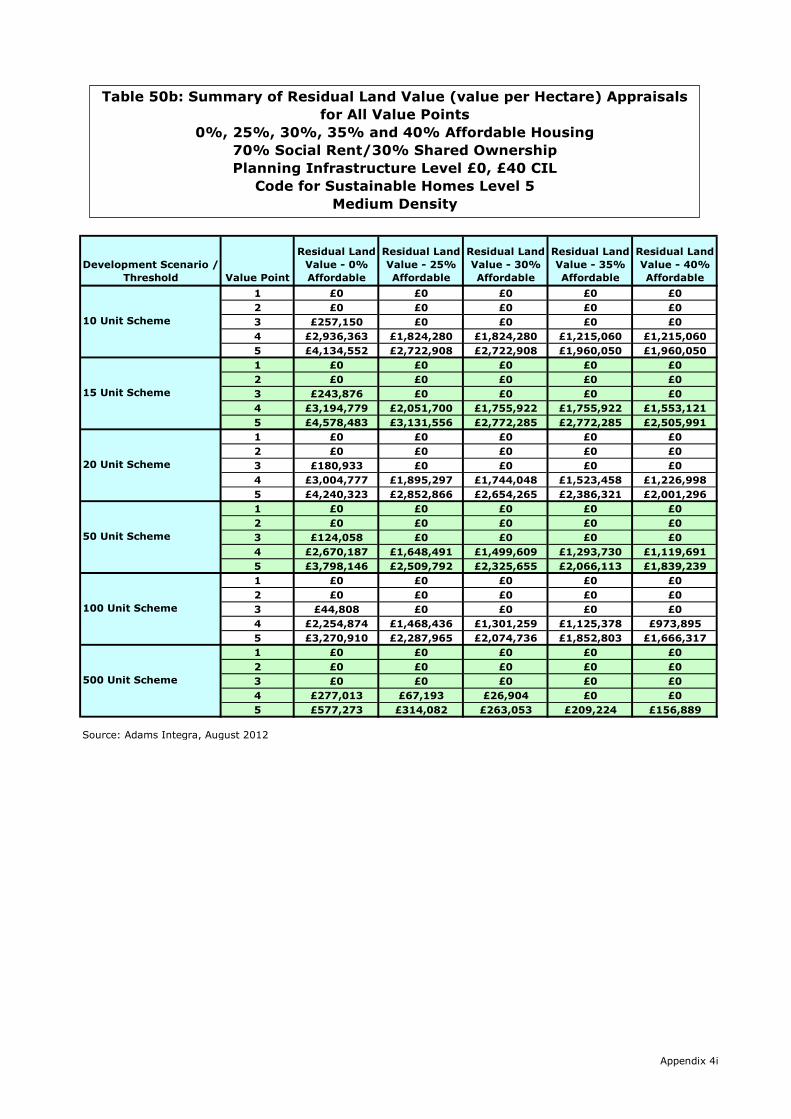
Development Scenario /
Threshold Value Point
Residual Land
Value - 0%
Affordable
Residual Land
Value - 25%
Affordable
Residual Land
Value - 30%
Affordable
Residual Land
Value - 35%
Affordable
Residual Land
Value - 40%
Affordable
1 £0 £0 £0 £0 £0
2 £0 £0 £0 £0 £0
3 £257,150 £0 £0 £0 £0
4 £2,936,363 £1,824,280 £1,824,280 £1,215,060 £1,215,060
5 £4,134,552 £2,722,908 £2,722,908 £1,960,050 £1,960,050
1 £0 £0 £0 £0 £0
2 £0 £0 £0 £0 £0
3 £243,876 £0 £0 £0 £0
4 £3,194,779 £2,051,700 £1,755,922 £1,755,922 £1,553,121
5 £4,578,483 £3,131,556 £2,772,285 £2,772,285 £2,505,991
1 £0 £0 £0 £0 £0
2 £0 £0 £0 £0 £0
3 £180,933 £0 £0 £0 £0
4 £3,004,777 £1,895,297 £1,744,048 £1,523,458 £1,226,998
5 £4,240,323 £2,852,866 £2,654,265 £2,386,321 £2,001,296
1 £0 £0 £0 £0 £0
2 £0 £0 £0 £0 £0
3 £124,058 £0 £0 £0 £0
4 £2,670,187 £1,648,491 £1,499,609 £1,293,730 £1,119,691
5 £3,798,146 £2,509,792 £2,325,655 £2,066,113 £1,839,239
1 £0 £0 £0 £0 £0
2 £0 £0 £0 £0 £0
3 £44,808 £0 £0 £0 £0
4 £2,254,874 £1,468,436 £1,301,259 £1,125,378 £973,895
5 £3,270,910 £2,287,965 £2,074,736 £1,852,803 £1,666,317
1 £0 £0 £0 £0 £0
2 £0 £0 £0 £0 £0
3 £0 £0 £0 £0 £0
4 £277,013 £67,193 £26,904 £0 £0
5 £577,273 £314,082 £263,053 £209,224 £156,889
Source: Adams Integra, August 2012
100 Unit Scheme
500 Unit Scheme
10 Unit Scheme
15 Unit Scheme
20 Unit Scheme
50 Unit Scheme
Table 50b: Summary of Residual Land Value (value per Hectare) Appraisals
for All Value Points
0%, 25%, 30%, 35% and 40% Affordable Housing
70% Social Rent/30% Shared Ownership
Planning Infrastructure Level £0, £40 CIL
Code for Sustainable Homes Level 5
Medium Density
Appendix 4i
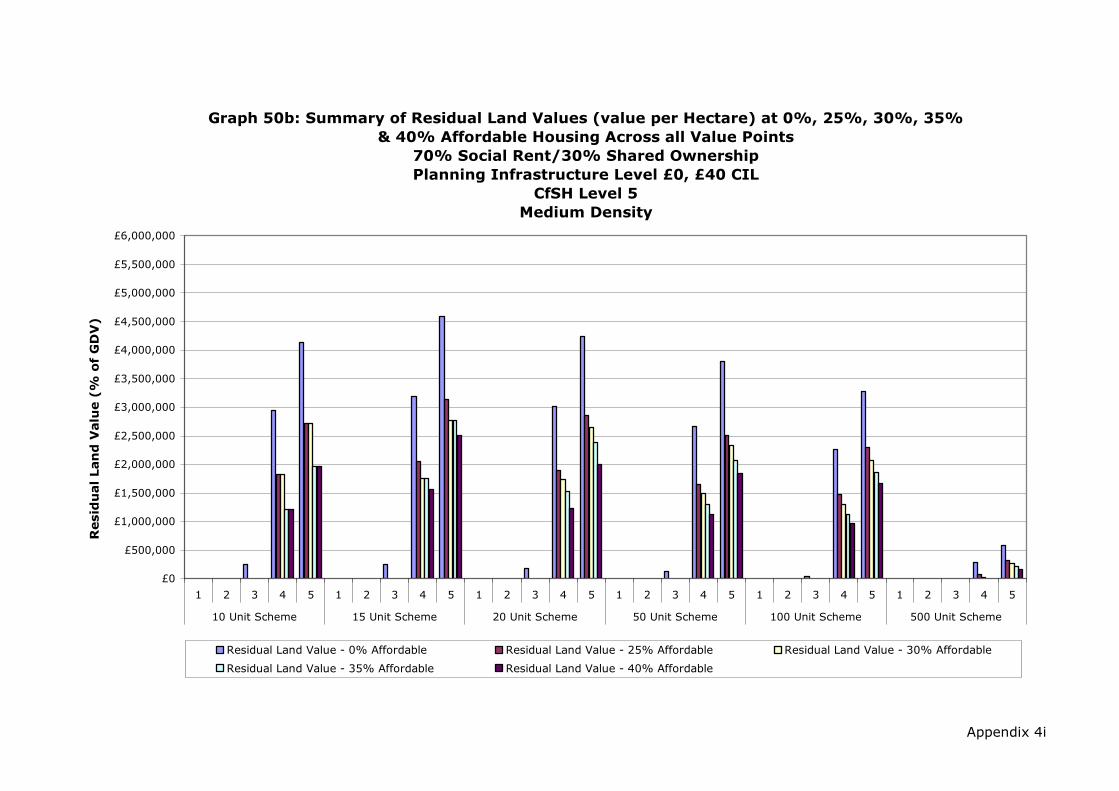
Appendix 4i
Graph 50b: Summary of Residual Land Values (value per Hectare) at 0%, 25%, 30%, 35%
& 40% Affordable Housing Across all Value Points
70% Social Rent/30% Shared Ownership
Planning Infrastructure Level £0, £40 CIL
CfSH Level 5
Medium Density
£0
£500,000
£1,000,000
£1,500,000
£2,000,000
£2,500,000
£3,000,000
£3,500,000
£4,000,000
£4,500,000
£5,000,000
£5,500,000
£6,000,000
1 2 3 4 5 1 2 3 4 5 1 2 3 4 5 1 2 3 4 5 1 2 3 4 5 1 2 3 4 5
10 Unit Scheme 15 Unit Scheme 20 Unit Scheme 50 Unit Scheme 100 Unit Scheme 500 Unit Scheme
Resid
ual Lan
d V
alu
e (%
o
f G
DV
)
Residual Land Value - 0% Affordable Residual Land Value - 25% Affordable Residual Land Value - 30% Affordable
Residual Land Value - 35% Affordable Residual Land Value - 40% Affordable

Development Scenario /
Threshold Value Point
Residual Land
Value - 0%
Affordable
Residual Land
Value - 25%
Affordable
Residual Land
Value - 30%
Affordable
Residual Land
Value - 35%
Affordable
Residual Land
Value - 40%
Affordable
1 £0 £0 £0 £0 £0
2 £0 £0 £0 £0 £0
3 £25,019 £0 £0 £0 £0
4 £455,521 £205,751 £205,751 £103,978 £103,978
5 £632,228 £321,847 £321,847 £203,600 £203,600
1 £0 £0 £0 £0 £0
2 £0 £0 £0 £0 £0
3 £58,176 £0 £0 £0 £0
4 £629,078 £335,711 £240,959 £240,959 £217,594
5 £888,844 £519,185 £403,589 £403,589 £378,089
1 £0 £0 £0 £0 £0
2 £0 £0 £0 £0 £0
3 £85,783 £0 £0 £0 £0
4 £865,897 £477,616 £454,851 £355,789 £273,066
5 £1,222,299 £735,625 £710,529 £591,443 £490,311
1 £0 £0 £0 £0 £0
2 £0 £0 £0 £0 £0
3 £200,047 £0 £0 £0 £0
4 £2,195,368 £1,275,738 £1,133,779 £909,323 £801,220
5 £3,093,729 £1,950,762 £1,777,593 £1,495,247 £1,370,725
1 £0 £0 £0 £0 £0
2 £0 £0 £0 £0 £0
3 £158,210 £0 £0 £0 £0
4 £3,922,604 £2,271,732 £1,950,723 £1,600,684 £1,279,675
5 £5,615,167 £3,570,284 £3,163,706 £2,737,515 £2,330,937
1 £0 £0 £0 £0 £0
2 £0 £0 £0 £0 £0
3 £0 £0 £0 £0 £0
4 £2,501,254 £175,233 £0 £0 £0
5 £5,516,516 £2,592,172 £2,025,183 £1,427,078 £845,581
Source: Adams Integra, August 2012
100 Unit Scheme
500 Unit Scheme
10 Unit Scheme
15 Unit Scheme
20 Unit Scheme
50 Unit Scheme
Table 51: Summary of Residual Land Value (£) Appraisals for
All Value Points
0%, 25%, 30%, 35% and 40% Affordable Housing
70% Social Rent/30% Shared Ownership
Planning Infrastructure Level £0, £40 CIL
Code for Sustainable Homes Level 5
High Density
Appendix 4i

Appendix 4i
Graph 51: Summary of Residual Land Values at 0%, 25%, 30%, 35% & 40%
Affordable Housing Across All Value Points
70% Social Rent/30% Shared Ownership
Planning Infrastructure Level £0, £40 CIL
CfSH Level 5
High Density
£0
£500,000
£1,000,000
£1,500,000
£2,000,000
£2,500,000
£3,000,000
£3,500,000
£4,000,000
£4,500,000
£5,000,000
£5,500,000
£6,000,000
1 2 3 4 5 1 2 3 4 5 1 2 3 4 5 1 2 3 4 5 1 2 3 4 5 1 2 3 4 5
10 Unit Scheme 15 Unit Scheme 20 Unit Scheme 50 Unit Scheme 100 Unit Scheme 500 Unit Scheme
Resid
ual Lan
d V
alu
e (£
)
Residual Land Value - 0% Affordable Residual Land Value - 25% Affordable Residual Land Value - 30% Affordable
Residual Land Value - 35% Affordable Residual Land Value - 40% Affordable
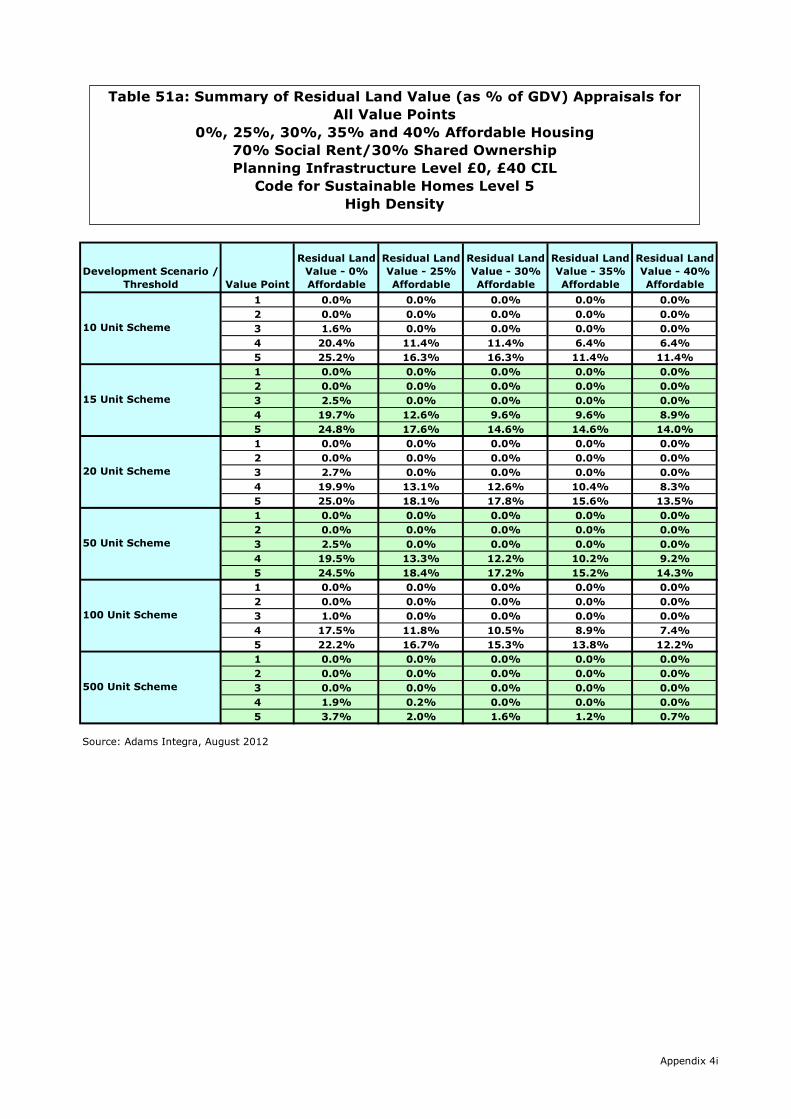
Development Scenario /
Threshold Value Point
Residual Land
Value - 0%
Affordable
Residual Land
Value - 25%
Affordable
Residual Land
Value - 30%
Affordable
Residual Land
Value - 35%
Affordable
Residual Land
Value - 40%
Affordable
1 0.0% 0.0% 0.0% 0.0% 0.0%
2 0.0% 0.0% 0.0% 0.0% 0.0%
3 1.6% 0.0% 0.0% 0.0% 0.0%
4 20.4% 11.4% 11.4% 6.4% 6.4%
5 25.2% 16.3% 16.3% 11.4% 11.4%
1 0.0% 0.0% 0.0% 0.0% 0.0%
2 0.0% 0.0% 0.0% 0.0% 0.0%
3 2.5% 0.0% 0.0% 0.0% 0.0%
4 19.7% 12.6% 9.6% 9.6% 8.9%
5 24.8% 17.6% 14.6% 14.6% 14.0%
1 0.0% 0.0% 0.0% 0.0% 0.0%
2 0.0% 0.0% 0.0% 0.0% 0.0%
3 2.7% 0.0% 0.0% 0.0% 0.0%
4 19.9% 13.1% 12.6% 10.4% 8.3%
5 25.0% 18.1% 17.8% 15.6% 13.5%
1 0.0% 0.0% 0.0% 0.0% 0.0%
2 0.0% 0.0% 0.0% 0.0% 0.0%
3 2.5% 0.0% 0.0% 0.0% 0.0%
4 19.5% 13.3% 12.2% 10.2% 9.2%
5 24.5% 18.4% 17.2% 15.2% 14.3%
1 0.0% 0.0% 0.0% 0.0% 0.0%
2 0.0% 0.0% 0.0% 0.0% 0.0%
3 1.0% 0.0% 0.0% 0.0% 0.0%
4 17.5% 11.8% 10.5% 8.9% 7.4%
5 22.2% 16.7% 15.3% 13.8% 12.2%
1 0.0% 0.0% 0.0% 0.0% 0.0%
2 0.0% 0.0% 0.0% 0.0% 0.0%
3 0.0% 0.0% 0.0% 0.0% 0.0%
4 1.9% 0.2% 0.0% 0.0% 0.0%
5 3.7% 2.0% 1.6% 1.2% 0.7%
Source: Adams Integra, August 2012
100 Unit Scheme
500 Unit Scheme
10 Unit Scheme
15 Unit Scheme
20 Unit Scheme
50 Unit Scheme
Table 51a: Summary of Residual Land Value (as % of GDV) Appraisals for
All Value Points
0%, 25%, 30%, 35% and 40% Affordable Housing
70% Social Rent/30% Shared Ownership
Planning Infrastructure Level £0, £40 CIL
Code for Sustainable Homes Level 5
High Density
Appendix 4i

Appendix 4i
Graph 51a: Summary of Residual Land Values (as % of GDV) at 0%, 25%, 30%, 35% &
40% Affordable Housing Across all Value Points
70% Social Rent/30% Shared Ownership
Planning Infrastructure Level £0, £40 CIL
CfSH Level 5
High Density
0.0%
5.0%
10.0%
15.0%
20.0%
25.0%
30.0%
35.0%
40.0%
1 2 3 4 5 1 2 3 4 5 1 2 3 4 5 1 2 3 4 5 1 2 3 4 5 1 2 3 4 5
10 Unit Scheme 15 Unit Scheme 20 Unit Scheme 50 Unit Scheme 100 Unit Scheme 500 Unit Scheme
Resid
ual Lan
d V
alu
e (%
o
f G
DV
)
Residual Land Value - 0% Affordable Residual Land Value - 25% Affordable Residual Land Value - 30% Affordable
Residual Land Value - 35% Affordable Residual Land Value - 40% Affordable
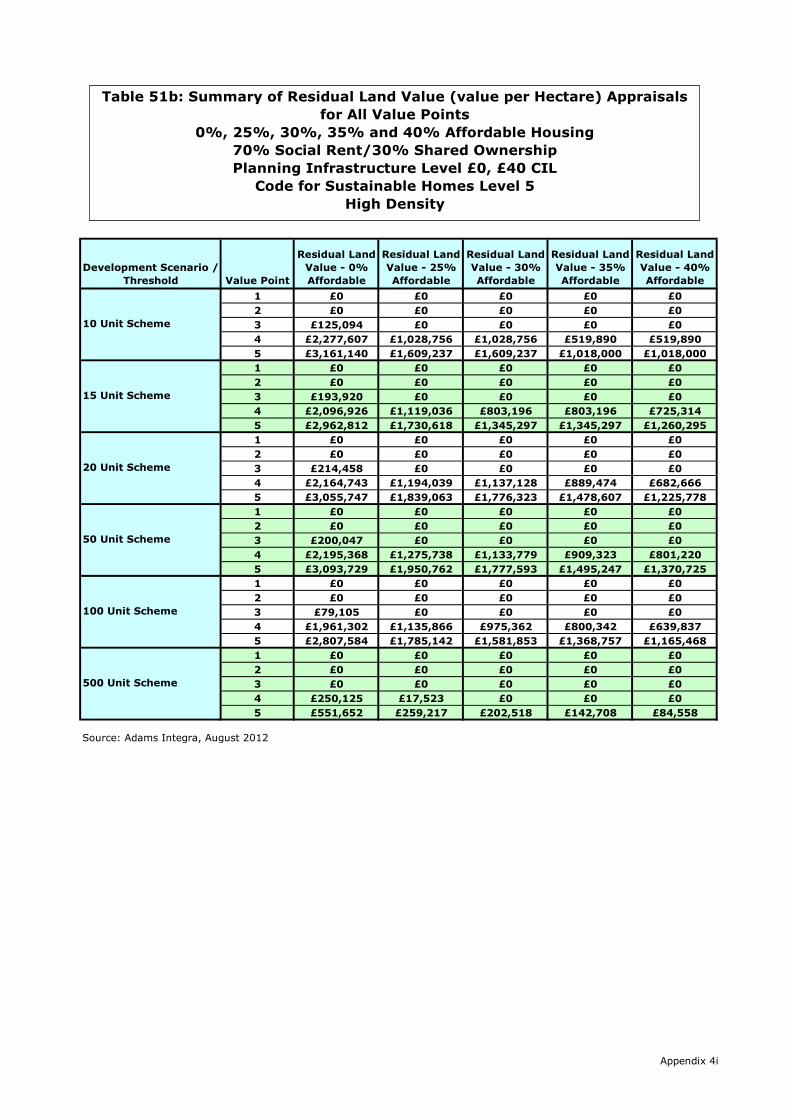
Development Scenario /
Threshold Value Point
Residual Land
Value - 0%
Affordable
Residual Land
Value - 25%
Affordable
Residual Land
Value - 30%
Affordable
Residual Land
Value - 35%
Affordable
Residual Land
Value - 40%
Affordable
1 £0 £0 £0 £0 £0
2 £0 £0 £0 £0 £0
3 £125,094 £0 £0 £0 £0
4 £2,277,607 £1,028,756 £1,028,756 £519,890 £519,890
5 £3,161,140 £1,609,237 £1,609,237 £1,018,000 £1,018,000
1 £0 £0 £0 £0 £0
2 £0 £0 £0 £0 £0
3 £193,920 £0 £0 £0 £0
4 £2,096,926 £1,119,036 £803,196 £803,196 £725,314
5 £2,962,812 £1,730,618 £1,345,297 £1,345,297 £1,260,295
1 £0 £0 £0 £0 £0
2 £0 £0 £0 £0 £0
3 £214,458 £0 £0 £0 £0
4 £2,164,743 £1,194,039 £1,137,128 £889,474 £682,666
5 £3,055,747 £1,839,063 £1,776,323 £1,478,607 £1,225,778
1 £0 £0 £0 £0 £0
2 £0 £0 £0 £0 £0
3 £200,047 £0 £0 £0 £0
4 £2,195,368 £1,275,738 £1,133,779 £909,323 £801,220
5 £3,093,729 £1,950,762 £1,777,593 £1,495,247 £1,370,725
1 £0 £0 £0 £0 £0
2 £0 £0 £0 £0 £0
3 £79,105 £0 £0 £0 £0
4 £1,961,302 £1,135,866 £975,362 £800,342 £639,837
5 £2,807,584 £1,785,142 £1,581,853 £1,368,757 £1,165,468
1 £0 £0 £0 £0 £0
2 £0 £0 £0 £0 £0
3 £0 £0 £0 £0 £0
4 £250,125 £17,523 £0 £0 £0
5 £551,652 £259,217 £202,518 £142,708 £84,558
Source: Adams Integra, August 2012
100 Unit Scheme
500 Unit Scheme
10 Unit Scheme
15 Unit Scheme
20 Unit Scheme
50 Unit Scheme
Table 51b: Summary of Residual Land Value (value per Hectare) Appraisals
for All Value Points
0%, 25%, 30%, 35% and 40% Affordable Housing
70% Social Rent/30% Shared Ownership
Planning Infrastructure Level £0, £40 CIL
Code for Sustainable Homes Level 5
High Density
Appendix 4i

Appendix 4i
Graph 51b: Summary of Residual Land Values (value per Hectare) at 0%, 25%, 30%, 35%
& 40% Affordable Housing Across all Value Points
70% Social Rent/30% Shared Ownership
Planning Infrastructure Level £0, £40 CIL
CfSH Level 5
High Density
£0
£500,000
£1,000,000
£1,500,000
£2,000,000
£2,500,000
£3,000,000
£3,500,000
£4,000,000
1 2 3 4 5 1 2 3 4 5 1 2 3 4 5 1 2 3 4 5 1 2 3 4 5 1 2 3 4 5
10 Unit Scheme 15 Unit Scheme 20 Unit Scheme 50 Unit Scheme 100 Unit Scheme 500 Unit Scheme
Resid
ual Lan
d V
alu
e (%
o
f G
DV
)
Residual Land Value - 0% Affordable Residual Land Value - 25% Affordable Residual Land Value - 30% Affordable
Residual Land Value - 35% Affordable Residual Land Value - 40% Affordable

Development Scenario /
Threshold Value Point
Residual Land
Value - 0%
Affordable
Residual Land
Value - 25%
Affordable
Residual Land
Value - 30%
Affordable
Residual Land
Value - 35%
Affordable
Residual Land
Value - 40%
Affordable
1 £0 £0 £0 £0 £0
2 £0 £0 £0 £0 £0
3 £42,560 £0 £0 £0 £0
4 £847,255 £545,213 £545,213 £450,157 £450,157
5 £1,171,639 £786,767 £786,767 £665,668 £665,668
1 £0 £0 £0 £0 £0
2 £0 £0 £0 £0 £0
3 £49,641 £0 £0 £0 £0
4 £1,244,812 £847,524 £748,932 £748,932 £681,332
5 £1,713,489 £1,213,124 £1,093,367 £1,093,367 £1,004,602
1 £0 £0 £0 £0 £0
2 £0 £0 £0 £0 £0
3 £60,125 £0 £0 £0 £0
4 £1,643,710 £1,150,608 £1,083,386 £985,346 £853,586
5 £2,281,696 £1,665,048 £1,576,781 £1,457,695 £1,286,572
1 £0 £0 £0 £0 £0
2 £0 £0 £0 £0 £0
3 £64,577 £0 £0 £0 £0
4 £3,797,076 £2,603,298 £2,389,390 £2,124,086 £1,930,710
5 £5,258,108 £3,762,842 £3,490,227 £3,163,564 £2,911,482
1 £0 £0 £0 £0 £0
2 £0 £0 £0 £0 £0
3 £0 £0 £0 £0 £0
4 £6,827,045 £4,617,443 £4,185,354 £3,733,922 £3,310,705
5 £9,579,715 £6,804,588 £6,259,394 £5,694,857 £5,158,535
1 £0 £0 £0 £0 £0
2 £0 £0 £0 £0 £0
3 £0 £0 £0 £0 £0
4 £3,603,109 £948,869 £419,607 £0 £0
5 £7,283,807 £3,939,219 £3,264,674 £2,599,508 £1,924,963
Source: Adams Integra, August 2012
100 Unit Scheme
500 Unit Scheme
10 Unit Scheme
15 Unit Scheme
20 Unit Scheme
50 Unit Scheme
Table 52: Summary of Residual Land Value (£) Appraisals for
All Value Points
0%, 25%, 30%, 35% and 40% Affordable Housing
70% Social Rent/30% Shared Ownership
Planning Infrastructure Level £0, £60 CIL
Code for Sustainable Homes Level 5
Low Density
Appendix 4i
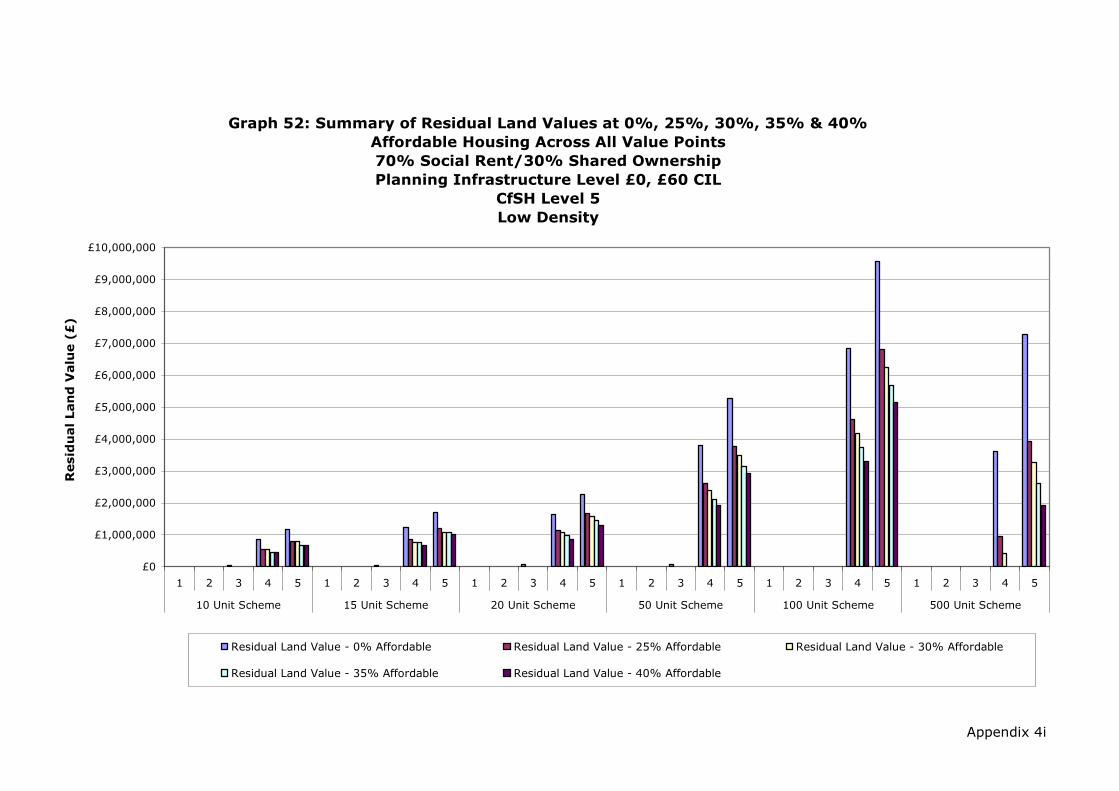
Appendix 4i
Graph 52: Summary of Residual Land Values at 0%, 25%, 30%, 35% & 40%
Affordable Housing Across All Value Points
70% Social Rent/30% Shared Ownership
Planning Infrastructure Level £0, £60 CIL
CfSH Level 5
Low Density
£0
£1,000,000
£2,000,000
£3,000,000
£4,000,000
£5,000,000
£6,000,000
£7,000,000
£8,000,000
£9,000,000
£10,000,000
1 2 3 4 5 1 2 3 4 5 1 2 3 4 5 1 2 3 4 5 1 2 3 4 5 1 2 3 4 5
10 Unit Scheme 15 Unit Scheme 20 Unit Scheme 50 Unit Scheme 100 Unit Scheme 500 Unit Scheme
Resid
ual Lan
d V
alu
e (£
)
Residual Land Value - 0% Affordable Residual Land Value - 25% Affordable Residual Land Value - 30% Affordable
Residual Land Value - 35% Affordable Residual Land Value - 40% Affordable
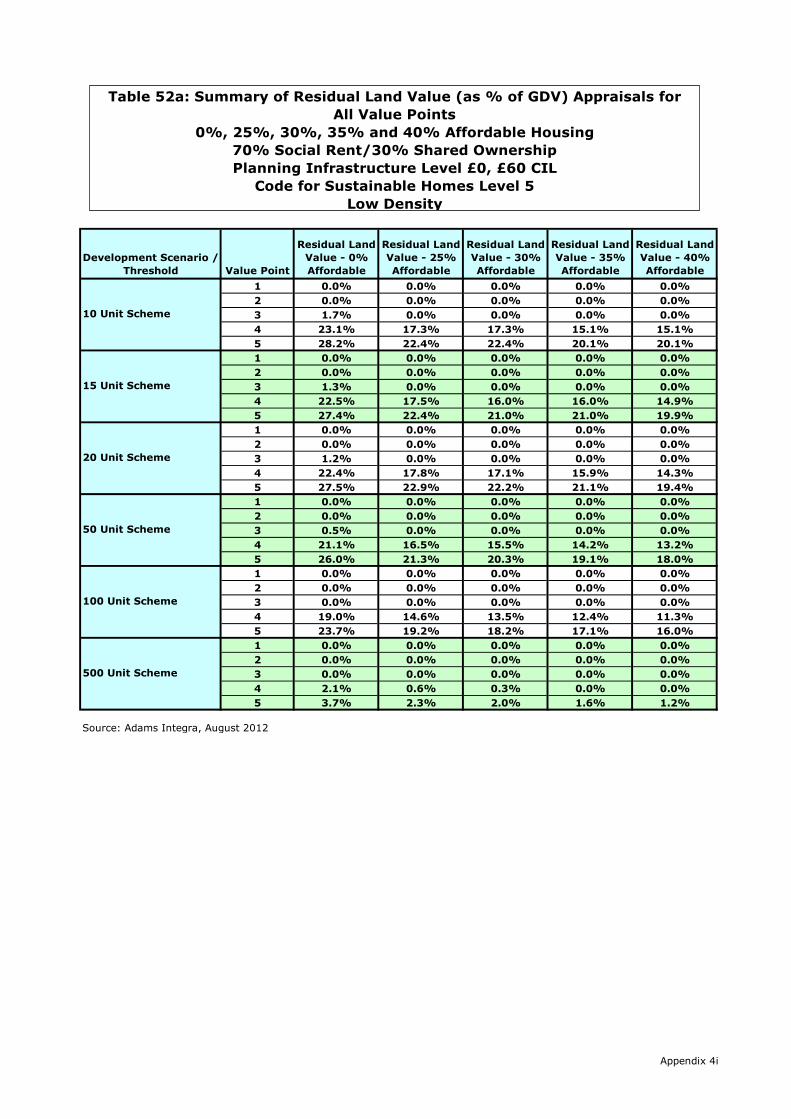
Development Scenario /
Threshold Value Point
Residual Land
Value - 0%
Affordable
Residual Land
Value - 25%
Affordable
Residual Land
Value - 30%
Affordable
Residual Land
Value - 35%
Affordable
Residual Land
Value - 40%
Affordable
1 0.0% 0.0% 0.0% 0.0% 0.0%
2 0.0% 0.0% 0.0% 0.0% 0.0%
3 1.7% 0.0% 0.0% 0.0% 0.0%
4 23.1% 17.3% 17.3% 15.1% 15.1%
5 28.2% 22.4% 22.4% 20.1% 20.1%
1 0.0% 0.0% 0.0% 0.0% 0.0%
2 0.0% 0.0% 0.0% 0.0% 0.0%
3 1.3% 0.0% 0.0% 0.0% 0.0%
4 22.5% 17.5% 16.0% 16.0% 14.9%
5 27.4% 22.4% 21.0% 21.0% 19.9%
1 0.0% 0.0% 0.0% 0.0% 0.0%
2 0.0% 0.0% 0.0% 0.0% 0.0%
3 1.2% 0.0% 0.0% 0.0% 0.0%
4 22.4% 17.8% 17.1% 15.9% 14.3%
5 27.5% 22.9% 22.2% 21.1% 19.4%
1 0.0% 0.0% 0.0% 0.0% 0.0%
2 0.0% 0.0% 0.0% 0.0% 0.0%
3 0.5% 0.0% 0.0% 0.0% 0.0%
4 21.1% 16.5% 15.5% 14.2% 13.2%
5 26.0% 21.3% 20.3% 19.1% 18.0%
1 0.0% 0.0% 0.0% 0.0% 0.0%
2 0.0% 0.0% 0.0% 0.0% 0.0%
3 0.0% 0.0% 0.0% 0.0% 0.0%
4 19.0% 14.6% 13.5% 12.4% 11.3%
5 23.7% 19.2% 18.2% 17.1% 16.0%
1 0.0% 0.0% 0.0% 0.0% 0.0%
2 0.0% 0.0% 0.0% 0.0% 0.0%
3 0.0% 0.0% 0.0% 0.0% 0.0%
4 2.1% 0.6% 0.3% 0.0% 0.0%
5 3.7% 2.3% 2.0% 1.6% 1.2%
Source: Adams Integra, August 2012
100 Unit Scheme
500 Unit Scheme
10 Unit Scheme
15 Unit Scheme
20 Unit Scheme
50 Unit Scheme
Table 52a: Summary of Residual Land Value (as % of GDV) Appraisals for
All Value Points
0%, 25%, 30%, 35% and 40% Affordable Housing
70% Social Rent/30% Shared Ownership
Planning Infrastructure Level £0, £60 CIL
Code for Sustainable Homes Level 5
Low Density
Appendix 4i

Appendix 4i
Graph 52a: Summary of Residual Land Values (as % of GDV) at 0%, 25%, 30%, 35% &
40% Affordable Housing Across all Value Points
70% Social Rent/30% Shared Ownership
Planning Infrastructure Level £0, £60 CIL
CfSH Level 5
Low Density
0.0%
5.0%
10.0%
15.0%
20.0%
25.0%
30.0%
35.0%
40.0%
1 2 3 4 5 1 2 3 4 5 1 2 3 4 5 1 2 3 4 5 1 2 3 4 5 1 2 3 4 5
10 Unit Scheme 15 Unit Scheme 20 Unit Scheme 50 Unit Scheme 100 Unit Scheme 500 Unit Scheme
Resid
ual Lan
d V
alu
e (%
o
f G
DV
)
Residual Land Value - 0% Affordable Residual Land Value - 25% Affordable Residual Land Value - 30% Affordable
Residual Land Value - 35% Affordable Residual Land Value - 40% Affordable

Development Scenario /
Threshold Value Point
Residual Land
Value - 0%
Affordable
Residual Land
Value - 25%
Affordable
Residual Land
Value - 30%
Affordable
Residual Land
Value - 35%
Affordable
Residual Land
Value - 40%
Affordable
1 £0 £0 £0 £0 £0
2 £0 £0 £0 £0 £0
3 £170,238 £0 £0 £0 £0
4 £3,389,019 £2,180,853 £2,180,853 £1,800,626 £1,800,626
5 £4,686,557 £3,147,068 £3,147,068 £2,662,672 £2,662,672
1 £0 £0 £0 £0 £0
2 £0 £0 £0 £0 £0
3 £132,375 £0 £0 £0 £0
4 £3,319,499 £2,260,065 £1,997,151 £1,997,151 £1,816,884
5 £4,569,303 £3,234,997 £2,915,644 £2,915,644 £2,678,939
1 £0 £0 £0 £0 £0
2 £0 £0 £0 £0 £0
3 £120,250 £0 £0 £0 £0
4 £3,287,420 £2,301,215 £2,166,772 £1,970,691 £1,707,172
5 £4,563,391 £3,330,096 £3,153,561 £2,915,389 £2,573,145
1 £0 £0 £0 £0 £0
2 £0 £0 £0 £0 £0
3 £51,662 £0 £0 £0 £0
4 £3,037,661 £2,082,639 £1,911,512 £1,699,269 £1,544,568
5 £4,206,487 £3,010,273 £2,792,181 £2,530,851 £2,329,185
1 £0 £0 £0 £0 £0
2 £0 £0 £0 £0 £0
3 £0 £0 £0 £0 £0
4 £2,730,818 £1,846,977 £1,674,141 £1,493,569 £1,324,282
5 £3,831,886 £2,721,835 £2,503,757 £2,277,943 £2,063,414
1 £0 £0 £0 £0 £0
2 £0 £0 £0 £0 £0
3 £0 £0 £0 £0 £0
4 £288,249 £75,909 £33,569 £0 £0
5 £582,705 £315,138 £261,174 £207,961 £153,997
Source: Adams Integra, August 2012
100 Unit Scheme
500 Unit Scheme
10 Unit Scheme
15 Unit Scheme
20 Unit Scheme
50 Unit Scheme
Table 52b: Summary of Residual Land Value (value per Hectare) Appraisals
for All Value Points
0%, 25%, 30%, 35% and 40% Affordable Housing
70% Social Rent/30% Shared Ownership
Planning Infrastructure Level £0, £60 CIL
Code for Sustainable Homes Level 5
Low Density
Appendix 4i

Appendix 4i
Graph 52b: Summary of Residual Land Values (value per Hectare) at 0%, 25%, 30%, 35%
& 40% Affordable Housing Across all Value Points
70% Social Rent/30% Shared Ownership
Planning Infrastructure Level £0, £60 CIL
CfSH Level 5
Low Density
£0
£500,000
£1,000,000
£1,500,000
£2,000,000
£2,500,000
£3,000,000
£3,500,000
£4,000,000
£4,500,000
£5,000,000
1 2 3 4 5 1 2 3 4 5 1 2 3 4 5 1 2 3 4 5 1 2 3 4 5 1 2 3 4 5
10 Unit Scheme 15 Unit Scheme 20 Unit Scheme 50 Unit Scheme 100 Unit Scheme 500 Unit Scheme
Resid
ual Lan
d V
alu
e (%
o
f G
DV
)
Residual Land Value - 0% Affordable Residual Land Value - 25% Affordable Residual Land Value - 30% Affordable
Residual Land Value - 35% Affordable Residual Land Value - 40% Affordable
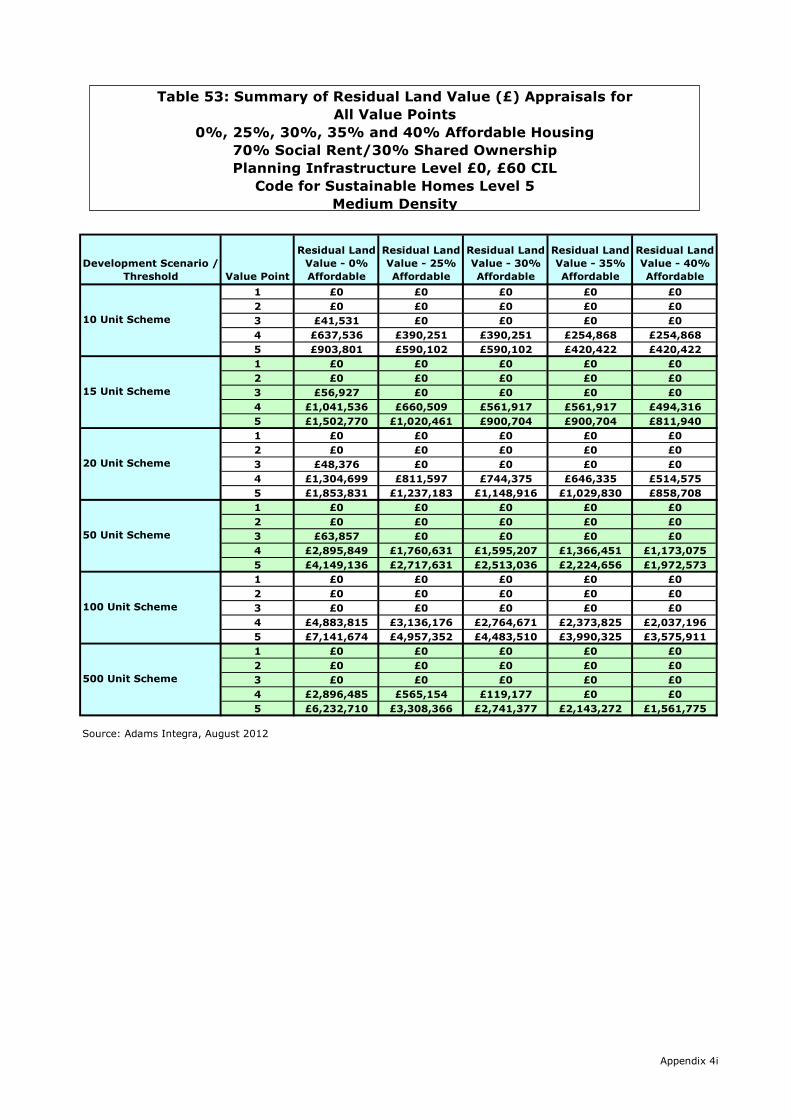
Development Scenario /
Threshold Value Point
Residual Land
Value - 0%
Affordable
Residual Land
Value - 25%
Affordable
Residual Land
Value - 30%
Affordable
Residual Land
Value - 35%
Affordable
Residual Land
Value - 40%
Affordable
1 £0 £0 £0 £0 £0
2 £0 £0 £0 £0 £0
3 £41,531 £0 £0 £0 £0
4 £637,536 £390,251 £390,251 £254,868 £254,868
5 £903,801 £590,102 £590,102 £420,422 £420,422
1 £0 £0 £0 £0 £0
2 £0 £0 £0 £0 £0
3 £56,927 £0 £0 £0 £0
4 £1,041,536 £660,509 £561,917 £561,917 £494,316
5 £1,502,770 £1,020,461 £900,704 £900,704 £811,940
1 £0 £0 £0 £0 £0
2 £0 £0 £0 £0 £0
3 £48,376 £0 £0 £0 £0
4 £1,304,699 £811,597 £744,375 £646,335 £514,575
5 £1,853,831 £1,237,183 £1,148,916 £1,029,830 £858,708
1 £0 £0 £0 £0 £0
2 £0 £0 £0 £0 £0
3 £63,857 £0 £0 £0 £0
4 £2,895,849 £1,760,631 £1,595,207 £1,366,451 £1,173,075
5 £4,149,136 £2,717,631 £2,513,036 £2,224,656 £1,972,573
1 £0 £0 £0 £0 £0
2 £0 £0 £0 £0 £0
3 £0 £0 £0 £0 £0
4 £4,883,815 £3,136,176 £2,764,671 £2,373,825 £2,037,196
5 £7,141,674 £4,957,352 £4,483,510 £3,990,325 £3,575,911
1 £0 £0 £0 £0 £0
2 £0 £0 £0 £0 £0
3 £0 £0 £0 £0 £0
4 £2,896,485 £565,154 £119,177 £0 £0
5 £6,232,710 £3,308,366 £2,741,377 £2,143,272 £1,561,775
Source: Adams Integra, August 2012
100 Unit Scheme
500 Unit Scheme
10 Unit Scheme
15 Unit Scheme
20 Unit Scheme
50 Unit Scheme
Table 53: Summary of Residual Land Value (£) Appraisals for
All Value Points
0%, 25%, 30%, 35% and 40% Affordable Housing
70% Social Rent/30% Shared Ownership
Planning Infrastructure Level £0, £60 CIL
Code for Sustainable Homes Level 5
Medium Density
Appendix 4i
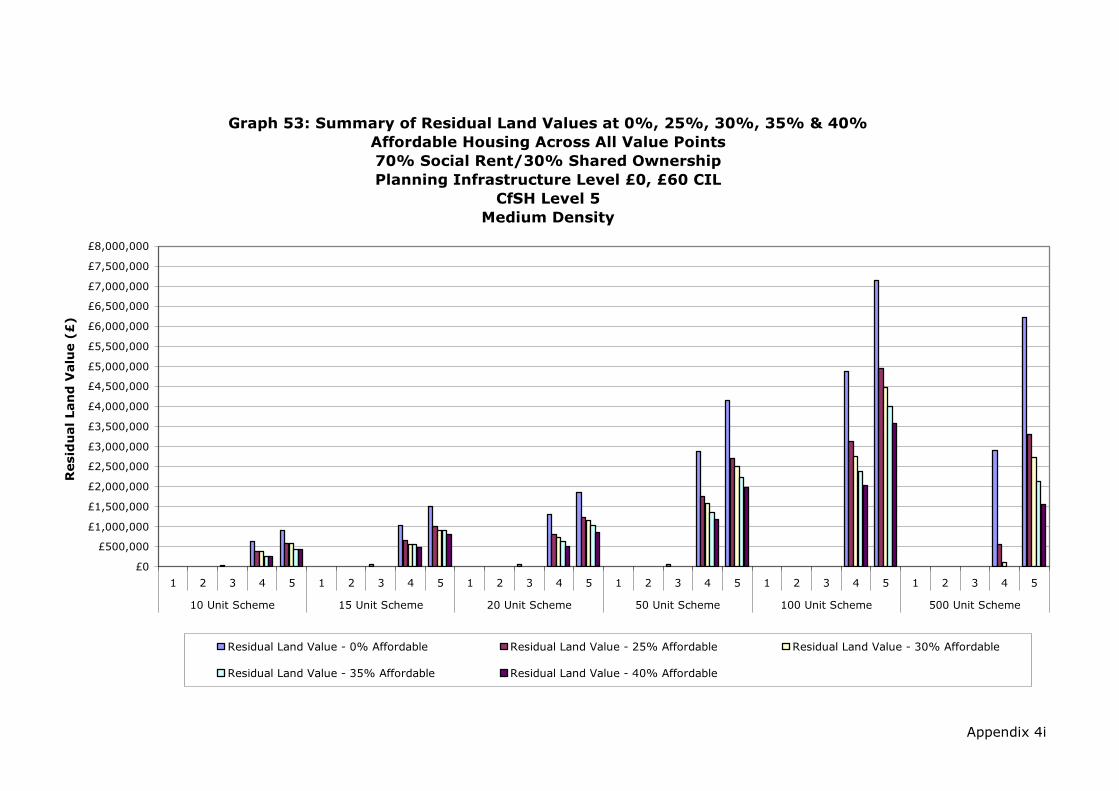
Appendix 4i
Graph 53: Summary of Residual Land Values at 0%, 25%, 30%, 35% & 40%
Affordable Housing Across All Value Points
70% Social Rent/30% Shared Ownership
Planning Infrastructure Level £0, £60 CIL
CfSH Level 5
Medium Density
£0
£500,000
£1,000,000
£1,500,000
£2,000,000
£2,500,000
£3,000,000
£3,500,000
£4,000,000
£4,500,000
£5,000,000
£5,500,000
£6,000,000
£6,500,000
£7,000,000
£7,500,000
£8,000,000
1 2 3 4 5 1 2 3 4 5 1 2 3 4 5 1 2 3 4 5 1 2 3 4 5 1 2 3 4 5
10 Unit Scheme 15 Unit Scheme 20 Unit Scheme 50 Unit Scheme 100 Unit Scheme 500 Unit Scheme
Resid
ual Lan
d V
alu
e (£
)
Residual Land Value - 0% Affordable Residual Land Value - 25% Affordable Residual Land Value - 30% Affordable
Residual Land Value - 35% Affordable Residual Land Value - 40% Affordable

Development Scenario /
Threshold Value Point
Residual Land
Value - 0%
Affordable
Residual Land
Value - 25%
Affordable
Residual Land
Value - 30%
Affordable
Residual Land
Value - 35%
Affordable
Residual Land
Value - 40%
Affordable
1 0.0% 0.0% 0.0% 0.0% 0.0%
2 0.0% 0.0% 0.0% 0.0% 0.0%
3 2.2% 0.0% 0.0% 0.0% 0.0%
4 22.8% 16.5% 16.5% 11.9% 11.9%
5 28.2% 22.1% 22.1% 17.6% 17.6%
1 0.0% 0.0% 0.0% 0.0% 0.0%
2 0.0% 0.0% 0.0% 0.0% 0.0%
3 1.9% 0.0% 0.0% 0.0% 0.0%
4 23.1% 17.2% 15.3% 15.3% 13.9%
5 28.9% 23.2% 21.5% 21.5% 20.2%
1 0.0% 0.0% 0.0% 0.0% 0.0%
2 0.0% 0.0% 0.0% 0.0% 0.0%
3 1.2% 0.0% 0.0% 0.0% 0.0%
4 22.3% 16.2% 15.2% 13.7% 11.5%
5 27.7% 21.9% 20.9% 19.4% 17.1%
1 0.0% 0.0% 0.0% 0.0% 0.0%
2 0.0% 0.0% 0.0% 0.0% 0.0%
3 0.7% 0.0% 0.0% 0.0% 0.0%
4 20.8% 14.9% 13.8% 12.3% 10.9%
5 26.2% 20.4% 19.3% 17.8% 16.4%
1 0.0% 0.0% 0.0% 0.0% 0.0%
2 0.0% 0.0% 0.0% 0.0% 0.0%
3 0.0% 0.0% 0.0% 0.0% 0.0%
4 18.5% 13.6% 12.4% 11.0% 9.7%
5 23.7% 19.0% 17.8% 16.4% 15.2%
1 0.0% 0.0% 0.0% 0.0% 0.0%
2 0.0% 0.0% 0.0% 0.0% 0.0%
3 0.0% 0.0% 0.0% 0.0% 0.0%
4 2.0% 0.4% 0.1% 0.0% 0.0%
5 3.7% 2.3% 1.9% 1.6% 1.2%
Source: Adams Integra, August 2012
100 Unit Scheme
500 Unit Scheme
10 Unit Scheme
15 Unit Scheme
20 Unit Scheme
50 Unit Scheme
Table 53a: Summary of Residual Land Value (as % of GDV) Appraisals for
All Value Points
0%, 25%, 30%, 35% and 40% Affordable Housing
70% Social Rent/30% Shared Ownership
Planning Infrastructure Level £0, £60 CIL
Code for Sustainable Homes Level 5
Medium Density
Appendix 4i
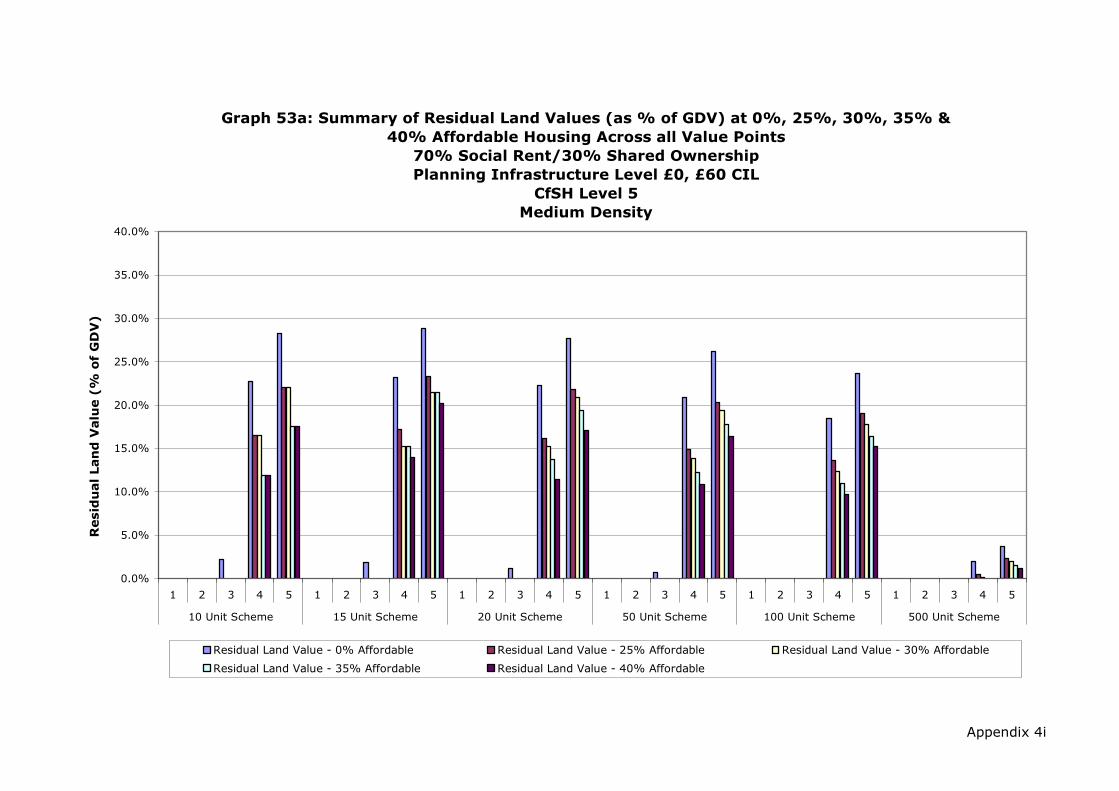
Appendix 4i
Graph 53a: Summary of Residual Land Values (as % of GDV) at 0%, 25%, 30%, 35% &
40% Affordable Housing Across all Value Points
70% Social Rent/30% Shared Ownership
Planning Infrastructure Level £0, £60 CIL
CfSH Level 5
Medium Density
0.0%
5.0%
10.0%
15.0%
20.0%
25.0%
30.0%
35.0%
40.0%
1 2 3 4 5 1 2 3 4 5 1 2 3 4 5 1 2 3 4 5 1 2 3 4 5 1 2 3 4 5
10 Unit Scheme 15 Unit Scheme 20 Unit Scheme 50 Unit Scheme 100 Unit Scheme 500 Unit Scheme
Resid
ual Lan
d V
alu
e (%
o
f G
DV
)
Residual Land Value - 0% Affordable Residual Land Value - 25% Affordable Residual Land Value - 30% Affordable
Residual Land Value - 35% Affordable Residual Land Value - 40% Affordable

Development Scenario /
Threshold Value Point
Residual Land
Value - 0%
Affordable
Residual Land
Value - 25%
Affordable
Residual Land
Value - 30%
Affordable
Residual Land
Value - 35%
Affordable
Residual Land
Value - 40%
Affordable
1 £0 £0 £0 £0 £0
2 £0 £0 £0 £0 £0
3 £186,890 £0 £0 £0 £0
4 £2,868,914 £1,756,128 £1,756,128 £1,146,908 £1,146,908
5 £4,067,103 £2,655,458 £2,655,458 £1,891,898 £1,891,898
1 £0 £0 £0 £0 £0
2 £0 £0 £0 £0 £0
3 £170,781 £0 £0 £0 £0
4 £3,124,607 £1,981,528 £1,685,750 £1,685,750 £1,482,949
5 £4,508,311 £3,061,384 £2,702,113 £2,702,113 £2,435,819
1 £0 £0 £0 £0 £0
2 £0 £0 £0 £0 £0
3 £108,845 £0 £0 £0 £0
4 £2,935,573 £1,826,093 £1,674,845 £1,454,254 £1,157,795
5 £4,171,120 £2,783,662 £2,585,061 £2,317,117 £1,932,092
1 £0 £0 £0 £0 £0
2 £0 £0 £0 £0 £0
3 £57,472 £0 £0 £0 £0
4 £2,606,264 £1,584,568 £1,435,686 £1,229,806 £1,055,768
5 £3,734,223 £2,445,868 £2,261,732 £2,002,190 £1,775,316
1 £0 £0 £0 £0 £0
2 £0 £0 £0 £0 £0
3 £0 £0 £0 £0 £0
4 £2,197,717 £1,411,279 £1,244,102 £1,068,221 £916,738
5 £3,213,753 £2,230,809 £2,017,579 £1,795,646 £1,609,160
1 £0 £0 £0 £0 £0
2 £0 £0 £0 £0 £0
3 £0 £0 £0 £0 £0
4 £260,684 £50,864 £10,726 £0 £0
5 £560,944 £297,753 £246,724 £192,894 £140,560
Source: Adams Integra, August 2012
100 Unit Scheme
500 Unit Scheme
10 Unit Scheme
15 Unit Scheme
20 Unit Scheme
50 Unit Scheme
Table 53b: Summary of Residual Land Value (value per Hectare) Appraisals
for All Value Points
0%, 25%, 30%, 35% and 40% Affordable Housing
70% Social Rent/30% Shared Ownership
Planning Infrastructure Level £0, £60 CIL
Code for Sustainable Homes Level 5
Medium Density
Appendix 4i
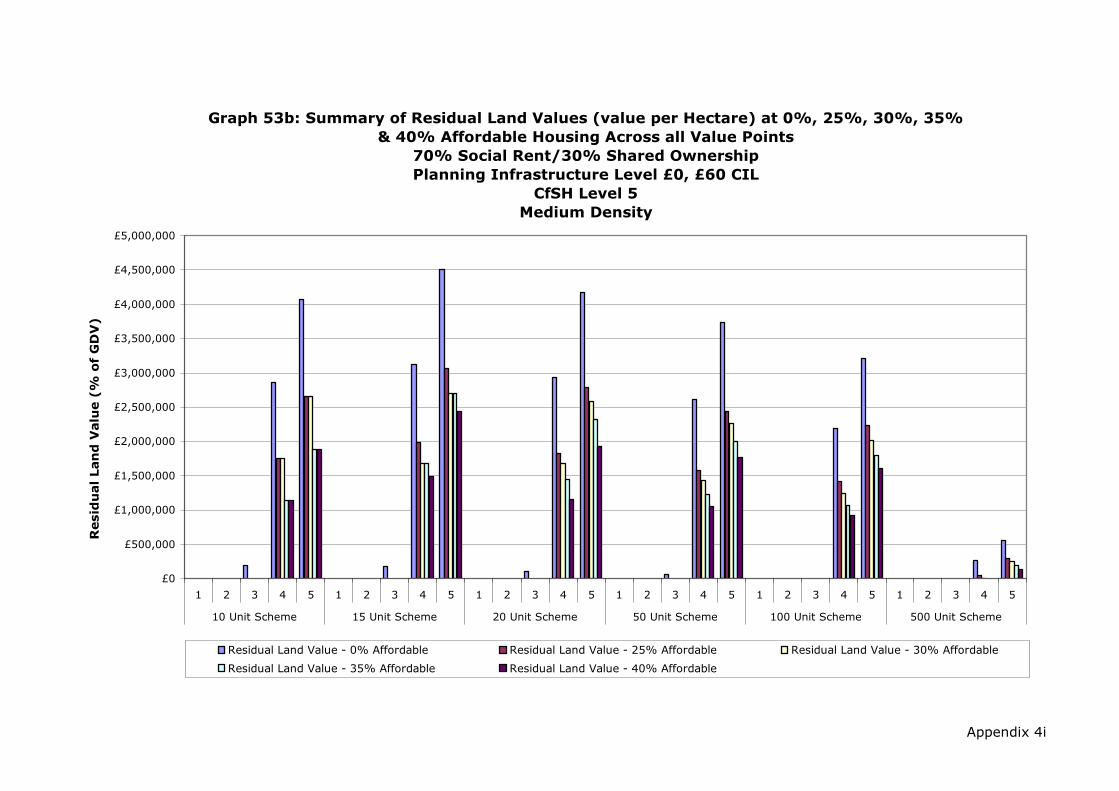
Appendix 4i
Graph 53b: Summary of Residual Land Values (value per Hectare) at 0%, 25%, 30%, 35%
& 40% Affordable Housing Across all Value Points
70% Social Rent/30% Shared Ownership
Planning Infrastructure Level £0, £60 CIL
CfSH Level 5
Medium Density
£0
£500,000
£1,000,000
£1,500,000
£2,000,000
£2,500,000
£3,000,000
£3,500,000
£4,000,000
£4,500,000
£5,000,000
1 2 3 4 5 1 2 3 4 5 1 2 3 4 5 1 2 3 4 5 1 2 3 4 5 1 2 3 4 5
10 Unit Scheme 15 Unit Scheme 20 Unit Scheme 50 Unit Scheme 100 Unit Scheme 500 Unit Scheme
Resid
ual Lan
d V
alu
e (%
o
f G
DV
)
Residual Land Value - 0% Affordable Residual Land Value - 25% Affordable Residual Land Value - 30% Affordable
Residual Land Value - 35% Affordable Residual Land Value - 40% Affordable

Development Scenario /
Threshold Value Point
Residual Land
Value - 0%
Affordable
Residual Land
Value - 25%
Affordable
Residual Land
Value - 30%
Affordable
Residual Land
Value - 35%
Affordable
Residual Land
Value - 40%
Affordable
1 £0 £0 £0 £0 £0
2 £0 £0 £0 £0 £0
3 £12,221 £0 £0 £0 £0
4 £443,108 £193,082 £193,082 £91,181 £91,181
5 £619,942 £309,434 £309,434 £190,931 £190,931
1 £0 £0 £0 £0 £0
2 £0 £0 £0 £0 £0
3 £40,094 £0 £0 £0 £0
4 £611,719 £318,171 £223,058 £223,058 £199,693
5 £871,485 £501,827 £386,049 £386,049 £360,549
1 £0 £0 £0 £0 £0
2 £0 £0 £0 £0 £0
3 £61,324 £0 £0 £0 £0
4 £842,416 £453,890 £431,125 £332,064 £249,341
5 £1,198,818 £712,144 £687,048 £567,962 £471,693
1 £0 £0 £0 £0 £0
2 £0 £0 £0 £0 £0
3 £140,571 £0 £0 £0 £0
4 £2,136,332 £1,216,702 £1,074,743 £850,287 £742,183
5 £3,034,692 £1,891,726 £1,718,557 £1,436,210 £1,311,689
1 £0 £0 £0 £0 £0
2 £0 £0 £0 £0 £0
3 £42,347 £0 £0 £0 £0
4 £3,811,376 £2,160,504 £1,839,495 £1,489,456 £1,168,447
5 £5,503,939 £3,459,056 £3,052,478 £2,626,287 £2,219,709
1 £0 £0 £0 £0 £0
2 £0 £0 £0 £0 £0
3 £0 £0 £0 £0 £0
4 £2,338,502 £7,470 £0 £0 £0
5 £5,353,765 £2,429,421 £1,862,432 £1,264,327 £682,829
Source: Adams Integra, August 2012
100 Unit Scheme
500 Unit Scheme
10 Unit Scheme
15 Unit Scheme
20 Unit Scheme
50 Unit Scheme
Table 54: Summary of Residual Land Value (£) Appraisals for
All Value Points
0%, 25%, 30%, 35% and 40% Affordable Housing
70% Social Rent/30% Shared Ownership
Planning Infrastructure Level £0, £60 CIL
Code for Sustainable Homes Level 5
High Density
Appendix 4i

Appendix 4i
Graph 54: Summary of Residual Land Values at 0%, 25%, 30%, 35% & 40%
Affordable Housing Across All Value Points
70% Social Rent/30% Shared Ownership
Planning Infrastructure Level £0, £60 CIL
CfSH Level 5
High Density
£0
£500,000
£1,000,000
£1,500,000
£2,000,000
£2,500,000
£3,000,000
£3,500,000
£4,000,000
£4,500,000
£5,000,000
£5,500,000
£6,000,000
1 2 3 4 5 1 2 3 4 5 1 2 3 4 5 1 2 3 4 5 1 2 3 4 5 1 2 3 4 5
10 Unit Scheme 15 Unit Scheme 20 Unit Scheme 50 Unit Scheme 100 Unit Scheme 500 Unit Scheme
Resid
ual Lan
d V
alu
e (£
)
Residual Land Value - 0% Affordable Residual Land Value - 25% Affordable Residual Land Value - 30% Affordable
Residual Land Value - 35% Affordable Residual Land Value - 40% Affordable

Development Scenario /
Threshold Value Point
Residual Land
Value - 0%
Affordable
Residual Land
Value - 25%
Affordable
Residual Land
Value - 30%
Affordable
Residual Land
Value - 35%
Affordable
Residual Land
Value - 40%
Affordable
1 0.0% 0.0% 0.0% 0.0% 0.0%
2 0.0% 0.0% 0.0% 0.0% 0.0%
3 0.8% 0.0% 0.0% 0.0% 0.0%
4 19.8% 10.7% 10.7% 5.6% 5.6%
5 24.7% 15.6% 15.6% 10.7% 10.7%
1 0.0% 0.0% 0.0% 0.0% 0.0%
2 0.0% 0.0% 0.0% 0.0% 0.0%
3 1.7% 0.0% 0.0% 0.0% 0.0%
4 19.2% 11.9% 8.9% 8.9% 8.1%
5 24.3% 17.0% 14.0% 14.0% 13.4%
1 0.0% 0.0% 0.0% 0.0% 0.0%
2 0.0% 0.0% 0.0% 0.0% 0.0%
3 1.9% 0.0% 0.0% 0.0% 0.0%
4 19.4% 12.4% 12.0% 9.7% 7.6%
5 24.5% 17.6% 17.2% 14.9% 13.0%
1 0.0% 0.0% 0.0% 0.0% 0.0%
2 0.0% 0.0% 0.0% 0.0% 0.0%
3 1.7% 0.0% 0.0% 0.0% 0.0%
4 19.0% 12.7% 11.5% 9.6% 8.5%
5 24.0% 17.8% 16.7% 14.6% 13.7%
1 0.0% 0.0% 0.0% 0.0% 0.0%
2 0.0% 0.0% 0.0% 0.0% 0.0%
3 0.3% 0.0% 0.0% 0.0% 0.0%
4 17.0% 11.2% 9.9% 8.3% 6.7%
5 21.8% 16.1% 14.8% 13.2% 11.6%
1 0.0% 0.0% 0.0% 0.0% 0.0%
2 0.0% 0.0% 0.0% 0.0% 0.0%
3 0.0% 0.0% 0.0% 0.0% 0.0%
4 1.8% 0.0% 0.0% 0.0% 0.0%
5 3.6% 1.9% 1.5% 1.1% 0.6%
Source: Adams Integra, August 2012
100 Unit Scheme
500 Unit Scheme
10 Unit Scheme
15 Unit Scheme
20 Unit Scheme
50 Unit Scheme
Table 54a: Summary of Residual Land Value (as % of GDV) Appraisals for
All Value Points
0%, 25%, 30%, 35% and 40% Affordable Housing
70% Social Rent/30% Shared Ownership
Planning Infrastructure Level £0, £60 CIL
Code for Sustainable Homes Level 5
High Density
Appendix 4i
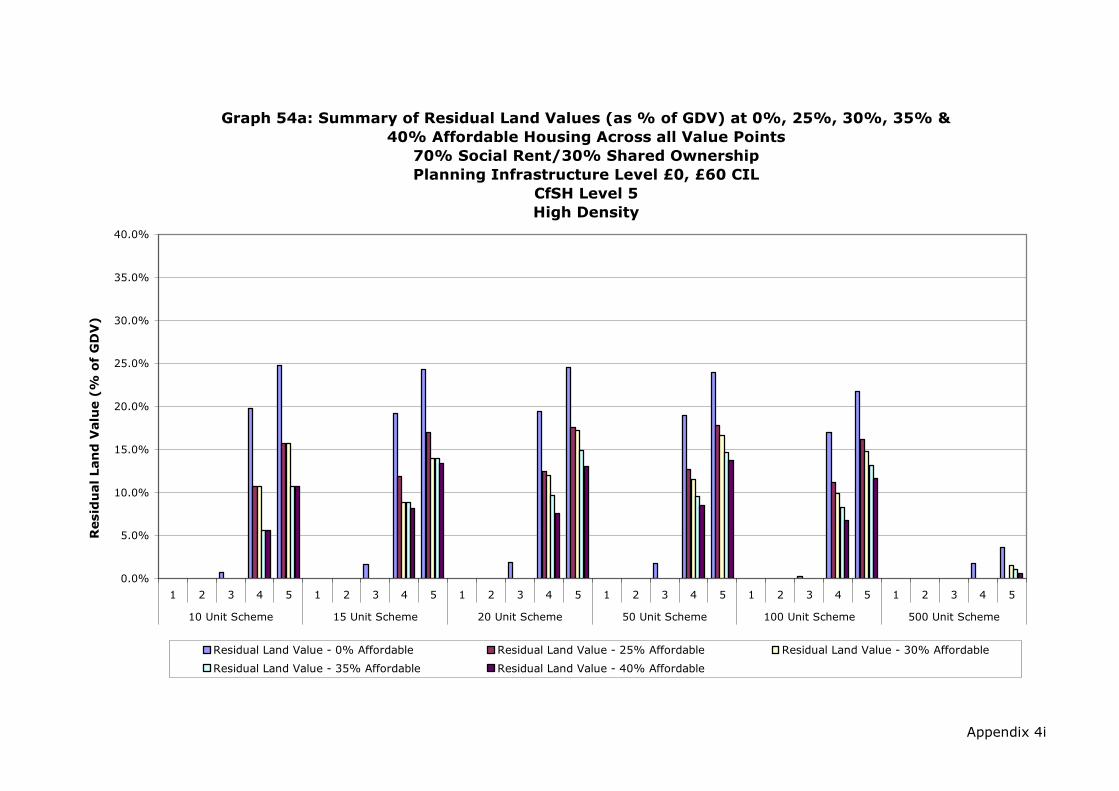
Appendix 4i
Graph 54a: Summary of Residual Land Values (as % of GDV) at 0%, 25%, 30%, 35% &
40% Affordable Housing Across all Value Points
70% Social Rent/30% Shared Ownership
Planning Infrastructure Level £0, £60 CIL
CfSH Level 5
High Density
0.0%
5.0%
10.0%
15.0%
20.0%
25.0%
30.0%
35.0%
40.0%
1 2 3 4 5 1 2 3 4 5 1 2 3 4 5 1 2 3 4 5 1 2 3 4 5 1 2 3 4 5
10 Unit Scheme 15 Unit Scheme 20 Unit Scheme 50 Unit Scheme 100 Unit Scheme 500 Unit Scheme
Resid
ual Lan
d V
alu
e (%
o
f G
DV
)
Residual Land Value - 0% Affordable Residual Land Value - 25% Affordable Residual Land Value - 30% Affordable
Residual Land Value - 35% Affordable Residual Land Value - 40% Affordable

Development Scenario /
Threshold Value Point
Residual Land
Value - 0%
Affordable
Residual Land
Value - 25%
Affordable
Residual Land
Value - 30%
Affordable
Residual Land
Value - 35%
Affordable
Residual Land
Value - 40%
Affordable
1 £0 £0 £0 £0 £0
2 £0 £0 £0 £0 £0
3 £61,107 £0 £0 £0 £0
4 £2,215,539 £965,409 £965,409 £455,903 £455,903
5 £3,099,712 £1,547,169 £1,547,169 £954,653 £954,653
1 £0 £0 £0 £0 £0
2 £0 £0 £0 £0 £0
3 £133,647 £0 £0 £0 £0
4 £2,039,064 £1,060,571 £743,525 £743,525 £665,643
5 £2,904,950 £1,672,755 £1,286,831 £1,286,831 £1,201,830
1 £0 £0 £0 £0 £0
2 £0 £0 £0 £0 £0
3 £153,309 £0 £0 £0 £0
4 £2,106,040 £1,134,724 £1,077,813 £830,159 £623,352
5 £2,997,044 £1,780,360 £1,717,620 £1,419,905 £1,179,233
1 £0 £0 £0 £0 £0
2 £0 £0 £0 £0 £0
3 £140,571 £0 £0 £0 £0
4 £2,136,332 £1,216,702 £1,074,743 £850,287 £742,183
5 £3,034,692 £1,891,726 £1,718,557 £1,436,210 £1,311,689
1 £0 £0 £0 £0 £0
2 £0 £0 £0 £0 £0
3 £21,174 £0 £0 £0 £0
4 £1,905,688 £1,080,252 £919,748 £744,728 £584,223
5 £2,751,970 £1,729,528 £1,526,239 £1,313,143 £1,109,854
1 £0 £0 £0 £0 £0
2 £0 £0 £0 £0 £0
3 £0 £0 £0 £0 £0
4 £233,850 £747 £0 £0 £0
5 £535,376 £242,942 £186,243 £126,433 £68,283
Source: Adams Integra, August 2012
100 Unit Scheme
500 Unit Scheme
10 Unit Scheme
15 Unit Scheme
20 Unit Scheme
50 Unit Scheme
Table 54b: Summary of Residual Land Value (value per Hectare) Appraisals
for All Value Points
0%, 25%, 30%, 35% and 40% Affordable Housing
70% Social Rent/30% Shared Ownership
Planning Infrastructure Level £0, £60 CIL
Code for Sustainable Homes Level 5
High Density
Appendix 4i
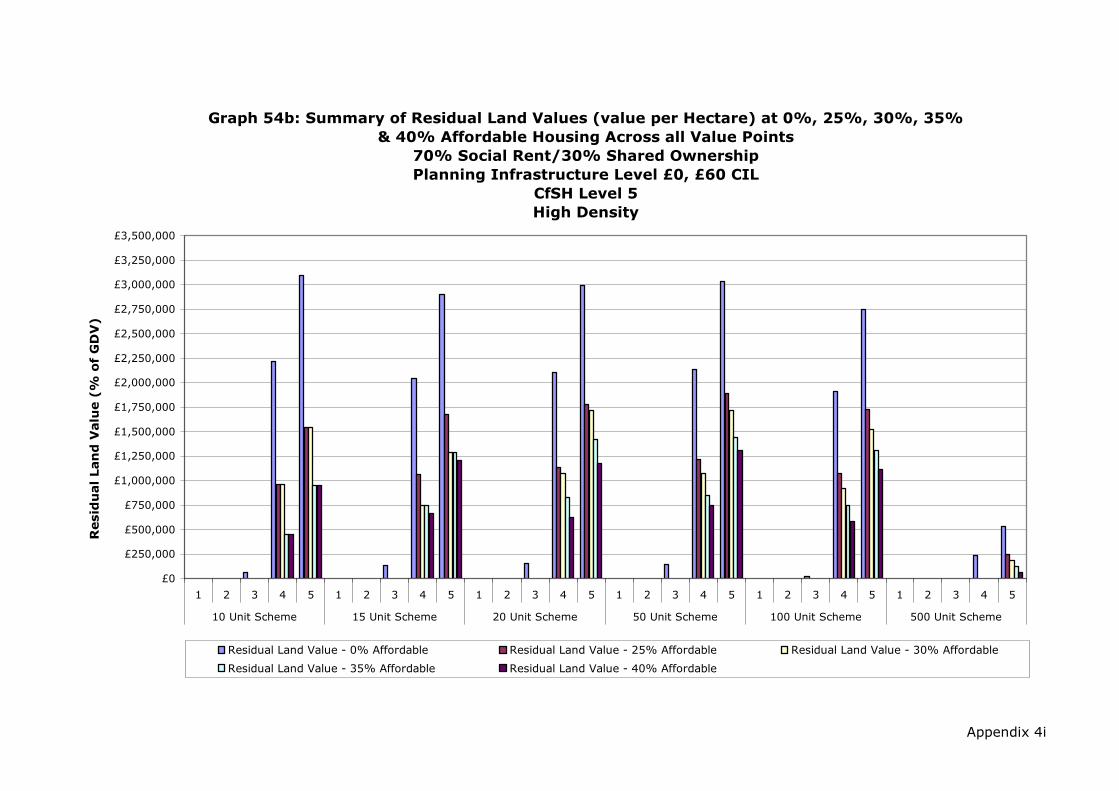
Appendix 4i
Graph 54b: Summary of Residual Land Values (value per Hectare) at 0%, 25%, 30%, 35%
& 40% Affordable Housing Across all Value Points
70% Social Rent/30% Shared Ownership
Planning Infrastructure Level £0, £60 CIL
CfSH Level 5
High Density
£0
£250,000
£500,000
£750,000
£1,000,000
£1,250,000
£1,500,000
£1,750,000
£2,000,000
£2,250,000
£2,500,000
£2,750,000
£3,000,000
£3,250,000
£3,500,000
1 2 3 4 5 1 2 3 4 5 1 2 3 4 5 1 2 3 4 5 1 2 3 4 5 1 2 3 4 5
10 Unit Scheme 15 Unit Scheme 20 Unit Scheme 50 Unit Scheme 100 Unit Scheme 500 Unit Scheme
Resid
ual Lan
d V
alu
e (%
o
f G
DV
)
Residual Land Value - 0% Affordable Residual Land Value - 25% Affordable Residual Land Value - 30% Affordable
Residual Land Value - 35% Affordable Residual Land Value - 40% Affordable

Appendix 4ii
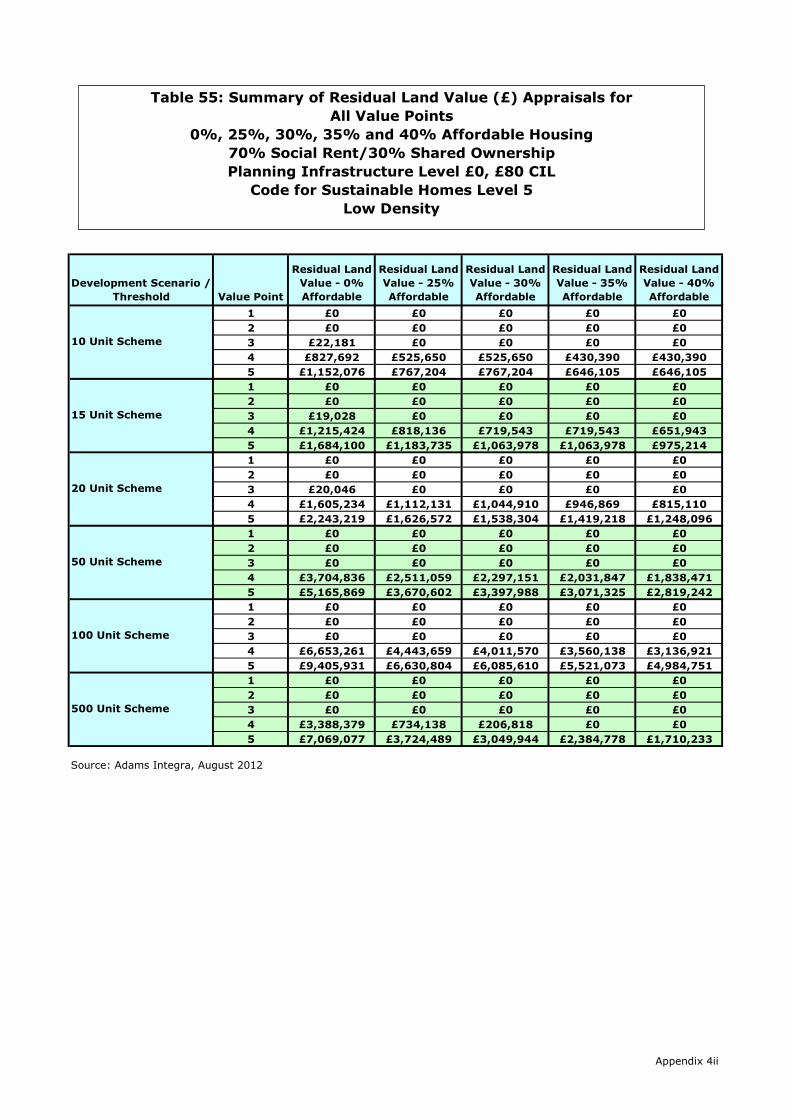
Development Scenario /
Threshold Value Point
Residual Land
Value - 0%
Affordable
Residual Land
Value - 25%
Affordable
Residual Land
Value - 30%
Affordable
Residual Land
Value - 35%
Affordable
Residual Land
Value - 40%
Affordable
1 £0 £0 £0 £0 £0
2 £0 £0 £0 £0 £0
3 £22,181 £0 £0 £0 £0
4 £827,692 £525,650 £525,650 £430,390 £430,390
5 £1,152,076 £767,204 £767,204 £646,105 £646,105
1 £0 £0 £0 £0 £0
2 £0 £0 £0 £0 £0
3 £19,028 £0 £0 £0 £0
4 £1,215,424 £818,136 £719,543 £719,543 £651,943
5 £1,684,100 £1,183,735 £1,063,978 £1,063,978 £975,214
1 £0 £0 £0 £0 £0
2 £0 £0 £0 £0 £0
3 £20,046 £0 £0 £0 £0
4 £1,605,234 £1,112,131 £1,044,910 £946,869 £815,110
5 £2,243,219 £1,626,572 £1,538,304 £1,419,218 £1,248,096
1 £0 £0 £0 £0 £0
2 £0 £0 £0 £0 £0
3 £0 £0 £0 £0 £0
4 £3,704,836 £2,511,059 £2,297,151 £2,031,847 £1,838,471
5 £5,165,869 £3,670,602 £3,397,988 £3,071,325 £2,819,242
1 £0 £0 £0 £0 £0
2 £0 £0 £0 £0 £0
3 £0 £0 £0 £0 £0
4 £6,653,261 £4,443,659 £4,011,570 £3,560,138 £3,136,921
5 £9,405,931 £6,630,804 £6,085,610 £5,521,073 £4,984,751
1 £0 £0 £0 £0 £0
2 £0 £0 £0 £0 £0
3 £0 £0 £0 £0 £0
4 £3,388,379 £734,138 £206,818 £0 £0
5 £7,069,077 £3,724,489 £3,049,944 £2,384,778 £1,710,233
Source: Adams Integra, August 2012
100 Unit Scheme
500 Unit Scheme
10 Unit Scheme
15 Unit Scheme
20 Unit Scheme
50 Unit Scheme
Table 55: Summary of Residual Land Value (£) Appraisals for
All Value Points
0%, 25%, 30%, 35% and 40% Affordable Housing
70% Social Rent/30% Shared Ownership
Planning Infrastructure Level £0, £80 CIL
Code for Sustainable Homes Level 5
Low Density
Appendix 4ii

Appendix 4ii
Graph 55: Summary of Residual Land Values at 0%, 25%, 30%, 35% & 40%
Affordable Housing Across All Value Points
70% Social Rent/30% Shared Ownership
Planning Infrastructure Level £0, £80 CIL
CfSH Level 5
Low Density
£0
£1,000,000
£2,000,000
£3,000,000
£4,000,000
£5,000,000
£6,000,000
£7,000,000
£8,000,000
£9,000,000
£10,000,000
£11,000,000
£12,000,000
1 2 3 4 5 1 2 3 4 5 1 2 3 4 5 1 2 3 4 5 1 2 3 4 5 1 2 3 4 5
10 Unit Scheme 15 Unit Scheme 20 Unit Scheme 50 Unit Scheme 100 Unit Scheme 500 Unit Scheme
Resid
ual Lan
d V
alu
e (£
)
Residual Land Value - 0% Affordable Residual Land Value - 25% Affordable Residual Land Value - 30% Affordable
Residual Land Value - 35% Affordable Residual Land Value - 40% Affordable Residual Land Value - 40% Affordable
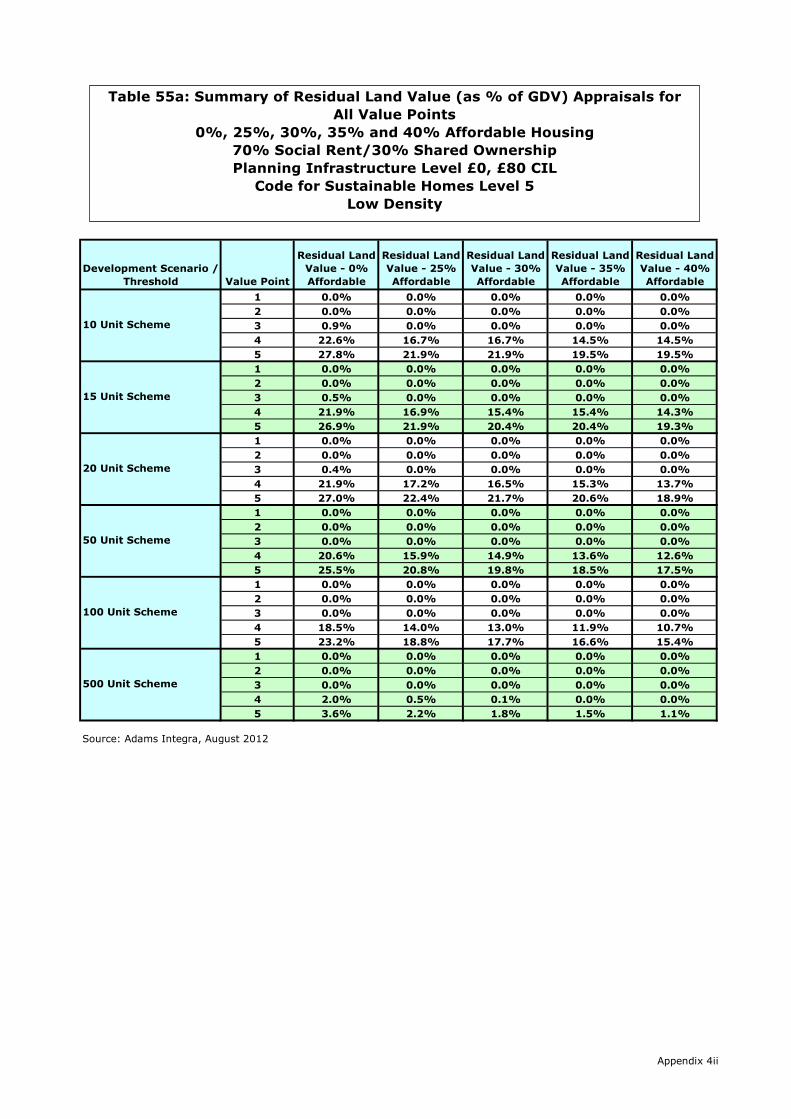
Development Scenario /
Threshold Value Point
Residual Land
Value - 0%
Affordable
Residual Land
Value - 25%
Affordable
Residual Land
Value - 30%
Affordable
Residual Land
Value - 35%
Affordable
Residual Land
Value - 40%
Affordable
1 0.0% 0.0% 0.0% 0.0% 0.0%
2 0.0% 0.0% 0.0% 0.0% 0.0%
3 0.9% 0.0% 0.0% 0.0% 0.0%
4 22.6% 16.7% 16.7% 14.5% 14.5%
5 27.8% 21.9% 21.9% 19.5% 19.5%
1 0.0% 0.0% 0.0% 0.0% 0.0%
2 0.0% 0.0% 0.0% 0.0% 0.0%
3 0.5% 0.0% 0.0% 0.0% 0.0%
4 21.9% 16.9% 15.4% 15.4% 14.3%
5 26.9% 21.9% 20.4% 20.4% 19.3%
1 0.0% 0.0% 0.0% 0.0% 0.0%
2 0.0% 0.0% 0.0% 0.0% 0.0%
3 0.4% 0.0% 0.0% 0.0% 0.0%
4 21.9% 17.2% 16.5% 15.3% 13.7%
5 27.0% 22.4% 21.7% 20.6% 18.9%
1 0.0% 0.0% 0.0% 0.0% 0.0%
2 0.0% 0.0% 0.0% 0.0% 0.0%
3 0.0% 0.0% 0.0% 0.0% 0.0%
4 20.6% 15.9% 14.9% 13.6% 12.6%
5 25.5% 20.8% 19.8% 18.5% 17.5%
1 0.0% 0.0% 0.0% 0.0% 0.0%
2 0.0% 0.0% 0.0% 0.0% 0.0%
3 0.0% 0.0% 0.0% 0.0% 0.0%
4 18.5% 14.0% 13.0% 11.9% 10.7%
5 23.2% 18.8% 17.7% 16.6% 15.4%
1 0.0% 0.0% 0.0% 0.0% 0.0%
2 0.0% 0.0% 0.0% 0.0% 0.0%
3 0.0% 0.0% 0.0% 0.0% 0.0%
4 2.0% 0.5% 0.1% 0.0% 0.0%
5 3.6% 2.2% 1.8% 1.5% 1.1%
Source: Adams Integra, August 2012
100 Unit Scheme
500 Unit Scheme
10 Unit Scheme
15 Unit Scheme
20 Unit Scheme
50 Unit Scheme
Table 55a: Summary of Residual Land Value (as % of GDV) Appraisals for
All Value Points
0%, 25%, 30%, 35% and 40% Affordable Housing
70% Social Rent/30% Shared Ownership
Planning Infrastructure Level £0, £80 CIL
Code for Sustainable Homes Level 5
Low Density
Appendix 4ii
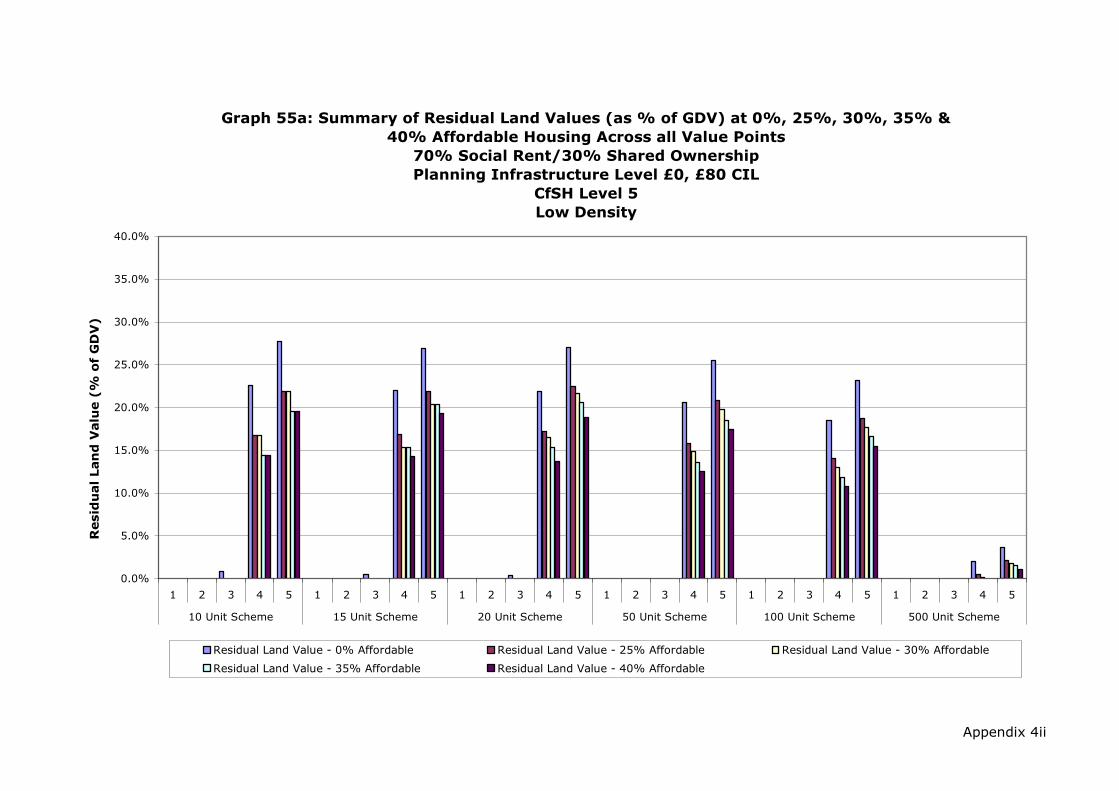
Appendix 4ii
Graph 55a: Summary of Residual Land Values (as % of GDV) at 0%, 25%, 30%, 35% &
40% Affordable Housing Across all Value Points
70% Social Rent/30% Shared Ownership
Planning Infrastructure Level £0, £80 CIL
CfSH Level 5
Low Density
0.0%
5.0%
10.0%
15.0%
20.0%
25.0%
30.0%
35.0%
40.0%
1 2 3 4 5 1 2 3 4 5 1 2 3 4 5 1 2 3 4 5 1 2 3 4 5 1 2 3 4 5
10 Unit Scheme 15 Unit Scheme 20 Unit Scheme 50 Unit Scheme 100 Unit Scheme 500 Unit Scheme
Resid
ual Lan
d V
alu
e (%
o
f G
DV
)
Residual Land Value - 0% Affordable Residual Land Value - 25% Affordable Residual Land Value - 30% Affordable
Residual Land Value - 35% Affordable Residual Land Value - 40% Affordable

Development Scenario /
Threshold Value Point
Residual Land
Value - 0%
Affordable
Residual Land
Value - 25%
Affordable
Residual Land
Value - 30%
Affordable
Residual Land
Value - 35%
Affordable
Residual Land
Value - 40%
Affordable
1 £0 £0 £0 £0 £0
2 £0 £0 £0 £0 £0
3 £88,725 £0 £0 £0 £0
4 £3,310,766 £2,102,600 £2,102,600 £1,721,558 £1,721,558
5 £4,608,303 £3,068,815 £3,068,815 £2,584,419 £2,584,419
1 £0 £0 £0 £0 £0
2 £0 £0 £0 £0 £0
3 £50,741 £0 £0 £0 £0
4 £3,241,130 £2,181,697 £1,918,783 £1,918,783 £1,738,515
5 £4,490,934 £3,156,628 £2,837,276 £2,837,276 £2,600,570
1 £0 £0 £0 £0 £0
2 £0 £0 £0 £0 £0
3 £40,091 £0 £0 £0 £0
4 £3,210,467 £2,224,263 £2,089,820 £1,893,739 £1,630,219
5 £4,486,439 £3,253,143 £3,076,609 £2,838,436 £2,496,192
1 £0 £0 £0 £0 £0
2 £0 £0 £0 £0 £0
3 £0 £0 £0 £0 £0
4 £2,963,869 £2,008,847 £1,837,721 £1,625,478 £1,470,777
5 £4,132,695 £2,936,482 £2,718,390 £2,457,060 £2,255,394
1 £0 £0 £0 £0 £0
2 £0 £0 £0 £0 £0
3 £0 £0 £0 £0 £0
4 £2,661,304 £1,777,464 £1,604,628 £1,424,055 £1,254,768
5 £3,762,372 £2,652,322 £2,434,244 £2,208,429 £1,993,900
1 £0 £0 £0 £0 £0
2 £0 £0 £0 £0 £0
3 £0 £0 £0 £0 £0
4 £271,070 £58,731 £16,545 £0 £0
5 £565,526 £297,959 £243,996 £190,782 £136,819
Source: Adams Integra, August 2012
100 Unit Scheme
500 Unit Scheme
10 Unit Scheme
15 Unit Scheme
20 Unit Scheme
50 Unit Scheme
Table 55b: Summary of Residual Land Value (value per Hectare) Appraisals
for All Value Points
0%, 25%, 30%, 35% and 40% Affordable Housing
70% Social Rent/30% Shared Ownership
Planning Infrastructure Level £0, £80 CIL
Code for Sustainable Homes Level 5
Low Density
Appendix 4ii
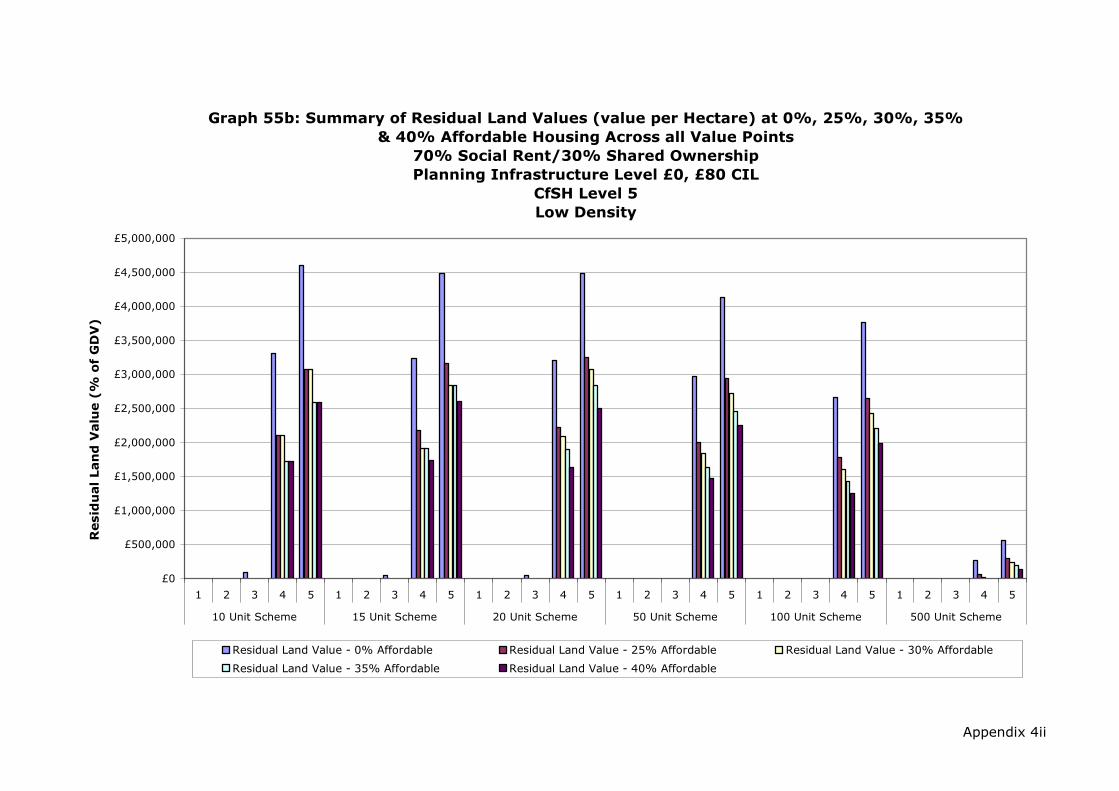
Appendix 4ii
Graph 55b: Summary of Residual Land Values (value per Hectare) at 0%, 25%, 30%, 35%
& 40% Affordable Housing Across all Value Points
70% Social Rent/30% Shared Ownership
Planning Infrastructure Level £0, £80 CIL
CfSH Level 5
Low Density
£0
£500,000
£1,000,000
£1,500,000
£2,000,000
£2,500,000
£3,000,000
£3,500,000
£4,000,000
£4,500,000
£5,000,000
1 2 3 4 5 1 2 3 4 5 1 2 3 4 5 1 2 3 4 5 1 2 3 4 5 1 2 3 4 5
10 Unit Scheme 15 Unit Scheme 20 Unit Scheme 50 Unit Scheme 100 Unit Scheme 500 Unit Scheme
Resid
ual Lan
d V
alu
e (%
o
f G
DV
)
Residual Land Value - 0% Affordable Residual Land Value - 25% Affordable Residual Land Value - 30% Affordable
Residual Land Value - 35% Affordable Residual Land Value - 40% Affordable
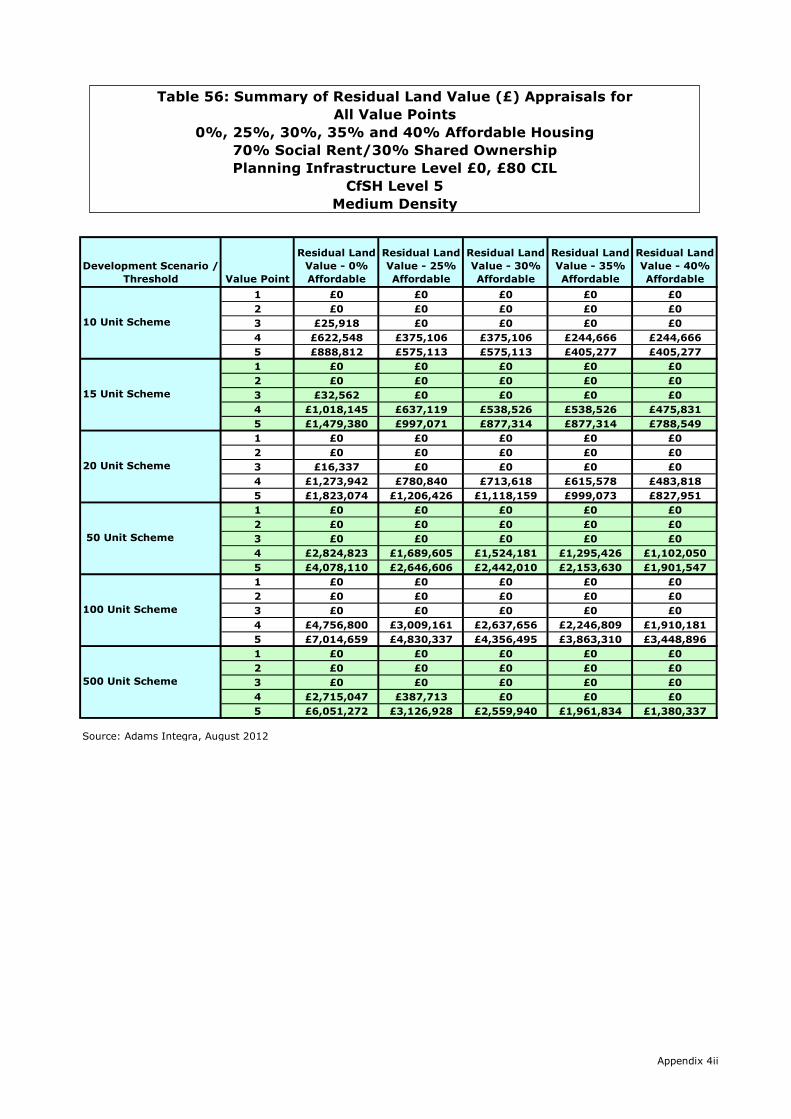
Development Scenario /
Threshold Value Point
Residual Land
Value - 0%
Affordable
Residual Land
Value - 25%
Affordable
Residual Land
Value - 30%
Affordable
Residual Land
Value - 35%
Affordable
Residual Land
Value - 40%
Affordable
1 £0 £0 £0 £0 £0
2 £0 £0 £0 £0 £0
3 £25,918 £0 £0 £0 £0
4 £622,548 £375,106 £375,106 £244,666 £244,666
5 £888,812 £575,113 £575,113 £405,277 £405,277
1 £0 £0 £0 £0 £0
2 £0 £0 £0 £0 £0
3 £32,562 £0 £0 £0 £0
4 £1,018,145 £637,119 £538,526 £538,526 £475,831
5 £1,479,380 £997,071 £877,314 £877,314 £788,549
1 £0 £0 £0 £0 £0
2 £0 £0 £0 £0 £0
3 £16,337 £0 £0 £0 £0
4 £1,273,942 £780,840 £713,618 £615,578 £483,818
5 £1,823,074 £1,206,426 £1,118,159 £999,073 £827,951
1 £0 £0 £0 £0 £0
2 £0 £0 £0 £0 £0
3 £0 £0 £0 £0 £0
4 £2,824,823 £1,689,605 £1,524,181 £1,295,426 £1,102,050
5 £4,078,110 £2,646,606 £2,442,010 £2,153,630 £1,901,547
1 £0 £0 £0 £0 £0
2 £0 £0 £0 £0 £0
3 £0 £0 £0 £0 £0
4 £4,756,800 £3,009,161 £2,637,656 £2,246,809 £1,910,181
5 £7,014,659 £4,830,337 £4,356,495 £3,863,310 £3,448,896
1 £0 £0 £0 £0 £0
2 £0 £0 £0 £0 £0
3 £0 £0 £0 £0 £0
4 £2,715,047 £387,713 £0 £0 £0
5 £6,051,272 £3,126,928 £2,559,940 £1,961,834 £1,380,337
Source: Adams Integra, August 2012
100 Unit Scheme
500 Unit Scheme
10 Unit Scheme
15 Unit Scheme
20 Unit Scheme
50 Unit Scheme
Table 56: Summary of Residual Land Value (£) Appraisals for
All Value Points
0%, 25%, 30%, 35% and 40% Affordable Housing
70% Social Rent/30% Shared Ownership
Planning Infrastructure Level £0, £80 CIL
CfSH Level 5
Medium Density
Appendix 4ii

Appendix 4ii
Graph 56: Summary of Residual Land Values at 0%, 25%, 30%, 35% & 40%
Affordable Housing Across All Value Points
70% Social Rent/30% Shared Ownership
Planning Infrastructure Level £0, £80 CIL
CfSH Level 5
Medium Density
£0
£500,000
£1,000,000
£1,500,000
£2,000,000
£2,500,000
£3,000,000
£3,500,000
£4,000,000
£4,500,000
£5,000,000
£5,500,000
£6,000,000
£6,500,000
£7,000,000
£7,500,000
£8,000,000
1 2 3 4 5 1 2 3 4 5 1 2 3 4 5 1 2 3 4 5 1 2 3 4 5 1 2 3 4 5
10 Unit Scheme 15 Unit Scheme 20 Unit Scheme 50 Unit Scheme 100 Unit Scheme 500 Unit Scheme
Resid
ual Lan
d V
alu
e (£
)
Residual Land Value - 0% Affordable Residual Land Value - 25% Affordable Residual Land Value - 30% Affordable
Residual Land Value - 35% Affordable Residual Land Value - 40% Affordable

Development Scenario /
Threshold Value Point
Residual Land
Value - 0%
Affordable
Residual Land
Value - 25%
Affordable
Residual Land
Value - 30%
Affordable
Residual Land
Value - 35%
Affordable
Residual Land
Value - 40%
Affordable
1 0.0% 0.0% 0.0% 0.0% 0.0%
2 0.0% 0.0% 0.0% 0.0% 0.0%
3 1.4% 0.0% 0.0% 0.0% 0.0%
4 22.2% 15.9% 15.9% 11.4% 11.4%
5 27.8% 21.5% 21.5% 17.0% 17.0%
1 0.0% 0.0% 0.0% 0.0% 0.0%
2 0.0% 0.0% 0.0% 0.0% 0.0%
3 1.1% 0.0% 0.0% 0.0% 0.0%
4 22.6% 16.6% 14.7% 14.7% 13.4%
5 28.4% 22.7% 20.9% 20.9% 19.6%
1 0.0% 0.0% 0.0% 0.0% 0.0%
2 0.0% 0.0% 0.0% 0.0% 0.0%
3 0.4% 0.0% 0.0% 0.0% 0.0%
4 21.7% 15.6% 14.6% 13.1% 10.8%
5 27.2% 21.3% 20.3% 18.9% 16.5%
1 0.0% 0.0% 0.0% 0.0% 0.0%
2 0.0% 0.0% 0.0% 0.0% 0.0%
3 0.0% 0.0% 0.0% 0.0% 0.0%
4 20.3% 14.3% 13.2% 11.6% 10.2%
5 25.7% 19.8% 18.8% 17.3% 15.8%
1 0.0% 0.0% 0.0% 0.0% 0.0%
2 0.0% 0.0% 0.0% 0.0% 0.0%
3 0.0% 0.0% 0.0% 0.0% 0.0%
4 18.0% 13.1% 11.8% 10.4% 9.1%
5 23.3% 18.5% 17.3% 15.9% 14.7%
1 0.0% 0.0% 0.0% 0.0% 0.0%
2 0.0% 0.0% 0.0% 0.0% 0.0%
3 0.0% 0.0% 0.0% 0.0% 0.0%
4 1.9% 0.3% 0.0% 0.0% 0.0%
5 3.6% 2.1% 1.8% 1.4% 1.0%
Source: Adams Integra, August 2012
100 Unit Scheme
500 Unit Scheme
10 Unit Scheme
15 Unit Scheme
20 Unit Scheme
50 Unit Scheme
Table 56a: Summary of Residual Land Value (as % of GDV) Appraisals for
All Value Points
0%, 25%, 30%, 35% and 40% Affordable Housing
70% Social Rent/30% Shared Ownership
Planning Infrastructure Level £0, £80 CIL
Code for Sustainable Homes Level 5
Medium Density
Appendix 4ii
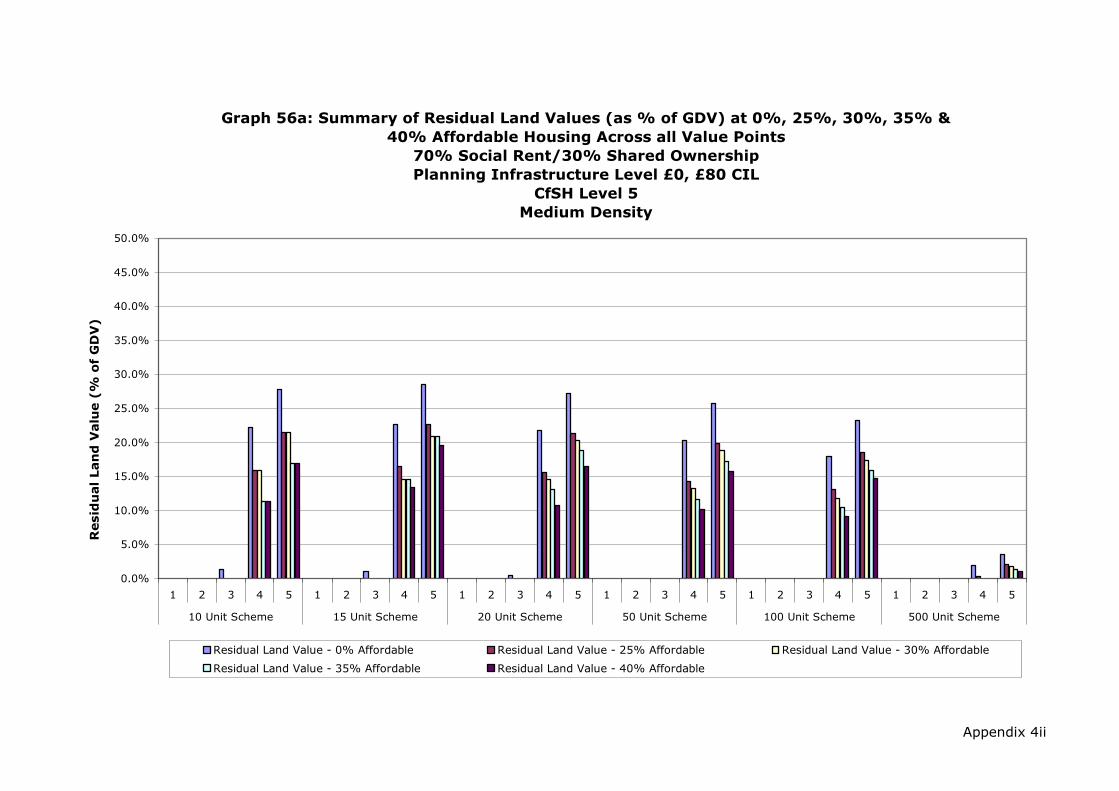
Appendix 4ii
Graph 56a: Summary of Residual Land Values (as % of GDV) at 0%, 25%, 30%, 35% &
40% Affordable Housing Across all Value Points
70% Social Rent/30% Shared Ownership
Planning Infrastructure Level £0, £80 CIL
CfSH Level 5
Medium Density
0.0%
5.0%
10.0%
15.0%
20.0%
25.0%
30.0%
35.0%
40.0%
45.0%
50.0%
1 2 3 4 5 1 2 3 4 5 1 2 3 4 5 1 2 3 4 5 1 2 3 4 5 1 2 3 4 5
10 Unit Scheme 15 Unit Scheme 20 Unit Scheme 50 Unit Scheme 100 Unit Scheme 500 Unit Scheme
Resid
ual Lan
d V
alu
e (%
o
f G
DV
)
Residual Land Value - 0% Affordable Residual Land Value - 25% Affordable Residual Land Value - 30% Affordable
Residual Land Value - 35% Affordable Residual Land Value - 40% Affordable

Development Scenario /
Threshold Value Point
Residual Land
Value - 0%
Affordable
Residual Land
Value - 25%
Affordable
Residual Land
Value - 30%
Affordable
Residual Land
Value - 35%
Affordable
Residual Land
Value - 40%
Affordable
1 £0 £0 £0 £0 £0
2 £0 £0 £0 £0 £0
3 £116,630 £0 £0 £0 £0
4 £2,801,465 £1,687,977 £1,687,977 £1,100,999 £1,100,999
5 £3,999,654 £2,588,009 £2,588,009 £1,823,746 £1,823,746
1 £0 £0 £0 £0 £0
2 £0 £0 £0 £0 £0
3 £97,685 £0 £0 £0 £0
4 £3,054,435 £1,911,356 £1,615,578 £1,615,578 £1,427,494
5 £4,438,139 £2,991,212 £2,631,941 £2,631,941 £2,365,647
1 £0 £0 £0 £0 £0
2 £0 £0 £0 £0 £0
3 £36,758 £0 £0 £0 £0
4 £2,866,370 £1,756,889 £1,605,641 £1,385,050 £1,088,591
5 £4,101,916 £2,714,458 £2,515,857 £2,247,913 £1,862,889
1 £0 £0 £0 £0 £0
2 £0 £0 £0 £0 £0
3 £0 £0 £0 £0 £0
4 £2,542,341 £1,520,645 £1,371,763 £1,165,883 £991,845
5 £3,670,299 £2,381,945 £2,197,809 £1,938,267 £1,711,393
1 £0 £0 £0 £0 £0
2 £0 £0 £0 £0 £0
3 £0 £0 £0 £0 £0
4 £2,140,560 £1,354,122 £1,186,945 £1,011,064 £859,581
5 £3,156,596 £2,173,652 £1,960,423 £1,738,489 £1,552,003
1 £0 £0 £0 £0 £0
2 £0 £0 £0 £0 £0
3 £0 £0 £0 £0 £0
4 £244,354 £34,894 £0 £0 £0
5 £544,615 £281,424 £230,395 £176,565 £124,230
Source: Adams Integra, August 2012
100 Unit Scheme
500 Unit Scheme
10 Unit Scheme
15 Unit Scheme
20 Unit Scheme
50 Unit Scheme
Table 56b: Summary of Residual Land Value (value per Hectare) Appraisals
for All Value Points
0%, 25%, 30%, 35% and 40% Affordable Housing
70% Social Rent/30% Shared Ownership
Planning Infrastructure Level £0, £80 CIL
Code for Sustainable Homes Level 5
Medium Density
Appendix 4ii
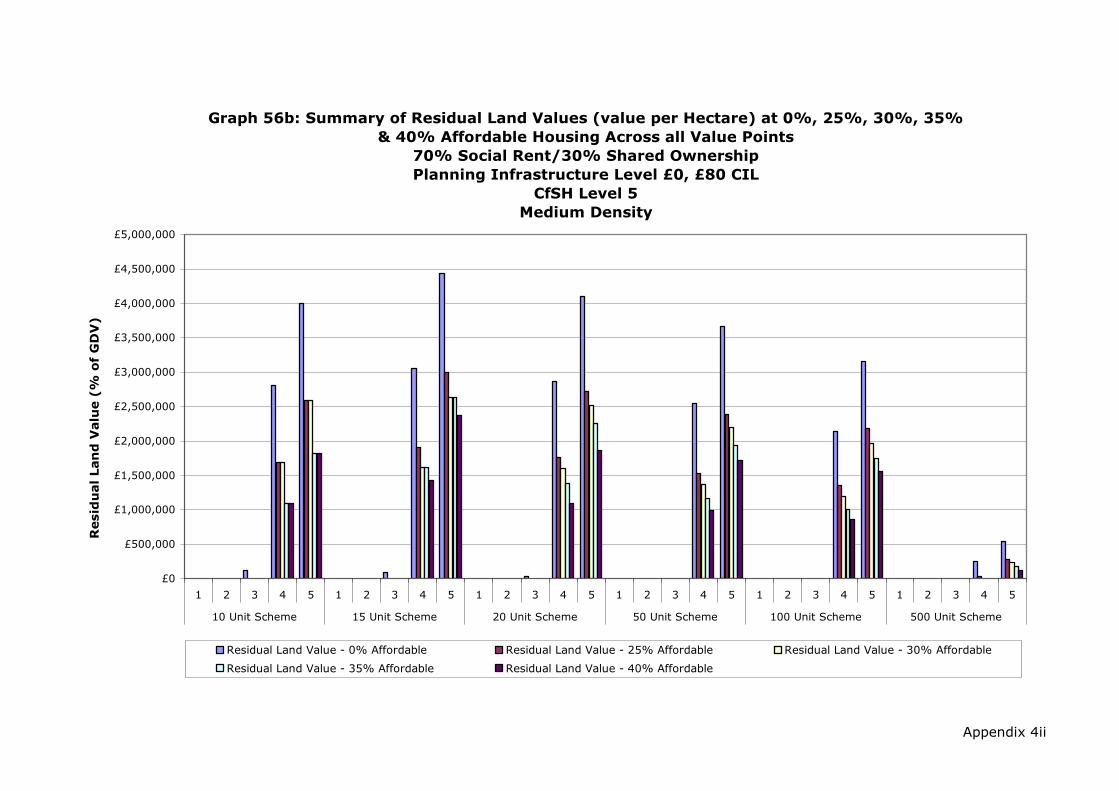
Appendix 4ii
Graph 56b: Summary of Residual Land Values (value per Hectare) at 0%, 25%, 30%, 35%
& 40% Affordable Housing Across all Value Points
70% Social Rent/30% Shared Ownership
Planning Infrastructure Level £0, £80 CIL
CfSH Level 5
Medium Density
£0
£500,000
£1,000,000
£1,500,000
£2,000,000
£2,500,000
£3,000,000
£3,500,000
£4,000,000
£4,500,000
£5,000,000
1 2 3 4 5 1 2 3 4 5 1 2 3 4 5 1 2 3 4 5 1 2 3 4 5 1 2 3 4 5
10 Unit Scheme 15 Unit Scheme 20 Unit Scheme 50 Unit Scheme 100 Unit Scheme 500 Unit Scheme
Resid
ual Lan
d V
alu
e (%
o
f G
DV
)
Residual Land Value - 0% Affordable Residual Land Value - 25% Affordable Residual Land Value - 30% Affordable
Residual Land Value - 35% Affordable Residual Land Value - 40% Affordable
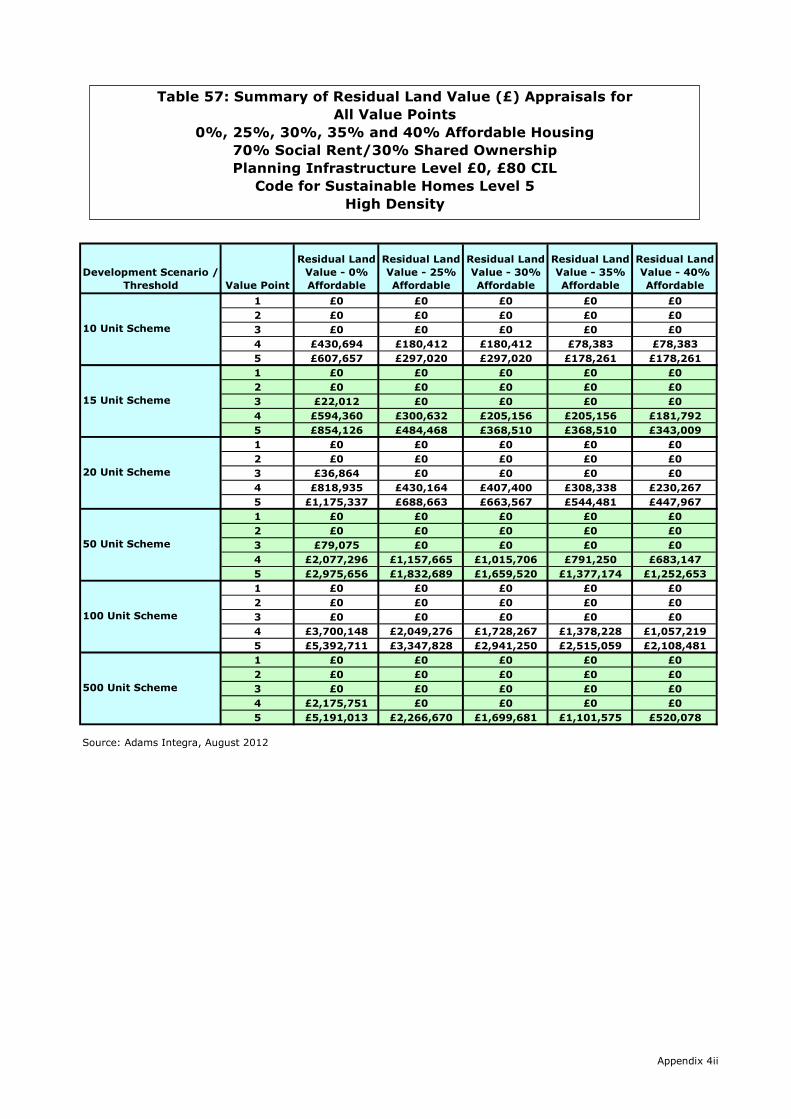
Development Scenario /
Threshold Value Point
Residual Land
Value - 0%
Affordable
Residual Land
Value - 25%
Affordable
Residual Land
Value - 30%
Affordable
Residual Land
Value - 35%
Affordable
Residual Land
Value - 40%
Affordable
1 £0 £0 £0 £0 £0
2 £0 £0 £0 £0 £0
3 £0 £0 £0 £0 £0
4 £430,694 £180,412 £180,412 £78,383 £78,383
5 £607,657 £297,020 £297,020 £178,261 £178,261
1 £0 £0 £0 £0 £0
2 £0 £0 £0 £0 £0
3 £22,012 £0 £0 £0 £0
4 £594,360 £300,632 £205,156 £205,156 £181,792
5 £854,126 £484,468 £368,510 £368,510 £343,009
1 £0 £0 £0 £0 £0
2 £0 £0 £0 £0 £0
3 £36,864 £0 £0 £0 £0
4 £818,935 £430,164 £407,400 £308,338 £230,267
5 £1,175,337 £688,663 £663,567 £544,481 £447,967
1 £0 £0 £0 £0 £0
2 £0 £0 £0 £0 £0
3 £79,075 £0 £0 £0 £0
4 £2,077,296 £1,157,665 £1,015,706 £791,250 £683,147
5 £2,975,656 £1,832,689 £1,659,520 £1,377,174 £1,252,653
1 £0 £0 £0 £0 £0
2 £0 £0 £0 £0 £0
3 £0 £0 £0 £0 £0
4 £3,700,148 £2,049,276 £1,728,267 £1,378,228 £1,057,219
5 £5,392,711 £3,347,828 £2,941,250 £2,515,059 £2,108,481
1 £0 £0 £0 £0 £0
2 £0 £0 £0 £0 £0
3 £0 £0 £0 £0 £0
4 £2,175,751 £0 £0 £0 £0
5 £5,191,013 £2,266,670 £1,699,681 £1,101,575 £520,078
Source: Adams Integra, August 2012
100 Unit Scheme
500 Unit Scheme
10 Unit Scheme
15 Unit Scheme
20 Unit Scheme
50 Unit Scheme
Table 57: Summary of Residual Land Value (£) Appraisals for
All Value Points
0%, 25%, 30%, 35% and 40% Affordable Housing
70% Social Rent/30% Shared Ownership
Planning Infrastructure Level £0, £80 CIL
Code for Sustainable Homes Level 5
High Density
Appendix 4ii
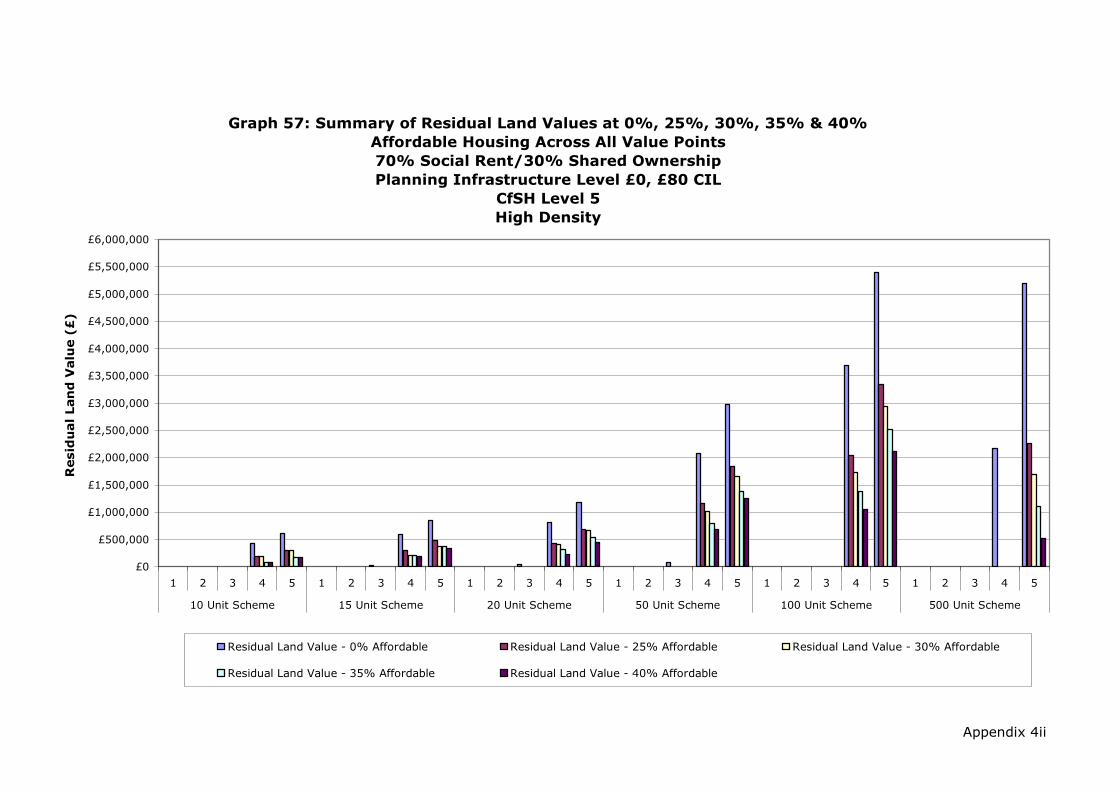
Appendix 4ii
Graph 57: Summary of Residual Land Values at 0%, 25%, 30%, 35% & 40%
Affordable Housing Across All Value Points
70% Social Rent/30% Shared Ownership
Planning Infrastructure Level £0, £80 CIL
CfSH Level 5
High Density
£0
£500,000
£1,000,000
£1,500,000
£2,000,000
£2,500,000
£3,000,000
£3,500,000
£4,000,000
£4,500,000
£5,000,000
£5,500,000
£6,000,000
1 2 3 4 5 1 2 3 4 5 1 2 3 4 5 1 2 3 4 5 1 2 3 4 5 1 2 3 4 5
10 Unit Scheme 15 Unit Scheme 20 Unit Scheme 50 Unit Scheme 100 Unit Scheme 500 Unit Scheme
Resid
ual Lan
d V
alu
e (£
)
Residual Land Value - 0% Affordable Residual Land Value - 25% Affordable Residual Land Value - 30% Affordable
Residual Land Value - 35% Affordable Residual Land Value - 40% Affordable

Development Scenario /
Threshold Value Point
Residual Land
Value - 0%
Affordable
Residual Land
Value - 25%
Affordable
Residual Land
Value - 30%
Affordable
Residual Land
Value - 35%
Affordable
Residual Land
Value - 40%
Affordable
1 0.0% 0.0% 0.0% 0.0% 0.0%
2 0.0% 0.0% 0.0% 0.0% 0.0%
3 0.0% 0.0% 0.0% 0.0% 0.0%
4 19.3% 10.0% 10.0% 4.8% 4.8%
5 24.2% 15.0% 15.0% 10.0% 10.0%
1 0.0% 0.0% 0.0% 0.0% 0.0%
2 0.0% 0.0% 0.0% 0.0% 0.0%
3 0.9% 0.0% 0.0% 0.0% 0.0%
4 18.6% 11.2% 8.2% 8.2% 7.4%
5 23.8% 16.4% 13.4% 13.4% 12.7%
1 0.0% 0.0% 0.0% 0.0% 0.0%
2 0.0% 0.0% 0.0% 0.0% 0.0%
3 1.2% 0.0% 0.0% 0.0% 0.0%
4 18.9% 11.8% 11.3% 9.0% 7.0%
5 24.1% 17.0% 16.6% 14.3% 12.3%
1 0.0% 0.0% 0.0% 0.0% 0.0%
2 0.0% 0.0% 0.0% 0.0% 0.0%
3 1.0% 0.0% 0.0% 0.0% 0.0%
4 18.5% 12.1% 10.9% 8.9% 7.9%
5 23.5% 17.3% 16.1% 14.0% 13.1%
1 0.0% 0.0% 0.0% 0.0% 0.0%
2 0.0% 0.0% 0.0% 0.0% 0.0%
3 0.0% 0.0% 0.0% 0.0% 0.0%
4 16.5% 10.6% 9.3% 7.7% 6.1%
5 21.3% 15.6% 14.2% 12.7% 11.0%
1 0.0% 0.0% 0.0% 0.0% 0.0%
2 0.0% 0.0% 0.0% 0.0% 0.0%
3 0.0% 0.0% 0.0% 0.0% 0.0%
4 1.7% 0.0% 0.0% 0.0% 0.0%
5 3.5% 1.8% 1.4% 0.9% 0.4%
Source: Adams Integra, August 2012
100 Unit Scheme
500 Unit Scheme
10 Unit Scheme
15 Unit Scheme
20 Unit Scheme
50 Unit Scheme
Table 57a: Summary of Residual Land Value (as % of GDV) Appraisals for
All Value Points
0%, 25%, 30%, 35% and 40% Affordable Housing
70% Social Rent/30% Shared Ownership
Planning Infrastructure Level £0, £80 CIL
Code for Sustainable Homes Level 5
High Density
Appendix 4ii
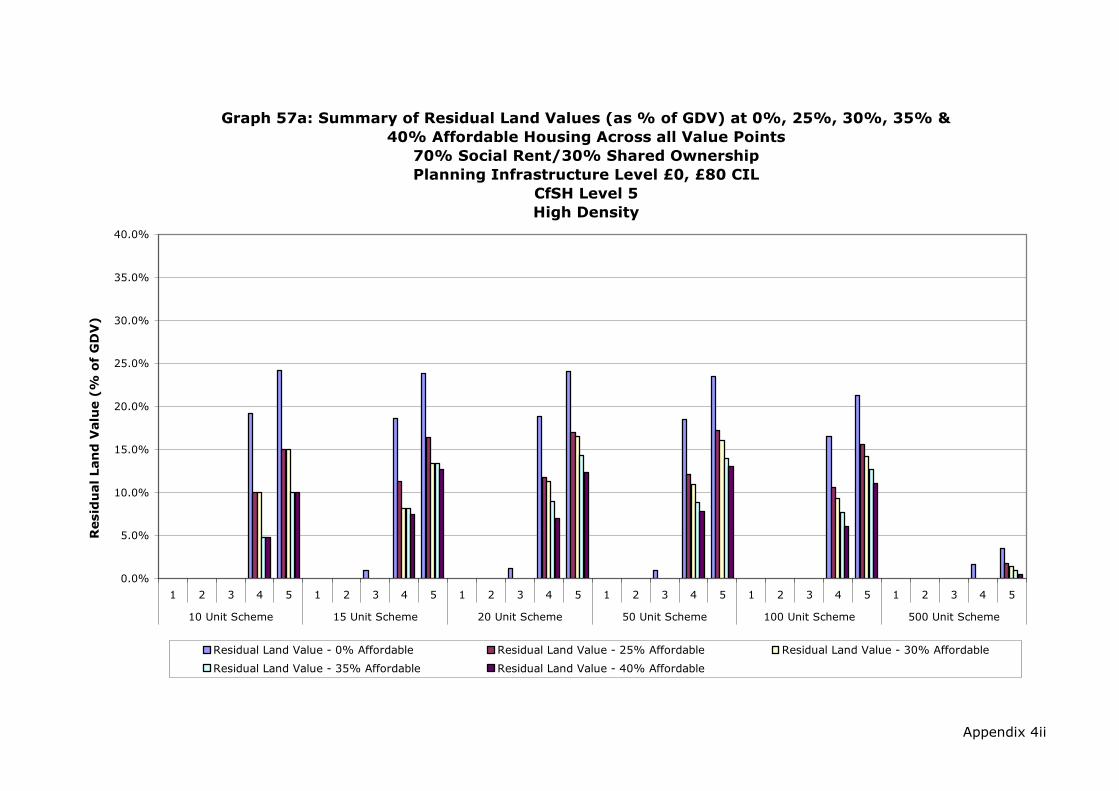
Appendix 4ii
Graph 57a: Summary of Residual Land Values (as % of GDV) at 0%, 25%, 30%, 35% &
40% Affordable Housing Across all Value Points
70% Social Rent/30% Shared Ownership
Planning Infrastructure Level £0, £80 CIL
CfSH Level 5
High Density
0.0%
5.0%
10.0%
15.0%
20.0%
25.0%
30.0%
35.0%
40.0%
1 2 3 4 5 1 2 3 4 5 1 2 3 4 5 1 2 3 4 5 1 2 3 4 5 1 2 3 4 5
10 Unit Scheme 15 Unit Scheme 20 Unit Scheme 50 Unit Scheme 100 Unit Scheme 500 Unit Scheme
Resid
ual Lan
d V
alu
e (%
o
f G
DV
)
Residual Land Value - 0% Affordable Residual Land Value - 25% Affordable Residual Land Value - 30% Affordable
Residual Land Value - 35% Affordable Residual Land Value - 40% Affordable

Development Scenario /
Threshold Value Point
Residual Land
Value - 0%
Affordable
Residual Land
Value - 25%
Affordable
Residual Land
Value - 30%
Affordable
Residual Land
Value - 35%
Affordable
Residual Land
Value - 40%
Affordable
1 £0 £0 £0 £0 £0
2 £0 £0 £0 £0 £0
3 £0 £0 £0 £0 £0
4 £2,153,472 £902,061 £902,061 £391,916 £391,916
5 £3,038,285 £1,485,101 £1,485,101 £891,306 £891,306
1 £0 £0 £0 £0 £0
2 £0 £0 £0 £0 £0
3 £73,373 £0 £0 £0 £0
4 £1,981,201 £1,002,105 £683,855 £683,855 £605,972
5 £2,847,087 £1,614,893 £1,228,366 £1,228,366 £1,143,365
1 £0 £0 £0 £0 £0
2 £0 £0 £0 £0 £0
3 £92,161 £0 £0 £0 £0
4 £2,047,337 £1,075,410 £1,018,499 £770,845 £575,667
5 £2,938,341 £1,721,658 £1,658,917 £1,361,202 £1,119,918
1 £0 £0 £0 £0 £0
2 £0 £0 £0 £0 £0
3 £79,075 £0 £0 £0 £0
4 £2,077,296 £1,157,665 £1,015,706 £791,250 £683,147
5 £2,975,656 £1,832,689 £1,659,520 £1,377,174 £1,252,653
1 £0 £0 £0 £0 £0
2 £0 £0 £0 £0 £0
3 £0 £0 £0 £0 £0
4 £1,850,074 £1,024,638 £864,134 £689,114 £528,609
5 £2,696,356 £1,673,914 £1,470,625 £1,257,529 £1,054,240
1 £0 £0 £0 £0 £0
2 £0 £0 £0 £0 £0
3 £0 £0 £0 £0 £0
4 £217,575 £0 £0 £0 £0
5 £519,101 £226,667 £169,968 £110,158 £52,008
Source: Adams Integra, August 2012
100 Unit Scheme
500 Unit Scheme
10 Unit Scheme
15 Unit Scheme
20 Unit Scheme
50 Unit Scheme
Table 57b: Summary of Residual Land Value (value per Hectare) Appraisals
for All Value Points
0%, 25%, 30%, 35% and 40% Affordable Housing
70% Social Rent/30% Shared Ownership
Planning Infrastructure Level £0, £80 CIL
Code for Sustainable Homes Level 5
High Density
Appendix 4ii

Appendix 4ii
Graph 57b: Summary of Residual Land Values (value per Hectare) at 0%, 25%, 30%, 35%
& 40% Affordable Housing Across all Value Points
70% Social Rent/30% Shared Ownership
Planning Infrastructure Level £0, £80 CIL
CfSH Level 5
High Density
£0
£500,000
£1,000,000
£1,500,000
£2,000,000
£2,500,000
£3,000,000
£3,500,000
£4,000,000
1 2 3 4 5 1 2 3 4 5 1 2 3 4 5 1 2 3 4 5 1 2 3 4 5 1 2 3 4 5
10 Unit Scheme 15 Unit Scheme 20 Unit Scheme 50 Unit Scheme 100 Unit Scheme 500 Unit Scheme
Resid
ual Lan
d V
alu
e (%
o
f G
DV
)
Residual Land Value - 0% Affordable Residual Land Value - 25% Affordable Residual Land Value - 30% Affordable
Residual Land Value - 35% Affordable Residual Land Value - 40% Affordable
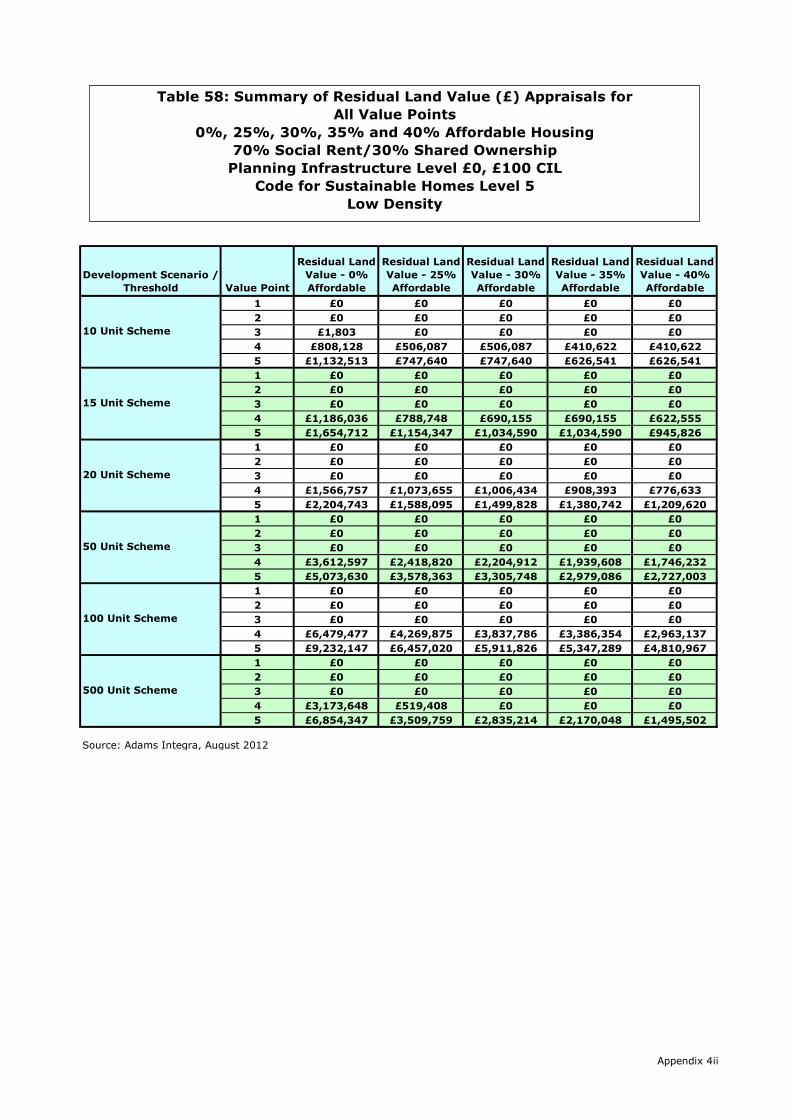
Development Scenario /
Threshold Value Point
Residual Land
Value - 0%
Affordable
Residual Land
Value - 25%
Affordable
Residual Land
Value - 30%
Affordable
Residual Land
Value - 35%
Affordable
Residual Land
Value - 40%
Affordable
1 £0 £0 £0 £0 £0
2 £0 £0 £0 £0 £0
3 £1,803 £0 £0 £0 £0
4 £808,128 £506,087 £506,087 £410,622 £410,622
5 £1,132,513 £747,640 £747,640 £626,541 £626,541
1 £0 £0 £0 £0 £0
2 £0 £0 £0 £0 £0
3 £0 £0 £0 £0 £0
4 £1,186,036 £788,748 £690,155 £690,155 £622,555
5 £1,654,712 £1,154,347 £1,034,590 £1,034,590 £945,826
1 £0 £0 £0 £0 £0
2 £0 £0 £0 £0 £0
3 £0 £0 £0 £0 £0
4 £1,566,757 £1,073,655 £1,006,434 £908,393 £776,633
5 £2,204,743 £1,588,095 £1,499,828 £1,380,742 £1,209,620
1 £0 £0 £0 £0 £0
2 £0 £0 £0 £0 £0
3 £0 £0 £0 £0 £0
4 £3,612,597 £2,418,820 £2,204,912 £1,939,608 £1,746,232
5 £5,073,630 £3,578,363 £3,305,748 £2,979,086 £2,727,003
1 £0 £0 £0 £0 £0
2 £0 £0 £0 £0 £0
3 £0 £0 £0 £0 £0
4 £6,479,477 £4,269,875 £3,837,786 £3,386,354 £2,963,137
5 £9,232,147 £6,457,020 £5,911,826 £5,347,289 £4,810,967
1 £0 £0 £0 £0 £0
2 £0 £0 £0 £0 £0
3 £0 £0 £0 £0 £0
4 £3,173,648 £519,408 £0 £0 £0
5 £6,854,347 £3,509,759 £2,835,214 £2,170,048 £1,495,502
Source: Adams Integra, August 2012
100 Unit Scheme
500 Unit Scheme
10 Unit Scheme
15 Unit Scheme
20 Unit Scheme
50 Unit Scheme
Table 58: Summary of Residual Land Value (£) Appraisals for
All Value Points
0%, 25%, 30%, 35% and 40% Affordable Housing
70% Social Rent/30% Shared Ownership
Planning Infrastructure Level £0, £100 CIL
Code for Sustainable Homes Level 5
Low Density
Appendix 4ii
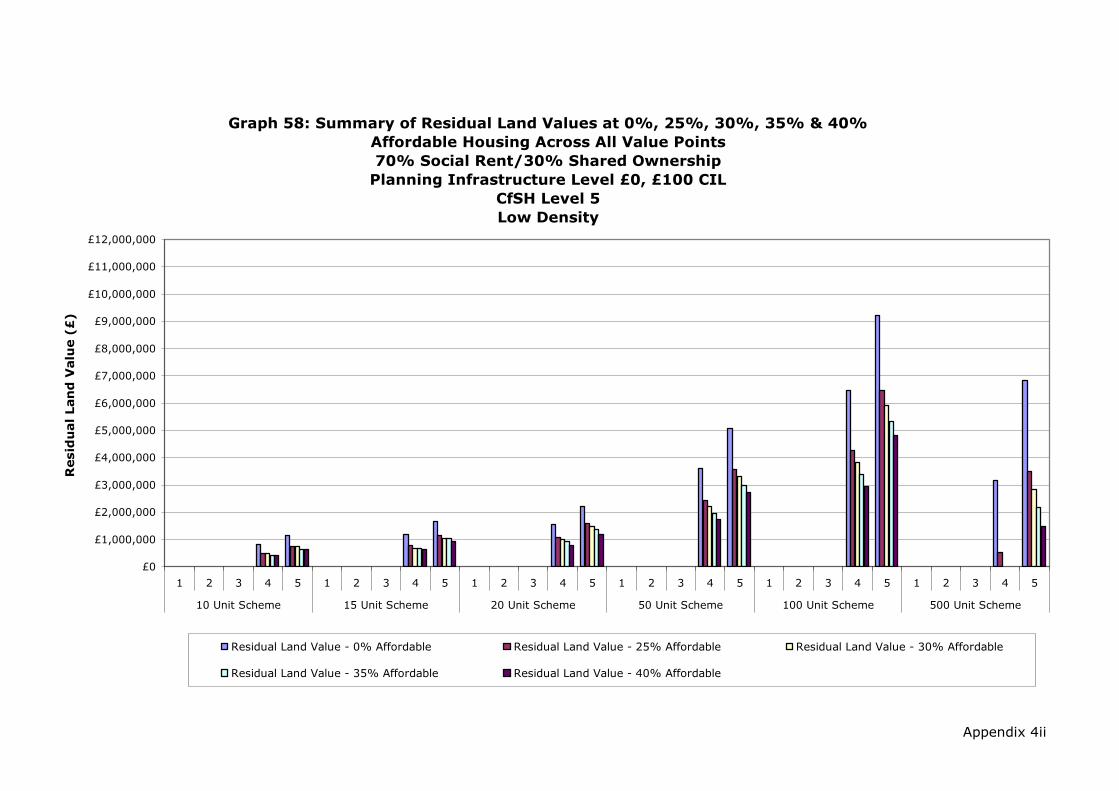
Appendix 4ii
Graph 58: Summary of Residual Land Values at 0%, 25%, 30%, 35% & 40%
Affordable Housing Across All Value Points
70% Social Rent/30% Shared Ownership
Planning Infrastructure Level £0, £100 CIL
CfSH Level 5
Low Density
£0
£1,000,000
£2,000,000
£3,000,000
£4,000,000
£5,000,000
£6,000,000
£7,000,000
£8,000,000
£9,000,000
£10,000,000
£11,000,000
£12,000,000
1 2 3 4 5 1 2 3 4 5 1 2 3 4 5 1 2 3 4 5 1 2 3 4 5 1 2 3 4 5
10 Unit Scheme 15 Unit Scheme 20 Unit Scheme 50 Unit Scheme 100 Unit Scheme 500 Unit Scheme
Resid
ual Lan
d V
alu
e (£
)
Residual Land Value - 0% Affordable Residual Land Value - 25% Affordable Residual Land Value - 30% Affordable
Residual Land Value - 35% Affordable Residual Land Value - 40% Affordable

Development Scenario /
Threshold Value Point
Residual Land
Value - 0%
Affordable
Residual Land
Value - 25%
Affordable
Residual Land
Value - 30%
Affordable
Residual Land
Value - 35%
Affordable
Residual Land
Value - 40%
Affordable
1 0.0% 0.0% 0.0% 0.0% 0.0%
2 0.0% 0.0% 0.0% 0.0% 0.0%
3 0.1% 0.0% 0.0% 0.0% 0.0%
4 22.1% 16.1% 16.1% 13.8% 13.8%
5 27.3% 21.3% 21.3% 18.9% 18.9%
1 0.0% 0.0% 0.0% 0.0% 0.0%
2 0.0% 0.0% 0.0% 0.0% 0.0%
3 0.0% 0.0% 0.0% 0.0% 0.0%
4 21.4% 16.2% 14.7% 14.7% 13.7%
5 26.5% 21.3% 19.9% 19.9% 18.7%
1 0.0% 0.0% 0.0% 0.0% 0.0%
2 0.0% 0.0% 0.0% 0.0% 0.0%
3 0.0% 0.0% 0.0% 0.0% 0.0%
4 21.4% 16.6% 15.9% 14.7% 13.0%
5 26.6% 21.9% 21.1% 20.0% 18.3%
1 0.0% 0.0% 0.0% 0.0% 0.0%
2 0.0% 0.0% 0.0% 0.0% 0.0%
3 0.0% 0.0% 0.0% 0.0% 0.0%
4 20.1% 15.3% 14.3% 13.0% 12.0%
5 25.1% 20.3% 19.3% 18.0% 16.9%
1 0.0% 0.0% 0.0% 0.0% 0.0%
2 0.0% 0.0% 0.0% 0.0% 0.0%
3 0.0% 0.0% 0.0% 0.0% 0.0%
4 18.0% 13.5% 12.4% 11.3% 10.1%
5 22.8% 18.3% 17.2% 16.1% 14.9%
1 0.0% 0.0% 0.0% 0.0% 0.0%
2 0.0% 0.0% 0.0% 0.0% 0.0%
3 0.0% 0.0% 0.0% 0.0% 0.0%
4 1.9% 0.3% 0.0% 0.0% 0.0%
5 3.5% 2.1% 1.7% 1.3% 1.0%
Source: Adams Integra, August 2012
100 Unit Scheme
500 Unit Scheme
10 Unit Scheme
15 Unit Scheme
20 Unit Scheme
50 Unit Scheme
Table 58a: Summary of Residual Land Value (as % of GDV) Appraisals for
All Value Points
0%, 25%, 30%, 35% and 40% Affordable Housing
70% Social Rent/30% Shared Ownership
Planning Infrastructure Level £0, £100 CIL
Code for Sustainable Homes Level 5
Low Density
Appendix 4ii

Appendix 4ii
Graph 58a: Summary of Residual Land Values (as % of GDV) at 0%, 25%, 30%, 35% &
40% Affordable Housing Across all Value Points
70% Social Rent/30% Shared Ownership
Planning Infrastructure Level £0, £100 CIL
CfSH Level 5
Low Density
0.0%
5.0%
10.0%
15.0%
20.0%
25.0%
30.0%
35.0%
40.0%
1 2 3 4 5 1 2 3 4 5 1 2 3 4 5 1 2 3 4 5 1 2 3 4 5 1 2 3 4 5
10 Unit Scheme 15 Unit Scheme 20 Unit Scheme 50 Unit Scheme 100 Unit Scheme 500 Unit Scheme
Resid
ual Lan
d V
alu
e (%
o
f G
DV
)
Residual Land Value - 0% Affordable Residual Land Value - 25% Affordable Residual Land Value - 30% Affordable
Residual Land Value - 35% Affordable Residual Land Value - 40% Affordable

Development Scenario /
Threshold Value Point
Residual Land
Value - 0%
Affordable
Residual Land
Value - 25%
Affordable
Residual Land
Value - 30%
Affordable
Residual Land
Value - 35%
Affordable
Residual Land
Value - 40%
Affordable
1 £0 £0 £0 £0 £0
2 £0 £0 £0 £0 £0
3 £7,211 £0 £0 £0 £0
4 £3,232,513 £2,024,347 £2,024,347 £1,642,490 £1,642,490
5 £4,530,050 £2,990,561 £2,990,561 £2,506,166 £2,506,166
1 £0 £0 £0 £0 £0
2 £0 £0 £0 £0 £0
3 £0 £0 £0 £0 £0
4 £3,162,762 £2,103,328 £1,840,414 £1,840,414 £1,660,147
5 £4,412,565 £3,078,259 £2,758,907 £2,758,907 £2,522,202
1 £0 £0 £0 £0 £0
2 £0 £0 £0 £0 £0
3 £0 £0 £0 £0 £0
4 £3,133,515 £2,147,310 £2,012,867 £1,816,786 £1,553,267
5 £4,409,486 £3,176,191 £2,999,656 £2,761,484 £2,419,240
1 £0 £0 £0 £0 £0
2 £0 £0 £0 £0 £0
3 £0 £0 £0 £0 £0
4 £2,890,078 £1,935,056 £1,763,929 £1,551,686 £1,396,986
5 £4,058,904 £2,862,691 £2,644,599 £2,383,269 £2,181,603
1 £0 £0 £0 £0 £0
2 £0 £0 £0 £0 £0
3 £0 £0 £0 £0 £0
4 £2,591,791 £1,707,950 £1,535,114 £1,354,542 £1,185,255
5 £3,692,859 £2,582,808 £2,364,730 £2,138,916 £1,924,387
1 £0 £0 £0 £0 £0
2 £0 £0 £0 £0 £0
3 £0 £0 £0 £0 £0
4 £253,892 £41,553 £0 £0 £0
5 £548,348 £280,781 £226,817 £173,604 £119,640
Source: Adams Integra, August 2012
100 Unit Scheme
500 Unit Scheme
10 Unit Scheme
15 Unit Scheme
20 Unit Scheme
50 Unit Scheme
Table 58b: Summary of Residual Land Value (value per Hectare) Appraisals
for All Value Points
0%, 25%, 30%, 35% and 40% Affordable Housing
70% Social Rent/30% Shared Ownership
Planning Infrastructure Level £0, £100
Code for Sustainable Homes Level 5
Low Density
Appendix 4ii

Appendix 4ii
Graph 58b: Summary of Residual Land Values (value per Hectare) at 0%, 25%, 30%, 35%
& 40% Affordable Housing Across all Value Points
70% Social Rent/30% Shared Ownership
Planning Infrastructure Level £0, £100 CIL
CfSH Level 5
Low Density
£0
£500,000
£1,000,000
£1,500,000
£2,000,000
£2,500,000
£3,000,000
£3,500,000
£4,000,000
£4,500,000
£5,000,000
1 2 3 4 5 1 2 3 4 5 1 2 3 4 5 1 2 3 4 5 1 2 3 4 5 1 2 3 4 5
10 Unit Scheme 15 Unit Scheme 20 Unit Scheme 50 Unit Scheme 100 Unit Scheme 500 Unit Scheme
Resid
ual Lan
d V
alu
e (%
o
f G
DV
)
Residual Land Value - 0% Affordable Residual Land Value - 25% Affordable Residual Land Value - 30% Affordable
Residual Land Value - 35% Affordable Residual Land Value - 40% Affordable

Development Scenario /
Threshold Value Point
Residual Land
Value - 0%
Affordable
Residual Land
Value - 25%
Affordable
Residual Land
Value - 30%
Affordable
Residual Land
Value - 35%
Affordable
Residual Land
Value - 40%
Affordable
1 £0 £0 £0 £0 £0
2 £0 £0 £0 £0 £0
3 £10,305 £0 £0 £0 £0
4 £607,559 £359,961 £359,961 £229,209 £229,209
5 £873,823 £560,124 £560,124 £390,132 £390,132
1 £0 £0 £0 £0 £0
2 £0 £0 £0 £0 £0
3 £8,196 £0 £0 £0 £0
4 £994,754 £613,728 £515,135 £515,135 £452,197
5 £1,455,989 £973,680 £853,923 £853,923 £765,158
1 £0 £0 £0 £0 £0
2 £0 £0 £0 £0 £0
3 £0 £0 £0 £0 £0
4 £1,243,185 £750,082 £682,861 £584,821 £457,780
5 £1,792,317 £1,175,669 £1,087,402 £968,315 £797,193
1 £0 £0 £0 £0 £0
2 £0 £0 £0 £0 £0
3 £0 £0 £0 £0 £0
4 £2,753,797 £1,618,579 £1,453,155 £1,224,400 £1,031,024
5 £4,007,085 £2,575,580 £2,370,984 £2,082,604 £1,830,521
1 £0 £0 £0 £0 £0
2 £0 £0 £0 £0 £0
3 £0 £0 £0 £0 £0
4 £4,629,785 £2,882,145 £2,510,641 £2,119,794 £1,783,165
5 £6,887,643 £4,703,322 £4,229,479 £3,736,295 £3,321,881
1 £0 £0 £0 £0 £0
2 £0 £0 £0 £0 £0
3 £0 £0 £0 £0 £0
4 £2,533,609 £208,600 £0 £0 £0
5 £5,869,835 £2,945,491 £2,378,502 £1,780,397 £1,198,900
Source: Adams Integra, August 2012
100 Unit Scheme
500 Unit Scheme
10 Unit Scheme
15 Unit Scheme
20 Unit Scheme
50 Unit Scheme
Table 59: Summary of Residual Land Value (£) Appraisals for
All Value Points
0%, 25%, 30%, 35% and 40% Affordable Housing
70% Social Rent/30% Shared Ownership
Planning Infrastructure Level £0, £100 CIL
Code for Sustainable Homes Level 5
Medium Density
Appendix 4ii

Appendix 4ii
Graph 59: Summary of Residual Land Values at 0%, 25%, 30%, 35% & 40%
Affordable Housing Across All Value Points
70% Social Rent/30% Shared Ownership
Planning Infrastructure Level £0, £100 CIL
CfSH Level 5
Medium Density
£0
£500,000
£1,000,000
£1,500,000
£2,000,000
£2,500,000
£3,000,000
£3,500,000
£4,000,000
£4,500,000
£5,000,000
£5,500,000
£6,000,000
£6,500,000
£7,000,000
£7,500,000
£8,000,000
1 2 3 4 5 1 2 3 4 5 1 2 3 4 5 1 2 3 4 5 1 2 3 4 5 1 2 3 4 5
10 Unit Scheme 15 Unit Scheme 20 Unit Scheme 50 Unit Scheme 100 Unit Scheme 500 Unit Scheme
Resid
ual Lan
d V
alu
e (£
)
Residual Land Value - 0% Affordable Residual Land Value - 25% Affordable Residual Land Value - 30% Affordable
Residual Land Value - 35% Affordable Residual Land Value - 40% Affordable

Development Scenario /
Threshold Value Point
Residual Land
Value - 0%
Affordable
Residual Land
Value - 25%
Affordable
Residual Land
Value - 30%
Affordable
Residual Land
Value - 35%
Affordable
Residual Land
Value - 40%
Affordable
1 0.0% 0.0% 0.0% 0.0% 0.0%
2 0.0% 0.0% 0.0% 0.0% 0.0%
3 0.5% 0.0% 0.0% 0.0% 0.0%
4 21.7% 15.2% 15.2% 10.7% 10.7%
5 27.3% 21.0% 21.0% 16.3% 16.3%
1 0.0% 0.0% 0.0% 0.0% 0.0%
2 0.0% 0.0% 0.0% 0.0% 0.0%
3 0.3% 0.0% 0.0% 0.0% 0.0%
4 22.1% 16.0% 14.0% 14.0% 12.7%
5 28.0% 22.2% 20.4% 20.4% 19.0%
1 0.0% 0.0% 0.0% 0.0% 0.0%
2 0.0% 0.0% 0.0% 0.0% 0.0%
3 0.0% 0.0% 0.0% 0.0% 0.0%
4 21.2% 15.0% 14.0% 12.4% 10.2%
5 26.8% 20.8% 19.8% 18.3% 15.9%
1 0.0% 0.0% 0.0% 0.0% 0.0%
2 0.0% 0.0% 0.0% 0.0% 0.0%
3 0.0% 0.0% 0.0% 0.0% 0.0%
4 19.8% 13.7% 12.6% 11.0% 9.6%
5 25.3% 19.3% 18.2% 16.7% 15.2%
1 0.0% 0.0% 0.0% 0.0% 0.0%
2 0.0% 0.0% 0.0% 0.0% 0.0%
3 0.0% 0.0% 0.0% 0.0% 0.0%
4 17.5% 12.5% 11.2% 9.8% 8.5%
5 22.8% 18.0% 16.8% 15.4% 14.1%
1 0.0% 0.0% 0.0% 0.0% 0.0%
2 0.0% 0.0% 0.0% 0.0% 0.0%
3 0.0% 0.0% 0.0% 0.0% 0.0%
4 1.7% 0.2% 0.0% 0.0% 0.0%
5 3.5% 2.0% 1.7% 1.3% 0.9%
Source: Adams Integra, August 2012
100 Unit Scheme
500 Unit Scheme
10 Unit Scheme
15 Unit Scheme
20 Unit Scheme
50 Unit Scheme
Table 59a: Summary of Residual Land Value (as % of GDV) Appraisals for
All Value Points
0%, 25%, 30%, 35% and 40% Affordable Housing
70% Social Rent/30% Shared Ownership
Planning Infrastructure Level £0, £100 CIL
Code for Sustainable Homes Level 5
Medium Density
Appendix 4ii
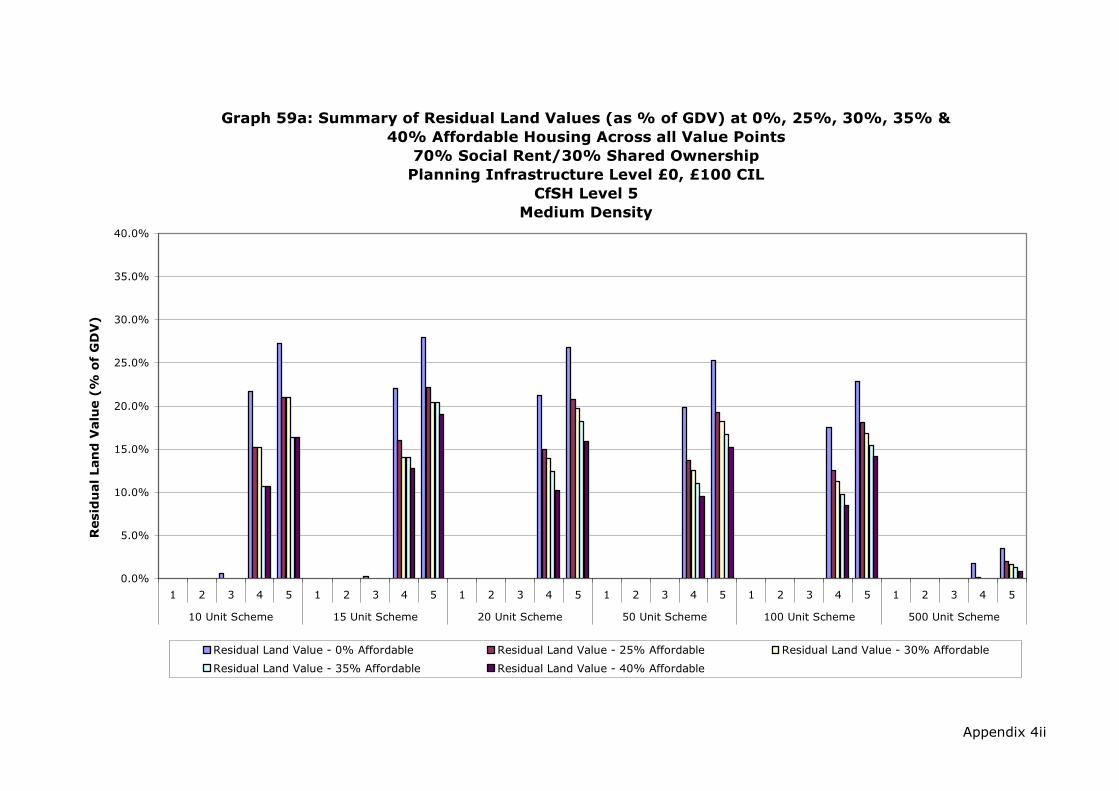
Appendix 4ii
Graph 59a: Summary of Residual Land Values (as % of GDV) at 0%, 25%, 30%, 35% &
40% Affordable Housing Across all Value Points
70% Social Rent/30% Shared Ownership
Planning Infrastructure Level £0, £100 CIL
CfSH Level 5
Medium Density
0.0%
5.0%
10.0%
15.0%
20.0%
25.0%
30.0%
35.0%
40.0%
1 2 3 4 5 1 2 3 4 5 1 2 3 4 5 1 2 3 4 5 1 2 3 4 5 1 2 3 4 5
10 Unit Scheme 15 Unit Scheme 20 Unit Scheme 50 Unit Scheme 100 Unit Scheme 500 Unit Scheme
Resid
ual Lan
d V
alu
e (%
o
f G
DV
)
Residual Land Value - 0% Affordable Residual Land Value - 25% Affordable Residual Land Value - 30% Affordable
Residual Land Value - 35% Affordable Residual Land Value - 40% Affordable
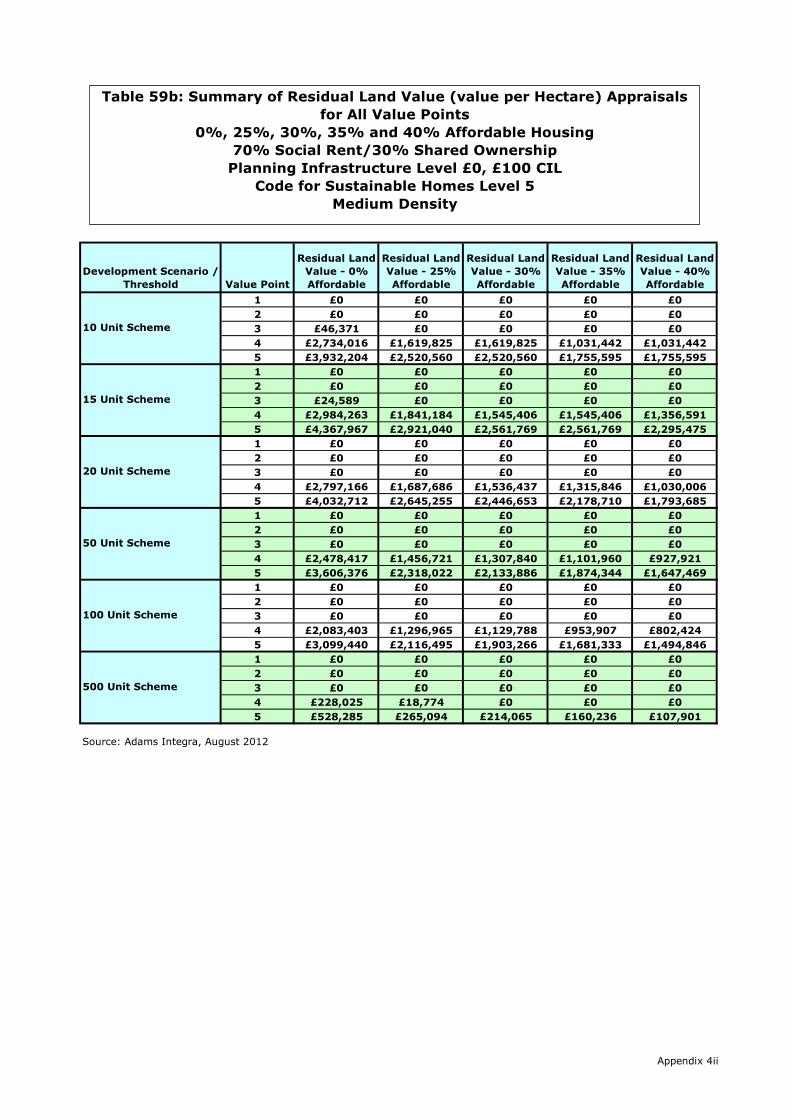
Development Scenario /
Threshold Value Point
Residual Land
Value - 0%
Affordable
Residual Land
Value - 25%
Affordable
Residual Land
Value - 30%
Affordable
Residual Land
Value - 35%
Affordable
Residual Land
Value - 40%
Affordable
1 £0 £0 £0 £0 £0
2 £0 £0 £0 £0 £0
3 £46,371 £0 £0 £0 £0
4 £2,734,016 £1,619,825 £1,619,825 £1,031,442 £1,031,442
5 £3,932,204 £2,520,560 £2,520,560 £1,755,595 £1,755,595
1 £0 £0 £0 £0 £0
2 £0 £0 £0 £0 £0
3 £24,589 £0 £0 £0 £0
4 £2,984,263 £1,841,184 £1,545,406 £1,545,406 £1,356,591
5 £4,367,967 £2,921,040 £2,561,769 £2,561,769 £2,295,475
1 £0 £0 £0 £0 £0
2 £0 £0 £0 £0 £0
3 £0 £0 £0 £0 £0
4 £2,797,166 £1,687,686 £1,536,437 £1,315,846 £1,030,006
5 £4,032,712 £2,645,255 £2,446,653 £2,178,710 £1,793,685
1 £0 £0 £0 £0 £0
2 £0 £0 £0 £0 £0
3 £0 £0 £0 £0 £0
4 £2,478,417 £1,456,721 £1,307,840 £1,101,960 £927,921
5 £3,606,376 £2,318,022 £2,133,886 £1,874,344 £1,647,469
1 £0 £0 £0 £0 £0
2 £0 £0 £0 £0 £0
3 £0 £0 £0 £0 £0
4 £2,083,403 £1,296,965 £1,129,788 £953,907 £802,424
5 £3,099,440 £2,116,495 £1,903,266 £1,681,333 £1,494,846
1 £0 £0 £0 £0 £0
2 £0 £0 £0 £0 £0
3 £0 £0 £0 £0 £0
4 £228,025 £18,774 £0 £0 £0
5 £528,285 £265,094 £214,065 £160,236 £107,901
Source: Adams Integra, August 2012
100 Unit Scheme
500 Unit Scheme
10 Unit Scheme
15 Unit Scheme
20 Unit Scheme
50 Unit Scheme
Table 59b: Summary of Residual Land Value (value per Hectare) Appraisals
for All Value Points
0%, 25%, 30%, 35% and 40% Affordable Housing
70% Social Rent/30% Shared Ownership
Planning Infrastructure Level £0, £100 CIL
Code for Sustainable Homes Level 5
Medium Density
Appendix 4ii
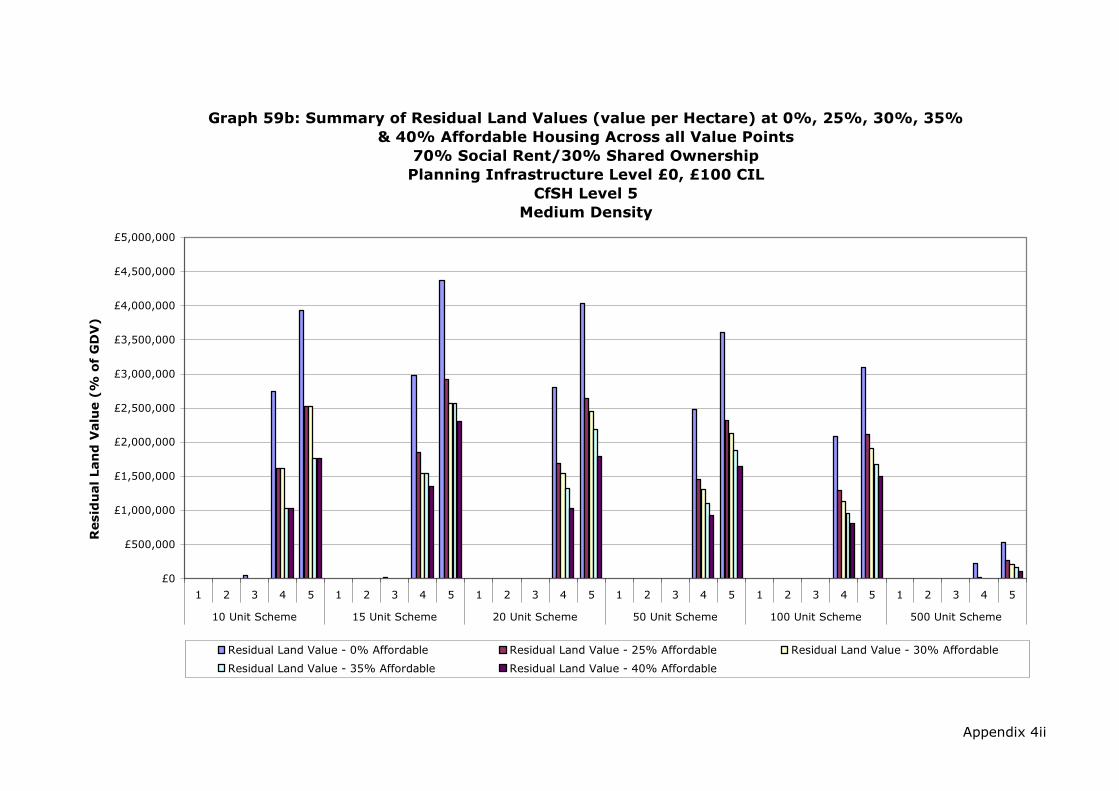
Appendix 4ii
Graph 59b: Summary of Residual Land Values (value per Hectare) at 0%, 25%, 30%, 35%
& 40% Affordable Housing Across all Value Points
70% Social Rent/30% Shared Ownership
Planning Infrastructure Level £0, £100 CIL
CfSH Level 5
Medium Density
£0
£500,000
£1,000,000
£1,500,000
£2,000,000
£2,500,000
£3,000,000
£3,500,000
£4,000,000
£4,500,000
£5,000,000
1 2 3 4 5 1 2 3 4 5 1 2 3 4 5 1 2 3 4 5 1 2 3 4 5 1 2 3 4 5
10 Unit Scheme 15 Unit Scheme 20 Unit Scheme 50 Unit Scheme 100 Unit Scheme 500 Unit Scheme
Resid
ual Lan
d V
alu
e (%
o
f G
DV
)
Residual Land Value - 0% Affordable Residual Land Value - 25% Affordable Residual Land Value - 30% Affordable
Residual Land Value - 35% Affordable Residual Land Value - 40% Affordable

Development Scenario /
Threshold Value Point
Residual Land
Value - 0%
Affordable
Residual Land
Value - 25%
Affordable
Residual Land
Value - 30%
Affordable
Residual Land
Value - 35%
Affordable
Residual Land
Value - 40%
Affordable
1 £0 £0 £0 £0 £0
2 £0 £0 £0 £0 £0
3 £0 £0 £0 £0 £0
4 £418,281 £169,437 £169,437 £65,586 £65,586
5 £595,371 £284,607 £284,607 £167,264 £167,264
1 £0 £0 £0 £0 £0
2 £0 £0 £0 £0 £0
3 £3,930 £0 £0 £0 £0
4 £577,002 £283,092 £187,255 £187,255 £165,546
5 £836,767 £471,975 £350,970 £350,970 £325,470
1 £0 £0 £0 £0 £0
2 £0 £0 £0 £0 £0
3 £12,405 £0 £0 £0 £0
4 £795,454 £406,438 £383,674 £284,612 £206,052
5 £1,151,855 £665,182 £640,086 £521,000 £424,242
1 £0 £0 £0 £0 £0
2 £0 £0 £0 £0 £0
3 £17,579 £0 £0 £0 £0
4 £2,018,259 £1,098,629 £956,670 £732,214 £624,111
5 £2,916,619 £1,773,653 £1,600,484 £1,318,137 £1,193,616
1 £0 £0 £0 £0 £0
2 £0 £0 £0 £0 £0
3 £0 £0 £0 £0 £0
4 £3,588,920 £1,938,048 £1,617,039 £1,267,000 £945,991
5 £5,281,483 £3,236,600 £2,830,022 £2,403,831 £1,997,253
1 £0 £0 £0 £0 £0
2 £0 £0 £0 £0 £0
3 £0 £0 £0 £0 £0
4 £2,013,000 £0 £0 £0 £0
5 £5,028,262 £2,103,918 £1,536,930 £938,824 £361,049
Source: Adams Integra, August 2012
100 Unit Scheme
500 Unit Scheme
10 Unit Scheme
15 Unit Scheme
20 Unit Scheme
50 Unit Scheme
Table 60: Summary of Residual Land Value (£) Appraisals for
All Value Points
0%, 25%, 30%, 35% and 40% Affordable Housing
70% Social Rent/30% Shared Ownership
Planning Infrastructure Level £0, £100 CIL
Code for Sustainable Homes Level 5
High Density
Appendix 4ii

Appendix 4ii
Graph 60: Summary of Residual Land Values at 0%, 25%, 30%, 35% & 40%
Affordable Housing Across All Value Points
70% Social Rent/30% Shared Ownership
Planning Infrastructure Level £0, £100 CIL
CfSH Level 5
High Density
£0
£500,000
£1,000,000
£1,500,000
£2,000,000
£2,500,000
£3,000,000
£3,500,000
£4,000,000
£4,500,000
£5,000,000
£5,500,000
£6,000,000
1 2 3 4 5 1 2 3 4 5 1 2 3 4 5 1 2 3 4 5 1 2 3 4 5 1 2 3 4 5
10 Unit Scheme 15 Unit Scheme 20 Unit Scheme 50 Unit Scheme 100 Unit Scheme 500 Unit Scheme
Resid
ual Lan
d V
alu
e (£
)
Residual Land Value - 0% Affordable Residual Land Value - 25% Affordable Residual Land Value - 30% Affordable
Residual Land Value - 35% Affordable Residual Land Value - 40% Affordable
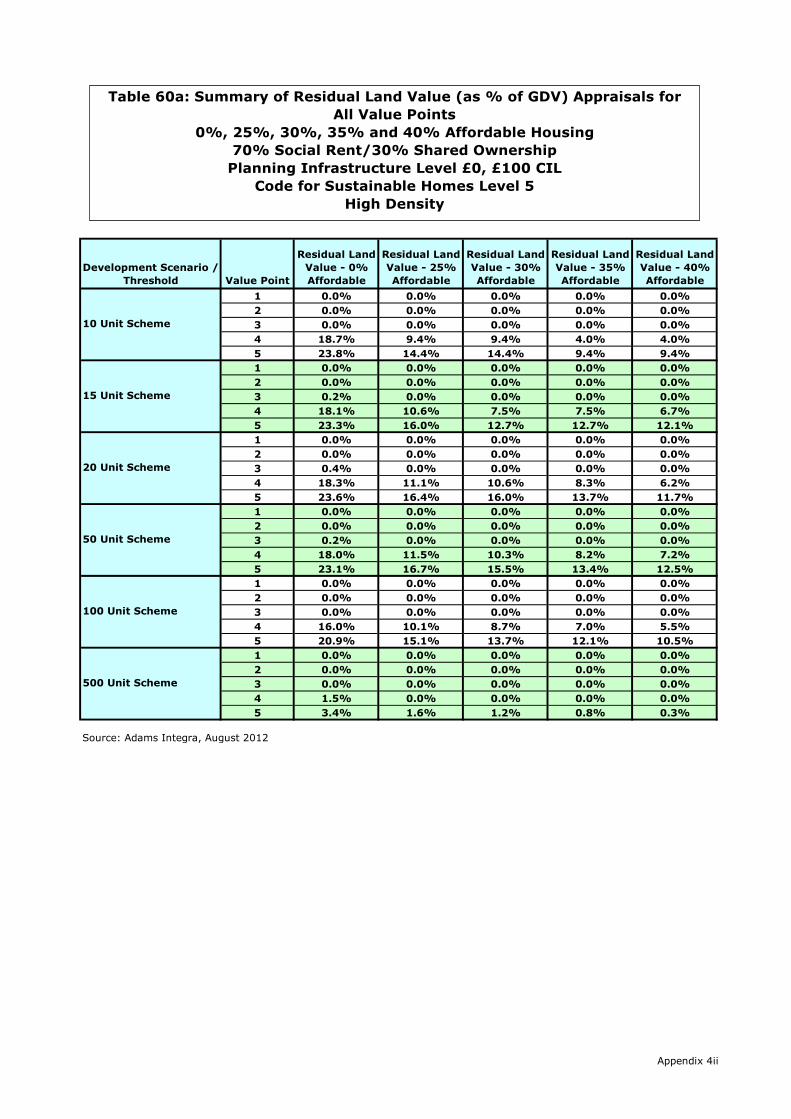
Development Scenario /
Threshold Value Point
Residual Land
Value - 0%
Affordable
Residual Land
Value - 25%
Affordable
Residual Land
Value - 30%
Affordable
Residual Land
Value - 35%
Affordable
Residual Land
Value - 40%
Affordable
1 0.0% 0.0% 0.0% 0.0% 0.0%
2 0.0% 0.0% 0.0% 0.0% 0.0%
3 0.0% 0.0% 0.0% 0.0% 0.0%
4 18.7% 9.4% 9.4% 4.0% 4.0%
5 23.8% 14.4% 14.4% 9.4% 9.4%
1 0.0% 0.0% 0.0% 0.0% 0.0%
2 0.0% 0.0% 0.0% 0.0% 0.0%
3 0.2% 0.0% 0.0% 0.0% 0.0%
4 18.1% 10.6% 7.5% 7.5% 6.7%
5 23.3% 16.0% 12.7% 12.7% 12.1%
1 0.0% 0.0% 0.0% 0.0% 0.0%
2 0.0% 0.0% 0.0% 0.0% 0.0%
3 0.4% 0.0% 0.0% 0.0% 0.0%
4 18.3% 11.1% 10.6% 8.3% 6.2%
5 23.6% 16.4% 16.0% 13.7% 11.7%
1 0.0% 0.0% 0.0% 0.0% 0.0%
2 0.0% 0.0% 0.0% 0.0% 0.0%
3 0.2% 0.0% 0.0% 0.0% 0.0%
4 18.0% 11.5% 10.3% 8.2% 7.2%
5 23.1% 16.7% 15.5% 13.4% 12.5%
1 0.0% 0.0% 0.0% 0.0% 0.0%
2 0.0% 0.0% 0.0% 0.0% 0.0%
3 0.0% 0.0% 0.0% 0.0% 0.0%
4 16.0% 10.1% 8.7% 7.0% 5.5%
5 20.9% 15.1% 13.7% 12.1% 10.5%
1 0.0% 0.0% 0.0% 0.0% 0.0%
2 0.0% 0.0% 0.0% 0.0% 0.0%
3 0.0% 0.0% 0.0% 0.0% 0.0%
4 1.5% 0.0% 0.0% 0.0% 0.0%
5 3.4% 1.6% 1.2% 0.8% 0.3%
Source: Adams Integra, August 2012
100 Unit Scheme
500 Unit Scheme
10 Unit Scheme
15 Unit Scheme
20 Unit Scheme
50 Unit Scheme
Table 60a: Summary of Residual Land Value (as % of GDV) Appraisals for
All Value Points
0%, 25%, 30%, 35% and 40% Affordable Housing
70% Social Rent/30% Shared Ownership
Planning Infrastructure Level £0, £100 CIL
Code for Sustainable Homes Level 5
High Density
Appendix 4ii

Appendix 4ii
Graph 60a: Summary of Residual Land Values (as % of GDV) at 0%, 25%, 30%, 35% &
40% Affordable Housing Across all Value Points
70% Social Rent/30% Shared Ownership
Planning Infrastructure Level £0, £100 CIL
CfSH Level 5
High Density
0.0%
5.0%
10.0%
15.0%
20.0%
25.0%
30.0%
35.0%
40.0%
1 2 3 4 5 1 2 3 4 5 1 2 3 4 5 1 2 3 4 5 1 2 3 4 5 1 2 3 4 5
10 Unit Scheme 15 Unit Scheme 20 Unit Scheme 50 Unit Scheme 100 Unit Scheme 500 Unit Scheme
Resid
ual Lan
d V
alu
e (%
o
f G
DV
)
Residual Land Value - 0% Affordable Residual Land Value - 25% Affordable Residual Land Value - 30% Affordable
Residual Land Value - 35% Affordable Residual Land Value - 40% Affordable

Development Scenario /
Threshold Value Point
Residual Land
Value - 0%
Affordable
Residual Land
Value - 25%
Affordable
Residual Land
Value - 30%
Affordable
Residual Land
Value - 35%
Affordable
Residual Land
Value - 40%
Affordable
1 £0 £0 £0 £0 £0
2 £0 £0 £0 £0 £0
3 £0 £0 £0 £0 £0
4 £2,091,404 £847,186 £847,186 £327,928 £327,928
5 £2,976,857 £1,423,034 £1,423,034 £836,322 £836,322
1 £0 £0 £0 £0 £0
2 £0 £0 £0 £0 £0
3 £13,100 £0 £0 £0 £0
4 £1,923,339 £943,640 £624,184 £624,184 £551,820
5 £2,789,224 £1,573,249 £1,169,901 £1,169,901 £1,084,899
1 £0 £0 £0 £0 £0
2 £0 £0 £0 £0 £0
3 £31,012 £0 £0 £0 £0
4 £1,988,635 £1,016,096 £959,185 £711,531 £515,130
5 £2,879,639 £1,662,955 £1,600,214 £1,302,499 £1,060,604
1 £0 £0 £0 £0 £0
2 £0 £0 £0 £0 £0
3 £17,579 £0 £0 £0 £0
4 £2,018,259 £1,098,629 £956,670 £732,214 £624,111
5 £2,916,619 £1,773,653 £1,600,484 £1,318,137 £1,193,616
1 £0 £0 £0 £0 £0
2 £0 £0 £0 £0 £0
3 £0 £0 £0 £0 £0
4 £1,794,460 £969,024 £808,520 £633,500 £472,995
5 £2,640,742 £1,618,300 £1,415,011 £1,201,915 £998,626
1 £0 £0 £0 £0 £0
2 £0 £0 £0 £0 £0
3 £0 £0 £0 £0 £0
4 £201,300 £0 £0 £0 £0
5 £502,826 £210,392 £153,693 £93,882 £36,105
Source: Adams Integra, August 2012
100 Unit Scheme
500 Unit Scheme
10 Unit Scheme
15 Unit Scheme
20 Unit Scheme
50 Unit Scheme
Table 60b: Summary of Residual Land Value (value per Hectare) Appraisals
for All Value Points
0%, 25%, 30%, 35% and 40% Affordable Housing
70% Social Rent/30% Shared Ownership
Planning Infrastructure Level £0, £100 CIL
Code for Sustainable Homes Level 5
High Density
Appendix 4ii
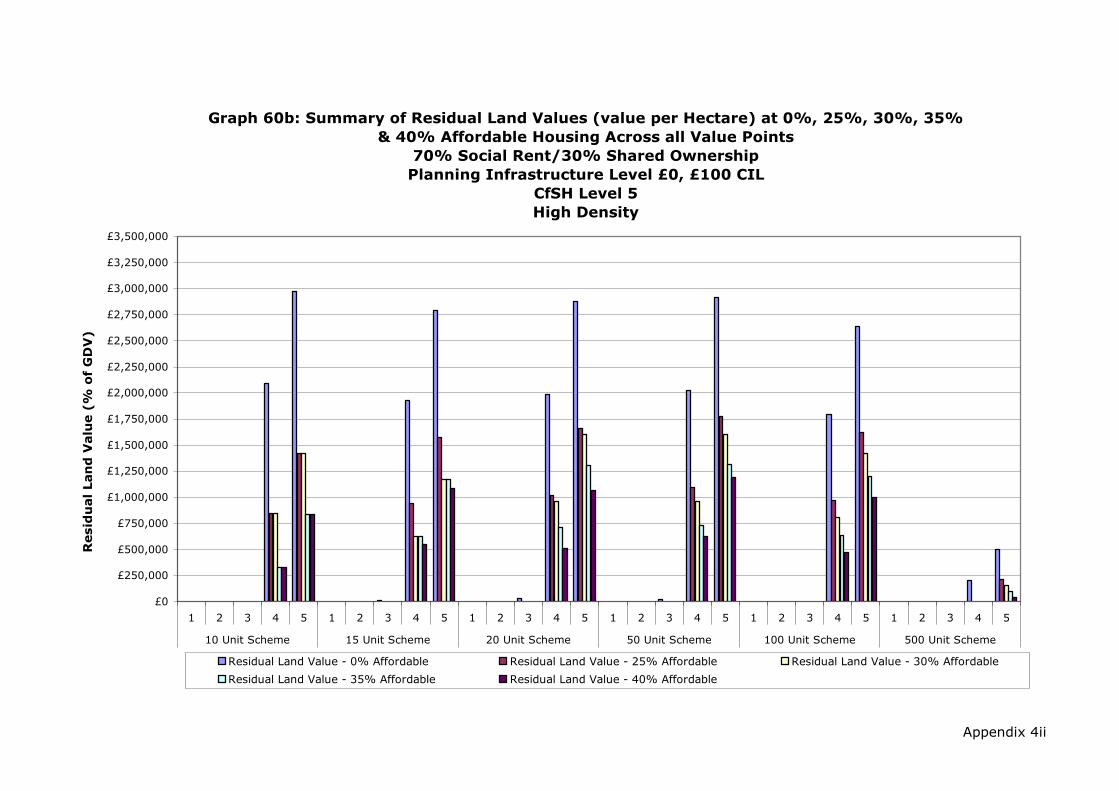
Appendix 4ii
Graph 60b: Summary of Residual Land Values (value per Hectare) at 0%, 25%, 30%, 35%
& 40% Affordable Housing Across all Value Points
70% Social Rent/30% Shared Ownership
Planning Infrastructure Level £0, £100 CIL
CfSH Level 5
High Density
£0
£250,000
£500,000
£750,000
£1,000,000
£1,250,000
£1,500,000
£1,750,000
£2,000,000
£2,250,000
£2,500,000
£2,750,000
£3,000,000
£3,250,000
£3,500,000
1 2 3 4 5 1 2 3 4 5 1 2 3 4 5 1 2 3 4 5 1 2 3 4 5 1 2 3 4 5
10 Unit Scheme 15 Unit Scheme 20 Unit Scheme 50 Unit Scheme 100 Unit Scheme 500 Unit Scheme
Resid
ual Lan
d V
alu
e (%
o
f G
DV
)
Residual Land Value - 0% Affordable Residual Land Value - 25% Affordable Residual Land Value - 30% Affordable
Residual Land Value - 35% Affordable Residual Land Value - 40% Affordable

Appendix 4a

Development Scenario /
Threshold Value Point
Residual Land
Value - 0%
Affordable
Residual Land
Value - 25%
Affordable
Residual Land
Value - 30%
Affordable
Residual Land
Value - 35%
Affordable
Residual Land
Value - 40%
Affordable
1 £0 £0 £0 £0 £0
2 £0 £0 £0 £0 £0
3 £37,854 £0 £0 £0 £0
4 £311,747 £193,806 £193,806 £144,883 £144,883
5 £445,812 £298,571 £298,571 £242,747 £242,747
1 £0 £0 £0 £0 £0
2 £0 £0 £0 £0 £0
3 £61,041 £0 £0 £0 £0
4 £593,939 £383,228 £360,463 £311,930 £263,396
5 £854,893 £593,387 £568,291 £509,189 £454,775
1 £0 £0 £0 £0 £0
2 £0 £0 £0 £0 £0
3 £118,789 £0 £0 £0 £0
4 £1,414,685 £906,984 £813,624 £698,369 £629,794
5 £2,048,694 £1,434,198 £1,319,323 £1,180,059 £1,098,232
Source: Adams Integra, August 2012
10 Unit Scheme
20 Unit Scheme
50 Unit Scheme
Table 61: Summary of Residual Land Value (£) Appraisals for
All Value Points
0%, 25%, 30%, 35% and 40% Affordable Housing
70% Social Rent/30% Shared Ownership
Planning Infrastructure Level £0, £0 CIL
Code for Sustainable Homes Level 5
Low Density
Flats Only Schemes
Appendix 4a
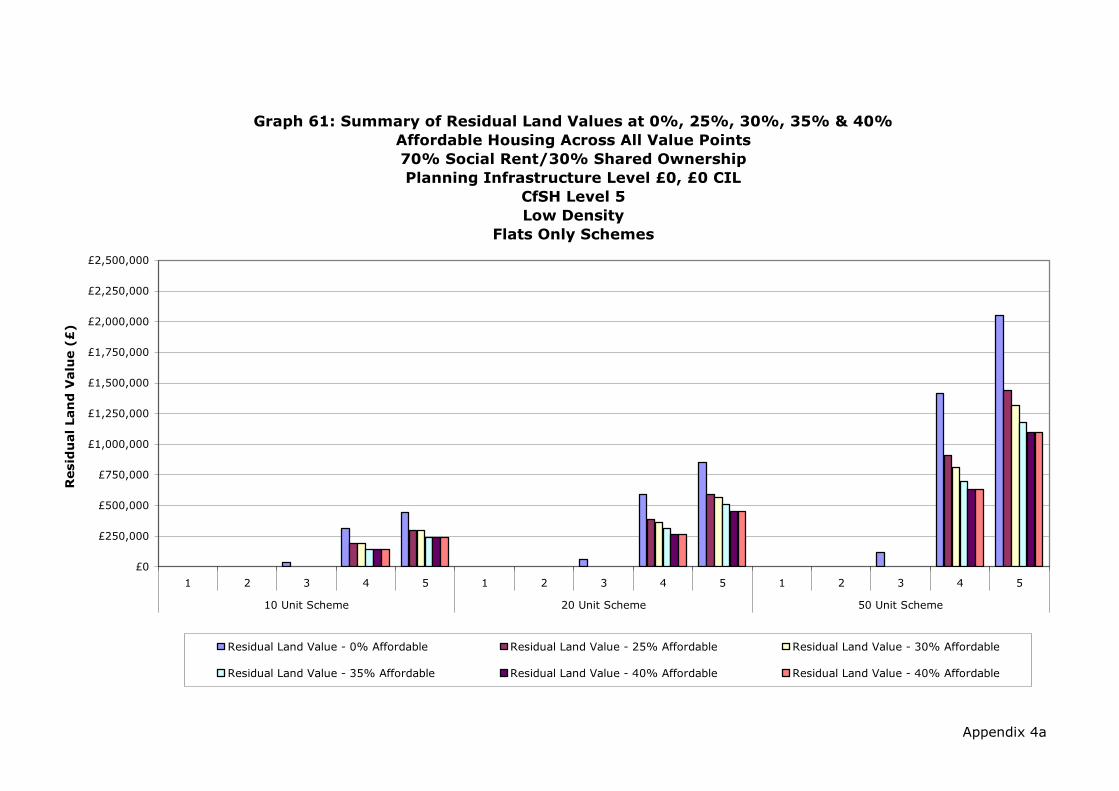
Appendix 4a
Graph 61: Summary of Residual Land Values at 0%, 25%, 30%, 35% & 40%
Affordable Housing Across All Value Points
70% Social Rent/30% Shared Ownership
Planning Infrastructure Level £0, £0 CIL
CfSH Level 5
Low Density
Flats Only Schemes
£0
£250,000
£500,000
£750,000
£1,000,000
£1,250,000
£1,500,000
£1,750,000
£2,000,000
£2,250,000
£2,500,000
1 2 3 4 5 1 2 3 4 5 1 2 3 4 5
10 Unit Scheme 20 Unit Scheme 50 Unit Scheme
Resid
ual Lan
d V
alu
e (£
)
Residual Land Value - 0% Affordable Residual Land Value - 25% Affordable Residual Land Value - 30% Affordable
Residual Land Value - 35% Affordable Residual Land Value - 40% Affordable Residual Land Value - 40% Affordable

Development Scenario /
Threshold Value Point
Residual Land
Value - 0%
Affordable
Residual Land
Value - 25%
Affordable
Residual Land
Value - 30%
Affordable
Residual Land
Value - 35%
Affordable
Residual Land
Value - 40%
Affordable
1 0.0% 0.0% 0.0% 0.0% 0.0%
2 0.0% 0.0% 0.0% 0.0% 0.0%
3 2.8% 0.0% 0.0% 0.0% 0.0%
4 17.9% 12.7% 12.7% 10.1% 10.1%
5 22.9% 17.7% 17.7% 15.3% 15.3%
1 0.0% 0.0% 0.0% 0.0% 0.0%
2 0.0% 0.0% 0.0% 0.0% 0.0%
3 2.3% 0.0% 0.0% 0.0% 0.0%
4 17.0% 12.4% 11.8% 10.5% 9.1%
5 22.0% 17.3% 16.9% 15.6% 14.4%
1 0.0% 0.0% 0.0% 0.0% 0.0%
2 0.0% 0.0% 0.0% 0.0% 0.0%
3 1.8% 0.0% 0.0% 0.0% 0.0%
4 16.2% 11.7% 10.7% 9.5% 8.7%
5 21.1% 16.7% 15.7% 14.5% 13.8%
Source: Adams Integra, August 2012
10 Unit Scheme
20 Unit Scheme
50 Unit Scheme
Table 61a: Summary of Residual Land Value (as % of GDV) Appraisals for
All Value Points
0%, 25%, 30%, 35% and 40% Affordable Housing
70% Social Rent/30% Shared Ownership
Planning Infrastructure Level £0, £0 CIL
Code for Sustainable Homes Level 5
Low Density
Flats Only Schemes
Appendix 4a

Appendix 4a
Graph 61a: Summary of Residual Land Values (as % of GDV) at 0%, 25%, 30%, 35% &
40% Affordable Housing Across all Value Points
70% Social Rent/30% Shared Ownership
Planning Infrastructure Level £0, £0 CIL
CfSH Level 5
Low Density
Flats Only Schemes
0.0%
5.0%
10.0%
15.0%
20.0%
25.0%
30.0%
35.0%
40.0%
1 2 3 4 5 1 2 3 4 5 1 2 3 4 5
10 Unit Scheme 20 Unit Scheme 50 Unit Scheme
Resid
ual Lan
d V
alu
e (%
o
f G
DV
)
Residual Land Value - 0% Affordable Residual Land Value - 25% Affordable Residual Land Value - 30% Affordable
Residual Land Value - 35% Affordable Residual Land Value - 40% Affordable
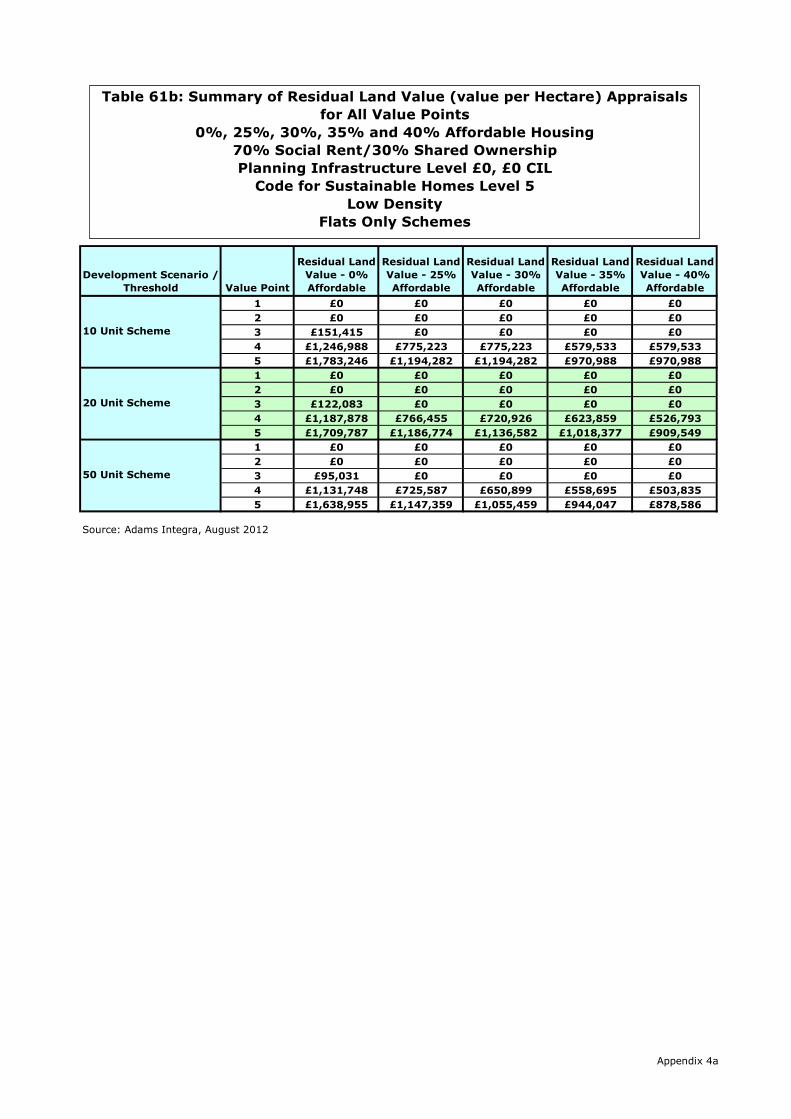
Development Scenario /
Threshold Value Point
Residual Land
Value - 0%
Affordable
Residual Land
Value - 25%
Affordable
Residual Land
Value - 30%
Affordable
Residual Land
Value - 35%
Affordable
Residual Land
Value - 40%
Affordable
1 £0 £0 £0 £0 £0
2 £0 £0 £0 £0 £0
3 £151,415 £0 £0 £0 £0
4 £1,246,988 £775,223 £775,223 £579,533 £579,533
5 £1,783,246 £1,194,282 £1,194,282 £970,988 £970,988
1 £0 £0 £0 £0 £0
2 £0 £0 £0 £0 £0
3 £122,083 £0 £0 £0 £0
4 £1,187,878 £766,455 £720,926 £623,859 £526,793
5 £1,709,787 £1,186,774 £1,136,582 £1,018,377 £909,549
1 £0 £0 £0 £0 £0
2 £0 £0 £0 £0 £0
3 £95,031 £0 £0 £0 £0
4 £1,131,748 £725,587 £650,899 £558,695 £503,835
5 £1,638,955 £1,147,359 £1,055,459 £944,047 £878,586
Source: Adams Integra, August 2012
10 Unit Scheme
20 Unit Scheme
50 Unit Scheme
Table 61b: Summary of Residual Land Value (value per Hectare) Appraisals
for All Value Points
0%, 25%, 30%, 35% and 40% Affordable Housing
70% Social Rent/30% Shared Ownership
Planning Infrastructure Level £0, £0 CIL
Code for Sustainable Homes Level 5
Low Density
Flats Only Schemes
Appendix 4a

Appendix 4a
Graph 61b: Summary of Residual Land Values (value per Ha) at 0%, 25%, 30%, 35% &
40% Affordable Housing Across all Value Points
70% Social Rent/30% Shared Ownership
Planning Infrastructure Level £0, £0 CIL
CfSH Level 5
Low Density
Flats Only Schemes
£0
£250,000
£500,000
£750,000
£1,000,000
£1,250,000
£1,500,000
£1,750,000
£2,000,000
£2,250,000
£2,500,000
1 2 3 4 5 1 2 3 4 5 1 2 3 4 5
10 Unit Scheme 20 Unit Scheme 50 Unit Scheme
Resid
ual Lan
d V
alu
e (%
o
f G
DV
)
Residual Land Value - 0% Affordable Residual Land Value - 25% Affordable Residual Land Value - 30% Affordable
Residual Land Value - 35% Affordable Residual Land Value - 40% Affordable

Development Scenario /
Threshold Value Point
Residual Land
Value - 0%
Affordable
Residual Land
Value - 25%
Affordable
Residual Land
Value - 30%
Affordable
Residual Land
Value - 35%
Affordable
Residual Land
Value - 40%
Affordable
1 £0 £0 £0 £0 £0
2 £0 £0 £0 £0 £0
3 £48,818 £0 £0 £0 £0
4 £303,051 £184,931 £184,931 £135,918 £135,918
5 £433,728 £286,487 £286,487 £230,414 £230,414
1 £0 £0 £0 £0 £0
2 £0 £0 £0 £0 £0
3 £82,916 £0 £0 £0 £0
4 £577,311 £366,427 £343,662 £295,129 £246,595
5 £831,671 £570,165 £545,069 £485,966 £431,310
1 £0 £0 £0 £0 £0
2 £0 £0 £0 £0 £0
3 £173,194 £0 £0 £0 £0
4 £1,375,494 £867,794 £774,434 £659,178 £590,603
5 £1,993,481 £1,378,986 £1,264,111 £1,124,846 £1,043,020
Source: Adams Integra, August 2012
10 Unit Scheme
20 Unit Scheme
50 Unit Scheme
Table 62: Summary of Residual Land Value (£) Appraisals for
All Value Points
0%, 25%, 30%, 35% and 40% Affordable Housing
70% Social Rent/30% Shared Ownership
Planning Infrastructure Level £0, £0 CIL
Code for Sustainable Homes Level 5
Medium Density
Flats Only Schemes
Appendix 4a

Appendix 4a
Graph 62: Summary of Residual Land Values at 0%, 25%, 30%, 35% & 40%
Affordable Housing Across All Value Points
70% Social Rent/30% Shared Ownership
Planning Infrastructure Level £0, £0 CIL
Medium Density
CfSH Level 5
Flats Only Schemes
£0
£250,000
£500,000
£750,000
£1,000,000
£1,250,000
£1,500,000
£1,750,000
£2,000,000
£2,250,000
£2,500,000
1 2 3 4 5 1 2 3 4 5 1 2 3 4 5
10 Unit Scheme 20 Unit Scheme 50 Unit Scheme
Resid
ual Lan
d V
alu
e (£
)
Residual Land Value - 0% Affordable Residual Land Value - 25% Affordable Residual Land Value - 30% Affordable
Residual Land Value - 35% Affordable Residual Land Value - 40% Affordable

Development Scenario /
Threshold Value Point
Residual Land
Value - 0%
Affordable
Residual Land
Value - 25%
Affordable
Residual Land
Value - 30%
Affordable
Residual Land
Value - 35%
Affordable
Residual Land
Value - 40%
Affordable
1 0.0% 0.0% 0.0% 0.0% 0.0%
2 0.0% 0.0% 0.0% 0.0% 0.0%
3 3.7% 0.0% 0.0% 0.0% 0.0%
4 17.8% 12.5% 12.5% 9.7% 9.7%
5 22.9% 17.5% 17.5% 15.0% 15.0%
1 0.0% 0.0% 0.0% 0.0% 0.0%
2 0.0% 0.0% 0.0% 0.0% 0.0%
3 3.1% 0.0% 0.0% 0.0% 0.0%
4 17.0% 12.2% 11.6% 10.3% 8.8%
5 21.9% 17.1% 16.7% 15.3% 14.1%
1 0.0% 0.0% 0.0% 0.0% 0.0%
2 0.0% 0.0% 0.0% 0.0% 0.0%
3 2.6% 0.0% 0.0% 0.0% 0.0%
4 16.2% 11.5% 10.5% 9.2% 8.4%
5 21.0% 16.5% 15.5% 14.3% 13.5%
Source: Adams Integra, August 2012
10 Unit Scheme
20 Unit Scheme
50 Unit Scheme
Table 62a: Summary of Residual Land Value (as % of GDV) Appraisals for
All Value Points
0%, 25%, 30%, 35% and 40% Affordable Housing
70% Social Rent/30% Shared Ownership
Planning Infrastructure Level £0, £0 CIL
Code for Sustainable Homes Level 5
Medium Density
Flats Only Schemes
Appendix 4a

Appendix 4a
Graph 62a: Summary of Residual Land Values (as % of GDV) at 0%, 25%, 30%, 35% &
40% Affordable Housing Across all Value Points
70% Social Rent/30% Shared Ownership
Planning Infrastructure Level £0, £0 CIL
CfSH Level 5
Medium Density
Flats Only Schemes
0.0%
5.0%
10.0%
15.0%
20.0%
25.0%
30.0%
35.0%
40.0%
45.0%
50.0%
1 2 3 4 5 1 2 3 4 5 1 2 3 4 5
10 Unit Scheme 20 Unit Scheme 50 Unit Scheme
Resid
ual Lan
d V
alu
e (%
o
f G
DV
)
Residual Land Value - 0% Affordable Residual Land Value - 25% Affordable Residual Land Value - 30% Affordable
Residual Land Value - 35% Affordable Residual Land Value - 40% Affordable

Development Scenario /
Threshold Value Point
Residual Land
Value - 0%
Affordable
Residual Land
Value - 25%
Affordable
Residual Land
Value - 30%
Affordable
Residual Land
Value - 35%
Affordable
Residual Land
Value - 40%
Affordable
1 £0 £0 £0 £0 £0
2 £0 £0 £0 £0 £0
3 £219,681 £0 £0 £0 £0
4 £1,363,731 £832,188 £832,188 £611,633 £611,633
5 £1,951,776 £1,289,191 £1,289,191 £1,036,864 £1,036,864
1 £0 £0 £0 £0 £0
2 £0 £0 £0 £0 £0
3 £186,562 £0 £0 £0 £0
4 £1,298,950 £824,460 £773,240 £664,040 £554,839
5 £1,871,260 £1,282,871 £1,226,405 £1,093,424 £970,448
1 £0 £0 £0 £0 £0
2 £0 £0 £0 £0 £0
3 £155,875 £0 £0 £0 £0
4 £1,237,945 £781,014 £696,990 £593,260 £531,543
5 £1,794,133 £1,241,087 £1,137,700 £1,012,362 £938,718
Source: Adams Integra, August 2012
10 Unit Scheme
20 Unit Scheme
50 Unit Scheme
Table 62b: Summary of Residual Land Value (value per Hectare) Appraisals
for All Value Points
0%, 25%, 30%, 35% and 40% Affordable Housing
70% Social Rent/30% Shared Ownership
Planning Infrastructure Level £0, £0 CIL
Code for Sustainable Homes Level 5
Medium Density
Flats Only Schemes
Appendix 4a

Appendix 4a
Graph 62b: Summary of Residual Land Values (value per Ha) at 0%, 25%, 30%, 35% &
40% Affordable Housing Across all Value Points
70% Social Rent/30% Shared Ownership
Planning Infrastructure Level £0, £0 CIL
CfSH Level 5
Medium Density
Flats Only Schemes
£0
£250,000
£500,000
£750,000
£1,000,000
£1,250,000
£1,500,000
£1,750,000
£2,000,000
£2,250,000
£2,500,000
1 2 3 4 5 1 2 3 4 5 1 2 3 4 5
10 Unit Scheme 20 Unit Scheme 50 Unit Scheme
Resid
ual Lan
d V
alu
e (%
o
f G
DV
)
Residual Land Value - 0% Affordable Residual Land Value - 25% Affordable Residual Land Value - 30% Affordable
Residual Land Value - 35% Affordable Residual Land Value - 40% Affordable

Development Scenario /
Threshold Value Point
Residual Land
Value - 0%
Affordable
Residual Land
Value - 25%
Affordable
Residual Land
Value - 30%
Affordable
Residual Land
Value - 35%
Affordable
Residual Land
Value - 40%
Affordable
1 £0 £0 £0 £0 £0
2 £0 £0 £0 £0 £0
3 £59,782 £0 £0 £0 £0
4 £294,356 £176,056 £176,056 £126,954 £126,954
5 £421,644 £274,403 £274,403 £218,081 £218,081
1 £0 £0 £0 £0 £0
2 £0 £0 £0 £0 £0
3 £104,791 £0 £0 £0 £0
4 £560,683 £349,625 £326,861 £278,328 £234,532
5 £808,449 £546,943 £521,846 £467,564 £407,846
1 £0 £0 £0 £0 £0
2 £0 £0 £0 £0 £0
3 £225,323 £0 £0 £0 £0
4 £1,336,304 £828,603 £735,243 £619,988 £551,413
5 £1,938,269 £1,323,774 £1,208,898 £1,069,634 £987,807
Source: Adams Integra, August 2012
10 Unit Scheme
20 Unit Scheme
50 Unit Scheme
Table 63: Summary of Residual Land Value (£) Appraisals for
All Value Points
0%, 25%, 30%, 35% and 40% Affordable Housing
70% Social Rent/30% Shared Ownership
Planning Infrastructure Level £0, £0 CIL
Code for Sustainable Homes Level 5
High Density
Flats Only Schemes
Appendix 4a

Appendix 4a
Graph 63: Summary of Residual Land Values at 0%, 25%, 30%, 35% & 40%
Affordable Housing Across All Value Points
70% Social Rent/30% Shared Ownership
Planning Infrastructure Level £0, £0 CIL
CfSH Level 5
High Density
Flats Only Schemes
£0
£250,000
£500,000
£750,000
£1,000,000
£1,250,000
£1,500,000
£1,750,000
£2,000,000
£2,250,000
£2,500,000
1 2 3 4 5 1 2 3 4 5 1 2 3 4 5
10 Unit Scheme 20 Unit Scheme 50 Unit Scheme
Resid
ual Lan
d V
alu
e (£
)
Residual Land Value - 0% Affordable Residual Land Value - 25% Affordable Residual Land Value - 30% Affordable
Residual Land Value - 35% Affordable Residual Land Value - 40% Affordable

Development Scenario /
Threshold Value Point
Residual Land
Value - 0%
Affordable
Residual Land
Value - 25%
Affordable
Residual Land
Value - 30%
Affordable
Residual Land
Value - 35%
Affordable
Residual Land
Value - 40%
Affordable
1 0.0% 0.0% 0.0% 0.0% 0.0%
2 0.0% 0.0% 0.0% 0.0% 0.0%
3 4.6% 0.0% 0.0% 0.0% 0.0%
4 17.8% 12.3% 12.3% 9.4% 9.4%
5 22.8% 17.3% 17.3% 14.7% 14.7%
1 0.0% 0.0% 0.0% 0.0% 0.0%
2 0.0% 0.0% 0.0% 0.0% 0.0%
3 4.0% 0.0% 0.0% 0.0% 0.0%
4 16.9% 12.0% 11.4% 10.0% 8.7%
5 21.9% 16.9% 16.5% 15.2% 13.7%
1 0.0% 0.0% 0.0% 0.0% 0.0%
2 0.0% 0.0% 0.0% 0.0% 0.0%
3 3.4% 0.0% 0.0% 0.0% 0.0%
4 16.1% 11.3% 10.3% 8.9% 8.1%
5 21.0% 16.4% 15.3% 14.0% 13.2%
Source: Adams Integra, August 2012
10 Unit Scheme
20 Unit Scheme
50 Unit Scheme
Table 63a: Summary of Residual Land Value (as % of GDV) Appraisals for
All Value Points
0%, 25%, 30%, 35% and 40% Affordable Housing
70% Social Rent/30% Shared Ownership
Planning Infrastructure Level £0, £0 CIL
Code for Sustainable Homes Level 5
High Density
Flats Only Schemes
Appendix 4a

Appendix 4a
Graph 63a: Summary of Residual Land Values (as % of GDV) at 0%, 25%, 30%, 35% &
40% Affordable Housing Across all Value Points
70% Social Rent/30% Shared Ownership
Planning Infrastructure Level £0, £0 CIL
CfSH Level 5
High Density
Flats Only Schemes
0.0%
5.0%
10.0%
15.0%
20.0%
25.0%
30.0%
35.0%
40.0%
1 2 3 4 5 1 2 3 4 5 1 2 3 4 5
10 Unit Scheme 20 Unit Scheme 50 Unit Scheme
Resid
ual Lan
d V
alu
e (%
o
f G
DV
)
Residual Land Value - 0% Affordable Residual Land Value - 25% Affordable Residual Land Value - 30% Affordable
Residual Land Value - 35% Affordable Residual Land Value - 40% Affordable
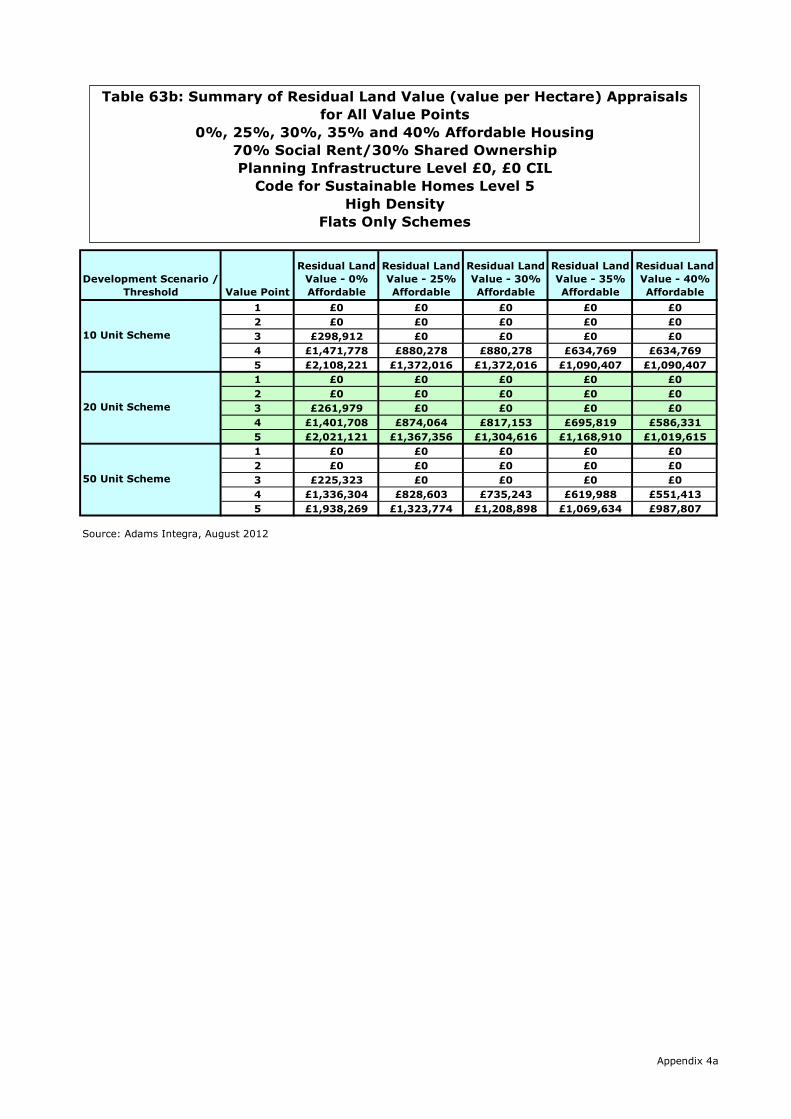
Development Scenario /
Threshold Value Point
Residual Land
Value - 0%
Affordable
Residual Land
Value - 25%
Affordable
Residual Land
Value - 30%
Affordable
Residual Land
Value - 35%
Affordable
Residual Land
Value - 40%
Affordable
1 £0 £0 £0 £0 £0
2 £0 £0 £0 £0 £0
3 £298,912 £0 £0 £0 £0
4 £1,471,778 £880,278 £880,278 £634,769 £634,769
5 £2,108,221 £1,372,016 £1,372,016 £1,090,407 £1,090,407
1 £0 £0 £0 £0 £0
2 £0 £0 £0 £0 £0
3 £261,979 £0 £0 £0 £0
4 £1,401,708 £874,064 £817,153 £695,819 £586,331
5 £2,021,121 £1,367,356 £1,304,616 £1,168,910 £1,019,615
1 £0 £0 £0 £0 £0
2 £0 £0 £0 £0 £0
3 £225,323 £0 £0 £0 £0
4 £1,336,304 £828,603 £735,243 £619,988 £551,413
5 £1,938,269 £1,323,774 £1,208,898 £1,069,634 £987,807
Source: Adams Integra, August 2012
10 Unit Scheme
20 Unit Scheme
50 Unit Scheme
Table 63b: Summary of Residual Land Value (value per Hectare) Appraisals
for All Value Points
0%, 25%, 30%, 35% and 40% Affordable Housing
70% Social Rent/30% Shared Ownership
Planning Infrastructure Level £0, £0 CIL
Code for Sustainable Homes Level 5
High Density
Flats Only Schemes
Appendix 4a

Appendix 4a
Graph 63b: Summary of Residual Land Values (value per Ha) at 0%, 25%, 30%, 35% &
40% Affordable Housing Across all Value Points
70% Social Rent/30% Shared Ownership
Planning Infrastructure Level £0, £0 CIL
CfSH Level 5
High Density
Flats Only Schemes
£0
£250,000
£500,000
£750,000
£1,000,000
£1,250,000
£1,500,000
£1,750,000
£2,000,000
£2,250,000
£2,500,000
1 2 3 4 5 1 2 3 4 5 1 2 3 4 5
10 Unit Scheme 20 Unit Scheme 50 Unit Scheme
Resid
ual Lan
d V
alu
e (%
o
f G
DV
)
Residual Land Value - 0% Affordable Residual Land Value - 25% Affordable Residual Land Value - 30% Affordable
Residual Land Value - 35% Affordable Residual Land Value - 40% Affordable

Appendix 4a-i
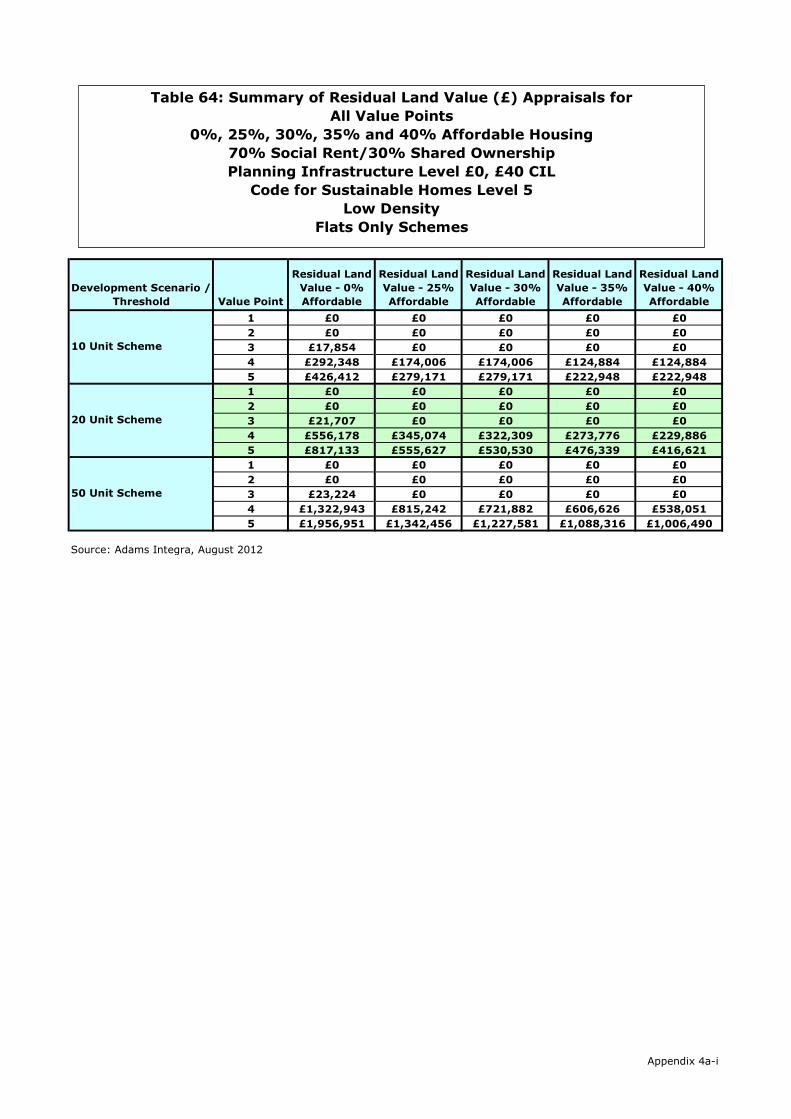
Development Scenario /
Threshold Value Point
Residual Land
Value - 0%
Affordable
Residual Land
Value - 25%
Affordable
Residual Land
Value - 30%
Affordable
Residual Land
Value - 35%
Affordable
Residual Land
Value - 40%
Affordable
1 £0 £0 £0 £0 £0
2 £0 £0 £0 £0 £0
3 £17,854 £0 £0 £0 £0
4 £292,348 £174,006 £174,006 £124,884 £124,884
5 £426,412 £279,171 £279,171 £222,948 £222,948
1 £0 £0 £0 £0 £0
2 £0 £0 £0 £0 £0
3 £21,707 £0 £0 £0 £0
4 £556,178 £345,074 £322,309 £273,776 £229,886
5 £817,133 £555,627 £530,530 £476,339 £416,621
1 £0 £0 £0 £0 £0
2 £0 £0 £0 £0 £0
3 £23,224 £0 £0 £0 £0
4 £1,322,943 £815,242 £721,882 £606,626 £538,051
5 £1,956,951 £1,342,456 £1,227,581 £1,088,316 £1,006,490
Source: Adams Integra, August 2012
10 Unit Scheme
20 Unit Scheme
50 Unit Scheme
Table 64: Summary of Residual Land Value (£) Appraisals for
All Value Points
0%, 25%, 30%, 35% and 40% Affordable Housing
70% Social Rent/30% Shared Ownership
Planning Infrastructure Level £0, £40 CIL
Code for Sustainable Homes Level 5
Low Density
Flats Only Schemes
Appendix 4a-i

Appendix 4a-i
Graph 64: Summary of Residual Land Values at 0%, 25%, 30%, 35% & 40%
Affordable Housing Across All Value Points
70% Social Rent/30% Shared Ownership
Planning Infrastructure Level £0, £40 CIL
CfSH Level 5
Low Density
Flats Only Schemes
£0
£250,000
£500,000
£750,000
£1,000,000
£1,250,000
£1,500,000
£1,750,000
£2,000,000
£2,250,000
£2,500,000
1 2 3 4 5 1 2 3 4 5 1 2 3 4 5
10 Unit Scheme 20 Unit Scheme 50 Unit Scheme
Resid
ual Lan
d V
alu
e (£
)
Residual Land Value - 0% Affordable Residual Land Value - 25% Affordable Residual Land Value - 30% Affordable
Residual Land Value - 35% Affordable Residual Land Value - 40% Affordable Residual Land Value - 40% Affordable
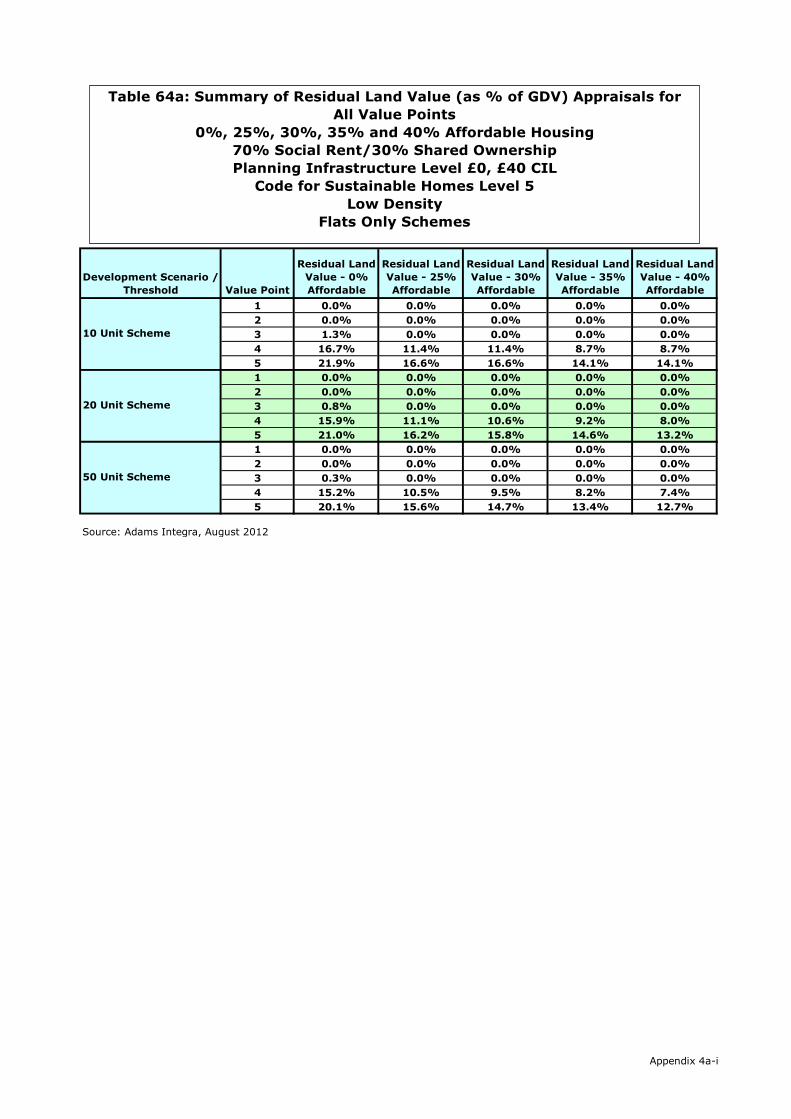
Development Scenario /
Threshold Value Point
Residual Land
Value - 0%
Affordable
Residual Land
Value - 25%
Affordable
Residual Land
Value - 30%
Affordable
Residual Land
Value - 35%
Affordable
Residual Land
Value - 40%
Affordable
1 0.0% 0.0% 0.0% 0.0% 0.0%
2 0.0% 0.0% 0.0% 0.0% 0.0%
3 1.3% 0.0% 0.0% 0.0% 0.0%
4 16.7% 11.4% 11.4% 8.7% 8.7%
5 21.9% 16.6% 16.6% 14.1% 14.1%
1 0.0% 0.0% 0.0% 0.0% 0.0%
2 0.0% 0.0% 0.0% 0.0% 0.0%
3 0.8% 0.0% 0.0% 0.0% 0.0%
4 15.9% 11.1% 10.6% 9.2% 8.0%
5 21.0% 16.2% 15.8% 14.6% 13.2%
1 0.0% 0.0% 0.0% 0.0% 0.0%
2 0.0% 0.0% 0.0% 0.0% 0.0%
3 0.3% 0.0% 0.0% 0.0% 0.0%
4 15.2% 10.5% 9.5% 8.2% 7.4%
5 20.1% 15.6% 14.7% 13.4% 12.7%
Source: Adams Integra, August 2012
10 Unit Scheme
20 Unit Scheme
50 Unit Scheme
Table 64a: Summary of Residual Land Value (as % of GDV) Appraisals for
All Value Points
0%, 25%, 30%, 35% and 40% Affordable Housing
70% Social Rent/30% Shared Ownership
Planning Infrastructure Level £0, £40 CIL
Code for Sustainable Homes Level 5
Low Density
Flats Only Schemes
Appendix 4a-i

Appendix 4a-i
Graph 64a: Summary of Residual Land Values (as % of GDV) at 0%, 25%, 30%, 35% &
40% Affordable Housing Across all Value Points
70% Social Rent/30% Shared Ownership
Planning Infrastructure Level £0, £40 CIL
CfSH Level 5
Low Density
Flats Only Schemes
0.0%
5.0%
10.0%
15.0%
20.0%
25.0%
30.0%
35.0%
40.0%
1 2 3 4 5 1 2 3 4 5 1 2 3 4 5
10 Unit Scheme 20 Unit Scheme 50 Unit Scheme
Resid
ual Lan
d V
alu
e (%
o
f G
DV
)
Residual Land Value - 0% Affordable Residual Land Value - 25% Affordable Residual Land Value - 30% Affordable
Residual Land Value - 35% Affordable Residual Land Value - 40% Affordable

Development Scenario /
Threshold Value Point
Residual Land
Value - 0%
Affordable
Residual Land
Value - 25%
Affordable
Residual Land
Value - 30%
Affordable
Residual Land
Value - 35%
Affordable
Residual Land
Value - 40%
Affordable
1 £0 £0 £0 £0 £0
2 £0 £0 £0 £0 £0
3 £71,417 £0 £0 £0 £0
4 £1,169,391 £696,025 £696,025 £499,535 £499,535
5 £1,705,649 £1,116,685 £1,116,685 £891,791 £891,791
1 £0 £0 £0 £0 £0
2 £0 £0 £0 £0 £0
3 £43,415 £0 £0 £0 £0
4 £1,112,357 £690,147 £644,618 £547,551 £459,773
5 £1,634,265 £1,111,253 £1,061,061 £952,677 £833,241
1 £0 £0 £0 £0 £0
2 £0 £0 £0 £0 £0
3 £18,579 £0 £0 £0 £0
4 £1,058,354 £652,193 £577,505 £485,301 £430,441
5 £1,565,561 £1,073,965 £982,065 £870,653 £805,192
Source: Adams Integra, August 2012
10 Unit Scheme
20 Unit Scheme
50 Unit Scheme
Table 64b: Summary of Residual Land Value (value per Hectare) Appraisals
for All Value Points
0%, 25%, 30%, 35% and 40% Affordable Housing
70% Social Rent/30% Shared Ownership
Planning Infrastructure Level £0, £40 CIL
Code for Sustainable Homes Level 5
Low Density
Flats Only Schemes
Appendix 4a-i
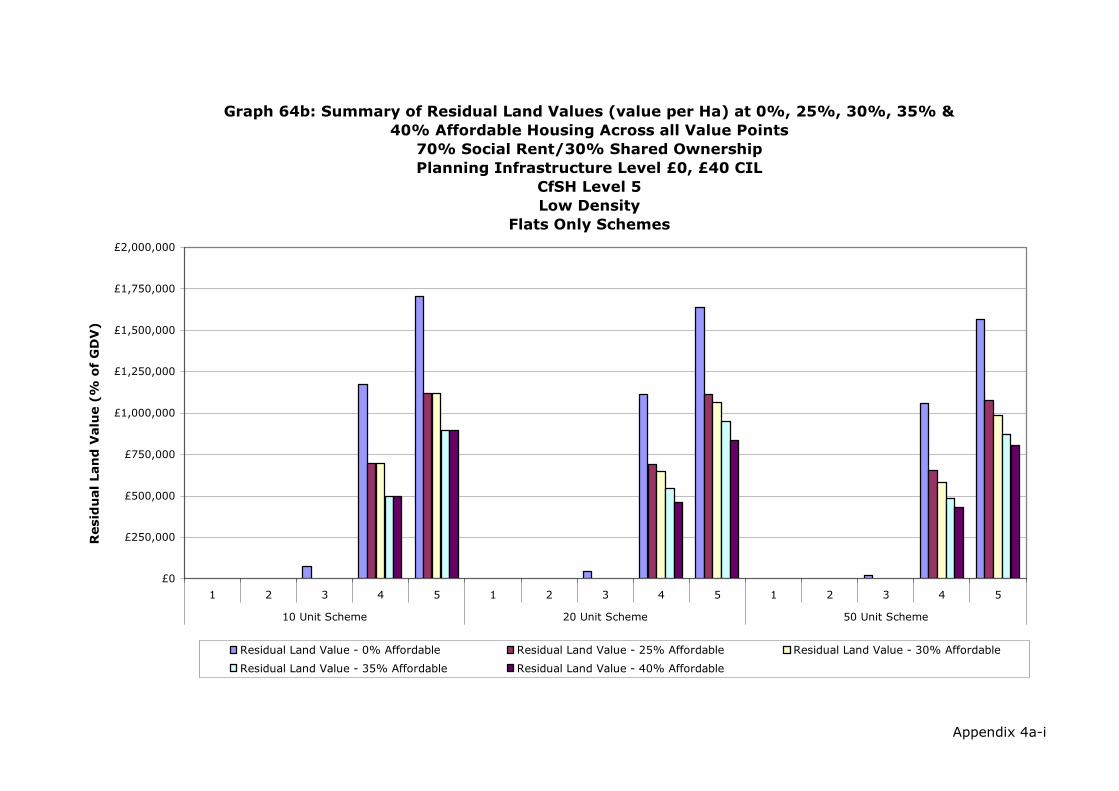
Appendix 4a-i
Graph 64b: Summary of Residual Land Values (value per Ha) at 0%, 25%, 30%, 35% &
40% Affordable Housing Across all Value Points
70% Social Rent/30% Shared Ownership
Planning Infrastructure Level £0, £40 CIL
CfSH Level 5
Low Density
Flats Only Schemes
£0
£250,000
£500,000
£750,000
£1,000,000
£1,250,000
£1,500,000
£1,750,000
£2,000,000
1 2 3 4 5 1 2 3 4 5 1 2 3 4 5
10 Unit Scheme 20 Unit Scheme 50 Unit Scheme
Resid
ual Lan
d V
alu
e (%
o
f G
DV
)
Residual Land Value - 0% Affordable Residual Land Value - 25% Affordable Residual Land Value - 30% Affordable
Residual Land Value - 35% Affordable Residual Land Value - 40% Affordable
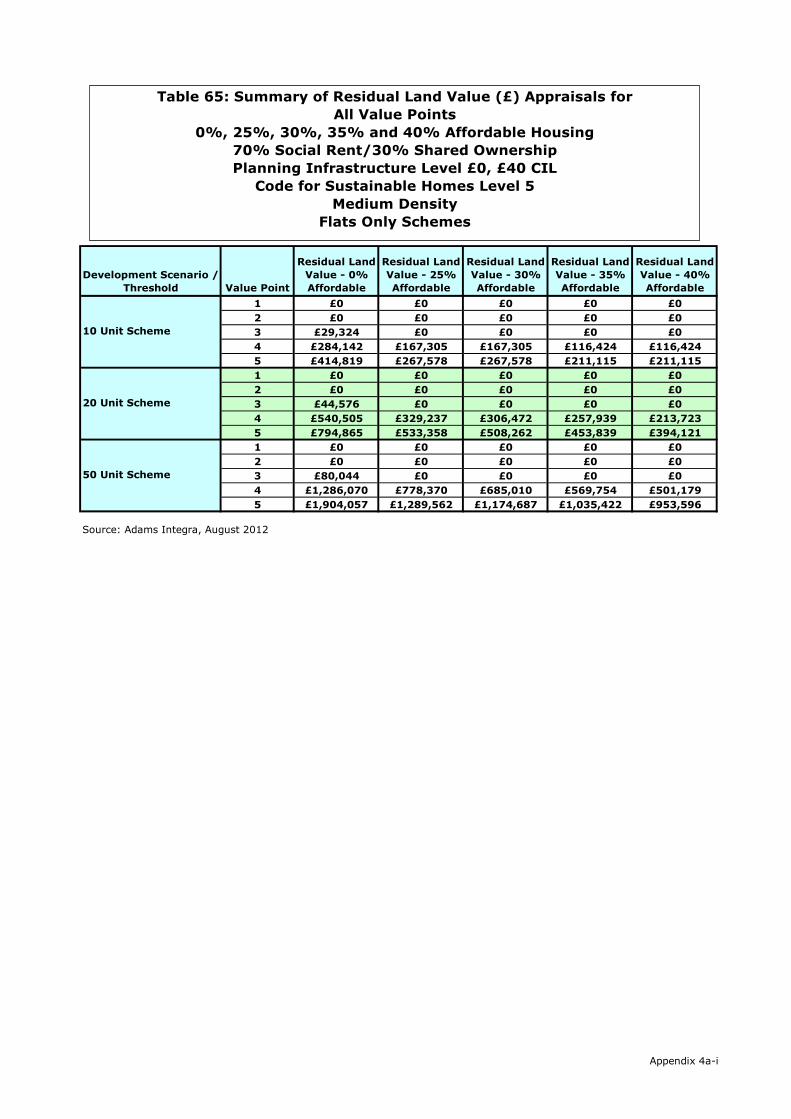
Development Scenario /
Threshold Value Point
Residual Land
Value - 0%
Affordable
Residual Land
Value - 25%
Affordable
Residual Land
Value - 30%
Affordable
Residual Land
Value - 35%
Affordable
Residual Land
Value - 40%
Affordable
1 £0 £0 £0 £0 £0
2 £0 £0 £0 £0 £0
3 £29,324 £0 £0 £0 £0
4 £284,142 £167,305 £167,305 £116,424 £116,424
5 £414,819 £267,578 £267,578 £211,115 £211,115
1 £0 £0 £0 £0 £0
2 £0 £0 £0 £0 £0
3 £44,576 £0 £0 £0 £0
4 £540,505 £329,237 £306,472 £257,939 £213,723
5 £794,865 £533,358 £508,262 £453,839 £394,121
1 £0 £0 £0 £0 £0
2 £0 £0 £0 £0 £0
3 £80,044 £0 £0 £0 £0
4 £1,286,070 £778,370 £685,010 £569,754 £501,179
5 £1,904,057 £1,289,562 £1,174,687 £1,035,422 £953,596
Source: Adams Integra, August 2012
10 Unit Scheme
20 Unit Scheme
50 Unit Scheme
Table 65: Summary of Residual Land Value (£) Appraisals for
All Value Points
0%, 25%, 30%, 35% and 40% Affordable Housing
70% Social Rent/30% Shared Ownership
Planning Infrastructure Level £0, £40 CIL
Code for Sustainable Homes Level 5
Medium Density
Flats Only Schemes
Appendix 4a-i
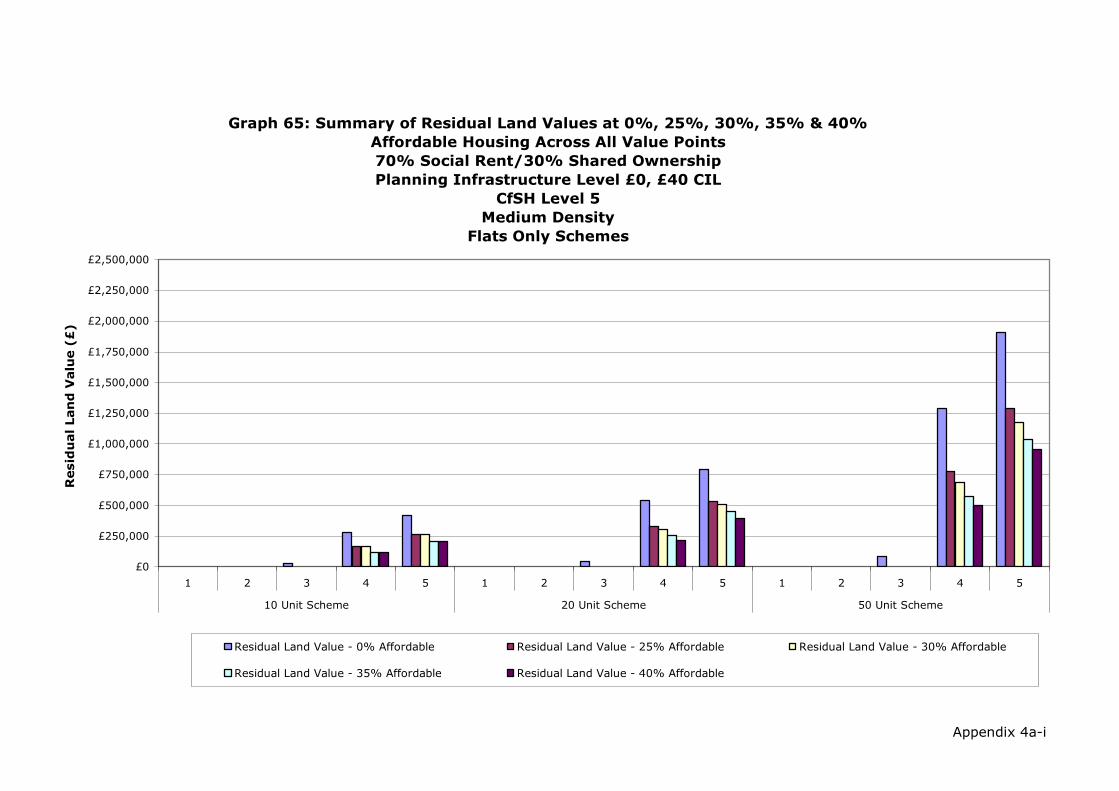
Appendix 4a-i
Graph 65: Summary of Residual Land Values at 0%, 25%, 30%, 35% & 40%
Affordable Housing Across All Value Points
70% Social Rent/30% Shared Ownership
Planning Infrastructure Level £0, £40 CIL
CfSH Level 5
Medium Density
Flats Only Schemes
£0
£250,000
£500,000
£750,000
£1,000,000
£1,250,000
£1,500,000
£1,750,000
£2,000,000
£2,250,000
£2,500,000
1 2 3 4 5 1 2 3 4 5 1 2 3 4 5
10 Unit Scheme 20 Unit Scheme 50 Unit Scheme
Resid
ual Lan
d V
alu
e (£
)
Residual Land Value - 0% Affordable Residual Land Value - 25% Affordable Residual Land Value - 30% Affordable
Residual Land Value - 35% Affordable Residual Land Value - 40% Affordable

Development Scenario /
Threshold Value Point
Residual Land
Value - 0%
Affordable
Residual Land
Value - 25%
Affordable
Residual Land
Value - 30%
Affordable
Residual Land
Value - 35%
Affordable
Residual Land
Value - 40%
Affordable
1 0.0% 0.0% 0.0% 0.0% 0.0%
2 0.0% 0.0% 0.0% 0.0% 0.0%
3 2.2% 0.0% 0.0% 0.0% 0.0%
4 16.7% 11.3% 11.3% 8.3% 8.3%
5 21.9% 16.4% 16.4% 13.8% 13.8%
1 0.0% 0.0% 0.0% 0.0% 0.0%
2 0.0% 0.0% 0.0% 0.0% 0.0%
3 1.7% 0.0% 0.0% 0.0% 0.0%
4 15.9% 10.9% 10.3% 9.0% 7.7%
5 21.0% 16.0% 15.5% 14.3% 12.9%
1 0.0% 0.0% 0.0% 0.0% 0.0%
2 0.0% 0.0% 0.0% 0.0% 0.0%
3 1.2% 0.0% 0.0% 0.0% 0.0%
4 15.1% 10.3% 9.3% 8.0% 7.1%
5 20.1% 15.5% 14.4% 13.2% 12.4%
Source: Adams Integra, August 2012
10 Unit Scheme
20 Unit Scheme
50 Unit Scheme
Table 65a: Summary of Residual Land Value (as % of GDV) Appraisals for
All Value Points
0%, 25%, 30%, 35% and 40% Affordable Housing
70% Social Rent/30% Shared Ownership
Planning Infrastructure Level £0, £40 CIL
Code for Sustainable Homes Level 5
Medium Density
Flats Only Schemes
Appendix 4a-i
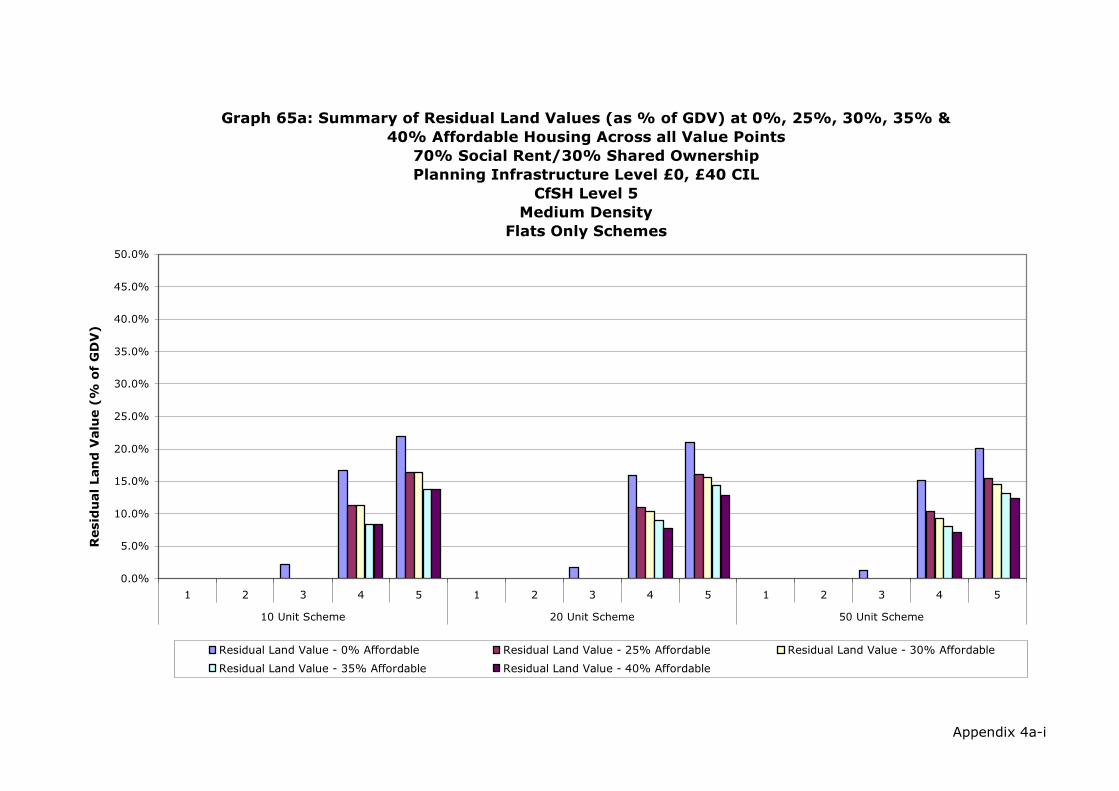
Appendix 4a-i
Graph 65a: Summary of Residual Land Values (as % of GDV) at 0%, 25%, 30%, 35% &
40% Affordable Housing Across all Value Points
70% Social Rent/30% Shared Ownership
Planning Infrastructure Level £0, £40 CIL
CfSH Level 5
Medium Density
Flats Only Schemes
0.0%
5.0%
10.0%
15.0%
20.0%
25.0%
30.0%
35.0%
40.0%
45.0%
50.0%
1 2 3 4 5 1 2 3 4 5 1 2 3 4 5
10 Unit Scheme 20 Unit Scheme 50 Unit Scheme
Resid
ual Lan
d V
alu
e (%
o
f G
DV
)
Residual Land Value - 0% Affordable Residual Land Value - 25% Affordable Residual Land Value - 30% Affordable
Residual Land Value - 35% Affordable Residual Land Value - 40% Affordable
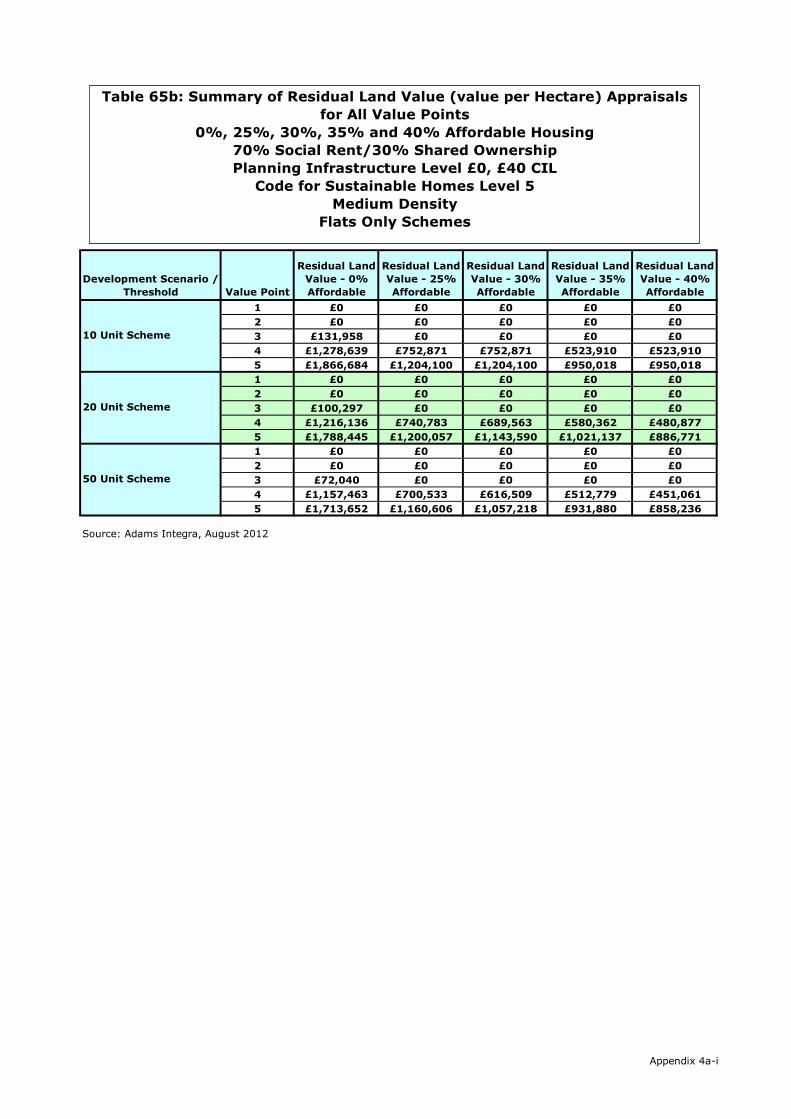
Development Scenario /
Threshold Value Point
Residual Land
Value - 0%
Affordable
Residual Land
Value - 25%
Affordable
Residual Land
Value - 30%
Affordable
Residual Land
Value - 35%
Affordable
Residual Land
Value - 40%
Affordable
1 £0 £0 £0 £0 £0
2 £0 £0 £0 £0 £0
3 £131,958 £0 £0 £0 £0
4 £1,278,639 £752,871 £752,871 £523,910 £523,910
5 £1,866,684 £1,204,100 £1,204,100 £950,018 £950,018
1 £0 £0 £0 £0 £0
2 £0 £0 £0 £0 £0
3 £100,297 £0 £0 £0 £0
4 £1,216,136 £740,783 £689,563 £580,362 £480,877
5 £1,788,445 £1,200,057 £1,143,590 £1,021,137 £886,771
1 £0 £0 £0 £0 £0
2 £0 £0 £0 £0 £0
3 £72,040 £0 £0 £0 £0
4 £1,157,463 £700,533 £616,509 £512,779 £451,061
5 £1,713,652 £1,160,606 £1,057,218 £931,880 £858,236
Source: Adams Integra, August 2012
10 Unit Scheme
20 Unit Scheme
50 Unit Scheme
Table 65b: Summary of Residual Land Value (value per Hectare) Appraisals
for All Value Points
0%, 25%, 30%, 35% and 40% Affordable Housing
70% Social Rent/30% Shared Ownership
Planning Infrastructure Level £0, £40 CIL
Code for Sustainable Homes Level 5
Medium Density
Flats Only Schemes
Appendix 4a-i
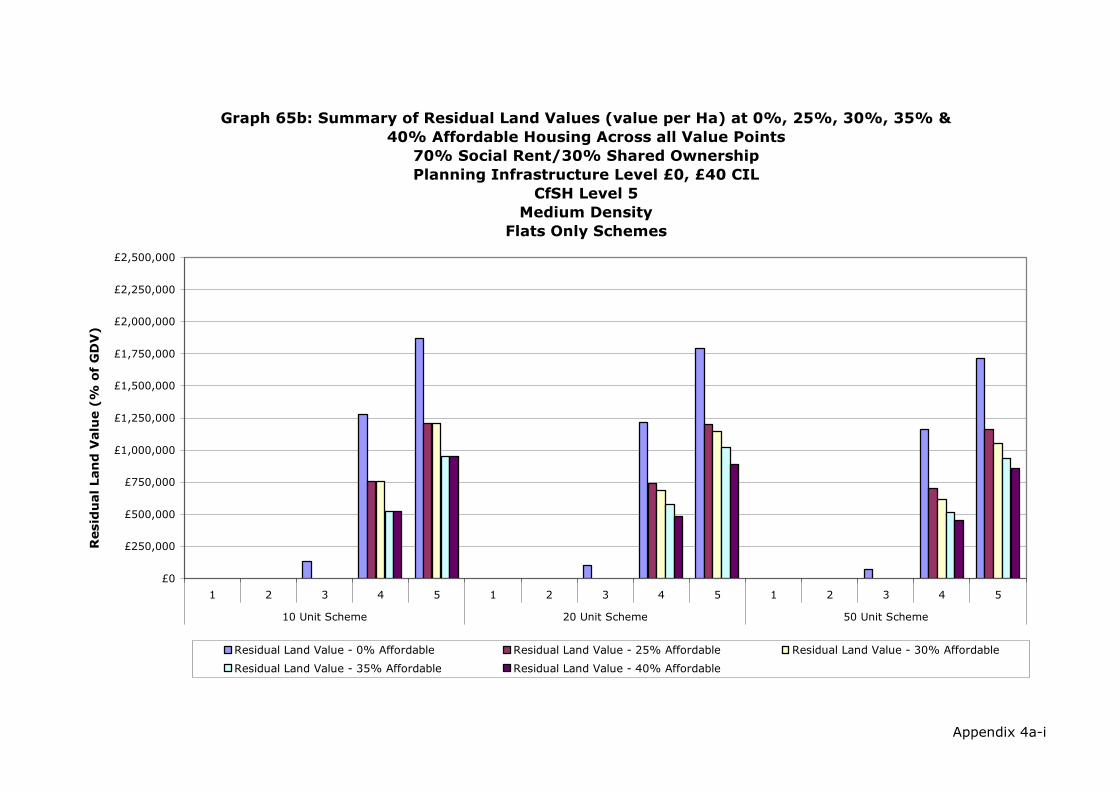
Appendix 4a-i
Graph 65b: Summary of Residual Land Values (value per Ha) at 0%, 25%, 30%, 35% &
40% Affordable Housing Across all Value Points
70% Social Rent/30% Shared Ownership
Planning Infrastructure Level £0, £40 CIL
CfSH Level 5
Medium Density
Flats Only Schemes
£0
£250,000
£500,000
£750,000
£1,000,000
£1,250,000
£1,500,000
£1,750,000
£2,000,000
£2,250,000
£2,500,000
1 2 3 4 5 1 2 3 4 5 1 2 3 4 5
10 Unit Scheme 20 Unit Scheme 50 Unit Scheme
Resid
ual Lan
d V
alu
e (%
o
f G
DV
)
Residual Land Value - 0% Affordable Residual Land Value - 25% Affordable Residual Land Value - 30% Affordable
Residual Land Value - 35% Affordable Residual Land Value - 40% Affordable

Development Scenario /
Threshold Value Point
Residual Land
Value - 0%
Affordable
Residual Land
Value - 25%
Affordable
Residual Land
Value - 30%
Affordable
Residual Land
Value - 35%
Affordable
Residual Land
Value - 40%
Affordable
1 £0 £0 £0 £0 £0
2 £0 £0 £0 £0 £0
3 £40,794 £0 £0 £0 £0
4 £275,937 £158,845 £158,845 £107,965 £107,965
5 £403,225 £255,984 £255,984 £199,283 £199,283
1 £0 £0 £0 £0 £0
2 £0 £0 £0 £0 £0
3 £67,445 £0 £0 £0 £0
4 £524,831 £313,400 £290,635 £247,094 £197,560
5 £772,596 £511,090 £485,994 £431,339 £371,620
1 £0 £0 £0 £0 £0
2 £0 £0 £0 £0 £0
3 £136,864 £0 £0 £0 £0
4 £1,249,198 £741,497 £648,137 £532,882 £469,144
5 £1,851,163 £1,236,668 £1,121,793 £982,528 £900,702
Source: Adams Integra, August 2012
10 Unit Scheme
20 Unit Scheme
50 Unit Scheme
Table 66: Summary of Residual Land Value (£) Appraisals for
All Value Points
0%, 25%, 30%, 35% and 40% Affordable Housing
70% Social Rent/30% Shared Ownership
Planning Infrastructure Level £0, £40 CIL
Code for Sustainable Homes Level 5
High Density
Flats Only Schemes
Appendix 4a-i

Appendix 4a-i
Graph 66: Summary of Residual Land Values at 0%, 25%, 30%, 35% & 40%
Affordable Housing Across All Value Points
70% Social Rent/30% Shared Ownership
Planning Infrastructure Level £0, £40 CIL
CfSH Level 5
High Density
Flats Only Schemes
£0
£250,000
£500,000
£750,000
£1,000,000
£1,250,000
£1,500,000
£1,750,000
£2,000,000
£2,250,000
£2,500,000
1 2 3 4 5 1 2 3 4 5 1 2 3 4 5
10 Unit Scheme 20 Unit Scheme 50 Unit Scheme
Resid
ual Lan
d V
alu
e (£
)
Residual Land Value - 0% Affordable Residual Land Value - 25% Affordable Residual Land Value - 30% Affordable
Residual Land Value - 35% Affordable Residual Land Value - 40% Affordable

Development Scenario /
Threshold Value Point
Residual Land
Value - 0%
Affordable
Residual Land
Value - 25%
Affordable
Residual Land
Value - 30%
Affordable
Residual Land
Value - 35%
Affordable
Residual Land
Value - 40%
Affordable
1 0.0% 0.0% 0.0% 0.0% 0.0%
2 0.0% 0.0% 0.0% 0.0% 0.0%
3 3.1% 0.0% 0.0% 0.0% 0.0%
4 16.6% 11.1% 11.1% 8.0% 8.0%
5 21.8% 16.1% 16.1% 13.4% 13.4%
1 0.0% 0.0% 0.0% 0.0% 0.0%
2 0.0% 0.0% 0.0% 0.0% 0.0%
3 2.6% 0.0% 0.0% 0.0% 0.0%
4 15.8% 10.7% 10.1% 8.9% 7.3%
5 20.9% 15.8% 15.3% 14.1% 12.5%
1 0.0% 0.0% 0.0% 0.0% 0.0%
2 0.0% 0.0% 0.0% 0.0% 0.0%
3 2.1% 0.0% 0.0% 0.0% 0.0%
4 15.1% 10.1% 9.1% 7.7% 6.9%
5 20.0% 15.3% 14.2% 12.9% 12.1%
Source: Adams Integra, August 2012
10 Unit Scheme
20 Unit Scheme
50 Unit Scheme
Table 66a: Summary of Residual Land Value (as % of GDV) Appraisals for
All Value Points
0%, 25%, 30%, 35% and 40% Affordable Housing
70% Social Rent/30% Shared Ownership
Planning Infrastructure Level £0, £40 CIL
Code for Sustainable Homes Level 5
High Density
Flats Only Schemes
Appendix 4a-i

Appendix 4a-i
Graph 66a: Summary of Residual Land Values (as % of GDV) at 0%, 25%, 30%, 35% &
40% Affordable Housing Across all Value Points
70% Social Rent/30% Shared Ownership
Planning Infrastructure Level £0, £40 CIL
CfSH Level 5
High Density
Flats Only Schemes
0.0%
5.0%
10.0%
15.0%
20.0%
25.0%
30.0%
35.0%
40.0%
1 2 3 4 5 1 2 3 4 5 1 2 3 4 5
10 Unit Scheme 20 Unit Scheme 50 Unit Scheme
Resid
ual Lan
d V
alu
e (%
o
f G
DV
)
Residual Land Value - 0% Affordable Residual Land Value - 25% Affordable Residual Land Value - 30% Affordable
Residual Land Value - 35% Affordable Residual Land Value - 40% Affordable