Embed Size (px)
Citation preview
Discussion Papers
The Impact of Introducing an Interest BarrierEvidence from the German Corporation Tax Reform 2008
Hermann Buslei and Martin Simmler
1215
Deutsches Institut für Wirtschaftsforschung 2012

Opinions expressed in this paper are those of the author(s) and do not necessarily reflect views of the institute. IMPRESSUM © DIW Berlin, 2012 DIW Berlin German Institute for Economic Research Mohrenstr. 58 10117 Berlin Tel. +49 (30) 897 89-0 Fax +49 (30) 897 89-200 http://www.diw.de ISSN print edition 1433-0210 ISSN electronic edition 1619-4535 Papers can be downloaded free of charge from the DIW Berlin website: http://www.diw.de/discussionpapers Discussion Papers of DIW Berlin are indexed in RePEc and SSRN: http://ideas.repec.org/s/diw/diwwpp.html http://www.ssrn.com/link/DIW-Berlin-German-Inst-Econ-Res.html
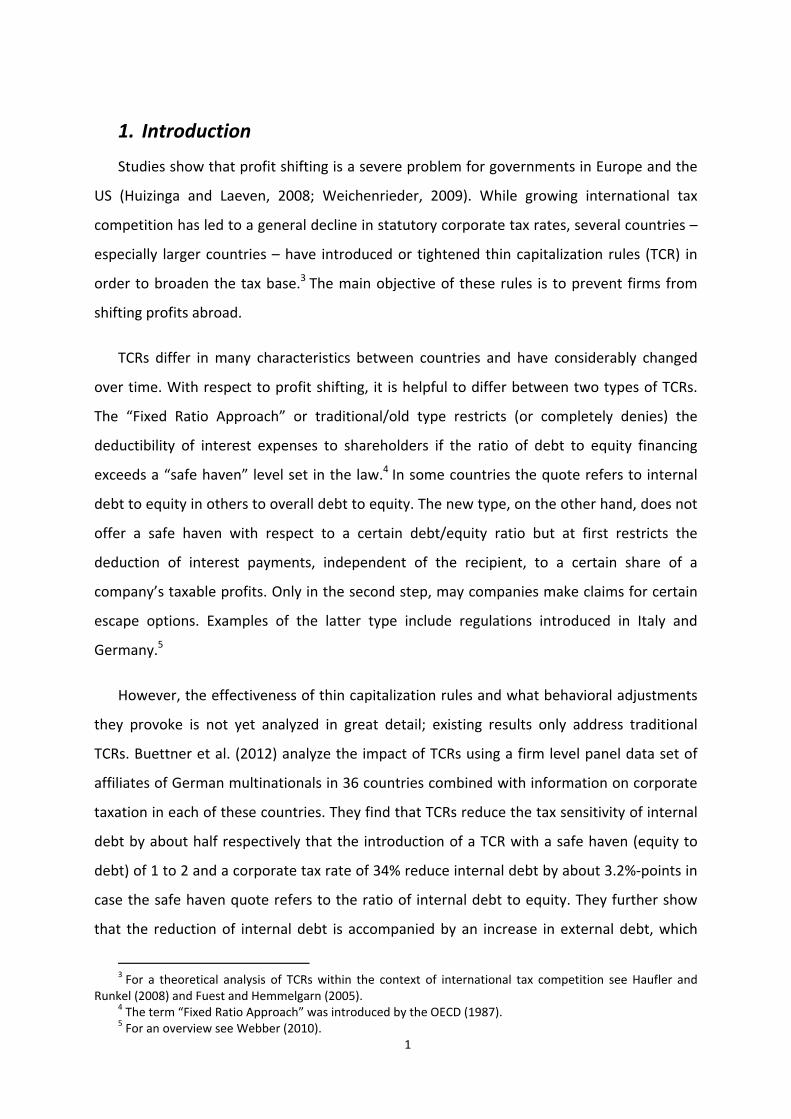
The impact of introducing an interest barrier ‐ Evidence from the German corporation tax reform 20081
Hermann Buslei DIW Berlin
Martin Simmler2 DIW Berlin
June 11, 2012
Abstract: In this study we investigate the impact of the thin capitalization rule (TCR),
introduced in Germany in 2008, on firms’ capital structure, investment and profitability. The
identification of the causal effects is based on the escape clauses in the regulation using a
difference‐in‐difference approach. Our results present evidence that firms strongly react in
order to avoid the limited deductibility of interest expenses: They either decrease their debt
ratio or split their assets to use the exemption limit. The latter is especially used by firms
with an interest result around the exemption limit of the interest barrier. In case the debt
ratio is reduced, our results present evidence for a proportional increase of firms’ tax base.
In general, in the short term, no negative investment effects are caused by the TCR. This
suggests that a part of the firms is able to substitute equity for debt at low costs or expects
to be able to circumvent the regulation. However, investment might also be fixed in the
short‐run for example due to long‐lasting contracts.
Keywords: thin capitalization, earnings stripping rule, debt ratio, profitability, investment.
JEL Classification: H25, H26, G32.
1 We thank Frank Fossen, Peter Haan, Luke Haywood, Frank Hechtner, Jochen Hundsdoerfer Adam
Lederer, Viktor Steiner, and the participants at the Economic Policy Seminar at Freie Universität Berlin and the Cluster Workshop at DIW Berlin for valuable comments. All remaining errors are ours.
2 Corresponding author, German Institute for Economic Research (DIW Berlin), 10117 Berlin, Germany, phone: +49 30 89789‐368, fax: +49 30 89789‐114,e‐mail: [email protected]
1
1. Introduction
Studies show that profit shifting is a severe problem for governments in Europe and the
US (Huizinga and Laeven, 2008; Weichenrieder, 2009). While growing international tax
competition has led to a general decline in statutory corporate tax rates, several countries –
especially larger countries – have introduced or tightened thin capitalization rules (TCR) in
order to broaden the tax base.3 The main objective of these rules is to prevent firms from
shifting profits abroad.
TCRs differ in many characteristics between countries and have considerably changed
over time. With respect to profit shifting, it is helpful to differ between two types of TCRs.
The “Fixed Ratio Approach” or traditional/old type restricts (or completely denies) the
deductibility of interest expenses to shareholders if the ratio of debt to equity financing
exceeds a “safe haven” level set in the law.4 In some countries the quote refers to internal
debt to equity in others to overall debt to equity. The new type, on the other hand, does not
offer a safe haven with respect to a certain debt/equity ratio but at first restricts the
deduction of interest payments, independent of the recipient, to a certain share of a
company’s taxable profits. Only in the second step, may companies make claims for certain
escape options. Examples of the latter type include regulations introduced in Italy and
Germany.5
However, the effectiveness of thin capitalization rules and what behavioral adjustments
they provoke is not yet analyzed in great detail; existing results only address traditional
TCRs. Buettner et al. (2012) analyze the impact of TCRs using a firm level panel data set of
affiliates of German multinationals in 36 countries combined with information on corporate
taxation in each of these countries. They find that TCRs reduce the tax sensitivity of internal
debt by about half respectively that the introduction of a TCR with a safe haven (equity to
debt) of 1 to 2 and a corporate tax rate of 34% reduce internal debt by about 3.2%‐points in
case the safe haven quote refers to the ratio of internal debt to equity. They further show
that the reduction of internal debt is accompanied by an increase in external debt, which
3 For a theoretical analysis of TCRs within the context of international tax competition see Haufler and
Runkel (2008) and Fuest and Hemmelgarn (2005). 4 The term “Fixed Ratio Approach” was introduced by the OECD (1987). 5 For an overview see Webber (2010).
2
indicates a substitution between both types of debt. In case the safe haven quote applies to
overall debt to equity, the reduction in internal debt is stronger. The substitution effect
however is still observed.
Using different data, Overesch and Wamser (2010) and Wamser (2008) confirm the
result of Buettner et al. (2012). Overesch and Wamser (2010) show that the German TCR
reduced internal borrowing in the period 1996 to 2004 significantly. Wamser (2008),
however, reports in his study that the reduction of internal borrowing was accompanied by
an increase in external debt. 6 Weichenrieder and Windischbauer (2008) add to the
aforementioned studies by presenting evidence that investment was not negatively affected
by the tightening of the German TCR in 2001. They explain, inter alia, this result with the
observation that firms worked around the legislation by setting up holding entities, for which
less strict safe haven ratio applied (for instance 1:9 instead of 1:3 in the regulations up to
2000). However, they also show that the usage of holding structure seems to follow a
general time trend and thus were only partially driven by the introduction of the TCR.
None of these studies consider the impact of TCRs on the tax base. Thus, it is unclear
whether TCRs of the old type as the TCR in Germany, which was effective until 2007 and was
based on a debt to equity ratio, broadened the tax base or not. Given the partial substitution
between internal and external debt, as mentioned above, one would expect it to not
broaden the base. The new TCR, introduced in Germany in 2008, intends to avoid the
shortcomings of the old regulation. These were, on the one hand, that firms substituted
external for internal debt and, on the other hand, that it was hard to distinguish between
shareholders and third parties as creditors in complex group structures. Both disadvantages
are due to the design of the old type TCRs, where only payments to shareholders were
considered.7 Under the new regime in Germany, a broader concept is applied. Interest
expenses (independent of the creditor) are now only fully deductible if the net interest
expenses do not exceed 30% of EBITDA, adjusted for tax purposes. Therefore, in contrast to
the old regulation, all firms in Germany are potentially affected by the limited interest
6 The study of Wamser (2008) is based on data for affiliates of foreign corporations in Germany and uses
the 2001 reform of the German thin capitalization rule as a quasi‐natural experiment. 7 Whether TCRs of the traditional type in other countries are similarly ineffective as in Germany cannot
easily be assessed. This depends among other things on information duties of companies against the tax authorities. However, as Italy made reforms similar to those of Germany, the disadvantages of the old regulation seem to also worry other governments.
3
deductibility. However, as the German government was not interested in harming its own
economy by implementing this broad concept of a TCR, it includes several escape clauses as
well. The most important one for the majority of firms is the tax exemption limit for the net
interest expenses of 1 million euro.8 This is one of the escape clauses that we base the
identification strategy on in this paper in order to analyze our research questions.
The questions we study in this paper are: (1) Do firms adjust their capital structure to
avoid the application of the TCR? In this regard, we focus in particular on whether firms
exploit the exemption limit of the interest barrier by splitting up firms assets to avoid the
application of the TCR without changing the debt ratio. This was discussed prior to the
reform as one possible option and has, to the best of our knowledge, not yet been analyzed.
(2) Does firms’ profitability in Germany increase due to the TCR? We examine explicitly the
impact of the TCR on firms’ profitability to fill the gap present in prior studies. Although one
would expect that profitability increases if the debt ratio is reduced, the relation need not be
proportional as firms might find other ways to shift profits abroad, for instance via transfer
prices. (3) What is the impact of the TCR on investment?9
Methodically, we apply a difference‐in‐difference approach (DiD) to identify the causal
effect of the TCR. As in prior studies, we exploit the panel structure of our data to account
for firm specific effects. Compared to other applications of DiD, the treatment in this study is
the threat that the TCR will apply in case the firms’ ratio of interest expenses to taxable
profit remains unchanged.10 We rely on the threat of the TCR application instead of its
application, since avoidance of TCR is advantageous for almost every firm. 11 Basing the study
on the actual application of the interest barrier would provide misleading results because
the application already depends on firms’ reaction. Our treatment group thus consists of
8 The threshold of 1 million euro was increased by the Peoples' Relief Act (Bürgerentlastungsgesetz)
(temporarily) and the Growth‐Enhancement Act (Wachstumsbeschleunigungsgesetz) (permanently) in 2009 to 3 million euro. However this was after December 31, 2008.
9 In our empirical analysis we capture the short‐term changes in tax base and investment. In the medium‐ and long‐term, investment may have a major impact on the tax base.
10 With the application of the TCR we mean that without an appropriate adjustment the firm faces a higher tax burden due to non‐deductible interest expenses.
11 Firms will avoid the application of the TCR as the additional tax burden, which arises due to the application of the TCR, is always greater than, or under best circumstances equal to, the additional tax burden, which arises from a reduction of the debt ratio. In principle three cases of firms have to be distinguished. One is a profit shifting firm, one a firm with excessive bank finance and the last one, is a firm which is financed by a German shareholder. The basic argument for all three groups is that the TCR leads to pure double taxation of interest expenses. See section 3.
4
firms for which the TCR would apply if they did not change their net interest expenses. Firms
in our control group are, in contrast, independent of their own decisions, not affected by the
TCR as they either have interest expenses below the interest exemption threshold or
because they are entitled to another escape clause.12 To determine whether the TCR would
apply to a firm, if its interest expenses remained unchanged, we use firm characteristics
before the announcement of the new TCR. The reactions that we analyze by comparing
treatment and control group over time are the behavioral responses (adjustment of
debt/equity financing or splitting up firms’ assets) that avoid the application of the TCR and
their related effects on investment and the tax base.
For our analysis we use financial statements data for all incorporated German firms from
the firm data base DAFNE, provided by Bureau von Dijk, to form two subsamples. The first
sample includes only firms with a net interest result near the exemption threshold of 1
million euro. For these firms, the “equity escape clause”, which we cannot model, is of minor
importance. In the second sample we include all firms that are affected by the TCR. This
allows us to draw more general conclusions about the effectiveness of the whole regulation.
Our results suggest that firms strongly react to the new regulation. In order to avoid the
limited deductibility of interest expenses, they either decrease their debt ratio or split up
their assets to use the exemption threshold. The latter however seems to be an option only
for firms near the threshold, at least in the short‐term. In general no negative investment
effects are found. This suggests that a part of the firms is able to substitute equity for debt at
low costs or expects to be able to circumvent the regulation. However, investment might
also be fixed in the short‐term, for example, due to long‐lasting contracts.
Moreover, our analysis points out that the newly introduced TCR is quite successful at
broadening the tax base in the short‐term. These results hold in principle for both samples,
however, these are much stronger for the sample with firms around the threshold, which is
due to the fact that we cannot model the “equity escape clause”, which exempts group
members with a debt ratio below the group average; an approach that seems to be used
especially by large companies.
12 The escape clauses are described in detail in Section 2. These are the stand‐alone, EBITDA and equity
escape clauses. Further, we analyze whether firms avoid the application of the TCR by splitting up their assets to exploit the exemption limit.
5
The outline of the paper is as follows. In the next section we provide a summary of the
new TCR in Germany and the timing of the reform law. Section three describes the empirical
methodology. The following section presents our dataset. Results are reported and
discussed in section five, and section six concludes.
2. Institutional Background
In 2008 Germany introduced a new interest barrier that is, in principle, more restrictive
than the old regulation. Anecdotal evidence and the results of empirical studies (especially
Huizinga and Laeven, 2008) had convinced German politicians that profit shifting by
multinationals was considerable and that it came, to a large extent, at the expense of
Germany. Before the reform in 2008, interest payments were generally deductible from total
revenues as regular expenses.13 The major exception from this rule was made for interest
payments on loans provided by substantially participating shareholders of limited liability
companies (share > 25%, article 8a German Corporate Tax Code in the year 2007).14 The rule
extended to related persons and non‐related persons with a right to recall. An exemption
limit of 0.25 million euro was granted. Interest payments could be fully deducted if the debt
to equity ratio was equal to, or remained below, 1.5 (safe haven). Obviously, the
government did not regard the old regulation as effective in preventing companies from
shifting profits to lower taxing countries (see Rödder and Stangl, 2007, p. 479, Deutscher
Bundestag, 2007, p. 29). The main cause for the ineffectiveness of the former regulation
might have been the problem of differentiating between financing of owners and third
parties in cases where a relationship between them was suspected but not proved (Thiel,
2007).
The new interest barrier was part of a major tax reform in 2008 and was an important
element of this reform. For the empirical investigation that follows, the timing of the
decision process is important and can be summarized as follows: In the coalition contract
signed by the so called large coalition of Christian Democrats and Social Democrats on
13 The first specific TCR was enacted in Germany in 1994, with quite generous debt/equity ratios and
applied to foreign shareholders. The first reform in the year 2001 brought less generous ratios. A second reform in the year 2004 extended the TCR to all shareholders. For the regulations introduced in 2004 see Körner (2004).
14 These interest payments were regarded as masked (covered) profit transfers and were re‐categorized into dividends and taxed respectively.
6
November 11, 2005, the coalition partners announced a major corporation tax reform. The
cornerstones of the reform ("Unternehmensteuerreform 2008") were fixed in summer
2006.15 First details concerning the deductibility of interest payments were included in a
report of a working group of the federal government and the Länder early in November
2006. A first draft bill for this reform was presented by the German government on February
5, 2007 (see Rödder and Stangl, 2007, p. 479). The law passed the last stage of the legislation
process (Bundesrat) on July 6, 2007 and was published on August 14, 2007. The parts
relevant for this study were enacted at the beginning of the year 2008.16
The new interest barrier is, in several ways, more restrictive than the regulations that
preceded it. It takes into account interest payments from all types of creditors and applies to
all types of companies. The basic rule of the new regulation states that interest payments
are deductible as long as they are balanced by interest income or, in case interest payments
exceed firms’ interest income, as long as the exceeding payments are less or equal to 30% of
earnings before interest, taxes, depreciation and amortization (EBITDA), adjusted for tax
purposes (see Art. 4h German Income Tax Code). The new regulation applies to the
corporate income, the local business, and to the income tax as well. Interest payments that
are not deductible in one year may be carried forward indefinitely and ‐ given sufficiently
high levels of EBITDA in later years ‐ may then be deducted.17 A carry‐forward of unused
EBITDA was not included in the initial regulation.18
15 http://archiv.bundesregierung.de/Content/DE/Archiv16/Artikel/2006/07/2006‐07‐12‐eckpunkte‐der‐
unternehmenssteuerreform‐verabschiedet.html 16 The probably most important change of the reform was the reduction in the tax rate of the corporation
tax from 25 to 15%. Gradual changes in the law that is of interest here were included in the Peoples' Relief Act (Bürgerentlastungsgesetz) and the Growth‐Enhancement Act (Wachstumsbeschleunigungsgesetz). The former passed the Bundesrat on July 10, 2009; the latter on December 18, 2009.
17 Excess interest payments are not re‐categorized into dividends, as was the case with the earlier interest barrier that only applied to affiliates. Thus, for foreign creditors whose interest income is taxable at home, the new legislation leads to a double taxation of the interest payments. As stated in the explanatory statement to accompany the new legislation, foreign creditors should be given an incentive to finance investments in Germany with equity. While paying the tax on the excess interest would be equal to paying the tax on dividends of the same amount in Germany, the corporations would avoid the double taxation in the second case as dividend payments from abroad are usually tax free in the home country of the investor.
18 Probably as a reaction to the criticism during the economic downturn in 2009, the 2010 Growth‐Enhancement Act (Wachstumsbeschleunigungsgesetz) introduced an EBITDA carry forward. As noted above, the basic rule of the interest barrier states that net interest payments up to 30% of current EBITDA are deductible. Under the new legislation, companies with interest payments below 30% of EBITDA in a calendar year are granted an EBITDA carry forward. The amount of the carry forward is equal to the difference between 30% of EBITDA and the net interest payments. The EBITDA carry forward may be used in the five following years and is simply added to the value of current EBITDA (see Rödding, 2009).
7
In order to prevent small firms and firms with a somehow "sufficient" equity financing
from an additional tax burden, the interest barrier comes with several "escape clauses".
Small companies should not face a burden, as the initial code in the year 2008 included a tax
exemption limit (Freigrenze) of 1 million euro. This limit was first increased to 3 million euro
in the 2009 Peoples' Relief Act (Bürgerentlastungsgesetz) for business years that started on
May 25, 2007, the earliest, and ended on January 1, 2010. The Growth‐Enhancement Act
(Wachstumsbeschleunigungsgesetz) suspended the time limitation of the increased tax
exemption limit.
The second escape clause applies to stand‐alone companies. There are two variants of
the stand‐alone escape. The first refers to single companies that do not belong to a group
and do not rely on significant shareholder debt financing (basic stand‐alone, Art. 8a, 2
Corporation Tax Code). The second variant refers to members of consolidated tax groups. If
all members of a group form a single tax group, the whole group is regarded (and treated in
the same way) as a single company. The whole group is thus exempted from the interest
barrier if no harmful financing by owners is present. We refer to this as the tax group stand‐
alone.
The third escape type is provided for members of a group that do not qualify as a tax
group. A group member may deduct all interest payments if the member's equity rate
(equity over total assets) is not lower than the equity rate in the whole group, according to
the consolidated statement of the group including the company under consideration (equity
escape). The initial regulation of the corporation tax reform 2008 included a tolerance level
of 1 percentage point.19 Like the second escape type, also this third type is granted only for
member companies of groups if limits for shareholder debt financing are not violated by any
member in the whole group (Art. 8a, 2 Corporation Tax Code).
Another escape option is directly related to the above mentioned exemption limit. Firms
with interest expenses above the exemption limit may incorporate new subsidiaries and shift
some of their assets over to these new entities. If this is possible, we would expect firms to
do so since in this case the firms and their subsidiaries are not affected by the interest
barrier and can still shift profits and/or have high leverage ratios.
19 This level was raised to 2 percentage points in the 2009 Growth‐Enhancement Act.

8
Due to the 2008/2009 economic downturn, in 2009 the regulation was retroactively
changed. The exemption limit was raised to 3 million euro, initially in a temporary move with
the Peoples' Relief Act in July 2009, then permanently with the Growth‐Enhancement Act of
December 2009. Further, a higher tolerance level for the “equity escape” and an EBITDA
carry forward were introduced in the 2009 Growth Enhancement Act. Since these changes
were not discussed seriously before the beginning of the year 2009, we include only
observations up to the year 2008 in our analysis. In the year 2008 the modifications had no
impact on the financial decisions that determined firms interest result.
3. Methodology
To analyze the causal effects of the TCR on firms' financing and investment decisions and on
their profitability we rely on a difference‐in‐difference approach.20 In a difference‐in‐
difference estimation the effect of a reform is measured by comparing the outcome for a
treatment (which is affected by the reform) with a control group both before and after a
reform.
The usage of the actual application of the TCR as the treatment in order to analyze the TCR’s
effectiveness would, however, be misleading since the TCR has not been created to be
applied but rather to set an incentive to reduce profit shifting and excessive bank financing.
To understand why firms are always better off when avoiding the application of the TCR
three cases have to be distinguished. The first case captures firms which shift profits abroad
to a low tax country. Suppose there are two countries, a high tax (h) and a low tax (l) one.
The tax rates are τh and τl .Further, there exists a firm that operates in both countries and
may either use equity or internal debt to finance its capital stock. Without a TCR, the firm
shifts via internal debt finance (all) profits from the high to the low tax country. The tax rate
for the profits is τl. If a TCR is introduced under these conditions, interest expenses are no
longer deductible such that profits are taxed in both countries. The overall tax rate is thus τl
+ τh. If the firm stops shifting profits and finances all investment with equity, the profits
accrue in the high tax country and are taxed at the rate τh. It is now obvious that only in the
case where τl equals zero, the firm is indifferent between the limited deductibility of interest
expenses due to the TCR and a substitution between equity for debt. If one takes further
20 For a general introduction, see Meyer (1995).
9
into account costs for internal debt financing or a strictly positive tax rate in the low tax
country, a profit‐shifting firm will try to avoid the TCR. The additional tax burden per unit of
profit which is created for these firms amounts to (τh – τl).
The second type of firms, which may be affected by the TCR, are those with excessive bank
financing. Suppose such a firm is financed half with debt and half with equity. The rate of
return amounts for both to 10%, the tax rate on profits to 50%. Without the application of
the TCR, the after tax rate of return of equity amounts to 5%. If the TCR is applied the rate of
return is reduced to 0% since interest expenses are no longer deductible. In case the firm
substitutes its debt with equity, the rate of return on equity, however, is still 5%. Thus, only
in the case where the rate of return on debt amounts to 0%, would the firm be indifferent
between the limited deductibility of interest expenses due to the TCR and a reduction of the
debt ratio. Therefore, also for firms with excessive bank financing it is always beneficial to
reduce its interest expenses. The additional tax burden that the TCR causes is zero if debt
and equity are equally taxed, and positive if equity faces a higher tax rate than debt, which is
the case in Germany.21
The last case to consider is shareholder debt financing of firms with a shareholder liable to
the German income tax. Before the TCR, the income tax rate on interest income on the
shareholder loan was 47.5%, assuming that the shareholder faces the highest income
bracket tax rate.22 No profits have been taxed at the company level. In case profits are
distributed the tax rate amounts to 48.4%.23 Thus, the shareholder is almost indifferent
between interest income and distributed profits. However, if the TCR applies, then the tax
rate on interest income increases by the tax rate on profits (around 30%) and is, therefore,
always higher than the tax rate on distributed profits.
Thus, for almost every firm it is beneficial to avoid the application of the TCR. This implies
that the effectiveness of the TCR can only be evaluated by the behavioral responses that the
21 Due to the introduction of the flat tax on interest income in 2009, the tax rate on interest income
amounts to 26.4% and is much smaller than for dividends (distributed profits from incorporate business), which amounts to 48.3%. The tax rate on distributed profits is the sum of the corporate income tax (including solidarity surcharge) and the local business tax (15.8% + 14% = 29.8%) plus a flat tax on shareholder level amounting to 26.4%. Thus, the overall tax burden amounts to 48.3% (29.8% + (100% – 29.8%)*26.4%).
22 Tax rate include the solidarity surcharge of 5.5%. The flat tax on interest income does not apply as the shareholder holds more than 10% of the equity of the firm (Art 32d, I Income tax code).
23 See footnote 20.

10
regulation causes. Thus, we use the threat that the regulation will be applied as the
treatment in this study.
To apply a valid difference‐in‐difference design, with the treatment defined above, two
important requirements have to be fulfilled. Firstly, the treatment and control groups should
exhibit the same trend in the absence of the treatment. In other words, it is required that
there are no other confounding treatments. Since there is no formal proof, we show in the
data section exemplarily for the debt ratio that treatment and control group followed a
common trend until the new TCR was announced. Further, although there have been other
changes (reduction of the corporate tax rate, changes in the adding‐back regulation for the
local trade tax) due to the corporate tax reform in 2008, we do not know of any regulation
that treated firms differently with respect to marginal incentives beyond the TCR.24
The second assumption, on which the DiD approach is based, states that the treatment has
to be exogenous, meaning that no selection into treatment and control group is possible.
This we ensure due to the formation of the treatment and control group. We come back to
this.
Given our data, we are, in principle, in the position to identify those firms in our sample
that are entitled to use any of the above outlined escape clauses.25 The only escape clause
we cannot model is the equity escape clause. To account for this regulation, the entire group
structure must be known, which is not possible as we only have data for German firms. In
order to account for this shortcoming and still be able to draw conclusions for the whole
regulation, we form two samples. In the first sample we only include firms for which the
equity escape should be of minor relevance. These are firms with interest expenses near the
exemption limit. Since the equity escape is quite complex and might result in changes in the
24 When assuming that both marginal and average incentives matter, our estimated treatment effect
might, in addition to the reaction to the TCR, also capture the effect that the control group probably benefits more from the 100,000 euro allowance, which was introduced for adding back certain parts of finance expenses, i.e. interest payments, at a rate of 25%. The control firms we look at in our baseline specification have interest expenses above 500,000 euro, thus the additional burden due to adding‐back certain finance expenses is 4/5 times 0.25 times the tax rate, which is around 14%, depending on the community. For treated firms with interest expenses of 1.2 million euro, the additional burden is 11/12 times 0.25 times the tax rate. Compared to before the reform, the incentive to reduce debt is therefore larger for the treated firms. The difference in the tax burden between the two firms is only 0.4%, thus the bias of estimated effects should be rather small.
25 With the restriction that we are not able to control for harmful shareholder financing, thus small uncertainties remain.
11
group structure, which are costly, we believe that for these firms the reduction of the debt
ratio is their first choice to avoid TCR application. On the other hand, in the second sample
we include all firms that are affected by the TCR in the treatment group in order to draw
conclusions about the general impact of the new regulation. Due to the fact that we cannot
model the equity escape clause, we probably underestimate the impact of the interest
barrier on those firms with an interest result above the exemption limit and for whom the
equity escape clause is not suitable.
Further, since modeling the entitlement to the EBITDA escape clause involves a high
degree of uncertainty, as we rely on financial statements, due to missing information on the
necessary tax adjustments of the EBITDA, we start by considering only the basic stand‐alone
and the tax group stand‐alone, presenting in the robustness section the results of the
regression in which we control for the entitlement to the EBITDA escape.26
The treatment in this study is whether a firm will be affected by the TCR if interest
expenses remain unchanged. Thus, the effect we estimate is a behavioral response to avoid
the application of the TCR by reducing the debt ratio or be splitting up firms assets such that
the absolute amount of interest expenses is reduced.27
In our first sample, we focus on firms for which the equity escape clause is of minor
importance. We assume that these are firms with interest expenses within a range of 0.5
million euro above and below the threshold. For the firms above the threshold it is very
likely that their option of first choice is to reduce their debt ratio.28 This choice warrants as
well that a common trend for treatment and control group can be reasonably assumed. To
ensure exogenous treatment, we use firms' 2006 characteristics to form treatment and
26 Before we decided on the definition of the treatment and control in our analysis, we estimated a
heterogeneous treatment specification. In this estimation, we checked whether firms for whom the TCR applied, but were also applicable to a specific escape clause, behaved differently from firms that were not able to use the escape clause. Firms who were applicable to the EBITDA escape did not behave differently (see section 5.3).
27 In principle, since net interest expenses are the relevant criterion, firms might also try to increase their interest income by reclassifying other income flows as interest income. However, we believe that this is only an option for a small number of firms and thus do not consider this behavioral reaction in the following.
28 In a robustness check we changed these limits; the results did not alter and thus are not sensitive to these specific limits.
12
control group, since, at the time, the changes in the TCR were not yet even proposed.29 To
avoid misclassification at the threshold and to ensure that firms in the control group are not
affected by the TCR,30 we exclude firms with net interest expenses between 0.8 and 1.2
million euro. Besides classifying treatment and control group based on the exemption
threshold, we account for the entitlement to the basic stand‐alone and the tax group stand‐
alone. Thus, the control group in our first sample consists of firms with net interest expenses
in 2006 between 0.5 and 0.8 million euro or of firms with net interest expenses between 1.2
and 1.5 million euro that are entitled to either basic stand‐alone or tax group stand‐alone.
Our treatment group covers the remaining firms that have net expenses between 1.2 and
1.5 million euro, but are not entitled to either of the two escape clauses.
In the second sample, we include all firms with net interest payments above 1 million
euro. We increase the number of observations in the control group as well by reducing the
lower limit from 0.5 to 0.2 million euro, such that the ratio of the number of firms in the
treatment and the control group remained unchanged (around 10%). As before, firms with
net interest expenses between 0.8 and 1.2 million euro are excluded. Our treatment group
thus consists of firms with net interest expenses above 1.2 million euro and that are not
entitled to either the basic or tax group stand‐alone. Firms that are entitled to one of the
clauses or exhibit interest expenses between 0.2 and 0.8 million euro form the control group
in the second sample.
Since firms can be assumed to be forward looking, we exclude from both samples all
2007 observations, as during this year firms probably started adjusting their debt ratio in
order to avoid the limited deductibility of interest expenses (see the graphical analysis in
section 4).
To analyze the impact of the new interest barrier on firm debt ratios, on profitability and
on firm investments, we use a difference‐in‐difference specification. The equation we
estimate is shown exemplarily for the debt ratio as dependent variable in equation (1). Const
is a constant, μ(i) is a firm specific effect, and Treatment is a dummy that is one for the
29 See Section 2. The proposal made by a working group of the federal government and the Länder in
November 2006 formed the basis for the draft bill. At that time, it could not be expected that the proposal would remain unchanged during the legislative procedure.
30 A firm with a net interest result of 0.95 million euro would, for example, be treated by the TCR if it invests 100,000 euro and finances the investment with new debt.
13
treated firms. These are firms for which the TCR would apply if they cannot use an escape
clause or do not reduce their net interest expenses sufficiently. After is a dummy which is
one for years after the 2007. is an iid error term. All other factors that affect the debt ratio
are summarized into X (i,t). These variables are, in our study, for the debt ratio as dependent
variable in addition to the tax rate on business income firm size, firm age, firms’ share of
tangible assets and the ratio of EBITDA to total assets. The construction of the variables is
described in section 4. Whereas Treatment captures differences between treatment and
control group with respect to the debt ratio, After captures the time difference for the debt
ratio between before and after the reform. The effect we are interested in is given by ,
which sums up the different development of the debt ratio for the firms that are affected by
the TCR.
, , , , ,
, , (1)
To avoid biased results due to firm specific effects, we estimate equation (1) in
differences between 2008 and 2006. The equation we estimate is given by (2). The
dependent variable is now the change in the debt ratio between 2008 and 2006.
Noteworthy, since we estimate in differences and construct the two groups based on the
firm characteristics in 2006, we do not have to control for time constant differences
between the treatment and control group.
∆ ∆ ∆ ∗ ∆ ∆ (2)
To analyze whether firms have split up their assets in order to avoid the interest barrier,
we rely on a slightly different estimation design. In case a firm splits up, we expect that the
number of subsidiaries increases more compared to firms that do not split up. Thus, in case
firms split up their assets to avoid the application of the TCR, we would expect that their
behavioral responses with respect to the debt ratio and the profitability are less strong.
Their capital stock, however, should decrease more compared to treated firms, which do not
split up. Since the number of additional subsidiaries may vary for different industries, we
construct a binary variable that is one if the number of subsidiaries increases between 2006
and 2008. To account for different trends in the debt ratio of firms where the number of
subsidiaries increases, we include the dummy indicating whether the number of subsidiaries

14
increased or not itself in the estimation equation ( ∆ ). Further, to analyze the
effect of interest, we include the interaction term between this dummy and the
∆(Treatment * After) variable. The coefficient of this variable captures how the debt ratio
has changed for these firms. The equation we estimate is given in (3).
∆ ∆ ∆ ∗ ∆ ∆ ∗
∆ ∗ ∗ ∆ ∗ ∆ ∆ (3)
To analyze of the impact of the interest barrier on investment and on the tax base of
firms, we use the same econometric approaches as described above. For both dependent
variables we use the same control variables, except the EBITDA to total assets. In the
specification for investment, we additionally include the change in the turnover. The
construction of the variables follows in the next section, where we also describe the data set
on which our study is based.
4. Data
The database for our study is the financial statements collection DAFNE provided for
German firms by Bureau van Dijk. The main source for this data base is the registrar of
companies in Germany. The dataset contains individual balance sheets, profit and loss
accounts, and information on ownership structures. For years after 2005 the database
covers nearly all incorporated firms in Germany, as for these firms strict publication
requirements apply.31 For unincorporated business the database is only representative for
limited partnerships with a limited liability company as general partner (GmbH & Co. KG).
However, as we are interested in firms with net interest expenses above 0.2 million euro and
probably only few partnerships with unlimited liability have interest payments above this
amount, the insufficient representation of these firms in our database should not have a
severe impact on the results of our empirical analysis.
From the description of the rules of the interest barrier given above, it is obvious that the
information on the net interest result is crucial for the analysis. The net interest result can
31 In principle all German incorporated companies have to publish their financial statements according to
Art. 325 of the Commercial Code, only subsidiaries that meet special requirements (see Art. 264 III Commercial Code) are not obliged to do so. To the best of our knowledge only a few thousand companies, out of nearly a million incorporated businesses, fulfill these requirements.

15
generally be calculated based on the information in DAFNE, however the relevant
information is directly observed only for a subsample of the data. The reason is that the
disclosure rules are less strict for the income statement than for the balance sheet. Small
companies are not legally required to publish their income statement at all.32 In the DAFNE
wave that we use for our empirical study (wave January 2012), we observe in total around
870,000 (940,000) companies with valid balance sheet information available for the year
2006 (2008).33 From these companies, around 100,000 (90,000) also provide an income
statement and thus we directly observe the information on the net interest result. For a
subsample of these we also have information on the ownership structure, which is
important for determining which firms are entitled to use TCR escape clauses. Therefore, for
the basic analysis using the two subsamples outlined above, we only include firms for which
income statements and ownership information are available. However, since the selection of
companies with an income statement and the selection of companies with the necessary
ownership information are probably nonrandom, we extend the analysis such that all firms
are included in a sensitivity analysis (section 5.3).
Noteworthy, for all samples, we exclude financial firms as well as firms within the sectors
of public administration and defense, education, health and social work, other community
activities, as well as firms with negative equity. The number of observations in sample 1 (2)
amounts to 767 (4,591), of which 174 (1,075) exhibit net interest expenses above 1.2 million
euro. Of these, 98 (493) are either entitled to the basic stand‐alone or to the tax group
stand‐alone. Thus, 76 (564) observations form our treatment group.
We turn to the construction of variables next. For our first research question the
dependent variable is the change in the debt ratio between 2008 and 2006. We follow the
literature and define the debt ratio as the ratio of liabilities to the book value of total assets.
32 The criteria for size are total assets, sales and number of employees. Small companies fulfill at least two
of the following three conditions: 1. total assets are equal or less than 4.015 million euro, sales are equal or less than 8.030 million euro and the number of employees is equal to or less than 50. A medium sized company does not fulfill at least two of the conditions that determines a small company and does fulfill at least two of the following three conditions: 1. total assets are equal to or less than 16.060 million euro, sales do not exceed 32.120 million euro and the number of employees does not exceed 250. For a large company, at least two of the values for assets, sales and employees must exceed the respective thresholds for a medium sized company. Moreover all companies listed at an organized bond market are considered as large companies. See article 267 of the German commercial code.
33 All numbers refer to companies with non‐consolidated statements. Companies for which only a consolidated statement is available are omitted here and in the empirical analysis.

16
In addition to the interaction term between the dummy indicating treatment and the
dummy indicating the year after the reform, we include the following other determinants as
covariates for the debt ratio as dependent variable: firm size (log of total assets in thousand
euro), log firm age, firms’ share of tangible assets (ratio of tangible assets to book value of
total assets) as well the ratio of EBITDA to the book value of total assets. Further, we include
the tax rate on business income to control for changes due to the German corporate tax
reform in 2008. For incorporated firms the tax rate on business income captures the
corporate income tax and the trade tax.34 For incorporated business the tax rate depends on
the shareholder structure, as these firms divide their income between the shareholders and
pass it through to the shareholders. For non‐natural persons as shareholder, the tax rate
captures the tax rate on corporate income and the trade tax; for natural persons it is the tax
rate on business income plus trade tax.35
To analyze whether the interest barrier broadens the tax base, we use the change in the
profit before taxes, scaled by the book value of total assets between 2008 and 2006. We
refer to this as firms’ profitability. In the estimation, we further control for the following
other determinants of firms’ profitability: log firm age, firm size, firms’ tangibility and the
business tax rate.
For our last research question, the outcome variable is the change of capital stock
between 2008 and 2006, scaled by capital stock in 2006. We refer to this variable as the
investment (quota). As for profitability, we control for the following other determinants: tax
rate on business income, log firm age, log sales (in thousands of euro) and for firms size and
firms tangibility. In an additional specification, we further use firm cash flows to analyze how
investment depends on internal available cash. We define firm cash flows to be the sum of
profits plus depreciation scaled by the capital stock for 2006 and 2007.
34 The business tax rate is the sum of corporate income tax rate (including solidarity surcharge) and local
business tax rate. Before 2008, the tax rate amounted to roughly 40%; after 2008 30%. We obtained the local business tax rates by merging the local business tax rates provided by the Statistical Offices (2004‐2009) to the database using the firms’ postal codes provided in DAFNE.
35 For non‐natural persons see footnote 32. For natural persons the tax rate (income tax rate including solidarity surcharge plus local business tax rate) amounts to 44.6%. See Fossen and Simmler (2012) for further details.

17
The entitlement to basic stand‐alone, tax group stand‐alone and the EBITDA escape
clause were modeled as follows.
Table 1: Firm characteristics 2006 of treatment and control group (Sample 1)
Notes: Statistics are for 2006 except for D(No. Subsidiaries), which is for 2008. Sample 1 includes firms with net interest expenses between 0.5 and 0.8 or between 1.2 and 1.5 million euro. Firms in the treatment group have net interest expenses between 1.2 and 1.5 million euro and are not entitled to the stand‐alone or to the consolidated tax escape clauses. The remaining firms belong to the control group. Source: DAFNE firm database, 2006, own calculations.
Basic Stand‐Alone Clause: In principle a single firm is considered as a stand‐alone firm if it
does not belong to a group and does not rely on significant shareholder debt financing. We
assume that every firm that has a German natural person as global ultimate owner is a
stand‐alone firm. This consideration is based on the fact that given a natural person is the
ultimate owner, the firm may actually stand‐alone or, if this is not the case, the firm is part
of a group which can be tax consolidated. In both cases, the TCR does not apply.
Tax Group Stand‐Alone‐Clause: In case the firm had a profit and loss agreement in place and
the global ultimate owner is a German company, we consider the firm as being a part of a
tax consolidated group and, thus, assume that the TCR does not apply.
EBITDA‐Clause: In case a firm has a ratio of interest expenses to for tax purposes adjusted
EBITDA in 2006 below 30%, the TCR does not apply. We construct the for tax purposes
Full Sample
Control Group
Treatment Group
t-test
Observations 767 691 76
Variable Mean Std dev. Mean Mean p-value
debt ratio 0.65 0.19 0.66 0.61 0.05
investment quota 0.091 0.354 0.095 0.054 0.38
profitability 0.047 0.084 0.050 0.029 0.04
firm age 30.4 30.5 30.8 26.8 0,29
tangibility 0,493 0,290 0,467 0,724 0,00
firm size (thd. €) 51,170 116,961 48,050 79,536 0.03
corporate tax rate 0,396 0,031 0,398 0,385 0,00
Cash flow/total assets 0.44 1.06 0.47 0.21 0.05
D(No. Subsidiaries) 0.18 . 0.18 0.17 0.58
EBITDA escape clause 0.31 . 0.29 0.49 0.00
Industries (shares):
manufacturing 0,34 . 0,36 0,17 0,00
Trade 0,24 . 0,26 0,09 0,00
Services 0,05 . 0,04 0,11 0,00
18
adjusted EBITDA by adding back the depreciation allowance, the net interest result and the
provisions, which are not allowed for tax purposes to the before tax profit.
Since basic stand‐alone and tax group stand‐alone are very similar, we sum them up into
one escape clause, which we name stand‐alone escape.
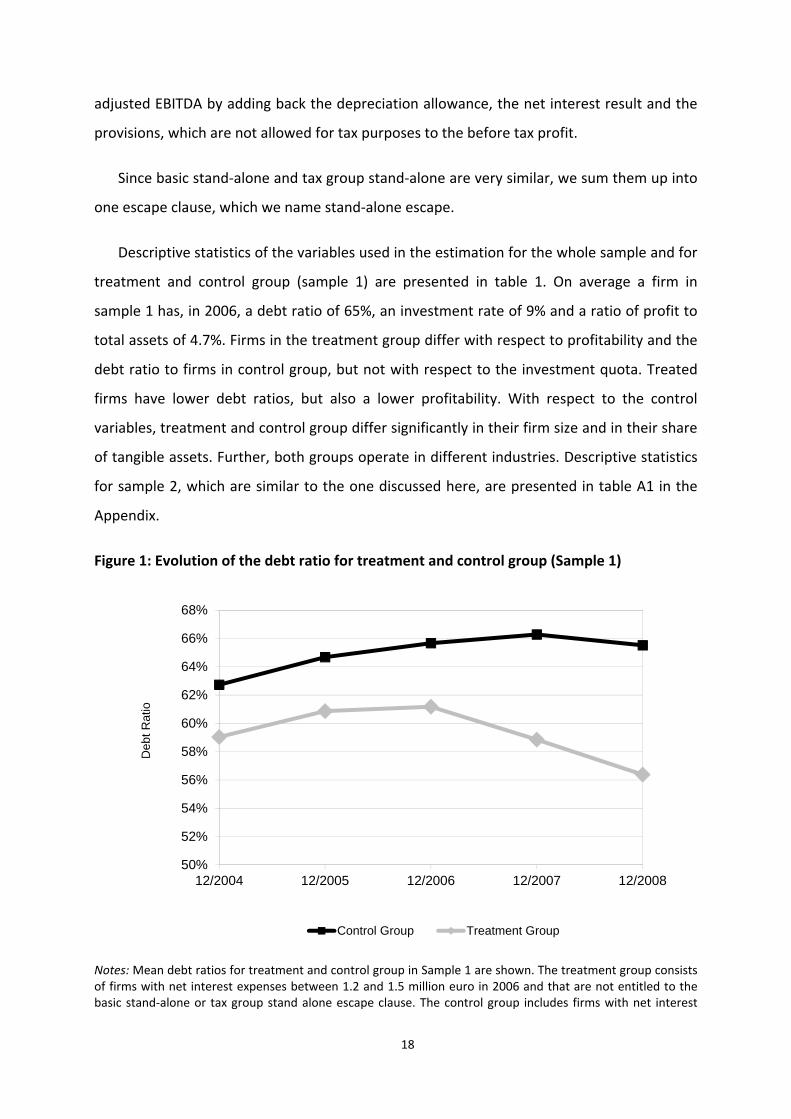
Descriptive statistics of the variables used in the estimation for the whole sample and for
treatment and control group (sample 1) are presented in table 1. On average a firm in
sample 1 has, in 2006, a debt ratio of 65%, an investment rate of 9% and a ratio of profit to
total assets of 4.7%. Firms in the treatment group differ with respect to profitability and the
debt ratio to firms in control group, but not with respect to the investment quota. Treated
firms have lower debt ratios, but also a lower profitability. With respect to the control
variables, treatment and control group differ significantly in their firm size and in their share
of tangible assets. Further, both groups operate in different industries. Descriptive statistics
for sample 2, which are similar to the one discussed here, are presented in table A1 in the
Appendix.
Figure 1: Evolution of the debt ratio for treatment and control group (Sample 1)
Notes: Mean debt ratios for treatment and control group in Sample 1 are shown. The treatment group consists of firms with net interest expenses between 1.2 and 1.5 million euro in 2006 and that are not entitled to the basic stand‐alone or tax group stand alone escape clause. The control group includes firms with net interest
50%
52%
54%
56%
58%
60%
62%
64%
66%
68%
12/2004 12/2005 12/2006 12/2007 12/2008
Deb
t R
atio
Control Group Treatment Group

19
expenses between 0.5 and 0.8 million euro or that are entitled to one of the stand‐alone escape clauses. For further descriptive statistics see table 1, for sample 2 see table A1 in the appendix.
Source: DAFNE firm database, own calculations.
We plot the development of debt ratio for treatment and control group (Figure 1).
Noteworthy, treatment and control group exhibit a similar trend before the TCR was
announced (around 12/2006 in Figure 1).36 Thus, a common trend of treatment and control
in the absence of the treatment seem to be a realistic assumption. Further, the graphical
analysis already shows a strong decline in the debt ratio for treated firms, which can be
attributed to the firms’ behavior to avoid the application of the TCR.
5. Results
We start with presenting our results of the impact of the TCR on firms finance structure,
investment and profitability for the first sample. In this sample only firms with an interest
result around the exemption limit of the interest barrier are included. In the second part, the
results for all firms potentially affected by the TCR follow, while in the last subsection the
sensitivity of the results is examined.
5.1. Results for firms with net interest expenses around the exemption limit
We first present the results for sample 1 without taking into account the possibility that
firms split up their assets. The results for our main specification are reported in table 2. The
dependent variable in equation (1) is the change in the debt ratio between 2008 and 2006;
in (2) the change in the capital stock between 2008 and 2006, scaled by the capital stock in
2006; and in (3) the change in the profitability between 2008 and 2006. In all specifications
we control for the change of the tax rate on business income, of the firm age as well as the
level of firm’s size and share of tangible assets in 2006. We use the levels of the latter two
variables instead of the change as the change might be endogenous. Further, as shown
above (table 1), there are strong differences in the levels of these variables between
treatment and control group. Thus controlling for the difference ensures unbiased
estimates.37 For the debt ratio as dependent variable we additionally include the ratio of
36 For profitability and investment, the figures look very similar. These are not reported, but are available
upon request. 37 We tried two other specifications in order to check the sensitivity of the results. When we use the
change in the firm size and the share of tangible assets instead of the level the coefficients of interest are
20
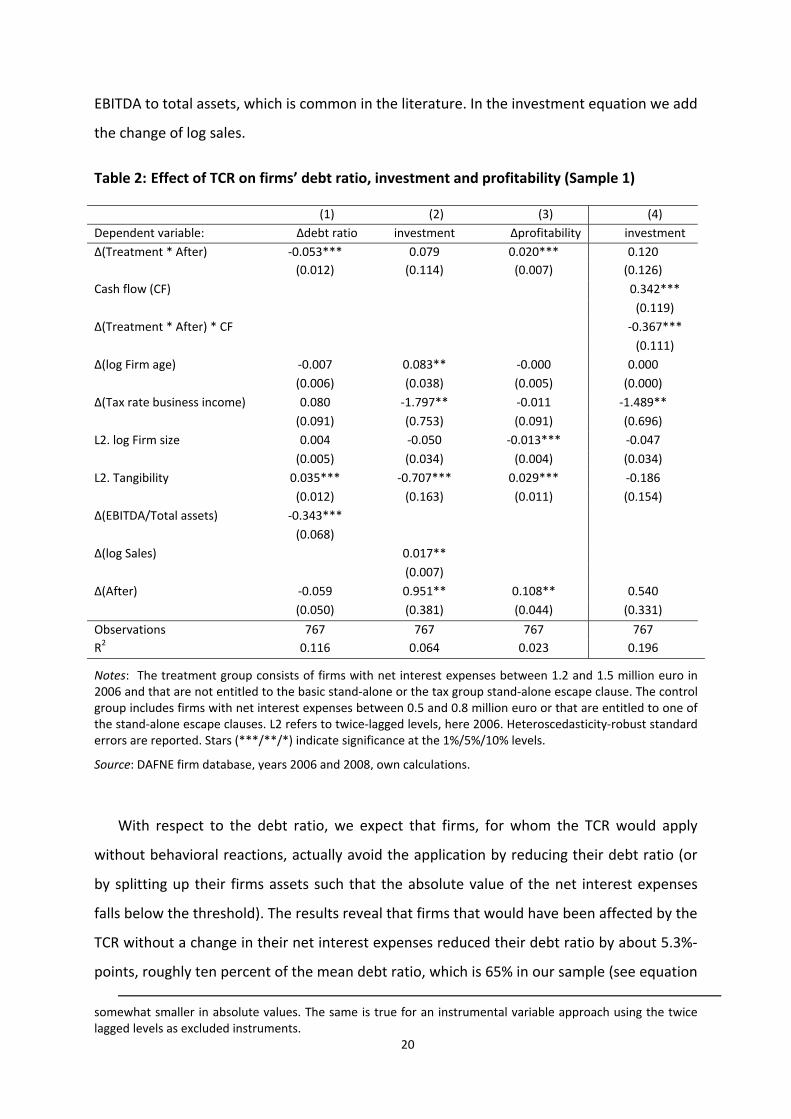
EBITDA to total assets, which is common in the literature. In the investment equation we add
the change of log sales.
Table 2: Effect of TCR on firms’ debt ratio, investment and profitability (Sample 1)
(1) (2) (3) (4)
Dependent variable: ∆debt ratio investment ∆profitability investment
∆(Treatment * After) ‐0.053*** 0.079 0.020*** 0.120
(0.012) (0.114) (0.007) (0.126)
Cash flow (CF) 0.342***
(0.119)
∆(Treatment * After) * CF ‐0.367***
(0.111)
∆(log Firm age) ‐0.007 0.083** ‐0.000 0.000
(0.006) (0.038) (0.005) (0.000)
∆(Tax rate business income) 0.080 ‐1.797** ‐0.011 ‐1.489**
(0.091) (0.753) (0.091) (0.696)
L2. log Firm size 0.004 ‐0.050 ‐0.013*** ‐0.047
(0.005) (0.034) (0.004) (0.034)
L2. Tangibility 0.035*** ‐0.707*** 0.029*** ‐0.186
(0.012) (0.163) (0.011) (0.154)
∆(EBITDA/Total assets) ‐0.343***
(0.068)
∆(log Sales) 0.017**
(0.007)
∆(After) ‐0.059 0.951** 0.108** 0.540
(0.050) (0.381) (0.044) (0.331)
Observations 767 767 767 767
R2 0.116 0.064 0.023 0.196
Notes: The treatment group consists of firms with net interest expenses between 1.2 and 1.5 million euro in 2006 and that are not entitled to the basic stand‐alone or the tax group stand‐alone escape clause. The control group includes firms with net interest expenses between 0.5 and 0.8 million euro or that are entitled to one of the stand‐alone escape clauses. L2 refers to twice‐lagged levels, here 2006. Heteroscedasticity‐robust standard errors are reported. Stars (***/**/*) indicate significance at the 1%/5%/10% levels.
Source: DAFNE firm database, years 2006 and 2008, own calculations.
With respect to the debt ratio, we expect that firms, for whom the TCR would apply
without behavioral reactions, actually avoid the application by reducing their debt ratio (or
by splitting up their firms assets such that the absolute value of the net interest expenses
falls below the threshold). The results reveal that firms that would have been affected by the
TCR without a change in their net interest expenses reduced their debt ratio by about 5.3%‐
points, roughly ten percent of the mean debt ratio, which is 65% in our sample (see equation
somewhat smaller in absolute values. The same is true for an instrumental variable approach using the twice lagged levels as excluded instruments.

21
(1) in table 2). Further analysis shows that internal and external debt is reduced equally by
these firms (table A2 in the Appendix). This is as expected since the new TCR in Germany
does not distinguish between different types of creditors.
The analysis of the change of firm’s tax base is motivated by the literature that finds a
substitution effect between internal and external debt under the old German TCR. Although
this substitution is not very likely to be present under the new regulation, as it does not
distinguish between different types of creditors, the development of equity financing and
the tax base of a firm might differ. Multinational firms could use other ways of reducing their
taxable income, for example transfer pricing. Thus, a decrease in debt does not have to
cause a proportionate increase in the tax base. However, the hypothesis that the TCR
broadens the tax base is clearly supported by our results. Firms for which TCR would have
applied exhibit an increase in their profitability of 2%‐points between 2006 and 2008
(equation (2)). Thus, a reduction in the debt ratio of 1%‐point causes an increase in firms’
profitability by around 0.37%‐points. To put this into perspective, we estimate this
relationship using data for 2005 and 2006. The impact found is somewhat lower (0.3), but
quite comparable. It seems, therefore, that the treated firms neither face severe costs of
increasing their equity nor find other ways to reduce their tax payments, as one would
otherwise expect that firms’ profitability would not have increased as much.
With respect to our last research question, our results (equation (3)) indicate that, at
least in the short‐term, no negative investment effects are caused by the TCR. This suggests
that profit‐shifting firms either cannot change investment in the short‐term and, thus,
negative investment due to the additional tax burden only shows up in the long‐term or that
these firms are able to avoid additional tax payments in the long‐term. A third explanation
might also be that with the reduction of the corporate tax rate from 25% to 15%, only a few
firms are still shifting profits abroad. Which explanation dominates is beyond the scope of
our study, but may be tackled using a longer post‐2008 time period. For firms with excessive
bank financing or shareholder financing, our findings present evidence that these firms do
not face severe costs of adjusting their equity. This could be due to the fact that the TCR
mostly affects large companies that may have sufficient internal cash to finance its own
investments. We check this by estimating equation (4), where we analyze differences in the
cash flow sensitivity of investment for treatment and control group. We expect a lower cash
22
flow sensitivity for the treated firms because, for these firms, internal cash flow does not
matter for their investments as sufficient internal finance is presumably available. The
results support our argument. Investment is only sensitive to internal cash for our control
group. This indicates that, due to the fact that it is mostly large firms that are affected by the
regulation that have sufficient internal cash flow, no negative investment effects for firms
with excessive bank financing or shareholder financing are caused by the TCR.
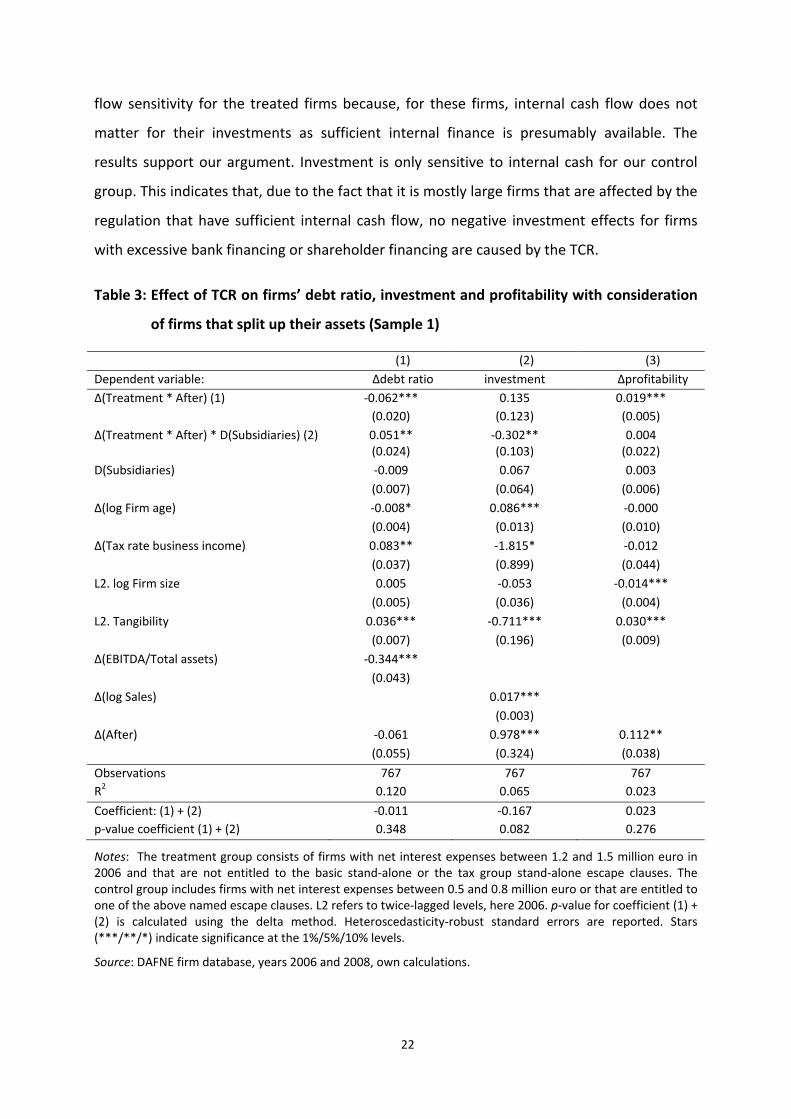
Table 3: Effect of TCR on firms’ debt ratio, investment and profitability with consideration
of firms that split up their assets (Sample 1)
(1) (2) (3)
Dependent variable: ∆debt ratio investment ∆profitability
∆(Treatment * After) (1) ‐0.062*** 0.135 0.019***
(0.020) (0.123) (0.005)
∆(Treatment * After) * D(Subsidiaries) (2) 0.051** ‐0.302** 0.004 (0.024) (0.103) (0.022)
D(Subsidiaries) ‐0.009 0.067 0.003
(0.007) (0.064) (0.006)
∆(log Firm age) ‐0.008* 0.086*** ‐0.000
(0.004) (0.013) (0.010)
∆(Tax rate business income) 0.083** ‐1.815* ‐0.012
(0.037) (0.899) (0.044)
L2. log Firm size 0.005 ‐0.053 ‐0.014***
(0.005) (0.036) (0.004)
L2. Tangibility 0.036*** ‐0.711*** 0.030***
(0.007) (0.196) (0.009)
∆(EBITDA/Total assets) ‐0.344***
(0.043)
∆(log Sales) 0.017***
(0.003)
∆(After) ‐0.061 0.978*** 0.112**
(0.055) (0.324) (0.038)
Observations 767 767 767
R2 0.120 0.065 0.023
Coefficient: (1) + (2) ‐0.011 ‐0.167 0.023
p‐value coefficient (1) + (2) 0.348 0.082 0.276
Notes: The treatment group consists of firms with net interest expenses between 1.2 and 1.5 million euro in 2006 and that are not entitled to the basic stand‐alone or the tax group stand‐alone escape clauses. The control group includes firms with net interest expenses between 0.5 and 0.8 million euro or that are entitled to one of the above named escape clauses. L2 refers to twice‐lagged levels, here 2006. p‐value for coefficient (1) + (2) is calculated using the delta method. Heteroscedasticity‐robust standard errors are reported. Stars (***/**/*) indicate significance at the 1%/5%/10% levels.
Source: DAFNE firm database, years 2006 and 2008, own calculations.

23
We turn now to the question of whether firms exploit the exemption limit of 1 million
euro by splitting up their assets. The treatment effects for firms that split up their assets are
shown at the bottom of table 3. They are equal to the sum of the coefficients for
∆(Treatment * After) and ∆(Treatment * After) * D(No. Subsidiaries). The standard errors are
calculated using the delta method.
First, the results point out that the estimated coefficients in the first specification are
slightly downward biased, since controlling for firms that split up increases the treatment
effect to 6.2%‐points (table 3). In contrast, treated firms that split up their assets did not
decrease their debt ratio. Further, the results of the investment equation show that our
proxy, the change of the number of subsidiaries, works quite well as firms for which the
number of subsidiaries increased reduce their capital stock considerably. However, there are
no negative investment effects in general as the capital stock is only shifted to newly
founded subsidiaries. Further, the results for profitability show that the tax base of firms
that split up their assets did not increase after treatment (last row of the table).
Our results confirm so far those in the studies by Overesch and Wamser (2010) and
Buettner et al. (2012) who find that firms react to TCRs by reducing their (internal) debt. The
analysis shows in line with Weichenrieder and Windischbauer (2008) further that firms use
different strategies to avoid the interest barrier. Firms that have the possibility to split up, do
so with the result that the TCR does not affect their finance behavior compared to firms that
cannot split and reduce their debt ratio by several percentage points. Compared to the old
regulation, where effects on the tax base are questionable since firms substituted internal by
external debt (Wamser, 2008 or Buettner et al, 2012) or used holding structure
(Weichenrieder and Windischbauer, 2008), the new TCR seems, at least in the short‐term,
quite successful at broadening the tax base. In line with Weichenrieder and Windischbauer
(2008), we do not find negative investment effects. For firms that shift profits this might be
explained either by the strong reduction of the corporate tax rate, which took place in the
same year that these firms stopped profit shifting; or by fixed investment in the short‐term
such that the real effects only show up in the long‐term or that these firms will find other
ways to around the TCR in the long‐term. For non‐profit shifting this finding suggests that
firms, which are affected by the TCR, have sufficient internal finance to carry out their
investment projects.
24
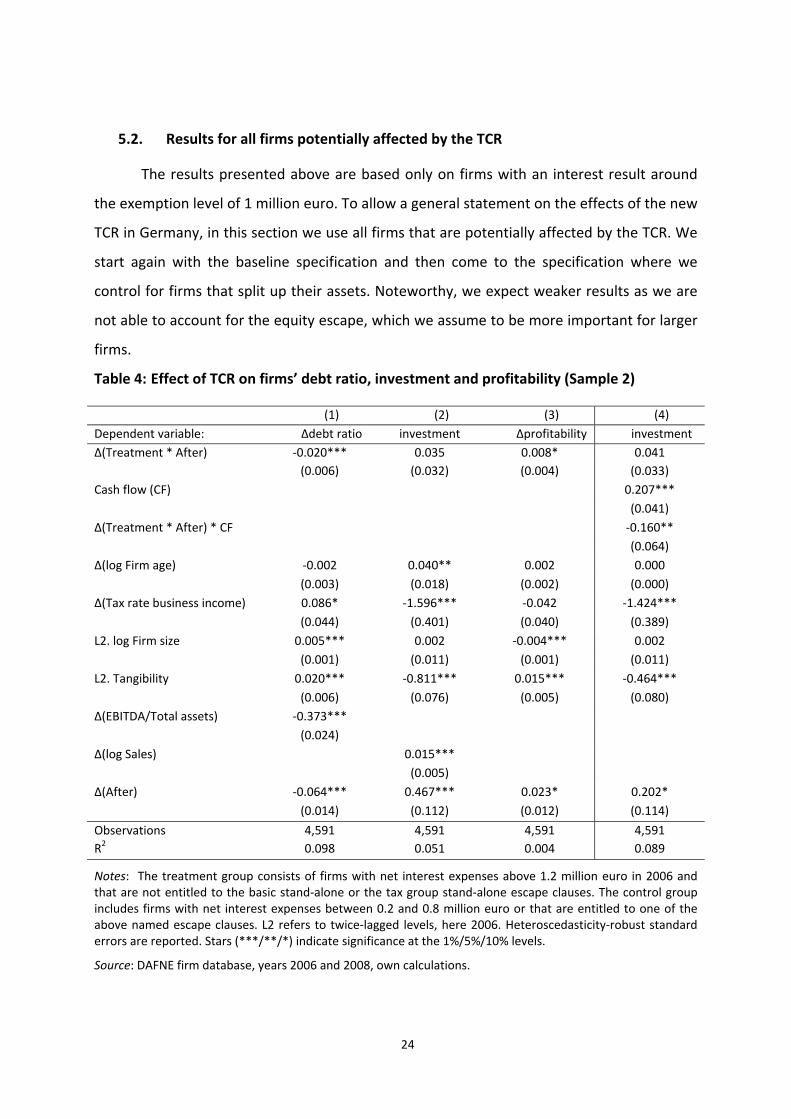
5.2. Results for all firms potentially affected by the TCR
The results presented above are based only on firms with an interest result around
the exemption level of 1 million euro. To allow a general statement on the effects of the new
TCR in Germany, in this section we use all firms that are potentially affected by the TCR. We
start again with the baseline specification and then come to the specification where we
control for firms that split up their assets. Noteworthy, we expect weaker results as we are
not able to account for the equity escape, which we assume to be more important for larger
firms.
Table 4: Effect of TCR on firms’ debt ratio, investment and profitability (Sample 2)
(1) (2) (3) (4)
Dependent variable: ∆debt ratio investment ∆profitability investment
∆(Treatment * After) ‐0.020*** 0.035 0.008* 0.041
(0.006) (0.032) (0.004) (0.033)
Cash flow (CF) 0.207***
(0.041)
∆(Treatment * After) * CF ‐0.160**
(0.064)
∆(log Firm age) ‐0.002 0.040** 0.002 0.000
(0.003) (0.018) (0.002) (0.000)
∆(Tax rate business income) 0.086* ‐1.596*** ‐0.042 ‐1.424***
(0.044) (0.401) (0.040) (0.389)
L2. log Firm size 0.005*** 0.002 ‐0.004*** 0.002
(0.001) (0.011) (0.001) (0.011)
L2. Tangibility 0.020*** ‐0.811*** 0.015*** ‐0.464***
(0.006) (0.076) (0.005) (0.080)
∆(EBITDA/Total assets) ‐0.373***
(0.024)
∆(log Sales) 0.015***
(0.005)
∆(After) ‐0.064*** 0.467*** 0.023* 0.202*
(0.014) (0.112) (0.012) (0.114)
Observations 4,591 4,591 4,591 4,591
R2 0.098 0.051 0.004 0.089
Notes: The treatment group consists of firms with net interest expenses above 1.2 million euro in 2006 and that are not entitled to the basic stand‐alone or the tax group stand‐alone escape clauses. The control group includes firms with net interest expenses between 0.2 and 0.8 million euro or that are entitled to one of the above named escape clauses. L2 refers to twice‐lagged levels, here 2006. Heteroscedasticity‐robust standard errors are reported. Stars (***/**/*) indicate significance at the 1%/5%/10% levels.
Source: DAFNE firm database, years 2006 and 2008, own calculations.

25
Table 5: Effect of TCR on firms’ debt ratio, investment and profitability with consideration
of firms that split up their assets (Sample 2)
(1) (2) (3)
Dependent variable: ∆debt ratio investment ∆profitability
∆(Treatment * After) (1) ‐0.022*** 0.039 0.010*
(0.008) (0.034) (0.005)
∆(Treatment * After) * D(Subsidiaries) (2) 0.007 ‐0.030 ‐0.008 (0.012) (0.044) (0.005)
D(Subsidiaries) ‐0.005* ‐0.009 0.002
(0.003) (0.033) (0.003)
∆(log Firm age) ‐0.002 0.039* 0.002
(0.002) (0.020) (0.005)
∆(Tax rate business income) 0.087*** ‐1.595** ‐0.041
(0.025) (0.549) (0.023)
L2. log Firm size 0.005** 0.003 ‐0.004**
(0.002) (0.008) (0.002)
L2. Tangibility 0.020*** ‐0.812*** 0.015**
(0.004) (0.063) (0.006)
∆(EBITDA/Total assets) ‐0.373***
(0.027)
∆(log Sales) 0.015***
(0.004)
∆(After) ‐0.065*** 0.461*** 0.022
(0.021) (0.048) (0.017)
Observations 4,588 4,588 4,588
R2 0.098 0.051 0.004
Coefficient: (1) + (2) ‐0.015 0.008 0.001
p‐value coefficient (1) + (2) 0.058 0.862 0.893
Notes: The treatment group consists of firms with net interest expenses above 1.2 million euro in 2006 and that are not entitled to the basic stand‐alone or the tax group stand‐alone escape clauses. The control group includes firms with net interest expenses between 0.2 and 0.8 million euro or that are entitled to one of the above named escape clauses. Heteroscedasticity‐robust standard errors are reported. L2 refers to twice‐lagged levels, here 2006. Standard errors are clustered by 10 branches. p‐value for coefficient (1) + (2) is calculated using the delta method. Stars (***/**/*) indicate significance at the 1%/5%/10% levels.
Source: DAFNE firm database, years 2006 and 2008, own calculations.
The results for the baseline specifications of the three equations are reported in table
4. Firms for which the TCR would have applied, had they had not reacted, reduced their debt
ratios by 2%‐points on average (equation (1)). Additional regression analysis (table A2 in the
Appendix) shows that the reduction of internal debt is somewhat stronger (3.3%‐points)
compared to external debt (2.2%‐points). The profitability of the firms, for whom the TCR
would apply without a behavioral reaction, increases by 0.8%‐points; the impact of a 1%‐
point reduction in the debt ratio on firms’ profitability amounts to 0.4%‐points. This is similar
to what we estimated using data for the years 2005 and 2006. Further, also for all firms that

26
were potentially affected by the TCR, no negative investment effects show up. Equation (4)
suggests that this is at least partially caused by sufficient internal cash flow. In general all
results from the first sample are confirmed. The effects are only smaller in absolute terms.
This seems to suggest that larger firms used the equity escape clause more often. Since we
cannot account for it, estimated coefficients are downward biased.
We turn to the specification where we account for firms that might split up their assets
(table 5). The results are less strong compared to the first sample. Firms that have been
affected by the TCR, but split up their assets, reduced their debt ratio less (1.5 %‐points
compared to 2.2%‐points) and exhibit no increase in profitability. Their capital stock
remained basically unchanged. This might either by caused by the fact that we are not able
to account for firms using the equity escape or by the fact that larger firms cannot easily split
up their assets, unlike smaller firms.
5.3. Sensitivity analysis
To check the sensitivity of our results, we start with extending our analysis presented
above to account for the EBITDA escape clause as well and then take into account firms for
which information on the income statement and/or on the ownership structure is missing. In
the last part of this section we address the question whether the financial crisis biases our
results.
We left out the EBITDA escape clause in the main specification since firms that are –
following our modeling – entitled to this escape clause do not seem to behave differently
than firms that are not entitled to any of the escape clauses. We show the results and
explain it in detail in Appendix B.
To check the sensitivity of the results, we include in our baseline specifications an
additional dummy for firms that are entitled to EBITDA escape clause as well the interaction
term for TREATMENT* AFTER and EBITDA escape clause. The results for sample 1 are
presented in table A3. They show that neither the treatment effects of the baseline
specification change significantly, nor the interaction terms for the treated firms that are
entitled to the EBITDA escape clause are significant. This could either mean that since
EBITDA is volatile and therefore to some extent uncertain, firms are not able to use this
escape clause. Thus, even if their ratio of interest expenses to EBITDA is less than 30%, they
27
still reduce their debt ratio to ensure that in “bad” years the TCR will not apply. This could be
possible for 2008, as in this year the regulation does not include a carry forward of an
unused share of deductible interest expenses to EBITDA. Further, one should note that all
interest expenses that are not deductible increase the net interest expenses in the next year.
However, another explanation could also be that we have measurement error in our variable
such that we are not able to identify firms that are entitled to use the EBITDA escape clause.
If this is the case, we would underestimate the true effect of the TCR. Since we are not able
to distinguish between these explanations, we leave it for further research, which should use
tax data to properly address this issue.
As a second sensitivity check, we include all observations, even if income statements or
ownership information are missing. To classify firms into treatment and control group we
apply a regression‐based imputation using the observed firm balance sheet characteristics in
2006.38 The results for our baseline specification for all firms with ownership information are
reported in table A4. Please note that due to missing income statements for some firms, we
neither control for EBITDA to total assets for debt ratio and nor for changes in sales for
investment as dependent variable. The estimated treatment effects are somewhat smaller
than for sample 2, which is due to the fact that we cannot account for the escape clauses.
Treated firms reduce their debt ratio by about 1%‐point and increase their profitability by
0.7%‐points. Again, no negative investment effects were found. Therefore, we can also rule
out that selection drives our results.
At least, we address the question whether the economic downturn in 2008 biases our
results. In case the downturn affected all firms equally, our results would still be consistent
as in this case our treatment and control group would have been affected in the same way.
Thus, by comparing both groups the effect of the financial crisis drops out. However, it may
be argued that the effect of the economic downturn differs by firm size. Since our control
38 The imputation was done with an OLS regression where the following covariates are included: Unpaid
contributions on subscribed capital, fixed assets, assets in between fixed and current assets, current assets, equity, special item with an equity portion, accruals, liabilities, deferred income (all scaled by the book value of total assets), intangible assets, tangible assets, financial assets (all scaled by the book value of fixed assets), inventories, receivables and other assets, securities, cash‐in‐hand (all scaled by the book value of current assets), liabilities up to one year, liabilities with a majority of more than one year, loans, liabilities to banks, payments on account of orders, trade payables, liabilities from central settlement, liabilities on bills accepted and drawn, liabilities to shareholders, payable to affiliated enterprises, payable to enterprises in which participation are held, other liabilities (all scaled by the book value of liabilities). Further, we include the log of total assets as well as legal form and industry dummies. The R2 of the regression is 0.47. The results are not shown but are available upon request from the authors.
28
group is on average smaller than our treatment group, the effect we estimate could thus be
due to the different impact of the financial crisis on firms depending on their size. However,
since we control for firms’ size in levels of 2006 in the estimation, the potentially different
effect of the financial crisis should be captured by this variable and thus not bias the
treatment effect.
Further support in favor of our results is obtained from running a regression using only
2006 and 2007 (see table A5 in Appendix A). In case the crisis drives our results, we expect
no differences between treatment and control group when comparing 2006 and 2007 as the
crisis started at the earliest in 2008. The results however show that firms for which the TCR
would have applied reduced already their debt ratio in 2007 by about 3%‐points. Further, an
increase in their profitability of about 1.7%‐points is observed. Thus, qualitatively these
results are similar to the ones presented above. Therefore, the bias due to the financial crisis
if present at all seems fairly small.
6. Summary and Conclusions
National governments use two instruments to avoid the up to now observed profit
shifting of multinational firms. On the one hand, tax competition has led to a significant
decrease in corporate tax rates, on the other hand, countries, typically the large and high‐tax
ones, have implemented TCRs in order to prevent profit shifting. The goal of this study is to
analyse the effectiveness of these regulations. Earlier contributions show that firms react to
TCRs by changing their finance structure.
Our study contributes to the existing literature in three ways. First, our analysis not only
considers the effects of TCRs on the finance structure and on investment, but it additionally
focuses on the question of whether the firms’ tax base is broadened due to the introduction
of a TCR. Secondly, our study is the first to investigate the impact of the newly introduced
interest barrier in Germany as one specific version of thin capitalization rules. Thirdly, in our
study we present evidence that firms might exploit threshold regulations in order to avoid
the application of TCRs.
To identify the causal effects of the TCR, which is firms’ behaviour to avoid the
application of the TCR, we use the escape clauses within the German interest barrier and

29
apply a difference‐in‐difference approach. Our results show that firms with interest
expenses near the exemption limit avoid the application of the regulation either by reducing
their debt ratio or by splitting up the firms’ assets. While in the first case the TCR is shown to
be successful in broadening the tax base, in the latter case it does not. Firms that split up do
not decrease their debt ratio and their profitability seems to increase less than the
profitability of firms that do not split up. Taking into account all firms, we find a significant,
but lower, impact of the interest barrier on the debt ratio and on firms’ profitability
compared to the reaction of firms with a net interest result close to the exemption limit.
With respect to firms’ investment, our results suggest that the TCR does not cause
negative investment effects in the short run. This means, on the one hand, that firms do not
face severe adjustment costs when substituting equity for debt. On the other hand,
however, this seems to suggest that either investment is fixed in the short‐term such that
negative investment effects are only caused in the long‐term, or that firms will find ways in
the long‐term to avoid TCR application. A third explanation, which is also possible, is that a
large number of firms, which are affected by the TCR, do not shift profits. Since we are not
able to answer this question, we leave it for further research.
Given our result that firms split up their assets to avoid the application of the interest
barrier, one has to expect that the 2009 increase in the exemption limit for the application of
the interest barrier from 1 to 3 million euro leads to similar adjustments by much larger
firms. This would severely hamper the impact of the interest barrier and should be validated
by future research. As we have not considered the so called equity escape, which intends to
exempt large groups with foreign members and “sufficient” equity financing, future research
should also try to assess the impact of this specific aspect the German interest barrier.

30
References
Bach, Stefan und Hermann Buslei (2009): Empirische Analysen zur Zinsschranke, DIW
Berlin Research Notes, 30, Berlin.,
www.diw.de/documents/publikationen/73/diw_01.c.96142.de/rn30.pdf.
Blaufus, Kay und Daniela Lorenz (2009): Wem droht die Zinsschranke? Eine empirische
Untersuchung zur Identifikation der Einflussfaktoren. Erscheint in Zeitschrift für
Betriebswirtschaft, 79.
www.whu.edu/cms/fileadmin/redaktion/LS‐ExReWe/Blaufuss_FoKo_FoFo.pdf.
Buettner, Thiess, Michael Overesch, Ulrich Schreiber and Georg Wamser (2012): The
Impact of Thin Capitalization Rules on the Capital Structure of Multinationals Firms, Journal
of Public Economics (forthcoming).
Buettner, Thiess and Georg Wamser (2009): Internal Debt and Multinationals' Profit
Shifting ‐ Empirical Evidence from Firm‐Level Panel Data, Oxford University Centre for
Business Taxation (Said Business School) WP 09/18.
Deutscher Bundestag (2007): Gesetzentwurf der Fraktionen der CDU/CSU und SPD ‐
Entwurf eines Unternehmensteuerreformgesetzes 2008, Bundestagsdrucksache 16/4841.
Fossen, Frank and Martin Simmler. (2012): Differential Taxation and Firms’ Financial
Leverage – Evidence from the Introduction of a Flat Tax on Interest Income, DIW Discussion
Paper No. 1190.
Fuest, Clemens and Thomas Hemmelgarn (2005): Corporate Tax Policy, Foreign Firm
Ownership and Thin Capitalization, Regional Science and Urban Economics, 35, 5, 508‐526.
Haufler, Andreas and Marco Runkel (2008): Firms’ Financial Choices and Thin
Capitalization Rules under Corporate Tax Competition, CESIfo Working Paper No. 2429.
Huizinga, Harry and Luc Laeven (2008): International profit shifting within multinationals:
A multi‐country perspective. Journal of Public Economics, 92, 1164–1182.

31
Körner, Andreas (2004): The New German Thin Capitalization Rules: Tax Planning;
Incompatibility with European Law, INTERTAX, 32, 8/9, 401‐415.
Meyer, Bruce D. (1995): Natural and Quasi‐Experiments in Economics, Journal of
Business & Economic Statistics, 13, 2, pp. 151‐161.
OECD (1987): Thin‐Capitalization and Taxation of Entertainers, Artistes and Sportsmen,
Committee on Fiscal Affairs, Issues in International Taxation No. 2, Paris.
Overesch, Michael and Wamser, Georg (2010): Corporate Tax Planning and Thin‐
Capitalization Rules: Evidence from a Quasi‐Experiment, Applied Economics, 42: 5, 563 —
573
PSP München, vbw – Vereinigung der Bayerischen Wirtschaft e.V. (2008):
Unternehmensteuerreform 2008: Zinsschranke und Hinzurechnung schaffen Überlast.
28.05.2008. www.psp.eu/media/presse/Studie_PSP_vbw_psp_eu.pdf.
Rödder and Stangl (2007): Zur geplanten Zinsschranke, Der Betrieb, 9, 479‐485.
Rödding, Adalbert (2009): Änderungen der Zinsschranke durch das
Wachstumsbeschleunigungsgesetz, Deutsches Steuerrecht (DStR), 2649‐2653.
Thiel, Jochen (2007): Die steuerliche Behandlung von Fremdfinanzierungen im
Unternehmen, Finanzrundschau 15, 729‐733.
Wamser, Georg (2008): The Impact of Thin‐Capitalization Rules on External Debt Usage –
A propensity Score Matching Approach, Ifo Working Paper No. 62, 2008.
Webber, Stuart (2010): Thin Capitalization and Interest Deduction Rules: A Worldwide
Survey Tax Notes International, 60, 9, 683‐708.
Weichenrieder, Alfons J. and Helen Windischbauer (2008): Thin‐Capitalization Rules and
Company Responses – Experience from German Legislation, CESIfo Working Paper No. 242.
Weichenrieder, Alfons J. (2009): Profit Shifting in the EU: Evidence from Germany,
International Tax and Public Finance, 16, 281‐297.
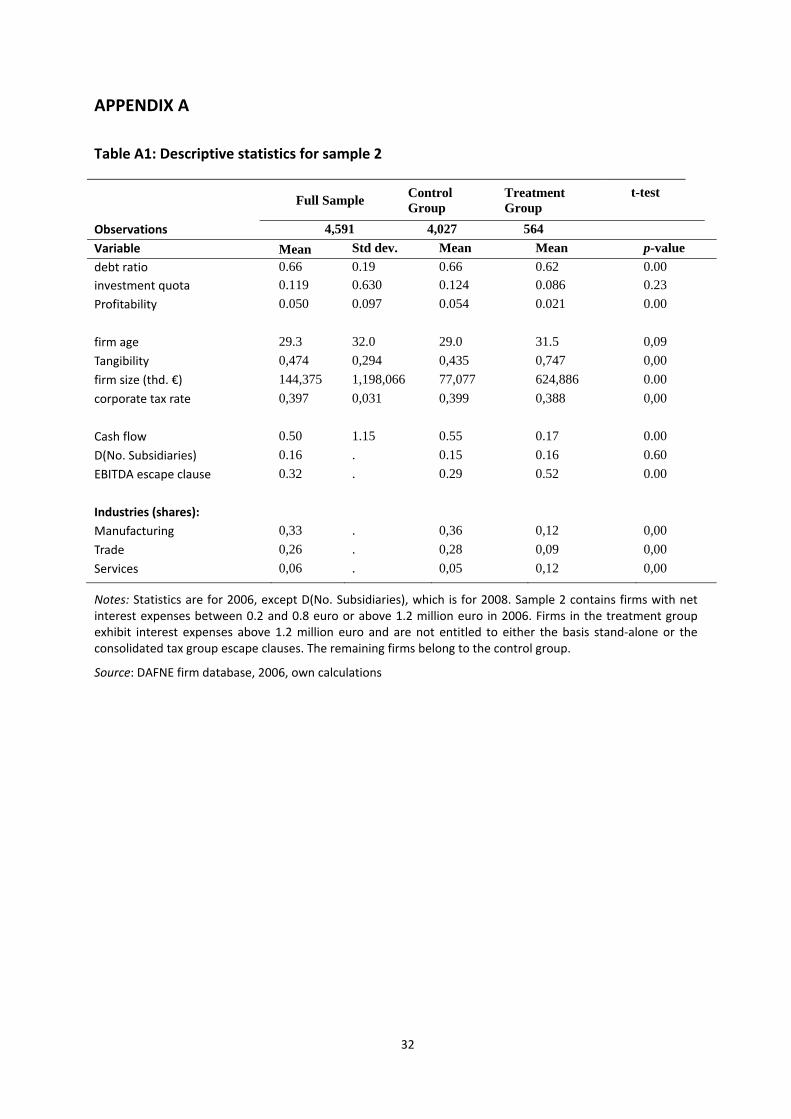
32
APPENDIX A
Table A1: Descriptive statistics for sample 2
Notes: Statistics are for 2006, except D(No. Subsidiaries), which is for 2008. Sample 2 contains firms with net interest expenses between 0.2 and 0.8 euro or above 1.2 million euro in 2006. Firms in the treatment group exhibit interest expenses above 1.2 million euro and are not entitled to either the basis stand‐alone or the consolidated tax group escape clauses. The remaining firms belong to the control group.
Source: DAFNE firm database, 2006, own calculations
Full Sample
Control Group
Treatment Group
t-test
Observations 4,591 4,027 564
Variable Mean Std dev. Mean Mean p-value
debt ratio 0.66 0.19 0.66 0.62 0.00
investment quota 0.119 0.630 0.124 0.086 0.23
Profitability 0.050 0.097 0.054 0.021 0.00
firm age 29.3 32.0 29.0 31.5 0,09
Tangibility 0,474 0,294 0,435 0,747 0,00
firm size (thd. €) 144,375 1,198,066 77,077 624,886 0.00
corporate tax rate 0,397 0,031 0,399 0,388 0,00
Cash flow 0.50 1.15 0.55 0.17 0.00
D(No. Subsidiaries) 0.16 . 0.15 0.16 0.60
EBITDA escape clause 0.32 . 0.29 0.52 0.00
Industries (shares):
Manufacturing 0,33 . 0,36 0,12 0,00
Trade 0,26 . 0,28 0,09 0,00
Services 0,06 . 0,05 0,12 0,00
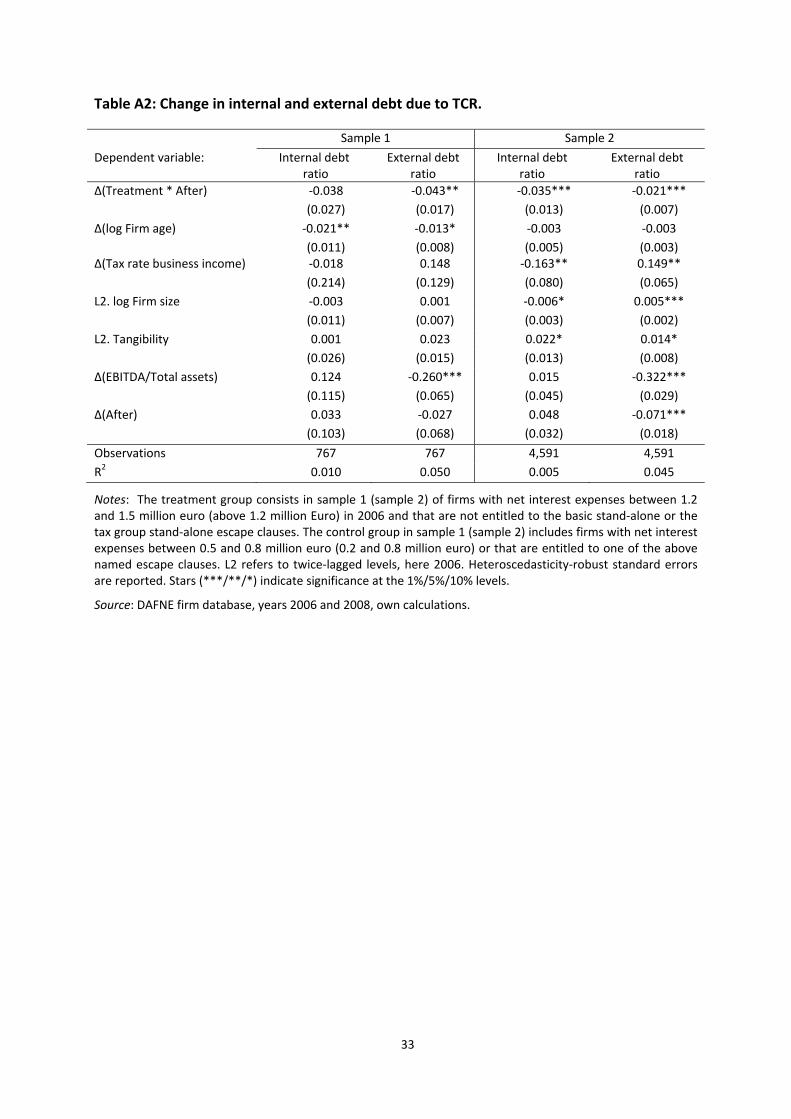
33
Table A2: Change in internal and external debt due to TCR.
Sample 1 Sample 2
Dependent variable: Internal debt ratio
External debtratio
Internal debt ratio
External debtratio
∆(Treatment * After) ‐0.038 ‐0.043** ‐0.035*** ‐0.021***
(0.027) (0.017) (0.013) (0.007)
∆(log Firm age) ‐0.021** ‐0.013* ‐0.003 ‐0.003
(0.011) (0.008) (0.005) (0.003)∆(Tax rate business income) ‐0.018 0.148 ‐0.163** 0.149**
(0.214) (0.129) (0.080) (0.065)
L2. log Firm size ‐0.003 0.001 ‐0.006* 0.005***
(0.011) (0.007) (0.003) (0.002)
L2. Tangibility 0.001 0.023 0.022* 0.014*
(0.026) (0.015) (0.013) (0.008)
∆(EBITDA/Total assets) 0.124 ‐0.260*** 0.015 ‐0.322***
(0.115) (0.065) (0.045) (0.029)
∆(After) 0.033 ‐0.027 0.048 ‐0.071***
(0.103) (0.068) (0.032) (0.018)
Observations 767 767 4,591 4,591
R2 0.010 0.050 0.005 0.045
Notes: The treatment group consists in sample 1 (sample 2) of firms with net interest expenses between 1.2 and 1.5 million euro (above 1.2 million Euro) in 2006 and that are not entitled to the basic stand‐alone or the tax group stand‐alone escape clauses. The control group in sample 1 (sample 2) includes firms with net interest expenses between 0.5 and 0.8 million euro (0.2 and 0.8 million euro) or that are entitled to one of the above named escape clauses. L2 refers to twice‐lagged levels, here 2006. Heteroscedasticity‐robust standard errors are reported. Stars (***/**/*) indicate significance at the 1%/5%/10% levels.
Source: DAFNE firm database, years 2006 and 2008, own calculations.
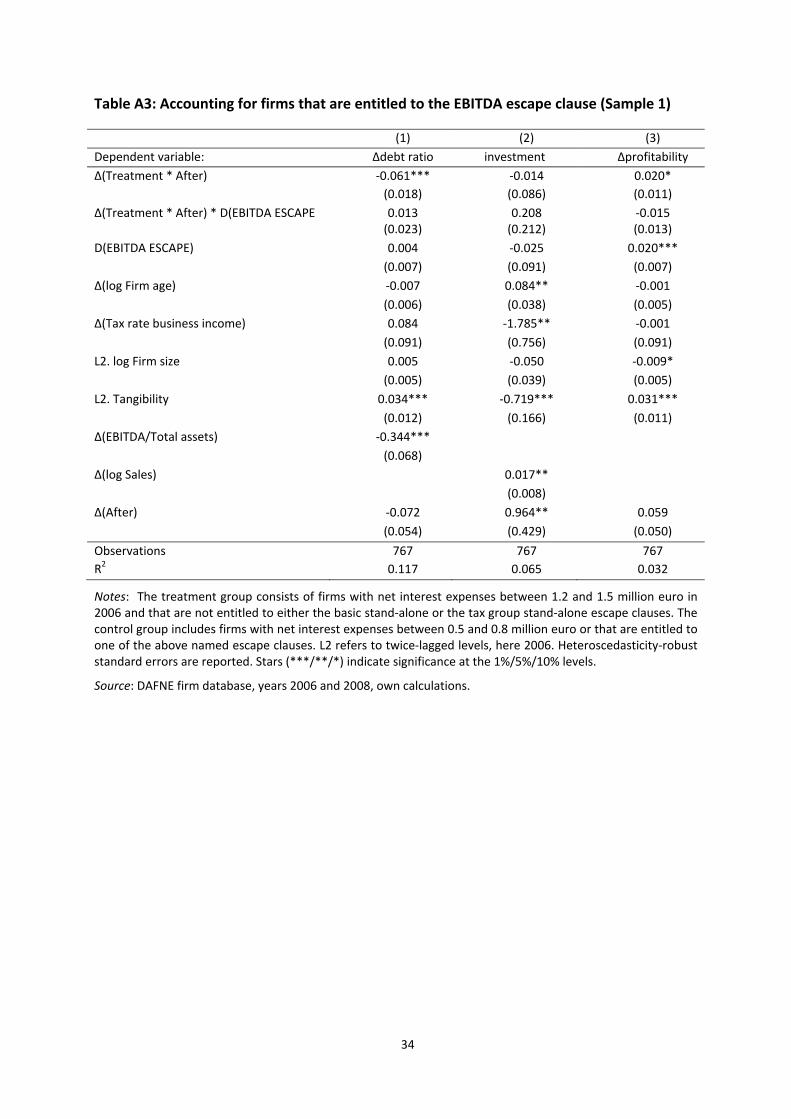
34
Table A3: Accounting for firms that are entitled to the EBITDA escape clause (Sample 1)
(1) (2) (3)
Dependent variable: ∆debt ratio investment ∆profitability
∆(Treatment * After) ‐0.061*** ‐0.014 0.020*
(0.018) (0.086) (0.011)
∆(Treatment * After) * D(EBITDA ESCAPE 0.013 0.208 ‐0.015 (0.023) (0.212) (0.013)
D(EBITDA ESCAPE) 0.004 ‐0.025 0.020***
(0.007) (0.091) (0.007)
∆(log Firm age) ‐0.007 0.084** ‐0.001
(0.006) (0.038) (0.005)
∆(Tax rate business income) 0.084 ‐1.785** ‐0.001
(0.091) (0.756) (0.091)
L2. log Firm size 0.005 ‐0.050 ‐0.009*
(0.005) (0.039) (0.005)
L2. Tangibility 0.034*** ‐0.719*** 0.031***
(0.012) (0.166) (0.011)
∆(EBITDA/Total assets) ‐0.344***
(0.068)
∆(log Sales) 0.017**
(0.008)
∆(After) ‐0.072 0.964** 0.059
(0.054) (0.429) (0.050)
Observations 767 767 767
R2 0.117 0.065 0.032
Notes: The treatment group consists of firms with net interest expenses between 1.2 and 1.5 million euro in 2006 and that are not entitled to either the basic stand‐alone or the tax group stand‐alone escape clauses. The control group includes firms with net interest expenses between 0.5 and 0.8 million euro or that are entitled to one of the above named escape clauses. L2 refers to twice‐lagged levels, here 2006. Heteroscedasticity‐robust standard errors are reported. Stars (***/**/*) indicate significance at the 1%/5%/10% levels.
Source: DAFNE firm database, years 2006 and 2008, own calculations.

35
Table A4: Results for all firms that are potentially affected by the TCR.
(1) (2) (3)
Dependent variable: ∆debt ratio Investment ∆profitability
∆(Treatment * After) ‐0.010*** ‐0.015 0.007**
(0.004) (0.021) (0.003)
∆(log Firm age) ‐0.002 0.053*** 0.001
(0.002) (0.013) (0.002)
∆(Tax rate business income) 0.073*** ‐0.786*** ‐0.033
(0.027) (0.197) (0.032)
L2. log Firm size 0.007*** 0.002 ‐0.004***
(0.001) (0.008) (0.001)
L2. Tangibility 0.003 ‐0.635*** 0.015***
(0.003) (0.044) (0.004)
∆(After) ‐0.078*** 0.443*** 0.025**
(0.011) (0.090) (0.010)
Observations 11,931 11,931 7,050
R2 0.004 0.046 0.004
Notes: The treatment group consists of firms with net interest expenses above 1.2 million euro in 2006 and that are not entitled to either the stand‐alone or the consolidated tax group escape clauses (if firms ownership information is available). The control group includes firms with net interest expenses between 0.2 and 0.8 million euro or that are entitled to one of the above named escape clauses. L2 refers to twice‐lagged levels, here 2006. Heteroscedasticity‐robust standard errors are reported. Stars (***/**/*) indicate significance at the 1%/5%/10% levels.
Source: DAFNE firm database, years 2006 and 2008, own calculations.
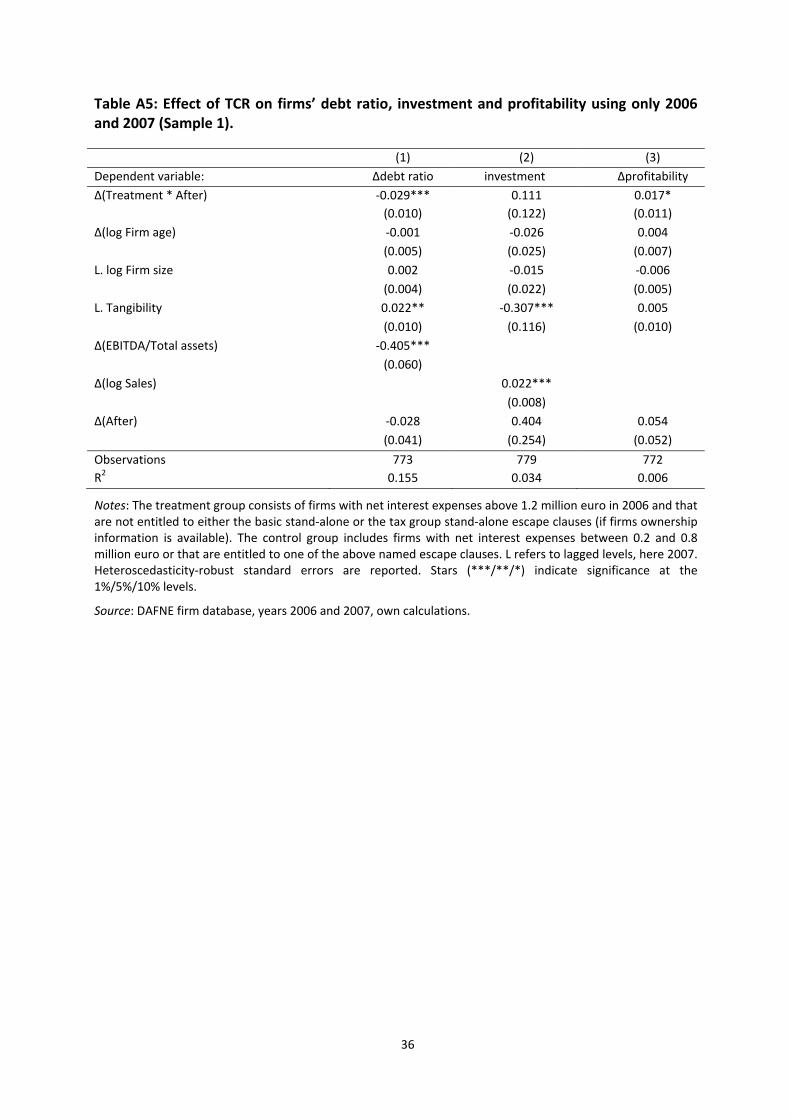
36
Table A5: Effect of TCR on firms’ debt ratio, investment and profitability using only 2006 and 2007 (Sample 1).
(1) (2) (3)
Dependent variable: ∆debt ratio investment ∆profitability
∆(Treatment * After) ‐0.029*** 0.111 0.017*
(0.010) (0.122) (0.011)
∆(log Firm age) ‐0.001 ‐0.026 0.004
(0.005) (0.025) (0.007)
L. log Firm size 0.002 ‐0.015 ‐0.006
(0.004) (0.022) (0.005)
L. Tangibility 0.022** ‐0.307*** 0.005
(0.010) (0.116) (0.010)
∆(EBITDA/Total assets) ‐0.405***
(0.060)
∆(log Sales) 0.022***
(0.008)
∆(After) ‐0.028 0.404 0.054
(0.041) (0.254) (0.052)
Observations 773 779 772
R2 0.155 0.034 0.006
Notes: The treatment group consists of firms with net interest expenses above 1.2 million euro in 2006 and that are not entitled to either the basic stand‐alone or the tax group stand‐alone escape clauses (if firms ownership information is available). The control group includes firms with net interest expenses between 0.2 and 0.8 million euro or that are entitled to one of the above named escape clauses. L refers to lagged levels, here 2007. Heteroscedasticity‐robust standard errors are reported. Stars (***/**/*) indicate significance at the 1%/5%/10% levels.
Source: DAFNE firm database, years 2006 and 2007, own calculations.
37
APPENDIX B
To test whether firms that are entitled to one of the escape clauses behave differently from
firms that are not entitled to any of them, we estimate, at first, a specification where the
entitlement to one of the escape clauses is modeled as heterogeneous treatment effect. We
construct dummy variables for stand‐alone escape clause as well as for the EBITDA escape
clause. These variables are interacted with the Treatment * After and the After variable from
equation (1). Then we construct differences between 2008 and 2006. The dummies for the
entitlement of another escape clause are modeled in such a way that the treatment effect is
still given byγ. The equation estimated is given below for one other escape clause. Note that
since we model the entitlement based on the firms' characteristics in 2006 and estimate in
differences, we do not have to control for time invariant differences between the firms that
are entitled and those that are not. The coefficient ϑ captures the change in the debt ratio
for firms that are entitled to the escape clause before and after the reform, φ captures how
firms with interest expenses above 1 million euro, but which are entitled to another escape
clause change their debt ratio. If we capture these firms perfectly, we expect that γ = ‐ φ,
since there should be no difference between firms with interest expenses below the
threshold and above the threshold that are not affected by the interest ceiling rule since
they are entitled to another escape clause.
∆ ∆ ∆ ∗ ∆ ∗
∆ ∗ ∗ ∗ ∆ ∆ (4)
The results for sample 1 are shown in table B1.39 They show that firms that are
entitled to the stand‐alone escape clause do not change their debt ratio (coefficient (1) + (2)
at the bottom of the table) differently than firms in the control group. However, the results
also suggest that treated firms, which are entitled to the EBITDA escape clause, do not
behave significantly different from firms that are not entitled, as the interaction term is not
significantly different from zero(coefficient (1) + (3) at the bottom of the table). Therefore,
we did not take into account whether a firm is entitled to the EBITDA escape clause or not
when forming our treatment and control group.
39 For sample 2 the results also do not change significantly. They are not reported but are available upon
request.
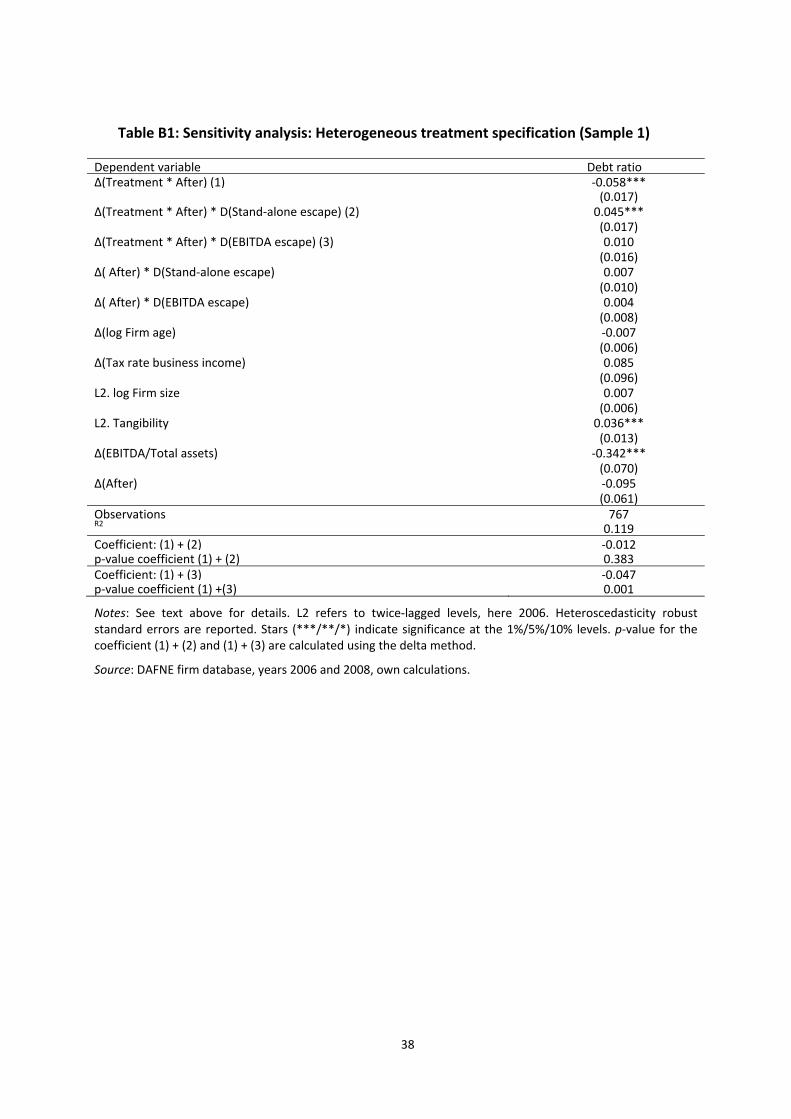
38
Table B1: Sensitivity analysis: Heterogeneous treatment specification (Sample 1)
Dependent variable Debt ratio ∆(Treatment * After) (1) ‐0.058*** (0.017) ∆(Treatment * After) * D(Stand‐alone escape) (2) 0.045*** (0.017) ∆(Treatment * After) * D(EBITDA escape) (3) 0.010 (0.016) ∆( After) * D(Stand‐alone escape) 0.007 (0.010) ∆( After) * D(EBITDA escape) 0.004 (0.008) ∆(log Firm age) ‐0.007 (0.006) ∆(Tax rate business income) 0.085 (0.096) L2. log Firm size 0.007 (0.006) L2. Tangibility 0.036*** (0.013) ∆(EBITDA/Total assets) ‐0.342*** (0.070) ∆(After) ‐0.095 (0.061) Observations 767 R2 0.119 Coefficient: (1) + (2) ‐0.012 p‐value coefficient (1) + (2) 0.383 Coefficient: (1) + (3) ‐0.047 p‐value coefficient (1) +(3) 0.001
Notes: See text above for details. L2 refers to twice‐lagged levels, here 2006. Heteroscedasticity robust standard errors are reported. Stars (***/**/*) indicate significance at the 1%/5%/10% levels. p‐value for the coefficient (1) + (2) and (1) + (3) are calculated using the delta method.
Source: DAFNE firm database, years 2006 and 2008, own calculations.