Embed Size (px)
DESCRIPTION
http://www.cddep.org/sites/cddep.org/files/publication_files/2011.nandideolalikar.doesalegalbanonsexselectiveabortions.ssrn_.pdf
Citation preview
Electronic copy available at: http://ssrn.com/abstract=1824420
Does a Legal Ban on Sex-Selective Abortions Improve Child Sex
Ratios? Evidence from a Policy Change in India
Arindam Nandi∗ and Anil B. Deolalikar†
April, 2011
Abstract
Despite strong recent economic growth, gender inequality remains a major concern for India. This
paper examines the effectiveness of a public policy geared towards the reduction of gender inequality.
The national Pre-Conception and Pre-Natal Diagnostics Techniques (PNDT) Act of 1994, implemented
in 1996, banned sex-selective abortions in the Indian states which hitherto had not legislated such a
policy. Although demographers frequently mention the futility of the Act, this paper is among the first
to evaluate the law using a treatment-effect type analysis of the pre-ban and post-ban periods. Using
village-level and town-level longitudinal data from the 1991 and 2001 censuses, we find a significantly
positive impact of the PNDT Act on the female-to-male child sex ratio (number of females per 1000 males
below the age of 6 years). Given the almost ubiquitous decline in the observed child sex ratio during the
study period, Our results are interpreted as the success of the law in hindering any further worsening
of the gender imbalance. We find that in the possible absence of the PNDT Act, child sex ratio would
have declined by another 13-20 points, or an additional 51,000 female fetuses would have been aborted.
Additional analysis using quantile regressions of the conditional distribution of the rural child sex ratio
reveals the heterogeneity among communities with respect to their response to the law.
1 Introduction
The just-released data from the Indian 2011 census has refocused the world’s attention on the dark side of
India’s demographic change – a low and falling ratio of girls to boys. For the last 40 years, each successive
census has found the number of young girls shrinking relative to boys. Interestingly, the deterioration in the
child sex ratio has occurred in the face of rising living standards and improvements in every other indicator
∗The Center for Disease Dynamics, Economics & Policy, Washington DC; [email protected]†University of California, Riverside
1
Electronic copy available at: http://ssrn.com/abstract=1824420
of demographic change and human development – average life expectancy, infant mortality, male and female
literacy, fertility rate, and schooling enrollment of children.
India is one of a handful of countries that has significantly more males than females. The problem is
particularly severe at younger ages; the child sex ratio (i.e., the number of girls per 1,000 boys in the 0-6
years age group) has declined steadily – from 964 in 1971 to 962 in 1981, 953 in 1991, 927 in 2001, and 914
in 2001.1 Although a distorted child sex ratio is observed in other Asian countries, including China, Taiwan,
Singapore and Vietnam, India has one of the lowest child sex ratios in the world.
The low child sex ratio in India arises from the practices of sex-selective abortions and excess female
infant mortality, both of which are the result of a strong cultural preference for sons over daughters.2 Some
estimates have put the number of ‘missing females’ (i.e., unborn girls) in India as high as 37 million (Sen
2003).
After abortion was legalized in India in 1971, and technologies to diagnose the sex of the fetus became
widely available, the practice of sex-selective abortions became widespread. As the prices for sex-selection
diagnostic tests fell during the 1980s and 1990s, the practice became even more rampant. The Indian
government finally responded to this problem by passing the Pre-Conception and Pre-Natal Diagnostics
Techniques (PNDT) (Prohibition of Sex Selection) Act in 1994. The PNDT Act prohibited the use of
diagnostic methods to diagnose the sex of an unborn child.
The low and falling child sex ratio in the country is a matter of grave policy concern, not only because
it violates the human rights of unborn and infant girls but also because it deprives the country of the
potential economic and social contribution of these ‘missing women.’ In addition, there may be longer-
run adverse impacts from a marriage market squeeze caused by an excess supply of male relative to female
youth.3 Already, states like Haryana and Punjab, where the sex ratio has been extremely distorted for several
decades, have been experiencing bride trafficking. In a recent interview, India’s home (interior) secretary,
Mr. G.K. Pillai, said: “Whatever measures that have been put in over the last 40 years have not had any
impact on child sex ratio and therefore that requires a complete review”4.
Secretary Pillai’s assertion is not quite accurate, since the child sex ratio could have deteriorated even
1The natural sex ratio in a population typically ranges from 950 to 970 girls per 1,000 boys.2Zeng Yi et al. (1993), Park and Cho (1995), Chu (2001), Lin et al. (2008), Zhu et al. (2009) study prenatal sex selection
practices in East Asian countries. Almond and Edlund (2008), Almond et al. (2009) find male-biased sex ratio among thechildren of Asian immigrants in US and Canada. Li (2002), Das Gupta (2005), Qian (2009), Ebenstein (2010) evaluate theimpact of family planning policies on gender imbalance. Rosenzweig and Schultz (1982), Das Gupta (1987), Clark (2000),Foster and Rosenzweig (1999), Duflo (2003), Jayaraj and Subramanian (2004), Qian (2008), Chamarbagwala (2010) examinethe association between socioeconomic status of adult women with relative outcomes for girls versus boys. Drew et al. (1986),Norberg (2004), Oster (2005), Lin and Luoh (2008) discuss possible noneconomic factors affecting gender imbalance.
3Angrist (2002) studies the long-run impact of sex imbalance on marriage and labor markets. Messner and Sampson (1991)in the context of US and Edlund et al. (2007) in the context of China associate male-biased sex ratios with increased violence.Francis (2009) examines the impact of gender imbalance on bride price and child outcomes in Taiwan. Hudson and Den Boer(2002, 2004) argue that socities with high male-to-female sex ratio have always experienced higher violent crime rates. Hesketh(2009) discusses the possible marriage market related outcomes of the gender imbalance in China.
4The Economic Times, 1 April 2011
2
more in the absence of policy measures, such as the PNDT Act. The problem is that while there have been
a large number of empirical studies of the child sex ratio in India and in other countries in recent years, none
has focused on the impact of legislation or a policy intervention on improving the boy-girl balance.5
To our knowledge, our paper is the first to explore the causal impact of a major legislation – the PNDT
Act – on the child sex ratio. While the Government of India began enforcing the PNDT Act from 1996, it was
non-binding for the western Indian state of Maharashtra, since that state already had its own PNDT-type
law in place since 1988. Therefore, the implementation of the PNDT Act in 1996 in all the other Indian states
provides us with an exogenous policy variation.We exploit this policy variation across states to analyze the
causal impact of the legislation on gender imbalance, using a rigorous treatment-effect analytical framework.
Our main outcome variable of interest, the child sex ratio (number of girls per 1000 boys of age below
6 years), depends on two factors – sex ratio at birth and gender-specific mortality rates among children
ever born. Preventing the abortion of girl fetuses will directly reduce the masculinity of the sex ratio at
birth. However, the law might have induced an additional behavioral shift among households. Unwanted
girl fetuses, if not aborted by virtue of the PNDT Act, could grow up as unwanted children in the household
and be deprived of important resources such as nutrition and medical care, thus being more vulnerable to
infant and child mortality. The use of the child sex ratio (instead of the sex ratio at birth) permits us to
capture the effect of the PNDT Act on both the number of female babies born relative to male babies as
well as on differential mortality across young boys and girls.6
There are two other ways in which our paper is unique. First, unlike previous studies on child sex ratios
in India, which use highly-aggregate state or district-level data, we use disaggregated Census data on more
than half a million Indian villages and 1,500 towns over two time periods – 1991 and 2001 – to evaluate
the impact of the PNDT Act on child sex ratios.7 Second, using quantile regression methods, we allow for
heterogeneous impacts of the PNDT Act on child sex ratios, depending upon the degree of son preference
existing in a village.
To anticipate our results, we find a significant positive causal effect of the PNDT Act on the child sex
ratio, with the magnitude of the effect varying across different subsamples. The positive effect of the PNDT
5For example, Arnold, Kishor and Roy (2002) use NFHS 1998-99 data to link the prenatal use of ultrasound and amniocentesisby pregnant women with sex-selective abortions and the sex ratio at birth. Visaria (2007) uses primary data from the states ofGujarat and Haryana to find evidence of sex-selective abortions, particularly for higher birth orders. Patel (2007 ed.) providesa comprehensive overview of sex-selective abortions in India. Subramanian and Selvaraja (2009) employ a logistic regressionapproach to analyze the odds of the birth of a boy child between the pre-ban and post-ban periods. Using five rounds of datafrom the National Sample Surveys (NSS), they find no significant difference in the odds of a boy-birth before and after the 1996PNDT.
6Another factor that may differentially affect the mortality rates of young boys and girls is the access to subsidized publicgoods. For example, with cheap access to healthcare facilities, households may be less likely to neglect girls. Hence, our analysisuses information on the access to healthcare and other infrastructural facilities, whenever possible.
7Although the Census village-level data are in the public domain, the dataset we use in this paper were provided to us byDeolalikar et al. (2009), who spent substantial time and effort in putting them together. We are grateful to them for makingthese data available to us. Deolalikar et al. (2009) is a concurrent study of the impact of public goods availability on child sexratios in India.
3
Act we obtain runs counter to the generally-perceived ineffectiveness of the law in the popular Indian press.
One reason for the popular misperception is that the child sex ratio in much of India, including in the state
of Maharashtra, worsened significantly during the 1991-2001 period. However, our empirical results suggest
that the gender imbalance in India would have worsened even more in the absence of the PNDT Act.
We also find that villages in the higher quantiles of the conditional child sex ratio distribution – i.e., those
with the weakest son preference – were most affected by the ban on sex-seletcive abortions.
Our research provides a silver lining to the generally bleak view of the 1996 PNDT Act. The significant
impact of the PNDT Act in improving the child sex ratio suggests that, with better enforcement, a ban
on sex-selective abortions can not only halt – but even reverse – the declining trend in the child sex ratio
in India. Encouragingly, the Indian government has taken a step in the right direction by expanding the
provisions of the PNDT Act in 2003 and by improving enforcement of the law in recent years.
2 Sex-selective Abortions in India
Abortion was legalized in India by the Medical Termination of Pregnancy Act of 1971. However, the law
required abortions to be performed by registered medical practitioners, and only under certain acute medical
conditions affecting the pregnant woman. Abortion as a choice, except for unwanted pregnancies resulting
from rape, was not legalized.
Fetal sex determination techniques such as amniocentesis, originally intended for the detection of fetal
abnormalities, were first introduced in 1975 (Luthra 1994). The rampant misuse of amniocentesis and other
techniques, such as chorionic villas sampling and ultrasound, for aborting female fetuses rapidly became a
major concern, and it remains so till this day (George and Dahiya 1998, Sudha and Rajan 1999, Arnold et
al. 2002, George 2002, UNFPA 2001). The astonishing pace at which the network of private clinics providing
sex determination and abortion services grew was marked by two features – the tests were cheap (Wertz and
Fletcher 1993) and they were widely available, even in remote rural areas bereft of basic amenities and health
facilities (possibly because of the widespread use of portable ultrasound equipments and amniocentesis kits)
(Menon 1996, Ganatra et al. 2001).
Although data paucity prevents us from obtaining dependable statistics on sex-selective abortions in
India, several studies have attempted to estimate the number of unborn girl fetuses from secondary sources.
The results, though marked by wide variation, indicate the severity of the problem. Jayaraman (1994) and
Arnold et al. (2002) estimate the number of aborted girl fetuses to be between 50,000 and 100,000 every
year. Other studies suggest that the incidence rate could be even higher – e.g. using data from the Special
Fertility and Mortality Survey (1998) of 1.1 million Indian households, Jha et al. (2006a) estimate that
4
between 450,000 to 540,000 sex-selective abortions take place in India each year.8
Anti-sex determination campaigns during the mid-1980s focused attention on the the vast scale of the
problem, especially in the urban areas of northern and western India (Retherford and Roy 2003). Prenatal
sex determination was banned in public healthcare facilities nationwide as early as 1978. However, largely
due to public awareness campaigns9, the state government of Maharashtra was the first to impose a complete
ban on all (public and private) prenatal sex determination in 198810. The rest of the country followed suit
with a similar ban by the Indian central government, known as the Pre-Conception and Pre-Natal Diagnostics
Techniques (Prohibition of Sex Selection) Act of 1994 (PNDT Act, effective from 1996).11
There is a general consensus (Luthra 1994, Jha et al. 2006a, Hatti and Sekhar 2004, Arnold et al. 2002,
Visaria 2007) that these bans have not been very effective. This perception is likely the result of continued
deterioration of the child sex ratio observed in the 2001 Census (and, most recently, the 2011 Census).
Despite the ban on sex-selective abortions, the child sex ratio declined from 945 in 1991 to 927 in 2001.
In the wake of these findings and the large public outcry that ensued, the Indian government amended the
PNDT Act in 2003 and doubled down on the campaign against sex-selective abortions.
Our objective is to evaluate the impact of the 1996 nationwide implementation of the PNDT Act. Unlike
previous studies, we use the difference in timing of the Act’s implementation in Maharashtra versus other
states to identify the causal effect of the Act on the child sex ratio. The national PNDT Act was very similar
to the Maharashtra Act of 1988 and thus non-binding to Maharashtra by virtue of it already being in place
in that state.
3 Data
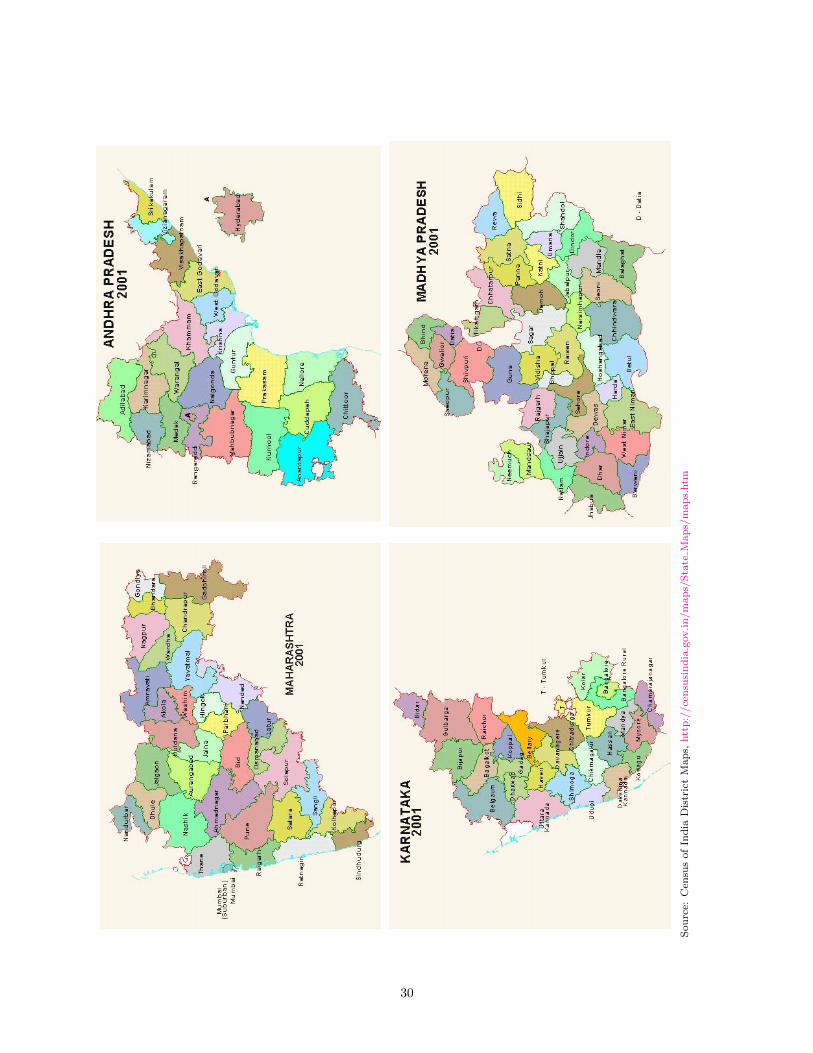
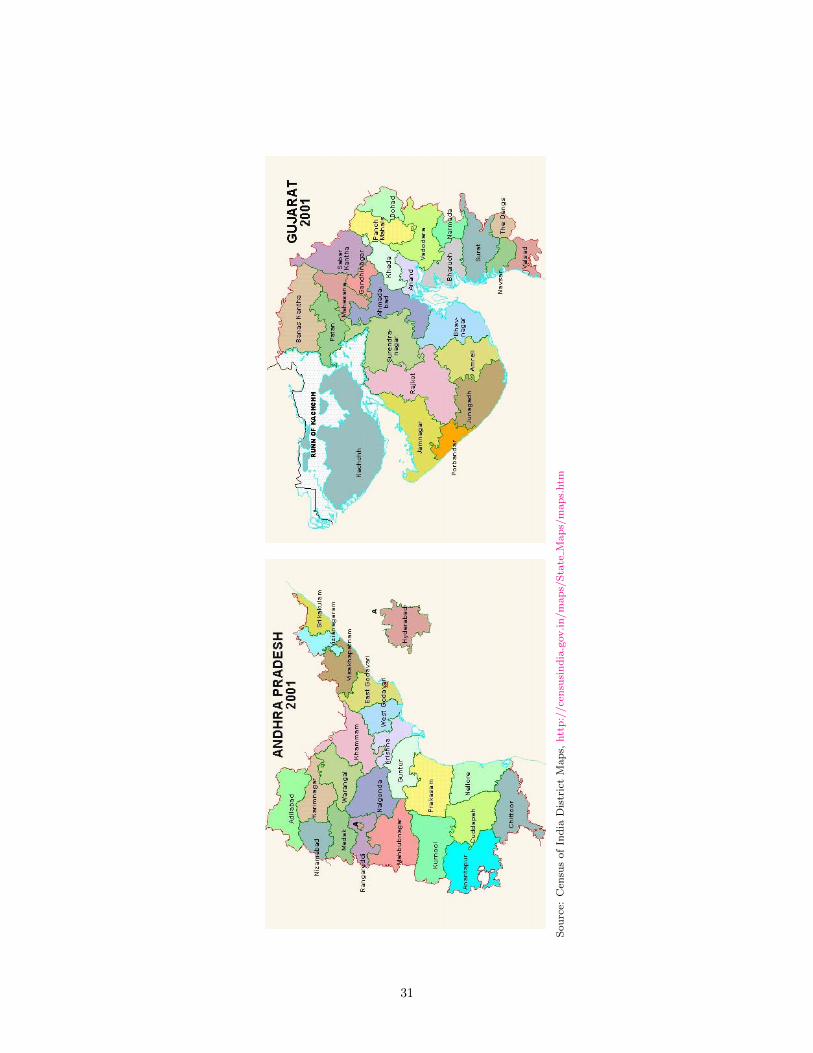
We use rural and urban data from the two decennial Indian censuses of 1991 and 2001. Our main study area
is the western state of Maharashtra (MH) and its neighboring states of Gujarat, Andhra Pradesh, Karnataka,
Madhya Pradesh and Chhattisgarh (Figure 1).12
The rural data for each census year come from two different Census sources. The Primary Census Abstract
8However, the estimates by Jha et al. (2006a) have been contested. See further discussions in Bhat (2006), George (2006),Jha et al. (2006b).
9The ‘Forum against Sex Determination and Sex Preselection’ in Maharashtra is a prominent example of such campaigns(Gangoli 1998).
10Source: “Handbook on Pre-Conception & Pre-Natal Diagnostic Techniques Act, 1994 and Rules with Amendments”, 2006,Ministry of Health and Family Welfare, Government of India. Following Maharastra, a few other states such as Punjab, Haryana,Rajasthan, and Gujarat implemented similar bans on fetal sex determination. However, we could not find any documentationand evidence on enforcement of these bans. Also, our results are robust to the exclusion of these states from our analysis.
11Under the law, first offenders face up to Rs. 10,000 fine and/or 3 year imprisonment. This includes persons or establishmentsperforming sex-selective abortion, as well as the husband/relatives if the woman if forced to undergo the procedure. Repeatoffenders are punishable with up to Rs 50,000 fine and/or 5 year imprisonment.
12The state of Chhattisgarh was created from Madhya Pradesh in 2000. However, the census data allow us to exactly mapvillages and towns in the states that were divided in between the two time periods, thus avoiding any complications arisingfrom the division of the state of Madhya Pradesh.
5
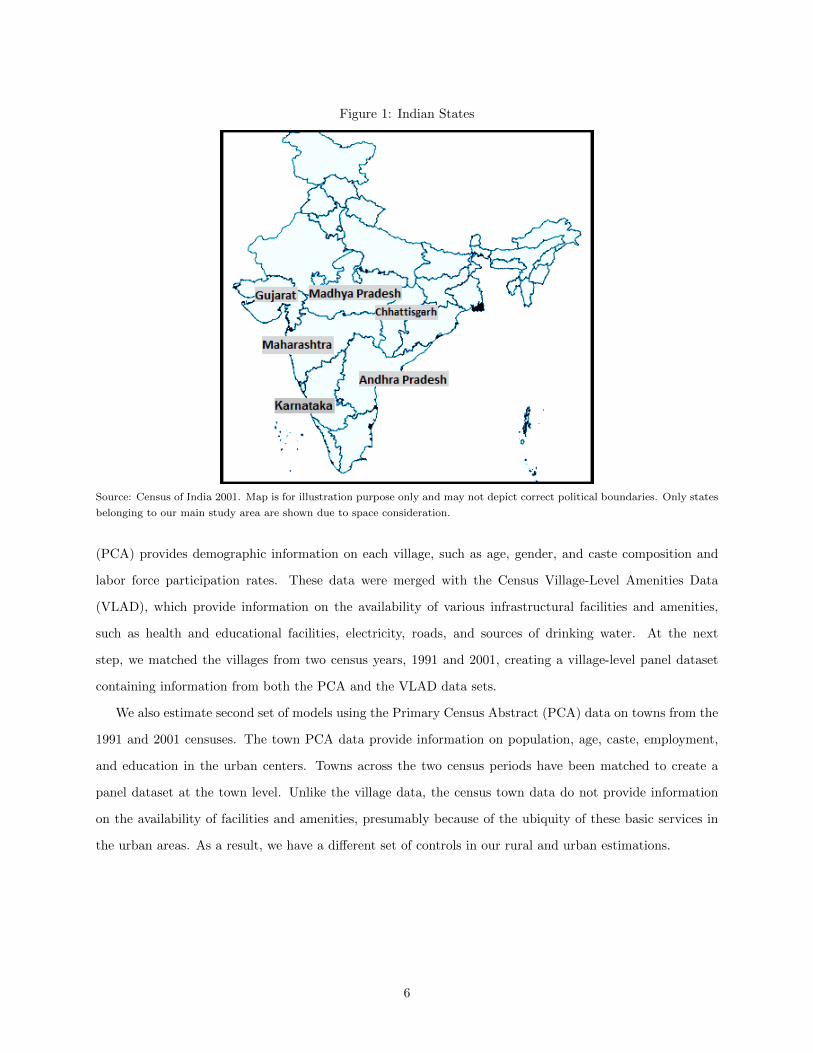
Figure 1: Indian States
Source: Census of India 2001. Map is for illustration purpose only and may not depict correct political boundaries. Only states
belonging to our main study area are shown due to space consideration.
(PCA) provides demographic information on each village, such as age, gender, and caste composition and
labor force participation rates. These data were merged with the Census Village-Level Amenities Data
(VLAD), which provide information on the availability of various infrastructural facilities and amenities,
such as health and educational facilities, electricity, roads, and sources of drinking water. At the next
step, we matched the villages from two census years, 1991 and 2001, creating a village-level panel dataset
containing information from both the PCA and the VLAD data sets.
We also estimate second set of models using the Primary Census Abstract (PCA) data on towns from the
1991 and 2001 censuses. The town PCA data provide information on population, age, caste, employment,
and education in the urban centers. Towns across the two census periods have been matched to create a
panel dataset at the town level. Unlike the village data, the census town data do not provide information
on the availability of facilities and amenities, presumably because of the ubiquity of these basic services in
the urban areas. As a result, we have a different set of controls in our rural and urban estimations.
6
4 Empirical Strategy
Our empirical strategy exploits spatial variation in the timing of the ban on sex-selective abortions. Villages
and towns in the state of Maharashtra, which had already passed and implemented legislation banning sex-
selective abortions in 1988, were not affected by the national PNDT Act in 1996, and as such constitute the
control group in our analysis. To avoid confusion with the conventional practice of referring to the group
without any treatment as a ‘control group’, we will hereafter refer to villages and towns in Maharashtra as
the ‘pre-treated’ group. The treatment (or the ‘newly-treated’) group consists of villages and towns in the
states bordering Maharashtra – states that experienced the centrally-mandated PNDT Act during the study
period 1991-2001.
Our estimating equation is:
yjt = τLawjt + αj + βt + γINFjt + δXjt + εjt (1)
where yjt is the child sex ratio (number of females aged 0-6 per 1,000 males aged 0-6) in the j-th village at
time t = 1, 2 (corresponding to years 1991 and 2001, respectively). On the right hand side, our main variable
of interest is the treatment status indicator (PNDT implementation) Lawjt. For pre-treated Maharashtra
villages, Lawjt = 1∀t, while for newly-treated non-Maharashtra villages, Lawj1 = 0 and Lawj2 = 1.
Among the control variables, INF is a time-varying vector of village and household infrastructure. Public
healthcare infrastructure is captured by the presence of at least one public health facility – a primary health
center, sub-center or a community health center. Additionally, we include the availability of a registered
private doctor, a community health worker, and a maternal or child welfare center in a village. Educational
facilities included in INF are the presence of a primary/middle school and a high school in a village. Other
infrastructural variables include the availability of a paved road, telephone service, electricity, and clean
drinking water (tap water) in a village.
A vector of village-level demographic characteristics is represented by the time-varying vector X. It
includes factors that may affect the strength of son preference among parents. Parental education is measured
by female and male literacy rates. To control for differences across ethnic groups, we include the percentages
of a village’s population that belongs to scheduled (low) castes (SC) and scheduled tribes (ST).13 The
standard of living in a village is captured by the mean amount of cultivated land per cultivator and the
percentage of cultivable land that is irrigated. Village size is controlled for by the inclusion of total log
population of a village.
Unobserved heterogeneity across villages is denoted by αj . It captures socioeconomic and cultural dif-
13SC and ST subpopulations are socio-economically backward groups designated by the Government of India
7
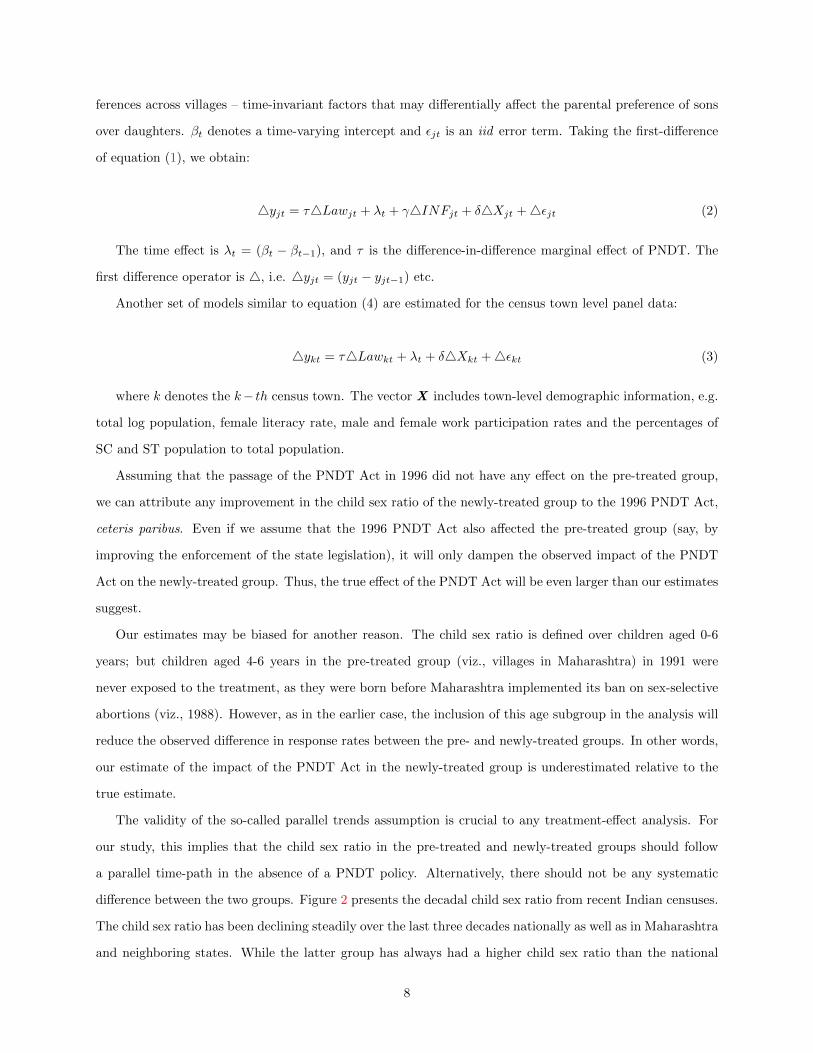
ferences across villages – time-invariant factors that may differentially affect the parental preference of sons
over daughters. βt denotes a time-varying intercept and εjt is an iid error term. Taking the first-difference
of equation (1), we obtain:
4yjt = τ4Lawjt + λt + γ4INFjt + δ4Xjt +4εjt (2)
The time effect is λt = (βt − βt−1), and τ is the difference-in-difference marginal effect of PNDT. The
first difference operator is 4, i.e. 4yjt = (yjt − yjt−1) etc.
Another set of models similar to equation (4) are estimated for the census town level panel data:
4ykt = τ4Lawkt + λt + δ4Xkt +4εkt (3)
where k denotes the k− th census town. The vector X includes town-level demographic information, e.g.
total log population, female literacy rate, male and female work participation rates and the percentages of
SC and ST population to total population.
Assuming that the passage of the PNDT Act in 1996 did not have any effect on the pre-treated group,
we can attribute any improvement in the child sex ratio of the newly-treated group to the 1996 PNDT Act,
ceteris paribus. Even if we assume that the 1996 PNDT Act also affected the pre-treated group (say, by
improving the enforcement of the state legislation), it will only dampen the observed impact of the PNDT
Act on the newly-treated group. Thus, the true effect of the PNDT Act will be even larger than our estimates
suggest.
Our estimates may be biased for another reason. The child sex ratio is defined over children aged 0-6
years; but children aged 4-6 years in the pre-treated group (viz., villages in Maharashtra) in 1991 were
never exposed to the treatment, as they were born before Maharashtra implemented its ban on sex-selective
abortions (viz., 1988). However, as in the earlier case, the inclusion of this age subgroup in the analysis will
reduce the observed difference in response rates between the pre- and newly-treated groups. In other words,
our estimate of the impact of the PNDT Act in the newly-treated group is underestimated relative to the
true estimate.
The validity of the so-called parallel trends assumption is crucial to any treatment-effect analysis. For
our study, this implies that the child sex ratio in the pre-treated and newly-treated groups should follow
a parallel time-path in the absence of a PNDT policy. Alternatively, there should not be any systematic
difference between the two groups. Figure 2 presents the decadal child sex ratio from recent Indian censuses.
The child sex ratio has been declining steadily over the last three decades nationally as well as in Maharashtra
and neighboring states. While the latter group has always had a higher child sex ratio than the national
8
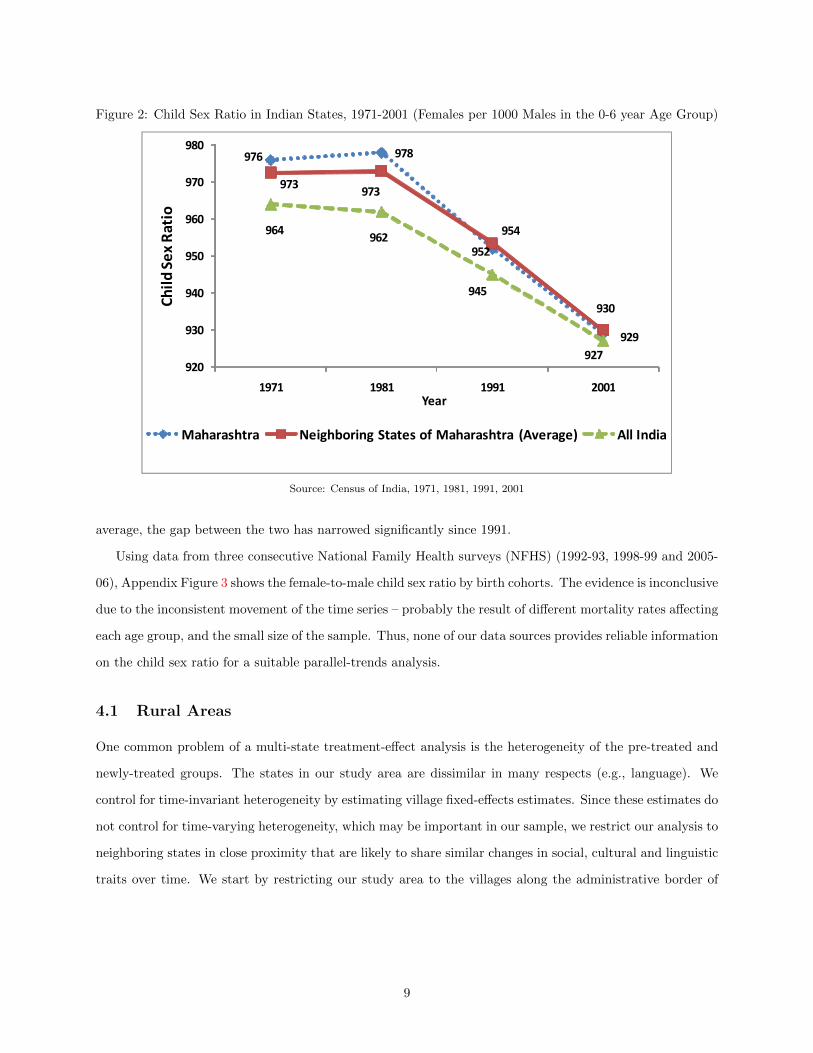
Figure 2: Child Sex Ratio in Indian States, 1971-2001 (Females per 1000 Males in the 0-6 year Age Group)
��� ���
���
���
��� ���
���
��
��� ���
���
�����
��
��
��
��
��
��
�� �� �� �
�����
����
���
����
����������� ������ ����������������������� �������� ����� ��
Source: Census of India, 1971, 1981, 1991, 2001
average, the gap between the two has narrowed significantly since 1991.
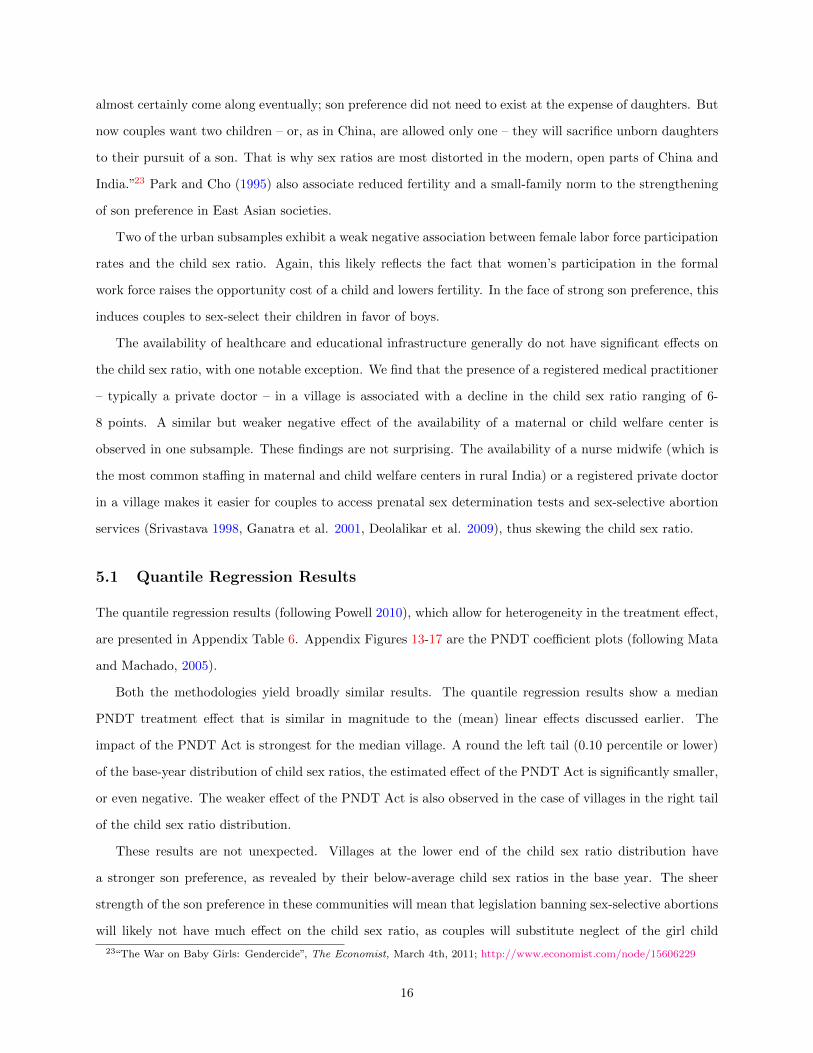
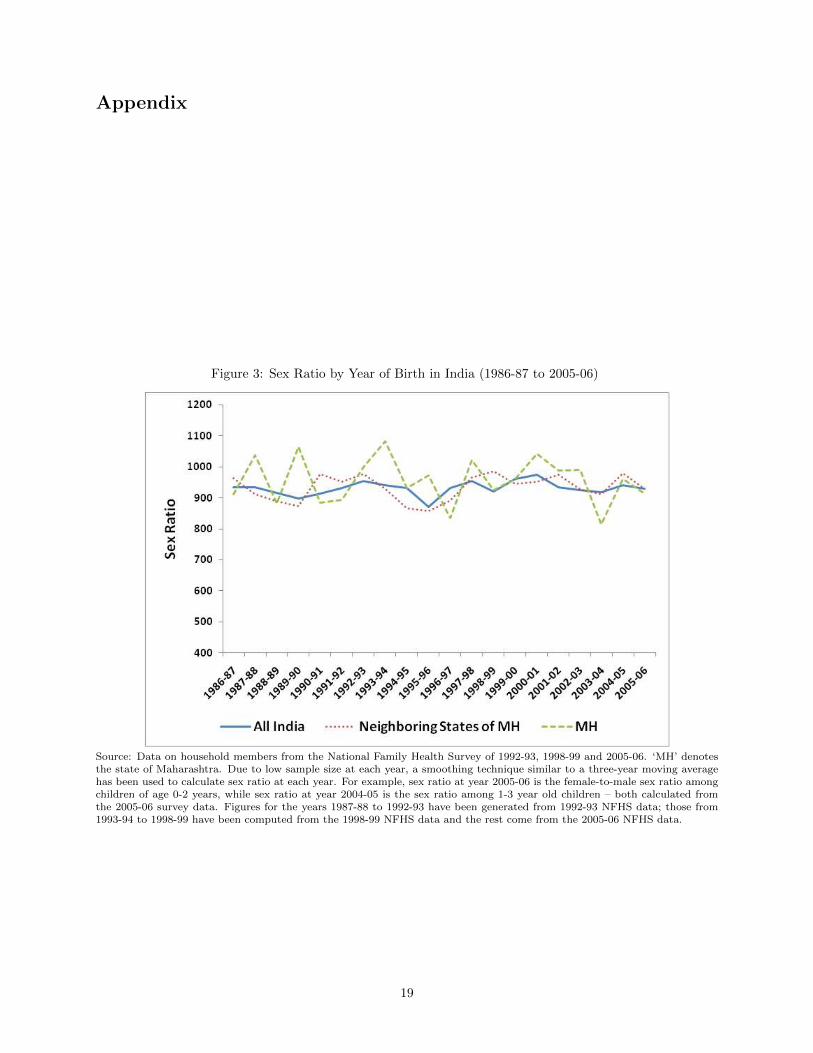
Using data from three consecutive National Family Health surveys (NFHS) (1992-93, 1998-99 and 2005-
06), Appendix Figure 3 shows the female-to-male child sex ratio by birth cohorts. The evidence is inconclusive
due to the inconsistent movement of the time series – probably the result of different mortality rates affecting
each age group, and the small size of the sample. Thus, none of our data sources provides reliable information
on the child sex ratio for a suitable parallel-trends analysis.
4.1 Rural Areas
One common problem of a multi-state treatment-effect analysis is the heterogeneity of the pre-treated and
newly-treated groups. The states in our study area are dissimilar in many respects (e.g., language). We
control for time-invariant heterogeneity by estimating village fixed-effects estimates. Since these estimates do
not control for time-varying heterogeneity, which may be important in our sample, we restrict our analysis to
neighboring states in close proximity that are likely to share similar changes in social, cultural and linguistic
traits over time. We start by restricting our study area to the villages along the administrative border of
9
Maharashtra and its neighboring states (Subsample I).14 The resulting sample includes 7,800 villages from the
border taluks (sub-districts) inside Maharashtra (pre-treated group) and 9,200 villages from non-Maharashtra
taluks bordering Maharashtra (newly-treated group).15
One downside of this approach is that our study area is susceptible to spillover effects. In the absence
of any cross-border migration restrictions, couples in the pre-treated group of villages seeking sex-selective
abortions could have readily traveled to a clinic just outside Maharashtra’s border (until the national PNDT
Act of 1996 was implemented in the other states). If we consider the case of complete contamination,
where couples from the pre-treated area continue to obtain tests across the border until a nationwide ban
is implemented, we will observe no relative improvement in the child sex ratio in the newly-treated areas as
compared to the pre-treated areas. Partial spillover will attenuate the observed impact of the PNDT Act on
the newly-treated group.
Next, we expand the analysis to a second subsample which is less vulnerable to contamination. Villages
are drawn from all the districts located along the border of Maharashtra and neighbor states; however, we
drop the villages from the immediate taluks on both sides of the Maharashtra border (Subsample II). This
gives us a sample of 16,300 pre-treated and 17,500 newly-treated villages. The motivation behind choosing
this subsample is that a pre-treated Maharashtra village is similar in characteristics to a newly-treated
village from a neighboring non-Maharashtra district, but the two villages are still adequately distant to
prevent spillovers.
To check the robustness of our results and for the sake of comparison, two additional subsamples are used
– Subsample III, which includes all villages from Maharashtra and neighboring states except the ones from
immediate districts on both sides of the border. This subsample contains 15,640 pre-treated and 113,900
newly-treated villages. Subsample IV includes all villages from Maharashtra and all villages from neighboring
states. There are 39,711 villages in Maharashtra and 140,622 villages in all the neighboring states.
Finally, Subsample V includes villages from Maharashtra and all other major states in the country (the
latter forming the newly-treated sample).16 The pre-treated group includes 39,711 villages from Maharashtra
and 502,462 villages from the rest of the country.17
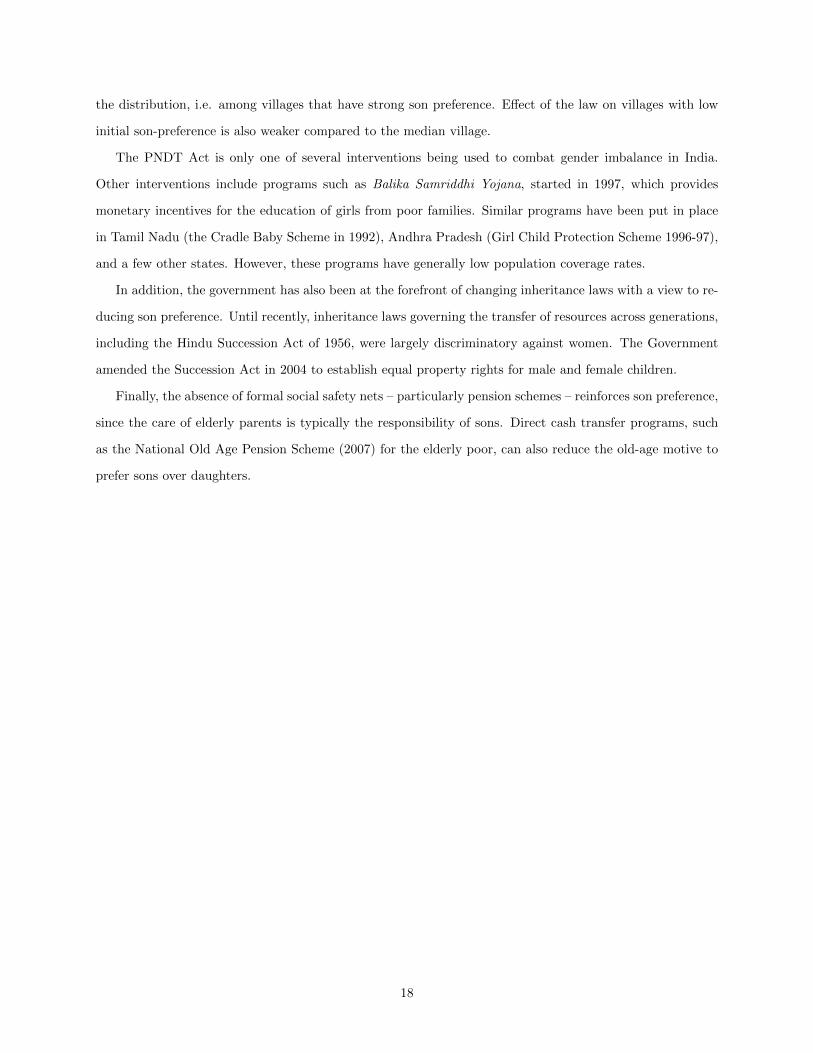
Table 1 presents mean child sex ratios across various rural census subsamples. Figures 4-8 in the Appendix
provide a snapshot of changes in the child sex ratio over our study period across the rural subsamples. The
14The administrative division of rural India is as follows – each state (median population size 44.1 million) is divided intoseveral districts (median population size 1.5 million). Each district is divided into several sub-districts or taluks (medianpopulation size 170,638). Each taluk consists of numerous villages (median population size 747). Median population sizes arebased on 2001 census data of 19 major states.
15District- and taluk-level administrative maps from Census 2001 were used to identify pre-treated and newly-treated villagesin various subsamples. Official district maps from the Census are provided in the Appendix.
16We include Maharashtra and 18 other major states in the sample. Smaller north-eastern states (except Assam), Goa, Delhiand Union Territories have been excluded from the analysis.
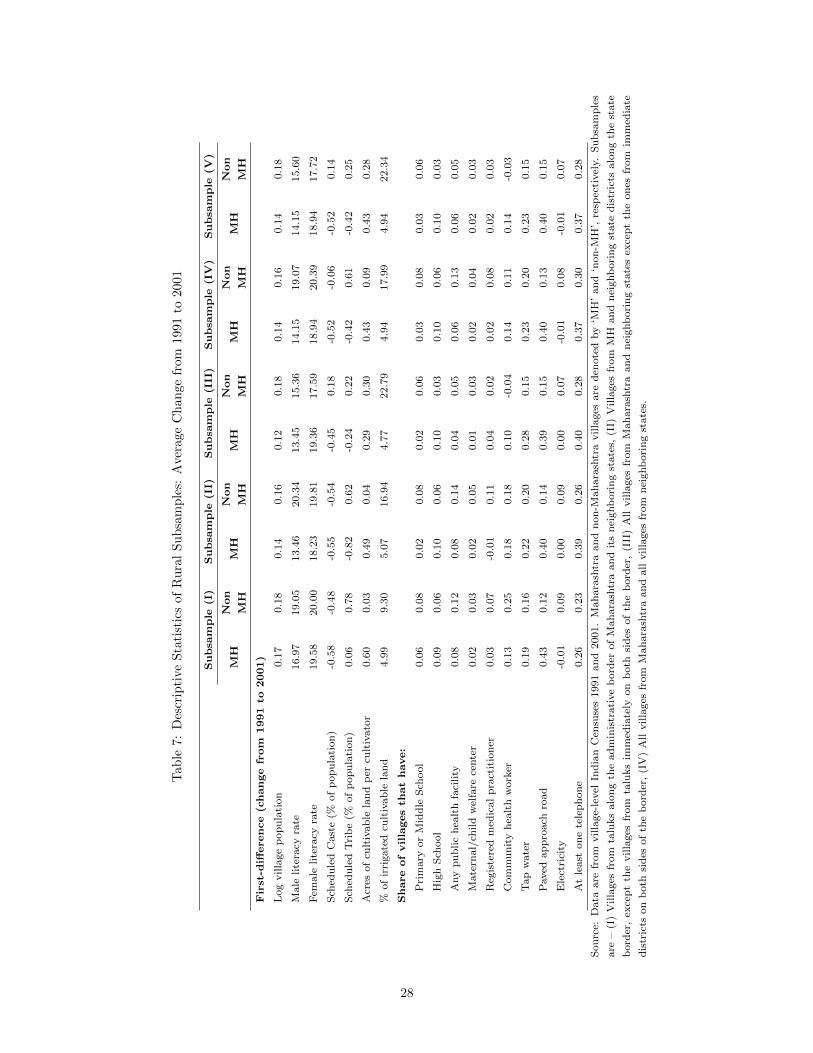
17Brief descriptive statistics on the characteristics of all five rural subsamples are presented in Appendix Table 7.
10
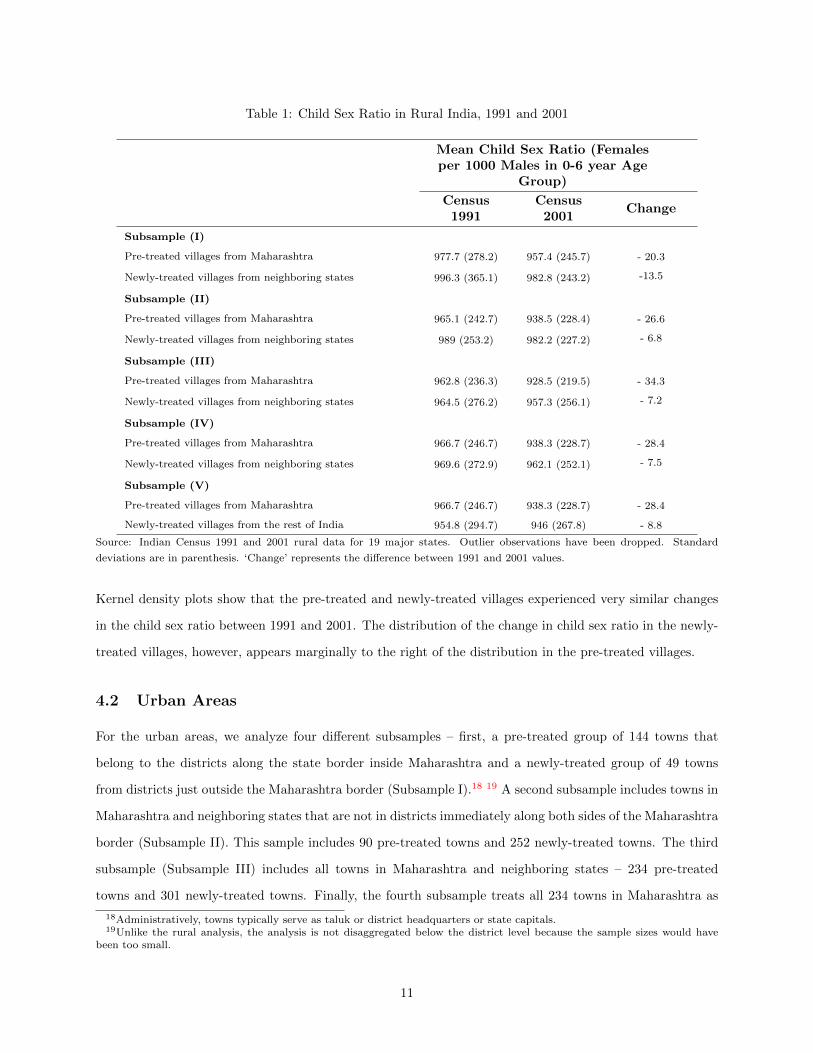
Table 1: Child Sex Ratio in Rural India, 1991 and 2001
Mean Child Sex Ratio (Femalesper 1000 Males in 0-6 year Age
Group)
Census1991
Census2001
Change
Subsample (I)
Pre-treated villages from Maharashtra 977.7 (278.2) 957.4 (245.7) - 20.3
Newly-treated villages from neighboring states 996.3 (365.1) 982.8 (243.2) -13.5
Subsample (II)
Pre-treated villages from Maharashtra 965.1 (242.7) 938.5 (228.4) - 26.6
Newly-treated villages from neighboring states 989 (253.2) 982.2 (227.2) - 6.8
Subsample (III)
Pre-treated villages from Maharashtra 962.8 (236.3) 928.5 (219.5) - 34.3
Newly-treated villages from neighboring states 964.5 (276.2) 957.3 (256.1) - 7.2
Subsample (IV)
Pre-treated villages from Maharashtra 966.7 (246.7) 938.3 (228.7) - 28.4
Newly-treated villages from neighboring states 969.6 (272.9) 962.1 (252.1) - 7.5
Subsample (V)
Pre-treated villages from Maharashtra 966.7 (246.7) 938.3 (228.7) - 28.4
Newly-treated villages from the rest of India 954.8 (294.7) 946 (267.8) - 8.8
Source: Indian Census 1991 and 2001 rural data for 19 major states. Outlier observations have been dropped. Standard
deviations are in parenthesis. ‘Change’ represents the difference between 1991 and 2001 values.
Kernel density plots show that the pre-treated and newly-treated villages experienced very similar changes
in the child sex ratio between 1991 and 2001. The distribution of the change in child sex ratio in the newly-
treated villages, however, appears marginally to the right of the distribution in the pre-treated villages.
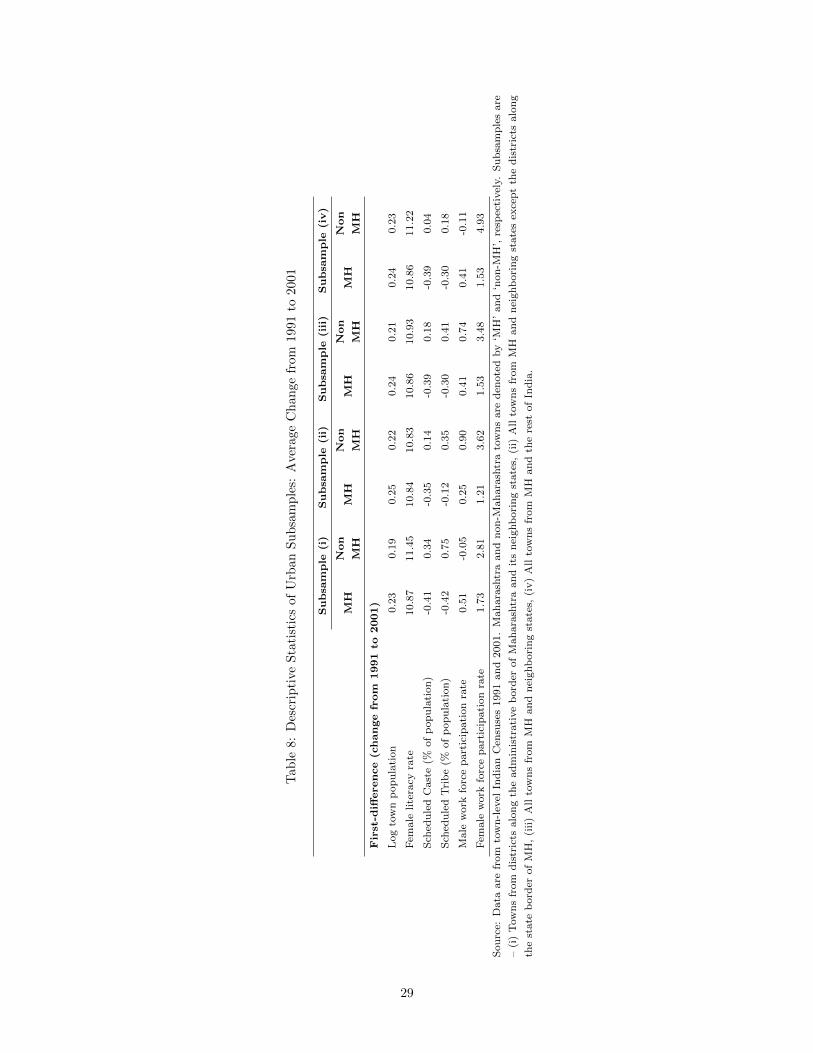
4.2 Urban Areas
For the urban areas, we analyze four different subsamples – first, a pre-treated group of 144 towns that
belong to the districts along the state border inside Maharashtra and a newly-treated group of 49 towns
from districts just outside the Maharashtra border (Subsample I).18 19 A second subsample includes towns in
Maharashtra and neighboring states that are not in districts immediately along both sides of the Maharashtra
border (Subsample II). This sample includes 90 pre-treated towns and 252 newly-treated towns. The third
subsample (Subsample III) includes all towns in Maharashtra and neighboring states – 234 pre-treated
towns and 301 newly-treated towns. Finally, the fourth subsample treats all 234 towns in Maharashtra as
18Administratively, towns typically serve as taluk or district headquarters or state capitals.19Unlike the rural analysis, the analysis is not disaggregated below the district level because the sample sizes would have
been too small.
11
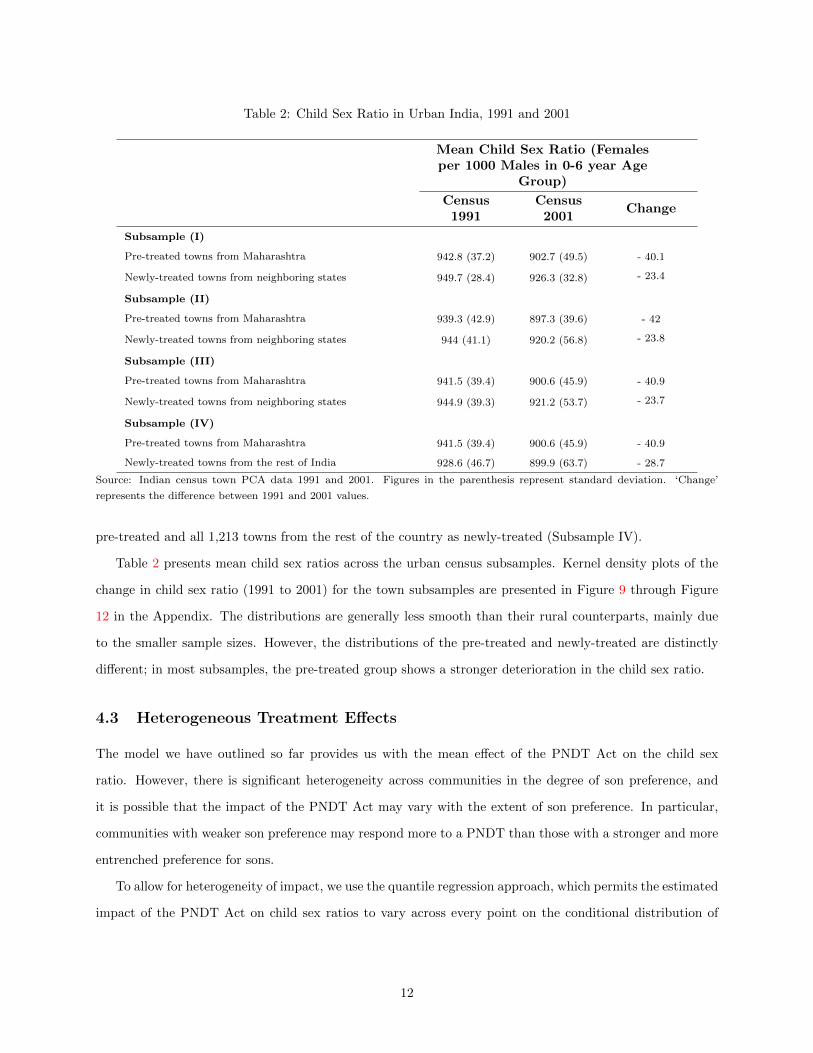
Table 2: Child Sex Ratio in Urban India, 1991 and 2001
Mean Child Sex Ratio (Femalesper 1000 Males in 0-6 year Age
Group)
Census1991
Census2001
Change
Subsample (I)
Pre-treated towns from Maharashtra 942.8 (37.2) 902.7 (49.5) - 40.1
Newly-treated towns from neighboring states 949.7 (28.4) 926.3 (32.8) - 23.4
Subsample (II)
Pre-treated towns from Maharashtra 939.3 (42.9) 897.3 (39.6) - 42
Newly-treated towns from neighboring states 944 (41.1) 920.2 (56.8) - 23.8
Subsample (III)
Pre-treated towns from Maharashtra 941.5 (39.4) 900.6 (45.9) - 40.9
Newly-treated towns from neighboring states 944.9 (39.3) 921.2 (53.7) - 23.7
Subsample (IV)
Pre-treated towns from Maharashtra 941.5 (39.4) 900.6 (45.9) - 40.9
Newly-treated towns from the rest of India 928.6 (46.7) 899.9 (63.7) - 28.7
Source: Indian census town PCA data 1991 and 2001. Figures in the parenthesis represent standard deviation. ‘Change’
represents the difference between 1991 and 2001 values.
pre-treated and all 1,213 towns from the rest of the country as newly-treated (Subsample IV).
Table 2 presents mean child sex ratios across the urban census subsamples. Kernel density plots of the
change in child sex ratio (1991 to 2001) for the town subsamples are presented in Figure 9 through Figure
12 in the Appendix. The distributions are generally less smooth than their rural counterparts, mainly due
to the smaller sample sizes. However, the distributions of the pre-treated and newly-treated are distinctly
different; in most subsamples, the pre-treated group shows a stronger deterioration in the child sex ratio.
4.3 Heterogeneous Treatment Effects
The model we have outlined so far provides us with the mean effect of the PNDT Act on the child sex
ratio. However, there is significant heterogeneity across communities in the degree of son preference, and
it is possible that the impact of the PNDT Act may vary with the extent of son preference. In particular,
communities with weaker son preference may respond more to a PNDT than those with a stronger and more
entrenched preference for sons.
To allow for heterogeneity of impact, we use the quantile regression approach, which permits the estimated
impact of the PNDT Act on child sex ratios to vary across every point on the conditional distribution of
12
the child sex ratio.20 There is one problem, however; first-differencing of the data, which we use in this
paper to control for unobserved village fixed effects, redefines the quantiles of the underlying distribution.
In other words, regression coefficients estimated at the various percentile points (say 0.25, 0.50, 0.75) of the
distribution of 4y may not be interpreted in the same way as similar coefficients obtained from quantile
regressions of y.
We are interested in knowing how the treatment effect varies across the distribution of the child sex ratio
in 1991 – not how it varies across the distribution of the 1991-2001 change in the child sex ratio. Thus, our
objective is to first-difference the data (i.e., use 4y as the dependent variable in our analysis), but to then
estimate the regression at different points of the conditional distribution of y, not 4y. To the best of our
knowledge, only Powell (2010) provides an econometric technique suitable for this framework. Following his
methodology, we estimate a GMM regression model where the quantiles are defined by both observation-
specific and fixed-effect residuals. The resulting coefficient can thus be interpreted in the same fashion as a
regular cross-sectional quantile regression estimate. Due to space constraint, we only report 0.10, 0.25, 0.50
(median), 0.75 and 0.90 percentile regression results from village subsample (V), i.e. all villages across the
country, in the Appendix. Additional results are available from the authors.
Another alternative methodology uses a sampling technique in the manner of Mata and Machado (2005).
Broadly speaking, this methodology involves taking a large random sample (5000 observations in our case)
from the dataset at each percentile of the conditional distribution of the child sex ratio in the base year (1991).
A first-difference regression is then run on each of these 100 samples, thereby mimicking quantile regressions
where the percentile points are based on the 1991 distribution of child sex ratio. The PNDT coefficients
(along with 95% confidence intervals) from these regressions are presented as graphs in the Appendix.
5 Empirical Findings
The basic results from the village fixed-effects models estimated using the first two rural subsamples are
presented in Table 3. Results from rural subsamples (III), (IV), and (V) serve as robustness checks. These
results are presented in Appendix Table 5 and mentioned, whenever relevant, in our current discussion. All
regression models correct for an unknown form of heteroskedasticity, using the Huber-White method. Results
are robust to clustering at the state, district, and taluk levels.
The first row in Table 3 presents the treatment effect estimates. Results from the first subsample – pre-
treated and newly-treated villages from immediate taluks on both sides of Maharashtra border – do not show
any significant impact of the PNDT Act. Given that these geographically close communities are susceptible
20Koenker and Bassett (1978).
13
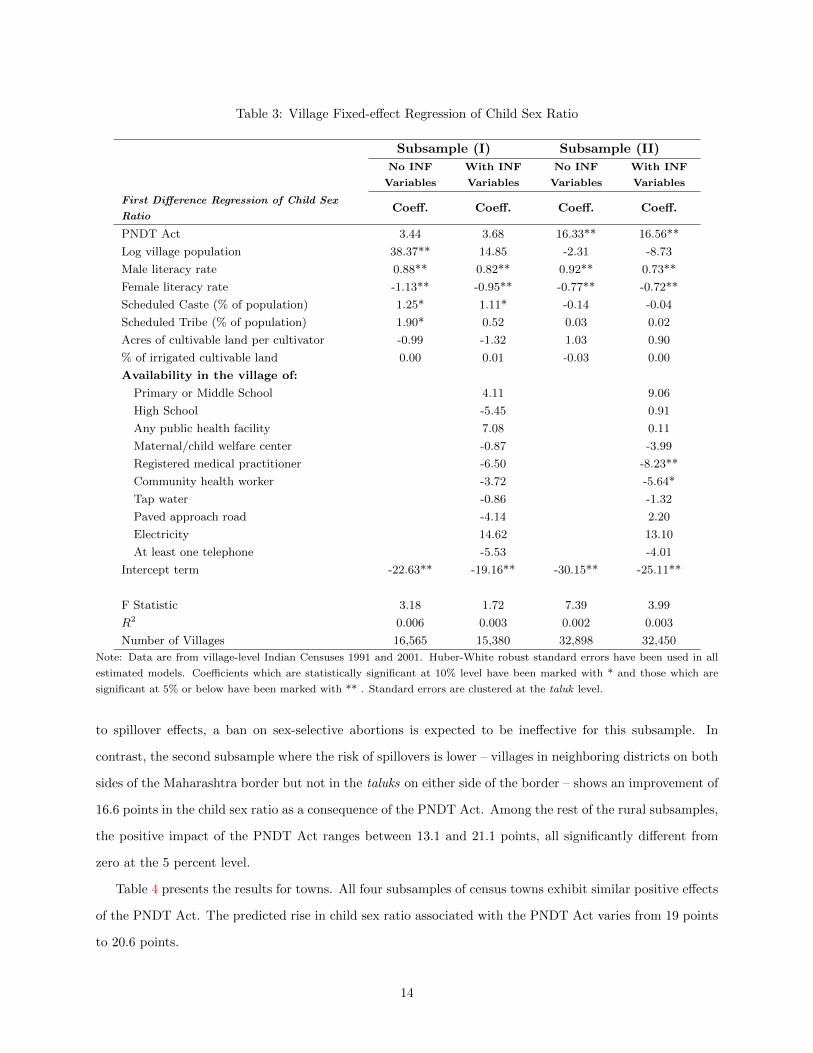
Table 3: Village Fixed-effect Regression of Child Sex Ratio
Subsample (I) Subsample (II)
No INF
Variables
With INF
Variables
No INF
Variables
With INF
Variables
First Difference Regression of Child Sex
RatioCoeff. Coeff. Coeff. Coeff.
PNDT Act 3.44 3.68 16.33** 16.56**
Log village population 38.37** 14.85 -2.31 -8.73
Male literacy rate 0.88** 0.82** 0.92** 0.73**
Female literacy rate -1.13** -0.95** -0.77** -0.72**
Scheduled Caste (% of population) 1.25* 1.11* -0.14 -0.04
Scheduled Tribe (% of population) 1.90* 0.52 0.03 0.02
Acres of cultivable land per cultivator -0.99 -1.32 1.03 0.90
% of irrigated cultivable land 0.00 0.01 -0.03 0.00
Availability in the village of:
Primary or Middle School 4.11 9.06
High School -5.45 0.91
Any public health facility 7.08 0.11
Maternal/child welfare center -0.87 -3.99
Registered medical practitioner -6.50 -8.23**
Community health worker -3.72 -5.64*
Tap water -0.86 -1.32
Paved approach road -4.14 2.20
Electricity 14.62 13.10
At least one telephone -5.53 -4.01
Intercept term -22.63** -19.16** -30.15** -25.11**
F Statistic 3.18 1.72 7.39 3.99
R2 0.006 0.003 0.002 0.003
Number of Villages 16,565 15,380 32,898 32,450
Note: Data are from village-level Indian Censuses 1991 and 2001. Huber-White robust standard errors have been used in all
estimated models. Coefficients which are statistically significant at 10% level have been marked with * and those which are
significant at 5% or below have been marked with ** . Standard errors are clustered at the taluk level.
to spillover effects, a ban on sex-selective abortions is expected to be ineffective for this subsample. In
contrast, the second subsample where the risk of spillovers is lower – villages in neighboring districts on both
sides of the Maharashtra border but not in the taluks on either side of the border – shows an improvement of
16.6 points in the child sex ratio as a consequence of the PNDT Act. Among the rest of the rural subsamples,
the positive impact of the PNDT Act ranges between 13.1 and 21.1 points, all significantly different from
zero at the 5 percent level.
Table 4 presents the results for towns. All four subsamples of census towns exhibit similar positive effects
of the PNDT Act. The predicted rise in child sex ratio associated with the PNDT Act varies from 19 points
to 20.6 points.
14
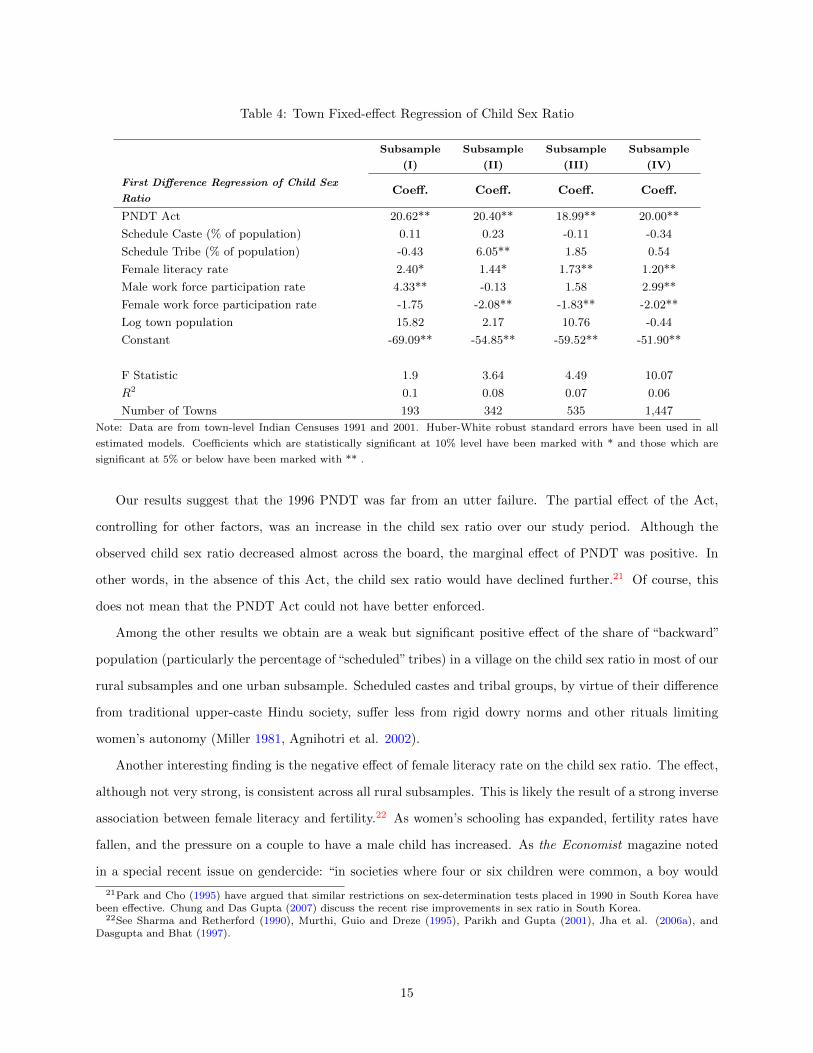
Table 4: Town Fixed-effect Regression of Child Sex Ratio
Subsample
(I)
Subsample
(II)
Subsample
(III)
Subsample
(IV)
First Difference Regression of Child Sex
RatioCoeff. Coeff. Coeff. Coeff.
PNDT Act 20.62** 20.40** 18.99** 20.00**
Schedule Caste (% of population) 0.11 0.23 -0.11 -0.34
Schedule Tribe (% of population) -0.43 6.05** 1.85 0.54
Female literacy rate 2.40* 1.44* 1.73** 1.20**
Male work force participation rate 4.33** -0.13 1.58 2.99**
Female work force participation rate -1.75 -2.08** -1.83** -2.02**
Log town population 15.82 2.17 10.76 -0.44
Constant -69.09** -54.85** -59.52** -51.90**
F Statistic 1.9 3.64 4.49 10.07
R2 0.1 0.08 0.07 0.06
Number of Towns 193 342 535 1,447
Note: Data are from town-level Indian Censuses 1991 and 2001. Huber-White robust standard errors have been used in all
estimated models. Coefficients which are statistically significant at 10% level have been marked with * and those which are
significant at 5% or below have been marked with ** .
Our results suggest that the 1996 PNDT was far from an utter failure. The partial effect of the Act,
controlling for other factors, was an increase in the child sex ratio over our study period. Although the
observed child sex ratio decreased almost across the board, the marginal effect of PNDT was positive. In
other words, in the absence of this Act, the child sex ratio would have declined further.21 Of course, this
does not mean that the PNDT Act could not have better enforced.
Among the other results we obtain are a weak but significant positive effect of the share of “backward”
population (particularly the percentage of “scheduled” tribes) in a village on the child sex ratio in most of our
rural subsamples and one urban subsample. Scheduled castes and tribal groups, by virtue of their difference
from traditional upper-caste Hindu society, suffer less from rigid dowry norms and other rituals limiting
women’s autonomy (Miller 1981, Agnihotri et al. 2002).
Another interesting finding is the negative effect of female literacy rate on the child sex ratio. The effect,
although not very strong, is consistent across all rural subsamples. This is likely the result of a strong inverse
association between female literacy and fertility.22 As women’s schooling has expanded, fertility rates have
fallen, and the pressure on a couple to have a male child has increased. As the Economist magazine noted
in a special recent issue on gendercide: “in societies where four or six children were common, a boy would
21Park and Cho (1995) have argued that similar restrictions on sex-determination tests placed in 1990 in South Korea havebeen effective. Chung and Das Gupta (2007) discuss the recent rise improvements in sex ratio in South Korea.
22See Sharma and Retherford (1990), Murthi, Guio and Dreze (1995), Parikh and Gupta (2001), Jha et al. (2006a), andDasgupta and Bhat (1997).
15
almost certainly come along eventually; son preference did not need to exist at the expense of daughters. But
now couples want two children – or, as in China, are allowed only one – they will sacrifice unborn daughters
to their pursuit of a son. That is why sex ratios are most distorted in the modern, open parts of China and
India.”23 Park and Cho (1995) also associate reduced fertility and a small-family norm to the strengthening
of son preference in East Asian societies.
Two of the urban subsamples exhibit a weak negative association between female labor force participation
rates and the child sex ratio. Again, this likely reflects the fact that women’s participation in the formal
work force raises the opportunity cost of a child and lowers fertility. In the face of strong son preference, this
induces couples to sex-select their children in favor of boys.
The availability of healthcare and educational infrastructure generally do not have significant effects on
the child sex ratio, with one notable exception. We find that the presence of a registered medical practitioner
– typically a private doctor – in a village is associated with a decline in the child sex ratio ranging of 6-
8 points. A similar but weaker negative effect of the availability of a maternal or child welfare center is
observed in one subsample. These findings are not surprising. The availability of a nurse midwife (which is
the most common staffing in maternal and child welfare centers in rural India) or a registered private doctor
in a village makes it easier for couples to access prenatal sex determination tests and sex-selective abortion
services (Srivastava 1998, Ganatra et al. 2001, Deolalikar et al. 2009), thus skewing the child sex ratio.
5.1 Quantile Regression Results
The quantile regression results (following Powell 2010), which allow for heterogeneity in the treatment effect,
are presented in Appendix Table 6. Appendix Figures 13-17 are the PNDT coefficient plots (following Mata
and Machado, 2005).
Both the methodologies yield broadly similar results. The quantile regression results show a median
PNDT treatment effect that is similar in magnitude to the (mean) linear effects discussed earlier. The
impact of the PNDT Act is strongest for the median village. A round the left tail (0.10 percentile or lower)
of the base-year distribution of child sex ratios, the estimated effect of the PNDT Act is significantly smaller,
or even negative. The weaker effect of the PNDT Act is also observed in the case of villages in the right tail
of the child sex ratio distribution.
These results are not unexpected. Villages at the lower end of the child sex ratio distribution have
a stronger son preference, as revealed by their below-average child sex ratios in the base year. The sheer
strength of the son preference in these communities will mean that legislation banning sex-selective abortions
will likely not have much effect on the child sex ratio, as couples will substitute neglect of the girl child
23“The War on Baby Girls: Gendercide”, The Economist, March 4th, 2011; http://www.economist.com/node/15606229
16

(which in turn would lead to excess mortality among girls) for sex-selective abortions. Likewise, at higher
quantiles of the conditional distribution (corresponding to higher child sex ratios and an indication of weak
son preference), the PNDT Act is also likely to have less impact, as the incidence of sex-selection practice is
already very low in such villages.
It is important to qualify our empirical results. First, similar to many treatment-effect studies, we have
no way to capture the regional or temporal variation in the enforcement of the PNDT Act. It is possible
for a part or all of the positive impact of the PNDT to originate from differences in enforcement between
the pre-treated and newly-treated communities. However, given the robustness of the results across various
rural and urban subsamples, it is unlikely that this is a serious problem with our analysis.
Second, our fixed-effect estimates ignore other time-varying changes in socioeconomic and cultural factors
that may differentially affect the pre-treated and newly-treated communities. This concern is mitigated by
our use of several subsamples, but these unobserved changes could still alter the magnitude of the impact of
the PNDT Act.
6 Conclusion
In this paper we use a policy variation to examine the causal impact of a legislative ban on sex-selective
abortions in India on child sex ratios. Using village- and town-level longitudinal data from the 1991 and
2001 censuses, we find a positive and significant causal impact of the 1994 PNDT Act on child sex ratios.
Our estimates suggest that, controlling for other factors, the PNDT Act accounts for an increase of 16-21
points in the child sex ratio. Our results are robust to a variety of methodologies and subsamples. While
the magnitude of the estimated effect may seem small, our calculations indicate that the PNDT Act may
have resulted in an additional 51,000 surviving girls aged 0-6 years in the newly-treated areas.
Our results are in stark contrast to the common perception in India that the PNDT Act has been a
failure. The perception is based on the fact that the child sex ratio in the country has continued to fall
even after the passage and implementation of the Act. However, our analysis suggests that in the absence
of the PNDT Act, the child sex ratio in the country would have declined even more than it did. Naturally,
our results say nothing about the room for improvement in the implementation of the PNDT Act. There is
no question that the Act is unevenly and weakly enforced. Encouragingly, however, the Indian government
expanded the provisions of the PNDT Act in 2003 and has been strengthening its enforcement
When we allow for heterogenous impact of the PNDT Act, we find that the PNDT Act has been most
effective among villages with average base-year characteristics, i.e. those around the median of the 1991 child
sex ratio distribution. We find the weakest impact (or a negative impact) of the law around the left tail of
17
the distribution, i.e. among villages that have strong son preference. Effect of the law on villages with low
initial son-preference is also weaker compared to the median village.
The PNDT Act is only one of several interventions being used to combat gender imbalance in India.
Other interventions include programs such as Balika Samriddhi Yojana, started in 1997, which provides
monetary incentives for the education of girls from poor families. Similar programs have been put in place
in Tamil Nadu (the Cradle Baby Scheme in 1992), Andhra Pradesh (Girl Child Protection Scheme 1996-97),
and a few other states. However, these programs have generally low population coverage rates.
In addition, the government has also been at the forefront of changing inheritance laws with a view to re-
ducing son preference. Until recently, inheritance laws governing the transfer of resources across generations,
including the Hindu Succession Act of 1956, were largely discriminatory against women. The Government
amended the Succession Act in 2004 to establish equal property rights for male and female children.
Finally, the absence of formal social safety nets – particularly pension schemes – reinforces son preference,
since the care of elderly parents is typically the responsibility of sons. Direct cash transfer programs, such
as the National Old Age Pension Scheme (2007) for the elderly poor, can also reduce the old-age motive to
prefer sons over daughters.
18
Appendix
Figure 3: Sex Ratio by Year of Birth in India (1986-87 to 2005-06)
Source: Data on household members from the National Family Health Survey of 1992-93, 1998-99 and 2005-06. ‘MH’ denotesthe state of Maharashtra. Due to low sample size at each year, a smoothing technique similar to a three-year moving averagehas been used to calculate sex ratio at each year. For example, sex ratio at year 2005-06 is the female-to-male sex ratio amongchildren of age 0-2 years, while sex ratio at year 2004-05 is the sex ratio among 1-3 year old children – both calculated fromthe 2005-06 survey data. Figures for the years 1987-88 to 1992-93 have been generated from 1992-93 NFHS data; those from1993-94 to 1998-99 have been computed from the 1998-99 NFHS data and the rest come from the 2005-06 NFHS data.
19
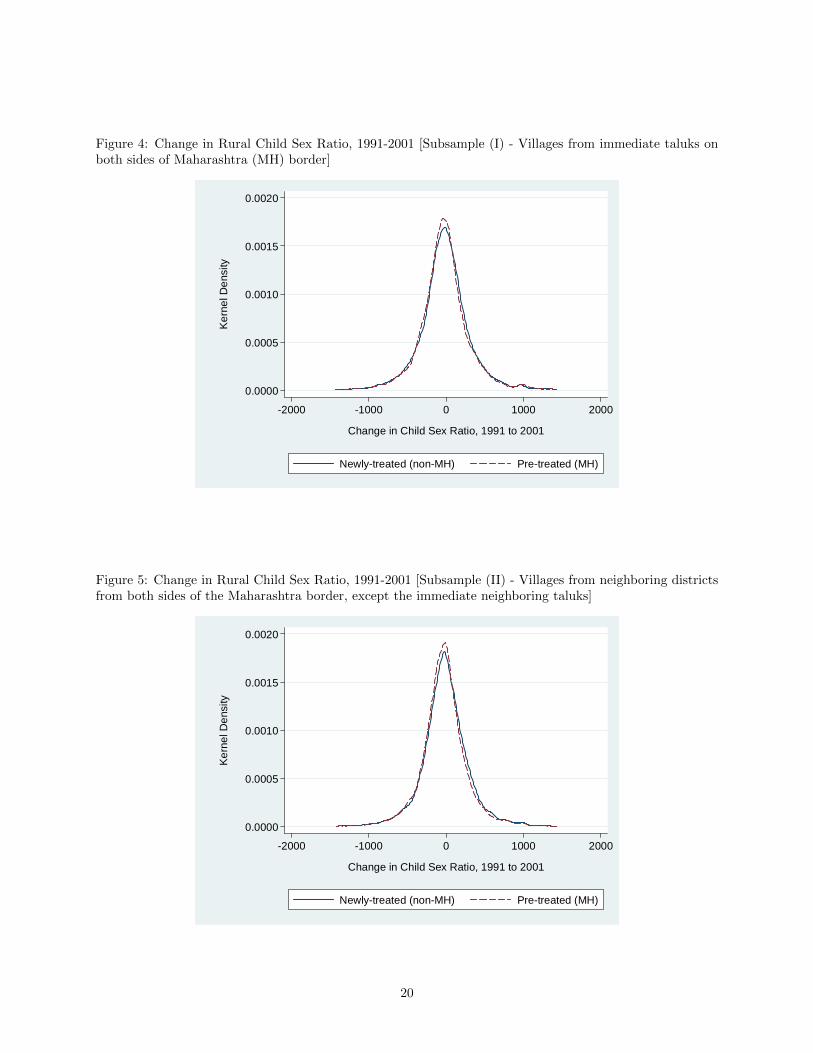
Figure 4: Change in Rural Child Sex Ratio, 1991-2001 [Subsample (I) - Villages from immediate taluks onboth sides of Maharashtra (MH) border]
0.0000
0.0005
0.0010
0.0015
0.0020
Ker
nel D
ensi
ty
-2000 -1000 0 1000 2000
Change in Child Sex Ratio, 1991 to 2001
Newly-treated (non-MH) Pre-treated (MH)
Figure 5: Change in Rural Child Sex Ratio, 1991-2001 [Subsample (II) - Villages from neighboring districtsfrom both sides of the Maharashtra border, except the immediate neighboring taluks]
0.0000
0.0005
0.0010
0.0015
0.0020
Ker
nel D
ensi
ty
-2000 -1000 0 1000 2000
Change in Child Sex Ratio, 1991 to 2001
Newly-treated (non-MH) Pre-treated (MH)
20
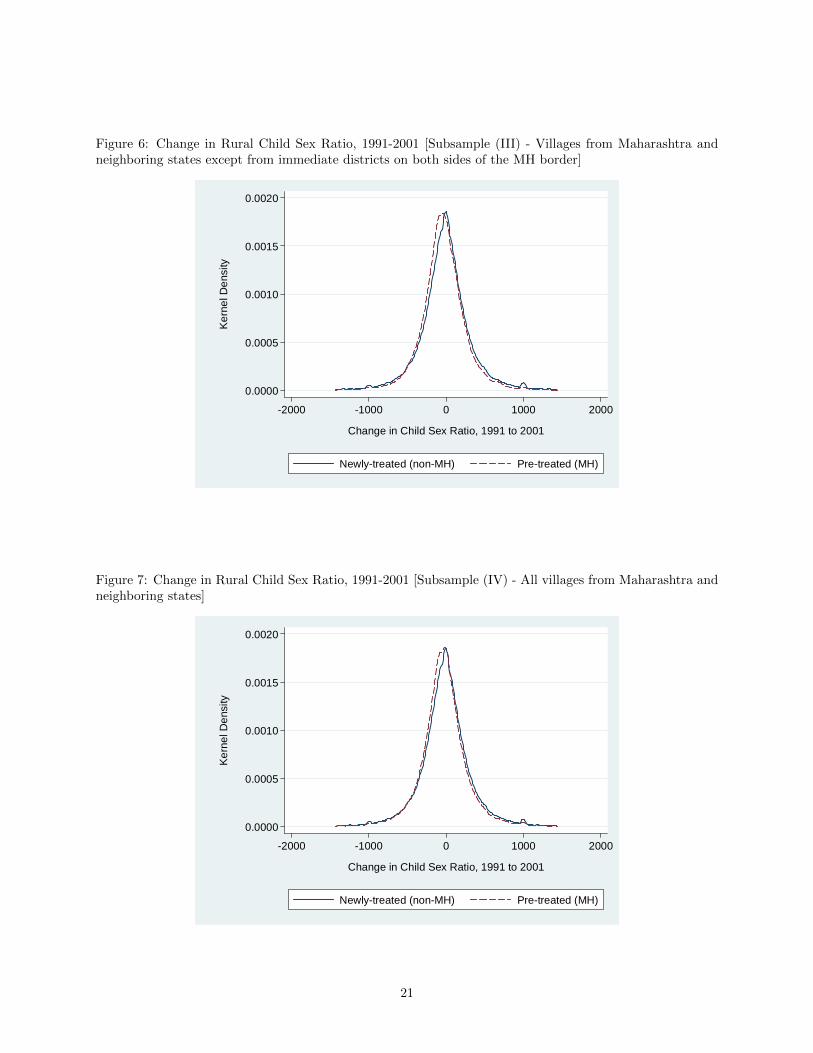
Figure 6: Change in Rural Child Sex Ratio, 1991-2001 [Subsample (III) - Villages from Maharashtra andneighboring states except from immediate districts on both sides of the MH border]
0.0000
0.0005
0.0010
0.0015
0.0020
Ker
nel D
ensi
ty
-2000 -1000 0 1000 2000
Change in Child Sex Ratio, 1991 to 2001
Newly-treated (non-MH) Pre-treated (MH)
Figure 7: Change in Rural Child Sex Ratio, 1991-2001 [Subsample (IV) - All villages from Maharashtra andneighboring states]
0.0000
0.0005
0.0010
0.0015
0.0020
Ker
nel D
ensi
ty
-2000 -1000 0 1000 2000
Change in Child Sex Ratio, 1991 to 2001
Newly-treated (non-MH) Pre-treated (MH)
21
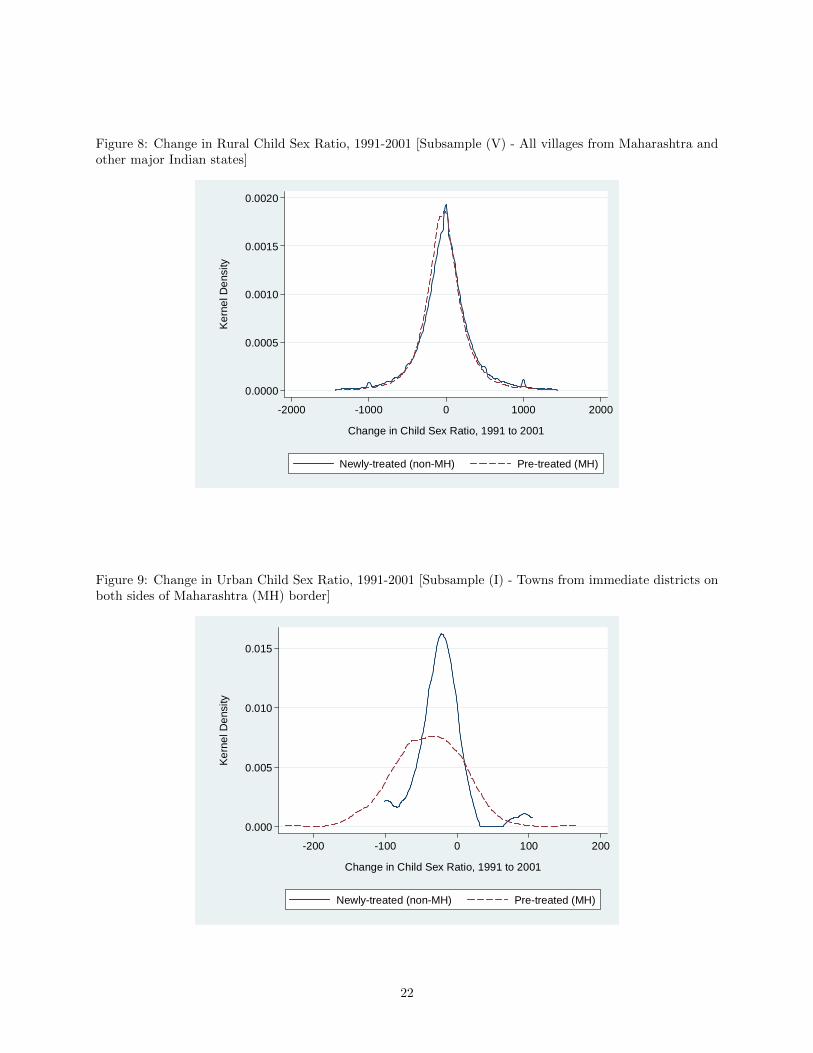
Figure 8: Change in Rural Child Sex Ratio, 1991-2001 [Subsample (V) - All villages from Maharashtra andother major Indian states]
0.0000
0.0005
0.0010
0.0015
0.0020
Ker
nel D
ensi
ty
-2000 -1000 0 1000 2000
Change in Child Sex Ratio, 1991 to 2001
Newly-treated (non-MH) Pre-treated (MH)
Figure 9: Change in Urban Child Sex Ratio, 1991-2001 [Subsample (I) - Towns from immediate districts onboth sides of Maharashtra (MH) border]
0.000
0.005
0.010
0.015
Ker
nel D
ensi
ty
-200 -100 0 100 200
Change in Child Sex Ratio, 1991 to 2001
Newly-treated (non-MH) Pre-treated (MH)
22

Figure 10: Change in Urban Child Sex Ratio, 1991-2001 [Subsample (II) - Towns from Maharashtra andneighboring states, except from the immediate districts on both sides of the MH border ]
0.000
0.002
0.004
0.006
0.008
0.010
Ker
nel D
ensi
ty
-200 -100 0 100 200
Change in Child Sex Ratio, 1991 to 2001
Newly-treated (non-MH) Pre-treated (MH)
Figure 11: Change in Urban Child Sex Ratio, 1991-2001 [ Subsample (III) - All towns from Maharashtraand neighboring states]
0.000
0.002
0.004
0.006
0.008
0.010
Ker
nel D
ensi
ty
-200 -100 0 100 200
Change in Child Sex Ratio, 1991 to 2001
Newly-treated (non-MH) Pre-treated (MH)
23
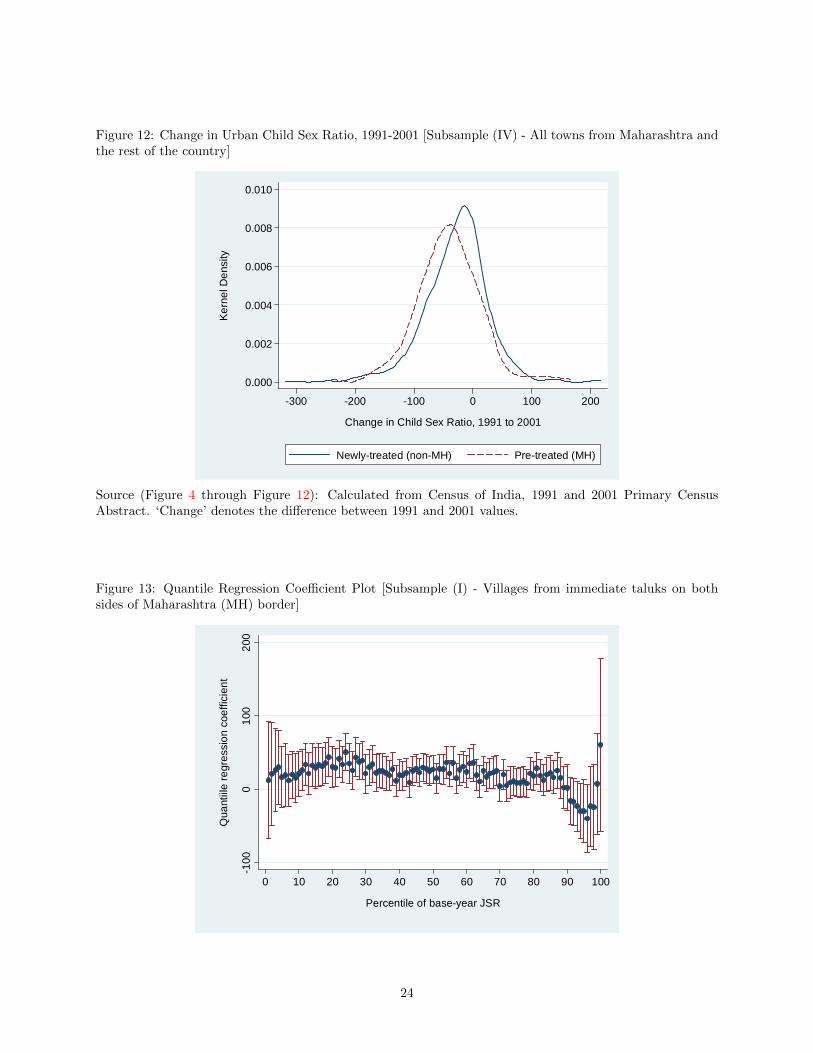
Figure 12: Change in Urban Child Sex Ratio, 1991-2001 [Subsample (IV) - All towns from Maharashtra andthe rest of the country]
0.000
0.002
0.004
0.006
0.008
0.010
Ker
nel D
ensi
ty
-300 -200 -100 0 100 200
Change in Child Sex Ratio, 1991 to 2001
Newly-treated (non-MH) Pre-treated (MH)
Source (Figure 4 through Figure 12): Calculated from Census of India, 1991 and 2001 Primary CensusAbstract. ‘Change’ denotes the difference between 1991 and 2001 values.
Figure 13: Quantile Regression Coefficient Plot [Subsample (I) - Villages from immediate taluks on bothsides of Maharashtra (MH) border]
-100
010
020
0
Qua
ntiil
e re
gres
sion
coe
ffici
ent
0 10 20 30 40 50 60 70 80 90 100
Percentile of base-year JSR
24
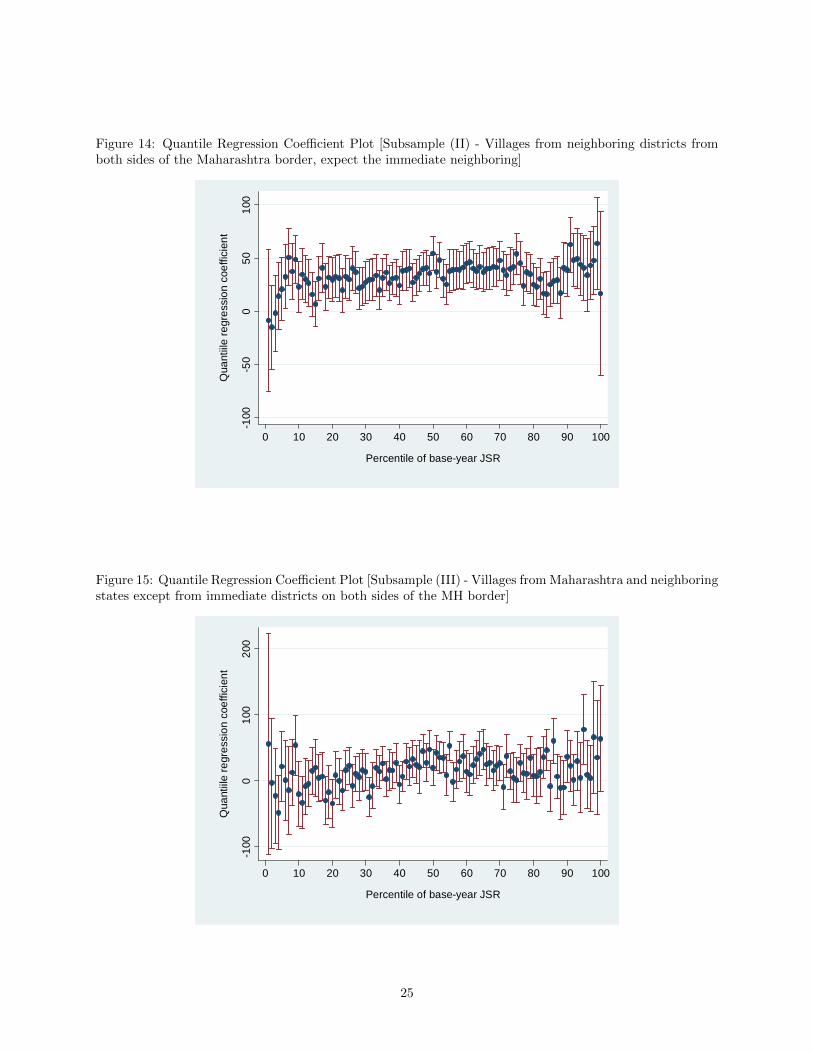
Figure 14: Quantile Regression Coefficient Plot [Subsample (II) - Villages from neighboring districts fromboth sides of the Maharashtra border, expect the immediate neighboring]
-100
-50
050
100
Qua
ntiil
e re
gres
sion
coe
ffici
ent
0 10 20 30 40 50 60 70 80 90 100
Percentile of base-year JSR
Figure 15: Quantile Regression Coefficient Plot [Subsample (III) - Villages from Maharashtra and neighboringstates except from immediate districts on both sides of the MH border]
-100
010
020
0
Qua
ntiil
e re
gres
sion
coe
ffici
ent
0 10 20 30 40 50 60 70 80 90 100
Percentile of base-year JSR
25
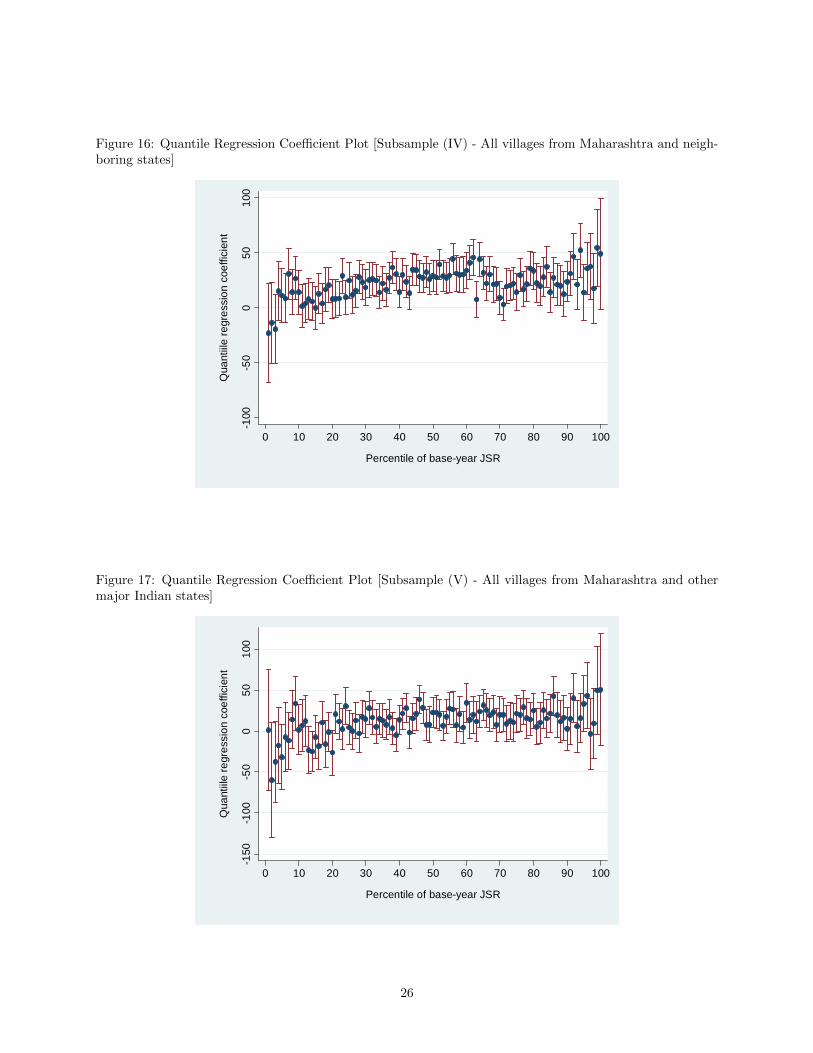
Figure 16: Quantile Regression Coefficient Plot [Subsample (IV) - All villages from Maharashtra and neigh-boring states]
-100
-50
050
100
Qua
ntiil
e re
gres
sion
coe
ffici
ent
0 10 20 30 40 50 60 70 80 90 100
Percentile of base-year JSR
Figure 17: Quantile Regression Coefficient Plot [Subsample (V) - All villages from Maharashtra and othermajor Indian states]
-150
-100
-50
050
100
Qua
ntiil
e re
gres
sion
coe
ffici
ent
0 10 20 30 40 50 60 70 80 90 100
Percentile of base-year JSR
26
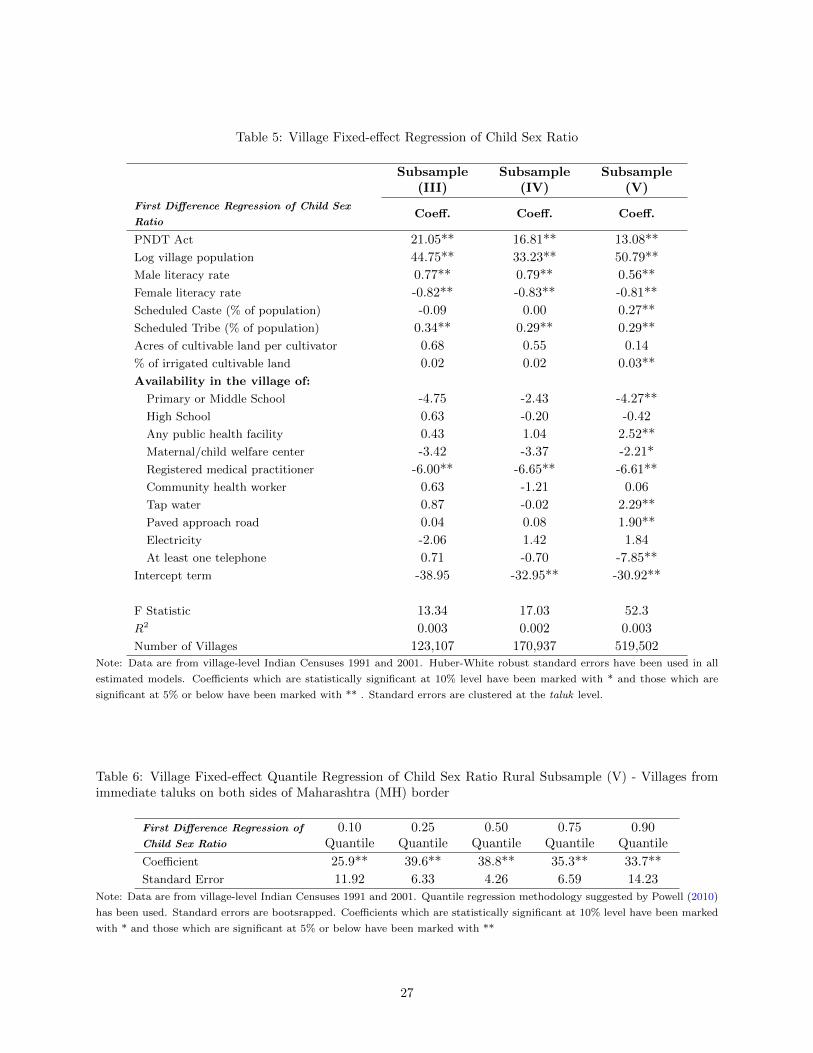
Table 5: Village Fixed-effect Regression of Child Sex Ratio
Subsample(III)
Subsample(IV)
Subsample(V)
First Difference Regression of Child Sex
RatioCoeff. Coeff. Coeff.
PNDT Act 21.05** 16.81** 13.08**
Log village population 44.75** 33.23** 50.79**
Male literacy rate 0.77** 0.79** 0.56**
Female literacy rate -0.82** -0.83** -0.81**
Scheduled Caste (% of population) -0.09 0.00 0.27**
Scheduled Tribe (% of population) 0.34** 0.29** 0.29**
Acres of cultivable land per cultivator 0.68 0.55 0.14
% of irrigated cultivable land 0.02 0.02 0.03**
Availability in the village of:
Primary or Middle School -4.75 -2.43 -4.27**
High School 0.63 -0.20 -0.42
Any public health facility 0.43 1.04 2.52**
Maternal/child welfare center -3.42 -3.37 -2.21*
Registered medical practitioner -6.00** -6.65** -6.61**
Community health worker 0.63 -1.21 0.06
Tap water 0.87 -0.02 2.29**
Paved approach road 0.04 0.08 1.90**
Electricity -2.06 1.42 1.84
At least one telephone 0.71 -0.70 -7.85**
Intercept term -38.95 -32.95** -30.92**
F Statistic 13.34 17.03 52.3
R2 0.003 0.002 0.003
Number of Villages 123,107 170,937 519,502Note: Data are from village-level Indian Censuses 1991 and 2001. Huber-White robust standard errors have been used in all
estimated models. Coefficients which are statistically significant at 10% level have been marked with * and those which are
significant at 5% or below have been marked with ** . Standard errors are clustered at the taluk level.
Table 6: Village Fixed-effect Quantile Regression of Child Sex Ratio Rural Subsample (V) - Villages fromimmediate taluks on both sides of Maharashtra (MH) border
First Difference Regression of
Child Sex Ratio
0.10Quantile
0.25Quantile
0.50Quantile
0.75Quantile
0.90Quantile
Coefficient 25.9** 39.6** 38.8** 35.3** 33.7**
Standard Error 11.92 6.33 4.26 6.59 14.23
Note: Data are from village-level Indian Censuses 1991 and 2001. Quantile regression methodology suggested by Powell (2010)
has been used. Standard errors are bootsrapped. Coefficients which are statistically significant at 10% level have been marked
with * and those which are significant at 5% or below have been marked with **
27
Tab
le7:
Des
crip
tive
Sta
tist
ics
of
Rura
lSu
bsa
mp
les:
Aver
age
Chan
ge
from
1991
to2001
Su
bsa
mple
(I)
Subsa
mple
(II)
Sub
sam
ple
(III
)S
ub
sam
ple
(IV
)S
ub
sam
ple
(V)
MH
Non
MH
MH
Non
MH
MH
Non
MH
MH
Non
MH
MH
Non
MH
Fir
st-d
ifference
(chan
ge
from
1991
to2001)
Log
villa
ge
pop
ula
tion
0.1
70.1
80.1
40.1
60.1
20.1
80.1
40.1
60.1
40.1
8
Male
lite
racy
rate
16.9
719.0
513.4
620.3
413.4
515.3
614.1
519.0
714.1
515.6
0
Fem
ale
lite
racy
rate
19.5
820.0
018.2
319.8
119.3
617.5
918.9
420.3
918.9
417.7
2
Sch
edule
dC
ast
e(%
of
pop
ula
tion)
-0.5
8-0
.48
-0.5
5-0
.54
-0.4
50.1
8-0
.52
-0.0
6-0
.52
0.1
4
Sch
edule
dT
rib
e(%
of
pop
ula
tion)
0.0
60.7
8-0
.82
0.6
2-0
.24
0.2
2-0
.42
0.6
1-0
.42
0.2
5
Acr
esof
cult
ivab
lela
nd
per
cult
ivato
r0.6
00.0
30.4
90.0
40.2
90.3
00.4
30.0
90.4
30.2
8
%of
irri
gate
dcu
ltiv
able
land
4.9
99.3
05.0
716.9
44.7
722.7
94.9
417.9
94.9
422.3
4
Sh
are
of
vil
lages
that
have:
Pri
mary
or
Mid
dle
Sch
ool
0.0
60.0
80.0
20.0
80.0
20.0
60.0
30.0
80.0
30.0
6
Hig
hS
chool
0.0
90.0
60.1
00.0
60.1
00.0
30.1
00.0
60.1
00.0
3
Any
pub
lic
hea
lth
faci
lity
0.0
80.1
20.0
80.1
40.0
40.0
50.0
60.1
30.0
60.0
5
Mate
rnal/
child
wel
fare
cente
r0.0
20.0
30.0
20.0
50.0
10.0
30.0
20.0
40.0
20.0
3
Reg
iste
red
med
ical
pra
ctit
ion
er0.0
30.0
7-0
.01
0.1
10.0
40.0
20.0
20.0
80.0
20.0
3
Com
mu
nit
yhea
lth
work
er0.1
30.2
50.1
80.1
80.1
0-0
.04
0.1
40.1
10.1
4-0
.03
Tap
wate
r0.1
90.1
60.2
20.2
00.2
80.1
50.2
30.2
00.2
30.1
5
Paved
ap
pro
ach
road
0.4
30.1
20.4
00.1
40.3
90.1
50.4
00.1
30.4
00.1
5
Ele
ctri
city
-0.0
10.0
90.0
00.0
90.0
00.0
7-0
.01
0.0
8-0
.01
0.0
7
At
least
one
tele
ph
one
0.2
60.2
30.3
90.2
60.4
00.2
80.3
70.3
00.3
70.2
8
Sou
rce:
Data
are
from
villa
ge-
level
Ind
ian
Cen
suse
s1991
an
d2001.
Mahara
shtr
aand
non-M
ah
ara
shtr
avilla
ges
are
den
ote
dby
‘MH
’and
‘non
-MH
’,re
spec
tivel
y.Su
bsa
mp
les
are
–(I
)V
illa
ges
from
talu
ks
alo
ng
the
ad
min
istr
ati
ve
bord
erof
Mah
ara
shtr
aan
dit
snei
ghb
ori
ng
state
s,(I
I)V
illa
ges
from
MH
an
dn
eighb
ori
ng
state
dis
tric
tsalo
ng
the
state
bord
er,
exce
pt
the
villa
ges
from
talu
ks
imm
edia
tely
on
both
sid
esof
the
bord
er,
(III
)A
llvilla
ges
from
Mah
ara
shtr
aan
dn
eighb
ori
ng
state
sex
cep
tth
eon
esfr
om
imm
edia
te
dis
tric
tson
both
sides
of
the
bord
er,
(IV
)A
llvilla
ges
from
Mah
ara
shtr
aand
all
villa
ges
from
nei
ghb
ori
ng
state
s.
28
Tab
le8:
Des
crip
tive
Sta
tist
ics
of
Urb
an
Subsa
mple
s:A
vera
ge
Ch
ange
from
1991
to2001
Su
bsa
mple
(i)
Sub
sam
ple
(ii)
Sub
sam
ple
(iii)
Sub
sam
ple
(iv)
MH
Non
MH
MH
Non
MH
MH
Non
MH
MH
Non
MH
Fir
st-d
ifference
(change
from
1991
to2001)
Log
tow
np
op
ula
tion
0.2
30.1
90.2
50.2
20.2
40.2
10.2
40.2
3
Fem
ale
lite
racy
rate
10.8
711.4
510.8
410.8
310.8
610.9
310.8
611.2
2
Sch
edule
dC
ast
e(%
of
pop
ula
tion)
-0.4
10.3
4-0
.35
0.1
4-0
.39
0.1
8-0
.39
0.0
4
Sch
edule
dT
rib
e(%
of
pop
ula
tion)
-0.4
20.7
5-0
.12
0.3
5-0
.30
0.4
1-0
.30
0.1
8
Male
work
forc
ep
art
icip
ati
on
rate
0.5
1-0
.05
0.2
50.9
00.4
10.7
40.4
1-0
.11
Fem
ale
work
forc
ep
art
icip
ati
on
rate
1.7
32.8
11.2
13.6
21.5
33.4
81.5
34.9
3
Sou
rce:
Data
are
from
tow
n-l
evel
Ind
ian
Cen
suse
s1991
an
d2001.
Mah
ara
shtr
aand
non-M
ah
ara
shtr
ato
wn
sare
den
ote
dby
‘MH
’and
‘non-M
H’,
resp
ecti
vel
y.Su
bsa
mp
les
are
–(i
)T
ow
ns
from
dis
tric
tsalo
ng
the
ad
min
istr
ati
ve
bord
erof
Mah
ara
shtr
aan
dit
snei
ghb
ori
ng
state
s,(i
i)A
llto
wn
sfr
om
MH
an
dn
eighb
ori
ng
state
sex
cept
the
dis
tric
tsalo
ng
the
state
bord
erof
MH
,(i
ii)
All
tow
ns
from
MH
an
dnei
ghb
ori
ng
state
s,(i
v)
All
tow
ns
from
MH
an
dth
ere
stof
Ind
ia.
29
Sou
rce:
Cen
sus
of
Ind
iaD
istr
ict
Map
s,htt
p:/
/ce
nsu
sin
dia
.gov.in/m
ap
s/S
tate
Maps/
map
s.htm
30
Sou
rce:
Cen
sus
of
Ind
iaD
istr
ict
Map
s,htt
p:/
/ce
nsu
sin
dia
.gov.in/m
ap
s/S
tate
Maps/
map
s.htm
31
References
Agnihotri, Satish, Richard Palmer-Jones, and Ashok Parikh, “Missing women in Indian districts: a
quantitative analysis,” Structural Change and Economic Dynamics, 2002, 13 (3), 285 – 314.
Almond, D and L. Edlund, “Son-biased sex ratios in the 2000 United States Census,” PNAS, 2008, vol.
105 no. 15, 5681–5682.
, L Edlund, and K. Milligan, “Son Preference and the Persistence of Culture: Evidence from Asian
Immigrants to Canada,” NBER Working Paper 15391, 2009.
Angrist, Josh, “How Do Sex Ratios Affect Marriage and Labor Markets? Evidence from America’s Second
Generation,” The Quarterly Journal of Economics, 2002, 117 (3), 997–1038.
Arnold, Fred, Sunita Kishor, and T. K. Roy, “Sex-selective Abortions in India,” Population and
Development Review, 2002, 28(4), 759–785.
Bhat, P. N., “Sex Ratio in India,” Correspondence, The Lancet, 2006, Vol 367 No 9524.
Chamarbagwala, Rubiana, “Sibling composition and selective gender-based survival bias,” Journal of
Population Economics, 2010.
Chung, Woojin and Monica Das Gupta, “The Decline of Son Preference in South Korea: The Roles of
Development and Public Policy,” Population and Development Review, 2007, 33, 757–783(27).
Clark, Shelley, “Son Preference and Sex Composition of Children: Evidence from India,” Demography,
2000, 37 (1), 95–108.
Deolalikar, Anil, R. Hasan, and R. Somanathan, “Public Goods Access and Juvenile Sex Ratios in
Rural India: Evidence from the 1991 and 2001 Village Census Data.,” Asian Development Bank Working
Paper Series, 2009, No. 167.
Drew, J S, B S Blumberg, and J Robert-Lamblin, “Hepatitis B virus and sex ratio of offspring in
East Greenland.,” Hum Biol., 1986, Feb;58(1), 115–120.
Duflo, Esther, “Grandmothers and granddaughters : Old age pension and intra-household Allocation in
South Africa,” World Bank Economic Review, 2003, 17(1), 1–25.
Ebenstein, A., “The ‘Missing Girls’ of China and the Unintended Consequences of the One Child Policy,”
Journal of Human Resources, 2010, 45(1), 87–115.
32
Edlund, L., H. Li, J. Yi, and J. Zhang, “Sex ratios and crime: Evidence from China’s One-child Policy,”
IZA Discussion Paper 3214, 2007.
Foster, Andrew and Mark Rosenzweig, “Missing Women, the Marriage Market and Economic Growth,”
SCID Working Paper 49, 1999.
Francis, Andrew M., “Sex ratios and the red dragon: using the Chinese Communist Revolution to explore
the effect of the sex ratio on women and children in Taiwan,” Journal of Population Economics, 2009.
Ganatra, B., S. Hirve, and V. N. Rao, “Sex-selection abortion: evidence from a community based study
in Western India,” Asia Pac Popul J, 2001, 16(2), 109–124.
Gangoli, Geetanjali, “Reproduction, Abortion and Women’s Health,” Social Scientist, 1998, 26(11-12),
83–105.
George, S, “Sex Ratio in India,” Correspondence, The Lancet, 2006, Vol 367 No 9524.
George, Sabu M., “Sex Selection/Determination in India: Contemporary Developments,” Reproductive
Health Matters, 2002, 10 (19), 190–192.
and Ranbir S. Dahiya, “Female Foeticide in Rural Haryana,” Economic and Political Weekly, 1998, 33
(32), 2191–2198.
Gupta, M Das, “Explaining Asia’s ‘Missing Women’ : A New Look at the Data,” Population and Devel-
opment Review, 2005, 31(3), 529–535.
Gupta, Monica Das, “Selective Discrimination against Female Children in Rural Punjab, India,” Popula-
tion and Development Review, 1987, 13 (1), 77–100.
Gupta, Monica Das and P. N. Mari Bhat, “Fertility Decline and Increased Manifestation of Sex Bias
in India,” Population Studies, 1997, 51 (3), 307–315.
Hatti, N. and T. V. Sekhar, “Lives at Risk: Declining Child Sex Ratios in India,” Project Lives at Risk:
Discrimination of Female Children in Modern India, funded by the Swedish Research Council. Mimeo,
2004.
Hesketh, Therese, “Too many males in China: the causes and the consequences,” Significance, 2009, 6 (1),
9–13.
Hudson, Valerie M. and Andrea Den Boer, “A Surplus of Men, A Deficit of Peace: Security and Sex
Ratios in Asia’s Largest States,” International Security, 2002, 26 (4), 5–38.
33
and Andrea M. Den Boer, Bare Branches: The Security Implications of Asia’s Surplus Male Popu-
lation, The MIT Press, 2004.
Jayaraj, D and S Subramanian, “Women’s wellbeing and the sex ratio at birth: some suggestive evidence
from India,” The Journal of Development Studies, 2004, 40(5), 91–119.
Jayaraman, K S, “India Bans the Use of Sex Screening Tests,” Nature, 1994, 370(6488).
Jha, P., R. Kumar, and N. Dhingra, “Sex Ratio in India - Authors’ Reply,” Correspondence, The Lancet,
2006b, Vol 367 No 9524.
Jha, Prabhat, Rajesh Kumar, Priya Vasa, Neeraj Dhingra, Deva Thiruchelvam, and Rahim
Moineddin, “Low male-to-female sex ratio of children born in India: national survey of 1·1 million
households,” The Lancet, 2006a, 367 (9506), 211 – 218.
Junhong, Chu, “Prenatal Sex Determination and Sex-Selective Abortion in Rural Central China,” Popu-
lation and Development Review, 2001, 27 (2), 259–281.
Koenker, R. and G. Bassett, “Regression Quantiles,” Econometrica, 1978, 46, 33–50.
Li, Guanghui, “Effects of the one-child policy on the number and sex composition of children in China,”
Mimeo, University of Washington, 2002.
Lin, Ming-Jen and Ming-Ching Luoh, “Can Hepatitis B Mothers Account for the Number of Missing
Women? Evidence from Three Million Newborns in Taiwan,” American Economic Review, December 2008,
98 (5), 2259–73.
Luthra, Rashmi, “A Case of Problematic Diffusion: The Use of Sex Determination Techniques in India,”
Science Communication, 1994, 15, 259–272.
Mata, Jose and Jose A. F. Machado, “Counterfactual decomposition of changes in wage distributions
using quantile regression,” Journal of Applied Econometrics, 2005, 20 (4), 445–465.
Menon, N, Social Reform, Sexuality and the State, Patricia Uberoi Ed. New Delhi: Sage Publications, 1996.
Messner, Steven F. and Robert J. Sampson, “The Sex Ratio, Family Disruption, and Rates of Violent
Crime: The Paradox of Demographic Structure,” Social Forces, 1991, 69 (3), 693–713.
Miller, Barbara D., The Endangered Sex: Neglect of Female Children in Rural North India, Ithaca: Cornell
University Press, 1981.
34
Murthi, Mamta, Anne-Catherine Guio, and Jean Dreze, “Mortality, Fertility, and Gender Bias in
India: A District-Level Analysis,” Population and Development Review, 1995, 21 (4), 745–782.
Norberg, Karen, “Partnership Status and the Human Sex Ratio at Birth,” Working Paper 10920, National
Bureau of Economic Research November 2004.
Oster, Emily, “Hepatitis B and the Case of the Missing Women,” Journal of Political Economy, 2005, 113
(6), 1163–1216.
Parikh, Kirit S. and Chiranjib Gupta, “How Effective Is Female Literacy in Reducing Fertility?,”
Economic and Political Weekly, 2001, 36 (35), 3391–3398.
Park, Chai Bin and Nam-Hoon Cho, “Consequences of Son Preference in a Low-Fertility Society:
Imbalance of the Sex Ratio at Birth in Korea,” Population and Development Review, 1995, 21 (1), 59–84.
Patel, Tulsi, Sex-selective Abortion in India - Gender, Society and New Reproductive Technologies, Sage
Publications, New Delhi, 2007 ed.
Powell, David, “Unconditional Quantile Regression for Panel Data with Exogenous or Endogenous Regres-
sors,” Working Papers 710-1, RAND Corporation Publications Department November 2010.
Qian, Nancy, “Missing Women and the Price of Tea in China: The Effect of Sex-Specific Earnings on Sex
Imbalance*,” Quarterly Journal of Economics, 2008, 123 (3), 1251–1285.
, “Quantity-Quality and the One Child Policy:The Only-Child Disadvantage in School Enrollment in Rural
China,” Working Paper 14973, National Bureau of Economic Research May 2009.
Retherford, R.D. and T. K. Roy, “Factors Affecting Sex-selective Abortion in India and 17 Major
States,” National Family Health Survey Reports, 2003, No.21.
Rosenzweig, Mark R. and T. Paul Schultz, “Market Opportunities, Genetic Endowments, and In-
trafamily Resource Distribution: Child Survival in Rural India,” The American Economic Review, 1982,
72 (4), 803–815.
Sen, Amartya, “Missing women–revisited,” BMJ, 2003, 327 (7427), 1297–1298.
Sharma, O. P. and R. D. Retherford, “Effect of female literacy on fertility in India,” 1990, New Delhi,
India, Office of the Registrar General (Occasional Paper No. 1 of 1990), 59 p.
Shrivastava, S. K., “Female Infanticide in Bihar,” Economic and Political Weekly, 1998, Vol. 32 (17).
35
Subramanian, S. V. and S. Selvaraj, “Social analysis of sex imbalance in India: before and after the
implementation of the Pre-Natal Diagnostic Techniques,” J Epidemiol Community Health, 2009, 63, 245–
252.
Sudha, S. and S. Irudaya Rajan, “Female Demographic Disadvantage in India 19811991: Sex Selective
Abortions and Female Infanticide,” Development and Change, 1999, 30, 585–618.
UNFPA, Sex-selective abortions and fertility decline: the case of Haryana and Punjab, New Delhi: United
Nations Population Fund, 2001.
Visaria, L., Sex-selective Abortion in India - Gender, Soceity and New Reproductive Technologies., Tulsi
Patel ed. Sage Publications, New Delhi, 2007.
Wertz, Dorothy C. and John C. Fletcher, “Prenatal diagnosis and sex selection in 19 nations,” Social
Science & Medicine, 1993, 37 (11), 1359 – 1366.
Yi, Zeng, Tu Ping, Gu Baochang, Xu Yi, Li Bohua, and Li Yongpiing, “Causes and Implications of
the Recent Increase in the Reported Sex Ratio at Birth in China,” Population and Development Review,
1993, 19 (2), 283–302.
Zhu, Wei Xing, Li Lu, and Therese Hesketh, “China’s excess males, sex selective abortion, and one
child policy: analysis of data from 2005 national intercensus survey,” BMJ, 2009, 338.
36


![[XLS] Object Summary.xlsx · Web view5/26/2010 5/26/2010. 5/2/2011 5/2/2011. 9/30/2011 9/30/2011. 7/6/2011 7/6/2011. 11/28/2011 11/28/2011. 12/6/2011 12/6/2011. 11/28/2011 11/28/2011](https://img.pdfslide.us/doc/110x75/5ae744ba7f8b9a87048f0cd5/xls-object-summaryxlsxweb-view5262010-5262010-522011-522011-9302011.jpg)