Embed Size (px)
Citation preview
47Glossary . . . . . . . . . . . . . . . . . . . . . . . . . . . . . . . . . . . . . . . . . . . . . .44Technical Note: Sampling Error from the 2012 Forms of Employment Survey . .42Appendix 3: Supplementary Information . . . . . . . . . . . . . . . . . . . . . . . . . .38Appendix 2: ABS Business Operator Counts . . . . . . . . . . . . . . . . . . . . . . .35
Appendix 1: The Forms of Employment Survey and Census ConceptualFrameworks . . . . . . . . . . . . . . . . . . . . . . . . . . . . . . . . . . . . . . . .
28Explanatory Notes . . . . . . . . . . . . . . . . . . . . . . . . . . . . . . . . . . . . . . . .A D D I T I O N A L I N F O R M A T I O N
19Tables . . . . . . . . . . . . . . . . . . . . . . . . . . . . . . . . . . . . . . . . . . . . . . .18List of Tables . . . . . . . . . . . . . . . . . . . . . . . . . . . . . . . . . . . . . . . . . . .14
Section Two: Counts of Australian Business Operators by SelectedCharacteristics, 2011 . . . . . . . . . . . . . . . . . . . . . . . . . . . . . . . . . .
8Tables . . . . . . . . . . . . . . . . . . . . . . . . . . . . . . . . . . . . . . . . . . . . . . . .7List of Tables . . . . . . . . . . . . . . . . . . . . . . . . . . . . . . . . . . . . . . . . . . . .3
Section One: Counts of Australian Business Operators by SelectedCharacteristics, 2012 . . . . . . . . . . . . . . . . . . . . . . . . . . . . . . . . . . .
2Notes . . . . . . . . . . . . . . . . . . . . . . . . . . . . . . . . . . . . . . . . . . . . . . . .page
C O N T E N T S
E M B A R G O : 1 1 . 3 0 A M ( C A N B E R R A T I M E ) T U E S 2 9 O C T 2 0 1 3
COUNTS OF AUSTRALIANBUSINESS OPERATORS A U S T R A L I A
8175.02 0 1 1 – 1 2
For further informationabout these and relatedstatistics, contact theNational Information andReferral Service on1300 135 070.
I N Q U I R I E S
w w w . a b s . g o v . a u
B r i a n P i n k
Au s t r a l i a n S t a t i s t i c i a n
The ABS welcomes feedback from users of these business operator counts to assist the
ABS assess the relevance of this publication.
To provide feedback or for further information about these and related statistics, contact
the National Information and Referral Service on 1300 135 070, e–mail
FE E D B A C K
The ABS will assess the user demand of this publication prior to forming a decision on
future releases.
FU T U R E RE L E A S E S
There have been some changes to this publication compared to the previous release.
Section One of the 2011–2012 Counts of Australian Business Operators (CABO) uses data
on business operators from the 2012 Forms of Employment Survey (FOES). Since the
previous release in 2008, the FOES was redeveloped to better capture information of
independent contractors, other business operators and employees. Information was also
collected of people who found their current job through a labour hire firm/employment
agency.
The change has resulted in a break in series for business operators and other employees
and users need to exercise caution when comparing data in the 2011 to 2012 publication
with the previous release, as data about this population group have changed (See
conceptual framework for more details).
A range of enhancements to the data have been made compared to the previous
publication to maintain relevance of the publication. This includes the following
variables:
! Housing tenure type (House owned outright, being rented, owned with a mortgage,
etc);
! Whether living at same address as one year ago;
! Whether living at same address as five years ago; and
! Year of arrival in Australia – customised groups – speaks of familiarity with local
(national) trading, cultural factors.
CH A N G E S FR O M
PR E V I O U S RE L E A S E S
Refer to paragraphs 3–8 of the Explanatory Notes.ST R U C T U R E OF TH E
PU B L I C A T I O N
This publication presents selected counts of Australian business operators as sourced
from the 2012 Forms of Employment Survey and the 2011 Census of Population and
Housing.
The counts presented in this publication are not directly comparable with those
presented in previous releases.
I N T R O D U C T I O N
2 A B S • CO U N T S OF A U S T R A L I A N B U S I N E S S OP E R A T O R S • 8 1 7 5 . 0 • 2 0 1 1 – 1 2
N O T E S
SECT I O N 1 CO U N T S OF AU S T R A L I A N BU S I N E S S OP E R A T O R SBY SE L E C T E D CH A R A C T E R I S T I C S , 20 1 2 . . . . . . . . . . .
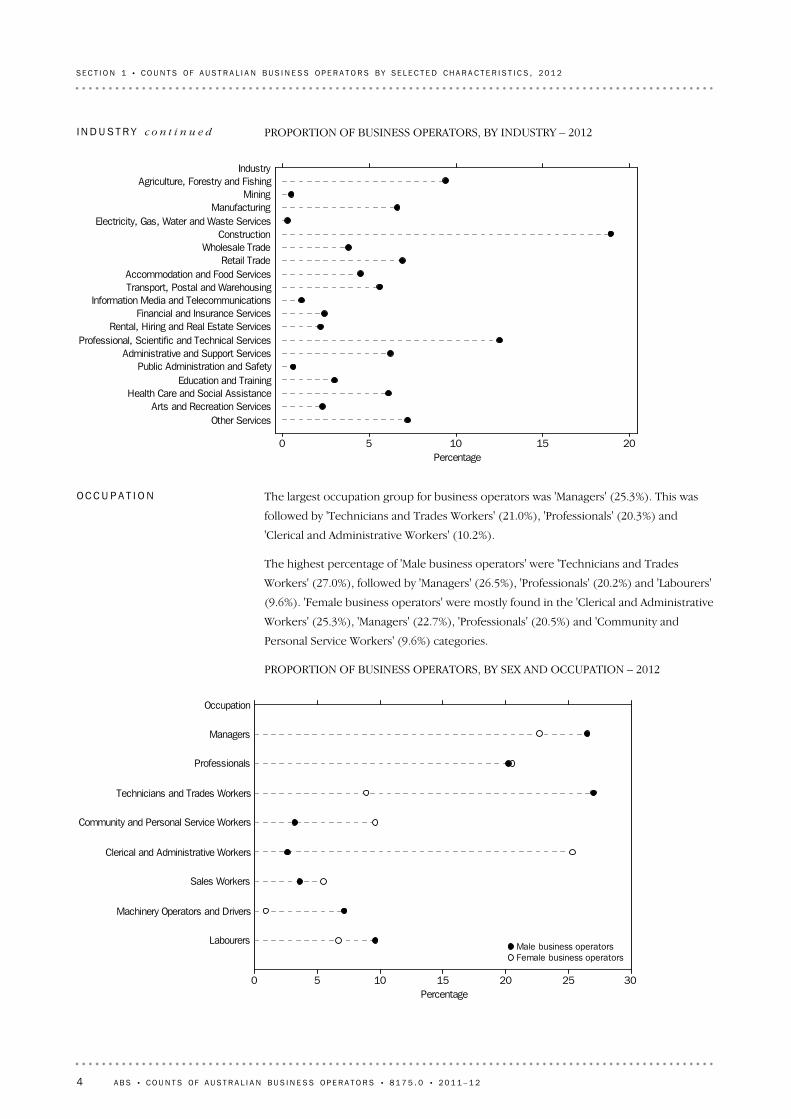
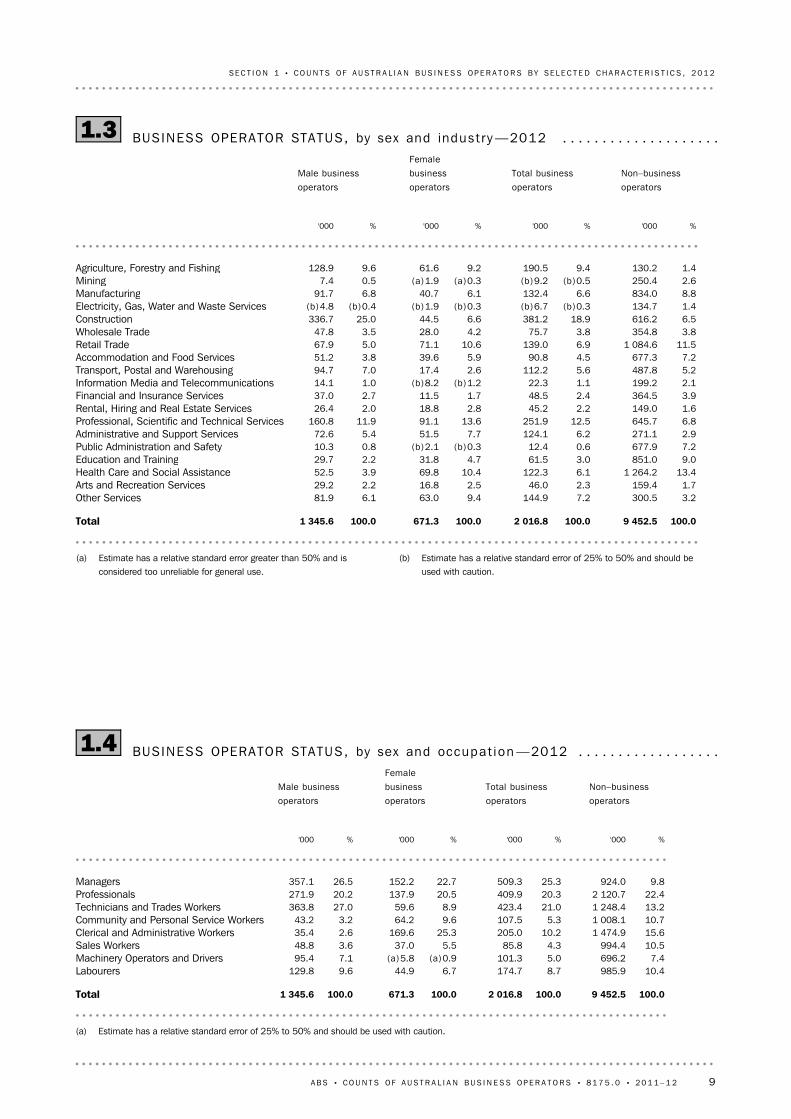
'Male business operators' participated in the 'Construction' (25.0%), 'Professional,
Scientific and Technical Services' (11.9%) and 'Agriculture, Forestry and Fishing' (9.6%)
industries.
'Female business operators' were most common across the 'Professional, Scientific and
Technical Services' (13.6%), 'Retail Trade' (10.6%) and 'Health Care and Social Assistance'
(10.4%) industries.
I N D U S T R Y
The most common duration in which business operators had been with their current
business was '10 to 19 years' (21.7%). This was followed by the '20 years and over'
(21.3%) and '3 to 5 years' (18.5%) duration periods. 'Male business operators' (24.0%)
were more likely than 'Female business operators' (15.8%) to have been in operation in
the '20 years and over' category.
DU R A T I O N W I T H
BU S I N E S S
The Forms of Employment Survey estimated there to be 2,016,800 business operators in
Australia in November 2012. Of these, 1,345,600 were 'Male business operators' (66.7%)
and 671,300 were 'Female business operators' (33.3%).
SE X
The data presented in Section One of this publication were sourced from the 2012
Forms of Employment Survey. These data were collected in November 2012 by ABS
interviewers from approximately 30,000 Australian households. For further information
(including how Forms of Employment Survey data differs from the 2011 Census of
Population and Housing data presented in Section Two), please refer to the Explanatory
Notes.
OV E R V I E W
A B S • CO U N T S OF A U S T R A L I A N B U S I N E S S OP E R A T O R S • 8 1 7 5 . 0 • 2 0 1 1 – 1 2 3
Managers
Professionals
Technicians and Trades Workers
Community and Personal Service Workers
Clerical and Administrative Workers
Sales Workers
Machinery Operators and Drivers
Labourers
Occupation
0 5 10 15 20 25 30Percentage
Male business operatorsFemale business operators
The largest occupation group for business operators was 'Managers' (25.3%). This was
followed by 'Technicians and Trades Workers' (21.0%), 'Professionals' (20.3%) and
'Clerical and Administrative Workers' (10.2%).
The highest percentage of 'Male business operators' were 'Technicians and Trades
Workers' (27.0%), followed by 'Managers' (26.5%), 'Professionals' (20.2%) and 'Labourers'
(9.6%). 'Female business operators' were mostly found in the 'Clerical and Administrative
Workers' (25.3%), 'Managers' (22.7%), 'Professionals' (20.5%) and 'Community and
Personal Service Workers' (9.6%) categories.
PROPORTION OF BUSINESS OPERATORS, BY SEX AND OCCUPATION – 2012
OC C U P A T I O N
Agriculture, Forestry and FishingMining
ManufacturingElectricity, Gas, Water and Waste Services
ConstructionWholesale Trade
Retail TradeAccommodation and Food ServicesTransport, Postal and Warehousing
Information Media and TelecommunicationsFinancial and Insurance Services
Rental, Hiring and Real Estate ServicesProfessional, Scientific and Technical Services
Administrative and Support ServicesPublic Administration and Safety
Education and TrainingHealth Care and Social Assistance
Arts and Recreation ServicesOther Services
Industry
0 5 10 15 20Percentage
PROPORTION OF BUSINESS OPERATORS, BY INDUSTRY – 2012I N D U S T R Y c o n t i n u e d
4 A B S • CO U N T S OF A U S T R A L I A N B U S I N E S S OP E R A T O R S • 8 1 7 5 . 0 • 2 0 1 1 – 1 2
SE C T I O N 1 • CO U N T S OF A U S T R A L I A N B U S I N E S S OP E R A T O R S B Y SE L E C T E D CH A R A C T E R I S T I C S , 2 0 1 2
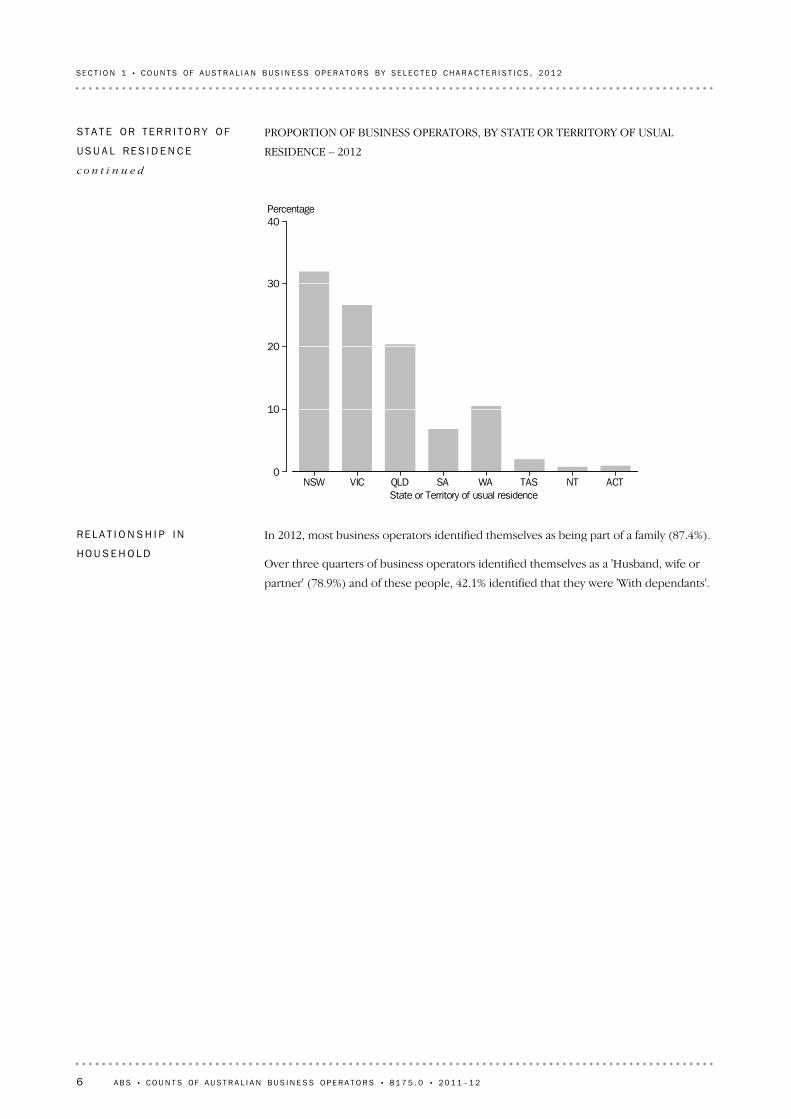
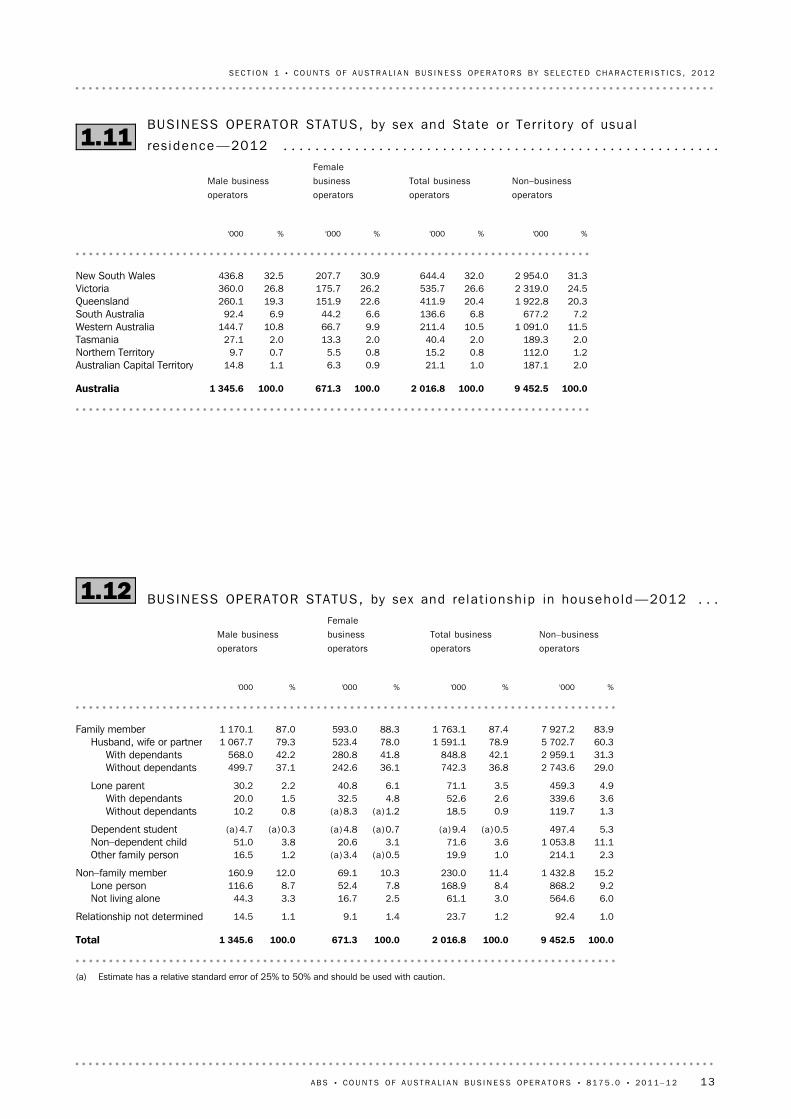
The state with the highest number of business operators was 'New South Wales'
(644,400) (32.0%). This was followed by 'Victoria' (535,700) (26.6%), 'Queensland'
(411,900) (20.4%), 'Western Australia' (211,400) (10.5%), 'South Australia' (136,600)
(6.8%), 'Tasmania' (40,400) (2.0%), the 'Australian Capital Territory' (21,100) (1.0%) and
the 'Northern Territory' (15,200) (0.8%).
ST A T E OR TE R R I T O R Y OF
US U A L RE S I D E N C E
15–19 20–24 25–34 35–44 45–54 55–59 60–64 65 and overAge
Percentage
0
10
20
30Male business ownersFemale business ownersTotal business owners
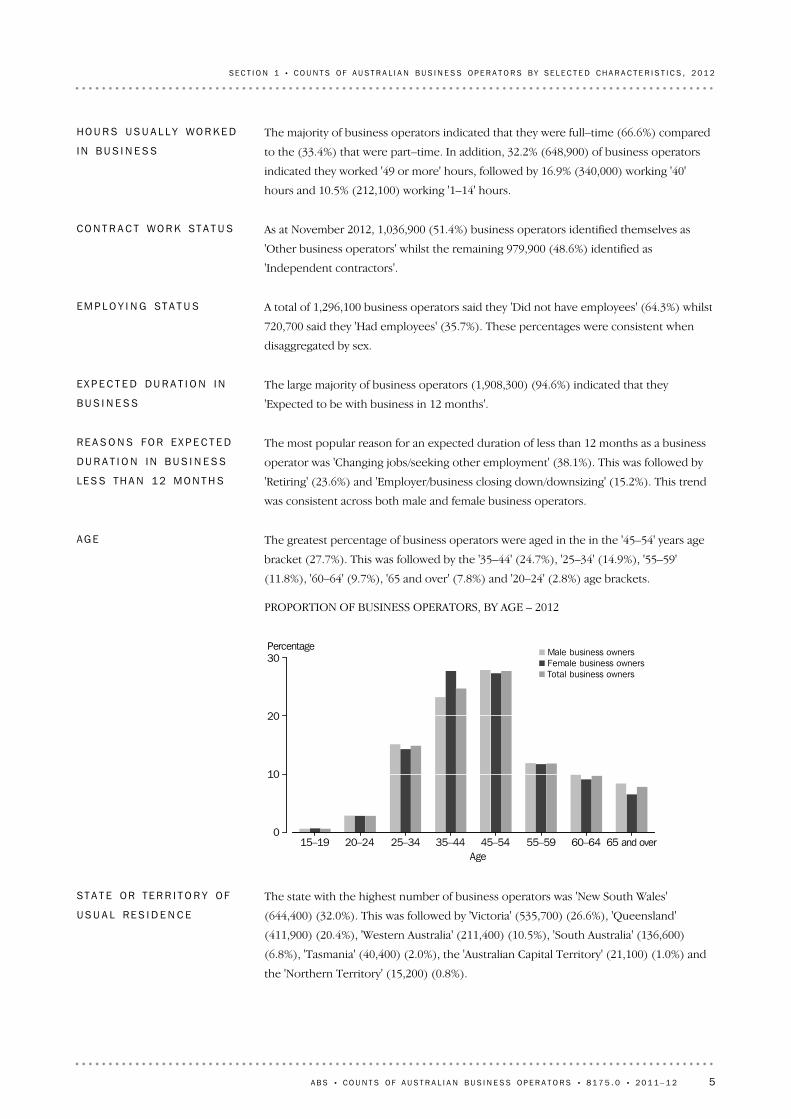
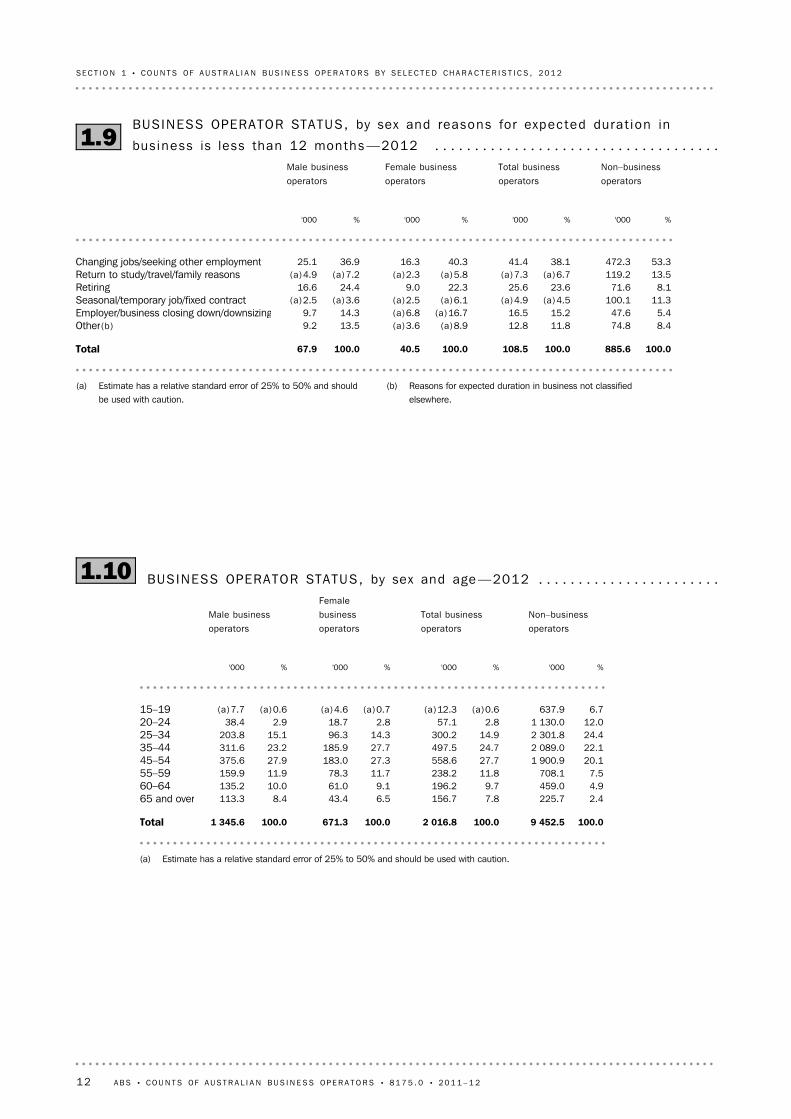
The greatest percentage of business operators were aged in the in the '45–54' years age
bracket (27.7%). This was followed by the '35–44' (24.7%), '25–34' (14.9%), '55–59'
(11.8%), '60–64' (9.7%), '65 and over' (7.8%) and '20–24' (2.8%) age brackets.
PROPORTION OF BUSINESS OPERATORS, BY AGE – 2012
AG E
The most popular reason for an expected duration of less than 12 months as a business
operator was 'Changing jobs/seeking other employment' (38.1%). This was followed by
'Retiring' (23.6%) and 'Employer/business closing down/downsizing' (15.2%). This trend
was consistent across both male and female business operators.
RE A S O N S FO R EX P E C T E D
DU R A T I O N IN BU S I N E S S
LE S S TH A N 12 MO N T H S
The large majority of business operators (1,908,300) (94.6%) indicated that they
'Expected to be with business in 12 months'.
EX P E C T E D DU R A T I O N IN
BU S I N E S S
A total of 1,296,100 business operators said they 'Did not have employees' (64.3%) whilst
720,700 said they 'Had employees' (35.7%). These percentages were consistent when
disaggregated by sex.
EM P L O Y I N G ST A T U S
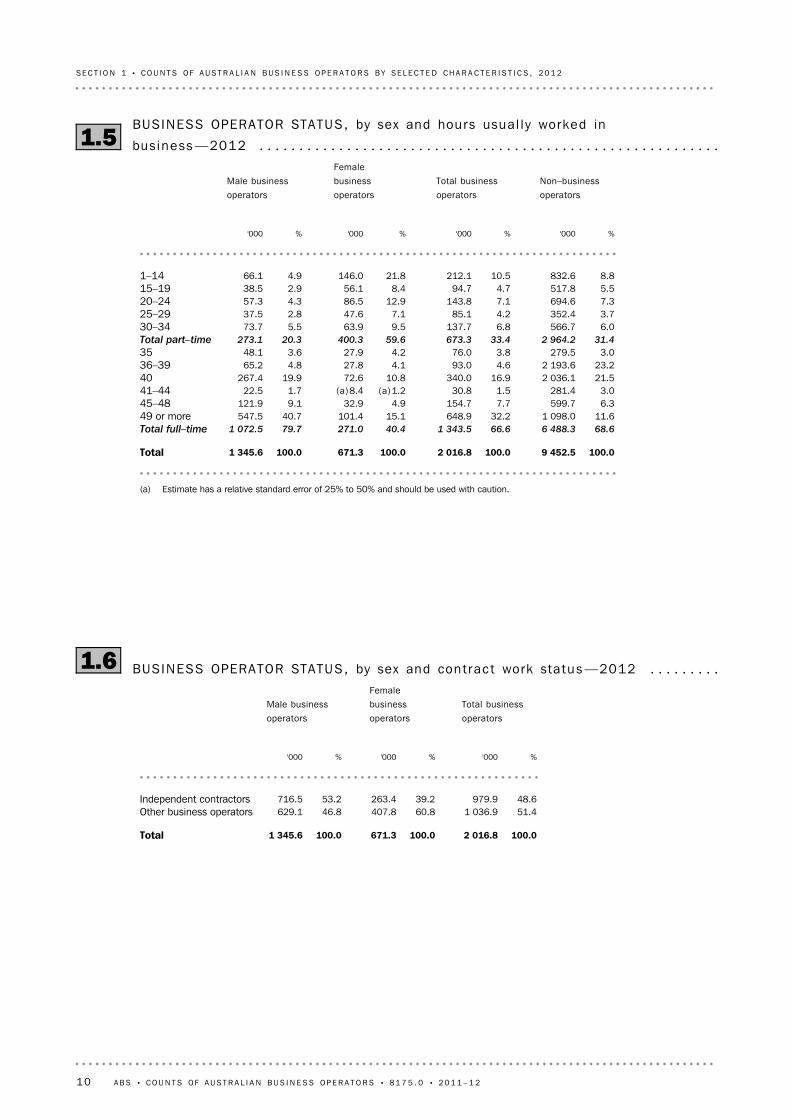
As at November 2012, 1,036,900 (51.4%) business operators identified themselves as
'Other business operators' whilst the remaining 979,900 (48.6%) identified as
'Independent contractors'.
CO N T R A C T WO R K ST A T U S
The majority of business operators indicated that they were full–time (66.6%) compared
to the (33.4%) that were part–time. In addition, 32.2% (648,900) of business operators
indicated they worked '49 or more' hours, followed by 16.9% (340,000) working '40'
hours and 10.5% (212,100) working '1–14' hours.
HO U R S US U A L L Y WO R K E D
IN BU S I N E S S
A B S • CO U N T S OF A U S T R A L I A N B U S I N E S S OP E R A T O R S • 8 1 7 5 . 0 • 2 0 1 1 – 1 2 5
SE C T I O N 1 • CO U N T S OF A U S T R A L I A N B U S I N E S S OP E R A T O R S B Y SE L E C T E D CH A R A C T E R I S T I C S , 2 0 1 2
In 2012, most business operators identified themselves as being part of a family (87.4%).
Over three quarters of business operators identified themselves as a 'Husband, wife or
partner' (78.9%) and of these people, 42.1% identified that they were 'With dependants'.
RE L A T I O N S H I P IN
HO U S E H O L D
NSW VIC QLD SA WA TAS NT ACTState or Territory of usual residence
Percentage
0
10
20
30
40
PROPORTION OF BUSINESS OPERATORS, BY STATE OR TERRITORY OF USUAL
RESIDENCE – 2012
ST A T E OR TE R R I T O R Y OF
US U A L RE S I D E N C E
c o n t i n u e d
6 A B S • CO U N T S OF A U S T R A L I A N B U S I N E S S OP E R A T O R S • 8 1 7 5 . 0 • 2 0 1 1 – 1 2
SE C T I O N 1 • CO U N T S OF A U S T R A L I A N B U S I N E S S OP E R A T O R S B Y SE L E C T E D CH A R A C T E R I S T I C S , 2 0 1 2
L I S T O F T A B L E S
13Business operator status, by sex and relationship in household, 20121.12 . . . . .13
Business operator status, by sex and State or Territory of usual
residence, 2012
1.11. . . . . . . . . . . . . . . . . . . . . . . . . . . . . . . . . . . . . . .
12Business operator status, by sex and age, 20121.10 . . . . . . . . . . . . . . . . . . . .12
Business operator status, by sex and reasons for expected duration in
business is less than 12 months, 2012
1.9. . . . . . . . . . . . . . . . . . . . . . . . .
11
Business operator status, by sex and expected duration in business,
2012
1.8. . . . . . . . . . . . . . . . . . . . . . . . . . . . . . . . . . . . . . . . . . . . . .
11Business operator status, by sex and employing status, 20121.7 . . . . . . . . . . .10Business operator status, by sex and contract work status, 20121.6 . . . . . . . . .10
Business operator status, by sex and hours usually worked in business,
2012
1.5. . . . . . . . . . . . . . . . . . . . . . . . . . . . . . . . . . . . . . . . . . . . . .
9Business operator status, by sex and occupation, 20121.4 . . . . . . . . . . . . . . . .9Business operator status, by sex and industry, 20121.3 . . . . . . . . . . . . . . . . . .8Business operator status, by sex and duration with business, 20121.2 . . . . . . . .8Business operator status, by sex, 20121.1 . . . . . . . . . . . . . . . . . . . . . . . . . .
SE C T I O N ON E
page
A B S • CO U N T S OF A U S T R A L I A N B U S I N E S S OP E R A T O R S • 8 1 7 5 . 0 • 2 0 1 1 – 1 2 7
SE C T I O N 1 • CO U N T S OF A U S T R A L I A N B U S I N E S S OP E R A T O R S B Y SE L E C T E D CH A R A C T E R I S T I C S , 2 0 1 2
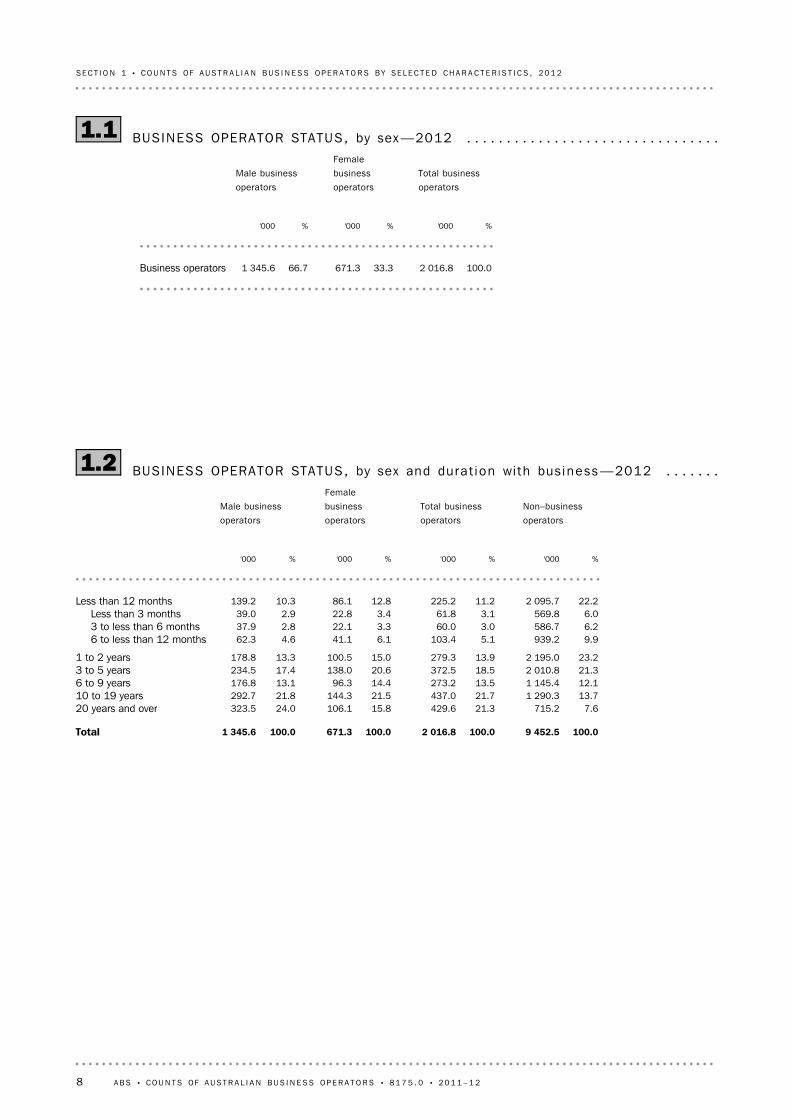
100.02 016.833.3671.366.71 345.6Business operators
%'000%'000%'000
Total businessoperators
Femalebusinessoperators
Male businessoperators
BUSINESS OPERATOR STATUS, by sex —20121.1 . . . . . . . . . . . . . . . . . . . . . . . . . . . . . . . .
100.09 452.5100.02 016.8100.0671.3100.01 345.6Total
7.6715.221.3429.615.8106.124.0323.520 years and over13.71 290.321.7437.021.5144.321.8292.710 to 19 years12.11 145.413.5273.214.496.313.1176.86 to 9 years21.32 010.818.5372.520.6138.017.4234.53 to 5 years23.22 195.013.9279.315.0100.513.3178.81 to 2 years
9.9939.25.1103.46.141.14.662.36 to less than 12 months6.2586.73.060.03.322.12.837.93 to less than 6 months6.0569.83.161.83.422.82.939.0Less than 3 months
22.22 095.711.2225.212.886.110.3139.2Less than 12 months
%'000%'000%'000%'000
Non–businessoperators
Total businessoperators
Femalebusinessoperators
Male businessoperators
BUSINESS OPERATOR STATUS, by sex and durat ion wi th bus iness —20121.2 . . . . . . .
8 A B S • CO U N T S OF A U S T R A L I A N B U S I N E S S OP E R A T O R S • 8 1 7 5 . 0 • 2 0 1 1 – 1 2
SE C T I O N 1 • CO U N T S OF A U S T R A L I A N B U S I N E S S OP E R A T O R S B Y SE L E C T E D CH A R A C T E R I S T I C S , 2 0 1 2
(b) Estimate has a relative standard error of 25% to 50% and should beused with caution.
(a) Estimate has a relative standard error greater than 50% and isconsidered too unreliable for general use.
100.09 452.5100.02 016.8100.0671.3100.01 345.6Total
3.2300.57.2144.99.463.06.181.9Other Services1.7159.42.346.02.516.82.229.2Arts and Recreation Services
13.41 264.26.1122.310.469.83.952.5Health Care and Social Assistance9.0851.03.061.54.731.82.229.7Education and Training7.2677.90.612.4(b)0.3(b)2.10.810.3Public Administration and Safety2.9271.16.2124.17.751.55.472.6Administrative and Support Services6.8645.712.5251.913.691.111.9160.8Professional, Scientific and Technical Services1.6149.02.245.22.818.82.026.4Rental, Hiring and Real Estate Services3.9364.52.448.51.711.52.737.0Financial and Insurance Services2.1199.21.122.3(b)1.2(b)8.21.014.1Information Media and Telecommunications5.2487.85.6112.22.617.47.094.7Transport, Postal and Warehousing7.2677.34.590.85.939.63.851.2Accommodation and Food Services
11.51 084.66.9139.010.671.15.067.9Retail Trade3.8354.83.875.74.228.03.547.8Wholesale Trade6.5616.218.9381.26.644.525.0336.7Construction1.4134.7(b)0.3(b)6.7(b)0.3(b)1.9(b)0.4(b)4.8Electricity, Gas, Water and Waste Services8.8834.06.6132.46.140.76.891.7Manufacturing2.6250.4(b)0.5(b)9.2(a)0.3(a)1.90.57.4Mining1.4130.29.4190.59.261.69.6128.9Agriculture, Forestry and Fishing
%'000%'000%'000%'000
Non–businessoperators
Total businessoperators
Femalebusinessoperators
Male businessoperators
BUSINESS OPERATOR STATUS, by sex and indust r y —20121.3 . . . . . . . . . . . . . . . . . . . .
(a) Estimate has a relative standard error of 25% to 50% and should be used with caution.
100.09 452.5100.02 016.8100.0671.3100.01 345.6Total
10.4985.98.7174.76.744.99.6129.8Labourers7.4696.25.0101.3(a)0.9(a)5.87.195.4Machinery Operators and Drivers
10.5994.44.385.85.537.03.648.8Sales Workers15.61 474.910.2205.025.3169.62.635.4Clerical and Administrative Workers10.71 008.15.3107.59.664.23.243.2Community and Personal Service Workers13.21 248.421.0423.48.959.627.0363.8Technicians and Trades Workers22.42 120.720.3409.920.5137.920.2271.9Professionals
9.8924.025.3509.322.7152.226.5357.1Managers
%'000%'000%'000%'000
Non–businessoperators
Total businessoperators
Femalebusinessoperators
Male businessoperators
BUSINESS OPERATOR STATUS, by sex and occupat ion —20121.4 . . . . . . . . . . . . . . . . . .
A B S • CO U N T S OF A U S T R A L I A N B U S I N E S S OP E R A T O R S • 8 1 7 5 . 0 • 2 0 1 1 – 1 2 9
SE C T I O N 1 • CO U N T S OF A U S T R A L I A N B U S I N E S S OP E R A T O R S B Y SE L E C T E D CH A R A C T E R I S T I C S , 2 0 1 2
(a) Estimate has a relative standard error of 25% to 50% and should be used with caution.
100.09 452.5100.02 016.8100.0671.3100.01 345.6Total
68.66 488.366.61 343.540.4271.079.71 072.5Total full–time11.61 098.032.2648.915.1101.440.7547.549 or more
6.3599.77.7154.74.932.99.1121.945–483.0281.41.530.8(a)1.2(a)8.41.722.541–44
21.52 036.116.9340.010.872.619.9267.44023.22 193.64.693.04.127.84.865.236–39
3.0279.53.876.04.227.93.648.13531.42 964.233.4673.359.6400.320.3273.1Total part–time
6.0566.76.8137.79.563.95.573.730–343.7352.44.285.17.147.62.837.525–297.3694.67.1143.812.986.54.357.320–245.5517.84.794.78.456.12.938.515–198.8832.610.5212.121.8146.04.966.11–14
%'000%'000%'000%'000
Non–businessoperators
Total businessoperators
Femalebusinessoperators
Male businessoperators
BUSINESS OPERATOR STATUS, by sex and hours usua l l y worked in
bus iness —20121.5 . . . . . . . . . . . . . . . . . . . . . . . . . . . . . . . . . . . . . . . . . . . . . . . . . . . . . . . . . .
100.02 016.8100.0671.3100.01 345.6Total
51.41 036.960.8407.846.8629.1Other business operators48.6979.939.2263.453.2716.5Independent contractors
%'000%'000%'000
Total businessoperators
Femalebusinessoperators
Male businessoperators
BUSINESS OPERATOR STATUS, by sex and cont rac t work status —20121.6 . . . . . . . . .
10 A B S • CO U N T S OF A U S T R A L I A N B U S I N E S S OP E R A T O R S • 8 1 7 5 . 0 • 2 0 1 1 – 1 2
SE C T I O N 1 • CO U N T S OF A U S T R A L I A N B U S I N E S S OP E R A T O R S B Y SE L E C T E D CH A R A C T E R I S T I C S , 2 0 1 2

— nil or rounded to zero (including null cells)
100.09 452.5100.02 016.8100.0671.3100.01 345.6Total
100.09 452.564.31 296.166.1443.463.4852.7Did not have employees——35.7720.733.9227.836.6492.9Had employees
%'000%'000%'000%'000
Non–businessoperators
Total businessoperators
Femalebusinessoperators
Male businessoperators
BUSINESS OPERATOR STATUS, by sex and employ ing status —20121.7 . . . . . . . . . . . .
100.09 452.5100.02 016.8100.0671.3100.01 345.6Total
9.4885.65.4108.56.040.55.067.9Did not expect to be with current business in 12 months90.68 566.894.61 908.394.0630.795.01 277.6Expected to be with current business in 12 months
%'000%'000%'000%'000
Non–businessoperators
Total businessoperators
Femalebusinessoperators
Male businessoperators
BUSINESS OPERATOR STATUS, by sex and expec ted durat ion in bus iness —20121.8 .
A B S • CO U N T S OF A U S T R A L I A N B U S I N E S S OP E R A T O R S • 8 1 7 5 . 0 • 2 0 1 1 – 1 2 11
SE C T I O N 1 • CO U N T S OF A U S T R A L I A N B U S I N E S S OP E R A T O R S B Y SE L E C T E D CH A R A C T E R I S T I C S , 2 0 1 2
(b) Reasons for expected duration in business not classifiedelsewhere.
(a) Estimate has a relative standard error of 25% to 50% and shouldbe used with caution.
100.0885.6100.0108.5100.040.5100.067.9Total
8.474.811.812.8(a)8.9(a)3.613.59.2Other(b)5.447.615.216.5(a)16.7(a)6.814.39.7Employer/business closing down/downsizing
11.3100.1(a)4.5(a)4.9(a)6.1(a)2.5(a)3.6(a)2.5Seasonal/temporary job/fixed contract8.171.623.625.622.39.024.416.6Retiring
13.5119.2(a)6.7(a)7.3(a)5.8(a)2.3(a)7.2(a)4.9Return to study/travel/family reasons53.3472.338.141.440.316.336.925.1Changing jobs/seeking other employment
%'000%'000%'000%'000
Non–businessoperators
Total businessoperators
Female businessoperators
Male businessoperators
BUSINESS OPERATOR STATUS, by sex and reasons for expec ted durat ion in
bus iness is less than 12 months —20121.9 . . . . . . . . . . . . . . . . . . . . . . . . . . . . . . . . . . . .
(a) Estimate has a relative standard error of 25% to 50% and should be used with caution.
100.09 452.5100.02 016.8100.0671.3100.01 345.6Total
2.4225.77.8156.76.543.48.4113.365 and over4.9459.09.7196.29.161.010.0135.260–647.5708.111.8238.211.778.311.9159.955–59
20.11 900.927.7558.627.3183.027.9375.645–5422.12 089.024.7497.527.7185.923.2311.635–4424.42 301.814.9300.214.396.315.1203.825–3412.01 130.02.857.12.818.72.938.420–24
6.7637.9(a)0.6(a)12.3(a)0.7(a)4.6(a)0.6(a)7.715–19
%'000%'000%'000%'000
Non–businessoperators
Total businessoperators
Femalebusinessoperators
Male businessoperators
BUSINESS OPERATOR STATUS, by sex and age —20121.10 . . . . . . . . . . . . . . . . . . . . . . .
12 A B S • CO U N T S OF A U S T R A L I A N B U S I N E S S OP E R A T O R S • 8 1 7 5 . 0 • 2 0 1 1 – 1 2
SE C T I O N 1 • CO U N T S OF A U S T R A L I A N B U S I N E S S OP E R A T O R S B Y SE L E C T E D CH A R A C T E R I S T I C S , 2 0 1 2
100.09 452.5100.02 016.8100.0671.3100.01 345.6Australia
2.0187.11.021.10.96.31.114.8Australian Capital Territory1.2112.00.815.20.85.50.79.7Northern Territory2.0189.32.040.42.013.32.027.1Tasmania
11.51 091.010.5211.49.966.710.8144.7Western Australia7.2677.26.8136.66.644.26.992.4South Australia
20.31 922.820.4411.922.6151.919.3260.1Queensland24.52 319.026.6535.726.2175.726.8360.0Victoria31.32 954.032.0644.430.9207.732.5436.8New South Wales
%'000%'000%'000%'000
Non–businessoperators
Total businessoperators
Femalebusinessoperators
Male businessoperators
BUSINESS OPERATOR STATUS, by sex and State or Ter r i to ry of usua l
res idence —20121.11 . . . . . . . . . . . . . . . . . . . . . . . . . . . . . . . . . . . . . . . . . . . . . . . . . . . . . . .
(a) Estimate has a relative standard error of 25% to 50% and should be used with caution.
100.09 452.5100.02 016.8100.0671.3100.01 345.6Total
1.092.41.223.71.49.11.114.5Relationship not determined
6.0564.63.061.12.516.73.344.3Not living alone9.2868.28.4168.97.852.48.7116.6Lone person
15.21 432.811.4230.010.369.112.0160.9Non–family member
2.3214.11.019.9(a)0.5(a)3.41.216.5Other family person11.11 053.83.671.63.120.63.851.0Non–dependent child
5.3497.4(a)0.5(a)9.4(a)0.7(a)4.8(a)0.3(a)4.7Dependent student
1.3119.70.918.5(a)1.2(a)8.30.810.2Without dependants3.6339.62.652.64.832.51.520.0With dependants4.9459.33.571.16.140.82.230.2Lone parent
29.02 743.636.8742.336.1242.637.1499.7Without dependants31.32 959.142.1848.841.8280.842.2568.0With dependants60.35 702.778.91 591.178.0523.479.31 067.7Husband, wife or partner83.97 927.287.41 763.188.3593.087.01 170.1Family member
%'000%'000%'000%'000
Non–businessoperators
Total businessoperators
Femalebusinessoperators
Male businessoperators
BUSINESS OPERATOR STATUS, by sex and re la t ionsh ip in househo ld —20121.12 . . .
A B S • CO U N T S OF A U S T R A L I A N B U S I N E S S OP E R A T O R S • 8 1 7 5 . 0 • 2 0 1 1 – 1 2 13
SE C T I O N 1 • CO U N T S OF A U S T R A L I A N B U S I N E S S OP E R A T O R S B Y SE L E C T E D CH A R A C T E R I S T I C S , 2 0 1 2
SECT I O N 2 CO U N T S OF AU S T R A L I A N BU S I N E S S OP E R A T O R SBY SE L E C T E D CH A R A C T E R I S T I C S , 20 1 1 . . . . . . . . . . .
Year 12 or equivalent
Year 11 or equivalent
Year 10 or equivalent
Year 9 or equivalent
Year 8 or below
Did not go to school
Not stated
Highest year of school completed
0 5 10 15 20 25 30 35 40 45 50 55Percentage
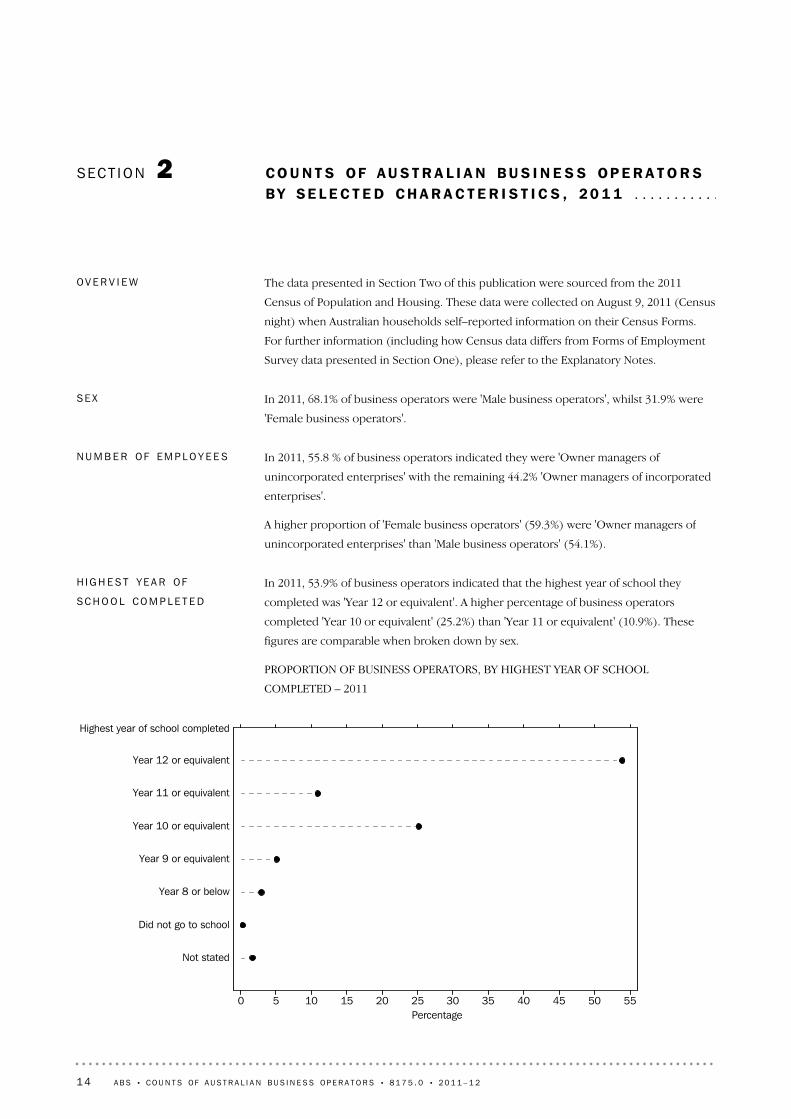
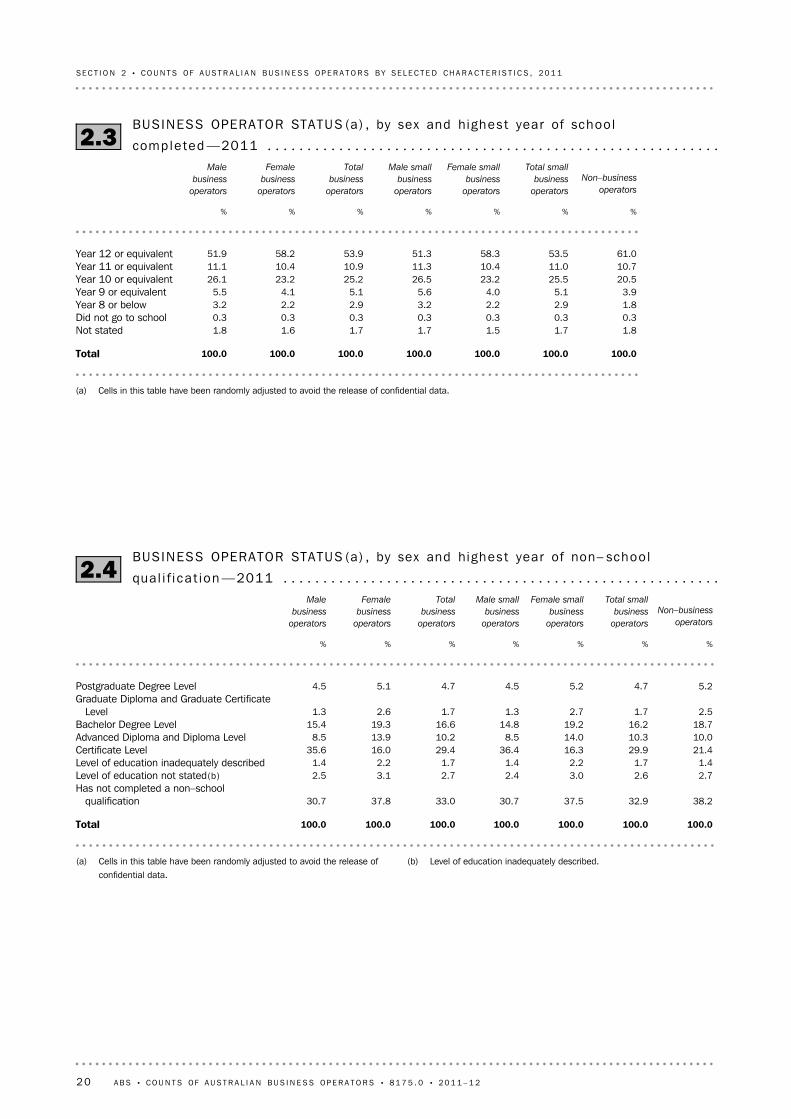
In 2011, 53.9% of business operators indicated that the highest year of school they
completed was 'Year 12 or equivalent'. A higher percentage of business operators
completed 'Year 10 or equivalent' (25.2%) than 'Year 11 or equivalent' (10.9%). These
figures are comparable when broken down by sex.
PROPORTION OF BUSINESS OPERATORS, BY HIGHEST YEAR OF SCHOOL
COMPLETED – 2011
H I G H E S T YE A R OF
SC H O O L CO M P L E T E D
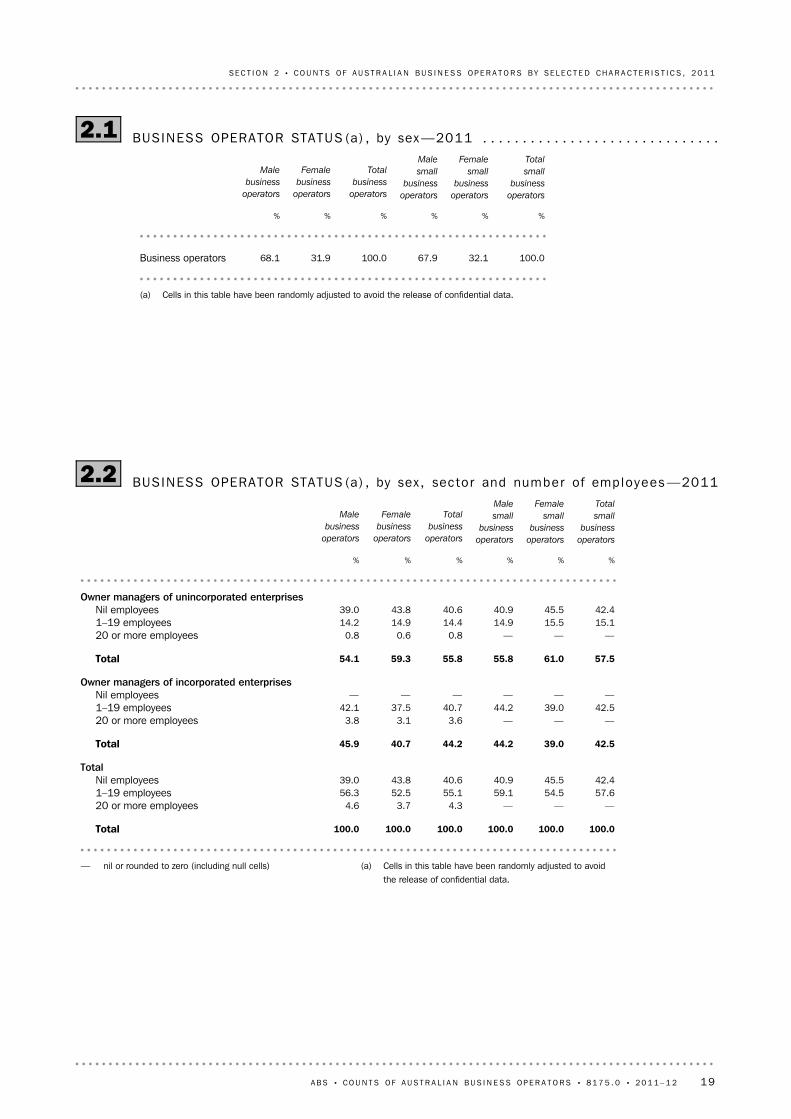
In 2011, 55.8 % of business operators indicated they were 'Owner managers of
unincorporated enterprises' with the remaining 44.2% 'Owner managers of incorporated
enterprises'.
A higher proportion of 'Female business operators' (59.3%) were 'Owner managers of
unincorporated enterprises' than 'Male business operators' (54.1%).
NU M B E R OF EM P L O Y E E S
In 2011, 68.1% of business operators were 'Male business operators', whilst 31.9% were
'Female business operators'.
SE X
The data presented in Section Two of this publication were sourced from the 2011
Census of Population and Housing. These data were collected on August 9, 2011 (Census
night) when Australian households self–reported information on their Census Forms.
For further information (including how Census data differs from Forms of Employment
Survey data presented in Section One), please refer to the Explanatory Notes.
OV E R V I E W
14 A B S • CO U N T S OF A U S T R A L I A N B U S I N E S S OP E R A T O R S • 8 1 7 5 . 0 • 2 0 1 1 – 1 2
There were differences in the most common income ranges between Male and Female
business operators and these differences were also evident between business operators
and small business operators. The highest proportion of 'Male business operators'
(16.3%) had an individual weekly income in excess of $2,000. In contrast, the highest
proportion of 'Female business operators' (17.4%) had an individual weekly income in
the '$400–$599' income range category. The largest gap in individual weekly income
between 'Male business operators' (16.3%) and 'Female business operators' (9.2%) were
in the '$2,000 or more' income range category.
The highest proportion of business operators with an individual weekly income in excess
of $2,000 was 14.0%. This contrasts with the highest proportion of small business
operators (14.1%) whose individual weekly income was in the '$400–$599' income
bracket range. The most common small business operators income range is lower than
the most common income range for 'Non–business operators', which is in the
'$600–$799' income range category.
I N D I V I D U A L WE E K L Y
IN C O M E
Natural and Physical Sciences
Information Technology
Engineering and Related Technologies
Architecture and Building
Agriculture, Environmental and Related Studies
Health
Education
Management and Commerce
Society and Culture
Creative Arts
Food, Hospitality and Personal Services
Mixed Field Programmes
Field of study inadequately described
Field of study not stated
Not applicable
Field of Study
0 10 20 30 40Percentage
Male business operatorsFemale business opearatorsTotal business operators
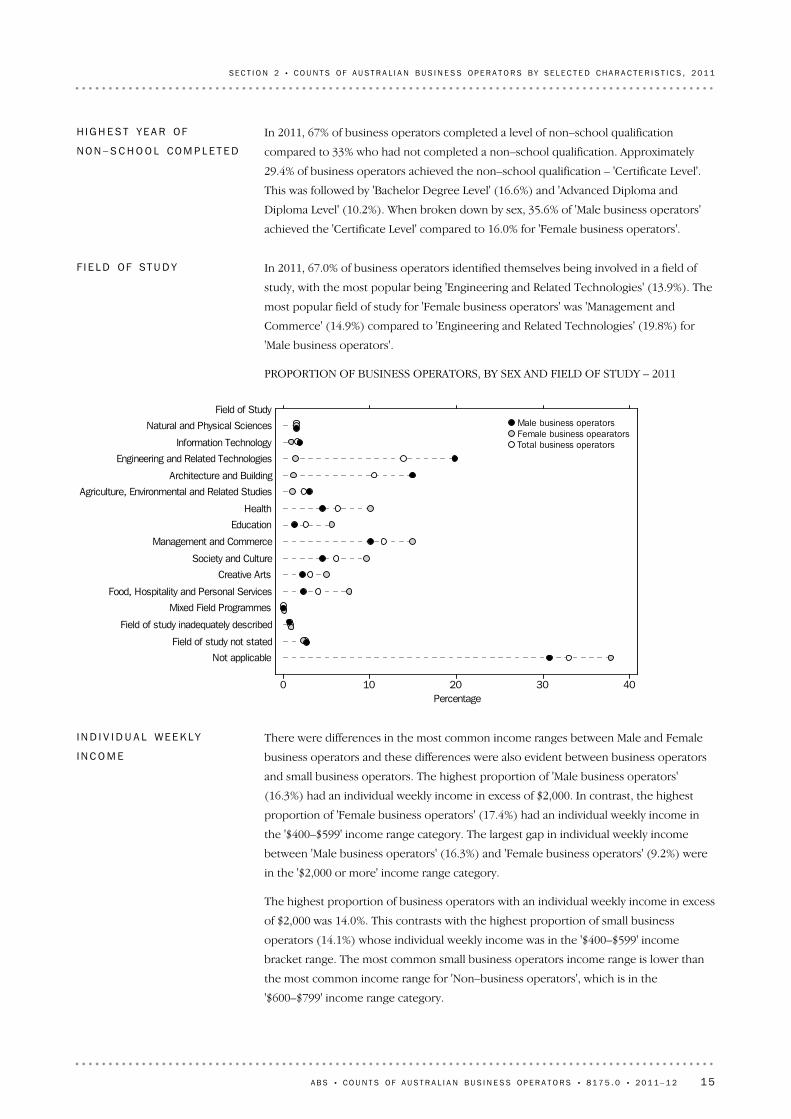
In 2011, 67.0% of business operators identified themselves being involved in a field of
study, with the most popular being 'Engineering and Related Technologies' (13.9%). The
most popular field of study for 'Female business operators' was 'Management and
Commerce' (14.9%) compared to 'Engineering and Related Technologies' (19.8%) for
'Male business operators'.
PROPORTION OF BUSINESS OPERATORS, BY SEX AND FIELD OF STUDY – 2011
F I E L D OF ST U D Y
In 2011, 67% of business operators completed a level of non–school qualification
compared to 33% who had not completed a non–school qualification. Approximately
29.4% of business operators achieved the non–school qualification – 'Certificate Level'.
This was followed by 'Bachelor Degree Level' (16.6%) and 'Advanced Diploma and
Diploma Level' (10.2%). When broken down by sex, 35.6% of 'Male business operators'
achieved the 'Certificate Level' compared to 16.0% for 'Female business operators'.
H I G H E S T YE A R OF
NO N – S C H O O L CO M P L E T E D
A B S • CO U N T S OF A U S T R A L I A N B U S I N E S S OP E R A T O R S • 8 1 7 5 . 0 • 2 0 1 1 – 1 2 15
SE C T I O N 2 • CO U N T S OF A U S T R A L I A N B U S I N E S S OP E R A T O R S B Y SE L E C T E D CH A R A C T E R I S T I C S , 2 0 1 1
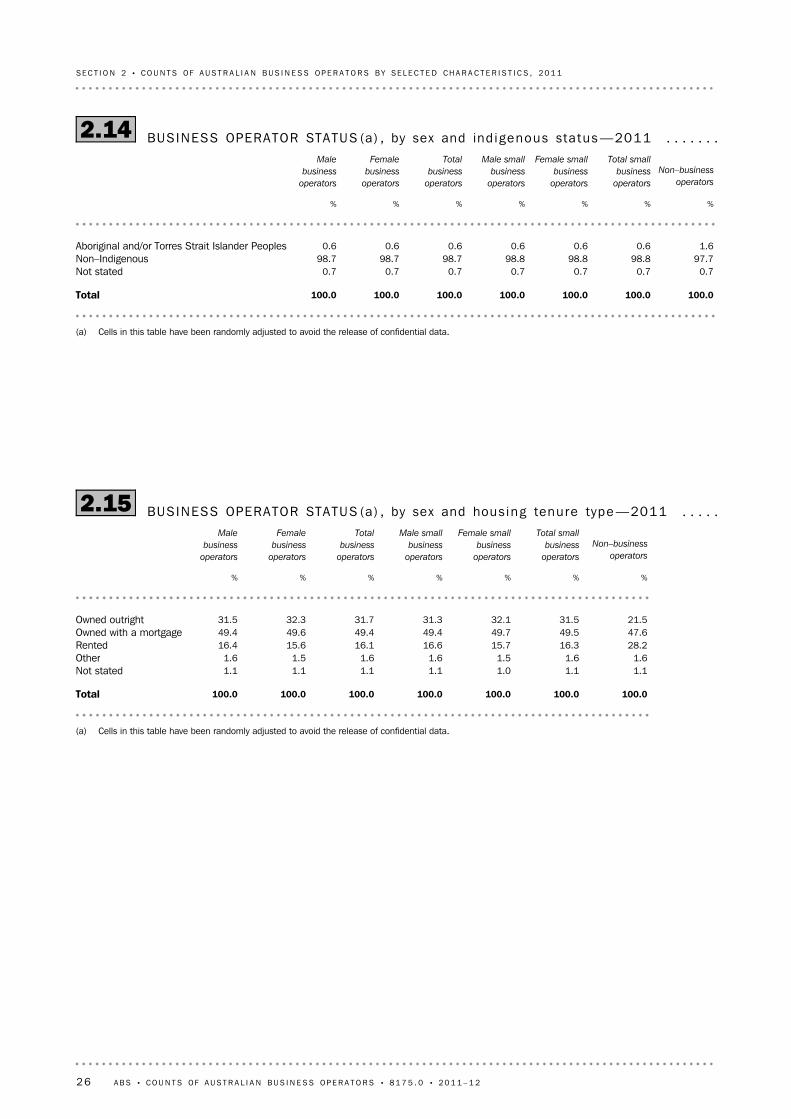
The majority (98.7%) of business operators identified themselves as 'Non–Indigenous'.I N D I G E N O U S ST A T U S
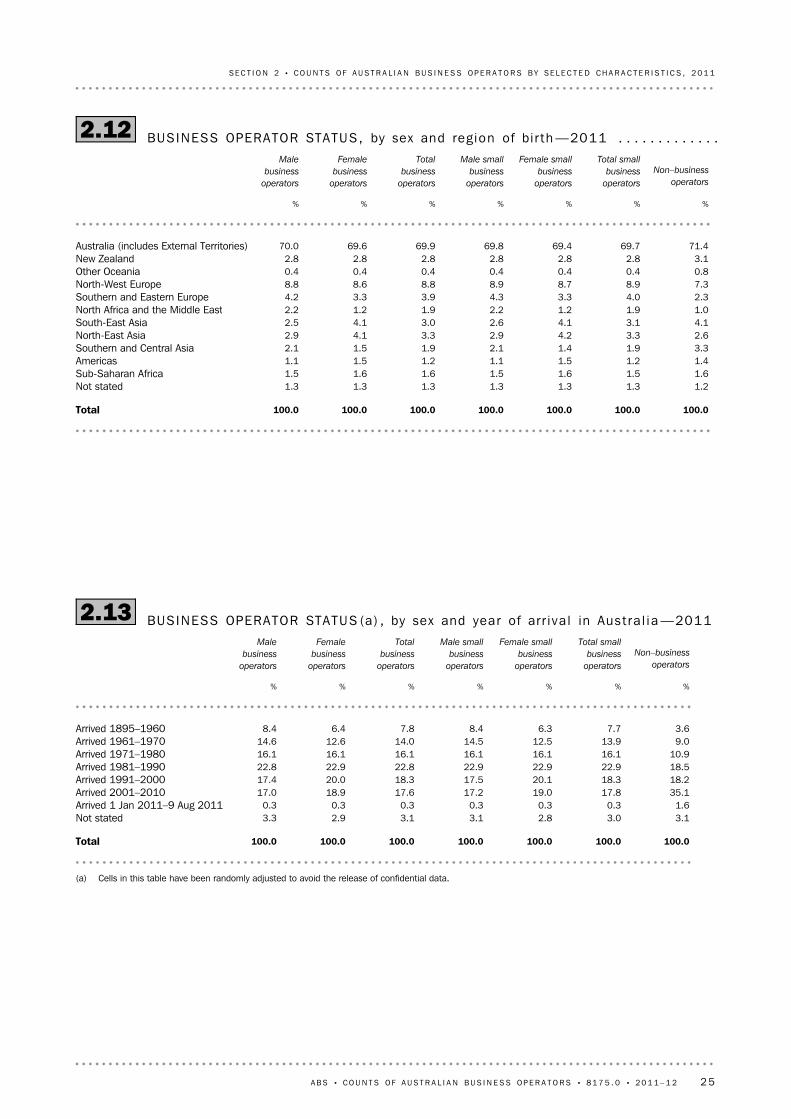
Of all the business operators not born in Australia, the most common period of arrival
was in the 'Arrived 1981–1990' category (22.8%). This was followed by the 'Arrived
1991–2000' (18.3%) and 'Arrived 2001–2010' (17.6%) categories. In contrast, the highest
proportion of immigrants in the 'Non–business operators' sub–population (35.1%),
arrived between 2001 and 2010.
YE A R OF AR R I V A L IN
AU S T R A L I A
The majority (69.9%) of business operators were born in 'Australia (includes External
Territories)'. The next most popular birth areas were 'North–West Europe' (8.8%) and
'Southern and Eastern Europe' (3.9%).
RE G I O N OF B I R T H
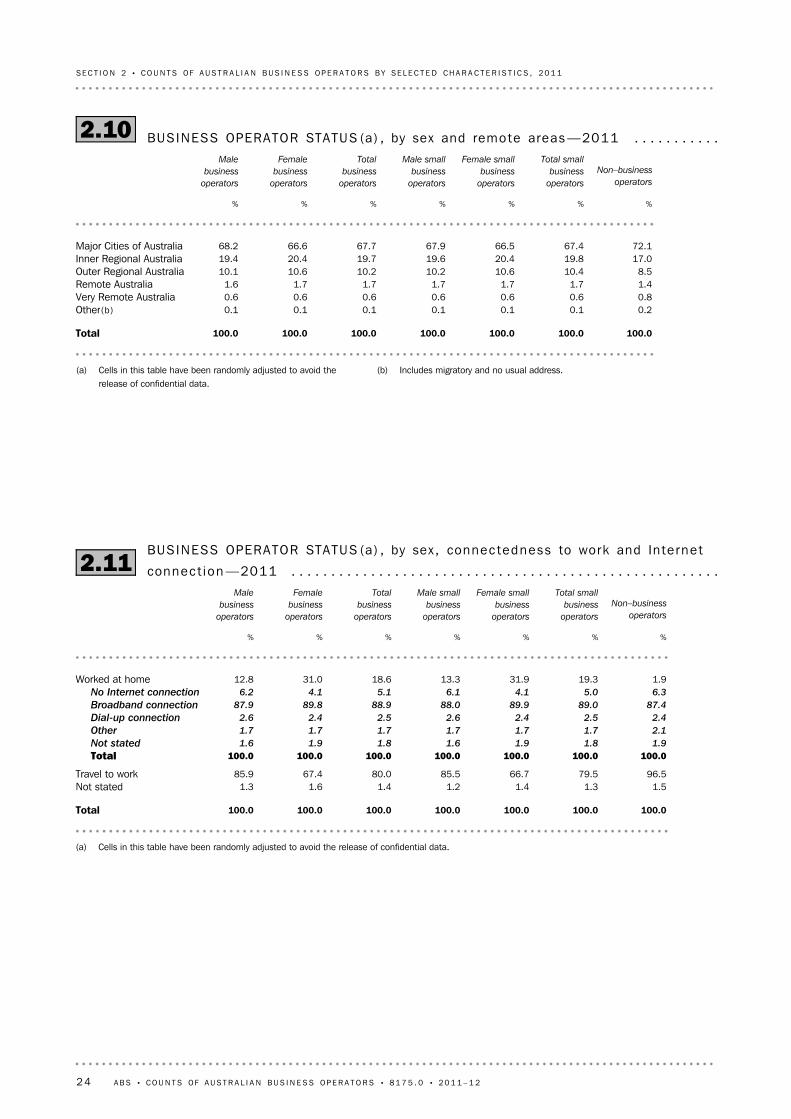
Approximately 18.6% of business operators were identified as 'Worked at home', with
88.9% of these business operators having a 'Broadband connection'.
CO N N E C T E D N E S S TO
WO R K AN D IN T E R N E T
CO N N E C T I O N
The majority (67.7%) of business operators were located in 'Major Cities of Australia'.RE M O T E AR E A S
NSW VIC QLD SA WA TAS NT ACTPlace of work
Percentage
0
10
20
30
40Male business operatorsFemale business operatorsTotal business operators
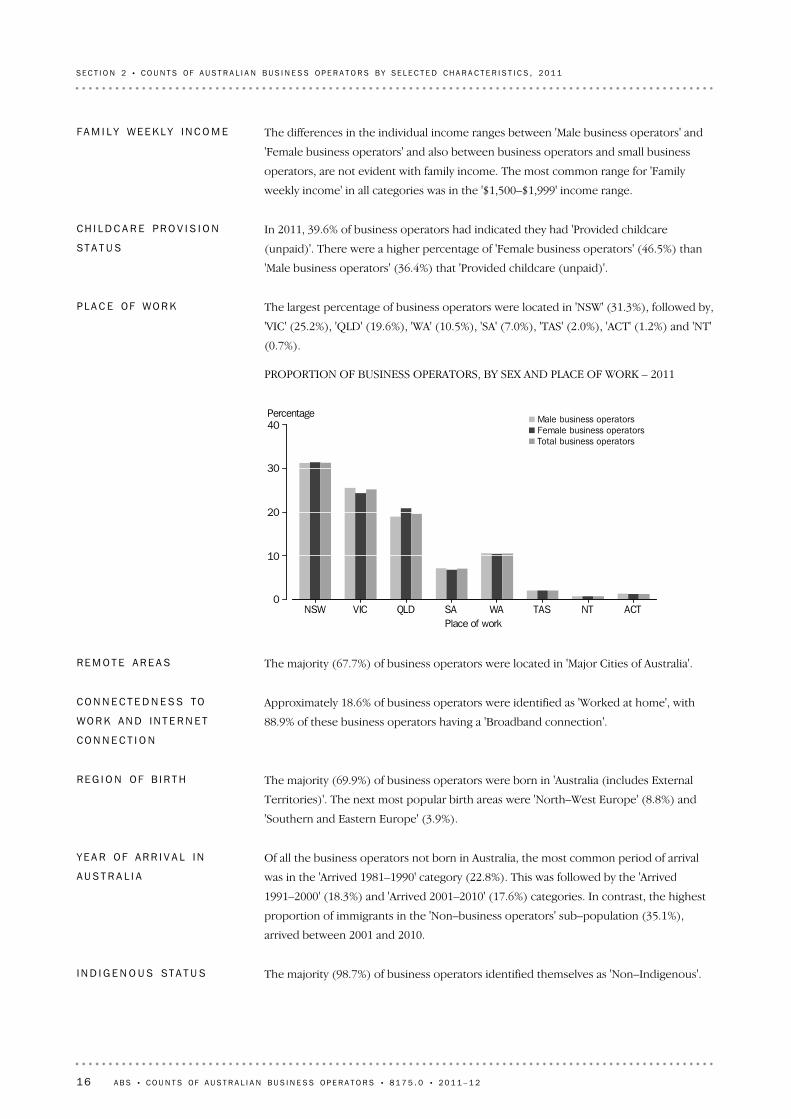
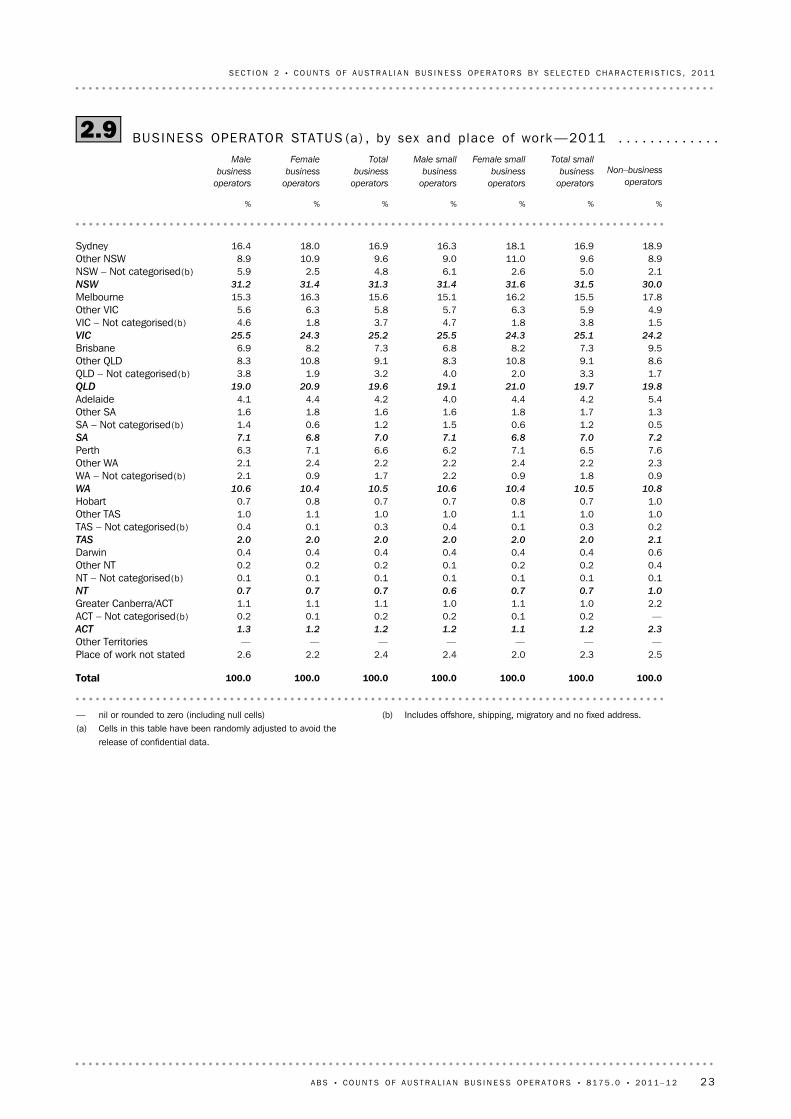
The largest percentage of business operators were located in 'NSW' (31.3%), followed by,
'VIC' (25.2%), 'QLD' (19.6%), 'WA' (10.5%), 'SA' (7.0%), 'TAS' (2.0%), 'ACT' (1.2%) and 'NT'
(0.7%).
PROPORTION OF BUSINESS OPERATORS, BY SEX AND PLACE OF WORK – 2011
PL A C E OF WO R K
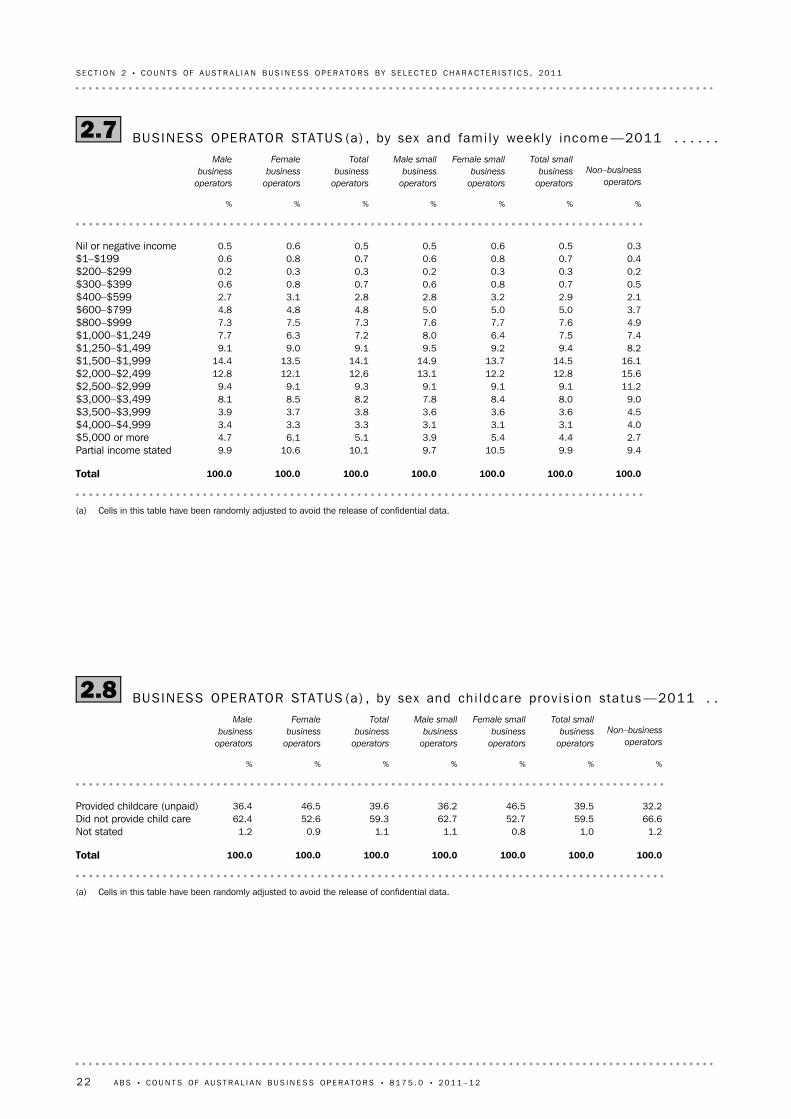
In 2011, 39.6% of business operators had indicated they had 'Provided childcare
(unpaid)'. There were a higher percentage of 'Female business operators' (46.5%) than
'Male business operators' (36.4%) that 'Provided childcare (unpaid)'.
CH I L D C A R E PR O V I S I O N
ST A T U S
The differences in the individual income ranges between 'Male business operators' and
'Female business operators' and also between business operators and small business
operators, are not evident with family income. The most common range for 'Family
weekly income' in all categories was in the '$1,500–$1,999' income range.
FA M I L Y WE E K L Y IN C O M E
16 A B S • CO U N T S OF A U S T R A L I A N B U S I N E S S OP E R A T O R S • 8 1 7 5 . 0 • 2 0 1 1 – 1 2
SE C T I O N 2 • CO U N T S OF A U S T R A L I A N B U S I N E S S OP E R A T O R S B Y SE L E C T E D CH A R A C T E R I S T I C S , 2 0 1 1
In 2011, 63.9% of business operators had the 'Same address five years ago'.US U A L AD D R E S S F I V E
YE A R S AG O
The majority (88.9%) of business operators had the 'Same address one year ago'.US U A L AD D R E S S ON E
YE A R AG O
The most popular type of housing tenure for business operators was 'Owned with a
mortgage' (49.4%). This was followed by the 'Owned outright' (31.7%) and 'Rented'
(16.1%) categories.
HO U S I N G TE N U R E T Y P E
A B S • CO U N T S OF A U S T R A L I A N B U S I N E S S OP E R A T O R S • 8 1 7 5 . 0 • 2 0 1 1 – 1 2 17
SE C T I O N 2 • CO U N T S OF A U S T R A L I A N B U S I N E S S OP E R A T O R S B Y SE L E C T E D CH A R A C T E R I S T I C S , 2 0 1 1
L I S T O F T A B L E S
27Business operator status, by sex and usual address five years ago, 20112.17 . . . . .27Business operator status, by sex and usual address one year ago, 20112.16 . . . . .26Business operator status, by sex and housing tenure type, 20112.15 . . . . . . . . .26Business operator status, by sex and indigenous status, 20112.14 . . . . . . . . . . .25Business operator status, by sex and year of arrival in Australia, 20112.13 . . . . . .25Business operator status, by sex and region of birth, 20112.12 . . . . . . . . . . . . .24
Business operator status, by sex, connectedness to work and Internet
connection, 2011
2.11. . . . . . . . . . . . . . . . . . . . . . . . . . . . . . . . . . . . . .
24Business operator status, by sex and remote areas, 20112.10 . . . . . . . . . . . . . .23Business operator status, by sex and place of work, 20112.9 . . . . . . . . . . . . . .22Business operator status, by sex and childcare provision status, 20112.8 . . . . . .22Business operator status, by sex and family weekly income, 20112.7 . . . . . . . . .21Business operator status, by sex and individual weekly income, 20112.6 . . . . . .21Business operator status, by sex and field of study, 20112.5 . . . . . . . . . . . . . .20
Business operator status, by sex and highest year of non–school
qualification, 2011
2.4. . . . . . . . . . . . . . . . . . . . . . . . . . . . . . . . . . . . . .
20
Business operator status, by sex and highest year of school completed,
2011
2.3. . . . . . . . . . . . . . . . . . . . . . . . . . . . . . . . . . . . . . . . . . . . . .
19Business operator status, by sex, sector and number of employees, 20112.2 . . . .19Business operator status, by sex, 20112.1 . . . . . . . . . . . . . . . . . . . . . . . . .
SE C T I O N TW O
page
18 A B S • CO U N T S OF A U S T R A L I A N B U S I N E S S OP E R A T O R S • 8 1 7 5 . 0 • 2 0 1 1 – 1 2
SE C T I O N 2 • CO U N T S OF A U S T R A L I A N B U S I N E S S OP E R A T O R S B Y SE L E C T E D CH A R A C T E R I S T I C S , 2 0 1 1
(a) Cells in this table have been randomly adjusted to avoid the release of confidential data.
100.032.167.9100.031.968.1Business operators
%%%%%%
Totalsmall
businessoperators
Femalesmall
businessoperators
Malesmall
businessoperators
Totalbusiness
operators
Femalebusiness
operators
Malebusiness
operators
BUSINESS OPERATOR STATUS (a) , by sex —20112.1 . . . . . . . . . . . . . . . . . . . . . . . . . . . . . .
(a) Cells in this table have been randomly adjusted to avoidthe release of confidential data.
— nil or rounded to zero (including null cells)
100.0100.0100.0100.0100.0100.0Total
———4.33.74.620 or more employees57.654.559.155.152.556.31–19 employees42.445.540.940.643.839.0Nil employees
Total
42.539.044.244.240.745.9Total
———3.63.13.820 or more employees42.539.044.240.737.542.11–19 employees
——————Nil employeesOwner managers of incorporated enterprises
57.561.055.855.859.354.1Total
———0.80.60.820 or more employees15.115.514.914.414.914.21–19 employees42.445.540.940.643.839.0Nil employees
Owner managers of unincorporated enterprises
%%%%%%
Totalsmall
businessoperators
Femalesmall
businessoperators
Malesmall
businessoperators
Totalbusiness
operators
Femalebusiness
operators
Malebusiness
operators
BUSINESS OPERATOR STATUS (a) , by sex , sec to r and number of employees —20112.2
A B S • CO U N T S OF A U S T R A L I A N B U S I N E S S OP E R A T O R S • 8 1 7 5 . 0 • 2 0 1 1 – 1 2 19
SE C T I O N 2 • CO U N T S OF A U S T R A L I A N B U S I N E S S OP E R A T O R S B Y SE L E C T E D CH A R A C T E R I S T I C S , 2 0 1 1
(a) Cells in this table have been randomly adjusted to avoid the release of confidential data.
100.0100.0100.0100.0100.0100.0100.0Total
1.81.71.51.71.71.61.8Not stated0.30.30.30.30.30.30.3Did not go to school1.82.92.23.22.92.23.2Year 8 or below3.95.14.05.65.14.15.5Year 9 or equivalent
20.525.523.226.525.223.226.1Year 10 or equivalent10.711.010.411.310.910.411.1Year 11 or equivalent61.053.558.351.353.958.251.9Year 12 or equivalent
%%%%%%%
Non–business
operators
Total small
business
operators
Female small
business
operators
Male small
business
operators
Total
business
operators
Female
business
operators
Male
business
operators
BUSINESS OPERATOR STATUS (a) , by sex and highes t year of schoo l
comp le ted —20112.3 . . . . . . . . . . . . . . . . . . . . . . . . . . . . . . . . . . . . . . . . . . . . . . . . . . . . . . . . .
(b) Level of education inadequately described.(a) Cells in this table have been randomly adjusted to avoid the release ofconfidential data.
100.0100.0100.0100.0100.0100.0100.0Total
38.232.937.530.733.037.830.7Has not completed a non–school
qualification
2.72.63.02.42.73.12.5Level of education not stated(b)1.41.72.21.41.72.21.4Level of education inadequately described
21.429.916.336.429.416.035.6Certificate Level10.010.314.08.510.213.98.5Advanced Diploma and Diploma Level18.716.219.214.816.619.315.4Bachelor Degree Level
2.51.72.71.31.72.61.3Graduate Diploma and Graduate Certificate
Level
5.24.75.24.54.75.14.5Postgraduate Degree Level
%%%%%%%
Non–business
operators
Total small
business
operators
Female small
business
operators
Male small
business
operators
Total
business
operators
Female
business
operators
Male
business
operators
BUSINESS OPERATOR STATUS (a) , by sex and highes t year of non– schoo l
qua l i f i ca t ion —20112.4 . . . . . . . . . . . . . . . . . . . . . . . . . . . . . . . . . . . . . . . . . . . . . . . . . . . . . . .
20 A B S • CO U N T S OF A U S T R A L I A N B U S I N E S S OP E R A T O R S • 8 1 7 5 . 0 • 2 0 1 1 – 1 2
SE C T I O N 2 • CO U N T S OF A U S T R A L I A N B U S I N E S S OP E R A T O R S B Y SE L E C T E D CH A R A C T E R I S T I C S , 2 0 1 1

(b) Not applicable comprises Persons who have a qualification that is out ofscope of this classification; Persons with no qualification and Personsstill studying for a first qualification.
— nil or rounded to zero (including null cells)(a) Cells in this table have been randomly adjusted to avoid the release of
confidential data.
100.0100.0100.0100.0100.0100.0100.0Total
38.232.937.530.733.037.830.7Not applicable(b)2.72.52.22.62.62.32.7Field of study not stated0.80.80.90.70.80.90.7Field of study inadequately described0.1—0.1——0.1—Mixed Field Programmes3.34.07.72.34.07.62.3Food, Hospitality and Personal Services2.23.25.12.23.15.02.2Creative Arts7.66.09.64.26.19.64.5Society and Culture
13.511.414.99.711.614.910.1Management and Commerce5.52.75.61.32.65.61.3Education6.66.310.24.56.310.14.5Health1.42.41.23.02.41.13.0Agriculture, Environmental and Related Studies3.010.81.215.310.51.214.9Architecture and Building
10.614.01.420.013.91.419.8Engineering and Related Technologies2.41.60.91.91.60.91.9Information Technology2.11.51.51.51.51.51.5Natural and Physical Sciences
%%%%%%%
Non–businessoperators
Total smallbusiness
operators
Female smallbusiness
operators
Male smallbusiness
operators
Totalbusiness
operators
Femalebusiness
operators
Malebusiness
operators
BUSINESS OPERATOR STATUS (a) , by sex and f ie ld of study —20112.5 . . . . . . . . . . . . .
(a) Cells in this table have been randomly adjusted to avoid the release of confidential data.
100.0100.0100.0100.0100.0100.0100.0Total
1.62.22.02.32.32.12.4Not stated9.512.48.314.414.09.216.3$2,000 or more
10.99.36.710.59.46.910.6$1,500–$1,9999.18.46.29.48.36.39.3$1,250–$1,499
12.811.89.213.111.69.212.8$1,000–$1,24913.011.810.412.411.510.312.1$800–$99915.214.014.813.713.614.513.2$600–$79911.814.117.812.313.617.411.8$400–$599
5.56.49.25.06.29.04.9$300–$3994.24.67.43.34.57.23.2$200–$2995.53.56.52.13.46.42.0$1–$1991.01.51.51.51.51.51.5Nil or negative income
%%%%%%%
Non–businessoperators
Total smallbusiness
operators
Female smallbusiness
operators
Male smallbusiness
operators
Totalbusiness
operators
Femalebusiness
operators
Malebusiness
operators
BUSINESS OPERATOR STATUS (a) , by sex and ind i v idua l week l y income —20112.6 . . .
A B S • CO U N T S OF A U S T R A L I A N B U S I N E S S OP E R A T O R S • 8 1 7 5 . 0 • 2 0 1 1 – 1 2 21
SE C T I O N 2 • CO U N T S OF A U S T R A L I A N B U S I N E S S OP E R A T O R S B Y SE L E C T E D CH A R A C T E R I S T I C S , 2 0 1 1
(a) Cells in this table have been randomly adjusted to avoid the release of confidential data.
100.0100.0100.0100.0100.0100.0100.0Total
9.49.910.59.710.110.69.9Partial income stated2.74.45.43.95.16.14.7$5,000 or more4.03.13.13.13.33.33.4$4,000–$4,9994.53.63.63.63.83.73.9$3,500–$3,9999.08.08.47.88.28.58.1$3,000–$3,499
11.29.19.19.19.39.19.4$2,500–$2,99915.612.812.213.112.612.112.8$2,000–$2,49916.114.513.714.914.113.514.4$1,500–$1,999
8.29.49.29.59.19.09.1$1,250–$1,4997.47.56.48.07.26.37.7$1,000–$1,2494.97.67.77.67.37.57.3$800–$9993.75.05.05.04.84.84.8$600–$7992.12.93.22.82.83.12.7$400–$5990.50.70.80.60.70.80.6$300–$3990.20.30.30.20.30.30.2$200–$2990.40.70.80.60.70.80.6$1–$1990.30.50.60.50.50.60.5Nil or negative income
%%%%%%%
Non–businessoperators
Total smallbusiness
operators
Female smallbusiness
operators
Male smallbusiness
operators
Totalbusiness
operators
Femalebusiness
operators
Malebusiness
operators
BUSINESS OPERATOR STATUS (a) , by sex and fami l y week l y income —20112.7 . . . . . .
(a) Cells in this table have been randomly adjusted to avoid the release of confidential data.
100.0100.0100.0100.0100.0100.0100.0Total
1.21.00.81.11.10.91.2Not stated66.659.552.762.759.352.662.4Did not provide child care32.239.546.536.239.646.536.4Provided childcare (unpaid)
%%%%%%%
Non–businessoperators
Total smallbusiness
operators
Female smallbusiness
operators
Male smallbusiness
operators
Totalbusiness
operators
Femalebusiness
operators
Malebusiness
operators
BUSINESS OPERATOR STATUS (a) , by sex and chi ldcare prov i s ion sta tus —20112.8 . .
22 A B S • CO U N T S OF A U S T R A L I A N B U S I N E S S OP E R A T O R S • 8 1 7 5 . 0 • 2 0 1 1 – 1 2
SE C T I O N 2 • CO U N T S OF A U S T R A L I A N B U S I N E S S OP E R A T O R S B Y SE L E C T E D CH A R A C T E R I S T I C S , 2 0 1 1
(b) Includes offshore, shipping, migratory and no fixed address.— nil or rounded to zero (including null cells)(a) Cells in this table have been randomly adjusted to avoid the
release of confidential data.
100.0100.0100.0100.0100.0100.0100.0Total
2.52.32.02.42.42.22.6Place of work not stated———————Other Territories
2.31.21.11.21.21.21.3ACT—0.20.10.20.20.10.2ACT – Not categorised(b)
2.21.01.11.01.11.11.1Greater Canberra/ACT1.00.70.70.60.70.70.7NT0.10.10.10.10.10.10.1NT – Not categorised(b)0.40.20.20.10.20.20.2Other NT0.60.40.40.40.40.40.4Darwin2.12.02.02.02.02.02.0TAS0.20.30.10.40.30.10.4TAS – Not categorised(b)1.01.01.11.01.01.11.0Other TAS1.00.70.80.70.70.80.7Hobart
10.810.510.410.610.510.410.6WA0.91.80.92.21.70.92.1WA – Not categorised(b)2.32.22.42.22.22.42.1Other WA7.66.57.16.26.67.16.3Perth7.27.06.87.17.06.87.1SA0.51.20.61.51.20.61.4SA – Not categorised(b)1.31.71.81.61.61.81.6Other SA5.44.24.44.04.24.44.1Adelaide
19.819.721.019.119.620.919.0QLD1.73.32.04.03.21.93.8QLD – Not categorised(b)8.69.110.88.39.110.88.3Other QLD9.57.38.26.87.38.26.9Brisbane
24.225.124.325.525.224.325.5VIC1.53.81.84.73.71.84.6VIC – Not categorised(b)4.95.96.35.75.86.35.6Other VIC
17.815.516.215.115.616.315.3Melbourne30.031.531.631.431.331.431.2NSW
2.15.02.66.14.82.55.9NSW – Not categorised(b)8.99.611.09.09.610.98.9Other NSW
18.916.918.116.316.918.016.4Sydney
%%%%%%%
Non–businessoperators
Total smallbusiness
operators
Female smallbusiness
operators
Male smallbusiness
operators
Totalbusiness
operators
Femalebusiness
operators
Malebusiness
operators
BUSINESS OPERATOR STATUS (a) , by sex and place of work —20112.9 . . . . . . . . . . . . .
A B S • CO U N T S OF A U S T R A L I A N B U S I N E S S OP E R A T O R S • 8 1 7 5 . 0 • 2 0 1 1 – 1 2 23
SE C T I O N 2 • CO U N T S OF A U S T R A L I A N B U S I N E S S OP E R A T O R S B Y SE L E C T E D CH A R A C T E R I S T I C S , 2 0 1 1
(b) Includes migratory and no usual address.(a) Cells in this table have been randomly adjusted to avoid therelease of confidential data.
100.0100.0100.0100.0100.0100.0100.0Total
0.20.10.10.10.10.10.1Other(b)0.80.60.60.60.60.60.6Very Remote Australia1.41.71.71.71.71.71.6Remote Australia8.510.410.610.210.210.610.1Outer Regional Australia
17.019.820.419.619.720.419.4Inner Regional Australia72.167.466.567.967.766.668.2Major Cities of Australia
%%%%%%%
Non–businessoperators
Total smallbusiness
operators
Female smallbusiness
operators
Male smallbusiness
operators
Totalbusiness
operators
Femalebusiness
operators
Malebusiness
operators
BUSINESS OPERATOR STATUS (a) , by sex and remote areas —20112.10 . . . . . . . . . . .
(a) Cells in this table have been randomly adjusted to avoid the release of confidential data.
100.0100.0100.0100.0100.0100.0100.0Total
1.51.31.41.21.41.61.3Not stated96.579.566.785.580.067.485.9Travel to work
100.0100.0100.0100.0100.0100.0100.0Total1.91.81.91.61.81.91.6Not stated2.11.71.71.71.71.71.7Other2.42.52.42.62.52.42.6Dial-up connection
87.489.089.988.088.989.887.9Broadband connection6.35.04.16.15.14.16.2No Internet connection1.919.331.913.318.631.012.8Worked at home
%%%%%%%
Non–businessoperators
Total smallbusiness
operators
Female smallbusiness
operators
Male smallbusiness
operators
Totalbusiness
operators
Femalebusiness
operators
Malebusiness
operators
BUSINESS OPERATOR STATUS (a) , by sex , connectedness to work and Internet
connect ion —20112.11 . . . . . . . . . . . . . . . . . . . . . . . . . . . . . . . . . . . . . . . . . . . . . . . . . . . . . .
24 A B S • CO U N T S OF A U S T R A L I A N B U S I N E S S OP E R A T O R S • 8 1 7 5 . 0 • 2 0 1 1 – 1 2
SE C T I O N 2 • CO U N T S OF A U S T R A L I A N B U S I N E S S OP E R A T O R S B Y SE L E C T E D CH A R A C T E R I S T I C S , 2 0 1 1
100.0100.0100.0100.0100.0100.0100.0Total
1.21.31.31.31.31.31.3Not stated1.61.51.61.51.61.61.5Sub-Saharan Africa1.41.21.51.11.21.51.1Americas3.31.91.42.11.91.52.1Southern and Central Asia2.63.34.22.93.34.12.9North-East Asia4.13.14.12.63.04.12.5South-East Asia1.01.91.22.21.91.22.2North Africa and the Middle East2.34.03.34.33.93.34.2Southern and Eastern Europe7.38.98.78.98.88.68.8North-West Europe0.80.40.40.40.40.40.4Other Oceania3.12.82.82.82.82.82.8New Zealand
71.469.769.469.869.969.670.0Australia (includes External Territories)
%%%%%%%
Non–businessoperators
Total smallbusiness
operators
Female smallbusiness
operators
Male smallbusiness
operators
Totalbusiness
operators
Femalebusiness
operators
Malebusiness
operators
BUSINESS OPERATOR STATUS, by sex and reg ion of bi r th —20112.12 . . . . . . . . . . . . .
(a) Cells in this table have been randomly adjusted to avoid the release of confidential data.
100.0100.0100.0100.0100.0100.0100.0Total
3.13.02.83.13.12.93.3Not stated1.60.30.30.30.30.30.3Arrived 1 Jan 2011–9 Aug 2011
35.117.819.017.217.618.917.0Arrived 2001–201018.218.320.117.518.320.017.4Arrived 1991–200018.522.922.922.922.822.922.8Arrived 1981–199010.916.116.116.116.116.116.1Arrived 1971–1980
9.013.912.514.514.012.614.6Arrived 1961–19703.67.76.38.47.86.48.4Arrived 1895–1960
%%%%%%%
Non–businessoperators
Total smallbusiness
operators
Female smallbusiness
operators
Male smallbusiness
operators
Totalbusiness
operators
Femalebusiness
operators
Malebusiness
operators
BUSINESS OPERATOR STATUS (a) , by sex and year of arr i va l in Aust ra l i a —20112.13
A B S • CO U N T S OF A U S T R A L I A N B U S I N E S S OP E R A T O R S • 8 1 7 5 . 0 • 2 0 1 1 – 1 2 25
SE C T I O N 2 • CO U N T S OF A U S T R A L I A N B U S I N E S S OP E R A T O R S B Y SE L E C T E D CH A R A C T E R I S T I C S , 2 0 1 1
(a) Cells in this table have been randomly adjusted to avoid the release of confidential data.
100.0100.0100.0100.0100.0100.0100.0Total
0.70.70.70.70.70.70.7Not stated97.798.898.898.898.798.798.7Non–Indigenous
1.60.60.60.60.60.60.6Aboriginal and/or Torres Strait Islander Peoples
%%%%%%%
Non–businessoperators
Total smallbusiness
operators
Female smallbusiness
operators
Male smallbusiness
operators
Totalbusiness
operators
Femalebusiness
operators
Malebusiness
operators
BUSINESS OPERATOR STATUS (a) , by sex and ind igenous status —20112.14 . . . . . . .
(a) Cells in this table have been randomly adjusted to avoid the release of confidential data.
100.0100.0100.0100.0100.0100.0100.0Total
1.11.11.01.11.11.11.1Not stated1.61.61.51.61.61.51.6Other
28.216.315.716.616.115.616.4Rented47.649.549.749.449.449.649.4Owned with a mortgage21.531.532.131.331.732.331.5Owned outright
%%%%%%%
Non–businessoperators
Total smallbusiness
operators
Female smallbusiness
operators
Male smallbusiness
operators
Totalbusiness
operators
Femalebusiness
operators
Malebusiness
operators
BUSINESS OPERATOR STATUS (a) , by sex and hous ing tenure type —20112.15 . . . . .
26 A B S • CO U N T S OF A U S T R A L I A N B U S I N E S S OP E R A T O R S • 8 1 7 5 . 0 • 2 0 1 1 – 1 2
SE C T I O N 2 • CO U N T S OF A U S T R A L I A N B U S I N E S S OP E R A T O R S B Y SE L E C T E D CH A R A C T E R I S T I C S , 2 0 1 1

(a) Cells in this table have been randomly adjusted to avoid the release of confidential data.
100.0100.0100.0100.0100.0100.0100.0Total
0.60.40.40.40.40.40.5Not stated1.40.50.50.50.50.50.5Overseas one year ago
16.610.210.110.310.210.110.3Elsewhere in Australia one year ago81.488.989.088.888.989.088.8Same address one year ago
%%%%%%%
Non–businessoperators
Total smallbusiness
operators
Female smallbusiness
operators
Male smallbusiness
operators
Totalbusiness
operators
Femalebusiness
operators
Malebusiness
operators
BUSINESS OPERATOR STATUS (a) , by sex and usua l address one year ago —20112.16
(a) Cells in this table have been randomly adjusted to avoid the release of confidential data.
100.0100.0100.0100.0100.0100.0100.0Total
1.20.90.80.90.90.80.9Not stated7.03.03.32.93.03.22.8Overseas five years ago
39.732.232.432.132.232.332.1Elsewhere in Australia five years ago52.163.963.564.163.963.664.1Same address five years ago
%%%%%%%
Non–businessoperators
Total smallbusiness
operators
Female smallbusiness
operators
Male smallbusiness
operators
Totalbusiness
operators
Femalebusiness
operators
Malebusiness
operators
BUSINESS OPERATOR STATUS (a) , by sex and usua l address f ive years
ago —20112.17 . . . . . . . . . . . . . . . . . . . . . . . . . . . . . . . . . . . . . . . . . . . . . . . . . . . . . . . . . . . . .
A B S • CO U N T S OF A U S T R A L I A N B U S I N E S S OP E R A T O R S • 8 1 7 5 . 0 • 2 0 1 1 – 1 2 27
SE C T I O N 2 • CO U N T S OF A U S T R A L I A N B U S I N E S S OP E R A T O R S B Y SE L E C T E D CH A R A C T E R I S T I C S , 2 0 1 1
EX P L A N A T O R Y NO T E S . . . . . . . . . . . . . . . . . . . . . . . . . . . . . . .
9 Data Sourced from the 2012 Forms of Employment SurveyPA R T A :
3 This publication has two Sections.
4 Section One includes data sourced from the 2012 FOES. The data presented describe
Australian business operators across a range of characteristics, using counts and
proportions. These characteristics provide an indication of the distribution of Australia's
business operators and also provide further insight into the characteristics of the
businesses operated in the Australian economy. For example, data on industry,
geography, and employment are relevant to individuals (i.e. business operators) and the
businesses they operate. Where possible, data have also been included for 'non–business
operators'.
5 Section Two includes data sourced from the 2011 Census. The data presented
describe the distribution of Australian business operators (including small business
operators) across a range of characteristics, in terms of proportions. The distribution of
these characteristics has also been compared with 'non–business operators' where
possible.
6 Together, Sections One and Two provide, on a similar conceptual basis, a
comprehensive picture of Australia's business operators. For the purposes of this
publication, business operators essentially comprise owner managers of incorporated
and unincorporated Australian enterprises, while non–business operators mainly
comprise all other employed persons (refer to the Glossary for further information).
Further, the data sources used in Sections One and Two collect information in regard to
individuals and their 'main job', which further enhances the consistency and
complementary nature of the data.
7 Additional information is presented towards the end of the publication, including
Explanatory and Technical Notes, an Appendix pertaining to the history of ABS business
operator counts, and a Glossary of terms used in the publication.
8 The Explanatory Notes which follow have therefore been separated into two parts.
Part A describes data sourced from the 2012 FOES. Part B describes data sourced from
the 2011 Census.
ST R U C T U R E OF TH E
PU B L I C A T I O N
1 This publication presents counts of Australian business operators sourced from the
2012 Forms Of Employment Survey (FOES) and the 2011 Census of Population and
Housing (Census).
2 The Census and the FOES are fundamentally different statistical collections (i.e. one
is a census and the other is a survey). The Census relies on Australian households to
self–report information on Census night, whereas data collected through the FOES are
directly collected by trained ABS interviewers. In addition, there are a range of concepts
and methodologies particular to each collection. It is therefore important to separately
discuss these and other issues, with specific reference to their use in Counts of
Australian Business Operators.
OV E R V I E W
28 A B S • CO U N T S OF A U S T R A L I A N B U S I N E S S OP E R A T O R S • 8 1 7 5 . 0 • 2 0 1 1 – 1 2

18 The statistics included in Section One of Counts of Australian Business Operators
(CABO) and sourced from the FOES were collected throughout Australia in November
2012 as a supplementary to the LFS.
RE F E R E N C E PE R I O D
17 The estimates in this publication relate to people covered by the FOES in
November 2012. In the LFS, coverage rules are applied which aim to ensure that each
person is associated with only one dwelling and hence has only one chance of selection
in the survey: See Labour Force, Australia (cat. no. 6202.0) for more details.
CO V E R A G E
12 The LFS is restricted to people aged fifteen years and over and excludes the
following people:
! members of the permanent defence forces;
! certain diplomatic personnel of overseas governments, customarily excluded from
the census and estimated populations;
! overseas residents in Australia;
! members of non–Australian defence forces (and their dependants); and
! Students at boarding schools, patients in hospitals, residents of homes (e.g.
retirement homes, homes for people with disabilities), Aboriginal and Torres Strait
Islander communities in very remote parts of Australia and inmates of prisons.
13 The FOES is a supplementary survey used to further refine this population. The
FOES was conducted in both urban and rural areas in all states and territories, but
excluded persons living in very remote parts of Australia which would otherwise have
been within the scope of the survey. The exclusion of these people will have only a
minor impact on any aggregate estimates produced for individual states and territories,
except the Northern Territory where such people account for approximately 22% of the
population.
14 This survey was restricted to employed people aged fifteen years and over who
were not contributing family workers in their main job. Questions were asked about
employment arrangements in the main job of all employed people.
15 For the purposes of the data included in Section One of this publication, the
business operator population comprises all owner managers of incorporated and
unincorporated businesses. It excludes persons who are classified to other types of
employment status categories [e.g. employees who do not own businesses (excluding
owner managers of incorporated enterprises) and contributing family workers].
16 Non–business operators comprise of people who work for a public or private
employer and receive remuneration as wages or salaries. Employees are engaged under a
contract of service (an employment contract) and take directions from their
employer/supervisor/manager/foreman on how the work is performed. It excludes
business operators as well as those persons who are also excluded from the scope of the
LFS and/or FOES (as described above).
SC O P E
10 The statistics presented in Section One of this publication were compiled using
data collected from the 2012 FOES. The FOES was conducted throughout Australia in
November 2012 as a supplement to the Monthly Labour Force Survey (LFS).
Respondents to the LFS who fell within the scope of the supplementary survey were
asked further questions.
11 In addition to the information presented in these Explanatory Notes, the
publication Labour Force, Australia (cat. no. 6202.0) contains information about survey
design, sample redesign, scope, coverage and population benchmarks relevant to the
LFS, which also apply to supplementary surveys. It also contains definitions of
demographic and labour force characteristics, and information about telephone
interviewing which are relevant to both the LFS and supplementary surveys.
I N T R O D U C T I O N
A B S • CO U N T S OF A U S T R A L I A N B U S I N E S S OP E R A T O R S • 8 1 7 5 . 0 • 2 0 1 1 – 1 2 29
EX P L A N A T O R Y N O T E S
31 This is the second release of CABO. As such, time–series analysis is not possible and
users should exercise caution making comparisons with previous sources of ABS
business operators data. However, data pertaining to owner managers of incorporated
and unincorporated businesses are available through the Forms of Employment and
other ABS Labour Force Surveys.
CO M P A R A B I L I T Y OF T I M E
SE R I E S
30 The data presented in Section One have been confidentialised to ensure no single
individual can be identified. The confidentialising process applied maximises the
availability of data without introducing bias to the estimates.
CO N F I D E N T I A L I T Y
28 CABO utilises a range of classifications which are also used in the FOES. The FOES
uses Australian Standard Classifications where available and appropriate.
29 For example, country of birth data are classified according to the Standard
Australian Classification of Countries (SACC), 2011 (cat. no. 1269.0). Occupation data
are classified according to the ANZSCO – Australian and New Zealand Standard
Classification of Occupations, First Edition, 2006 Revision 1, (cat. no. 1220.0). Industry
data are classified according to the ANZSIC – Australian and New Zealand Standard
Industrial Classification, 2006 (cat. no. 1292.0).
CL A S S I F I C A T I O N S
27 The estimates in Section One of CABO are based on information collected in the
November 2012 FOES, and, due to seasonal factors, may not be representative of other
months of the year.
SE A S O N A L FA C T O R S
24 Estimates in this publication are subject to sampling and non–sampling errors:
25 Sampling error is the difference between the published estimate and the value that
would have been produced if all dwellings had been included in the survey. For more
information refer to the Technical Note.
26 Non–sampling errors are inaccuracies that occur because of imperfections in
reporting by respondents and interviewers and errors made in coding and processing
data. These inaccuracies may occur in any enumeration, whether it be a full count or a
sample. Every effort is made to reduce the non–sampling error to a minimum by careful
design of questionnaires, intensive training and supervision of interviewers and effective
processing procedures.
RE L I A B I L I T Y OF TH E
ES T I M A T E S
21 Users should note the issues associated with sample size which impact on the
estimates in Section One of CABO and sourced from the 2012 FOES.
22 Supplementary surveys (such as the FOES) are not always conducted on the full
LFS sample. Since August 1994 the sample for supplementary surveys has been restricted
to no more than seven–eighths of the LFS sample.
23 The sample for FOES is a subsample of the 36,803 private dwelling households and
special dwelling units included in the LFS in November 2012. The final sample on which
estimates are based is composed of 29,655 persons aged 15 years and over who, in
November 2012, were:
! employed;
! employees;
! independent contractors; and
! other business operators.
SA M P L E S I Z E
19 The FOES has been collected since August 1998, approximately every three years
(1998, 2001 and 2004) and annually from 2006 onwards.
20 Refer to the sections below entitled 'Previous Surveys' and 'Next Surveys' for further
information about previous and future releases and how these will impact on future
releases of CABO.
CO L L E C T I O N FR E Q U E N C Y
30 A B S • CO U N T S OF A U S T R A L I A N B U S I N E S S OP E R A T O R S • 8 1 7 5 . 0 • 2 0 1 1 – 1 2
EX P L A N A T O R Y N O T E S
42 The 2011 Census aims to count every person who spent Census night (9 August
2011) in Australia. This includes people in the six states, the Northern Territory, the
Australian Capital Territory, Jervis Bay Territory, and the external territories of Christmas
Island and Cocos (Keeling) Islands. The other Australian external territories (Norfolk
Island, and minor islands such as Heard and McDonald Islands), are outside the scope of
the Australian Census.
43 People who leave Australia but who are not required to undertake migration
formalities, for example those on oil and gas rigs off the Australian coast, and
expeditioners to the Australian Antarctic Territory are also included in the Census. They
are coded to Off–Shore Statistical Areas Level 1.
44 The only groups of people who spend Census night in Australia but are excluded
from the Census are foreign diplomats and their families, and foreign crew members on
ships who remain on the ship and do not undertake migration formalities.
SC O P E
41 The statistics presented in Section Two of this publication were compiled using
data collected from the 2011 Census. The Census is conducted every five years and
collects a range of demographic, social and economic information from all people and
dwellings (excluding diplomatic personnel and dwellings) in Australia on Census night.
I N T R O D U C T I O N
40 Data Sourced from the 2011 Census of Population and HousingPA R T B :
39 The ABS plans to conduct the FOES again in November 2013.NE X T SU R V E Y S
38 The FOES was first conducted in August 1998 then in November 2001, November
2004 and annually from November 2006. Results of previous surveys on employment
arrangement have been published in: Forms of Employment, Australia (cat. no. 6359.0)
and Employment Arrangements and Superannuation, Australia (cat. no. 6361.0).
PR E V I O U S SU R V E Y S
37 When comparing ABS Labour Force data (including the data presented in CABO)
with Census data, users should be aware of the issue of Census undercount. For further
information, refer to the paper entitled Census of Population and Housing – Details of
Undercount, 2011 (cat. no. 2940.0).
CO M P A R A B I L I T Y W I T H TH E
CE N S U S OF PO P U L A T I O N AN D
HO U S I N G
36 Due to difference in the scope and sample size of the FOES (which impacts on
estimates included in this publication) and that of the LFS, the estimation procedure may
lead to some small variations between estimates provided in Section One of Counts of
Australian Business Operators and those from the LFS.
CO M P A R A B I L I T Y W I T H
MO N T H L Y LA B O U R FO R C E
ST A T I S T I C S
32 The degree of comparability between data presented in Section One of CABO and
the 2012 FOES is high. Refer to the section of the Explanatory Notes entitled 'Scope' for
further information. As such, users may refer to the 2012 FOES for additional information
regarding the independent contractors and other business operators of Australian
businesses.
33 Whilst FOES data are considered a suitable source from which to derive counts of
Australian business operators, it should be noted that the FOES forms part of the suite of
ABS' Monthly Labour Force Supplementary (sample) Surveys, and as such, is subject to
sampling and non–sampling error.
34 It is also important to note that the main function of ABS' LFS (including the FOES)
is not to collect information on business operators, but is instead focussed on
developing high quality estimates of employment and unemployment.
35 Given these conceptual and methodological limitations of FOES data, care has been
taken to present the data at relatively broad levels so as to minimise the potential impact
of the conceptual and methodological influences described above.
CO M P A R A B I L I T Y OF T I M E
SE R I E S continued
A B S • CO U N T S OF A U S T R A L I A N B U S I N E S S OP E R A T O R S • 8 1 7 5 . 0 • 2 0 1 1 – 1 2 31
EX P L A N A T O R Y N O T E S

45 The Census also includes people on vessels in or between Australian ports and
people on board long distance trains, buses or aircraft. People entering Australia before
midnight on Census night are counted, while people leaving an Australian port for an
overseas destination before midnight on Census night are not. Visitors to Australia are
included regardless of how long they have been in the country or how long they plan to
stay. However, for people who will be in Australia less than one year, only basic
demographic data are available.
46 Detainees under the jurisdiction of the Department of Immigration and Citizenship,
in detention centres in Australia, people in police lock–ups or prisons, are in the scope
of the Census. For the 2011 Census, details will be sourced from administrative data, so
only basic demographic statistics such as age, sex and marital status may be available.
47 All private dwellings, except diplomatic dwellings, are included in the Census,
whether occupied or unoccupied. Caravans in caravan parks and manufactured homes in
manufactured home estates, are counted only if occupied. For the 2006 and 2011
Censuses, unoccupied residences in retirement villages (self–contained) are included.
Occupied non–private dwellings, such as hospitals, prisons, hotels, etc. are also included.
48 The business operator population is a subset of this population. Specifically, the
business operator population comprises all owner managers of incorporated and
unincorporated businesses. It excludes persons who are classified to other types of
employment status categories [e.g. employees who do not own businesses (excluding
owner managers of incorporated enterprises), contributing family workers, persons not
in the labour force, and the unemployed].
49 Non–business operators comprise employees who do not own businesses and
contributing family workers. It excludes business operators as well as persons who were
not in the labour force or who were unemployed.
50 In order to produce data on the respective business operator and non–business
operator populations, the Census Form was structured such that persons aged fifteen
years or more were asked if they had a full or part–time job at any time in the week
leading up to the Census. Those persons indicating they did, were then asked if they
worked for an employer or in their own business in the 'main job held last week' (i.e. the
job where the person usually works the most hours).
51 Persons indicating they worked in their own business were then asked if the
business was incorporated or unincorporated. These people were also asked whether
the business employed people. Responses were classified according to how many people
were employed by the business. It is this question about employee numbers which
allows ABS to produce data about small business operators.
52 Persons aged fifteen years or more were also asked a series of other questions
pertaining to their individual characteristics, such as their occupation, industry, income,
place of usual residence and Indigenous status on the Census Form. This allows ABS to
match individual business operator and non–business operator records so that data
across a wide range of these characteristics can be included in Counts of Australian
Business Operators.
53 Persons who provided insufficient information on Employment Type of Person
(EMTP) on their Census Form, were excluded from the business operator population.
Where EMTP was stated (business operator or non–business operator) but the variable
of interest (for example, income) was not stated, the person was included and left as not
stated. Analysis revealed that this adjustment caused minimal change to the proportions
being derived from the Census.
SC O P E continued
32 A B S • CO U N T S OF A U S T R A L I A N B U S I N E S S OP E R A T O R S • 8 1 7 5 . 0 • 2 0 1 1 – 1 2
EX P L A N A T O R Y N O T E S
65 This is the second release of CABO. As such, time–series analysis is not possible and
users should exercise caution when making comparisons with previous ABS business
operators data.
66 Data are however available for a wide range of topics from current and previous
Census, much of which may be accessed directly from the ABS website
<www.abs.gov.au>. Users are advised to investigate the comparability of data items over
time. A useful resource for these purposes is the Census Dictionary (cat. no. 2901.0).
CO M P A R A B I L I T Y OF T I M E
SE R I E S
64 The data presented in CABO have been confidentialised to ensure no single
individual can be identified. The confidentialising process applied is expected to
maximise the availability of data without introducing any bias to the estimates.
CO N F I D E N T I A L I T Y
59 The Australian Census is self–enumerated. This means that householders are
required to complete the Census form themselves, rather than having the help of a
Census Collector. The Census form may be completed by one household member on
behalf of others. Error can be introduced if the respondent does not understand the
question, or does not know the correct information about other household members.
Self–enumeration carries the risk that wrong answers could be given, either intentionally
or unintentionally.
60 The data presented in this publication may be subject to non–sampling error.
61 These data are not subject to sampling error as the data represents a complete
enumeration of those persons who identified themselves as a business operator.
However, users should be aware of the issue of undercount which impacts on Census
(estimated at approximately 1.7%).
62 It should be noted that the issue of undercount in the 2011 Census is not an issue
particular to the production of business operator counts. It is an issue which relates to
Census data per se, and can be associated with the scope, coverage, timing,
measurement of underlying concepts and methodologies used in the 2011 Census. The
ABS has published an article which examines these issues in more detail.
63 For further information, refer to the paper entitled Census of Population and
Housing – Undercount, 2011 (cat. no. 2940.0).
RE L I A B I L I T Y OF TH E
ES T I M A T E S
57 The Census is collected every five years.
58 Refer to the sections below entitled 'Previous Census' and 'Next Census' for further
information about previous and future releases and how these will impact on future
releases of Counts of Australian Business Operators.
CO L L E C T I O N FR E Q U E N C Y
56 The Census was conducted on the night of 9 August, 2011.RE F E R E N C E PE R I O D
54 CABO utilises a range of classifications which are also used in the Census.
Specifically, Australian Standard Classifications are used where available and appropriate.
Examples of these are the Australian Standard Classification of Occupations (ASCO) and
the Standard Australian Classification of Countries (SACC). These classifications are used
as the basis on which to build Census–specific classifications such as Birthplace of
Individual (which uses SACC).
55 Classifications such as these are reviewed on an irregular basis to reflect changes in
the Australian social environment. Where an Australian Standard Classification is not
available, classifications specific to Census variables have been developed.
CL A S S I F I C A T I O N S
A B S • CO U N T S OF A U S T R A L I A N B U S I N E S S OP E R A T O R S • 8 1 7 5 . 0 • 2 0 1 1 – 1 2 33
EX P L A N A T O R Y N O T E S
72 The ABS will assess the user demand of this publication prior to forming a decision
on future releases.
FU T U R E RE L E A S E S
71 The next Census of Population and Housing will be conducted in 2016.NE X T CE N S U S
70 Information regarding previous Census may be accessed through the ABS website
<www.abs.gov.au>.
PR E V I O U S CE N S U S
69 Where figures have been rounded discrepancies may occur between the sum of
component items and the total.
RO U N D I N G
67 The data presented in Section Two of this publication have been confronted with
data from a range of LFS. In most cases, the proportions presented in this publication are
broadly comparable with data derived from these surveys. However, users are advised to
exercise caution when making data comparisons, and in particular, should consider the
scope of each survey before making any comparisons.
68 Users are also reminded of the issue of undercount which impacts on Census
estimates. For further information, refer to the paper entitled Census of Population and
Housing – Details of Undercount, 2011 (cat. no. 2940.0).
CO M P A R A B I L I T Y W I T H
MO N T H L Y LA B O U R FO R C E
ST A T I S T I C S
standard errorSE
Standard Australian Classification of CountriesSACC
relative standard errorRSE
owner manager of unincorporated enterpriseOMUE
owner manager of incorporated enterpriseOMIE
numberno.
millionm
Labour Force Survey (Australia)LFS
Forms of Employment SurveyFOES
Counts of Australian Business OperatorsCABO
Catalogue numbercat. no.
Australian Standard Classification of OccupationsASCO
Australian and New Zealand Standard Industrial ClassificationANZSIC
Australian and New Zealand Standard Classification of OccupationsANZSCO
Australian Bureau of StatisticsABS
percentage%
thousand'000AB B R E V I A T I O N S
34 A B S • CO U N T S OF A U S T R A L I A N B U S I N E S S OP E R A T O R S • 8 1 7 5 . 0 • 2 0 1 1 – 1 2
EX P L A N A T O R Y N O T E S
APP E N D I X 1 TH E FO R M S OF EM P L O Y M E N T SU R V E Y AN DCE N S U S CO N C E P T U A L FR A M E W O R K S . . . . . . . . . . . . . .
The conceptual framework used in Australia's Labour Force Statistics (LFS) aligns closely
with the standards and guidelines set out in Resolutions of the International Conference
of Labour Statisticians. Descriptions of the underlying concepts and structure of
Australia's labour force statistics, and the sources and methods used in compiling these
estimates, are presented in Labour Statistics: Concepts, Sources and Methods (cat. no.
6102.0.55.001) which is available on the ABS website <http://www.abs.gov.au>
(Methods, Classifications, Concepts and Standards).
In addition to the LFS conceptual framework outlined above, the Forms of Employment
Survey (FOES) uses an employment type conceptual framework, which classifies
jobholders to an employment type category on the basis of their main job, that is, the job
in which the most hours are usually worked. This framework allows data presented in
Counts of Australian Business Operators (CABO) to be split between business operators
and non–business operators.
This conceptual framework classifies jobholders to a 'Form of employment' on the basis
of their main job, that is, the job in which they usually worked the most hours. The form
of employment category groups are:
! Employees;
! Independent contractors; and
! Other business operators.
Employees are then further classified according to whether they had paid leave
entitlements, that is, whether they had paid sick and/or paid holiday leave.
TH E FO R M S OF EM P L O Y M E N T
SU R V E Y AN D CE N S U S
CO N C E P T U A L FR A M E W O R K S
A B S • CO U N T S OF A U S T R A L I A N B U S I N E S S OP E R A T O R S • 8 1 7 5 . 0 • 2 0 1 1 – 1 2 35
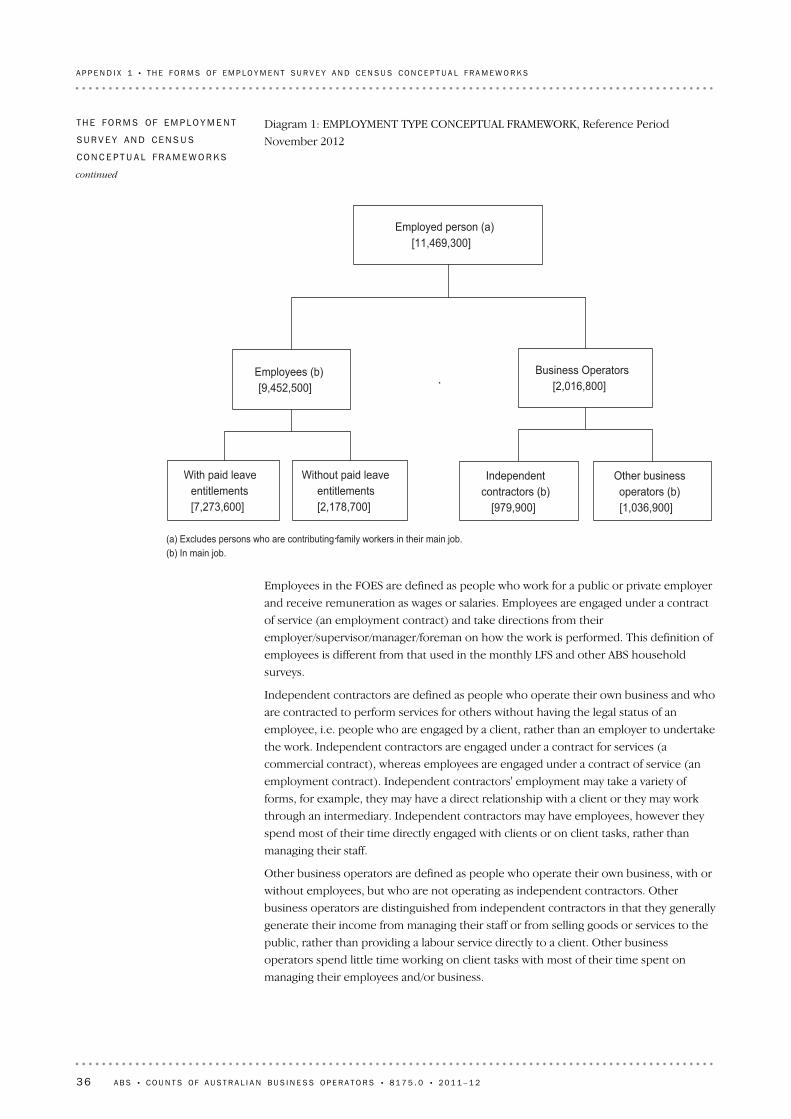
Employees in the FOES are defined as people who work for a public or private employer
and receive remuneration as wages or salaries. Employees are engaged under a contract
of service (an employment contract) and take directions from their
employer/supervisor/manager/foreman on how the work is performed. This definition of
employees is different from that used in the monthly LFS and other ABS household
surveys.
Independent contractors are defined as people who operate their own business and who
are contracted to perform services for others without having the legal status of an
employee, i.e. people who are engaged by a client, rather than an employer to undertake
the work. Independent contractors are engaged under a contract for services (a
commercial contract), whereas employees are engaged under a contract of service (an
employment contract). Independent contractors' employment may take a variety of
forms, for example, they may have a direct relationship with a client or they may work
through an intermediary. Independent contractors may have employees, however they
spend most of their time directly engaged with clients or on client tasks, rather than
managing their staff.
Other business operators are defined as people who operate their own business, with or
without employees, but who are not operating as independent contractors. Other
business operators are distinguished from independent contractors in that they generally
generate their income from managing their staff or from selling goods or services to the
public, rather than providing a labour service directly to a client. Other business
operators spend little time working on client tasks with most of their time spent on
managing their employees and/or business.
Employed person (a)[11,469,300]
Employees (b)[9,452,500]
With paid leaveentitlements[7,273,600]
Without paid leaveentitlements[2,178,700]
Independentcontractors (b)
[979,900]
Other businessoperators (b)[1,036,900]
(a) Excludes persons who are contributing family workers in their main job.(b) In main job.
Business Operators[2,016,800]
Diagram 1: EMPLOYMENT TYPE CONCEPTUAL FRAMEWORK, Reference Period
November 2012
TH E FO R M S OF EM P L O Y M E N T
SU R V E Y AN D CE N S U S
CO N C E P T U A L FR A M E W O R K S
continued
36 A B S • CO U N T S OF A U S T R A L I A N B U S I N E S S OP E R A T O R S • 8 1 7 5 . 0 • 2 0 1 1 – 1 2
A P P E N D I X 1 • T H E FO R M S OF EM P L O Y M E N T SU R V E Y A N D CE N S U S CO N C E P T U A L FR A M E W O R K S
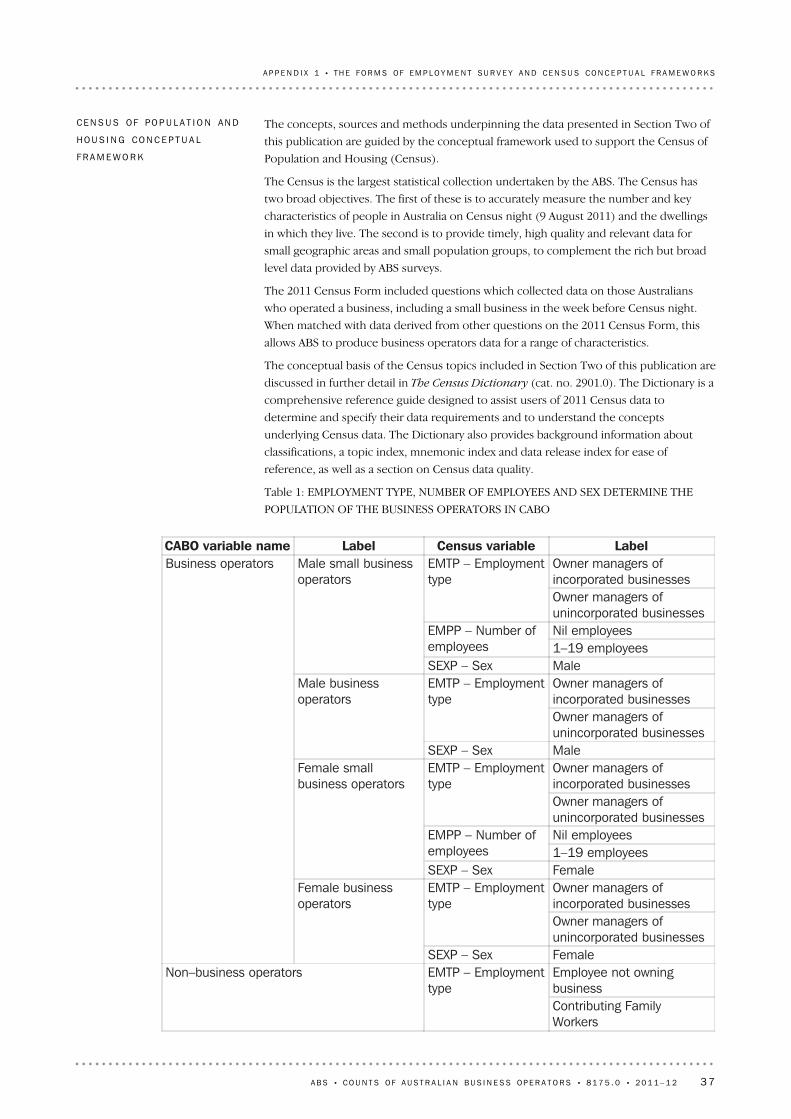
CABO variable name Label Census variable Label Owner managers of incorporated businesses
EMTP – Employment type
Owner managers of unincorporated businesses Nil employees EMPP – Number of
employees 1–19 employees
Male small business operators
SEXP – Sex Male Owner managers of incorporated businesses
EMTP – Employment type
Owner managers of unincorporated businesses
Male business operators
SEXP – Sex Male Owner managers of incorporated businesses
EMTP – Employment type
Owner managers of unincorporated businesses Nil employees EMPP – Number of
employees 1–19 employees
Female small business operators
SEXP – Sex Female Owner managers of incorporated businesses
EMTP – Employment type
Owner managers of unincorporated businesses
Business operators
Female business operators
SEXP – Sex Female Employee not owning business
Non–business operators EMTP – Employment type
Contributing Family Workers
The concepts, sources and methods underpinning the data presented in Section Two of
this publication are guided by the conceptual framework used to support the Census of
Population and Housing (Census).
The Census is the largest statistical collection undertaken by the ABS. The Census has
two broad objectives. The first of these is to accurately measure the number and key
characteristics of people in Australia on Census night (9 August 2011) and the dwellings
in which they live. The second is to provide timely, high quality and relevant data for
small geographic areas and small population groups, to complement the rich but broad
level data provided by ABS surveys.
The 2011 Census Form included questions which collected data on those Australians
who operated a business, including a small business in the week before Census night.
When matched with data derived from other questions on the 2011 Census Form, this
allows ABS to produce business operators data for a range of characteristics.
The conceptual basis of the Census topics included in Section Two of this publication are
discussed in further detail in The Census Dictionary (cat. no. 2901.0). The Dictionary is a
comprehensive reference guide designed to assist users of 2011 Census data to
determine and specify their data requirements and to understand the concepts
underlying Census data. The Dictionary also provides background information about
classifications, a topic index, mnemonic index and data release index for ease of
reference, as well as a section on Census data quality.
Table 1: EMPLOYMENT TYPE, NUMBER OF EMPLOYEES AND SEX DETERMINE THE
POPULATION OF THE BUSINESS OPERATORS IN CABO
CE N S U S OF PO P U L A T I O N AN D
HO U S I N G CO N C E P T U A L
FR A M E W O R K
A B S • CO U N T S OF A U S T R A L I A N B U S I N E S S OP E R A T O R S • 8 1 7 5 . 0 • 2 0 1 1 – 1 2 37
A P P E N D I X 1 • T H E FO R M S OF EM P L O Y M E N T SU R V E Y A N D CE N S U S CO N C E P T U A L FR A M E W O R K S

APP E N D I X 2 AB S BU S I N E S S OP E R A T O R S CO U N T S . . . . . . . . . . . . . .
The ABS has maintained an integrated business register (ABSBR) since the development
phase of the first Integrated Economic Censuses conducted in respect of 1968–69.
From the amendment of the Income Tax Assessment Act in 1986 until 2002, this was
primarily sourced from Group Employer (GE) registrations with the Australian Taxation
Office (ATO). When a business commenced employing staff, a GE registration was
required to enable the business to deduct income tax from its employees.
No comprehensive register of 'Non–employing' businesses was maintained by any
government organisation and the ABS did not seek to create such a register. As such, any
business counts produced from the ABSBR prior to 2002 included 'Employing' businesses
only.
D I S C O N T I N U E D AB S
BU S I N E S S CO U N T S
Counts from the ABS Business
Register (Prior to 2002)
The business operator data presented in this release have been derived from two data
sources: the 2012 Forms of Employment Survey and the 2011 Census of Population and
Housing (Census).
These data are relevant for users interested in understanding the characteristics of those
persons engaged in one or more businesses currently operating within the Australian
economy.
The 2012 Forms of Employment Survey was used to derive counts (as well as
proportions) of business operators in Australia, while the 2011 Census has been used as
a data source to produce a range of proportions relating to Australian business operators
(including small business operators).
The decision to use Forms of Employment Survey data to produce count data was taken
following detailed analysis which confirmed that the overall counts derived from the
Forms of Employment Survey provided for a more reliable and accurate series of
estimates compared with data derived from other sources (including from other Monthly
Labour Force Supplementary Surveys and the 2011 Census). Specifically, data
confrontation exercises confirmed Forms of Employment Survey data compared well
with data derived from a range of administrative and survey sources.
This approach is expected to provide a more stable platform upon which users will be
able to access data pertaining to the changing demographics of Australia's business
operators over time.
CO U N T S FR O M TH I S RE L E A S E
The following Appendix provides a brief history of ABS business operator counts and
discusses planned future developments.
The ABS has been producing business operator counts for many years. These counts
have been presented in the form of business demography products, most recently,
through this publication, Counts of Australian Business Operators (CABO).
In addition, ABS has been producing data pertaining to owner managers of incorporated
and unincorporated enterprises (each being a subset of the Australian business operator
population) across a range of other statistical products.
Over time, ABS has been working to improve the quality of business operator counts and
has been developing new sources of business operator data.
I N T R O D U C T I O N
38 A B S • CO U N T S OF A U S T R A L I A N B U S I N E S S OP E R A T O R S • 8 1 7 5 . 0 • 2 0 1 1 – 1 2
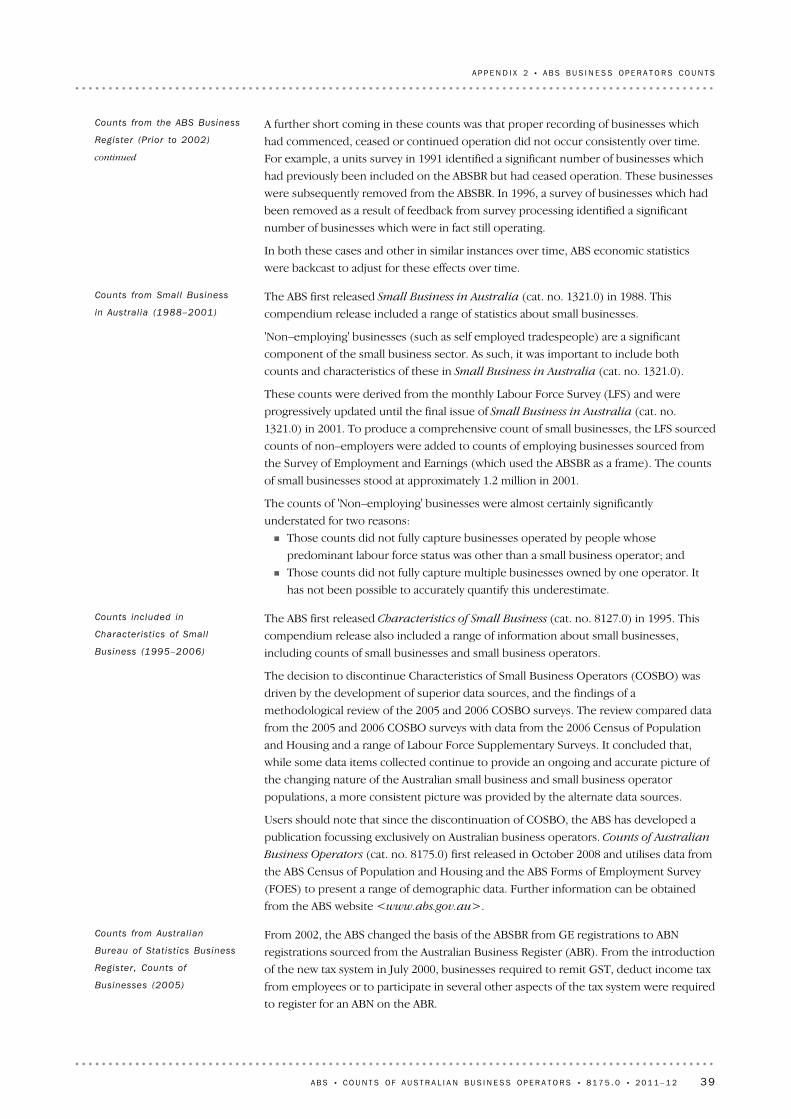
From 2002, the ABS changed the basis of the ABSBR from GE registrations to ABN
registrations sourced from the Australian Business Register (ABR). From the introduction
of the new tax system in July 2000, businesses required to remit GST, deduct income tax
from employees or to participate in several other aspects of the tax system were required
to register for an ABN on the ABR.
Counts from Austral ian
Bureau of Stat ist ics Business
Register, Counts of
Businesses (2005)
The ABS first released Characteristics of Small Business (cat. no. 8127.0) in 1995. This
compendium release also included a range of information about small businesses,
including counts of small businesses and small business operators.
The decision to discontinue Characteristics of Small Business Operators (COSBO) was
driven by the development of superior data sources, and the findings of a
methodological review of the 2005 and 2006 COSBO surveys. The review compared data
from the 2005 and 2006 COSBO surveys with data from the 2006 Census of Population
and Housing and a range of Labour Force Supplementary Surveys. It concluded that,
while some data items collected continue to provide an ongoing and accurate picture of
the changing nature of the Australian small business and small business operator
populations, a more consistent picture was provided by the alternate data sources.
Users should note that since the discontinuation of COSBO, the ABS has developed a
publication focussing exclusively on Australian business operators. Counts of Australian
Business Operators (cat. no. 8175.0) first released in October 2008 and utilises data from
the ABS Census of Population and Housing and the ABS Forms of Employment Survey
(FOES) to present a range of demographic data. Further information can be obtained
from the ABS website <www.abs.gov.au>.
Counts included in
Character ist ics of Smal l
Business (1995–2006)
The ABS first released Small Business in Australia (cat. no. 1321.0) in 1988. This
compendium release included a range of statistics about small businesses.
'Non–employing' businesses (such as self employed tradespeople) are a significant
component of the small business sector. As such, it was important to include both
counts and characteristics of these in Small Business in Australia (cat. no. 1321.0).
These counts were derived from the monthly Labour Force Survey (LFS) and were
progressively updated until the final issue of Small Business in Australia (cat. no.
1321.0) in 2001. To produce a comprehensive count of small businesses, the LFS sourced
counts of non–employers were added to counts of employing businesses sourced from
the Survey of Employment and Earnings (which used the ABSBR as a frame). The counts
of small businesses stood at approximately 1.2 million in 2001.
The counts of 'Non–employing' businesses were almost certainly significantly
understated for two reasons:
! Those counts did not fully capture businesses operated by people whose
predominant labour force status was other than a small business operator; and
! Those counts did not fully capture multiple businesses owned by one operator. It
has not been possible to accurately quantify this underestimate.
Counts from Smal l Business
in Austral ia (1988–2001)
A further short coming in these counts was that proper recording of businesses which
had commenced, ceased or continued operation did not occur consistently over time.
For example, a units survey in 1991 identified a significant number of businesses which
had previously been included on the ABSBR but had ceased operation. These businesses
were subsequently removed from the ABSBR. In 1996, a survey of businesses which had
been removed as a result of feedback from survey processing identified a significant
number of businesses which were in fact still operating.
In both these cases and other in similar instances over time, ABS economic statistics
were backcast to adjust for these effects over time.
Counts from the ABS Business
Register (Prior to 2002)
continued
A B S • CO U N T S OF A U S T R A L I A N B U S I N E S S OP E R A T O R S • 8 1 7 5 . 0 • 2 0 1 1 – 1 2 39
A P P E N D I X 2 • A B S B U S I N E S S OP E R A T O R S C O U N T S
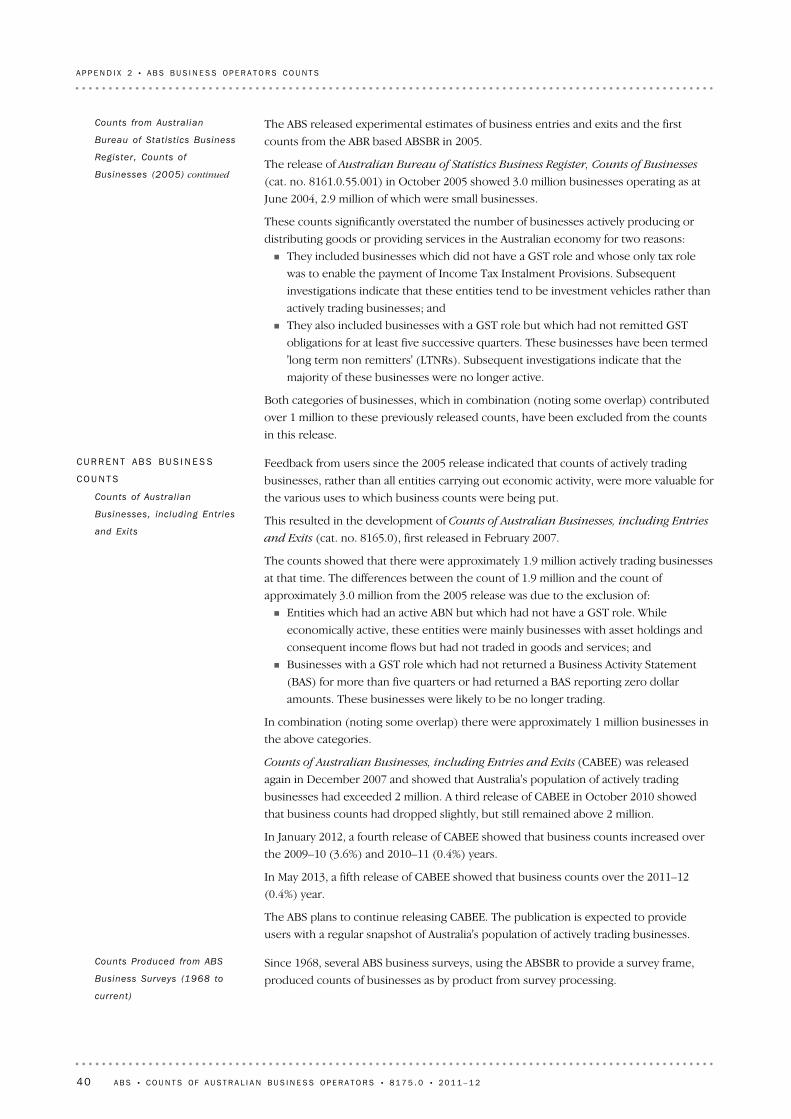
Since 1968, several ABS business surveys, using the ABSBR to provide a survey frame,
produced counts of businesses as by product from survey processing.
Counts Produced from ABS
Business Surveys (1968 to
current)
Feedback from users since the 2005 release indicated that counts of actively trading
businesses, rather than all entities carrying out economic activity, were more valuable for
the various uses to which business counts were being put.
This resulted in the development of Counts of Australian Businesses, including Entries
and Exits (cat. no. 8165.0), first released in February 2007.
The counts showed that there were approximately 1.9 million actively trading businesses
at that time. The differences between the count of 1.9 million and the count of
approximately 3.0 million from the 2005 release was due to the exclusion of:
! Entities which had an active ABN but which had not have a GST role. While
economically active, these entities were mainly businesses with asset holdings and
consequent income flows but had not traded in goods and services; and
! Businesses with a GST role which had not returned a Business Activity Statement
(BAS) for more than five quarters or had returned a BAS reporting zero dollar
amounts. These businesses were likely to be no longer trading.
In combination (noting some overlap) there were approximately 1 million businesses in
the above categories.
Counts of Australian Businesses, including Entries and Exits (CABEE) was released
again in December 2007 and showed that Australia's population of actively trading
businesses had exceeded 2 million. A third release of CABEE in October 2010 showed
that business counts had dropped slightly, but still remained above 2 million.
In January 2012, a fourth release of CABEE showed that business counts increased over
the 2009–10 (3.6%) and 2010–11 (0.4%) years.
In May 2013, a fifth release of CABEE showed that business counts over the 2011–12
(0.4%) year.
The ABS plans to continue releasing CABEE. The publication is expected to provide
users with a regular snapshot of Australia's population of actively trading businesses.
CU R R E N T AB S BU S I N E S S
CO U N T S
Counts of Austral ian
Businesses, including Entr ies
and Exits
The ABS released experimental estimates of business entries and exits and the first
counts from the ABR based ABSBR in 2005.
The release of Australian Bureau of Statistics Business Register, Counts of Businesses
(cat. no. 8161.0.55.001) in October 2005 showed 3.0 million businesses operating as at
June 2004, 2.9 million of which were small businesses.
These counts significantly overstated the number of businesses actively producing or
distributing goods or providing services in the Australian economy for two reasons:
! They included businesses which did not have a GST role and whose only tax role
was to enable the payment of Income Tax Instalment Provisions. Subsequent
investigations indicate that these entities tend to be investment vehicles rather than
actively trading businesses; and
! They also included businesses with a GST role but which had not remitted GST
obligations for at least five successive quarters. These businesses have been termed
'long term non remitters' (LTNRs). Subsequent investigations indicate that the
majority of these businesses were no longer active.
Both categories of businesses, which in combination (noting some overlap) contributed
over 1 million to these previously released counts, have been excluded from the counts
in this release.
Counts from Austral ian
Bureau of Stat ist ics Business
Register, Counts of
Businesses (2005) continued
40 A B S • CO U N T S OF A U S T R A L I A N B U S I N E S S OP E R A T O R S • 8 1 7 5 . 0 • 2 0 1 1 – 1 2
A P P E N D I X 2 • A B S B U S I N E S S OP E R A T O R S C O U N T S
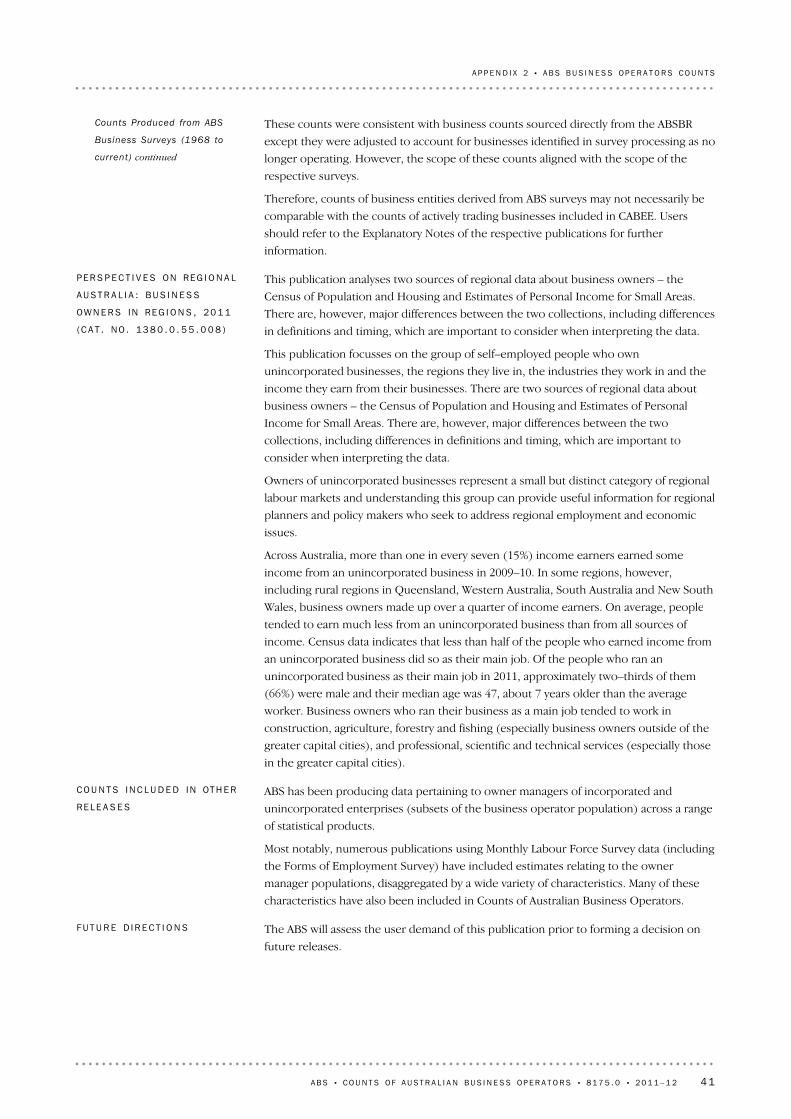
The ABS will assess the user demand of this publication prior to forming a decision on
future releases.
FU T U R E D I R E C T I O N S
ABS has been producing data pertaining to owner managers of incorporated and
unincorporated enterprises (subsets of the business operator population) across a range
of statistical products.
Most notably, numerous publications using Monthly Labour Force Survey data (including
the Forms of Employment Survey) have included estimates relating to the owner
manager populations, disaggregated by a wide variety of characteristics. Many of these
characteristics have also been included in Counts of Australian Business Operators.
CO U N T S IN C L U D E D IN OT H E R
RE L E A S E S
This publication analyses two sources of regional data about business owners – the
Census of Population and Housing and Estimates of Personal Income for Small Areas.
There are, however, major differences between the two collections, including differences
in definitions and timing, which are important to consider when interpreting the data.
This publication focusses on the group of self–employed people who own
unincorporated businesses, the regions they live in, the industries they work in and the
income they earn from their businesses. There are two sources of regional data about
business owners – the Census of Population and Housing and Estimates of Personal
Income for Small Areas. There are, however, major differences between the two
collections, including differences in definitions and timing, which are important to
consider when interpreting the data.
Owners of unincorporated businesses represent a small but distinct category of regional
labour markets and understanding this group can provide useful information for regional
planners and policy makers who seek to address regional employment and economic
issues.
Across Australia, more than one in every seven (15%) income earners earned some
income from an unincorporated business in 2009–10. In some regions, however,
including rural regions in Queensland, Western Australia, South Australia and New South
Wales, business owners made up over a quarter of income earners. On average, people
tended to earn much less from an unincorporated business than from all sources of
income. Census data indicates that less than half of the people who earned income from
an unincorporated business did so as their main job. Of the people who ran an
unincorporated business as their main job in 2011, approximately two–thirds of them
(66%) were male and their median age was 47, about 7 years older than the average
worker. Business owners who ran their business as a main job tended to work in
construction, agriculture, forestry and fishing (especially business owners outside of the
greater capital cities), and professional, scientific and technical services (especially those
in the greater capital cities).
PE R S P E C T I V E S ON RE G I O N A L
AU S T R A L I A : BU S I N E S S
OW N E R S IN RE G I O N S , 20 1 1
(C A T . NO . 13 8 0 . 0 . 5 5 . 0 0 8 )
These counts were consistent with business counts sourced directly from the ABSBR
except they were adjusted to account for businesses identified in survey processing as no
longer operating. However, the scope of these counts aligned with the scope of the
respective surveys.
Therefore, counts of business entities derived from ABS surveys may not necessarily be
comparable with the counts of actively trading businesses included in CABEE. Users
should refer to the Explanatory Notes of the respective publications for further
information.
Counts Produced from ABS
Business Surveys (1968 to
current) continued
A B S • CO U N T S OF A U S T R A L I A N B U S I N E S S OP E R A T O R S • 8 1 7 5 . 0 • 2 0 1 1 – 1 2 41
A P P E N D I X 2 • A B S B U S I N E S S OP E R A T O R S C O U N T S
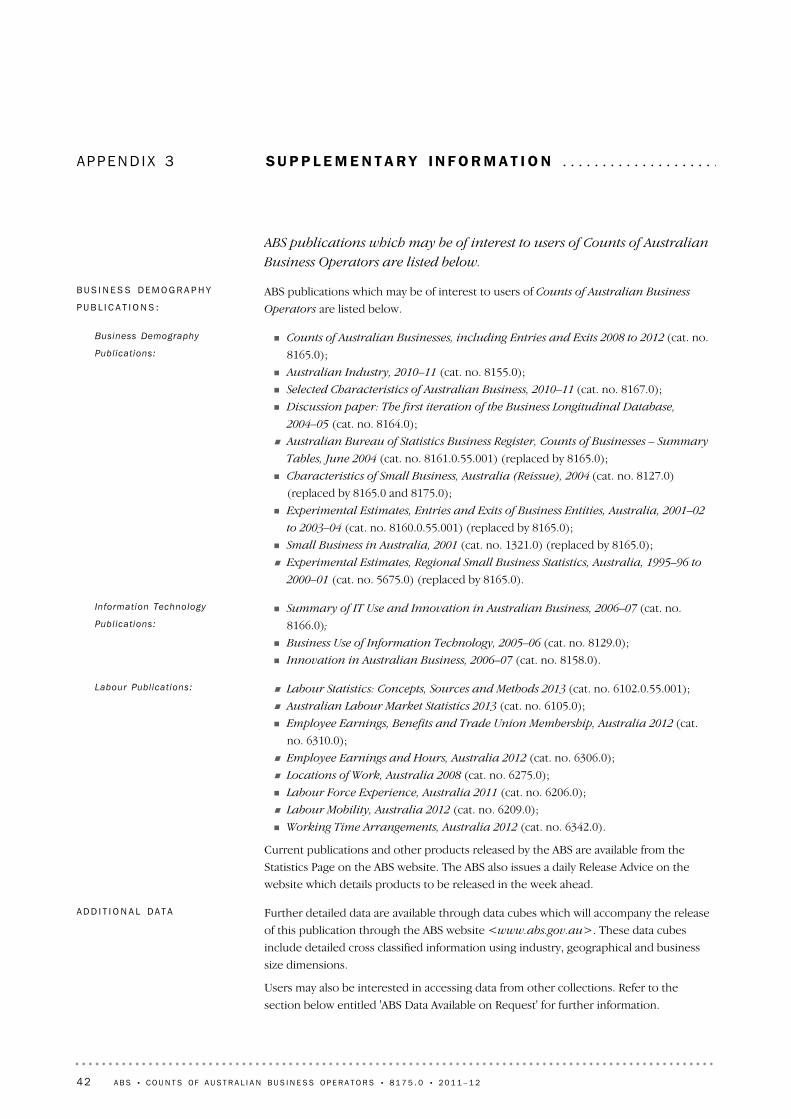
APP E N D I X 3 SU P P L E M E N T A R Y IN F O R M A T I O N . . . . . . . . . . . . . . . . . . . .
Further detailed data are available through data cubes which will accompany the release
of this publication through the ABS website <www.abs.gov.au>. These data cubes
include detailed cross classified information using industry, geographical and business
size dimensions.
Users may also be interested in accessing data from other collections. Refer to the
section below entitled 'ABS Data Available on Request' for further information.
AD D I T I O N A L DA T A
! Labour Statistics: Concepts, Sources and Methods 2013 (cat. no. 6102.0.55.001);
! Australian Labour Market Statistics 2013 (cat. no. 6105.0);
! Employee Earnings, Benefits and Trade Union Membership, Australia 2012 (cat.
no. 6310.0);
! Employee Earnings and Hours, Australia 2012 (cat. no. 6306.0);
! Locations of Work, Australia 2008 (cat. no. 6275.0);
! Labour Force Experience, Australia 2011 (cat. no. 6206.0);
! Labour Mobility, Australia 2012 (cat. no. 6209.0);
! Working Time Arrangements, Australia 2012 (cat. no. 6342.0).
Current publications and other products released by the ABS are available from the
Statistics Page on the ABS website. The ABS also issues a daily Release Advice on the
website which details products to be released in the week ahead.
Labour Publ icat ions:
! Summary of IT Use and Innovation in Australian Business, 2006–07 (cat. no.
8166.0);
! Business Use of Information Technology, 2005–06 (cat. no. 8129.0);
! Innovation in Australian Business, 2006–07 (cat. no. 8158.0).
Information Technology
Publ icat ions:
! Counts of Australian Businesses, including Entries and Exits 2008 to 2012 (cat. no.
8165.0);
! Australian Industry, 2010–11 (cat. no. 8155.0);
! Selected Characteristics of Australian Business, 2010–11 (cat. no. 8167.0);
! Discussion paper: The first iteration of the Business Longitudinal Database,
2004–05 (cat. no. 8164.0);
! Australian Bureau of Statistics Business Register, Counts of Businesses – Summary
Tables, June 2004 (cat. no. 8161.0.55.001) (replaced by 8165.0);
! Characteristics of Small Business, Australia (Reissue), 2004 (cat. no. 8127.0)
(replaced by 8165.0 and 8175.0);
! Experimental Estimates, Entries and Exits of Business Entities, Australia, 2001–02
to 2003–04 (cat. no. 8160.0.55.001) (replaced by 8165.0);
! Small Business in Australia, 2001 (cat. no. 1321.0) (replaced by 8165.0);
! Experimental Estimates, Regional Small Business Statistics, Australia, 1995–96 to
2000–01 (cat. no. 5675.0) (replaced by 8165.0).
Business Demography
Publ icat ions:
ABS publications which may be of interest to users of Counts of Australian Business
Operators are listed below.
BU S I N E S S DE M O G R A P H Y
PU B L I C A T I O N S :
ABS publications which may be of interest to users of Counts of AustralianBusiness Operators are listed below.
42 A B S • CO U N T S OF A U S T R A L I A N B U S I N E S S OP E R A T O R S • 8 1 7 5 . 0 • 2 0 1 1 – 1 2

ABS publications draw extensively on information provided freely by individuals,
businesses, governments and other organisations. Their continued cooperation is very
much appreciated: without it, the wide range of statistics published by the ABS would
not be available. Information received by the ABS is treated in strict confidence as
required by the Census and Statistics Act 1905.
AC K N O W L E D G E M E N T
As well as the statistics included in this and related publications, the ABS may have other
relevant data available on request and for a charge. Inquiries should be made to the ABS
National Information and Referral Service on 1300 135 070. Information is also available
online via a selection of economic–specific theme pages. To access these theme pages,
go to the ABS website home page <www.abs.gov.au>, open the Economy link shown
under 'Key Products' (located in the left side navigator), then select one of the links
shown under 'Business Demography'.
The ABS has a range of data available on request from the Forms of Employment Survey.
The latest release of the survey includes a section which lists the data items and
populations which relate to the survey. More detailed breakdowns of some data items
may also be available on request.
For more information about Forms of Employment Survey data available on request,
contact Labour Supplementary Survey Section on Canberra (02) 6252 7206, email
AB S DA T A AV A I L A B L E ON
RE Q U E S T
A B S • CO U N T S OF A U S T R A L I A N B U S I N E S S OP E R A T O R S • 8 1 7 5 . 0 • 2 0 1 1 – 1 2 43
A P P E N D I X 3 • SU P P L E M E N T A R Y I N F O R M A T I O N
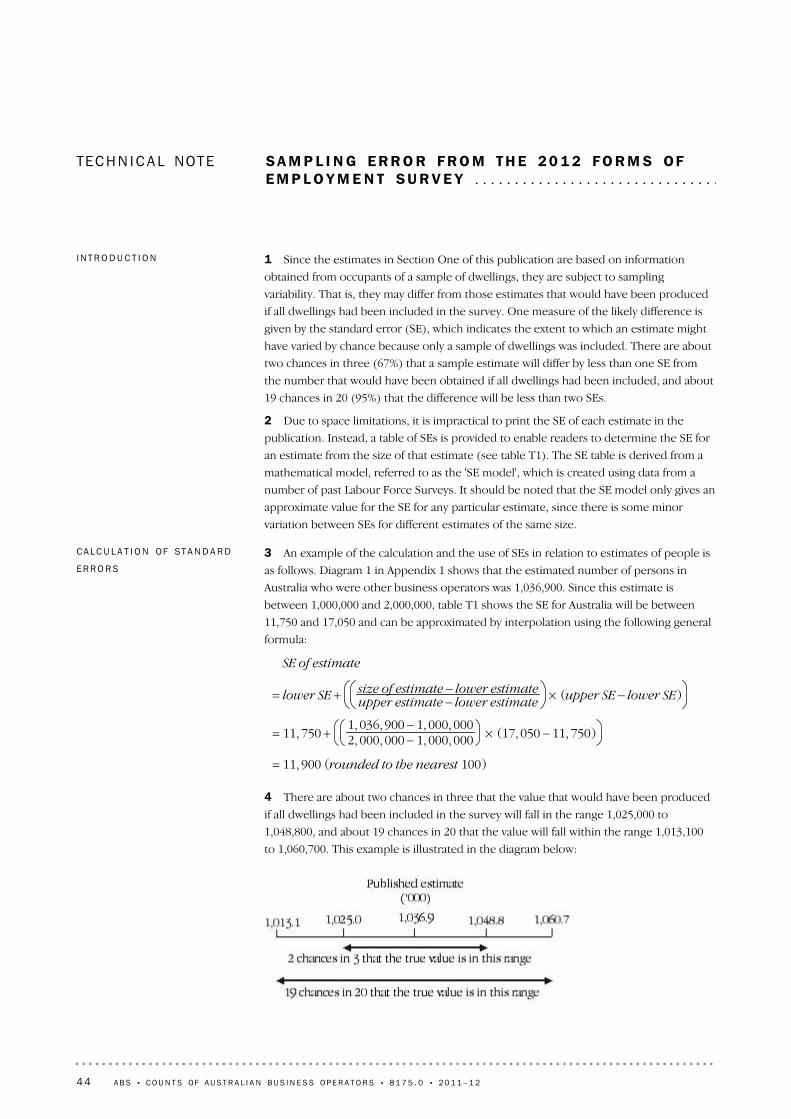
TECH N I C A L NOTE SA M P L I N G ER R O R FR O M TH E 20 1 2 FO R M S OFEM P L O Y M E N T SU R V E Y . . . . . . . . . . . . . . . . . . . . . . . . . . . . . . .
4 There are about two chances in three that the value that would have been produced
if all dwellings had been included in the survey will fall in the range 1,025,000 to
1,048,800, and about 19 chances in 20 that the value will fall within the range 1,013,100
to 1,060,700. This example is illustrated in the diagram below:
SE of estimate
= lower SE + size of estimate − lower estimateupper estimate − lower estimate %
(upper SE − lower SE)
= 11, 750 +1, 036, 900 − 1, 000, 0002, 000, 000 − 1, 000, 000 % (17, 050 − 11, 750)
= 11, 900 (rounded to the nearest 100)
3 An example of the calculation and the use of SEs in relation to estimates of people is
as follows. Diagram 1 in Appendix 1 shows that the estimated number of persons in
Australia who were other business operators was 1,036,900. Since this estimate is
between 1,000,000 and 2,000,000, table T1 shows the SE for Australia will be between
11,750 and 17,050 and can be approximated by interpolation using the following general
formula:
CA L C U L A T I O N OF S T A N D A R D
ER R O R S
1 Since the estimates in Section One of this publication are based on information
obtained from occupants of a sample of dwellings, they are subject to sampling
variability. That is, they may differ from those estimates that would have been produced
if all dwellings had been included in the survey. One measure of the likely difference is
given by the standard error (SE), which indicates the extent to which an estimate might
have varied by chance because only a sample of dwellings was included. There are about
two chances in three (67%) that a sample estimate will differ by less than one SE from
the number that would have been obtained if all dwellings had been included, and about
19 chances in 20 (95%) that the difference will be less than two SEs.
2 Due to space limitations, it is impractical to print the SE of each estimate in the
publication. Instead, a table of SEs is provided to enable readers to determine the SE for
an estimate from the size of that estimate (see table T1). The SE table is derived from a
mathematical model, referred to as the 'SE model', which is created using data from a
number of past Labour Force Surveys. It should be noted that the SE model only gives an
approximate value for the SE for any particular estimate, since there is some minor
variation between SEs for different estimates of the same size.
I N T R O D U C T I O N
44 A B S • CO U N T S OF A U S T R A L I A N B U S I N E S S OP E R A T O R S • 8 1 7 5 . 0 • 2 0 1 1 – 1 2
11 While this formula will only be exact for differences between separate and
uncorrelated characteristics or subpopulations, it is expected to provide a good
approximation for all differences likely to be of interest in this publication.
SE(x − y) = [SE(x)]2 + [SE(y)]2
10 Published estimates may also be used to calculate the difference between two
survey estimates (of numbers or percentages). Such an estimate is subject to sampling
error. The sampling error of the difference between two estimates depends on their SEs
and the relationship (correlation) between them. An appropriate SE of the difference
between two estimates (x–y) may be calculated by the following formula:
D I F F E R E N C E S
8 The SE for the proportion of females who were other business operators, is 0.6
percentage points, calculated as (39.3/100)x1.4. There are about two chances in three
that the proportion of female business operators is between 38.7% and 39.9% and 19
chances in 20 that the proportion is within the range 38.1% to 40.4%.
9 All other estimates produced from population estimates smaller than the values in T2
have RSEs larger than 25% and should be used with caution. T2 also indicates the size of
the population estimates that would produce all other estimates with RSEs greater than
50% are considered too unreliable for general use.
RSE = (1.8)2 − (1.1)2 = 1.4%
7 Considering the example above, of the 1,036,900 persons who were other business
operators, 407,800 or 39.3% were female. The SE of 407,800, may be calculated by
interpolation as 7,500. To convert this to an RSE we express the SE as a percentage of the
estimate, or 7,500/407,800 = 1.8%. The SE for 1,036,900 was calculated previously as
11,900, which converted to an RSE is 11,900/1,036,900 = 1.1%. Applying the above
formulae, the RSE of the proportion is:
RSE xy = [RSE(x)]2 − [RSE(y)]2
6 Proportions and percentages formed from the ratio of two estimates are also subject
to sampling errors. The size of the error depends on the accuracy of both the numerator
and the denominator. A formula to approximate the RSE of a proportion is given below.
This formula is only valid when x is a subset of y:
PR O P O R T I O N S AN D
PE R C E N T A G E S
5 In general, the size of the SE increases as the size of the estimate increases.
Conversely, the RSE decreases as the size of the estimate increases. Very small estimates
are thus subject to such high RSEs that their value for most practical purposes is
unreliable. In the tables in this publication, only estimates with RSEs of 25% or less are
considered reliable for most purposes. Estimates with RSEs greater than 25% but less
than or equal to 50% are preceded by an asterisk (e.g. *3.4) to indicate that they are
subject to high SEs and should be used with caution. Estimates with RSEs of greater than
50%, preceded by a double asterisk (e.g. **0.3), are considered too unreliable for general
use and should only be used to aggregate with other estimates to provide derived
estimates with RSEs of 25% or less.
CA L C U L A T I O N OF S T A N D A R D
ER R O R S continued
A B S • CO U N T S OF A U S T R A L I A N B U S I N E S S OP E R A T O R S • 8 1 7 5 . 0 • 2 0 1 1 – 1 2 45
T E C H N I C A L N O T E • SA M P L I N G ER R O R FR O M T H E 20 1 2 FO R M S OF EM P L O Y M E N T SU R V E Y
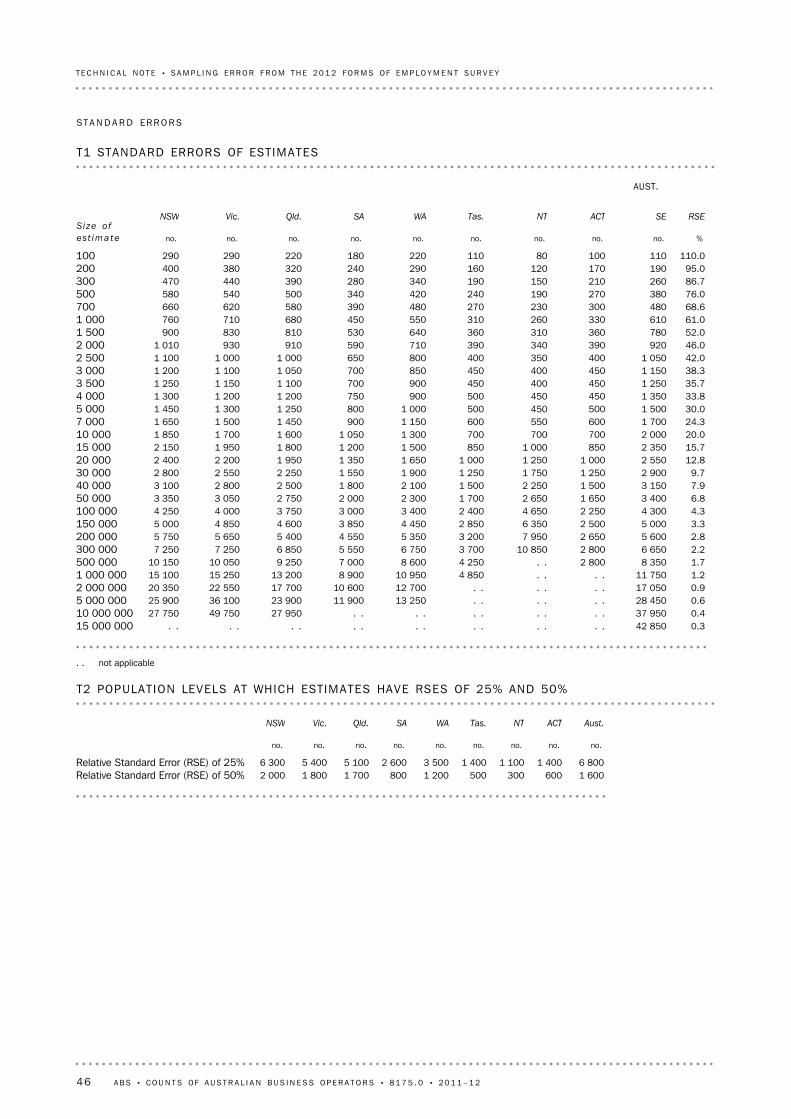
1 6006003005001 2008001 7001 8002 000Relative Standard Error (RSE) of 50%6 8001 4001 1001 4003 5002 6005 1005 4006 300Relative Standard Error (RSE) of 25%
no. no. no. no. no. no. no. no. no.
Aust.ACTNTTas.WASAQld.Vic.NSW
T2 POPULAT ION LEVELS AT WHICH ESTIMATES HAVE RSES OF 25% AND 50%
. . not applicable
0.342 850. .. .. .. .. .. .. .. .15 000 0000.437 950. .. .. .. .. .27 95049 75027 75010 000 0000.628 450. .. .. .13 25011 90023 90036 10025 9005 000 0000.917 050. .. .. .12 70010 60017 70022 55020 3502 000 0001.211 750. .. .4 85010 9508 90013 20015 25015 1001 000 0001.78 3502 800. .4 2508 6007 0009 25010 05010 150500 0002.26 6502 80010 8503 7006 7505 5506 8507 2507 250300 0002.85 6002 6507 9503 2005 3504 5505 4005 6505 750200 0003.35 0002 5006 3502 8504 4503 8504 6004 8505 000150 0004.34 3002 2504 6502 4003 4003 0003 7504 0004 250100 0006.83 4001 6502 6501 7002 3002 0002 7503 0503 35050 0007.93 1501 5002 2501 5002 1001 8002 5002 8003 10040 0009.72 9001 2501 7501 2501 9001 5502 2502 5502 80030 000
12.82 5501 0001 2501 0001 6501 3501 9502 2002 40020 00015.72 3508501 0008501 5001 2001 8001 9502 15015 00020.02 0007007007001 3001 0501 6001 7001 85010 00024.31 7006005506001 1509001 4501 5001 6507 00030.01 5005004505001 0008001 2501 3001 4505 00033.81 3504504505009007501 2001 2001 3004 00035.71 2504504004509007001 1001 1501 2503 50038.31 1504504004508507001 0501 1001 2003 00042.01 0504003504008006501 0001 0001 1002 50046.09203903403907105909109301 0102 00052.07803603103606405308108309001 50061.06103302603105504506807107601 00068.648030023027048039058062066070076.038027019024042034050054058050086.726021015019034028039044047030095.0190170120160290240320380400200
110.011010080110220180220290290100
% no. no. no. no. no. no. no. no. no.
RSESEACTNTTas.WASAQld.Vic.NSW
AUST.
Size ofes t ima t e
T1 STANDARD ERRORS OF ESTIMATES
ST A N D A R D ER R O R S
46 A B S • CO U N T S OF A U S T R A L I A N B U S I N E S S OP E R A T O R S • 8 1 7 5 . 0 • 2 0 1 1 – 1 2
T E C H N I C A L N O T E • SA M P L I N G ER R O R FR O M T H E 20 1 2 FO R M S OF EM P L O Y M E N T SU R V E Y
GL O S S A R Y . . . . . . . . . . . . . . . . . . . . . . . . . . . . . . . . . . . . . . . . . . . .
Refers to whether business operators had employees or did not have employees during areference period.
Employing status
Duration with business is the period of time business operators have been with theirbusinesses. The length of time includes periods of paid leave, unpaid leave or strike.
Duration with business
Refers to whether business operators worked on a contract basis or not during areference period.
Contract work status
The length of the current period of employment people had with their employer or intheir own business. The length of time includes periods of paid leave, unpaid leave orstrike.
Continuous duration withcurrent employer or business
Childcare provision status refers to the various methods persons may organise care for achild or children. This includes instances where persons were caring for their ownchild/children, another person's child or children, or a combination of both.
Childcare provision status
The Australian Census of Population and Housing (Census) is an official count ofpopulation and dwellings, and collects details of age, sex, and other characteristics ofthat population.
Census statistics are used as the basis for estimating the population at the national, stateand local government levels, for electoral purposes and the distribution of governmentfunds. They are used by individuals and organisations in the public and private sectors,for planning, administration, research, and decision making.
One of the important features of the Census is that it allows different characteristics of anindividual, family or household to be related. While information on some characteristicsis available from other sources, only a Census can provide information on a standardbasis for the country as a whole, as well as for small geographic areas and smallpopulation groups.
Census
For the purposes of this publication, business operators are classified according to thesize of the main business they operate. The specific business size ranges used are basedon the number of persons employed in the business. Small business operators aredefined as those operators who employ fewer than 20 persons (includingnon–employing businesses). This treatment concords with ABS' standard (employmentbased) definition of "small business".
Business size ranges
For data in Section One, the business operator population comprises all owner managersof incorporated and unincorporated businesses. It excludes persons who are classified toother types of employment status categories [e.g. persons such as employees who donot own businesses (excluding owner managers of incorporated enterprises) andcontributing family workers]. It also excludes persons who are under the age of fifteenand overseas visitors.
For data in Section Two, the business operator population comprises all owner managersof incorporated and unincorporated businesses. It excludes persons who are classified toother types of employment status categories [e.g. employees who do not ownbusinesses (excluding owner managers of incorporated enterprises), contributing familyworkers, persons not in the labour force, and the unemployed]. It also excludes personswho are under the age of fifteen, overseas visitors and those persons who providedinsufficient information on their Census of Population and Housing form to be includedin the business operator population.
Business operator
A B S • CO U N T S OF A U S T R A L I A N B U S I N E S S OP E R A T O R S • 8 1 7 5 . 0 • 2 0 1 1 – 1 2 47
For data in Section One, non–business operators comprise employed persons notowning their own business and contributing family workers. It excludes businessoperators and persons who were excluded from the scope of the Monthly Labour ForceSurvey and/or Forms of Employment Survey. It also excludes persons who are under theage of fifteen and overseas visitors.
Non–business operator
The business or job in which the most hours were usually worked.Main job
An industry is a group of businesses or organisations that undertake similar economicactivities to produce goods and services. In this publication, industry of main job refersto ANZSIC Division as classified according to the Australian and New Zealand StandardIndustrial Classification (ANZSIC), 2006 (cat. no. 1292.0).
Industry of main job
The main purpose of the industry division level is to provide a limited number ofcategories which give a broad overall picture of the economy. There are nineteendivisions within ANZSIC06 each identified by an alphabetical letter, that is, 'A' forAgriculture, Forestry and Fishing, 'B' for Mining, 'C' for Manufacturing, etc.
Industry division
Individuals have been classified according to their description of activities undertaken bytheir employer/business at the place where they work. Businesses are coded toindustries in the Australian and New Zealand Standard Industrial Classification 2006(ANZSIC06) which is a classification system for grouping producing businesses (of bothgoods and services) in Australia and New Zealand to permit comparability of data.
Within ANZSIC, there is a structure comprising four levels ranging from industry division(broadest level) to the industry class (finest level). For more information, users shouldrefer to the Australian and New Zealand Standard Industrial Classification 2006 (cat.no. 1292.0).
Industry (ANZSIC)
The gross weekly income (including pensions and allowances) that the person usuallyreceives each week.
Individual weekly income
Indigenous status indicates whether or not an individual is a person of Aboriginal originand/or Torres Strait Islander origin.
Indigenous status
Incorporated Entities are those entities which are given corporate, or separate legalentity status under legislation such as the Corporation Act 2001 and other ParliamentaryActs.
Incorporated entity
The tenure status of a business operator’s occupancy of their residence: owned outright,owned with a mortgage or renting.
Housing tenure type
The number of hours usually worked in a week.Hours usually worked
Refers to the highest level of primary or secondary schooling a person aged 15 years andover has completed.
Highest year of schoolcompleted
Employed persons who usually worked 35 hours or more a week (in their main job) andothers who, although usually worked fewer than 35 hours a week, worked 35 hours ormore during the reference week.
Full–time workers in main job
Field of Study refers to the subject matter taught in a course, unit, and modules of study.It is also a hierarchical classification and comprises 12 broad fields of study, 71 narrowfields and 356 detailed fields. For more information refer to the Australian StandardClassification of Education (ASCED) (cat. no. 1272.0).
Field of Study
The sum of the individual weekly incomes reported by all family members aged fifteenyears and over.
Family weekly income
Expected duration with business is the expected period of time business operatorsexpect to be with their businesses before leaving and seeking other employment,retiring, downsizing, return to study, travel, etc.
Expected duration withbusiness
48 A B S • CO U N T S OF A U S T R A L I A N B U S I N E S S OP E R A T O R S • 8 1 7 5 . 0 • 2 0 1 1 – 1 2
GL O S S A R Y
Owner managers of incorporated/unincorporated enterprises who were engaged by anorganisation to provide a particular service or undertake a particular task at an agreedprice or rate, and generally for a specified period.
Worked on a contract basis
An unincorporated entity is an entity which has not become a corporation under theCorporation Act 2001. Unincorporated entities can choose to remain 'unincorporated',where by the business does not possess a separate legal identity to that of its owner, or itcan choose the limited liability status of a company where the business assets are legallyseparate to that of the owners.
Unincorporated Entity
The relationship of each person in a family to the family reference person or, where aperson is not a part of a family, that person's relationship to the household referenceperson.
Relationship in household
The week preceding the week in which the interview was conducted.Reference week
Employed persons who usually worked fewer than 35 hours a week (in their main job)and who did so during the reference week.
Part–time workers in main job
An occupation is a collection of jobs that are sufficiently similar in their title and tasks,skill level and skill specialisation which are grouped together for the purposes ofclassification. In this publication, occupation refers to Major Group as defined by theANZSCO – Australian and New Zealand Standard Classification of Occupations, FirstEdition, 2006 (cat. no. 1220.0).
Occupation of main job
Non–school qualification describes the level of education of the highest completednon–school qualification (e.g. bachelor degree, diploma).
Non–school qualification
For data in Section Two, non–business operators comprise employees who do not ownbusinesses and contributing family workers. It excludes business operators as well aspersons who were not in the labour force or unemployed. It also excludes persons whowere under the age of fifteen, overseas visitors and those persons who providedinsufficient information on the Census of Population and Housing form to be included inthe non–business operator population.
Non–business operatorcontinued
A B S • CO U N T S OF A U S T R A L I A N B U S I N E S S OP E R A T O R S • 8 1 7 5 . 0 • 2 0 1 1 – 1 2 49
GL O S S A R Y


www.abs.gov.auWEB ADDRESS
All statistics on the ABS website can be downloaded freeof charge.
F R E E A C C E S S T O S T A T I S T I C S
Client Services, ABS, GPO Box 796, Sydney NSW 2001POST
1300 135 211FAX
1300 135 070PHONE
Our consultants can help you access the full range ofinformation published by the ABS that is available free ofcharge from our website. Information tailored to yourneeds can also be requested as a 'user pays' service.Specialists are on hand to help you with analytical ormethodological advice.
I N F O R M A T I O N A N D R E F E R R A L S E R V I C E
www.abs.gov.au the ABS website is the best place fordata from our publications and information about the ABS.
INTERNET
F O R M O R E I N F O R M A T I O N . . .
© Commonwealth of Australia 2013Produced by the Australian Bureau of Statistics
81
75
.0
•
CO
UN
TS
O
F A
US
TR
AL
IA
N
BU
SI
NE
SS
O
PE
RA
TO
RS
, A
US
TR
AL
IA
•
20
11
–1
2