Embed Size (px)
Citation preview

2011.03.09 - SLIDE 1IS 240 – Spring 2011
Prof. Ray Larson University of California, Berkeley
School of Information
Principles of Information Retrieval
Lecture 13: Evaluation Cont.
2011.03.09 - SLIDE 2IS 240 – Spring 2011
Overview
• Review– Calculating Recall and Precision– The trec_eval program– Limits of retrieval performance – Relationship
of Recall and Precision
• More on Evaluation (Alternatives to R/P)
• Expected Search Length
• Precison/Recall with scales of relevance
• Cumulative Gain (revisited)

2011.03.09 - SLIDE 3IS 240 – Spring 2011
How Test Runs are Evaluated
1. d123*
2. d84
3. d56*4. d6
5. d8
6. d9*7. d511
8. d129
9. d187
10. d25*11. d38
12. d48
13. d250
14. d113
15. d3*
• First ranked doc is relevant, which is 10% of the total relevant. Therefore Precision at the 10% Recall level is 100%
• Next Relevant gives us 66% Precision at 20% recall level
• Etc….
Rq={d3,d5,d9,d25,d39,d44,d56,d71,d89,d123} : 10 Relevant
Examples from Chapter 3 in Baeza-Yates

2011.03.09 - SLIDE 4IS 240 – Spring 2011
Graphing for a Single Query
100 90 80 70 60 50 40 30 20 10 0
0 10 20 30 40 50 60 70 80 90 100
PRECISION
RECALL
2011.03.09 - SLIDE 5IS 240 – Spring 2011
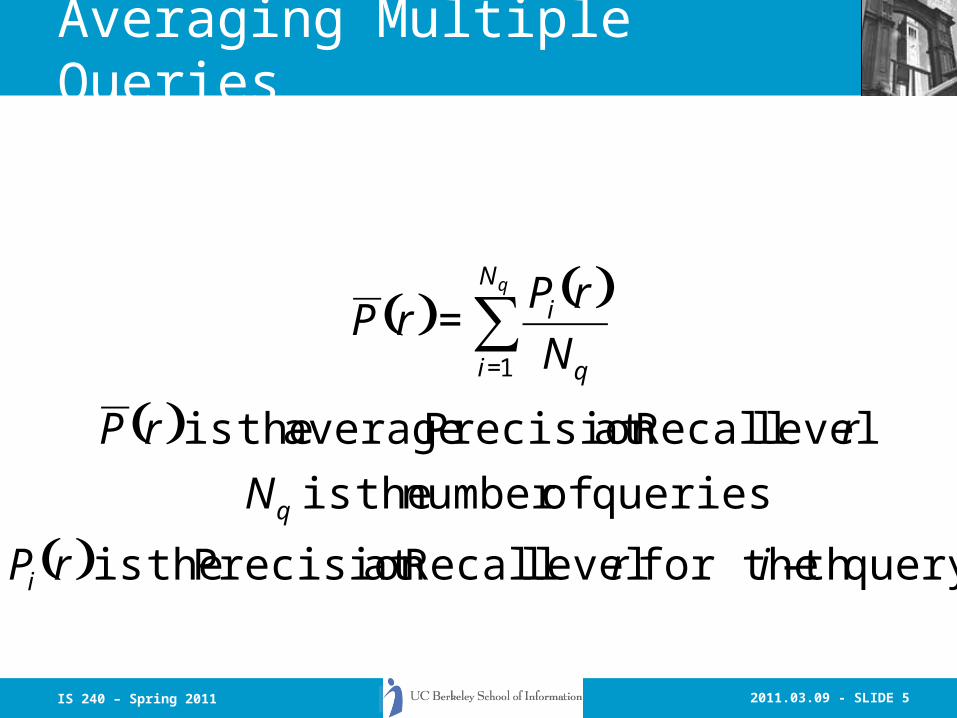
Averaging Multiple Queries
( ) ( )
( )
( ) query th - for the level Recallat Precision theis
queries ofnumber theis
level Recallat Precision average theis
1
irrP
N
rrP
N
rPrP
i
q
N
i q
iq
∑=
=
2011.03.09 - SLIDE 6IS 240 – Spring 2011
Interpolation
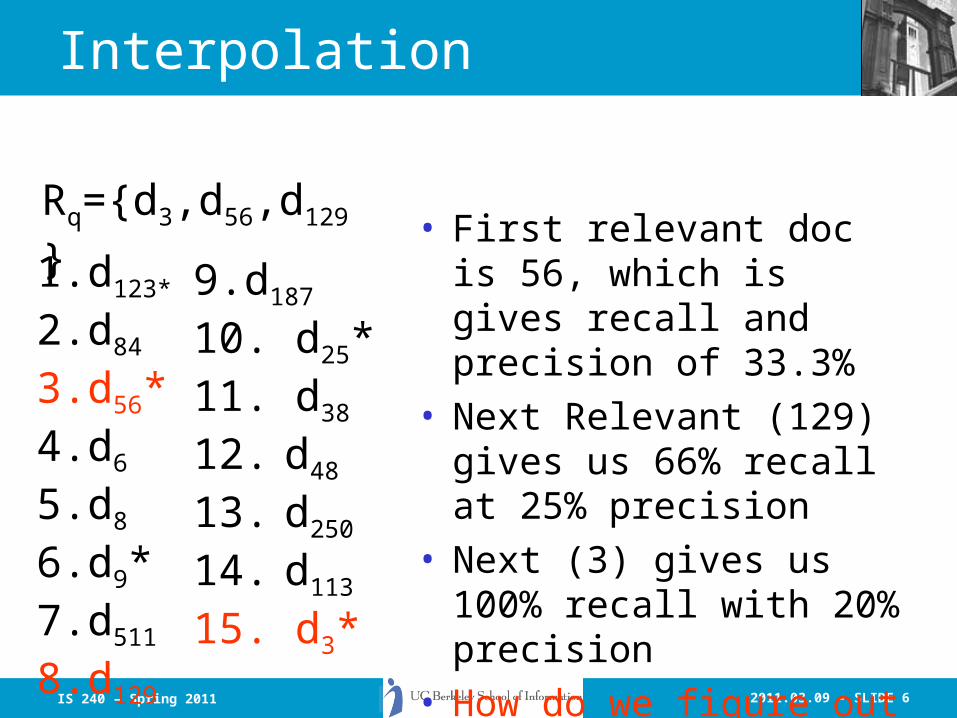
Rq={d3,d56,d129}
1. d123*
2. d84
3. d56*4. d6
5. d8
6. d9*7. d511
8. d129
9. d187
10. d25*11. d38
12. d48
13. d250
14. d113
15. d3*
• First relevant doc is 56, which is gives recall and precision of 33.3%
• Next Relevant (129) gives us 66% recall at 25% precision
• Next (3) gives us 100% recall with 20% precision
• How do we figure out the precision at the 11 standard recall levels?

2011.03.09 - SLIDE 7IS 240 – Spring 2011
Interpolation
{ }
( )
th-)1( theandth - ebetween th level recall
anyat Precision known Maximum The I.e.,
)(max
level recall standardth - the toreference a is
10,...,2,1,0,
1
+
≤≤=
∈
+
jj
rPrrrrP
j
jr
jjj
j

2011.03.09 - SLIDE 8IS 240 – Spring 2011
Interpolation
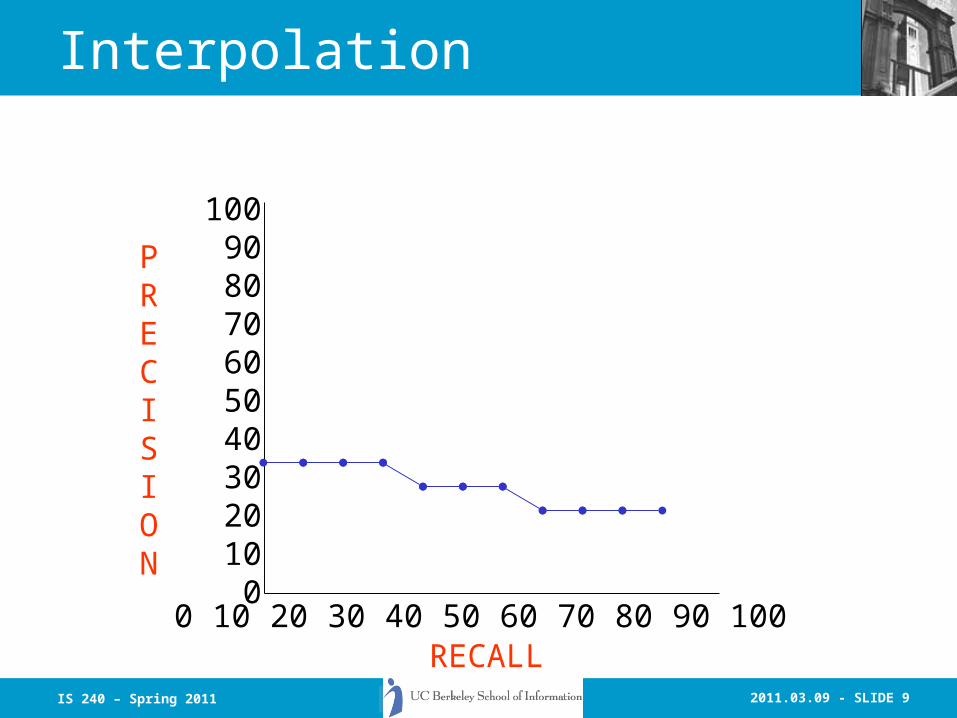
• So, at recall levels 0%, 10%, 20%, and 30% the interpolated precision is 33.3%
• At recall levels 40%, 50%, and 60% interpolated precision is 25%
• And at recall levels 70%, 80%, 90% and 100%, interpolated precision is 20%
• Giving graph…
2011.03.09 - SLIDE 9IS 240 – Spring 2011
Interpolation
100 90 80 70 60 50 40 30 20 10 0
0 10 20 30 40 50 60 70 80 90 100
PRECISION
RECALL

2011.03.09 - SLIDE 10IS 240 – Spring 2011
TREC_EVAL Output
Queryid (Num): 49 Total number of documents over all queries Retrieved: 49000 Relevant: 1670 Rel_ret: 1258Interpolated Recall - Precision Averages: at 0.00 0.6880 at 0.10 0.5439 at 0.20 0.4773 at 0.30 0.4115 at 0.40 0.3741 at 0.50 0.3174 at 0.60 0.2405 at 0.70 0.1972 at 0.80 0.1721 at 0.90 0.1337 at 1.00 0.1113 Average precision (non-interpolated) for all rel docs(averaged over queries) 0.3160
Number of Queries
From QRELSRelevant and Retrieved
Average Precision atFixed Recall Levels
From individual queries

2011.03.09 - SLIDE 11IS 240 – Spring 2011
TREC_EVAL Output
Precision: At 5 docs: 0.3837 At 10 docs: 0.3408 At 15 docs: 0.3102 At 20 docs: 0.2806 At 30 docs: 0.2422 At 100 docs: 0.1365 At 200 docs: 0.0883 At 500 docs: 0.0446 At 1000 docs: 0.0257R-Precision (precision after R (= num_rel for a query) docs retrieved): Exact: 0.3068
Average Precision atFixed Number of Documents
Precision after R Documents retrieved

2011.03.09 - SLIDE 12IS 240 – Spring 2011
Problems with Precision/Recall
• Can’t know true recall value – except in small collections
• Precision/Recall are related– A combined measure sometimes more
appropriate
• Assumes batch mode– Interactive IR is important and has different
criteria for successful searches– We will touch on this in the UI section
• Assumes a strict rank ordering matters
2011.03.09 - SLIDE 13IS 240 – Spring 2011
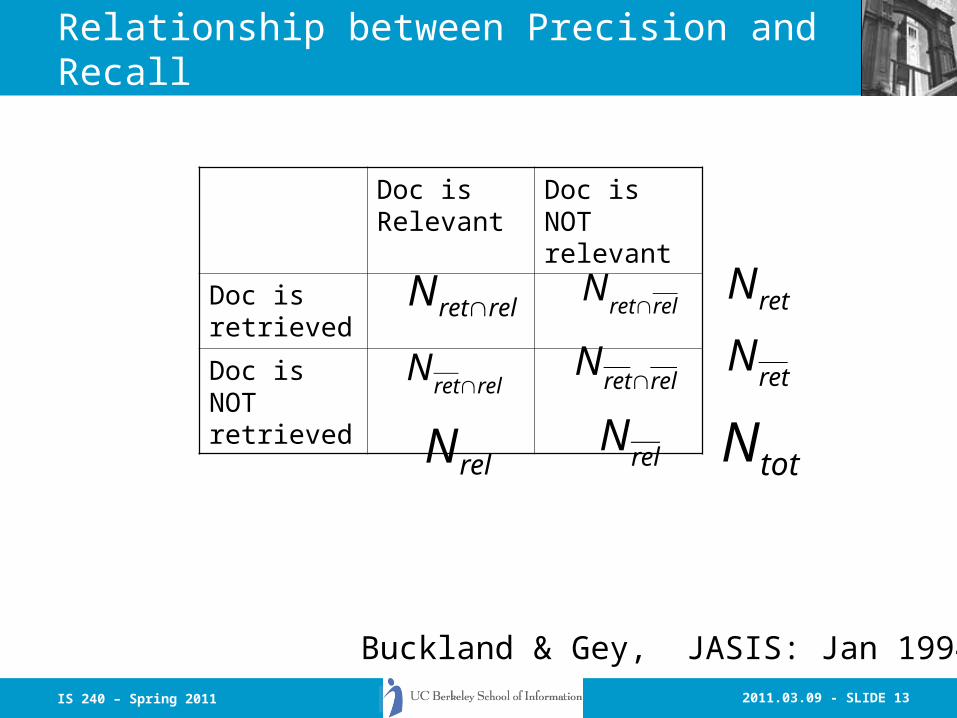
Relationship between Precision and Recall
Doc is Relevant
Doc is NOT relevant
Doc is retrieved
Doc is NOT retrieved
relretN ∩ relretN ∩
relretN ∩ relret
N ∩
relN relN
retN
retN
totN
Buckland & Gey, JASIS: Jan 1994
2011.03.09 - SLIDE 14IS 240 – Spring 2011
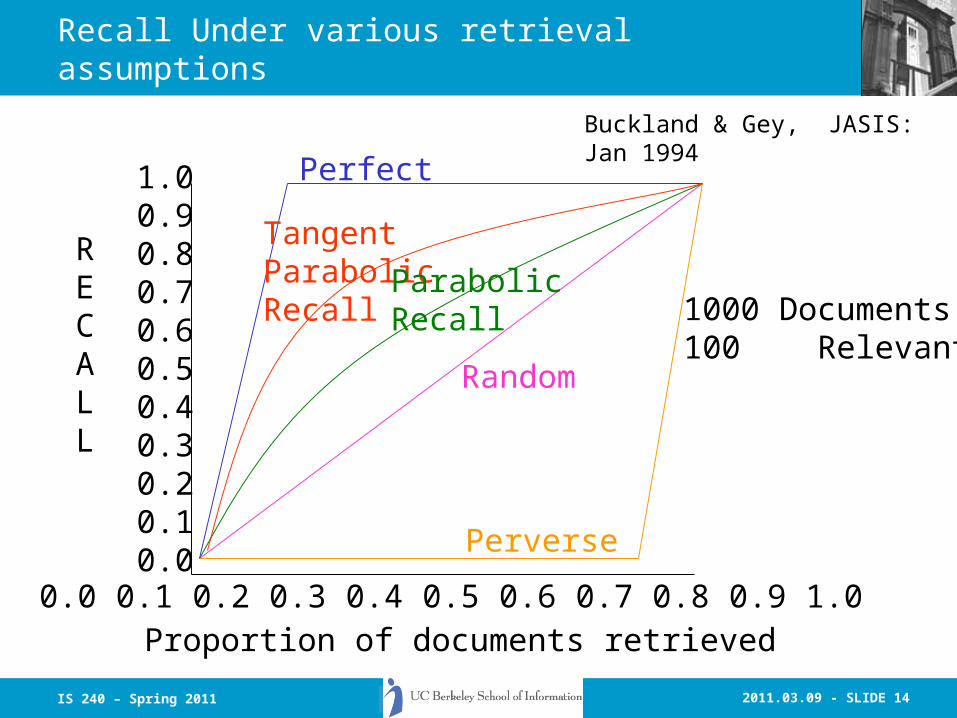
Recall Under various retrieval assumptions
Buckland & Gey, JASIS: Jan 1994
1.00.90.80.70.60.50.40.30.20.10.0
RECALL
0.0 0.1 0.2 0.3 0.4 0.5 0.6 0.7 0.8 0.9 1.0Proportion of documents retrieved
Random
Perfect
Perverse
TangentParabolicRecall
ParabolicRecall 1000 Documents
100 Relevant
2011.03.09 - SLIDE 15IS 240 – Spring 2011
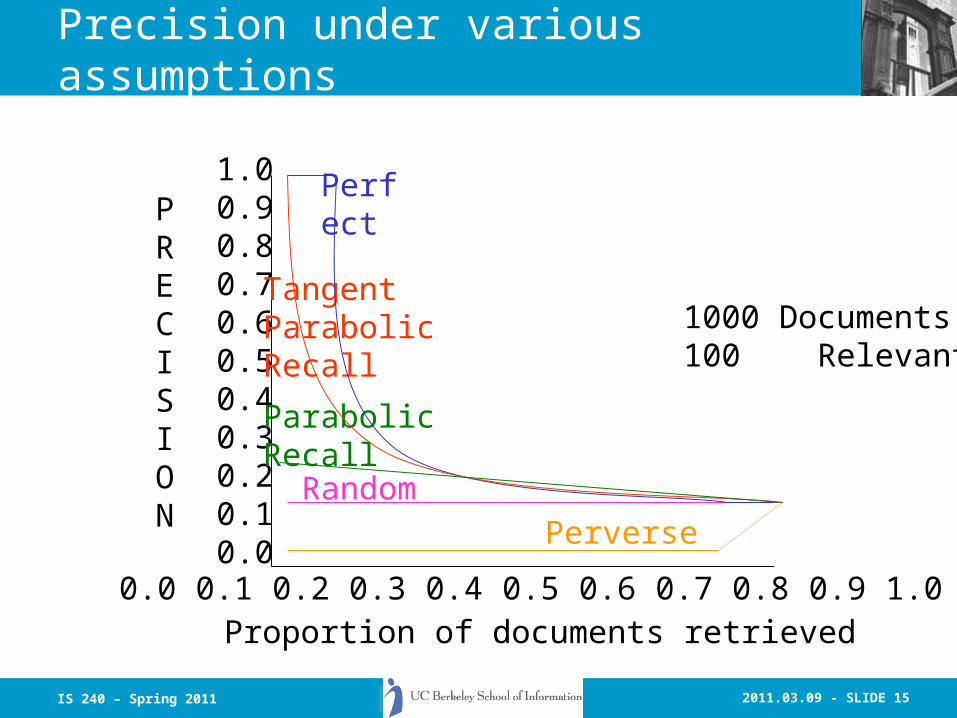
Precision under various assumptions
1000 Documents100 Relevant
1.00.90.80.70.60.50.40.30.20.10.0
PRECISION
0.0 0.1 0.2 0.3 0.4 0.5 0.6 0.7 0.8 0.9 1.0Proportion of documents retrieved
Random
Perfect
Perverse
TangentParabolicRecall
ParabolicRecall
2011.03.09 - SLIDE 16IS 240 – Spring 2011
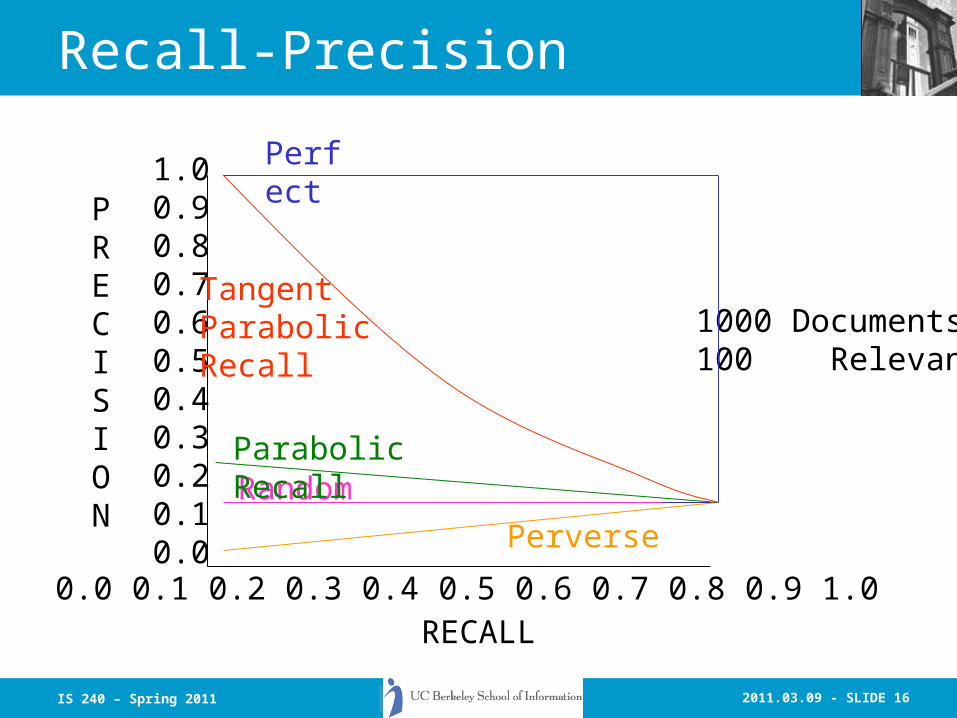
Recall-Precision
1000 Documents100 Relevant
1.00.90.80.70.60.50.40.30.20.10.0
PRECISION
0.0 0.1 0.2 0.3 0.4 0.5 0.6 0.7 0.8 0.9 1.0RECALL
Random
Perfect
Perverse
TangentParabolicRecall
Parabolic Recall

2011.03.09 - SLIDE 17IS 240 – Spring 2011
CACM Query 25

2011.03.09 - SLIDE 18IS 240 – Spring 2011
Relationship of Precision and Recall
x
NxRxP rel)()( =
documentsrelevant Total
documentsafter x Recall )(
documentsafter x Precision )(
where
===
relNxRxP

2011.03.09 - SLIDE 19IS 240 – Spring 2011
Today
• More on Evaluation (Alternatives to R/P)• Expected Search Length• Non-Binary Relevance and Evaluation

2011.03.09 - SLIDE 20IS 240 – Spring 2011
Other Relationships
From van Rijsbergen Information Retrieval (2nd Ed.)
RELEVANT NON-RELEVANT
RETRIEVED
NOT RETRIEVED
BA I
BA I
BA I
BA I
A A
B
B
N

2011.03.09 - SLIDE 21IS 240 – Spring 2011
Other Relationships
N
A
A
BA
A
BA
B
BA
|| GENERALITY
||
|| FALLOUT
||
|| RECALL
||
|| PRECISION
=
=
=
=
I
I
I

2011.03.09 - SLIDE 22IS 240 – Spring 2011
Other Relationships
)1()( GFGR
GRP
−+××
=
All of the previous measures are related by this equationP=Precision, R=Recall, F=Fallout, G=Generality

2011.03.09 - SLIDE 23IS 240 – Spring 2011
MiniTREC 2000
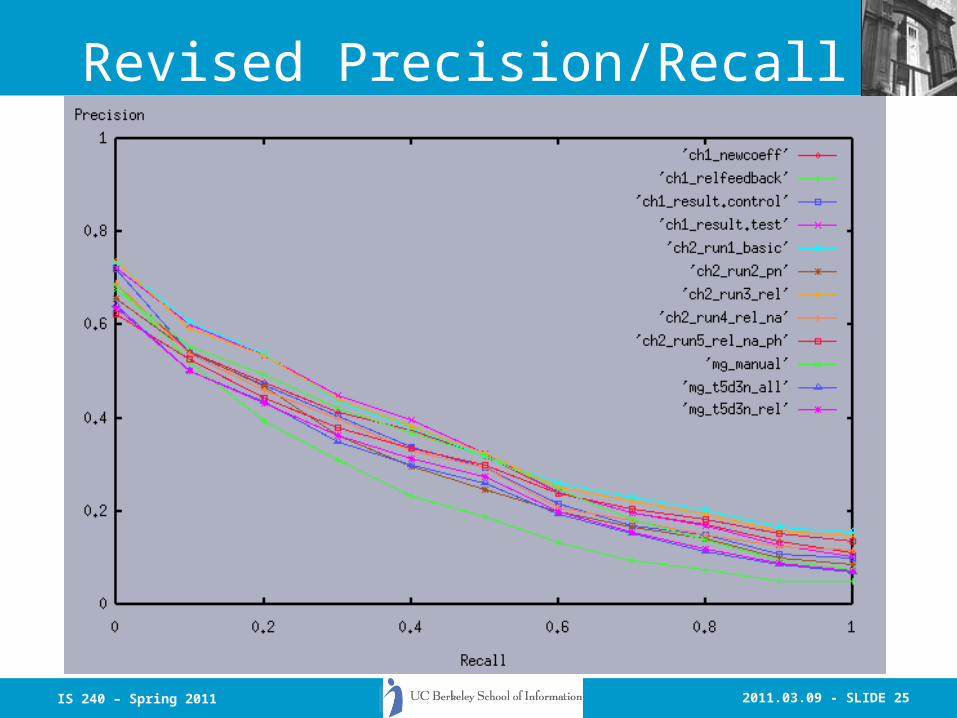
• Collection: Financial Times (FT) ~600 Mb• 50 Topics (#401-450) from TREC 8• 22516 FT QRELs from TREC8• Four Groups, 12 runs
– Cheshire 1 – 4 runs– Cheshire 2 – 5 runs– MG -- 3 runs– SMART -- Still working…(not really)
• Total of 598000 ranked documents submitted

2011.03.09 - SLIDE 24IS 240 – Spring 2011
Precision/Recall for all MiniTREC runs
2011.03.09 - SLIDE 25IS 240 – Spring 2011
Revised Precision/Recall

2011.03.09 - SLIDE 26IS 240 – Spring 2011
Further Analysis
• Analysis of Variance (ANOVA)– Uses the ret_rel, total relevant and average
precision for each topic– Not a perfectly balanced design…– Looked at the simple models:
• Recall = Runid• Precision = Runid

2011.03.09 - SLIDE 27IS 240 – Spring 2011
ANOVA results: Recall Waller-Duncan K-ratio t Test for recall
NOTE: This test minimizes the Bayes risk under additive loss and certain other assumptions.
Kratio 100 Error Degrees of Freedom 572 Error Mean Square 0.065999 F Value 4.65 Critical Value of t 1.95638 Minimum Significant Difference 0.1019 Harmonic Mean of Cell Sizes 48.63971
NOTE: Cell sizes are not equal.

2011.03.09 - SLIDE 28IS 240 – Spring 2011
ANOVA Results: Mean Recall
Means with the same letter are not significantly different. Waller Grouping Mean N runid A 0.82235 49 mg_manua B A 0.79772 49 ch1_test B A 0.79422 49 ch1_newc B A 0.75550 49 ch2_run2 B A 0.75385 49 ch2_run1 B A 0.74771 49 mg_t5_al B A 0.74707 49 ch2_run3 B A 0.74647 49 mg_t5_re B A 0.73035 49 ch1_cont B 0.71279 45 ch2_run5 B 0.71167 49 ch2_run4 C 0.50788 49 ch1_relf

2011.03.09 - SLIDE 29IS 240 – Spring 2011
ANOVA Recall - Revised
Means with the same letter are not significantly different.Waller Grouping Mean N runid A 0.79772 49 ch1_test A 0.79684 49 mg_manua A 0.79422 49 ch1_newc A 0.75550 49 ch2_run2 A 0.75385 49 ch2_run1 A 0.74771 49 mg_t5_al A 0.74707 49 ch2_run3 A 0.74647 49 mg_t5_re A 0.73035 49 ch1_cont A 0.71279 45 ch2_run5 A 0.71167 49 ch2_run4 B 0.50788 49 ch1_relf
2011.03.09 - SLIDE 30IS 240 – Spring 2011
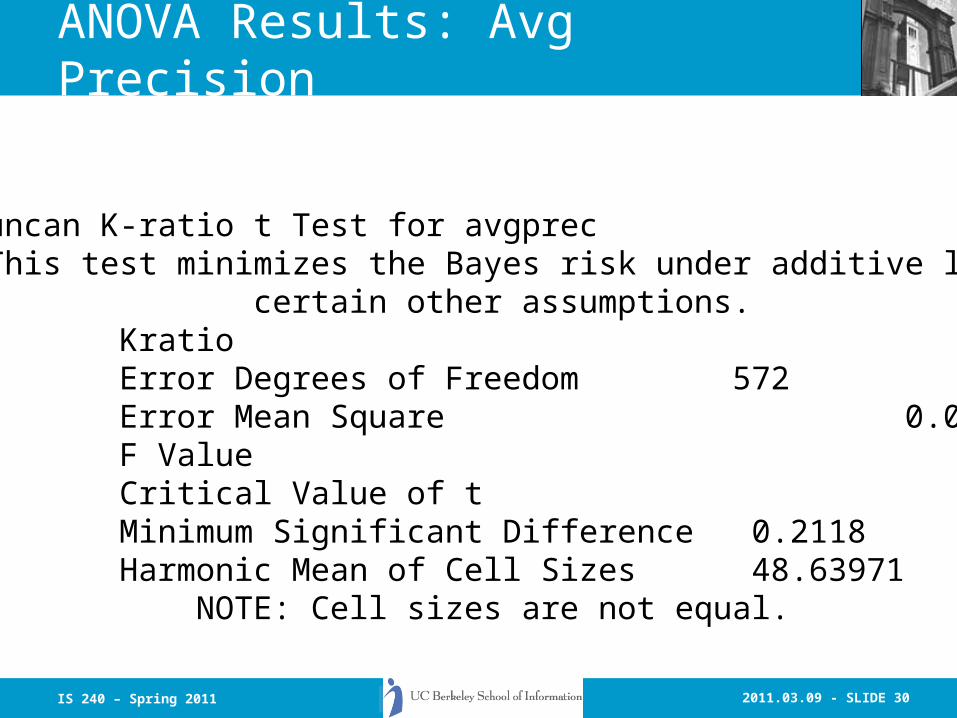
ANOVA Results: Avg Precision
Waller-Duncan K-ratio t Test for avgprec NOTE: This test minimizes the Bayes risk under additive loss and certain other assumptions. Kratio 100 Error Degrees of Freedom 572 Error Mean Square 0.078327 F Value 0.78 Critical Value of t 3.73250 Minimum Significant Difference 0.2118 Harmonic Mean of Cell Sizes 48.63971 NOTE: Cell sizes are not equal.
2011.03.09 - SLIDE 31IS 240 – Spring 2011
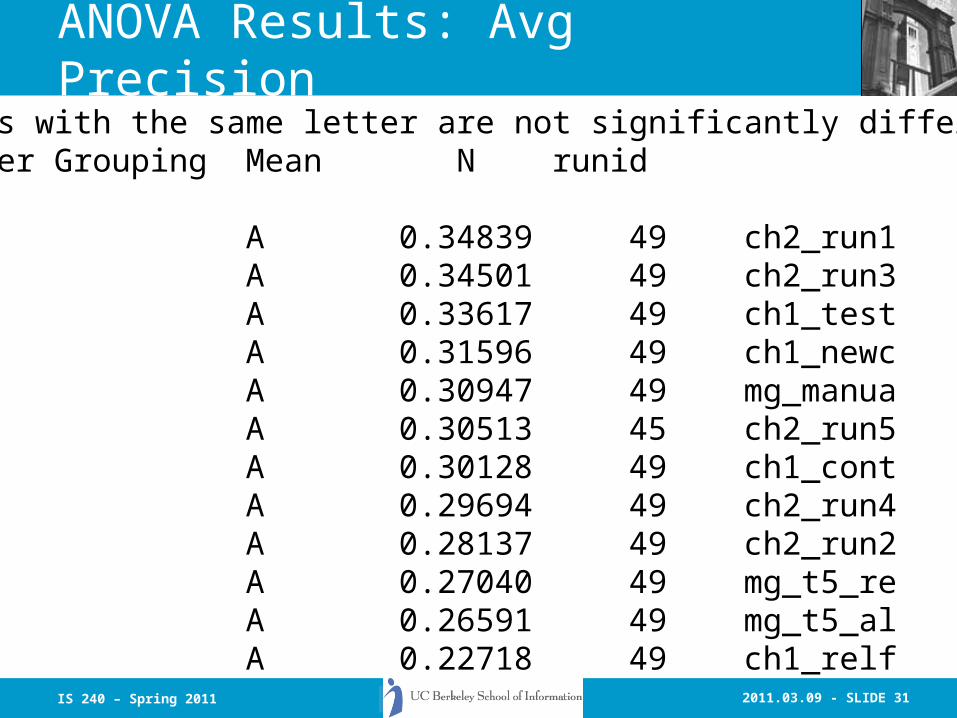
ANOVA Results: Avg Precision Means with the same letter are not significantly different. Waller Grouping Mean N runid
A 0.34839 49 ch2_run1 A 0.34501 49 ch2_run3 A 0.33617 49 ch1_test A 0.31596 49 ch1_newc A 0.30947 49 mg_manua A 0.30513 45 ch2_run5 A 0.30128 49 ch1_cont A 0.29694 49 ch2_run4 A 0.28137 49 ch2_run2 A 0.27040 49 mg_t5_re A 0.26591 49 mg_t5_al A 0.22718 49 ch1_relf
2011.03.09 - SLIDE 32IS 240 – Spring 2011
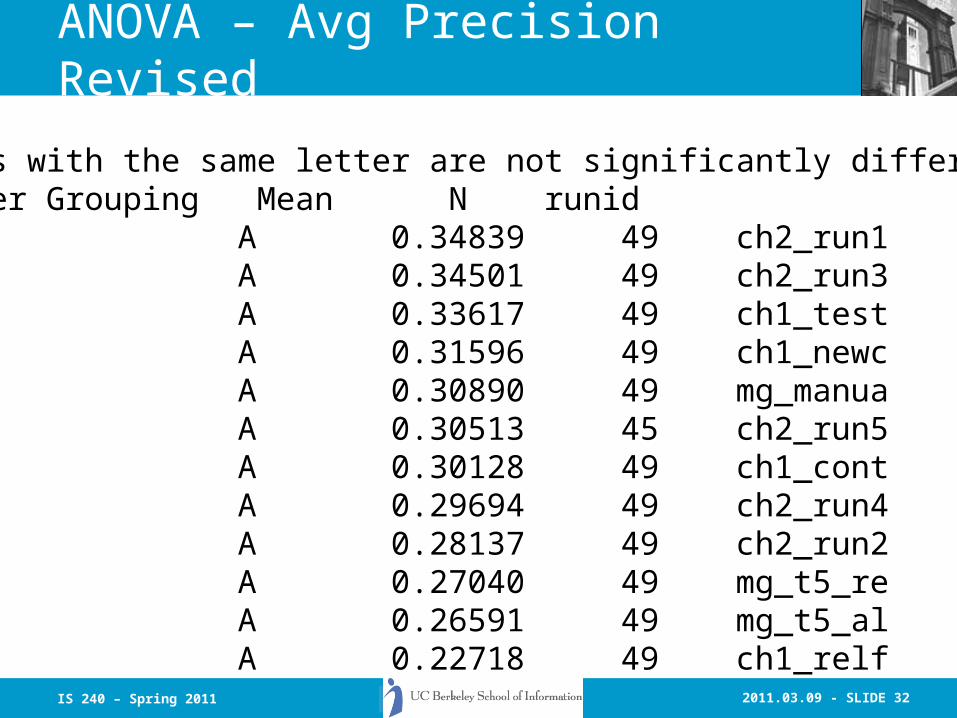
ANOVA – Avg Precision Revised
Means with the same letter are not significantly different. Waller Grouping Mean N runid A 0.34839 49 ch2_run1 A 0.34501 49 ch2_run3 A 0.33617 49 ch1_test A 0.31596 49 ch1_newc A 0.30890 49 mg_manua A 0.30513 45 ch2_run5 A 0.30128 49 ch1_cont A 0.29694 49 ch2_run4 A 0.28137 49 ch2_run2 A 0.27040 49 mg_t5_re A 0.26591 49 mg_t5_al A 0.22718 49 ch1_relf

2011.03.09 - SLIDE 33IS 240 – Spring 2011
What to Evaluate?
• Effectiveness– Difficult to measure– Recall and Precision are only one way– What might be others?
2011.03.09 - SLIDE 34IS 240 – Spring 2011
Other Ways of Evaluating
• “The primary function of a retrieval system is conceived to be that of saving its users to as great an extent as possible, the labor of perusing and discarding irrelevant documents, in their search for relevant ones”
William S. Cooper (1968) “Expected Search Length: A Single measure of Retrieval Effectiveness Based on the Weak Ordering Action of Retrieval Systems” American Documentation, 19(1).

2011.03.09 - SLIDE 35IS 240 – Spring 2011
Other Ways of Evaluating
• If the purpose of retrieval system is to rank the documents in descending order of their probability of relevance for the user, then maybe the sequence is important and can be used as a way of evaluating systems.
• How to do it?

2011.03.09 - SLIDE 36IS 240 – Spring 2011
Query Types
• Only one relevant document is wanted
• Some arbitrary number n is wanted
• All relevant documents are wanted
• Some proportion of the relevant documents is wanted
• No documents are wanted? (Special case)

2011.03.09 - SLIDE 37IS 240 – Spring 2011
Search Length and Expected Search Length
• Work by William Cooper in the late ’60s• Issues with IR Measures:
– Usually not a single measure– Assume “retrieved” and “not retrieved” sets
without considering more than two classes– No built-in way to compare to purely random
retrieval– Don’t take into account how much relevant
material the user actually needs (or wants)
2011.03.09 - SLIDE 38IS 240 – Spring 2011
Weak Ordering in IR Systems
• The assumption that there are two sets of “Retrieved” and “Not Retrieved” is not really accurate.
• IR Systems usually rank into many sets of equal retrieval weights
• Consider Coordinate-Level ranking…

2011.03.09 - SLIDE 39IS 240 – Spring 2011
Weak Ordering
2011.03.09 - SLIDE 40IS 240 – Spring 2011
Search Length
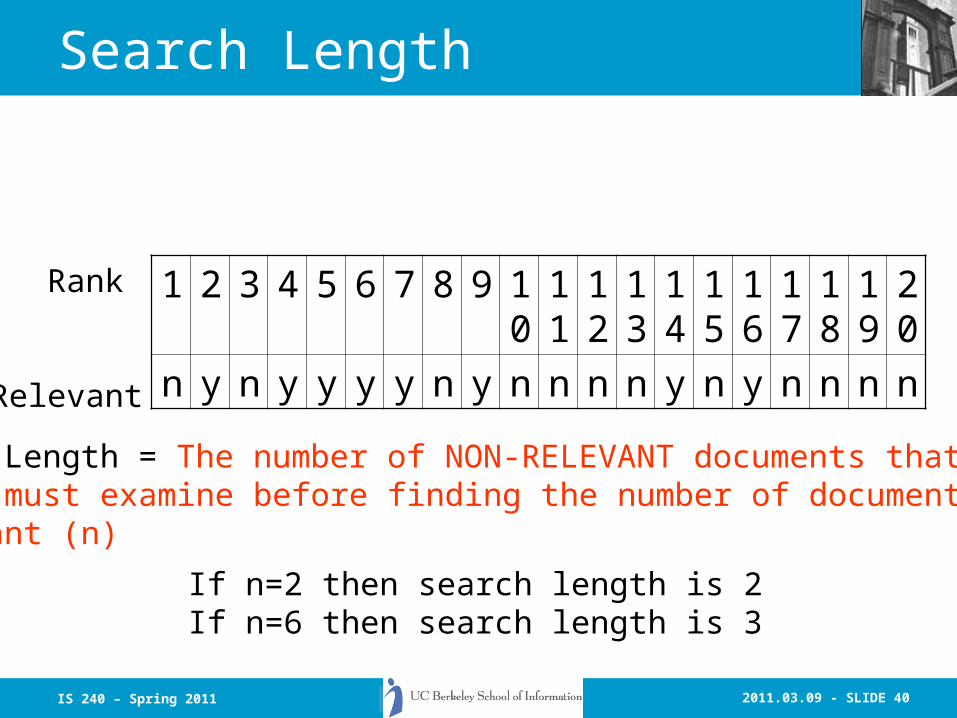
1 2 3 4 5 6 7 8 9 10
11
12
13
14
15
16
17
18
19
20
n y n y y y y n y n n n n y n y n n n n
Rank
Relevant
Search Length = The number of NON-RELEVANT documents thata user must examine before finding the number of documents that they want (n)
If n=2 then search length is 2If n=6 then search length is 3

2011.03.09 - SLIDE 41IS 240 – Spring 2011
Weak Ordering Search Length
1 1 1 2 2 2 2 2 3 3 3 3 3 4 4 4 4 4 4 4
n n y y n y y y n y y n n n n n n n y n
Rank
Relevant
If we assume order within ranks is random…If n=6 then we must go to level 3 of the ranking, but thePOSSIBLE search lengths are 3, 4, 5, or 6.
To compute Expected Search Length we need to know theprobability of each possible search length. to get this we needto consider the number of different ways in which documentmay be distributed in the ranks…

2011.03.09 - SLIDE 42IS 240 – Spring 2011
Expected Search Length
Rank
Relevant
46*10
15*
10
24*
10
33*
10
4
6. oflength search ain 1 and 5 oflength search ain 2 4, of
length search ain 3 3,length search in result would4 theseof 102
5
or... 5 among ddistribute becan docsrelevant 2that
waysdifferent ofnumber heconsider t and 2 and 1 ranks ignorecan We
=⎟⎠
⎞⎜⎝
⎛+⎟⎠
⎞⎜⎝
⎛+⎟⎠
⎞⎜⎝
⎛+⎟⎠
⎞⎜⎝
⎛
=⎟⎟⎠
⎞⎜⎜⎝
⎛
1 1 1 2 2 2 2 2 3 3 3 3 3 4 4 4 4 4 4 4
n n y y n y y y n y y n n n n n n n y n

2011.03.09 - SLIDE 43IS 240 – Spring 2011
Expected Search Length
qs
i
r
j
q
for needed level final in the docs ofnumber
level final in the docs rel-non ofnumber
level final in the docsrelevant ofnumber
final thepreceding
levels allin q torel-non docs ofnumber total
given type a ofquery
===
==
1)ESL(
docs )1/( containingeach subsets 1 intoPartition
+⋅
+=
++
rsi
jq
rir
2011.03.09 - SLIDE 44IS 240 – Spring 2011
Expected Search Length
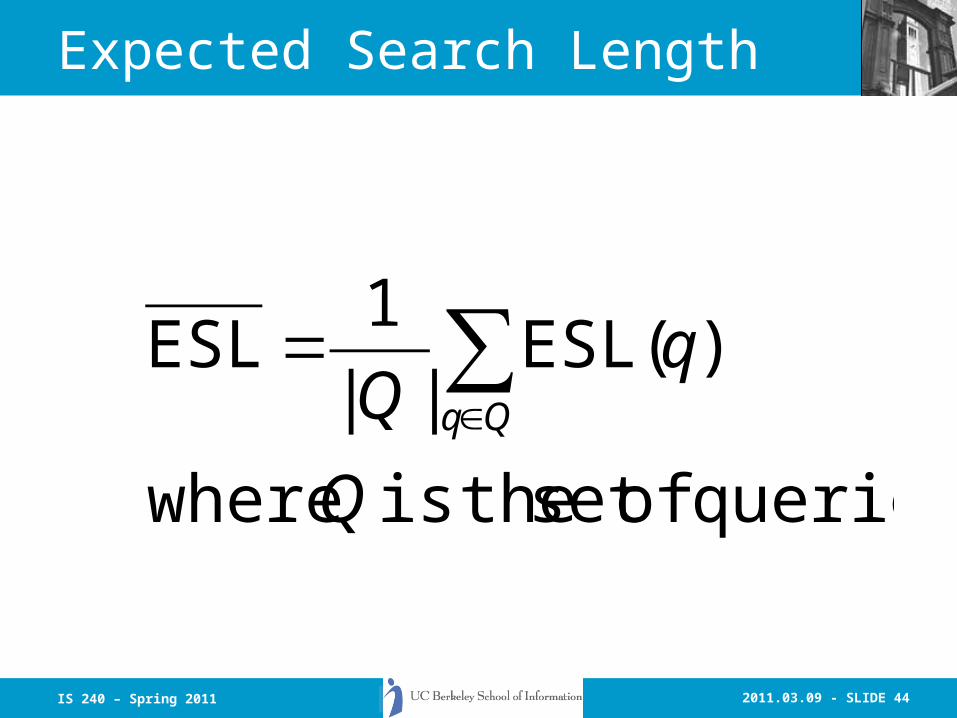
queries ofset theis where
)ESL(||
1ESL
Q
qQ Qq∑∈
=

2011.03.09 - SLIDE 45IS 240 – Spring 2011
Expected search length advantages
• Instead of assuming that high recall is something that everyone wants, it lets the user determine what is wanted in terms of numbers relevant items retrieved
• There are other measures that have been used recently that have something of the same idea– “Extended Cumulated Gain” used in INEX

2011.03.09 - SLIDE 46IS 240 – Spring 2011
Criteria for Evaluation Measures
• Basic Principle: Should be able to distinguish, or rank systems by how effectively they can perform retrieval
• Efficiency vs. Effectiveness (when does each matter?)
• Is relevance really a binary judgement?
2011.03.09 - SLIDE 47IS 240 – Spring 2011
Non-Binary Relevance Judgements
• TREC has been accused of having a fairly low threshold of relevance– Is a document that just mentions the query topic
in passing really equally relevant compared to one that is devoted to an in-depth discussion of the topic?
– What kind of criteria might be used for scales of relevance?
• INEX is one evaluation forum that has been attempting to use these graded definitions of relevance in evaluating XML retrieval

2011.03.09 - SLIDE 48IS 240 – Spring 2011
Scales of relevance
• Sormunen (2002) studied TREC judgements and re-judged on a 4 point scale. The re-judgements agreed on 95% of the items, but found for the relevant:– Highly Relevant (15%)– Fairly Relevant (33%)– Marginally Relevant (51%)– Not Relevant (~1% i.e. disagreed with TREC)
• also 3% of items TREC judged non-relevant were considered to be relevant in the re-judgement

2011.03.09 - SLIDE 49IS 240 – Spring 2011
What kind of measures
• Can’t get away from relevance, but instead of binary, we can consider a scale (i.e., typically ordinal or categorical scale values)
• Kekäläinen and Järvelin explored several ways of dealing with scales of relevance– Tradition Precision as function of Recall– Precision and Recall by degree of document
relevance– Generalized Precision and Recall by level of
Document relevance
2011.03.09 - SLIDE 50IS 240 – Spring 2011
Traditional P at R averages
• The first approach is just the traditional way of calculating average precision at particular recall levels.
• This involves adopting some quantisation function to transform scales of relevance into the usual binary value
2011.03.09 - SLIDE 51IS 240 – Spring 2011
INEX 2002 metric #1
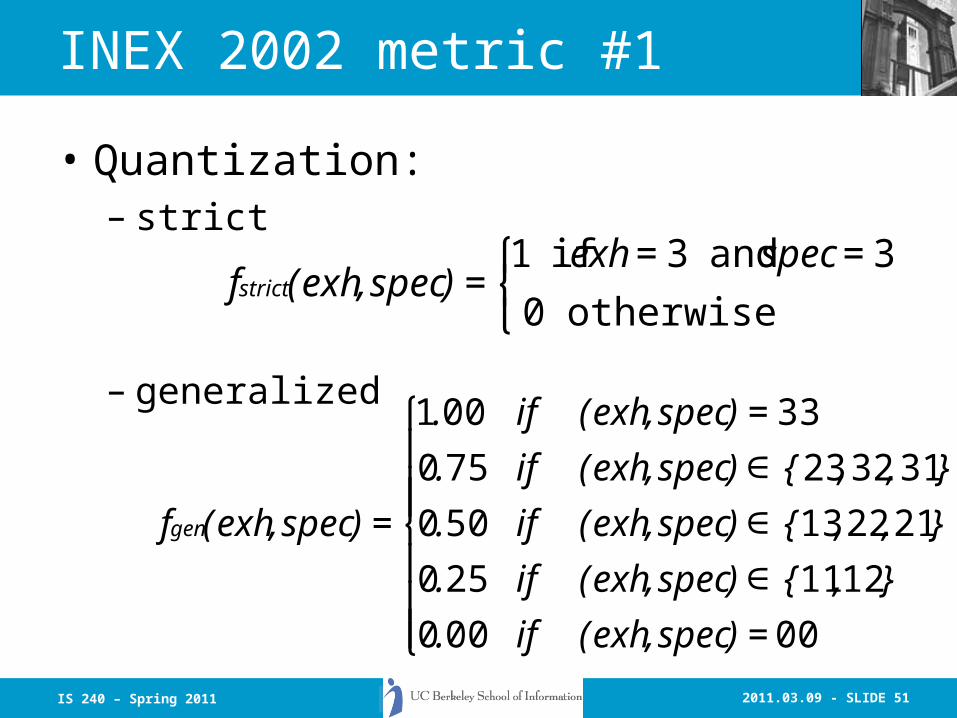
• Quantization: – strict
– generalized
€
fstrict(exh,spec) =1 if exh = 3 and spec = 3
0 otherwise
⎧ ⎨ ⎩
€
fgen(exh,spec) =
1.00 if (exh,spec) = 33
0.75 if (exh,spec)∈ {23,32,31}
0.50 if (exh,spec)∈ {13,22,21}
0.25 if (exh,spec)∈ {11,12}
0.00 if (exh,spec) = 00
⎧
⎨
⎪ ⎪ ⎪
⎩
⎪ ⎪ ⎪

2011.03.09 - SLIDE 52IS 240 – Spring 2011
P & R by degree of doc relevance
• Consider each “degree” or value of relevance separately, i.e. given the example scale above:– Highly Relevant = 3– Fairly Relevant = 2– Marginally Relevant = 1– Not Relevant = 0
• Documents judged at each degree are treated separately and P/R curves and averages done for each
2011.03.09 - SLIDE 53IS 240 – Spring 2011
Generalized P & R
• Instead of the ordinal scale above, the measures are mapped to a continuous scale between 0 and 1
• R is the set of retrieved documents from database D = {d1,d2,…,dN} for some query
• the documents have some relevance score r(di), which is a real number ranging from 0.0 to 1.0, with any number of intermediate points (i.e. 4 points in the previous examples)
• Then…
2011.03.09 - SLIDE 54IS 240 – Spring 2011
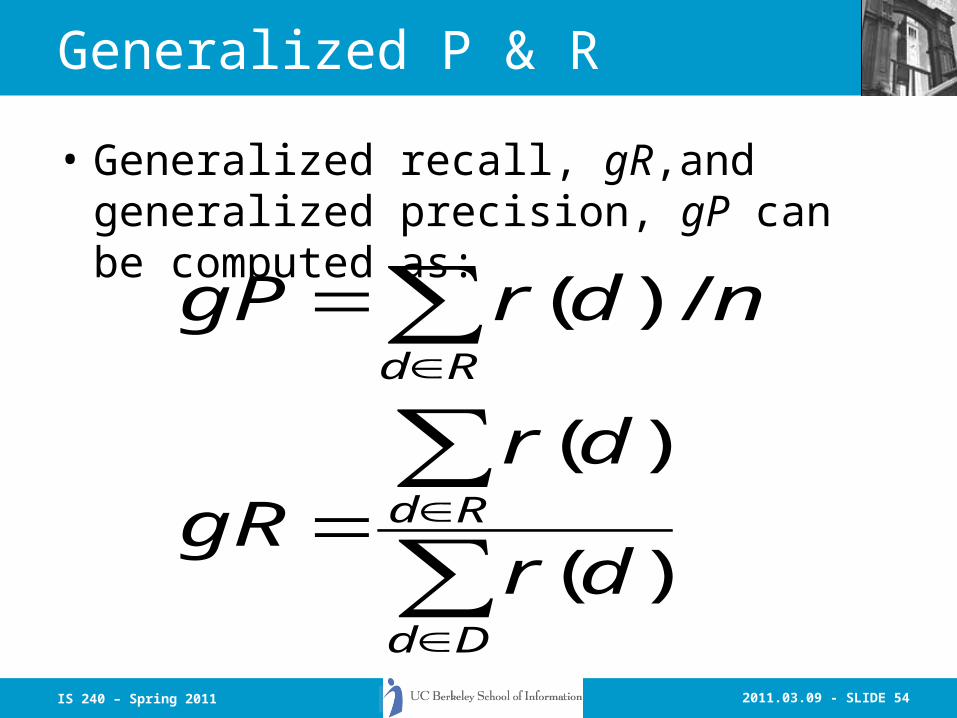
Generalized P & R
• Generalized recall, gR,and generalized precision, gP can be computed as:
∑∑
∑
∈
∈
∈
=
=
Dd
Rd
Rd
dr
drgR
ndrgP
)(
)(
/)(

2011.03.09 - SLIDE 55IS 240 – Spring 2011
Measures for Large-Scale Eval• Typical user behavior in web search
systems has shown a preference for high precision
• Also graded scales of relevance seem more useful than just “yes/no”
• Measures have been devised to help evaluate situations taking these into account

2011.03.09 - SLIDE 56IS 240 – Spring 2011
Cumulative Gain Measures
• Because real systems tend to overload users with result, and because users usually have some scale of relevance, then the most relevant item should be retrieved first
• Järvelin and Kekäläinen developed measures that attempt to estimate the cumulative relevance gain that the user receives by examining the retrieval results up to a given rank (TOIS 20(4), Oct 2002)

2011.03.09 - SLIDE 57IS 240 – Spring 2011
Cumulative Gain measures
• If we assume that highly relevant documents are more useful when appearing earlier in a result list (are ranked higher)
• And, highly relevant documents are more useful than marginally relevant documents, which are in turn more useful than non-relevant documents
• Then measures that take these factors into account would better reflect user needs
2011.03.09 - SLIDE 58IS 240 – Spring 2011
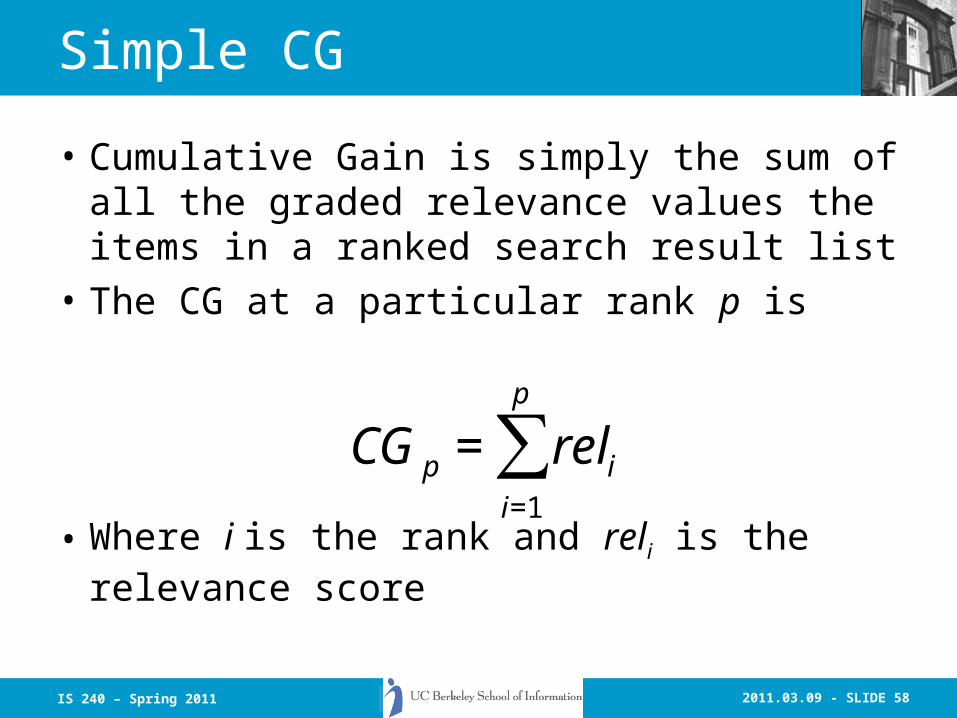
Simple CG
• Cumulative Gain is simply the sum of all the graded relevance values the items in a ranked search result list
• The CG at a particular rank p is
• Where i is the rank and reli is the relevance score
€
CGp = reli
i=1
p
∑

2011.03.09 - SLIDE 59IS 240 – Spring 2011
Discounted Cumulative Gain
• DCG measures the gain (usefulness) of a document based on its position in the result list– The gain is accumulated (like simple CG) with
the gain of each result discounted at lower ranks
• The idea is that highly relevant docs appearing lower in the search result should be penalized proportion to their position in the results
2011.03.09 - SLIDE 60IS 240 – Spring 2011
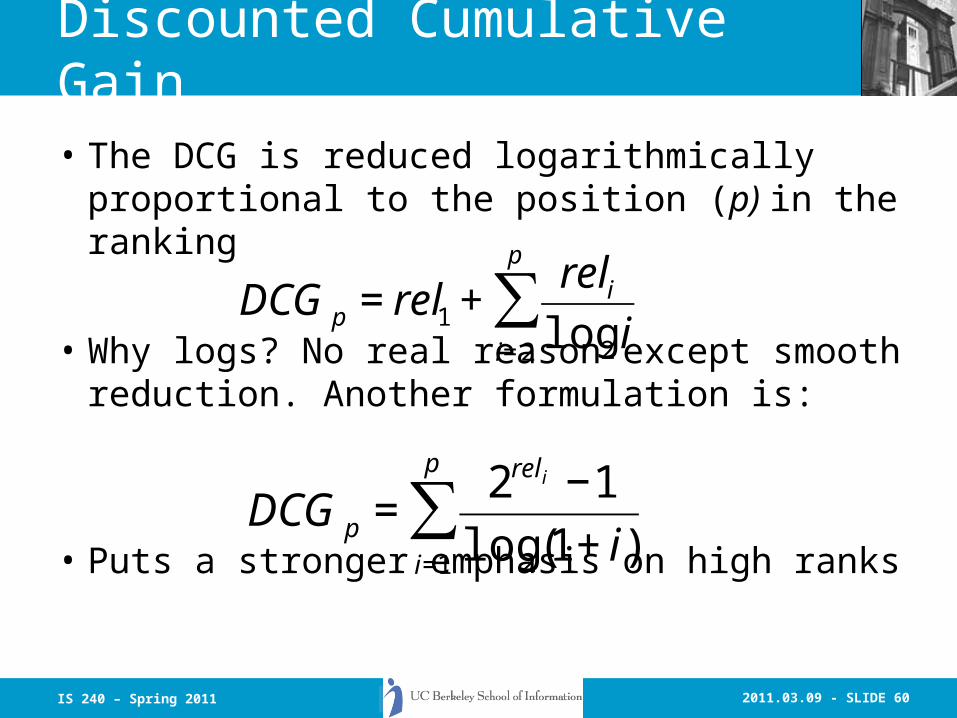
Discounted Cumulative Gain
• The DCG is reduced logarithmically proportional to the position (p) in the ranking
• Why logs? No real reason except smooth reduction. Another formulation is:
• Puts a stronger emphasis on high ranks
€
DCGp = rel1 +reli
log2 ii= 2
p
∑
€
DCGp =2rel i −1
log2(1+ i)i=1
p
∑

2011.03.09 - SLIDE 61IS 240 – Spring 2011
Normalized DCG
• Because search results lists vary in size depending on the query, comparing results across queries doesn’t work with DCG alone
• To do this DCG is normalized across the query set:– First create an “ideal” result by sorting the
result list by relevance score– Use that ideal value to create a normalized
DCG
2011.03.09 - SLIDE 62IS 240 – Spring 2011
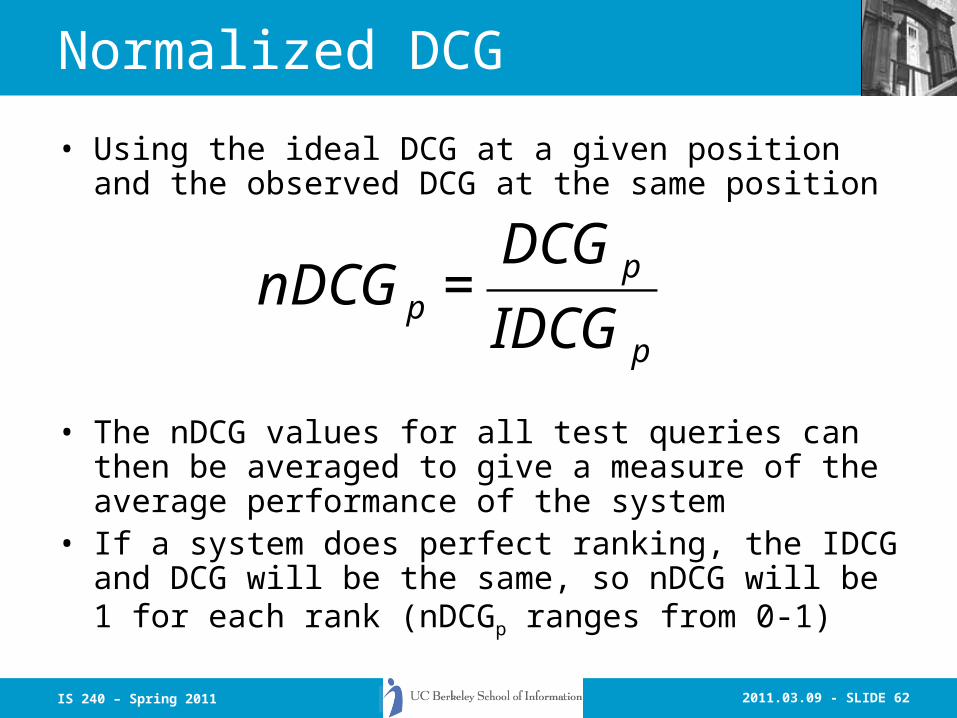
Normalized DCG
• Using the ideal DCG at a given position and the observed DCG at the same position
• The nDCG values for all test queries can then be averaged to give a measure of the average performance of the system
• If a system does perfect ranking, the IDCG and DCG will be the same, so nDCG will be 1 for each rank (nDCGp ranges from 0-1)€
nDCGp =DCGp
IDCGp

2011.03.09 - SLIDE 63IS 240 – Spring 2011
XCG
• XCG was developed for the INEX XML retrieval evaluation
• XCG uses graded relevance scoring instead of binary
• For XML retrieval it also takes into account “near misses” (like neighboring paragraphs, or paragraphs in a section when the section is considered relevant)
2011.03.09 - SLIDE 64IS 240 – Spring 2011
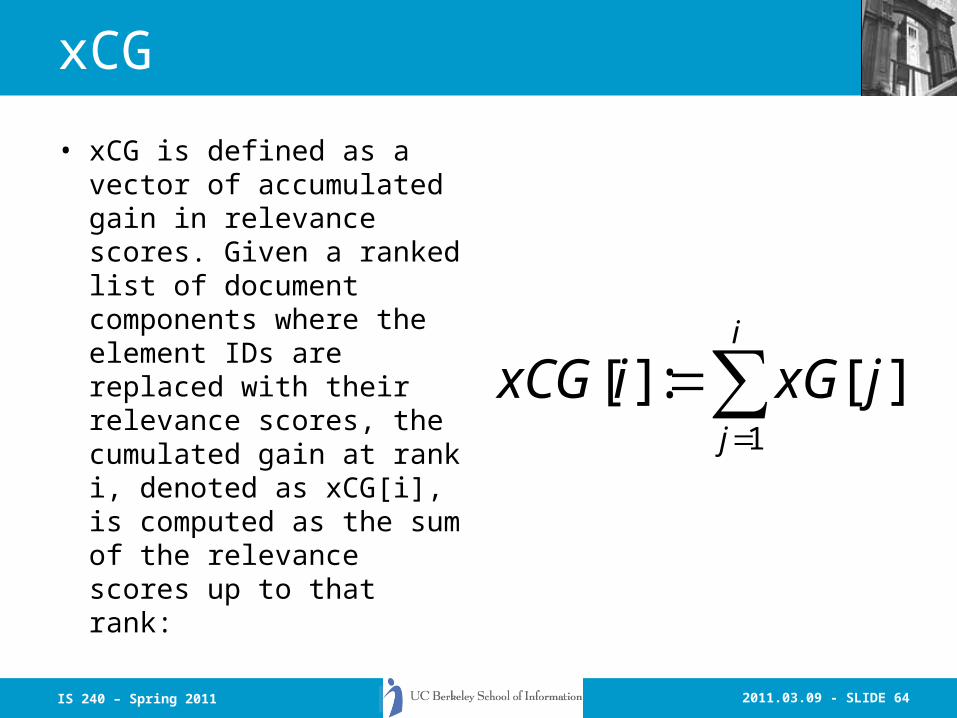
xCG
• xCG is defined as a vector of accumulated gain in relevance scores. Given a ranked list of document components where the element IDs are replaced with their relevance scores, the cumulated gain at rank i, denoted as xCG[i], is computed as the sum of the relevance scores up to that rank:
∑=
=i
j
jxGixCG1
][:][

2011.03.09 - SLIDE 65IS 240 – Spring 2011
xCG used like a normalized DCG

2011.03.09 - SLIDE 66IS 240 – Spring 2011
Next Time
• IR Components: Relevance Feedback