Embed Size (px)
Citation preview
2011 Hard Red Winter Wheat Regional Quality Survey
PGIPlains Grains Inc.
North Dakota Wheat Commissionwww.ndwheat.com
Washington Grain Commissionwww.washingtongrainalliance.com
Oregon Wheat Commissionwww.owgl.org
PGI Plains Grains Inc.
PGIPlains Grains Inc.
321B CITD, Stillwater, OK 74078Phone: (405) 744- 9333
[email protected] • www.plainsgrains.org
Colorado Wheat Administrative Committ eewww.coloradowheat.org
Kansas Wheat Commissionwww.kswheat.com
Montana Wheat & Barley Committ ewbc.agr.mt.gov
Nebraska Wheat Boardwww.nebraskawheat.com
Oklahoma Wheat Commissionwww.wheat.state.ok.us
South Dakota Wheat Commissionwww.sdwheat.org
Texas Wheat Producers Board and Associationwww.texaswheat.org
Wyoming Wheat Growers Associationwww.wyomingwheat.com

page 12011 Hard Red Winter Wheat Regional Quality Survey
Plains Grains, Inc., a non-profit, private quality based marketing initiative, was formed in 2004 through the Oklahoma Wheat Commission, the Oklahoma Department of Agriculture, Food and Forestry, the Oklahoma State University Division of Agricultural Sciences and Natural Resources.
PGI was designed to bridge the gap between wheat producers, grain companies and foreign and domestic flour millers to benefit all segments of the wheat industry.
PGI facilitates the appropriate wheat quality tracking needed to provide millers with the quality information they need to purchase U.S. wheat. While state data is important, it is critical to Plains Grains marketing goals to have quality data for the entire HRW wheat
production area. Each state may be able to produce the quality needed by foreign buyers, but it will take multiple states to achieve the critical mass needed to meet the quantity needs. By working together as
a region we can meet both quality and quantity demands.
In 2004, PGI’s crop quality survey included the Oklahoma HRW wheat crop. Designed as a regional marketing entity, PGI then brought five other HRW
wheat producing states on board for the crop quality survey in 2005.
Due to the welcome reception and success of PGI in the foreign marketplace, the entire Great Plains HRW wheat production region subscribed to the PGI crop quality survey in 2006.
Plains Grains, Inc.
PGI Plains Grains Inc.
PGIPlains Grains Inc.
Visit our web site at www.plainsgrains.org for up-to-date information, interactive maps, and more!
page 22011 Hard Red Winter Wheat Regional Quality Survey
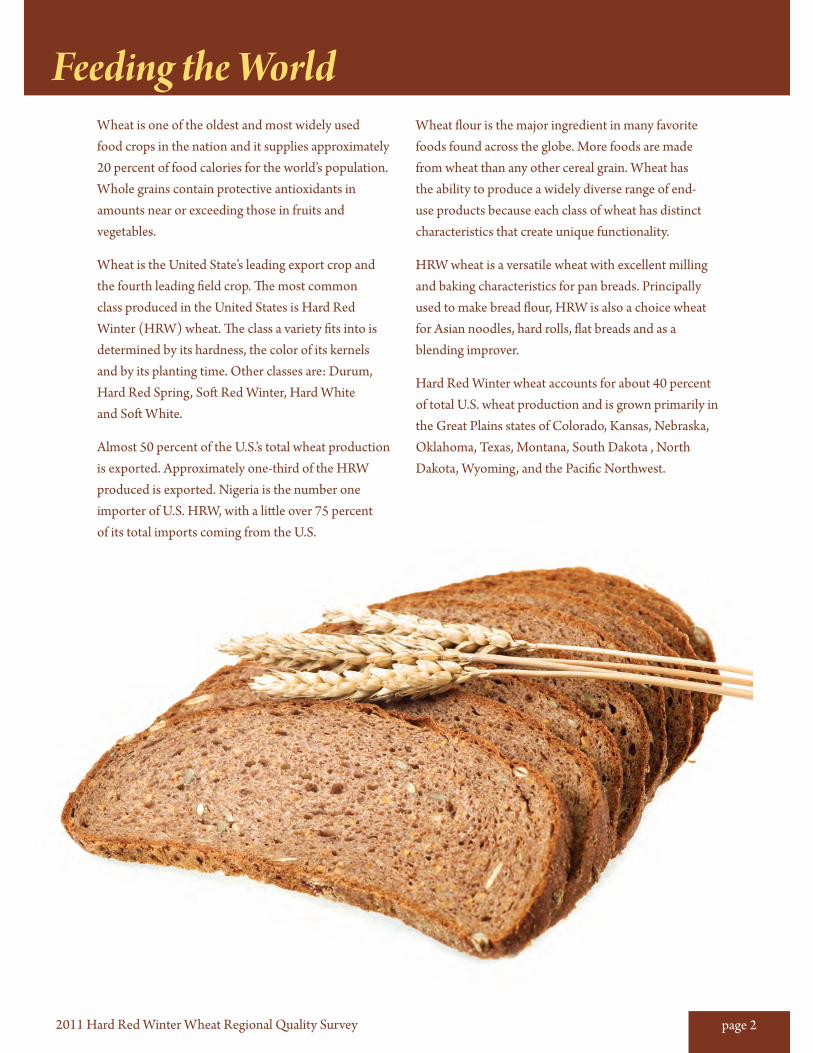
Wheat is one of the oldest and most widely used food crops in the nation and it supplies approximately 20 percent of food calories for the world’s population.Whole grains contain protective antioxidants in amounts near or exceeding those in fruits and vegetables.
Wheat is the United State’s leading export crop and the fourth leading field crop. The most common class produced in the United States is Hard Red Winter (HRW) wheat. The class a variety fits into is determined by its hardness, the color of its kernels and by its planting time. Other classes are: Durum, Hard Red Spring, Soft Red Winter, Hard White and Soft White.
Almost 50 percent of the U.S.’s total wheat production is exported. Approximately one-third of the HRW produced is exported. Nigeria is the number one importer of U.S. HRW, with a little over 75 percent of its total imports coming from the U.S.
Wheat flour is the major ingredient in many favorite foods found across the globe. More foods are made from wheat than any other cereal grain. Wheat has the ability to produce a widely diverse range of end-use products because each class of wheat has distinct characteristics that create unique functionality.
HRW wheat is a versatile wheat with excellent milling and baking characteristics for pan breads. Principally used to make bread flour, HRW is also a choice wheat for Asian noodles, hard rolls, flat breads and as a blending improver.
Hard Red Winter wheat accounts for about 40 percent of total U.S. wheat production and is grown primarily in the Great Plains states of Colorado, Kansas, Nebraska, Oklahoma, Texas, Montana, South Dakota , North Dakota, Wyoming, and the Pacific Northwest.
Feeding the World
page 32011 Hard Red Winter Wheat Regional Quality Survey
Wheat Major Classes
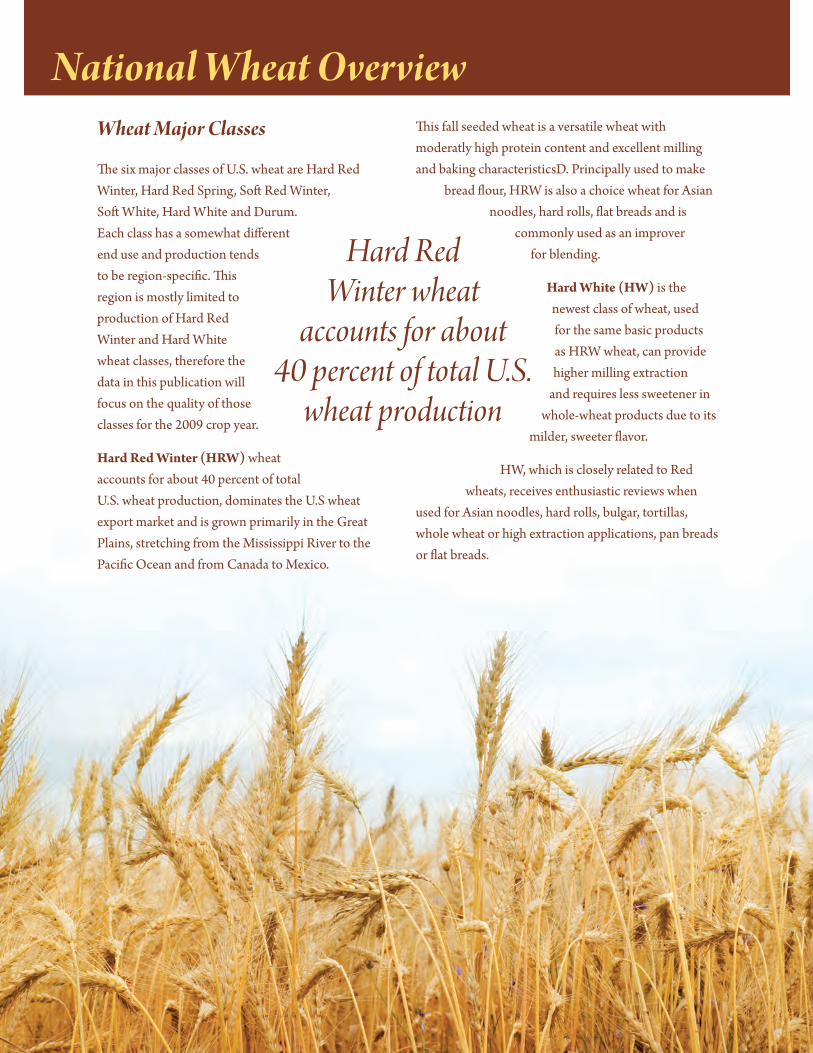
The six major classes of U.S. wheat are Hard Red Winter, Hard Red Spring, Soft Red Winter, Soft White, Hard White and Durum. Each class has a somewhat different end use and production tends to be region-specific. This region is mostly limited to production of Hard Red Winter and Hard White wheat classes, therefore the data in this publication will focus on the quality of those classes for the 2009 crop year.
Hard Red Winter (HRW) wheat accounts for about 40 percent of total U.S. wheat production, dominates the U.S wheat export market and is grown primarily in the Great Plains, stretching from the Mississippi River to the Pacific Ocean and from Canada to Mexico.
This fall seeded wheat is a versatile wheat with moderatly high protein content and excellent milling and baking characteristicsD. Principally used to make
bread flour, HRW is also a choice wheat for Asian noodles, hard rolls, flat breads and is
commonly used as an improver for blending.
Hard White (HW) is the newest class of wheat, used for the same basic products as HRW wheat, can provide higher milling extraction
and requires less sweetener in whole-wheat products due to its
milder, sweeter flavor.
HW, which is closely related to Red wheats, receives enthusiastic reviews when
used for Asian noodles, hard rolls, bulgar, tortillas, whole wheat or high extraction applications, pan breads or flat breads.
National Wheat Overview
Hard Red Winter wheat
accounts for about 40 percent of total U.S.
wheat production
page 42011 Hard Red Winter Wheat Regional Quality Survey
Crop Production Review and AnalysisWeather and HarvestThe 2011 Hard Red Winter (HRW) wheat crop could be characterized as one of contrast. The Southern Great Plains (middle of Kansas southward) is experiencing a drought of historical proportions. Texas, Southwest Oklahoma, and Southwest Kansas were particularly hard hit with total precipitation over the normal growing season of less 5% of normal over large areas. Most of that precipitation came in the fall at planting time which did allow for germination and emergence, but little moisture after that. Planting and emergence in these areas were within the 5 year average range, but moisture stress was observed soon after and continued to be an issue throughout the remainder of the growing season. In sharp contrast, wheat planted from central Kansas northward to Pacific Northwest was planted in a timely manner with early season condition reports ranging from fair in Colorado and Kansas to better than average in Montana. By late May areas of northern Colorado and Northern Kansas had started to receive timely moisture that proved to be beneficial to the crop while areas of the Northern Plains and Pacific Northwest were experiencing excessive moisture. By mid-July the northwestern production areas (Pacific Northwest) had excessive moisture give way to heat and high winds which stressed the crop.
Survey MethodsSample collection and analysis were conducted by the USDA ARS Hard Red Winter Wheat Quality Lab, Manhattan, Kansas, American Institute of Baking, and Plains Grains, Inc. A total of 473 samples were collected from grain elevators when the local harvest was at least 30% complete in Texas, Oklahoma, Colorado, Kansas, Nebraska, South Dakota, Wyoming, North Dakota, Montana, Washington and Oregon.
The area sampled represents approximately 80% of HRW production. Official grade and non-grade factors were determined on each individual sample and each resulting composite sample. Milling, dough functionality and bake tests were run on 101 composites based on 46 production areas and three protein ranges of <11.5%, 11.5% - 12.5%, and >12.5%. Results were then mathematically aggregated to represent Gulf-tributary, PNW-tributary, and Overall results. The analytical methods used are described in the Analysis Methods section of this booklet.
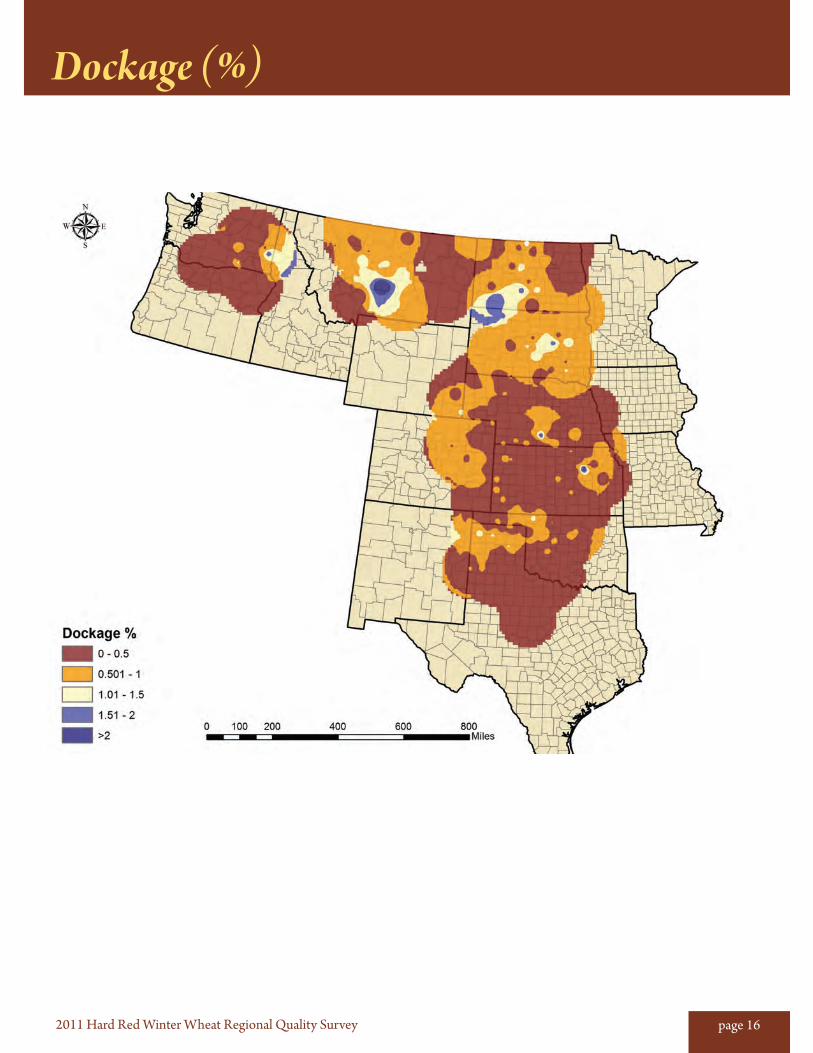
Wheat and Grade DataSeventy-two percent of individual samples graded US #1 and ninety-seven percent graded US #2 or better. Average dockage is 0.5%, damaged kernels and shrunken & broken kernels and total defects are all below the five-year averages while foreign material is equal to the five-year average. Kernel characteristics, including test weight (above the five-year average), thousand kernel weight (above the five-year average) and kernel diameter(above the five-year average), are very good considering the adverse growing conditions the crop developed under (moisture stress (high and low) and heat stress in the PNW).
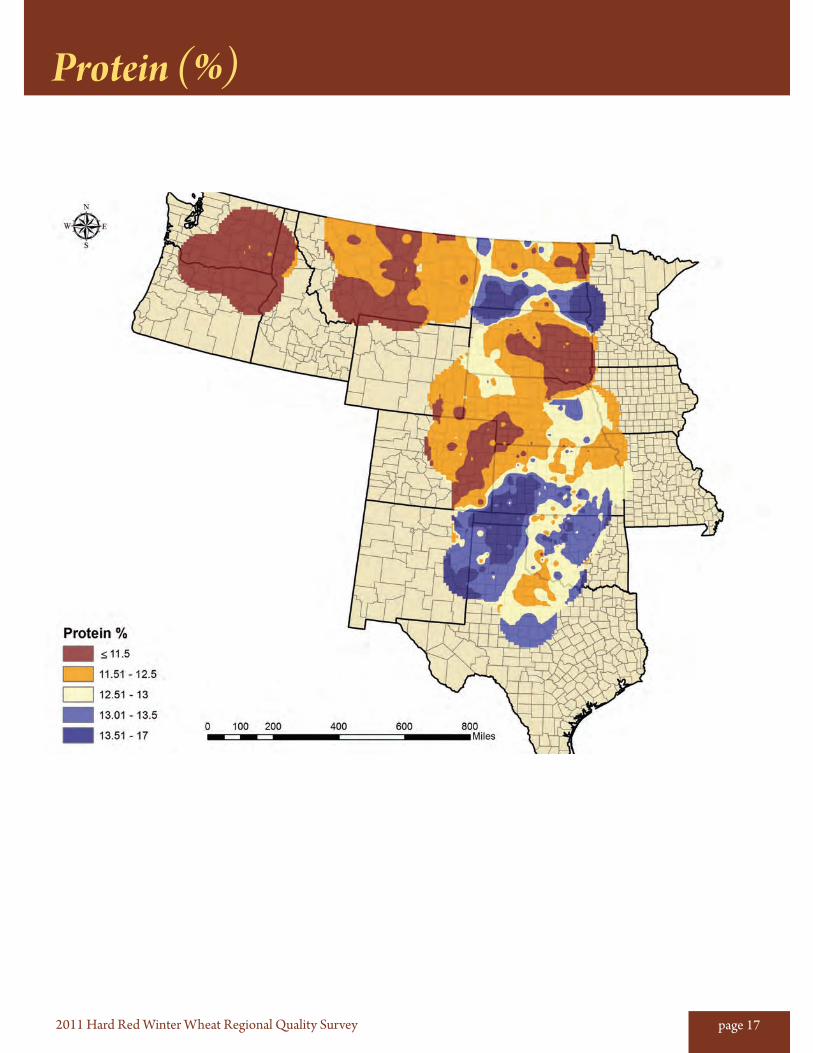
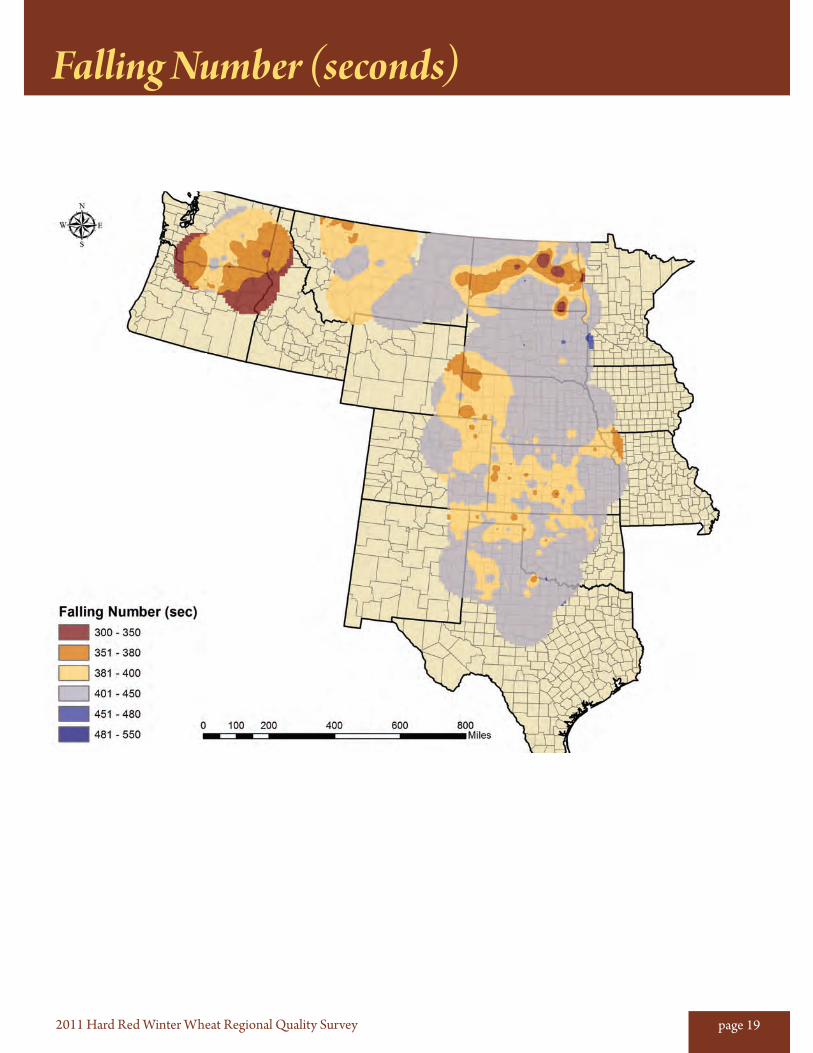
Growing conditions also favored protein accumulation in the grain. Protein content is 12.3% which is consistent with the five-year average and significantly higher than the 2010 crop of 11.8% protein. Forty percent of the crop is in excess of 12.5 % protein. While a majority of the protein was in southern half the US where precipitation was limited, northern areas exceeded the 2010 protein levels even with excessive precipitation. Moisture 10.8% is significantly lower than the five-year average of 11.2% and the falling number of 403 seconds indicates a sound crop.
page 52011 Hard Red Winter Wheat Regional Quality Survey
Crop Production Review and AnalysisFlour and Baking DataThe Buhler laboratory mill flour yield of (70.4%), while below the 2010 overall average of 70.9%, is similar to the five-year average of 70.3%. Flour protein averages 10.5%, which is below the five-year average, but is significantly higher than 2010. Farinograph peak time of 5.0 minutes is similar to the five-year average and is significantly higher than the 2010 average. Farinograph stability significantly exceeds the five-year average by over 3 minutes at 14.7 minutes. Farinograph absorption is lower than the five-year average, but significantly higher than the 2010 average. The average W value is equal to the five-year average. Loaf volume averages 804 cc, comparable to the 2010 crop, but below the five-year average of 831 cc.
SummaryThe 2011 HRW crop can be characterized as one with low dockage, very good kernel characteristics, in most cases exceeding the five-year average, has very good grain protein and is sound. It has good milling properties with flour extraction equal to the five-year average with similar to average flour protein content. Dough properties include very good stability with a peak time that equals the five-year average and a W value that compares to the five-year average.
A complete set of individual data, data broken out by protein level, tributary, histograms, charts and graphs was used to develop this analysis; that data set can be found at: http://www.plainsgrains.org/pdfs/wheat_quality_survey_22_2134523057.XLS or you can visit www.plainsgrains.org and select the “2011 Crop Analysis” link.
Hard Red Winter Wheat Production Charts
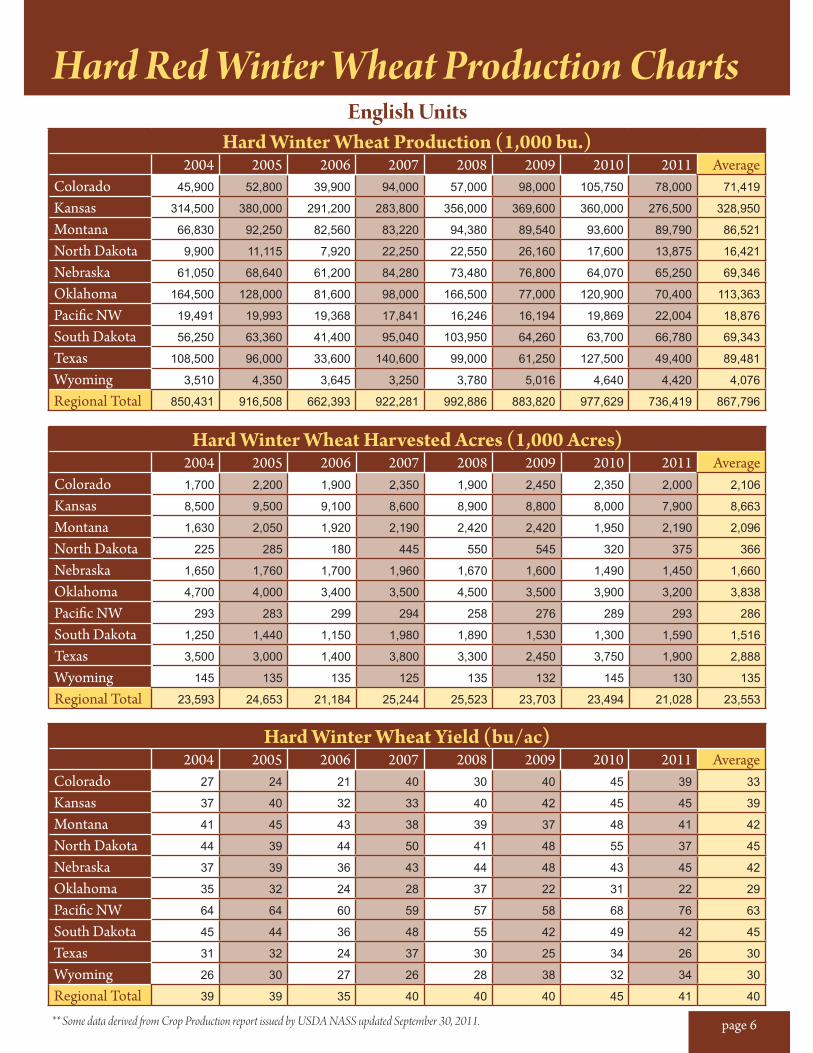
Hard Winter Wheat Production (1,000 bu.)2004 2005 2006 2007 2008 2009 2010 2011 Average
Colorado 45,900 52,800 39,900 94,000 57,000 98,000 105,750 78,000 71,419
Kansas 314,500 380,000 291,200 283,800 356,000 369,600 360,000 276,500 328,950
Montana 66,830 92,250 82,560 83,220 94,380 89,540 93,600 89,790 86,521
North Dakota 9,900 11,115 7,920 22,250 22,550 26,160 17,600 13,875 16,421
Nebraska 61,050 68,640 61,200 84,280 73,480 76,800 64,070 65,250 69,346
Oklahoma 164,500 128,000 81,600 98,000 166,500 77,000 120,900 70,400 113,363
Pacific NW 19,491 19,993 19,368 17,841 16,246 16,194 19,869 22,004 18,876
South Dakota 56,250 63,360 41,400 95,040 103,950 64,260 63,700 66,780 69,343
Texas 108,500 96,000 33,600 140,600 99,000 61,250 127,500 49,400 89,481
Wyoming 3,510 4,350 3,645 3,250 3,780 5,016 4,640 4,420 4,076
Regional Total 850,431 916,508 662,393 922,281 992,886 883,820 977,629 736,419 867,796
** Some data derived from Crop Production report issued by USDA NASS updated September 30, 2011.
English Units
Hard Winter Wheat Harvested Acres (1,000 Acres)2004 2005 2006 2007 2008 2009 2010 2011 Average
Colorado 1,700 2,200 1,900 2,350 1,900 2,450 2,350 2,000 2,106
Kansas 8,500 9,500 9,100 8,600 8,900 8,800 8,000 7,900 8,663
Montana 1,630 2,050 1,920 2,190 2,420 2,420 1,950 2,190 2,096
North Dakota 225 285 180 445 550 545 320 375 366
Nebraska 1,650 1,760 1,700 1,960 1,670 1,600 1,490 1,450 1,660
Oklahoma 4,700 4,000 3,400 3,500 4,500 3,500 3,900 3,200 3,838
Pacific NW 293 283 299 294 258 276 289 293 286
South Dakota 1,250 1,440 1,150 1,980 1,890 1,530 1,300 1,590 1,516
Texas 3,500 3,000 1,400 3,800 3,300 2,450 3,750 1,900 2,888
Wyoming 145 135 135 125 135 132 145 130 135
Regional Total 23,593 24,653 21,184 25,244 25,523 23,703 23,494 21,028 23,553
Hard Winter Wheat Yield (bu/ac)2004 2005 2006 2007 2008 2009 2010 2011 Average
Colorado 27 24 21 40 30 40 45 39 33
Kansas 37 40 32 33 40 42 45 45 39
Montana 41 45 43 38 39 37 48 41 42
North Dakota 44 39 44 50 41 48 55 37 45
Nebraska 37 39 36 43 44 48 43 45 42
Oklahoma 35 32 24 28 37 22 31 22 29
Pacific NW 64 64 60 59 57 58 68 76 63
South Dakota 45 44 36 48 55 42 49 42 45
Texas 31 32 24 37 30 25 34 26 30
Wyoming 26 30 27 26 28 38 32 34 30
Regional Total 39 39 35 40 40 40 45 41 40
page 6
Hard Red Winter Wheat Production Charts
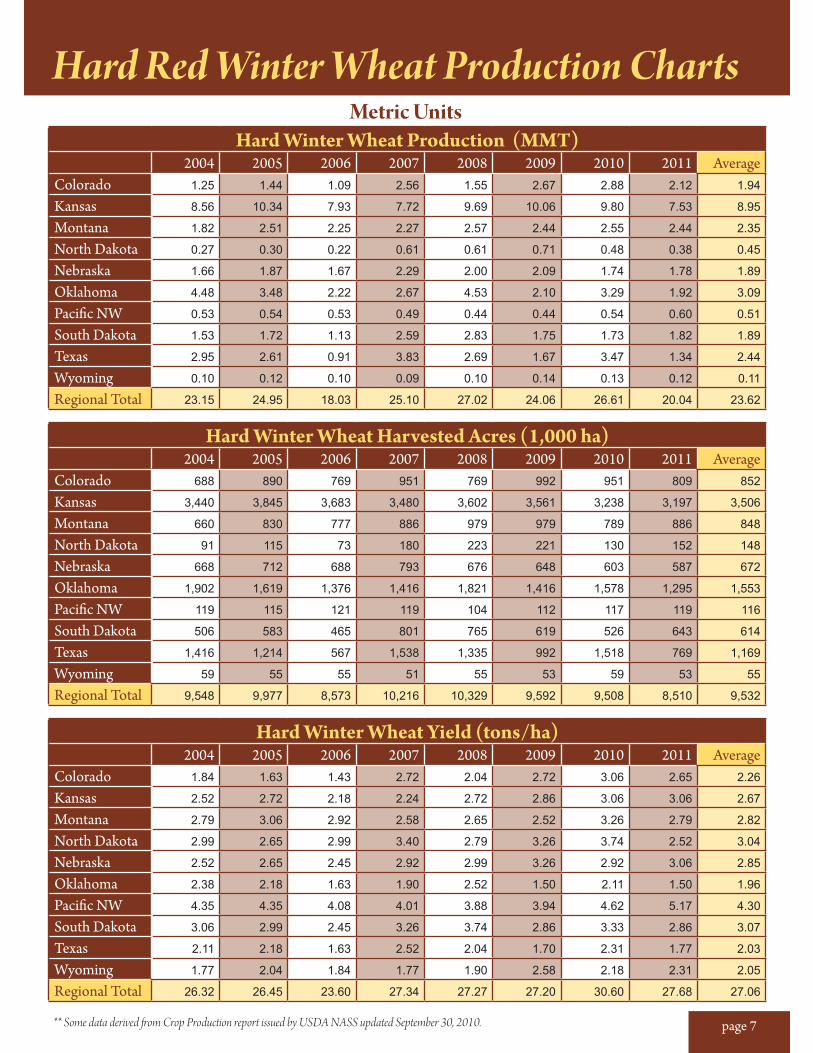
** Some data derived from Crop Production report issued by USDA NASS updated September 30, 2010.
Metric Units
Hard Winter Wheat Yield (tons/ha)2004 2005 2006 2007 2008 2009 2010 2011 Average
Colorado 1.84 1.63 1.43 2.72 2.04 2.72 3.06 2.65 2.26
Kansas 2.52 2.72 2.18 2.24 2.72 2.86 3.06 3.06 2.67
Montana 2.79 3.06 2.92 2.58 2.65 2.52 3.26 2.79 2.82
North Dakota 2.99 2.65 2.99 3.40 2.79 3.26 3.74 2.52 3.04
Nebraska 2.52 2.65 2.45 2.92 2.99 3.26 2.92 3.06 2.85
Oklahoma 2.38 2.18 1.63 1.90 2.52 1.50 2.11 1.50 1.96
Pacific NW 4.35 4.35 4.08 4.01 3.88 3.94 4.62 5.17 4.30
South Dakota 3.06 2.99 2.45 3.26 3.74 2.86 3.33 2.86 3.07
Texas 2.11 2.18 1.63 2.52 2.04 1.70 2.31 1.77 2.03
Wyoming 1.77 2.04 1.84 1.77 1.90 2.58 2.18 2.31 2.05
Regional Total 26.32 26.45 23.60 27.34 27.27 27.20 30.60 27.68 27.06
Hard Winter Wheat Harvested Acres (1,000 ha)2004 2005 2006 2007 2008 2009 2010 2011 Average
Colorado 688 890 769 951 769 992 951 809 852
Kansas 3,440 3,845 3,683 3,480 3,602 3,561 3,238 3,197 3,506
Montana 660 830 777 886 979 979 789 886 848
North Dakota 91 115 73 180 223 221 130 152 148
Nebraska 668 712 688 793 676 648 603 587 672
Oklahoma 1,902 1,619 1,376 1,416 1,821 1,416 1,578 1,295 1,553
Pacific NW 119 115 121 119 104 112 117 119 116
South Dakota 506 583 465 801 765 619 526 643 614
Texas 1,416 1,214 567 1,538 1,335 992 1,518 769 1,169
Wyoming 59 55 55 51 55 53 59 53 55
Regional Total 9,548 9,977 8,573 10,216 10,329 9,592 9,508 8,510 9,532
Hard Winter Wheat Production (MMT)2004 2005 2006 2007 2008 2009 2010 2011 Average
Colorado 1.25 1.44 1.09 2.56 1.55 2.67 2.88 2.12 1.94
Kansas 8.56 10.34 7.93 7.72 9.69 10.06 9.80 7.53 8.95
Montana 1.82 2.51 2.25 2.27 2.57 2.44 2.55 2.44 2.35
North Dakota 0.27 0.30 0.22 0.61 0.61 0.71 0.48 0.38 0.45
Nebraska 1.66 1.87 1.67 2.29 2.00 2.09 1.74 1.78 1.89
Oklahoma 4.48 3.48 2.22 2.67 4.53 2.10 3.29 1.92 3.09
Pacific NW 0.53 0.54 0.53 0.49 0.44 0.44 0.54 0.60 0.51
South Dakota 1.53 1.72 1.13 2.59 2.83 1.75 1.73 1.82 1.89
Texas 2.95 2.61 0.91 3.83 2.69 1.67 3.47 1.34 2.44
Wyoming 0.10 0.12 0.10 0.09 0.10 0.14 0.13 0.12 0.11
Regional Total 23.15 24.95 18.03 25.10 27.02 24.06 26.61 20.04 23.62
page 7
page 82011 Hard Red Winter Wheat Regional Quality Survey
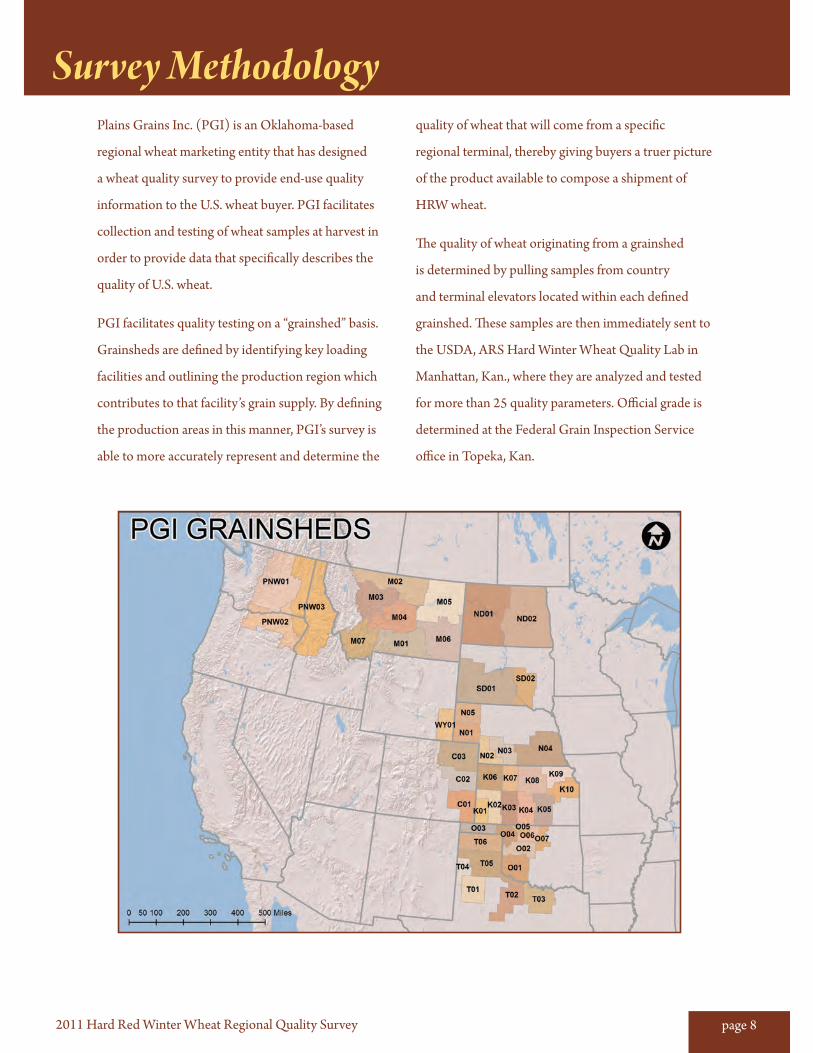
Plains Grains Inc. (PGI) is an Oklahoma-based
regional wheat marketing entity that has designed
a wheat quality survey to provide end-use quality
information to the U.S. wheat buyer. PGI facilitates
collection and testing of wheat samples at harvest in
order to provide data that specifically describes the
quality of U.S. wheat.
PGI facilitates quality testing on a “grainshed” basis.
Grainsheds are defined by identifying key loading
facilities and outlining the production region which
contributes to that facility’s grain supply. By defining
the production areas in this manner, PGI’s survey is
able to more accurately represent and determine the
quality of wheat that will come from a specific
regional terminal, thereby giving buyers a truer picture
of the product available to compose a shipment of
HRW wheat.
The quality of wheat originating from a grainshed
is determined by pulling samples from country
and terminal elevators located within each defined
grainshed. These samples are then immediately sent to
the USDA, ARS Hard Winter Wheat Quality Lab in
Manhattan, Kan., where they are analyzed and tested
for more than 25 quality parameters. Official grade is
determined at the Federal Grain Inspection Service
office in Topeka, Kan.
Survey Methodology
page 92011 Hard Red Winter Wheat Regional Quality Survey
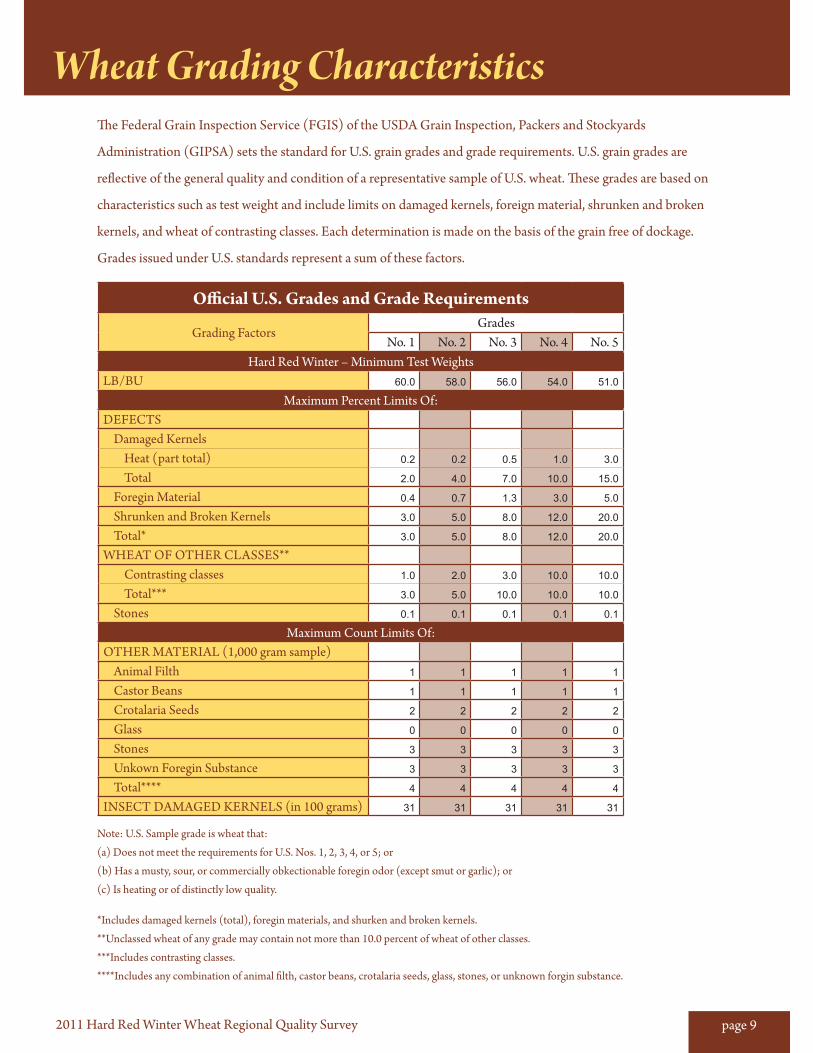
The Federal Grain Inspection Service (FGIS) of the USDA Grain Inspection, Packers and Stockyards
Administration (GIPSA) sets the standard for U.S. grain grades and grade requirements. U.S. grain grades are
reflective of the general quality and condition of a representative sample of U.S. wheat. These grades are based on
characteristics such as test weight and include limits on damaged kernels, foreign material, shrunken and broken
kernels, and wheat of contrasting classes. Each determination is made on the basis of the grain free of dockage.
Grades issued under U.S. standards represent a sum of these factors.
Note: U.S. Sample grade is wheat that:
(a) Does not meet the requirements for U.S. Nos. 1, 2, 3, 4, or 5; or
(b) Has a musty, sour, or commercially obkectionable foregin odor (except smut or garlic); or
(c) Is heating or of distinctly low quality.
*Includes damaged kernels (total), foregin materials, and shurken and broken kernels.
**Unclassed wheat of any grade may contain not more than 10.0 percent of wheat of other classes.
***Includes contrasting classes.
****Includes any combination of animal filth, castor beans, crotalaria seeds, glass, stones, or unknown forgin substance.
Wheat Grading Characteristics
Official U.S. Grades and Grade Requirements
Grading FactorsGrades
No. 1 No. 2 No. 3 No. 4 No. 5Hard Red Winter – Minimum Test Weights
LB/BU 60.0 58.0 56.0 54.0 51.0
Maximum Percent Limits Of:DEFECTS
Damaged KernelsHeat (part total) 0.2 0.2 0.5 1.0 3.0
Total 2.0 4.0 7.0 10.0 15.0
Foregin Material 0.4 0.7 1.3 3.0 5.0
Shrunken and Broken Kernels 3.0 5.0 8.0 12.0 20.0
Total* 3.0 5.0 8.0 12.0 20.0
WHEAT OF OTHER CLASSES**Contrasting classes 1.0 2.0 3.0 10.0 10.0
Total*** 3.0 5.0 10.0 10.0 10.0
Stones 0.1 0.1 0.1 0.1 0.1
Maximum Count Limits Of:OTHER MATERIAL (1,000 gram sample)
Animal Filth 1 1 1 1 1
Castor Beans 1 1 1 1 1
Crotalaria Seeds 2 2 2 2 2
Glass 0 0 0 0 0
Stones 3 3 3 3 3
Unkown Foregin Substance 3 3 3 3 3
Total**** 4 4 4 4 4
INSECT DAMAGED KERNELS (in 100 grams) 31 31 31 31 31
page 102011 Hard Red Winter Wheat Regional Quality Survey
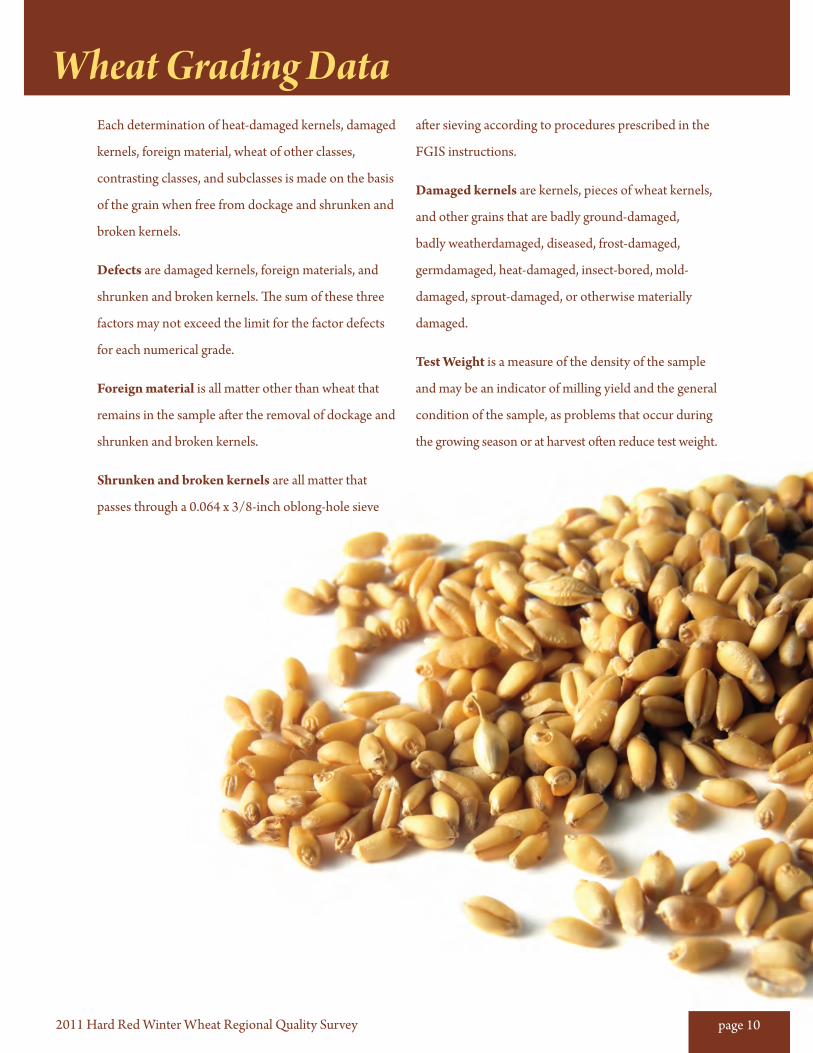
Each determination of heat-damaged kernels, damaged
kernels, foreign material, wheat of other classes,
contrasting classes, and subclasses is made on the basis
of the grain when free from dockage and shrunken and
broken kernels.
Defects are damaged kernels, foreign materials, and
shrunken and broken kernels. The sum of these three
factors may not exceed the limit for the factor defects
for each numerical grade.
Foreign material is all matter other than wheat that
remains in the sample after the removal of dockage and
shrunken and broken kernels.
Shrunken and broken kernels are all matter that
passes through a 0.064 x 3/8-inch oblong-hole sieve
after sieving according to procedures prescribed in the
FGIS instructions.
Damaged kernels are kernels, pieces of wheat kernels,
and other grains that are badly ground-damaged,
badly weatherdamaged, diseased, frost-damaged,
germdamaged, heat-damaged, insect-bored, mold-
damaged, sprout-damaged, or otherwise materially
damaged.
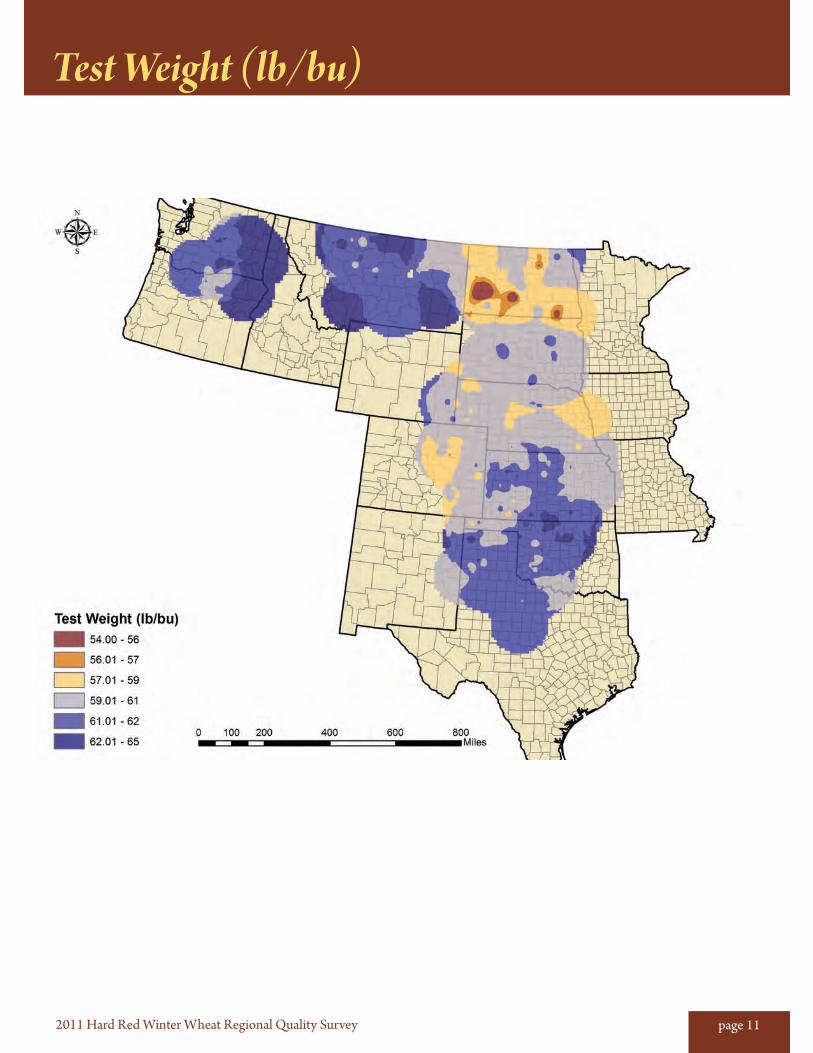
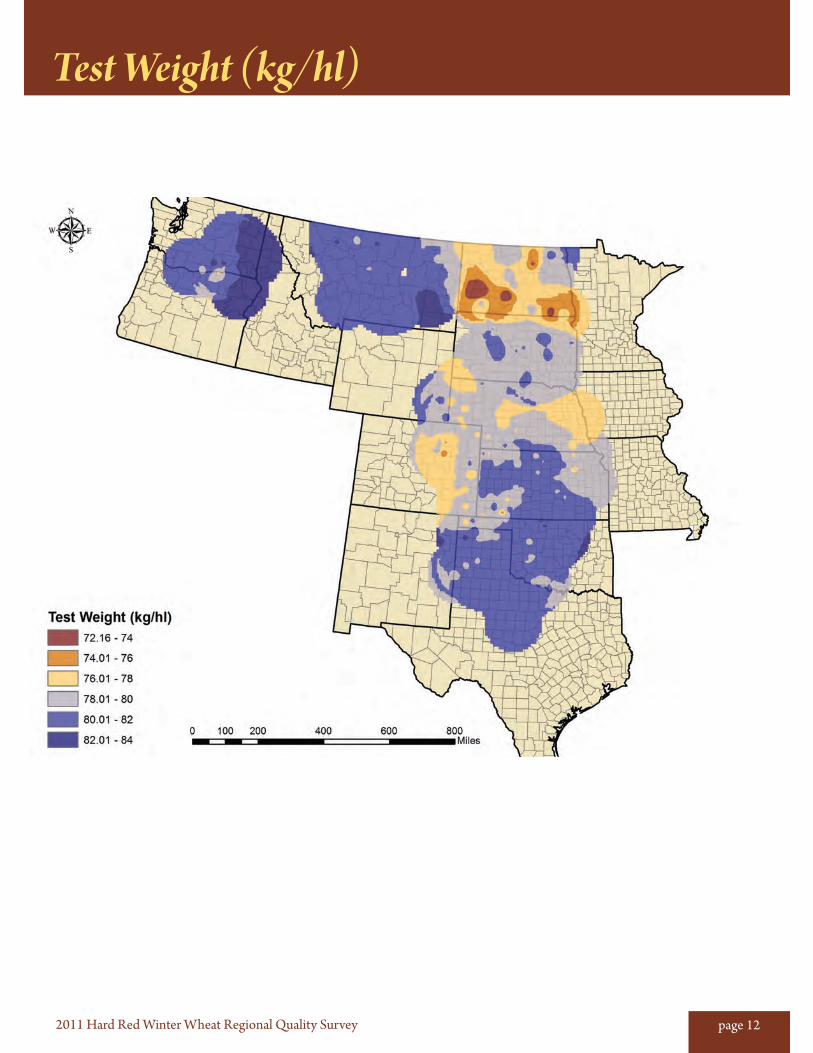
Test Weight is a measure of the density of the sample
and may be an indicator of milling yield and the general
condition of the sample, as problems that occur during
the growing season or at harvest often reduce test weight.
Wheat Grading Data
page 112011 Hard Red Winter Wheat Regional Quality Survey
Test Weight (lb/bu)
page 122011 Hard Red Winter Wheat Regional Quality Survey
Test Weight (kg/hl)
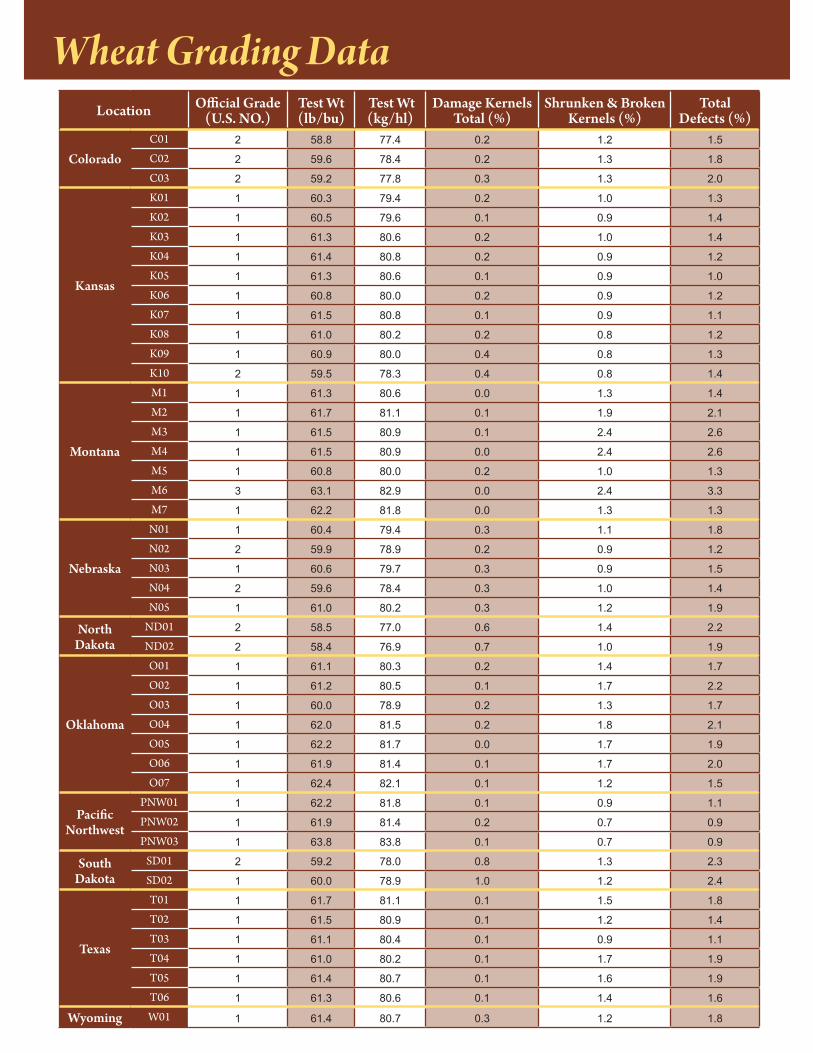
Wheat Grading DataLocation Official Grade
(U.S. NO.)Test Wt (lb/bu)
Test Wt (kg/hl)
Damage Kernels Total (%)
Shrunken & Broken Kernels (%)
Total Defects (%)
ColoradoC01 2 58.8 77.4 0.2 1.2 1.5
C02 2 59.6 78.4 0.2 1.3 1.8
C03 2 59.2 77.8 0.3 1.3 2.0
Kansas
K01 1 60.3 79.4 0.2 1.0 1.3
K02 1 60.5 79.6 0.1 0.9 1.4
K03 1 61.3 80.6 0.2 1.0 1.4
K04 1 61.4 80.8 0.2 0.9 1.2
K05 1 61.3 80.6 0.1 0.9 1.0
K06 1 60.8 80.0 0.2 0.9 1.2
K07 1 61.5 80.8 0.1 0.9 1.1
K08 1 61.0 80.2 0.2 0.8 1.2
K09 1 60.9 80.0 0.4 0.8 1.3
K10 2 59.5 78.3 0.4 0.8 1.4
Montana
M1 1 61.3 80.6 0.0 1.3 1.4
M2 1 61.7 81.1 0.1 1.9 2.1
M3 1 61.5 80.9 0.1 2.4 2.6
M4 1 61.5 80.9 0.0 2.4 2.6
M5 1 60.8 80.0 0.2 1.0 1.3
M6 3 63.1 82.9 0.0 2.4 3.3
M7 1 62.2 81.8 0.0 1.3 1.3
Nebraska
N01 1 60.4 79.4 0.3 1.1 1.8
N02 2 59.9 78.9 0.2 0.9 1.2
N03 1 60.6 79.7 0.3 0.9 1.5
N04 2 59.6 78.4 0.3 1.0 1.4
N05 1 61.0 80.2 0.3 1.2 1.9
North Dakota
ND01 2 58.5 77.0 0.6 1.4 2.2
ND02 2 58.4 76.9 0.7 1.0 1.9
Oklahoma
O01 1 61.1 80.3 0.2 1.4 1.7
O02 1 61.2 80.5 0.1 1.7 2.2
O03 1 60.0 78.9 0.2 1.3 1.7
O04 1 62.0 81.5 0.2 1.8 2.1
O05 1 62.2 81.7 0.0 1.7 1.9
O06 1 61.9 81.4 0.1 1.7 2.0
O07 1 62.4 82.1 0.1 1.2 1.5
Pacific Northwest
PNW01 1 62.2 81.8 0.1 0.9 1.1
PNW02 1 61.9 81.4 0.2 0.7 0.9
PNW03 1 63.8 83.8 0.1 0.7 0.9
South Dakota
SD01 2 59.2 78.0 0.8 1.3 2.3
SD02 1 60.0 78.9 1.0 1.2 2.4
Texas
T01 1 61.7 81.1 0.1 1.5 1.8
T02 1 61.5 80.9 0.1 1.2 1.4
T03 1 61.1 80.4 0.1 0.9 1.1
T04 1 61.0 80.2 0.1 1.7 1.9
T05 1 61.4 80.7 0.1 1.6 1.9
T06 1 61.3 80.6 0.1 1.4 1.6
Wyoming W01 1 61.4 80.7 0.3 1.2 1.8
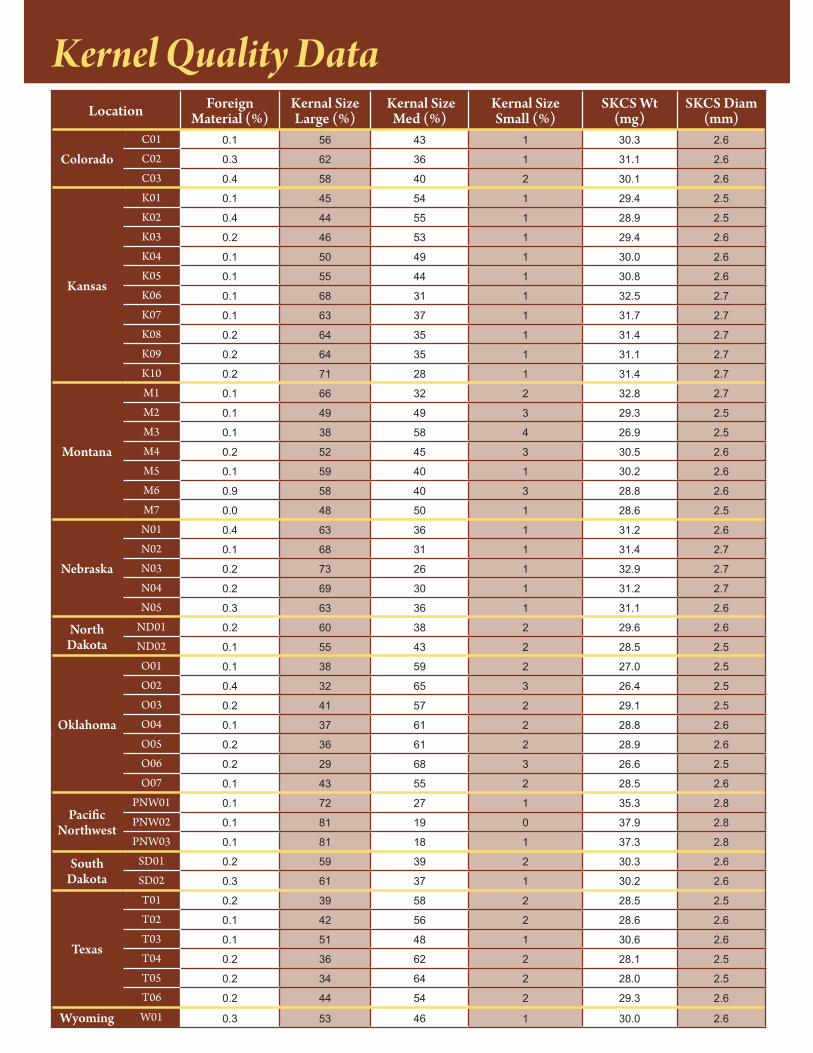
Kernel Quality DataLocation Foreign
Material (%)Kernal Size Large (%)
Kernal Size Med (%)
Kernal Size Small (%)
SKCS Wt (mg)
SKCS Diam (mm)
ColoradoC01 0.1 56 43 1 30.3 2.6
C02 0.3 62 36 1 31.1 2.6
C03 0.4 58 40 2 30.1 2.6
Kansas
K01 0.1 45 54 1 29.4 2.5
K02 0.4 44 55 1 28.9 2.5
K03 0.2 46 53 1 29.4 2.6
K04 0.1 50 49 1 30.0 2.6
K05 0.1 55 44 1 30.8 2.6
K06 0.1 68 31 1 32.5 2.7
K07 0.1 63 37 1 31.7 2.7
K08 0.2 64 35 1 31.4 2.7
K09 0.2 64 35 1 31.1 2.7
K10 0.2 71 28 1 31.4 2.7
Montana
M1 0.1 66 32 2 32.8 2.7
M2 0.1 49 49 3 29.3 2.5
M3 0.1 38 58 4 26.9 2.5
M4 0.2 52 45 3 30.5 2.6
M5 0.1 59 40 1 30.2 2.6
M6 0.9 58 40 3 28.8 2.6
M7 0.0 48 50 1 28.6 2.5
Nebraska
N01 0.4 63 36 1 31.2 2.6
N02 0.1 68 31 1 31.4 2.7
N03 0.2 73 26 1 32.9 2.7
N04 0.2 69 30 1 31.2 2.7
N05 0.3 63 36 1 31.1 2.6
North Dakota
ND01 0.2 60 38 2 29.6 2.6
ND02 0.1 55 43 2 28.5 2.5
Oklahoma
O01 0.1 38 59 2 27.0 2.5
O02 0.4 32 65 3 26.4 2.5
O03 0.2 41 57 2 29.1 2.5
O04 0.1 37 61 2 28.8 2.6
O05 0.2 36 61 2 28.9 2.6
O06 0.2 29 68 3 26.6 2.5
O07 0.1 43 55 2 28.5 2.6
Pacific Northwest
PNW01 0.1 72 27 1 35.3 2.8
PNW02 0.1 81 19 0 37.9 2.8
PNW03 0.1 81 18 1 37.3 2.8
South Dakota
SD01 0.2 59 39 2 30.3 2.6
SD02 0.3 61 37 1 30.2 2.6
Texas
T01 0.2 39 58 2 28.5 2.5
T02 0.1 42 56 2 28.6 2.6
T03 0.1 51 48 1 30.6 2.6
T04 0.2 36 62 2 28.1 2.5
T05 0.2 34 64 2 28.0 2.5
T06 0.2 44 54 2 29.3 2.6
Wyoming W01 0.3 53 46 1 30.0 2.6
page 152011 Hard Red Winter Wheat Regional Quality Survey
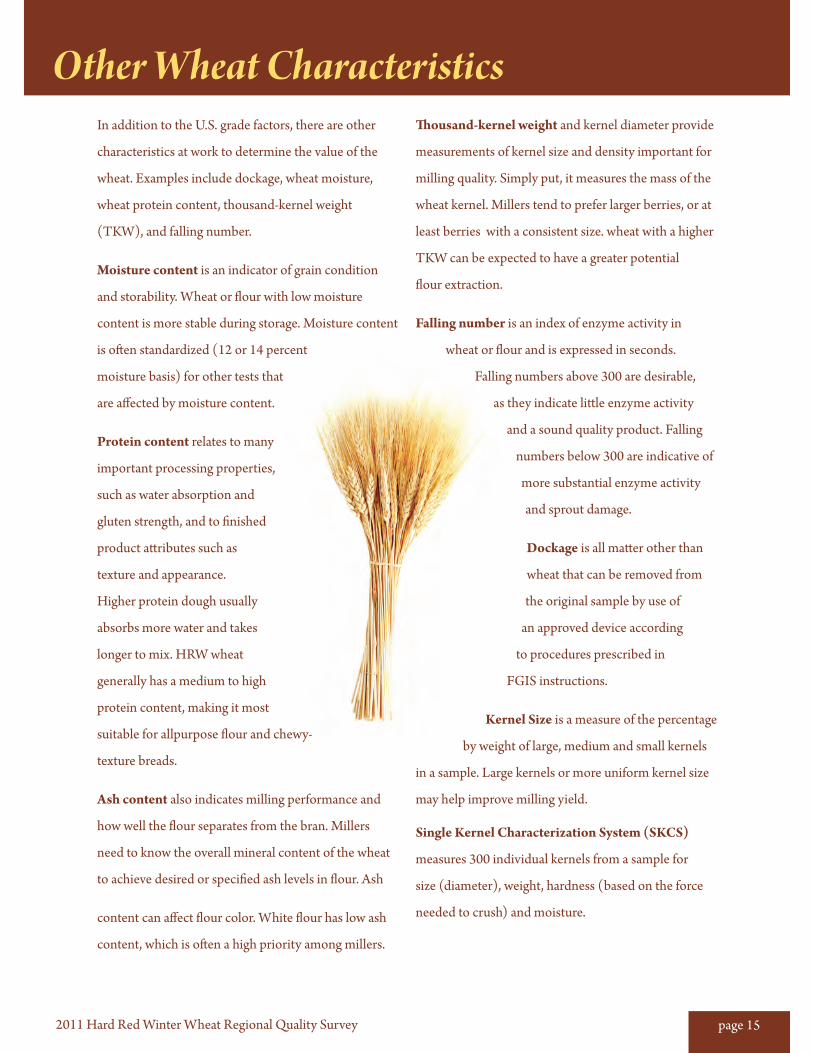
In addition to the U.S. grade factors, there are other
characteristics at work to determine the value of the
wheat. Examples include dockage, wheat moisture,
wheat protein content, thousand-kernel weight
(TKW), and falling number.
Moisture content is an indicator of grain condition
and storability. Wheat or flour with low moisture
content is more stable during storage. Moisture content
is often standardized (12 or 14 percent
moisture basis) for other tests that
are affected by moisture content.
Protein content relates to many
important processing properties,
such as water absorption and
gluten strength, and to finished
product attributes such as
texture and appearance.
Higher protein dough usually
absorbs more water and takes
longer to mix. HRW wheat
generally has a medium to high
protein content, making it most
suitable for allpurpose flour and chewy-
texture breads.
Ash content also indicates milling performance and
how well the flour separates from the bran. Millers
need to know the overall mineral content of the wheat
to achieve desired or specified ash levels in flour. Ash
content can affect flour color. White flour has low ash
content, which is often a high priority among millers.
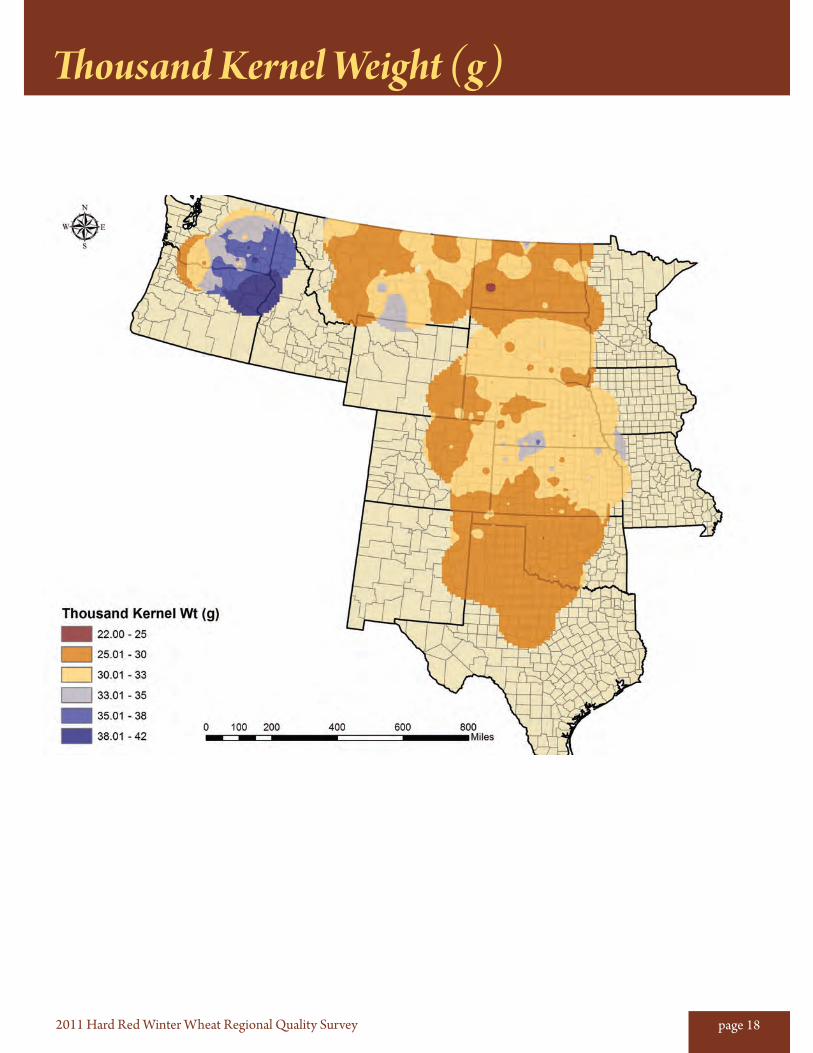
Thousand-kernel weight and kernel diameter provide
measurements of kernel size and density important for
milling quality. Simply put, it measures the mass of the
wheat kernel. Millers tend to prefer larger berries, or at
least berries with a consistent size. wheat with a higher
TKW can be expected to have a greater potential
flour extraction.
Falling number is an index of enzyme activity in
wheat or flour and is expressed in seconds.
Falling numbers above 300 are desirable,
as they indicate little enzyme activity
and a sound quality product. Falling
numbers below 300 are indicative of
more substantial enzyme activity
and sprout damage.
Dockage is all matter other than
wheat that can be removed from
the original sample by use of
an approved device according
to procedures prescribed in
FGIS instructions.
Kernel Size is a measure of the percentage
by weight of large, medium and small kernels
in a sample. Large kernels or more uniform kernel size
may help improve milling yield.
Single Kernel Characterization System (SKCS)
measures 300 individual kernels from a sample for
size (diameter), weight, hardness (based on the force
needed to crush) and moisture.
Other Wheat Characteristics
page 162011 Hard Red Winter Wheat Regional Quality Survey
Dockage (%)
page 172011 Hard Red Winter Wheat Regional Quality Survey
Protein (%)
page 182011 Hard Red Winter Wheat Regional Quality Survey
Thousand Kernel Weight (g)
page 192011 Hard Red Winter Wheat Regional Quality Survey
Falling Number (seconds)
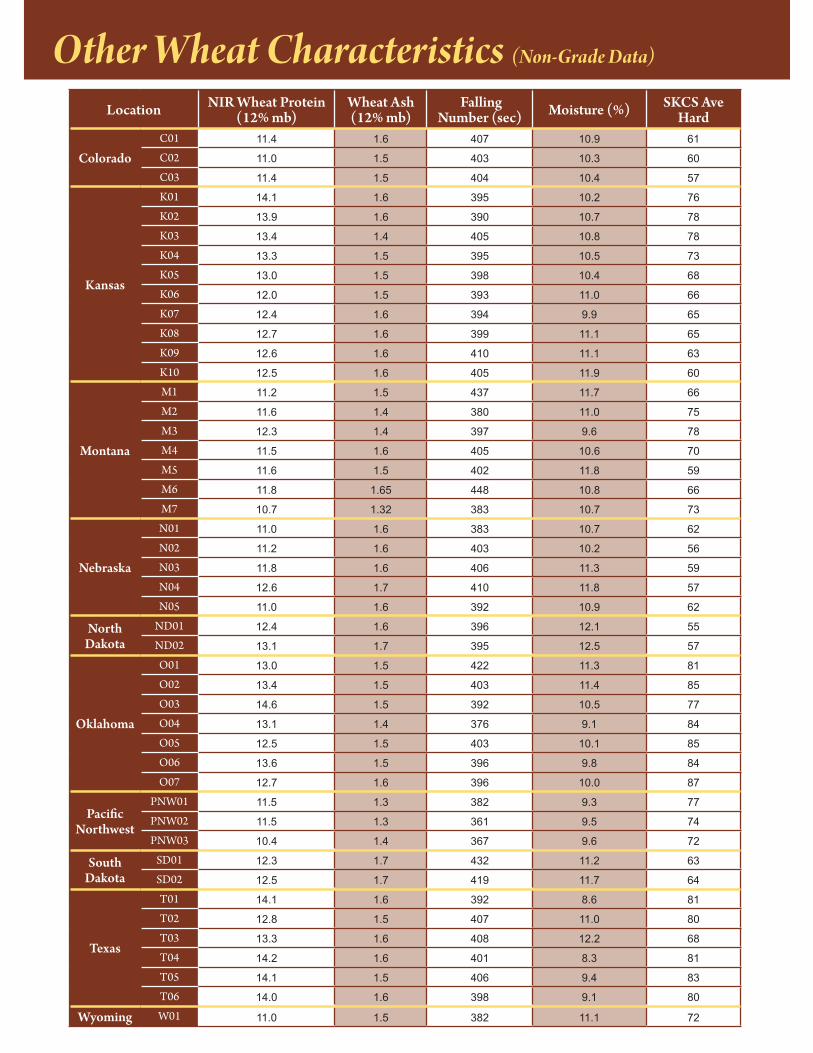
Other Wheat Characteristics (Non-Grade Data)
Location NIR Wheat Protein (12% mb)
Wheat Ash (12% mb)
Falling Number (sec) Moisture (%) SKCS Ave
Hard
ColoradoC01 11.4 1.6 407 10.9 61
C02 11.0 1.5 403 10.3 60
C03 11.4 1.5 404 10.4 57
Kansas
K01 14.1 1.6 395 10.2 76
K02 13.9 1.6 390 10.7 78
K03 13.4 1.4 405 10.8 78
K04 13.3 1.5 395 10.5 73
K05 13.0 1.5 398 10.4 68
K06 12.0 1.5 393 11.0 66
K07 12.4 1.6 394 9.9 65
K08 12.7 1.6 399 11.1 65
K09 12.6 1.6 410 11.1 63
K10 12.5 1.6 405 11.9 60
Montana
M1 11.2 1.5 437 11.7 66
M2 11.6 1.4 380 11.0 75
M3 12.3 1.4 397 9.6 78
M4 11.5 1.6 405 10.6 70
M5 11.6 1.5 402 11.8 59
M6 11.8 1.65 448 10.8 66
M7 10.7 1.32 383 10.7 73
Nebraska
N01 11.0 1.6 383 10.7 62
N02 11.2 1.6 403 10.2 56
N03 11.8 1.6 406 11.3 59
N04 12.6 1.7 410 11.8 57
N05 11.0 1.6 392 10.9 62
North Dakota
ND01 12.4 1.6 396 12.1 55
ND02 13.1 1.7 395 12.5 57
Oklahoma
O01 13.0 1.5 422 11.3 81
O02 13.4 1.5 403 11.4 85
O03 14.6 1.5 392 10.5 77
O04 13.1 1.4 376 9.1 84
O05 12.5 1.5 403 10.1 85
O06 13.6 1.5 396 9.8 84
O07 12.7 1.6 396 10.0 87
Pacific Northwest
PNW01 11.5 1.3 382 9.3 77
PNW02 11.5 1.3 361 9.5 74
PNW03 10.4 1.4 367 9.6 72
South Dakota
SD01 12.3 1.7 432 11.2 63
SD02 12.5 1.7 419 11.7 64
Texas
T01 14.1 1.6 392 8.6 81
T02 12.8 1.5 407 11.0 80
T03 13.3 1.6 408 12.2 68
T04 14.2 1.6 401 8.3 81
T05 14.1 1.5 406 9.4 83
T06 14.0 1.6 398 9.1 80
Wyoming W01 11.0 1.5 382 11.1 72
page 212011 Hard Red Winter Wheat Regional Quality Survey
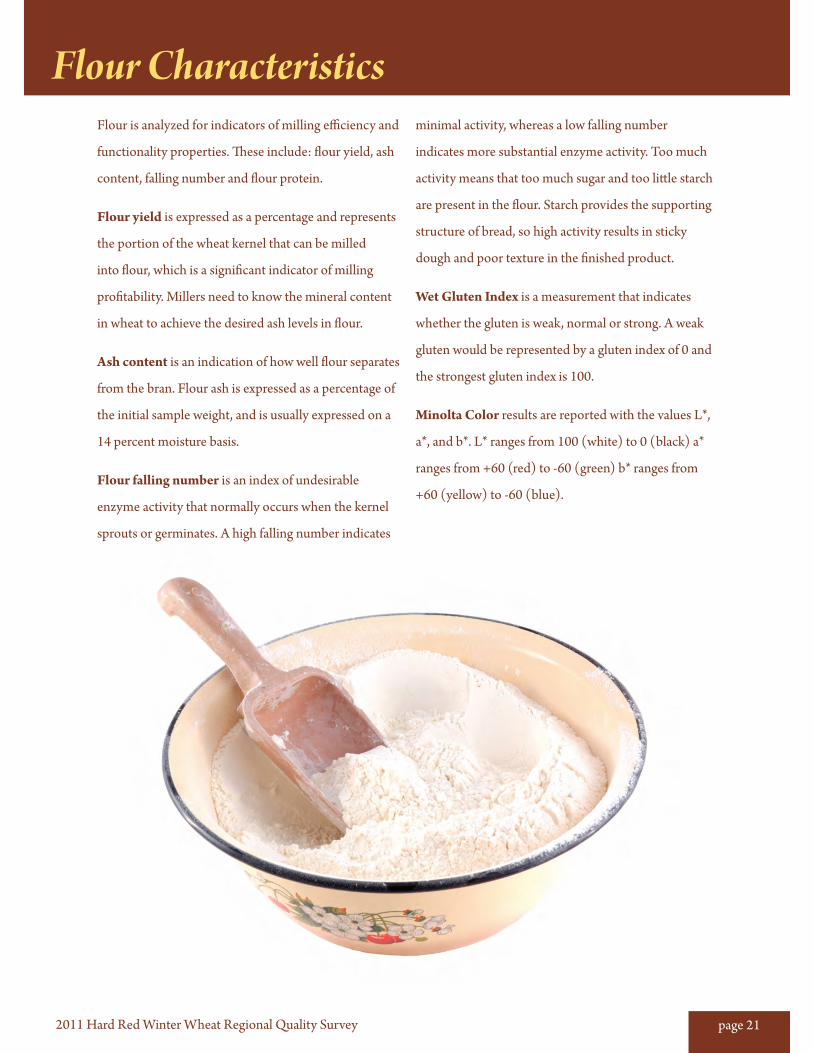
Flour is analyzed for indicators of milling efficiency and
functionality properties. These include: flour yield, ash
content, falling number and flour protein.
Flour yield is expressed as a percentage and represents
the portion of the wheat kernel that can be milled
into flour, which is a significant indicator of milling
profitability. Millers need to know the mineral content
in wheat to achieve the desired ash levels in flour.
Ash content is an indication of how well flour separates
from the bran. Flour ash is expressed as a percentage of
the initial sample weight, and is usually expressed on a
14 percent moisture basis.
Flour falling number is an index of undesirable
enzyme activity that normally occurs when the kernel
sprouts or germinates. A high falling number indicates
minimal activity, whereas a low falling number
indicates more substantial enzyme activity. Too much
activity means that too much sugar and too little starch
are present in the flour. Starch provides the supporting
structure of bread, so high activity results in sticky
dough and poor texture in the finished product.
Wet Gluten Index is a measurement that indicates
whether the gluten is weak, normal or strong. A weak
gluten would be represented by a gluten index of 0 and
the strongest gluten index is 100.
Minolta Color results are reported with the values L*,
a*, and b*. L* ranges from 100 (white) to 0 (black) a*
ranges from +60 (red) to -60 (green) b* ranges from
+60 (yellow) to -60 (blue).
Flour Characteristics
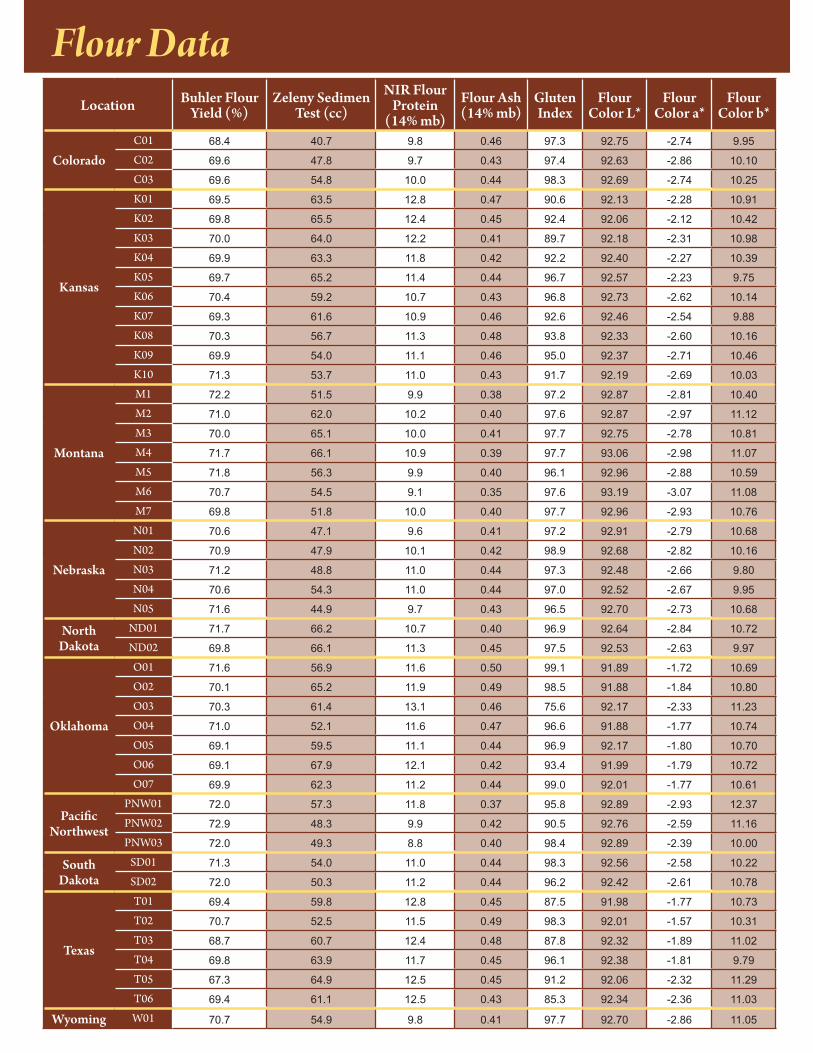
Flour DataLocation Buhler Flour
Yield (%)Zeleny Sedimen
Test (cc)NIR Flour
Protein (14% mb)
Flour Ash (14% mb)
Gluten Index
Flour Color L*
Flour Color a*
Flour Color b*
ColoradoC01 68.4 40.7 9.8 0.46 97.3 92.75 -2.74 9.95
C02 69.6 47.8 9.7 0.43 97.4 92.63 -2.86 10.10
C03 69.6 54.8 10.0 0.44 98.3 92.69 -2.74 10.25
Kansas
K01 69.5 63.5 12.8 0.47 90.6 92.13 -2.28 10.91
K02 69.8 65.5 12.4 0.45 92.4 92.06 -2.12 10.42
K03 70.0 64.0 12.2 0.41 89.7 92.18 -2.31 10.98
K04 69.9 63.3 11.8 0.42 92.2 92.40 -2.27 10.39
K05 69.7 65.2 11.4 0.44 96.7 92.57 -2.23 9.75
K06 70.4 59.2 10.7 0.43 96.8 92.73 -2.62 10.14
K07 69.3 61.6 10.9 0.46 92.6 92.46 -2.54 9.88
K08 70.3 56.7 11.3 0.48 93.8 92.33 -2.60 10.16
K09 69.9 54.0 11.1 0.46 95.0 92.37 -2.71 10.46
K10 71.3 53.7 11.0 0.43 91.7 92.19 -2.69 10.03
Montana
M1 72.2 51.5 9.9 0.38 97.2 92.87 -2.81 10.40
M2 71.0 62.0 10.2 0.40 97.6 92.87 -2.97 11.12
M3 70.0 65.1 10.0 0.41 97.7 92.75 -2.78 10.81
M4 71.7 66.1 10.9 0.39 97.7 93.06 -2.98 11.07
M5 71.8 56.3 9.9 0.40 96.1 92.96 -2.88 10.59
M6 70.7 54.5 9.1 0.35 97.6 93.19 -3.07 11.08
M7 69.8 51.8 10.0 0.40 97.7 92.96 -2.93 10.76
Nebraska
N01 70.6 47.1 9.6 0.41 97.2 92.91 -2.79 10.68
N02 70.9 47.9 10.1 0.42 98.9 92.68 -2.82 10.16
N03 71.2 48.8 11.0 0.44 97.3 92.48 -2.66 9.80
N04 70.6 54.3 11.0 0.44 97.0 92.52 -2.67 9.95
N05 71.6 44.9 9.7 0.43 96.5 92.70 -2.73 10.68
North Dakota
ND01 71.7 66.2 10.7 0.40 96.9 92.64 -2.84 10.72
ND02 69.8 66.1 11.3 0.45 97.5 92.53 -2.63 9.97
Oklahoma
O01 71.6 56.9 11.6 0.50 99.1 91.89 -1.72 10.69
O02 70.1 65.2 11.9 0.49 98.5 91.88 -1.84 10.80
O03 70.3 61.4 13.1 0.46 75.6 92.17 -2.33 11.23
O04 71.0 52.1 11.6 0.47 96.6 91.88 -1.77 10.74
O05 69.1 59.5 11.1 0.44 96.9 92.17 -1.80 10.70
O06 69.1 67.9 12.1 0.42 93.4 91.99 -1.79 10.72
O07 69.9 62.3 11.2 0.44 99.0 92.01 -1.77 10.61
Pacific Northwest
PNW01 72.0 57.3 11.8 0.37 95.8 92.89 -2.93 12.37
PNW02 72.9 48.3 9.9 0.42 90.5 92.76 -2.59 11.16
PNW03 72.0 49.3 8.8 0.40 98.4 92.89 -2.39 10.00
South Dakota
SD01 71.3 54.0 11.0 0.44 98.3 92.56 -2.58 10.22
SD02 72.0 50.3 11.2 0.44 96.2 92.42 -2.61 10.78
Texas
T01 69.4 59.8 12.8 0.45 87.5 91.98 -1.77 10.73
T02 70.7 52.5 11.5 0.49 98.3 92.01 -1.57 10.31
T03 68.7 60.7 12.4 0.48 87.8 92.32 -1.89 11.02
T04 69.8 63.9 11.7 0.45 96.1 92.38 -1.81 9.79
T05 67.3 64.9 12.5 0.45 91.2 92.06 -2.32 11.29
T06 69.4 61.1 12.5 0.43 85.3 92.34 -2.36 11.03
Wyoming W01 70.7 54.9 9.8 0.41 97.7 92.70 -2.86 11.05
page 232011 Hard Red Winter Wheat Regional Quality Survey
The strength and mixing properties of dough help the
baker determine the value of the flour they purchase.
Flour specifications often require specialized testing to
determine how flour will perform during processing.
Farinograph testing is one of the most common
flour quality tests in the world. Farinograph results
are used to determine dough strength and processing
requirements.
Absorption is a measurement of the
amount of water required for the flour
to be optimally processed into
the finished product. Peak time
indicates the time it takes for
the dough to develop from the
moment the water is added
until maximum consistency is
achieved. This measurement is
expressed in minutes.
Stability is an indication
of dough strength, as it is a
measurement of how long the dough
maintains maximum consistency. Stability
is also expressed in minutes. Weak gluten flour has a
lower water absorption and shorter stability time than
strong gluten flour.
Peak time represents dough development time by
measuring the length of time from the moment water is
added until the dough reaches maximum consistency.
This measurement indicates optimum mixing time for
the dough under standardized conditions.
Mixing Tolerance Index is the resistance of the
dough to breakdown during continued mixing. It is
the difference in Brabender Unit (BU) value at the
top of the curve at peak time and the value at the
top of the curve five minutes after the peak. This
indicates tolerance to over-mixing and is expressed as a
numerical score based on comparison to a control.
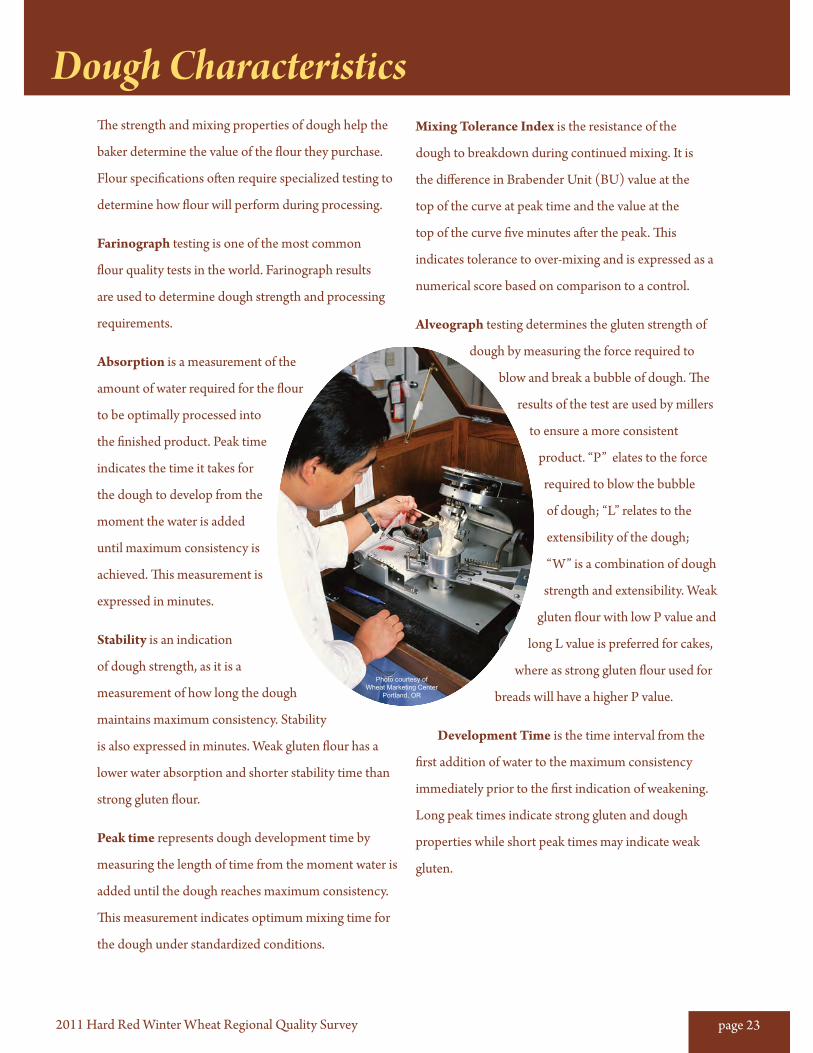
Alveograph testing determines the gluten strength of
dough by measuring the force required to
blow and break a bubble of dough. The
results of the test are used by millers
to ensure a more consistent
product. “P” elates to the force
required to blow the bubble
of dough; “L” relates to the
extensibility of the dough;
“W” is a combination of dough
strength and extensibility. Weak
gluten flour with low P value and
long L value is preferred for cakes,
where as strong gluten flour used for
breads will have a higher P value.
Development Time is the time interval from the
first addition of water to the maximum consistency
immediately prior to the first indication of weakening.
Long peak times indicate strong gluten and dough
properties while short peak times may indicate weak
gluten.
Dough Characteristics
Photo courtesy of Wheat Marketing Center
Portland, OR
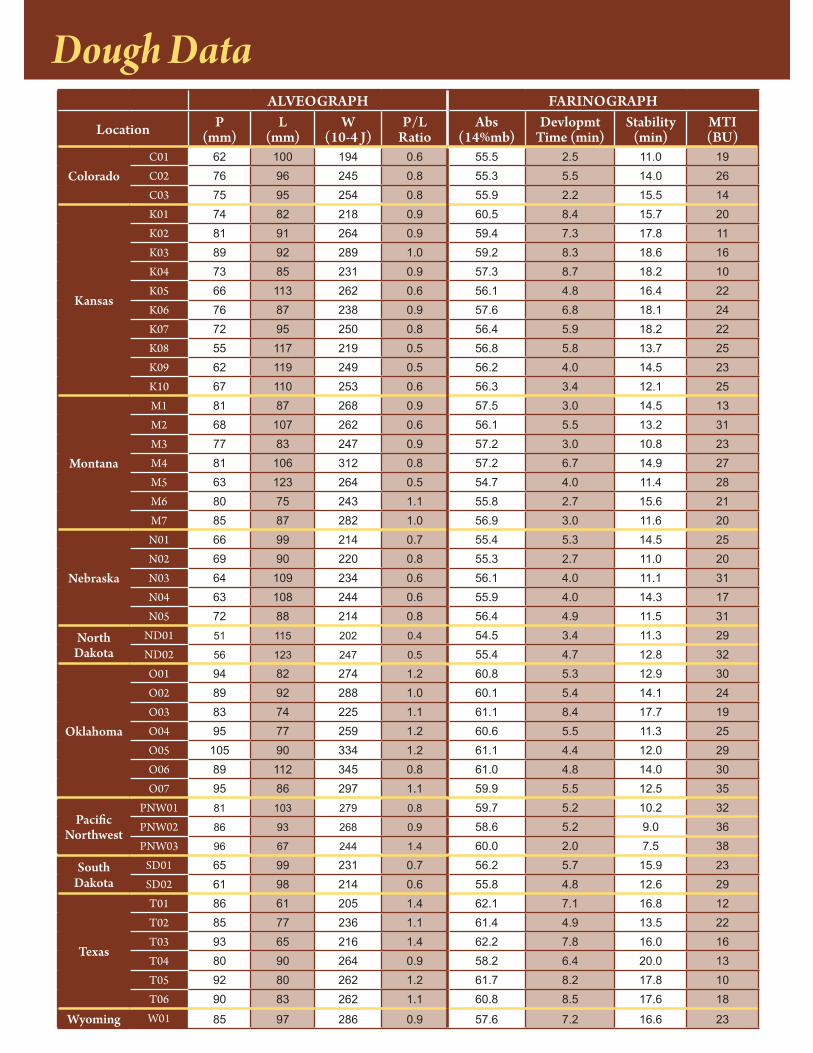
Dough DataALveOGraPH FARINOGraPH
Location P (mm)
L (mm)
W (10-4 J)
P/L Ratio
Abs (14%mb)
Devlopmt Time (min)
Stability (min)
MTI (BU)
ColoradoC01 62 100 194 0.6 55.5 2.5 11.0 19C02 76 96 245 0.8 55.3 5.5 14.0 26C03 75 95 254 0.8 55.9 2.2 15.5 14
Kansas
K01 74 82 218 0.9 60.5 8.4 15.7 20K02 81 91 264 0.9 59.4 7.3 17.8 11K03 89 92 289 1.0 59.2 8.3 18.6 16K04 73 85 231 0.9 57.3 8.7 18.2 10K05 66 113 262 0.6 56.1 4.8 16.4 22K06 76 87 238 0.9 57.6 6.8 18.1 24K07 72 95 250 0.8 56.4 5.9 18.2 22K08 55 117 219 0.5 56.8 5.8 13.7 25K09 62 119 249 0.5 56.2 4.0 14.5 23K10 67 110 253 0.6 56.3 3.4 12.1 25
Montana
M1 81 87 268 0.9 57.5 3.0 14.5 13M2 68 107 262 0.6 56.1 5.5 13.2 31M3 77 83 247 0.9 57.2 3.0 10.8 23M4 81 106 312 0.8 57.2 6.7 14.9 27M5 63 123 264 0.5 54.7 4.0 11.4 28M6 80 75 243 1.1 55.8 2.7 15.6 21M7 85 87 282 1.0 56.9 3.0 11.6 20
Nebraska
N01 66 99 214 0.7 55.4 5.3 14.5 25N02 69 90 220 0.8 55.3 2.7 11.0 20N03 64 109 234 0.6 56.1 4.0 11.1 31N04 63 108 244 0.6 55.9 4.0 14.3 17N05 72 88 214 0.8 56.4 4.9 11.5 31
North Dakota
ND01 51 115 202 0.4 54.5 3.4 11.3 29ND02 56 123 247 0.5 55.4 4.7 12.8 32
Oklahoma
O01 94 82 274 1.2 60.8 5.3 12.9 30O02 89 92 288 1.0 60.1 5.4 14.1 24O03 83 74 225 1.1 61.1 8.4 17.7 19O04 95 77 259 1.2 60.6 5.5 11.3 25O05 105 90 334 1.2 61.1 4.4 12.0 29O06 89 112 345 0.8 61.0 4.8 14.0 30O07 95 86 297 1.1 59.9 5.5 12.5 35
Pacific Northwest
PNW01 81 103 279 0.8 59.7 5.2 10.2 32PNW02 86 93 268 0.9 58.6 5.2 9.0 36PNW03 96 67 244 1.4 60.0 2.0 7.5 38
South Dakota
SD01 65 99 231 0.7 56.2 5.7 15.9 23SD02 61 98 214 0.6 55.8 4.8 12.6 29
Texas
T01 86 61 205 1.4 62.1 7.1 16.8 12T02 85 77 236 1.1 61.4 4.9 13.5 22T03 93 65 216 1.4 62.2 7.8 16.0 16T04 80 90 264 0.9 58.2 6.4 20.0 13T05 92 80 262 1.2 61.7 8.2 17.8 10T06 90 83 262 1.1 60.8 8.5 17.6 18
Wyoming W01 85 97 286 0.9 57.6 7.2 16.6 23
page 252011 Hard Red Winter Wheat Regional Quality Survey
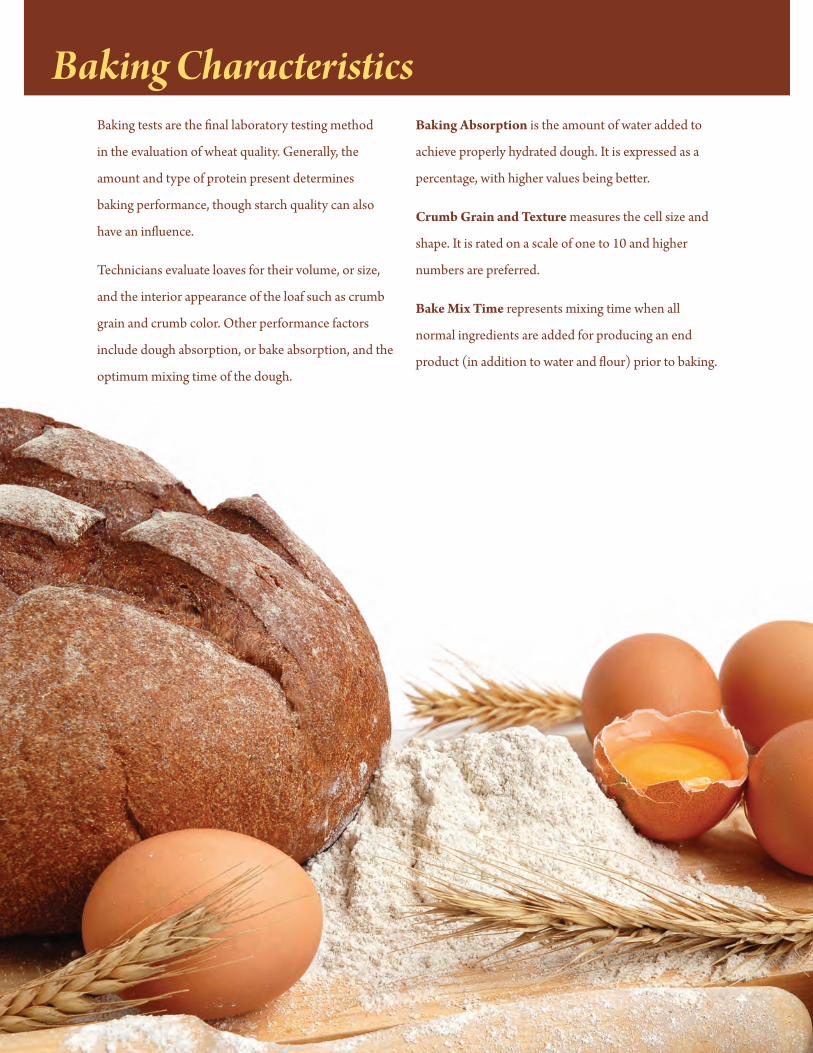
Baking tests are the final laboratory testing method
in the evaluation of wheat quality. Generally, the
amount and type of protein present determines
baking performance, though starch quality can also
have an influence.
Technicians evaluate loaves for their volume, or size,
and the interior appearance of the loaf such as crumb
grain and crumb color. Other performance factors
include dough absorption, or bake absorption, and the
optimum mixing time of the dough.
Baking Absorption is the amount of water added to
achieve properly hydrated dough. It is expressed as a
percentage, with higher values being better.
Crumb Grain and Texture measures the cell size and
shape. It is rated on a scale of one to 10 and higher
numbers are preferred.
Bake Mix Time represents mixing time when all
normal ingredients are added for producing an end
product (in addition to water and flour) prior to baking.
Baking Characteristics
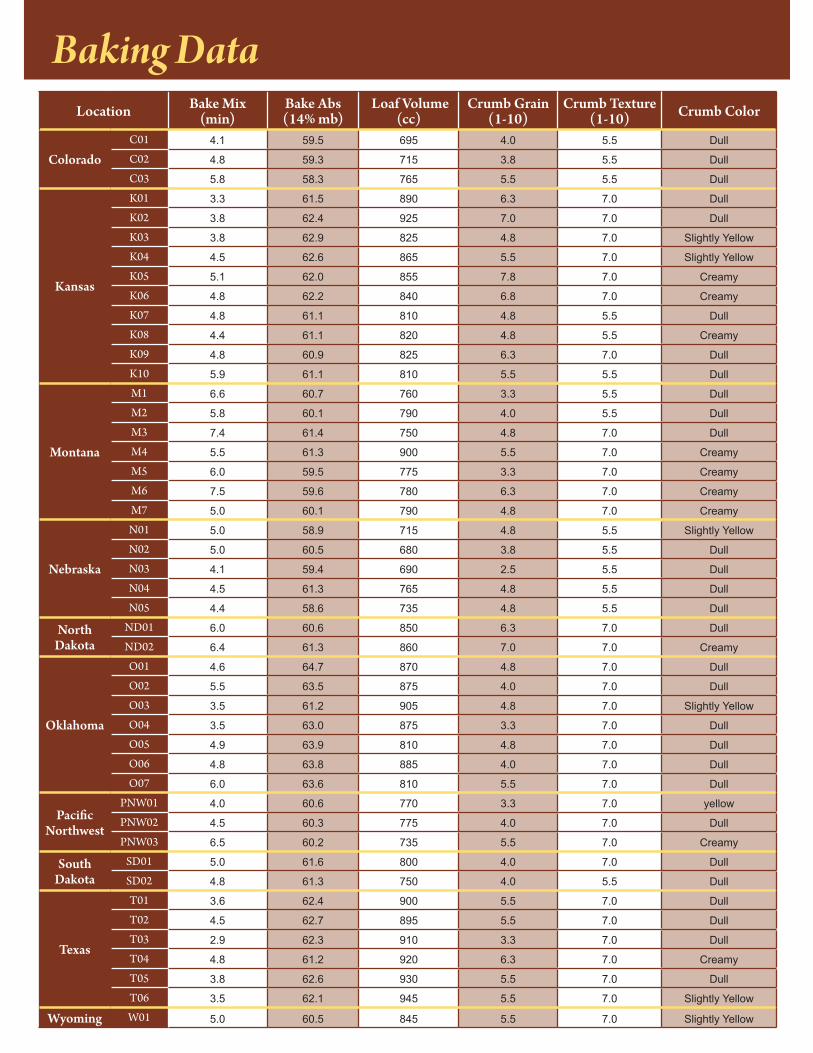
Baking DataLocation Bake Mix
(min)Bake Abs (14% mb)
Loaf volume (cc)
Crumb Grain (1-10)
Crumb Texture (1-10) Crumb Color
ColoradoC01 4.1 59.5 695 4.0 5.5 Dull
C02 4.8 59.3 715 3.8 5.5 Dull
C03 5.8 58.3 765 5.5 5.5 Dull
Kansas
K01 3.3 61.5 890 6.3 7.0 Dull
K02 3.8 62.4 925 7.0 7.0 Dull
K03 3.8 62.9 825 4.8 7.0 Slightly Yellow
K04 4.5 62.6 865 5.5 7.0 Slightly Yellow
K05 5.1 62.0 855 7.8 7.0 Creamy
K06 4.8 62.2 840 6.8 7.0 Creamy
K07 4.8 61.1 810 4.8 5.5 Dull
K08 4.4 61.1 820 4.8 5.5 Creamy
K09 4.8 60.9 825 6.3 7.0 Dull
K10 5.9 61.1 810 5.5 5.5 Dull
Montana
M1 6.6 60.7 760 3.3 5.5 Dull
M2 5.8 60.1 790 4.0 5.5 Dull
M3 7.4 61.4 750 4.8 7.0 Dull
M4 5.5 61.3 900 5.5 7.0 Creamy
M5 6.0 59.5 775 3.3 7.0 Creamy
M6 7.5 59.6 780 6.3 7.0 Creamy
M7 5.0 60.1 790 4.8 7.0 Creamy
Nebraska
N01 5.0 58.9 715 4.8 5.5 Slightly Yellow
N02 5.0 60.5 680 3.8 5.5 Dull
N03 4.1 59.4 690 2.5 5.5 Dull
N04 4.5 61.3 765 4.8 5.5 Dull
N05 4.4 58.6 735 4.8 5.5 Dull
North Dakota
ND01 6.0 60.6 850 6.3 7.0 Dull
ND02 6.4 61.3 860 7.0 7.0 Creamy
Oklahoma
O01 4.6 64.7 870 4.8 7.0 Dull
O02 5.5 63.5 875 4.0 7.0 Dull
O03 3.5 61.2 905 4.8 7.0 Slightly Yellow
O04 3.5 63.0 875 3.3 7.0 Dull
O05 4.9 63.9 810 4.8 7.0 Dull
O06 4.8 63.8 885 4.0 7.0 Dull
O07 6.0 63.6 810 5.5 7.0 Dull
Pacific Northwest
PNW01 4.0 60.6 770 3.3 7.0 yellow
PNW02 4.5 60.3 775 4.0 7.0 Dull
PNW03 6.5 60.2 735 5.5 7.0 Creamy
South Dakota
SD01 5.0 61.6 800 4.0 7.0 Dull
SD02 4.8 61.3 750 4.0 5.5 Dull
Texas
T01 3.6 62.4 900 5.5 7.0 Dull
T02 4.5 62.7 895 5.5 7.0 Dull
T03 2.9 62.3 910 3.3 7.0 Dull
T04 4.8 61.2 920 6.3 7.0 Creamy
T05 3.8 62.6 930 5.5 7.0 Dull
T06 3.5 62.1 945 5.5 7.0 Slightly Yellow
Wyoming W01 5.0 60.5 845 5.5 7.0 Slightly Yellow
page 272011 Hard Red Winter Wheat Regional Quality Survey
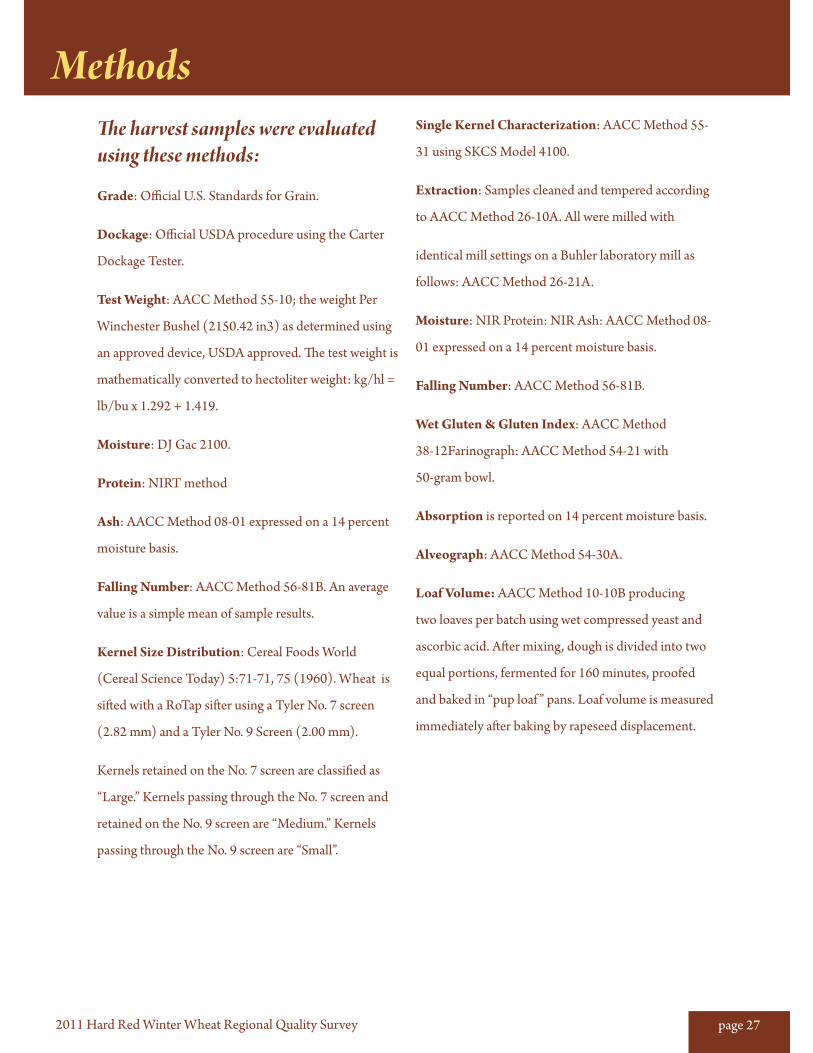
MethodsThe harvest samples were evaluated using these methods:
Grade: Official U.S. Standards for Grain.
Dockage: Official USDA procedure using the Carter
Dockage Tester.
Test Weight: AACC Method 55-10; the weight Per
Winchester Bushel (2150.42 in3) as determined using
an approved device, USDA approved. The test weight is
mathematically converted to hectoliter weight: kg/hl =
lb/bu x 1.292 + 1.419.
Moisture: DJ Gac 2100.
Protein: NIRT method
Ash: AACC Method 08-01 expressed on a 14 percent
moisture basis.
Falling Number: AACC Method 56-81B. An average
value is a simple mean of sample results.
Kernel Size Distribution: Cereal Foods World
(Cereal Science Today) 5:71-71, 75 (1960). Wheat is
sifted with a RoTap sifter using a Tyler No. 7 screen
(2.82 mm) and a Tyler No. 9 Screen (2.00 mm).
Kernels retained on the No. 7 screen are classified as
“Large.” Kernels passing through the No. 7 screen and
retained on the No. 9 screen are “Medium.” Kernels
passing through the No. 9 screen are “Small”.
Single Kernel Characterization: AACC Method 55-
31 using SKCS Model 4100.
Extraction: Samples cleaned and tempered according
to AACC Method 26-10A. All were milled with
identical mill settings on a Buhler laboratory mill as
follows: AACC Method 26-21A.
Moisture: NIR Protein: NIR Ash: AACC Method 08-
01 expressed on a 14 percent moisture basis.
Falling Number: AACC Method 56-81B.
Wet Gluten & Gluten Index: AACC Method
38-12Farinograph: AACC Method 54-21 with
50-gram bowl.
Absorption is reported on 14 percent moisture basis.
Alveograph: AACC Method 54-30A.
Loaf Volume: AACC Method 10-10B producing
two loaves per batch using wet compressed yeast and
ascorbic acid. After mixing, dough is divided into two
equal portions, fermented for 160 minutes, proofed
and baked in “pup loaf ” pans. Loaf volume is measured
immediately after baking by rapeseed displacement.