Embed Size (px)
DESCRIPTION
2011 State of America's Children-Education
Citation preview
Education
Key Facts ....................................................................................................................................... H-2How America Ranks Among Industrialized Countries in Education ............................................... H-3Annual Expenditures Per Student, 2007 (graph)............................................................................ H-3The Four Americas ......................................................................................................................... H-4Earnings by Educational Attainment, 2009..................................................................................... H-5Expected Lifetime Earnings by Education Level ............................................................................ H-5Racial Isolation of Black and Latino Students in the Public Schools, 1968-2006........................... H-6Change in Black Segregation in the South, 1954-2005 ................................................................. H-6Reading and Math Performance of 4th, 8th and 12th Graders, by Race ....................................... H-7Reading and Math Performance of 4th Graders, 2009 .................................................................. H-8Reading and Math Performance of 8th Graders, 2009 .................................................................. H-9Public School Education, Selected Indicators .............................................................................. H-10Graduation Rates, by Race, 2007-2008........................................................................................H-11Spending on Prisoners vs. Spending on Public School Students, 2007 ...................................... H-12School Discipline, 2006 ................................................................................................................ H-13Violence and Risk Behaviors of High School Students, 2007 ...................................................... H-14A New Look at America’s “Dropout Factories”.............................................................................. H-15Dropouts, 2009............................................................................................................................. H-16Title I of the Elementary and Secondary Education Act ............................................................... H-17Children Receiving Services Under the Individuals with Disabilities Education Act (IDEA),by Age, 2008 ................................................................................................................................ H-18Enrollment in Classes for Students with Mental Retardation, by Race, 2006 (graph).................. H-19Enrollment in Classes for Students with Emotional Disturbances, by Race, 2006 (graph) .......... H-19Enrollment in Classes for Students with Learning Disabilities, by Race, 2006 (graph)................ H-19Enrollment in Classes for Students with Mental Retardation, 2006 ............................................. H-20Enrollment in Classes for Students with Emotional Disturbances, 2006...................................... H-21Enrollment in Classes for Students with Learning Disabilities, 2006............................................ H-22Enrollment in Programs for the Gifted and Talented, 2006........................................................... H-23High School Teachers with Undergraduate Major in Subject Matter Taught, 2007-2008 ............. H-24Demographics of Public School Teachers Grade 9-12................................................................. H-24College Graduation Rates Among Young Adults, 1957-2009 (graph) .......................................... H-25Percent of Young Adults Who Completed Four Years of College or More,by Race/Ethnicity and Sex, 1957 to 2009 .................................................................................... H-26
H-2 Children’s Defense Fund
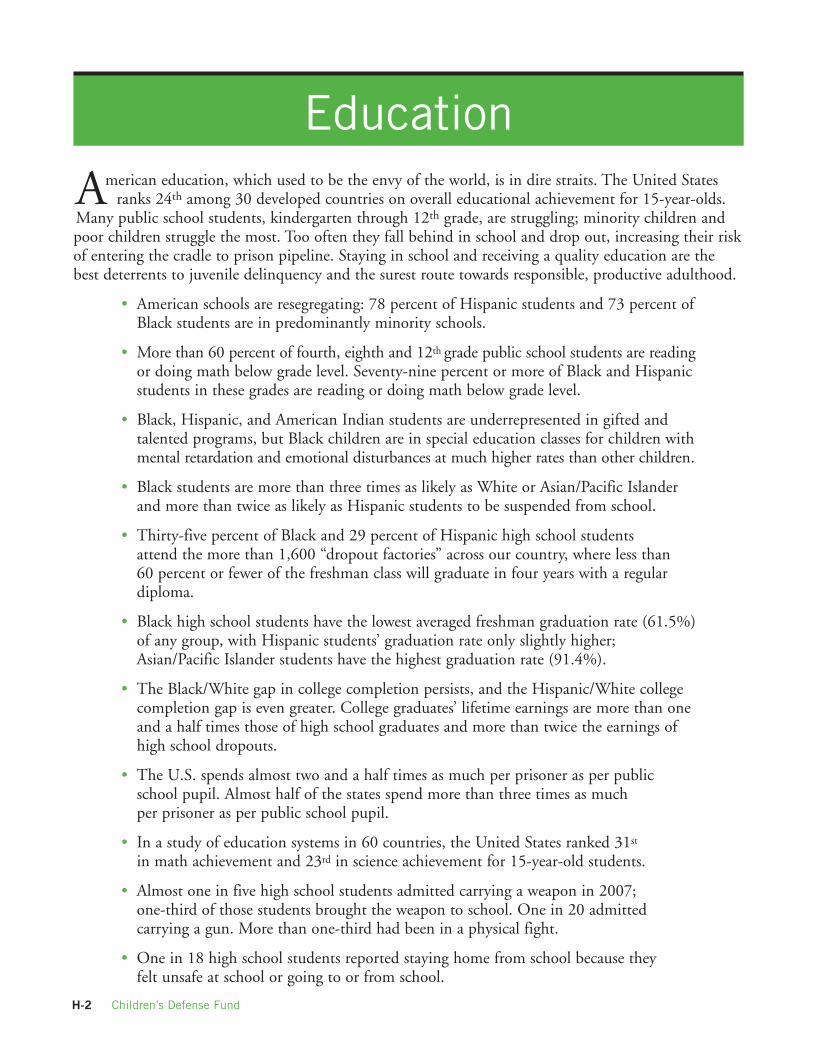
Educationmerican education, which used to be the envy of the world, is in dire straits. The United Statesranks 24th among 30 developed countries on overall educational achievement for 15-year-olds.
Many public school students, kindergarten through 12th grade, are struggling; minority children andpoor children struggle the most. Too often they fall behind in school and drop out, increasing their riskof entering the cradle to prison pipeline. Staying in school and receiving a quality education are thebest deterrents to juvenile delinquency and the surest route towards responsible, productive adulthood.
• American schools are resegregating: 78 percent of Hispanic students and 73 percent ofBlack students are in predominantly minority schools.
• More than 60 percent of fourth, eighth and 12th grade public school students are readingor doing math below grade level. Seventy-nine percent or more of Black and Hispanicstudents in these grades are reading or doing math below grade level.
• Black, Hispanic, and American Indian students are underrepresented in gifted andtalented programs, but Black children are in special education classes for children withmental retardation and emotional disturbances at much higher rates than other children.
• Black students are more than three times as likely as White or Asian/Pacific Islanderand more than twice as likely as Hispanic students to be suspended from school.
• Thirty-five percent of Black and 29 percent of Hispanic high school studentsattend the more than 1,600 “dropout factories” across our country, where less than60 percent or fewer of the freshman class will graduate in four years with a regulardiploma.
• Black high school students have the lowest averaged freshman graduation rate (61.5%)of any group, with Hispanic students’ graduation rate only slightly higher;Asian/Pacific Islander students have the highest graduation rate (91.4%).
• The Black/White gap in college completion persists, and the Hispanic/White collegecompletion gap is even greater. College graduates’ lifetime earnings are more than oneand a half times those of high school graduates and more than twice the earnings ofhigh school dropouts.
• The U.S. spends almost two and a half times as much per prisoner as per publicschool pupil. Almost half of the states spend more than three times as muchper prisoner as per public school pupil.
• In a study of education systems in 60 countries, the United States ranked 31stin math achievement and 23rd in science achievement for 15-year-old students.
• Almost one in five high school students admitted carrying a weapon in 2007;one-third of those students brought the weapon to school. One in 20 admittedcarrying a gun. More than one-third had been in a physical fight.
• One in 18 high school students reported staying home from school because theyfelt unsafe at school or going to or from school.
A
H-3State of America’s Children® 2011
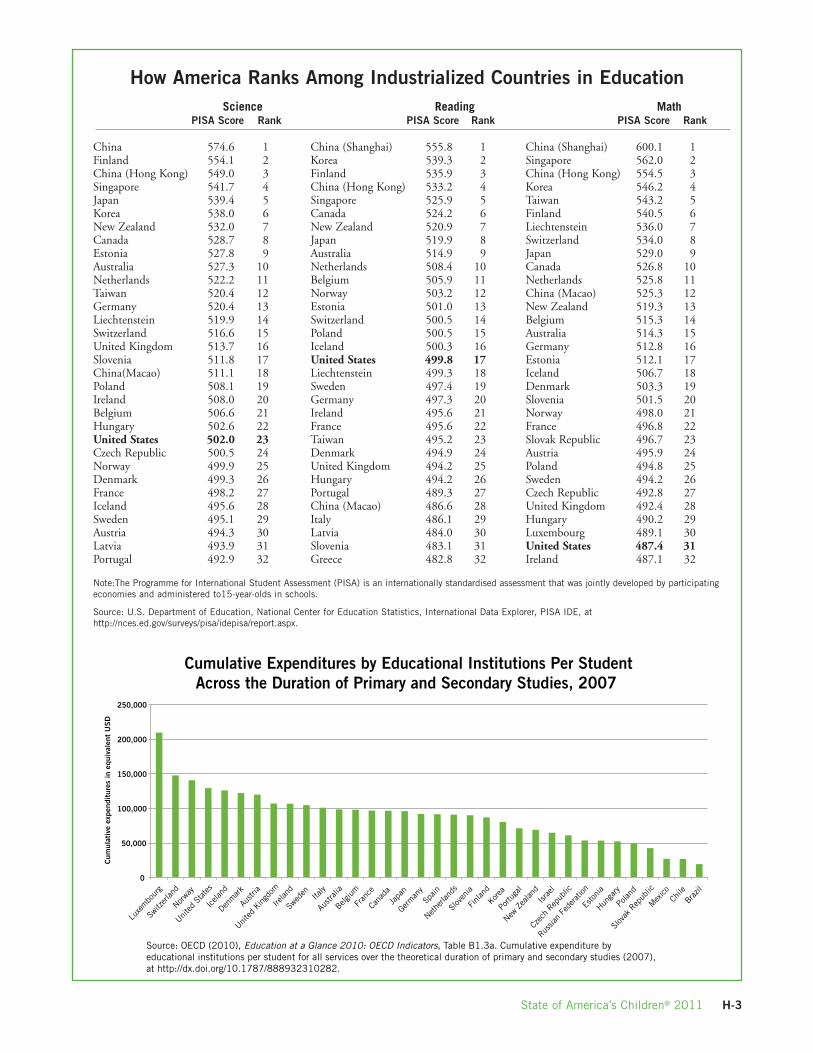
How America Ranks Among Industrialized Countries in EducationScience Reading Math
PISA Score Rank PISA Score Rank PISA Score Rank
China 574.6 1 China (Shanghai) 555.8 1 China (Shanghai) 600.1 1Finland 554.1 2 Korea 539.3 2 Singapore 562.0 2China (Hong Kong) 549.0 3 Finland 535.9 3 China (Hong Kong) 554.5 3Singapore 541.7 4 China (Hong Kong) 533.2 4 Korea 546.2 4Japan 539.4 5 Singapore 525.9 5 Taiwan 543.2 5Korea 538.0 6 Canada 524.2 6 Finland 540.5 6New Zealand 532.0 7 New Zealand 520.9 7 Liechtenstein 536.0 7Canada 528.7 8 Japan 519.9 8 Switzerland 534.0 8Estonia 527.8 9 Australia 514.9 9 Japan 529.0 9Australia 527.3 10 Netherlands 508.4 10 Canada 526.8 10Netherlands 522.2 11 Belgium 505.9 11 Netherlands 525.8 11Taiwan 520.4 12 Norway 503.2 12 China (Macao) 525.3 12Germany 520.4 13 Estonia 501.0 13 New Zealand 519.3 13Liechtenstein 519.9 14 Switzerland 500.5 14 Belgium 515.3 14Switzerland 516.6 15 Poland 500.5 15 Australia 514.3 15United Kingdom 513.7 16 Iceland 500.3 16 Germany 512.8 16Slovenia 511.8 17 United States 499.8 17 Estonia 512.1 17China(Macao) 511.1 18 Liechtenstein 499.3 18 Iceland 506.7 18Poland 508.1 19 Sweden 497.4 19 Denmark 503.3 19Ireland 508.0 20 Germany 497.3 20 Slovenia 501.5 20Belgium 506.6 21 Ireland 495.6 21 Norway 498.0 21Hungary 502.6 22 France 495.6 22 France 496.8 22United States 502.0 23 Taiwan 495.2 23 Slovak Republic 496.7 23Czech Republic 500.5 24 Denmark 494.9 24 Austria 495.9 24Norway 499.9 25 United Kingdom 494.2 25 Poland 494.8 25Denmark 499.3 26 Hungary 494.2 26 Sweden 494.2 26France 498.2 27 Portugal 489.3 27 Czech Republic 492.8 27Iceland 495.6 28 China (Macao) 486.6 28 United Kingdom 492.4 28Sweden 495.1 29 Italy 486.1 29 Hungary 490.2 29Austria 494.3 30 Latvia 484.0 30 Luxembourg 489.1 30Latvia 493.9 31 Slovenia 483.1 31 United States 487.4 31Portugal 492.9 32 Greece 482.8 32 Ireland 487.1 32
Note:The Programme for International Student Assessment (PISA) is an internationally standardised assessment that was jointly developed by participatingeconomies and administered to15-year-olds in schools.
Source: U.S. Department of Education, National Center for Education Statistics, International Data Explorer, PISA IDE, athttp://nces.ed.gov/surveys/pisa/idepisa/report.aspx.
Source: OECD (2010), Education at a Glance 2010: OECD Indicators, Table B1.3a. Cumulative expenditure byeducational institutions per student for all services over the theoretical duration of primary and secondary studies (2007),at http://dx.doi.org/10.1787/888932310282.
0
50,000
100,000
150,000
200,000
250,000
Luxe
mbo
urg
Switz
erlan
d
Norway
UnitedSt
ates
Icela
nd
Denmark
Austr
ia
UnitedKin
gdom
Irelan
d
Swed
en Italy
Austr
alia
Belgium
Fran
ce
Cana
daJa
pan
German
ySp
ain
Nethe
rland
s
Slov
enia
Finlan
d
Korea
Portu
gal
NewZe
aland
Israe
l
Czec
hRep
ublic
Russia
nFe
deratio
n
Estonia
Hunga
ry
Polan
d
Slov
akRep
ublic
Mex
icoCh
ileBra
zil
Cum
ulat
ive
expe
ndit
ures
ineq
uiva
lent
US
D
Cumulative Expenditures by Educational Institutions Per StudentAcross the Duration of Primary and Secondary Studies, 2007
H-4 Children’s Defense Fund
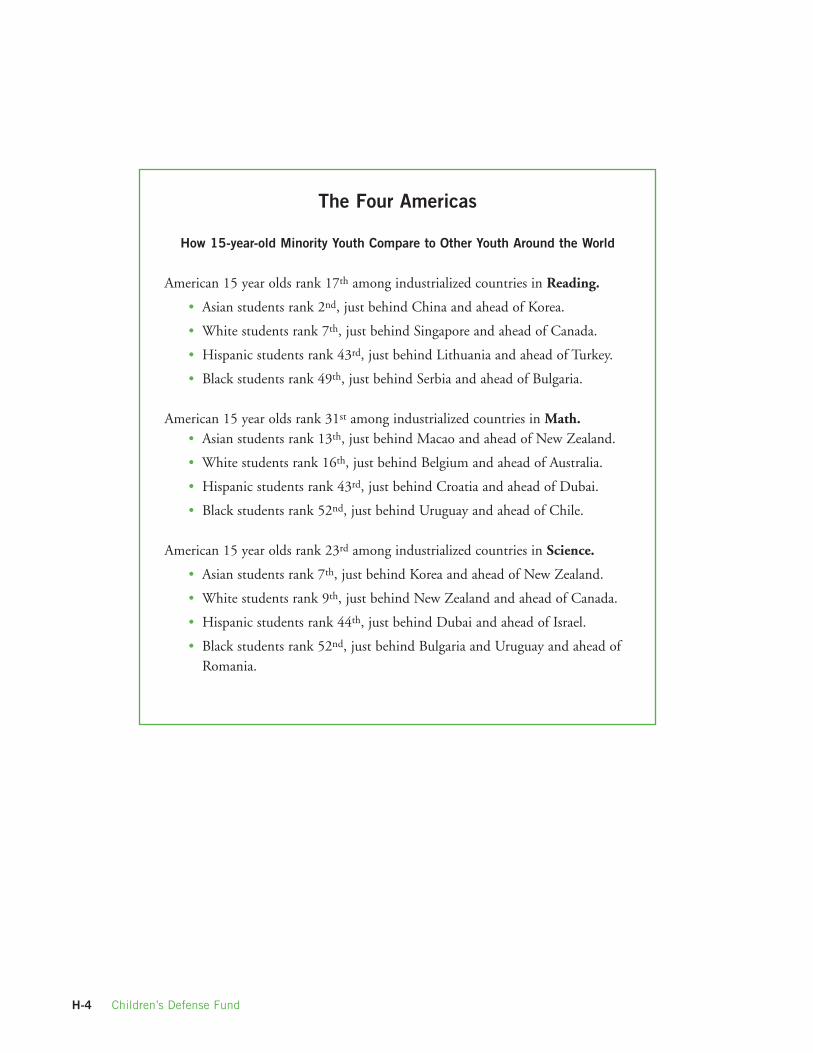
The Four Americas
How 15-year-old Minority Youth Compare to Other Youth Around the World
American 15 year olds rank 17th among industrialized countries in Reading.
• Asian students rank 2nd, just behind China and ahead of Korea.
• White students rank 7th, just behind Singapore and ahead of Canada.
• Hispanic students rank 43rd, just behind Lithuania and ahead of Turkey.
• Black students rank 49th, just behind Serbia and ahead of Bulgaria.
American 15 year olds rank 31st among industrialized countries in Math.• Asian students rank 13th, just behind Macao and ahead of New Zealand.
• White students rank 16th, just behind Belgium and ahead of Australia.
• Hispanic students rank 43rd, just behind Croatia and ahead of Dubai.
• Black students rank 52nd, just behind Uruguay and ahead of Chile.
American 15 year olds rank 23rd among industrialized countries in Science.
• Asian students rank 7th, just behind Korea and ahead of New Zealand.
• White students rank 9th, just behind New Zealand and ahead of Canada.
• Hispanic students rank 44th, just behind Dubai and ahead of Israel.
• Black students rank 52nd, just behind Bulgaria and Uruguay and ahead ofRomania.
H-5State of America’s Children® 2011
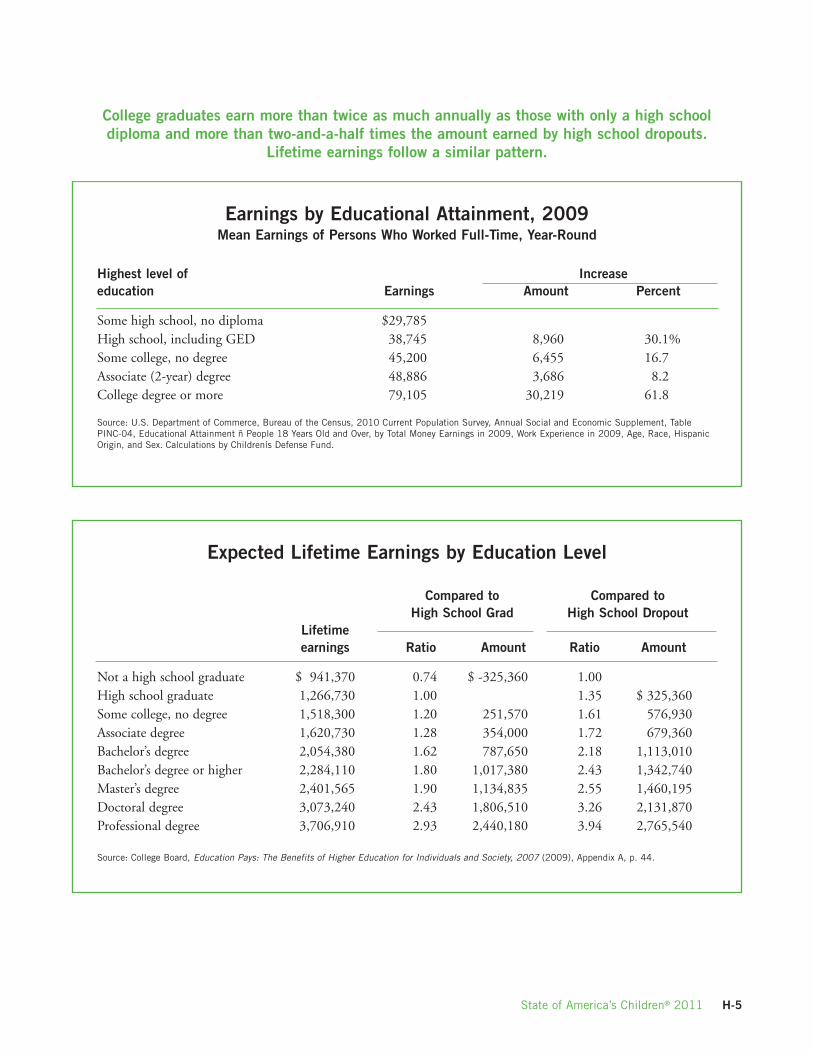
Earnings by Educational Attainment, 2009Mean Earnings of Persons Who Worked Full-Time, Year-Round
Highest level of Increaseeducation Earnings Amount Percent
Some high school, no diploma $29,785High school, including GED 38,745 8,960 30.1%Some college, no degree 45,200 6,455 16.7Associate (2-year) degree 48,886 3,686 8.2College degree or more 79,105 30,219 61.8
Source: U.S. Department of Commerce, Bureau of the Census, 2010 Current Population Survey, Annual Social and Economic Supplement, TablePINC-04, Educational Attainment ñ People 18 Years Old and Over, by Total Money Earnings in 2009, Work Experience in 2009, Age, Race, HispanicOrigin, and Sex. Calculations by Childrenís Defense Fund.
Expected Lifetime Earnings by Education Level
Compared to Compared toHigh School Grad High School Dropout
Lifetimeearnings Ratio Amount Ratio Amount
Not a high school graduate $ 941,370 0.74 $ -325,360 1.00High school graduate 1,266,730 1.00 1.35 $ 325,360Some college, no degree 1,518,300 1.20 251,570 1.61 576,930Associate degree 1,620,730 1.28 354,000 1.72 679,360Bachelor’s degree 2,054,380 1.62 787,650 2.18 1,113,010Bachelor’s degree or higher 2,284,110 1.80 1,017,380 2.43 1,342,740Master’s degree 2,401,565 1.90 1,134,835 2.55 1,460,195Doctoral degree 3,073,240 2.43 1,806,510 3.26 2,131,870Professional degree 3,706,910 2.93 2,440,180 3.94 2,765,540
Source: College Board, Education Pays: The Benefits of Higher Education for Individuals and Society, 2007 (2009), Appendix A, p. 44.
College graduates earn more than twice as much annually as those with only a high schooldiploma and more than two-and-a-half times the amount earned by high school dropouts.
Lifetime earnings follow a similar pattern.
H-6 Children’s Defense Fund
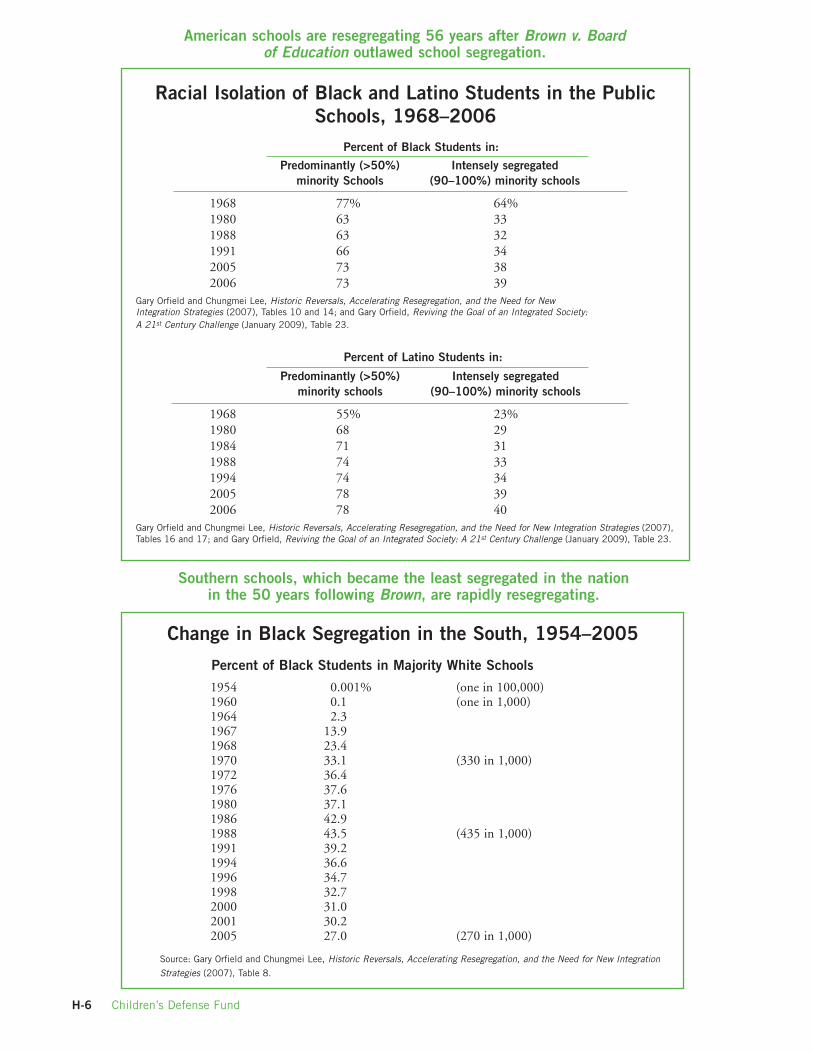
Racial Isolation of Black and Latino Students in the PublicSchools, 1968–2006
Percent of Black Students in:
Predominantly (>50%) Intensely segregatedminority Schools (90–100%) minority schools
1968 77% 64%1980 63 331988 63 321991 66 342005 73 382006 73 39
Gary Orfield and Chungmei Lee, Historic Reversals, Accelerating Resegregation, and the Need for NewIntegration Strategies (2007), Tables 10 and 14; and Gary Orfield, Reviving the Goal of an Integrated Society:A 21st Century Challenge (January 2009), Table 23.
Percent of Latino Students in:
Predominantly (>50%) Intensely segregatedminority schools (90–100%) minority schools
1968 55% 23%1980 68 291984 71 311988 74 331994 74 342005 78 392006 78 40
Gary Orfield and Chungmei Lee, Historic Reversals, Accelerating Resegregation, and the Need for New Integration Strategies (2007),Tables 16 and 17; and Gary Orfield, Reviving the Goal of an Integrated Society: A 21st Century Challenge (January 2009), Table 23.
American schools are resegregating 56 years after Brown v. Boardof Education outlawed school segregation.
Change in Black Segregation in the South, 1954–2005
Percent of Black Students in Majority White Schools
1954 0.001% (one in 100,000)1960 0.1 (one in 1,000)1964 2.31967 13.91968 23.41970 33.1 (330 in 1,000)1972 36.41976 37.61980 37.11986 42.91988 43.5 (435 in 1,000)1991 39.21994 36.61996 34.71998 32.72000 31.02001 30.22005 27.0 (270 in 1,000)
Source: Gary Orfield and Chungmei Lee, Historic Reversals, Accelerating Resegregation, and the Need for New Integration
Strategies (2007), Table 8.
Southern schools, which became the least segregated in the nationin the 50 years following Brown, are rapidly resegregating.
H-7State of America’s Children® 2011
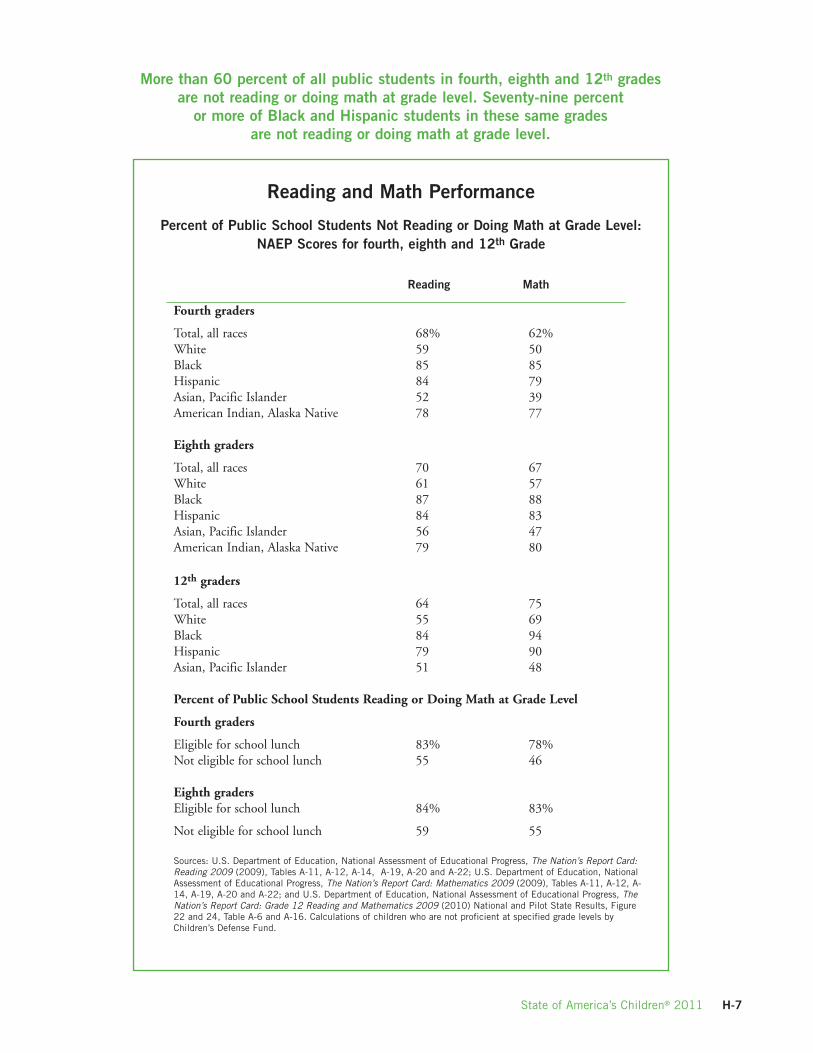
More than 60 percent of all public students in fourth, eighth and 12th gradesare not reading or doing math at grade level. Seventy-nine percent
or more of Black and Hispanic students in these same gradesare not reading or doing math at grade level.
Reading and Math Performance
Percent of Public School Students Not Reading or Doing Math at Grade Level:NAEP Scores for fourth, eighth and 12th Grade
Reading Math
Fourth graders
Total, all races 68% 62%White 59 50Black 85 85Hispanic 84 79Asian, Pacific Islander 52 39American Indian, Alaska Native 78 77
Eighth graders
Total, all races 70 67White 61 57Black 87 88Hispanic 84 83Asian, Pacific Islander 56 47American Indian, Alaska Native 79 80
12th graders
Total, all races 64 75White 55 69Black 84 94Hispanic 79 90Asian, Pacific Islander 51 48
Percent of Public School Students Reading or Doing Math at Grade Level
Fourth graders
Eligible for school lunch 83% 78%Not eligible for school lunch 55 46
Eighth gradersEligible for school lunch 84% 83%
Not eligible for school lunch 59 55
Sources: U.S. Department of Education, National Assessment of Educational Progress, The Nation’s Report Card:Reading 2009 (2009), Tables A-11, A-12, A-14, A-19, A-20 and A-22; U.S. Department of Education, NationalAssessment of Educational Progress, The Nation’s Report Card: Mathematics 2009 (2009), Tables A-11, A-12, A-14, A-19, A-20 and A-22; and U.S. Department of Education, National Assessment of Educational Progress, TheNation’s Report Card: Grade 12 Reading and Mathematics 2009 (2010) National and Pilot State Results, Figure22 and 24, Table A-6 and A-16. Calculations of children who are not proficient at specified grade levels byChildren’s Defense Fund.
H-8 Children’s Defense Fund
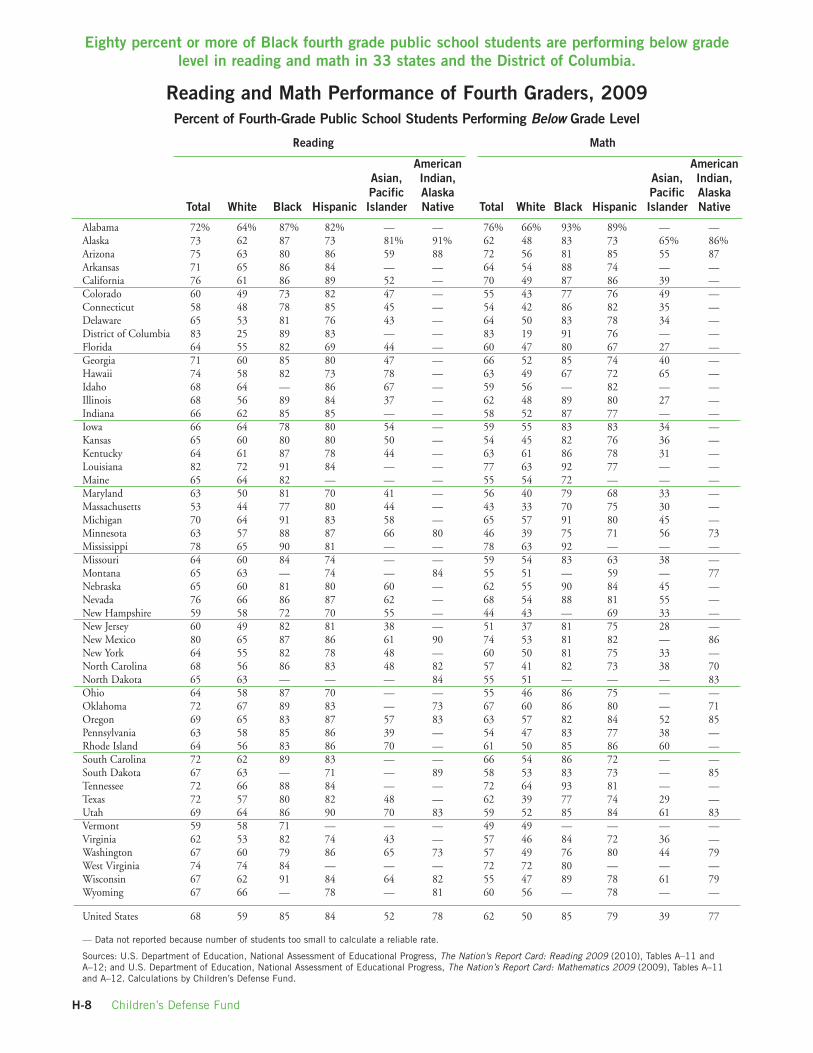
Reading and Math Performance of Fourth Graders, 2009Percent of Fourth-Grade Public School Students Performing Below Grade Level
Reading Math
American AmericanAsian, Indian, Asian, Indian,Pacific Alaska Pacific Alaska
Total White Black Hispanic Islander Native Total White Black Hispanic Islander Native
Alabama 72% 64% 87% 82% — — 76% 66% 93% 89% — —Alaska 73 62 87 73 81% 91% 62 48 83 73 65% 86%Arizona 75 63 80 86 59 88 72 56 81 85 55 87Arkansas 71 65 86 84 — — 64 54 88 74 — —California 76 61 86 89 52 — 70 49 87 86 39 —Colorado 60 49 73 82 47 — 55 43 77 76 49 —Connecticut 58 48 78 85 45 — 54 42 86 82 35 —Delaware 65 53 81 76 43 — 64 50 83 78 34 —District of Columbia 83 25 89 83 — — 83 19 91 76 — —Florida 64 55 82 69 44 — 60 47 80 67 27 —Georgia 71 60 85 80 47 — 66 52 85 74 40 —Hawaii 74 58 82 73 78 — 63 49 67 72 65 —Idaho 68 64 — 86 67 — 59 56 — 82 — —Illinois 68 56 89 84 37 — 62 48 89 80 27 —Indiana 66 62 85 85 — — 58 52 87 77 — —Iowa 66 64 78 80 54 — 59 55 83 83 34 —Kansas 65 60 80 80 50 — 54 45 82 76 36 —Kentucky 64 61 87 78 44 — 63 61 86 78 31 —Louisiana 82 72 91 84 — — 77 63 92 77 — —Maine 65 64 82 — — — 55 54 72 — — —Maryland 63 50 81 70 41 — 56 40 79 68 33 —Massachusetts 53 44 77 80 44 — 43 33 70 75 30 —Michigan 70 64 91 83 58 — 65 57 91 80 45 —Minnesota 63 57 88 87 66 80 46 39 75 71 56 73Mississippi 78 65 90 81 — — 78 63 92 — — —Missouri 64 60 84 74 — — 59 54 83 63 38 —Montana 65 63 — 74 — 84 55 51 — 59 — 77Nebraska 65 60 81 80 60 — 62 55 90 84 45 —Nevada 76 66 86 87 62 — 68 54 88 81 55 —New Hampshire 59 58 72 70 55 — 44 43 — 69 33 —New Jersey 60 49 82 81 38 — 51 37 81 75 28 —New Mexico 80 65 87 86 61 90 74 53 81 82 — 86New York 64 55 82 78 48 — 60 50 81 75 33 —North Carolina 68 56 86 83 48 82 57 41 82 73 38 70North Dakota 65 63 — — — 84 55 51 — — — 83Ohio 64 58 87 70 — — 55 46 86 75 — —Oklahoma 72 67 89 83 — 73 67 60 86 80 — 71Oregon 69 65 83 87 57 83 63 57 82 84 52 85Pennsylvania 63 58 85 86 39 — 54 47 83 77 38 —Rhode Island 64 56 83 86 70 — 61 50 85 86 60 —South Carolina 72 62 89 83 — — 66 54 86 72 — —South Dakota 67 63 — 71 — 89 58 53 83 73 — 85Tennessee 72 66 88 84 — — 72 64 93 81 — —Texas 72 57 80 82 48 — 62 39 77 74 29 —Utah 69 64 86 90 70 83 59 52 85 84 61 83Vermont 59 58 71 — — — 49 49 — — — —Virginia 62 53 82 74 43 — 57 46 84 72 36 —Washington 67 60 79 86 65 73 57 49 76 80 44 79West Virginia 74 74 84 — — — 72 72 80 — — —Wisconsin 67 62 91 84 64 82 55 47 89 78 61 79Wyoming 67 66 — 78 — 81 60 56 — 78 — —
United States 68 59 85 84 52 78 62 50 85 79 39 77
— Data not reported because number of students too small to calculate a reliable rate.
Sources: U.S. Department of Education, National Assessment of Educational Progress, The Nation’s Report Card: Reading 2009 (2010), Tables A–11 andA–12; and U.S. Department of Education, National Assessment of Educational Progress, The Nation’s Report Card: Mathematics 2009 (2009), Tables A–11and A–12. Calculations by Children’s Defense Fund.
Eighty percent or more of Black fourth grade public school students are performing below gradelevel in reading and math in 33 states and the District of Columbia.
H-9State of America’s Children® 2011
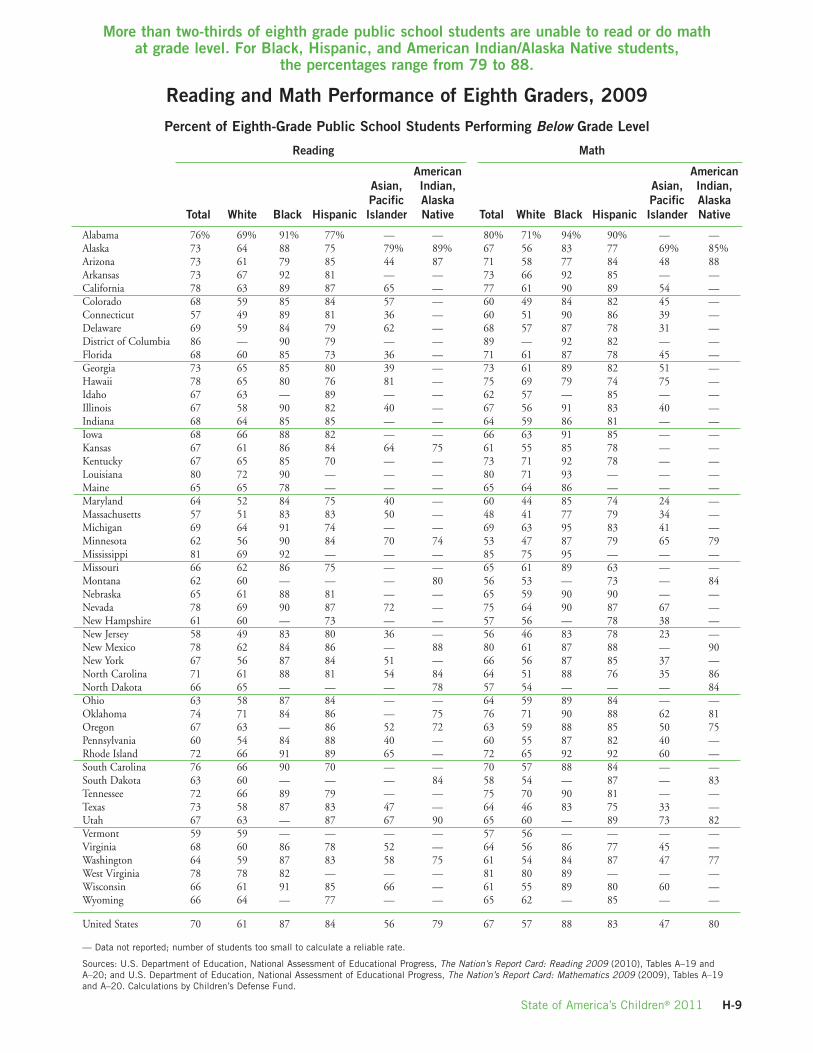
Reading and Math Performance of Eighth Graders, 2009
Percent of Eighth-Grade Public School Students Performing Below Grade Level
Reading Math
American AmericanAsian, Indian, Asian, Indian,Pacific Alaska Pacific Alaska
Total White Black Hispanic Islander Native Total White Black Hispanic Islander Native
Alabama 76% 69% 91% 77% — — 80% 71% 94% 90% — —Alaska 73 64 88 75 79% 89% 67 56 83 77 69% 85%Arizona 73 61 79 85 44 87 71 58 77 84 48 88Arkansas 73 67 92 81 — — 73 66 92 85 — —California 78 63 89 87 65 — 77 61 90 89 54 —Colorado 68 59 85 84 57 — 60 49 84 82 45 —Connecticut 57 49 89 81 36 — 60 51 90 86 39 —Delaware 69 59 84 79 62 — 68 57 87 78 31 —District of Columbia 86 — 90 79 — — 89 — 92 82 — —Florida 68 60 85 73 36 — 71 61 87 78 45 —Georgia 73 65 85 80 39 — 73 61 89 82 51 —Hawaii 78 65 80 76 81 — 75 69 79 74 75 —Idaho 67 63 — 89 — — 62 57 — 85 — —Illinois 67 58 90 82 40 — 67 56 91 83 40 —Indiana 68 64 85 85 — — 64 59 86 81 — —Iowa 68 66 88 82 — — 66 63 91 85 — —Kansas 67 61 86 84 64 75 61 55 85 78 — —Kentucky 67 65 85 70 — — 73 71 92 78 — —Louisiana 80 72 90 — — — 80 71 93 — — —Maine 65 65 78 — — — 65 64 86 — — —Maryland 64 52 84 75 40 — 60 44 85 74 24 —Massachusetts 57 51 83 83 50 — 48 41 77 79 34 —Michigan 69 64 91 74 — — 69 63 95 83 41 —Minnesota 62 56 90 84 70 74 53 47 87 79 65 79Mississippi 81 69 92 — — — 85 75 95 — — —Missouri 66 62 86 75 — — 65 61 89 63 — —Montana 62 60 — — — 80 56 53 — 73 — 84Nebraska 65 61 88 81 — — 65 59 90 90 — —Nevada 78 69 90 87 72 — 75 64 90 87 67 —New Hampshire 61 60 — 73 — — 57 56 — 78 38 —New Jersey 58 49 83 80 36 — 56 46 83 78 23 —New Mexico 78 62 84 86 — 88 80 61 87 88 — 90New York 67 56 87 84 51 — 66 56 87 85 37 —North Carolina 71 61 88 81 54 84 64 51 88 76 35 86North Dakota 66 65 — — — 78 57 54 — — — 84Ohio 63 58 87 84 — — 64 59 89 84 — —Oklahoma 74 71 84 86 — 75 76 71 90 88 62 81Oregon 67 63 — 86 52 72 63 59 88 85 50 75Pennsylvania 60 54 84 88 40 — 60 55 87 82 40 —Rhode Island 72 66 91 89 65 — 72 65 92 92 60 —South Carolina 76 66 90 70 — — 70 57 88 84 — —South Dakota 63 60 — — — 84 58 54 — 87 — 83Tennessee 72 66 89 79 — — 75 70 90 81 — —Texas 73 58 87 83 47 — 64 46 83 75 33 —Utah 67 63 — 87 67 90 65 60 — 89 73 82Vermont 59 59 — — — — 57 56 — — — —Virginia 68 60 86 78 52 — 64 56 86 77 45 —Washington 64 59 87 83 58 75 61 54 84 87 47 77West Virginia 78 78 82 — — — 81 80 89 — — —Wisconsin 66 61 91 85 66 — 61 55 89 80 60 —Wyoming 66 64 — 77 — — 65 62 — 85 — —
United States 70 61 87 84 56 79 67 57 88 83 47 80
— Data not reported; number of students too small to calculate a reliable rate.
Sources: U.S. Department of Education, National Assessment of Educational Progress, The Nation’s Report Card: Reading 2009 (2010), Tables A–19 andA–20; and U.S. Department of Education, National Assessment of Educational Progress, The Nation’s Report Card: Mathematics 2009 (2009), Tables A–19and A–20. Calculations by Children’s Defense Fund.
More than two-thirds of eighth grade public school students are unable to read or do mathat grade level. For Black, Hispanic, and American Indian/Alaska Native students,
the percentages range from 79 to 88.
H-10 Children’s Defense Fund
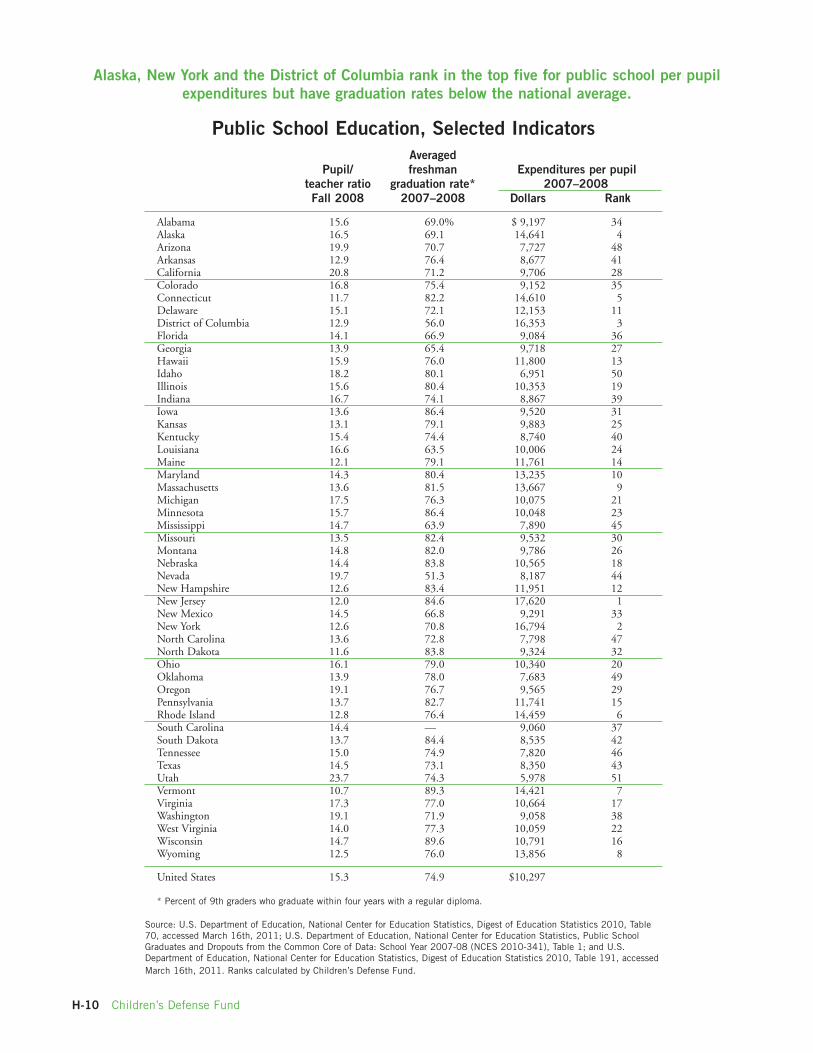
Public School Education, Selected IndicatorsAveraged
Pupil/ freshman Expenditures per pupilteacher ratio graduation rate* 2007–2008Fall 2008 2007–2008 Dollars Rank
Alabama 15.6 69.0% $ 9,197 34Alaska 16.5 69.1 14,641 4Arizona 19.9 70.7 7,727 48Arkansas 12.9 76.4 8,677 41California 20.8 71.2 9,706 28Colorado 16.8 75.4 9,152 35Connecticut 11.7 82.2 14,610 5Delaware 15.1 72.1 12,153 11District of Columbia 12.9 56.0 16,353 3Florida 14.1 66.9 9,084 36Georgia 13.9 65.4 9,718 27Hawaii 15.9 76.0 11,800 13Idaho 18.2 80.1 6,951 50Illinois 15.6 80.4 10,353 19Indiana 16.7 74.1 8,867 39Iowa 13.6 86.4 9,520 31Kansas 13.1 79.1 9,883 25Kentucky 15.4 74.4 8,740 40Louisiana 16.6 63.5 10,006 24Maine 12.1 79.1 11,761 14Maryland 14.3 80.4 13,235 10Massachusetts 13.6 81.5 13,667 9Michigan 17.5 76.3 10,075 21Minnesota 15.7 86.4 10,048 23Mississippi 14.7 63.9 7,890 45Missouri 13.5 82.4 9,532 30Montana 14.8 82.0 9,786 26Nebraska 14.4 83.8 10,565 18Nevada 19.7 51.3 8,187 44New Hampshire 12.6 83.4 11,951 12New Jersey 12.0 84.6 17,620 1New Mexico 14.5 66.8 9,291 33New York 12.6 70.8 16,794 2North Carolina 13.6 72.8 7,798 47North Dakota 11.6 83.8 9,324 32Ohio 16.1 79.0 10,340 20Oklahoma 13.9 78.0 7,683 49Oregon 19.1 76.7 9,565 29Pennsylvania 13.7 82.7 11,741 15Rhode Island 12.8 76.4 14,459 6South Carolina 14.4 — 9,060 37South Dakota 13.7 84.4 8,535 42Tennessee 15.0 74.9 7,820 46Texas 14.5 73.1 8,350 43Utah 23.7 74.3 5,978 51Vermont 10.7 89.3 14,421 7Virginia 17.3 77.0 10,664 17Washington 19.1 71.9 9,058 38West Virginia 14.0 77.3 10,059 22Wisconsin 14.7 89.6 10,791 16Wyoming 12.5 76.0 13,856 8
United States 15.3 74.9 $10,297
* Percent of 9th graders who graduate within four years with a regular diploma.
Source: U.S. Department of Education, National Center for Education Statistics, Digest of Education Statistics 2010, Table70, accessed March 16th, 2011; U.S. Department of Education, National Center for Education Statistics, Public SchoolGraduates and Dropouts from the Common Core of Data: School Year 2007-08 (NCES 2010-341), Table 1; and U.S.Department of Education, National Center for Education Statistics, Digest of Education Statistics 2010, Table 191, accessedMarch 16th, 2011. Ranks calculated by Children’s Defense Fund.
Alaska, New York and the District of Columbia rank in the top five for public school per pupilexpenditures but have graduation rates below the national average.
H-11State of America’s Children® 2011
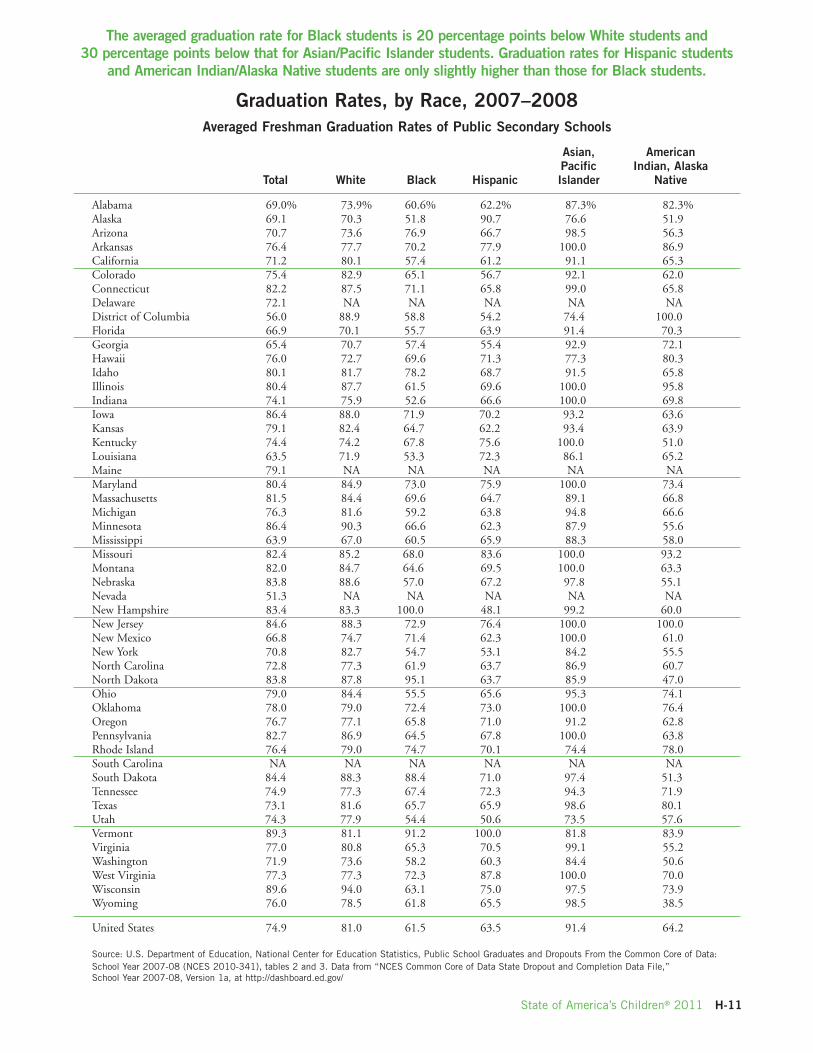
Graduation Rates, by Race, 2007–2008Averaged Freshman Graduation Rates of Public Secondary Schools
Asian, AmericanPacific Indian, Alaska
Total White Black Hispanic Islander Native
Alabama 69.0% 73.9% 60.6% 62.2% 87.3% 82.3%Alaska 69.1 70.3 51.8 90.7 76.6 51.9Arizona 70.7 73.6 76.9 66.7 98.5 56.3Arkansas 76.4 77.7 70.2 77.9 100.0 86.9California 71.2 80.1 57.4 61.2 91.1 65.3Colorado 75.4 82.9 65.1 56.7 92.1 62.0Connecticut 82.2 87.5 71.1 65.8 99.0 65.8Delaware 72.1 NA NA NA NA NADistrict of Columbia 56.0 88.9 58.8 54.2 74.4 100.0Florida 66.9 70.1 55.7 63.9 91.4 70.3Georgia 65.4 70.7 57.4 55.4 92.9 72.1Hawaii 76.0 72.7 69.6 71.3 77.3 80.3Idaho 80.1 81.7 78.2 68.7 91.5 65.8Illinois 80.4 87.7 61.5 69.6 100.0 95.8Indiana 74.1 75.9 52.6 66.6 100.0 69.8Iowa 86.4 88.0 71.9 70.2 93.2 63.6Kansas 79.1 82.4 64.7 62.2 93.4 63.9Kentucky 74.4 74.2 67.8 75.6 100.0 51.0Louisiana 63.5 71.9 53.3 72.3 86.1 65.2Maine 79.1 NA NA NA NA NAMaryland 80.4 84.9 73.0 75.9 100.0 73.4Massachusetts 81.5 84.4 69.6 64.7 89.1 66.8Michigan 76.3 81.6 59.2 63.8 94.8 66.6Minnesota 86.4 90.3 66.6 62.3 87.9 55.6Mississippi 63.9 67.0 60.5 65.9 88.3 58.0Missouri 82.4 85.2 68.0 83.6 100.0 93.2Montana 82.0 84.7 64.6 69.5 100.0 63.3Nebraska 83.8 88.6 57.0 67.2 97.8 55.1Nevada 51.3 NA NA NA NA NANew Hampshire 83.4 83.3 100.0 48.1 99.2 60.0New Jersey 84.6 88.3 72.9 76.4 100.0 100.0New Mexico 66.8 74.7 71.4 62.3 100.0 61.0New York 70.8 82.7 54.7 53.1 84.2 55.5North Carolina 72.8 77.3 61.9 63.7 86.9 60.7North Dakota 83.8 87.8 95.1 63.7 85.9 47.0Ohio 79.0 84.4 55.5 65.6 95.3 74.1Oklahoma 78.0 79.0 72.4 73.0 100.0 76.4Oregon 76.7 77.1 65.8 71.0 91.2 62.8Pennsylvania 82.7 86.9 64.5 67.8 100.0 63.8Rhode Island 76.4 79.0 74.7 70.1 74.4 78.0South Carolina NA NA NA NA NA NASouth Dakota 84.4 88.3 88.4 71.0 97.4 51.3Tennessee 74.9 77.3 67.4 72.3 94.3 71.9Texas 73.1 81.6 65.7 65.9 98.6 80.1Utah 74.3 77.9 54.4 50.6 73.5 57.6Vermont 89.3 81.1 91.2 100.0 81.8 83.9Virginia 77.0 80.8 65.3 70.5 99.1 55.2Washington 71.9 73.6 58.2 60.3 84.4 50.6West Virginia 77.3 77.3 72.3 87.8 100.0 70.0Wisconsin 89.6 94.0 63.1 75.0 97.5 73.9Wyoming 76.0 78.5 61.8 65.5 98.5 38.5
United States 74.9 81.0 61.5 63.5 91.4 64.2
Source: U.S. Department of Education, National Center for Education Statistics, Public School Graduates and Dropouts From the Common Core of Data:School Year 2007-08 (NCES 2010-341), tables 2 and 3. Data from “NCES Common Core of Data State Dropout and Completion Data File,”School Year 2007-08, Version 1a, at http://dashboard.ed.gov/
The averaged graduation rate for Black students is 20 percentage points below White students and30 percentage points below that for Asian/Pacific Islander students. Graduation rates for Hispanic students
and American Indian/Alaska Native students are only slightly higher than those for Black students.
H-12 Children’s Defense Fund
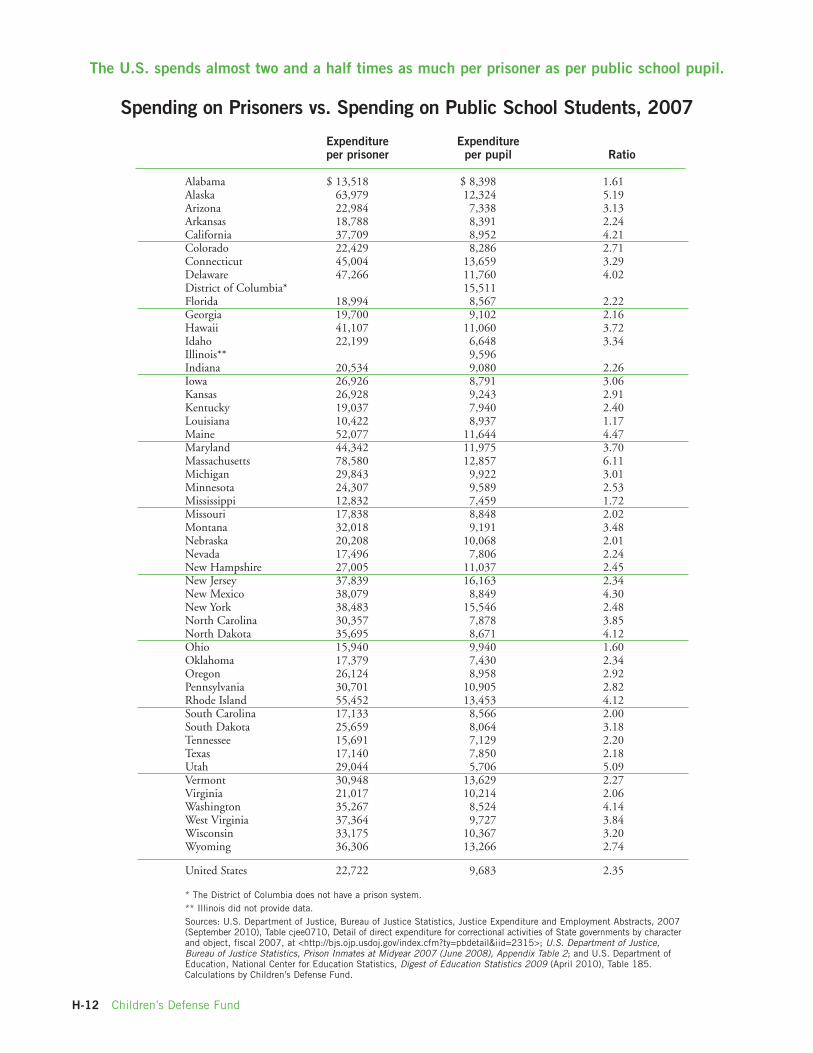
Expenditure Expenditureper prisoner per pupil Ratio
Alabama $ 13,518 $ 8,398 1.61Alaska 63,979 12,324 5.19Arizona 22,984 7,338 3.13Arkansas 18,788 8,391 2.24California 37,709 8,952 4.21Colorado 22,429 8,286 2.71Connecticut 45,004 13,659 3.29Delaware 47,266 11,760 4.02District of Columbia* 15,511Florida 18,994 8,567 2.22Georgia 19,700 9,102 2.16Hawaii 41,107 11,060 3.72Idaho 22,199 6,648 3.34Illinois** 9,596Indiana 20,534 9,080 2.26Iowa 26,926 8,791 3.06Kansas 26,928 9,243 2.91Kentucky 19,037 7,940 2.40Louisiana 10,422 8,937 1.17Maine 52,077 11,644 4.47Maryland 44,342 11,975 3.70Massachusetts 78,580 12,857 6.11Michigan 29,843 9,922 3.01Minnesota 24,307 9,589 2.53Mississippi 12,832 7,459 1.72Missouri 17,838 8,848 2.02Montana 32,018 9,191 3.48Nebraska 20,208 10,068 2.01Nevada 17,496 7,806 2.24New Hampshire 27,005 11,037 2.45New Jersey 37,839 16,163 2.34New Mexico 38,079 8,849 4.30New York 38,483 15,546 2.48North Carolina 30,357 7,878 3.85North Dakota 35,695 8,671 4.12Ohio 15,940 9,940 1.60Oklahoma 17,379 7,430 2.34Oregon 26,124 8,958 2.92Pennsylvania 30,701 10,905 2.82Rhode Island 55,452 13,453 4.12South Carolina 17,133 8,566 2.00South Dakota 25,659 8,064 3.18Tennessee 15,691 7,129 2.20Texas 17,140 7,850 2.18Utah 29,044 5,706 5.09Vermont 30,948 13,629 2.27Virginia 21,017 10,214 2.06Washington 35,267 8,524 4.14West Virginia 37,364 9,727 3.84Wisconsin 33,175 10,367 3.20Wyoming 36,306 13,266 2.74
United States 22,722 9,683 2.35
* The District of Columbia does not have a prison system.** Illinois did not provide data.Sources: U.S. Department of Justice, Bureau of Justice Statistics, Justice Expenditure and Employment Abstracts, 2007(September 2010), Table cjee0710, Detail of direct expenditure for correctional activities of State governments by characterand object, fiscal 2007, at <http://bjs.ojp.usdoj.gov/index.cfm?ty=pbdetail&iid=2315>; U.S. Department of Justice,Bureau of Justice Statistics, Prison Inmates at Midyear 2007 (June 2008), Appendix Table 2; and U.S. Department ofEducation, National Center for Education Statistics, Digest of Education Statistics 2009 (April 2010), Table 185.Calculations by Children’s Defense Fund.
Spending on Prisoners vs. Spending on Public School Students, 2007
The U.S. spends almost two and a half times as much per prisoner as per public school pupil.
H-13State of America’s Children® 2011
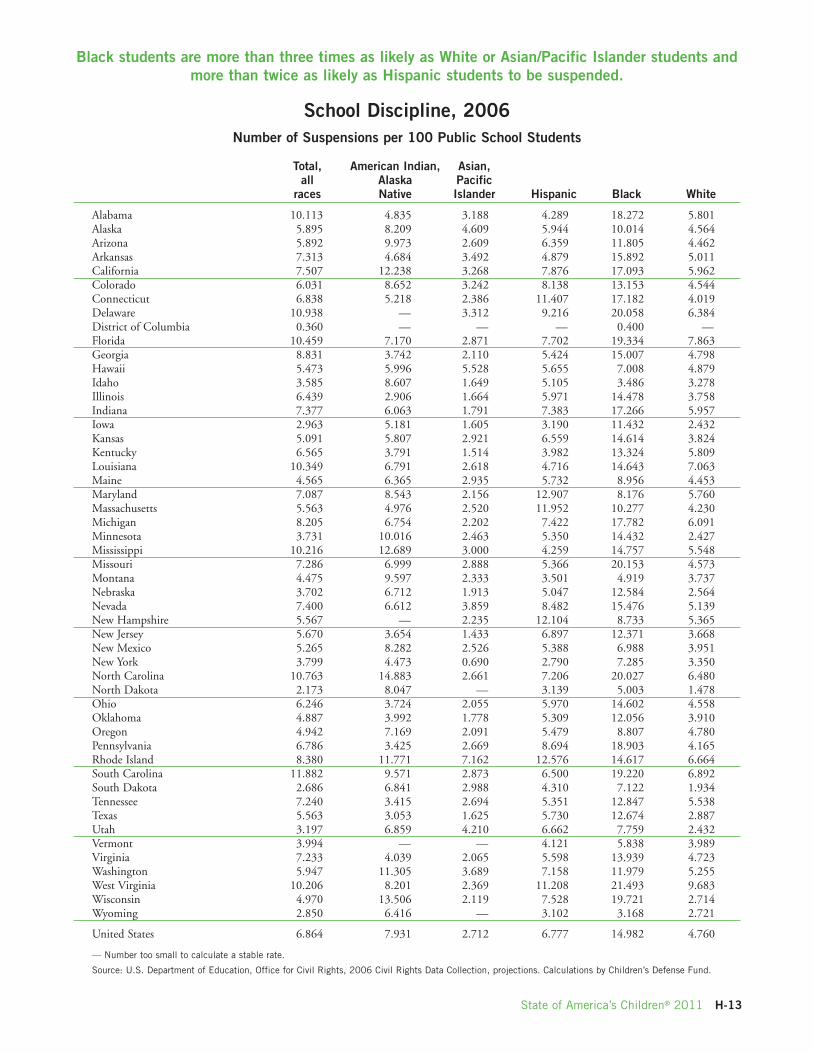
School Discipline, 2006Number of Suspensions per 100 Public School Students
Total, American Indian, Asian,all Alaska Pacific
races Native Islander Hispanic Black White
Alabama 10.113 4.835 3.188 4.289 18.272 5.801Alaska 5.895 8.209 4.609 5.944 10.014 4.564Arizona 5.892 9.973 2.609 6.359 11.805 4.462Arkansas 7.313 4.684 3.492 4.879 15.892 5.011California 7.507 12.238 3.268 7.876 17.093 5.962Colorado 6.031 8.652 3.242 8.138 13.153 4.544Connecticut 6.838 5.218 2.386 11.407 17.182 4.019Delaware 10.938 — 3.312 9.216 20.058 6.384District of Columbia 0.360 — — — 0.400 —Florida 10.459 7.170 2.871 7.702 19.334 7.863Georgia 8.831 3.742 2.110 5.424 15.007 4.798Hawaii 5.473 5.996 5.528 5.655 7.008 4.879Idaho 3.585 8.607 1.649 5.105 3.486 3.278Illinois 6.439 2.906 1.664 5.971 14.478 3.758Indiana 7.377 6.063 1.791 7.383 17.266 5.957Iowa 2.963 5.181 1.605 3.190 11.432 2.432Kansas 5.091 5.807 2.921 6.559 14.614 3.824Kentucky 6.565 3.791 1.514 3.982 13.324 5.809Louisiana 10.349 6.791 2.618 4.716 14.643 7.063Maine 4.565 6.365 2.935 5.732 8.956 4.453Maryland 7.087 8.543 2.156 12.907 8.176 5.760Massachusetts 5.563 4.976 2.520 11.952 10.277 4.230Michigan 8.205 6.754 2.202 7.422 17.782 6.091Minnesota 3.731 10.016 2.463 5.350 14.432 2.427Mississippi 10.216 12.689 3.000 4.259 14.757 5.548Missouri 7.286 6.999 2.888 5.366 20.153 4.573Montana 4.475 9.597 2.333 3.501 4.919 3.737Nebraska 3.702 6.712 1.913 5.047 12.584 2.564Nevada 7.400 6.612 3.859 8.482 15.476 5.139New Hampshire 5.567 — 2.235 12.104 8.733 5.365New Jersey 5.670 3.654 1.433 6.897 12.371 3.668New Mexico 5.265 8.282 2.526 5.388 6.988 3.951New York 3.799 4.473 0.690 2.790 7.285 3.350North Carolina 10.763 14.883 2.661 7.206 20.027 6.480North Dakota 2.173 8.047 — 3.139 5.003 1.478Ohio 6.246 3.724 2.055 5.970 14.602 4.558Oklahoma 4.887 3.992 1.778 5.309 12.056 3.910Oregon 4.942 7.169 2.091 5.479 8.807 4.780Pennsylvania 6.786 3.425 2.669 8.694 18.903 4.165Rhode Island 8.380 11.771 7.162 12.576 14.617 6.664South Carolina 11.882 9.571 2.873 6.500 19.220 6.892South Dakota 2.686 6.841 2.988 4.310 7.122 1.934Tennessee 7.240 3.415 2.694 5.351 12.847 5.538Texas 5.563 3.053 1.625 5.730 12.674 2.887Utah 3.197 6.859 4.210 6.662 7.759 2.432Vermont 3.994 — — 4.121 5.838 3.989Virginia 7.233 4.039 2.065 5.598 13.939 4.723Washington 5.947 11.305 3.689 7.158 11.979 5.255West Virginia 10.206 8.201 2.369 11.208 21.493 9.683Wisconsin 4.970 13.506 2.119 7.528 19.721 2.714Wyoming 2.850 6.416 — 3.102 3.168 2.721
United States 6.864 7.931 2.712 6.777 14.982 4.760
— Number too small to calculate a stable rate.
Source: U.S. Department of Education, Office for Civil Rights, 2006 Civil Rights Data Collection, projections. Calculations by Children’s Defense Fund.
Black students are more than three times as likely as White or Asian/Pacific Islander students andmore than twice as likely as Hispanic students to be suspended.
H-14 Children’s Defense Fund
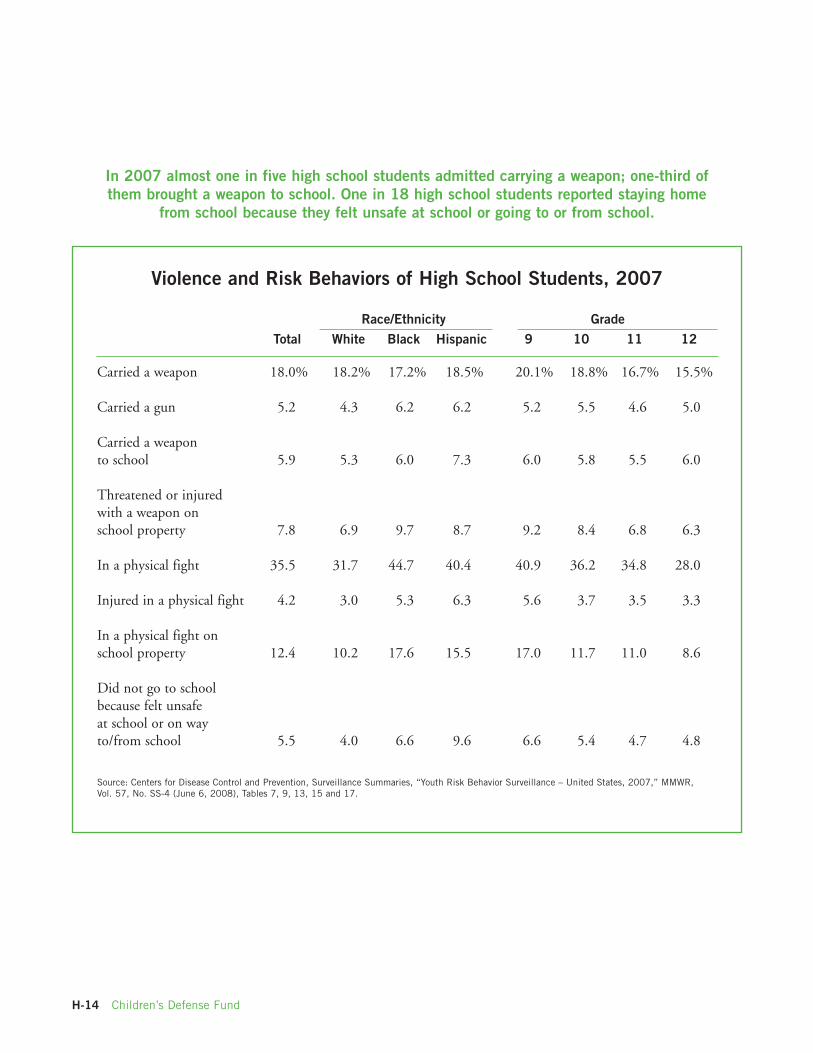
Violence and Risk Behaviors of High School Students, 2007
Race/Ethnicity GradeTotal White Black Hispanic 9 10 11 12
Carried a weapon 18.0% 18.2% 17.2% 18.5% 20.1% 18.8% 16.7% 15.5%
Carried a gun 5.2 4.3 6.2 6.2 5.2 5.5 4.6 5.0
Carried a weaponto school 5.9 5.3 6.0 7.3 6.0 5.8 5.5 6.0
Threatened or injuredwith a weapon onschool property 7.8 6.9 9.7 8.7 9.2 8.4 6.8 6.3
In a physical fight 35.5 31.7 44.7 40.4 40.9 36.2 34.8 28.0
Injured in a physical fight 4.2 3.0 5.3 6.3 5.6 3.7 3.5 3.3
In a physical fight onschool property 12.4 10.2 17.6 15.5 17.0 11.7 11.0 8.6
Did not go to schoolbecause felt unsafeat school or on wayto/from school 5.5 4.0 6.6 9.6 6.6 5.4 4.7 4.8
Source: Centers for Disease Control and Prevention, Surveillance Summaries, “Youth Risk Behavior Surveillance – United States, 2007,” MMWR,Vol. 57, No. SS-4 (June 6, 2008), Tables 7, 9, 13, 15 and 17.
In 2007 almost one in five high school students admitted carrying a weapon; one-third ofthem brought a weapon to school. One in 18 high school students reported staying home
from school because they felt unsafe at school or going to or from school.
H-15State of America’s Children® 2011
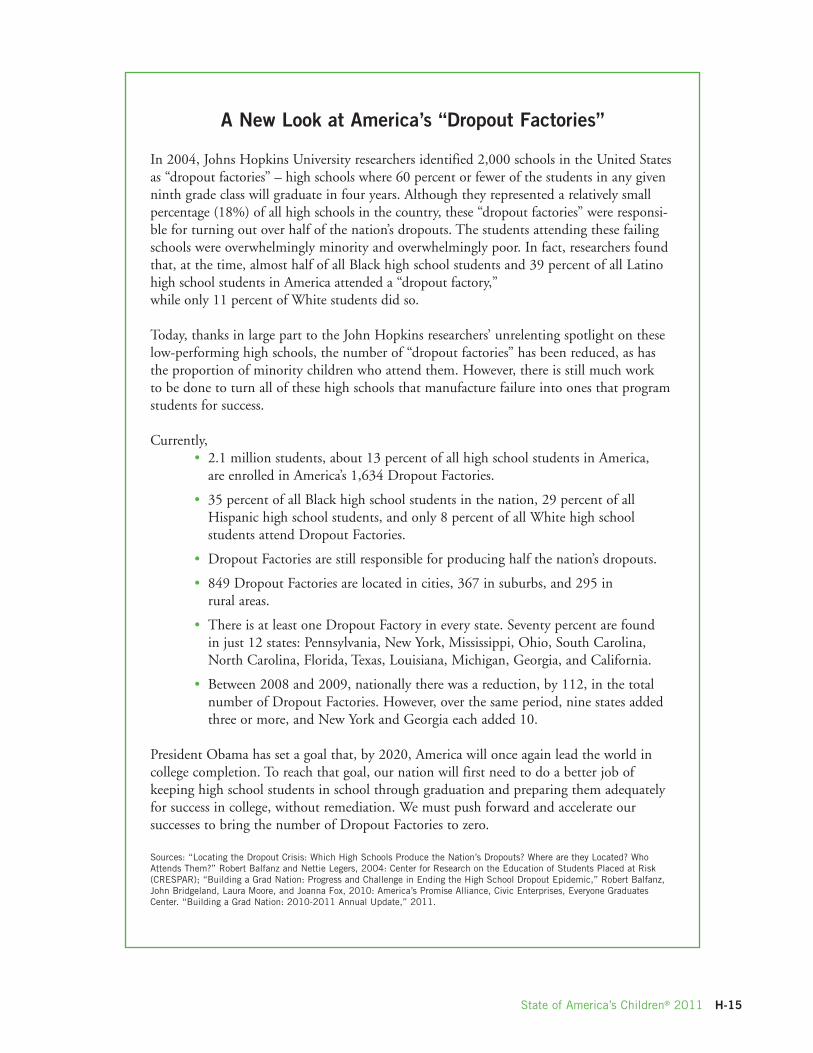
A New Look at America’s “Dropout Factories”
In 2004, Johns Hopkins University researchers identified 2,000 schools in the United Statesas “dropout factories” – high schools where 60 percent or fewer of the students in any givenninth grade class will graduate in four years. Although they represented a relatively smallpercentage (18%) of all high schools in the country, these “dropout factories” were responsi-ble for turning out over half of the nation’s dropouts. The students attending these failingschools were overwhelmingly minority and overwhelmingly poor. In fact, researchers foundthat, at the time, almost half of all Black high school students and 39 percent of all Latinohigh school students in America attended a “dropout factory,”while only 11 percent of White students did so.
Today, thanks in large part to the John Hopkins researchers’ unrelenting spotlight on theselow-performing high schools, the number of “dropout factories” has been reduced, as hasthe proportion of minority children who attend them. However, there is still much workto be done to turn all of these high schools that manufacture failure into ones that programstudents for success.
Currently,• 2.1 million students, about 13 percent of all high school students in America,are enrolled in America’s 1,634 Dropout Factories.
• 35 percent of all Black high school students in the nation, 29 percent of allHispanic high school students, and only 8 percent of all White high schoolstudents attend Dropout Factories.
• Dropout Factories are still responsible for producing half the nation’s dropouts.
• 849 Dropout Factories are located in cities, 367 in suburbs, and 295 inrural areas.
• There is at least one Dropout Factory in every state. Seventy percent are foundin just 12 states: Pennsylvania, New York, Mississippi, Ohio, South Carolina,North Carolina, Florida, Texas, Louisiana, Michigan, Georgia, and California.
• Between 2008 and 2009, nationally there was a reduction, by 112, in the totalnumber of Dropout Factories. However, over the same period, nine states addedthree or more, and New York and Georgia each added 10.
President Obama has set a goal that, by 2020, America will once again lead the world incollege completion. To reach that goal, our nation will first need to do a better job ofkeeping high school students in school through graduation and preparing them adequatelyfor success in college, without remediation. We must push forward and accelerate oursuccesses to bring the number of Dropout Factories to zero.
Sources: “Locating the Dropout Crisis: Which High Schools Produce the Nation’s Dropouts? Where are they Located? WhoAttends Them?” Robert Balfanz and Nettie Legers, 2004: Center for Research on the Education of Students Placed at Risk(CRESPAR); “Building a Grad Nation: Progress and Challenge in Ending the High School Dropout Epidemic,” Robert Balfanz,John Bridgeland, Laura Moore, and Joanna Fox, 2010: America’s Promise Alliance, Civic Enterprises, Everyone GraduatesCenter. “Building a Grad Nation: 2010-2011 Annual Update,” 2011.
H-16 Children’s Defense Fund
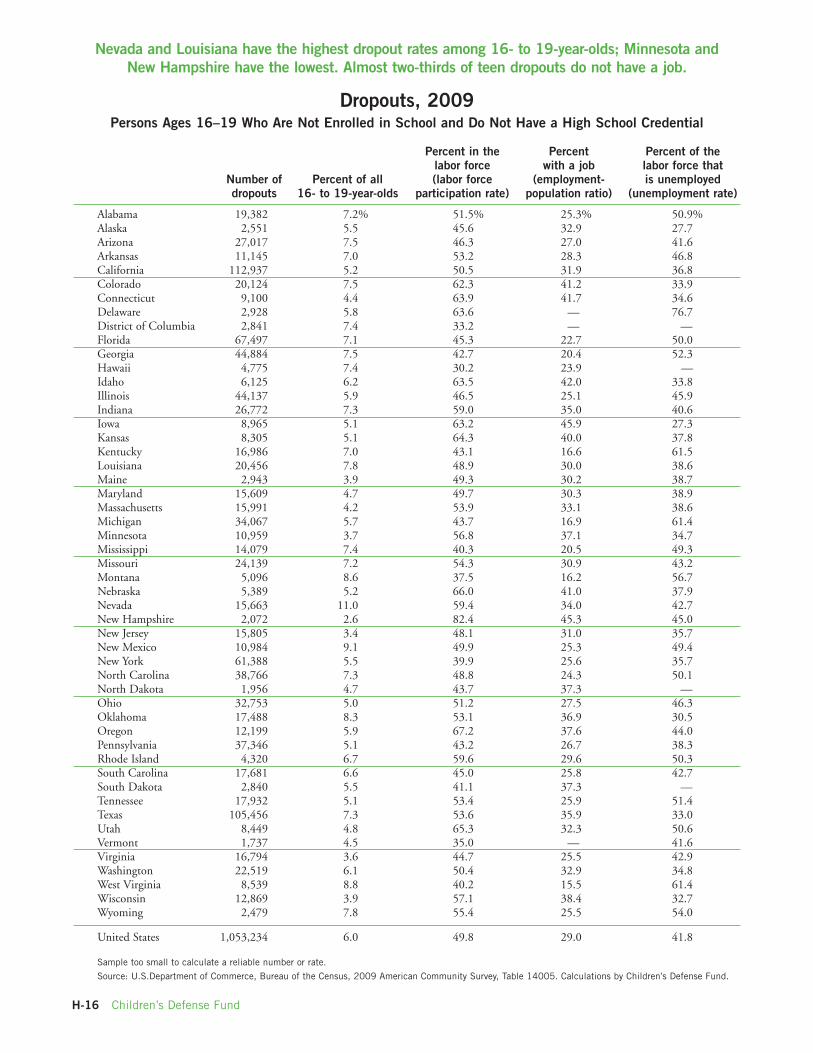
Dropouts, 2009Persons Ages 16–19 Who Are Not Enrolled in School and Do Not Have a High School Credential
Percent in the Percent Percent of thelabor force with a job labor force that
Number of Percent of all (labor force (employment- is unemployeddropouts 16- to 19-year-olds participation rate) population ratio) (unemployment rate)
Alabama 19,382 7.2% 51.5% 25.3% 50.9%Alaska 2,551 5.5 45.6 32.9 27.7Arizona 27,017 7.5 46.3 27.0 41.6Arkansas 11,145 7.0 53.2 28.3 46.8California 112,937 5.2 50.5 31.9 36.8Colorado 20,124 7.5 62.3 41.2 33.9Connecticut 9,100 4.4 63.9 41.7 34.6Delaware 2,928 5.8 63.6 — 76.7District of Columbia 2,841 7.4 33.2 — —Florida 67,497 7.1 45.3 22.7 50.0Georgia 44,884 7.5 42.7 20.4 52.3Hawaii 4,775 7.4 30.2 23.9 —Idaho 6,125 6.2 63.5 42.0 33.8Illinois 44,137 5.9 46.5 25.1 45.9Indiana 26,772 7.3 59.0 35.0 40.6Iowa 8,965 5.1 63.2 45.9 27.3Kansas 8,305 5.1 64.3 40.0 37.8Kentucky 16,986 7.0 43.1 16.6 61.5Louisiana 20,456 7.8 48.9 30.0 38.6Maine 2,943 3.9 49.3 30.2 38.7Maryland 15,609 4.7 49.7 30.3 38.9Massachusetts 15,991 4.2 53.9 33.1 38.6Michigan 34,067 5.7 43.7 16.9 61.4Minnesota 10,959 3.7 56.8 37.1 34.7Mississippi 14,079 7.4 40.3 20.5 49.3Missouri 24,139 7.2 54.3 30.9 43.2Montana 5,096 8.6 37.5 16.2 56.7Nebraska 5,389 5.2 66.0 41.0 37.9Nevada 15,663 11.0 59.4 34.0 42.7New Hampshire 2,072 2.6 82.4 45.3 45.0New Jersey 15,805 3.4 48.1 31.0 35.7New Mexico 10,984 9.1 49.9 25.3 49.4New York 61,388 5.5 39.9 25.6 35.7North Carolina 38,766 7.3 48.8 24.3 50.1North Dakota 1,956 4.7 43.7 37.3 —Ohio 32,753 5.0 51.2 27.5 46.3Oklahoma 17,488 8.3 53.1 36.9 30.5Oregon 12,199 5.9 67.2 37.6 44.0Pennsylvania 37,346 5.1 43.2 26.7 38.3Rhode Island 4,320 6.7 59.6 29.6 50.3South Carolina 17,681 6.6 45.0 25.8 42.7South Dakota 2,840 5.5 41.1 37.3 —Tennessee 17,932 5.1 53.4 25.9 51.4Texas 105,456 7.3 53.6 35.9 33.0Utah 8,449 4.8 65.3 32.3 50.6Vermont 1,737 4.5 35.0 — 41.6Virginia 16,794 3.6 44.7 25.5 42.9Washington 22,519 6.1 50.4 32.9 34.8West Virginia 8,539 8.8 40.2 15.5 61.4Wisconsin 12,869 3.9 57.1 38.4 32.7Wyoming 2,479 7.8 55.4 25.5 54.0
United States 1,053,234 6.0 49.8 29.0 41.8
Sample too small to calculate a reliable number or rate.
Source: U.S.Department of Commerce, Bureau of the Census, 2009 American Community Survey, Table 14005. Calculations by Children’s Defense Fund.
Nevada and Louisiana have the highest dropout rates among 16- to 19-year-olds; Minnesota andNew Hampshire have the lowest. Almost two-thirds of teen dropouts do not have a job.
H-17State of America’s Children® 2011
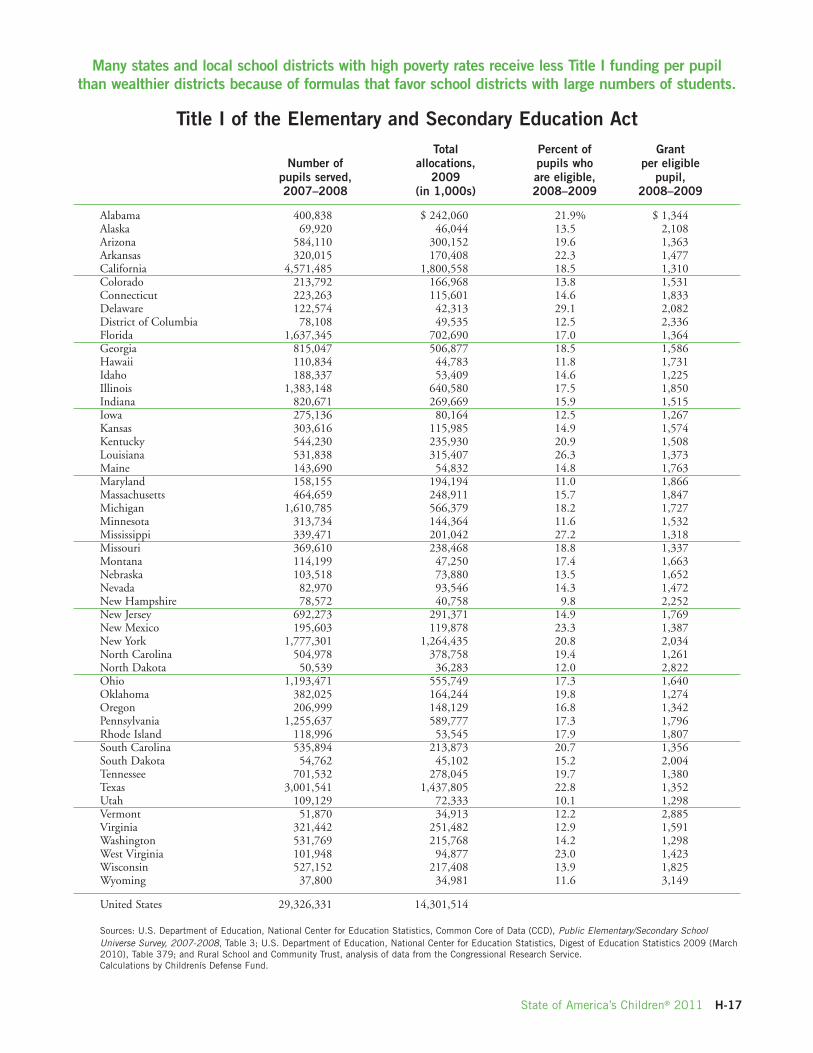
Title I of the Elementary and Secondary Education ActTotal Percent of Grant
Number of allocations, pupils who per eligiblepupils served, 2009 are eligible, pupil,2007–2008 (in 1,000s) 2008–2009 2008–2009
Alabama 400,838 $ 242,060 21.9% $ 1,344Alaska 69,920 46,044 13.5 2,108Arizona 584,110 300,152 19.6 1,363Arkansas 320,015 170,408 22.3 1,477California 4,571,485 1,800,558 18.5 1,310Colorado 213,792 166,968 13.8 1,531Connecticut 223,263 115,601 14.6 1,833Delaware 122,574 42,313 29.1 2,082District of Columbia 78,108 49,535 12.5 2,336Florida 1,637,345 702,690 17.0 1,364Georgia 815,047 506,877 18.5 1,586Hawaii 110,834 44,783 11.8 1,731Idaho 188,337 53,409 14.6 1,225Illinois 1,383,148 640,580 17.5 1,850Indiana 820,671 269,669 15.9 1,515Iowa 275,136 80,164 12.5 1,267Kansas 303,616 115,985 14.9 1,574Kentucky 544,230 235,930 20.9 1,508Louisiana 531,838 315,407 26.3 1,373Maine 143,690 54,832 14.8 1,763Maryland 158,155 194,194 11.0 1,866Massachusetts 464,659 248,911 15.7 1,847Michigan 1,610,785 566,379 18.2 1,727Minnesota 313,734 144,364 11.6 1,532Mississippi 339,471 201,042 27.2 1,318Missouri 369,610 238,468 18.8 1,337Montana 114,199 47,250 17.4 1,663Nebraska 103,518 73,880 13.5 1,652Nevada 82,970 93,546 14.3 1,472New Hampshire 78,572 40,758 9.8 2,252New Jersey 692,273 291,371 14.9 1,769New Mexico 195,603 119,878 23.3 1,387New York 1,777,301 1,264,435 20.8 2,034North Carolina 504,978 378,758 19.4 1,261North Dakota 50,539 36,283 12.0 2,822Ohio 1,193,471 555,749 17.3 1,640Oklahoma 382,025 164,244 19.8 1,274Oregon 206,999 148,129 16.8 1,342Pennsylvania 1,255,637 589,777 17.3 1,796Rhode Island 118,996 53,545 17.9 1,807South Carolina 535,894 213,873 20.7 1,356South Dakota 54,762 45,102 15.2 2,004Tennessee 701,532 278,045 19.7 1,380Texas 3,001,541 1,437,805 22.8 1,352Utah 109,129 72,333 10.1 1,298Vermont 51,870 34,913 12.2 2,885Virginia 321,442 251,482 12.9 1,591Washington 531,769 215,768 14.2 1,298West Virginia 101,948 94,877 23.0 1,423Wisconsin 527,152 217,408 13.9 1,825Wyoming 37,800 34,981 11.6 3,149
United States 29,326,331 14,301,514
Sources: U.S. Department of Education, National Center for Education Statistics, Common Core of Data (CCD), Public Elementary/Secondary SchoolUniverse Survey, 2007-2008, Table 3; U.S. Department of Education, National Center for Education Statistics, Digest of Education Statistics 2009 (March2010), Table 379; and Rural School and Community Trust, analysis of data from the Congressional Research Service.Calculations by Childrenís Defense Fund.
Many states and local school districts with high poverty rates receive less Title I funding per pupilthan wealthier districts because of formulas that favor school districts with large numbers of students.
H-18 Children’s Defense Fund
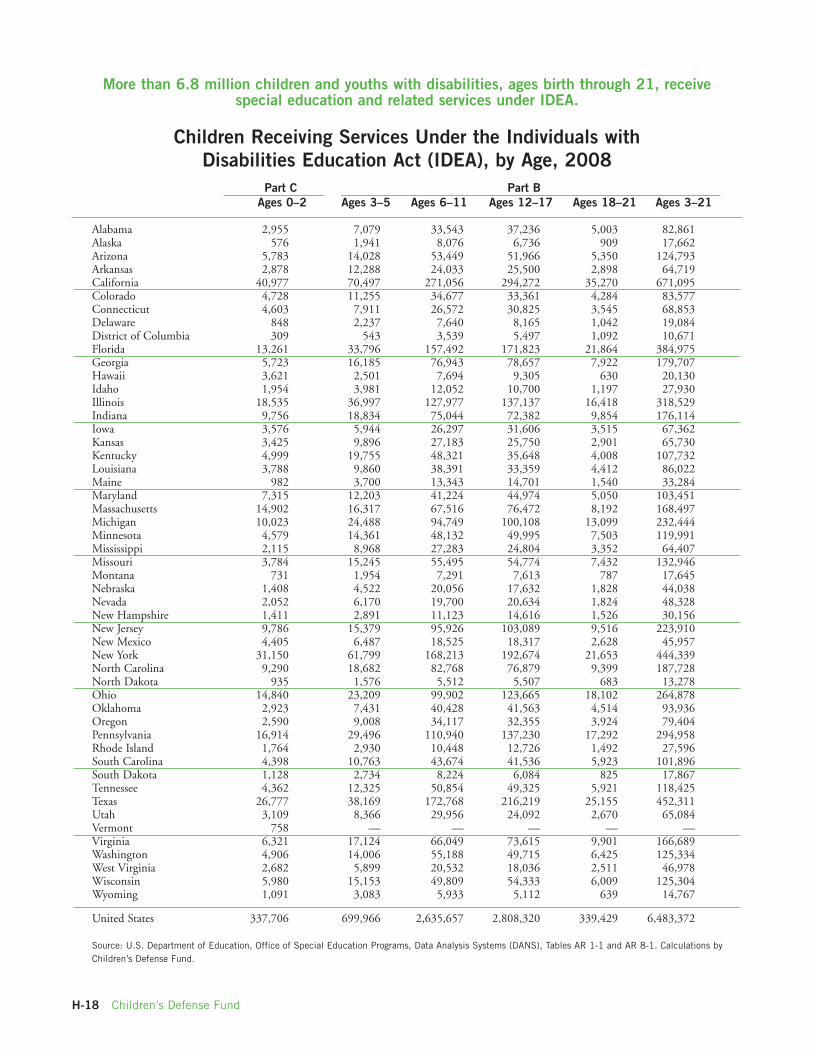
Children Receiving Services Under the Individuals withDisabilities Education Act (IDEA), by Age, 2008
Part C Part BAges 0–2 Ages 3–5 Ages 6–11 Ages 12–17 Ages 18–21 Ages 3–21
Alabama 2,955 7,079 33,543 37,236 5,003 82,861Alaska 576 1,941 8,076 6,736 909 17,662Arizona 5,783 14,028 53,449 51,966 5,350 124,793Arkansas 2,878 12,288 24,033 25,500 2,898 64,719California 40,977 70,497 271,056 294,272 35,270 671,095Colorado 4,728 11,255 34,677 33,361 4,284 83,577Connecticut 4,603 7,911 26,572 30,825 3,545 68,853Delaware 848 2,237 7,640 8,165 1,042 19,084District of Columbia 309 543 3,539 5,497 1,092 10,671Florida 13,261 33,796 157,492 171,823 21,864 384,975Georgia 5,723 16,185 76,943 78,657 7,922 179,707Hawaii 3,621 2,501 7,694 9,305 630 20,130Idaho 1,954 3,981 12,052 10,700 1,197 27,930Illinois 18,535 36,997 127,977 137,137 16,418 318,529Indiana 9,756 18,834 75,044 72,382 9,854 176,114Iowa 3,576 5,944 26,297 31,606 3,515 67,362Kansas 3,425 9,896 27,183 25,750 2,901 65,730Kentucky 4,999 19,755 48,321 35,648 4,008 107,732Louisiana 3,788 9,860 38,391 33,359 4,412 86,022Maine 982 3,700 13,343 14,701 1,540 33,284Maryland 7,315 12,203 41,224 44,974 5,050 103,451Massachusetts 14,902 16,317 67,516 76,472 8,192 168,497Michigan 10,023 24,488 94,749 100,108 13,099 232,444Minnesota 4,579 14,361 48,132 49,995 7,503 119,991Mississippi 2,115 8,968 27,283 24,804 3,352 64,407Missouri 3,784 15,245 55,495 54,774 7,432 132,946Montana 731 1,954 7,291 7,613 787 17,645Nebraska 1,408 4,522 20,056 17,632 1,828 44,038Nevada 2,052 6,170 19,700 20,634 1,824 48,328New Hampshire 1,411 2,891 11,123 14,616 1,526 30,156New Jersey 9,786 15,379 95,926 103,089 9,516 223,910New Mexico 4,405 6,487 18,525 18,317 2,628 45,957New York 31,150 61,799 168,213 192,674 21,653 444,339North Carolina 9,290 18,682 82,768 76,879 9,399 187,728North Dakota 935 1,576 5,512 5,507 683 13,278Ohio 14,840 23,209 99,902 123,665 18,102 264,878Oklahoma 2,923 7,431 40,428 41,563 4,514 93,936Oregon 2,590 9,008 34,117 32,355 3,924 79,404Pennsylvania 16,914 29,496 110,940 137,230 17,292 294,958Rhode Island 1,764 2,930 10,448 12,726 1,492 27,596South Carolina 4,398 10,763 43,674 41,536 5,923 101,896South Dakota 1,128 2,734 8,224 6,084 825 17,867Tennessee 4,362 12,325 50,854 49,325 5,921 118,425Texas 26,777 38,169 172,768 216,219 25,155 452,311Utah 3,109 8,366 29,956 24,092 2,670 65,084Vermont 758 — — — — —Virginia 6,321 17,124 66,049 73,615 9,901 166,689Washington 4,906 14,006 55,188 49,715 6,425 125,334West Virginia 2,682 5,899 20,532 18,036 2,511 46,978Wisconsin 5,980 15,153 49,809 54,333 6,009 125,304Wyoming 1,091 3,083 5,933 5,112 639 14,767
United States 337,706 699,966 2,635,657 2,808,320 339,429 6,483,372
Source: U.S. Department of Education, Office of Special Education Programs, Data Analysis Systems (DANS), Tables AR 1-1 and AR 8-1. Calculations byChildren’s Defense Fund.
More than 6.8 million children and youths with disabilities, ages birth through 21, receivespecial education and related services under IDEA.
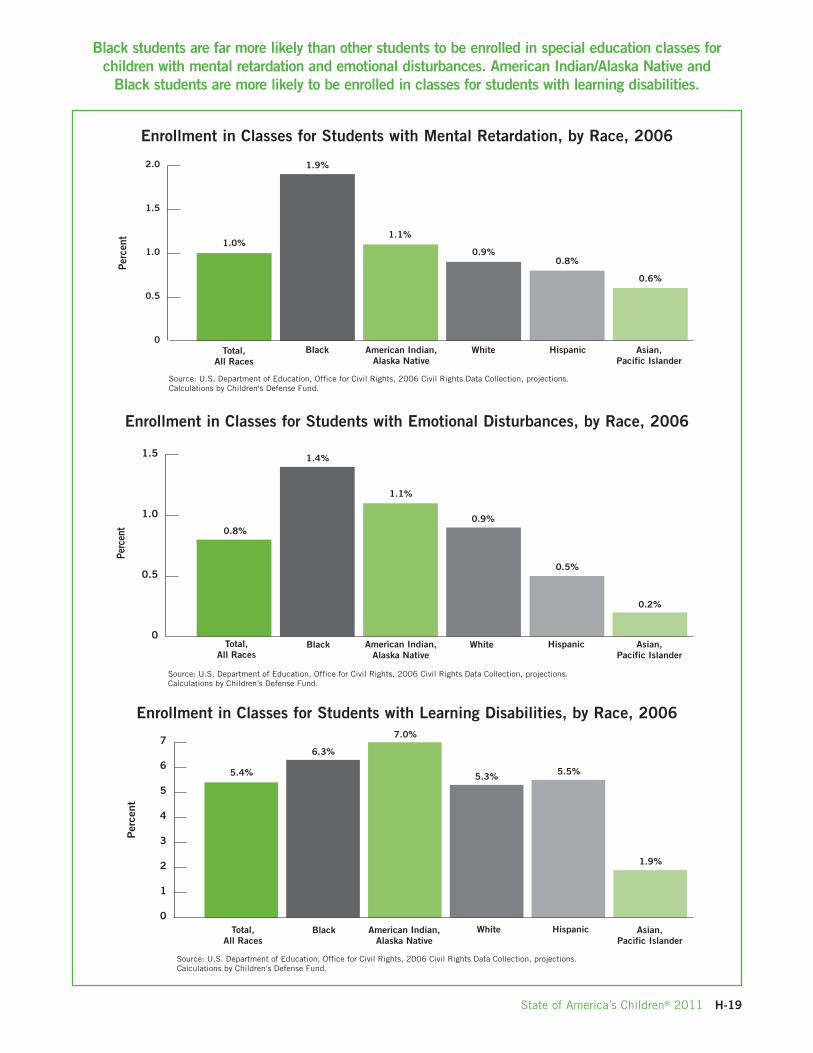
Black students are far more likely than other students to be enrolled in special education classes forchildren with mental retardation and emotional disturbances. American Indian/Alaska Native and
Black students are more likely to be enrolled in classes for students with learning disabilities.
H-19State of America’s Children® 2011
Per
cent
Source: U.S. Department of Education, Office for Civil Rights, 2006 Civil Rights Data Collection, projections.Calculations by Children’s Defense Fund.
Asian,Pacific Islander
American Indian,Alaska Native
HispanicBlack WhiteTotal,All Races
0
1
2
3
4
5
6
7
Perc
ent
Source: U.S. Department of Education, Office for Civil Rights, 2006 Civil Rights Data Collection, projections.Calculations by Children's Defense Fund.
Asian,Pacific Islander
American Indian,Alaska Native
HispanicBlack WhiteTotal,All Races
0
0.5
1.0
1.5
2.0
Perc
ent
Source: U.S. Department of Education, Office for Civil Rights, 2006 Civil Rights Data Collection, projections.Calculations by Children’s Defense Fund.
0
0.5
1.0
1.5
Asian,Pacific Islander
American Indian,Alaska Native
HispanicBlack WhiteTotal,All Races
1.0%
0.8%
5.4% 5.3%
6.3%
5.5%
7.0%
1.9%
0.9%
1.4%
0.5%
1.1%
0.2%
0.9%
1.9%
0.8%
1.1%
0.6%
Enrollment in Classes for Students with Mental Retardation, by Race, 2006
Enrollment in Classes for Students with Emotional Disturbances, by Race, 2006
Enrollment in Classes for Students with Learning Disabilities, by Race, 2006
H-20 Children’s Defense Fund
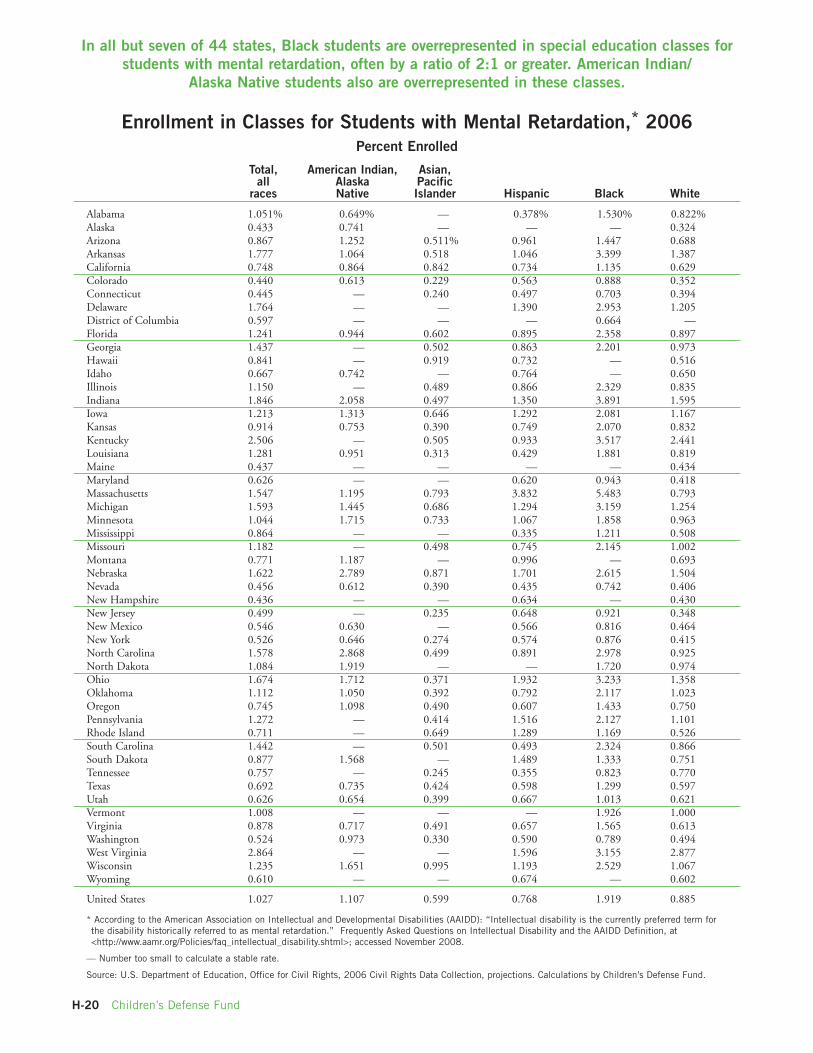
Enrollment in Classes for Students with Mental Retardation,* 2006Percent Enrolled
Total, American Indian, Asian,all Alaska Pacific
races Native Islander Hispanic Black White
Alabama 1.051% 0.649% — 0.378% 1.530% 0.822%Alaska 0.433 0.741 — — — 0.324Arizona 0.867 1.252 0.511% 0.961 1.447 0.688Arkansas 1.777 1.064 0.518 1.046 3.399 1.387California 0.748 0.864 0.842 0.734 1.135 0.629Colorado 0.440 0.613 0.229 0.563 0.888 0.352Connecticut 0.445 — 0.240 0.497 0.703 0.394Delaware 1.764 — — 1.390 2.953 1.205District of Columbia 0.597 — — — 0.664 —Florida 1.241 0.944 0.602 0.895 2.358 0.897Georgia 1.437 — 0.502 0.863 2.201 0.973Hawaii 0.841 — 0.919 0.732 — 0.516Idaho 0.667 0.742 — 0.764 — 0.650Illinois 1.150 — 0.489 0.866 2.329 0.835Indiana 1.846 2.058 0.497 1.350 3.891 1.595Iowa 1.213 1.313 0.646 1.292 2.081 1.167Kansas 0.914 0.753 0.390 0.749 2.070 0.832Kentucky 2.506 — 0.505 0.933 3.517 2.441Louisiana 1.281 0.951 0.313 0.429 1.881 0.819Maine 0.437 — — — — 0.434Maryland 0.626 — — 0.620 0.943 0.418Massachusetts 1.547 1.195 0.793 3.832 5.483 0.793Michigan 1.593 1.445 0.686 1.294 3.159 1.254Minnesota 1.044 1.715 0.733 1.067 1.858 0.963Mississippi 0.864 — — 0.335 1.211 0.508Missouri 1.182 — 0.498 0.745 2.145 1.002Montana 0.771 1.187 — 0.996 — 0.693Nebraska 1.622 2.789 0.871 1.701 2.615 1.504Nevada 0.456 0.612 0.390 0.435 0.742 0.406New Hampshire 0.436 — — 0.634 — 0.430New Jersey 0.499 — 0.235 0.648 0.921 0.348New Mexico 0.546 0.630 — 0.566 0.816 0.464New York 0.526 0.646 0.274 0.574 0.876 0.415North Carolina 1.578 2.868 0.499 0.891 2.978 0.925North Dakota 1.084 1.919 — — 1.720 0.974Ohio 1.674 1.712 0.371 1.932 3.233 1.358Oklahoma 1.112 1.050 0.392 0.792 2.117 1.023Oregon 0.745 1.098 0.490 0.607 1.433 0.750Pennsylvania 1.272 — 0.414 1.516 2.127 1.101Rhode Island 0.711 — 0.649 1.289 1.169 0.526South Carolina 1.442 — 0.501 0.493 2.324 0.866South Dakota 0.877 1.568 — 1.489 1.333 0.751Tennessee 0.757 — 0.245 0.355 0.823 0.770Texas 0.692 0.735 0.424 0.598 1.299 0.597Utah 0.626 0.654 0.399 0.667 1.013 0.621Vermont 1.008 — — — 1.926 1.000Virginia 0.878 0.717 0.491 0.657 1.565 0.613Washington 0.524 0.973 0.330 0.590 0.789 0.494West Virginia 2.864 — — 1.596 3.155 2.877Wisconsin 1.235 1.651 0.995 1.193 2.529 1.067Wyoming 0.610 — — 0.674 — 0.602
United States 1.027 1.107 0.599 0.768 1.919 0.885
* According to the American Association on Intellectual and Developmental Disabilities (AAIDD): “Intellectual disability is the currently preferred term forthe disability historically referred to as mental retardation.” Frequently Asked Questions on Intellectual Disability and the AAIDD Definition, at<http://www.aamr.org/Policies/faq_intellectual_disability.shtml>; accessed November 2008.
— Number too small to calculate a stable rate.
Source: U.S. Department of Education, Office for Civil Rights, 2006 Civil Rights Data Collection, projections. Calculations by Children’s Defense Fund.
In all but seven of 44 states, Black students are overrepresented in special education classes forstudents with mental retardation, often by a ratio of 2:1 or greater. American Indian/
Alaska Native students also are overrepresented in these classes.
H-21State of America’s Children® 2011
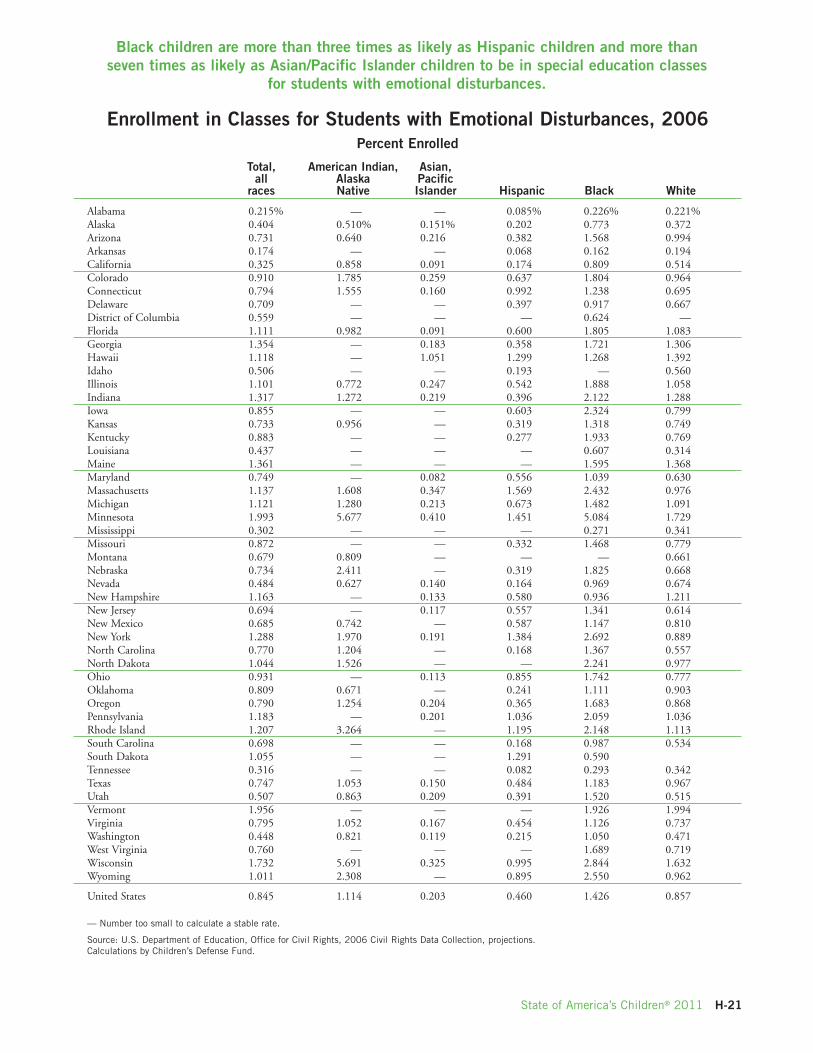
Enrollment in Classes for Students with Emotional Disturbances, 2006Percent Enrolled
Total, American Indian, Asian,all Alaska Pacific
races Native Islander Hispanic Black White
Alabama 0.215% — — 0.085% 0.226% 0.221%Alaska 0.404 0.510% 0.151% 0.202 0.773 0.372Arizona 0.731 0.640 0.216 0.382 1.568 0.994Arkansas 0.174 — — 0.068 0.162 0.194California 0.325 0.858 0.091 0.174 0.809 0.514Colorado 0.910 1.785 0.259 0.637 1.804 0.964Connecticut 0.794 1.555 0.160 0.992 1.238 0.695Delaware 0.709 — — 0.397 0.917 0.667District of Columbia 0.559 — — — 0.624 —Florida 1.111 0.982 0.091 0.600 1.805 1.083Georgia 1.354 — 0.183 0.358 1.721 1.306Hawaii 1.118 — 1.051 1.299 1.268 1.392Idaho 0.506 — — 0.193 — 0.560Illinois 1.101 0.772 0.247 0.542 1.888 1.058Indiana 1.317 1.272 0.219 0.396 2.122 1.288Iowa 0.855 — — 0.603 2.324 0.799Kansas 0.733 0.956 — 0.319 1.318 0.749Kentucky 0.883 — — 0.277 1.933 0.769Louisiana 0.437 — — — 0.607 0.314Maine 1.361 — — — 1.595 1.368Maryland 0.749 — 0.082 0.556 1.039 0.630Massachusetts 1.137 1.608 0.347 1.569 2.432 0.976Michigan 1.121 1.280 0.213 0.673 1.482 1.091Minnesota 1.993 5.677 0.410 1.451 5.084 1.729Mississippi 0.302 — — — 0.271 0.341Missouri 0.872 — — 0.332 1.468 0.779Montana 0.679 0.809 — — — 0.661Nebraska 0.734 2.411 — 0.319 1.825 0.668Nevada 0.484 0.627 0.140 0.164 0.969 0.674New Hampshire 1.163 — 0.133 0.580 0.936 1.211New Jersey 0.694 — 0.117 0.557 1.341 0.614New Mexico 0.685 0.742 — 0.587 1.147 0.810New York 1.288 1.970 0.191 1.384 2.692 0.889North Carolina 0.770 1.204 — 0.168 1.367 0.557North Dakota 1.044 1.526 — — 2.241 0.977Ohio 0.931 — 0.113 0.855 1.742 0.777Oklahoma 0.809 0.671 — 0.241 1.111 0.903Oregon 0.790 1.254 0.204 0.365 1.683 0.868Pennsylvania 1.183 — 0.201 1.036 2.059 1.036Rhode Island 1.207 3.264 — 1.195 2.148 1.113South Carolina 0.698 — — 0.168 0.987 0.534South Dakota 1.055 — — 1.291 0.590Tennessee 0.316 — — 0.082 0.293 0.342Texas 0.747 1.053 0.150 0.484 1.183 0.967Utah 0.507 0.863 0.209 0.391 1.520 0.515Vermont 1.956 — — — 1.926 1.994Virginia 0.795 1.052 0.167 0.454 1.126 0.737Washington 0.448 0.821 0.119 0.215 1.050 0.471West Virginia 0.760 — — — 1.689 0.719Wisconsin 1.732 5.691 0.325 0.995 2.844 1.632Wyoming 1.011 2.308 — 0.895 2.550 0.962
United States 0.845 1.114 0.203 0.460 1.426 0.857
— Number too small to calculate a stable rate.
Source: U.S. Department of Education, Office for Civil Rights, 2006 Civil Rights Data Collection, projections.Calculations by Children’s Defense Fund.
Black children are more than three times as likely as Hispanic children and more thanseven times as likely as Asian/Pacific Islander children to be in special education classes
for students with emotional disturbances.
H-22 Children’s Defense Fund
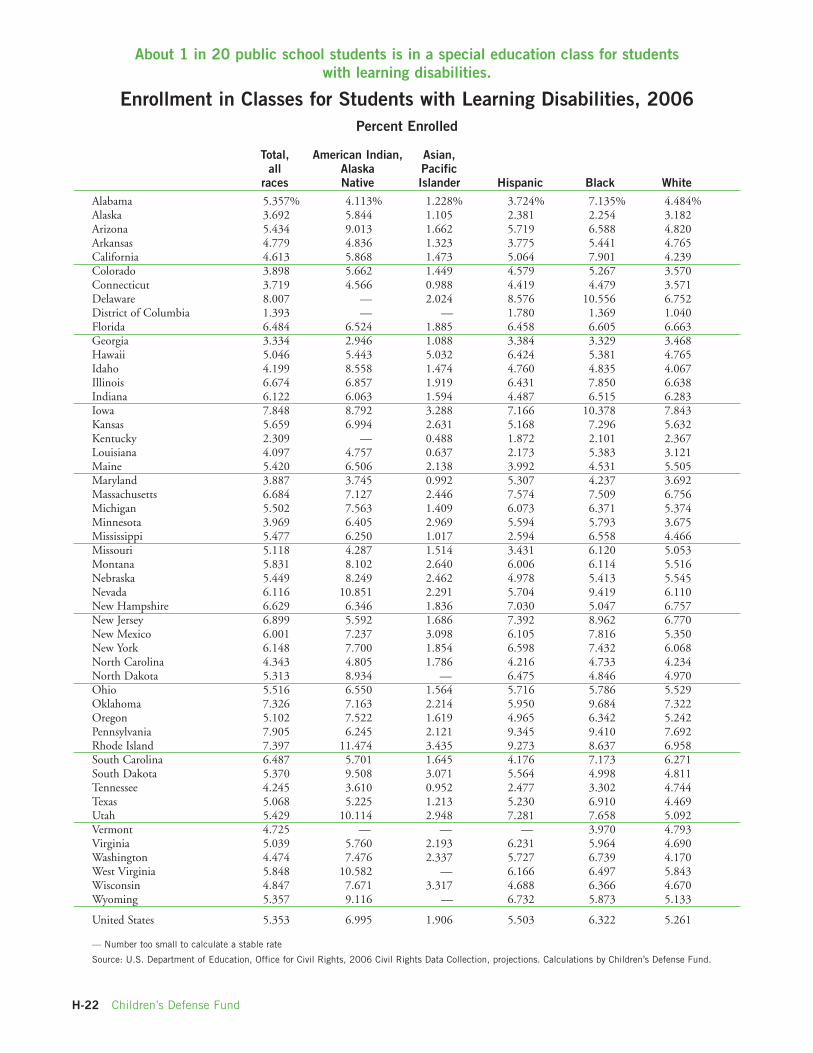
Enrollment in Classes for Students with Learning Disabilities, 2006Percent Enrolled
Total, American Indian, Asian,all Alaska Pacific
races Native Islander Hispanic Black WhiteAlabama 5.357% 4.113% 1.228% 3.724% 7.135% 4.484%Alaska 3.692 5.844 1.105 2.381 2.254 3.182Arizona 5.434 9.013 1.662 5.719 6.588 4.820Arkansas 4.779 4.836 1.323 3.775 5.441 4.765California 4.613 5.868 1.473 5.064 7.901 4.239Colorado 3.898 5.662 1.449 4.579 5.267 3.570Connecticut 3.719 4.566 0.988 4.419 4.479 3.571Delaware 8.007 — 2.024 8.576 10.556 6.752District of Columbia 1.393 — — 1.780 1.369 1.040Florida 6.484 6.524 1.885 6.458 6.605 6.663Georgia 3.334 2.946 1.088 3.384 3.329 3.468Hawaii 5.046 5.443 5.032 6.424 5.381 4.765Idaho 4.199 8.558 1.474 4.760 4.835 4.067Illinois 6.674 6.857 1.919 6.431 7.850 6.638Indiana 6.122 6.063 1.594 4.487 6.515 6.283Iowa 7.848 8.792 3.288 7.166 10.378 7.843Kansas 5.659 6.994 2.631 5.168 7.296 5.632Kentucky 2.309 — 0.488 1.872 2.101 2.367Louisiana 4.097 4.757 0.637 2.173 5.383 3.121Maine 5.420 6.506 2.138 3.992 4.531 5.505Maryland 3.887 3.745 0.992 5.307 4.237 3.692Massachusetts 6.684 7.127 2.446 7.574 7.509 6.756Michigan 5.502 7.563 1.409 6.073 6.371 5.374Minnesota 3.969 6.405 2.969 5.594 5.793 3.675Mississippi 5.477 6.250 1.017 2.594 6.558 4.466Missouri 5.118 4.287 1.514 3.431 6.120 5.053Montana 5.831 8.102 2.640 6.006 6.114 5.516Nebraska 5.449 8.249 2.462 4.978 5.413 5.545Nevada 6.116 10.851 2.291 5.704 9.419 6.110New Hampshire 6.629 6.346 1.836 7.030 5.047 6.757New Jersey 6.899 5.592 1.686 7.392 8.962 6.770New Mexico 6.001 7.237 3.098 6.105 7.816 5.350New York 6.148 7.700 1.854 6.598 7.432 6.068North Carolina 4.343 4.805 1.786 4.216 4.733 4.234North Dakota 5.313 8.934 — 6.475 4.846 4.970Ohio 5.516 6.550 1.564 5.716 5.786 5.529Oklahoma 7.326 7.163 2.214 5.950 9.684 7.322Oregon 5.102 7.522 1.619 4.965 6.342 5.242Pennsylvania 7.905 6.245 2.121 9.345 9.410 7.692Rhode Island 7.397 11.474 3.435 9.273 8.637 6.958South Carolina 6.487 5.701 1.645 4.176 7.173 6.271South Dakota 5.370 9.508 3.071 5.564 4.998 4.811Tennessee 4.245 3.610 0.952 2.477 3.302 4.744Texas 5.068 5.225 1.213 5.230 6.910 4.469Utah 5.429 10.114 2.948 7.281 7.658 5.092Vermont 4.725 — — — 3.970 4.793Virginia 5.039 5.760 2.193 6.231 5.964 4.690Washington 4.474 7.476 2.337 5.727 6.739 4.170West Virginia 5.848 10.582 — 6.166 6.497 5.843Wisconsin 4.847 7.671 3.317 4.688 6.366 4.670Wyoming 5.357 9.116 — 6.732 5.873 5.133
United States 5.353 6.995 1.906 5.503 6.322 5.261
— Number too small to calculate a stable rate
Source: U.S. Department of Education, Office for Civil Rights, 2006 Civil Rights Data Collection, projections. Calculations by Children’s Defense Fund.
About 1 in 20 public school students is in a special education class for studentswith learning disabilities.
H-23State of America’s Children® 2011
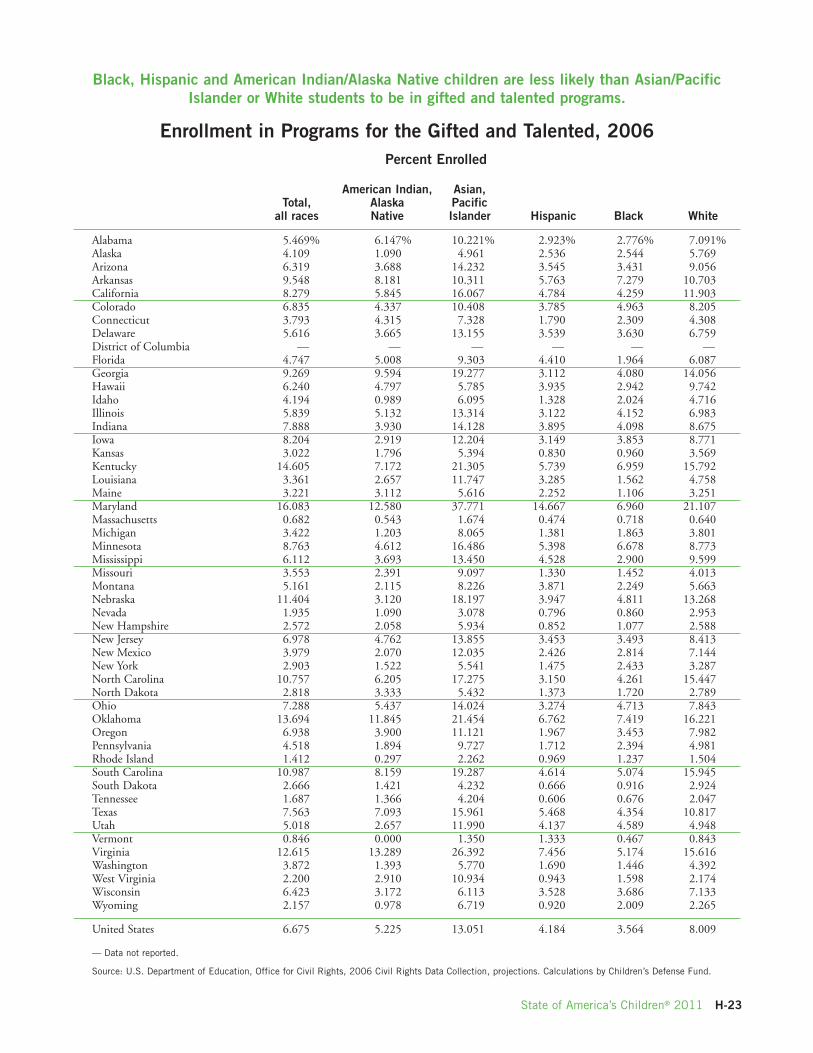
Enrollment in Programs for the Gifted and Talented, 2006Percent Enrolled
American Indian, Asian,Total, Alaska Pacific
all races Native Islander Hispanic Black White
Alabama 5.469% 6.147% 10.221% 2.923% 2.776% 7.091%Alaska 4.109 1.090 4.961 2.536 2.544 5.769Arizona 6.319 3.688 14.232 3.545 3.431 9.056Arkansas 9.548 8.181 10.311 5.763 7.279 10.703California 8.279 5.845 16.067 4.784 4.259 11.903Colorado 6.835 4.337 10.408 3.785 4.963 8.205Connecticut 3.793 4.315 7.328 1.790 2.309 4.308Delaware 5.616 3.665 13.155 3.539 3.630 6.759District of Columbia — — — — — —Florida 4.747 5.008 9.303 4.410 1.964 6.087Georgia 9.269 9.594 19.277 3.112 4.080 14.056Hawaii 6.240 4.797 5.785 3.935 2.942 9.742Idaho 4.194 0.989 6.095 1.328 2.024 4.716Illinois 5.839 5.132 13.314 3.122 4.152 6.983Indiana 7.888 3.930 14.128 3.895 4.098 8.675Iowa 8.204 2.919 12.204 3.149 3.853 8.771Kansas 3.022 1.796 5.394 0.830 0.960 3.569Kentucky 14.605 7.172 21.305 5.739 6.959 15.792Louisiana 3.361 2.657 11.747 3.285 1.562 4.758Maine 3.221 3.112 5.616 2.252 1.106 3.251Maryland 16.083 12.580 37.771 14.667 6.960 21.107Massachusetts 0.682 0.543 1.674 0.474 0.718 0.640Michigan 3.422 1.203 8.065 1.381 1.863 3.801Minnesota 8.763 4.612 16.486 5.398 6.678 8.773Mississippi 6.112 3.693 13.450 4.528 2.900 9.599Missouri 3.553 2.391 9.097 1.330 1.452 4.013Montana 5.161 2.115 8.226 3.871 2.249 5.663Nebraska 11.404 3.120 18.197 3.947 4.811 13.268Nevada 1.935 1.090 3.078 0.796 0.860 2.953New Hampshire 2.572 2.058 5.934 0.852 1.077 2.588New Jersey 6.978 4.762 13.855 3.453 3.493 8.413New Mexico 3.979 2.070 12.035 2.426 2.814 7.144New York 2.903 1.522 5.541 1.475 2.433 3.287North Carolina 10.757 6.205 17.275 3.150 4.261 15.447North Dakota 2.818 3.333 5.432 1.373 1.720 2.789Ohio 7.288 5.437 14.024 3.274 4.713 7.843Oklahoma 13.694 11.845 21.454 6.762 7.419 16.221Oregon 6.938 3.900 11.121 1.967 3.453 7.982Pennsylvania 4.518 1.894 9.727 1.712 2.394 4.981Rhode Island 1.412 0.297 2.262 0.969 1.237 1.504South Carolina 10.987 8.159 19.287 4.614 5.074 15.945South Dakota 2.666 1.421 4.232 0.666 0.916 2.924Tennessee 1.687 1.366 4.204 0.606 0.676 2.047Texas 7.563 7.093 15.961 5.468 4.354 10.817Utah 5.018 2.657 11.990 4.137 4.589 4.948Vermont 0.846 0.000 1.350 1.333 0.467 0.843Virginia 12.615 13.289 26.392 7.456 5.174 15.616Washington 3.872 1.393 5.770 1.690 1.446 4.392West Virginia 2.200 2.910 10.934 0.943 1.598 2.174Wisconsin 6.423 3.172 6.113 3.528 3.686 7.133Wyoming 2.157 0.978 6.719 0.920 2.009 2.265
United States 6.675 5.225 13.051 4.184 3.564 8.009
— Data not reported.
Source: U.S. Department of Education, Office for Civil Rights, 2006 Civil Rights Data Collection, projections. Calculations by Children’s Defense Fund.
Black, Hispanic and American Indian/Alaska Native children are less likely than Asian/PacificIslander or White students to be in gifted and talented programs.
H-24 Children’s Defense Fund
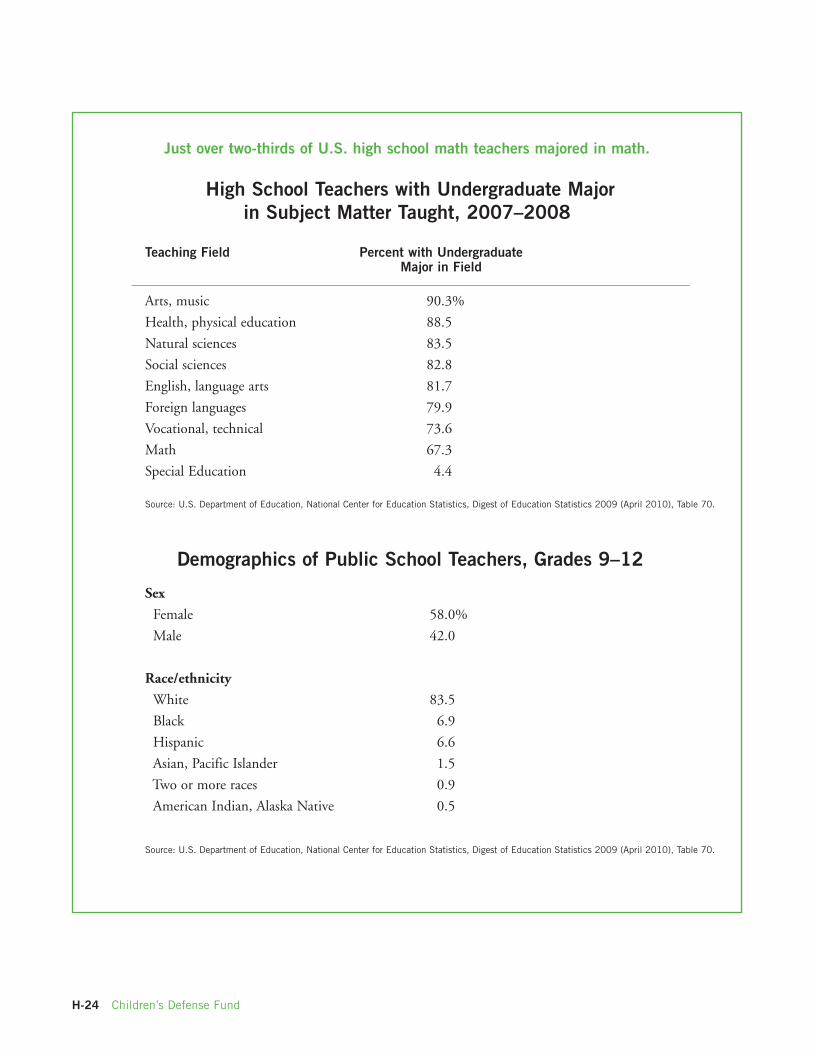
High School Teachers with Undergraduate Majorin Subject Matter Taught, 2007–2008
Teaching Field Percent with UndergraduateMajor in Field
Arts, music 90.3%
Health, physical education 88.5
Natural sciences 83.5
Social sciences 82.8
English, language arts 81.7
Foreign languages 79.9
Vocational, technical 73.6
Math 67.3
Special Education 4.4
Source: U.S. Department of Education, National Center for Education Statistics, Digest of Education Statistics 2009 (April 2010), Table 70.
Demographics of Public School Teachers, Grades 9–12
Sex
Female 58.0%
Male 42.0
Race/ethnicity
White 83.5
Black 6.9
Hispanic 6.6
Asian, Pacific Islander 1.5
Two or more races 0.9
American Indian, Alaska Native 0.5
Source: U.S. Department of Education, National Center for Education Statistics, Digest of Education Statistics 2009 (April 2010), Table 70.
Just over two-thirds of U.S. high school math teachers majored in math.
H-25State of America’s Children® 2011
Per
cent
ages
25
–29
who
com
plet
ed4
year
sof
colle
geor
mor
e
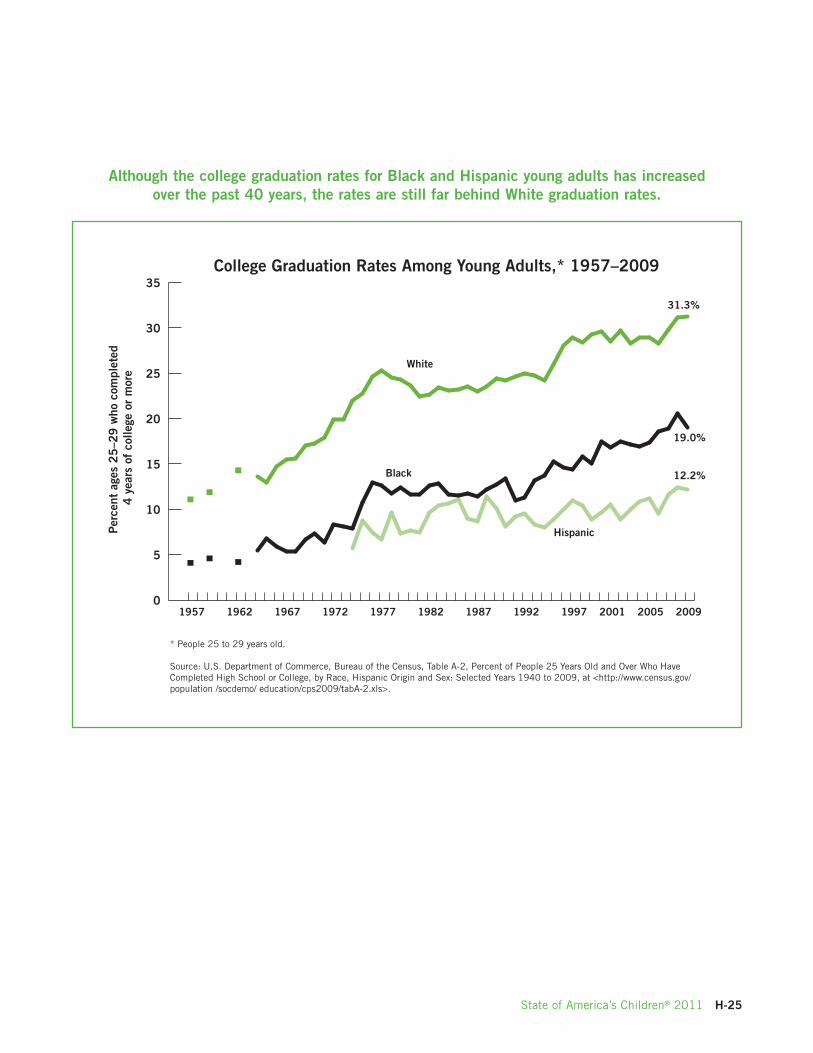
College Graduation Rates Among Young Adults,* 1957–2009
* People 25 to 29 years old.
Source: U.S. Department of Commerce, Bureau of the Census, Table A-2, Percent of People 25 Years Old and Over Who HaveCompleted High School or College, by Race, Hispanic Origin and Sex: Selected Years 1940 to 2009, at <http://www.census.gov/population /socdemo/ education/cps2009/tabA-2.xls>.
Black
Hispanic
White
0
5
10
15
20
25
30
35
31.3%
19.0%
12.2%
200920052001199719921987198219771972196719621957
Although the college graduation rates for Black and Hispanic young adults has increasedover the past 40 years, the rates are still far behind White graduation rates.
H-26 Children’s Defense Fund
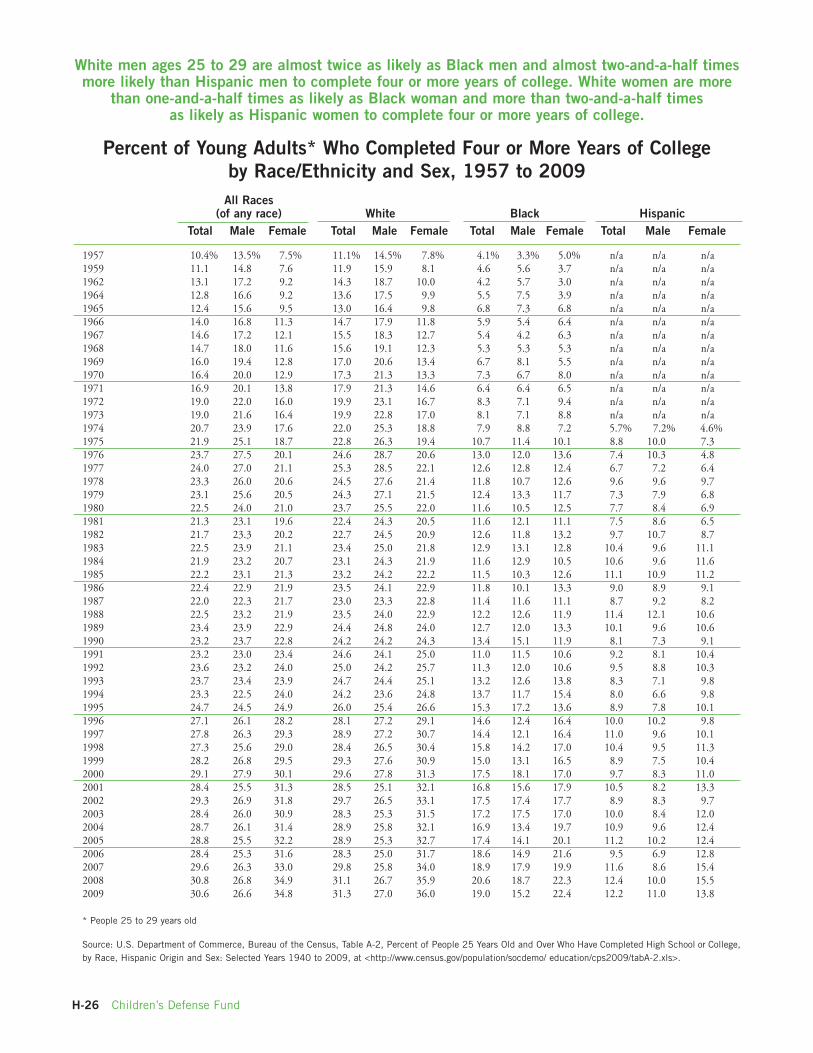
Percent of Young Adults* Who Completed Four or More Years of Collegeby Race/Ethnicity and Sex, 1957 to 2009
All Races(of any race) White Black Hispanic
Total Male Female Total Male Female Total Male Female Total Male Female
1957 10.4% 13.5% 7.5% 11.1% 14.5% 7.8% 4.1% 3.3% 5.0% n/a n/a n/a1959 11.1 14.8 7.6 11.9 15.9 8.1 4.6 5.6 3.7 n/a n/a n/a1962 13.1 17.2 9.2 14.3 18.7 10.0 4.2 5.7 3.0 n/a n/a n/a1964 12.8 16.6 9.2 13.6 17.5 9.9 5.5 7.5 3.9 n/a n/a n/a1965 12.4 15.6 9.5 13.0 16.4 9.8 6.8 7.3 6.8 n/a n/a n/a1966 14.0 16.8 11.3 14.7 17.9 11.8 5.9 5.4 6.4 n/a n/a n/a1967 14.6 17.2 12.1 15.5 18.3 12.7 5.4 4.2 6.3 n/a n/a n/a1968 14.7 18.0 11.6 15.6 19.1 12.3 5.3 5.3 5.3 n/a n/a n/a1969 16.0 19.4 12.8 17.0 20.6 13.4 6.7 8.1 5.5 n/a n/a n/a1970 16.4 20.0 12.9 17.3 21.3 13.3 7.3 6.7 8.0 n/a n/a n/a1971 16.9 20.1 13.8 17.9 21.3 14.6 6.4 6.4 6.5 n/a n/a n/a1972 19.0 22.0 16.0 19.9 23.1 16.7 8.3 7.1 9.4 n/a n/a n/a1973 19.0 21.6 16.4 19.9 22.8 17.0 8.1 7.1 8.8 n/a n/a n/a1974 20.7 23.9 17.6 22.0 25.3 18.8 7.9 8.8 7.2 5.7% 7.2% 4.6%1975 21.9 25.1 18.7 22.8 26.3 19.4 10.7 11.4 10.1 8.8 10.0 7.31976 23.7 27.5 20.1 24.6 28.7 20.6 13.0 12.0 13.6 7.4 10.3 4.81977 24.0 27.0 21.1 25.3 28.5 22.1 12.6 12.8 12.4 6.7 7.2 6.41978 23.3 26.0 20.6 24.5 27.6 21.4 11.8 10.7 12.6 9.6 9.6 9.71979 23.1 25.6 20.5 24.3 27.1 21.5 12.4 13.3 11.7 7.3 7.9 6.81980 22.5 24.0 21.0 23.7 25.5 22.0 11.6 10.5 12.5 7.7 8.4 6.91981 21.3 23.1 19.6 22.4 24.3 20.5 11.6 12.1 11.1 7.5 8.6 6.51982 21.7 23.3 20.2 22.7 24.5 20.9 12.6 11.8 13.2 9.7 10.7 8.71983 22.5 23.9 21.1 23.4 25.0 21.8 12.9 13.1 12.8 10.4 9.6 11.11984 21.9 23.2 20.7 23.1 24.3 21.9 11.6 12.9 10.5 10.6 9.6 11.61985 22.2 23.1 21.3 23.2 24.2 22.2 11.5 10.3 12.6 11.1 10.9 11.21986 22.4 22.9 21.9 23.5 24.1 22.9 11.8 10.1 13.3 9.0 8.9 9.11987 22.0 22.3 21.7 23.0 23.3 22.8 11.4 11.6 11.1 8.7 9.2 8.21988 22.5 23.2 21.9 23.5 24.0 22.9 12.2 12.6 11.9 11.4 12.1 10.61989 23.4 23.9 22.9 24.4 24.8 24.0 12.7 12.0 13.3 10.1 9.6 10.61990 23.2 23.7 22.8 24.2 24.2 24.3 13.4 15.1 11.9 8.1 7.3 9.11991 23.2 23.0 23.4 24.6 24.1 25.0 11.0 11.5 10.6 9.2 8.1 10.41992 23.6 23.2 24.0 25.0 24.2 25.7 11.3 12.0 10.6 9.5 8.8 10.31993 23.7 23.4 23.9 24.7 24.4 25.1 13.2 12.6 13.8 8.3 7.1 9.81994 23.3 22.5 24.0 24.2 23.6 24.8 13.7 11.7 15.4 8.0 6.6 9.81995 24.7 24.5 24.9 26.0 25.4 26.6 15.3 17.2 13.6 8.9 7.8 10.11996 27.1 26.1 28.2 28.1 27.2 29.1 14.6 12.4 16.4 10.0 10.2 9.81997 27.8 26.3 29.3 28.9 27.2 30.7 14.4 12.1 16.4 11.0 9.6 10.11998 27.3 25.6 29.0 28.4 26.5 30.4 15.8 14.2 17.0 10.4 9.5 11.31999 28.2 26.8 29.5 29.3 27.6 30.9 15.0 13.1 16.5 8.9 7.5 10.42000 29.1 27.9 30.1 29.6 27.8 31.3 17.5 18.1 17.0 9.7 8.3 11.02001 28.4 25.5 31.3 28.5 25.1 32.1 16.8 15.6 17.9 10.5 8.2 13.32002 29.3 26.9 31.8 29.7 26.5 33.1 17.5 17.4 17.7 8.9 8.3 9.72003 28.4 26.0 30.9 28.3 25.3 31.5 17.2 17.5 17.0 10.0 8.4 12.02004 28.7 26.1 31.4 28.9 25.8 32.1 16.9 13.4 19.7 10.9 9.6 12.42005 28.8 25.5 32.2 28.9 25.3 32.7 17.4 14.1 20.1 11.2 10.2 12.42006 28.4 25.3 31.6 28.3 25.0 31.7 18.6 14.9 21.6 9.5 6.9 12.82007 29.6 26.3 33.0 29.8 25.8 34.0 18.9 17.9 19.9 11.6 8.6 15.42008 30.8 26.8 34.9 31.1 26.7 35.9 20.6 18.7 22.3 12.4 10.0 15.52009 30.6 26.6 34.8 31.3 27.0 36.0 19.0 15.2 22.4 12.2 11.0 13.8
* People 25 to 29 years old
Source: U.S. Department of Commerce, Bureau of the Census, Table A-2, Percent of People 25 Years Old and Over Who Have Completed High School or College,by Race, Hispanic Origin and Sex: Selected Years 1940 to 2009, at <http://www.census.gov/population/socdemo/ education/cps2009/tabA-2.xls>.
White men ages 25 to 29 are almost twice as likely as Black men and almost two-and-a-half timesmore likely than Hispanic men to complete four or more years of college. White women are more
than one-and-a-half times as likely as Black woman and more than two-and-a-half timesas likely as Hispanic women to complete four or more years of college.