Embed Size (px)
Citation preview
2011 SOCIAL MEDIA BRAND INDEX
By Erica Ruyle and Theo Downes-Le Guin, Market Strategies International
Social media provides brands with new opportunities to increase market presence and to engage existing and new customers. When a consumer connects with a brand in social media, she is offering to connect her own online persona and credibility to the brand. Even if we don’t quite understand the dynamics of this relationship, marketers know that this connection represents a profoundly new opportunity to nurture loyalty and advocacy.
White Paper
Market Strategies International is pleased to offer the first edition of its annual Social Media Brand Index. The Index is intended to provide an objective, comprehensive view of how top brands across different industries succeeded in social media during 2011. The Index includes measures of both consumer-generated social media as well as the brands’ sponsored content.
Index SignificanceFor corporate marketers, a brand’s socialness matters only if we can clearly relate success in social media channels to return on investment (ROI). If consumers’ social connections to a brand produce greater profit, and if we can increase those connections through marketing activities, then we have a new—and very powerful—element in the marketing mix.
Because social media represents a young and heterogeneous marketing medium, however, we are likely to be years from agreed-upon models of ROI that are adaptable across multiple channels (e.g., Facebook vs. Twitter) and across multiple product and consumer types. After all, true ROI (effect of investment on corporate profit) is elusive even in mature and more static media such as network television advertising. Like it or not, marketing ROI is, and always will be, a tough nut to crack because marketing is not a clearly defined cost in the same way as materials or labor.
All trademarks and registered trademarks are the property of their respective owners.
For more information on the Social
Media Brand Index, please email
Market Strategies International is a
market research consultancy focused
on helping clients make confident
business decisions.
Additional information can be found
at www.marketstrategies.com.
White Paper
2
Our Index rests on the assumption that social media will remain an important part of many companies’ marketing mix, and that our ability to reliably and validly demonstrate that importance in financial terms will grow over time. For now, it’s enough to understand the “what” without fully understanding the “why.”
A Better Way to Index BrandsMarket Strategies is by no means the first to tread into the territory of measuring brand socialness. Ongoing and ad hoc studies dating back several years by EngagementDB, Infegy/Social Radar, Razorfish, Sysomos, Vitrue and Yomego (detailed in the appendix) helped lay the groundwork for marketers’ efforts to understand brand performance in social media. Our conclusion from comparing various approaches was that a comprehensive measure would have to include social media reach, consumer sentiment toward the brand, and some understanding of the impact of social interactions activated by paid marketing vs. social interactions that are wholly consumer-driven and organic.
A comprehensive measure has to include social media reach, consumer sentiment, and some understanding of the impact of social interactions activated by paid marketing vs. wholly consumer-driven content.
METHODOLOGY
BrandsOur competitive set of 146 brands for the Index is based on the top companies in the 2010 Fortune 500 and on Interbrand’s 100 Best Global Brands (see appendix for more detail). By using these sources, we sought to create a competitive set that was comprehensive but not overly weighted toward US-based and publicly traded brands.
The methodology behind the Fortune and Interbrand rankings led to the exclusion of some well-known brands that might otherwise be expected to appear in the rankings. In an effort to focus on truly global brands and on corporate rather than product brands, we excluded some telecommunications, pharmaceutical and other brands that face awareness challenges outside of home markets.
While some of the strongest and most interesting brands are, in fact, product brands—iPad, Kleenex and Lipitor to name a few—there are simply not enough publicly disclosed financial data on product brands to meet our criteria for inclusion. Only in the case of luxury goods (which Interbrand values separately from the parent entity) are product brands favored over the parent company (e.g., Louis Vuitton, not LVMH).
Technology brands that are mostly or only focused on social media brands such as Facebook and Twitter were excluded while broader technology and web brands that include—but are not limited to—social media platforms (such as Google and Amazon) were retained.
Any brand with fewer than 20,000 unique posts in the last year was not included in the Index.
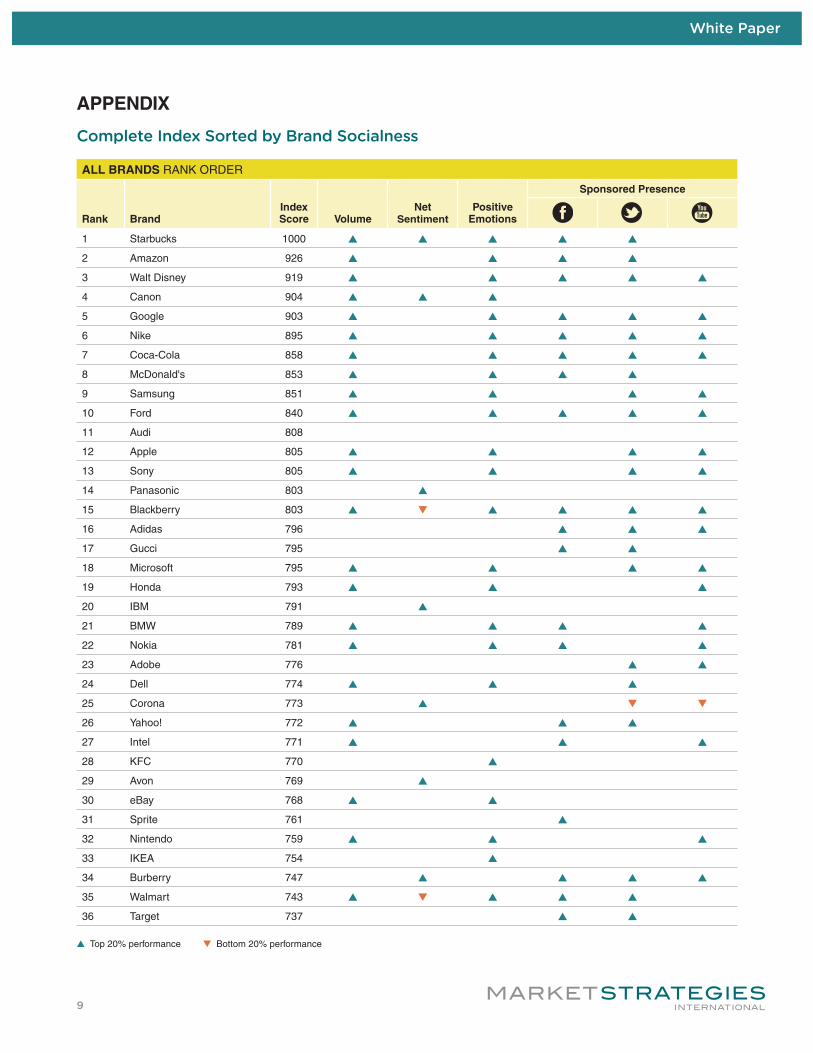
Index Components The Index’s underlying premise, based on our review of the emerging literature on social media marketing strategies, is that four elements drive a successful brand presence in social media:
• Volume represents the number of conversations, sometimes called buzz or sound bites (individual sentences that contain a consumer opinion, emotion or behavior). The number of posts, comments and mentions represents the extent to which a brand is being discussed online in any forum or social media context.
White Paper
3
• Net Sentiment represents the ratio of positive to negative sentiments expressed about a brand based on automated natural language processing of the content of posts, comments and mentions.
• Positive Emotions represent the number of content items that are identified as having positive emotions, again based on automated coding of content.
• Sponsored Presence represents the number of “likes” on a company’s sponsored Facebook US/English page, the number of followers per sponsored corporate Twitter account(s), and the number of subscribers to sponsored YouTube channel(s). A brand’s sponsored presence on these platforms indicates intent to create consumer engagement with fans, followers or viewers, a proxy for reach in traditional marketing terms.
For our analysis, Volume, Net Sentiment and Positive Emotions were collected and produced in NetBase, a leading social media analytics platform, based on 12 months of online activity in 2011. NetBase indexes over nine billion sound bites, extracted from more than one billion posts. This includes more than 50 million social media sources such as public Facebook profiles and Twitter accounts, more than 40 million blogs and more than 7 million forums.
50% 30% 15% 5%Volume Net
SentimentPositive
EmotionsSponsored Presence
+ + +
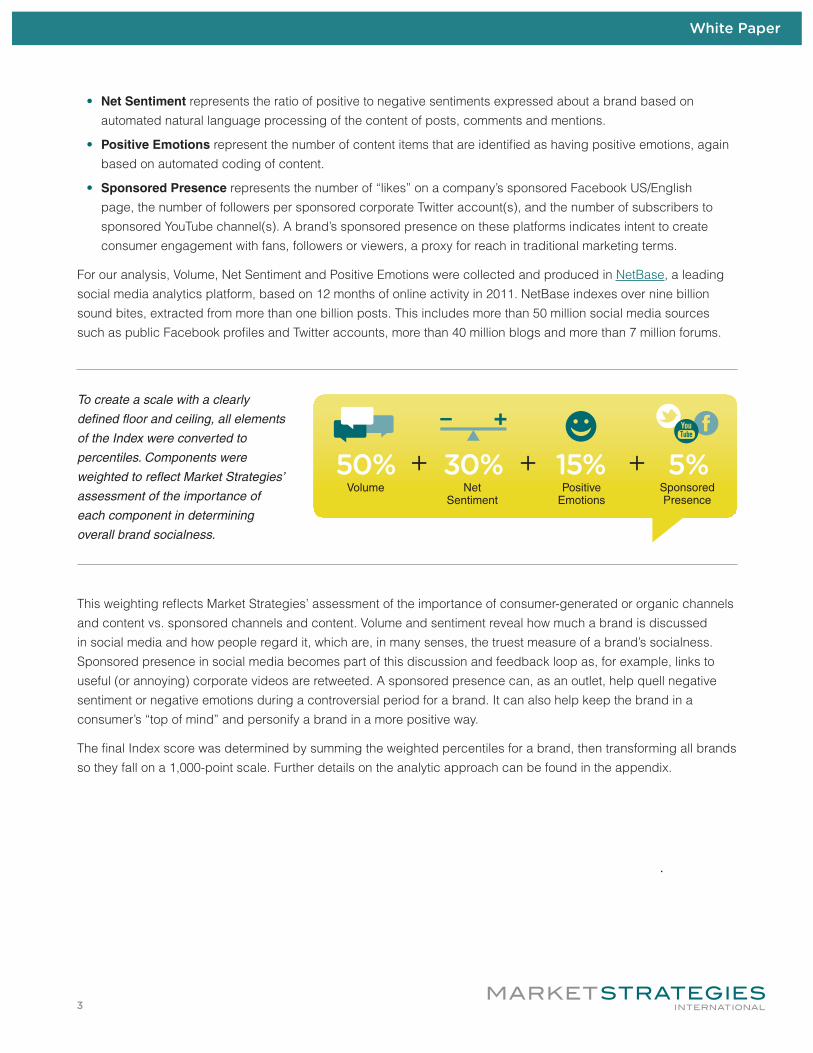
To create a scale with a clearly
defined floor and ceiling, all elements
of the Index were converted to
percentiles. Components were
weighted to reflect Market Strategies’
assessment of the importance of
each component in determining
overall brand socialness.
This weighting reflects Market Strategies’ assessment of the importance of consumer-generated or organic channels and content vs. sponsored channels and content. Volume and sentiment reveal how much a brand is discussed in social media and how people regard it, which are, in many senses, the truest measure of a brand’s socialness. Sponsored presence in social media becomes part of this discussion and feedback loop as, for example, links to useful (or annoying) corporate videos are retweeted. A sponsored presence can, as an outlet, help quell negative sentiment or negative emotions during a controversial period for a brand. It can also help keep the brand in a consumer’s “top of mind” and personify a brand in a more positive way.
The final Index score was determined by summing the weighted percentiles for a brand, then transforming all brands so they fall on a 1,000-point scale. Further details on the analytic approach can be found in the appendix.
White Paper
4
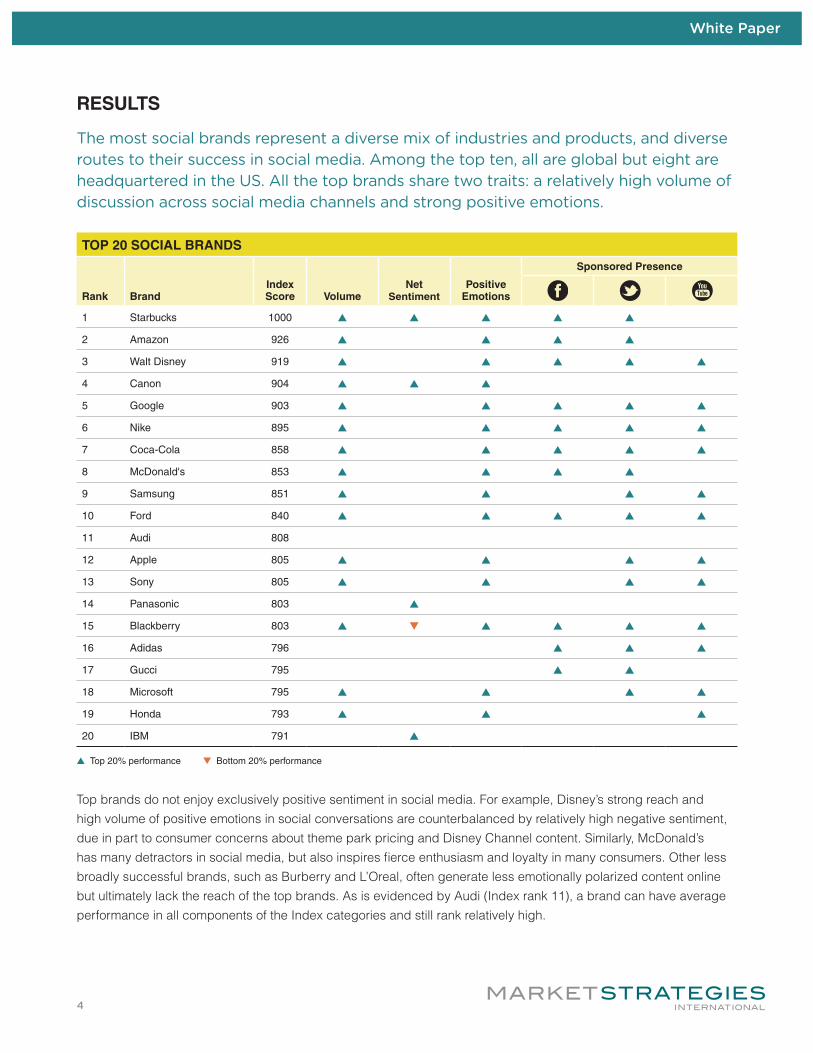
TOP 20 SOCIAL BRANDS
Rank BrandIndex Score Volume
Net Sentiment
Positive Emotions
Sponsored Presence
1 Starbucks 1000 s s s s s
2 Amazon 926 s s s s
3 Walt Disney 919 s s s s s
4 Canon 904 s s s
5 Google 903 s s s s s
6 Nike 895 s s s s s
7 Coca-Cola 858 s s s s s
8 McDonald's 853 s s s s
9 Samsung 851 s s s s
10 Ford 840 s s s s s
11 Audi 808
12 Apple 805 s s s s
13 Sony 805 s s s s
14 Panasonic 803 s
15 Blackberry 803 s t s s s s
16 Adidas 796 s s s
17 Gucci 795 s s
18 Microsoft 795 s s s s
19 Honda 793 s s s
20 IBM 791 s
s Top 20% performance t Bottom 20% performance
RESULTS
The most social brands represent a diverse mix of industries and products, and diverse routes to their success in social media. Among the top ten, all are global but eight are headquartered in the US. All the top brands share two traits: a relatively high volume of discussion across social media channels and strong positive emotions.
Top brands do not enjoy exclusively positive sentiment in social media. For example, Disney’s strong reach and high volume of positive emotions in social conversations are counterbalanced by relatively high negative sentiment, due in part to consumer concerns about theme park pricing and Disney Channel content. Similarly, McDonald’s has many detractors in social media, but also inspires fierce enthusiasm and loyalty in many consumers. Other less broadly successful brands, such as Burberry and L’Oreal, often generate less emotionally polarized content online but ultimately lack the reach of the top brands. As is evidenced by Audi (Index rank 11), a brand can have average performance in all components of the Index categories and still rank relatively high.
White Paper
5
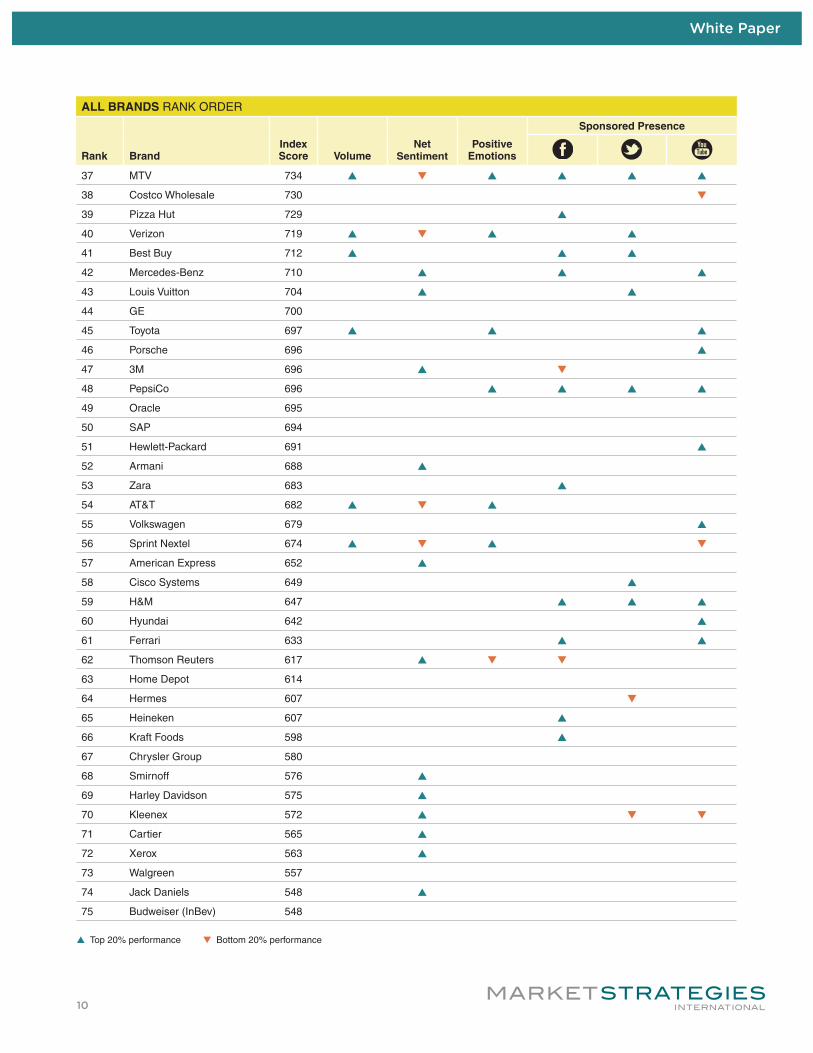
The most social brands also rank in the top quintile of performance in sponsored, non-organic social media presence—despite the low weight given to sponsored presence in the calculation of the Index. The ten most social brands enjoy above-average reach for their sponsored Facebook, Twitter and YouTube presences, while low-performing brands consistently have minimal sponsored presence (or attract few followers to their sponsored channels).
It’s tempting to read causality into these findings (sponsored social media presence drives overall success). But in truth, the model of influence is devilishly complex. Brands that are consumer-oriented and use a “branded house” rather than “house of brands” strategy are much more likely to be the topic of organic consumer attention, and also have generally been early adopters and experimenters in social media. Spontaneous attention in social media undoubtedly boosts reach for sponsored social media channels—just as a wide, sponsored presence can help to sustain the frequency and intensity of discussion outside of those channels.
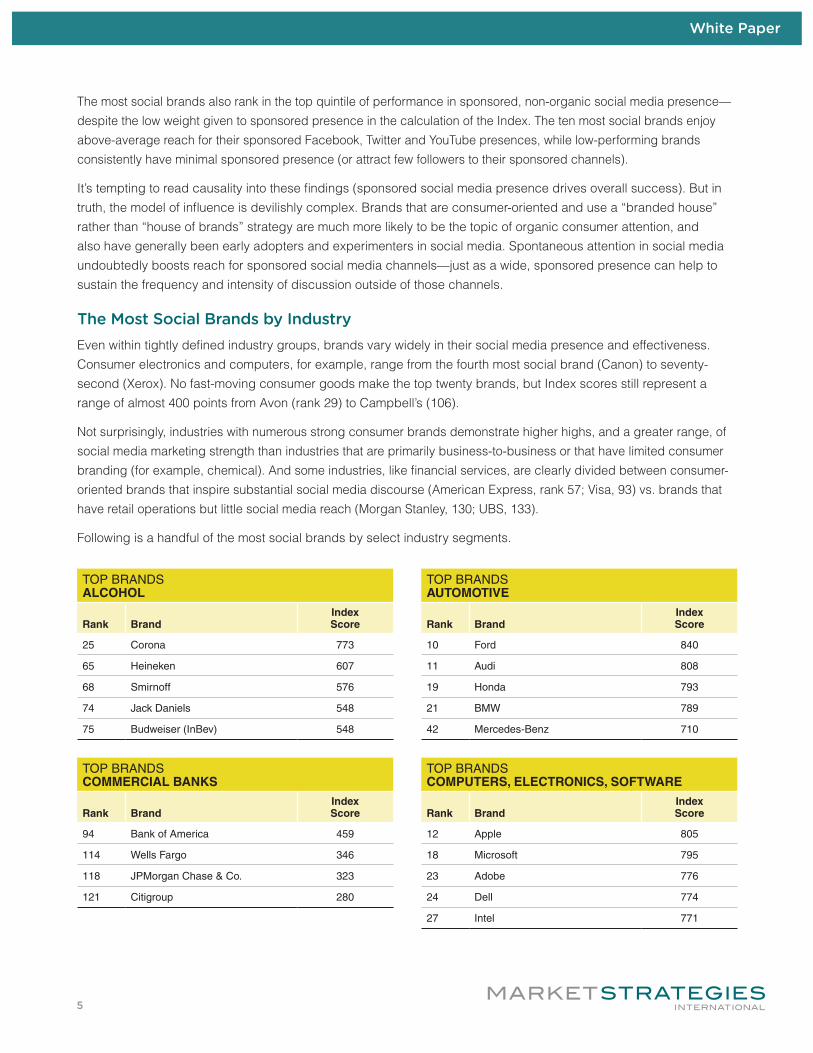
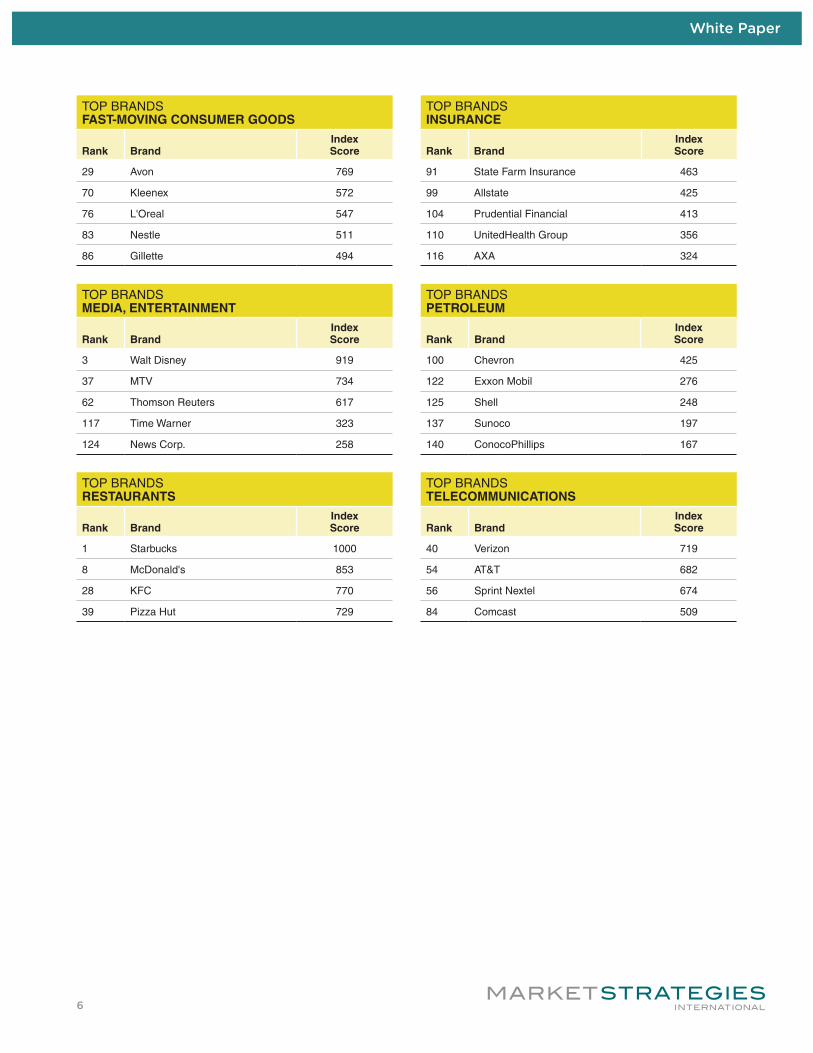
The Most Social Brands by IndustryEven within tightly defined industry groups, brands vary widely in their social media presence and effectiveness. Consumer electronics and computers, for example, range from the fourth most social brand (Canon) to seventy-second (Xerox). No fast-moving consumer goods make the top twenty brands, but Index scores still represent a range of almost 400 points from Avon (rank 29) to Campbell’s (106).
Not surprisingly, industries with numerous strong consumer brands demonstrate higher highs, and a greater range, of social media marketing strength than industries that are primarily business-to-business or that have limited consumer branding (for example, chemical). And some industries, like financial services, are clearly divided between consumer-oriented brands that inspire substantial social media discourse (American Express, rank 57; Visa, 93) vs. brands that have retail operations but little social media reach (Morgan Stanley, 130; UBS, 133).
Following is a handful of the most social brands by select industry segments.
TOP BRANDS ALCOHOL
Rank BrandIndex Score
25 Corona 773
65 Heineken 607
68 Smirnoff 576
74 Jack Daniels 548
75 Budweiser (InBev) 548
TOP BRANDS AUTOMOTIVE
Rank BrandIndex Score
10 Ford 840
11 Audi 808
19 Honda 793
21 BMW 789
42 Mercedes-Benz 710
TOP BRANDS COMMERCIAL BANKS
Rank BrandIndex Score
94 Bank of America 459
114 Wells Fargo 346
118 JPMorgan Chase & Co. 323
121 Citigroup 280
TOP BRANDS COMPUTERS, ELECTRONICS, SOFTWARE
Rank BrandIndex Score
12 Apple 805
18 Microsoft 795
23 Adobe 776
24 Dell 774
27 Intel 771
White Paper
6
TOP BRANDS FAST-MOVING CONSUMER GOODS
Rank BrandIndex Score
29 Avon 769
70 Kleenex 572
76 L'Oreal 547
83 Nestle 511
86 Gillette 494
TOP BRANDS INSURANCE
Rank BrandIndex Score
91 State Farm Insurance 463
99 Allstate 425
104 Prudential Financial 413
110 UnitedHealth Group 356
116 AXA 324
TOP BRANDS MEDIA, ENTERTAINMENT
Rank BrandIndex Score
3 Walt Disney 919
37 MTV 734
62 Thomson Reuters 617
117 Time Warner 323
124 News Corp. 258
TOP BRANDS PETROLEUM
Rank BrandIndex Score
100 Chevron 425
122 Exxon Mobil 276
125 Shell 248
137 Sunoco 197
140 ConocoPhillips 167
TOP BRANDS RESTAURANTS
Rank BrandIndex Score
1 Starbucks 1000
8 McDonald's 853
28 KFC 770
39 Pizza Hut 729
TOP BRANDS TELECOMMUNICATIONS
Rank BrandIndex Score
40 Verizon 719
54 AT&T 682
56 Sprint Nextel 674
84 Comcast 509
White Paper
7
Diversity of social channels and tactics is critical to success.
A legitimate debate rages in the blogosphere as to whether “social media marketing” is oxymoronic. Some strategists argue that traditional marketing approaches are ineffective given the user-driven nature
of social media. Whether or not corporations can effectively stimulate and manage their social media presence over the long haul, it is clear that many traditional tactics of marketing are being replicated in social online channels and are joined by new advocacy-based models as well.
The most social brands seek to combine different elements to create a rich online presence through channels such as Facebook, Twitter, YouTube and blogging. These elements complement a brand’s traditional marketing effort and work to improve its brand perception and create deeper connections with customers. Of course, our analysis demonstrates that sponsored social activities alone aren’t enough—they must accompany a robust, consumer-generated presence and positive net sentiment as well, neither of which are completely in the brand’s control.
Every industry has a different “right” level of social.
Unfortunately, given our first finding about the importance of diverse social channels, not every brand can take advantage of every social media marketing channel and tactic. Much of the current dialog among
digital marketers is oriented toward well-known consumer brands and ignores the vast difference between consumer-facing vs. B2B brands, between a “branded house” and “house of brands,” and between different industry verticals.
As a result, many marketers assume that every brand needs a social strategy, and every product category will benefit. Pity the corporate marketer working in a B2B-focused industry category whose senior execs are pressuring him for a social strategy. It’s neither helpful nor appropriate to compare tactics and outcomes for Honeywell International to Gucci. Furthermore, some industries (such as pharmaceuticals) are required to restrict their social media interactions because of regulatory requirements and/or possible legal exposure (see Pfizer’s Facebook page, for example).
For these reasons, it’s critical that you gauge expectations and tactics that are appropriate to your industry and brand. This Index offers some modest tools to help set expectations. If no scores in your industry reach the top quartile, for example, you are likely in an industry where the intensity of brand loyalty is lower and products are intrinsically less amenable to social discussions; tailor your social media marketing investment accordingly. If you are in an industry with a broad range of Index scores, on the other hand, you may need to dig into whose strategies and tactics are most successful, how widely social media marketing investments vary among competitors, and what it takes to lead—rather than trail—the pack.
Finally, sometimes it just makes more sense to compare competitors on a product line basis. Xbox and Wii is a better indicator than Microsoft and Nintendo in the gaming segment. Similarly, iPad and Kindle and Xoom is better than Apple and Amazon and Motorola. Although the Index doesn’t offer all the tools to facilitate these comparisons, our basic approach can be replicated for product brands on a custom basis.
Reach without positive sentiment is a short-term win.The ancient PR chestnut that “any publicity is good publicity” takes on new resonance in social media.
Even more than in traditional PR channels, “publicity” in social media is beyond the control of the brand. Moreover, the results of social discussions live on forever in that giant archive of consumer sentiment we call the web.
FIVE KEY TAKEAWAYS
No. 1
No. 2
No. 3

White Paper
8
The enduring tendency to focus on measures of size (volume of content, reach, buzz, etc.) is a legacy of early days in social media marketing. And without question, reaching a threshold of critical “social mass” is a key component of success—which is why the Index weights Volume higher than any other component. But while individuals may be equally pleased with negative or positive sentiment as long as their discussion volume is high (thank you, Paris Hilton), brands do not enjoy the full luxury of the “any publicity” adage online. A key measure of social media marketing success is to generate positive attitudes about the brand through all possible channels (from product or service quality to advertising) and combine that with carefully-planned sponsored activities that increase customer engagement and loyalty.
Not all sponsored channels are equal.Tapping into social media via sponsored channels helps propel a brand forward in the consumer’s mind
and may significantly increase reach. But doing so requires using the right channels in the right ways. While there are multiple channels that allow sponsorship, we focus on the three best known: Facebook, Twitter and YouTube.
Almost every brand in this Index has some sort of corporate Twitter presence. Twitter is currently the easiest sponsored channel for a company to grow its reach. While Facebook is also a highly common sponsored presence, our analysis suggests that Facebook rarely seeds social conversations as effectively as Twitter. To be sure, Twitter retweets and Facebook “likes” are fundamentally different. But reaching out to your consumers 140 characters at a time requires a level of creativity and engagement that brands often fail to provide on Facebook.
YouTube remains a more challenging sponsored channel to use effectively. Not all brands will benefit from a corporate YouTube channel; videos, when done poorly, have the power of not only words but images to degrade brand image. Length of video, content, production values and frequency of postings present a complex balance for marketers to achieve.
Finally, not all consumers are savvy in all social media, underscoring our first takeaway: diversity of approaches (with careful attention to avoid oversaturating the consumer) is critical to success. Successful brands segment their presence by product, message and media, allowing consumers to pick and choose how they wish to engage.
Measuring success requires mashing up data sources.This Index and social media monitoring in general is most useful when combined with as many
other data sources as possible, from traditional market research to marketing spend data, to internal and external marketing metrics such as the ACSI Customer Satisfaction Score and Net Promoter Score. Especially in pursuit of a sense of ROI for social media marketing activities, success—whether judged by this Index or another metric—must be correlated with investment and financial outcome for the brand.
Even if we set aside the Holy Grail of marketing ROI, however, a deep understanding of your brand’s socialness aids in creative development. Social media provides a competitive context that might not be available in traditional research, and correlates to word of mouth marketing, an important factor in measuring brand influence. Social discussions—whether online or in person—demonstrate credibility and satisfaction since the people talking about the brand don’t stand to gain personally. The positive experiences marketers learn from analyzing social media help make any story that a marketer chooses to highlight relatable and relevant to the audience.
No. 4
No. 5
White Paper
9
ALL BRANDS RANK ORDER
Rank BrandIndex Score Volume
Net Sentiment
Positive Emotions
Sponsored Presence
1 Starbucks 1000 s s s s s
2 Amazon 926 s s s s
3 Walt Disney 919 s s s s s
4 Canon 904 s s s
5 Google 903 s s s s s
6 Nike 895 s s s s s
7 Coca-Cola 858 s s s s s
8 McDonald's 853 s s s s
9 Samsung 851 s s s s
10 Ford 840 s s s s s
11 Audi 808
12 Apple 805 s s s s
13 Sony 805 s s s s
14 Panasonic 803 s
15 Blackberry 803 s t s s s s
16 Adidas 796 s s s
17 Gucci 795 s s
18 Microsoft 795 s s s s
19 Honda 793 s s s
20 IBM 791 s
21 BMW 789 s s s s
22 Nokia 781 s s s s
23 Adobe 776 s s
24 Dell 774 s s s
25 Corona 773 s t t
26 Yahoo! 772 s s s
27 Intel 771 s s s
28 KFC 770 s
29 Avon 769 s
30 eBay 768 s s
31 Sprite 761 s
32 Nintendo 759 s s s
33 IKEA 754 s
34 Burberry 747 s s s s
35 Walmart 743 s t s s s
36 Target 737 s s
s Top 20% performance t Bottom 20% performance
APPENDIX
Complete Index Sorted by Brand Socialness
White Paper
10
ALL BRANDS RANK ORDER
Rank BrandIndex Score Volume
Net Sentiment
Positive Emotions
Sponsored Presence
37 MTV 734 s t s s s s
38 Costco Wholesale 730 t
39 Pizza Hut 729 s
40 Verizon 719 s t s s
41 Best Buy 712 s s s
42 Mercedes-Benz 710 s s s
43 Louis Vuitton 704 s s
44 GE 700
45 Toyota 697 s s s
46 Porsche 696 s
47 3M 696 s t
48 PepsiCo 696 s s s s
49 Oracle 695
50 SAP 694
51 Hewlett-Packard 691 s
52 Armani 688 s
53 Zara 683 s
54 AT&T 682 s t s
55 Volkswagen 679 s
56 Sprint Nextel 674 s t s t
57 American Express 652 s
58 Cisco Systems 649 s
59 H&M 647 s s s
60 Hyundai 642 s
61 Ferrari 633 s s
62 Thomson Reuters 617 s t t
63 Home Depot 614
64 Hermes 607 t
65 Heineken 607 s
66 Kraft Foods 598 s
67 Chrysler Group 580
68 Smirnoff 576 s
69 Harley Davidson 575 s
70 Kleenex 572 s t t
71 Cartier 565 s
72 Xerox 563 s
73 Walgreen 557
74 Jack Daniels 548 s
75 Budweiser (InBev) 548
s Top 20% performance t Bottom 20% performance
White Paper
11
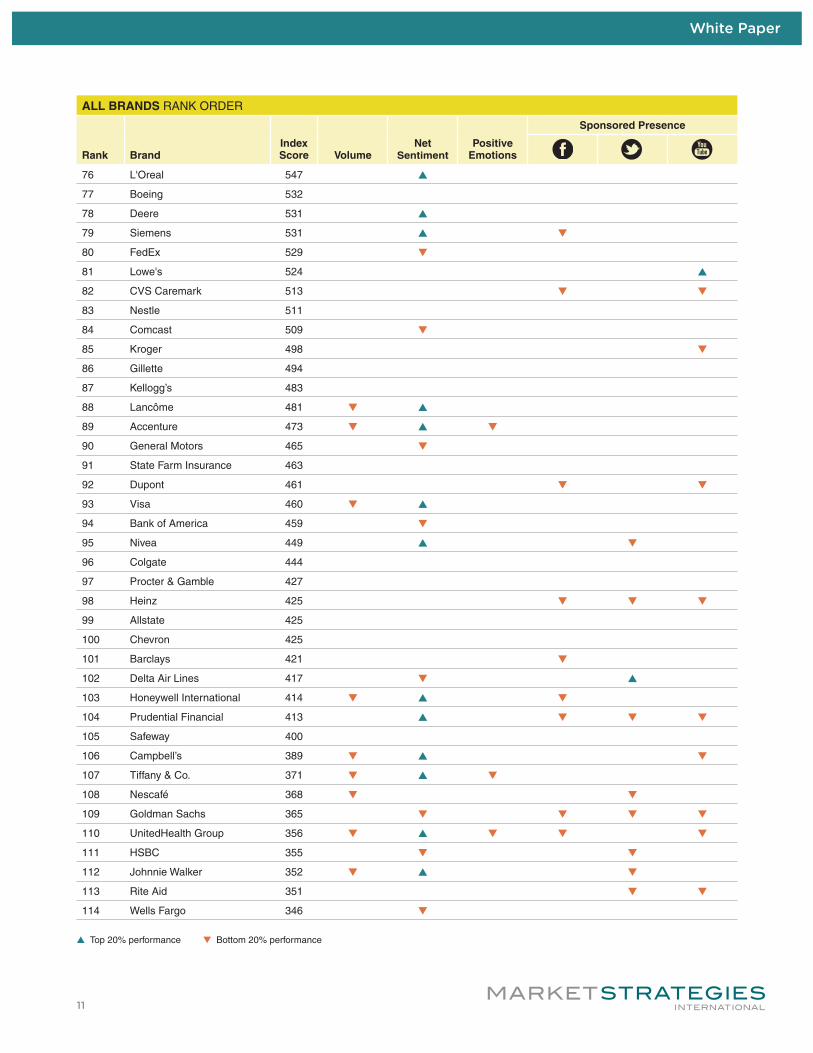
ALL BRANDS RANK ORDER
Rank BrandIndex Score Volume
Net Sentiment
Positive Emotions
Sponsored Presence
76 L'Oreal 547 s
77 Boeing 532
78 Deere 531 s
79 Siemens 531 s t
80 FedEx 529 t
81 Lowe's 524 s
82 CVS Caremark 513 t t
83 Nestle 511
84 Comcast 509 t
85 Kroger 498 t
86 Gillette 494
87 Kellogg’s 483
88 Lancôme 481 t s
89 Accenture 473 t s t
90 General Motors 465 t
91 State Farm Insurance 463
92 Dupont 461 t t
93 Visa 460 t s
94 Bank of America 459 t
95 Nivea 449 s t
96 Colgate 444
97 Procter & Gamble 427
98 Heinz 425 t t t
99 Allstate 425
100 Chevron 425
101 Barclays 421 t
102 Delta Air Lines 417 t s
103 Honeywell International 414 t s t
104 Prudential Financial 413 s t t t
105 Safeway 400
106 Campbell’s 389 t s t
107 Tiffany & Co. 371 t s t
108 Nescafé 368 t t
109 Goldman Sachs 365 t t t t
110 UnitedHealth Group 356 t s t t t
111 HSBC 355 t t
112 Johnnie Walker 352 t s t
113 Rite Aid 351 t t
114 Wells Fargo 346 t
s Top 20% performance t Bottom 20% performance
White Paper
12
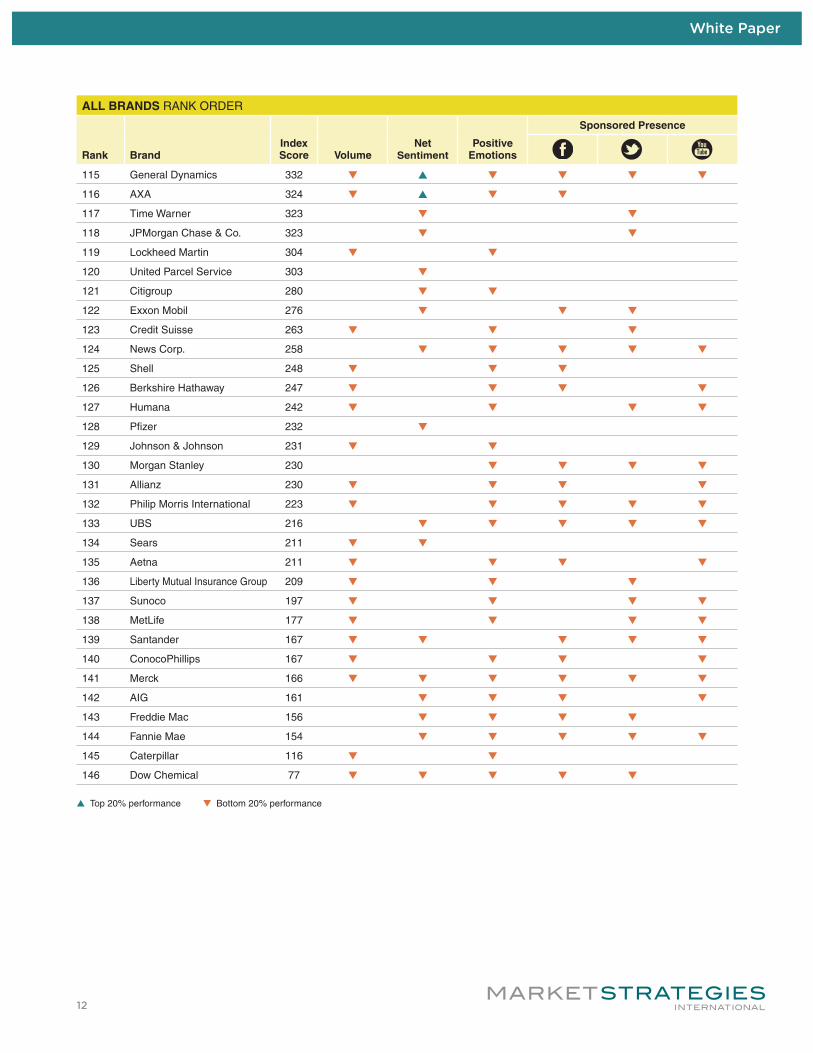
ALL BRANDS RANK ORDER
Rank BrandIndex Score Volume
Net Sentiment
Positive Emotions
Sponsored Presence
115 General Dynamics 332 t s t t t t
116 AXA 324 t s t t
117 Time Warner 323 t t
118 JPMorgan Chase & Co. 323 t t
119 Lockheed Martin 304 t t
120 United Parcel Service 303 t
121 Citigroup 280 t t
122 Exxon Mobil 276 t t t
123 Credit Suisse 263 t t t
124 News Corp. 258 t t t t t
125 Shell 248 t t t
126 Berkshire Hathaway 247 t t t t
127 Humana 242 t t t t
128 Pfizer 232 t
129 Johnson & Johnson 231 t t
130 Morgan Stanley 230 t t t t
131 Allianz 230 t t t t
132 Philip Morris International 223 t t t t t
133 UBS 216 t t t t t
134 Sears 211 t t
135 Aetna 211 t t t t
136 Liberty Mutual Insurance Group 209 t t t
137 Sunoco 197 t t t t
138 MetLife 177 t t t t
139 Santander 167 t t t t t
140 ConocoPhillips 167 t t t t
141 Merck 166 t t t t t t
142 AIG 161 t t t t
143 Freddie Mac 156 t t t t
144 Fannie Mae 154 t t t t t
145 Caterpillar 116 t t
146 Dow Chemical 77 t t t t t
s Top 20% performance t Bottom 20% performance
White Paper
13
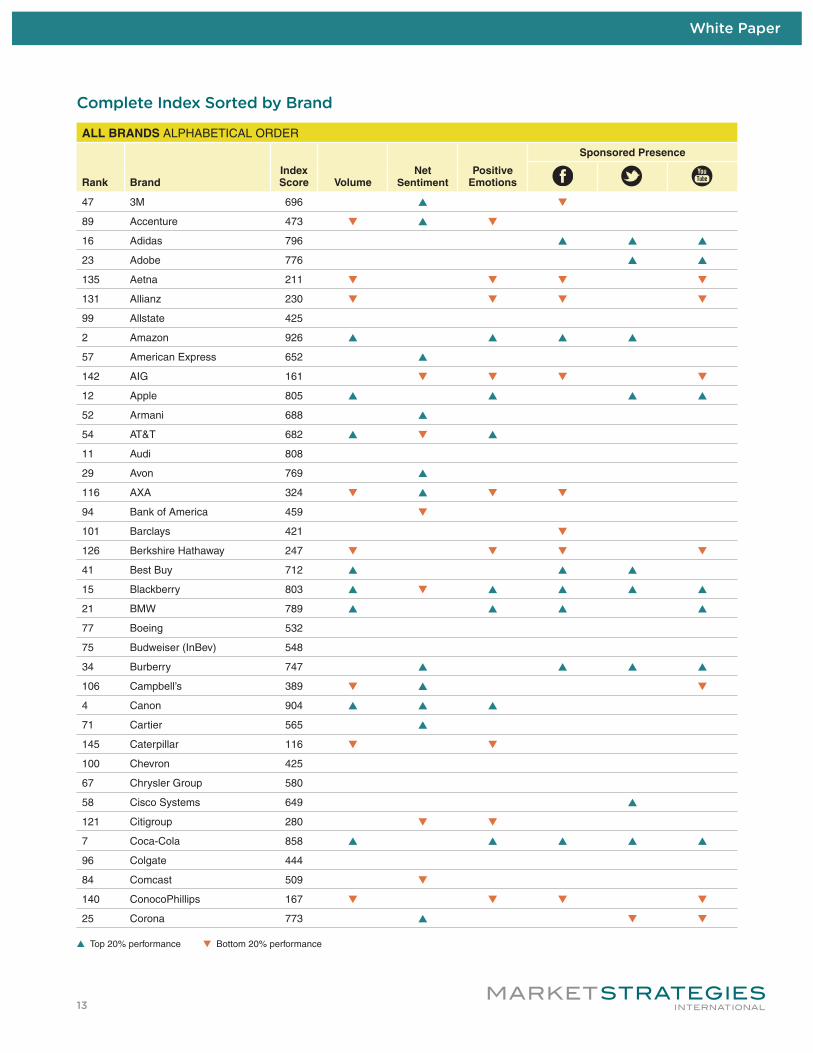
ALL BRANDS ALPHABETICAL ORDER
Rank BrandIndex Score Volume
Net Sentiment
Positive Emotions
Sponsored Presence
47 3M 696 s t
89 Accenture 473 t s t
16 Adidas 796 s s s
23 Adobe 776 s s
135 Aetna 211 t t t t
131 Allianz 230 t t t t
99 Allstate 425
2 Amazon 926 s s s s
57 American Express 652 s
142 AIG 161 t t t t
12 Apple 805 s s s s
52 Armani 688 s
54 AT&T 682 s t s
11 Audi 808
29 Avon 769 s
116 AXA 324 t s t t
94 Bank of America 459 t
101 Barclays 421 t
126 Berkshire Hathaway 247 t t t t
41 Best Buy 712 s s s
15 Blackberry 803 s t s s s s
21 BMW 789 s s s s
77 Boeing 532
75 Budweiser (InBev) 548
34 Burberry 747 s s s s
106 Campbell’s 389 t s t
4 Canon 904 s s s
71 Cartier 565 s
145 Caterpillar 116 t t
100 Chevron 425
67 Chrysler Group 580
58 Cisco Systems 649 s
121 Citigroup 280 t t
7 Coca-Cola 858 s s s s s
96 Colgate 444
84 Comcast 509 t
140 ConocoPhillips 167 t t t t
25 Corona 773 s t t
s Top 20% performance t Bottom 20% performance
Complete Index Sorted by Brand
White Paper
14
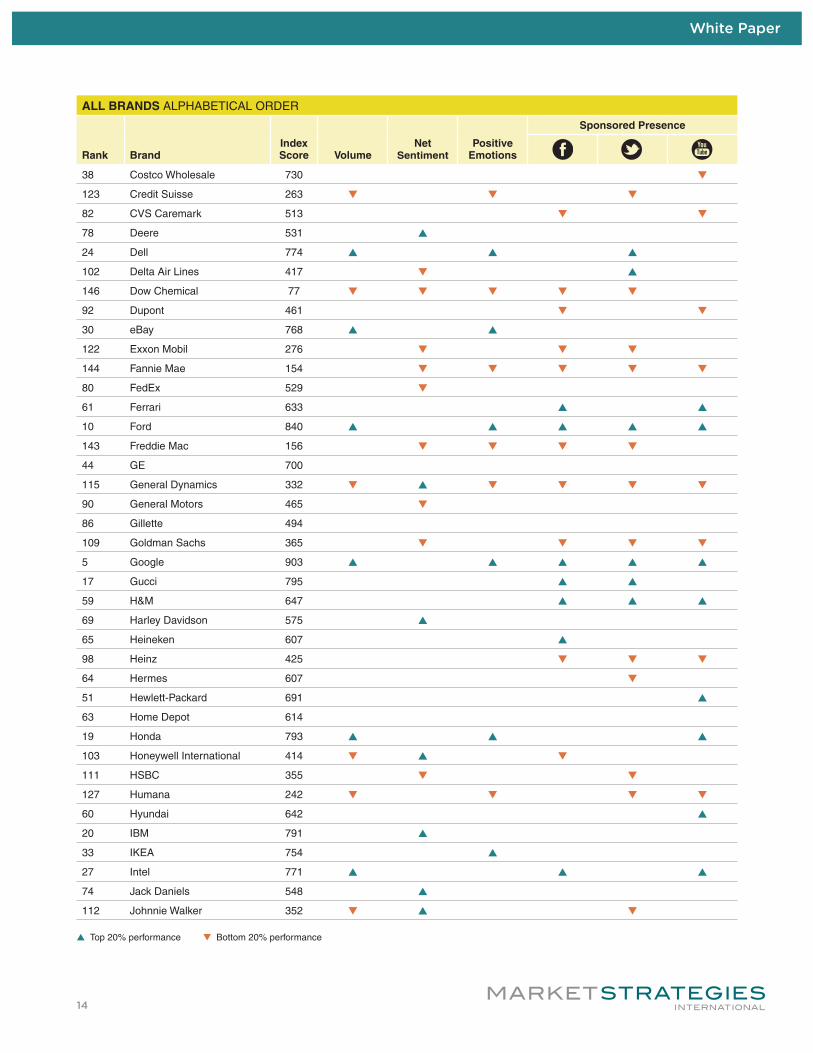
ALL BRANDS ALPHABETICAL ORDER
Rank BrandIndex Score Volume
Net Sentiment
Positive Emotions
Sponsored Presence
38 Costco Wholesale 730 t
123 Credit Suisse 263 t t t
82 CVS Caremark 513 t t
78 Deere 531 s
24 Dell 774 s s s
102 Delta Air Lines 417 t s
146 Dow Chemical 77 t t t t t
92 Dupont 461 t t
30 eBay 768 s s
122 Exxon Mobil 276 t t t
144 Fannie Mae 154 t t t t t
80 FedEx 529 t
61 Ferrari 633 s s
10 Ford 840 s s s s s
143 Freddie Mac 156 t t t t
44 GE 700
115 General Dynamics 332 t s t t t t
90 General Motors 465 t
86 Gillette 494
109 Goldman Sachs 365 t t t t
5 Google 903 s s s s s
17 Gucci 795 s s
59 H&M 647 s s s
69 Harley Davidson 575 s
65 Heineken 607 s
98 Heinz 425 t t t
64 Hermes 607 t
51 Hewlett-Packard 691 s
63 Home Depot 614
19 Honda 793 s s s
103 Honeywell International 414 t s t
111 HSBC 355 t t
127 Humana 242 t t t t
60 Hyundai 642 s
20 IBM 791 s
33 IKEA 754 s
27 Intel 771 s s s
74 Jack Daniels 548 s
112 Johnnie Walker 352 t s t
s Top 20% performance t Bottom 20% performance
White Paper
15
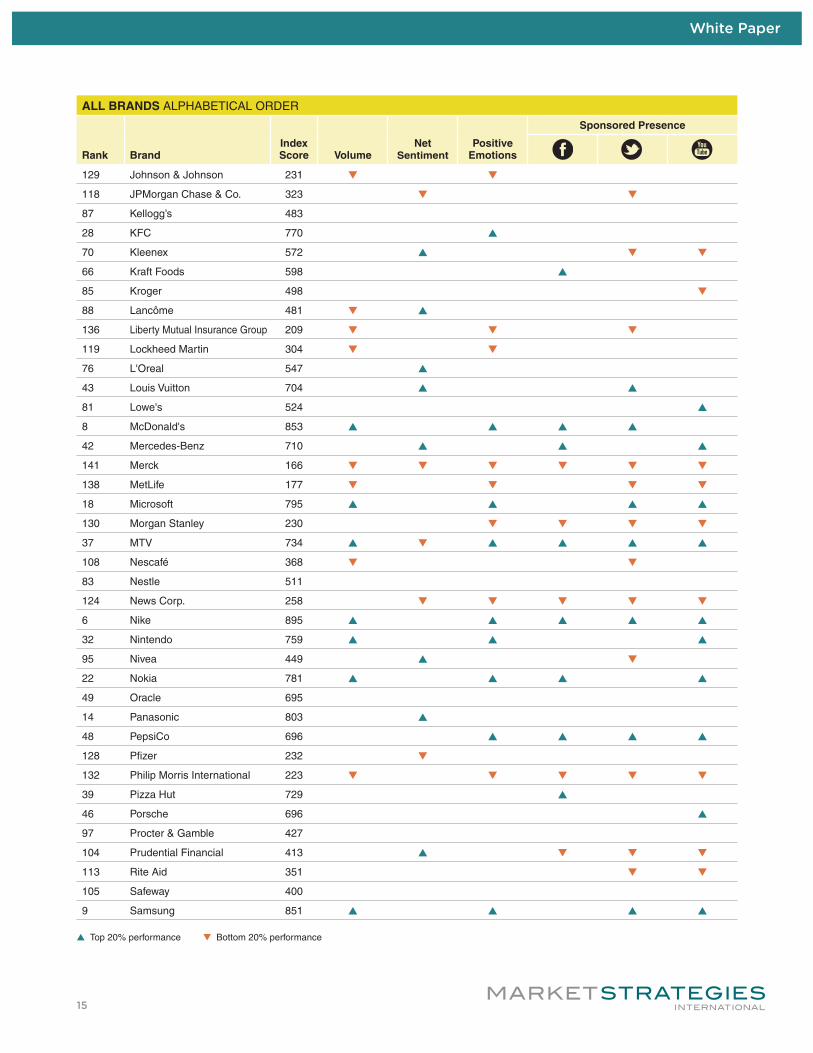
ALL BRANDS ALPHABETICAL ORDER
Rank BrandIndex Score Volume
Net Sentiment
Positive Emotions
Sponsored Presence
129 Johnson & Johnson 231 t t
118 JPMorgan Chase & Co. 323 t t
87 Kellogg’s 483
28 KFC 770 s
70 Kleenex 572 s t t
66 Kraft Foods 598 s
85 Kroger 498 t
88 Lancôme 481 t s
136 Liberty Mutual Insurance Group 209 t t t
119 Lockheed Martin 304 t t
76 L'Oreal 547 s
43 Louis Vuitton 704 s s
81 Lowe's 524 s
8 McDonald's 853 s s s s
42 Mercedes-Benz 710 s s s
141 Merck 166 t t t t t t
138 MetLife 177 t t t t
18 Microsoft 795 s s s s
130 Morgan Stanley 230 t t t t
37 MTV 734 s t s s s s
108 Nescafé 368 t t
83 Nestle 511
124 News Corp. 258 t t t t t
6 Nike 895 s s s s s
32 Nintendo 759 s s s
95 Nivea 449 s t
22 Nokia 781 s s s s
49 Oracle 695
14 Panasonic 803 s
48 PepsiCo 696 s s s s
128 Pfizer 232 t
132 Philip Morris International 223 t t t t t
39 Pizza Hut 729 s
46 Porsche 696 s
97 Procter & Gamble 427
104 Prudential Financial 413 s t t t
113 Rite Aid 351 t t
105 Safeway 400
9 Samsung 851 s s s s
s Top 20% performance t Bottom 20% performance
White Paper
16
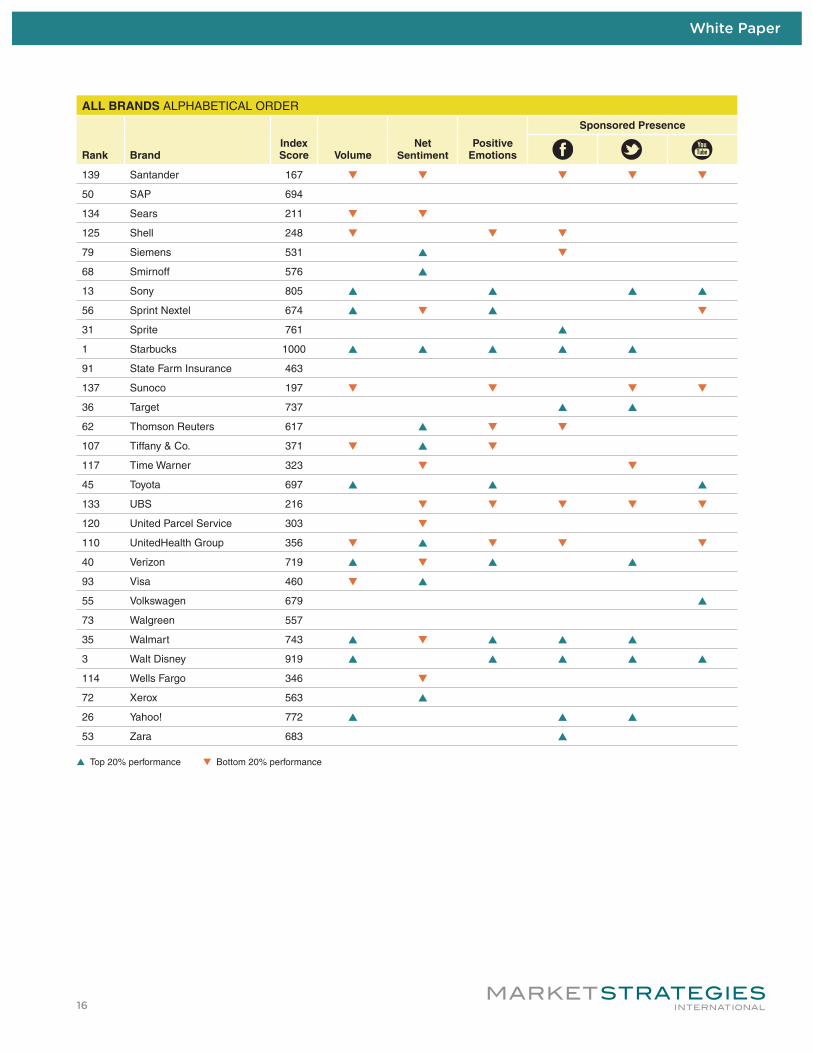
ALL BRANDS ALPHABETICAL ORDER
Rank BrandIndex Score Volume
Net Sentiment
Positive Emotions
Sponsored Presence
139 Santander 167 t t t t t
50 SAP 694
134 Sears 211 t t
125 Shell 248 t t t
79 Siemens 531 s t
68 Smirnoff 576 s
13 Sony 805 s s s s
56 Sprint Nextel 674 s t s t
31 Sprite 761 s
1 Starbucks 1000 s s s s s
91 State Farm Insurance 463
137 Sunoco 197 t t t t
36 Target 737 s s
62 Thomson Reuters 617 s t t
107 Tiffany & Co. 371 t s t
117 Time Warner 323 t t
45 Toyota 697 s s s
133 UBS 216 t t t t t
120 United Parcel Service 303 t
110 UnitedHealth Group 356 t s t t t
40 Verizon 719 s t s s
93 Visa 460 t s
55 Volkswagen 679 s
73 Walgreen 557
35 Walmart 743 s t s s s
3 Walt Disney 919 s s s s s
114 Wells Fargo 346 t
72 Xerox 563 s
26 Yahoo! 772 s s s
53 Zara 683 s
s Top 20% performance t Bottom 20% performance
White Paper
17
Current and Past Social Media Measurement StudiesCurrent measurements
• Yomego’s Social Media Reputation (SMR). This ongoing, paid service averages frequency of mentions and aggregated sentiment, adjusting current results by comparing them to past months to determine an overall score from 0 to 100. While more complete than other rankings, the SMR score appears to place a disproportionate weight (50%) on the recency score, potentially penalizing brands for short-term spikes in reach and satisfaction.
• Vitrue’s Vitrue 100. This annual report monitors buzz and does not incorporate sentiment into its ranking system for 100 brands; platform technology brands for social media, such as Facebook, are excluded. According to Vitrue, “the index numbers are not intended to be used in absolute terms; rather, they provide a numerical basis to compare the social media prominence of two or more items.”
Past measurements
• EngagementDB’s Ranking the Top 100 Global Brands: Who’s most engaged? Evaluated the number of channels in which a company participates in conjunction with its respective level of engagement in each channel. Specifics about the methodology are not available. Released for 2009 only.
• Infegy/Social Radar’s Top Social Brands of 2009. Measured brands with the most active web presence based on overall buzz. The list measures the number of unique individuals or sources that posted content about each brand rather than the overall number of mentions and does not incorporate sentiment. Released for 2009 only.
• Razorfish’s Social Influence Marketing (SIM) Score. Measured the reach and likeability (sentiment) of a brand com-pared to the total reach/likeability of the brand’s industry. Since the SIM Score incorporates industry averages, it has not been used to create a comprehensive index to rank brands across industries. Released for 2008 and 2009 only.
• Sysomos’ Best Global Brands Online 2009. Used top 20 brands on Interbrand’s Best Global Brands List. Creates two separate rankings, one based on online buzz (mentions) and another based on sentiment. Released for 2009 only.
Brand SelectionOur competitive set of 146 brands for the Index is based on the top companies in the 2010 Fortune 500 and on Interbrand’s 100 Best Global Brands.
The Fortune 500 is an annual list compiled and published by Fortune magazine that ranks the top 500 US privately-held and public corporations for which revenues are publicly available. Companies are ranked by their adjusted gross revenue.
To be included for consideration on Interbrand’s ranking, a brand must be truly global and transcend geographic and cultural differences. At least 30% of revenues must come from outside the home country and no more than 50% of revenues should come from any one continent. The brand must have a presence on at least three major continents, with broad geographic coverage in growing and emerging markets. There must be publicly available data on the brand’s financial performance and economic profit must be positive with a return above the operating and financing costs. The brand must have a public profile and awareness above and beyond its own marketplace.
When entering brands in NetBase to derive Index components (Volume, Net Sentiment and Positive Emotions), we made every effort to disambiguate brands to remove spurious content and “false hits” by modifying search terms and filtering results. Brands that are or have common nouns (e.g., Shell) pose a greater issue in disambiguation and have a greater chance of producing exaggerated reach estimates.
White Paper
© 2012 Market Strategies International. All rights reserved.No part of this publication may be reproduced by any method whatsoever without the prior consent of Market Strategies International.
Social Media Brand Index Ver 1.1
For more information: www.marketstrategies.comRead our blog: www.freshmr.com
Analysis and Index CalculationThe analytic period for the Index is January 1, 2011 through December 31, 2011.
Volume. The number of content items discovered within NetBase for the search period.
Net Sentiment. The ratio of positive to negative sentiments expressed about a brand as coded by NetBase, which is calculated using the following formula: Net Sentiment score = (Positive sentiment – Negative sentiment) / (Posi-tive sentiment + Negative sentiment). Note that neutral content, which can range to 80% or more of all content on a brand or topic, is excluded. The score can range from -100 to +10.
Sentiment is widely depended upon social media marketing to understand how individuals feel about a particular brand, and is the most commonly examined measure of a brand’s “success” in social media. This is in spite that for most brands and topics in social media, the majority of content is neither positive nor negative but simply neutral.
Automated sentiment coding within social media monitoring platforms is done via sophisticated language analysis of content. While automated coding goes well beyond anything possible even a few years ago, and greatly expedites the ability to retrieve this information quickly, it is not always accurate. Across the common social media analytic platforms, sentiment coding accuracy is claimed to be 70% to 90%; some would argue that even this number is high. Automated coding cannot correctly detect nuances in the human language; for example, sarcasm escapes most (if not all) social media monitoring platforms.
Positive Emotions. The number of content items coded as strongly or somewhat positive discovered within NetBase for the search period.
Sponsored Presence. The number of Facebook “likes,” Twitter followers and YouTube subscribers for sponsored, corporate pages/accounts/channels at 2011 year end.
All Index components were converted to percentile rankings and weighted to reflect Market Strategies’ assessment of the importance of each component in determining overall brand socialness (Volume = 0.50, Net Sentiment = 0.30, Positive Emotions = 0.15, Sponsored Presence = 0.05). The final raw score was converted to array all Index scores on a 1,000-point scale for easy comparison.
Index rankings are relative only to one another. The Index must have a highest (1,000) score. A score of 1,000 does not mean the perfect social brand; rather, it means that compared with the other brands included in this study, the brand in question has superior performance in the weighted components of the Index.


![[Social media];[Brand community]](https://img.pdfslide.us/doc/110x75/55956ab31a28ab3f2c8b476f/social-mediabrand-community.jpg)


!["Your brand social" [Social media packages]](https://img.pdfslide.us/doc/110x75/557dda72d8b42a4c238b511a/your-brand-social-social-media-packages.jpg)