Embed Size (px)
Citation preview
MUNDARING PRIMARY SCHOOL REPORT 2011
Mundaring Primary School 2011 School Report Page 1
MUNDARING PRIMARY SCHOOL
2011 ANNUAL REPORT
Carols by candlelight - December 2011

MUNDARING PRIMARY SCHOOL REPORT 2011
Mundaring Primary School 2011 School Report Page 2
SCHOOL PURPOSE To develop the cognitive, social, physical and creative abilities and skills of students thereby enabling them to fulfil their potential and contribute to the development of society. SCHOOL ETHOS: LEARNING TOGETHER The school operates in partnership with the school community, where parents and friends are welcome and encouraged to take part in various aspects of the school operations. DESCRIPTION Mundaring Primary School is located approximately 40 kilometres east of Perth on Stevens Street. Our school opened at this site in 1990 after moving from the original site on Great Eastern Highway and celebrated its centenary in November 2007. Our school is characterised as being community and environmentally friendly. It has a small country school feel yet is large enough to offer a range of options and facilities. The school is nestled in a tranquil bush setting among the trees with grassed play areas, an oval, cricket nets, basketball/netball/tennis courts and extensive playground equipment. The school is an air-conditioned open design with three clusters of classrooms, three early childhood units, an administration block, undercover area with canteen/uniform shop and purpose built specialist teaching areas including a library resource centre, music room and art centre. There is a computer laboratory in the library resource centre and computers located in every classroom and open teaching area with the additional technology support of electronic whiteboards in all classrooms.
SCHOOL PRIORITIES School priorities and focus areas are reviewed annually using a rigorous cycle of data review, planning and reporting. In 2011 the school’s priorities were: • Literacy: Focus Areas - Reading Strand • Numeracy: Focus Area : Number Strand • Science: Environmental Science In 2012 our priorities will be: • Numeracy : Focus Area : Number • Literacy : Focus Areas - Reading, Spelling, Grammar & Punctuation • Students At Educational Risk (SAER) • Curriculum Implementation: The Australian Curriculum (English & Mathematics)
MUNDARING PRIMARY SCHOOL REPORT 2011
Mundaring Primary School 2011 School Report Page 3
MUNDARING PRIMARY SCHOOL
2011 School Report
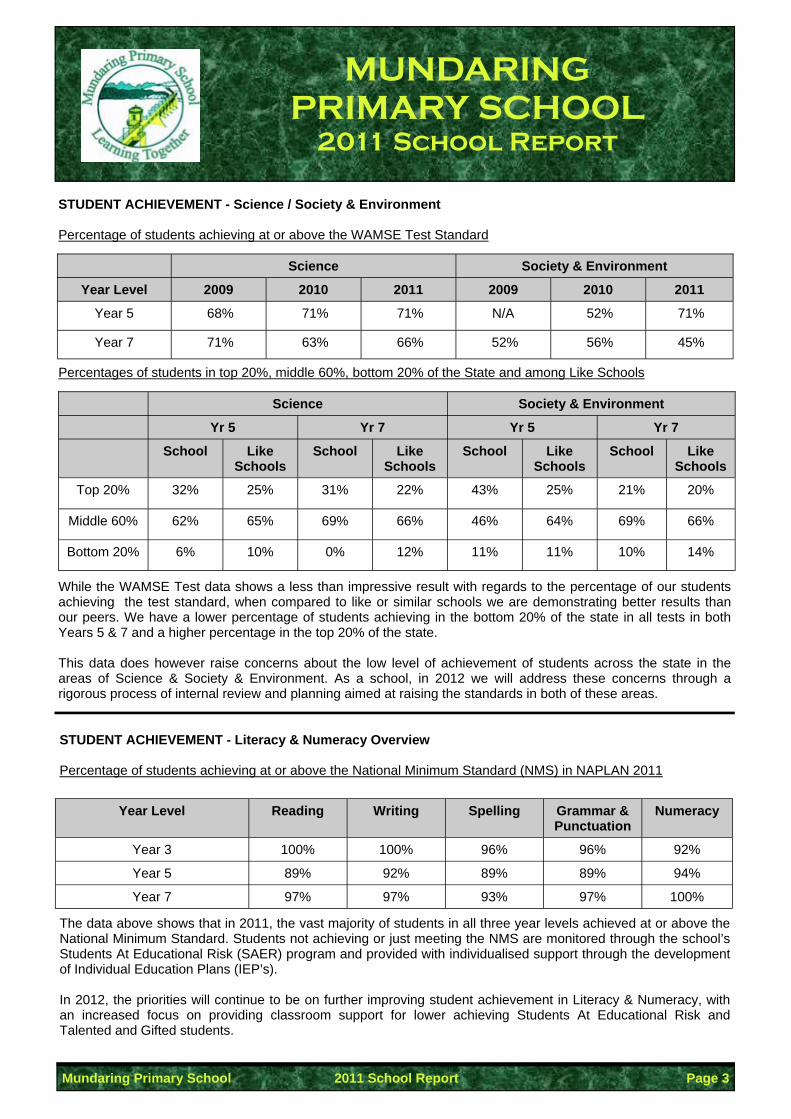
STUDENT ACHIEVEMENT - Literacy & Numeracy Overview Percentage of students achieving at or above the National Minimum Standard (NMS) in NAPLAN 2011
The data above shows that in 2011, the vast majority of students in all three year levels achieved at or above the National Minimum Standard. Students not achieving or just meeting the NMS are monitored through the school’s Students At Educational Risk (SAER) program and provided with individualised support through the development of Individual Education Plans (IEP’s). In 2012, the priorities will continue to be on further improving student achievement in Literacy & Numeracy, with an increased focus on providing classroom support for lower achieving Students At Educational Risk and Talented and Gifted students.
Year Level
Reading Writing Spelling Grammar & Punctuation
Numeracy
Year 3 100% 100% 96% 96% 92%
Year 5 89% 92% 89% 89% 94%
Year 7 97% 97% 93% 97% 100%
STUDENT ACHIEVEMENT - Science / Society & Environment Percentage of students achieving at or above the WAMSE Test Standard
Percentages of students in top 20%, middle 60%, bottom 20% of the State and among Like Schools
While the WAMSE Test data shows a less than impressive result with regards to the percentage of our students achieving the test standard, when compared to like or similar schools we are demonstrating better results than our peers. We have a lower percentage of students achieving in the bottom 20% of the state in all tests in both Years 5 & 7 and a higher percentage in the top 20% of the state. This data does however raise concerns about the low level of achievement of students across the state in the areas of Science & Society & Environment. As a school, in 2012 we will address these concerns through a rigorous process of internal review and planning aimed at raising the standards in both of these areas.
Science
Year Level 2009 2010 2011 2009 2010 2011
Year 5 68% 71% 71% N/A 52% 71%
Year 7 71% 63% 66% 52% 56% 45%
Society & Environment
Science Society & Environment Yr 5 Yr 7 Yr 5 School Like
Schools School Like
Schools School Like
Schools School Like
Schools
Top 20% 32% 25% 31% 22% 43% 25% 21% 20%
Middle 60% 62% 65% 69% 66% 46% 64% 69% 66%
Bottom 20% 6% 10% 0% 12% 11% 11% 10% 14%
Yr 7

MUNDARING PRIMARY SCHOOL REPORT 2011
Mundaring Primary School 2011 School Report Page 4
STUDENT ACHIEVEMENT - Literacy (Reading)
• Graph 1 shows mean (average) student achievement compared to ’like’ schools. This graph provides evidence that in 2011, the school achieved better mean test scores than schools of a similar socio-economic background across all year levels. This is the best result the school has achieved in some years.
• Graph 2 shows Reading results compared to the expected level of achievement. The data is presented in coloured bands representing Standard Deviations from the Mean. Scores within the yellow band are “at expected level”, scores in the green bands are “above expected level” and scores in the red bands are “below expected level”. This graph shows that while 2011 results were at expected level, there has been a downward trend since 2006 which will be addressed through rigorous review, appropriate planning and program implementation.
• Reading will continue as a priority in 2012, with an emphasis on providing SAER support and improving outcomes for the students in the middle bands of achievement. The implementation of a Whole School Literacy Plan will underpin further improvements in this area.
Graph 1 - Average Score Compared To Similar (Like) Schools
Graph 2 - Year Level Performance Compared To Expected Level
MUNDARING PRIMARY SCHOOL REPORT 2011
Mundaring Primary School 2011 School Report Page 5
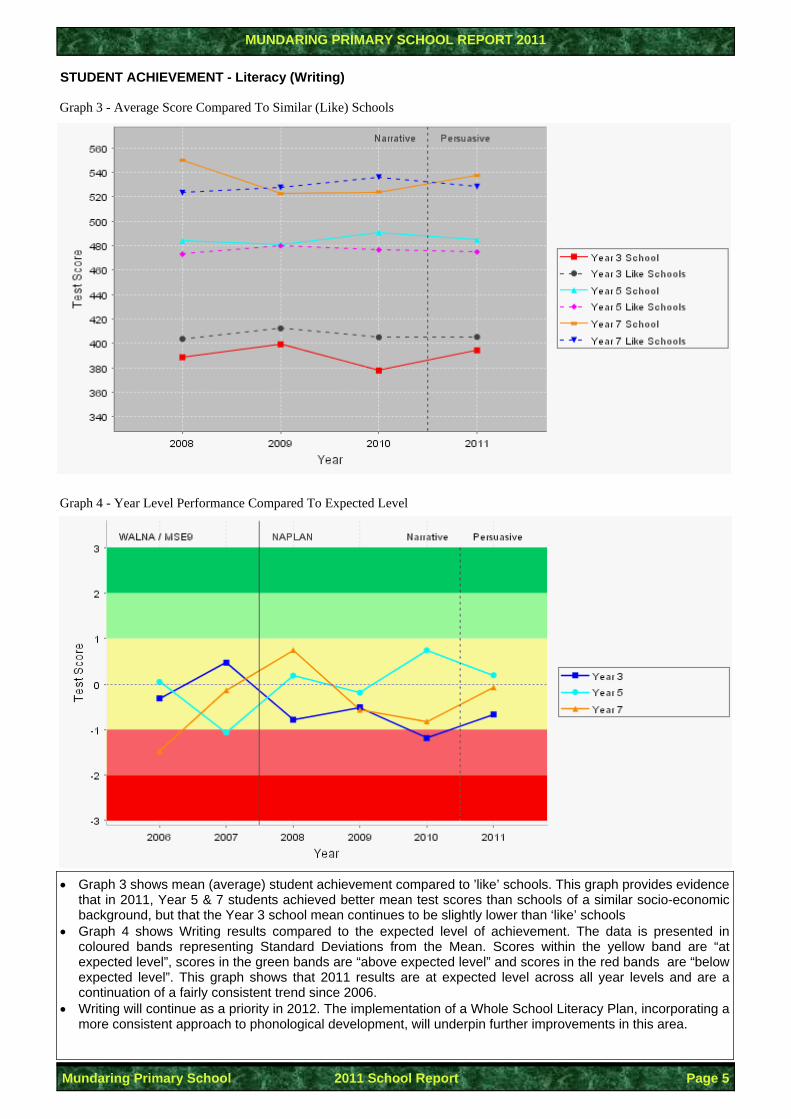
STUDENT ACHIEVEMENT - Literacy (Writing)
• Graph 3 shows mean (average) student achievement compared to ’like’ schools. This graph provides evidence that in 2011, Year 5 & 7 students achieved better mean test scores than schools of a similar socio-economic background, but that the Year 3 school mean continues to be slightly lower than ‘like’ schools
• Graph 4 shows Writing results compared to the expected level of achievement. The data is presented in coloured bands representing Standard Deviations from the Mean. Scores within the yellow band are “at expected level”, scores in the green bands are “above expected level” and scores in the red bands are “below expected level”. This graph shows that 2011 results are at expected level across all year levels and are a continuation of a fairly consistent trend since 2006.
• Writing will continue as a priority in 2012. The implementation of a Whole School Literacy Plan, incorporating a more consistent approach to phonological development, will underpin further improvements in this area.
Graph 3 - Average Score Compared To Similar (Like) Schools
Graph 4 - Year Level Performance Compared To Expected Level

MUNDARING PRIMARY SCHOOL REPORT 2011
Mundaring Primary School 2011 School Report Page 6
STUDENT ACHIEVEMENT - Literacy (Spelling)
• Graph 5 shows mean (average) student achievement compared to ’like’ schools. This graph provides evidence that in 2011, the school achieved better mean test scores than schools of a similar socio-economic background across all year levels.
• Graph 6 shows Spelling results compared to the expected level of achievement. The data is presented in coloured bands representing Standard Deviations from the Mean. Scores within the yellow band are “at expected level”, scores in the green bands are “above expected level” and scores in the red bands are “below expected level”. This graph shows that 2011 results are at expected level across all year levels and demonstrates a pleasing return to a more positive level of achievement.
• Spelling will continue as a priority in 2012. The implementation of a Whole School Literacy Plan, incorporating a more consistent approach to phonological development, will underpin further improvements in this area.
Graph 5 - Average Score Compared To Similar (Like) Schools
Graph 6 - Year Level Performance Compared To Expected Level
MUNDARING PRIMARY SCHOOL REPORT 2011
Mundaring Primary School 2011 School Report Page 7
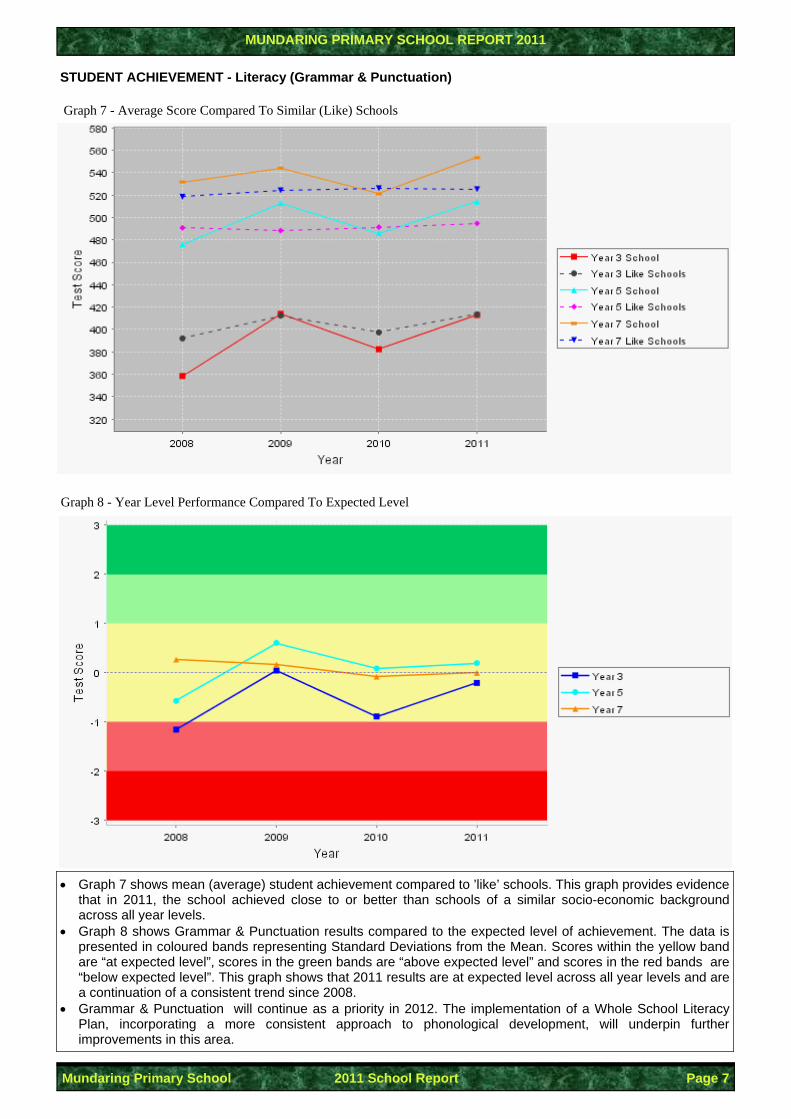
STUDENT ACHIEVEMENT - Literacy (Grammar & Punctuation)
• Graph 7 shows mean (average) student achievement compared to ’like’ schools. This graph provides evidence that in 2011, the school achieved close to or better than schools of a similar socio-economic background across all year levels.
• Graph 8 shows Grammar & Punctuation results compared to the expected level of achievement. The data is presented in coloured bands representing Standard Deviations from the Mean. Scores within the yellow band are “at expected level”, scores in the green bands are “above expected level” and scores in the red bands are “below expected level”. This graph shows that 2011 results are at expected level across all year levels and are a continuation of a consistent trend since 2008.
• Grammar & Punctuation will continue as a priority in 2012. The implementation of a Whole School Literacy Plan, incorporating a more consistent approach to phonological development, will underpin further improvements in this area.
Graph 7 - Average Score Compared To Similar (Like) Schools
Graph 8 - Year Level Performance Compared To Expected Level
MUNDARING PRIMARY SCHOOL REPORT 2011
Mundaring Primary School 2011 School Report Page 8
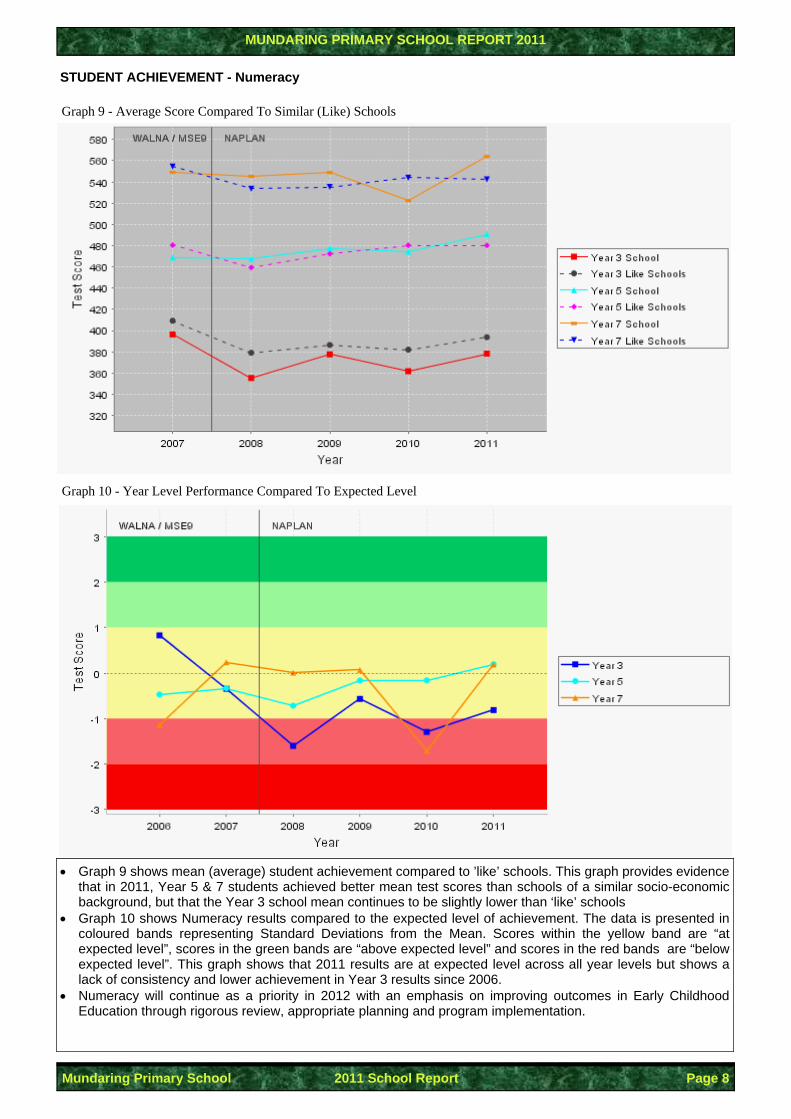
STUDENT ACHIEVEMENT - Numeracy
• Graph 9 shows mean (average) student achievement compared to ’like’ schools. This graph provides evidence that in 2011, Year 5 & 7 students achieved better mean test scores than schools of a similar socio-economic background, but that the Year 3 school mean continues to be slightly lower than ‘like’ schools
• Graph 10 shows Numeracy results compared to the expected level of achievement. The data is presented in coloured bands representing Standard Deviations from the Mean. Scores within the yellow band are “at expected level”, scores in the green bands are “above expected level” and scores in the red bands are “below expected level”. This graph shows that 2011 results are at expected level across all year levels but shows a lack of consistency and lower achievement in Year 3 results since 2006.
• Numeracy will continue as a priority in 2012 with an emphasis on improving outcomes in Early Childhood Education through rigorous review, appropriate planning and program implementation.
Graph 9 - Average Score Compared To Similar (Like) Schools
Graph 10 - Year Level Performance Compared To Expected Level

MUNDARING PRIMARY SCHOOL REPORT 2011
Mundaring Primary School 2011 School Report Page 9
STUDENT ACHIEVEMENT - Value Adding (Growth) in both Literacy & Numeracy
• The graphs on this page show the mean growth (Value Adding) over two years for the same group of students. • Growth is indicated as the difference between the mean NAPLAN score in 2009 testing and the mean
NAPLAN score in 2011 testing. This is displayed as NAPLAN Base Points. • The school data includes only students who sat both tests at Mundaring PS (Stable Cohort). • Graph 11 shows that in all Literacy and Numeracy strands, the Year 5 students of 2011 displayed greater
growth as a group over the preceding two years than that of their peer students in similar schools. • Graph 12 shows a similar picture, with the Year 7 students of 2011 displaying greater growth as a group over
the preceding two years than that of their peer students in similar schools in all but Reading. • This data clearly shows that for students who stay at Mundaring PS over a period of years, the school’s
teaching and learning programs result in improved outcomes when compared to similar schools.
N.B. Writing is not included in this data due to a change of genre in the NAPLAN Writing Test in 2010.
Graph 11 - Year 3 (2009) to Year 5 (2011) - Stable Cohort
Graph 12 - Year 5 (2009) to Year 7 (2011) - Stable Cohort
0
20
40
60
80
100
120
140
Reading Spelling Grammar &Punctuation
Numeracy
Strand
NA
PLA
N B
ase
Poin
ts
SchoolLike Schools
0
10
20
30
40
50
60
70
80
90
Reading Spelling Grammar &Punctuation
Numeracy
Strand
NA
PLA
N B
ase
Poin
ts
SchoolLike Schools

MUNDARING PRIMARY SCHOOL REPORT 2011
Mundaring Primary School 2011 School Report Page 10
STUDENT ACHIEVEMENT - Teacher Judgements (Priority Areas - English & Mathematics)
• The graphs above display the grade distributions of student in Years 3, 5 & 7 in English and Mathematics. The graphs show that according to teacher judgements, grades are being awarded match the expected “normal curve”, with most students achieving ’C’ or satisfactory grades.
• Graphs 13 to 15 show Teacher Judgements in English based upon report data from Semester 2 2011. This
data shows that when compared with “like” or similar schools, our Year 3 & Year 5 teachers are generally making consistent judgements. The Year 7 teacher judgement data shows a higher number of E grades being awarded to the cohort. This will be addressed through a review of the school’s moderation processes in 2012.
• Graphs 16 to 18 show Teacher Judgements in Mathematics based upon report data from Semester 2 2011.
Again this data generally supports the belief that our teachers are making consistent judgements, with some evidence that we may need to review the schools moderation processes in the upper year levels.
READING (Graphs 13 - 15) NUMERACY (Graphs 16 - 18)
MUNDARING PRIMARY SCHOOL REPORT 2011
Mundaring Primary School 2011 School Report Page 11
STUDENT ATTENDANCE
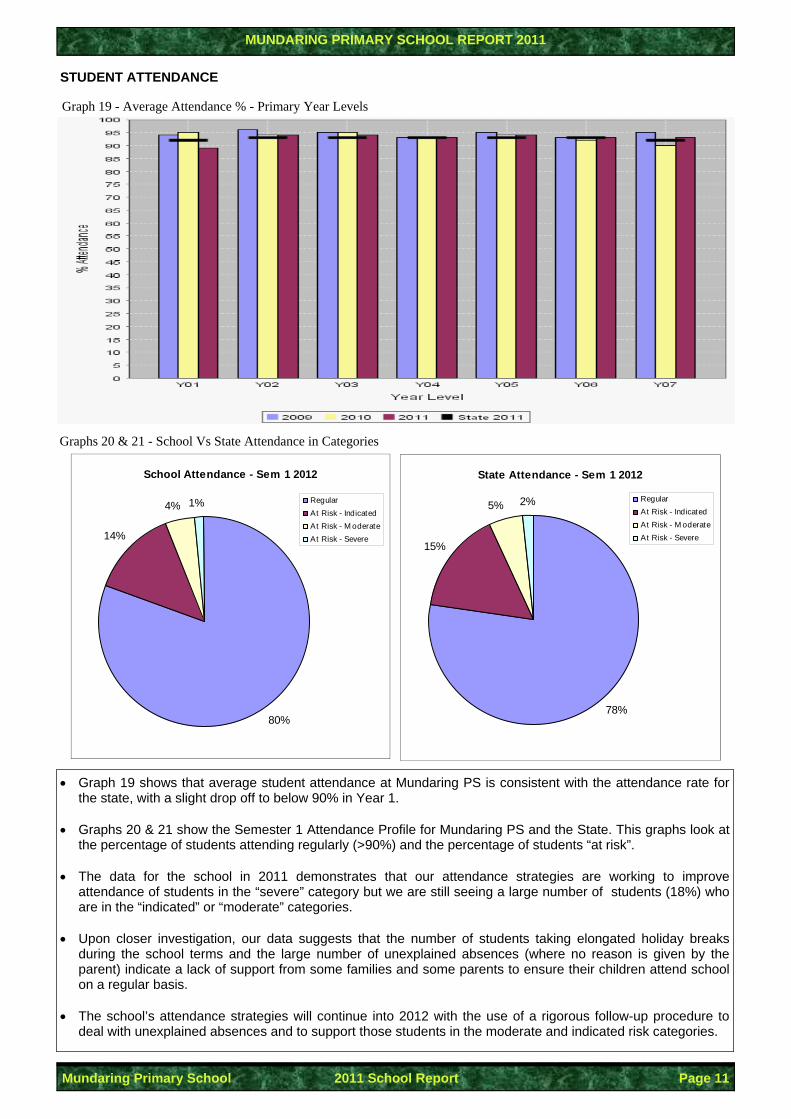
• Graph 19 shows that average student attendance at Mundaring PS is consistent with the attendance rate for the state, with a slight drop off to below 90% in Year 1.
• Graphs 20 & 21 show the Semester 1 Attendance Profile for Mundaring PS and the State. This graphs look at
the percentage of students attending regularly (>90%) and the percentage of students “at risk”. • The data for the school in 2011 demonstrates that our attendance strategies are working to improve
attendance of students in the “severe” category but we are still seeing a large number of students (18%) who are in the “indicated” or “moderate” categories.
• Upon closer investigation, our data suggests that the number of students taking elongated holiday breaks
during the school terms and the large number of unexplained absences (where no reason is given by the parent) indicate a lack of support from some families and some parents to ensure their children attend school on a regular basis.
• The school’s attendance strategies will continue into 2012 with the use of a rigorous follow-up procedure to
deal with unexplained absences and to support those students in the moderate and indicated risk categories.
Graph 19 - Average Attendance % - Primary Year Levels
Graphs 20 & 21 - School Vs State Attendance in Categories
State Attendance - Sem 1 2012
78%
15%
5% 2% Regular At Risk - IndicatedAt Risk - M oderateAt Risk - Severe
School Attendance - Sem 1 2012
80%
14%
4% 1% Regular At Risk - IndicatedAt Risk - M oderateAt Risk - Severe

MUNDARING PRIMARY SCHOOL REPORT 2011
Mundaring Primary School 2011 School Report Page 12
STUDENT ATTITUDE, BEHAVIOUR AND EFFORT
• Graph 22 represents data collected from Semester 2 2011 reports and is based upon teacher judgements of the attitude, behaviour and effort of their students.
• The areas reported on are:
• 1) works to the best of their ability • 2) shows self respect and care • 3) shows courtesy and respect for the rights of others • 4) participates responsibly in social and civic activities • 5) cooperates productively and builds positive relationships with others • 6) is enthusiastic about learning • 7) sets goals and works towards them with perseverance • 8) shows confidence in making positive choices and decisions.
• The data shows that the school is seeing most children in the early years (Year 1 to Year 4) displaying
appropriate behaviour and attitudes more often than not, with only a few students in Year 3 being rated as “seldom” by their teachers in the area of goal setting and perseverance.
• The data does however show some children in the older grades (Year 5 to Yr 7) displaying inappropriate
behaviour and attitudes at times, being rated as “seldom” by their teachers across various areas. While this change in attitude can in some part be explained by the children growing up and becoming more independent, the school will be reviewing its policies and programs with a view to developing a whole school approach to addressing this situation.
• It must be noted here that the number of referrals to Admin for misbehaviour is relatively low, with the vast
majority of students (92%) acting responsibly in the classroom and the playground. The school will however be investigating ways in which to further improve student attitudes, behaviours and effort in 2012.
STUDENT SUSPENSIONS AND EXCLUSIONS There were no student suspensions or exclusions in 2011.
Graph 22
Graph 22

MUNDARING PRIMARY SCHOOL REPORT 2011
Mundaring Primary School 2011 School Report Page 13
HIGHLIGHTS OF THE SCHOOL YEAR
MUNDARING PS STUDENTS DANCE TO FITNESS Students from O’Connor Block at Mundaring Primary School participate in physical fitness activities to develop a healthy lifestyle. The teachers are also building up their fitness as they join in the daily games and activities. For 15 minutes in the mornings, Year 1, 2 and 3 students from Mrs Dent, Ms Moir, Mrs Rigg, Mr Tonkin and Mrs Pruyn's classes walk, run, skip and dance into physical fitness and a healthy lifestyle.
P&C AWESOME ARVO The P&C Awesome Arvo was a huge success with a fantastic turnout from school families who all enjoyed a fun and relaxed afternoon. The P&C committee who organised the afternoon were thrilled by the positive feedback and particularly from the large number of requests to ‘do it again’ – though those kids who wanted it to happen every Friday were a little disappointed to hear it was only going to be once a year! Thank you to everyone who helped make it happen from parent volunteers to teaching staff, it was all greatly appreciated.
SCITECH COMES TO MUNDARING PS Following a professional development day held at Mundaring Primary School for staff by a member of the Scitech education unit, demonstration lessons were held in all classrooms. The focus was on methods of learning and teaching scientific investigations. This includes concepts such as identifying and controlling variables, planning for investigations in small groups, measuring and observing accurately and collecting data in tables and graphs. Students from pre-primary through to Year 7 participated in these activities, bringing scientific investigations to students in a fun way.
MUNDARING PRIMARY SCHOOL REPORT 2011
Mundaring Primary School 2011 School Report Page 14
HIGHLIGHTS OF THE SCHOOL YEAR
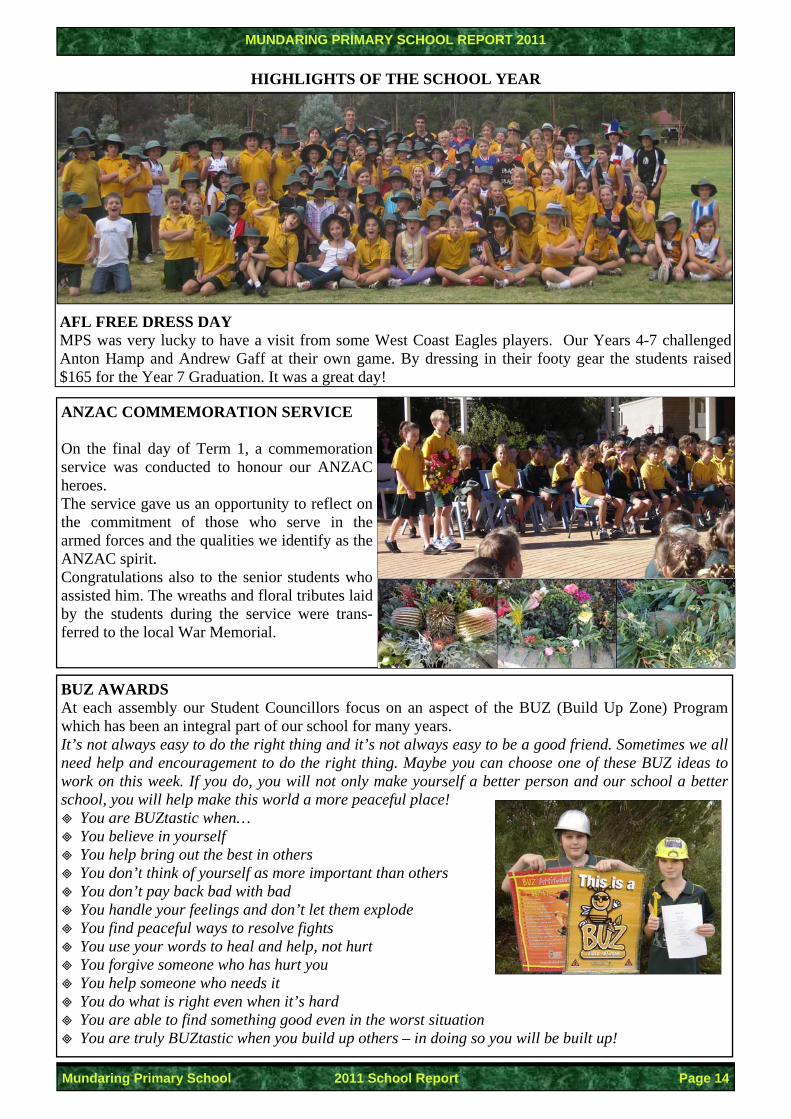
AFL FREE DRESS DAY MPS was very lucky to have a visit from some West Coast Eagles players. Our Years 4-7 challenged Anton Hamp and Andrew Gaff at their own game. By dressing in their footy gear the students raised $165 for the Year 7 Graduation. It was a great day!
ANZAC COMMEMORATION SERVICE On the final day of Term 1, a commemoration service was conducted to honour our ANZAC heroes. The service gave us an opportunity to reflect on the commitment of those who serve in the armed forces and the qualities we identify as the ANZAC spirit. Congratulations also to the senior students who assisted him. The wreaths and floral tributes laid by the students during the service were trans-ferred to the local War Memorial.
BUZ AWARDS At each assembly our Student Councillors focus on an aspect of the BUZ (Build Up Zone) Program which has been an integral part of our school for many years. It’s not always easy to do the right thing and it’s not always easy to be a good friend. Sometimes we all need help and encouragement to do the right thing. Maybe you can choose one of these BUZ ideas to work on this week. If you do, you will not only make yourself a better person and our school a better school, you will help make this world a more peaceful place! You are BUZtastic when… You believe in yourself You help bring out the best in others You don’t think of yourself as more important than others You don’t pay back bad with bad You handle your feelings and don’t let them explode You find peaceful ways to resolve fights You use your words to heal and help, not hurt You forgive someone who has hurt you You help someone who needs it You do what is right even when it’s hard You are able to find something good even in the worst situation You are truly BUZtastic when you build up others – in doing so you will be built up!
MUNDARING PRIMARY SCHOOL REPORT 2011
Mundaring Primary School 2011 School Report Page 15
HIGHLIGHTS OF THE SCHOOL YEAR
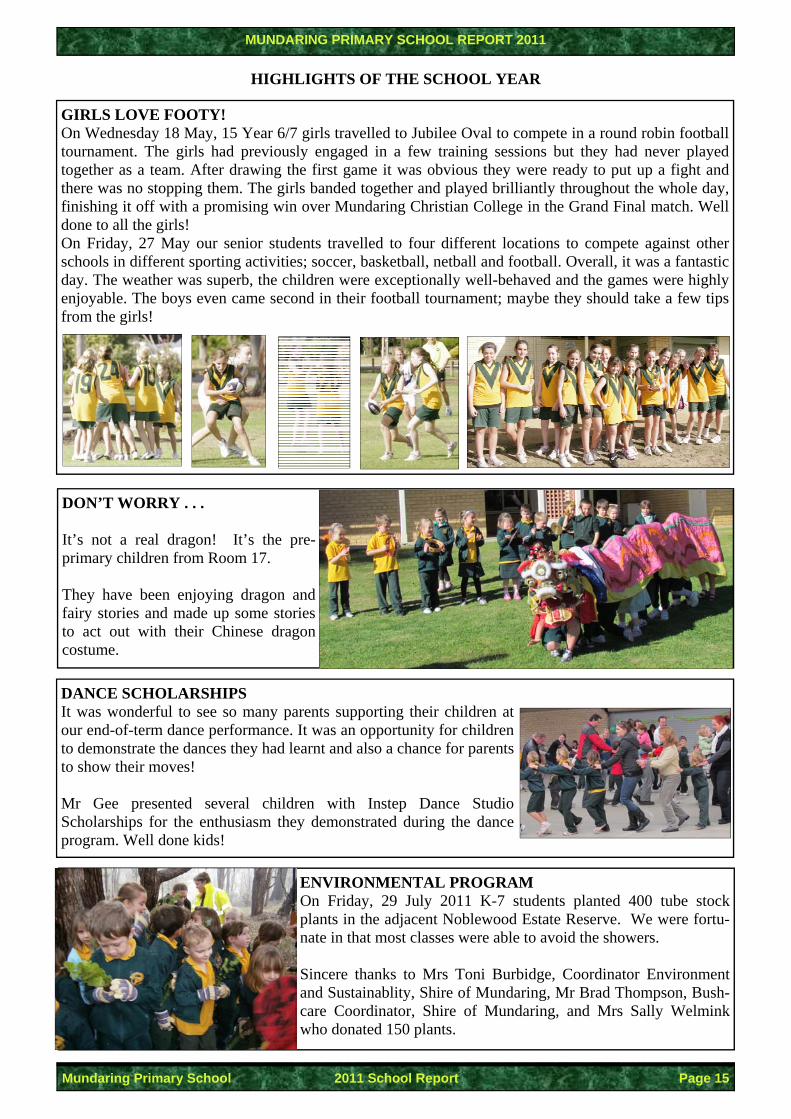
GIRLS LOVE FOOTY! On Wednesday 18 May, 15 Year 6/7 girls travelled to Jubilee Oval to compete in a round robin football tournament. The girls had previously engaged in a few training sessions but they had never played together as a team. After drawing the first game it was obvious they were ready to put up a fight and there was no stopping them. The girls banded together and played brilliantly throughout the whole day, finishing it off with a promising win over Mundaring Christian College in the Grand Final match. Well done to all the girls! On Friday, 27 May our senior students travelled to four different locations to compete against other schools in different sporting activities; soccer, basketball, netball and football. Overall, it was a fantastic day. The weather was superb, the children were exceptionally well-behaved and the games were highly enjoyable. The boys even came second in their football tournament; maybe they should take a few tips from the girls!
DON’T WORRY . . . It’s not a real dragon! It’s the pre-primary children from Room 17. They have been enjoying dragon and fairy stories and made up some stories to act out with their Chinese dragon costume.
DANCE SCHOLARSHIPS It was wonderful to see so many parents supporting their children at our end-of-term dance performance. It was an opportunity for children to demonstrate the dances they had learnt and also a chance for parents to show their moves! Mr Gee presented several children with Instep Dance Studio Scholarships for the enthusiasm they demonstrated during the dance program. Well done kids!
ENVIRONMENTAL PROGRAM On Friday, 29 July 2011 K-7 students planted 400 tube stock plants in the adjacent Noblewood Estate Reserve. We were fortu-nate in that most classes were able to avoid the showers. Sincere thanks to Mrs Toni Burbidge, Coordinator Environment and Sustainablity, Shire of Mundaring, Mr Brad Thompson, Bush-care Coordinator, Shire of Mundaring, and Mrs Sally Welmink who donated 150 plants.
MUNDARING PRIMARY SCHOOL REPORT 2011
Mundaring Primary School 2011 School Report Page 16
HIGHLIGHTS OF THE SCHOOL YEAR
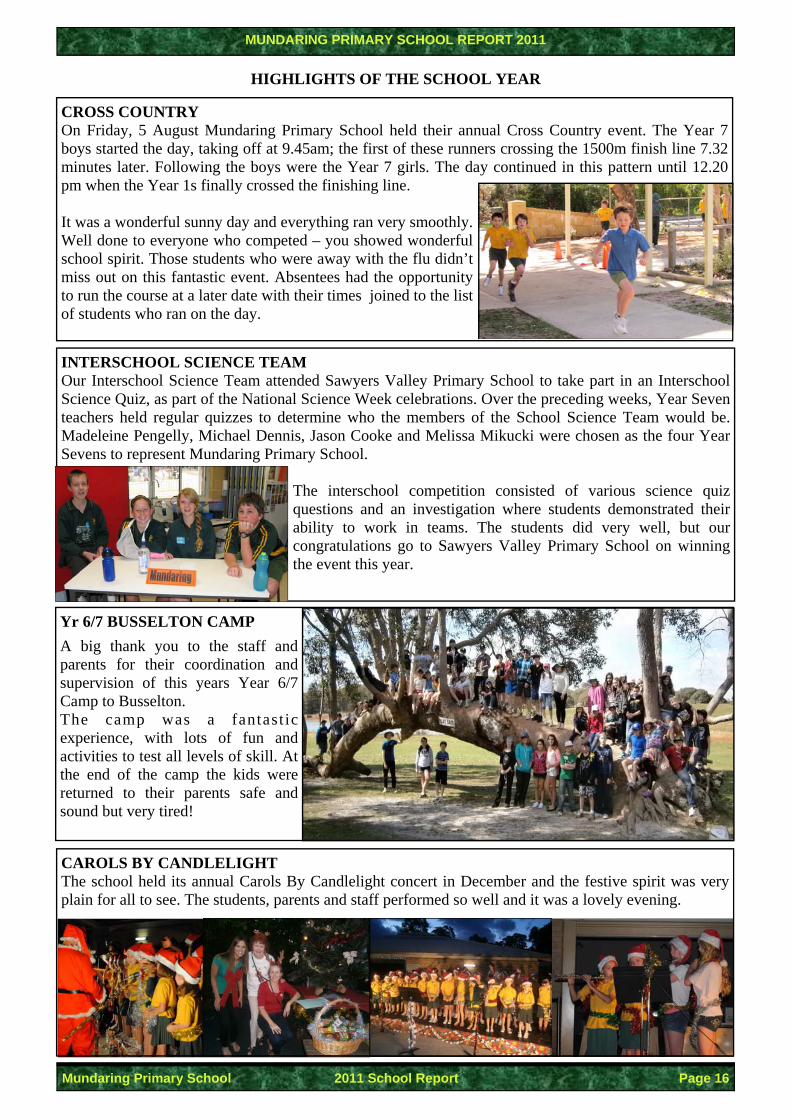
CROSS COUNTRY On Friday, 5 August Mundaring Primary School held their annual Cross Country event. The Year 7 boys started the day, taking off at 9.45am; the first of these runners crossing the 1500m finish line 7.32 minutes later. Following the boys were the Year 7 girls. The day continued in this pattern until 12.20 pm when the Year 1s finally crossed the finishing line. It was a wonderful sunny day and everything ran very smoothly. Well done to everyone who competed – you showed wonderful school spirit. Those students who were away with the flu didn’t miss out on this fantastic event. Absentees had the opportunity to run the course at a later date with their times joined to the list of students who ran on the day.
INTERSCHOOL SCIENCE TEAM Our Interschool Science Team attended Sawyers Valley Primary School to take part in an Interschool Science Quiz, as part of the National Science Week celebrations. Over the preceding weeks, Year Seven teachers held regular quizzes to determine who the members of the School Science Team would be. Madeleine Pengelly, Michael Dennis, Jason Cooke and Melissa Mikucki were chosen as the four Year Sevens to represent Mundaring Primary School.
The interschool competition consisted of various science quiz questions and an investigation where students demonstrated their ability to work in teams. The students did very well, but our congratulations go to Sawyers Valley Primary School on winning the event this year.
Yr 6/7 BUSSELTON CAMP
A big thank you to the staff and parents for their coordination and supervision of this years Year 6/7 Camp to Busselton. The camp was a fantast ic experience, with lots of fun and activities to test all levels of skill. At the end of the camp the kids were returned to their parents safe and sound but very tired!
CAROLS BY CANDLELIGHT The school held its annual Carols By Candlelight concert in December and the festive spirit was very plain for all to see. The students, parents and staff performed so well and it was a lovely evening.
MUNDARING PRIMARY SCHOOL REPORT 2011
Mundaring Primary School 2011 School Report Page 17
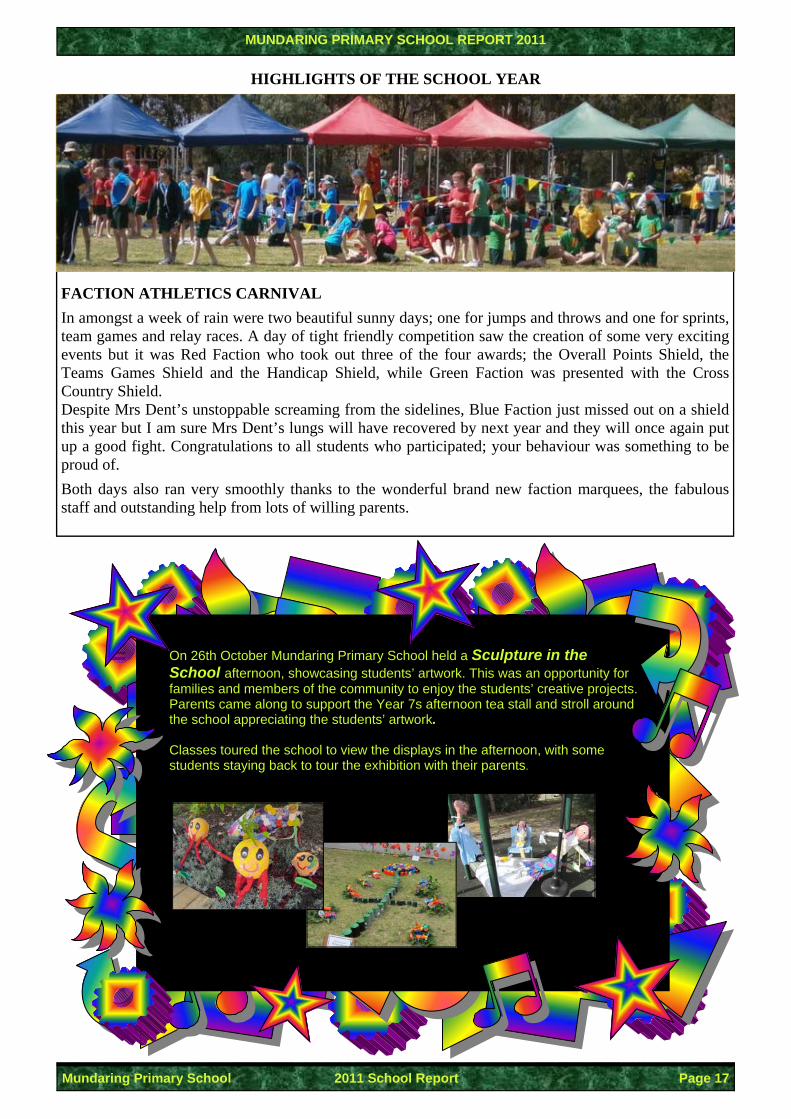
FACTION ATHLETICS CARNIVAL
In amongst a week of rain were two beautiful sunny days; one for jumps and throws and one for sprints, team games and relay races. A day of tight friendly competition saw the creation of some very exciting events but it was Red Faction who took out three of the four awards; the Overall Points Shield, the Teams Games Shield and the Handicap Shield, while Green Faction was presented with the Cross Country Shield. Despite Mrs Dent’s unstoppable screaming from the sidelines, Blue Faction just missed out on a shield this year but I am sure Mrs Dent’s lungs will have recovered by next year and they will once again put up a good fight. Congratulations to all students who participated; your behaviour was something to be proud of.
Both days also ran very smoothly thanks to the wonderful brand new faction marquees, the fabulous staff and outstanding help from lots of willing parents.
HIGHLIGHTS OF THE SCHOOL YEAR
On 26th October Mundaring Primary School held a Sculpture in the School afternoon, showcasing students’ artwork. This was an opportunity for families and members of the community to enjoy the students’ creative projects. Parents came along to support the Year 7s afternoon tea stall and stroll around the school appreciating the students’ artwork. Classes toured the school to view the displays in the afternoon, with some students staying back to tour the exhibition with their parents.
MUNDARING PRIMARY SCHOOL REPORT 2011
Mundaring Primary School 2011 School Report Page 18
1 11,926.00$ 11,986.00$ 2 40,681.00$ 40,732.97$ 3 ‐$ ‐$ 4 4,824.00$ 4,823.70$ 5 110.00$ 110.00$ 6 190,827.79$ 190,828.69$ 7 ‐$ ‐$ 8 ‐$ ‐$ 9 ‐$ ‐$
10 28,560.00$ 28,688.77$ 11 43,558.00$ 43,558.00$
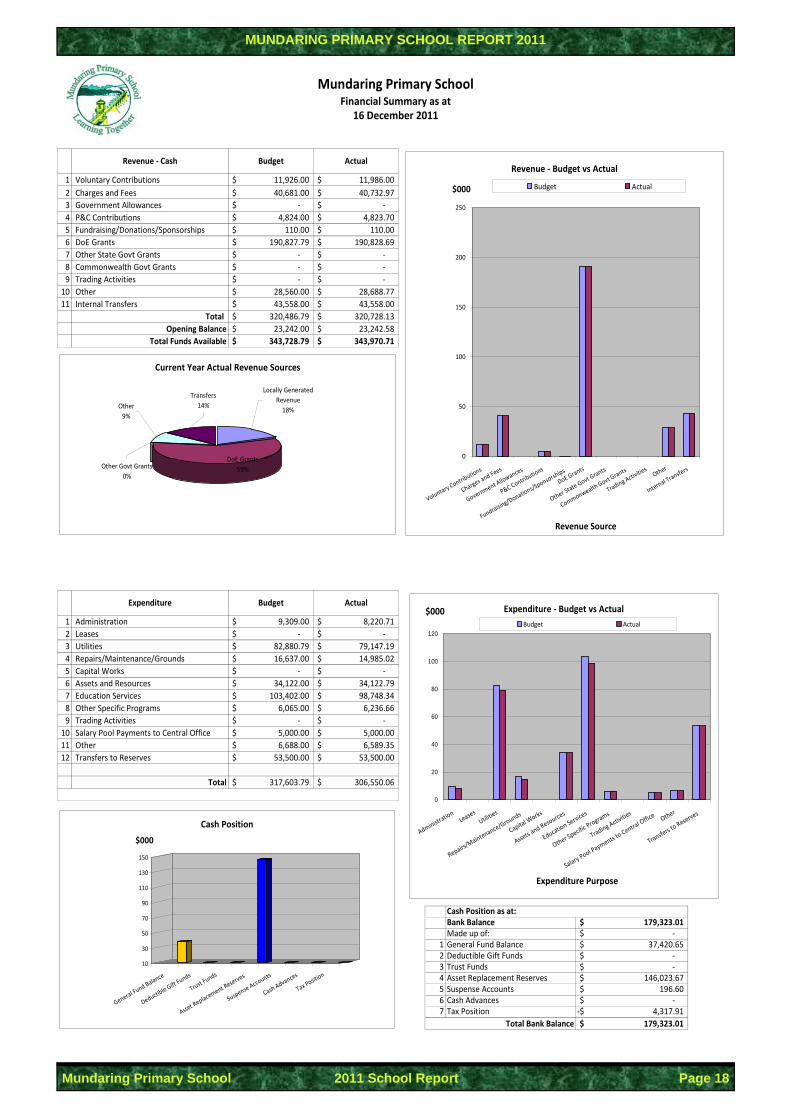
320,486.79$ 320,728.13$ 23,242.00$ 23,242.58$
343,728.79$ 343,970.71$
Locally Gen 57,652.67$ DoE Grants 190,828.69$ Other Govt ‐$ Other 28,688.77$ Transfers 43,558.00$
320,728.13$
1 9,309.00$ 8,220.71$ 2 ‐$ ‐$ 3 82,880.79$ 79,147.19$ 4 16,637.00$ 14,985.02$ 5 ‐$ ‐$ 6 34,122.00$ 34,122.79$ 7 103,402.00$ 98,748.34$ 8 6,065.00$ 6,236.66$ 9 ‐$ ‐$
10 5,000.00$ 5,000.00$ 11 6,688.00$ 6,589.35$ 12 53,500.00$ 53,500.00$
317,603.79$ 306,550.06$
Bank Balance 179,323.01$ Made up of: ‐$
1 General Fund Balance 37,420.65$ 2 Deductible Gift Funds ‐$ 3 Trust Funds ‐$ 4 Asset Replacement Reserves 146,023.67$ 5 Suspense Accounts 196.60$ 6 Cash Advances ‐$ 7 Tax Position 4,317.91‐$
179,323.01$ Total Bank Balance
Cash Position as at:
Other Transfers to Reserves
Total
Assets and ResourcesEducation ServicesOther Specific Programs
Salary Pool Payments to Central Office
Budget ActualExpenditure
Trading Activities
AdministrationLeasesUtilitiesRepairs/Maintenance/GroundsCapital Works
Total Funds Available
Internal Transfers
BudgetRevenue ‐ Cash
Trading ActivitiesOther
Fundraising/Donations/SponsorshipsDoE GrantsOther State Govt Grants
Total
Mundaring Primary SchoolFinancial Summary as at
Actual
16 December 2011
Opening Balance
Voluntary ContributionsCharges and FeesGovernment AllowancesP&C Contributions
Commonwealth Govt Grants
Revenue ‐ Budget vs Actual
0
50
100
150
200
250
Volunt
ary Con
tributio
ns
Charge
s and Fe
es
Govern
ment A
llowanc
es
P&C Co
ntribut
ions
Fundra
ising/D
onation
s/Spons
orships
DoE Gra
nts
Other S
tate Go
vt Gran
ts
Commo
nwealth
Govt G
rants
Tradin
g Activit
ies Other
Interna
l Trans
fers
$000
Revenue Source
Budget Actual
Current Year Actual Revenue Sources
Transfers14%
Locally Generated Revenue18%
DoE Grants59%Other Govt Grants
0%
Other 9%
Expenditure ‐ Budget vs Actual
0
20
40
60
80
100
120
Adminis
tration Lea
sesUtil
ities
Repairs
/Main
tenanc
e/Grou
nds
Capital
Works
Assets
and Re
source
s
Educat
ion Ser
vices
Other S
pecific
Progra
ms
Tradin
g Activ
ities
Salary P
ool Pay
ments
to Cen
tral Off
ice Other
Transf
ers to
Reserv
es
$000
Expenditure Purpose
Budget Actual
10
30
50
70
90
110
130
150
$000
Genera
l Fund
Balanc
e
Deduct
ible Gif
t Funds
Trust F
unds
Asset R
eplace
ment R
eserve
s
Suspen
se Acco
unts
Cash A
dvance
s
Tax Po
sition
Cash Position
Insert your School Logo Here or Delete if not required

MUNDARING PRIMARY SCHOOL REPORT 2011
Mundaring Primary School 2011 School Report Page 19
As the data analysis and highlights on the preceding pages show, 2011 was a very positive year for Mundaring Primary School with regards to student achievement and progress. Student achievement data demonstrates that the school has achieved the best results in some years, with 13 out of 15 NAPLAN areas showing results at or better than similar schools. From the Value Adding Data on page 7, it is obvious that the school’s programs in middle and upper primary are providing students with the best possible opportunities to demonstrate academic growth at a higher level than that of similar schools. More work however, needs to be done in the early years of education to ensure that our younger students are given the best possible start from which to springboard to success. The school will undertake a program of rigorous review and planning, including an educational audit of early childhood programs and practices, to ensure improvement in this area. At the end of 2011, Mundaring Primary School was reclassified from a Level 5 school to a Level 4 school due to decreasing numbers. This has brought with it changes to the leadership of the school with my commencement as Principal in January 2012 and a decrease in the number of Deputy Principal positions at the school. I see great opportunities ahead for the school to regain some of the ground we have lost over recent years. I see our success in this endeavour being linked directly to the way we work with our parents and community, to the quality of our teaching and learning programs, and to the level of support we offer our students who are most at risk. I look forward to the challenge of meeting the diverse needs of the students and wider school community at Mundaring Primary School in 2012 and into the future. Paul Larkin Principal 5th July 2012
Principal’s Comment