Embed Size (px)
Citation preview
Highway 50 2011 State of the Corridor Report (1)
CALTRANS DISTRICT 3
2011 Report on the Highway 50 Corridor System Management Plan
Overview
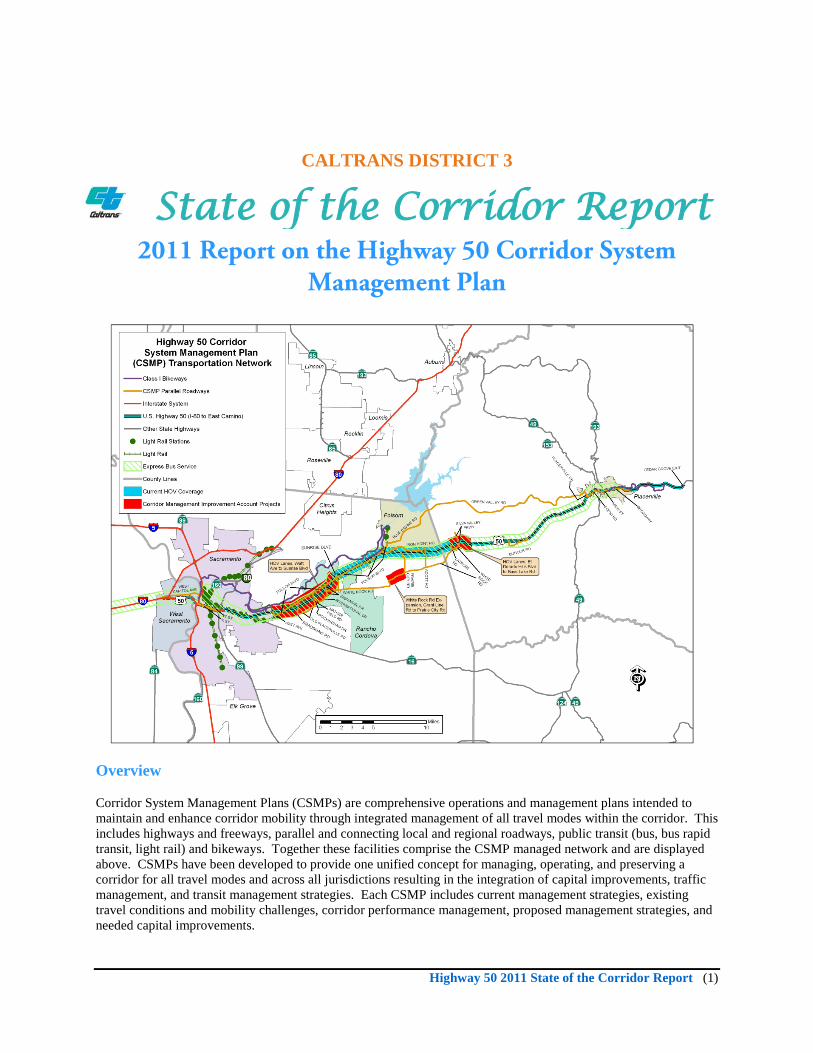
Corridor System Management Plans (CSMPs) are comprehensive operations and management plans intended to maintain and enhance corridor mobility through integrated management of all travel modes within the corridor. This includes highways and freeways, parallel and connecting local and regional roadways, public transit (bus, bus rapid transit, light rail) and bikeways. Together these facilities comprise the CSMP managed network and are displayed above. CSMPs have been developed to provide one unified concept for managing, operating, and preserving a corridor for all travel modes and across all jurisdictions resulting in the integration of capital improvements, traffic management, and transit management strategies. Each CSMP includes current management strategies, existing travel conditions and mobility challenges, corridor performance management, proposed management strategies, and needed capital improvements.
State of the Corridor Report
Highway 50 2011 State of the Corridor Report (2)
Purpose of the State of the Corridor Report
The annual State of the Corridor (SOTC) Report maintains the momentum started by the completion of the 2009 CSMPs and the 2010 SOTC Report by monitoring and reporting annual corridor performance and ongoing implementation of CSMP strategies. The SOTC Report documents the movement towards true integrated multimodal corridor system management, as well as anticipated corridor mobility challenges, and impediments to CSMP implementation. The SOTC Report includes the following components:
• Status of the Corridor Mobility Improvement Account and Highway 99 Program Bond Projects
• Major Corridor Accomplishments
• Performance Measures
• Moving Forward
o CSMP Strategies
o Key Projects
o Micro-simulation Modeling
• Glossary Corridor Mobility Improvement Account Bond Project Status CSMPs were developed for corridors associated with the Corridor Mobility Improvement Account (CMIA) and Highway 99 Bond Program projects, supported by the Highway Safety, Traffic Reduction, Air Quality, and Port Security Bond Act of 2006, Proposition 1B. Three projects on Highway 50 in District 3 were awarded CMIA funds. The status of these projects is as follows: High Occupancy Vehicle (HOV) lanes on Highway 50, from Watt Avenue to Sunrise Boulevard: Construction began in January 2010 and is scheduled to be completed by January 2013. White Rock Rd Expansion, from Grant Line Rd to Prairie City Rd: The CTC allocation for project construction funding is anticipated to be requested in August 2011. Project construction is expected to begin late in 2011, and to be completed in 2013. HOV Lanes on Highway 50, from El Dorado Hills Boulevard to Bass Lake Road: Construction for the first phase of the project began in November 2008 and is anticipated to be completed in December 2011. In May 2010, EDCTC successfully obtained $3.5 million in CMIA cost savings, through the CTC, to extend the eastbound HOV lane an additional 1.5 miles to east of Bass Lake Road.
Highway 50 2011 State of the Corridor Report (3)
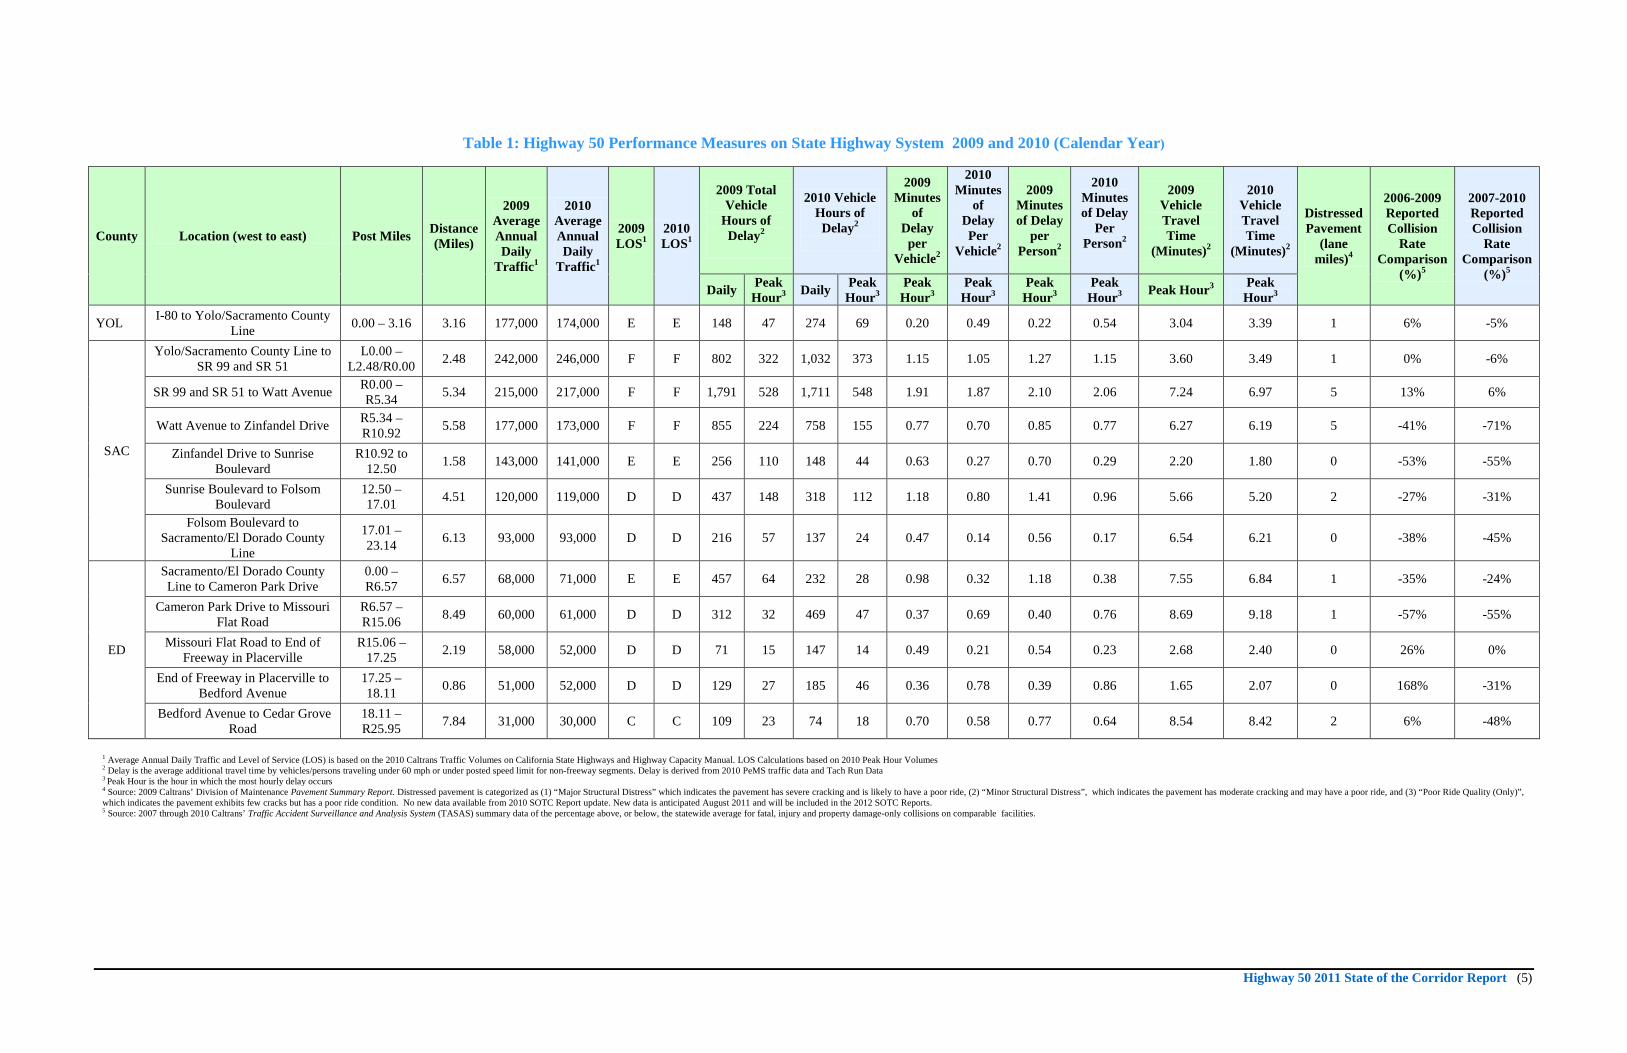
Major Corridor Accomplishments Highway 50 – Harbor Boulevard Interchange Improvement Project: In November 2010, the $34.7 million project was completed to enhance the efficient movement of goods to, and from, the Port of Sacramento with the addition of new ramps and auxiliary lanes at the interchange, and widening Harbor Boulevard to 6 lanes. Highway 50 High Occupancy Vehicle Lane Project, from Bass Lake Rd. to Cameron Park Drive: The CTC approved the programming of $9.5 million in CMIA Program savings to Phase 2A Segment 1 of the Highway 50 HOV Lane Project. Highway 50 El Dorado County Freeway Service Patrol: In December 2010, the El Dorado County Transportation Commission (EDCTC) began funding new Freeway Service Patrol assistance to motorists on Highway 50 from the Sacramento County line to the Greenstone Road Interchange. Approximately 113 motorists were assisted in the first 36 days of the new program. The Freeway Service Patrol (FSP) provides assistance to the traveling public during peak commute hours. The FSP is designed to increase roadway safety, reduce motorist delays, reduce freeway congestion, reduce air pollution, and improve overall efficiency of freeway operations. This new expands FSP an additional 10 miles east into El Dorado County from the existing FSP limits in Sacramento County. Highway 50 – Missouri Flat Road Interchange Project, Phase 1B: This phase of the project is scheduled for completion in the summer of 2012. This $37.5 million project will widen the Highway 50 Weber Creek bridges and provide bicycle and pedestrian facilities between Missouri Flat Road and the Western Placerville / Forni Road interchanges. This project will also provide traffic signal improvements and will widen Missouri Flat Road. International Drive Extension: In December 2010, the International Drive extension project was completed in Rancho Cordova. This $13.5 million project created a new connector road between Sunrise Boulevard and Kilgore Road to alleviate traffic congestion on White Rock Road. The 50 Mobility Partnership identified this project as a near-term priority roadway improvement for connectivity in the corridor. American River Parkway Pavement Repair: In 2010, Sacramento County Department of Transportation in cooperation with Sacramento Regional Parks completed a pavement repair project, replacing 9,000 feet of asphalt bike path between Howe Avenue and Watt Avenue. Highway 50 Still Meadows Warning Signs: In July 2010, a pilot project was completed in partnership with the EDCTC that included the installation of four vehicle activated illuminated warning signs on Highway 50, as well as a vehicle-detection pavement loop on Still Meadows Road. These signs are intended to warn motorists of cross traffic entering and leaving the highway from uncontrolled intersections, thereby reducing the collision rate. Performance Measures A diverse mixture of transportation modes and roadways such as state highways, major arterial roadways, transit services and bicycle facilities, make up the managed network and combine to provide mobility in the Highway 50 corridor. Continuous monitoring of the network through the use of performance measures is an integral part of corridor management and investment decision making by aiding in the identification of immediate, efficient, and effective system operational strategies and capital improvements. State Highway System Performance Measures Performance measures and data for the State Highway System (SHS) identified in the 2009 CSMP and performance measure data collected for 2010 are included in Table 1. The data for 2010 was updated using Performance Measurement System (PeMS) and tachometer run (tach-run) data. Since the completion of the 2009 CSMP, additional detection has been completed offering better PeMS coverage and more reliable data. As a result, the 2010 SOTC Report provides the performance measures which are being used as our baseline to track system performance.
Highway 50 2011 State of the Corridor Report (4)
The 2011 SOTC Report and future annual SOTC Reports will include run-charts indicating changes in the performance measures in logical time increments. The delay values for Table 1 were calculated from data obtained from Caltrans PeMS and draft 2010 traffic volume data provided by the District 3 Traffic Census unit. PeMS uses loop detectors embedded in the pavement of freeways to measure speeds at various locations. Delay is calculated by comparing the free-flow speed of a segment to observed speeds in PeMS. The data was collected for the typical mid-week commute (Tuesday, Wednesday, and Thursday) at time periods that would provide average daily recurrent congestion, specifically spring and fall of 2010. Before the data was used in delay/travel time calculations, it was analyzed against the draft 2010 traffic volume data provided by the District 3 Traffic Census unit to remove any outliers. For areas that had no PeMS coverage, “tach runs” were used to calculate delay and travel times. These tach runs were done during the spring of 2010 on Tuesdays, Wednesdays, and Thursdays during non-holiday weeks. The tach runs captured peak commute congestion standard probe vehicle techniques.
The performance measures may appear somewhat inconsistent when compared to each other. For example, in some instances, delay/travel time increases where traffic volumes decline and in other cases it is the reverse. Changes in reported delay/travel can occur for reasons other than changes in traffic volumes, such as the effects of non-recurrent congestion including roadway incidents (traffic collisions, stalled vehicles, etc.), weather conditions (rain, fog, etc.), roadway construction activities, economic changes and mode shifts. These inconsistencies may limit the value of the reported performance measures comparing a 2 year period; however, over longer periods of time trends can be illustrated. The corridor system management process is still in the early stages of development, and the value of reporting performance will become clearer over time, as will the ability to see trends and make better use of the data.
Highway 50 2011 State of the Corridor Report (5)
1 Average Annual Daily Traffic and Level of Service (LOS) is based on the 2010 Caltrans Traffic Volumes on California State Highways and Highway Capacity Manual. LOS Calculations based on 2010 Peak Hour Volumes 2 Delay is the average additional travel time by vehicles/persons traveling under 60 mph or under posted speed limit for non-freeway segments. Delay is derived from 2010 PeMS traffic data and Tach Run Data 3 Peak Hour is the hour in which the most hourly delay occurs 4 Source: 2009 Caltrans’ Division of Maintenance Pavement Summary Report. Distressed pavement is categorized as (1) “Major Structural Distress” which indicates the pavement has severe cracking and is likely to have a poor ride, (2) “Minor Structural Distress”, which indicates the pavement has moderate cracking and may have a poor ride, and (3) “Poor Ride Quality (Only)”, which indicates the pavement exhibits few cracks but has a poor ride condition. No new data available from 2010 SOTC Report update. New data is anticipated August 2011 and will be included in the 2012 SOTC Reports. 5 Source: 2007 through 2010 Caltrans’ Traffic Accident Surveillance and Analysis System (TASAS) summary data of the percentage above, or below, the statewide average for fatal, injury and property damage-only collisions on comparable facilities.
Table 1: Highway 50 Performance Measures on State Highway System 2009 and 2010 (Calendar Year)
County Location (west to east) Post Miles Distance (Miles)
2009 Average Annual Daily
Traffic1
2010 Average Annual Daily
Traffic1
2009 LOS1
2010 LOS1
2009 Total Vehicle
Hours of Delay2
2010 Vehicle Hours of Delay2
2009 Minutes
of Delay
per Vehicle2
2010 Minutes
of Delay Per
Vehicle2
2009 Minutes of Delay
per Person2
2010 Minutes of Delay
Per Person2
2009 Vehicle Travel Time
(Minutes)2
2010 Vehicle Travel Time
(Minutes)2
Distressed Pavement
(lane miles)4
2006-2009 Reported Collision
Rate Comparison
(%)5
2007-2010 Reported Collision
Rate Comparison
(%)5 Daily Peak
Hour3 Daily Peak Hour3
Peak Hour3
Peak Hour3
Peak Hour3
Peak Hour3 Peak Hour3 Peak
Hour3
YOL I-80 to Yolo/Sacramento County Line 0.00 – 3.16 3.16 177,000 174,000 E E 148 47 274 69 0.20 0.49 0.22 0.54 3.04 3.39 1 6% -5%
SAC
Yolo/Sacramento County Line to SR 99 and SR 51
L0.00 – L2.48/R0.00 2.48 242,000 246,000 F F 802 322 1,032 373 1.15 1.05 1.27 1.15 3.60 3.49 1 0% -6%
SR 99 and SR 51 to Watt Avenue R0.00 – R5.34 5.34 215,000 217,000 F F 1,791 528 1,711 548 1.91 1.87 2.10 2.06 7.24 6.97 5 13% 6%
Watt Avenue to Zinfandel Drive R5.34 – R10.92 5.58 177,000 173,000 F F 855 224 758 155 0.77 0.70 0.85 0.77 6.27 6.19 5 -41% -71%
Zinfandel Drive to Sunrise Boulevard
R10.92 to 12.50 1.58 143,000 141,000 E E 256 110 148 44 0.63 0.27 0.70 0.29 2.20 1.80 0 -53% -55%
Sunrise Boulevard to Folsom Boulevard
12.50 – 17.01 4.51 120,000 119,000 D D 437 148 318 112 1.18 0.80 1.41 0.96 5.66 5.20 2 -27% -31%
Folsom Boulevard to Sacramento/El Dorado County
Line
17.01 – 23.14 6.13 93,000 93,000 D D 216 57 137 24 0.47 0.14 0.56 0.17 6.54 6.21 0 -38% -45%
ED
Sacramento/El Dorado County Line to Cameron Park Drive
0.00 – R6.57 6.57 68,000 71,000 E E 457 64 232 28 0.98 0.32 1.18 0.38 7.55 6.84 1 -35% -24%
Cameron Park Drive to Missouri Flat Road
R6.57 – R15.06 8.49 60,000 61,000 D D 312 32 469 47 0.37 0.69 0.40 0.76 8.69 9.18 1 -57% -55%
Missouri Flat Road to End of Freeway in Placerville
R15.06 – 17.25 2.19 58,000 52,000 D D 71 15 147 14 0.49 0.21 0.54 0.23 2.68 2.40 0 26% 0%
End of Freeway in Placerville to Bedford Avenue
17.25 – 18.11 0.86 51,000 52,000 D D 129 27 185 46 0.36 0.78 0.39 0.86 1.65 2.07 0 168% -31%
Bedford Avenue to Cedar Grove Road
18.11 – R25.95 7.84 31,000 30,000 C C 109 23 74 18 0.70 0.58 0.77 0.64 8.54 8.42 2 6% -48%
Highway 50 2011 State of the Corridor Report (6)
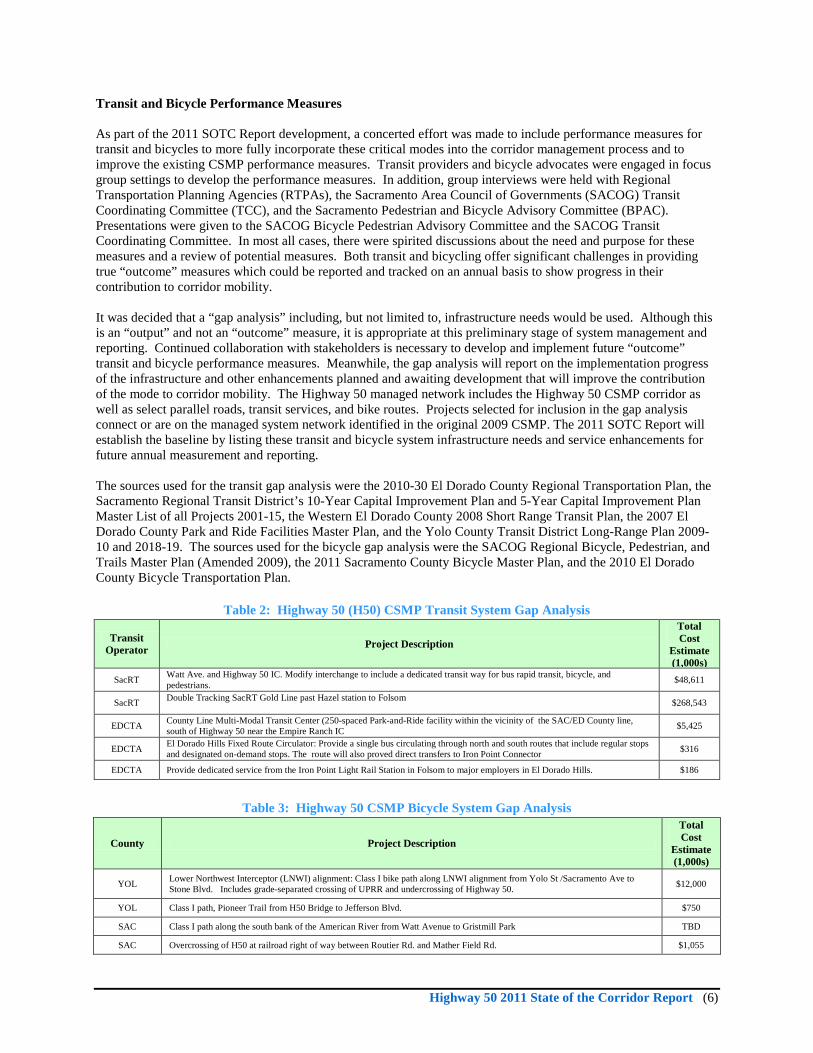
Transit and Bicycle Performance Measures As part of the 2011 SOTC Report development, a concerted effort was made to include performance measures for transit and bicycles to more fully incorporate these critical modes into the corridor management process and to improve the existing CSMP performance measures. Transit providers and bicycle advocates were engaged in focus group settings to develop the performance measures. In addition, group interviews were held with Regional Transportation Planning Agencies (RTPAs), the Sacramento Area Council of Governments (SACOG) Transit Coordinating Committee (TCC), and the Sacramento Pedestrian and Bicycle Advisory Committee (BPAC). Presentations were given to the SACOG Bicycle Pedestrian Advisory Committee and the SACOG Transit Coordinating Committee. In most all cases, there were spirited discussions about the need and purpose for these measures and a review of potential measures. Both transit and bicycling offer significant challenges in providing true “outcome” measures which could be reported and tracked on an annual basis to show progress in their contribution to corridor mobility. It was decided that a “gap analysis” including, but not limited to, infrastructure needs would be used. Although this is an “output” and not an “outcome” measure, it is appropriate at this preliminary stage of system management and reporting. Continued collaboration with stakeholders is necessary to develop and implement future “outcome” transit and bicycle performance measures. Meanwhile, the gap analysis will report on the implementation progress of the infrastructure and other enhancements planned and awaiting development that will improve the contribution of the mode to corridor mobility. The Highway 50 managed network includes the Highway 50 CSMP corridor as well as select parallel roads, transit services, and bike routes. Projects selected for inclusion in the gap analysis connect or are on the managed system network identified in the original 2009 CSMP. The 2011 SOTC Report will establish the baseline by listing these transit and bicycle system infrastructure needs and service enhancements for future annual measurement and reporting. The sources used for the transit gap analysis were the 2010-30 El Dorado County Regional Transportation Plan, the Sacramento Regional Transit District’s 10-Year Capital Improvement Plan and 5-Year Capital Improvement Plan Master List of all Projects 2001-15, the Western El Dorado County 2008 Short Range Transit Plan, the 2007 El Dorado County Park and Ride Facilities Master Plan, and the Yolo County Transit District Long-Range Plan 2009-10 and 2018-19. The sources used for the bicycle gap analysis were the SACOG Regional Bicycle, Pedestrian, and Trails Master Plan (Amended 2009), the 2011 Sacramento County Bicycle Master Plan, and the 2010 El Dorado County Bicycle Transportation Plan.
Table 2: Highway 50 (H50) CSMP Transit System Gap Analysis
Transit Operator Project Description
Total Cost
Estimate (1,000s)
SacRT Watt Ave. and Highway 50 IC. Modify interchange to include a dedicated transit way for bus rapid transit, bicycle, and pedestrians. $48,611
SacRT Double Tracking SacRT Gold Line past Hazel station to Folsom $268,543
EDCTA County Line Multi-Modal Transit Center (250-spaced Park-and-Ride facility within the vicinity of the SAC/ED County line, south of Highway 50 near the Empire Ranch IC $5,425
EDCTA El Dorado Hills Fixed Route Circulator: Provide a single bus circulating through north and south routes that include regular stops and designated on-demand stops. The route will also proved direct transfers to Iron Point Connector $316
EDCTA Provide dedicated service from the Iron Point Light Rail Station in Folsom to major employers in El Dorado Hills. $186
Table 3: Highway 50 CSMP Bicycle System Gap Analysis
County Project Description
Total Cost
Estimate (1,000s)
YOL Lower Northwest Interceptor (LNWI) alignment: Class I bike path along LNWI alignment from Yolo St /Sacramento Ave to Stone Blvd. Includes grade-separated crossing of UPRR and undercrossing of Highway 50. $12,000
YOL Class I path, Pioneer Trail from H50 Bridge to Jefferson Blvd. $750
SAC Class I path along the south bank of the American River from Watt Avenue to Gristmill Park TBD
SAC Overcrossing of H50 at railroad right of way between Routier Rd. and Mather Field Rd. $1,055
Highway 50 2011 State of the Corridor Report (7)
SAC Class II bike lanes on Sunrise Blvd from Rancho Cordova City limit to Grant Line Rd $1,105
SAC Class II bike lanes on White Rock Road from Sunrise Boulevard to El Dorado County Line $4,471
SAC Crossing of H50 east of Zinfandel Road TBD
SAC Crossing of H50 near Folsom Blvd. in Folsom TBD
SAC Grant Line Path: Class I bike path from Mosher Rd to White Rock Rd. $7,567
SAC Class I & II facilities along Iron Point Road, from Folsom Blvd. to Sacramento County line TBD
SAC Bike station in Downtown Folsom at light rail station $350
SAC Highway 50 Parallel Route: Class I bike path from Empire Ranch Rd to Alder Creek $850
ED Class II bike lanes from El Dorado Hills Blvd. to Pleasant Grove Middle School in Cameron Park $50
ED Class II bike lanes on Silva Valley Prkwy. from the new connection with White Rock Road to Green Valley Road $2,500
ED Class II bike lanes on White Rock Road from the western El Dorado County line to Carson Crossing Road $300
ED Extend existing Class I bike path at Los Trampas Dr. to Halcon Road in Camino. Provides a connection into Camino and reduces the need for a grade separated crossing of Highway 50 at the existing trail terminus. $500
ED Class I bike path from Halcon Road to Snows Road $1,000
ED Class II bike lanes – included on extension of Saratoga Way from Finders Way to western county line (connection to Folsom). $75
ED Class I bike path- Missouri Flat Rd to Mother Lode Dr in El Dorado. Completes Class I bike path connection. $1,200
ED Class I bike path – Mother Lode Dr in El Dorado to Mother Lode Dr in Shingle Springs. Completes the connection between Placerville, Diamond Springs, El Dorado, and Shingle Springs. $1,900
ED Class II bike lanes- Country Club Drive from Cameron Park Drive to Cambridge Road. $1,200
ED Class II bike lanes – Country Club Drive from Cambridge Road to Bass Lake Road $350
ED Overcrossing of Missouri Flat Rd. Provides a safe and direct crossing of Missouri Flat Road. $1,000
ED Bicycle-pedestrian overcrossing of H50 at El Dorado Hills Blvd. $4,800
ED Class I bike path – Main Street/ Placerville Drive to Ray Lawyer Dr. $400
ED Class I bike path – Clay St. to Bedford Ave. $205
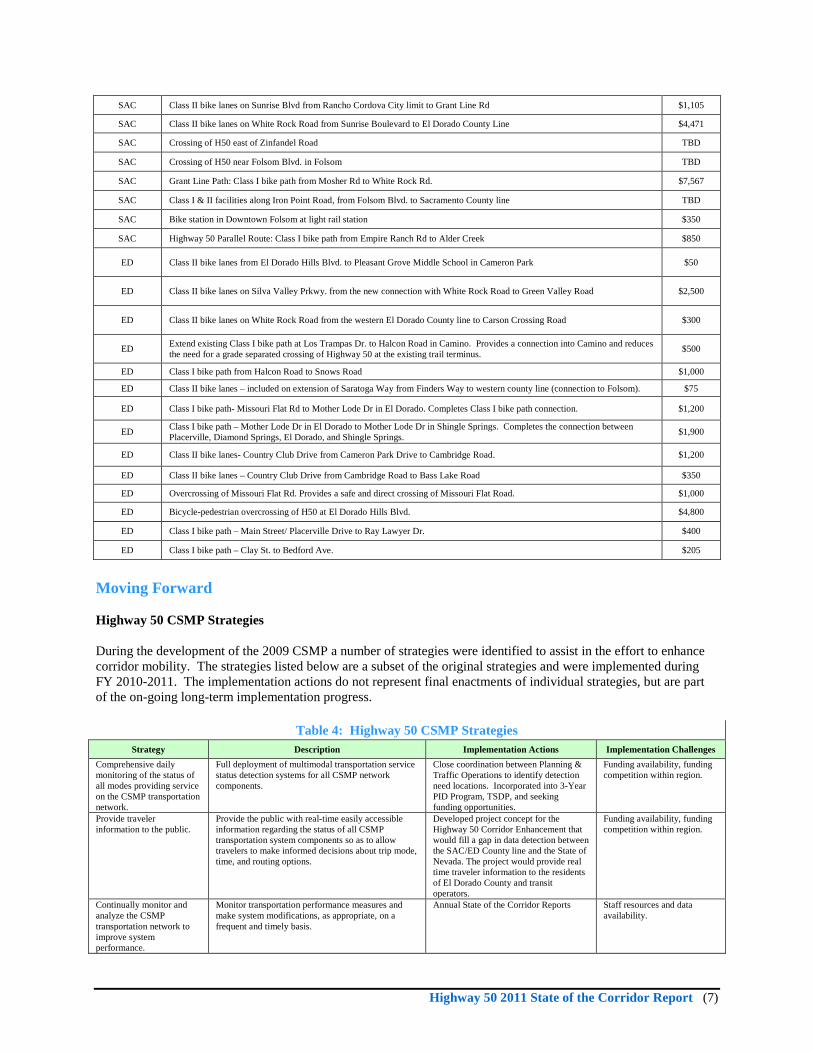
Moving Forward Highway 50 CSMP Strategies
During the development of the 2009 CSMP a number of strategies were identified to assist in the effort to enhance corridor mobility. The strategies listed below are a subset of the original strategies and were implemented during FY 2010-2011. The implementation actions do not represent final enactments of individual strategies, but are part of the on-going long-term implementation progress.
Table 4: Highway 50 CSMP Strategies Strategy Description Implementation Actions Implementation Challenges
Comprehensive daily monitoring of the status of all modes providing service on the CSMP transportation network.
Full deployment of multimodal transportation service status detection systems for all CSMP network components.
Close coordination between Planning & Traffic Operations to identify detection need locations. Incorporated into 3-Year PID Program, TSDP, and seeking funding opportunities.
Funding availability, funding competition within region.
Provide traveler information to the public.
Provide the public with real-time easily accessible information regarding the status of all CSMP transportation system components so as to allow travelers to make informed decisions about trip mode, time, and routing options.
Developed project concept for the Highway 50 Corridor Enhancement that would fill a gap in data detection between the SAC/ED County line and the State of Nevada. The project would provide real time traveler information to the residents of El Dorado County and transit operators.
Funding availability, funding competition within region.
Continually monitor and analyze the CSMP transportation network to improve system performance.
Monitor transportation performance measures and make system modifications, as appropriate, on a frequent and timely basis.
Annual State of the Corridor Reports Staff resources and data availability.
Highway 50 2011 State of the Corridor Report (8)
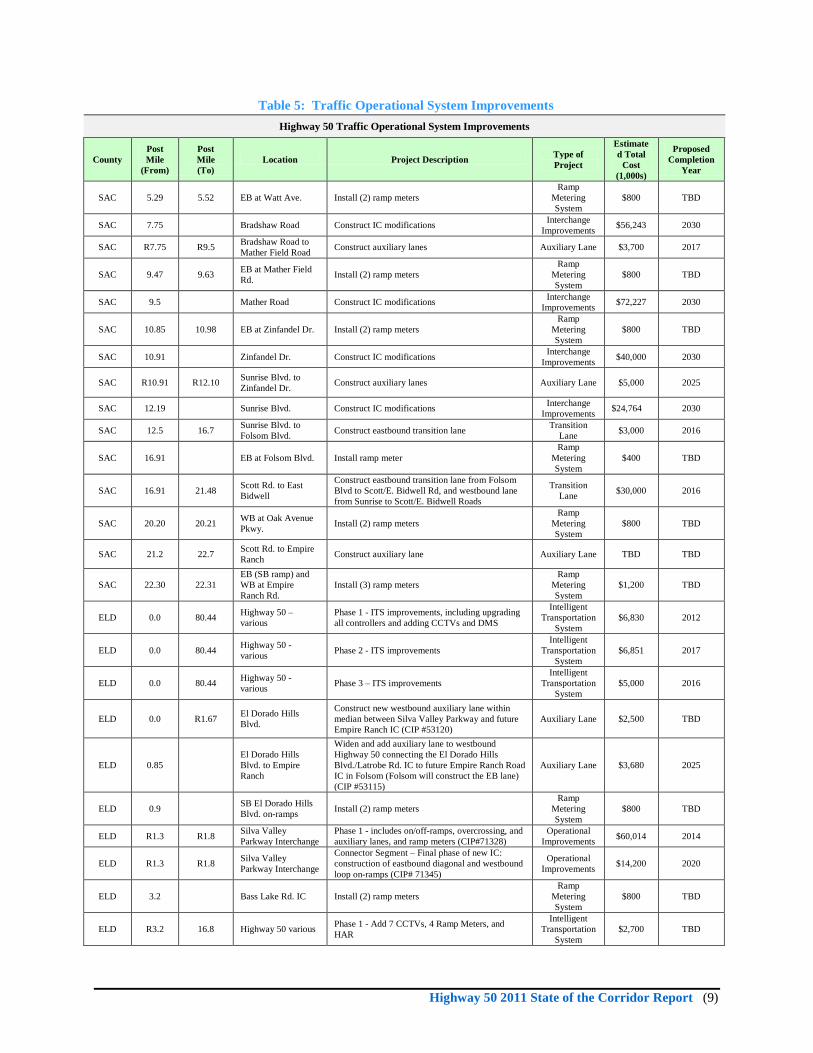
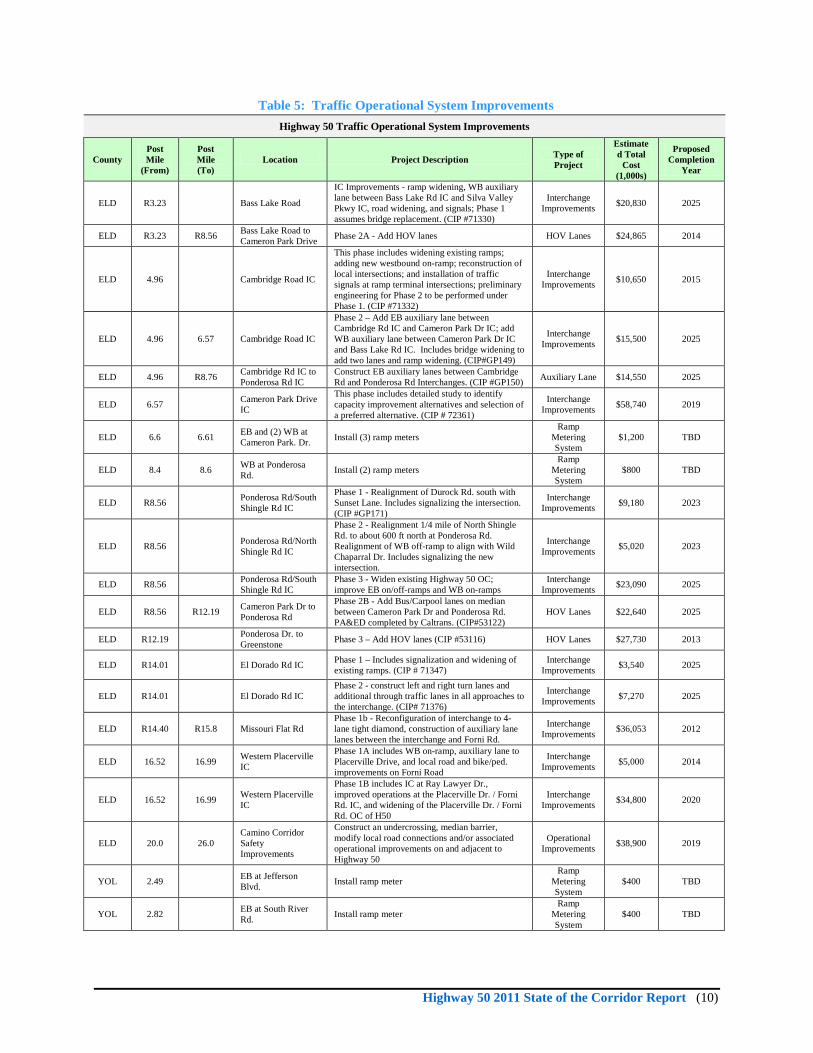
Traffic Operational System Improvements The primary method for Highway 50 corridor system management is the development, implementation, and use of system and operational management strategies to facilitate efficient and effective transportation network use; including ramp metering, auxiliary lanes, transition lanes, and short mixed flow lane extensions. Examples of traffic operation system (TOS) projects and methods, needed for traffic monitoring and information dissemination, include Closed Circuit Television Systems (CCTV), Changeable Message Signs (CMS), Extinguishable Message Signs (EMS), Electronic Tag Readers (ETR), Highway Advisory Radio (HAR), Roadside Weather Information Systems (RWIS), and Traffic Monitoring Stations (TMS). Collectively, these very low cost strategies allow the system to operate at optimal performance without adding significant through-capacity. The ramp metering system projects are from the 2011Caltrans Ramp Metering Development Plan. Table 5 includes the priority system and operational improvement project needs for the Highway 50 corridor.
Table 5: Traffic Operational System Improvements Highway 50 Traffic Operational System Improvements
County Post Mile
(From)
Post Mile (To)
Location Project Description Type of Project
Estimated Total
Cost (1,000s)
Proposed Completion
Year
YOL 0 3.15 I-80 to Sacramento County Line Construct HOV lanes HOV Lane $100,000 2020
YOL 2.49 Jefferson Road Expand the ramps from 1 to 2 lanes, improve signalization, add ramp meters, etc.
Operational Improvements $26,450 2015
YOL 2.88 South River Road Install ramp meters and modify ramp design Operational Improvements $22,625 2015
SAC 0.43 WB at 5th Street Install ramp meter Ramp
Metering System
$400 TBD
SAC 0.61 I-5 Interchange Reconstruct IC with freeway to freeway HOV connectors
IC Reconstruction $200,000 2030
SAC 0.71 EB at Stockton Blvd. Install ramp meter Ramp
Metering System
$400 TBD
SAC 0.80 SR 99 Interchange Reconstruct IC with freeway to freeway HOV connectors
IC Reconstruction $200,000 2030
SAC 0.89 5.33 Downtown to Watt Ave. Construct HOV lanes HOV Lane $90,000 2020
SAC 2.61 2.81 EB at 65th Street Install (2) ramp meters Ramp
Metering System
$800 TBD
SAC 3.75 3.91 Howe Avenue Construct transition lane Transition Lane $3,000 2020
Decrease the duration of non-recurrent traffic congestion.
Expand and enhance the Freeway Service Patrol (FSP) to respond to automobile accidents and vehicle break-downs.
EDCTC expanded FSP to cover more of Highway 50 during weekday peak periods.
Funding availability, funding competition within the region.
Complete Bus/Carpool lane network.
Complete the regional bus/carpool lane network, including freeway-to-freeway HOV lane connectors.
Sacramento 50 Bus/Carpool lanes project is in construction and is anticipated to be complete in the Fall 2012. Highway 50 HOV lanes Phase I El Dorado Hills to Bass Lake grade is in construction and is anticipated to be complete in Fall of 2011.
Funding availability, funding competition within the region. Public agency and public acceptance of network.
Improve bike-pedestrian access in the CSMP transportation network.
Plan and program for construction of additional bicycle paths / lanes, and related improvements for access and connectivity to transit, park and ride lots, and destination points.
Developed gap analysis for transit and bicycle projects
Funding availability, funding competition within the region.
Provide “Bike-Sharing”/”Car-Sharing” to/from transit (“Carlink”), and from neighborhoods.
Expand the Regional Rideshare and Spare-the-Air programs to include bicycle and car sharing opportunities.
Developed gap analysis for transit and bicycle projects
Funding availability and coordination between SACOG, TMA, Air Districts, employers, developers, property managers, and local government officials.
Highway 50 2011 State of the Corridor Report (9)
Table 5: Traffic Operational System Improvements Highway 50 Traffic Operational System Improvements
County Post Mile
(From)
Post Mile (To)
Location Project Description Type of Project
Estimated Total
Cost (1,000s)
Proposed Completion
Year
SAC 5.29 5.52 EB at Watt Ave. Install (2) ramp meters Ramp
Metering System
$800 TBD
SAC 7.75 Bradshaw Road Construct IC modifications Interchange Improvements $56,243 2030
SAC R7.75 R9.5 Bradshaw Road to Mather Field Road Construct auxiliary lanes Auxiliary Lane $3,700 2017
SAC 9.47 9.63 EB at Mather Field Rd. Install (2) ramp meters
Ramp Metering System
$800 TBD
SAC 9.5 Mather Road Construct IC modifications Interchange Improvements $72,227 2030
SAC 10.85 10.98 EB at Zinfandel Dr. Install (2) ramp meters Ramp
Metering System
$800 TBD
SAC 10.91 Zinfandel Dr. Construct IC modifications Interchange Improvements $40,000 2030
SAC R10.91 R12.10 Sunrise Blvd. to Zinfandel Dr. Construct auxiliary lanes Auxiliary Lane $5,000 2025
SAC 12.19 Sunrise Blvd. Construct IC modifications Interchange Improvements $24,764 2030
SAC 12.5 16.7 Sunrise Blvd. to Folsom Blvd. Construct eastbound transition lane Transition
Lane $3,000 2016
SAC 16.91 EB at Folsom Blvd. Install ramp meter Ramp
Metering System
$400 TBD
SAC 16.91 21.48 Scott Rd. to East Bidwell
Construct eastbound transition lane from Folsom Blvd to Scott/E. Bidwell Rd, and westbound lane from Sunrise to Scott/E. Bidwell Roads
Transition Lane $30,000 2016
SAC 20.20 20.21 WB at Oak Avenue Pkwy. Install (2) ramp meters
Ramp Metering System
$800 TBD
SAC 21.2 22.7 Scott Rd. to Empire Ranch Construct auxiliary lane Auxiliary Lane TBD TBD
SAC 22.30 22.31 EB (SB ramp) and WB at Empire Ranch Rd.
Install (3) ramp meters Ramp
Metering System
$1,200 TBD
ELD 0.0 80.44 Highway 50 – various
Phase 1 - ITS improvements, including upgrading all controllers and adding CCTVs and DMS
Intelligent Transportation
System $6,830 2012
ELD 0.0 80.44 Highway 50 - various Phase 2 - ITS improvements
Intelligent Transportation
System $6,851 2017
ELD 0.0 80.44 Highway 50 - various Phase 3 – ITS improvements
Intelligent Transportation
System $5,000 2016
ELD 0.0 R1.67 El Dorado Hills Blvd.
Construct new westbound auxiliary lane within median between Silva Valley Parkway and future Empire Ranch IC (CIP #53120)
Auxiliary Lane $2,500 TBD
ELD 0.85 El Dorado Hills Blvd. to Empire Ranch
Widen and add auxiliary lane to westbound Highway 50 connecting the El Dorado Hills Blvd./Latrobe Rd. IC to future Empire Ranch Road IC in Folsom (Folsom will construct the EB lane) (CIP #53115)
Auxiliary Lane $3,680 2025
ELD 0.9 SB El Dorado Hills Blvd. on-ramps Install (2) ramp meters
Ramp Metering System
$800 TBD
ELD R1.3 R1.8 Silva Valley Parkway Interchange
Phase 1 - includes on/off-ramps, overcrossing, and auxiliary lanes, and ramp meters (CIP#71328)
Operational Improvements $60,014 2014
ELD R1.3 R1.8 Silva Valley Parkway Interchange
Connector Segment – Final phase of new IC: construction of eastbound diagonal and westbound loop on-ramps (CIP# 71345)
Operational Improvements $14,200 2020
ELD 3.2 Bass Lake Rd. IC Install (2) ramp meters Ramp
Metering System
$800 TBD
ELD R3.2 16.8 Highway 50 various Phase 1 - Add 7 CCTVs, 4 Ramp Meters, and HAR
Intelligent Transportation
System $2,700 TBD
Highway 50 2011 State of the Corridor Report (10)
Table 5: Traffic Operational System Improvements Highway 50 Traffic Operational System Improvements
County Post Mile
(From)
Post Mile (To)
Location Project Description Type of Project
Estimated Total
Cost (1,000s)
Proposed Completion
Year
ELD R3.23 Bass Lake Road
IC Improvements - ramp widening, WB auxiliary lane between Bass Lake Rd IC and Silva Valley Pkwy IC, road widening, and signals; Phase 1 assumes bridge replacement. (CIP #71330)
Interchange Improvements $20,830 2025
ELD R3.23 R8.56 Bass Lake Road to Cameron Park Drive Phase 2A - Add HOV lanes HOV Lanes $24,865 2014
ELD 4.96 Cambridge Road IC
This phase includes widening existing ramps; adding new westbound on-ramp; reconstruction of local intersections; and installation of traffic signals at ramp terminal intersections; preliminary engineering for Phase 2 to be performed under Phase 1. (CIP #71332)
Interchange Improvements $10,650 2015
ELD 4.96 6.57 Cambridge Road IC
Phase 2 – Add EB auxiliary lane between Cambridge Rd IC and Cameron Park Dr IC; add WB auxiliary lane between Cameron Park Dr IC and Bass Lake Rd IC. Includes bridge widening to add two lanes and ramp widening. (CIP#GP149)
Interchange Improvements $15,500 2025
ELD 4.96 R8.76 Cambridge Rd IC to Ponderosa Rd IC
Construct EB auxiliary lanes between Cambridge Rd and Ponderosa Rd Interchanges. (CIP #GP150) Auxiliary Lane $14,550 2025
ELD 6.57 Cameron Park Drive IC
This phase includes detailed study to identify capacity improvement alternatives and selection of a preferred alternative. (CIP # 72361)
Interchange Improvements $58,740 2019
ELD 6.6 6.61 EB and (2) WB at Cameron Park. Dr. Install (3) ramp meters
Ramp Metering System
$1,200 TBD
ELD 8.4 8.6 WB at Ponderosa Rd. Install (2) ramp meters
Ramp Metering System
$800 TBD
ELD R8.56 Ponderosa Rd/South Shingle Rd IC
Phase 1 - Realignment of Durock Rd. south with Sunset Lane. Includes signalizing the intersection. (CIP #GP171)
Interchange Improvements $9,180 2023
ELD R8.56 Ponderosa Rd/North Shingle Rd IC
Phase 2 - Realignment 1/4 mile of North Shingle Rd. to about 600 ft north at Ponderosa Rd. Realignment of WB off-ramp to align with Wild Chaparral Dr. Includes signalizing the new intersection.
Interchange Improvements $5,020 2023
ELD R8.56 Ponderosa Rd/South Shingle Rd IC
Phase 3 - Widen existing Highway 50 OC; improve EB on/off-ramps and WB on-ramps
Interchange Improvements $23,090 2025
ELD R8.56 R12.19 Cameron Park Dr to Ponderosa Rd
Phase 2B - Add Bus/Carpool lanes on median between Cameron Park Dr and Ponderosa Rd. PA&ED completed by Caltrans. (CIP#53122)
HOV Lanes $22,640 2025
ELD R12.19 Ponderosa Dr. to Greenstone Phase 3 – Add HOV lanes (CIP #53116) HOV Lanes $27,730 2013
ELD R14.01 El Dorado Rd IC Phase 1 – Includes signalization and widening of existing ramps. (CIP # 71347)
Interchange Improvements $3,540 2025
ELD R14.01 El Dorado Rd IC Phase 2 - construct left and right turn lanes and additional through traffic lanes in all approaches to the interchange. (CIP# 71376)
Interchange Improvements $7,270 2025
ELD R14.40 R15.8 Missouri Flat Rd Phase 1b - Reconfiguration of interchange to 4-lane tight diamond, construction of auxiliary lane lanes between the interchange and Forni Rd.
Interchange Improvements $36,053 2012
ELD 16.52 16.99 Western Placerville IC
Phase 1A includes WB on-ramp, auxiliary lane to Placerville Drive, and local road and bike/ped. improvements on Forni Road
Interchange Improvements $5,000 2014
ELD 16.52 16.99 Western Placerville IC
Phase 1B includes IC at Ray Lawyer Dr., improved operations at the Placerville Dr. / Forni Rd. IC, and widening of the Placerville Dr. / Forni Rd. OC of H50
Interchange Improvements $34,800 2020
ELD 20.0 26.0 Camino Corridor Safety Improvements
Construct an undercrossing, median barrier, modify local road connections and/or associated operational improvements on and adjacent to Highway 50
Operational Improvements $38,900 2019
YOL 2.49 EB at Jefferson Blvd. Install ramp meter
Ramp Metering System
$400 TBD
YOL 2.82 EB at South River Rd. Install ramp meter
Ramp Metering System
$400 TBD
Highway 50 2011 State of the Corridor Report (11)
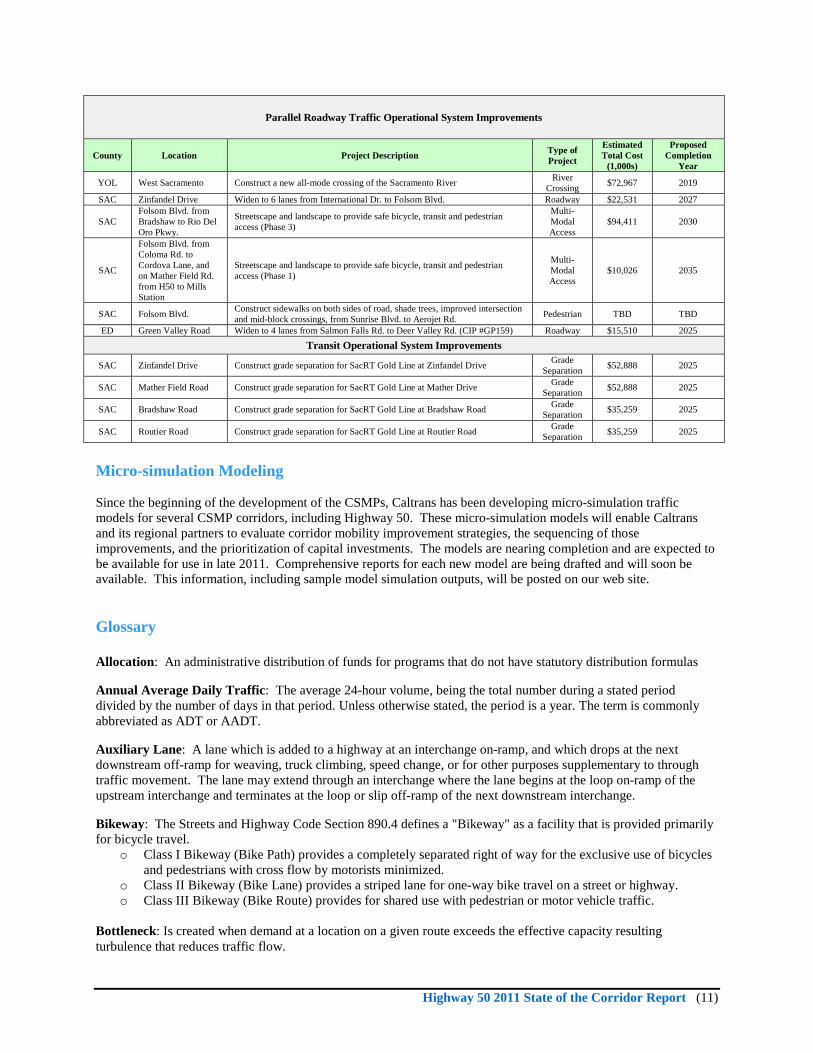
Parallel Roadway Traffic Operational System Improvements
County Location Project Description Type of Project
Estimated Total Cost
(1,000s)
Proposed Completion
Year
YOL West Sacramento Construct a new all-mode crossing of the Sacramento River River Crossing $72,967 2019
SAC Zinfandel Drive Widen to 6 lanes from International Dr. to Folsom Blvd. Roadway $22,531 2027
SAC Folsom Blvd. from Bradshaw to Rio Del Oro Pkwy.
Streetscape and landscape to provide safe bicycle, transit and pedestrian access (Phase 3)
Multi-Modal Access
$94,411 2030
SAC
Folsom Blvd. from Coloma Rd. to Cordova Lane, and on Mather Field Rd. from H50 to Mills Station
Streetscape and landscape to provide safe bicycle, transit and pedestrian access (Phase 1)
Multi-Modal Access
$10,026 2035
SAC Folsom Blvd. Construct sidewalks on both sides of road, shade trees, improved intersection and mid-block crossings, from Sunrise Blvd. to Aerojet Rd. Pedestrian TBD TBD
ED Green Valley Road Widen to 4 lanes from Salmon Falls Rd. to Deer Valley Rd. (CIP #GP159) Roadway $15,510 2025
Transit Operational System Improvements
SAC Zinfandel Drive Construct grade separation for SacRT Gold Line at Zinfandel Drive Grade Separation $52,888 2025
SAC Mather Field Road Construct grade separation for SacRT Gold Line at Mather Drive Grade Separation $52,888 2025
SAC Bradshaw Road Construct grade separation for SacRT Gold Line at Bradshaw Road Grade Separation $35,259 2025
SAC Routier Road Construct grade separation for SacRT Gold Line at Routier Road Grade Separation $35,259 2025
Micro-simulation Modeling Since the beginning of the development of the CSMPs, Caltrans has been developing micro-simulation traffic models for several CSMP corridors, including Highway 50. These micro-simulation models will enable Caltrans and its regional partners to evaluate corridor mobility improvement strategies, the sequencing of those improvements, and the prioritization of capital investments. The models are nearing completion and are expected to be available for use in late 2011. Comprehensive reports for each new model are being drafted and will soon be available. This information, including sample model simulation outputs, will be posted on our web site. Glossary Allocation: An administrative distribution of funds for programs that do not have statutory distribution formulas
Annual Average Daily Traffic: The average 24-hour volume, being the total number during a stated period divided by the number of days in that period. Unless otherwise stated, the period is a year. The term is commonly abbreviated as ADT or AADT.
Auxiliary Lane: A lane which is added to a highway at an interchange on-ramp, and which drops at the next downstream off-ramp for weaving, truck climbing, speed change, or for other purposes supplementary to through traffic movement. The lane may extend through an interchange where the lane begins at the loop on-ramp of the upstream interchange and terminates at the loop or slip off-ramp of the next downstream interchange.
Bikeway: The Streets and Highway Code Section 890.4 defines a "Bikeway" as a facility that is provided primarily for bicycle travel.
o Class I Bikeway (Bike Path) provides a completely separated right of way for the exclusive use of bicycles and pedestrians with cross flow by motorists minimized.
o Class II Bikeway (Bike Lane) provides a striped lane for one-way bike travel on a street or highway. o Class III Bikeway (Bike Route) provides for shared use with pedestrian or motor vehicle traffic.
Bottleneck: Is created when demand at a location on a given route exceeds the effective capacity resulting turbulence that reduces traffic flow.
Highway 50 2011 State of the Corridor Report (12)
Bus Rapid Transit: A combination of facility, systems, and vehicle investments that convert conventional bus services into a fixed-facility transit service, greatly increasing their efficiency and effectiveness to the end user.
California Transportation Commission (CTC): The Commission is responsible for the programming and allocating of funds for the construction of highway, passenger rail and transit improvements throughout California.
Changeable Message Sign: A sign that is capable of displaying more than one message, changeable manually, by remote control, or by automatic control.
Connector: Highway or freeway road which connects to another highway or freeway. It can be part of an interchange or a longer roadway.
Conventional Highway: A highway without control of access which may or may not be divided. Grade separations at intersections or access control may be used when justified at spot locations.
Electronic Tag Readers (ETR): An apparatus for object identification which includes a portable electronic tag reader having a transceiver capable both of reading identification information from electronic tags and transmitting collected information to a base unit for remote analysis
Extinguishable Message Sign (EMS): Used to display a fixed message such as TUNE RADIO TO 1610 AM or ALL TRUCKS EXIT AT SCALES. It can also be used as a roadside sign to display fixed messages with flashing beacons to draw attention to the activated sign.
Expressway: An arterial highway with at least partial control of access, which may or may not be divided or have grade separations at intersections.
Freeway: A divided arterial highway with full control of access and with grade separations at intersections.
Highway Advisory Radio (HAR): HAR units are used when there is a need to provide extensive roadway information to motorists, such as chain control or adverse weather conditions.
High Occupancy Vehicle Lane: A freeway lane which is limited to high occupancy vehicles and motorcycles during peak travel periods. It is accepted that high occupancy vehicle lanes may allow some specific types of vehicles (e.g. zero-emission vehicles) during restricted periods.
Incident Management: Technologies that allow transportation managers to indentify and respond quickly to incidents on the highway system.
Intelligent Transportation Systems (ITS): Electronics, communications, or information processing used singly or in combination to improve the efficiency or safety of a surface transportation system.
Level of Service: A qualitative assessment of a road's operating conditions. For local government comprehensive planning purposes, level of service means an indicator of the extent or degree of service provided by, or proposed to be provided by, a facility based on and related to the operational characteristics of the facility. Level of service indicates the capacity per unit of demand for each public facility. 2) This term refers to a standard measurement used by transportation officials which reflects the relative ease of traffic flow on a scale of A to F, with free-flow being rated LOS-A and congested conditions rated as LOS-F.
Metropolitan Planning Organization (MPO): The organization designated by the governor and local elected officials as responsible, together with the state, for the transportation planning in an urbanized area. It serves as the forum for cooperative decision making by principal elected officials of general local government. [23 CFR 405.104]
Metropolitan Transportation Plan: The official multimodal transportation plan addressing no less than a 20-year planning horizon that is developed, adopted and updated by the MPO through the metropolitan transportation planning process [23 CFR 405.104]
Highway 50 2011 State of the Corridor Report (13)
Micro-simulation Modeling: Used to simulate the behavior of individual vehicles within a predefined road network and are used to predict the likely impact of changes in traffic patterns resulting from changes to traffic flow or from changes to the physical environment.
Multimodal: The availability of transportation options using different modes within a system or corridor.
Operational Improvement: A capital improvement for installation or implementation of a transportation system management and operations program. This includes Intelligent Transportation System elements such as transportation security surveillance and control equipment; a computerized signal system; a motorist information system; an integrated traffic control system; an incident management program; equipment and programs for transportation response to man-made and natural disasters; or a transportation demand management facility, strategy, or program; and such other capital improvements to a public road as the Secretary may designate by regulation. The term does not include a resurfacing, restorative, or rehabilitative improvement; construction of an additional lane, interchange, or grade separation; or construction of a new facility on a new location.
Paratransit Service: Transportation service required by ADA for individuals with disabilities who are unable to use fixed-route transit systems. The service must be comparable to the fixed route service.
Peak Hour: Is the hour in which the most hourly delay occurs.
Performance Measurement System (PeMS): A traffic data collection, processing and analysis tool for assessing the performance of the Transportation system. PeMS obtains 30-second loop detector count and occupancy data from over 26,000 individual lane detectors in real-time from the Transportation Management Centers in Caltrans Districts 3, 4, 5, 6, 7, 8, 10, 11 and 12. The result is a web-based tool that is very valuable for planners, modelers as well as operations and systems engineers for corridor studies, operational analyses and many other traffic purposes.
Performance Measures: Indicators of transportation system outcomes with regard to such things as average speed, reliability of travel, and accident rates.
Post Mile: Mileage measured in statute, miles from a county line or the beginning of a route to another county line or the ending of the route. Each post mile along a route in a county is a unique location on the State Highway System.
Project Initiation Document / Project Study Report: A project initiation document is required for all major projects prior to their being programmed in a State or local programming document. It clearly defines the design concept and design scope of the most likely project alternatives and to tie them to realistic cost estimates and schedules so that an alternative selected for programming or local commitment has a high probability of standing up throughout the project development process as a commitment in terms of scope, cost and schedule. It is essential that all incidental work to the project be included in the scope and cost estimates, such as safety elements and upgrades, mitigation, rehabilitation of existing, etc.
Ramp Metering: A traffic management strategy which utilizes a system of traffic signals on freeway entrance and connector ramps to regulate the volume of traffic entering a freeway corridor in order to maximize the efficiency of the freeway and thereby minimize the total delay in the transportation corridor.
Regional Transportation Plan: State mandated document prepared biennially by all RTPAs. The Plan describes existing and projected transportation needs, conditions and financing affecting all modes within a 20-year horizon.
Regional Transportation Planning Agency: The agency responsible for the preparation of RTPs and RTIPs and designated by the California Business Transportation and Housing Agency to allocate transit funds. RTPAs can be local transportation commissions, COGs, MPOs or statutorily created agencies.
Roadside Weather Information System (RWIS): Utilizes meteorological measurement stations strategically positioned alongside the highway to collect local pavement and atmospheric data. Weather data such as air temperature, precipitation, and wind speed are measured and collected and road sensors are used to determine if the roadway surface is wet, dry, frosted, snow covered, or iced.
Tachometer Run (tach-run): Congestion data collected using probe vehicles and Global Positioning System units
Highway 50 2011 State of the Corridor Report (14)
State Highway Operation and Protection Program Plan (Plan): Required by Streets and Highways Code Section 164.6. A ten-year state rehabilitation plan, prepared each odd-numbered year, by the Department that identifies rehabilitation needs, schedules for meeting those needs, and strategies for cost control and program efficiencies. State Highway Operation and Protection Program (SHOPP): Required by Government Code Section 14526.5. A four-year listing of projects proposed for construction consistent with the goals and priorities in the latest SHOPP Plan. SHOPP projects are limited to capital improvements relative to maintenance, safety and rehabilitation of State highways and bridges that do not add new capacity lanes to the system. Traffic Accident Surveillance and Analysis System (TASAS): A system that provides a detailed list and/or summary of accidents that have occurred on highways, ramps, or intersections on the state highway system. Transition Lane: The extension of an existing general purpose or auxiliary lane to provide supplementary operational capacity in areas of closely spaced interchanges or where parallel arterial capacity does not exist. Traffic Monitoring Stations (TMS): The hub of a transportation management system, where information about the transportation network is collected and compiled with other operational and control data to manage the transportation network and produce traveler information.

![SotC SRD - Fate · SotC SRD SotC SRD Spirit of the Century (OGL SRD) ... °On Top Of It ... °Heart’s Secret [Empathy]](https://img.pdfslide.us/doc/110x75/5b367e717f8b9aec518e8e59/sotc-srd-sotc-srd-sotc-srd-spirit-of-the-century-ogl-srd-on-top-of.jpg)