Embed Size (px)
Citation preview

2011 FIRST QUARTER REPORTONE T R U S T E D S O U R C E
3
FOR THE FIRST QUARTER ENDED MARCH 31, 2011 PREPARED AS OF MAY 9, 2011
The following management’s discussion and analysis of financial condition and results of operations (“MD&A”) for the interim period ended March 31, 2011 should be read in conjunction with the Consolidated Financial Statements as at and for the interim period ended March 31, 2011 and the annual MD&A included in the Company’s 2010 Annual Report. Effective January 1, 2011, the Company is required to prepare and report its financial statements in accordance with International Financial Reporting Standards (“IFRS”). Comparative information for 2010 was required to be restated accordingly, including an opening Consolidated Balance Sheet as at January 1, 2010. A summary of the significant financial effects of the conversion to IFRS is included later in this MD&A and additional detailed information may be found in Notes 2 and 4 to the Interim Consolidated Financial Statements. All amounts are stated in thousands of Canadian dollars, except per share amounts.
RESULTS OF OPERATIONSFor the first quarter ended March 31, 2011, the Company
incurred a loss of $4,425, or $0.40 per share, compared to a loss of $3,785, or $0.35 per share, for the first quarter of 2010. The basic aggregated weighted average number of Class A Subordinate Voting shares (“Class A shares”) and Class B Multiple Voting shares (“Class B shares”) outstanding was 10,936,554 in both periods.
Revenues for the quarter were $10,616 compared to $12,144 in 2010. The net decrease of $1,528 was primarily due to lower clay brick shipments offset in part by higher shipments of concrete masonry products and a small increase in revenues of the highly seasonal Landscape Products business segment.
During the first quarter of 2011 the Company reviewed the remaining useful life of plant and production equipment which resulted in changes in the expected useful life of certain production equipment. As a result, depreciation expense, which is included in Cost of Sales in the Consolidated Statement of Comprehensive Income (Loss) decreased by $999 for the three month period ended March 31, 2011 compared to the same period in 2010.
Selling expenses were $248, or approximately 14.1%, higher than last year as a result of increased advertising and marketing expenditures to support the introduction of new products and to expand the Company’s market profile. General and administrative expenses increased by $214, or approximately 17.6%, primarily due to a higher provision for potentially uncollectible accounts.
The operating loss for the quarter was $3,561 compared to $2,916 for the first quarter of 2010.
The increase in finance costs to $919 for the first quarter of 2011 from $824 in 2010 was primarily due to the additional interest expense in the current period on the $9,000 subordinated secured debenture which was issued on February 26, 2010.
The Company’s share of the loss from its 50% joint venture interest in Universal Resource Recovery Inc. (“Universal”) amounted to $714 in the first quarter of 2011 compared to $600 in 2010. Universal’s composting operations, which were voluntarily suspended in the second half of 2010, resumed in December 2010 and were being ramped up in phases through the first quarter of 2011.
The recovery of income taxes for the first quarter of 2011 reflected an effective income tax rate of approximately 14.8% compared to an effective income tax rate of approximately 12.4% in 2010. These rates are significantly lower than the normalized rates of approximately 26.25% in 2011 and 29.00% in 2010 primarily due to the fact that the Company did not record a deferred tax asset with respect to the future income tax benefit pertaining to the non-capital losses incurred by the Company’s U.S. operations. Other items which impacted the effective income tax rates were the fluctuations from period to period of permanent differences between accounting income and taxable income as well as the tax impact in 2010 of various IFRS adjustments to the pre-tax loss.
More detailed discussion with respect to each operating business segment follows:
MASONRY PRODUCTSFor the three month period ended March 31, 2011, this
business segment incurred an operating loss of $996 on revenues of $9,740 compared to an operating loss of $112 on revenues of $11,433 for the corresponding period in 2010.
MANAGEMENT’S DISCUSSION AND ANALYSIS OF FINANCIAL CONDITION AND RESULTS OF OPERATIONS
4
Brick shipments in the Canadian market were lower than last year due, primarily, to poor weather conditions which resulted in a reduction in housing starts in the first quarter of this year. In the U.S. market, brick shipments were up over 2010 although this market continues to be impacted by historically low levels of residential construction activity.
Sales volumes of concrete masonry products continued to grow, increasing by approximately 76% over the first quarter of 2010 as a result of increased recognition and acceptance of these products in the marketplace.
The decrease in revenues was partially offset by a decrease in depreciation expense as a result of a change in estimated useful life of certain production equipment. Higher advertising and marketing expenses related to the introduction of new products negatively impacted operating results for the quarter.
LANDSCAPE PRODUCTSThe Landscape Products business segment incurred an
operating loss of $2,565 for the three month period ended March 31, 2011 compared to $2,804 in 2010.
The improvement in operating results was the result of higher sales volumes and an increase in average selling prices.
Revenues were $876 for the first quarter of 2011 compared to $711 last year reflecting the low level of activity during the winter months.
CASh FLOwSCash flow used for operating activities for the period
ended March 31, 2011 totaled $4,430 compared to $4,368 for the same period last year. The impact of the decline in depreciation expense was substantially offset by lower net working capital requirements during the quarter, including lower cash disbursements for trade payables.
Cash utilized for purchases of property, plant and equipment totaled $1,057 for the quarter, including approximately $420 related to new products, compared to $315 in 2010.
Advances to Universal during the first quarter of 2011 were $975 compared to $1,000 for the same period in 2010.
On February 26, 2010, the Company completed a $9,000 subordinated secured debenture financing. In connection therewith, a $3,000 unsecured promissory note payable,
which was due in December, 2009 but not paid, was refinanced as part of the debenture issue as described in Note 7 to the Interim Consolidated Financial Statements.
The subordinated debenture was recorded for accounting purposes at its fair value which, net of transaction costs incurred in the amount of $377, amounted to $8,623 and is being carried at amortized cost. The transaction costs are being amortized over the term of the loan resulting in an effective interest rate of 11.89%. As at March 31, 2011 the unamortized transaction costs were $240.
FINANCIAL CONDITIONThe Company’s Masonry Products and Landscape Products
business segments are seasonal in nature. The Landscape Products business is affected to a greater degree than the Masonry Products business. As a result of this seasonality, operating results are impacted accordingly and cash requirements are generally expected to increase through the first half of the year and decline through the second half of the year.
As at March 31, 2011, bank operating advances were $8,434. This represented an increase of $6,610 from the amount outstanding at December 31, 2010. Trade payables totaled $10,683 at March 31, 2011 compared to $9,638 at December 31, 2010.
The ratio of total liabilities to shareholders’ equity was 0.57:1 at March 31, 2011 compared to 0.49:1 at December 31, 2010. The increase in this ratio from December 2010 to March 2011 was primarily due to the increase in bank operating advances, as noted above, and lower retained earnings resulting from the loss incurred for the quarter ended March 31, 2011.
As at March 31, 2011, working capital was $14,423, representing a working capital ratio of 1.57:1. Comparable figures for working capital and the working capital ratio at December 31, 2010 were $18,499 and 2.07:1, respectively. Cash and cash equivalents totaled $4,293 at March 31, 2011 compared to $5,383 at December 31, 2010.
The Company has an operating credit facility of $15,000. This is a demand facility which is secured primarily by trade receivables and inventories of the Company’s Masonry Products and Landscape Products business segments in both Canada and the U.S. The actual amount that the Company
5
may borrow under this facility is determined based on standard margin formulas for trade receivables and inventories. The borrowing limit is reduced by the amount of the mark-to-market exposure on the interest rate swap contract. Utilization at March 31, 2011 was $9,972, including $8,434 for bank operating advances, $316 for outstanding letters of credit and $1,222 for the mark-to-market exposure on the interest rate swap contract.
The Company expects that future cash flows from operations, cash and cash equivalents on hand and the unutilized balance of its operating credit facility will be sufficient to satisfy its obligations as they become due.
The Company was in compliance with all financial covenants under its long-term debt agreement as at March 31, 2011 and anticipates that it will maintain compliance throughout the year.
Information with respect to the Company’s material off-balance sheet arrangements, which consist primarily of operating leases and natural gas supply and transportation contracts, is disclosed in the table of contractual obligations in the annual MD&A included with the Company’s 2010 Annual Report and in Note 14 to the Interim Consolidated Financial Statements.
With respect to contractual obligations outstanding as at March 31, 2011, changes included reductions of the remaining balances of the Company’s purchase obligations under the natural gas supply and transportation contracts. These are more fully described in Note 14 to the Interim Consolidated Financial Statements.
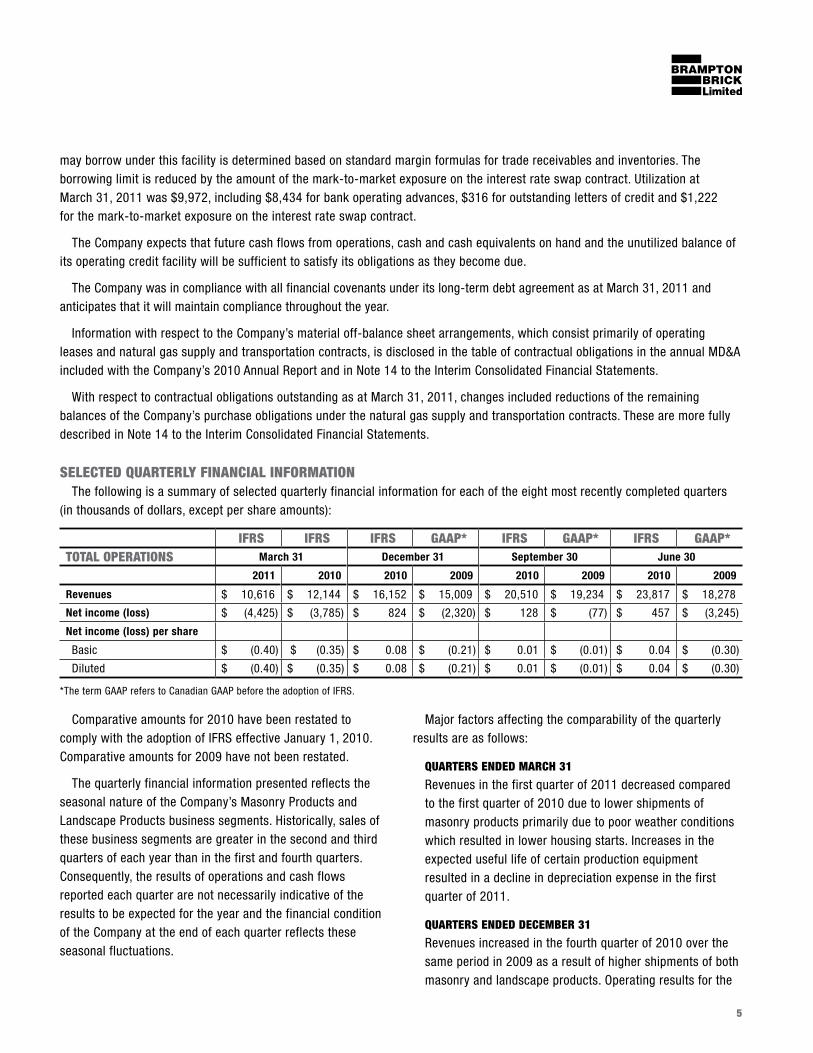
SELECTED QUARTERLY FINANCIAL INFORMATIONThe following is a summary of selected quarterly financial information for each of the eight most recently completed quarters
(in thousands of dollars, except per share amounts):
IFRS IFRS IFRS GAAP* IFRS GAAP* IFRS GAAP*TOTAL OPERATIONS March 31 December 31 September 30 June 30
2011 2010 2010 2009 2010 2009 2010 2009
Revenues $ 10,616 $ 12,144 $ 16,152 $ 15,009 $ 20,510 $ 19,234 $ 23,817 $ 18,278
Net income (loss) $ (4,425) $ (3,785) $ 824 $ (2,320) $ 128 $ (77) $ 457 $ (3,245)
Net income (loss) per share
Basic $ (0.40) $ (0.35) $ 0.08 $ (0.21) $ 0.01 $ (0.01) $ 0.04 $ (0.30)
Diluted $ (0.40) $ (0.35) $ 0.08 $ (0.21) $ 0.01 $ (0.01) $ 0.04 $ (0.30)
*The term GAAP refers to Canadian GAAP before the adoption of IFRS.
Comparative amounts for 2010 have been restated to comply with the adoption of IFRS effective January 1, 2010. Comparative amounts for 2009 have not been restated.
The quarterly financial information presented reflects the seasonal nature of the Company’s Masonry Products and Landscape Products business segments. Historically, sales of these business segments are greater in the second and third quarters of each year than in the first and fourth quarters. Consequently, the results of operations and cash flows reported each quarter are not necessarily indicative of the results to be expected for the year and the financial condition of the Company at the end of each quarter reflects these seasonal fluctuations.
Major factors affecting the comparability of the quarterly results are as follows:
QUARTERS ENDED MARCh 31
Revenues in the first quarter of 2011 decreased compared to the first quarter of 2010 due to lower shipments of masonry products primarily due to poor weather conditions which resulted in lower housing starts. Increases in the expected useful life of certain production equipment resulted in a decline in depreciation expense in the first quarter of 2011.
QUARTERS ENDED DECEMbER 31
Revenues increased in the fourth quarter of 2010 over the same period in 2009 as a result of higher shipments of both masonry and landscape products. Operating results for the
6
quarter were negatively impacted by higher interest costs and a decrease in the income tax recovery.
As at December 31, 2010, the Company evaluated the impairment loss of $10,571 that was recorded upon the transition to IFRS as at January 1, 2010 for possible reversal, and concluded that the impairment loss had reversed by an aggregate of $885, net of exchange differences.
The reversal of the loss was recorded in the Consolidated Statement of Comprehensive Income (Loss) for the quarter and year ended December 31, 2010.
QUARTERS ENDED SEPTEMbER 30
Higher shipments in the Masonry Products business segment in 2010 resulted in an increase in revenues which resulted in an improvement in operating results. The variance in the provision for income taxes also contributed to the increase in net income compared to the same period in 2009.
QUARTERS ENDED JUNE 30
The increase in revenues in the second quarter of 2010 compared to the same period in 2009 was primarily due to much higher shipments in the Masonry Products business segment corresponding to an increase in residential construction activity in Canada.
The improvement in operating results was the result of much higher sales, improved profit margins due to the positive impact on unit manufacturing costs of higher production volumes and the recording in 2009 of certain unusual charges, including an unrealized loss on derivative financial instruments, a loss on sale of a portion of the promissory note receivable and a loss on sale of properties held for sale.
OThERInformation with respect to transactions with related
parties in 2011 is disclosed in Notes 7 and 15 to the Interim Consolidated Financial Statements.
Information with respect to transactions with related parties for the year ended December 31, 2010 is disclosed in Notes 10, 11 and 18 to Consolidated Financial Statements included in the Company’s 2010 Annual Report.
The aggregate number of issued and outstanding Class A Subordinate Voting shares and Class B Multiple Voting shares
as at March 31, 2011 is disclosed in Note 8 to the Interim Consolidated Financial Statements. There have been no changes to the issued and outstanding shares to the date of the MD&A.
There have been no changes in the Company’s internal control over financial reporting during the period ended March 31, 2011 that have materially affected, or are reasonably likely to materially affect, the Company’s internal control over financial reporting.
The Company’s Annual Report and Annual Information Form for the year ended December 31, 2010 and the Management Information Circular issued in connection with the Annual General Meeting of Shareholders to be held on May 12, 2011 may be found on SEDAR at www.sedar.com.
SIGNIFICANT FINANCIAL EFFECTS OF CONVERSION TO IFRS
The more significant financial effects on the Company’s consolidated financial statements resulting from the conversion to IFRS were as follows:
a) Property, plant and equipment
Upon transition to IFRS, the Company elected to use the fair value as deemed cost election for properties and certain production equipment utilized in its Canadian Masonry Products and Landscape Products business segments. As a result, the net carrying value of land and machinery and equipment as at January 1, 2010 increased by $35,366 and $20,025, respectively. The aggregate increase, net of related deferred income tax liabilities of $9,426, amounted to $45,965 and was reflected as an adjustment to Retained Earnings in the January 1, 2010 opening Consolidated Balance Sheet.
The increase in the carrying value of machinery and equipment resulted in an increase in depreciation expense of approximately $519 for the interim period ended March 31, 2010 from the amount reported under previous GAAP. See Note 4(v)f of the Interim Consolidated Financial Statements.
b) Asset impairment
Under Impairment of Assets (“IAS 36”), asset impairments are determined based on the assessment of the difference between the carrying amount and recoverable amount of the assets in a cash generating unit (CGU). The Company
7
has determined that the Brampton clay brick plant, the Canadian concrete plants (Markham, Milton and Brampton), the Farmersburg, Indiana clay brick plant and the Wixom, Michigan concrete plant are the CGUs for purposes of the asset impairment tests. The standard requires that an impairment is determined based on the recoverable amount of the CGU. The recoverable amount is the higher of the amount determined under the “value in use” or “fair value less costs to sell” basis. An impairment charge is recognized when the carrying value of the CGU exceeds its recoverable amount. Under IFRS, an impairment loss for a CGU can be reversed if there has been a change in the estimates used to determine the recoverable amount, however the reversal of an impairment loss shall not exceed the carrying amount that would have been determined, net of depreciation, had no impairment loss been recognized for the CGU in prior periods.
Under the previous GAAP methodology, which utilized undiscounted future cash flows to determine the recoverable amount, the asset impairment evaluations completed as at January 1, 2010 and December 31, 2010 indicated that there was no impairment of any of its CGUs.
Under IFRS, discounted cash flows are utilized to determine the recoverable amount. The Company completed its asset impairment evaluations with respect to its Brampton clay brick plant, the Canadian concrete plants (Markham, Milton and Brampton) and the Wixom, Michigan concrete plant and concluded that there was no impairment as at January 1, 2010 or at December 31, 2010.
The asset impairment evaluation as at January 1, 2010 with respect to the Farmersburg, Indiana clay brick plant indicated an impairment and, accordingly, an impairment loss of $10,571 was recognized in the opening January 1, 2010 balance sheet for property, plant and equipment. The loss was recorded in retained earnings.
The decrease in the carrying value of property, plant and equipment as at January 1, 2010 with respect to this impairment loss resulted in a decrease in depreciation expense of approximately $127 for the interim period ended March 31, 2010.
As at December 31, 2010, the Company evaluated the impairment loss recorded as at January 1, 2010 for possible reversal, and concluded that the impairment
loss had reversed by an aggregate $885, net of exchange differences. The impairment loss decreased due to an improvement in the estimated future cash flows. The reversal of the loss was recorded in the Consolidated Statement of Comprehensive Income (Loss) in the fourth quarter of 2010. See Note 4(v)g of the Interim Consolidated Financial Statements.
c) Accounting for joint venture
The Company’s 50% joint venture interest in Universal was accounted for under previous GAAP using the proportionate consolidation method. The Company’s share of Universal’s assets, liabilities, revenues, expenses and cash flows were included in the consolidated financial statements on a line-by-line basis. Upon conversion to IFRS, the Company elected to account for this investment using the equity method of accounting. Under this method, the Company’s net investment in Universal is now reflected on one line in the Consolidated Balance Sheet and its share of the equity income or loss and related cash inflows and outflows are reflected on one line in the Consolidated Statement of Comprehensive Income (Loss) and Consolidated Statement of Cash Flows, respectively.
Universal is a private company in Canada and is not required to comply with IFRS. However, the accounting policies of Universal have been reviewed and adjustments have been made for reporting purposes, where necessary, to ensure consistency with the policies adopted by the Company. On January 1, 2010, an impairment assessment of Universal’s property, plant and equipment was performed in accordance with IAS 36, which resulted in an impairment charge that increased the loss that is shared by the joint venture partners under the equity method of accounting. Accordingly, the Company recorded an increase in its share of the loss in Universal of $3,119 on transition to IFRS. The recoverability of Universal’s property, plant and equipment was re-evaluated at December 31, 2010 in accordance with IAS 36 which resulted in a partial reversal of the impairment charge recorded as at January 1, 2010. This resulted in a reduction in the Company’s share of the loss in Universal for the fourth quarter and year ended December 31, 2010 of $1,880 compared to the previously reported share of loss under previous GAAP. See Note 4(v)d of the Interim Consolidated Financial Statements.
8
d) Foreign currency translation
The Company has concluded that the functional currency of its U.S. subsidiaries is the U.S. dollar. The Company now translates all assets and liabilities included in the financial statements of its U.S. subsidiaries into Canadian dollars at current exchange rates in effect at the balance sheet date, revenues and expenses are translated at average exchange rates prevailing during the period and translation gains or losses are reflected in other comprehensive income (loss).
Previously, non-monetary assets and liabilities were translated at historical exchange rates in effect at the dates of the transactions, revenues and expenses were translated at average exchange rates prevailing during the period and unrealized translation gains or losses were recognized in the Consolidated Statement of Comprehensive Income (Loss).
The financial impact of this change was a decrease in the carrying value of current assets of approximately $263 at January 1, 2010 and approximately $241 at December 31, 2010, a decrease in the carrying value of property, plant equipment of approximately $1,954 at January 1, 2010 and approximately $4,708 at December 31, 2010. Other comprehensive loss increased by $1,528 for the three month period ended March 31, 2010. See Note 4(v)c of the Interim Consolidated Financial Statements.
In addition, the Company has elected, in accordance with the IFRS transitional provisions, to reset the cumulative translation adjustment account, which includes gains and losses arising from the translation of its U.S. subsidiaries prior to January 1, 2010, to zero. Accordingly, Accumulated other comprehensive loss and Retained earnings were each reduced by $3,829 as at January 1, 2010. See Note 4(v)b of the Interim Consolidated Financial Statements.
OUTLOOKThe Company’s Masonry Products and Landscape Products
business segments are cyclical. Demand for masonry products fluctuates in accordance with the level of new residential and commercial construction activity. Demand for landscape products fluctuates in accordance with the level of industrial, commercial and institutional construction activity and consumer spending.
Housing starts in the Company’s Canadian market were lower in the first quarter of 2011 compared to the same period in 2010. Current economic forecasts project that housing starts in 2011 will be lower than 2010. Sales of masonry products can be expected to be impacted accordingly. However, the Company has undertaken a number of steps, including the introduction of new products, targeted marketing strategies and customer service initiatives to help mitigate the potential decline.
In addition, the Company has now entered the concrete block market in Ontario which can be expected to generate increased sales as well as improve manufacturing efficiencies through increased capacity utilization.
In the U.S. market, while economic conditions have begun to show modest improvement, the overall economic environment remains challenging and housing starts are forecasted to increase only moderately over 2010.
Sales of landscape products are expected to increase in 2011 as a result of growth in sales of new products along with new sales and marketing initiatives.
Certain statements contained herein constitute “forward-looking statements”. Such forward-looking statements involve known and unknown risks, uncertainties and other factors including, but not limited to, those identified under “Risks and Uncertainties” in the Company’s 2010 Annual Report, which may cause actual results, performance or achievements of the Company to be materially different from future results, performance or achievements expressed or implied by such forward-looking statements.
The Consolidated Financial Statements as at and for the periods ended March 31, 2011 and March 31, 2010 have not been reviewed by the Company’s auditors.
9
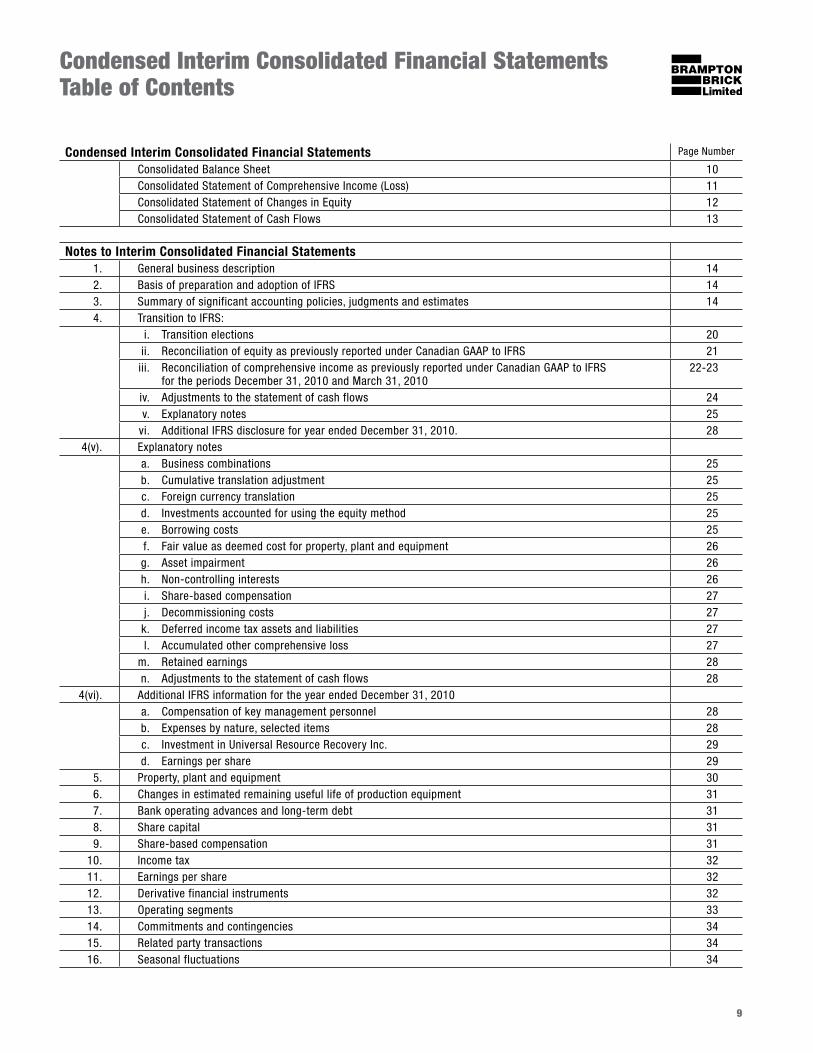
Condensed Interim Consolidated Financial Statements Table of Contents
Condensed Interim Consolidated Financial Statements Page Number
Consolidated Balance Sheet 10Consolidated Statement of Comprehensive Income (Loss) 11Consolidated Statement of Changes in Equity 12Consolidated Statement of Cash Flows 13
Notes to Interim Consolidated Financial Statements1. General business description 142. Basis of preparation and adoption of IFRS 143. Summary of significant accounting policies, judgments and estimates 144. Transition to IFRS:
i. Transition elections 20 ii. Reconciliation of equity as previously reported under Canadian GAAP to IFRS 21 iii. Reconciliation of comprehensive income as previously reported under Canadian GAAP to IFRS
for the periods December 31, 2010 and March 31, 201022-23
iv. Adjustments to the statement of cash flows 24 v. Explanatory notes 25 vi. Additional IFRS disclosure for year ended December 31, 2010. 28
4(v). Explanatory notes a. Business combinations 25 b. Cumulative translation adjustment 25 c. Foreign currency translation 25 d. Investments accounted for using the equity method 25 e. Borrowing costs 25 f. Fair value as deemed cost for property, plant and equipment 26 g. Asset impairment 26 h. Non-controlling interests 26 i. Share-based compensation 27 j. Decommissioning costs 27 k. Deferred income tax assets and liabilities 27 l. Accumulated other comprehensive loss 27 m. Retained earnings 28 n. Adjustments to the statement of cash flows 28
4(vi). Additional IFRS information for the year ended December 31, 2010 a. Compensation of key management personnel 28 b. Expenses by nature, selected items 28 c. Investment in Universal Resource Recovery Inc. 29 d. Earnings per share 29
5. Property, plant and equipment 306. Changes in estimated remaining useful life of production equipment 317. Bank operating advances and long-term debt 318. Share capital 319. Share-based compensation 31
10. Income tax 3211. Earnings per share 3212. Derivative financial instruments 3213. Operating segments 3314. Commitments and contingencies 3415. Related party transactions 3416. Seasonal fluctuations 34
10
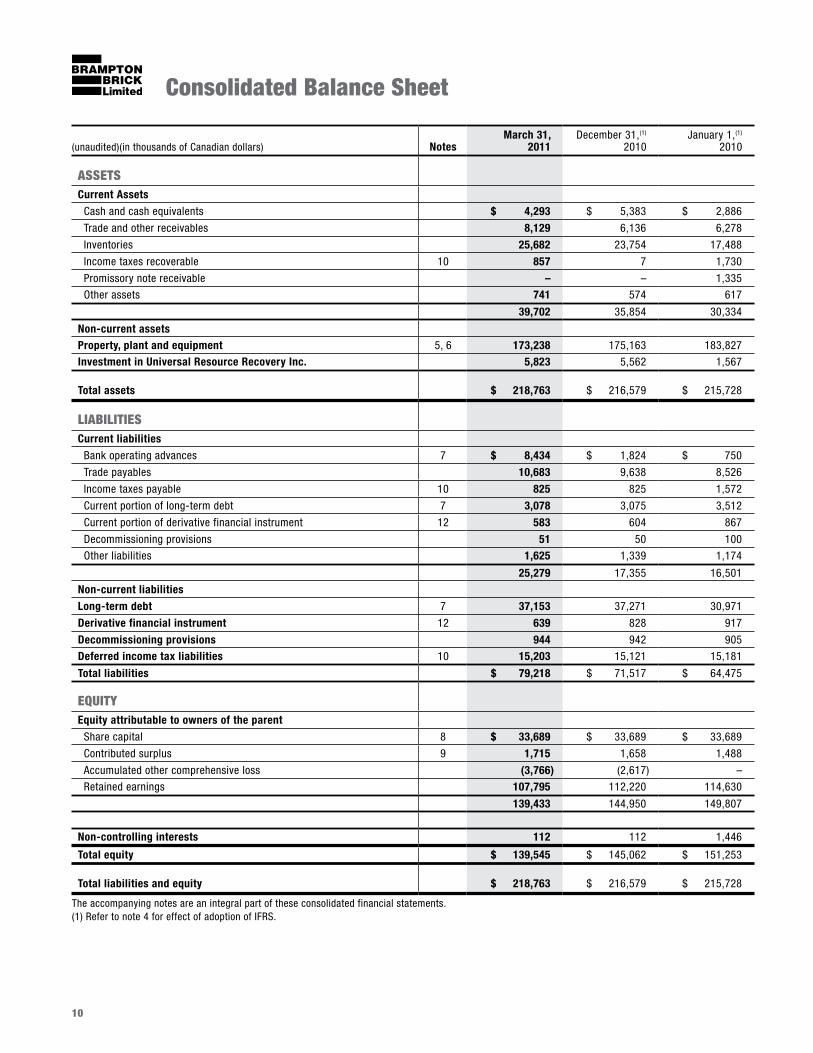
Consolidated balance Sheet
(unaudited)(in thousands of Canadian dollars) NotesMarch 31,
2011December 31,(1)
2010January 1,(1)
2010
ASSETSCurrent Assets
Cash and cash equivalents $ 4,293 $ 5,383 $ 2,886
Trade and other receivables 8,129 6,136 6,278
Inventories 25,682 23,754 17,488
Income taxes recoverable 10 857 7 1,730
Promissory note receivable – – 1,335
Other assets 741 574 617
39,702 35,854 30,334
Non-current assetsProperty, plant and equipment 5, 6 173,238 175,163 183,827
Investment in Universal Resource Recovery Inc. 5,823 5,562 1,567
Total assets $ 218,763 $ 216,579 $ 215,728
LIAbILITIES
Current liabilities
Bank operating advances 7 $ 8,434 $ 1,824 $ 750
Trade payables 10,683 9,638 8,526
Income taxes payable 10 825 825 1,572
Current portion of long-term debt 7 3,078 3,075 3,512
Current portion of derivative financial instrument 12 583 604 867
Decommissioning provisions 51 50 100
Other liabilities 1,625 1,339 1,174
25,279 17,355 16,501
Non-current liabilities
Long-term debt 7 37,153 37,271 30,971
Derivative financial instrument 12 639 828 917
Decommissioning provisions 944 942 905
Deferred income tax liabilities 10 15,203 15,121 15,181
Total liabilities $ 79,218 $ 71,517 $ 64,475
EQUITY
Equity attributable to owners of the parent
Share capital 8 $ 33,689 $ 33,689 $ 33,689
Contributed surplus 9 1,715 1,658 1,488
Accumulated other comprehensive loss (3,766) (2,617) –
Retained earnings 107,795 112,220 114,630
139,433 144,950 149,807
Non-controlling interests 112 112 1,446
Total equity $ 139,545 $ 145,062 $ 151,253
Total liabilities and equity $ 218,763 $ 216,579 $ 215,728
The accompanying notes are an integral part of these consolidated financial statements. (1) Refer to note 4 for effect of adoption of IFRS.
11
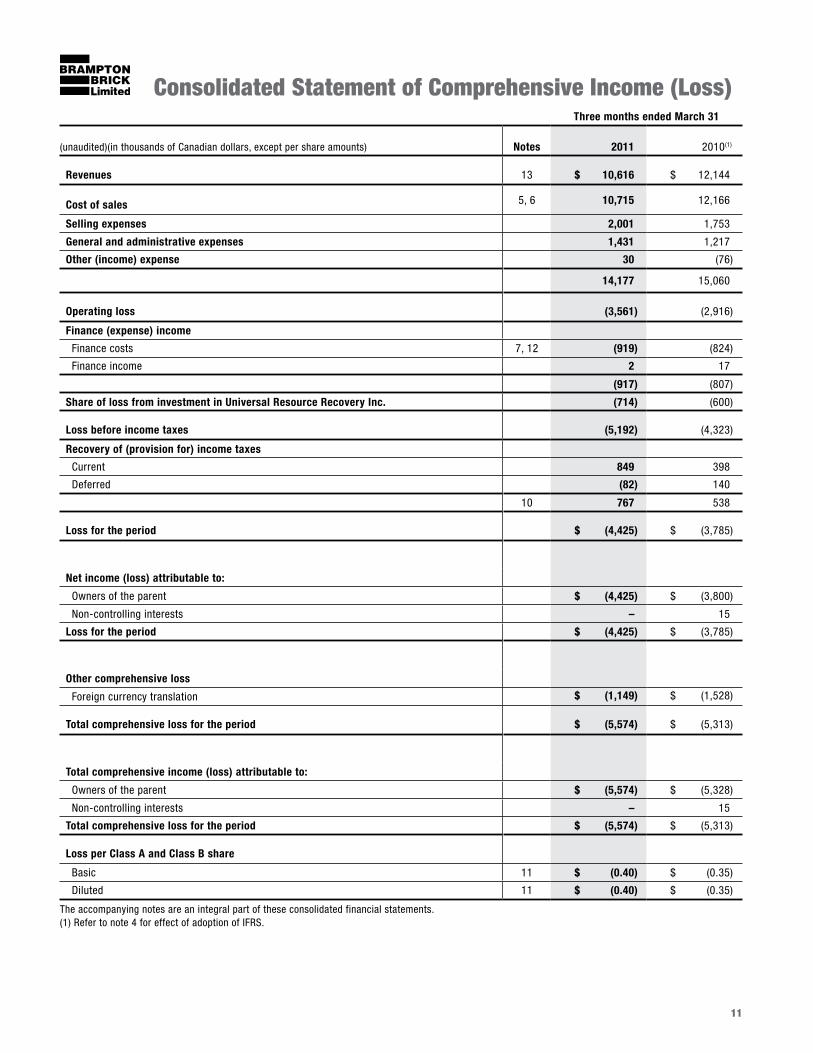
Consolidated Statement of Comprehensive Income (Loss)Three months ended March 31
(unaudited)(in thousands of Canadian dollars, except per share amounts) Notes 2011 2010(1)
Revenues 13 $ 10,616 $ 12,144
Cost of sales 5, 6 10,715 12,166
Selling expenses 2,001 1,753
General and administrative expenses 1,431 1,217
Other (income) expense 30 (76)
14,177 15,060
Operating loss (3,561) (2,916)
Finance (expense) income
Finance costs 7, 12 (919) (824)
Finance income 2 17
(917) (807)
Share of loss from investment in Universal Resource Recovery Inc. (714) (600)
Loss before income taxes (5,192) (4,323)
Recovery of (provision for) income taxes
Current 849 398
Deferred (82) 140
10 767 538
Loss for the period $ (4,425) $ (3,785)
Net income (loss) attributable to:
Owners of the parent $ (4,425) $ (3,800)
Non-controlling interests – 15
Loss for the period $ (4,425) $ (3,785)
Other comprehensive loss
Foreign currency translation $ (1,149) $ (1,528)
Total comprehensive loss for the period $ (5,574) $ (5,313)
Total comprehensive income (loss) attributable to:
Owners of the parent $ (5,574) $ (5,328)
Non-controlling interests – 15
Total comprehensive loss for the period $ (5,574) $ (5,313)
Loss per Class A and Class B share
Basic 11 $ (0.40) $ (0.35)
Diluted 11 $ (0.40) $ (0.35)
The accompanying notes are an integral part of these consolidated financial statements. (1) Refer to note 4 for effect of adoption of IFRS.
12
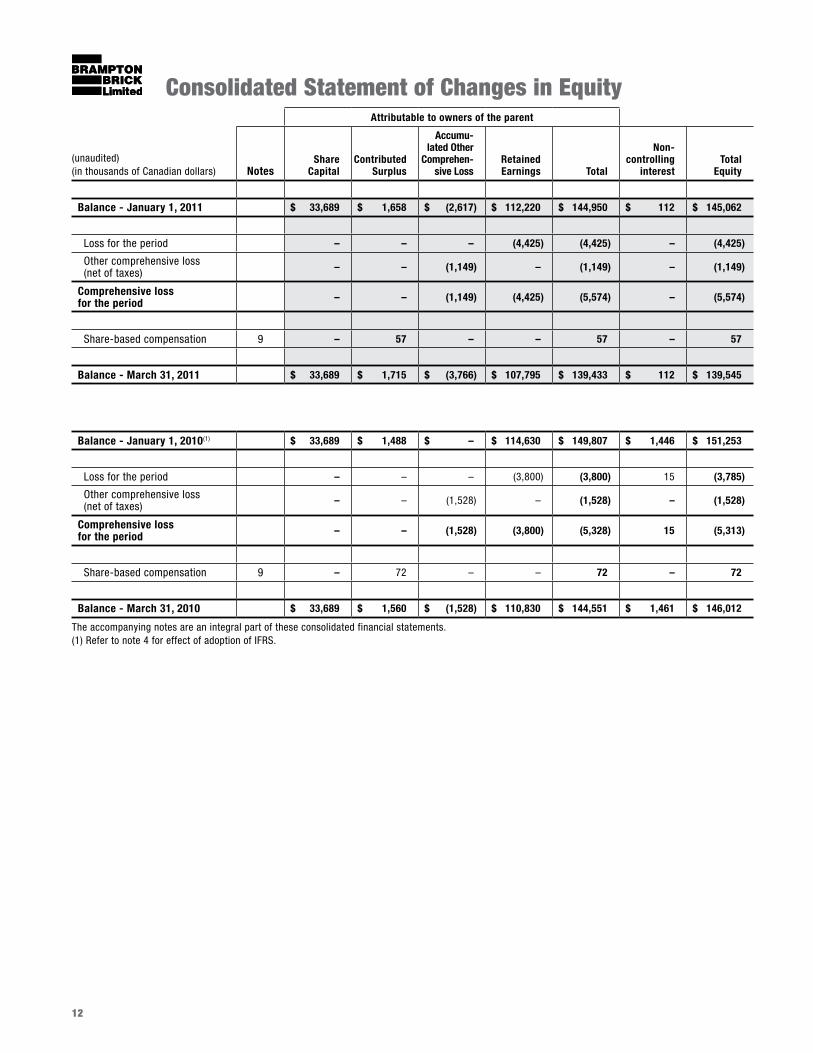
Attributable to owners of the parent
(unaudited) (in thousands of Canadian dollars) Notes
Share Capital
Contributed Surplus
Accumu-lated Other
Comprehen-sive Loss
Retained Earnings Total
Non-controlling
interestTotal
Equity
Balance - January 1, 2011 $ 33,689 $ 1,658 $ (2,617) $ 112,220 $ 144,950 $ 112 $ 145,062
Loss for the period – – – (4,425) (4,425) – (4,425)
Other comprehensive loss (net of taxes) – – (1,149) – (1,149) – (1,149)
Comprehensive loss for the period – – (1,149) (4,425) (5,574) – (5,574)
Share-based compensation 9 – 57 – – 57 – 57
Balance - March 31, 2011 $ 33,689 $ 1,715 $ (3,766) $ 107,795 $ 139,433 $ 112 $ 139,545
Balance - January 1, 2010(1) $ 33,689 $ 1,488 $ – $ 114,630 $ 149,807 $ 1,446 $ 151,253
Loss for the period – – – (3,800) (3,800) 15 (3,785)
Other comprehensive loss (net of taxes) – – (1,528) – (1,528) – (1,528)
Comprehensive loss for the period – – (1,528) (3,800) (5,328) 15 (5,313)
Share-based compensation 9 – 72 – – 72 – 72
Balance - March 31, 2010 $ 33,689 $ 1,560 $ (1,528) $ 110,830 $ 144,551 $ 1,461 $ 146,012
The accompanying notes are an integral part of these consolidated financial statements. (1) Refer to note 4 for effect of adoption of IFRS.
Consolidated Statement of Changes in Equity
13
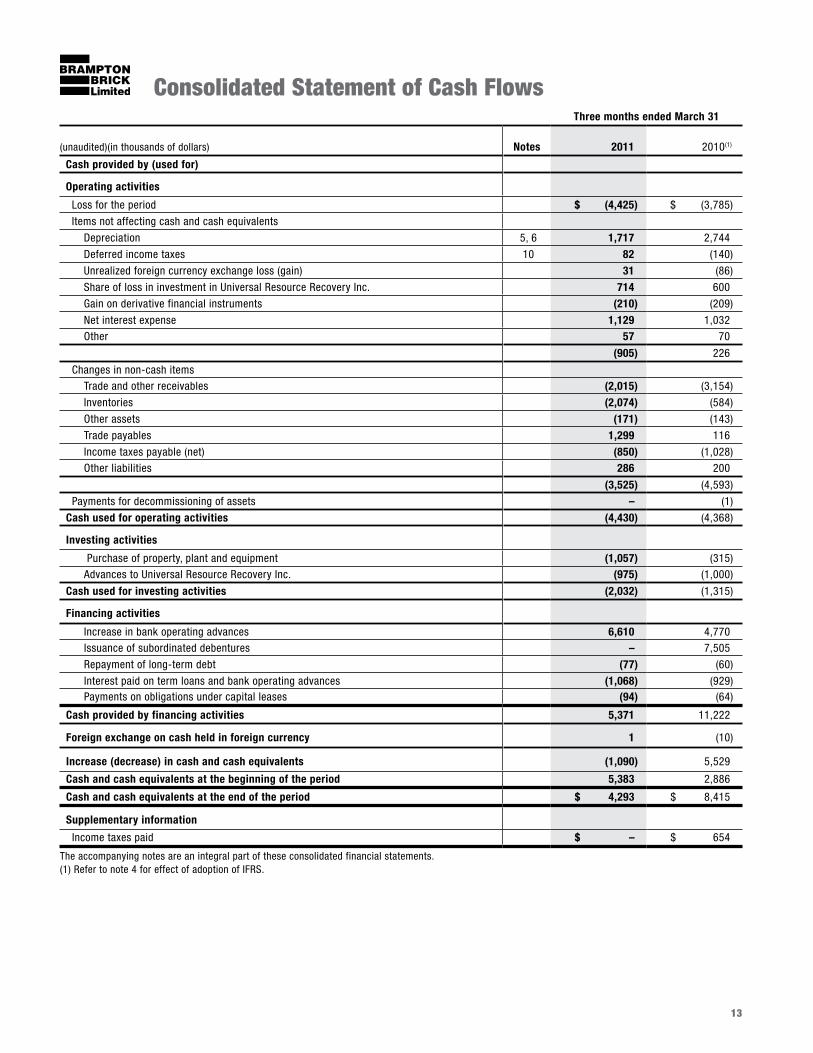
Consolidated Statement of Cash FlowsThree months ended March 31
(unaudited)(in thousands of dollars) Notes 2011 2010(1)
Cash provided by (used for)
Operating activities
Loss for the period $ (4,425) $ (3,785)
Items not affecting cash and cash equivalents
Depreciation 5, 6 1,717 2,744
Deferred income taxes 10 82 (140)
Unrealized foreign currency exchange loss (gain) 31 (86)
Share of loss in investment in Universal Resource Recovery Inc. 714 600
Gain on derivative financial instruments (210) (209)
Net interest expense 1,129 1,032
Other 57 70
(905) 226
Changes in non-cash items
Trade and other receivables (2,015) (3,154)
Inventories (2,074) (584)
Other assets (171) (143)
Trade payables 1,299 116
Income taxes payable (net) (850) (1,028)
Other liabilities 286 200
(3,525) (4,593)
Payments for decommissioning of assets – (1)
Cash used for operating activities (4,430) (4,368)
Investing activities
Purchase of property, plant and equipment (1,057) (315)
Advances to Universal Resource Recovery Inc. (975) (1,000)
Cash used for investing activities (2,032) (1,315)
Financing activities
Increase in bank operating advances 6,610 4,770
Issuance of subordinated debentures – 7,505
Repayment of long-term debt (77) (60)
Interest paid on term loans and bank operating advances (1,068) (929) Payments on obligations under capital leases (94) (64)
Cash provided by financing activities 5,371 11,222
Foreign exchange on cash held in foreign currency 1 (10)
Increase (decrease) in cash and cash equivalents (1,090) 5,529
Cash and cash equivalents at the beginning of the period 5,383 2,886
Cash and cash equivalents at the end of the period $ 4,293 $ 8,415
Supplementary information
Income taxes paid $ – $ 654
The accompanying notes are an integral part of these consolidated financial statements. (1) Refer to note 4 for effect of adoption of IFRS.
14
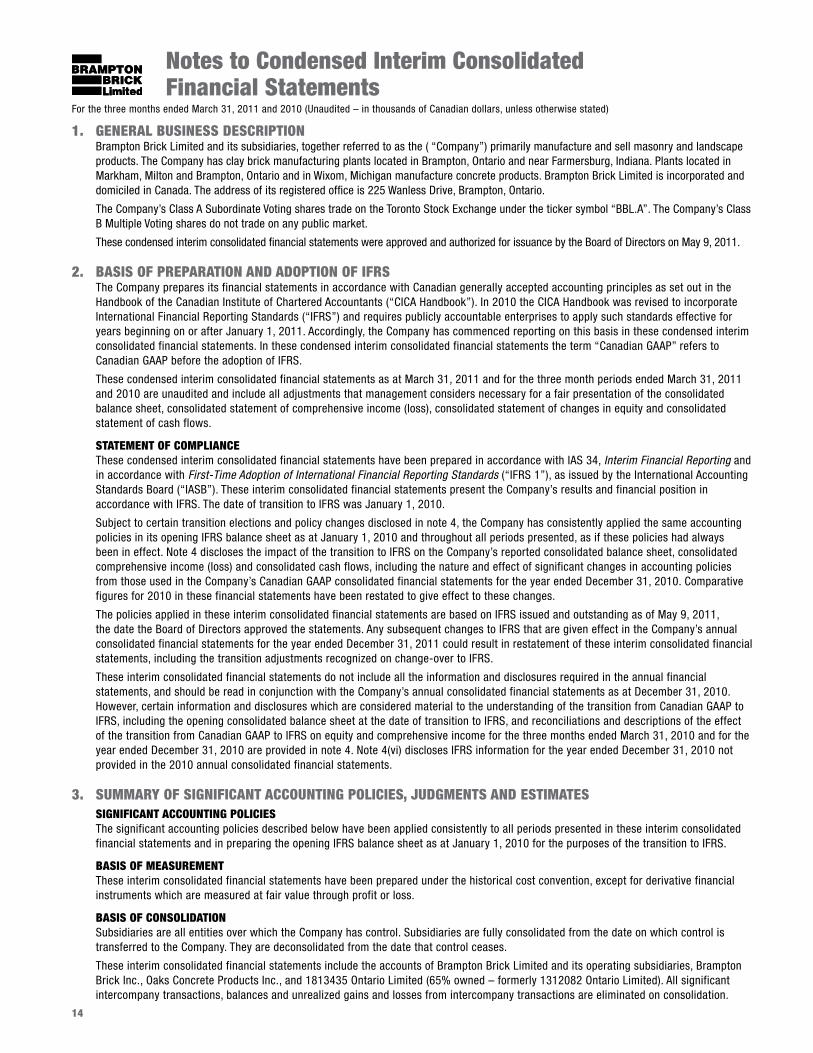
For the three months ended March 31, 2011 and 2010 (Unaudited – in thousands of Canadian dollars, unless otherwise stated)
Notes to Condensed Interim Consolidated Financial Statements
1. GENERAL bUSINESS DESCRIPTIONBrampton Brick Limited and its subsidiaries, together referred to as the ( “Company”) primarily manufacture and sell masonry and landscape products. The Company has clay brick manufacturing plants located in Brampton, Ontario and near Farmersburg, Indiana. Plants located in Markham, Milton and Brampton, Ontario and in Wixom, Michigan manufacture concrete products. Brampton Brick Limited is incorporated and domiciled in Canada. The address of its registered office is 225 Wanless Drive, Brampton, Ontario.
The Company’s Class A Subordinate Voting shares trade on the Toronto Stock Exchange under the ticker symbol “BBL.A”. The Company’s Class B Multiple Voting shares do not trade on any public market.
These condensed interim consolidated financial statements were approved and authorized for issuance by the Board of Directors on May 9, 2011.
2. bASIS OF PREPARATION AND ADOPTION OF IFRSThe Company prepares its financial statements in accordance with Canadian generally accepted accounting principles as set out in the Handbook of the Canadian Institute of Chartered Accountants (“CICA Handbook”). In 2010 the CICA Handbook was revised to incorporate International Financial Reporting Standards (“IFRS”) and requires publicly accountable enterprises to apply such standards effective for years beginning on or after January 1, 2011. Accordingly, the Company has commenced reporting on this basis in these condensed interim consolidated financial statements. In these condensed interim consolidated financial statements the term “Canadian GAAP” refers to Canadian GAAP before the adoption of IFRS.
These condensed interim consolidated financial statements as at March 31, 2011 and for the three month periods ended March 31, 2011 and 2010 are unaudited and include all adjustments that management considers necessary for a fair presentation of the consolidated balance sheet, consolidated statement of comprehensive income (loss), consolidated statement of changes in equity and consolidated statement of cash flows.
STATEMENT OF COMPLIANCEThese condensed interim consolidated financial statements have been prepared in accordance with IAS 34, Interim Financial Reporting and in accordance with First-Time Adoption of International Financial Reporting Standards (“IFRS 1”), as issued by the International Accounting Standards Board (“IASB”). These interim consolidated financial statements present the Company’s results and financial position in accordance with IFRS. The date of transition to IFRS was January 1, 2010.
Subject to certain transition elections and policy changes disclosed in note 4, the Company has consistently applied the same accounting policies in its opening IFRS balance sheet as at January 1, 2010 and throughout all periods presented, as if these policies had always been in effect. Note 4 discloses the impact of the transition to IFRS on the Company’s reported consolidated balance sheet, consolidated comprehensive income (loss) and consolidated cash flows, including the nature and effect of significant changes in accounting policies from those used in the Company’s Canadian GAAP consolidated financial statements for the year ended December 31, 2010. Comparative figures for 2010 in these financial statements have been restated to give effect to these changes.
The policies applied in these interim consolidated financial statements are based on IFRS issued and outstanding as of May 9, 2011, the date the Board of Directors approved the statements. Any subsequent changes to IFRS that are given effect in the Company’s annual consolidated financial statements for the year ended December 31, 2011 could result in restatement of these interim consolidated financial statements, including the transition adjustments recognized on change-over to IFRS.
These interim consolidated financial statements do not include all the information and disclosures required in the annual financial statements, and should be read in conjunction with the Company’s annual consolidated financial statements as at December 31, 2010. However, certain information and disclosures which are considered material to the understanding of the transition from Canadian GAAP to IFRS, including the opening consolidated balance sheet at the date of transition to IFRS, and reconciliations and descriptions of the effect of the transition from Canadian GAAP to IFRS on equity and comprehensive income for the three months ended March 31, 2010 and for the year ended December 31, 2010 are provided in note 4. Note 4(vi) discloses IFRS information for the year ended December 31, 2010 not provided in the 2010 annual consolidated financial statements.
3. SUMMARY OF SIGNIFICANT ACCOUNTING POLICIES, JUDGMENTS AND ESTIMATESSIGNIFICANT ACCOUNTING POLICIESThe significant accounting policies described below have been applied consistently to all periods presented in these interim consolidated financial statements and in preparing the opening IFRS balance sheet as at January 1, 2010 for the purposes of the transition to IFRS.
bASIS OF MEASUREMENTThese interim consolidated financial statements have been prepared under the historical cost convention, except for derivative financial instruments which are measured at fair value through profit or loss.
bASIS OF CONSOLIDATIONSubsidiaries are all entities over which the Company has control. Subsidiaries are fully consolidated from the date on which control is transferred to the Company. They are deconsolidated from the date that control ceases.
These interim consolidated financial statements include the accounts of Brampton Brick Limited and its operating subsidiaries, Brampton Brick Inc., Oaks Concrete Products Inc., and 1813435 Ontario Limited (65% owned – formerly 1312082 Ontario Limited). All significant intercompany transactions, balances and unrealized gains and losses from intercompany transactions are eliminated on consolidation.
15
bUSINESS COMbINATIONSAcquisition of a business or entity by the Company is reported as a business combination, applying the acquisition method. Under this method, assets, liabilities and contingent liabilities acquired are brought into the Company’s financial statements at the fair value as of the acquisition date. Transaction costs are expensed as incurred. (See note 4(v)(a) for IFRS 1 transition election.)
INVESTMENT IN JOINT VENTUREThe Company’s interest in Universal Resource Recovery Inc., (“Universal”), a 50-50 joint venture of the Company, is accounted for using the equity method of accounting. The Company adopted this policy on transition to IFRS, effective January 1, 2010. Prior to this date, the Company’s interest in Universal was accounted for using the proportionate consolidation method. (See note 4(v)(d) for Canadian GAAP to IFRS transition adjustments.)
Under the equity method of accounting, the consolidated balance sheet carrying amount of the investment in Universal is increased or decreased to recognize the Company’s share of the profit or loss of Universal. The Company’s share of the profit or loss of Universal is recognized in the consolidated statement of comprehensive income (loss). If the Company’s share of losses equals or exceeds its interest in Universal, including unsecured advances, the Company would not recognize further losses, unless it had incurred obligations or made payments on behalf of Universal. Dividends received from Universal reduce the carrying amount of the investment. Additional advances to Universal increase the carrying amount of the investment. Adjustments are made to conform Universal’s accounting policies to those of the Company for like transactions and events in similar circumstances.
The Company assesses at each reporting period whether there is objective evidence that its interest in Universal is impaired. If impaired, the carrying value of the Company’s share of the underlying assets of Universal is written down to its estimated recoverable amount (being the higher of fair value less costs to sell and value in use) and charged to the consolidated statement of comprehensive income (loss). Reversals of impairments are permitted when events or circumstances warrant.
NON-CONTROLLING INTERESTS Non-controlling interests represent outside parties’ equity interests in 1813435 Ontario Limited (65% owned – formerly 1312082 Ontario Limited). The share of net assets of this subsidiary attributable to non-controlling interests is presented as a separate component of equity. The share of net income and comprehensive income attributable to non-controlling interests is recognized directly in equity. Changes in the Company’s ownership interest in subsidiaries that do not result in a loss of control are accounted for as equity transactions. (See note 4(v)(h) for Canadian GAAP to IFRS disclosure changes.)
FOREIGN CURRENCY TRANSLATION(i) Functional and presentation currency
Items included in the financial statements of each consolidated entity of Brampton Brick Limited are measured using the currency of the primary economic environment in which the entity operates (the “functional currency”). These interim consolidated financial statements are presented in Canadian dollars, which is Brampton Brick Limited’s functional currency. The financial statements of the Company’s U.S. subsidiaries, (Brampton Brick Inc. and Oaks Concrete Products Inc.) which have the U.S. dollar as the functional currency are translated into Canadian dollars as follows: assets and liabilities – at the closing rate at the balance sheet statement date, and income and expenses – at the average rate of the reporting period (as this is considered a reasonable approximation of actual rates). All foreign currency differences are recognized in other comprehensive income (loss).
When the Company disposes of its entire interest in a foreign operation, or loses control, joint control, or significant influence over a foreign operation, the foreign currency gains or losses accumulated in other comprehensive income related to the foreign operation are recognized in profit or loss. If the Company disposes of part of an interest in a foreign operation which remains a subsidiary, a proportionate amount of foreign currency gains or losses accumulated in other comprehensive income related to the subsidiary is reallocated between controlling and non-controlling interests.
(ii) Transactions and balances Foreign currency transactions are translated into the functional currency using the exchange rates prevailing at the dates of the transactions. Foreign exchange gains and losses resulting from the settlement of foreign currency transactions and from the translation at month-end exchange rates of monetary assets and liabilities denominated in currencies other than the Company’s functional currency are recognized in the consolidated statement of comprehensive income (loss).
CASh AND CASh EQUIVALENTSCash and cash equivalents are defined as cash and short-term deposits with original maturities of three months or less.
FINANCIAL INSTRUMENTSFinancial assets and liabilities are recognized when the Company becomes a party to the contractual provisions of the instrument. Financial assets are derecognized when the rights to receive cash flows from the assets have expired or have been transferred and the Company has transferred substantially all risks and rewards of ownership.
Financial assets and liabilities are offset and the net amount is reported in the balance sheet when there is a legally enforceable right to offset the recognized amounts and there is an intention to settle on a net basis, or realize the asset and settle the liability simultaneously.
At initial recognition, the Company classifies its financial instruments in the following categories, depending on the purpose for which the instruments were acquired:
16
(i) Financial assets and liabilities at fair value through profit or loss: A financial asset or liability is classified at fair value through profit or loss if it is classified as held for trading or is designated as such upon initial recognition. Derivatives are also included in this category unless they are designated as hedges. See note 12 for derivative financial instruments held by the Company and classified in this category.
Financial instruments in this category are recognized both initially and subsequently at fair value. Upon initial recognition attributable transaction costs are recognized in the consolidated statement of comprehensive income (loss) as incurred. Gains and losses arising from changes in fair value are presented in the consolidated statement of comprehensive income (loss) in the period in which they arise. Financial assets and liabilities at fair value through profit or loss are classified as current except for the portion expected to be realized or paid beyond twelve months of the balance sheet date, which is classified as non-current.
(ii) Available-for-sale financial assets: Available-for-sale financial assets are non-derivative financial assets that are designated as available-for-sale and that are not classified in any of the other categories. Available-for-sale financial assets are recognized initially at fair value plus transaction costs and are subsequently carried at fair value. Gains or losses arising from changes in fair value are recognized in other comprehensive income. Available-for-sale investments are classified as non-current, unless the investment matures within twelve months, or management expects to dispose of them within twelve months.
(iii) Loans and receivables: Loans and receivables are non-derivative financial assets with fixed or determinable payments that are not quoted in an active market. The Company’s loans and receivables are comprised of trade receivables and cash and cash equivalents and are included in current assets due to their short term nature. Such assets are recognized initially at the amount expected to be received, less, when material, a discount to reduce the loans and receivables to fair value. Subsequent to initial recognition loans and receivables are measured at amortized cost using the effective interest method, less any impairment losses.
(iv) Financial liabilities at amortized cost: Financial liabilities at amortized cost include trade payables, other liabilities, bank debt and long-term debt. Trade payables are initially recognized at the amount required to be paid less, when material, a discount to reduce the payables to fair value. Subsequently, trade payables are measured at amortized cost using the effective interest method. Bank debt and long-term debt are recognized initially at fair value, net of any transaction costs incurred, and subsequently at amortized cost using the effective interest method.
Financial liabilities are classified as current liabilities if payment is due within twelve months. Otherwise, they are presented as non-current liabilities.
(v) Derivative financial instruments: The Company occasionally uses derivative financial instruments to manage interest rate risk and foreign currency risk. Derivatives are initially recognized at fair value on the date a derivative contract is entered into and are subsequently re-measured at their fair value. The method of recognizing the resulting gain or loss depends on whether the derivative is designated as a hedging instrument, and if so, the nature of the item being hedged. If hedge accounting is used, the effectiveness of the derivative in managing an identified risk is assessed on initial application and on an ongoing basis thereafter. Unrealized gains and losses, net of related income taxes, on the derivative contracts, are recorded in other comprehensive income (loss). If a hedge becomes ineffective, hedge accounting is discontinued and the derivative contracts are adjusted to fair value at each reporting date, with changes in fair value recorded in the consolidated statement of comprehensive income (loss).
TRADE RECEIVAbLES Trade receivables are amounts due from customers for goods sold or services performed in the normal course of business, net of any allowance for doubtful accounts and sales discounts.
INVENTORIESInventories of manufactured items and work-in-process are recorded at the lower of cost, determined on an average production cost basis, and net realizable value.
Raw materials and resale inventories are recorded at the lower of cost, determined on a first-in, first-out basis, and replacement cost for raw materials and net realizable value for resale inventory.
Average production cost comprises raw materials, direct labour, other direct costs and related production overheads, based on normal production capacity, including applicable depreciation on property, plant and equipment. Net realizable value is the estimated selling price in the ordinary course of business, less the estimated cost of making the sale.
PROPERTY, PLANT AND EQUIPMENTProperty, plant and equipment are measured at cost less accumulated depreciation and accumulated impairment losses. Cost includes expenditures that are directly attributable to the acquisition of the asset. Subsequent costs are included in the asset’s carrying amount or recognized as a separate asset, as appropriate, only when it is probable that future economic benefits associated with the item will flow to the Company and the cost can be measured reliably. The carrying amount of a replaced asset is derecognized when replaced. Repairs and maintenance costs are charged to the consolidated statement of comprehensive income (loss) during the period in which they are incurred.
DepreciationAsset classes are sub-divided into major components to recognize differences in the life spans of the components identified. When parts of an item of property, plant and equipment have different useful lives, they are accounted for as separate items (major components) of property, plant and equipment and each component is depreciated separately. Residual values, method of depreciation and useful lives of assets are reviewed annually and adjusted if appropriate.
17
Depreciation is provided on a straight-line basis at rates designed to write off the property, plant and equipment components over their estimated useful lives, as follows:
Land improvements 5 to 10 years Buildings 10 to 40 years Machinery and equipment 3 to 40 years Mobile equipment 4 to 10 years
Quarries are amortized on the unit of production method based on shale extraction and estimated remaining shale reserves.
Estimates of remaining useful lives in respect of certain items of plant and equipment were revised January 1, 2011. The change was accounted for prospectively, see note 6.
Gains and losses on disposals of property, plant and equipment are determined by comparing the proceeds with the carrying amount of the asset and are included as part of other gains and losses in the statement of comprehensive income (loss).
The Company elected to measure certain assets of property, plant and equipment at their fair value and use the fair value as deemed cost election under the IFRS 1 transitional provisions as at January 1, 2010. (See note 4(v)(f) for IFRS 1 transitional election.)
LEASESLeases are classified as finance or operating depending upon the terms and conditions of the contracts. Leases that transfer substantially all of the risks and rewards of ownership of the asset and to which the criteria as described under IAS 17, Leases, apply are classified as finance leases and are accounted for as an acquisition of a non-current asset and an assumption of an obligation at the inception of the lease, measured at the present value of minimum lease payments. Asset values recorded under finance leases are amortized on a straight-line basis over the period of expected use. Obligations recorded under finance leases are reduced by lease payments net of imputed interest.
Other leases are operating leases and are not recognized in the Company’s balance sheet and are expensed over the lease term on a straight-line basis.
IMPAIRMENT OF NON-FINANCIAL ASSETSProperty, plant and equipment are assessed at the end of each reporting period to determine whether there is indication that an asset may be impaired. If any such indication exists, the recoverable amount of the asset is estimated in order to determine the extent, if any, of the impairment loss. For the purpose of measuring recoverable amounts, assets are grouped at the lowest levels for which there are separately identifiable cash flows (cash generating units or “CGU”s). The recoverable amount is the higher of an asset’s fair value less costs to sell and value in use (being the present value of the expected future cash flows of the relevant asset or CGU). An impairment loss is recognized for the amount by which the asset’s carrying amount exceeds its recoverable amount.
The Company evaluates impairment losses for potential reversals when events or circumstances warrant such consideration. (See note 4(v)(g) Canadian GAAP to IFRS transitional adjustments.)
TRADE PAYAbLES Trade payables are obligations to pay for goods or services that have been acquired in the normal course of business from suppliers. They are classified as current liabilities if payment is due within one year or less. If not, they are presented as non-current liabilities.
PROVISIONSProvisions, where applicable, are recognized when the Company has a present legal or constructive obligation as a result of past events; it is probable that an outflow of resources will be required to settle the obligation; and the amount has been reliably estimated.
Provisions are measured at management’s best estimate of the expenditure required to settle the obligation at the end of the reporting period, and are discounted to present value where the effect is material.
bORROwING COSTSBorrowing costs attributable to the acquisition, construction or production of qualifying assets are added to the cost of those assets, until such time as the assets are substantially ready for their intended use. All other borrowing costs are recognized as interest expense in the statement of comprehensive income (loss) in the period in which they are incurred. (See note 4(v)(e) for Canadian GAAP to IFRS transitional election.)
DECOMMISSIONING PROVISIONSThe cost of the Company’s obligation to rehabilitate its shale quarries is estimated based on the present value of expected future rehabilitation costs and is recognized in the period in which the obligation is incurred. The present value of these costs is added to the cost of the associated asset and amortized over its useful life, while the corresponding liability will accrete to its future value over the same period.
The present value of the rehabilitation liability is determined based on a pre-tax discount rate that takes into account the time value of money and the risks specific to the liability. The liability is reviewed at each reporting date to determine if the discount rate is still applicable and to determine if changes are required to the original estimate.
Changes to estimated future costs are recognized on the balance sheet by either increasing or decreasing the rehabilitation liability and rehabilitation asset if the initial estimate was originally recognized as part of an asset measured in accordance with IAS 16, Property,
18
Plant and Equipment. Any reduction in the rehabilitation liability and therefore any deduction from the rehabilitation asset may not exceed the carrying amount of that asset. If it does, any excess over the carrying value is taken immediately to the consolidated statement of comprehensive income (loss). (See note 4(v)(j) for Canadian GAAP to IFRS transition adjustments.)
INCOME TAxESIncome tax expense comprises current and deferred tax. Current tax and deferred tax are recognized in profit or loss, except to the extent that it relates to items recognized directly in other comprehensive income or directly in equity, in which case the tax is also recognized in other comprehensive income or directly in equity.
Current tax expense is based on the results for the period as adjusted for items that are not taxable or not deductible. Current tax is calculated using tax rates and laws that were enacted or substantively enacted at the end of the reporting period.
Deferred tax is recognized, using the liability method, in respect of temporary differences arising between the carrying amounts of assets and liabilities for financial reporting purposes and the amounts used for taxation purposes. Deferred tax is calculated on a non-discounted basis using tax rates and laws that have been enacted or substantially enacted at the end of the reporting period and are expected to be in effect in the periods in which the deferred tax assets and liabilities are expected to be realized or settled.
A deferred tax asset is recognized for unused tax losses, tax credits and deductible temporary differences, to the extent that it is probable that future taxable income will be available against which they can be utilized. Deferred tax assets are reviewed at each reporting date and are reduced to the extent that it is no longer probable that the related tax benefit will be realized.
Current and deferred tax assets and liabilities are offset when there is a legally enforceable right to offset current tax assets and liabilities and when the deferred tax balances relate to the same taxation authority or either the same taxable group company; or different group entities which intend either to settle current tax assets and liabilities on a net basis, or to realize the assets and settle the liabilities simultaneously, in each future period in which significant amounts of deferred tax assets or liabilities are expected to be settled or recovered.
Deferred income tax assets and liabilities are presented as non-current. (See note 4(v)(k) for Canadian GAAP to IFRS transition adjustments.)
Tax on income in interim periods is accrued using the weighted average tax rate that would be applicable to the expected total annual earnings of each entity within the consolidated group.
ShARE CAPITALClass A Subordinate Voting shares and Class B Multiple Voting shares are classified as equity. Incremental costs directly attributable to the issuance of shares are recognized as a deduction from equity.
DIVIDENDSDividends on Class A Subordinate Voting shares and Class B Multiple Voting shares are recognized in the Company’s consolidated financial statements in the period in which the dividends are approved by the Board of Directors of the Company.
REVENUE RECOGNITION For masonry and landscape product sales, revenue is recognized when the sales price is fixed or determinable and collectibility is reasonably assured. These criteria are generally met at the time the product is shipped to the customer or picked up by the customer or when contractual conditions are met in the case of the Dealer Stocking program, as described below.
Shipments arranged by the Company are sold F.O.B. job site. Customers therefore take ownership and assume the risk of loss upon delivery and all products are invoiced on the same date as they are shipped. Cartage charges are invoiced at the time of shipment.
Pick ups arranged by the customer are sold F.O.B. plant. Customers take ownership and assume the risk of loss upon the shipment leaving the Company’s yard.
The Company offers a Dealer Stocking Program to a limited number of customers. Under this program, these customers may purchase up to a specific quantity of product that the Company will store on its site for a specified period of time. These transactions meet the criteria outlined in the Appendix to IAS 18, Revenue, for “Bill and Hold” arrangements. In these instances, revenue is recognized at the time the product is manufactured and placed into the designated area in the yard. If ultimate delivery is arranged by the Company, cartage is charged and revenue for cartage is recognized at the time of delivery.
The Company does not record a provision for product returns or defective products at the time of sale, as the amounts are not significant.
Sales discounts, including volume rebates, sales incentives and prompt payment discounts, are classified in revenues. Volume rebates and sales incentive credits are computed quarterly, on a customer by customer basis, and the provision is adjusted as required. Credit notes are issued quarterly and processed against the applicable customer account. Prompt payment discounts are recorded at the time payment is received. A general provision, based on historical payment patterns, is reviewed quarterly and adjusted as required.
COST OF SALESCost of sales includes cost of finished goods sold and costs related to shipping and handling of product.
19
EARNINGS PER ShAREBasic earnings per share (“EPS”) is calculated by dividing the net income (loss) for the period attributable to equity owners of Brampton Brick Limited by the weighted average number of Class A Subordinate Voting shares (“Class A shares”) and Class B Multiple Voting shares (“Class B shares”) outstanding during the period.
Diluted earnings per share is calculated by adjusting the weighted average number of Class A and Class B shares outstanding to assume conversion of all dilutive outstanding stock options. The number of shares outstanding is increased by the number of additional shares that would be issued upon the exercise of “in-the-money” stock options, if dilutive, and is reduced by the number of shares that could be repurchased, at the average market price, with the cash proceeds therefrom.
ShARE-bASED COMPENSATION Stock options are accounted for under the fair value method. Each tranche in a grant is considered a separate grant with its own vesting period and grant date fair value. Fair value of each tranche is measured at the date of grant using the Black-Scholes option pricing model. Forfeitures are estimated for the purposes of determining the fair value of each tranche. Compensation expense is recognized over the vesting period of each tranche based on the number of options expected to vest with a corresponding credit to contributed surplus. The number of options expected to vest is reviewed at least annually, with any impact being recognized immediately. No compensation expense is recognized for options that do not ultimately vest. For expired and cancelled options, compensation expense is not reversed and the related credit remains in contributed surplus.
When options are exercised, the Company issues new Class A Subordinate Voting shares. The proceeds received are credited to share capital, together with the related amounts previously added to contributed surplus.
EMPLOYEE bENEFITS – DEFINED CONTRIbUTION PENSION PLANSThe Company’s employee pension plans are defined contribution plans. The Company pays contributions into separate entities and does not have any legal or constructive obligation to pay further amounts. The obligations are recognized as an employee benefit expense in the consolidated statement of comprehensive income (loss) in the periods during which services are rendered by employees.
ACCOUNTING STANDARDS ISSUED bUT NOT YET APPLIEDInternational Financial Reporting Standard 9 , Financial Instruments (“IFRS 9”) IFRS 9 was issued by the IASB in November 2009 and will replace IAS 39, Financial Instruments: Recognition and Measurement (“IAS 39”). IFRS 9 addresses classification and measurement of financial assets and replaces the multiple category and measurement models in IAS 39 for debt instruments with a new mixed measurement model having only two categories: amortized cost and fair value through profit or loss.
Requirements for financial liabilities were added in October 2010 and they largely carried forward existing requirements in IAS 39, except that fair value changes due to credit risk for liabilities designated at fair value through profit and loss would generally be recorded in other comprehensive income.
IFRS 9 is effective for annual periods beginning on or after January 1, 2013, with earlier adoption permitted. The Company has not yet determined the impact of IFRS 9 on its financial statements.
SIGNIFICANT ACCOUNTING JUDGMENTS AND ESTIMATES The preparation of these interim consolidated financial statements in conformity with IFRS requires management to make judgments, estimates and assumptions that affect the application of accounting policies and the reported amounts of assets, liabilities, income and expenses. Actual results may differ from these estimates.
The following are the estimates and judgments applied by management that most significantly affect the Company’s consolidated financial statements:
Impairment of assetsAt each reporting date the Company assesses property, plant and equipment to determine whether there is any indication that an asset may be impaired. The recoverable amount of the asset is estimated whenever such indicators exist in order to determine the extent, if any, of the impairment loss. For the purposes of measuring the recoverable amount, assets are grouped at the lowest level for which there are separately identifiable cash flows (cash generating units or “CGU”s). The recoverable amount is the higher of an asset’s fair value less costs to sell and the value in use. Fair value less costs to sell is determined as the amount that would be obtained from the sale of the asset in an arm’s length transaction between knowledgeable and willing parties. In the absence of an arms length transaction, fair value for assets is generally determined as the present value of estimated future cash flows arising from the continued use of the asset, which includes estimates such as the cost of future expansion plans and eventual disposal, using assumptions that an independent market participant may take into account. Cash flows are discounted to their present value using a post-tax discount rate that reflects current market assessments of the time value of money and the risks specific to the asset. Value in use is determined as the present value of estimated future cash flows arising from continued use and eventual disposition of the asset, which excludes future capital expenditures that would increase the service potential of the asset. Cash flows are discounted to their present value using a pre-tax discount rate that reflects current market assessments of the time value of money and the risks to the specific asset. Management makes judgments in assessing the estimated future cash flows and discount rates used in the impairment models.
20
Recovery of deferred tax assets Judgment is required in determining whether deferred tax assets are recognized on the balance sheet. Deferred tax assets, including those arising from unutilized tax losses, require management to assess the likelihood that the Company will generate taxable earnings in future periods, in order to utilize recognized deferred tax assets. Estimates of future taxable income are based on forecast cash flows from operations and the application of existing tax laws in each jurisdiction. To the extent that future cash flows and taxable income differ significantly from estimates, the ability of the Company to realize the net deferred tax assets recorded at the reporting date could be impacted.
The Company is subject to taxation in a number of jurisdictions. There are many transactions and calculations during the course of business for which the ultimate tax determination requires judgment. Where the final outcome of these tax-related matters is different from the amounts that were initially recorded, such differences will affect the tax provisions in the period in which such determination is made.
Decommissioning provisions The Company is obligated to rehabilitate its quarry properties in Cheltenham, Ontario and Farmersburg, Indiana, as a condition of its licenses to mine shale. The Company assesses its quarry rehabilitation provision annually. Significant estimates and assumptions are made in determining the provision for quarry rehabilitation as there are numerous factors that will affect the ultimate amount payable. These factors include estimates of the extent and costs of rehabilitation activities, technological changes, regulatory changes, cost increases as compared to the inflation rates, and changes in the discount rate. These uncertainties may result in future actual expenditures differing from the amounts currently provided. The provision at the reporting date represents the Company’s best estimate of the present value of the future rehabilitation costs required.
Derivative financial instrumentsManagement estimates the fair value of its interest rate swap agreement as the present value of expected future cash flows to be received or paid based on available market data which includes market yields and counterparty credit spreads. This interest rate swap agreement is used to reduce interest rate risk arising from fluctuations in interest rates and to manage the fixed and floating interest rate mix of the Company’s total debt portfolio and the related overall cost of borrowing. Management makes judgments in assessing the fair value of its interest rate swap agreement.
4. TRANSITION TO IFRS The date of transition to IFRS for the Company was January 1, 2010. IFRS 1 sets forth guidance for the initial adoption of IFRS. IFRS 1 requires first-time adopters to retrospectively apply all effective IFRS standards as of the transition date, except that IFRS 1 also provides for certain optional exemptions and certain mandatory exceptions to the general requirements of retrospective application.
The effect of the Company’s transition to IFRS, described in note 2, is summarized in this note as follows:
(i) Transition elections;
(ii) Reconciliation of equity as previously reported under Canadian GAAP to IFRS;
(iii) Reconciliation of comprehensive income as previously reported under Canadian GAAP to IFRS; A) For the year ended December 31, 2010
B) For the three months ended March 31, 2010
(iv) Adjustments to the statement of cash flows;
(v) Explanatory notes; and
(vi) Additional IFRS information for year ended December 31, 2010.
(I) TRANSITION ELECTIONS The Company has applied the following optional transition exemptions from full retrospective application of IFRS:
As described in Note 4(v)Business combinations aCumulative translation adjustment bBorrowing costs eFair value as deemed cost of property, plant and equipment f
IFRS 1 provides for a number of mandatory exceptions from full retrospective application of IFRS, with estimates being the only mandatory exception applicable to the Company. Estimates previously made by the Company under Canadian GAAP are consistent with their application under IFRS.
21
(II) RECONCILIATION OF EQUITY AS PREVIOUSLY REPORTED UNDER CANADIAN GAAP TO IFRS
(unaudited)(in thousands of Canadian dollars)Notes4(v)
December 31, 2010
March 31, 2010
January 1, 2010
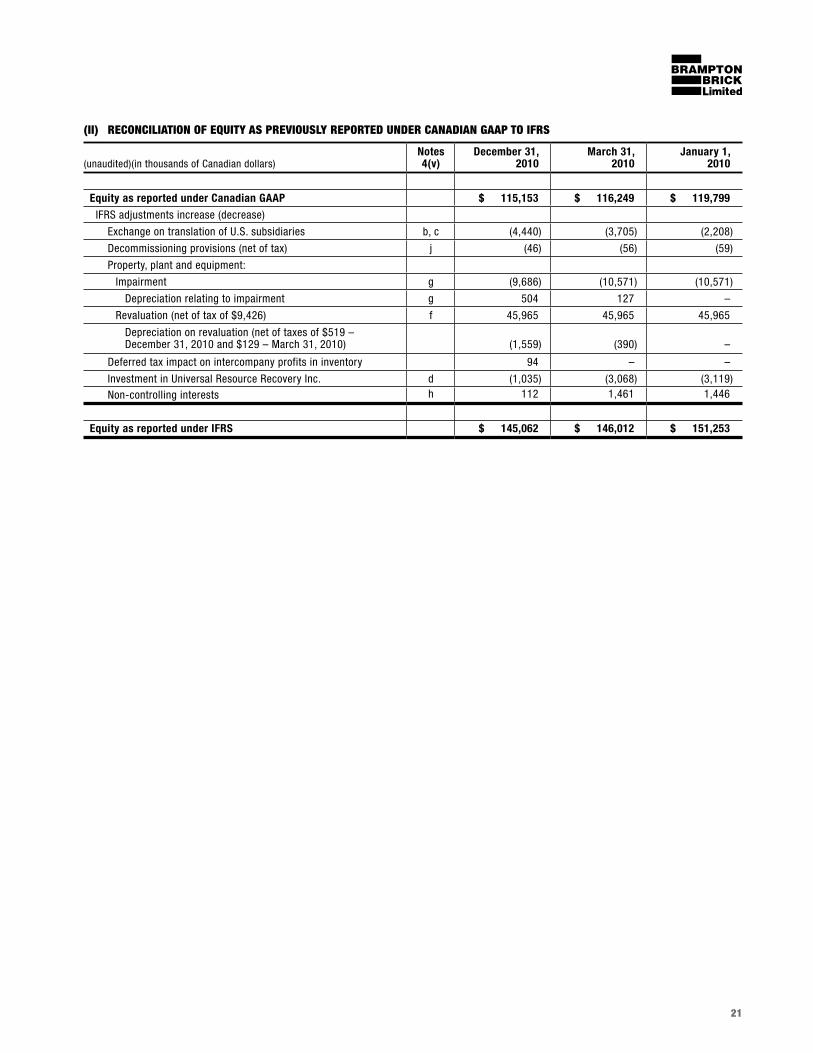
Equity as reported under Canadian GAAP $ 115,153 $ 116,249 $ 119,799
IFRS adjustments increase (decrease)
Exchange on translation of U.S. subsidiaries b, c (4,440) (3,705) (2,208)
Decommissioning provisions (net of tax) j (46) (56) (59)
Property, plant and equipment:
Impairment g (9,686) (10,571) (10,571)
Depreciation relating to impairment g 504 127 –
Revaluation (net of tax of $9,426) f 45,965 45,965 45,965
Depreciation on revaluation (net of taxes of $519 – December 31, 2010 and $129 – March 31, 2010) (1,559) (390) –
Deferred tax impact on intercompany profits in inventory 94 – –
Investment in Universal Resource Recovery Inc. d (1,035) (3,068) (3,119) Non-controlling interests h 112 1,461 1,446
Equity as reported under IFRS $ 145,062 $ 146,012 $ 151,253
22
(III) (A) RECONCILIATION OF COMPREhENSIVE INCOME AS PREVIOUSLY REPORTED UNDER CANADIAN GAAP TO IFRS
Year ended December 31
(unaudited)(in thousands of Canadian dollars) Notes 2010 2010 2010
4(v) CGAAP Total Adjustments IFRS
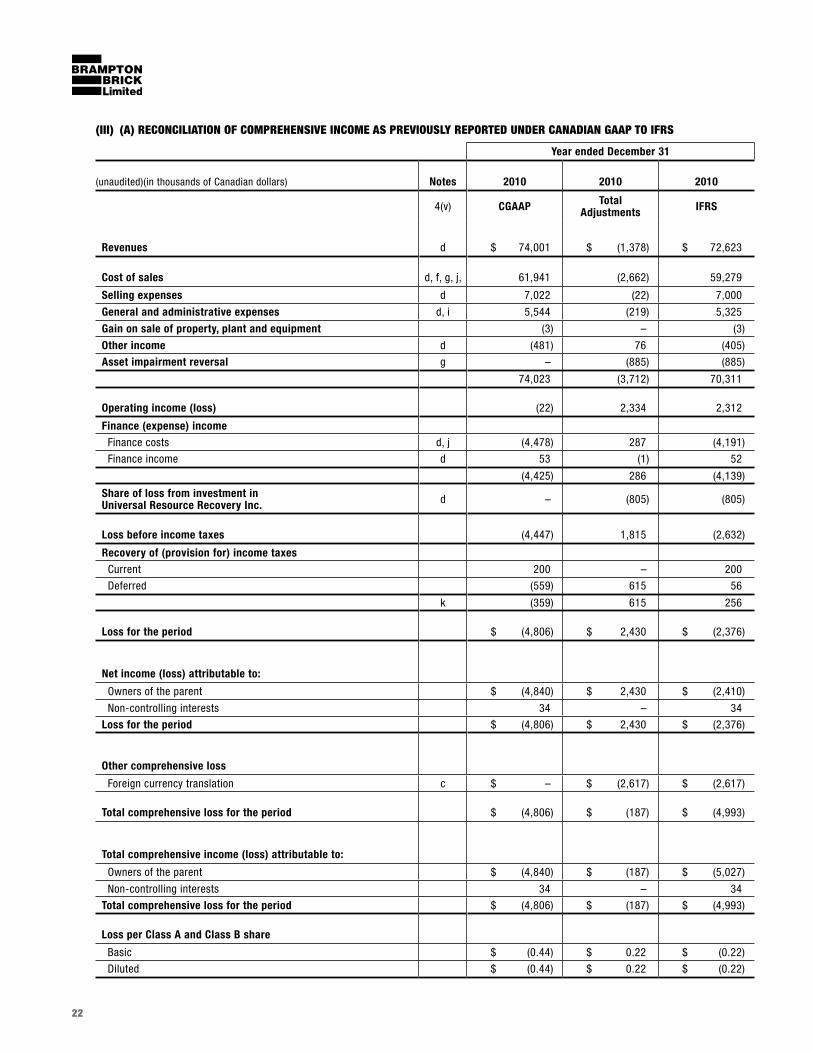
Revenues d $ 74,001 $ (1,378) $ 72,623
Cost of sales d, f, g, j, 61,941 (2,662) 59,279
Selling expenses d 7,022 (22) 7,000
General and administrative expenses d, i 5,544 (219) 5,325
Gain on sale of property, plant and equipment (3) – (3)
Other income d (481) 76 (405)
Asset impairment reversal g – (885) (885)
74,023 (3,712) 70,311
Operating income (loss) (22) 2,334 2,312
Finance (expense) income Finance costs d, j (4,478) 287 (4,191)
Finance income d 53 (1) 52
(4,425) 286 (4,139)
Share of loss from investment in Universal Resource Recovery Inc. d – (805) (805)
Loss before income taxes (4,447) 1,815 (2,632)
Recovery of (provision for) income taxesCurrent 200 – 200
Deferred (559) 615 56
k (359) 615 256
Loss for the period $ (4,806) $ 2,430 $ (2,376)
Net income (loss) attributable to:
Owners of the parent $ (4,840) $ 2,430 $ (2,410)
Non-controlling interests 34 – 34
Loss for the period $ (4,806) $ 2,430 $ (2,376)
Other comprehensive loss
Foreign currency translation c $ – $ (2,617) $ (2,617)
Total comprehensive loss for the period $ (4,806) $ (187) $ (4,993)
Total comprehensive income (loss) attributable to:
Owners of the parent $ (4,840) $ (187) $ (5,027)
Non-controlling interests 34 – 34
Total comprehensive loss for the period $ (4,806) $ (187) $ (4,993)
Loss per Class A and Class B share
Basic $ (0.44) $ 0.22 $ (0.22)
Diluted $ (0.44) $ 0.22 $ (0.22)
23
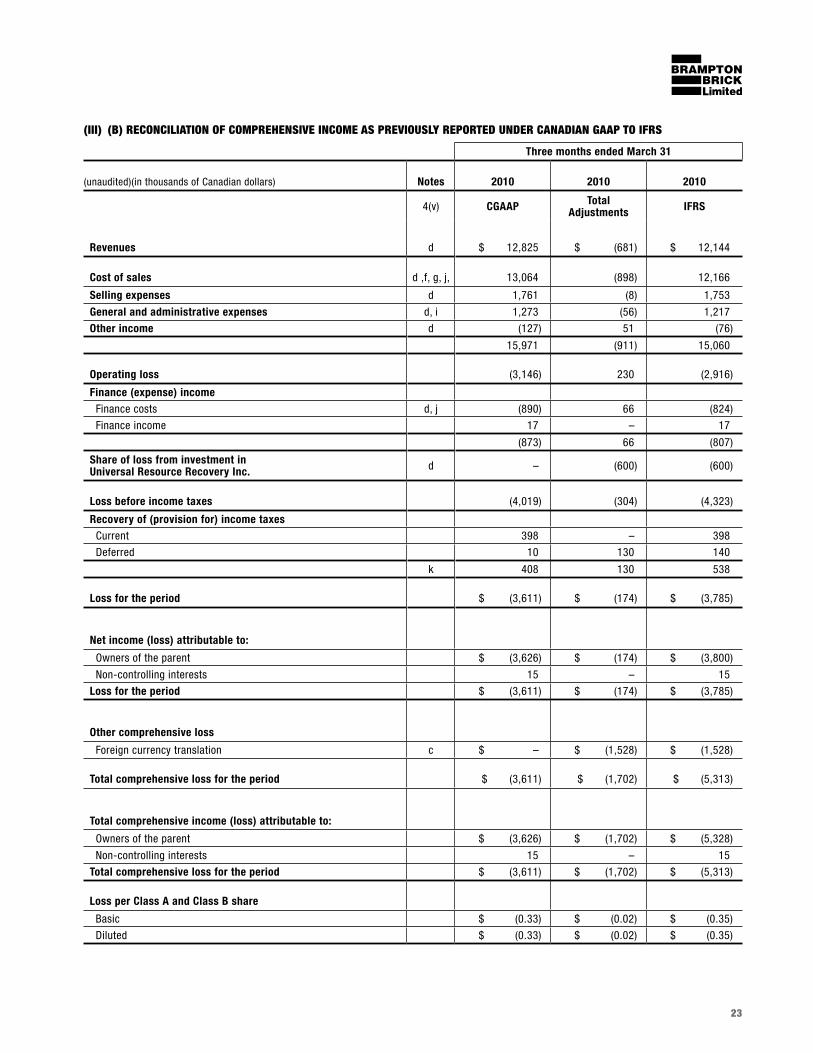
(III) (b) RECONCILIATION OF COMPREhENSIVE INCOME AS PREVIOUSLY REPORTED UNDER CANADIAN GAAP TO IFRS
Three months ended March 31
(unaudited)(in thousands of Canadian dollars) Notes 2010 2010 2010
4(v) CGAAP Total Adjustments IFRS
Revenues d $ 12,825 $ (681) $ 12,144
Cost of sales d ,f, g, j, 13,064 (898) 12,166
Selling expenses d 1,761 (8) 1,753
General and administrative expenses d, i 1,273 (56) 1,217
Other income d (127) 51 (76)
15,971 (911) 15,060
Operating loss (3,146) 230 (2,916)
Finance (expense) income Finance costs d, j (890) 66 (824)
Finance income 17 – 17
(873) 66 (807)
Share of loss from investment in Universal Resource Recovery Inc. d – (600) (600)
Loss before income taxes (4,019) (304) (4,323)
Recovery of (provision for) income taxesCurrent 398 – 398
Deferred 10 130 140
k 408 130 538
Loss for the period $ (3,611) $ (174) $ (3,785)
Net income (loss) attributable to:
Owners of the parent $ (3,626) $ (174) $ (3,800)
Non-controlling interests 15 – 15
Loss for the period $ (3,611) $ (174) $ (3,785)
Other comprehensive loss
Foreign currency translation c $ – $ (1,528) $ (1,528)
Total comprehensive loss for the period $ (3,611) $ (1,702) $ (5,313)
Total comprehensive income (loss) attributable to:
Owners of the parent $ (3,626) $ (1,702) $ (5,328)
Non-controlling interests 15 – 15
Total comprehensive loss for the period $ (3,611) $ (1,702) $ (5,313)
Loss per Class A and Class B share
Basic $ (0.33) $ (0.02) $ (0.35)
Diluted $ (0.33) $ (0.02) $ (0.35)
24
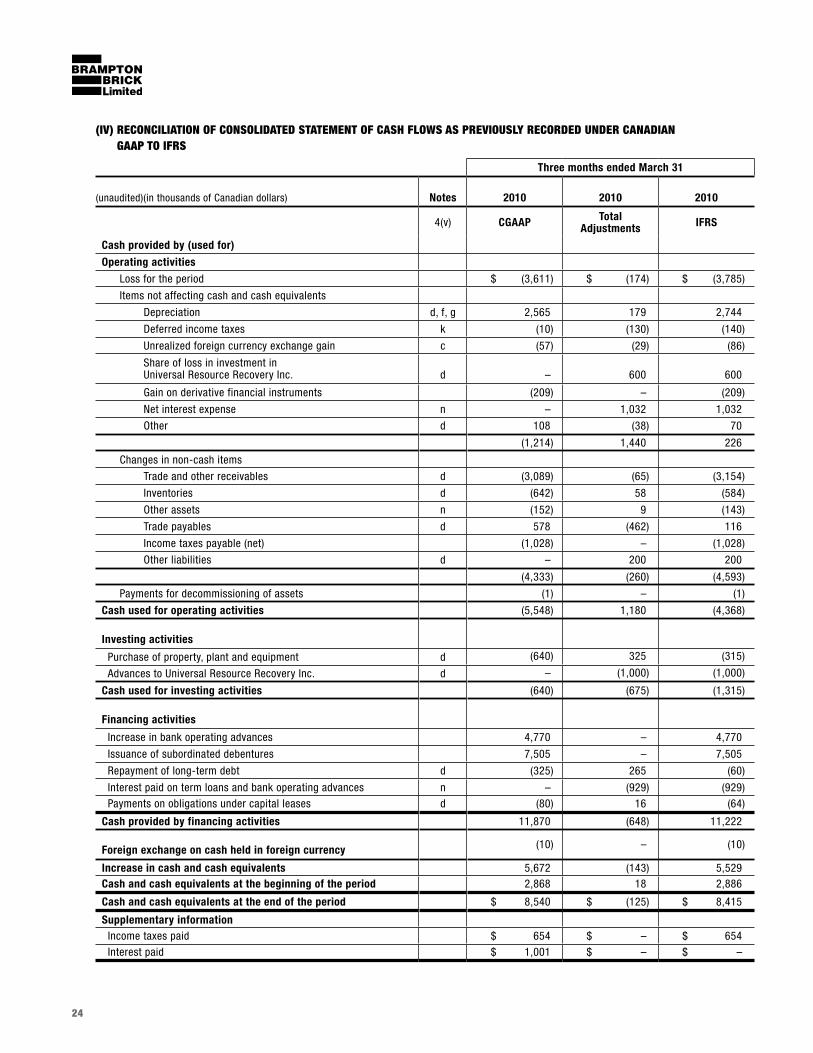
(IV) RECONCILIATION OF CONSOLIDATED STATEMENT OF CASh FLOwS AS PREVIOUSLY RECORDED UNDER CANADIAN GAAP TO IFRS
Three months ended March 31
(unaudited)(in thousands of Canadian dollars) Notes 2010 2010 2010
4(v) CGAAP Total Adjustments IFRS
Cash provided by (used for)
Operating activities
Loss for the period $ (3,611) $ (174) $ (3,785)
Items not affecting cash and cash equivalents
Depreciation d, f, g 2,565 179 2,744
Deferred income taxes k (10) (130) (140)
Unrealized foreign currency exchange gain c (57) (29) (86)
Share of loss in investment in Universal Resource Recovery Inc. d – 600 600
Gain on derivative financial instruments (209) – (209)
Net interest expense n – 1,032 1,032
Other d 108 (38) 70
(1,214) 1,440 226
Changes in non-cash items
Trade and other receivables d (3,089) (65) (3,154)
Inventories d (642) 58 (584)
Other assets n (152) 9 (143)
Trade payables d 578 (462) 116
Income taxes payable (net) (1,028) – (1,028)
Other liabilities d – 200 200
(4,333) (260) (4,593)
Payments for decommissioning of assets (1) – (1)
Cash used for operating activities (5,548) 1,180 (4,368)
Investing activities
Purchase of property, plant and equipment d (640) 325 (315)
Advances to Universal Resource Recovery Inc. d – (1,000) (1,000)
Cash used for investing activities (640) (675) (1,315)
Financing activities
Increase in bank operating advances 4,770 – 4,770
Issuance of subordinated debentures 7,505 – 7,505
Repayment of long-term debt d (325) 265 (60)
Interest paid on term loans and bank operating advances n – (929) (929)Payments on obligations under capital leases d (80) 16 (64)
Cash provided by financing activities 11,870 (648) 11,222
Foreign exchange on cash held in foreign currency (10) – (10)
Increase in cash and cash equivalents 5,672 (143) 5,529 Cash and cash equivalents at the beginning of the period 2,868 18 2,886
Cash and cash equivalents at the end of the period $ 8,540 $ (125) $ 8,415
Supplementary informationIncome taxes paid $ 654 $ – $ 654 Interest paid $ 1,001 $ – $ –
25
(V) ExPLANATORY NOTES(a) Business combinations
In accordance with the IFRS transitional provisions, the Company elected not to apply IFRS 3, Business Combinations retrospectively to business combinations that occurred before the date of transition to IFRS. As such, Canadian GAAP balances relating to business combinations entered into before the date of transition have been carried forward without adjustment.
(b) Cumulative translation adjustment In accordance with the IFRS transitional provisions, the Company has elected to reset the cumulative translation adjustment account, which includes gains and losses arising from the translation of the Company’s U.S. subsidiaries, to zero at the date of transition to IFRS. Accumulated other comprehensive loss and retained earnings have been reduced by $3,829.
(c) Foreign currency translation The financial statements of the Company’s U.S. subsidiaries, which have the U.S. dollar as their functional currency, are translated into Canadian dollars as follows: assets and liabilities – at the closing rate on the balance sheet date and income and expenses – at the average rates prevailing during the period (as this is considered a reasonable approximation of actual rates). Foreign currency differences are recognized in other comprehensive income (loss). Under Canadian GAAP, the Company’s U.S. subsidiaries were classified as integrated and accounted for under the temporal method. Under this method, monetary assets and liabilities of subsidiaries were translated into Canadian dollars at the exchange rate in effect at the balance sheet dates. Non-monetary assets and liabilities were translated at the exchange rate in effect at the date of the transaction. Revenues and expenses were translated at average exchange rates prevailing during the period. Resulting unrealized gains or losses were recognized in the income statement.
As a result of the transition from Canadian GAAP to IFRS, translation of the financial statements of the Company’s U.S. subsidiaries as at January 1, 2010 gave rise to a foreign exchange loss totaling $2,208, which was recognized in other comprehensive income (loss). In accordance with the IFRS transitional provisions, this account was set to zero and retained earnings was reduced by the same amount. In addition, other comprehensive loss increased by $1,528 for the three months ended March 31, 2010 and increased by $2,617 for the year ended December 31, 2010. (See note 4(v)(l) for summary of transition adjustments to accumulated other comprehensive loss.)
(d) Investment accounted for using the equity method The Company has a 50% interest in Universal. This investment was accounted for under Canadian GAAP using the proportionate consolidation method. Under this method of accounting, the Company’s consolidated financial statements included its 50% share of Universal’s assets, liabilities, revenues, expenses and cash flows. On transition to IFRS, the Company changed the accounting policy for this investment to the equity method. As a result, the Company’s share of Universal’s assets and liabilities were removed from the Company’s consolidated balance sheet and the aggregate amount was netted against the Company’s investment in Universal Resource Recovery Inc.
Furthermore, Universal is a private company in Canada and is not required to comply with IFRS. However, the accounting policies of Universal have been reviewed and adjustments have been made for reporting purposes, where necessary, to ensure consistency with the policies adopted by the Company. On January 1, 2010, an impairment assessment of Universal’s property, plant and equipment was performed in accordance with IAS 36, Impairment of Assets (“IAS 36”) which resulted in an impairment charge that increased the loss that is shared by the joint venture partners under the equity method of accounting. Accordingly, the Company recorded an increase in its share of the loss in Universal of $3,119 on transition to IFRS. The recoverability of Universal’s property, plant and equipment was re-evaluated at December 31, 2010 in accordance with IAS 36 which resulted in a partial reversal of the impairment charge recorded as at January 1, 2010. This resulted in a reduction in the Company’s share of the loss in Universal for the fourth quarter and year ended December 31, 2010 of $1,880 compared to the previously reported share of loss under Canadian GAAP. The Company’s share of loss in Universal measured under IFRS was $805 for the year ended December 31, 2010. The following summarizes the Canadian GAAP to IFRS transitional adjustments with respect to this policy change on the Company’s January 1, 2010 balance sheet.
January 1, 2010 $
Current assets - decrease 578Long-term assets - decrease 13,019Current liabilities - decrease 2,299Long-term liabilities - decrease 6,612Share of loss from Universal on transition - increase (3,119)Investment in Universal Resource Recovery - increase 1,567
(e) Borrowing costsIn accordance with the IFRS transitional provisions, the Company elected not to capitalize certain borrowing costs pertaining to the construction of its Indiana clay brick manufacturing facility which were incurred prior to January 1, 2010 and which had previously been expensed under Canadian GAAP.
26
(f) Fair value as deemed cost for property, plant and equipmentIn accordance with the transitional provisions, the Company applied the fair value as deemed cost election as at January 1, 2010 to certain parcels of land and to certain production equipment located at its Canadian production facilities.
An independent appraisal report for land prepared as at January 1, 2010 estimated the fair value of the Company’s land located in Brampton, Markham and Milton to be $61,610 using the direct comparison approach as permitted under IFRS. This represents an aggregate increase of $35,366 compared to the carrying amount of $26,244 under Canadian GAAP.
Certain production equipment located at the Company’s four Canadian manufacturing plants (in Brampton, Markham and Milton) was revalued to $57,760, representing an aggregate increase of $20,025 compared to the carrying amount of $37,735 under Canadian GAAP. The production equipment was appraised by management personnel using the depreciated replacement cost approach and was subsequently supported by independent appraisal reports. The aggregate increase to retained earnings on transition, net of tax impact of $9,426 (note 4(v)(k)), is $45,965. As a result of the increase in the IFRS carrying amount of these assets, the amount of depreciation recorded related to such assets will be greater than the amount that was charged to income under Canadian GAAP. Depreciation expense for the three months ended March 31, 2010 and for the year ended December 31, 2010 is greater under IFRS than Canadian GAAP by $519 and $2,077 respectively. The resulting increase in depreciation was included in cost of sales.
(g) Asset impairment Under Canadian GAAP, an impairment was recognized if an asset’s carrying value exceeded the sum of the asset’s undiscounted future cash flows. Impairments recognized under Canadian GAAP were not reversed.
The Company determined that the Brampton clay brick plant, the Canadian concrete plants (in Brampton, Markham and Milton), the Wixom, Michigan concrete plant and the Farmersburg, Indiana clay brick plant were the CGUs for the purposes of asset impairment testing under IFRS.
As a result of ongoing economic pressures impacting the construction industry, the Company completed IFRS asset impairment evaluations with respect to its Brampton clay brick plant, Canadian concrete plants and the Wixom, Michigan concrete plant and concluded that there was no impairment using the value in use methodology as at January 1, 2010.
On the transition date, the asset impairment evaluation with respect to the Farmersburg, Indiana clay brick plant was also initially performed using the value in use methodology which indicated a potential impairment. As a result, the Company performed an impairment analysis utilizing the fair value less costs to sell methodology. As the recoverable amount determined under the fair value less costs to sell methodology was higher than the amount determined using the value in use methodology, in accordance with IAS 36 – Impairment of Assets, the fair value less costs to sell methodology was used to record an impairment charge of $10,571 in the opening IFRS balance sheet relating to the Company’s Farmersburg, Indiana clay brick plant. The effect of the impairment was a decrease in property, plant and equipment of $10,571 from a carrying value of $55,986 in accordance with Canadian GAAP, to $45,415 in accordance with IFRS. The impairment loss was recorded on a pro-rata basis to the individual assets of the CGU, with a corresponding charge to retained earnings. The recoverable amount was estimated using the approved business plan for a period of five years. Cash flows beyond five years were extrapolated using an estimated terminal growth rate of 2%. The cash flows were discounted using a post-tax discount rate of 10.15%.
The Company revisited the impairment indicators at December 31, 2010 and performed impairment tests for all CGUs on this date using the value in use methodology. Consistent with the opening balance sheet, there was no impairment identified for the Brampton clay brick plant, Canadian concrete plants and the Wixom, Michigan concrete plant at this date. The assessment for the Farmersburg, Indiana clay brick plant under the value in use methodology continued to indicate impairment. Under the fair value less costs to sell methodology, the CGU for the Indiana clay brick plant indicated that the recoverable amount exceeded the carrying amount by $885, net of exchange differences, as at December 31, 2010.
Under IFRS an impairment loss for a CGU can be reversed if there has been a change in the estimates used to determine the recoverable amount. The reversal of an impairment loss shall not exceed the carrying amount that would have been determined, net of depreciation, had no impairment loss been recognized for the CGU in prior periods. Accordingly, a partial reversal of the impairment loss in the amount of $885 was allocated to the carrying value of the Farmersburg, Indiana assets recorded on a pro rata basis, with a corresponding amount reflected in the statement of comprehensive income (loss) in the fourth quarter and year ended December 31, 2010.
The reversal of the impairment is primarily due to an improvement in the 5 year estimated future cash flows for this CGU as a result of forecasted improvements in the economic environment for the construction industry. Cash flows beyond 5 years were extrapolated using an estimated terminal growth rate of 2%. The cash flows were discounted using a post tax discount rate of 11.96% as at December 31, 2010.
(h) Non-controlling interestsUnder IFRS, the non-controlling interests’ share of the net assets of the Company’s subsidiary, 1813435 Ontario Limited, (65% owned – formerly 1312082 Ontario Limited), is included in equity and the non-controlling interests’ share of its comprehensive income is allocated directly to equity. Under Canadian GAAP, non-controlling interests’ share of income and other comprehensive income were deducted in calculating net income and comprehensive income of the entity. Non-controlling interest of $1,446 at January 1, 2010 ($1,461 at March 31, 2010 and $112 at December 31, 2010) as determined under Canadian GAAP has been reclassified to equity.
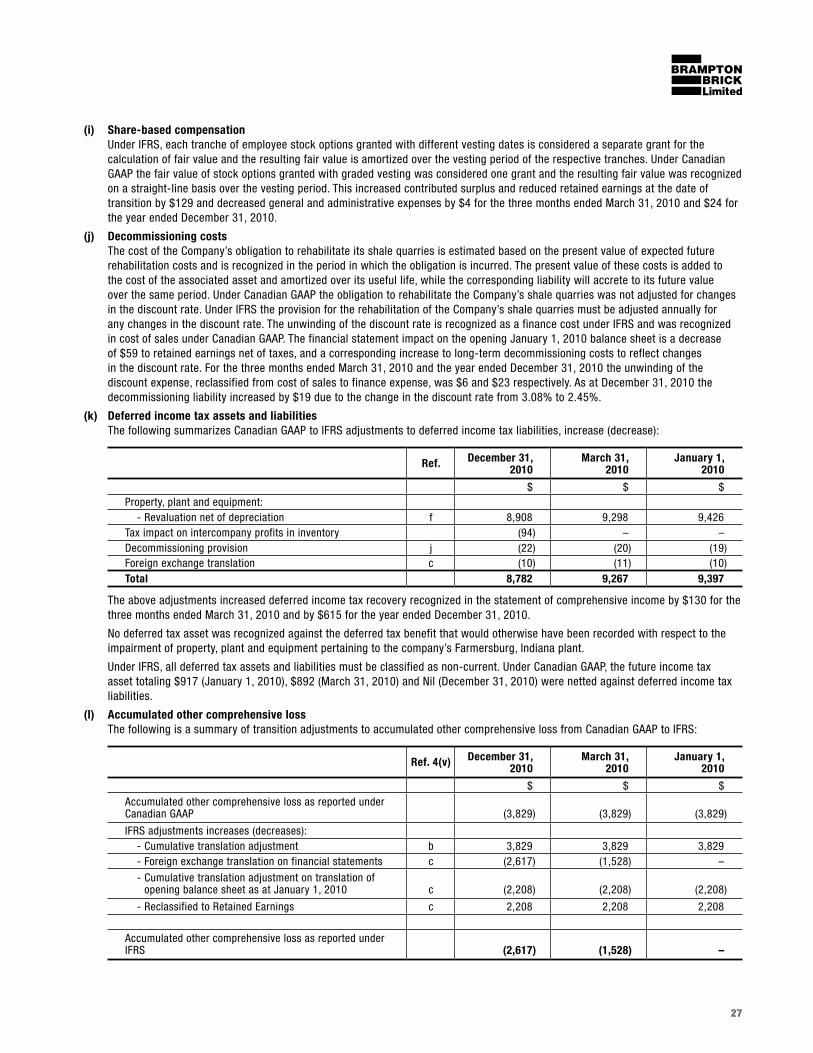
27
(i) Share-based compensationUnder IFRS, each tranche of employee stock options granted with different vesting dates is considered a separate grant for the calculation of fair value and the resulting fair value is amortized over the vesting period of the respective tranches. Under Canadian GAAP the fair value of stock options granted with graded vesting was considered one grant and the resulting fair value was recognized on a straight-line basis over the vesting period. This increased contributed surplus and reduced retained earnings at the date of transition by $129 and decreased general and administrative expenses by $4 for the three months ended March 31, 2010 and $24 for the year ended December 31, 2010.
(j) Decommissioning costs The cost of the Company’s obligation to rehabilitate its shale quarries is estimated based on the present value of expected future rehabilitation costs and is recognized in the period in which the obligation is incurred. The present value of these costs is added to the cost of the associated asset and amortized over its useful life, while the corresponding liability will accrete to its future value over the same period. Under Canadian GAAP the obligation to rehabilitate the Company’s shale quarries was not adjusted for changes in the discount rate. Under IFRS the provision for the rehabilitation of the Company’s shale quarries must be adjusted annually for any changes in the discount rate. The unwinding of the discount rate is recognized as a finance cost under IFRS and was recognized in cost of sales under Canadian GAAP. The financial statement impact on the opening January 1, 2010 balance sheet is a decrease of $59 to retained earnings net of taxes, and a corresponding increase to long-term decommissioning costs to reflect changes in the discount rate. For the three months ended March 31, 2010 and the year ended December 31, 2010 the unwinding of the discount expense, reclassified from cost of sales to finance expense, was $6 and $23 respectively. As at December 31, 2010 the decommissioning liability increased by $19 due to the change in the discount rate from 3.08% to 2.45%.
(k) Deferred income tax assets and liabilities The following summarizes Canadian GAAP to IFRS adjustments to deferred income tax liabilities, increase (decrease):
Ref. December 31, 2010
March 31, 2010
January 1, 2010
$ $ $Property, plant and equipment: - Revaluation net of depreciation f 8,908 9,298 9,426Tax impact on intercompany profits in inventory (94) – –Decommissioning provision j (22) (20) (19)Foreign exchange translation c (10) (11) (10)Total 8,782 9,267 9,397
The above adjustments increased deferred income tax recovery recognized in the statement of comprehensive income by $130 for the three months ended March 31, 2010 and by $615 for the year ended December 31, 2010.
No deferred tax asset was recognized against the deferred tax benefit that would otherwise have been recorded with respect to the impairment of property, plant and equipment pertaining to the company’s Farmersburg, Indiana plant.
Under IFRS, all deferred tax assets and liabilities must be classified as non-current. Under Canadian GAAP, the future income tax asset totaling $917 (January 1, 2010), $892 (March 31, 2010) and Nil (December 31, 2010) were netted against deferred income tax liabilities.
(l) Accumulated other comprehensive loss The following is a summary of transition adjustments to accumulated other comprehensive loss from Canadian GAAP to IFRS:
Ref. 4(v) December 31, 2010
March 31, 2010
January 1, 2010
$ $ $ Accumulated other comprehensive loss as reported under Canadian GAAP (3,829) (3,829) (3,829)
IFRS adjustments increases (decreases): - Cumulative translation adjustment b 3,829 3,829 3,829 - Foreign exchange translation on financial statements c (2,617) (1,528) –
- Cumulative translation adjustment on translation of opening balance sheet as at January 1, 2010 c (2,208) (2,208) (2,208)
- Reclassified to Retained Earnings c 2,208 2,208 2,208
Accumulated other comprehensive loss as reported under IFRS (2,617) (1,528) –
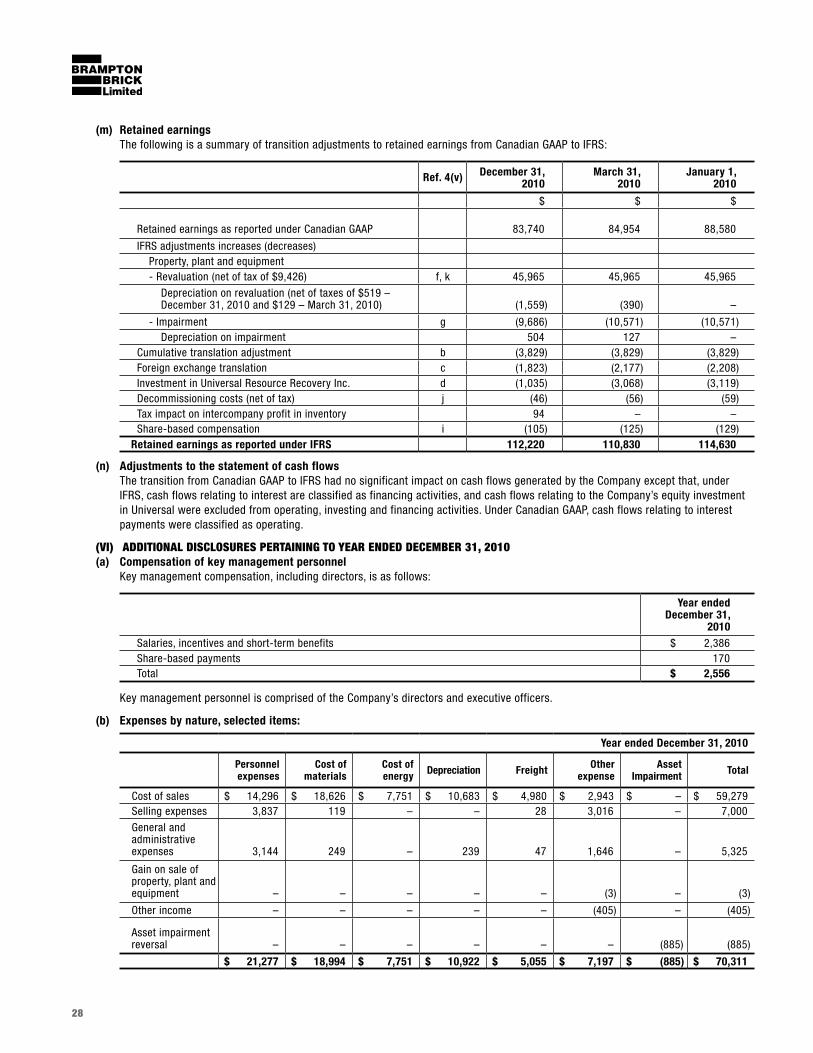
28
(m) Retained earnings The following is a summary of transition adjustments to retained earnings from Canadian GAAP to IFRS:
Ref. 4(v) December 31, 2010
March 31, 2010
January 1, 2010
$ $ $
Retained earnings as reported under Canadian GAAP 83,740 84,954 88,580
IFRS adjustments increases (decreases) Property, plant and equipment - Revaluation (net of tax of $9,426) f, k 45,965 45,965 45,965
Depreciation on revaluation (net of taxes of $519 – December 31, 2010 and $129 – March 31, 2010) (1,559) (390) –
- Impairment g (9,686) (10,571) (10,571) Depreciation on impairment 504 127 –Cumulative translation adjustment b (3,829) (3,829) (3,829)Foreign exchange translation c (1,823) (2,177) (2,208)Investment in Universal Resource Recovery Inc. d (1,035) (3,068) (3,119)Decommissioning costs (net of tax) j (46) (56) (59)Tax impact on intercompany profit in inventory 94 – –Share-based compensation i (105) (125) (129)
Retained earnings as reported under IFRS 112,220 110,830 114,630
(n) Adjustments to the statement of cash flowsThe transition from Canadian GAAP to IFRS had no significant impact on cash flows generated by the Company except that, under IFRS, cash flows relating to interest are classified as financing activities, and cash flows relating to the Company’s equity investment in Universal were excluded from operating, investing and financing activities. Under Canadian GAAP, cash flows relating to interest payments were classified as operating.
(VI) ADDITIONAL DISCLOSURES PERTAINING TO YEAR ENDED DECEMbER 31, 2010(a) Compensation of key management personnel
Key management compensation, including directors, is as follows:
Year ended December 31,
2010Salaries, incentives and short-term benefits $ 2,386Share-based payments 170Total $ 2,556
Key management personnel is comprised of the Company’s directors and executive officers.
(b) Expenses by nature, selected items:
Year ended December 31, 2010
Personnelexpenses
Cost of materials
Cost of energy Depreciation Freight Other
expenseAsset
Impairment Total
Cost of sales $ 14,296 $ 18,626 $ 7,751 $ 10,683 $ 4,980 $ 2,943 $ – $ 59,279Selling expenses 3,837 119 – – 28 3,016 – 7,000
General and administrative expenses 3,144 249 – 239 47 1,646 – 5,325
Gain on sale of property, plant and equipment – – – – – (3) – (3)
Other income – – – – – (405) – (405)
Asset impairment reversal – – – – – – (885) (885)
$ 21,277 $ 18,994 $ 7,751 $ 10,922 $ 5,055 $ 7,197 $ (885) $ 70,311

29
(c) Investment in Universal Resource Recovery Inc.The Company’s share of the assets, liabilities, revenues and loss for its 50% joint venture investment in Universal for the year ended December 31, 2010 is summarized as follows:
Year endedDecember 31,
2010
$Current assets 515Long-term assets 13,051Current liabilities 2,152Long-term liabilities 5,852
Revenues 1,378Loss (805)
The Company’s share of letters of credit issued by Universal’s banker with respect to its operations was $562 at March 31, 2011 (December 31, 2010 – $562). The Company and the joint venture partner have each provided a guarantee in the amount of $6,500 to Universal’s banker as additional security for Universal’s credit facilities.
There are no other known contingencies and commitments of the joint venture and the Company is not responsible for any contingencies or commitments pertaining to the other venturer.
(d) Earnings per share i) Basic
Basic earnings per share is calculated by dividing the net income(loss) attributable to owners of the parent by the weighted average number of Class A and Class B shares outstanding as at December 31, 2010.
Year endedDecember 31,
2010Loss attributable to owners of parent $ 2,410Weighted average number of Class A and Class B shares (in thousands) 10,937Basic loss per share $ 0.22
ii) DilutedDiluted earnings per share is calculated by adjusting the weighted average number of Class A and Class B shares outstanding to assume conversion of all dilutive outstanding stock options. The number of shares outstanding is increased by the number of additional shares that would be issued upon the exercise of “in-the-money” stock options, if dilutive, and is reduced by the number of shares that could be repurchased, at the average market price, with the cash proceeds therefrom.
Year ended December 31,
2010Loss attributable to owners of parent $ 2,410Weighted average number of Class A and Class B shares (in thousands) 10,937Diluted loss per share $ 0.22
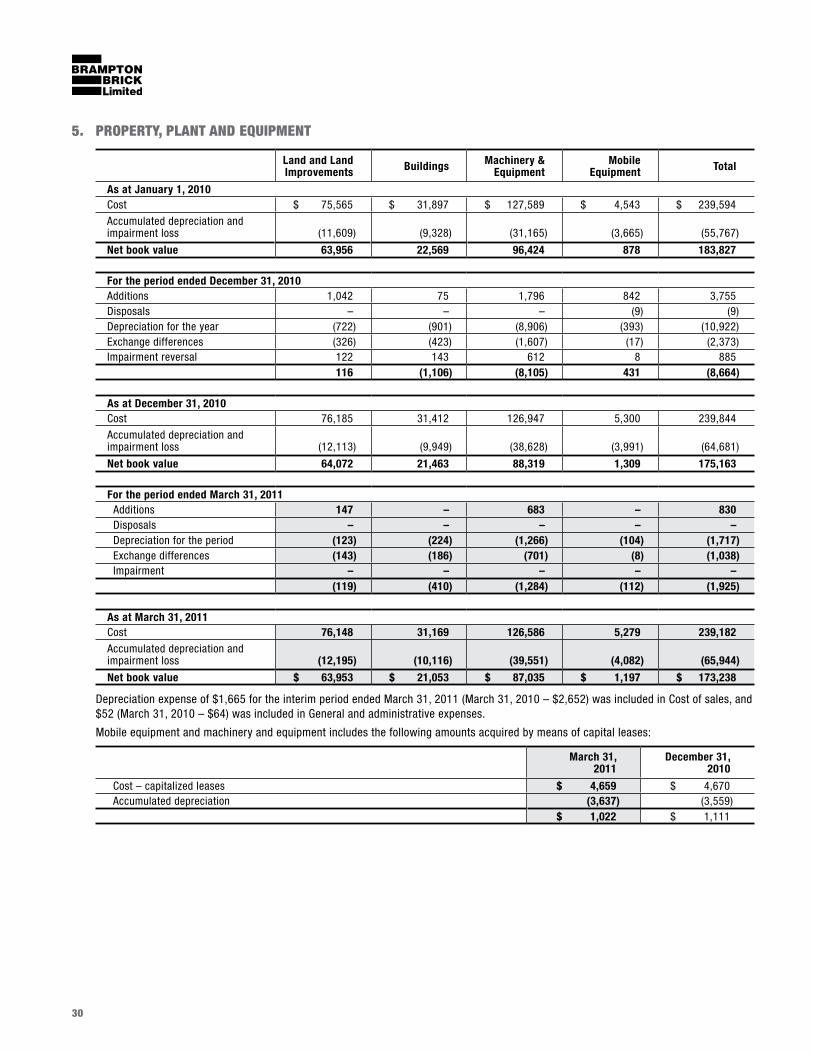
30
5. PROPERTY, PLANT AND EQUIPMENT
Land and Land Improvements Buildings Machinery &
EquipmentMobile
Equipment Total
As at January 1, 2010Cost $ 75,565 $ 31,897 $ 127,589 $ 4,543 $ 239,594
Accumulated depreciation and impairment loss (11,609) (9,328) (31,165) (3,665) (55,767)
Net book value 63,956 22,569 96,424 878 183,827
For the period ended December 31, 2010Additions 1,042 75 1,796 842 3,755Disposals – – – (9) (9)Depreciation for the year (722) (901) (8,906) (393) (10,922)Exchange differences (326) (423) (1,607) (17) (2,373)Impairment reversal 122 143 612 8 885
116 (1,106) (8,105) 431 (8,664)
As at December 31, 2010Cost 76,185 31,412 126,947 5,300 239,844
Accumulated depreciation and impairment loss (12,113) (9,949) (38,628) (3,991) (64,681)
Net book value 64,072 21,463 88,319 1,309 175,163
For the period ended March 31, 2011Additions 147 – 683 – 830Disposals – – – – –Depreciation for the period (123) (224) (1,266) (104) (1,717)Exchange differences (143) (186) (701) (8) (1,038)Impairment – – – – –
(119) (410) (1,284) (112) (1,925)
As at March 31, 2011Cost 76,148 31,169 126,586 5,279 239,182 Accumulated depreciation and impairment loss (12,195) (10,116) (39,551) (4,082) (65,944)
Net book value $ 63,953 $ 21,053 $ 87,035 $ 1,197 $ 173,238
Depreciation expense of $1,665 for the interim period ended March 31, 2011 (March 31, 2010 – $2,652) was included in Cost of sales, and $52 (March 31, 2010 – $64) was included in General and administrative expenses.
Mobile equipment and machinery and equipment includes the following amounts acquired by means of capital leases:
March 31, 2011
December 31, 2010
Cost – capitalized leases $ 4,659 $ 4,670Accumulated depreciation (3,637) (3,559)
$ 1,022 $ 1,111
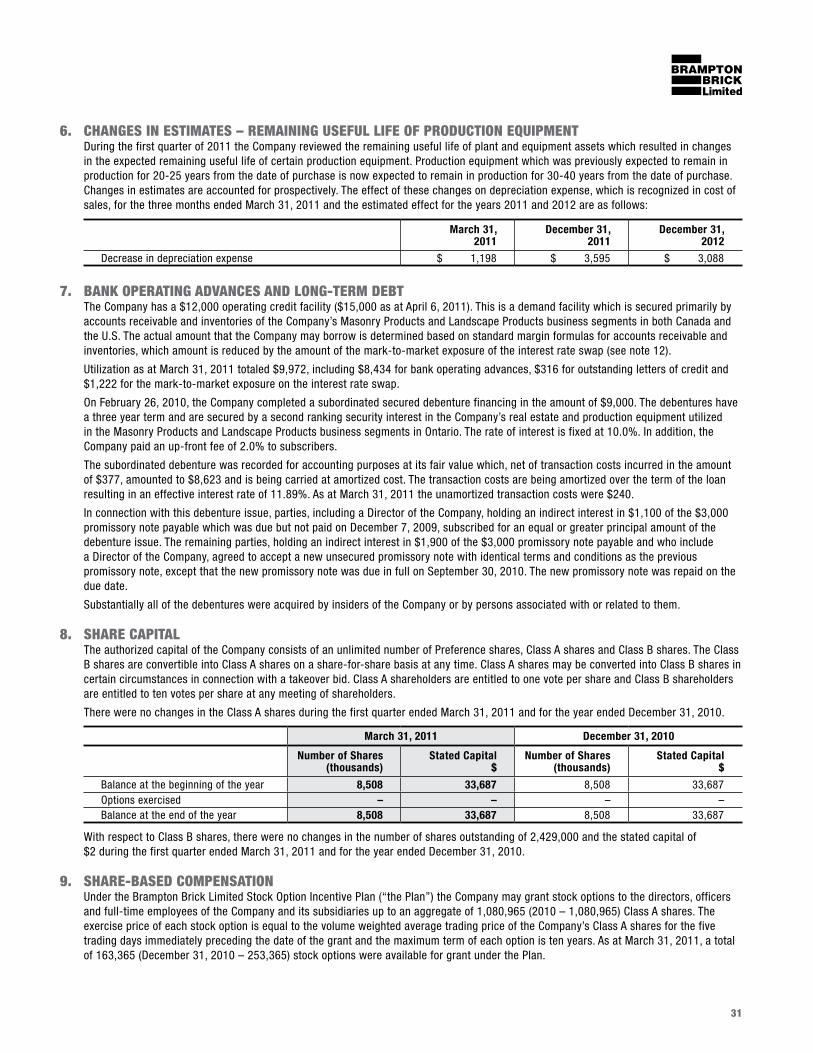
31
6. ChANGES IN ESTIMATES – REMAINING USEFUL LIFE OF PRODUCTION EQUIPMENTDuring the first quarter of 2011 the Company reviewed the remaining useful life of plant and equipment assets which resulted in changes in the expected remaining useful life of certain production equipment. Production equipment which was previously expected to remain in production for 20-25 years from the date of purchase is now expected to remain in production for 30-40 years from the date of purchase. Changes in estimates are accounted for prospectively. The effect of these changes on depreciation expense, which is recognized in cost of sales, for the three months ended March 31, 2011 and the estimated effect for the years 2011 and 2012 are as follows:
March 31, 2011
December 31, 2011
December 31, 2012
Decrease in depreciation expense $ 1,198 $ 3,595 $ 3,088
7. bANK OPERATING ADVANCES AND LONG-TERM DEbTThe Company has a $12,000 operating credit facility ($15,000 as at April 6, 2011). This is a demand facility which is secured primarily by accounts receivable and inventories of the Company’s Masonry Products and Landscape Products business segments in both Canada and the U.S. The actual amount that the Company may borrow is determined based on standard margin formulas for accounts receivable and inventories, which amount is reduced by the amount of the mark-to-market exposure of the interest rate swap (see note 12).
Utilization as at March 31, 2011 totaled $9,972, including $8,434 for bank operating advances, $316 for outstanding letters of credit and $1,222 for the mark-to-market exposure on the interest rate swap.
On February 26, 2010, the Company completed a subordinated secured debenture financing in the amount of $9,000. The debentures have a three year term and are secured by a second ranking security interest in the Company’s real estate and production equipment utilized in the Masonry Products and Landscape Products business segments in Ontario. The rate of interest is fixed at 10.0%. In addition, the Company paid an up-front fee of 2.0% to subscribers.
The subordinated debenture was recorded for accounting purposes at its fair value which, net of transaction costs incurred in the amount of $377, amounted to $8,623 and is being carried at amortized cost. The transaction costs are being amortized over the term of the loan resulting in an effective interest rate of 11.89%. As at March 31, 2011 the unamortized transaction costs were $240.
In connection with this debenture issue, parties, including a Director of the Company, holding an indirect interest in $1,100 of the $3,000 promissory note payable which was due but not paid on December 7, 2009, subscribed for an equal or greater principal amount of the debenture issue. The remaining parties, holding an indirect interest in $1,900 of the $3,000 promissory note payable and who include a Director of the Company, agreed to accept a new unsecured promissory note with identical terms and conditions as the previous promissory note, except that the new promissory note was due in full on September 30, 2010. The new promissory note was repaid on the due date.
Substantially all of the debentures were acquired by insiders of the Company or by persons associated with or related to them.
8. ShARE CAPITALThe authorized capital of the Company consists of an unlimited number of Preference shares, Class A shares and Class B shares. The Class B shares are convertible into Class A shares on a share-for-share basis at any time. Class A shares may be converted into Class B shares in certain circumstances in connection with a takeover bid. Class A shareholders are entitled to one vote per share and Class B shareholders are entitled to ten votes per share at any meeting of shareholders.
There were no changes in the Class A shares during the first quarter ended March 31, 2011 and for the year ended December 31, 2010.
March 31, 2011 December 31, 2010
Number of Shares(thousands)
Stated Capital$
Number of Shares(thousands)
Stated Capital$
Balance at the beginning of the year 8,508 33,687 8,508 33,687 Options exercised – – – –Balance at the end of the year 8,508 33,687 8,508 33,687
With respect to Class B shares, there were no changes in the number of shares outstanding of 2,429,000 and the stated capital of $2 during the first quarter ended March 31, 2011 and for the year ended December 31, 2010.
9. ShARE-bASED COMPENSATIONUnder the Brampton Brick Limited Stock Option Incentive Plan (“the Plan”) the Company may grant stock options to the directors, officers and full-time employees of the Company and its subsidiaries up to an aggregate of 1,080,965 (2010 – 1,080,965) Class A shares. The exercise price of each stock option is equal to the volume weighted average trading price of the Company’s Class A shares for the five trading days immediately preceding the date of the grant and the maximum term of each option is ten years. As at March 31, 2011, a total of 163,365 (December 31, 2010 – 253,365) stock options were available for grant under the Plan.
32
On March 23, 2011, the Company granted stock options to eight senior executive officers and to all non-management members of the Board of Directors of the Company to acquire an aggregate of 90,000 Class A shares at the market price of $5.10 per share. Each option vested 20% on the date immediately following the date of the grant and an additional 20% shall vest on each anniversary thereof until fully vested. As of the date of the grant, the fair value of each stock option granted was estimated to be $1.05, using the Black-Scholes option pricing model with the following assumptions:
Risk-free interest rate 2.89%Expected life 7.9 yearsVolatility (determined by reference to historically observed prices of the Class A shares) 28%Expected dividend yield 3.9%Expected forfeitures NIL
The total compensation cost charged against income for the quarter ended March 31, 2011 with respect to all stock options granted after January 1, 2002 was $57 (2010 – $72). The Company did not record compensation cost with respect to stock options granted prior to January 1, 2002, of which 7,500 options remain outstanding at March 31, 2011.
At March 31, 2011, an aggregate of 690,900 stock options were outstanding, of which 455,900 were fully vested and exercisable by the holders thereof at a weighted average exercise price of $10.74 per share.
10. INCOME TAxThe Company computes an income tax provision in each of the jurisdictions in which it operates. However, actual amounts of income tax expense only become final upon filing and acceptance of the tax return by the relevant authorities, which occur subsequent to the issuance of the financial statements. Additionally, estimation of income taxes includes evaluating the recoverability of deferred tax assets based on an assessment of the ability to use the underlying future tax deductions before they expire against future taxable income. The assessment is based upon existing tax laws and estimates of future taxable income. To the extent estimates differ from the final tax return, earnings would be affected in a subsequent period.
In interim periods, the income tax provision is based on actual earnings by jurisdiction. The Company’s consolidated effective tax rate for the period ending March 31, 2011 was 14.8% (March 31, 2010 – 12.4%).
11. EARNINGS PER ShARE Loss per share is calculated on losses attributable to the parent using the weighted average number of shares outstanding for the period. As referred to in Note 3, the diluted loss per share is calculated to reflect the dilutive effect of the exercise of the outstanding stock options on loss per share.
The weighted average number of Class A and Class B shares outstanding utilized in the calculations of loss per share is as follows:
March 31, 2011 March 31, 2010
Loss $
Shares(thousands)
Per share Amount $
Loss $
Shares(thousands)
Per share Amount $
Basic loss per share 4,425 10,937 0.40 3,800 10,937 0.35Dilutive effect of options(i) – 0.00 – 0.00Diluted loss per share 10,937 0.40 10,937 0.35
(i) Excludes the effect of 488,400 options (March 31, 2010 – 376,544) to purchase Class A shares that are anti-dilutive.
12. DERIVATIVE FINANCIAL INSTRUMENTS In July 2007, the Company entered into an interest rate swap contract to hedge the risk arising from variability of cash flows related to anticipated borrowings under its term bank facility. The swap commenced in January 2008 with a notional principal amount of $3,000, increasing to $20,000 by September 2008. The notional principal amount reduces by $3,000 per year from December 2010 to December 2013 and by $8,000 in December 2014. The fixed rate under the swap contract is 5.16%.
On June 29, 2009, the Company entered into a new fixed-rate term financing agreement and repaid its term bank loan. The repayment of the term bank loan resulted in the interest rate swap contract no longer being an effective cash flow hedge. Consequently, changes in the fair value of the interest rate swap are reflected in the consolidated statement of comprehensive income. As at March 31, 2011 the fair value of the interest rate swap was a liability of $1,222 of which $583 (December 31, 2010 – $604) and $639 (December 31, 2010 – $828) have been classified as current and non-current derivative financial liabilities, respectively.
33
13. OPERATING SEGMENT DISCLOSURESFor purposes of operating decision making and assessing performance, management considers that the Company operates within two dominant business segments; Masonry Products and Landscape Products.
A brief description of each business segment is as follows:
Masonry Products – manufacture of clay brick and a range of concrete masonry products including stone veneer, window sills and concrete brick for use in residential construction and institutional, commercial and industrial building projects.
Landscape Products – manufacture of concrete paving stones, retaining walls, garden walls, and sales of accessory products for use in residential construction and institutional, commercial and industrial building projects.
Segmented information, with comparative information for 2010, is as follows:
Three months ended March 31
2011 2010
i) Revenues $ $
Masonry Products 9,740 11,433 Landscape Products 876 711
Consolidated revenues 10,616 12,144
ii) Operating loss
Masonry Products (996) (112) Landscape Products (2,565) (2,804)
Consolidated operating loss (3,561) (2,916) Finance costs (919) (824) Finance income 2 17 Share of loss from investment in Universal Resource Recovery Inc. (714) (600) Income taxes 767 538
Consolidated loss (4,425) (3,785)
March 31, 2011 December 31, 2010
iii) Total assets $ $
Masonry and Landscape Products 211,765 209,841 Other 6,998 6,738
Consolidated total assets 218,763 216,579
Certain long-term assets are used for both the Masonry Products and Landscape Products business segments. Assets do not form part of management’s evaluation of performance of individual business units and therefore are not reported on a segmented basis.
Geographical information is as follows:
Three months ended March 31
2011 Revenues
$
2010 Revenues
$
March 31, 2011 Property, plant and equipment
$
March 31, 2010 Property, plant and equipment
$
Canada 10,102 11,446 126,600 130,238United States 514 698 46,638 50,058
10,616 12,144 173,238 180,296
34
14. COMMITMENTS AND CONTINGENCIESAs at March 31, 2011, the Company had commitments with suppliers to purchase production equipment totaling $1,008.
The Company normally enters into supply and transportation contracts for natural gas to cover future requirements. As at March 31, 2011, the Company has contracted for most of the balance of its estimated 2011 natural gas supply requirements at an aggregate estimated cost of $1,835, none of which was at fixed prices, and for most of the balance of its estimated 2011 transportation requirements at an aggregate estimated cost of $588, of which 70% was at fixed prices. The potential unrealized loss on the fixed price contracts was approximately $70 (2010 – unrealized loss of $52), which was not taken to income since these are supply contracts that will be charged to operations in the period the gas is consumed.
Letters of credit are issued by the Company’s banker to provide security to certain service providers and in connection with certain governmental operating permits. The aggregate amount of letters of credit outstanding as at March 31, 2011 was $316 (December 31, 2010 – $323).
Commitments of Universal are disclosed in note 4(vi)(c).
15. RELATED PARTY TRANSACTIONSThe Company has determined which of its customers are related to the Company via common directors or shareholders. Sales to these customers are made under competitive terms and conditions. These customers accounted for 6.8% (2010 – 10.8%) of net sales in aggregate for the quarter ended March 31, 2011. Purchases from related parties amounted to $53 for the three month period ended March 31, 2011 (2010 – $113).
Other related party transactions have been described in note 7.
16. SEASONAL FLUCTUATIONSThe Company’s business is seasonal. Historically, sales are greater in the second and third quarters of each year than in the first and fourth quarters. The Landscape Products business segment is affected to a greater degree than the Masonry Products business segment. Consequently, the results of operations and cash flows for the three month period ended March 31, 2011 are not necessarily indicative of the results to be expected for the full year.

225 Wanless DriveBrampton, ONL7A 1E9www.bramptonbrick.com