Embed Size (px)
Citation preview
2011 Employee Job Satisfaction and EngagementGratification and Commitment at Work in a Sluggish Economy
A R e s e a r c h R e p o r t b y t h e S o c i e t y f o r H u m a n R e s o u r c e M a n a g e m e n t ( S H R M )
About SHRMThe Society for Human Resource Management (SHRM) is the world’s largest association devoted to human resource management. Representing more than 250,000 members in over 140 countries, the Society serves the needs of HR professionals and advances the interests of the HR profes-sion. Founded in 1948, SHRM has more than 575 affiliated chapters within the United States and subsidiary offices in China and India. Visit SHRM Online at www.shrm.org.
Media ContactsKate [email protected]+ 1-703-535-6260
Julie [email protected]+ 1-703-535-6273
USASHRM1800 Duke StreetAlexandria, VA 22314Phone: + 1-800-283-7476Fax: + 1-703-535-6490 E-mail: [email protected]
ChinaBeijing Representative OfficeSHRM Corporation5/F, South Block, Tower CRaycom Info Tech Park No.2, Kexueyuan South RoadZhongguancun, Haidian DistrictBeijing, 100190ChinaTel: +86-10-59822093 / 59822146Fax: +86-10-59822588
IndiaSHRM India702, 7th Floor Raheja Towers Plot C- 62, G BlockBandra Kurla Complex, Bandra (E)Mumbai 400051Maharashtra Tel: +91-22-42472000Fax: +91-22-42472010
SHRM Online: www.shrm.orgSHRM Research: www.shrm.org/researchSHRM Survey Findings: www.shrm.org/surveys
To order printed copies of this report: visit www.shrmstore.shrm.org or call 1-800-444-5006.
11-0618
2011 Employee Job Satisfaction and Engagement | iii
Table of Contents
About This Research Report ������������������������������������������������������������������������� 1
Executive Summary: Employees Are Satisfied With Their Jobs and Moderately Engaged ��������������������������������������������������������������������������������������2
Survey Results: Employee Job Satisfaction ��������������������������������������������������8
Career Development �������������������������������������������������������������������������������������������������������9Opportunities to Use Skills and Abilities ����������������������������������������������������������������9Career Advancement Opportunities �����������������������������������������������������������������������10Organization’s Commitment to Professional Development ��������������������������������10Job-Specific Training ��������������������������������������������������������������������������������������������������11Career Development Opportunities ������������������������������������������������������������������������12Networking ������������������������������������������������������������������������������������������������������������������12Paid Training and Tuition Reimbursement Programs�����������������������������������������13
Employee Relationship With Management��������������������������������������������������������������� 14Relationship With Immediate Supervisor ������������������������������������������������������������� 14Communication Between Employees and Senior Management ������������������������ 15Autonomy and Independence ����������������������������������������������������������������������������������� 15Management’s Recognition of Employee Job Performance �������������������������������� 16
Compensation and Benefits ���������������������������������������������������������������������������������������� 20Compensation/Pay ���������������������������������������������������������������������������������������������������� 20Benefits ������������������������������������������������������������������������������������������������������������������������ 22Flexibility to Balance Life and Work Issues ���������������������������������������������������������� 23
Work Environment �������������������������������������������������������������������������������������������������������27Job Security �����������������������������������������������������������������������������������������������������������������27Organization’s Financial Stability �������������������������������������������������������������������������� 28The Work Itself ����������������������������������������������������������������������������������������������������������� 28Feeling Safe in the Work Environment ������������������������������������������������������������������ 29Overall Corporate Culture ��������������������������������������������������������������������������������������� 29Relationships With Co-Workers ����������������������������������������������������������������������������� 30Meaningfulness of the Job ��������������������������������������������������������������������������������������� 30Contribution of Work to the Organization’s Business Goals �������������������������������31Variety of Work ���������������������������������������������������������������������������������������������������������� 32Organization’s Commitment to Corporate Social Responsibility ��������������������� 32Organization’s Commitment to a Diverse and Inclusive Workplace ���������������� 33Organization’s Commitment to a “Green” Workplace ����������������������������������������� 33
2011 Employee Job Satisfaction and EngagementA Research Report by the Society for Human Resource Management (SHRM)
iv | 2011 Employee Job Satisfaction and Engagement
Survey Results: Employee Engagement ������������������������������������������������������36Engagement Opinions �����������������������������������������������������������������������������������������������37Engagement Behaviors ��������������������������������������������������������������������������������������������� 38Conditions for Engagement ������������������������������������������������������������������������������������� 39Overall Employee Engagement ������������������������������������������������������������������������������� 39
Conclusions: What Can HR Professionals and Employers Do? ������������������42
About the Research ������������������������������������������������������������������������������������ 44Methodology ��������������������������������������������������������������������������������������������������������������� 44Notations ��������������������������������������������������������������������������������������������������������������������� 44About the Respondents ��������������������������������������������������������������������������������������������� 46
Appendix �����������������������������������������������������������������������������������������������������48
Endnotes ����������������������������������������������������������������������������������������������������� 61
Additional SHRM Resources ����������������������������������������������������������������������62
2011 Employee Job Satisfaction and Engagement | 1
The following report presents the results of the 2011 Society for Human Re-source Management (SHRM) Employee Job Satisfaction and Engagement survey of U�S� employees� The objective of this annual survey is to identify and under-stand the factors important to overall employee job satisfaction and engagement� This knowledge helps organizations better understand and appreciate employee preferences when developing programs and policies designated to influence these areas� The survey explored 35 aspects of employee job satisfaction, divided into four topic areas—career development, relationship with management, compensation and benefits, and work environment� New this year, the survey was expanded to include multiple aspects of employee engagement� SHRM has conducted the Job Satisfaction Survey since 2002�
The overall results, illustrated in figures, are included throughout the report with the corresponding text� The more in-depth analyses are listed in tables in the Appendix; these include the following:
• A comparison of the level of importance of certain aspects to job satisfaction as indicated by employees, including statistically significant differences�
• Overall results for every year the survey was conducted compared with the 2011 findings to determine if there have been significant changes in the span of almost a decade�
• A comparison of the level of satisfaction with certain aspects of job satisfac-tion, as indicated by employees�
• Analysis based on employees’ organization staff size�
• Additional analyses by employee job tenure, gender, race and age�
• An analysis of the top five job satisfaction aspects by demographic variables, including organization size, employee job tenure, age, job level and gender�
About This Research Report

Executive Summary
2011 Employee Job Satisfaction and Engagement | 3
Employees 67 years and older were more likely to report being very satisfied overall compared with employees in the 31-to-61 age group.
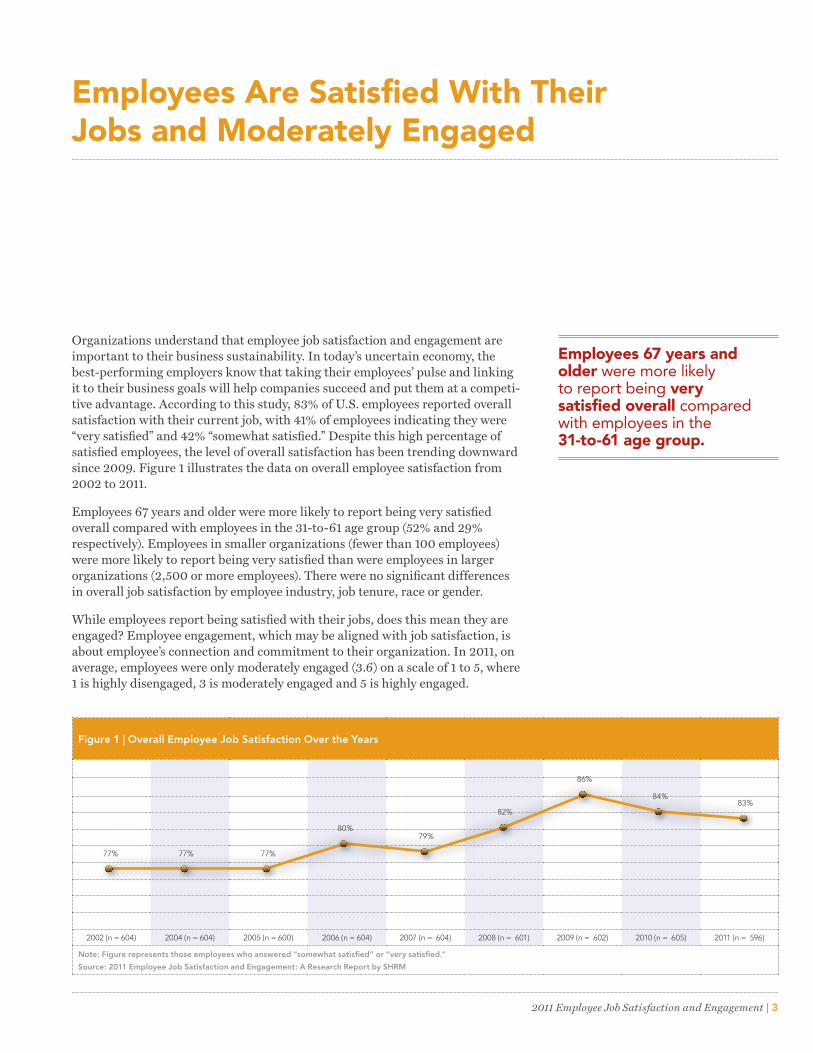
Organizations understand that employee job satisfaction and engagement are important to their business sustainability� In today’s uncertain economy, the best-performing employers know that taking their employees’ pulse and linking it to their business goals will help companies succeed and put them at a competi-tive advantage� According to this study, 83% of U�S� employees reported overall satisfaction with their current job, with 41% of employees indicating they were “very satisfied” and 42% “somewhat satisfied�” Despite this high percentage of satisfied employees, the level of overall satisfaction has been trending downward since 2009� Figure 1 illustrates the data on overall employee satisfaction from 2002 to 2011�
Employees 67 years and older were more likely to report being very satisfied overall compared with employees in the 31-to-61 age group (52% and 29% respectively)� Employees in smaller organizations (fewer than 100 employees) were more likely to report being very satisfied than were employees in larger organizations (2,500 or more employees)� There were no significant differences in overall job satisfaction by employee industry, job tenure, race or gender�
While employees report being satisfied with their jobs, does this mean they are engaged? Employee engagement, which may be aligned with job satisfaction, is about employee’s connection and commitment to their organization� In 2011, on average, employees were only moderately engaged (3�6) on a scale of 1 to 5, where 1 is highly disengaged, 3 is moderately engaged and 5 is highly engaged�
Employees Are Satisfied With Their Jobs and Moderately Engaged
Figure 1 | Overall Employee Job Satisfaction Over the Years
2002 (n = 604) 2004 (n = 604) 2005 (n = 600) 2006 (n = 604) 2007 (n = 604) 2008 (n = 601) 2009 (n = 602) 2010 (n = 605) 2011 (n = 596)
Note: Figure represents those employees who answered “somewhat satisfied” or “very satisfied.”
Source: 2011 Employee Job Satisfaction and Engagement: A Research Report by SHRM
77% 77% 77%
80%
82%
86%
84%83%
79%
4 | 2011 Employee Job Satisfaction and Engagement
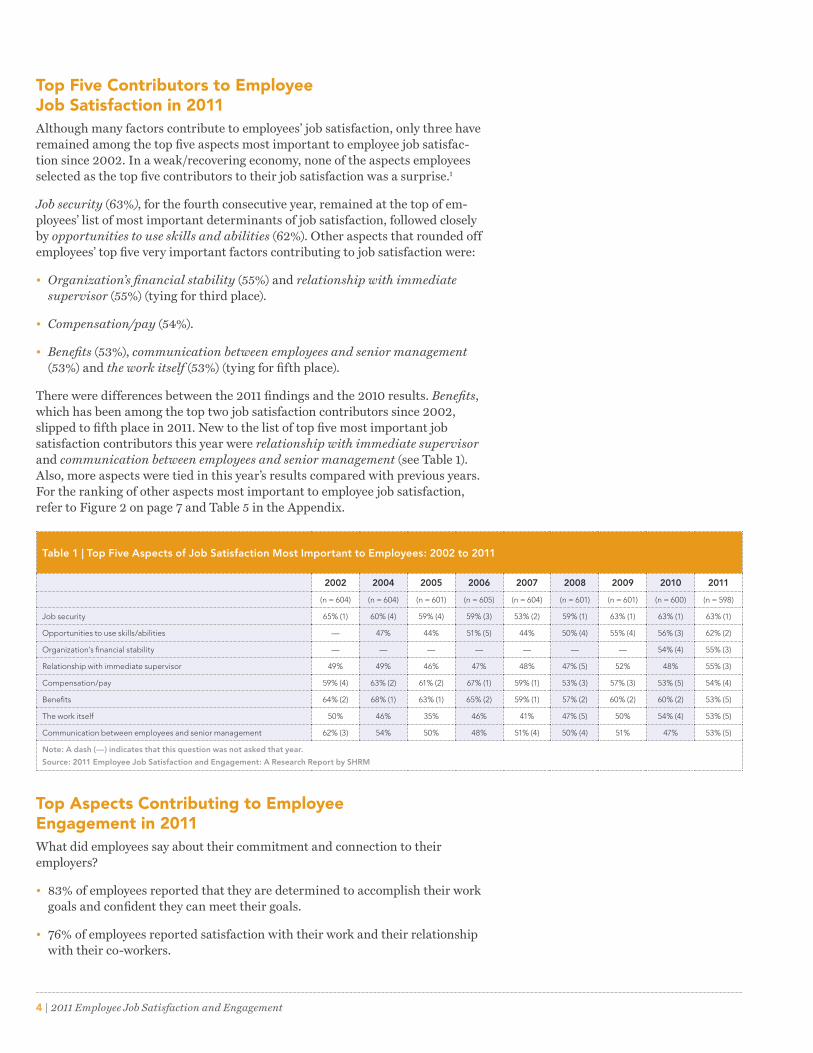
Top Five Contributors to Employee Job Satisfaction in 2011Although many factors contribute to employees’ job satisfaction, only three have remained among the top five aspects most important to employee job satisfac-tion since 2002� In a weak/recovering economy, none of the aspects employees selected as the top five contributors to their job satisfaction was a surprise�1
Job security (63%), for the fourth consecutive year, remained at the top of em-ployees’ list of most important determinants of job satisfaction, followed closely by opportunities to use skills and abilities (62%)� Other aspects that rounded off employees’ top five very important factors contributing to job satisfaction were:
• Organization’s financial stability (55%) and relationship with immediate supervisor (55%) (tying for third place)�
• Compensation/pay (54%)�
• Benefits (53%), communication between employees and senior management (53%) and the work itself (53%) (tying for fifth place)�
There were differences between the 2011 findings and the 2010 results� Benefits, which has been among the top two job satisfaction contributors since 2002, slipped to fifth place in 2011� New to the list of top five most important job satisfaction contributors this year were relationship with immediate supervisor and communication between employees and senior management (see Table 1)� Also, more aspects were tied in this year’s results compared with previous years� For the ranking of other aspects most important to employee job satisfaction, refer to Figure 2 on page 7 and Table 5 in the Appendix�
Top Aspects Contributing to Employee Engagement in 2011 What did employees say about their commitment and connection to their employers?
• 83% of employees reported that they are determined to accomplish their work goals and confident they can meet their goals�
• 76% of employees reported satisfaction with their work and their relationship with their co-workers�
Table 1 | Top Five Aspects of Job Satisfaction Most Important to Employees: 2002 to 2011
2002 2004 2005 2006 2007 2008 2009 2010 2011
(n = 604) (n = 604) (n = 601) (n = 605) (n = 604) (n = 601) (n = 601) (n = 600) (n = 598)
Job security 65% (1) 60% (4) 59% (4) 59% (3) 53% (2) 59% (1) 63% (1) 63% (1) 63% (1)
Opportunities to use skills/abilities — 47% 44% 51% (5) 44% 50% (4) 55% (4) 56% (3) 62% (2)
Organization’s financial stability — — — — — — — 54% (4) 55% (3)
Relationship with immediate supervisor 49% 49% 46% 47% 48% 47% (5) 52% 48% 55% (3)
Compensation/pay 59% (4) 63% (2) 61% (2) 67% (1) 59% (1) 53% (3) 57% (3) 53% (5) 54% (4)
Benefits 64% (2) 68% (1) 63% (1) 65% (2) 59% (1) 57% (2) 60% (2) 60% (2) 53% (5)
The work itself 50% 46% 35% 46% 41% 47% (5) 50% 54% (4) 53% (5)
Communication between employees and senior management 62% (3) 54% 50% 48% 51% (4) 50% (4) 51% 47% 53% (5)
Note: A dash (—) indicates that this question was not asked that year.
Source: 2011 Employee Job Satisfaction and Engagement: A Research Report by SHRM
2011 Employee Job Satisfaction and Engagement | 5
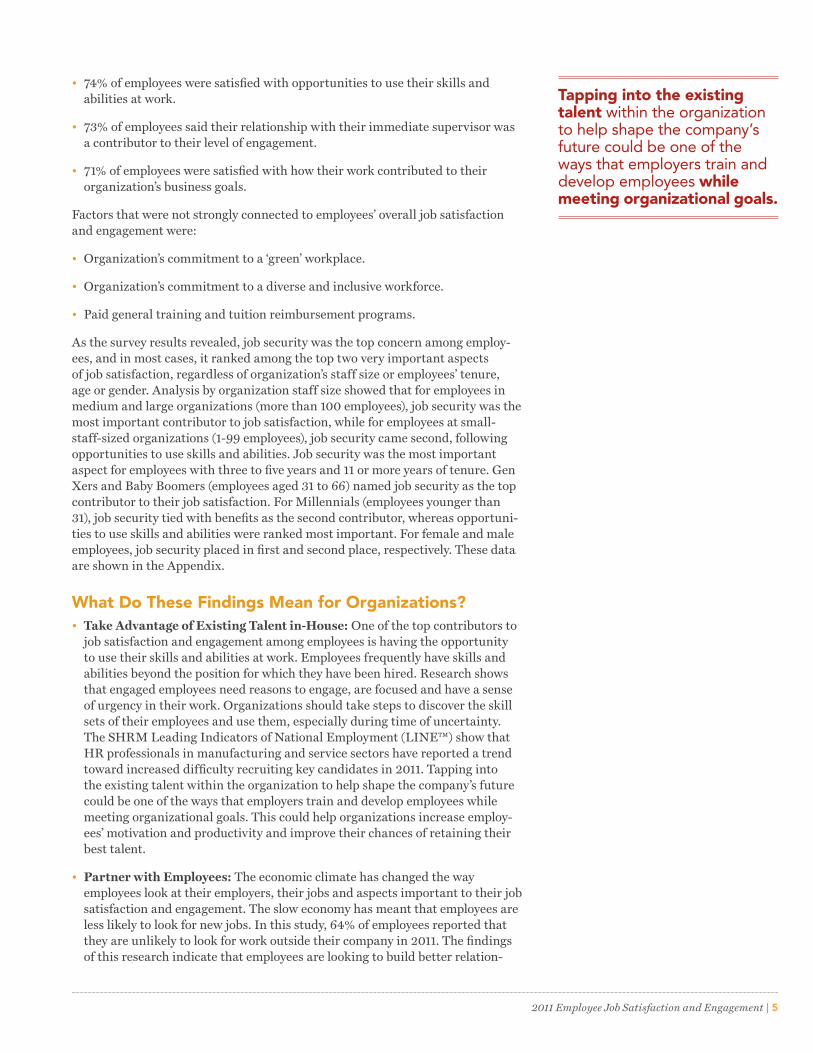
Tapping into the existing talent within the organization to help shape the company’s future could be one of the ways that employers train and develop employees while meeting organizational goals.
• 74% of employees were satisfied with opportunities to use their skills and abilities at work�
• 73% of employees said their relationship with their immediate supervisor was a contributor to their level of engagement�
• 71% of employees were satisfied with how their work contributed to their organization’s business goals�
Factors that were not strongly connected to employees’ overall job satisfaction and engagement were:
• Organization’s commitment to a ‘green’ workplace�
• Organization’s commitment to a diverse and inclusive workforce�
• Paid general training and tuition reimbursement programs�
As the survey results revealed, job security was the top concern among employ-ees, and in most cases, it ranked among the top two very important aspects of job satisfaction, regardless of organization’s staff size or employees’ tenure, age or gender� Analysis by organization staff size showed that for employees in medium and large organizations (more than 100 employees), job security was the most important contributor to job satisfaction, while for employees at small-staff-sized organizations (1-99 employees), job security came second, following opportunities to use skills and abilities� Job security was the most important aspect for employees with three to five years and 11 or more years of tenure� Gen Xers and Baby Boomers (employees aged 31 to 66) named job security as the top contributor to their job satisfaction� For Millennials (employees younger than 31), job security tied with benefits as the second contributor, whereas opportuni-ties to use skills and abilities were ranked most important� For female and male employees, job security placed in first and second place, respectively� These data are shown in the Appendix�
What Do These Findings Mean for Organizations?• Take Advantage of Existing Talent in-House: One of the top contributors to
job satisfaction and engagement among employees is having the opportunity to use their skills and abilities at work� Employees frequently have skills and abilities beyond the position for which they have been hired� Research shows that engaged employees need reasons to engage, are focused and have a sense of urgency in their work� Organizations should take steps to discover the skill sets of their employees and use them, especially during time of uncertainty� The SHRM Leading Indicators of National Employment (LINE™) show that HR professionals in manufacturing and service sectors have reported a trend toward increased difficulty recruiting key candidates in 2011� Tapping into the existing talent within the organization to help shape the company’s future could be one of the ways that employers train and develop employees while meeting organizational goals� This could help organizations increase employ-ees’ motivation and productivity and improve their chances of retaining their best talent�
• Partner with Employees: The economic climate has changed the way employees look at their employers, their jobs and aspects important to their job satisfaction and engagement� The slow economy has meant that employees are less likely to look for new jobs� In this study, 64% of employees reported that they are unlikely to look for work outside their company in 2011� The findings of this research indicate that employees are looking to build better relation-
6 | 2011 Employee Job Satisfaction and Engagement
ships with their organizations’ management� Two of the top five contributors to employees’ job satisfaction were relationship with immediate supervisor and communication between employees and senior management� The relation-ship with immediate supervisor was also a strong condition for employee engagement� Employers will benefit from partnering with employees because it will increase trust, connection and commitment within the organization�
• Set Clear Direction: After recent years of economic and organizational uncertainty, there may be a disconnect between management and employees� Clear direction set by the leaders of the organization and HR will help employ-ees understand what lies ahead� Communicating effectively with employees can provide the workforce with direction, dispel rumors and promote trust� Organizations might consider upward communication such as gathering feedback from employees through focus groups led by their peers� Employers will need to take the results of their dialogue with employees and translate them into measurable actions that fit into their organization’s strategic plan� These actions will need to have both short-term and long-term results� HR professionals are well positioned to help their organizations navigate through these changes�
2011 Employee Job Satisfaction and Engagement | 7
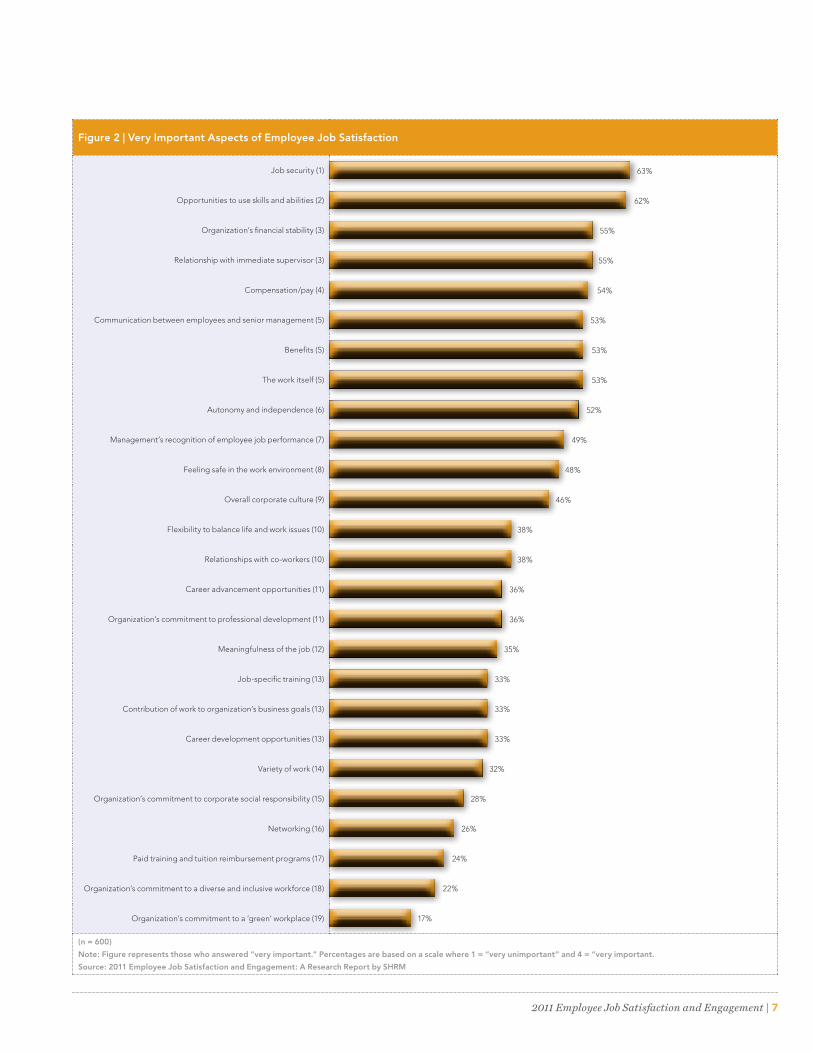
Figure 2 | Very Important Aspects of Employee Job Satisfaction
Job security (1)
Opportunities to use skills and abilities (2)
Organization’s financial stability (3)
Relationship with immediate supervisor (3)
Compensation/pay (4)
Communication between employees and senior management (5)
Benefits (5)
The work itself (5)
Autonomy and independence (6)
Management’s recognition of employee job performance (7)
Feeling safe in the work environment (8)
Overall corporate culture (9)
Flexibility to balance life and work issues (10)
Relationships with co-workers (10)
Career advancement opportunities (11)
Organization’s commitment to professional development (11)
Meaningfulness of the job (12)
Job-specific training (13)
Contribution of work to organization’s business goals (13)
Career development opportunities (13)
Variety of work (14)
Organization’s commitment to corporate social responsibility (15)
Networking (16)
Paid training and tuition reimbursement programs (17)
Organization’s commitment to a diverse and inclusive workforce (18)
Organization’s commitment to a ‘green’ workplace (19)
(n = 600)
Note: Figure represents those who answered “very important.” Percentages are based on a scale where 1 = “very unimportant” and 4 = “very important.
Source: 2011 Employee Job Satisfaction and Engagement: A Research Report by SHRM
63%
62%
55%
55%
54%
53%
53%
53%
52%
49%
48%
46%
38%
38%
36%
36%
35%
33%
33%
33%
32%
28%
26%
24%
22%
17%

Survey Results: Employee Job Satisfaction
2011 Employee Job Satisfaction and Engagement | 9
Employees rated only one of the factors in the career development category—opportunities to use skills and abilities—in the top five very important contributors to job satisfaction.
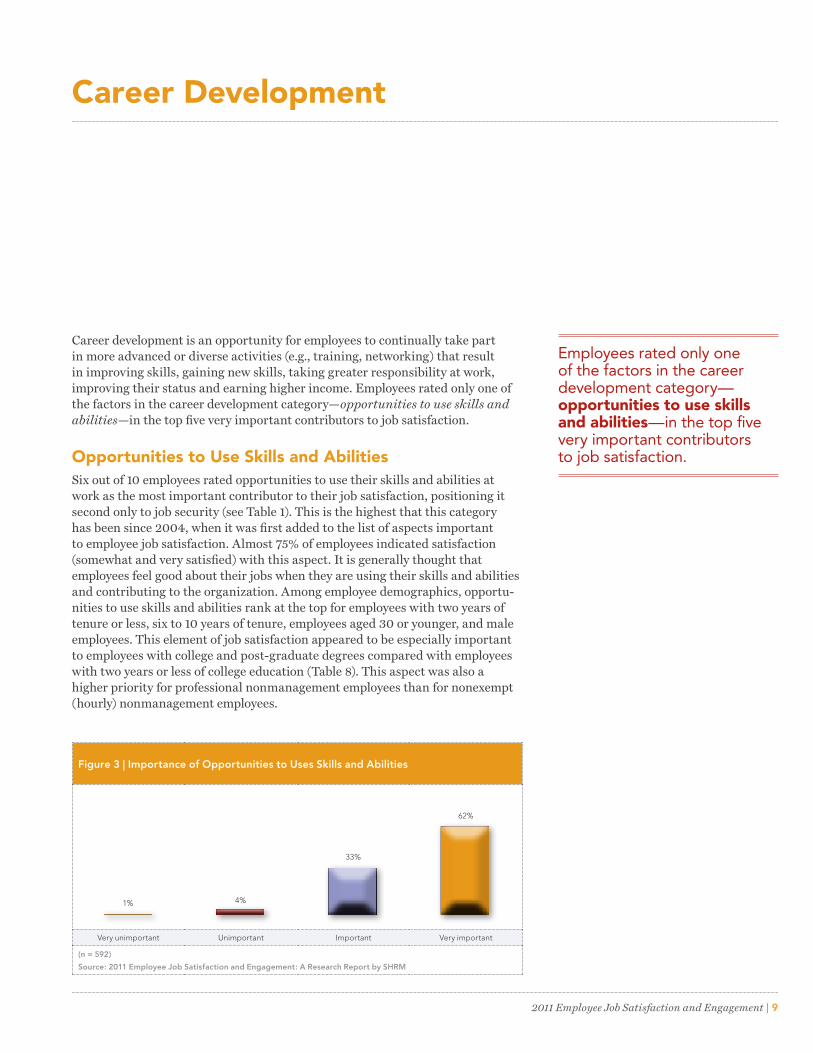
Career development is an opportunity for employees to continually take part in more advanced or diverse activities (e�g�, training, networking) that result in improving skills, gaining new skills, taking greater responsibility at work, improving their status and earning higher income� Employees rated only one of the factors in the career development category—opportunities to use skills and abilities—in the top five very important contributors to job satisfaction�
Opportunities to Use Skills and AbilitiesSix out of 10 employees rated opportunities to use their skills and abilities at work as the most important contributor to their job satisfaction, positioning it second only to job security (see Table 1)� This is the highest that this category has been since 2004, when it was first added to the list of aspects important to employee job satisfaction� Almost 75% of employees indicated satisfaction (somewhat and very satisfied) with this aspect� It is generally thought that employees feel good about their jobs when they are using their skills and abilities and contributing to the organization� Among employee demographics, opportu-nities to use skills and abilities rank at the top for employees with two years of tenure or less, six to 10 years of tenure, employees aged 30 or younger, and male employees� This element of job satisfaction appeared to be especially important to employees with college and post-graduate degrees compared with employees with two years or less of college education (Table 8)� This aspect was also a higher priority for professional nonmanagement employees than for nonexempt (hourly) nonmanagement employees�
Career Development
Figure 3 | Importance of Opportunities to Uses Skills and Abilities
Very unimportant Unimportant Important Very important
(n = 592)
Source: 2011 Employee Job Satisfaction and Engagement: A Research Report by SHRM
1%
33%
4%
62%
10 | 2011 Employee Job Satisfaction and Engagement
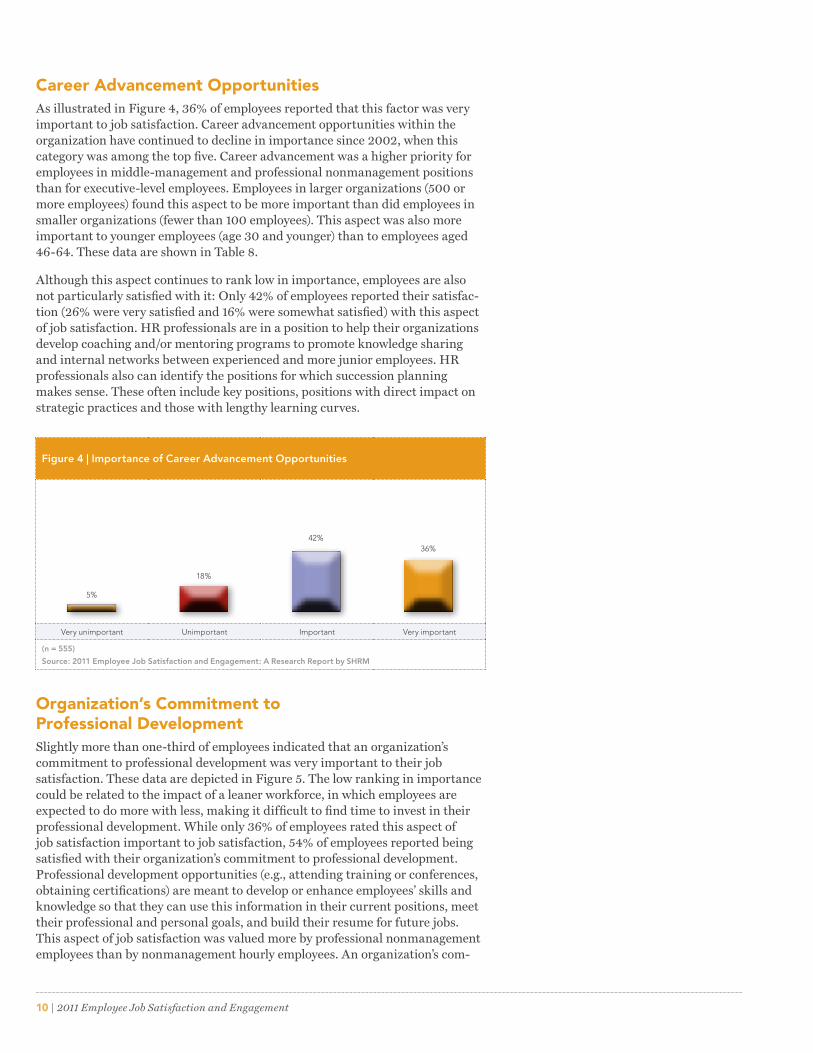
Career Advancement OpportunitiesAs illustrated in Figure 4, 36% of employees reported that this factor was very important to job satisfaction� Career advancement opportunities within the organization have continued to decline in importance since 2002, when this category was among the top five� Career advancement was a higher priority for employees in middle-management and professional nonmanagement positions than for executive-level employees� Employees in larger organizations (500 or more employees) found this aspect to be more important than did employees in smaller organizations (fewer than 100 employees)� This aspect was also more important to younger employees (age 30 and younger) than to employees aged 46-64� These data are shown in Table 8�
Although this aspect continues to rank low in importance, employees are also not particularly satisfied with it: Only 42% of employees reported their satisfac-tion (26% were very satisfied and 16% were somewhat satisfied) with this aspect of job satisfaction� HR professionals are in a position to help their organizations develop coaching and/or mentoring programs to promote knowledge sharing and internal networks between experienced and more junior employees� HR professionals also can identify the positions for which succession planning makes sense� These often include key positions, positions with direct impact on strategic practices and those with lengthy learning curves�
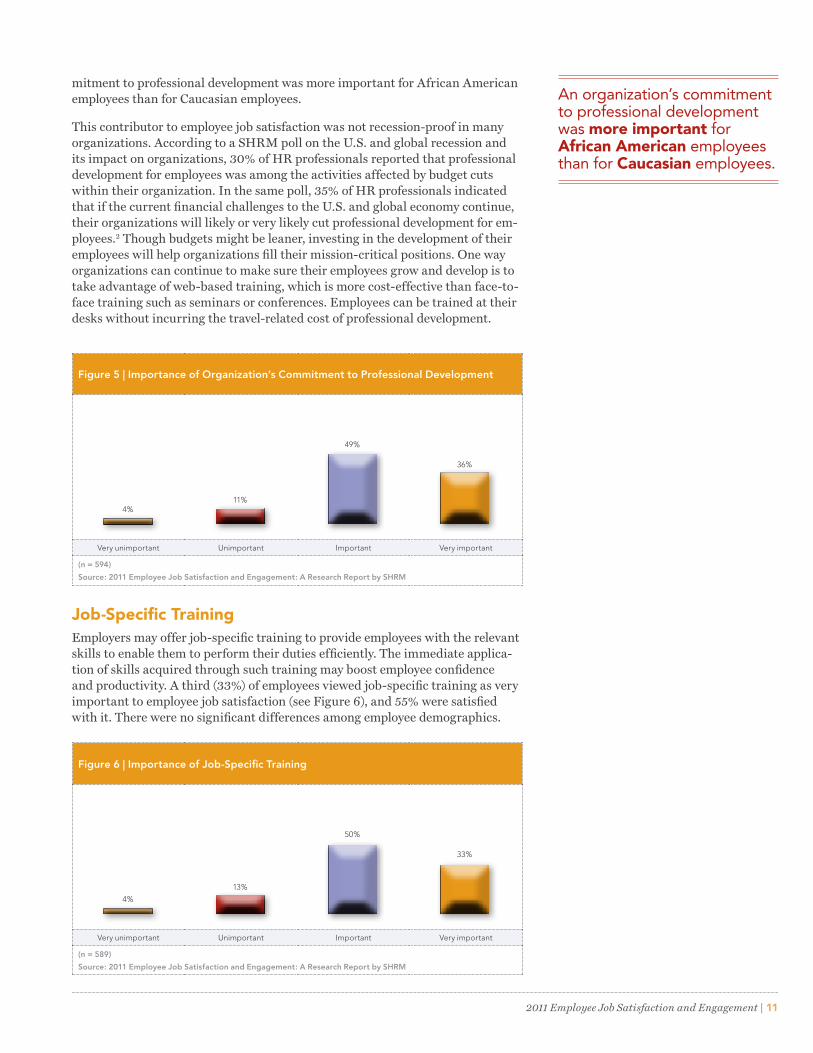
Organization’s Commitment to Professional DevelopmentSlightly more than one-third of employees indicated that an organization’s commitment to professional development was very important to their job satisfaction� These data are depicted in Figure 5� The low ranking in importance could be related to the impact of a leaner workforce, in which employees are expected to do more with less, making it difficult to find time to invest in their professional development� While only 36% of employees rated this aspect of job satisfaction important to job satisfaction, 54% of employees reported being satisfied with their organization’s commitment to professional development� Professional development opportunities (e�g�, attending training or conferences, obtaining certifications) are meant to develop or enhance employees’ skills and knowledge so that they can use this information in their current positions, meet their professional and personal goals, and build their resume for future jobs� This aspect of job satisfaction was valued more by professional nonmanagement employees than by nonmanagement hourly employees� An organization’s com-
Figure 4 | Importance of Career Advancement Opportunities
Very unimportant Unimportant Important Very important
(n = 555)
Source: 2011 Employee Job Satisfaction and Engagement: A Research Report by SHRM
5%
42%
18%
36%
2011 Employee Job Satisfaction and Engagement | 11
An organization’s commitment to professional development was more important for African American employees than for Caucasian employees.
mitment to professional development was more important for African American employees than for Caucasian employees�
This contributor to employee job satisfaction was not recession-proof in many organizations� According to a SHRM poll on the U�S� and global recession and its impact on organizations, 30% of HR professionals reported that professional development for employees was among the activities affected by budget cuts within their organization� In the same poll, 35% of HR professionals indicated that if the current financial challenges to the U�S� and global economy continue, their organizations will likely or very likely cut professional development for em-ployees�2 Though budgets might be leaner, investing in the development of their employees will help organizations fill their mission-critical positions� One way organizations can continue to make sure their employees grow and develop is to take advantage of web-based training, which is more cost-effective than face-to-face training such as seminars or conferences� Employees can be trained at their desks without incurring the travel-related cost of professional development�
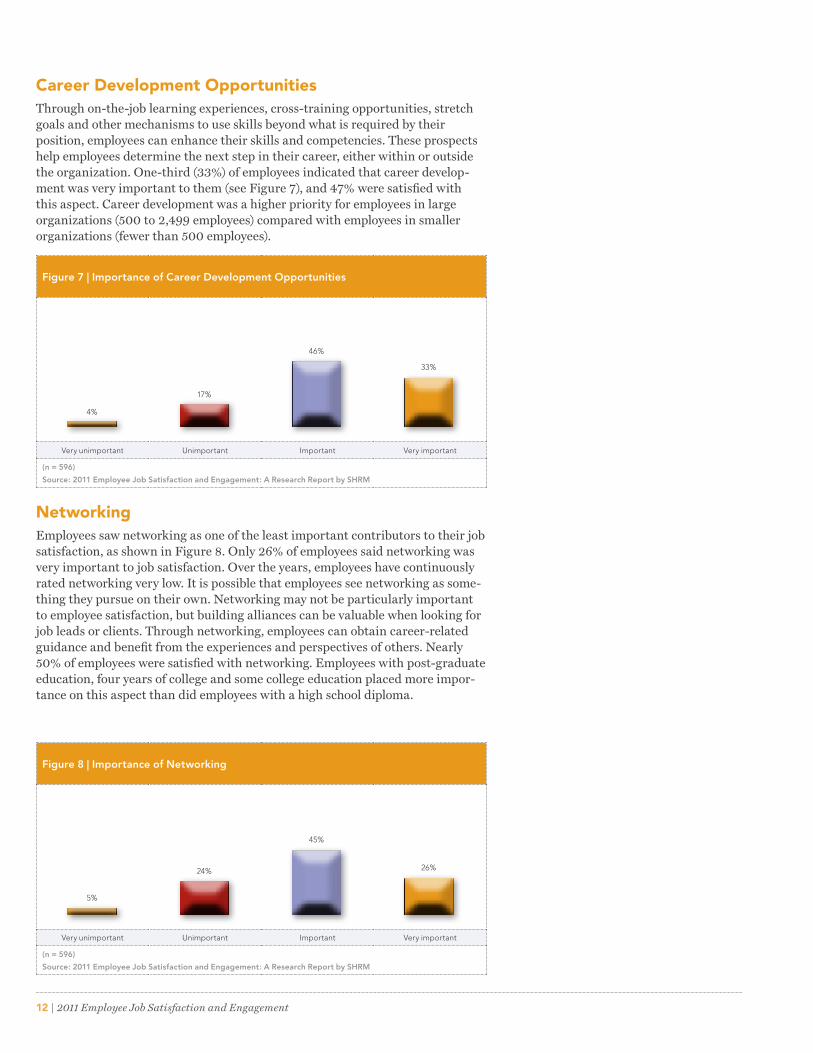
Job-Specific TrainingEmployers may offer job-specific training to provide employees with the relevant skills to enable them to perform their duties efficiently� The immediate applica-tion of skills acquired through such training may boost employee confidence and productivity� A third (33%) of employees viewed job-specific training as very important to employee job satisfaction (see Figure 6), and 55% were satisfied with it� There were no significant differences among employee demographics�
Figure 5 | Importance of Organization’s Commitment to Professional Development
Very unimportant Unimportant Important Very important
(n = 594)
Source: 2011 Employee Job Satisfaction and Engagement: A Research Report by SHRM
4%
49%
11%
36%
Figure 6 | Importance of Job-Specific Training
Very unimportant Unimportant Important Very important
(n = 589)
Source: 2011 Employee Job Satisfaction and Engagement: A Research Report by SHRM
4%
50%
13%
33%
12 | 2011 Employee Job Satisfaction and Engagement
Career Development OpportunitiesThrough on-the-job learning experiences, cross-training opportunities, stretch goals and other mechanisms to use skills beyond what is required by their position, employees can enhance their skills and competencies� These prospects help employees determine the next step in their career, either within or outside the organization� One-third (33%) of employees indicated that career develop-ment was very important to them (see Figure 7), and 47% were satisfied with this aspect� Career development was a higher priority for employees in large organizations (500 to 2,499 employees) compared with employees in smaller organizations (fewer than 500 employees)�
NetworkingEmployees saw networking as one of the least important contributors to their job satisfaction, as shown in Figure 8� Only 26% of employees said networking was very important to job satisfaction� Over the years, employees have continuously rated networking very low� It is possible that employees see networking as some-thing they pursue on their own� Networking may not be particularly important to employee satisfaction, but building alliances can be valuable when looking for job leads or clients� Through networking, employees can obtain career-related guidance and benefit from the experiences and perspectives of others� Nearly 50% of employees were satisfied with networking� Employees with post-graduate education, four years of college and some college education placed more impor-tance on this aspect than did employees with a high school diploma�
Figure 7 | Importance of Career Development Opportunities
Very unimportant Unimportant Important Very important
(n = 596)
Source: 2011 Employee Job Satisfaction and Engagement: A Research Report by SHRM
4%
46%
17%
33%
Figure 8 | Importance of Networking
Very unimportant Unimportant Important Very important
(n = 596)
Source: 2011 Employee Job Satisfaction and Engagement: A Research Report by SHRM
5%
45%
24% 26%
2011 Employee Job Satisfaction and Engagement | 13
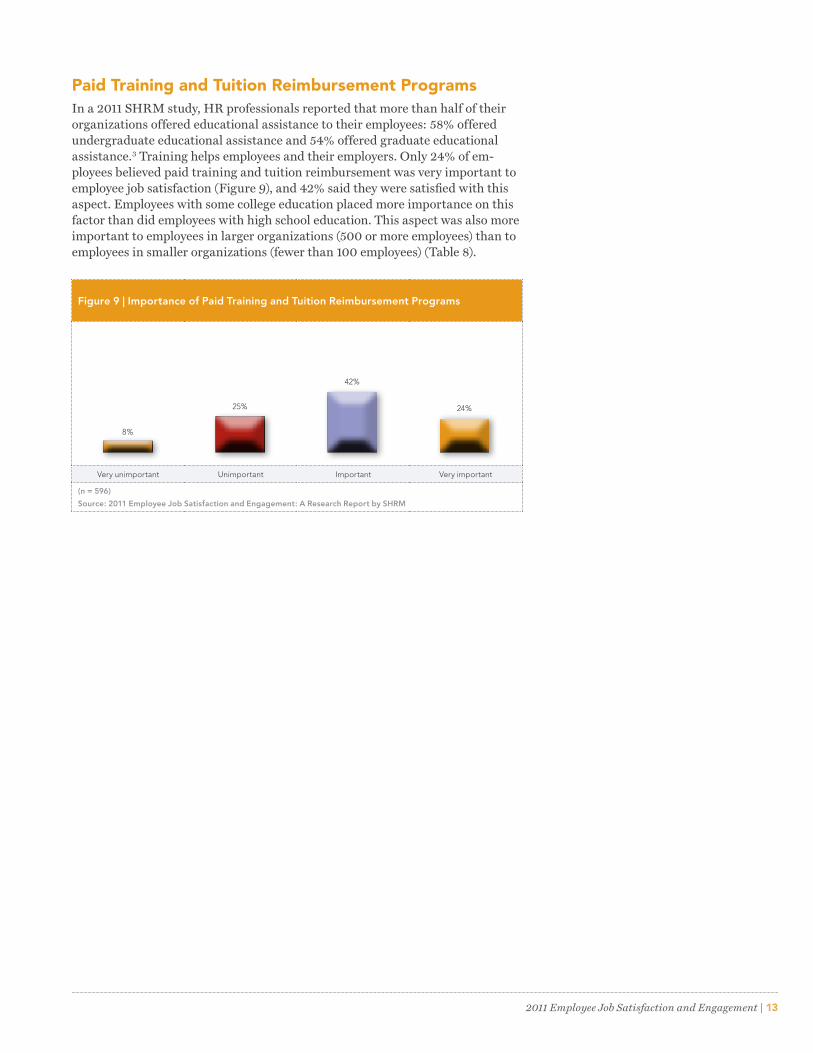
Paid Training and Tuition Reimbursement ProgramsIn a 2011 SHRM study, HR professionals reported that more than half of their organizations offered educational assistance to their employees: 58% offered undergraduate educational assistance and 54% offered graduate educational assistance�3 Training helps employees and their employers� Only 24% of em-ployees believed paid training and tuition reimbursement was very important to employee job satisfaction (Figure 9), and 42% said they were satisfied with this aspect� Employees with some college education placed more importance on this factor than did employees with high school education� This aspect was also more important to employees in larger organizations (500 or more employees) than to employees in smaller organizations (fewer than 100 employees) (Table 8)�
Figure 9 | Importance of Paid Training and Tuition Reimbursement Programs
Very unimportant Unimportant Important Very important
(n = 596)
Source: 2011 Employee Job Satisfaction and Engagement: A Research Report by SHRM
8%
42%
25% 24%
14 | 2011 Employee Job Satisfaction and Engagement
Employees rated their relationship with their immediate supervisor as more important to their job satisfaction than benefits and compensation.
The relationship an employee has with his or her supervisor is a central element to the employee’s affiliation with the organization, and it has been argued that many employee behaviors are largely a function of the way they are managed by their supervisors� One of the components of a good relationship is effective communication� When there are open lines of communication (e�g�, encouraging an open-door policy), supervisors can respond more effectively to the needs and problems of their employees� Effective communication from senior management can provide the workforce with direction� In addition, management’s recogni-tion of employees’ performance through praise (private or public), awards and incentives is a cost-effective way of increasing employee morale, productivity and competitiveness�
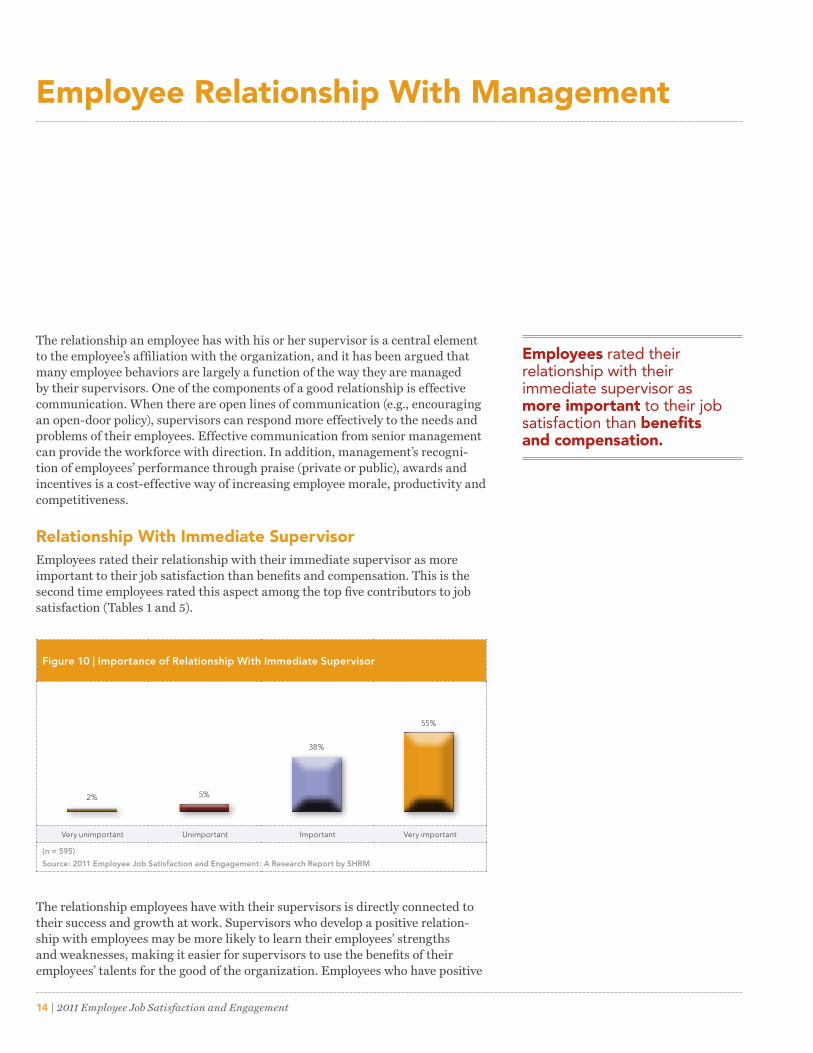
Relationship With Immediate SupervisorEmployees rated their relationship with their immediate supervisor as more important to their job satisfaction than benefits and compensation� This is the second time employees rated this aspect among the top five contributors to job satisfaction (Tables 1 and 5)�
The relationship employees have with their supervisors is directly connected to their success and growth at work� Supervisors who develop a positive relation-ship with employees may be more likely to learn their employees’ strengths and weaknesses, making it easier for supervisors to use the benefits of their employees’ talents for the good of the organization� Employees who have positive
Employee Relationship With Management
Figure 10 | Importance of Relationship With Immediate Supervisor
Very unimportant Unimportant Important Very important
(n = 595)
Source: 2011 Employee Job Satisfaction and Engagement: A Research Report by SHRM
2%
38%
5%
55%
2011 Employee Job Satisfaction and Engagement | 15
relationships with their supervisors—a relationship in which they feel safe and supported—may be more likely to go above and beyond what is required of them� They also may share with their supervisor job-related problems or even personal problems, which can be barriers to employee productivity� It is important that supervisors set clear expectations and provide feedback about work performance so as to avoid any potential frustrations or issues� Nearly three quarters of employees were satisfied with this aspect of job satisfaction�
The relationship with immediate supervisor was cited as important more frequently by college graduate employees compared with employees who only had high school education or some college education (see Table 8)�
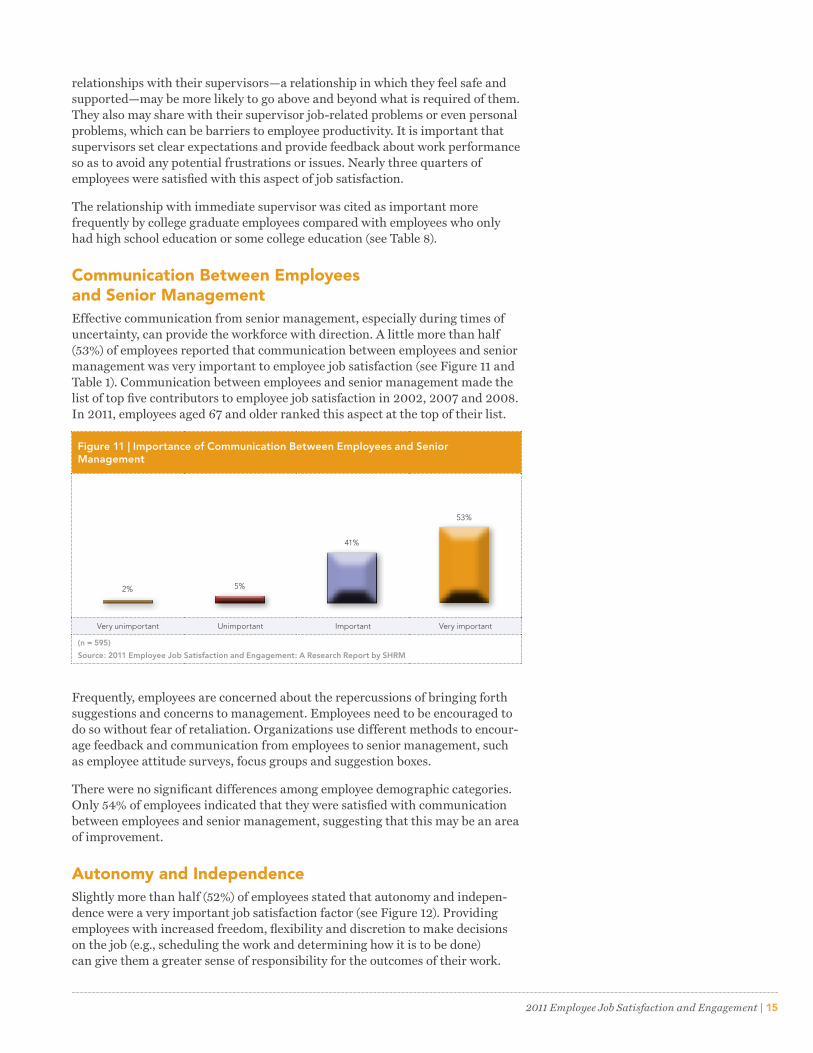
Communication Between Employees and Senior ManagementEffective communication from senior management, especially during times of uncertainty, can provide the workforce with direction� A little more than half (53%) of employees reported that communication between employees and senior management was very important to employee job satisfaction (see Figure 11 and Table 1)� Communication between employees and senior management made the list of top five contributors to employee job satisfaction in 2002, 2007 and 2008� In 2011, employees aged 67 and older ranked this aspect at the top of their list�
Frequently, employees are concerned about the repercussions of bringing forth suggestions and concerns to management� Employees need to be encouraged to do so without fear of retaliation� Organizations use different methods to encour-age feedback and communication from employees to senior management, such as employee attitude surveys, focus groups and suggestion boxes�
There were no significant differences among employee demographic categories� Only 54% of employees indicated that they were satisfied with communication between employees and senior management, suggesting that this may be an area of improvement�
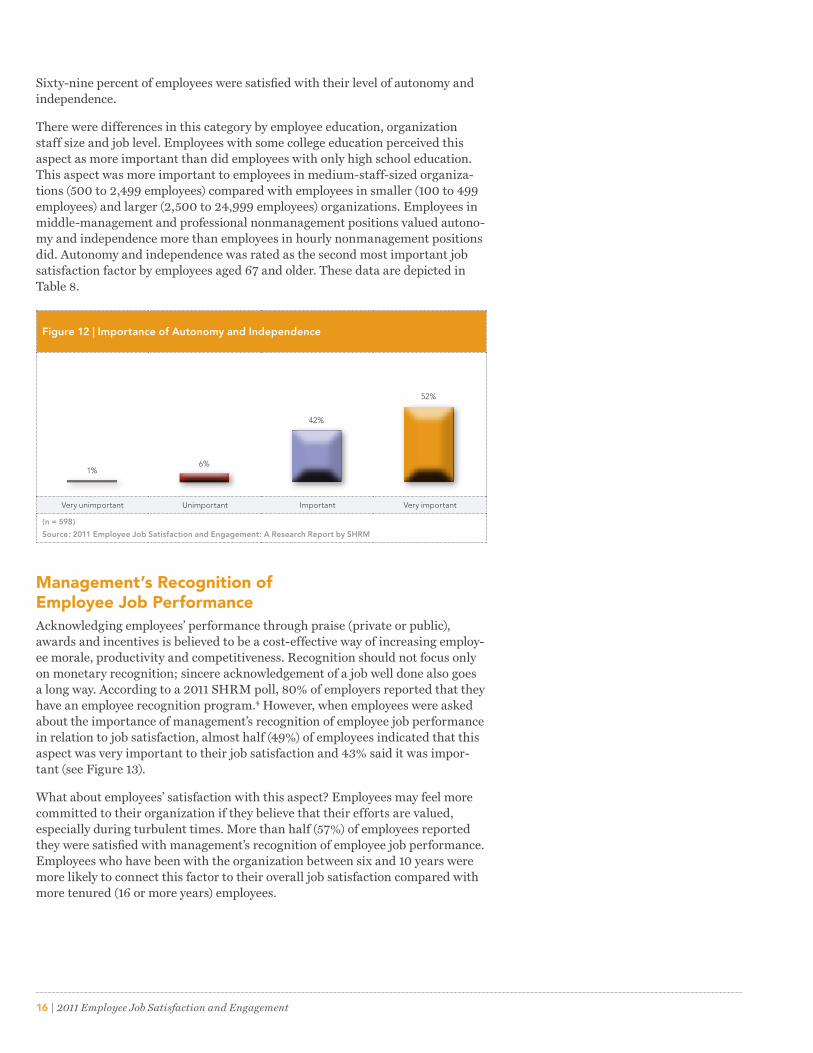
Autonomy and IndependenceSlightly more than half (52%) of employees stated that autonomy and indepen-dence were a very important job satisfaction factor (see Figure 12)� Providing employees with increased freedom, flexibility and discretion to make decisions on the job (e�g�, scheduling the work and determining how it is to be done) can give them a greater sense of responsibility for the outcomes of their work�
Figure 11 | Importance of Communication Between Employees and Senior Management
Very unimportant Unimportant Important Very important
(n = 595)
Source: 2011 Employee Job Satisfaction and Engagement: A Research Report by SHRM
2%
41%
5%
53%
16 | 2011 Employee Job Satisfaction and Engagement
Sixty-nine percent of employees were satisfied with their level of autonomy and independence�
There were differences in this category by employee education, organization staff size and job level� Employees with some college education perceived this aspect as more important than did employees with only high school education� This aspect was more important to employees in medium-staff-sized organiza-tions (500 to 2,499 employees) compared with employees in smaller (100 to 499 employees) and larger (2,500 to 24,999 employees) organizations� Employees in middle-management and professional nonmanagement positions valued autono-my and independence more than employees in hourly nonmanagement positions did� Autonomy and independence was rated as the second most important job satisfaction factor by employees aged 67 and older� These data are depicted in Table 8�
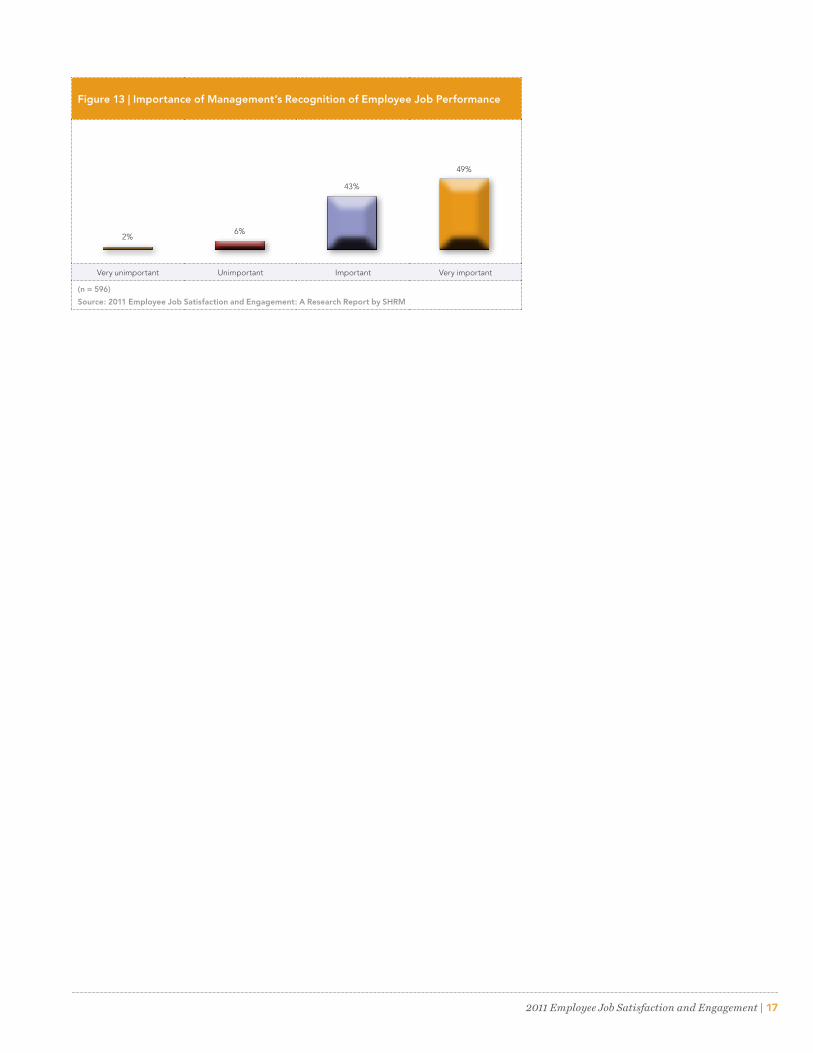
Management’s Recognition of Employee Job PerformanceAcknowledging employees’ performance through praise (private or public), awards and incentives is believed to be a cost-effective way of increasing employ-ee morale, productivity and competitiveness� Recognition should not focus only on monetary recognition; sincere acknowledgement of a job well done also goes a long way� According to a 2011 SHRM poll, 80% of employers reported that they have an employee recognition program�4 However, when employees were asked about the importance of management’s recognition of employee job performance in relation to job satisfaction, almost half (49%) of employees indicated that this aspect was very important to their job satisfaction and 43% said it was impor-tant (see Figure 13)�
What about employees’ satisfaction with this aspect? Employees may feel more committed to their organization if they believe that their efforts are valued, especially during turbulent times� More than half (57%) of employees reported they were satisfied with management’s recognition of employee job performance� Employees who have been with the organization between six and 10 years were more likely to connect this factor to their overall job satisfaction compared with more tenured (16 or more years) employees�
Figure 12 | Importance of Autonomy and Independence
Very unimportant Unimportant Important Very important
(n = 598)
Source: 2011 Employee Job Satisfaction and Engagement: A Research Report by SHRM
1%
42%
6%
52%
2011 Employee Job Satisfaction and Engagement | 17
Figure 13 | Importance of Management’s Recognition of Employee Job Performance
Very unimportant Unimportant Important Very important
(n = 596)
Source: 2011 Employee Job Satisfaction and Engagement: A Research Report by SHRM
2%
43%
6%
49%
18 | 2011 Employee Job Satisfaction and Engagement
“Companies that did not focus on or communicate appreciation to employees likely experienced lower employee trust, confidence and cooperation, as well as higher employee burnout, disengagement and voluntary turnover.”
•Do you think employees’ satisfaction with their jobs rose during the recession? What do you think was the most important factor regarding job satisfaction during the past few years?
Employee satisfaction and engagement are very individual issues that are influenced by an employee’s personal life, professional situation, expecta-tions and values. One factor that influences this is communication from—and a connection to—the employer. During the recession, companies managed their reductions in force in varying ways. This was a crucial time for companies to communicate to employees their importance in relation to the company’s success.
Companies that communicated their visions and created a climate of employee appreciation and recognition during this time experienced higher employee satisfaction. Those employees felt “in the know” and trusted their management. Companies that did not focus on or communicate appreciation to employees likely experienced lower employee trust, confidence and cooperation, as well as higher employee burnout, disengagement and voluntary turnover. Employees in those organizations felt blindsided, unappreciated and, in some cases, betrayed.
•Now that the economy has improved and more people are looking for new jobs, what types of perks or benefits are they seeking?
Expert Q & ADawn Adams, president, HResults
2011 Employee Job Satisfaction and Engagement | 19
“While many workers are grateful for their jobs, they expect recognition for their efforts and loyalty.”
Employees continue to seek competitive wages, an appreciative climate, afford-able benefits and workplace flexibility.
•HR departments were strained during the economic downturn, between budget cuts and having to handle the unenviable task of administering layoffs. What should be HR’s top priority to improve employee relations going forward during the economic recovery?
HR’s top priority should be talent management and retention of high perform-ers. HR needs to listen carefully to what employees need in order to find out what isn’t working, and then determine how to meet their needs so that HR develops and leverages current talent. Some initiatives could include coaching the high performers, providing clearer direction to the average performers and providing greater opportunities to all employees, allowing them to contribute and make decisions with more impact.
•Do you think we are still at the point where most workers are grateful just to have a job, or do you see the tide turning, with employees demanding more out of their employers?
While many workers are grateful for their jobs, they expect recognition for their efforts and loyalty. Although employees are aware of high benefits costs and may accept higher co-pays or deductibles, they still need and expect affordable options from their employers.
•Health care reform in 2010 created many new responsibilities for HR professionals. Do you think those will interfere with other efforts to reform benefits, such as developing workplace flexibility policies?
Health care reform required HR professionals to spend their time and energy learning about altering plans and complying with unclear or changing regula-tions. As the reform regulations are firmed up and the dust begins to settle, HR professionals will need to continue to find and provide additional perks—such as workplace flexibility—that do not increase expenses.
20 | 2011 Employee Job Satisfaction and Engagement
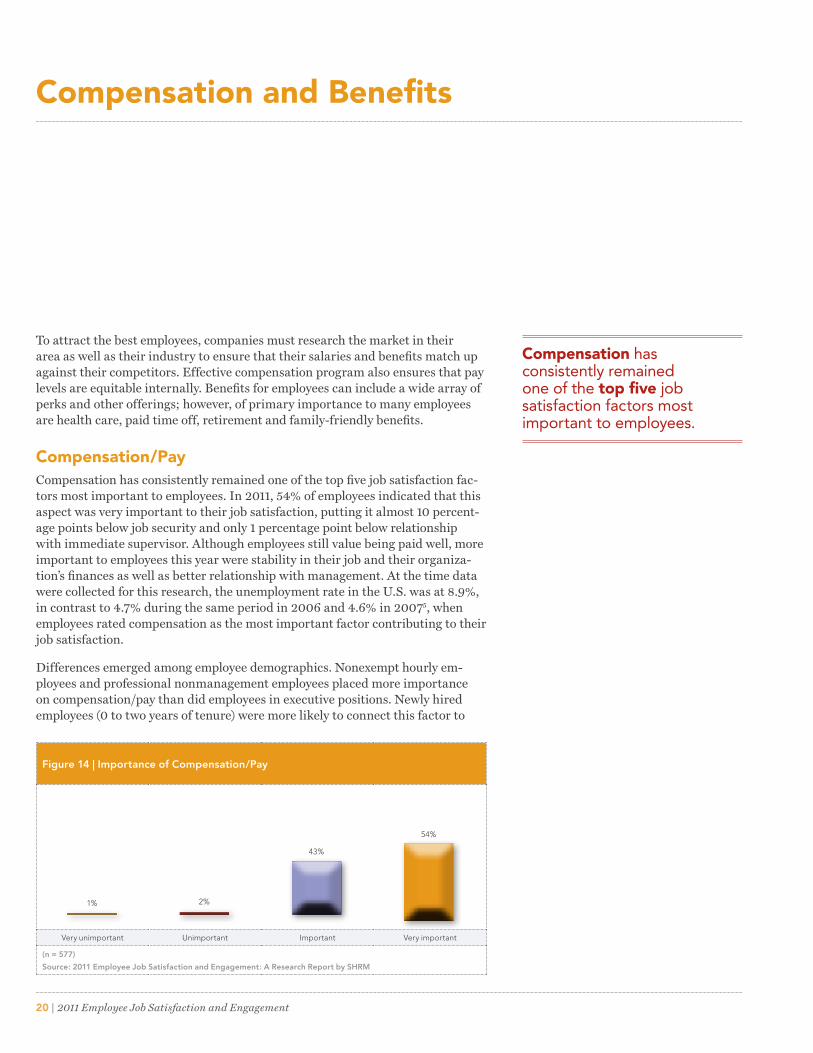
Compensation has consistently remained one of the top five job satisfaction factors most important to employees.
To attract the best employees, companies must research the market in their area as well as their industry to ensure that their salaries and benefits match up against their competitors� Effective compensation program also ensures that pay levels are equitable internally� Benefits for employees can include a wide array of perks and other offerings; however, of primary importance to many employees are health care, paid time off, retirement and family-friendly benefits�
Compensation/PayCompensation has consistently remained one of the top five job satisfaction fac-tors most important to employees� In 2011, 54% of employees indicated that this aspect was very important to their job satisfaction, putting it almost 10 percent-age points below job security and only 1 percentage point below relationship with immediate supervisor� Although employees still value being paid well, more important to employees this year were stability in their job and their organiza-tion’s finances as well as better relationship with management� At the time data were collected for this research, the unemployment rate in the U�S� was at 8�9%, in contrast to 4�7% during the same period in 2006 and 4�6% in 20075, when employees rated compensation as the most important factor contributing to their job satisfaction�
Differences emerged among employee demographics� Nonexempt hourly em-ployees and professional nonmanagement employees placed more importance on compensation/pay than did employees in executive positions� Newly hired employees (0 to two years of tenure) were more likely to connect this factor to
Compensation and Benefits
Figure 14 | Importance of Compensation/Pay
Very unimportant Unimportant Important Very important
(n = 577)
Source: 2011 Employee Job Satisfaction and Engagement: A Research Report by SHRM
1%
43%
2%
54%
2011 Employee Job Satisfaction and Engagement | 21
their overall job satisfaction compared with more tenured (16 or more years) employees�
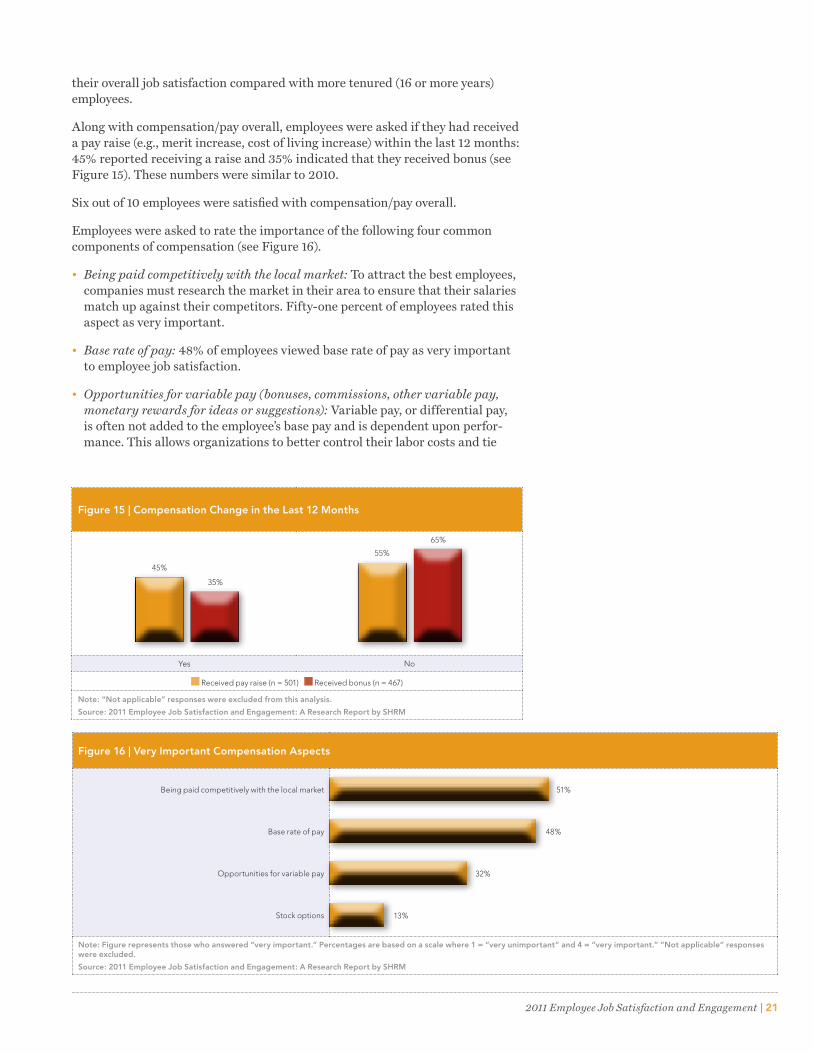
Along with compensation/pay overall, employees were asked if they had received a pay raise (e�g�, merit increase, cost of living increase) within the last 12 months: 45% reported receiving a raise and 35% indicated that they received bonus (see Figure 15)� These numbers were similar to 2010�
Six out of 10 employees were satisfied with compensation/pay overall�
Employees were asked to rate the importance of the following four common components of compensation (see Figure 16)�
• Being paid competitively with the local market: To attract the best employees, companies must research the market in their area to ensure that their salaries match up against their competitors� Fifty-one percent of employees rated this aspect as very important�
• Base rate of pay: 48% of employees viewed base rate of pay as very important to employee job satisfaction�
• Opportunities for variable pay (bonuses, commissions, other variable pay, monetary rewards for ideas or suggestions): Variable pay, or differential pay, is often not added to the employee’s base pay and is dependent upon perfor-mance� This allows organizations to better control their labor costs and tie
Figure 15 | Compensation Change in the Last 12 Months
Yes No
Received pay raise (n = 501) Received bonus (n = 467)
Note: “Not applicable” responses were excluded from this analysis.
Source: 2011 Employee Job Satisfaction and Engagement: A Research Report by SHRM
35%
45%
65%
55%
Figure 16 | Very Important Compensation Aspects
Being paid competitively with the local market
Base rate of pay
Opportunities for variable pay
Stock options
Note: Figure represents those who answered “very important.” Percentages are based on a scale where 1 = “very unimportant” and 4 = “very important.” “Not applicable” responses were excluded.
Source: 2011 Employee Job Satisfaction and Engagement: A Research Report by SHRM
51%
48%
32%
13%
22 | 2011 Employee Job Satisfaction and Engagement
Health care/medical benefits were valued more by nonexempt (hourly), professional nonmanagement and middle management employees compared with executive employees.
performance and pay together� A third of employees (32%) reported that this aspect was very important to job satisfaction�
• Stock options: This is another form of compensation that organizations offer to their employees� Only 13% of employees rated stock options as very important�
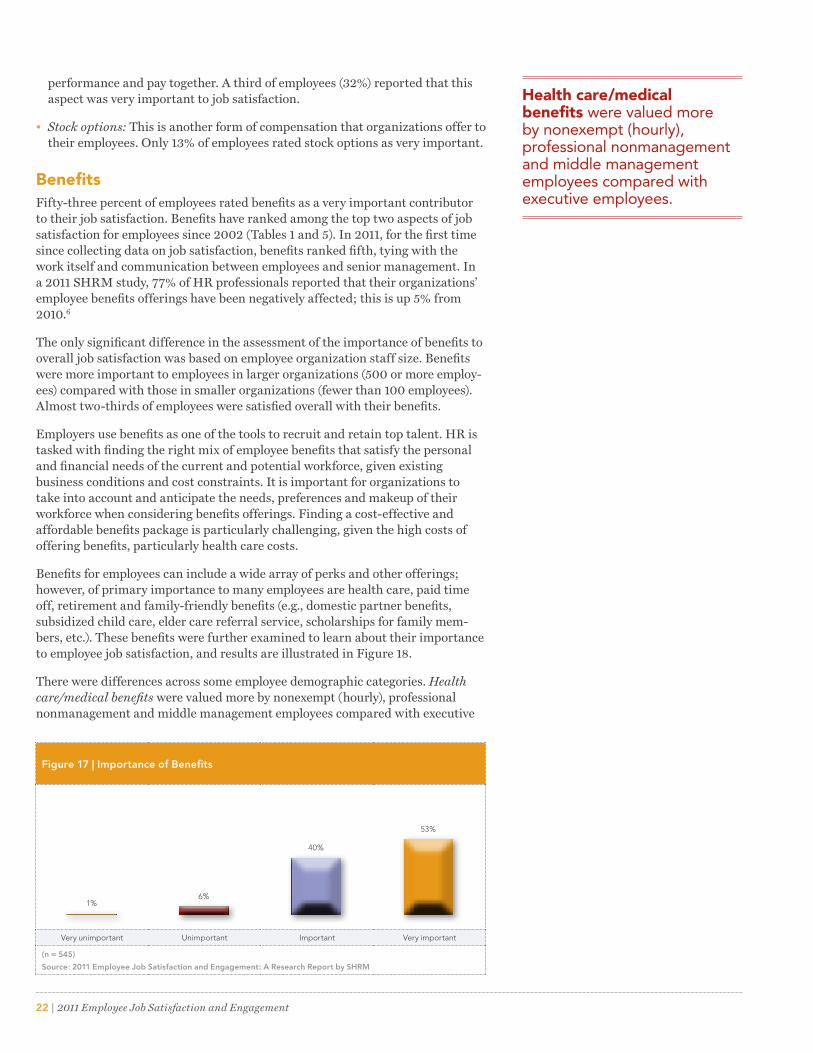
BenefitsFifty-three percent of employees rated benefits as a very important contributor to their job satisfaction� Benefits have ranked among the top two aspects of job satisfaction for employees since 2002 (Tables 1 and 5)� In 2011, for the first time since collecting data on job satisfaction, benefits ranked fifth, tying with the work itself and communication between employees and senior management� In a 2011 SHRM study, 77% of HR professionals reported that their organizations’ employee benefits offerings have been negatively affected; this is up 5% from 2010�6
The only significant difference in the assessment of the importance of benefits to overall job satisfaction was based on employee organization staff size� Benefits were more important to employees in larger organizations (500 or more employ-ees) compared with those in smaller organizations (fewer than 100 employees)� Almost two-thirds of employees were satisfied overall with their benefits�
Employers use benefits as one of the tools to recruit and retain top talent� HR is tasked with finding the right mix of employee benefits that satisfy the personal and financial needs of the current and potential workforce, given existing business conditions and cost constraints� It is important for organizations to take into account and anticipate the needs, preferences and makeup of their workforce when considering benefits offerings� Finding a cost-effective and affordable benefits package is particularly challenging, given the high costs of offering benefits, particularly health care costs�
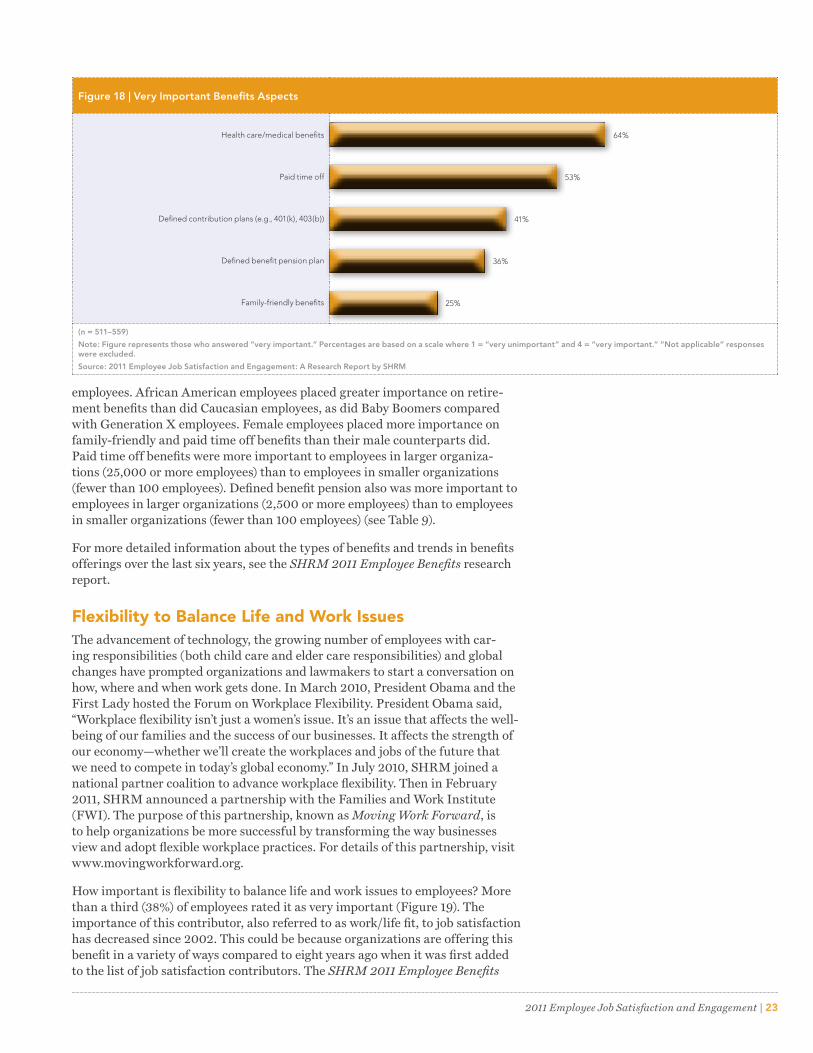
Benefits for employees can include a wide array of perks and other offerings; however, of primary importance to many employees are health care, paid time off, retirement and family-friendly benefits (e�g�, domestic partner benefits, subsidized child care, elder care referral service, scholarships for family mem-bers, etc�)� These benefits were further examined to learn about their importance to employee job satisfaction, and results are illustrated in Figure 18�
There were differences across some employee demographic categories� Health care/medical benefits were valued more by nonexempt (hourly), professional nonmanagement and middle management employees compared with executive
Figure 17 | Importance of Benefits
Very unimportant Unimportant Important Very important
(n = 545)
Source: 2011 Employee Job Satisfaction and Engagement: A Research Report by SHRM
1%
40%
6%
53%
2011 Employee Job Satisfaction and Engagement | 23
employees� African American employees placed greater importance on retire-ment benefits than did Caucasian employees, as did Baby Boomers compared with Generation X employees� Female employees placed more importance on family-friendly and paid time off benefits than their male counterparts did� Paid time off benefits were more important to employees in larger organiza-tions (25,000 or more employees) than to employees in smaller organizations (fewer than 100 employees)� Defined benefit pension also was more important to employees in larger organizations (2,500 or more employees) than to employees in smaller organizations (fewer than 100 employees) (see Table 9)�
For more detailed information about the types of benefits and trends in benefits offerings over the last six years, see the SHRM 2011 Employee Benefits research report.
Flexibility to Balance Life and Work IssuesThe advancement of technology, the growing number of employees with car-ing responsibilities (both child care and elder care responsibilities) and global changes have prompted organizations and lawmakers to start a conversation on how, where and when work gets done� In March 2010, President Obama and the First Lady hosted the Forum on Workplace Flexibility� President Obama said, “Workplace flexibility isn’t just a women’s issue� It’s an issue that affects the well-being of our families and the success of our businesses� It affects the strength of our economy—whether we’ll create the workplaces and jobs of the future that we need to compete in today’s global economy�” In July 2010, SHRM joined a national partner coalition to advance workplace flexibility� Then in February 2011, SHRM announced a partnership with the Families and Work Institute (FWI)� The purpose of this partnership, known as Moving Work Forward, is to help organizations be more successful by transforming the way businesses view and adopt flexible workplace practices� For details of this partnership, visit www�movingworkforward�org�
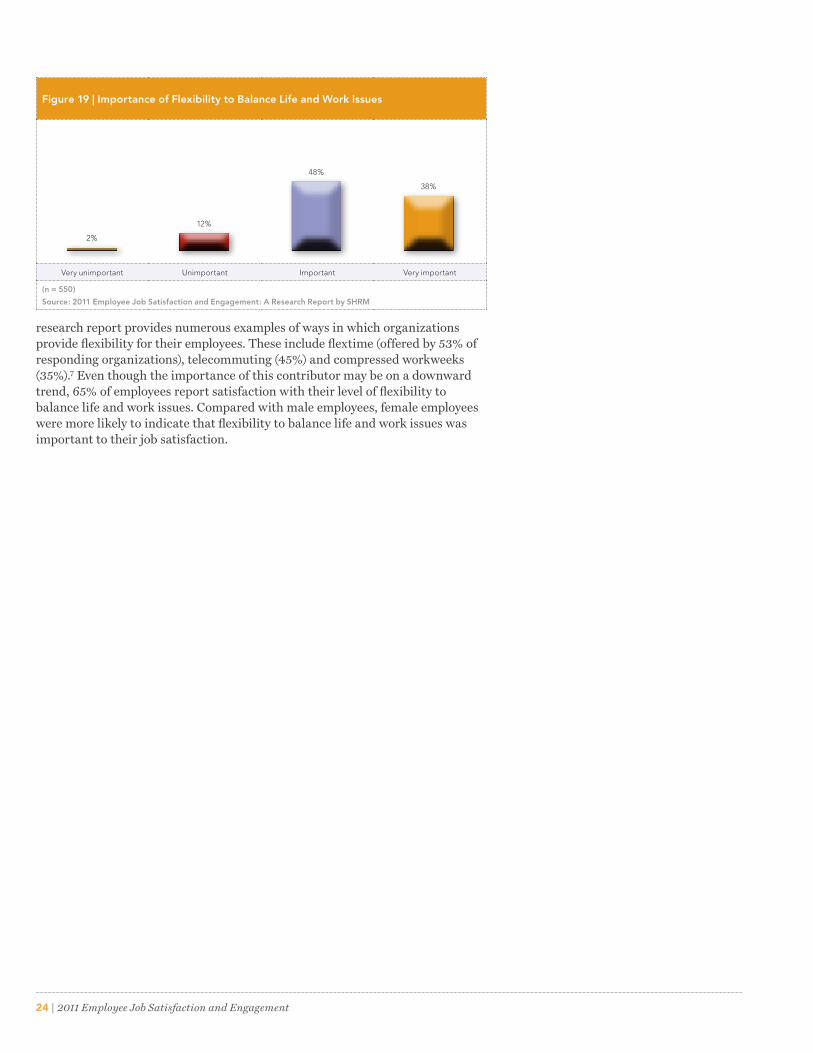
How important is flexibility to balance life and work issues to employees? More than a third (38%) of employees rated it as very important (Figure 19)� The importance of this contributor, also referred to as work/life fit, to job satisfaction has decreased since 2002� This could be because organizations are offering this benefit in a variety of ways compared to eight years ago when it was first added to the list of job satisfaction contributors� The SHRM 2011 Employee Benefits
Figure 18 | Very Important Benefits Aspects
Health care/medical benefits
Paid time off
Defined contribution plans (e.g., 401(k), 403(b))
Defined benefit pension plan
Family-friendly benefits
(n = 511–559)
Note: Figure represents those who answered “very important.” Percentages are based on a scale where 1 = “very unimportant” and 4 = “very important.” “Not applicable” responses were excluded.
Source: 2011 Employee Job Satisfaction and Engagement: A Research Report by SHRM
64%
53%
41%
36%
25%
24 | 2011 Employee Job Satisfaction and Engagement
research report provides numerous examples of ways in which organizations provide flexibility for their employees� These include flextime (offered by 53% of responding organizations), telecommuting (45%) and compressed workweeks (35%)�7 Even though the importance of this contributor may be on a downward trend, 65% of employees report satisfaction with their level of flexibility to balance life and work issues� Compared with male employees, female employees were more likely to indicate that flexibility to balance life and work issues was important to their job satisfaction�
Figure 19 | Importance of Flexibility to Balance Life and Work Issues
Very unimportant Unimportant Important Very important
(n = 550)
Source: 2011 Employee Job Satisfaction and Engagement: A Research Report by SHRM
2%
48%
12%
38%
2011 Employee Job Satisfaction and Engagement | 25
“Technology by far is where the most opportunities exist, then advanced roles in accounting and accomplished sales professionals.”
•Have we reached a point where some workers are comfortable seeking new jobs, now that economic conditions have improved? If so, what are their reasons for looking elsewhere?
Yes, in general, many specialized higher-level skilled employees in technology, accounting, sales and human resources are seeking jobs now that the economy has improved. In many cases, these same employees have been employed over the past few years during the recession and slow recovery, and chose to stay because of limited options. However, they may have preferred to move from their position or company simply because they wanted additional advancement, challenge or a better work environment.
•What industries are seeing the most movement at this time, and where are openings still limited?
Technology by far is where the most opportunities exist, then advanced roles in accounting and accomplished sales professionals. Some rebound in higher-level administrative roles is also occurring, along with human resource positions, especially experienced recruiters. Lower-level skilled workers and less experienced skilled workers in general are still challenged in finding meaningful employment, but those areas also are improving, albeit slowly.
•Do you think employees’ satisfaction with their jobs rose during the recession, at least for those who were able to stay employed? What
Expert Q & APaul Villella, chief executive officer, HireStrategy
26 | 2011 Employee Job Satisfaction and Engagement
“In fact, it [job satisfaction] probably declined, because many individuals who would have otherwise changed jobs stayed [at their jobs] and, in many cases, wore multiple hats, further frustrating them in their roles.”
do you think was the most important factor regarding job satisfaction during the past few years?
I do not think job satisfaction rose during the recession. In fact, it probably declined, because many individuals who would have otherwise changed jobs stayed [at their jobs] and, in many cases, wore multiple hats, further frustrating them in their roles.
•Do you think employers that eliminated benefits or cut perks during tough economic times will have a harder time keeping workers when the job market improves?
I think that these same employers will respond to market conditions and restore or enhance current benefits and perks.
•With the standard 40-hour workweek becoming dated in most sectors, do you see workplace flexibility becoming more prevalent in today’s labor force? How can the benefits of flexibility be measured for employers that are hesitant to use such policies?
I do see the use of worker flexibility as a key to employee retention. Telecom-muting when possible is also on the rise and factors into an employee’s decision about moving on versus staying with their current employer.
2011 Employee Job Satisfaction and Engagement | 27
For the fourth consecutive year, job security tops employees’ list of aspects most important to their job satisfaction.
Employers understand that employees spend a fair amount of their time at work and take steps to ensure the work environment is conducive for employees to be productive and satisfied at work� Employees ranked three aspects from the work environment category in the top five contributors important to employee job satisfaction�
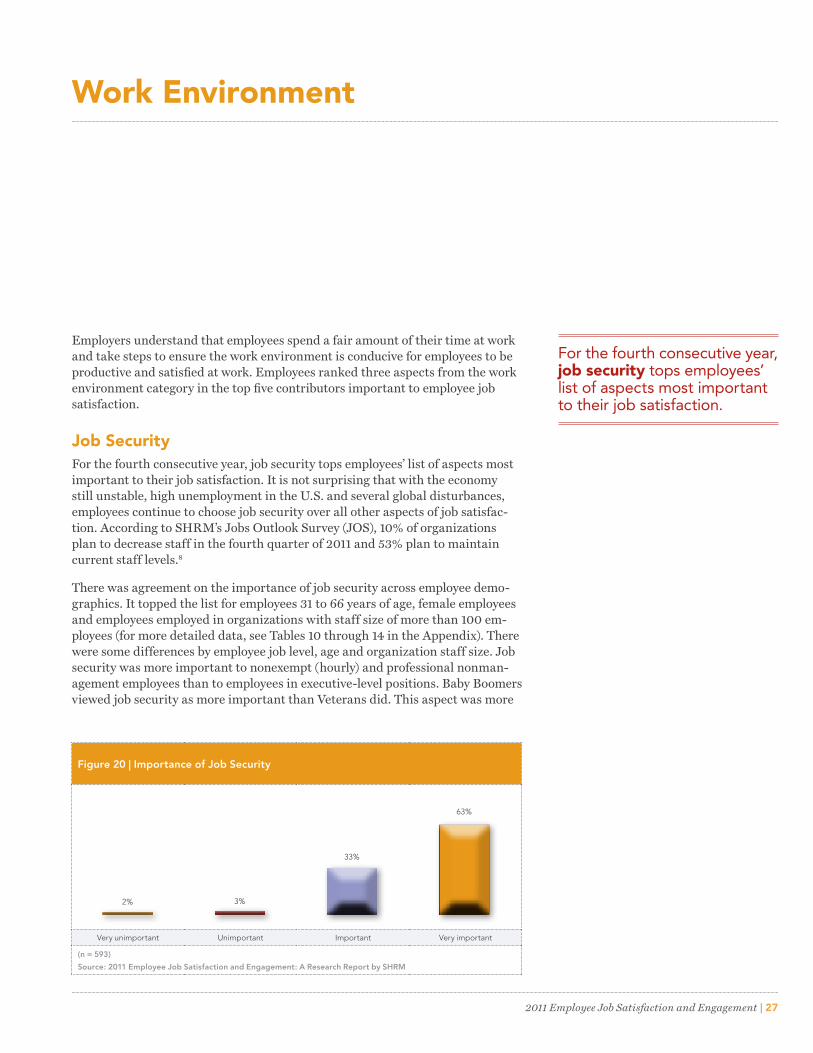
Job SecurityFor the fourth consecutive year, job security tops employees’ list of aspects most important to their job satisfaction� It is not surprising that with the economy still unstable, high unemployment in the U�S� and several global disturbances, employees continue to choose job security over all other aspects of job satisfac-tion� According to SHRM’s Jobs Outlook Survey (JOS), 10% of organizations plan to decrease staff in the fourth quarter of 2011 and 53% plan to maintain current staff levels�8
There was agreement on the importance of job security across employee demo-graphics� It topped the list for employees 31 to 66 years of age, female employees and employees employed in organizations with staff size of more than 100 em-ployees (for more detailed data, see Tables 10 through 14 in the Appendix)� There were some differences by employee job level, age and organization staff size� Job security was more important to nonexempt (hourly) and professional nonman-agement employees than to employees in executive-level positions� Baby Boomers viewed job security as more important than Veterans did� This aspect was more
Work Environment
Figure 20 | Importance of Job Security
Very unimportant Unimportant Important Very important
(n = 593)
Source: 2011 Employee Job Satisfaction and Engagement: A Research Report by SHRM
2%
33%
3%
63%
28 | 2011 Employee Job Satisfaction and Engagement
important to employees in larger organizations (2,500 or more employees) than to employees in smaller organizations (fewer than 100 employees)�
Two-thirds of employees were satisfied with job security in their current job�
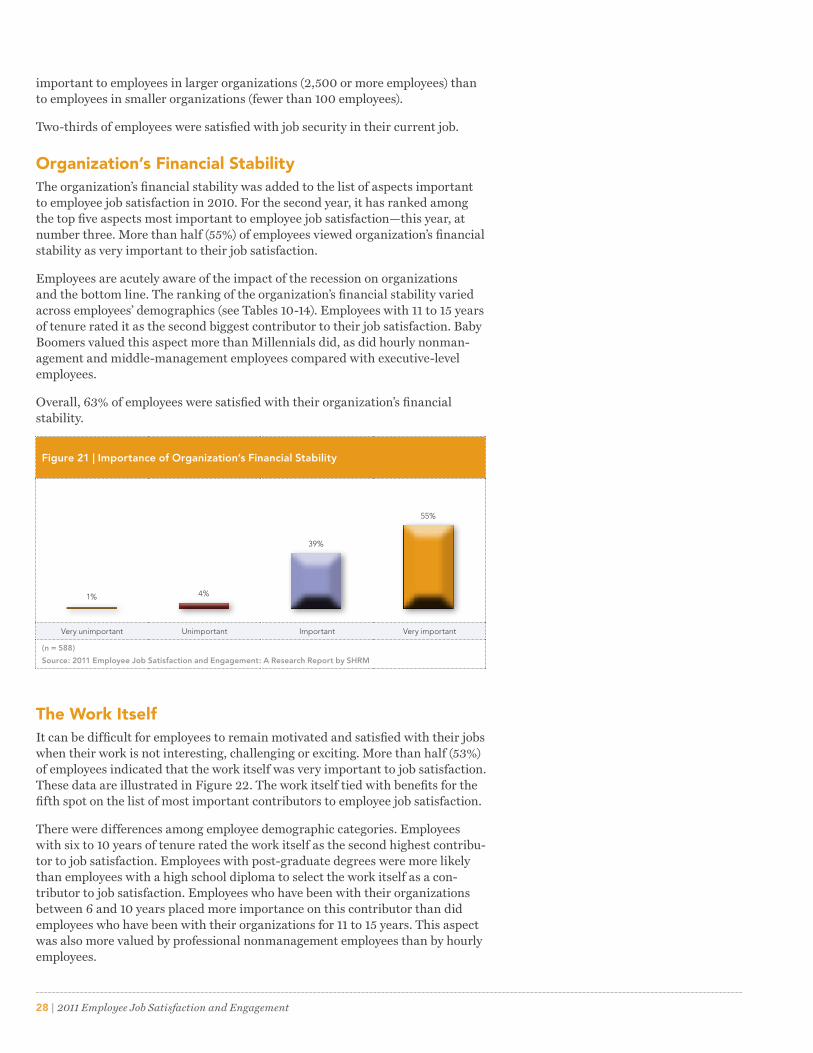
Organization’s Financial StabilityThe organization’s financial stability was added to the list of aspects important to employee job satisfaction in 2010� For the second year, it has ranked among the top five aspects most important to employee job satisfaction—this year, at number three� More than half (55%) of employees viewed organization’s financial stability as very important to their job satisfaction�
Employees are acutely aware of the impact of the recession on organizations and the bottom line� The ranking of the organization’s financial stability varied across employees’ demographics (see Tables 10-14)� Employees with 11 to 15 years of tenure rated it as the second biggest contributor to their job satisfaction� Baby Boomers valued this aspect more than Millennials did, as did hourly nonman-agement and middle-management employees compared with executive-level employees�
Overall, 63% of employees were satisfied with their organization’s financial stability�
The Work ItselfIt can be difficult for employees to remain motivated and satisfied with their jobs when their work is not interesting, challenging or exciting� More than half (53%) of employees indicated that the work itself was very important to job satisfaction� These data are illustrated in Figure 22� The work itself tied with benefits for the fifth spot on the list of most important contributors to employee job satisfaction�
There were differences among employee demographic categories� Employees with six to 10 years of tenure rated the work itself as the second highest contribu-tor to job satisfaction� Employees with post-graduate degrees were more likely than employees with a high school diploma to select the work itself as a con-tributor to job satisfaction� Employees who have been with their organizations between 6 and 10 years placed more importance on this contributor than did employees who have been with their organizations for 11 to 15 years� This aspect was also more valued by professional nonmanagement employees than by hourly employees�
Figure 21 | Importance of Organization’s Financial Stability
Very unimportant Unimportant Important Very important
(n = 588)
Source: 2011 Employee Job Satisfaction and Engagement: A Research Report by SHRM
1%
39%
4%
55%
2011 Employee Job Satisfaction and Engagement | 29
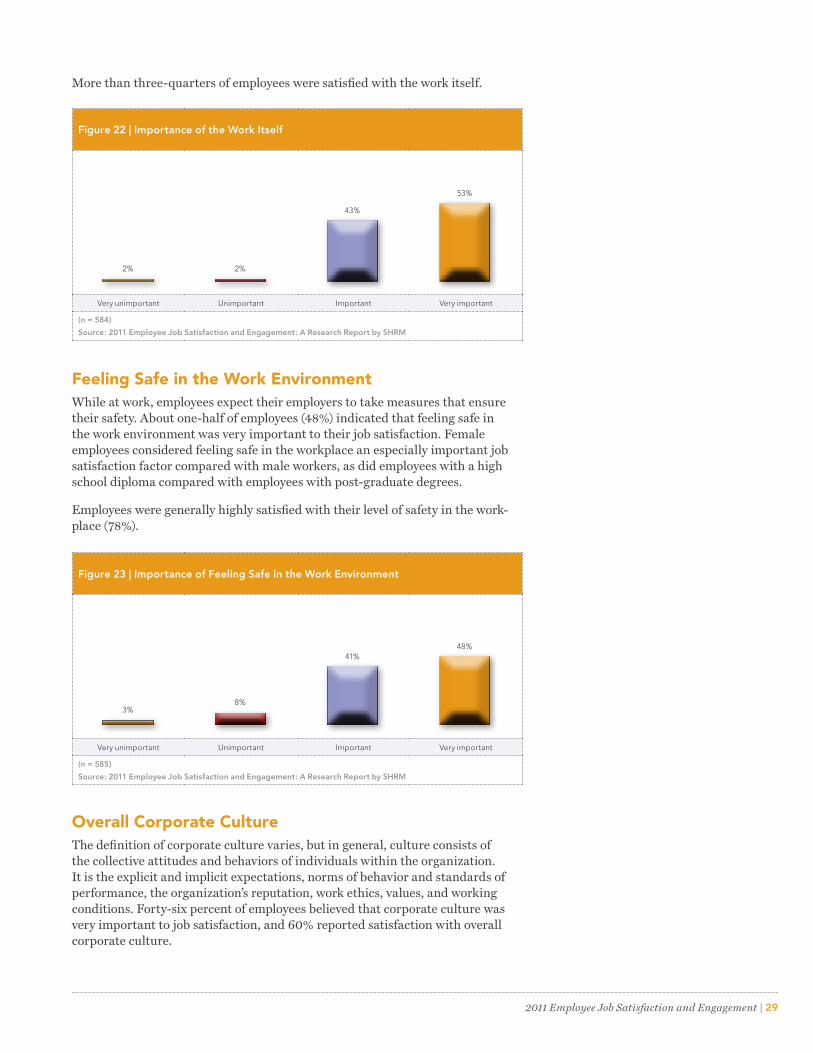
More than three-quarters of employees were satisfied with the work itself�
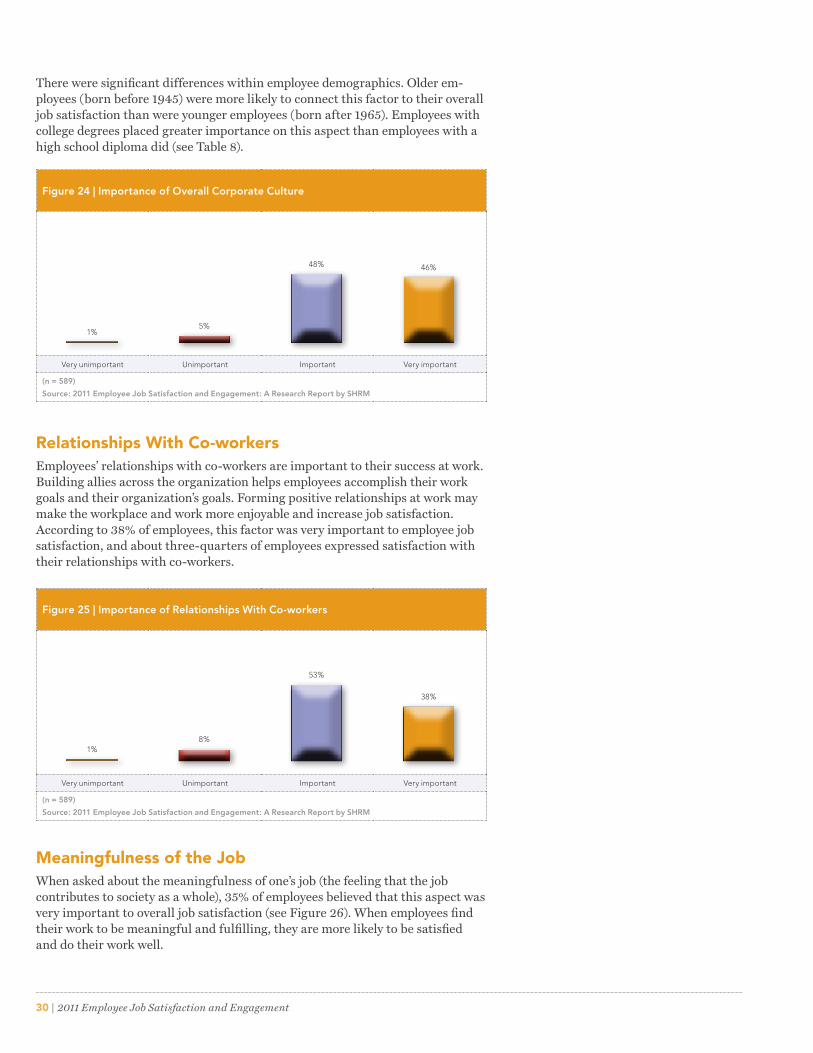
Feeling Safe in the Work EnvironmentWhile at work, employees expect their employers to take measures that ensure their safety� About one-half of employees (48%) indicated that feeling safe in the work environment was very important to their job satisfaction� Female employees considered feeling safe in the workplace an especially important job satisfaction factor compared with male workers, as did employees with a high school diploma compared with employees with post-graduate degrees�
Employees were generally highly satisfied with their level of safety in the work-place (78%)�
Overall Corporate CultureThe definition of corporate culture varies, but in general, culture consists of the collective attitudes and behaviors of individuals within the organization� It is the explicit and implicit expectations, norms of behavior and standards of performance, the organization’s reputation, work ethics, values, and working conditions� Forty-six percent of employees believed that corporate culture was very important to job satisfaction, and 60% reported satisfaction with overall corporate culture�
Figure 22 | Importance of the Work Itself
Very unimportant Unimportant Important Very important
(n = 584)
Source: 2011 Employee Job Satisfaction and Engagement: A Research Report by SHRM
2%
43%
2%
53%
Figure 23 | Importance of Feeling Safe in the Work Environment
Very unimportant Unimportant Important Very important
(n = 585)
Source: 2011 Employee Job Satisfaction and Engagement: A Research Report by SHRM
3%
41%
8%
48%
30 | 2011 Employee Job Satisfaction and Engagement
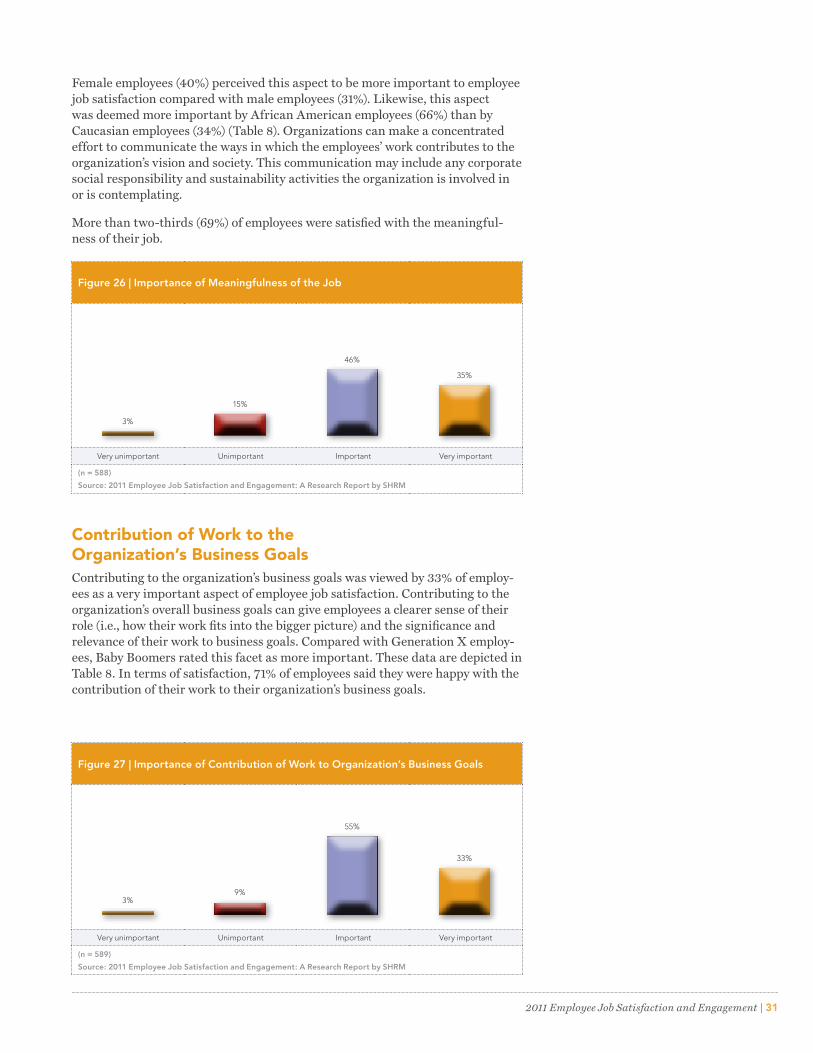
There were significant differences within employee demographics� Older em-ployees (born before 1945) were more likely to connect this factor to their overall job satisfaction than were younger employees (born after 1965)� Employees with college degrees placed greater importance on this aspect than employees with a high school diploma did (see Table 8)�
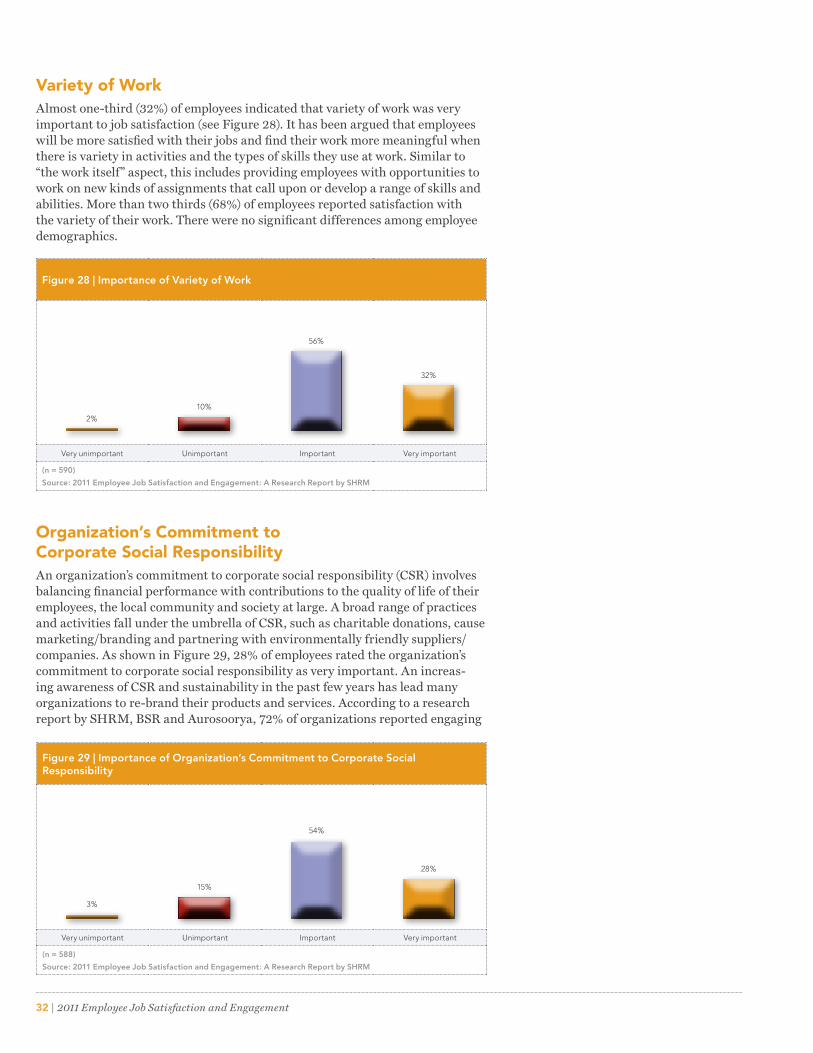
Relationships With Co-workersEmployees’ relationships with co-workers are important to their success at work� Building allies across the organization helps employees accomplish their work goals and their organization’s goals� Forming positive relationships at work may make the workplace and work more enjoyable and increase job satisfaction� According to 38% of employees, this factor was very important to employee job satisfaction, and about three-quarters of employees expressed satisfaction with their relationships with co-workers�
Meaningfulness of the JobWhen asked about the meaningfulness of one’s job (the feeling that the job contributes to society as a whole), 35% of employees believed that this aspect was very important to overall job satisfaction (see Figure 26)� When employees find their work to be meaningful and fulfilling, they are more likely to be satisfied and do their work well�
Figure 24 | Importance of Overall Corporate Culture
Very unimportant Unimportant Important Very important
(n = 589)
Source: 2011 Employee Job Satisfaction and Engagement: A Research Report by SHRM
1%
48%
5%
46%
Figure 25 | Importance of Relationships With Co-workers
Very unimportant Unimportant Important Very important
(n = 589)
Source: 2011 Employee Job Satisfaction and Engagement: A Research Report by SHRM
1%
53%
8%
38%
2011 Employee Job Satisfaction and Engagement | 31
Female employees (40%) perceived this aspect to be more important to employee job satisfaction compared with male employees (31%)� Likewise, this aspect was deemed more important by African American employees (66%) than by Caucasian employees (34%) (Table 8)� Organizations can make a concentrated effort to communicate the ways in which the employees’ work contributes to the organization’s vision and society� This communication may include any corporate social responsibility and sustainability activities the organization is involved in or is contemplating�
More than two-thirds (69%) of employees were satisfied with the meaningful-ness of their job�
Contribution of Work to the Organization’s Business GoalsContributing to the organization’s business goals was viewed by 33% of employ-ees as a very important aspect of employee job satisfaction� Contributing to the organization’s overall business goals can give employees a clearer sense of their role (i�e�, how their work fits into the bigger picture) and the significance and relevance of their work to business goals� Compared with Generation X employ-ees, Baby Boomers rated this facet as more important� These data are depicted in Table 8� In terms of satisfaction, 71% of employees said they were happy with the contribution of their work to their organization’s business goals�
Figure 26 | Importance of Meaningfulness of the Job
Very unimportant Unimportant Important Very important
(n = 588)
Source: 2011 Employee Job Satisfaction and Engagement: A Research Report by SHRM
3%
46%
15%
35%
Figure 27 | Importance of Contribution of Work to Organization’s Business Goals
Very unimportant Unimportant Important Very important
(n = 589)
Source: 2011 Employee Job Satisfaction and Engagement: A Research Report by SHRM
3%
55%
9%
33%
32 | 2011 Employee Job Satisfaction and Engagement
Variety of WorkAlmost one-third (32%) of employees indicated that variety of work was very important to job satisfaction (see Figure 28)� It has been argued that employees will be more satisfied with their jobs and find their work more meaningful when there is variety in activities and the types of skills they use at work� Similar to “the work itself” aspect, this includes providing employees with opportunities to work on new kinds of assignments that call upon or develop a range of skills and abilities� More than two thirds (68%) of employees reported satisfaction with the variety of their work� There were no significant differences among employee demographics�
Organization’s Commitment to Corporate Social ResponsibilityAn organization’s commitment to corporate social responsibility (CSR) involves balancing financial performance with contributions to the quality of life of their employees, the local community and society at large� A broad range of practices and activities fall under the umbrella of CSR, such as charitable donations, cause marketing/branding and partnering with environmentally friendly suppliers/companies� As shown in Figure 29, 28% of employees rated the organization’s commitment to corporate social responsibility as very important� An increas-ing awareness of CSR and sustainability in the past few years has lead many organizations to re-brand their products and services� According to a research report by SHRM, BSR and Aurosoorya, 72% of organizations reported engaging
Figure 28 | Importance of Variety of Work
Very unimportant Unimportant Important Very important
(n = 590)
Source: 2011 Employee Job Satisfaction and Engagement: A Research Report by SHRM
2%
56%
10%
32%
Figure 29 | Importance of Organization’s Commitment to Corporate Social Responsibility
Very unimportant Unimportant Important Very important
(n = 588)
Source: 2011 Employee Job Satisfaction and Engagement: A Research Report by SHRM
3%
54%
15%
28%
2011 Employee Job Satisfaction and Engagement | 33
Organizations that show commitment to a diverse and inclusive workplace were more appealing to African American employees than to Caucasian employees and to female employees than to male employees.
in sustainable workplace or business practices�9 The job satisfaction research indicates that organizations that practice corporate social responsibility have a stronger appeal for female employees than for male employees� Overall, 49% of employees said they were satisfied with their organization’s commitment to CSR�
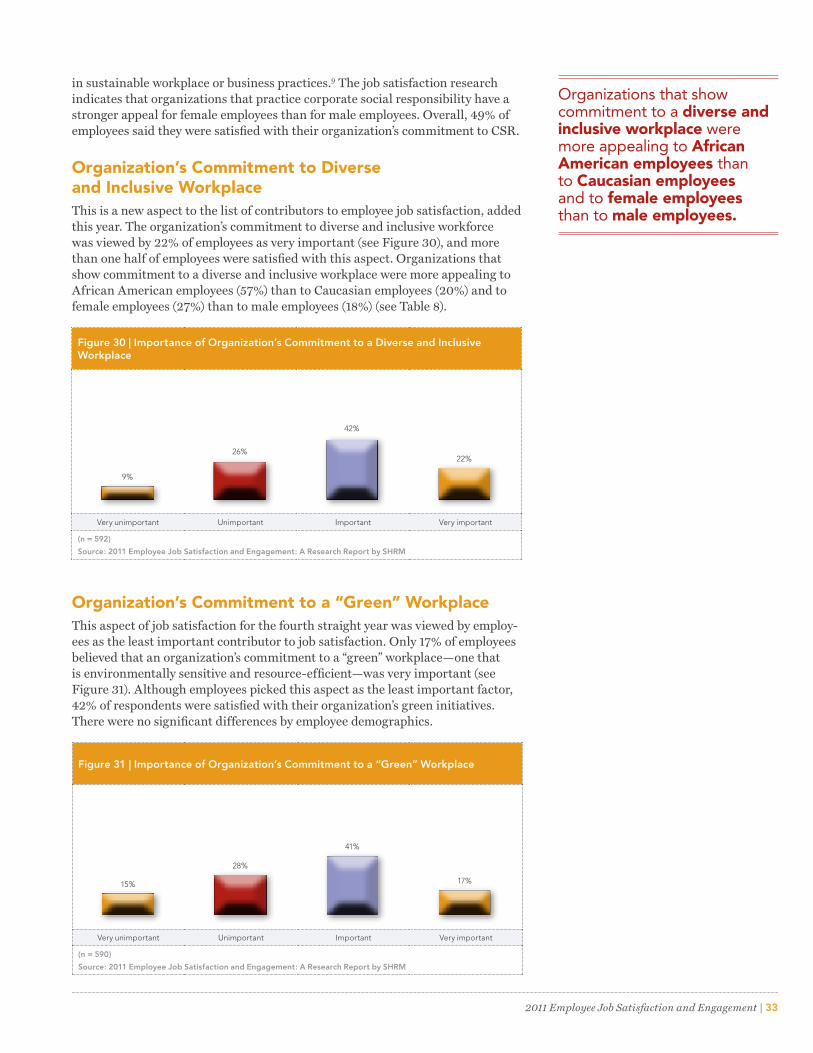
Organization’s Commitment to Diverse and Inclusive WorkplaceThis is a new aspect to the list of contributors to employee job satisfaction, added this year� The organization’s commitment to diverse and inclusive workforce was viewed by 22% of employees as very important (see Figure 30), and more than one half of employees were satisfied with this aspect� Organizations that show commitment to a diverse and inclusive workplace were more appealing to African American employees (57%) than to Caucasian employees (20%) and to female employees (27%) than to male employees (18%) (see Table 8)�
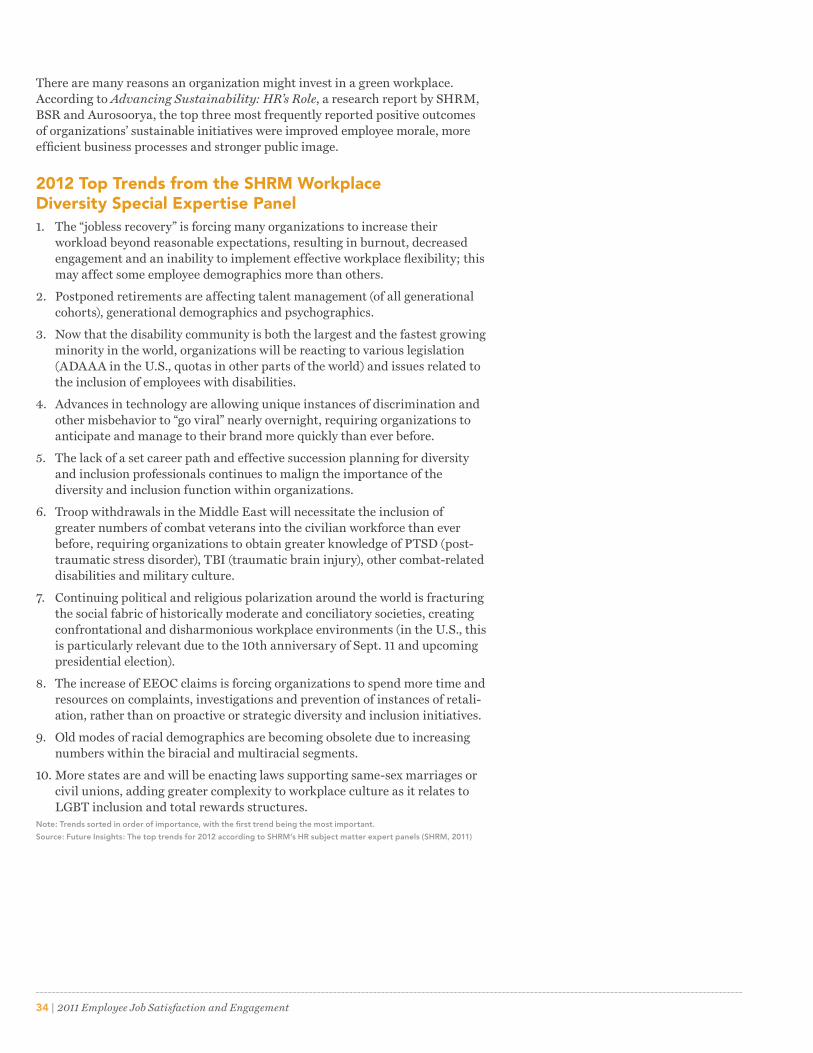
Organization’s Commitment to a “Green” WorkplaceThis aspect of job satisfaction for the fourth straight year was viewed by employ-ees as the least important contributor to job satisfaction� Only 17% of employees believed that an organization’s commitment to a “green” workplace—one that is environmentally sensitive and resource-efficient—was very important (see Figure 31)� Although employees picked this aspect as the least important factor, 42% of respondents were satisfied with their organization’s green initiatives� There were no significant differences by employee demographics�
Figure 30 | Importance of Organization’s Commitment to a Diverse and Inclusive Workplace
Very unimportant Unimportant Important Very important
(n = 592)
Source: 2011 Employee Job Satisfaction and Engagement: A Research Report by SHRM
9%
42%
26%22%
Figure 31 | Importance of Organization’s Commitment to a “Green” Workplace
Very unimportant Unimportant Important Very important
(n = 590)
Source: 2011 Employee Job Satisfaction and Engagement: A Research Report by SHRM
15%
41%
28%
17%
34 | 2011 Employee Job Satisfaction and Engagement
There are many reasons an organization might invest in a green workplace� According to Advancing Sustainability: HR’s Role, a research report by SHRM, BSR and Aurosoorya, the top three most frequently reported positive outcomes of organizations’ sustainable initiatives were improved employee morale, more efficient business processes and stronger public image�
2012 Top Trends from the SHRM Workplace Diversity Special Expertise Panel 1� The “jobless recovery” is forcing many organizations to increase their
workload beyond reasonable expectations, resulting in burnout, decreased engagement and an inability to implement effective workplace flexibility; this may affect some employee demographics more than others�
2� Postponed retirements are affecting talent management (of all generational cohorts), generational demographics and psychographics�
3� Now that the disability community is both the largest and the fastest growing minority in the world, organizations will be reacting to various legislation (ADAAA in the U�S�, quotas in other parts of the world) and issues related to the inclusion of employees with disabilities�
4� Advances in technology are allowing unique instances of discrimination and other misbehavior to “go viral” nearly overnight, requiring organizations to anticipate and manage to their brand more quickly than ever before�
5� The lack of a set career path and effective succession planning for diversity and inclusion professionals continues to malign the importance of the diversity and inclusion function within organizations�
6� Troop withdrawals in the Middle East will necessitate the inclusion of greater numbers of combat veterans into the civilian workforce than ever before, requiring organizations to obtain greater knowledge of PTSD (post-traumatic stress disorder), TBI (traumatic brain injury), other combat-related disabilities and military culture�
7� Continuing political and religious polarization around the world is fracturing the social fabric of historically moderate and conciliatory societies, creating confrontational and disharmonious workplace environments (in the U�S�, this is particularly relevant due to the 10th anniversary of Sept� 11 and upcoming presidential election)�
8� The increase of EEOC claims is forcing organizations to spend more time and resources on complaints, investigations and prevention of instances of retali-ation, rather than on proactive or strategic diversity and inclusion initiatives�
9� Old modes of racial demographics are becoming obsolete due to increasing numbers within the biracial and multiracial segments�
10� More states are and will be enacting laws supporting same-sex marriages or civil unions, adding greater complexity to workplace culture as it relates to LGBT inclusion and total rewards structures�
Note: Trends sorted in order of importance, with the first trend being the most important.
Source: Future Insights: The top trends for 2012 according to SHRM’s HR subject matter expert panels (SHRM, 2011)


Survey Results: Employee Engagement
2011 Employee Job Satisfaction and Engagement | 37
Job satisfaction refers to how employees feel about their compensation, benefits, work environment, career development and relationship with management. Employee engagement is about employees’ commitment and connection at work—what is motivating employees to work harder, who is motivating them to work harder and what conditions are motivating them to work harder.
New this year, the survey expanded to include some questions around employee engagement based on a well-established engagement theory and body of research�10 After the recent recession and the continued economic uncertainty that continues to challenge many organizations, HR professionals and their organization’s leaders will need to engage their employees to remain competitive and retain the best talent�
How does employee engagement differ from job satisfaction? Job satisfaction refers to how employees feel about their compensation, benefits, work environ-ment, career development and relationship with management� Employee engagement is about employees’ commitment and connection at work—what is motivating employees to work harder, who is motivating them to work harder and what conditions are motivating them to work harder�
Many organizations that survived the recession are relying on their workforce to help them stay ahead of their competitors and manage their bottom line� Because of the recession and slow recovery, organizations’ resources have been stretched, and some employees may be feeling fatigued, dissatisfied and disen-gaged�
Why should organizations care about their workforce engagement level? Many studies have linked employee engagement to employee performance, customer satisfaction, productivity, absenteeism, turnover and support of the organization� In this research, employee engagement is divided into three areas—the “feel,” the “look” and the conditions of engagement�
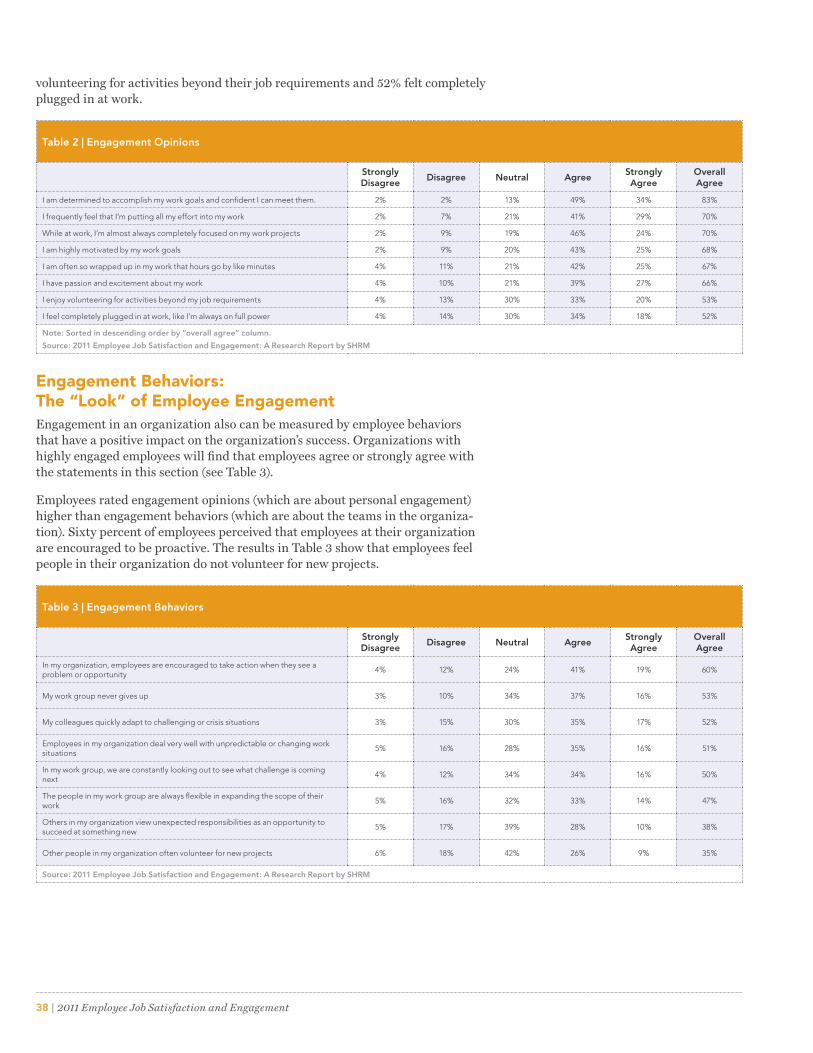
Engagement Opinions: The “Feel” of Employee EngagementPersonal engagement is defined by feelings of urgency, focus, enthusiasm and intensity� It is the energized feeling that an employee has about work� Employees with high engagement will generally agree or strongly agree with the eight state-ments in this section (see Table 2)�
The findings indicate that employees were feeling the urgency and intensity in their work� Eighty-three percent of employees agreed (34% strongly agreed and 49% agreed) that they were determined to accomplish their work goals and confident that they could meet those goals� Seventy percent of employees said they were frequently putting all their effort into their work and were completely focused on their work projects� Slightly more than one half of employees reported feeling focused and enthusiastic about their work, 53% said that they enjoyed
Engagement
38 | 2011 Employee Job Satisfaction and Engagement
volunteering for activities beyond their job requirements and 52% felt completely plugged in at work�
Table 2 | Engagement Opinions
Strongly Disagree
Disagree Neutral AgreeStrongly Agree
Overall Agree
I am determined to accomplish my work goals and confident I can meet them. 2% 2% 13% 49% 34% 83%
I frequently feel that I’m putting all my effort into my work 2% 7% 21% 41% 29% 70%
While at work, I’m almost always completely focused on my work projects 2% 9% 19% 46% 24% 70%
I am highly motivated by my work goals 2% 9% 20% 43% 25% 68%
I am often so wrapped up in my work that hours go by like minutes 4% 11% 21% 42% 25% 67%
I have passion and excitement about my work 4% 10% 21% 39% 27% 66%
I enjoy volunteering for activities beyond my job requirements 4% 13% 30% 33% 20% 53%
I feel completely plugged in at work, like I’m always on full power 4% 14% 30% 34% 18% 52%
Note: Sorted in descending order by “overall agree” column.
Source: 2011 Employee Job Satisfaction and Engagement: A Research Report by SHRM
Engagement Behaviors: The “Look” of Employee EngagementEngagement in an organization also can be measured by employee behaviors that have a positive impact on the organization’s success� Organizations with highly engaged employees will find that employees agree or strongly agree with the statements in this section (see Table 3)�
Employees rated engagement opinions (which are about personal engagement) higher than engagement behaviors (which are about the teams in the organiza-tion)� Sixty percent of employees perceived that employees at their organization are encouraged to be proactive� The results in Table 3 show that employees feel people in their organization do not volunteer for new projects�
Table 3 | Engagement Behaviors
Strongly Disagree
Disagree Neutral AgreeStrongly Agree
Overall Agree
In my organization, employees are encouraged to take action when they see a problem or opportunity
4% 12% 24% 41% 19% 60%
My work group never gives up 3% 10% 34% 37% 16% 53%
My colleagues quickly adapt to challenging or crisis situations 3% 15% 30% 35% 17% 52%
Employees in my organization deal very well with unpredictable or changing work situations
5% 16% 28% 35% 16% 51%
In my work group, we are constantly looking out to see what challenge is coming next
4% 12% 34% 34% 16% 50%
The people in my work group are always flexible in expanding the scope of their work
5% 16% 32% 33% 14% 47%
Others in my organization view unexpected responsibilities as an opportunity to succeed at something new
5% 17% 39% 28% 10% 38%
Other people in my organization often volunteer for new projects 6% 18% 42% 26% 9% 35%
Source: 2011 Employee Job Satisfaction and Engagement: A Research Report by SHRM
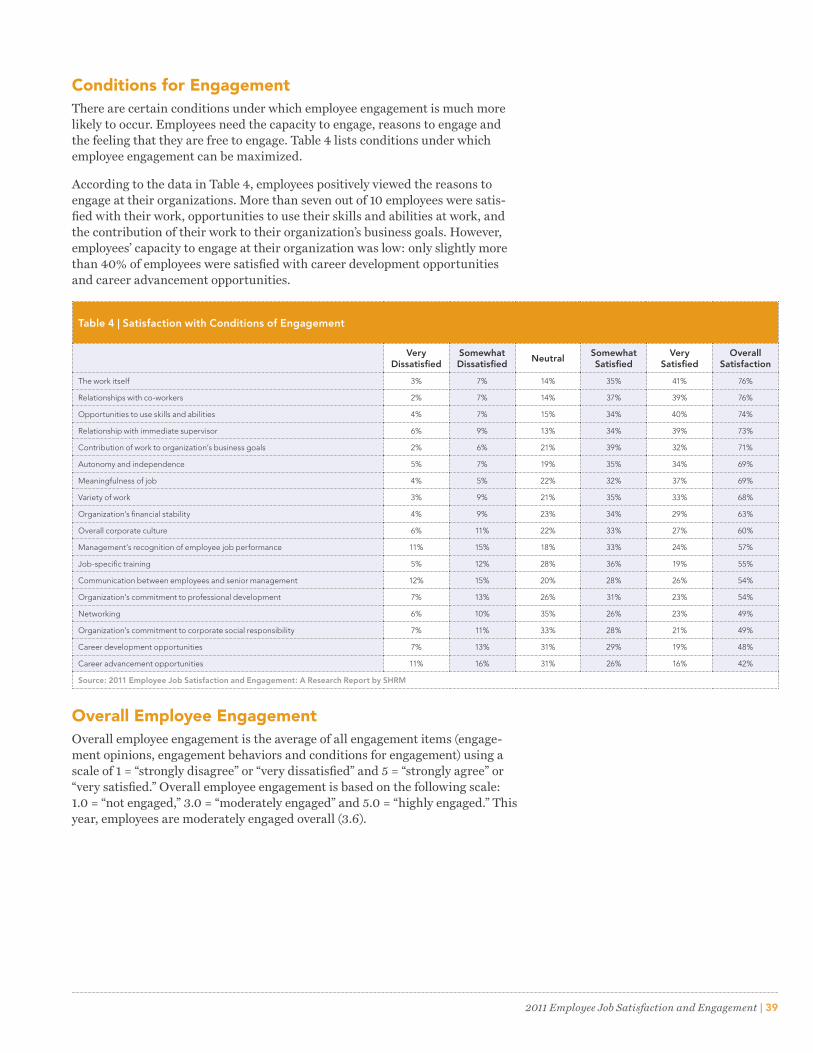
2011 Employee Job Satisfaction and Engagement | 39
Conditions for EngagementThere are certain conditions under which employee engagement is much more likely to occur� Employees need the capacity to engage, reasons to engage and the feeling that they are free to engage� Table 4 lists conditions under which employee engagement can be maximized�
According to the data in Table 4, employees positively viewed the reasons to engage at their organizations� More than seven out of 10 employees were satis-fied with their work, opportunities to use their skills and abilities at work, and the contribution of their work to their organization’s business goals� However, employees’ capacity to engage at their organization was low: only slightly more than 40% of employees were satisfied with career development opportunities and career advancement opportunities�
Table 4 | Satisfaction with Conditions of Engagement
Very Dissatisfied
Somewhat Dissatisfied
NeutralSomewhat Satisfied
Very Satisfied
Overall Satisfaction
The work itself 3% 7% 14% 35% 41% 76%
Relationships with co-workers 2% 7% 14% 37% 39% 76%
Opportunities to use skills and abilities 4% 7% 15% 34% 40% 74%
Relationship with immediate supervisor 6% 9% 13% 34% 39% 73%
Contribution of work to organization’s business goals 2% 6% 21% 39% 32% 71%
Autonomy and independence 5% 7% 19% 35% 34% 69%
Meaningfulness of job 4% 5% 22% 32% 37% 69%
Variety of work 3% 9% 21% 35% 33% 68%
Organization’s financial stability 4% 9% 23% 34% 29% 63%
Overall corporate culture 6% 11% 22% 33% 27% 60%
Management’s recognition of employee job performance 11% 15% 18% 33% 24% 57%
Job-specific training 5% 12% 28% 36% 19% 55%
Communication between employees and senior management 12% 15% 20% 28% 26% 54%
Organization’s commitment to professional development 7% 13% 26% 31% 23% 54%
Networking 6% 10% 35% 26% 23% 49%
Organization’s commitment to corporate social responsibility 7% 11% 33% 28% 21% 49%
Career development opportunities 7% 13% 31% 29% 19% 48%
Career advancement opportunities 11% 16% 31% 26% 16% 42%
Source: 2011 Employee Job Satisfaction and Engagement: A Research Report by SHRM
Overall Employee EngagementOverall employee engagement is the average of all engagement items (engage-ment opinions, engagement behaviors and conditions for engagement) using a scale of 1 = “strongly disagree” or “very dissatisfied” and 5 = “strongly agree” or “very satisfied�” Overall employee engagement is based on the following scale: 1�0 = “not engaged,” 3�0 = “moderately engaged” and 5�0 = “highly engaged�” This year, employees are moderately engaged overall (3�6)�
40 | 2011 Employee Job Satisfaction and Engagement
“All the surveys ... consistently show that only a small minority of employees feel fully engaged at work. The reason is that employers are so busy trying to get more out of their workforce that they’ve all but lost sight of meeting the most fundamental needs of their employees.”
• Is it true that only a small percentage of workers are truly engaged with their jobs? Please explain why this is the case in today’s labor environment.
All the surveys, from Gallup to Towers Watson, consistently show that only a small minor-ity of employees feel fully engaged at work. From our perspective at The Energy Project, the reason is that employers are so busy trying to get more out of their workforce that they’ve all but lost sight of meeting the most fundamental needs of their employees. We see those needs as physical (for energy), emotional (for appreciation), mental (for self-expression) and spiritual (for meaning). The more employees feel preoccupied by those unmet needs, the less energy they bring to work every day.
•Do you think employee satisfaction improved during the recent recession, based on the fact that those employed were simply happy to have jobs? If not, why?
There is little question that employee satisfaction deteriorated, in many cases dramati-cally, during the recession. And for most people, that recession isn’t over. From a pure survival perspective, many employees were relieved to have jobs. That’s very different than satisfaction. It’s deeply unsettling, frightening and even traumatizing to watch those around you being laid off. Those layoffs, in turn, put more work on a smaller group of people—the survivors—who were often already feeling overworked. It also left them feeling uncertain and anxious about their own futures. None of this serves satisfaction or engagement.
Expert Q & ATony Schwartz, CEO, The Energy Project
2011 Employee Job Satisfaction and Engagement | 41
“Human beings are not meant to operate like computers, at high speeds, continuously, for long periods of time. When we try to do so, we end up being run by our digital devices.”
•Going forward, how can HR play a role in improving employee satisfaction? Is it a matter of simply changing a few policies in the workplace?
I deeply believe that we’re at an inflection point. We’re in a new kind of energy crisis, and this one’s personal. Demand is exceeding our capacity. So long as we have sufficient fuel in our tanks, we don’t think much about capacity. Now, perhaps for the first time, we’re beginning to run on empty—the sense that it’s not sustainable—and virtually no company we’ve come across is actively addressing this issue.
The challenge to leaders, and to HR as their partners, is to help employees systematically build their capacity, and to provide support for doing so in the form of policies, prac-tices, facilities and cultural messages. Just one example: Human beings are not meant to operate like computers, at high speeds, continuously, for long periods of time. When we try to do so, we end up being run by our digital devices.
We need a new workplace paradigm built around the fact that human beings are designed to pulse between spending and renewing energy. Counterintuitive as it may seem, intermittent rest and recovery actually fuel sustainable high performance—espe-cially when demand is high.
•Workplace flexibility is a hot topic at the moment, but benefits like telecommuting and flex schedules are not realistic in all workplaces. What are the alternatives as far as offering a less rigid 9-to-5 work schedule?
Flexibility isn’t an option—it’s a necessity if you want to get the best from any given individual. The reason is that every human being has different needs and different rhythms. The starting point with any valued employee ought to be, “What can we do to empower you to bring the best of yourself to work every day?” That means accommo-dating a range of ways of working, even if doing so requires being creative and thinking out of the box.
• If employers do not get more creative with workplace flexibility and related benefits, what will be the result, and how will that affect our labor force in the future?
If people are truly an employer’s greatest asset—as so many regularly say—then they ought to be actively investing in those assets. We know, from overwhelming evidence and also from common sense, that the better people feel at work, the better they perform. If they’re encouraged to take care of themselves, feel valued, have opportuni-ties to express their unique talents and believe what they’re doing is meaningful, they’re going to be more loyal and engaged and higher performing. Employers that address this reality in authentic and systematic ways will build huge competitive advantage in the years ahead.

Conclusions
2011 Employee Job Satisfaction and Engagement | 43
Many of the aspects rated as very important to employee job satisfaction received low ratings when it came to respondents’ actual level of satisfaction.
It is no doubt that the factors that influence employee job satisfaction and engagement are dynamic in nature� These factors include internal and external ones, such as restructuring, demographic makeup of the organization, change in management, economic change, political change, global change and many oth-ers� This makes it difficult at times for HR professionals and employers to hone in on aspects most important to employee satisfaction and engagement�
Findings from this research reveal that:
• Employees are overall satisfied with their jobs, with 41% “very satisfied” and 42% “somewhat satisfied�”
• Employees are moderately engaged�
• Employees are looking for security in their job and their organization’s fi-nances�
• Employees are looking to build a better relationship with upper management�
• Employees are determined to accomplish their work goals and confident in their ability to do so�
Many of the aspects rated as very important to employee job satisfaction received low ratings when it came to respondents’ actual level of satisfaction� Less than three out of 10 employees reported feeling very satisfied with their organization’s financial stability, job security, benefits, communication between employees and senior management, and compensation (see Table 6)—all of which were rated among the top five “very important” contributors to job satisfaction� Employees also reported dissatisfaction with career development and advancement opportunities, which are among factors that affect their capac-ity to engage�
What can HR professionals and employers do? HR professionals are strategically situated to help their organizations cultivate a culture that promotes employee engagement and job satisfaction through policies and practices, training line managers to better communicate the company’s mission and vision, and involv-ing line managers in the organization’s strategic planning� HR professionals also can evaluate their employee engagement and job satisfaction by benchmarking their organization’s employee survey results against others in their industry and against organizations of similar size using products and services such as SHRM Customized Benchmarking Service and SHRM People InSight�
What Can HR Professionals and Employers Do?
44 | 2011 Employee Job Satisfaction and Engagement
MethodologyThe sample of employees was randomly selected by an outside survey research organization’s web-enabled employee panel, which is based on the American Community Study� A total of 600 individuals completed the online 2011 Job Satisfaction Survey, yielding a response rate of 83%� The survey was in the field for a period of seven days� All respondents were employed, either full time or part time� Comparing the 600 employees in this survey to the 2010 sample of employees showed that the 2011 sample had more Baby Boomers than the 2010 sample�
Notations Analysis: Throughout this report, conventional statistical methods are used to determine if observed differences are statistically significant (i�e�, there is a small likelihood that the differences occurred by chance)� When presenting data from the overall survey results, findings are discussed, in some cases, even if they are not statistically significant� In some cases, the data are not depicted in corresponding tables/figures even though the results are statistically significant� Additional analyses by employee job tenure, gender, job level and age were conducted�
• Organization staff size categories: small (1 to 99 employees), medium (100 to 499 employees) and large (500 or more employees)�
• Employee job tenure categories, or total years with the company: two years or less, three to five years, six to 10 years, 11 to 15 years, and 16 years or more�
• Employee job level: nonmanagement (e�g�, assistant, coordinator, specialist), professional nonmanagement (e�g�, analyst, nurse, engineer), middle manage-ment (e�g�, manager, supervisor, director) and executive level (e�g�, CEO, CFO)�
• Employee age categories: Millennials (born 1981 and after), Generation X (born 1965-1980), Baby Boomers (born 1945-1964), and Veterans (born before 1945)�
Tables: Unless otherwise noted in a specific table, please note that the following are applicable to data depicted in tables throughout this report�
• Data are sorted in descending order by “overall” column in a table�
About the Research
2011 Employee Job Satisfaction and Engagement | 45
• Percentages for a question or a response option may not total 100% due to rounding�
• Tables include only response options for which there were significant differ-ences�
Figures: Unless otherwise noted in a specific figure, the following are applicable to data depicted in figures throughout this report�
• Percentages for a question may not total 100% due to rounding�
Generalization of results: As with any research, readers should exercise caution when generalizing results and take individual circumstances and experi-ences into consideration when making decisions based on these data� While SHRM is confident in its research, it is prudent to understand that the results presented in this survey report are only truly representative of the sample of employees responding to the survey�
Number of respondents: The number of respondents (indicated by “n” in figures and tables) varies from table to table and figure to figure because some respon-dents did not answer all of the questions� Individuals may not have responded to a question on the survey because the question or some of its parts were not applicable or because the requested data were unavailable� This also accounts for the varying number of responses within each table or figure�
Confidence level and margin of error: A confidence level and margin of error give readers some measure of how much they can rely on survey responses to represent all U�S� employees� Given the level of response to the survey, SHRM Research is 96% confident that responses given by responding employees can be applied to all U�S� employees, in general, with a margin of error of approximately 4%� For example, 55% of the responding employees reported that the relation-ship with immediate supervisor was very important for employees’ job satisfac-tion� With a 4% margin of error, the reader can be 96% certain that between 51% and 59% of employees believe that the relationship with immediate supervisor is very important to employee job satisfaction� It is important to know that as the sample size decreases, the margin of error increases�
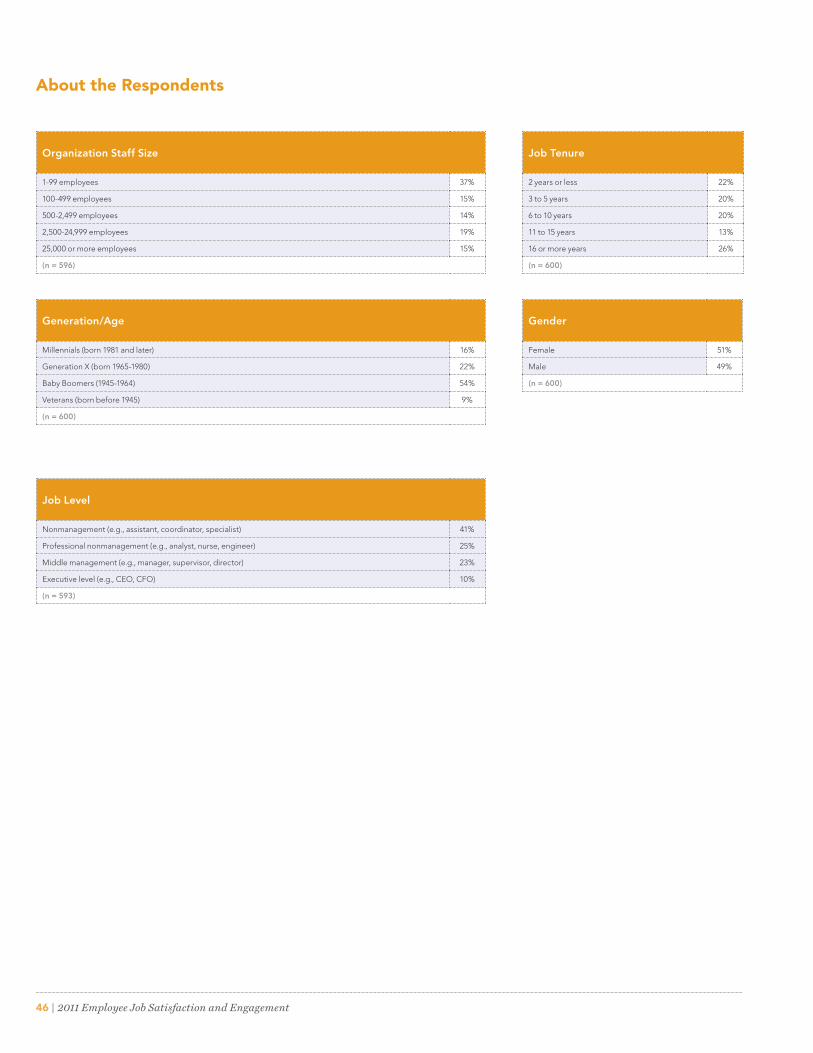
46 | 2011 Employee Job Satisfaction and Engagement
Job Tenure
2 years or less 22%
3 to 5 years 20%
6 to 10 years 20%
11 to 15 years 13%
16 or more years 26%
(n = 600)
Gender
Female 51%
Male 49%
(n = 600)
About the Respondents
Organization Staff Size
1-99 employees 37%
100-499 employees 15%
500-2,499 employees 14%
2,500-24,999 employees 19%
25,000 or more employees 15%
(n = 596)
Generation/Age
Millennials (born 1981 and later) 16%
Generation X (born 1965-1980) 22%
Baby Boomers (1945-1964) 54%
Veterans (born before 1945) 9%
(n = 600)
Job Level
Nonmanagement (e.g., assistant, coordinator, specialist) 41%
Professional nonmanagement (e.g., analyst, nurse, engineer) 25%
Middle management (e.g., manager, supervisor, director) 23%
Executive level (e.g., CEO, CFO) 10%
(n = 593)
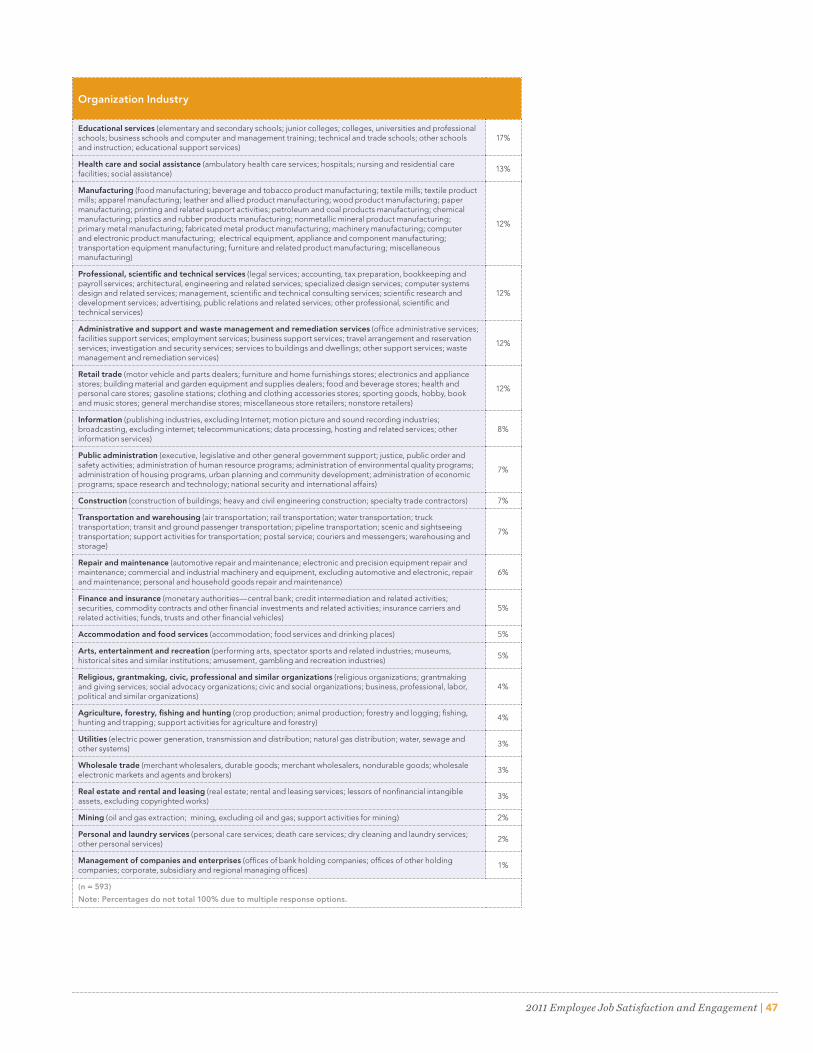
2011 Employee Job Satisfaction and Engagement | 47
Organization Industry
Educational services (elementary and secondary schools; junior colleges; colleges, universities and professional schools; business schools and computer and management training; technical and trade schools; other schools and instruction; educational support services)
17%
Health care and social assistance (ambulatory health care services; hospitals; nursing and residential care facilities; social assistance)
13%
Manufacturing (food manufacturing; beverage and tobacco product manufacturing; textile mills; textile product mills; apparel manufacturing; leather and allied product manufacturing; wood product manufacturing; paper manufacturing; printing and related support activities; petroleum and coal products manufacturing; chemical manufacturing; plastics and rubber products manufacturing; nonmetallic mineral product manufacturing; primary metal manufacturing; fabricated metal product manufacturing; machinery manufacturing; computer and electronic product manufacturing; electrical equipment, appliance and component manufacturing; transportation equipment manufacturing; furniture and related product manufacturing; miscellaneous manufacturing)
12%
Professional, scientific and technical services (legal services; accounting, tax preparation, bookkeeping and payroll services; architectural, engineering and related services; specialized design services; computer systems design and related services; management, scientific and technical consulting services; scientific research and development services; advertising, public relations and related services; other professional, scientific and technical services)
12%
Administrative and support and waste management and remediation services (office administrative services; facilities support services; employment services; business support services; travel arrangement and reservation services; investigation and security services; services to buildings and dwellings; other support services; waste management and remediation services)
12%
Retail trade (motor vehicle and parts dealers; furniture and home furnishings stores; electronics and appliance stores; building material and garden equipment and supplies dealers; food and beverage stores; health and personal care stores; gasoline stations; clothing and clothing accessories stores; sporting goods, hobby, book and music stores; general merchandise stores; miscellaneous store retailers; nonstore retailers)
12%
Information (publishing industries, excluding Internet; motion picture and sound recording industries; broadcasting, excluding internet; telecommunications; data processing, hosting and related services; other information services)
8%
Public administration (executive, legislative and other general government support; justice, public order and safety activities; administration of human resource programs; administration of environmental quality programs; administration of housing programs, urban planning and community development; administration of economic programs; space research and technology; national security and international affairs)
7%
Construction (construction of buildings; heavy and civil engineering construction; specialty trade contractors) 7%
Transportation and warehousing (air transportation; rail transportation; water transportation; truck transportation; transit and ground passenger transportation; pipeline transportation; scenic and sightseeing transportation; support activities for transportation; postal service; couriers and messengers; warehousing and storage)
7%
Repair and maintenance (automotive repair and maintenance; electronic and precision equipment repair and maintenance; commercial and industrial machinery and equipment, excluding automotive and electronic, repair and maintenance; personal and household goods repair and maintenance)
6%
Finance and insurance (monetary authorities—central bank; credit intermediation and related activities; securities, commodity contracts and other financial investments and related activities; insurance carriers and related activities; funds, trusts and other financial vehicles)
5%
Accommodation and food services (accommodation; food services and drinking places) 5%
Arts, entertainment and recreation (performing arts, spectator sports and related industries; museums, historical sites and similar institutions; amusement, gambling and recreation industries)
5%
Religious, grantmaking, civic, professional and similar organizations (religious organizations; grantmaking and giving services; social advocacy organizations; civic and social organizations; business, professional, labor, political and similar organizations)
4%
Agriculture, forestry, fishing and hunting (crop production; animal production; forestry and logging; fishing, hunting and trapping; support activities for agriculture and forestry)
4%
Utilities (electric power generation, transmission and distribution; natural gas distribution; water, sewage and other systems)
3%
Wholesale trade (merchant wholesalers, durable goods; merchant wholesalers, nondurable goods; wholesale electronic markets and agents and brokers)
3%
Real estate and rental and leasing (real estate; rental and leasing services; lessors of nonfinancial intangible assets, excluding copyrighted works)
3%
Mining (oil and gas extraction; mining, excluding oil and gas; support activities for mining) 2%
Personal and laundry services (personal care services; death care services; dry cleaning and laundry services; other personal services)
2%
Management of companies and enterprises (offices of bank holding companies; offices of other holding companies; corporate, subsidiary and regional managing offices)
1%
(n = 593)
Note: Percentages do not total 100% due to multiple response options.

Appendix
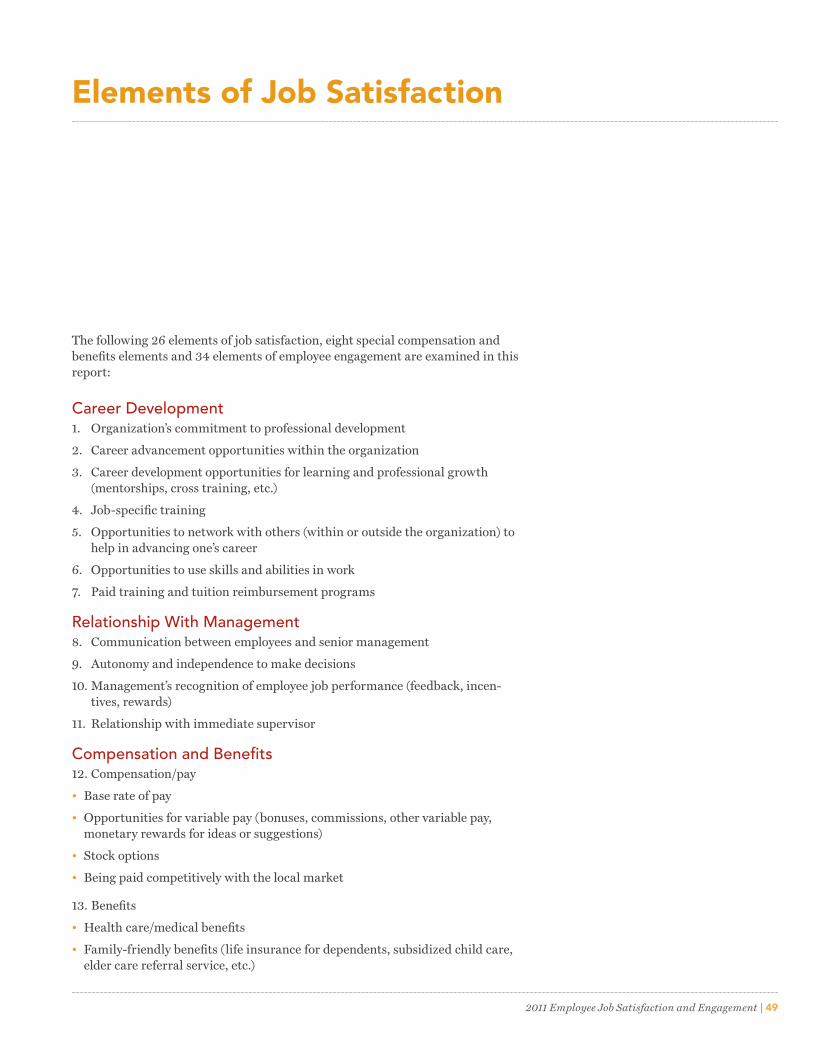
2011 Employee Job Satisfaction and Engagement | 49
Elements of Job Satisfaction
The following 26 elements of job satisfaction, eight special compensation and benefits elements and 34 elements of employee engagement are examined in this report:
Career Development1� Organization’s commitment to professional development
2� Career advancement opportunities within the organization
3� Career development opportunities for learning and professional growth (mentorships, cross training, etc�)
4� Job-specific training
5� Opportunities to network with others (within or outside the organization) to help in advancing one’s career
6� Opportunities to use skills and abilities in work
7� Paid training and tuition reimbursement programs
Relationship With Management8� Communication between employees and senior management
9� Autonomy and independence to make decisions
10� Management’s recognition of employee job performance (feedback, incen-tives, rewards)
11� Relationship with immediate supervisor
Compensation and Benefits 12� Compensation/pay
• Base rate of pay
• Opportunities for variable pay (bonuses, commissions, other variable pay, monetary rewards for ideas or suggestions)
• Stock options
• Being paid competitively with the local market
13� Benefits
• Health care/medical benefits
• Family-friendly benefits (life insurance for dependents, subsidized child care, elder care referral service, etc�)
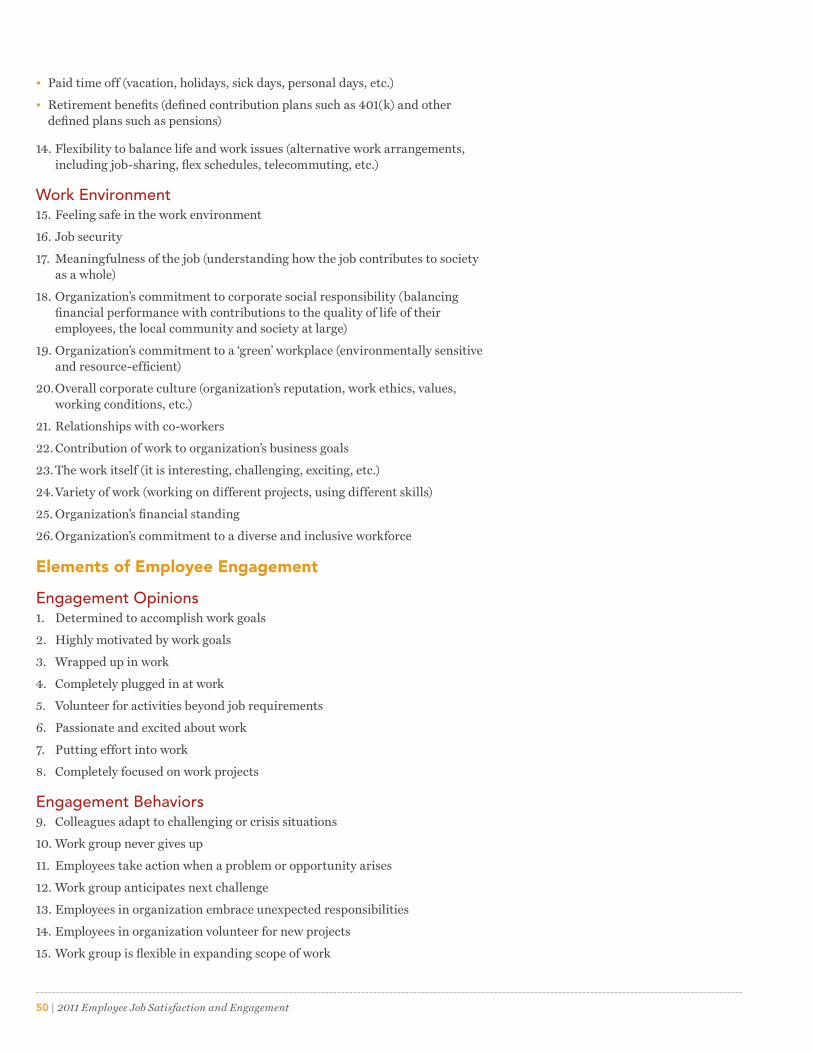
50 | 2011 Employee Job Satisfaction and Engagement
• Paid time off (vacation, holidays, sick days, personal days, etc�)
• Retirement benefits (defined contribution plans such as 401(k) and other defined plans such as pensions)
14� Flexibility to balance life and work issues (alternative work arrangements, including job-sharing, flex schedules, telecommuting, etc�)
Work Environment 15� Feeling safe in the work environment
16� Job security
17� Meaningfulness of the job (understanding how the job contributes to society as a whole)
18� Organization’s commitment to corporate social responsibility (balancing financial performance with contributions to the quality of life of their employees, the local community and society at large)
19� Organization’s commitment to a ‘green’ workplace (environmentally sensitive and resource-efficient)
20� Overall corporate culture (organization’s reputation, work ethics, values, working conditions, etc�)
21� Relationships with co-workers
22� Contribution of work to organization’s business goals
23� The work itself (it is interesting, challenging, exciting, etc�)
24� Variety of work (working on different projects, using different skills)
25� Organization’s financial standing
26� Organization’s commitment to a diverse and inclusive workforce
Elements of Employee Engagement
Engagement Opinions 1� Determined to accomplish work goals
2� Highly motivated by work goals
3� Wrapped up in work
4� Completely plugged in at work
5� Volunteer for activities beyond job requirements
6� Passionate and excited about work
7� Putting effort into work
8� Completely focused on work projects
Engagement Behaviors9� Colleagues adapt to challenging or crisis situations
10� Work group never gives up
11� Employees take action when a problem or opportunity arises
12� Work group anticipates next challenge
13� Employees in organization embrace unexpected responsibilities
14� Employees in organization volunteer for new projects
15� Work group is flexible in expanding scope of work
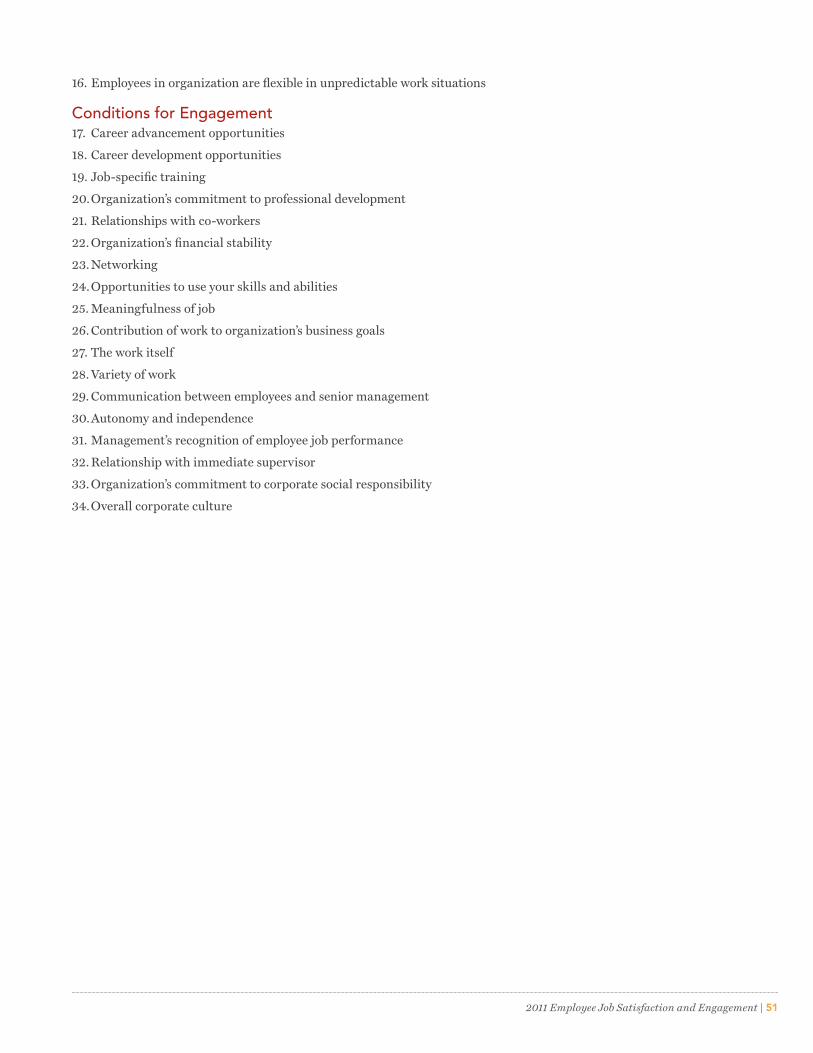
2011 Employee Job Satisfaction and Engagement | 51
16� Employees in organization are flexible in unpredictable work situations
Conditions for Engagement17� Career advancement opportunities
18� Career development opportunities
19� Job-specific training
20� Organization’s commitment to professional development
21� Relationships with co-workers
22� Organization’s financial stability
23� Networking
24� Opportunities to use your skills and abilities
25� Meaningfulness of job
26� Contribution of work to organization’s business goals
27� The work itself
28� Variety of work
29� Communication between employees and senior management
30� Autonomy and independence
31� Management’s recognition of employee job performance
32� Relationship with immediate supervisor
33� Organization’s commitment to corporate social responsibility
34� Overall corporate culture
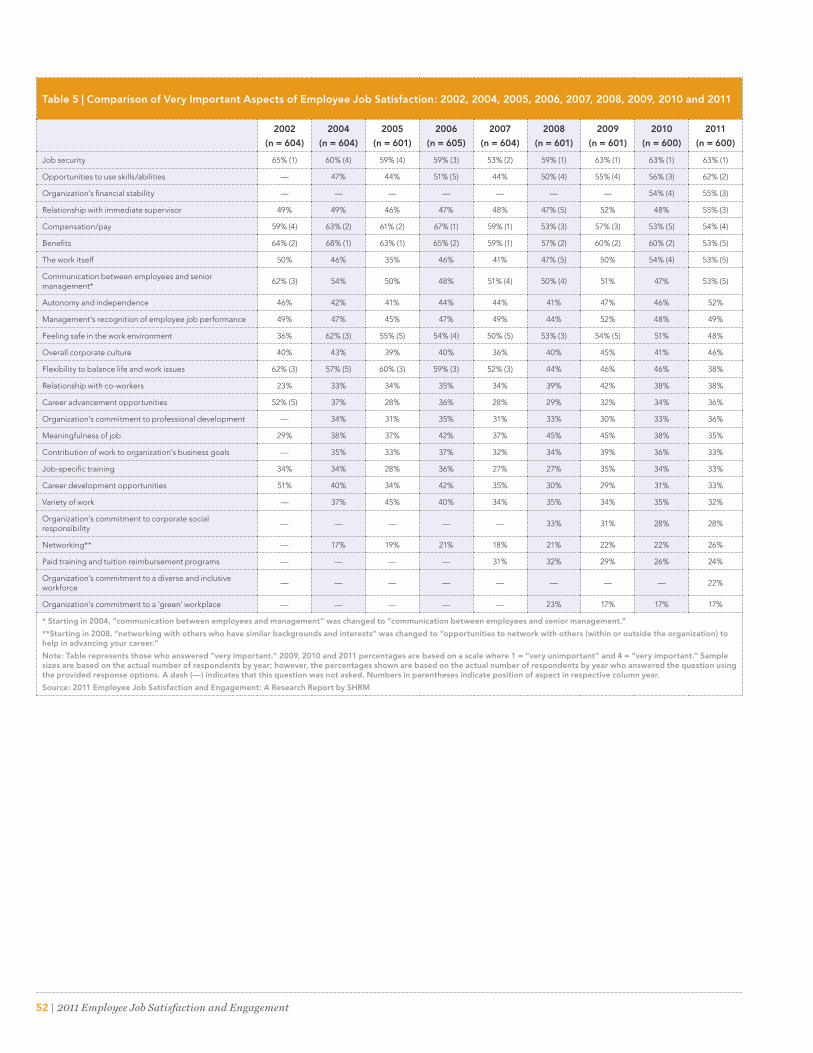
52 | 2011 Employee Job Satisfaction and Engagement
Table 5 | Comparison of Very Important Aspects of Employee Job Satisfaction: 2002, 2004, 2005, 2006, 2007, 2008, 2009, 2010 and 2011
2002
(n = 604)
2004
(n = 604)
2005
(n = 601)
2006
(n = 605)
2007
(n = 604)
2008
(n = 601)
2009
(n = 601)
2010
(n = 600)
2011
(n = 600)
Job security 65% (1) 60% (4) 59% (4) 59% (3) 53% (2) 59% (1) 63% (1) 63% (1) 63% (1)
Opportunities to use skills/abilities — 47% 44% 51% (5) 44% 50% (4) 55% (4) 56% (3) 62% (2)
Organization’s financial stability — — — — — — — 54% (4) 55% (3)
Relationship with immediate supervisor 49% 49% 46% 47% 48% 47% (5) 52% 48% 55% (3)
Compensation/pay 59% (4) 63% (2) 61% (2) 67% (1) 59% (1) 53% (3) 57% (3) 53% (5) 54% (4)
Benefits 64% (2) 68% (1) 63% (1) 65% (2) 59% (1) 57% (2) 60% (2) 60% (2) 53% (5)
The work itself 50% 46% 35% 46% 41% 47% (5) 50% 54% (4) 53% (5)
Communication between employees and senior management*
62% (3) 54% 50% 48% 51% (4) 50% (4) 51% 47% 53% (5)
Autonomy and independence 46% 42% 41% 44% 44% 41% 47% 46% 52%
Management’s recognition of employee job performance 49% 47% 45% 47% 49% 44% 52% 48% 49%
Feeling safe in the work environment 36% 62% (3) 55% (5) 54% (4) 50% (5) 53% (3) 54% (5) 51% 48%
Overall corporate culture 40% 43% 39% 40% 36% 40% 45% 41% 46%
Flexibility to balance life and work issues 62% (3) 57% (5) 60% (3) 59% (3) 52% (3) 44% 46% 46% 38%
Relationship with co-workers 23% 33% 34% 35% 34% 39% 42% 38% 38%
Career advancement opportunities 52% (5) 37% 28% 36% 28% 29% 32% 34% 36%
Organization’s commitment to professional development — 34% 31% 35% 31% 33% 30% 33% 36%
Meaningfulness of job 29% 38% 37% 42% 37% 45% 45% 38% 35%
Contribution of work to organization’s business goals — 35% 33% 37% 32% 34% 39% 36% 33%
Job-specific training 34% 34% 28% 36% 27% 27% 35% 34% 33%
Career development opportunities 51% 40% 34% 42% 35% 30% 29% 31% 33%
Variety of work — 37% 45% 40% 34% 35% 34% 35% 32%
Organization’s commitment to corporate social responsibility
— — — — — 33% 31% 28% 28%
Networking** — 17% 19% 21% 18% 21% 22% 22% 26%
Paid training and tuition reimbursement programs — — — — 31% 32% 29% 26% 24%
Organization’s commitment to a diverse and inclusive workforce
— — — — — — — — 22%
Organization’s commitment to a ‘green’ workplace — — — — — 23% 17% 17% 17%
* Starting in 2004, “communication between employees and management” was changed to “communication between employees and senior management.”
**Starting in 2008, “networking with others who have similar backgrounds and interests” was changed to “opportunities to network with others (within or outside the organization) to help in advancing your career.”
Note: Table represents those who answered “very important.” 2009, 2010 and 2011 percentages are based on a scale where 1 = “very unimportant” and 4 = “very important.” Sample sizes are based on the actual number of respondents by year; however, the percentages shown are based on the actual number of respondents by year who answered the question using the provided response options. A dash (—) indicates that this question was not asked. Numbers in parentheses indicate position of aspect in respective column year.
Source: 2011 Employee Job Satisfaction and Engagement: A Research Report by SHRM
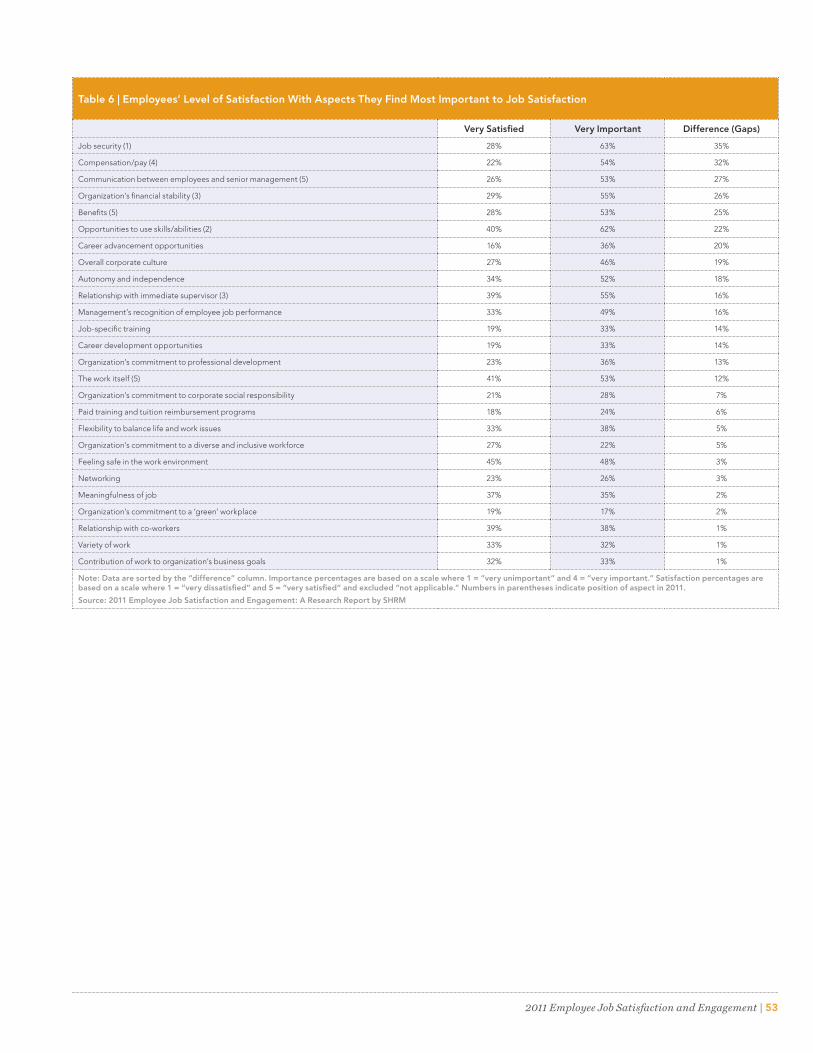
2011 Employee Job Satisfaction and Engagement | 53
Table 6 | Employees’ Level of Satisfaction With Aspects They Find Most Important to Job Satisfaction
Very Satisfied Very Important Difference (Gaps)
Job security (1) 28% 63% 35%
Compensation/pay (4) 22% 54% 32%
Communication between employees and senior management (5) 26% 53% 27%
Organization’s financial stability (3) 29% 55% 26%
Benefits (5) 28% 53% 25%
Opportunities to use skills/abilities (2) 40% 62% 22%
Career advancement opportunities 16% 36% 20%
Overall corporate culture 27% 46% 19%
Autonomy and independence 34% 52% 18%
Relationship with immediate supervisor (3) 39% 55% 16%
Management’s recognition of employee job performance 33% 49% 16%
Job-specific training 19% 33% 14%
Career development opportunities 19% 33% 14%
Organization’s commitment to professional development 23% 36% 13%
The work itself (5) 41% 53% 12%
Organization’s commitment to corporate social responsibility 21% 28% 7%
Paid training and tuition reimbursement programs 18% 24% 6%
Flexibility to balance life and work issues 33% 38% 5%
Organization’s commitment to a diverse and inclusive workforce 27% 22% 5%
Feeling safe in the work environment 45% 48% 3%
Networking 23% 26% 3%
Meaningfulness of job 37% 35% 2%
Organization’s commitment to a ‘green’ workplace 19% 17% 2%
Relationship with co-workers 39% 38% 1%
Variety of work 33% 32% 1%
Contribution of work to organization’s business goals 32% 33% 1%
Note: Data are sorted by the “difference” column. Importance percentages are based on a scale where 1 = “very unimportant” and 4 = “very important.” Satisfaction percentages are based on a scale where 1 = “very dissatisfied” and 5 = “very satisfied” and excluded “not applicable.” Numbers in parentheses indicate position of aspect in 2011.
Source: 2011 Employee Job Satisfaction and Engagement: A Research Report by SHRM
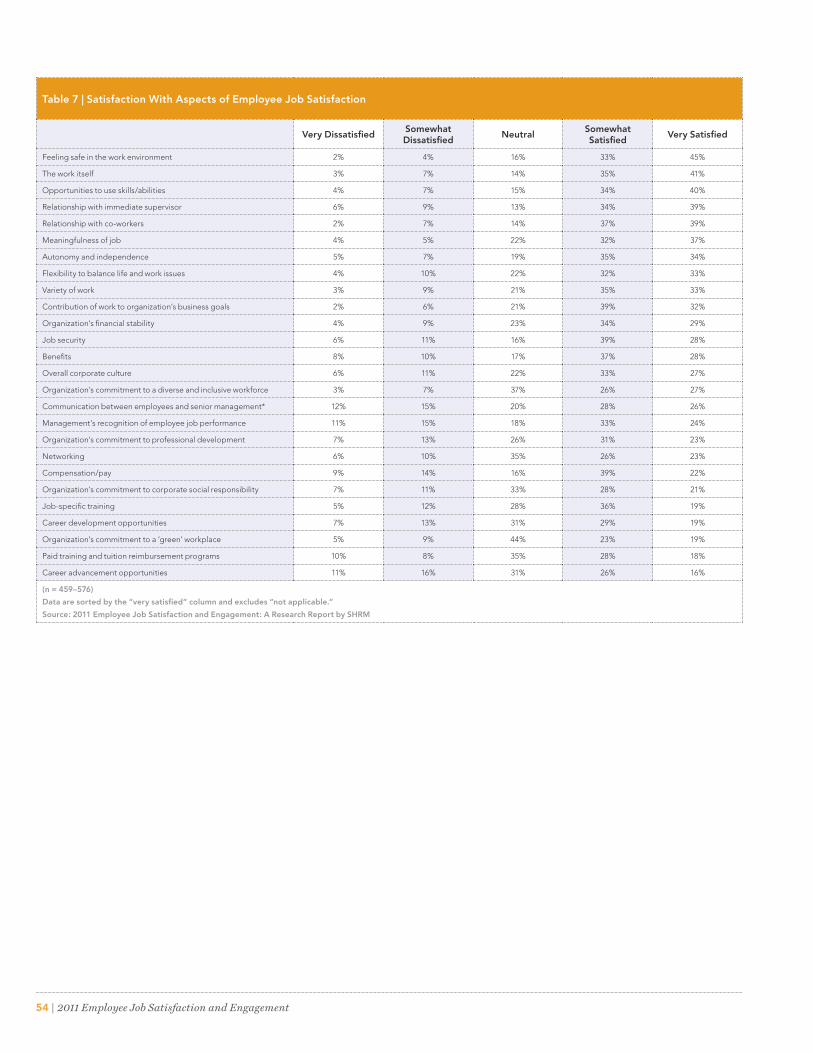
54 | 2011 Employee Job Satisfaction and Engagement
Table 7 | Satisfaction With Aspects of Employee Job Satisfaction
Very DissatisfiedSomewhat Dissatisfied
NeutralSomewhat Satisfied
Very Satisfied
Feeling safe in the work environment 2% 4% 16% 33% 45%
The work itself 3% 7% 14% 35% 41%
Opportunities to use skills/abilities 4% 7% 15% 34% 40%
Relationship with immediate supervisor 6% 9% 13% 34% 39%
Relationship with co-workers 2% 7% 14% 37% 39%
Meaningfulness of job 4% 5% 22% 32% 37%
Autonomy and independence 5% 7% 19% 35% 34%
Flexibility to balance life and work issues 4% 10% 22% 32% 33%
Variety of work 3% 9% 21% 35% 33%
Contribution of work to organization’s business goals 2% 6% 21% 39% 32%
Organization’s financial stability 4% 9% 23% 34% 29%
Job security 6% 11% 16% 39% 28%
Benefits 8% 10% 17% 37% 28%
Overall corporate culture 6% 11% 22% 33% 27%
Organization’s commitment to a diverse and inclusive workforce 3% 7% 37% 26% 27%
Communication between employees and senior management* 12% 15% 20% 28% 26%
Management’s recognition of employee job performance 11% 15% 18% 33% 24%
Organization’s commitment to professional development 7% 13% 26% 31% 23%
Networking 6% 10% 35% 26% 23%
Compensation/pay 9% 14% 16% 39% 22%
Organization’s commitment to corporate social responsibility 7% 11% 33% 28% 21%
Job-specific training 5% 12% 28% 36% 19%
Career development opportunities 7% 13% 31% 29% 19%
Organization’s commitment to a ‘green’ workplace 5% 9% 44% 23% 19%
Paid training and tuition reimbursement programs 10% 8% 35% 28% 18%
Career advancement opportunities 11% 16% 31% 26% 16%
(n = 459–576)
Data are sorted by the “very satisfied” column and excludes “not applicable.”
Source: 2011 Employee Job Satisfaction and Engagement: A Research Report by SHRM
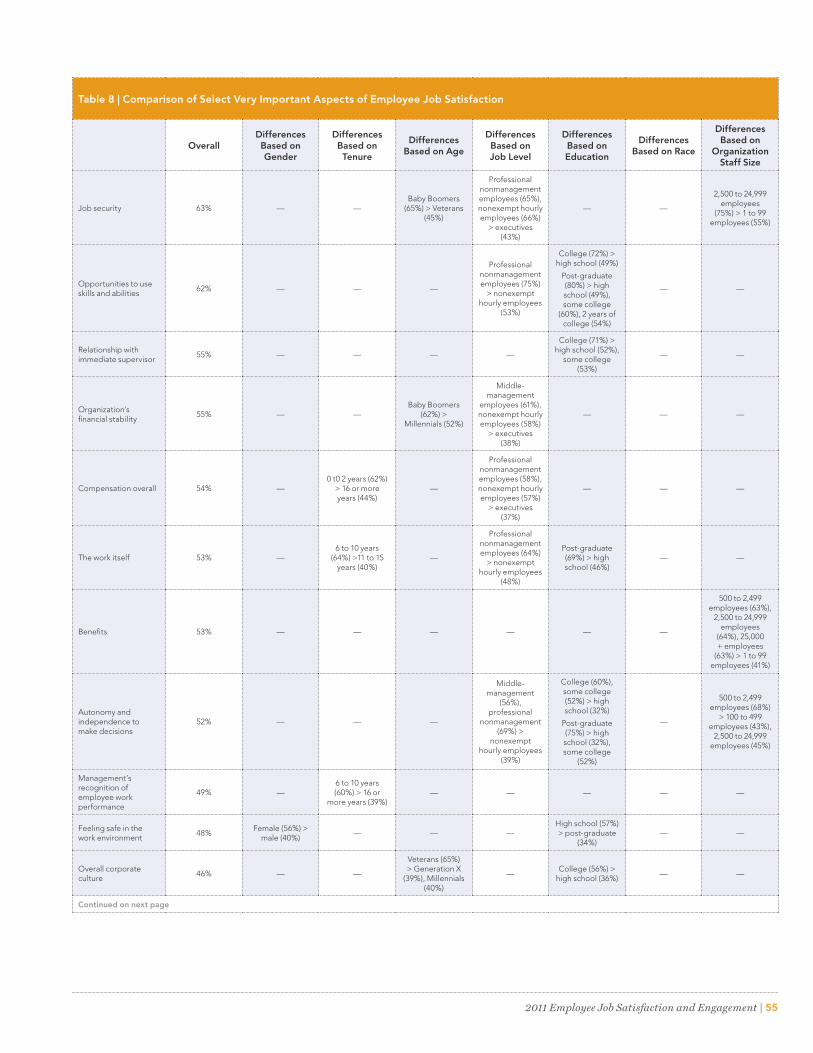
2011 Employee Job Satisfaction and Engagement | 55
Table 8 | Comparison of Select Very Important Aspects of Employee Job Satisfaction
OverallDifferences Based on Gender
Differences Based on Tenure
Differences Based on Age
Differences Based on Job Level
Differences Based on Education
Differences Based on Race
Differences Based on
Organization Staff Size
Job security 63% — —Baby Boomers
(65%) > Veterans (45%)
Professional nonmanagement employees (65%), nonexempt hourly employees (66%)
> executives (43%)
— —
2,500 to 24,999 employees
(75%) > 1 to 99 employees (55%)
Opportunities to use skills and abilities
62% — — —
Professional nonmanagement employees (75%)
> nonexempt hourly employees
(53%)
College (72%) > high school (49%)
Post-graduate (80%) > high school (49%), some college
(60%), 2 years of college (54%)
— —
Relationship with immediate supervisor
55% — — — —
College (71%) > high school (52%),
some college (53%)
— —
Organization’s financial stability
55% — —Baby Boomers
(62%) > Millennials (52%)
Middle-management
employees (61%), nonexempt hourly employees (58%)
> executives (38%)
— — —
Compensation overall 54% —0 t0 2 years (62%)
> 16 or more years (44%)
—
Professional nonmanagement employees (58%), nonexempt hourly employees (57%)
> executives (37%)
— — —
The work itself 53% —6 to 10 years
(64%) >11 to 15 years (40%)
—
Professional nonmanagement employees (64%)
> nonexempt hourly employees
(48%)
Post-graduate (69%) > high school (46%)
— —
Benefits 53% — — — — — —
500 to 2,499 employees (63%),
2,500 to 24,999 employees
(64%), 25,000 + employees
(63%) > 1 to 99 employees (41%)
Autonomy and independence to make decisions
52% — — —
Middle-management
(56%), professional
nonmanagement (69%) >
nonexempt hourly employees
(39%)
College (60%), some college (52%) > high school (32%)
Post-graduate (75%) > high school (32%), some college
(52%)
—
500 to 2,499 employees (68%)
> 100 to 499 employees (43%),
2,500 to 24,999 employees (45%)
Management’s recognition of employee work performance
49% —6 to 10 years (60%) > 16 or
more years (39%)— — — — —
Feeling safe in the work environment
48%Female (56%) >
male (40%)— — —
High school (57%) > post-graduate
(34%)— —
Overall corporate culture
46% — —
Veterans (65%) > Generation X
(39%), Millennials (40%)
—College (56%) >
high school (36%)— —
Continued on next page
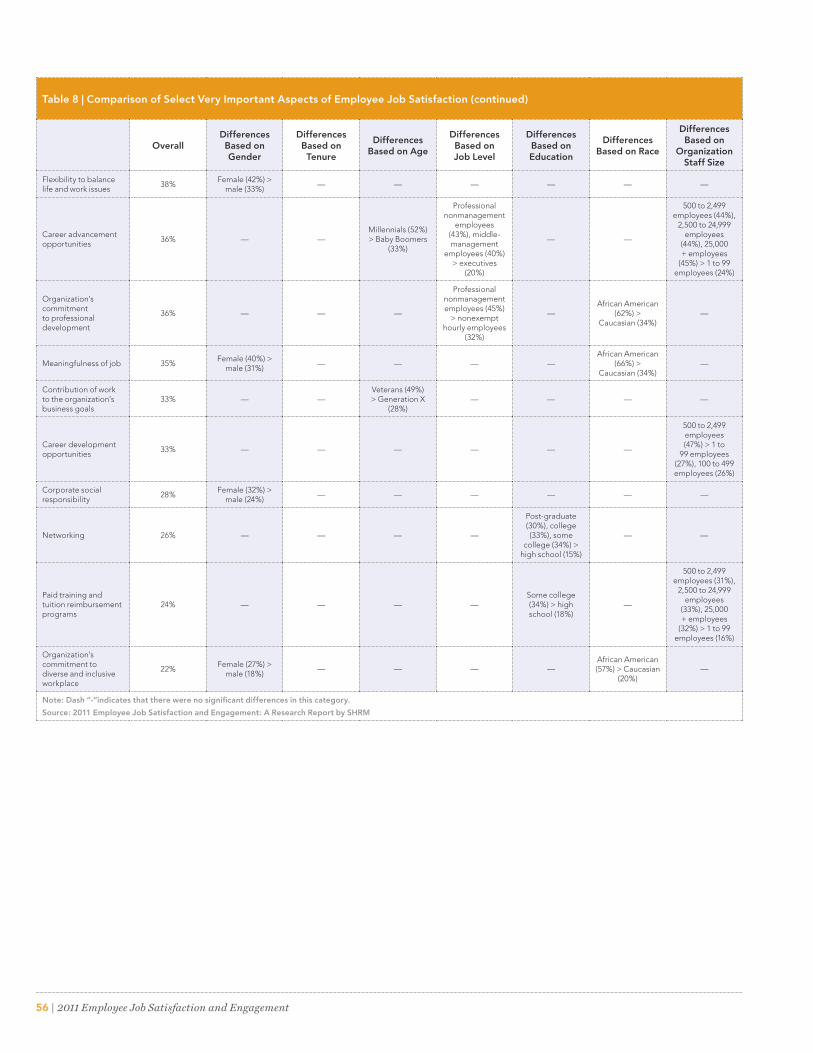
56 | 2011 Employee Job Satisfaction and Engagement
Table 8 | Comparison of Select Very Important Aspects of Employee Job Satisfaction (continued)
OverallDifferences Based on Gender
Differences Based on Tenure
Differences Based on Age
Differences Based on Job Level
Differences Based on Education
Differences Based on Race
Differences Based on
Organization Staff Size
Flexibility to balance life and work issues
38%Female (42%) >
male (33%)— — — — — —
Career advancement opportunities
36% — —Millennials (52%) > Baby Boomers
(33%)
Professional nonmanagement
employees (43%), middle-management
employees (40%) > executives
(20%)
— —
500 to 2,499 employees (44%),
2,500 to 24,999 employees
(44%), 25,000 + employees
(45%) > 1 to 99 employees (24%)
Organization’s commitment to professional development
36% — — —
Professional nonmanagement employees (45%)
> nonexempt hourly employees
(32%)
—African American
(62%) > Caucasian (34%)
—
Meaningfulness of job 35%Female (40%) >
male (31%)— — — —
African American (66%) >
Caucasian (34%)—
Contribution of work to the organization’s business goals
33% — —Veterans (49%) > Generation X
(28%)— — — —
Career development opportunities
33% — — — — — —
500 to 2,499 employees (47%) > 1 to
99 employees (27%), 100 to 499 employees (26%)
Corporate social responsibility
28%Female (32%) >
male (24%)— — — — — —
Networking 26% — — — —
Post-graduate (30%), college (33%), some
college (34%) > high school (15%)
— —
Paid training and tuition reimbursement programs
24% — — — —Some college (34%) > high school (18%)
—
500 to 2,499 employees (31%),
2,500 to 24,999 employees
(33%), 25,000 + employees
(32%) > 1 to 99 employees (16%)
Organization’s commitment to diverse and inclusive workplace
22%Female (27%) >
male (18%)— — — —
African American (57%) > Caucasian
(20%)—
Note: Dash “-“indicates that there were no significant differences in this category.
Source: 2011 Employee Job Satisfaction and Engagement: A Research Report by SHRM
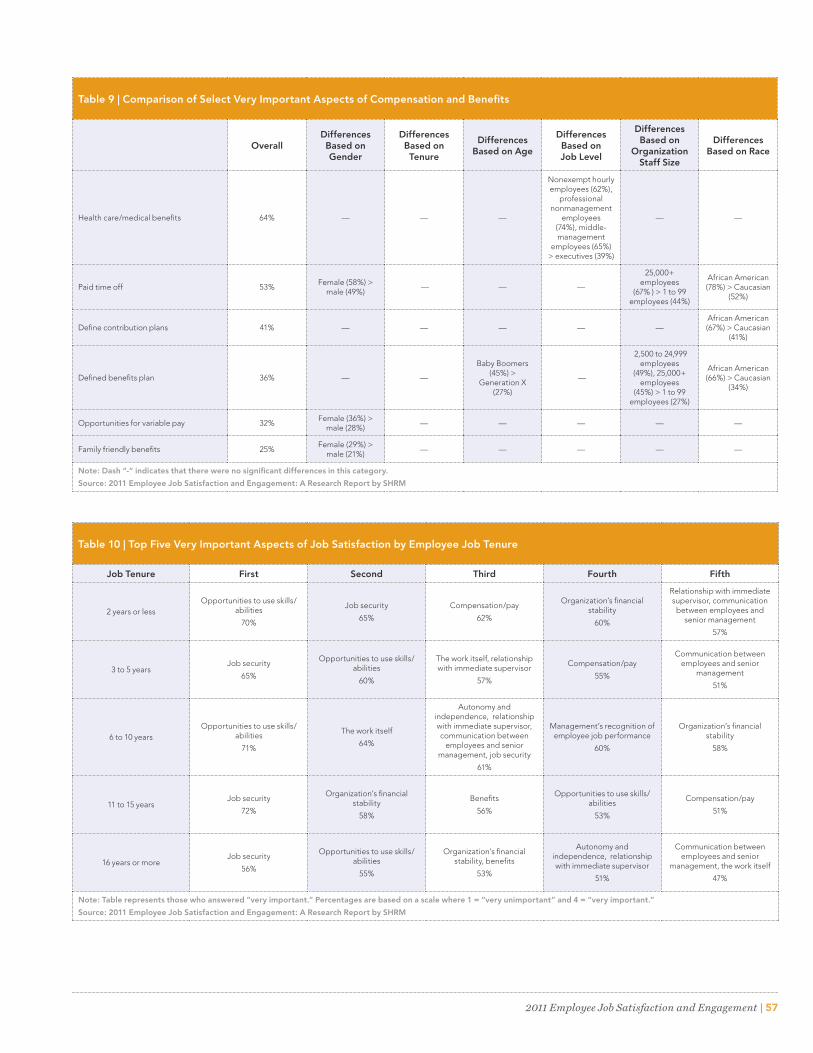
2011 Employee Job Satisfaction and Engagement | 57
Table 9 | Comparison of Select Very Important Aspects of Compensation and Benefits
OverallDifferences Based on Gender
Differences Based on Tenure
Differences Based on Age
Differences Based on Job Level
Differences Based on
Organization Staff Size
Differences Based on Race
Health care/medical benefits 64% — — —
Nonexempt hourly employees (62%),
professional nonmanagement
employees (74%), middle-management
employees (65%) > executives (39%)
— —
Paid time off 53%Female (58%) >
male (49%) — — —
25,000+ employees
(67% ) > 1 to 99 employees (44%)
African American (78%) > Caucasian
(52%)
Define contribution plans 41% — — — — —African American (67%) > Caucasian
(41%)
Defined benefits plan 36% — —
Baby Boomers (45%) >
Generation X (27%)
—
2,500 to 24,999 employees
(49%), 25,000+ employees
(45%) > 1 to 99 employees (27%)
African American (66%) > Caucasian
(34%)
Opportunities for variable pay 32%Female (36%) >
male (28%)— — — — —
Family friendly benefits 25%Female (29%) >
male (21%)— — — — —
Note: Dash “-“ indicates that there were no significant differences in this category.
Source: 2011 Employee Job Satisfaction and Engagement: A Research Report by SHRM
Table 10 | Top Five Very Important Aspects of Job Satisfaction by Employee Job Tenure
Job Tenure First Second Third Fourth Fifth
2 years or lessOpportunities to use skills/
abilities
70%
Job security
65%
Compensation/pay
62%
Organization’s financial stability
60%
Relationship with immediate supervisor, communication between employees and
senior management
57%
3 to 5 yearsJob security
65%
Opportunities to use skills/abilities
60%
The work itself, relationship with immediate supervisor
57%
Compensation/pay
55%
Communication between employees and senior
management
51%
6 to 10 yearsOpportunities to use skills/
abilities
71%
The work itself
64%
Autonomy and independence, relationship with immediate supervisor, communication between
employees and senior management, job security
61%
Management’s recognition of employee job performance
60%
Organization’s financial stability
58%
11 to 15 yearsJob security
72%
Organization’s financial stability
58%
Benefits
56%
Opportunities to use skills/abilities
53%
Compensation/pay
51%
16 years or moreJob security
56%
Opportunities to use skills/abilities
55%
Organization’s financial stability, benefits
53%
Autonomy and independence, relationship with immediate supervisor
51%
Communication between employees and senior
management, the work itself
47%
Note: Table represents those who answered “very important.” Percentages are based on a scale where 1 = “very unimportant” and 4 = “very important.”
Source: 2011 Employee Job Satisfaction and Engagement: A Research Report by SHRM
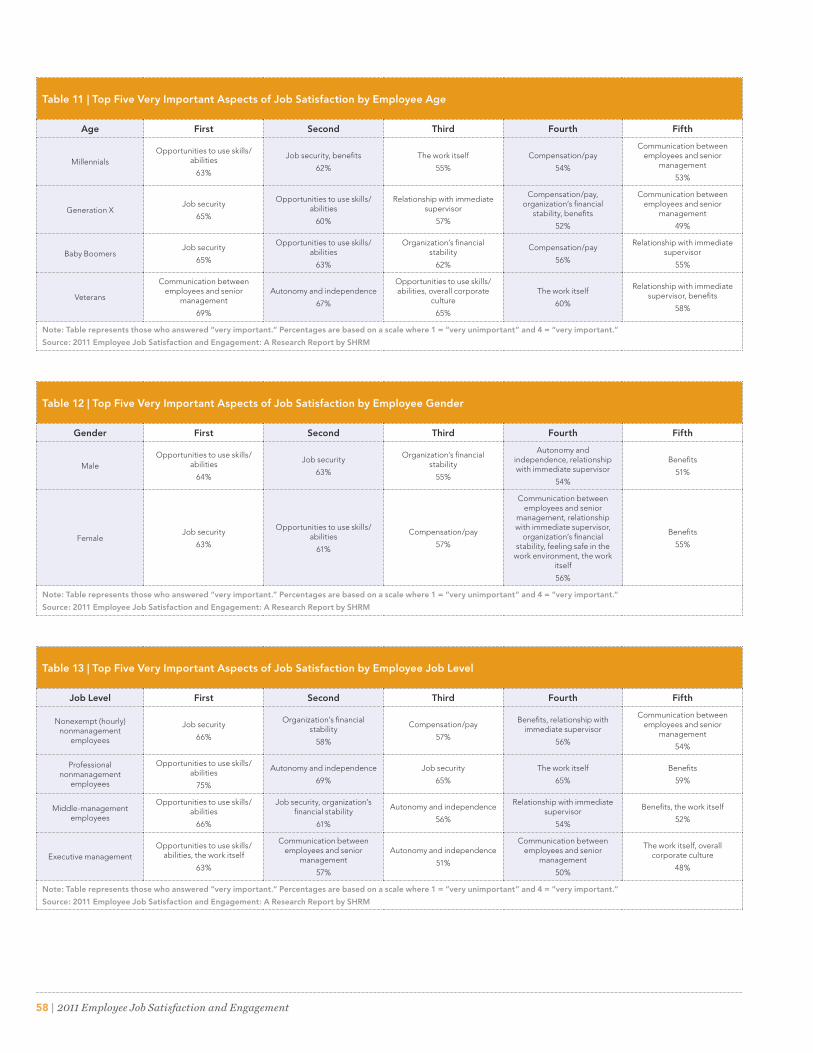
58 | 2011 Employee Job Satisfaction and Engagement
Table 11 | Top Five Very Important Aspects of Job Satisfaction by Employee Age
Age First Second Third Fourth Fifth
MillennialsOpportunities to use skills/
abilities
63%
Job security, benefits
62%
The work itself
55%
Compensation/pay
54%
Communication between employees and senior
management
53%
Generation XJob security
65%
Opportunities to use skills/abilities
60%
Relationship with immediate supervisor
57%
Compensation/pay, organization’s financial
stability, benefits
52%
Communication between employees and senior
management
49%
Baby BoomersJob security
65%
Opportunities to use skills/abilities
63%
Organization’s financial stability
62%
Compensation/pay
56%
Relationship with immediate supervisor
55%
Veterans
Communication between employees and senior
management
69%
Autonomy and independence
67%
Opportunities to use skills/abilities, overall corporate
culture
65%
The work itself
60%
Relationship with immediate supervisor, benefits
58%
Note: Table represents those who answered “very important.” Percentages are based on a scale where 1 = “very unimportant” and 4 = “very important.”
Source: 2011 Employee Job Satisfaction and Engagement: A Research Report by SHRM
Table 12 | Top Five Very Important Aspects of Job Satisfaction by Employee Gender
Gender First Second Third Fourth Fifth
MaleOpportunities to use skills/
abilities
64%
Job security
63%
Organization’s financial stability
55%
Autonomy and independence, relationship with immediate supervisor
54%
Benefits
51%
FemaleJob security
63%
Opportunities to use skills/abilities
61%
Compensation/pay
57%
Communication between employees and senior
management, relationship with immediate supervisor,
organization’s financial stability, feeling safe in the
work environment, the work itself
56%
Benefits
55%
Note: Table represents those who answered “very important.” Percentages are based on a scale where 1 = “very unimportant” and 4 = “very important.”
Source: 2011 Employee Job Satisfaction and Engagement: A Research Report by SHRM
Table 13 | Top Five Very Important Aspects of Job Satisfaction by Employee Job Level
Job Level First Second Third Fourth Fifth
Nonexempt (hourly) nonmanagement
employees
Job security
66%
Organization’s financial stability
58%
Compensation/pay
57%
Benefits, relationship with immediate supervisor
56%
Communication between employees and senior
management
54%
Professional nonmanagement
employees
Opportunities to use skills/abilities
75%
Autonomy and independence
69%
Job security
65%
The work itself
65%
Benefits
59%
Middle-management employees
Opportunities to use skills/abilities
66%
Job security, organization’s financial stability
61%
Autonomy and independence
56%
Relationship with immediate supervisor
54%
Benefits, the work itself
52%
Executive management Opportunities to use skills/
abilities, the work itself
63%
Communication between employees and senior
management
57%
Autonomy and independence
51%
Communication between employees and senior
management
50%
The work itself, overall corporate culture
48%
Note: Table represents those who answered “very important.” Percentages are based on a scale where 1 = “very unimportant” and 4 = “very important.”
Source: 2011 Employee Job Satisfaction and Engagement: A Research Report by SHRM
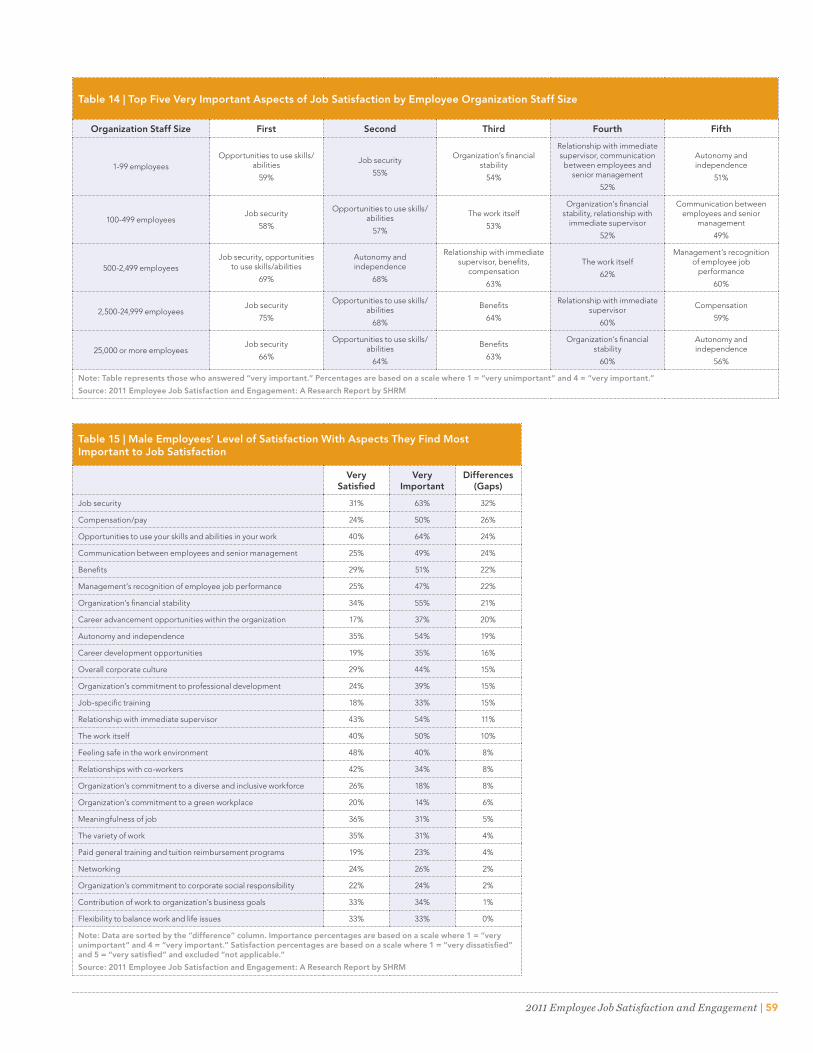
2011 Employee Job Satisfaction and Engagement | 59
Table 15 | Male Employees’ Level of Satisfaction With Aspects They Find Most Important to Job Satisfaction
Very Satisfied
Very Important
Differences (Gaps)
Job security 31% 63% 32%
Compensation/pay 24% 50% 26%
Opportunities to use your skills and abilities in your work 40% 64% 24%
Communication between employees and senior management 25% 49% 24%
Benefits 29% 51% 22%
Management’s recognition of employee job performance 25% 47% 22%
Organization’s financial stability 34% 55% 21%
Career advancement opportunities within the organization 17% 37% 20%
Autonomy and independence 35% 54% 19%
Career development opportunities 19% 35% 16%
Overall corporate culture 29% 44% 15%
Organization’s commitment to professional development 24% 39% 15%
Job-specific training 18% 33% 15%
Relationship with immediate supervisor 43% 54% 11%
The work itself 40% 50% 10%
Feeling safe in the work environment 48% 40% 8%
Relationships with co-workers 42% 34% 8%
Organization’s commitment to a diverse and inclusive workforce 26% 18% 8%
Organization’s commitment to a green workplace 20% 14% 6%
Meaningfulness of job 36% 31% 5%
The variety of work 35% 31% 4%
Paid general training and tuition reimbursement programs 19% 23% 4%
Networking 24% 26% 2%
Organization’s commitment to corporate social responsibility 22% 24% 2%
Contribution of work to organization’s business goals 33% 34% 1%
Flexibility to balance work and life issues 33% 33% 0%
Note: Data are sorted by the “difference” column. Importance percentages are based on a scale where 1 = “very unimportant” and 4 = “very important.” Satisfaction percentages are based on a scale where 1 = “very dissatisfied” and 5 = “very satisfied” and excluded “not applicable.”
Source: 2011 Employee Job Satisfaction and Engagement: A Research Report by SHRM
Table 14 | Top Five Very Important Aspects of Job Satisfaction by Employee Organization Staff Size
Organization Staff Size First Second Third Fourth Fifth
1-99 employees Opportunities to use skills/
abilities
59%
Job security
55%
Organization’s financial stability
54%
Relationship with immediate supervisor, communication between employees and
senior management
52%
Autonomy and independence
51%
100-499 employeesJob security
58%
Opportunities to use skills/abilities
57%
The work itself
53%
Organization’s financial stability, relationship with
immediate supervisor
52%
Communication between employees and senior
management
49%
500-2,499 employeesJob security, opportunities
to use skills/abilities
69%
Autonomy and independence
68%
Relationship with immediate supervisor, benefits,
compensation
63%
The work itself
62%
Management’s recognition of employee job
performance
60%
2,500-24,999 employeesJob security
75%
Opportunities to use skills/abilities
68%
Benefits
64%
Relationship with immediate supervisor
60%
Compensation
59%
25,000 or more employeesJob security
66%
Opportunities to use skills/abilities
64%
Benefits
63%
Organization’s financial stability
60%
Autonomy and independence
56%
Note: Table represents those who answered “very important.” Percentages are based on a scale where 1 = “very unimportant” and 4 = “very important.”
Source: 2011 Employee Job Satisfaction and Engagement: A Research Report by SHRM
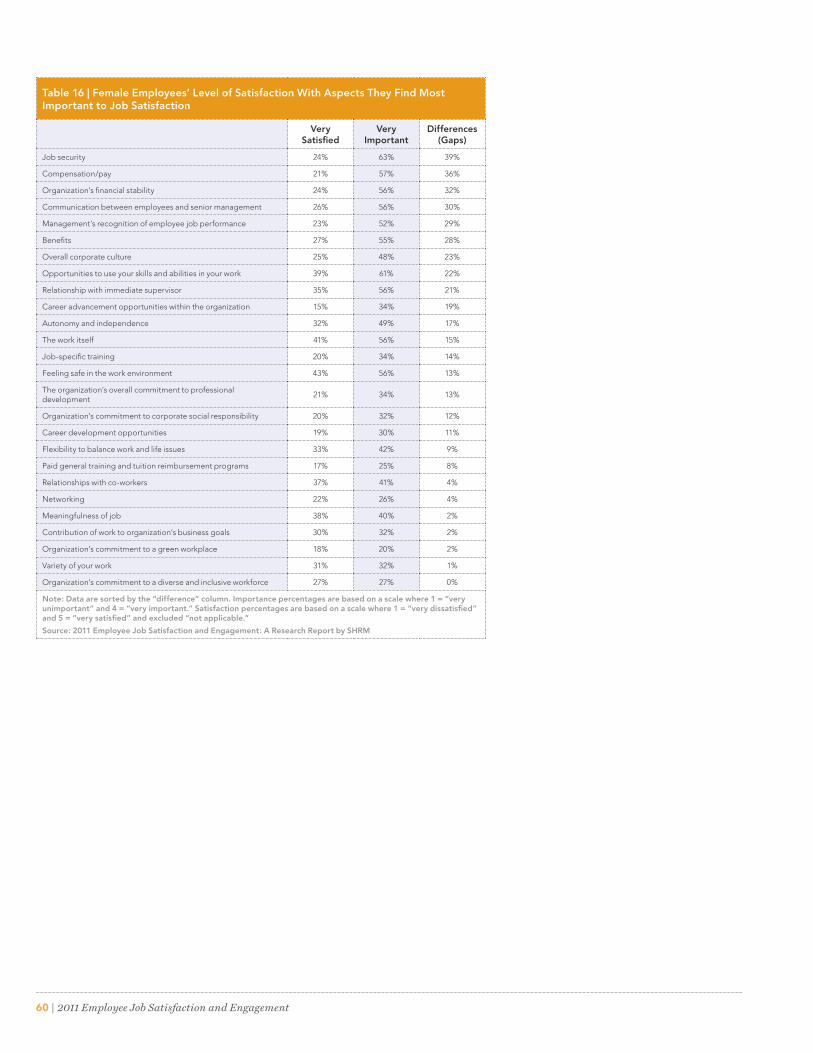
60 | 2011 Employee Job Satisfaction and Engagement
Table 16 | Female Employees’ Level of Satisfaction With Aspects They Find Most Important to Job Satisfaction
Very Satisfied
Very Important
Differences (Gaps)
Job security 24% 63% 39%
Compensation/pay 21% 57% 36%
Organization’s financial stability 24% 56% 32%
Communication between employees and senior management 26% 56% 30%
Management’s recognition of employee job performance 23% 52% 29%
Benefits 27% 55% 28%
Overall corporate culture 25% 48% 23%
Opportunities to use your skills and abilities in your work 39% 61% 22%
Relationship with immediate supervisor 35% 56% 21%
Career advancement opportunities within the organization 15% 34% 19%
Autonomy and independence 32% 49% 17%
The work itself 41% 56% 15%
Job-specific training 20% 34% 14%
Feeling safe in the work environment 43% 56% 13%
The organization’s overall commitment to professional development
21% 34% 13%
Organization’s commitment to corporate social responsibility 20% 32% 12%
Career development opportunities 19% 30% 11%
Flexibility to balance work and life issues 33% 42% 9%
Paid general training and tuition reimbursement programs 17% 25% 8%
Relationships with co-workers 37% 41% 4%
Networking 22% 26% 4%
Meaningfulness of job 38% 40% 2%
Contribution of work to organization’s business goals 30% 32% 2%
Organization’s commitment to a green workplace 18% 20% 2%
Variety of your work 31% 32% 1%
Organization’s commitment to a diverse and inclusive workforce 27% 27% 0%
Note: Data are sorted by the “difference” column. Importance percentages are based on a scale where 1 = “very unimportant” and 4 = “very important.” Satisfaction percentages are based on a scale where 1 = “very dissatisfied” and 5 = “very satisfied” and excluded “not applicable.”
Source: 2011 Employee Job Satisfaction and Engagement: A Research Report by SHRM
2011 Employee Job Satisfaction and Engagement | 61
Endnotes1� When reviewing the top five list of aspects that are most important to
employees’ job satisfaction, it is important to remember that in some cases there may be differences of only a few percentage points, affecting whether an aspect was rated first or second and so forth�
2� Society for Human Resource Management� (2010)� SHRM poll: Financial challenges to the U.S. and global economy and their impact on organiza-tions—Fall 2010 update. Retrieved from http://www�shrm�org/Research/SurveyFindings/Articles/Pages/SHRMPollFinancialChallengestotheUSand-GlobalEconomyandTheirImpactonOrganizations%E2%80%94Fall2010Update�aspx�
3� Society for Human Resource Management� (2011)� 2011 employee benefits: A survey report by SHRM. Alexandria, VA: Author�
4� Society for Human Resource Management� (2011)� SHRM/Globoforce employee recognition tracker survey: Employee recognition programs. Retrieved from http://www�shrm�org/Research/SurveyFindings/Articles/Pages/EmployeeRecognitionProgramsSurveyFindings�aspx�
5� Bureau of Labor and Statistics� Labor force statistics from the current population survey. Retrieved July 24, 2011, from http://www�bls�gov/cps/�
6� Society for Human Resource Management� (2011)� 2011 employee benefits: A survey report by SHRM. Alexandria, VA: Author�
7� Ibid�
8� Society for Human Resource Management� (2011)� SHRM jobs outlook survey. Retrieved from http://www�shrm�org/Research/MonthlyEmploy-mentIndices/lmo/Pages/default�aspx�
9� Society for Human Resource Management, BSR & Aurosoorya� (2011)� Advancing sustainability: HR’s role. Alexandria, VA: SHRM�
10� Macey, W� H�, Scheider, B�, Barbera, K� M�, & Young, S� A� (2009)� Employee engagement: Tools for analysis, practice, and competitive advantage. Hoboken, NJ: Wiley-Blackwell�
62 | 2011 Employee Job Satisfaction and Engagement
SHRM Resources Related to Employee Job Satisfaction and EngagementFind the Right Balance Between Stress and Results
Recession Alters Relationship Between Employers, Workers
Give Employees a Sense of Purpose
SHRM Workplace Flexibility Public Policy Statement
SHRM Health Care Reform Resources Page
Employee Engagement and Commitment: SHRM Foundation’s Effective Practice Guidelines
Job Satisfaction and Employee Engagement Benchmarking
Employee Benefits Prevalence Benchmarking
Health Care Benchmarking
Retirement and Welfare Benchmarking
SHRM People InSight: An Employee Job Satisfaction and Engagement Service
To access these publications, please visit www�shrm�org
SHRM Research Products
Benefits1� 2011 Employee Benefits: A Research Report by SHRM (June 2011)
2� Health Care Reform: Where Are Organizations in the Decision-Making Process? (February 2011)
3� Organizations’ Response to Health Care Reform (September 2010)
4� 401(k) Investment Education and Advice Organizations Are Providing to Plan Participants (September 2010)
5� 2010 Employee Benefits: A Survey Report by SHRM (June 2010)
Business Leadership1� Metro Economic Outlook Reports
2� The Post-Recession Workplace: Competitive Strategies for Recovery and Beyond (November 2010)
Additional SHRM Resources
2011 Employee Job Satisfaction and Engagement | 63
3� Challenges Facing Organizations and HR in the Next 10 Years (September 2010)
Compensation1� SHRM Compensation Data Center
Diversity1� Workplace Diversity Practices: How Has Diversity and Inclusion Changed
Over Time? (October 2010)
2� Global Diversity & Inclusion: Perceptions Practices, & Attitudes (June 2009)
3� 2008 Religion and Corporate Culture Survey Report (October 2008)
4� The 2007 State of the Workplace Diversity Management Survey Report (February 2008)
Employee Relations1� Employee Suggestion Programs (November 2010)
2� 2010 Job Satisfaction: A Survey Report by SHRM (June 2010)
3� Workplace Policies for Office Pools (January 2010)
4� Assistance Organizations Offer to Help Employees Manage Their Financial Resources (November 2009)
5� 2009 Job Satisfaction Survey Report (June 2009)
Ethics and Sustainability1� Advancing Sustainability: HR’s Role (April 2011)
2� Organizational Whistle-blowing—Reporting Unethical and Illegal Behavior in the Workplace (March 2011)
Global HR3� Global Firms in 2020: The Next Decade of Change for Organizations and
Workers (November 2010)
4� Creating People Advantage 2010: How Companies Can Adapt Their HR Practices for Volatile Times (October 2010)
5� What Senior HR Leaders Need to Know: Perspectives from the United States, Canada, India, the Middle East and North Africa Executive Summary (March 2008)
Safety and Security1� Policies Related to Alcohol at Work-Related Events (November 2010)
2� The H1N1 Virus—How Prepared Is Your Workplace? (October 2009)
3� What preventative measures is your organization using to reduce the spread of flu in the workplace? (January 2008)
Staffing Management1� SHRM Research Spotlight: Social Networking Websites and Staffing (April
2011)
2� Recruiting Veterans With Disabilities: Perceptions in the Workplace (Janu-ary 2011)
3� Background Checking—Reference, Credit and Criminal (December 2010)
4� Employing Military Personnel and Recruiting Veterans—What HR Can Do (October 2010)
64 | 2011 Employee Job Satisfaction and Engagement
5� Background Checking: The Implications of Credit Background Checks on the Decision to Hire (September 2010)
6� Background Checking: Has the Use of Credit Background Checks Increased? A Comparative Look (September 2010)
7� Hiring Practices and Attitudes: Traditional vs� Online Degree Credentials (August 2010)
To access these reports and view a complete listing of all SHRM Survey products, please visit www�shrm�org/surveys.
Fill the gap between expensive benchmarking services and going it alone� SHRM offers customized benchmarking reports that can help you and your organization benchmark against more than 140 metrics in health care, human capital, and retirement and welfare� Visit our website at www�shrm�org/bench-marks or call 703-535-6366�
New Customized Benchmarking Reports•Employee Benefits Prevalence
•Employee Job Satisfaction and Engagement
Need Advanced Benchmarking Reports and Advice?HR/Workforce Analytics Solution for Human Capital Benchmarks includes a hard copy of your report that contains FOUR customized data segments to fit your needs:
• Industry, staff size, sub-industries, unionization, revenue, sector (nonprofit, for-profit, government), consulting and more!
• Region (based on SHRM membership regions)�
• Industry�
• All industries�
The package also includes our Metrics Support Service: spend up to 60 minutes with a benchmarking expert to coach you through getting started, interpreting the data in your report and using these data in your company� Also included is a copy of How to Measure Human Resource Management by Jac Fitz-enz�
Affordable Customized Benchmarking Reports: Human Capital, Health Care, Retirement and Welfarewww�shrm�org/benchmarks
Revenue per FTE HR-to-Employee Ratio HR Expenses Annual Salary Increase Time-to-Fill Cost-per-Hire Annual Overall Turnover Rate Annual Voluntary Turnover Rate HR Expense to FTE Ratio Areas of HR Outsourcing Revenue per FTE HR-to-Employee Ratio HR Expenses Annual Salary Increase Time-to-Fill Cost-per-Hire Annual Overall Turnover Rate Annual Voluntary Turnover Rate HR Expense to FTE Ratio Areas of HR Outsourcing Revenue per FTE HR-to-Employee Ratio HR Expenses Annual Salary Increase Time-to-Fill Cost-per-Hire Annual Overall Turnover Rate Annual Voluntary Turnover Rate HR Expense to FTE Ratio Areas of HR Outsourcing Revenue per FTE HR-to-Employee Ratio HR Expenses Annual Salary Increase Time-to-Fill Cost-per-Hire Annual Overall Turnover Rate Annual Vol-untary Turnover Rate HR Expense to FTE Ratio Areas of HR Outsourcing Revenue per FTE HR-to-Employee Ratio HR Expenses Annual Salary Increase Time-to-Fill Cost-per-Hire Annual Overall Turn-over Rate Annual Voluntary Turnover Rate HR Expense to FTE Ratio Areas of HR Outsourcing Rev-enue per FTE HR-to-Employee Ratio HR Expenses Annual Salary Increase Time-to-Fill Cost-per-Hire Annual Overall Turnover Rate Annual Voluntary Turnover Rate HR Expense to FTE Ratio Areas of HR Outsourcing Revenue per FTE HR-to-Employee Ratio HR Expenses Annual Salary Increase Time-to-Fill Cost-per-Hire Annual Overall Turnover Rate Annual Voluntary Turnover Rate HR Expense to FTE Ratio Areas of HR Outsourcing Revenue per FTE HR-to-Employee Ratio HR Expenses Annual Salary Increase Time-to-Fill Cost-per-Hire Annual Overall Turnover Rate Annual Voluntary Turnover Rate HR Expense to FTE Ratio Areas of HR Outsourcing Revenue per FTE HR-to-Employee Ratio HR Expenses Annual Salary Increase Time-to-Fill Cost-per-Hire Annual Overall Turnover Rate Annual Voluntary Turnover Rate HR Expense to FTE Ratio Areas of HR Outsourcing Revenue per FTE HR-to-Employee Ratio HR Expenses Annual Salary Increase Time-to-Fill Cost-per-Hire Annual Overall Turnover Rate Annual Voluntary Turnover Rate HR Expense to FTE Ratio Areas of HR Outsourcing Revenue per FTE HR-to-Employee Ratio HR Expenses Annual Salary Increase Time-to-Fill Cost-per-Hire Annual Overall Turnover Rate Annual Voluntary Turnover Rate HR Expense to FTE Ratio Areas of HR Outsourcing Revenue per FTE HR-to-Employee Ratio HR Expenses Annual Salary Increase Time-to-Fill Cost-per-Hire Annual Overall Turnover Rate Annual Voluntary Turnover Rate HR Expense to FTE Ratio Areas of HR Outsourcing Revenue per FTE HR-to-Employee Ratio HR Expenses Annual Salary Increase Time-to-Fill Cost-per-Hire Annual Overall Turnover Rate Annual Voluntary Turnover Rate HR Expense to FTE Ratio Areas of HR Outsourcing Revenue per FTE HR-to-Employee Ratio HR Expenses Annual Salary Increase Time-to-Fill Cost-per-Hire Annual Overall Turnover Rate Annual Voluntary Turnover Rate HR Expense to FTE Ratio Areas of HR Outsourcing
SHRM® Human CapitalCustomizedBenCHmarkingRepoRt
www.shrm.org/benchmarks
Total Annual Health Care Cost per Covered Employee Number and Types of Health Care Plans Of-fered Monthly Premium Employer Pays for Employee-Only Coverage Waiting Period in Months for Coverage for New Employees Amount of Specific Stop-Loss (SSL) Coverage Annual Out-of-Network Deductible for Employee-Only Coverage Co-pay for In-Network Primary Care Office Visits for Employ-ee-Only Coverage Employer Contribution to Health Savings Account Total Annual Health Care Cost per Covered Employee Number and Types of Health Care Plans Offered Monthly Premium Employer Pays for Employee-Only Coverage Waiting Period in Months for Coverage for New Employees Amount of Specific Stop-Loss (SSL) Coverage Annual Out-of-Network Deductible for Employee-Only Cover-age Co-pay for In-Network Primary Care Office Visits for Employee-Only Coverage Employer Contri-bution to Health Savings Account Total Annual Health Care Cost per Covered Employee Number and Types of Health Care Plans Offered Monthly Premium Employer Pays for Employee-Only Coverage Waiting Period in Months for Coverage for New Employees Amount of Specific Stop-Loss (SSL) Cov-erage Annual Out-of-Network Deductible for Employee-Only Coverage Co-pay for In-Network Primary Care Office Visits for Employee-Only Coverage Employer Contribution to Health Savings Account Total Annual Health Care Cost per Covered Employee Number and Types of Health Care Plans Of-fered Monthly Premium Employer Pays for Employee-Only Coverage Waiting Period in Months for Coverage for New Employees Amount of Specific Stop-Loss (SSL) Coverage Annual Out-of-Network Deductible for Employee-Only Coverage Co-pay for In-Network Primary Care Office Visits for Employ-ee-Only Coverage Employer Contribution to Health Savings Account Total Annual Health Care Cost per Covered Employee Number and Types of Health Care Plans Offered Monthly Premium Employer Pays for Employee-Only Coverage Waiting Period in Months for Coverage for New Employees Amount of Specific Stop-Loss (SSL) Coverage Annual Out-of-Network Deductible for Employee-Only Cover-age Co-pay for In-Network Primary Care Office Visits for Employee-Only Coverage Employer Contri-bution to Health Savings Account Total Annual Health Care Cost per Covered Employee Number and Types of Health Care Plans Offered Monthly Premium Employer Pays for Employee-Only Coverage Waiting Period in Months for Coverage for New Employees Amount of Specific Stop-Loss (SSL) Cov-erage Annual Out-of-Network Deductible for Employee-Only Coverage Co-pay for In-Network Primary Care Office Visits for Employee-Only Coverage Employer Contribution to Health Savings Account Total Annual Health Care Cost per Covered Employee Number and Types of Health Care Plans Of-fered Monthly Premium Employer Pays for Employee-Only Coverage Waiting Period in Months for Coverage for New Employees Amount of Specific Stop-Loss (SSL) Coverage Annual Out-of-Network Deductible for Employee-Only Coverage Co-pay for In-Network Primary Care Office Visits for Employ-ee-Only Coverage Employer Contribution to Health Savings Account
SHRM® HealtH Care Customized BenCHmarking RepoRt
www.shrm.org/benchmarks
Percentage of Traditional Final Average Pension Percentage of Traditional Career Average Pension Length of Cliff Vesting Period 401(k) Employer Match 401(k), 403(b) or Similar Prevalence Rates Percentage of Organizations Providing Employer Contribution Graded Vesting Period Cliff Vesting Period Percentage of Organizations Providing Retiree Health Care Percentage of Traditional Final Average Pension Percentage of Traditional Career Average Pension Length of Cliff Vesting Period 401(k) Employer Match 401(k), 403(b) or Similar Prevalence Rates Percentage of Organizations Providing Employer Contribution Graded Vesting Period Cliff Vesting Period Percentage of Organiza-tions Providing Retiree Health Care Percentage of Traditional Final Average Pension Percentage of Traditional Career Average Pension Length of Cliff Vesting Period 401(k) Employer Match 401(k), 403(b) or Similar Prevalence Rates Percentage of Organizations Providing Employer Contribution Graded Vesting Period Cliff Vesting Period Percentage of Organizations Providing Retiree Health Care Percentage of Traditional Final Average Pension Percentage of Traditional Career Average Pen-sion Length of Cliff Vesting Period 401(k) Employer Match 401(k), 403(b) or Similar Prevalence Rates Percentage of Organizations Providing Employer Contribution Graded Vesting Period Cliff Vesting Period Percentage of Organizations Providing Retiree Health Care Percentage of Traditional Final Average Pension Percentage of Traditional Career Average Pension Length of Cliff Vesting Period 401(k) Employer Match 401(k), 403(b) or Similar Prevalence Rates Percentage of Organiza-tions Providing Employer Contribution Graded Vesting Period Cliff Vesting Period Percentage of Or-ganizations Providing Retiree Health Care Percentage of Traditional Final Average Pension Percent-age of Traditional Career Average Pension Length of Cliff Vesting Period 401(k) Employer Match 401(k), 403(b) or Similar Prevalence Rates Percentage of Organizations Providing Employer Contri-bution Graded Vesting Period Cliff Vesting Period Percentage of Organizations Providing Retiree Health Care Percentage of Traditional Final Average Pension Percentage of Traditional Career Aver-age Pension Length of Cliff Vesting Period 401(k) Employer Match 401(k), 403(b) or Similar Preva-lence Rates Percentage of Organizations Providing Employer Contribution Graded Vesting Period Cliff Vesting Period Percentage of Organizations Providing Retiree Health Care Percentage of Tradi-tional Final Average Pension Percentage of Traditional Career Average Pension Length of Cliff Vest-ing Period 401(k) Employer Match 401(k), 403(b) or Similar Prevalence Rates Percentage of Orga-nizations Providing Employer Contribution Graded Vesting Period Cliff Vesting Period Percentage of Organizations Providing Retiree Health Care Percentage of Traditional Final Average Pension Per-centage of Traditional Career Average Pension Length of Cliff Vesting Period 401(k) Employer Match 401(k), 403(b) or Similar Prevalence Rates Percentage of Organizations Providing Employer Contribution Graded Vesting Period Cliff Vesting Period Percentage of Organizations Providing Re-tiree Health Care
SHRM® retirement & Welfare Customized BenCHmarking RepoRt
www.shrm.org/benchmarks
Health and Welfare Benefits Preventive Health and Wellness Benefits Retirement Savings and Planning Benefits Financial and Compensation Benefits Leave Benefits Family-friendly Benefits Flexible Working Benefits Personal Services Benefits Housing and Relocation Benefits Business Travel Benefits Health and Welfare Benefits Preventive Health and Wellness Benefits Retirement Savings and Planning Benefits Financial and Compensation Benefits Leave Benefits Family-friendly Benefits Flexible Working Benefits Personal Services Benefits Housing and Relocation Benefits Business Travel Benefits Health and Welfare Benefits Preventive Health and Wellness Benefits Retirement Savings and Planning Benefits Financial and Compensation Benefits Leave Benefits Family-friendly Benefits Flexible Working Benefits Personal Services Benefits Housing and Relocation Benefits Business Travel Benefits Health and Welfare Benefits Preventive Health and Wellness Benefits Retirement Savings and Planning Benefits Financial and Compensation Benefits Leave Benefits Family-friendly Benefits Flexible Working Benefits Personal Services Benefits Housing and Relocation Benefits Business Travel Benefits Health and Welfare Benefits Preventive Health and Wellness Benefits Retirement Savings and Planning Benefits Financial and Compensation Benefits Leave Benefits Family-friendly Benefits Flexible Working Benefits Personal Services Benefits Housing and Relocation Benefits Business Travel Benefits Health and Welfare Benefits Preventive Health and Wellness Benefits Retirement Savings and Planning Benefits Financial and Compensation Benefits Leave Benefits Family-friendly Benefits Flexible Working Benefits Personal Services Benefits Housing and Relocation Benefits Business Travel Benefits Health and Welfare Benefits Preventive Health and Wellness Benefits Retirement Savings and Planning Benefits Financial and Compensation Benefits Leave Benefits Family-friendly Benefits Flexible Working Benefits Personal Services Benefits Housing and Relocation Benefits Business Travel Benefits Health and Welfare Benefits Preventive Health and Wellness Benefits Retirement Savings and Planning Benefits Financial and Compensation Benefits Leave Benefits Family-friendly Benefits Flexible Working Benefits Personal Services Benefits Housing and Relocation Benefits Business Travel Benefits Health and Welfare Benefits Preventive Health and Wellness Benefits Retirement Savings and Planning Benefits Financial and Compensation Benefits Leave Benefits Family-friendly Benefits Flexible Working Benefits Personal Services Benefits Housing and Relocation Benefits Business Travel Benefits Health and Welfare Benefits Preventive Health and Wellness Benefits Retirement Savings and Planning Benefits Financial and Compensation Benefits Leave Benefits Family-friendly Benefits Flexible Working Benefits Personal Services Benefits Housing and Relocation Benefits Business Travel Benefits Health and Welfare Benefits Preventive Health and Wellness Benefits Retirement Savings and Planning Benefits Financial and Compensation Benefits Leave Benefits Family-friendly Benefits Flexible Working Benefits Personal Services Benefits Housing and Relocation Benefits Business Travel Benefits
SHRM® eMpLoYee BENEFITS PreValeNCe Customized BenCHmarking RepoRt
www.shrm.org/benchmarks
Career Advancement Opportunities Career Development Opportunities Job-specific Training Networking Opportunities Paid General Training and Tuition Reimbursement Programs Commitment to Professional Development Communication Between Employees and Senior Management Autonomy and Independence Relationship with Immediate Supervisor Compensation/Pay Stock Options Benefits Package Paid Time Off Job Security Meaningfulness of Job Commitment to Corporate Social Responsibility Financial Stability Overall Corporate Culture Relationships with Co-workers Career Advancement Opportunities Career Development Opportunities Job-specific Training Networking Opportunities Paid General Training and Tuition Reimbursement Programs Commitment to Professional Development Communication Between Employees and Senior Management Autonomy and Independence Relationship with Immediate Supervisor Compensation/Pay Stock Options Benefits Package Paid Time Off Job Security Meaningfulness of Job Commitment to Corporate Social Responsibility Financial Stability Overall Corporate Culture Relationships with Co-workers Career Advancement Opportunities Career Development Opportunities Job-specific Training Networking Opportunities Paid General Training and Tuition Reimbursement Programs Commitment to Professional Development Communication Between Employees and Senior Management Autonomy and Independence Relationship with Immediate Supervisor Compensation/Pay Stock Options Benefits Package Paid Time Off Job Security Meaningfulness of Job Commitment to Corporate Social Responsibility Financial Stability Overall Corporate Culture Relationships with Co-workers Career Advancement Opportunities Career Development Opportunities Job-specific Training Networking Opportunities Paid General Training and Tuition Reimbursement Programs Commitment to Professional Development Communication Between Employees and Senior Management Autonomy and Independence Relationship with Immediate Supervisor Compensation/Pay Stock Options Benefits Package Paid Time Off Job Security Meaningfulness of Job Commitment to Corporate Social Responsibility Financial Stability Overall Corporate Culture Relationships with Co-workers Career Advancement Opportunities Career Development Opportunities Job-specific Training Networking Opportunities Paid General Training and Tuition Reimbursement Programs Commitment to Professional Development Communication Between Employees and Senior Management Autonomy and Independence Relationship with Immediate Supervisor Compensation/Pay Stock Options Benefits Package Paid Time Off Job Security Meaningfulness of Job Commitment to Corporate Social Responsibility Financial Stability Overall Corporate Culture Relationships with Co-workers Career Advancement Opportunities Career Development Opportunities Job-specific Training Networking Opportunities Paid General Training and Tuition Reimbursement Programs Commitment to Professional Development Communication Between Employees and Senior Management Autonomy and Independence Relationship with Immediate Supervisor Compensation/Pay Stock Options Benefits Package Paid Time Off Job Security Meaningfulness of Job Commitment to Corporate Social Responsibility Financial Stability Overall Corporate Culture Relationships with Co-workers
www.shrm.org/benchmarks
SHRM® emplOYee JOB satisFaCtioN & engagement Customized BenCHmarking RepoRt

Project leaderJustina Victor, survey research analyst
Project contributorsEvren Esen, manager, SHRM Survey Research Center
Mark Schmit, Ph�D�, SPHR, director, SHRM Research
Joe Coombs, specialist, Workplace Trends and Forecasting
EditorKatya Scanlan, copy editor
DesignTerry Biddle, senior design specialist
Project Team
This report is published by the Society for Human Resource Management (SHRM)� All content is for informational purposes only and is not to be construed as a guaranteed outcome� The Society for Human Resource Management cannot accept responsibility for any errors or omissions or any liability resulting from the use or misuse of any such information�
© December 2011 Society for Human Resource Manage-ment� All rights reserved� Printed in the United States of America�
This publication may not be reproduced, stored in a retriev-al system or transmitted in whole or in part, in any form or by any means, electronic, mechanical, photocopying, recording or otherwise, without the prior written permis-sion of the Society for Human Resource Management�
SHRM members can download this research report and many others free of charge at www�shrm�org/surveys� If you are not a SHRM member and would like to become one, please visit www�shrm�org/application
4426687815869
ISBN 978-1-586-44266-8
SHRM Store #: 62.27051$79.95 member | $99.95 nonmember
SHRM® PEOPLE INSIGHT An Employee Job Satisfaction & Engagement Survey Service
What motivates your top performers? Is that workplace fl exibility benefi t paying off? What are the primary causes of turnover at your organization?
To maximize satisfaction and engagement, you need to know what your employees think and feel. To that
end, SHRM’s People InSight survey service delivers actionable intelligence. We focus on nearly three dozen
aspects of job satisfaction and 34 engagement factors to provide true insight on what your employees
value—and areas in need of improvement.
At SHRM® PEOPLE INSIGHT:
• We do the heavy lifting—developing and administering online surveys and crunching the numbers.
• We segment results by department and overall employee population.
• We benchmark your data by industry, staff size and other criteria
against our database of 5,000 employees.
11-0764
NEWNEWNEWNEWNEWNEWNEWNEWNEWNEWNEWNEWNEWNEWNEWNEWNEWNEWNEWNEWNEWNEWNEWNEWNEWNEWNEWNEWNEWNEWNEWNEWNEWNEWNEWNEWNEWNEWNEWNEWNEWNEWNEWNEWNEWNEWNEWNEWNEWNEWNEWNEWNEWNEWNEWLet SHRM Take Your Employees’ Pulse!
At At At At SHRMSHRM PEOPLE INSIGHT:PEOPLE INSIGHT:PEOPLE INSIGHT:PEOPLE INSIGHT:PEOPLE INSIGHT:PEOPLE INSIGHT:PEOPLE INSIGHT:PEOPLE INSIGHT:PEOPLE INSIGHT:PEOPLE INSIGHT:PEOPLE INSIGHT:PEOPLE INSIGHT:PEOPLE INSIGHT:PEOPLE INSIGHT:• We do the heavy lifting—developing and administering online surveys and crunching the numbers.• We do the heavy lifting—developing and administering online surveys and crunching the numbers.• We do the heavy lifting—developing and administering online surveys and crunching the numbers.• We do the heavy lifting—developing and administering online surveys and crunching the numbers.• We do the heavy lifting—developing and administering online surveys and crunching the numbers.• We do the heavy lifting—developing and administering online surveys and crunching the numbers.• We do the heavy lifting—developing and administering online surveys and crunching the numbers.• We do the heavy lifting—developing and administering online surveys and crunching the numbers.• We do the heavy lifting—developing and administering online surveys and crunching the numbers.• We do the heavy lifting—developing and administering online surveys and crunching the numbers.• We do the heavy lifting—developing and administering online surveys and crunching the numbers.• We do the heavy lifting—developing and administering online surveys and crunching the numbers.• We do the heavy lifting—developing and administering online surveys and crunching the numbers.• We do the heavy lifting—developing and administering online surveys and crunching the numbers.• We do the heavy lifting—developing and administering online surveys and crunching the numbers.• We do the heavy lifting—developing and administering online surveys and crunching the numbers.• We do the heavy lifting—developing and administering online surveys and crunching the numbers.• We do the heavy lifting—developing and administering online surveys and crunching the numbers.• We do the heavy lifting—developing and administering online surveys and crunching the numbers.• We do the heavy lifting—developing and administering online surveys and crunching the numbers.• We do the heavy lifting—developing and administering online surveys and crunching the numbers.• We do the heavy lifting—developing and administering online surveys and crunching the numbers.• We do the heavy lifting—developing and administering online surveys and crunching the numbers.• We do the heavy lifting—developing and administering online surveys and crunching the numbers.• We do the heavy lifting—developing and administering online surveys and crunching the numbers.• We do the heavy lifting—developing and administering online surveys and crunching the numbers.• We do the heavy lifting—developing and administering online surveys and crunching the numbers.• We do the heavy lifting—developing and administering online surveys and crunching the numbers.• We do the heavy lifting—developing and administering online surveys and crunching the numbers.• We do the heavy lifting—developing and administering online surveys and crunching the numbers.• We do the heavy lifting—developing and administering online surveys and crunching the numbers.• We do the heavy lifting—developing and administering online surveys and crunching the numbers.• We do the heavy lifting—developing and administering online surveys and crunching the numbers.• We do the heavy lifting—developing and administering online surveys and crunching the numbers.• We do the heavy lifting—developing and administering online surveys and crunching the numbers.• We do the heavy lifting—developing and administering online surveys and crunching the numbers.• We do the heavy lifting—developing and administering online surveys and crunching the numbers.• We do the heavy lifting—developing and administering online surveys and crunching the numbers.• We do the heavy lifting—developing and administering online surveys and crunching the numbers.• We do the heavy lifting—developing and administering online surveys and crunching the numbers.• We do the heavy lifting—developing and administering online surveys and crunching the numbers.• We do the heavy lifting—developing and administering online surveys and crunching the numbers.• We do the heavy lifting—developing and administering online surveys and crunching the numbers.• We do the heavy lifting—developing and administering online surveys and crunching the numbers.• We do the heavy lifting—developing and administering online surveys and crunching the numbers.• We do the heavy lifting—developing and administering online surveys and crunching the numbers.• We do the heavy lifting—developing and administering online surveys and crunching the numbers.• We do the heavy lifting—developing and administering online surveys and crunching the numbers.• We do the heavy lifting—developing and administering online surveys and crunching the numbers.• We do the heavy lifting—developing and administering online surveys and crunching the numbers.• We do the heavy lifting—developing and administering online surveys and crunching the numbers.• We do the heavy lifting—developing and administering online surveys and crunching the numbers.• We do the heavy lifting—developing and administering online surveys and crunching the numbers.• We do the heavy lifting—developing and administering online surveys and crunching the numbers.• We do the heavy lifting—developing and administering online surveys and crunching the numbers.• We do the heavy lifting—developing and administering online surveys and crunching the numbers.• We do the heavy lifting—developing and administering online surveys and crunching the numbers.• We do the heavy lifting—developing and administering online surveys and crunching the numbers.• We do the heavy lifting—developing and administering online surveys and crunching the numbers.• We do the heavy lifting—developing and administering online surveys and crunching the numbers.• We do the heavy lifting—developing and administering online surveys and crunching the numbers.• We do the heavy lifting—developing and administering online surveys and crunching the numbers.• We do the heavy lifting—developing and administering online surveys and crunching the numbers.• We do the heavy lifting—developing and administering online surveys and crunching the numbers.• We do the heavy lifting—developing and administering online surveys and crunching the numbers.• We do the heavy lifting—developing and administering online surveys and crunching the numbers.• We do the heavy lifting—developing and administering online surveys and crunching the numbers.• We do the heavy lifting—developing and administering online surveys and crunching the numbers.• We do the heavy lifting—developing and administering online surveys and crunching the numbers.• We do the heavy lifting—developing and administering online surveys and crunching the numbers.• We do the heavy lifting—developing and administering online surveys and crunching the numbers.
• We segment results by department and overall employee population.• We segment results by department and overall employee population.• We segment results by department and overall employee population.• We segment results by department and overall employee population.• We segment results by department and overall employee population.• We segment results by department and overall employee population.• We segment results by department and overall employee population.• We segment results by department and overall employee population.• We segment results by department and overall employee population.• We segment results by department and overall employee population.• We segment results by department and overall employee population.• We segment results by department and overall employee population.• We segment results by department and overall employee population.• We segment results by department and overall employee population.• We segment results by department and overall employee population.• We segment results by department and overall employee population.• We segment results by department and overall employee population.• We segment results by department and overall employee population.• We segment results by department and overall employee population.• We segment results by department and overall employee population.• We segment results by department and overall employee population.• We segment results by department and overall employee population.• We segment results by department and overall employee population.• We segment results by department and overall employee population.• We segment results by department and overall employee population.• We segment results by department and overall employee population.• We segment results by department and overall employee population.• We segment results by department and overall employee population.• We segment results by department and overall employee population.• We segment results by department and overall employee population.• We segment results by department and overall employee population.• We segment results by department and overall employee population.• We segment results by department and overall employee population.• We segment results by department and overall employee population.• We segment results by department and overall employee population.• We segment results by department and overall employee population.• We segment results by department and overall employee population.• We segment results by department and overall employee population.• We segment results by department and overall employee population.• We segment results by department and overall employee population.• We segment results by department and overall employee population.• We segment results by department and overall employee population.• We segment results by department and overall employee population.• We segment results by department and overall employee population.• We segment results by department and overall employee population.• We segment results by department and overall employee population.• We segment results by department and overall employee population.• We segment results by department and overall employee population.• We segment results by department and overall employee population.• We segment results by department and overall employee population.
• We benchmark your data by industry, staff size and other criteria • We benchmark your data by industry, staff size and other criteria • We benchmark your data by industry, staff size and other criteria • We benchmark your data by industry, staff size and other criteria • We benchmark your data by industry, staff size and other criteria • We benchmark your data by industry, staff size and other criteria • We benchmark your data by industry, staff size and other criteria • We benchmark your data by industry, staff size and other criteria • We benchmark your data by industry, staff size and other criteria • We benchmark your data by industry, staff size and other criteria • We benchmark your data by industry, staff size and other criteria • We benchmark your data by industry, staff size and other criteria • We benchmark your data by industry, staff size and other criteria • We benchmark your data by industry, staff size and other criteria • We benchmark your data by industry, staff size and other criteria • We benchmark your data by industry, staff size and other criteria • We benchmark your data by industry, staff size and other criteria • We benchmark your data by industry, staff size and other criteria • We benchmark your data by industry, staff size and other criteria • We benchmark your data by industry, staff size and other criteria • We benchmark your data by industry, staff size and other criteria • We benchmark your data by industry, staff size and other criteria • We benchmark your data by industry, staff size and other criteria • We benchmark your data by industry, staff size and other criteria • We benchmark your data by industry, staff size and other criteria • We benchmark your data by industry, staff size and other criteria • We benchmark your data by industry, staff size and other criteria • We benchmark your data by industry, staff size and other criteria • We benchmark your data by industry, staff size and other criteria • We benchmark your data by industry, staff size and other criteria • We benchmark your data by industry, staff size and other criteria • We benchmark your data by industry, staff size and other criteria • We benchmark your data by industry, staff size and other criteria • We benchmark your data by industry, staff size and other criteria • We benchmark your data by industry, staff size and other criteria • We benchmark your data by industry, staff size and other criteria • We benchmark your data by industry, staff size and other criteria • We benchmark your data by industry, staff size and other criteria • We benchmark your data by industry, staff size and other criteria • We benchmark your data by industry, staff size and other criteria • We benchmark your data by industry, staff size and other criteria • We benchmark your data by industry, staff size and other criteria • We benchmark your data by industry, staff size and other criteria • We benchmark your data by industry, staff size and other criteria • We benchmark your data by industry, staff size and other criteria • We benchmark your data by industry, staff size and other criteria • We benchmark your data by industry, staff size and other criteria • We benchmark your data by industry, staff size and other criteria • We benchmark your data by industry, staff size and other criteria • We benchmark your data by industry, staff size and other criteria • We benchmark your data by industry, staff size and other criteria • We benchmark your data by industry, staff size and other criteria • We benchmark your data by industry, staff size and other criteria
against our database of 5,000 employeesagainst our database of 5,000 employeesagainst our database of 5,000 employeesagainst our database of 5,000 employeesagainst our database of 5,000 employeesagainst our database of 5,000 employeesagainst our database of 5,000 employeesagainst our database of 5,000 employeesagainst our database of 5,000 employeesagainst our database of 5,000 employeesagainst our database of 5,000 employeesagainst our database of 5,000 employeesagainst our database of 5,000 employeesagainst our database of 5,000 employeesagainst our database of 5,000 employeesagainst our database of 5,000 employeesagainst our database of 5,000 employeesagainst our database of 5,000 employees.
11-076411-0764
www.shrm.org/PeopleInSight
Questions and Order Information: www.shrm.org/peopleinsight | 703-535-6301 | [email protected]
11-0764 Resize People InSight ad JobReport.indd 1 12/12/11 12:07 PM