Embed Size (px)
Citation preview

Sudden ecosystem state change in Lake Winnipeg, Canada, caused by eutrophication
arising from crop and livestock production during the 20th
century
Bunting, L.,a P.R. Leavitt,
a,*, , B. Wissel,
b K.R. Laird,
c B.F. Cumming,
c A. St. Amand,
d
and D.R. Engstrome
aLimnology Laboratory, Department of Biology, University of Regina, Regina,
Saskatchewan, Canada
bEnvironmental Quality Analysis Laboratory, University of Regina, Regina,
Saskatchewan, Canada
cPaleoecological Environmental Assessment and Research Laboratory, Department of
Biology, Queen’s University, Kingston, Ontario, Canada
dPhycoTech Inc., Saint Joseph, Michigan, USA
eSt. Croix Watershed Research Station, Science Museum of Minnesota, St. Croix,
Minnesota, USA.
*Corresponding Author: [email protected]
2
Acknowledgements
We thank Jill Coleman for sedimentary phosphorus determinations, Zoraida
Quiñones-Riveria for pigment analyses, Derek Donald and Martin Callaghan for core
collection, and Manitoba Water Stewardship for maps and limnological data. We thank
Alex Salki and the Lake Winnipeg Research Consortium for facilitating shiptime on the
MV Namao, as well as sponsors for funding. This project was supported by Manitoba
Water Stewardship, Natural Science and Engineering Research Council of Canada
(NSERC), the Canada Research Chair program, Canada Foundation for Innovation, the
Province of Saskatchewan, and the University of Regina. This manuscript was improved
by reviews from D.E. Schindler, R. Vogt, D.W. Schindler, K. Finlay, D. Williamson, N.
Armstrong, and B. Parker.

3
Abstract
Lake Winnipeg, Canada, has experienced severe blooms of N2-fixing
cyanobacteria since 1990; however, little is known of background limnological
conditions, causes of eutrophication, or whether modern conditions represent a stable
ecosystem state change. To address these issues, sedimentary records of nitrogen (N)
inputs (as 15N, %N), phosphorus (P) influxes (total P, chemical fractions), lake
production (13C, %C), and algal abundance and community composition (pigments,
algal microfossils) were analyzed in three cores from the lake’s south basin. Under
baseline conditions (ca. 1800-1900), the basin was mesotrophic (~15-20 μg P L-1
) with
diazotrophic cyanobacteria (Aphanizomenon, Anabaena), mesotrophic and eutrophic
diatoms (Aulacoseira islandica, Stephanodiscus niagarae), and sedimentary P fractions
characteristic of hardwater prairie lakes. Eutrophication accelerated during a second
phase (1900-1990), when N, P and C contents increased 10-50%, 15N enriched 3-4‰,
and concentrations of most algal pigments increased 300-500%. Nearly 75% of this 20th
century variability was explained by concomitant increases in production of livestock
(mainly cattle and hogs) and crops (wheat, potatoes, canola), but not by variation in
climate. A third phase (1990-present) was marked by 50% declines in pigments from
chlorophtyes and cyanobacteria, a 10-fold increase in concentrations of akinetes from
Aphanizomenon and Anabaena spp., and occurred because of a century of fertilization,
rapid changes in economic policies, and agricultural diversification. We conclude that P
influx must decline by ~50% to suppress N2-fixing cyanobacteria (500% to re-establish
baseline conditions) and that failure to regulate P influx may initiate a fourth phase in
which pollution with N promotes potentially toxic cyanobacteria.
4
Introduction
Eutrophication remains the most significant environmental problem which
threatens the integrity of aquatic resources throughout the world despite 50 years of
research to identify the factors that degrade water quality (Carpenter et al. 1998;
Schindler 2006). In cases where eutrophication has been caused by nutrient influx from
discrete sources (e.g., municipal waste water, factory farms) (Schindler 1977), significant
improvements in water quality have been achieved following diversion of point-source
nutrients (Jeppesen et al. 2005). In contrast, eutrophication by nonpoint nutrient sources
(e.g., agriculture, atmospheric deposition) has been more difficult to quantify and
regulate, because diffuse fluxes are often intermittent (Bennett et al. 2001), derived from
large-scale land-use practices (Carpenter et al. 1998), or are regulated by opposing
management strategies for food production and environmental quality (Bunting et al.
2007). Unfortunately, such diffuse nutrient inputs are now the primary cause of aquatic
pollution in many regions of the world (Smith 2003; Schindler 2006).
Water quality degradation arises from diffuse nutrient sources for several main
reasons. First, agricultural inputs of phosphorus (P) and nitrogen (N) in commercial
fertilizer and animal feed supplements often exceed agricultural outputs (Foy et al. 2002;
Bunting et al. 2007). Second, excessive livestock densities can lead to manure
production that overwhelms both storage capacities and regional requirements of crops.
Third, application of N in commercial fertilizer or manure can lead to ammonia (NH3)
volatilization and N deposition at remote locations (Vitousek et al. 1997). In many
instance, excess fertilization favours soil surpluses of P that are mobile and can leach into
5
downstream aquatic ecosystems (Smith et al. 1995; Bennett et al. 2001). Such surpluses
of soil P can last for millennia (Carpenter 2005), facilitate accumulation of soluble P
within downsteam lakes, and alter mechanisms regulating lake structure and function
(Leavitt et al. 2006; Bunting et al. 2007).
Ecological theory suggests that persistent fertilization of lakes may lead to
potentially-irreversible changes in the structure and function of lake ecosystems (Scheffer
et al. 2001; Scheffer and Carpenter 2003; Carpenter 2003). In particular, analysis of
small shallow lakes suggests that increased variation in water-column parameters (e.g., P
concentration) and regulatory mechanisms are reliable indicators of state change from
irradiance-sufficient mixed assemblages of benthic and planktonic primary producers to
communities in turbid waters composed predominantly of buoyant cyanobacteria
(Cottingham et al. 2000; Carpenter 2003; Carpenter and Brock 2006). Interestingly, the
shift between states may arise from either rapid persistent changes in external forcing
(Leavitt et al. 2009) or comparatively small variation in environmental conditions
(climate, food web) which are reinforced by internal feedback mechanisms within
alternate states (e.g., vertical stratification, internal nutrients, macrophytes, shading)
(Scheffer et al. 2001; Scheffer and Carpenter 2003). However, little is known of whether
these regime shift hypotheses are relevant to large lakes. Similarly, further research is
required to quantify the patterns and controls of ecosystem state change at decadal scales,
as recent studies suggest that surface blooms of N2-fixing cyanobacteria may not
represent the terminal state in the eutrophication sequence (Leavitt et al. 2006; Bunting et
al. 2007; Xu et al. 2010).
6
In this paper, we analyzed profundal sediments for diverse chemical and
biological parameters to test the hypothesis that Lake Winnipeg, Canada, has undergone
sudden ecosystem state change due to cumulative effects of a century of agriculture,
rather than climatic variability. Lake Winnipeg is presently eutrophic (south basin >100
μg TP L-1
); however, little is known of the baseline limnological conditions, the
magnitude, timing or causes of eutrophication, or whether outbreaks of diazotrophic
cyanobacteria (Aphanizomenon, Anabaena spp.) since 1990 represent an externally-
forced increase in production (Carpenter 2003; Leavitt et al. 2009) or a self-reinforcing
change between alternative stable states (Scheffer et al. 2001; Scheffer and Carpenter
2003). To address these issues, we created highly resolved time series of historical N
inputs (as 15N, N content), P influxes (as TP and P fractions), aquatic production (13
C,
C content), and algal abundance and community composition (pigments, microfossils
from cyanobacteria and diatoms) for statistical comparison with coeval records of
climatic variability, crop production, and livestock densities using variance partitioning
analyses (Borcard et al. 1992; Hall et al. 1999). We conclude that while the south basin
of Lake Winnipeg is naturally mesotrophic, a century of crop and livestock development
has increased lake production ~500%, allowed intensification of agricultural practices
after 1980 to initiate a state change, and poised the lake on the threshold of a further shift
to increased biomass and toxicity of cyanobacteria.
Methods

7
Site description – Lake Winnipeg is a large (23,750 km2), shallow (mean depth =
12 m), polymictic, multi-basin, eutrophic lake (>100 μg P L-1
) situated at 217.6 m above
sea level (a.s.l.) in the Province of Manitoba (MB), Canada (Fig. 1, Table 1). The
953,250 km2 lake catchment is located mainly within four Canadian provinces (MB,
Alberta [AB], Saskatchewan [SK], Ontario [ON]), with additional contributions from the
northern United States, primarily North Dakota (ND) and Minnesota (MN). More than
660,000 km2 (70%) of the catchment is used for agriculture, which in Canada is divided
evenly between areas for cultivation of crops (wheat, barley, oats, canola; also potatoes
and corn in MB) and that used for pasture, forage, or zero-tillage management in support
of the production of ~12 million beef cattle and ~15 million hogs per annum (LWIC
2006; MWS 2006). More than 80% of the 6.6 million inhabitants of the watershed are
located in urban areas (Statistics Canada and U.S. Bureau of Census data), although cities
with populations >200,000 are relatively uncommon (Fig. 1).
Climatic conditions vary with location in the catchment, with aridity generally
increasing from east to west and north to south (Pham et al. 2009). Within the central
watershed, the climate is characterized as sub-humid continental, with short warm
summers (mean 19°C in July), cold winters (mean -16°C in January), low mean annual
temperatures (~1oC), and an average of 105 frost-free days (Leavitt et al. 2006). In
addition, this region has experienced an ~3oC increase in mean temperature since the 19
th
century, mainly as pronounced increases in fall, winter, and spring minimum
temperatures. As a result, ice cover in southern MB has declined more than 35 days since
1860 (Hall et al. 1999).

8
Three major river systems flow into Lake Winnipeg, while the sole outflow, the
Nelson River, drains northeast into Hudson Bay (Fig. 1). The Red and Assiniboine rivers
join within City of Winnipeg and enter the lake from the south (~8% of total water
inflow), the Saskatchewan River enters the lake from the northwest (~22%), and the
Winnipeg River enters from the southeast (~40%) (Fig. 1). Well developed Chernozemic
soils predominate throughout the catchments of the Red-Assiniboine and Saskatchewan
river systems (Brunskill et al. 1980), while forest and peatland soil types (regosols,
brunisols, luvisols, gleysols, organic peat) predominate in the Winnipeg River watershed
(Smith et al. 1998).
Land use varies substantially among sub-basins. For example, the Red (~127,000
km2) and Assiniboine river catchments (~41,500 km
2) are composed largely of arable
land that supports cereal, feed and specialty crop production, range and pasture lands, and
intensive cattle and hog operations (UARBSC 2000). These sub-basins also include the
major urban centers of Winnipeg MB (pop. 742,000), Fargo-Moorehead ND, and Regina
SK (each pop. 200,000), livestock processing centers, and several smaller cities (MWS
2006). Agricultural land use is broadly similar within the Saskatchewan River drainage
basin (~416,000 km2) (specialty, cereal, and forage crops; range and pasture lands;
livestock feedlots), while major cities are located in SK (Saskatoon, pop. 200,000) and
AB (Calgary, Edmonton, pop. >750,000 each), and substantial forestry is practiced along
the northern boreal margin of the catchment (Jones and Armstrong 2001). In contrast,
land-use within the Winnipeg River catchment (~137,000 km2) is restricted mainly to
mining, forestry, and recreational activities, with few large population centres (Patalas
and Salki 1992; Smith et al. 1998).
9
Nutrient influx to Lake Winnipeg – At present, Lake Winnipeg receives ~96,000
tonnes N and ~7,900 tonnes P each year, both derived mainly from non-urban sources
(Table 2). Decade-long mass flux estimates suggest that Manitoba represents the largest
source of nutrients to Lake Winnipeg (47% TP, 49% TN), due to a combination of
agricultural runoff, background and undefined sources, atmospheric loading, internal lake
processes, and urban and industrial effluent (Bourne et al. 2002; MWS 2006). The
remaining portion of annual TP and TN influx to the lake is derived from headwater
jurisdictions within the US (35% TP, 21% TN), ON (13% TP, 21% TN), and the
Canadian Prairies (SK and AB, 5% TP, 9% TN) (Bourne et al. 2002; MWS 2006). On
average, ~84% of TP and ~70% of TN is delivered to the south basin of Lake Winnipeg
via the Red (54% TP, 30% TN) and Winnipeg river systems (13% TP, 29% TN) (M.
Stainton, G. McCullough, Fisheries and Oceans Canada [FOC], unpublished data).
Despite these generalities, magnitude and importance of individual sources likely vary
among years, such that TP loading to Lake Winnipeg is highly correlated (r2
= 0.97) to
catchment water yield, particularly from the Red River (Jones and Armstrong 2001;
Bourne et al. 2002; MWS 2006).
Relatively little is known of how nutrient influx to Lake Winnipeg has varied in
the past. Total annual influxes of N and P have risen at least 13% and 10%, respectively,
since the early 1970s, primarily due to increased nutrient inputs from the Red and
Winnipeg river systems (Jones and Armstrong 2001; Bourne et al. 2002; MWS 2006;
LWIC 2006). These latter increases reflect elevated river discharge since the early 1990s,
a 29% increase in flow-adjusted concentrations of TP in both the Red and Winnipeg
10
rivers during the past 40 yr, and a concomitant 58% increase in TN concentrations in the
Red River and possibly the Winnipeg River (Jones and Armstrong 2001). Furthermore,
unpublished hydrologic models have combined these data with continuous measurements
of Red River discharge to predict that mean whole-lake TP concentrations varied from
~12 μg P L-1
during the arid 1930s to ~55 μg P L-1
ca. 2000, assuming constant nutrient
export from land (G. McCullough, R. Hesslein, FOC, unpublished data). In addition,
analysis of P fractions in a sediment core with low temporal resolution suggests that there
have been few large-scale changes in P influx during the past ~500 years, other than a
modest increase (<10%) in TP deposition during the 20th
century (Mayer et al. 2006).
Historical development of eutrophication – Relatively little is known of the
historical changes in limnological conditions within Lake Winnipeg due to its large size,
remote location, and potentially high spatial heterogeneity. Sporadic monitoring of the
south basin during the 20th
century suggests a shift from mesotrophic conditions recorded
in the mid- to late-1920s (Lowe 1924; Bajkov 1930, 1934) and late-1960s (Crowe 1973;
Brunskill 1973; Brunskill and Graham 1979) to a more advanced state of eutrophy
thereafter (Brunskill et al. 1979a, 1979b, 1980), as indicated by elevated concentrations
of TP (~80 μg P L1
) and TN (~700 μg TN L1
) in the south basin during 1992-1996
(Manitoba Water Stewardship [MWS] unpublished data). Similarly, surveys conducted
during 2000-2005 revealed enriched concentrations of TP (>100 μg P L1
) and TN (~750
μg N L1
) throughout the south basin, with soluble reactive P (SRP) accounting for ~50%
of TP (>50 μg P L1
) during fall sampling (M. Stainton, FOC, unpublished data).
Occasional phytoplankton analyses conducted during the 20th
century suggest that a

11
diatom community composed mainly of Stephanodiscus niagarae Ehrenberg in 1920s
(Lowe 1924), 1930a (Bajkov 1930, 1934), and 1969 (Crowe 1973; Brunskill and Graham
1979) was supplemented with, or replaced by, diazotrophic cyanobacteria
(Aphanizomenon, Anabaena) and the diatom genus Aulacoseira by the 1990s (Brunskill
et al. 1979a; Hecky et al. 1986; Kling 1998). Interestingly, paleolimnological analysis of
two sediment cores with low temporal resolution suggests that heterocystous
cyanobacteria and Aulacoseria spp. have been present in Lake Winnipeg for several
millennia (Kling 1998).
Field and laboratory methods – Three sediment cores (62.6–77.6 cm in length)
were collected along a 35-km transect within the south basin of Lake Winnipeg in July
2006 using a Glew gravity corer deployed from the MV Namao (Fig. 1). The cores were
sectioned in 7.5-mm intervals and sediment samples were either refrigerated (4C) or
frozen (-10C) in darkness until analysis of individual strata for measures of sediment age
(210
Pb, 137
Cs activities), past lake nutrient status (C, N, and P contents; 15N, 13
C), algal
abundance and gross community composition (pigments), and for Core 1 alone,
microfossils from diatoms and cyanobacteria.
Sediment chronology was established for each core by gamma spectrometric
analysis of 210
Pb and 137
Cs activities in 15-16 lyophilized (48 h, 0.01 Pa) whole sediment
samples distributed evenly over the length of the core (Appleby et al. 1986; Schelske et
al. 1994). Sediment age and mass accumulation rates (g cm2
yr1
) were calculated using
the constant rate of supply (CRS) calculation (Binford 1990).

12
Stable isotope ratios and elemental composition were determined on whole
sediment samples using a ThermoQuest (F-MAT) DeltaPLUS
XL isotope ratio mass
spectrometer equipped with continuous flow (Con Flo II) unit, an automated Carlo Erba
elemental analyzer as an inlet device, and following standard procedures of Savage et al.
(2004). Stable N (15N) and C (13
C) isotopic compositions were expressed in the
conventional -notation in units of per mil (‰) deviation from atmospheric N2 and an
organic C standard which had been calibrated previously against authentic Vienna Pee
Dee Belemnite. Sample reproducibility was <0.25‰ and <0.10‰ for 15N and 13
C
determinations, respectively.
Sediment TP concentrations and four operationally-defined fractions of P were
measured using the standard protocols of Engstrom and Wright (1984). All extracts were
analyzed with a Lachat QuikChem model 8000 flow-injection auto-analyzer using the
ascorbic acid method. TP was quantified as ortho-P extracted by sequential exposure to
30% H2O2 and 0.5M HCl, while a second aliquot was extracted in 1 M NH4Cl to estimate
chemically-exchangeable P (EP; NH4Cl-P). The residue from the second aliquot was
sequentially extracted with 0.1 M NaOH to measure non-apatite inorganic P (NAI-P;
NaOH-P) composed of Fe- and Al-bound P, and 0.5 M HCl to determine apatite
(carbonate)-bound P (AP; HCl-P). Finally, residual organically-bound P (OP; residual-P)
was estimated as the difference between TP and the sum of the inorganic P fractions. In
general, EP is considered available to biota following release from sediments, AP
includes P bound in crystal lattices of apatite grains and is largely biologically inert
(Mayer et al. 2006), while NAI-P includes orthophosphate adsorbed on Fe and Al-oxides,
Fe and Al minerals such as vivianite or variscite, and Ca-P minerals other than crystalline

13
apatite (Williams et al. 1980) and is considered to be the maximum potential particulate P
that can be rendered soluble by diagenesis (Logan et al. 1979).
Algal abundance and community composition was quantified from analysis of
fossil pigments and their derivatives. Pigments were extracted from lyophilized (48 h,
0.01 Pa) whole sediment samples, filtered (0.2-μm pore), and dried under pure N2 gas
using the standard methods of Leavitt and Hodgson (2001). Carotenoids, chlorophylls
(Chls), and their derivatives were isolated and quantified using an Agilent model 1100
high-performance liquid chromatography (HPLC) system equipped with photo-diode
array and fluorescence detectors, and calibrated with authentic standards. Pigment
analysis was restricted to taxonomically diagnostic carotenoids, including those
characteristic of siliceous algae and some dinoflagellates (fucoxanthin), mainly diatoms
(diatoxanthin), cryptophytes (alloxanthin), chlorophytes (Chl b, pheophytin b),
Nostocales cyanobacteria (canthaxanthin), total cyanobacteria (echinenone), total algae
(β-carotene), as well as ubiquitous Chl a and its derivative pheophytin a. Isomeric
carotenoids from chlorophytes (lutein) and cyanobacteria (zeaxanthin) were inseparable
on our HPLC system and were presented together as lutein-zeaxanthin (potentially
bloom-forming algae). All pigment concentrations were expressed as nmol pigment g1
sediment C, a metric which is linearly correlated to annual algal standing stock in whole-
lake calibration studies (reviewed in Leavitt and Hodgson 2001).
For Core 1 alone, cyanobacterial akinetes (resting stages) were isolated from
refrigerated sediments and prepared for microscopy following the modified protocol of
Crumpton (1987). Whole sediment samples (~1 g) were diluted with 20 mL distilled
water, sonicated three times, and preserved with glutaraldehyde (0.2 mL). Samples were
14
homogenized and ~10 aliquots (~0.10 mL) per interval were individually removed,
diluted with distilled water, and fossils filtered onto a 0.45-μm pore membrane filter.
Filters were mounted on cover slips using hydroxypropyl-methacrylate (HPMA) resin, air
dried for 24 h, and permanently mounted onto glass microscope slides with HPMA resin.
For each sample, ~200 cyanobacterial akinetes were identified and enumerated by
counting random fields using an Olympus BX51 compound microscope equipped with
Nomarski and phase-contrast optics, and epifluorescent detection (λexcitation = 450-480
nm). Microfossil concentrations were estimated as akinetes g1
dry mass of whole
sediment. Taxonomic identities were based on references from Bunting et al. (2007) and
a standard reference collection.
Diatom microfossils (frustules, valves) were isolated from Core 1 sediments and
prepared for microscopy following the standard protocol reviewed in Laird and Cumming
(2009). Whole sediments (0.2–0.3 g) were placed in a 20-mL glass vial with a mixture of
concentrated HNO3 : H2SO4 (50 : 50, by mole), heated for ~6 h at 70°C, and settled for
24 h. Samples were washed repeatedly to constant pH with distilled water. Suspensions
of siliceous microfossils were spiked with known densities of artificial microspheres,
evaporated onto cover slips, and mounted permanently onto glass microscope slides with
Naphrax® medium. For each sample, ~400 diatom valves were identified and
enumerated along transects using a Leica DMRB microscope equipped with a 100
fluotar objective and differential interference contrast optics (1000 magnification; N.A.
= 1.3) to determine species composition, microfossil concentration (valves g1
dry mass
sediment), and relative (%) species abundance. Taxonomy and nomenclature are
15
presented in detail in Laird and Cumming (2009) (boreal lake taxa) and Michels et al.
(2007) (prairie lake taxa).
Historical changes in water-column TP concentrations were reconstructed from
analysis of diatom species assemblages in Core 1 following standard paleolimnological
procedures (Hall and Smol 1992). Nutrient preferences of individual species were
obtained from a survey of diatom composition in surfacial sediments of 140 regional sites
(124 MN lakes, 16 sites from Lake of the Woods, ON). Diatom-inferred TP (DI-TP) was
reconstructed using a robust weighted-average model (r2
bootstrap = 0.75, RMSEP = 0.20)
using the computer program C2 (Juggins 2003) and covered a gradient of 5–364 g P
L1
, as detailed in Hyatt et al. (2011). Principal components analysis (PCA) was
performed on diatom relative abundance with a square-root transformation using the
computer program C2 (Juggins 2003). Local assemblage zones were identified using
stratigraphically constrained cluster analysis of diatom microfossil time series using
CONISS
v. 2.0 (Grimm 1987). Local assemblage zones were estimated using the
Euclidian distance dissimilarity coefficient.
Historical data – Time series of 191 environmental variables from MB were
collected for the 20th
century to both quantify the statistical relationships between fossil
records of lake trophic status (pigments, %N, %C, 15N, 13
C) in the south basin prior to
recent expansion of cyanobacterial blooms and identify potential causal agents related to
regional variation in climate, livestock populations, and crop production (Appendix 1).
Manitoba represents the largest source of nutrients to the lake, but development of
provincial management strategies has been hampered by lack of historical context for
16
recent eutrophication and an understanding of the relative influence of climate, crop
production, and animal husbandry practices (D. Williamson, MWS, pers. comm.).
Consequently, we sought to quantify the statistical relationship between provincial land-
use practices, climate, and water quality during the 20th
century to better prioritize goals
for lake remediation, even though we recognize that this approach will not account for
nutrients influxes from headwater regions in southern and western portions of the
catchment, or the unique effects of the City of Winnipeg. Fortunately, mass balance
studies conducted within the Lake Winnipeg basin demonstrate that most nutrients from
SK and AB are sequestered in intervening lakes and reservoirs prior to transmission to
Lake Winnipeg (Leavitt et al. 2006; Finlay et al. 2010; B. Parker, Environment Canada,
unpublished data), and that City of Winnipeg contributes 5-10% of TN and TP to the lake
in most years. Finally, we used estimates of total agricultural production within MB for
comparison with the fossil time series because agricultural activities within MB are
largely restricted to land within the Lake Winnipeg catchment.
Climate records were obtained from Environment Canada weather stations located
at Winnipeg St. Johns College (1900–1937) and Winnipeg Richardson International
Airport (1938–2006). These records were blended without modification, as comparison
of each with overlapping records from additional stations suggested that there was no
measurable offset between sites for major meteorological time series. Potential climate
predictors included monthly, seasonal, and annual total precipitation (mm; 1875–2006),
annual rainfall (mm; 1875–2006), mean monthly and seasonal temperature (oC; 1875–
2006), and mean minimum and maximum temperatures on monthly, seasonal and annual
scales (C, 1875–2006). In addition, historical records of ice thaw and freeze for the Red

17
River at Winnipeg were used to estimate the regional ice-free season of the western
Canadian plains 1900–1995, as described by Hall et al. (1999). Records of mean annual
lake level (m a.s.l.) and discharge (m3) from the 12 main tributary rivers and the sole
outflow (Nelson River) were obtained from MWS.
Historical records of livestock populations, production, and associated agricultural
products were obtained for MB from Census of Canada reports (Statistics Canada 1871–
2006). Canadian census data have been variously available in MB at annual, 5-yr, and
decadal intervals during the 20th
century. Consequently, annual estimates of all
commercial livestock species density and production (e.g., beef cattle, dairy cattle, hogs,
sheep, chickens, etc.) and their products (e.g., milk, fleece, eggs, etc.) were estimated for
each year 1906–2006 by linear interpolation between census years (Appendix 1).
Similarly, annual estimates of total, urban, and rural human populations were obtained for
MB from Census of Canada reports (Statistics Canada 1871–2006) by linear interpolation
among census data available at annual, 5-yr, or decadal intervals since 1871.
Crop production variables included a combination of areal estimates of diverse
farming activities, fertilizer sales, and direct measurements of agricultural production.
Historical records were obtained from Census of Canada reports (Statistics Canada 1871–
2006) including number of farms (farms yr-1
), area (km2) used for specific activities (e.g.,
cropland, pasture, summer-fallow), area seeded or planted with individual crop species
(km2), calendar day of year [DOY] of agricultural activities (seeding, heading, swathing,
harvest) for major cultivars, and annual mass of products harvested for each crop (kg). In
all cases, estimates of annual production were approximated by linear interpolation
among census data collected at annual, 5- or 10-yr intervals since 1908. Annual fertilizer
18
sales (kg), farm expenditure on fertilizer and lime (CND$), and nutrient content (N, PO4,
K, potash) of purchased fertilizer (kg) were obtained from diverse sources, including
Statistics Canada (1968–1977), fertilizer trade catalogues, the Canadian Fertilizer
Institute, the Potash and Phosphate Institute (1978–2001), and Korol (2002). In general,
chemical fertilizer use was limited prior to 1960.
Although too brief to be used in our statistical analysis, we also compiled annual
records of limnological variables available for 1969 and 1992-2005 from MWS and FOC
for concentrations (μg L1
) of TP (1969, 1992–2005), TN (1992–2005), and Chl a (1992-
2005). Similarly, annual records of commercial fish harvest from Lake Winnipeg (1883–
2006) were obtained from MWS. However, although the lake supports a $20M
commercial fishery, fish production and harvest were viewed, in part, as a response to
eutrophication, rather than predictors of causal relationships, and were not included
subsequent statistical analyses.
Numeric analyses – Constrained and partial canonical ordinations (ter Braak
1988) were used to evaluate the statistical relationships between fossil records of trophic
status (pigments and stable isotopes; diatoms) and time series of explanatory variables
related to climate (C), livestock (L), and crops (A). Specifically, we used the variance
partitioning analysis (VPA) protocol of Borcard et al. (1992), as modified by Hall et al.
(1999) for paleolimnological applications, to estimate the fraction of historical variance
in time series of fossil assemblages explained by categories of predictor variables (C, L,
A) and their first- (C × L, C × A, A × L) and second-order (C × L × A) interactions. In
this procedure, redundancy analysis (RDA) was used to partition variation in fossil
19
assemblages because exploratory detrended correspondence analysis (DCA) suggested
that fossil composition varied along environmental gradients in a linear rather than
unimodal fashion (ter Braak 1986). Separate VPA was conducted for indices of past lake
trophic status (9 biomarker pigments, 13C, 15
N, %C, %N) and diatom community
composition (% relative abundance) for the periods 1901-1992 and 1904-1993,
respectively. All computations were performed using CANOCO v. 4 (ter Braak 1990)
(Microcomputer Power, New York, USA).
VPA is most effective when there are similar numbers of predictors within
explanatory categories and when predictors do not greatly outnumber response variables
(Borcard et al. 1992; Hall et al. 1999). Consequently, several criteria were used to
optimize predictor selection from the 191 candidate time series (Appendix 1). First, we
eliminated time series less than 70 years in duration before interpolation because our
objective was to identify the environmental factors best correlated with inter-decadal
changes in lake production during the 20th
century. Second, we used least-squares
regression analysis of environmental time series within individual categories (e.g., C) to
quantify the correlation among potential predictors. If two candidate time series were
highly correlated, we eliminated a variable if we could assume its effect on mass flux
(e.g., mass harvested, area cultivated) was 10-fold less than that of a well-correlated
predictor (honeybees vs. hogs, minor specialty crops vs. wheat, etc.). Third, forward
selection and Monte Carlo permutation testing was used separately for each category (C,
L, A) within RDA to select the variables that explained significant (P <0.05) independent
variation in fossil time series. Final predictors included six variables from livestock (total
populations of cattle, hogs, horses, sheep, chickens + hens), crop (production of wheat,
20
oats, barley, canola, potatoes, corn), and climate categories (mean summer and winter
temperature, summer and winter precipitation, ice-free period, Red River discharge).
Although rural human population was also retained, we eliminated it from subsequent
analyses because we were interested in the relative importance of individual human
activities caused by elevated populations.
Explanatory and response variables were transformed and harmonized prior to
multivariate analyses. First, all fossil time series were centered (mean = 0), standardized
(variance = 1.0), and inspected for normal distribution, although no transformations were
required. Because many explanatory variables were resolved more highly (annual) than
the fossil time series (2.5-yr sample-1
, separated by 3-5 yr), all predictor time series were
smoothed using a 3-year moving average, before being harmonized to fossil time series
by sampling predictors at time intervals which matched those of the sedimentary records
(17 intervals for pigments and isotopes, 19 for diatoms). In addition, all agricultural
variables, most livestock predictors (except chickens + hens), and few climate variables
(only Red River discharge) required log10 transformation to normalize variance.
Results
Sediment chronology – 210
Pb activity declined monotonically with depth in each
of the Lake Winnipeg sediment cores (Fig. 2a), and suggested only limited mixing of
surface sediments. Similarly, activity profiles for 137
Cs were well defined, with a clear
maximum in 210
Pb-dated intervals corresponding to peak atmospheric nuclear testing in
1964 (Fig. 2b). Application of the CRS calculation also showed that bulk dry sediment

21
accumulation rates (SAR) were high and similar over the length of each core, with mean
( SE) rates of 50.0 0.8, 64.6 1.1, and 83.2 0.9 mg cm2
yr1
for Cores 1, 2 and 3,
respectively, although in each case mean SAR increased slightly after ~1990.
Consequently, depth-age (Fig. 2c) and cumulative mass-depth relationships (not shown)
were nearly linear prior to 1990 (r2 >0.98, P< 0.0001) (Fig. 2c) and sedimentary profiles
encompassed 310, 218 and 185 yr for Cores 1 (77.6 cm), 2 (62.6 cm), and 3 (62.6 cm),
respectively. Mean SAR estimates were very similar to those obtained from previous
studies (63.5–86.1 mg cm2
yr1
) of the south basin (Wilkinson and Simpson 2003).
Sedimentary geochemistry – Although the cores were taken from locations
separated by ~35 km, they exhibited a high degree of similarity in elemental composition
and stable isotope content throughout the past 200 years (Fig. 3). Consistent with the
constant SAR, both N (~0.17% of dry mass) (Fig. 3b) and C contents (~1.5%) (Fig. 3c)
were very stable from ca. 1800–1900, increased gradually by 50%, then rose rapidly in
sediments deposited ca. 2006 (Fig. 3b, d). Similarly, C : N mass ratios (~10:1) varied
little either among cores or with burial depth and were characteristic of algal-derived
material (data not shown). In contrast, 15N values increased linearly from background
depleted levels (~4.5‰) ca. 1900 to an enriched maximum (~8.0‰) in surface sediments
(Fig. 3a). Similarly, although 13C values of whole sediment were consistently ~1-2‰
lower in Core 1 than at other sites (Fig. 3c), C isotope ratios in each core were relatively
enriched and constant from ca. 1800–1900, declined irregularly by ~1‰ until ca. 1990,
then exhibited high temporal variability during the past 20 years, with a maximum ca.
2000 and a further minimum ca. 2006.

22
In all three cores, concentrations of TP and chemical fractions showed few
pronounced changes in sediments deposited during the past two centuries (Fig. 4). For
example, TP content was essentially constant throughout the 19th
century and increased
by only 10-15% between ca. 1900 and the present day (Fig. 4a). In general, these
increases reflected variation in NAI-P which accounted for ~45% TP content throughout
the sediment record. NAI-P was stable during ca. 1800–1900, increased gradually until
ca. 1990, then declined sharply to minima in the early 2000s (Fig. 4c). In contrast, AP
(Fig. 4b) and EP concentrations (Fig. 4d) demonstrated little systematic variation through
time, and accounted for ~30% and ~10% of TP content, with the exception of elevated
EP content in surface sediments, and brief declines of AP in Core 1 (1 sample only)
during the 1970s (Fig. 4b). Overall, residual OP content was more variable among cores
and through time (5-15% of TP), exhibiting an increase after 1900 in two cores (Fig. 4e).
Fossil pigments and cyanobacterial microfossils – In contrast to the relatively
complacent geochemical records, analysis of algal fossils revealed three main patterns of
community change consistent with pronounced eutrophication of Lake Winnipeg (Fig. 5).
First, concentrations of pigments from diatoms (diatoxanthin) (Fig. 5a) and cryptophytes
(alloxanthin) (Fig. 5b) which are common in spring algal communities were relatively
constant from ca. 1800–1900, then increased steadily to irregular maxima in recent
sediments. Second, biochemical fossils from summer bloom-forming chlorophytes
(pheophytin b, Chl b) (Fig. 5c) and Nostocales cyanobacteria (canthaxanthin) (Fig. 5d),
and chemically-stable indicators of total algal abundance (β-carotene, pheophytin a) (Fig.
5e), were constant throughout the 19th
century, increased 300-500% to maxima in the late
23
1980s, then declined ~50% in sediments deposited since 1990. Third, concentrations of
akinetes from diazotrophic cyanobacteria increased exponentially in Core 1 sediments
from baseline values between ca. 1800–1990 to 10-fold higher abundances since that time
(Fig. 5f). In general, microfossils from Anabaena spp. were always 10-fold more
abundant than those from Aphanizomenon spp. throughout the 200-year record. Such
concomitant changes in pigment and cyanobacterial microfossil deposition ca. 1990
reflect either shading of other algae by positively buoyant N2-fixing cyanobacteria, or a
change in depositional processes as neutrally-buoyant phytoplankton are replaced by
positively-buoyant diazotrophs (Bunting et al. 2007). Regardless, taken together, these
patterns demonstrate that algal abundance increased ~three- to five-fold during the 20th
century, with an ecosystem state change occurring ca. 1990. In contrast, ratios of labile
to chemically-stable pigments (Chl a : pheophytin a) did not change with depth (not
shown), indicating that preservation environments have been relatively constant since
1800 (Leavitt and Hodgson 2001).
Fossil diatoms – Diatoms were well preserved, abundant, and composed of taxa
characteristic of productive waters throughout the past 200 years (Fig. 6). Constrained
cluster analysis of fossil valve concentrations identified three diatom zones in Core 1,
including communities with low concentrations representing baseline conditions (Zone I,
ca. 1800–1915), a period of slowly rising densities (Zone II, ca. 1915–1975), and an era
of greatly increased diatom deposition (Zone III, ca. 1980-present). Although the same
zones were also identified by cluster analysis of diatom relative (%) abundance (data not
shown), there were only modest changes in species composition during the past 200

24
years. At all core intervals, mesotrophic Aulacoseira islandica (regional TPoptimum = 15.4
μg P L-1
) accounted for 60-85% of sedimentary diatoms in Core 1 (Fig. 6), consistent
with reports of its abundance in spring throughout the 20th
century (Lowe 1923; Bajkov
1930, 1934; Kling 1998). Instead, transition from Zone I to II was marked by declines in
abundance of eutrophic Stephanodiscus niagarae (TPopt = 58.5) and mesotrophic
Aulacoseira subarctica (O. Müller) Haworth (TPopt = 21.5), coupled with modest
increases in A. islandica and eutrophic Stephanodiscus hantzschii Grunow (TPopt = 40.1).
In contrast, the shift from Zone II to III revealed large increases in concentrations of
several diatom taxa, including A. islandica, Stephanodiscus minutulus Håkansson (TPopt
= 41.7) and eutrophic Stephanodiscus spp. (S. parvus Stoermer and Håkansson, S.
hantzschia), and the first occurrence of Cyclostephanos spp. (TPopt = 33.3, 95.1).
Interestingly, diatom-inferred TP concentrations did not vary substantially (range ~12 to
~20 μg P L-1
) during the past 200 years (Fig. 6), suggesting that while total diatom
production increased through the 20th
century (Figs. 5a, 6), factors other than nutrients
regulated precise species composition (e.g., silica, light, turbulence, etc.). Consistent
with this interpretation, total concentrations of diatom valves were correlated strongly (r2
= 0.66, P<0.0001) with sedimentary concentrations of diatoxanthin, the pigment
characteristic of diatoms.
Variance partitioning analysis – VPA revealed that environmental variation
associated with climate (C), crop-based agriculture (A), or livestock husbandry (L)
explained 74.5% of historical changes in lake trophic status (fossil pigments, 13C, 15
N,
C and N content) during 1901–1992 (Fig. 7). Comparison of unique and interactive
25
categories revealed that most of the explained variation arose from interactions between
crops and livestock (A × L = 39.6%; A × L × C = 17.9% explained variance) rather than
from climate change (C = 3.7%; C × A = 0.3%; C × L = 0.1%). Consistent with this
interpretation, RDA with climate predictors alone explained only 22.0% of fossil change
during the 20th
century, whereas similar analysis using either crops (66.5%) or livestock
alone (62.0%) explained three-fold more variation in pigments and geochemistry (Fig. 7).
Only cattle (correlated positively with hogs, negatively with horses) and chickens + hens
(correlated positively with sheep) were retained by forward selection and Monte Carlo
analysis as unique significant livestock predictors of change in fossil time series.
Similarly, canola and potato production were retained in a RDA of fossils with crop
predictors, although production of both these cultivars was correlated positively with that
of many other crops, particularly wheat. Finally, only winter precipitation (correlated
positively with mean summer temperature, negatively with Red River discharge) was
retained as a predictor in RDA constrained to use only climate variables. Interestingly,
multivariate analyses were unable to explain any significant (P <0.05) variation in past
diatom community composition (% relative abundance) during 1904-1993, either in VPA
or in RDA constrained uniquely to climate, crop, or livestock predictors.
Discussion
Analysis of highly resolved time series of sediment geochemistry and algal fossils
demonstrated that southern Lake Winnipeg has undergone three phases of eutrophication
since 1800. The first phase (ca. 1800-1900) includes baseline conditions prior to

26
eutrophication in which the south basin was mesotrophic (~15-20 μg TP L-1
), with stable
influx of N, P, and C (Figs. 3, 4), meso-eutrophic diatom species (A. islandica, S.
niagarae, S. medius) (Fig. 6), and colonial cyanobacteria (Fig. 5d), including diazotrophic
Aphanizomenon and Anabaena spp. (Fig. 5f). Lake Winnipeg eutrophied during the
second phase (ca. 1900–1990), when the coeval intensification of crop and livestock
production (Fig. 7) increased influx of N (Fig. 3a, b) and P (Fig. 4) and allowed a three-
to five-fold increase in abundance of most algae, except N2-fixing cyanobacteria (Fig. 5).
As in other prairie lakes (Hall et al. 1999; Leavitt et al. 2009), climatic variability during
the 20th
century had limited affect on water quality. Finally, during the third stage of
eutrophication (ca. 1990-2006), southern Lake Winnipeg experienced a sudden persistent
ecosystem state change (Scheffer et al. 2001; Scheffer and Carpenter 2003) defined by
rising variance in biogeochemical cycles (Figs. 3, 4) and vernal algal populations (Fig.
5a, b; Fig. 6), a 50% reduction in pigments from summer-blooming algae (Fig. 5c-e), and
a 10-fold increase in sedimentation of N2-fixing cyanobacterial fossils (Fig. 5f). As
described below, suppression of recent diazotrophic blooms will require a ~50% decline
in nutrient influx (~500% to re-establish baseline conditions), while failure to reduce
nutrients may result in a fourth phase of eutrophication in which toxic low-light adapted
Planktothrix and Microcystis predominate such as seen in agricultural regions worldwide
(Leavitt et al. 2006; Bunting et al. 2007; Xu et al. 2010).
Quantification of baseline conditions – Development of effective lake
management strategies requires well defined scientific objectives for remediation of
water quality. Unfortunately, due to its large size and relatively remote location (Fig. 1),

27
few limnological data exist prior to 1970 (Lowe 1924; Bajkov 1930, 1934; Brunskill
1973), and baseline conditions are unknown beyond preliminary analysis of fossil algae
(Kling 1998) and phosphorus (Mayer et al. 2006) in poorly resolved cores. Here we
demonstrate that the southern basin of Lake Winnipeg was naturally mesotrophic (TP =
15-20 μg TP L-1
) prior to intensification of European-style agriculture, with diatoms
characteristic of regional eutrophic lakes (Cumming et al. 1995; Hall et al. 1999) (Fig. 6),
abundant cyanobacteria (Fig. 5d), low but constant densities of diazotrophic
Aphanizomenon and Anabaena spp. (Fig. 5f), and sedimentary P typical of productive
hardwater lakes (Allan 1980; Engstrom et al. 2006) (Fig. 4).
Several lines of evidence suggest that southern Lake Winnipeg was P-rich prior to
development of the drainage basin. First, baseline concentrations of TP in sediments
(~0.6 mg P g-1
dry mass) (Fig. 4a) were similar to pre-agricultural values (0.8 + 0.1 mg P
g-1
dry mass) (Hall et al. 1999 and unpublished data) recorded in diverse lakes of the
northern Great Plains (Allen et al. 1980; Triplett et al. 2009; Engstrom et al. 2009), other
large shallow hardwater lakes (e.g., Lake Okeechobee) (Engstrom et al. 2006), and
previous analysis of Lake Winnipeg sediments (Mayer et al. 2006). Second, fossil
diatom communities were composed predominantly of taxa with inferred P requirements
>15 μg TP L-1
(Fig. 6), such that abundance-weighted estimates of water-column P
ranged 15-20 μg TP L-1
during the 19th
century. Finally, sediments were composed
largely of inorganic forms of labile (NAI-P; 45%) and inert inorganic P (AP; 30%),
similar to other eutrophic lakes of the northern Great Plains (Allen et al. 1980; Engstrom
et al. 2009; Triplett et al. 2009). Unfortunately, the high proportion of biologically-
unavailable P, combined with minimal temporal variability in P concentration (Fig. 4),
28
despite pronounced eutrophication (Fig. 5), suggest that historical changes in sedimentary
P cannot be used to estimate baseline water-quality conditions within the lake.
Calculations based on combined analysis of total algal abundance (as fossil β-
carotene) (Fig. 5e) and modern nutrient content suggest that baseline water-column
concentrations of TP in the south basin ranged 15-20 μg TP L-1
, characteristic of other
mesotrophic prairie lakes (Pham et al. 2008, 2009). Here we assumed that algal
production during the 20th
century was limited by the influx of P (Schindler 1977), that
the relationship between algal density and P concentrations was consistent throughout
1800-1992, and that variations in fossil β-carotene concentrations were correlated linearly
to changes in total algal abundance (Cuddington et al. 1999; Leavitt and Hodgson 2001).
Therefore, given that mean (+ SD) water-column TP in the south basin was 80 + 15 μg P
L-1
during 1992-1996 (MWS unpublished data), and that sedimentary β-carotene
concentrations in the three cores were between 4.33 + 1.10 and 5.53 + 1.74 -fold greater
during the early 1990s than before 1900 (depending on whether mean [1960-1992] or
maximum pigment concentrations were used), we estimate that the south basin contained
14.5 – 18.5 μg TP L-1
prior to eutrophication. These values agree well with the range
inferred from analysis of fossil diatoms (Fig. 6; but see caveats below) and unpublished
hydrological simulations of nutrient export (G. McCullough, R. Hesslein, FOC,
unpublished data), and demonstrate that Lake Winnipeg should be managed for
mesotrophic rather than oligotrophic conditions.
Mechanisms causing water-quality change during the 20th
century – Water quality
in the south basin of Lake Winnipeg was degraded substantially during the 20th
century
29
(Fig. 5), largely due to the combined effects of crop and livestock production, but not
climate change (Fig. 7). Specifically, abundance of all algal groups except diazotrophic
cyanobacteria increased 300-500% (Fig. 5), 15N values increased 3-4 ‰ due to influx of
enriched N (Fig. 3a) (Anderson and Cabana 2005; vander Zanden et al. 2005; Bunting et
al. 2007), and 13C declined 1-2‰ consistent with increased primary production and
reliance on respired CO2 (Leavitt et al. 2006; Bunting et al. 2007). VPA explained almost
75% of historical variation in indices of lake trophic status (pigments, isotopes, %C, %N)
between ca. 1900-1992 due to increased production of cattle, hogs, chicken, and major
crop cultivars (canola, potatoes, wheat, etc.), while the unique effects of climate and its
first-order interactions with crop and livestock production (C, C× L, C× A) explained a
non-significant (P >0.15) fraction (4.1%) of historical change (Fig. 7). Such weak effects
of pronounced warming (~3oC increase, ~35 day decline in ice cover) have been
documented for other lakes within the Lake Winnipeg catchment (Leavitt et al. 2009),
and are consistent with theoretical and empirical expectations that changes in mass (m)
influx (water, solutes, particles) can overwhelm effects on lakes of increased energy (E)
influx (as temperature, irradiance, ice cover, wind energy) (Dröscher et al. 2009; Leavitt
et al. 2009; Vogt et al. 2011).
Intensification of nutrient fluxes due to widespread crop production and animal
husbandry is now the most significant mechanism causing eutrophication of fresh and
coastal waters (Carpenter et al. 1998; Smith 2003). For example, grains such as wheat
(~1×10⁹ kg yr
-1 in 1910s) and barley (0.3-0.5×10
9 kg yr
-1 in 1910s) have dominated
production since regional farming began (Honey and Oleson 2006), but their harvest
increased dramatically following World War II (WWII; 1939-1945), reaching 5×10⁹ kg

30
yr-1
and 2×10⁹ kg yr
-1, respectively, during the 1980s (Statistics Canada 1871-2006).
Similarly, irrigation-intensive potato production increased linearly from stable values of
~0.1×10⁹ kg yr
-1 1900-1950 to modern harvests >1×10
9 kg yr
-1 (Statistics Canada 1871-
2006) due to increased demand for processed food (Honey and Oleson 2006). Although
canola was introduced after 1945, this crop found favour only after 1960s (Honey and
Oleson 2006), when its area seeded increased from <12,000 ha in 1961, to 0.24×10⁶ ha in
1971, and 1.15×10⁶ ha in 2004 (~25% of Canadian canola crop). Interestingly, we infer
that the effects of crop production on water quality arose mainly due to mechanized
tillage of soils and manure application, rather than due to chemical fertilizer use, because
there was little eutrophication during the 1800s despite substantial crop development
(Fig. 3-6), because lake production was inversely correlated with horse density in VPA
(horses were replaced by tractors), and because use of chemical fertilizers was negligible
prior to 1960 (Korol and Rattray 1999) yet coeval fossil pigment concentrations were
~70% of late 1980s maxima (Fig. 5).
Degradation of water quality by livestock production arises most commonly when
animal densities greatly exceed that of humans, and mass imbalances occur between
nutrient importation to sustain forage and other crops and their export in agricultural
products (e.g., Bennett et al. 2001; Bunting et al. 2007). With the exception of the 1930s
(drought) and 1940s (WWII), human populations in MB increased linearly from ca. 1850
to present, and now exceed 1.26×10⁶ individuals, mainly in City of Winnipeg (~55%). In
contrast, cattle populations were ~0.75×10⁶ until ca. 1950, increased to ~1.5×10
6 by
1975, declined for 20 yr, and then peaked at ~1.75×10⁶ in the 2000s (Statistics Canada
1906-2006). Similarly, MB hog populations were <0.75×10⁶ until ~1980, after which

31
time densities increased exponentially to ~3×10⁶ head by 2005. Interestingly, chicken
and hen populations varied between 6- and 8×10⁶ since the mid 1940s, after having
increased rapidly during the early 20th
century (Statistics Canada 1906-2006). Taken
together, we find that MB biomass for these three species alone is ~12-fold greater than
that of humans (~60 kg ind-1
), assuming market weights for chickens (2 kg ind-1
), hogs
(112 kg ind-1
), and cattle (317 kg ind-1
). Given that Winnipeg (pop. 742,000) accounts
for 5-10% of nutrient influx to Lake Winnipeg (Table 2), we infer that livestock wastes
may contribute strongly to the eutrophication of Lake Winnipeg, either as direct runoff or
via their use as fertilizers (Bunting et al. 2007).
Strongly enriched (3-4‰) sedimentary 15N values recorded after 1900 are
consistent with increased influx of N from agricultural (Anderson and Cabana 2005;
vander Zanden et al. 2005; Bunting et al. 2007) or urban sources (Savage et al. 2004;
Leavitt et al. 2006). Although it is difficult to distinguish among N sources, we infer that
the City of Winnipeg is the most likely source of enriched N, despite accounting for only
5-10% of TN influx, as similar enrichments have not been recorded in eight cores from
the north basin of Lake Winnipeg (Bunting et al. unpublished data), four cores from
adjoining Lake Manitoba (Leavitt et al. unpublished data), and six other lakes within the
catchment (Leavitt et al. 2007), all sites which receive substantial agricultural N, but not
direct urban N. As reviewed elsewhere (Savage et al. 2004; Leavitt et al. 2007), urban
wastewater treatment can enrich dissolved N by 10-25‰ due to intense isotopic
fractionation during NH3 volatilization or denitrification of waste N. Consistent with this
interpretation, changes in fossil 15N were correlated more highly with growth of

32
Winnipeg’s population during the 20th
century (r2 = 0.82, P <0.0001) than with changes
in either MB cattle (r2 = 0.74, P <0.0001) or hog populations (r
2 = 0.52, P <0.0001).
Limited unique effects of climatic variability on eutrophication of southern Lake
Winnipeg during the 20th
century (Fig. 7) are consistent with predictions of the Energy-
mass (Em) flux framework (Leavitt et al. 2009) and empirical observations from more
than 20 agriculturally-impacted lakes within the Canadian Prairies (Hall et al. 1999;
Pham et al. 2008; Dröscher et al. 2009; Leavitt et al. 2009). Regional fall, winter, and
spring mean and minimum temperatures have increased ~3oC since the late 1800s
(Statistics Canada 1897-2006), leading to ~35 day increase in ice-free season in southern
MB (Hall et al. 1999). Although similar magnitudes of climatic variation affect lakes
worldwide (reviewed in Adrian et al. 2009), recent syntheses suggest that unique effects
of global warming (air temperature, ice cover, wind) can be overridden by changes in
mass influx associated with agricultural development and modified hydrologic regime
(Pham et al. 2008; Dröscher et al. 2009; Leavitt et al. 2009). Similarly, although Red
River discharge also varied 10-fold among decades (MWS unpublished data) and was
retained in the VPA (Fig. 7), there was no sustained interdecadal increase in hydrologic
influx until 1990, and climatic variables uniquely explain only ~4% of historical variation
in lake production parameters (Fig. 7). Instead, we note that conversion of terrestrial
ecosystems to agriculture within lake catchments increases m influx to lakes by >10-fold
whenever land-use practices prevent re-establishment of natural vegetation (reviewed in
Dearing and Jones 2003).
Our statistical approach was unable to clearly isolate the unique effects of crop
and livestock production on water quality degradation during the 20th
century (Fig. 7),
33
mainly because of residual co-linearity among predictors following selection of
environmental time series (see Methods). Additionally, cumulative explained variance
(~75%) was lower than that recorded in VPA of other lakes in the catchment (87-97%)
using identical protocols (Hall et al. 1999; Leavitt et al. 2009), likely because we did not
include urban (~5-10% TP and TN) or US nutrient sources (~34% TP, 21% TN) (Table
2). Similarly, we were unable to partition the unique effects of N and P pollution as has
been done in coastal marine systems (Savage et al. 2010), because TN has been rarely
monitored and because TN in regional lakes includes a high proportion (>70%) of
dissolved organic N of uncertain biological availability (Patoine et al. 2006; Leavitt et al.
2006; Bunting et al. 2010). High colinearity among sedimentary variables also prevented
us from quantifying the unique effects of N and P on southern Lake Winnipeg using
fossil time series, even though historical changes in total algal abundance (as β-carotene)
were correlated strongly with sedimentary concentrations of P (r2 = 0.47 + 0.25, P
<0.02), %N (r2 = 0.81 + 0.08, P <0.0001), and 15
N values (r2 = 0.72 + 0.16, P <0.0001)
in all three cores (1901-1992). Finally, the lack of historical variation in diatoms species
composition prevented VPA of relative abundance data, and complicated interpretations
of diatom-inferred TP concentrations (Fig. 6). Despite these caveats, the observation that
changes in MB crop (wheat, canola, potatoes) and livestock production (cattle, hogs,
chicken + hens) explained ~75% of variation in south basin production 1901-1992 allows
regulatory agencies to develop more effective management strategies, as outlined below.
Ecosystem State Change – Nearly a century of eutrophication combined with
rapid agricultural development during the past ~30 years appears to have initiated an
34
ecosystem state change ca. 1990 (Scheffer et al. 2001; Scheffer and Carpenter 2003),
from diverse productive algal communities to modern assemblages composed mainly of
buoyant diazotrophic Aphanizomenon and Anabaena spp. (Fig. 5) (Kling 1998). As
predicted from theory (Cottingham et al. 2000; Carpenter 2003; Carpenter and Brock
2006), state change was also marked by elevated temporal variation in many lake
characteristics, including production and deposition of diatoms (Fig. 5a, Fig. 6),
cryptophytes (Fig. 5b), and summer bloom-forming algae (Figs 5c-d), carbon cycling
(Fig. 3c), and relative composition of sedimentary P fractions (Fig. 4). At present, it is
unclear whether the 50% decline in concentrations of ubiquitous fossil pigments (β-
carotene, pheophytin a) after 1990 (Fig. 5e) reflects a true reduction in algal abundance
due to shading by floating cyanobacteria (McGowan et al. 2005; Bunting et al. 2007),
lateral transfer of these algae to lakeshores (LWIC 2006), or increased pigment
degradation due to slower sinking of buoyant taxa (Cuddington et al. 1999; Leavitt and
Hodgson 2001). Regardless, we inter that southern Lake Winnipeg has undergone a state
change due to a persistent change in external forcing (Leavitt et al. 2009), rather than a
transition between alternative stable states (Scheffer et al. 2001; Scheffer and Carpenter
2003; Carpenter 2005), because the south basin’s polymictic status and poor light
penetration (Zsecchi <1 m, Zmean 9.7 m) prevent many internal mechanisms (internal
nutrient loading, macrophytes, stratification, benthic algal production) (Fig. 6) needed to
stabilize alternative states (Scheffer and Carpenter 2003). This distinction is important
for managers because stabilizing feedback mechanisms associated with alternative stable
states can substantially delay lake response to declines in external nutrient influx
(Scheffer et al. 2001; Scheffer and Carpenter 2003).

35
Socio-economic analyses suggest that ecosystem state change occurred because of
a sequence of international (Venema 2006), federal (Bradshaw et al. 2004), and
provincial (Martin et al. 1999; Novek 2003) policy decisions which intensified MB
agriculture, especially hog, potato and canola production, following a century of intensive
exploitation for grains. Specifically, Canadian agricultural policies were modified in the
1980s and 1990s to comply with World Trade Organization, Canada-US, and North
American Free Trade agreements and to increase exports (hogs, oilseeds, grains),
deregulate transportation (railways), induce foreign investment, reduce governmental
subsidies, and eliminate price controls, among other activities (Venema 2006). In
particular, the National Farmers Union notes that modification (1984) and elimination
(1996) of long-standing (since 1897) rail transportation subsidies (Crows Nest Pass
Agreement, Western Grain Transportation Act) increased grain transportation costs more
than three-fold, particularly for MB farmers 1500 km distant from coastal grain shipping
ports (Novek 2003). Concomitantly, international prices for grains declined, the federal
Gross Revenue Insurance Plan for farmers was eliminated (Bradshaw et al. 2004), and
world pork demand tripled (Agriculture and Agri-Food Canada 1997; Novek 2003;
Venema 2006).
Manitoba government sought to offset resultant 40% declines in agricultural
revenues and promoted ‘the Manitoba advantage’ (low feed-grain costs, intensive forage
cultivation, 5.4 × 10⁶ ha for waste assimilation, pro-business attitude) to both regional
farmers and international hog producers facing severe environmental and regulatory
constraints (e.g., North Carolina, Denmark, Netherlands, Taiwan) (Martin et al. 1999;
Novek 2003; MB Agriculture and Food 2010). As a result, hog number increased five-
36
fold and operations intensified (~350% fewer farms, 8-fold increase in areal animal
densities) during 1981-2000 (Schnaiberg and Gould 1994; Novek 2003; Venema 2006)
while fodder corn production increased from 0.1 ×10⁹ kg yr
-1 to ~1.2 ×10
9 kg yr
-1
(Statistics Canada 1871-2006). Between 1990 and 2010, agricultural diversification also
increased annual harvest of canola and potatoes by ~2.5 ×10⁹ kg (500%) and ~0.7 ×10
9
kg (275%), respectively, whereas production of other major grains declined slightly
(wheat, barley, mixed grains, corn) or changed little (oats) relative to previous production
(Statistics Canada 1871-2006). Such sudden increases in crop and livestock production
increased nutrient runoff in southern MB, as recorded by elevated nutrient concentrations
in all tributary rivers ( Jones and Armstrong 2001), ~20% increases in water column
concentrations of N and P (MWS unpublished data), and a decline in water column TN :
TP ratios from ~8.5 to 6.3 since 1990 (MWS unpublished data).
Scientific and management implications – Sedimentary analyses provide a unique
opportunity to improve scientifically-based strategies for lake remediation. By assuming
Lake Winnipeg has been regulated mainly by the influx of P prior to regime shift ca.
1990, we propose that modern TP content in the south basin (~100 μg P L-1
) must be
reduced ~five-fold to return the basin to mesotrophic conditions characteristic of the pre-
agricultural era (~15-20 μg P L-1
). These targets are consistent with the P optimum of the
predominant (60-80% of valves) diatom taxon, Aulacoseira islandica (~15.4 μg P L-1
),
determined using a survey of >100 regional lakes, although we caution that factors other
than nutrient influx (e.g., physical mixing, Si, light, etc.) appear to be regulating diatom
species composition in the south basin (Fig. 6). Similarly, we recommend that modern

37
TP concentrations be reduced to ~50 μg P L-1
(50% decrease) to suppress current
outbreaks of diazotrophic cyanobacteria and reduce the present surplus of water column
SRP (~50% of TP), yet allow for the high interannual variability in river discharge which
regulates nutrient influx to the lake. We infer that the lake will not show hysteresis in
response to nutrient reduction because the recent state change appears to lack most
internal mechanisms that would stabilize a turbid, cyanobacteria-rich state (e.g., anoxia,
internal nutrient loading, bioavailable sedimentary P) (Fig. 4). Further, we believe that
these thresholds (50%, 500% reductions) will also apply to the north basin of Lake
Winnipeg, despite ~50% lower ambient TN and TP concentrations (MWS unpublished
data), as most of the nutrients enter that site from the south basin.
Finally, we caution that failure to immediately reduce P influx may initiate a final
transition in lake state from buoyant N2-fixing Aphanizomenon and Anabaena to
potentially toxic, but low-light adapted cyanobacteria (Planktothrix, Microcystis,
Cylindrospermopsis) due to continued pollution with N, as has occurred in the Canadian
Prairies (Patoine et al. 2006; Leavitt et al. 2007), Europe (Scheffer et al. 1990; Bunting et
al. 2007), China (Paerl and Scott 2010; Xu et al. 2010), and elsewhere. These turbid
polymictic lakes usually lie in catchments with P-rich soils due to natural geology or
prolonged agriculture (Carpenter 2005), accumulate >50 μg P L-1
as bioavailable SRP
during summer despite greatly elevated cyanobacterial biomass, and exhibit highly
significant correlations (r2 >0.7) between total algal biomass and N influx, but not P
supply, in long-term (>20 yr) monitoring studies (e.g., Bunting et al. 2007). In addition,
several of these sites have paleolimnological time series which demonstrate that
diazotrophic cyanobacteria are replaced within decades by potentially toxic cyanobacteria

38
due to continued pollution of P-rich systems with N (Leavitt et al. 2006; Bunting et al.
2007). As demonstrated by three years of month-long, large-scale (>3000 L) mesocosm
experiments, pollution of P-rich polymictic lakes with reduced N (urea, NH3) can
suppress N2-fixing Aphanizomonen and Anabaena but increase total biomass and toxicity
of Microcystis and Planktothrix by up to 400% when lakes have >50 μg SRP L-1
and
dissolved N : P <20 : 1 (Finlay et al. 2010). Unfortunately, monitoring since 1992
demonstrates that southern Lake Winnipeg now exhibits these same characteristics,
suggesting that the lake is already subject to damage by N pollution and that there may be
substantial benefits to reducing both N and P influx (Paerl and Scott 2010).

39
References
ADRIAN, R., AND OTHERS. 2009. Lakes as sentinels of climate change. Limnol. Oceanogr.
54: 2283-2297.
AGRICULTURE AND AGRIFOOD CANADA (AAC). 1997. Investing in Canada’s Hog and
Pork Industry. www.aeis.agr.ca/misb/aisd/redmeat.
ALLAN, R. J. 1980. The inadequacy of existing chlorophyll a/phosphorus concentration
correlations for assessing remedial measures of hypertrophic lakes. Environ. Pollut. Ser.
B.1: 217-231.
ANDERSON, C., AND G. CABANA. 2005. 15N in riverine food webs: Effects of N inputs
from agricultural watersheds. Can. J. Fish. Aquat. Sci. 62: 333-340.
APPLEBY, P. G., P. J. NOLAN, D. W. GIFFORD, M. J. GODFREY, F. OLDFIELD, N. J.
ANDERSON, AND R. W. BATTARBEE. 1986. 210
Pb dating by low background gamma
counting. Hydrobiologia 143: 21-27.
BAJKOV, A. 1930. Biological conditions of Manitoba lakes. Contrib. Can. Biol. Fish. 5:
383-422.
BAJKOV, A. 1934. The plankton of Lake Winnipeg drainage system. Int. Rev. Gesamt.
Hydrobiol. Hydrograph 31: 239-272.
BENNETT, E. M., S. R. CARPENTER, AND N. F. CARACO. 2001. Human impact on erodible
phosphorus and eutrophication: A global perspective. Bioscience 51: 227-234.
BINFORD, M.W. 1990. Calculation and uncertainty analysis of 210
Pb dates for PIRLA
project lake sediment cores. J. Paleolimnol. 3: 253-269.

40
BORCARD, D., P. LEGENDRE, AND P. DRAPEAU. 1992. Partialling out the spatial
component of ecological variation. Ecology 73: 1045-1055.
BOURNE, A., N. ARMSTRONG, AND G. JONES. 2002. A preliminary estimate of total
nitrogen and total phosphorus loading to streams in Manitoba, Canada. Manitoba
Conservation Report 2002-04. Winnipeg, MB, Canada. 49pp.
BRADSHAW, B., H. DOLAN, AND B. SMIT. 2004. Farm-level adaptation to climate
variability and change: Crop diversification in the Canadian prairies. Climate Change 67:
119-141.
BRUNSKILL, G. J. 1973. Rates of supply of nitrogen and phosphorus to Lake Winnipeg,
Manitoba, Canada. Int. Verein. Theor. Angew. Limnol. Verhandl. 18: 1755-1759.
BRUNSKILL, G. J., AND B. W. GRAHAM. 1979. The offshore sediments of Lake
Winnipeg. Can. Fish. Mar. Serv. MS Report 1540, 75 p.
BRUNSKILL, G. J., P. CAMPBELL, AND S. E. M. ELLIOTT. 1979. Temperature, oxygen,
conductance and dissolved major elements in Lake Winnipeg. Can. Fish. Mar. Serv. MS
Report 1526, 127 p.
BRUNSKILL, G. J., S. E. M. ELLIOTT, AND P. CAMPBELL. 1980. Morphometry, hydrology,
and watershed data pertinent to the limnology of Lake Winnipeg. Canadian MS Report
Fish. Aquat. Sci. 1556. 39 pp.
BUNTING, L., P. R. LEAVITT, C. E. GIBSON, E. J. MCGEE, AND V. A. HALL. 2007.
Degradation of water quality in Lough Neagh, Northern Ireland, by diffuse nitrogen flux
from a phosphorus-rich catchment. Limnol. Oceanogr. 52: 354-369.

41
BUNTING, L., P. R. LEAVITT, R. P. WEIDMAN, AND R. D. VINEBROOKE. 2010. Regulation
of the nitrogen biogeochemistry of mountain lakes by subsidies of terrestrial dissolved
organic matter and the implications for climate studies. Limnol. Oceanogr. 55: 333-345.
CARPENTER, S. R. 2003. Regime shifts in lake ecosystems: Patterns and variation.
International Ecology Institute, Oldendorf, Germany.
CARPENTER, S. R. 2005. Eutrophication of aquatic ecosystems: Bistability and soil
phosphorus. Proc. Natl. Acad. Sci. USA. 102: 10002-10005.
CARPENTER, S. R., AND W. A. BROCK. 2006. Rising variance: A leading indicator of
ecological transition. Ecol. Lett. 9: 311-318.
CARPENTER, S. R., N. F. CARACO, D. L. CORRELL, R. W. HOWARTH, A. N. SHARPLEY, AND
V. H. SMITH. 1998. Nonpoint pollution of surface waters with phosphorus and nitrogen.
Ecol. Appl. 8: 559-568.
COTTINGHAM, K. L., J. A. RUSAK, AND P. R. LEAVITT. 2000. Increased ecosystem
variability and reduced predictability following fertilization: Evidence from
palaeolimnology. Ecol. Lett. 3: 340-348.
CROWE, J. M. E. 1973. Limnology of the south basin of Lake Winnipeg, March 1965-
March 1969: Manitoba Department of Mines and Environmental Management, Research
Branch MS Report 73-24, 37 p.
CRUMPTON, W. G. 1987. A simple and reliable method for making permanent mounts of
phytoplankton for light and fluorescence microscopy. Limnol. Ocanogr. 32: 1154–1159.
CUDDINGTON, K., AND P. R. LEAVITT. 1999. An individual-based model of pigment flux
in lakes: Implications for organic biogeochemistry and paleoecology. Can. J. Fish. Aquat.
Sci. 56: 1964-1977.
42
CUMMING, B. F., S. E. WILSON, R. I. HALL, AND J. P. SMOL. 1995. Diatoms from British
Columbia (Canada) lakes and their relationship to salinity, nutrients, and other
limnological variables. Biblioth. Diatomol. Band 31. Gebrüder Bornträger, Berlin.
DEARING, J. A., AND R. T. JONES. 2003. Coupling temporal and spatial dimensions of
global sediment flux through lake and marine sediment records. Glob. Planet. Change 39:
147-168.
DRÖSCHER, I., A. PATOINE, K. FINLAY, AND P. R. LEAVITT. 2009. Climate control of the
spring clear-water phase through the transfer of energy and mass to lakes. Limnol.
Oceanogr. 54: 2469-2480.
ENGSTROM, D. R., J. E. ALMENDINGER, AND J. A. WOLIN. 2009. Historical changes in
sediment and phosphorus loading to the upper Mississippi River: Mass-balance
reconstruction from the sediments of Lake Pepin. J. Paleolimnol. 41: 563-588.
ENGSTROM, D. R., AND H. E. WRIGHT. 1984. Chemical stratigraphy of lake sediments as a
record of environmental change. p. 11-67, in E. Y. Haworth and J. W. J. Lund [eds.],
Lake sediments and environmental history. University of Minnesota Press.
ENGSTROM, D. R., S. P. SCHOTTLER, P. R. LEAVITT, AND K. E. HAVENS. 2006. A
reevaluation of the cultural eutrophication of Lake Okeechobee using multi-proxy
sediment records. Ecol. Applic. 16: 1194-1206.
FINLAY, K., A. PATOINE, D. B. DONALD, M. J. BOGARD, AND P. R. LEAVITT. 2010.
Experimental evidence that pollution with urea can degrade water quality in phosphorus-
rich lakes of the Northern Great Plains. Limnol. Oceanogr. 55: 1213-1230.

43
FOY, R. H., J. S. BAILEY, AND S. D. LENNOX. 2002. Mineral balances for the use of
phosphorus and other nutrients by agriculture in Northern Ireland from 1925-2000 –
Methodology, trends, and impacts of losses to water. Ir. J. Agric. Food Res. 41: 247-263.
GRIMM, E. 1987. CONISS: A FORTRAN 77 program for stratigraphically constrained
cluster analysis by the methods of incremental sum of squares. Comp. Geosci. 13: 13-35.
HALL, R. I., AND J. P. SMOL. 1992. A weighted averaging regression and calibration
model for inferring total phosphorus concentration from diatoms in British-Columbia
(Canada) lakes. Freshwat. Biol. 27: 417-434.
HALL, R. I., P. R. LEAVITT, R. QUINLAN, A. S. DIXIT, AND J. P. SMOL. 1999. Effects of
agriculture, urbanization, and climate on water quality in the northern Great Plains.
Limnol. Oceanogr. 44: 739-756.
HECKY, R. E., H. J. KLING, AND G. J. BRUNSKILL. 1986. Seasonality of phytoplankton in
relation to silicon cycling and interstitial water circulation in large, shallow lakes of
central Canada. Hydrobiol. 138: 117-126.
HONEY, J. AND B. OLESON. 2006. A century of agriculture in Manitoba. Department of
Agribusiness and Agricultural Economics, Occasional publication, University of
Manitoba. http://www.umanitoba.ca/afs/agric_economics/Century/
ACenturyofAgriculture.PDF
HYATT, C. V., A. M. PATERSON, K. M. RÜHLAND, AND J. P.SMOL. 2011. Examining 20th
century water quality and ecological changes in the Lake of the Woods, Ontario, Canada:
A paleolimnological investigation. J. Great Lakes Res. 37: In press.
44
JEPPESEN, E., AND OTHERS. 2005. Lake responses to reduced nutrient loading – an
analysis of contemporary long-term data from 35 case studies. Freshwat. Biol. 50:
1747–1771.
JONES, G., AND N. ARMSTRONG. 2001. Long-term trends in total nitrogen and total
phosphorus concentrations in Manitoba streams. Water Quality Management Section,
Water Branch, Manitoba Conservation, Winnipeg, MB. Manitoba Conservation Report
No. 2001-07. 154 pp.
JUGGINS, S. 2003. C2 software for ecological and palaeoecological data analysis and
visualization user guide version 1.3. University of Newcastle.
KLING, H. J. 1998. A summary of past and recent plankton of Lake Winnipeg, Canada
using algal fossil remains. J. Paleolimnol. 19: 297-307.
KOROL, M. 2002. Canadian fertilizer consumption, shipments and trade 2001/2002.
Agriculture and Agri-Food Canada Strategic Policy Branch. www.agr.ca
KOROL, M., AND G. RATTRAY. 1999. Canadian fertilizer consumption, shipping and trade
1997/1998. Agriculture and Agri-Food Canada Strategic Policy Branch. Report.
www.agr.ca
LAIRD, K. R., AND B. F. CUMMING. 2009. Diatom-inferred lake level from near-shore
cores in a drainage lake from the Experimental Lakes Area, northwestern Ontario,
Canada. J. Paleolimnol. 42: 65-80.
LAKE WINNIPEG IMPLEMENTATION COMMITTEE (LWIC). 2006. Restoring the health of
Lake Winnipeg. Main Report and Technical Annex. Lake Winnipeg Implementation
Committee, Winnipeg, Manitoba. 60 pp.
45
LEAVITT, P. R., AND D. A. HODGSON. 2001. Sedimentary pigments. p. 295-325, in J. P.
Smol, H. J. B. Birks, and W. M. Last [eds.], Tracking environmental change using lake
sediments. V. 3: Terrestrial, algal and siliceous indicators. Kluwer.
LEAVITT, P. R., C. S. BROCK, C. EBEL, AND A. PATOINE. 2006. Landscape-scale effects
of urban nitrogen on a chain of freshwater lakes in central North America. Limnol.
Oceanogr. 51: 2262-2277.
LEAVITT, P. R. AND OTHERS. 2009. Paleolimnological evidence of the effects on lakes of
energy and mass transfer from climate and humans. Limnol. Oceanogr. 54: 2330-2348.
LOGAN, T. J., T. O. OLOYA, AND S. YAKSICH. 1979. Phosphate characteristics and
bioavailablity of suspended sediments from streams draining into Lake Erie. J. Great
Lakes Res. 5:112-123.
LOWE, C. W. 1924. The freshwater algae of Canada. Trans. Roy. Soc. Can. XVIII, 48 pp.
MANITOBA AGRICULTURE AND FOOD. 2010. Pork in Manitoba. Government of Manitoba
www.gov.mb.ca/agriculture/livestock.
MANITOBA WATER STEWARDSHIP (MWS). 2006. Questions and answers: Water quality
management zones for nutrients. A proposed regulation under the Water Protection Act.
Manitoba Government.
MARTIN, L., Z. KRUJA, AND A. ALEXIOU. 1999. Prospects of hog production and
processing in Canada: Update. The George Morris Centre. Guelph, Ontario. 46 pp.
http://www.georgemorris.org/aspx/Public/Utils/DbFileViewerPopup.aspx?FileID=79
MAYER, T., S. L. SIMPSON, L. H. THORLEIFSON, W. L. LOCKHART, AND P. WILKINSON.
2006. Phosphorus geochemistry of recent sediments in the South Basin of Lake
Winnipeg. Aquat. Ecosyst. Health Manage. 9: 307-318.
46
MCGOWAN, S., P. R. LEAVITT, R. I. HALL, N. J. ANDERSON, E. JEPPESEN, AND B.V
ODGAARD. 2005. Controls of algal abundance and community composition during
ecosystem state change. Ecology 86: 2200-2211.
MICHELS, A., K. R. LAIRD, S. E. WILSON, D. THOMSON, P. R. LEAVITT, R. J. OGLESBY,
AND B. F. CUMMING. 2007. Multi-decadal to millennial-scale shifts in drought conditions
on the Canadian Prairies over the past six millennia: Implications for future drought
assessment. Global Change Biol. 13: 1295–1307.
NOVEK, J. 2003. Intensive hog farming in Manitoba: Transnational treadmills and local
conflicts. Can. Rev. Sociol. Anthropol. 40: 3-26.
PATALAS, K., AND A. SALKI. 1992. Crustacean plankton in Lake Winnipeg: Variations in
space and time as a function of lake morphology, geology, and climate. Can. J. Fish.
Aquat. Sci. 49: 1035-1059.
PATOINE, A., M., D. GRAHAM, AND P. R. LEAVITT. 2006. Spatial variation in nitrogen
fixation in lakes of the northern Great Plains. Limnol. Oceanogr. 51: 1665-1677.
PAERL, H. W., AND J. T. SCOTT. 2010. Throwing fuel on the fire: Synergistic effects of
excessive nitrogen inputs and global warming on harmful algal blooms. Env. Sci.
Technol. 44: 7756-7758.
PHAM, S. V., P. R. LEAVITT, S. MCGOWAN, AND P. PERES-NETO. 2008. Spatial variability
of climate and land-use effects on lakes of the northern Great Plains. Limnol. Oceanogr.
53: 728-742.
PHAM, S. V., P. R. LEAVITT, S. MCGOWAN, B. WISSEL, AND L. I. WASSENAAR. 2009.
Spatial and temporal variability of prairie lake hydrology as revealed using stable
isotopes of hydrogen and oxygen. Limnol. Oceanogr. 54: 101-118.

47
SAVAGE, C., P. R. LEAVITT, AND R. ELMGREN. 2004. Distribution and retention of sewage
nitrogen in surface sediments of a coastal bay. Limnol. Oceanogr. 49: 1503-1511.
SAVAGE, C., P. R. LEAVITT, AND R. ELMGREN. 2010. Effects of land use, urbanization,
and climate variability on coastal eutrophication in the Baltic Sea. Limnol. Oceanogr. 55:
1033-1046.
SCHEFFER, M., AND S. R. CARPENTER. 2003. Catastrophic regime shifts in ecosystems:
Linking theory to observation. Trends Ecol. Evol. 18: 648-656.
SCHEFFER, M., S. R. CARPENTER, J. A. FOLEY, C. FOLFE, AND B. WALKER. 2001.
Catastrophic shifts in ecosystems. Nature 413: 591-596.
SCHEFFER, M., S. RINALDI, A. GRAGNANI, L. R. MUR, AND E. H. VAN NES. 1990. On the
dominance of filamentous cyanobacteria in shallow, turbid lakes. Ecology 78: 272-282.
SCHELSKE, C. L., A. PEPLOW, M. BRENNER, AND C. N. SPENCER. 1994. Low-background
gamma counting: Applications for 210
Pb dating of sediments. J. Paleolimnol. 10: 115-
128.
SCHINDLER, D.W. 1977. Eutrophication and recovery in experimental lakes: Implications
for lake management. Science 184: 897-899.
SCHINDLER, D. W. 2006. Recent advances in understanding and management of
eutrophication. Limnol. Oceanogr. 51: 377-384.
SCHNAIBERG, A. AND K. GOULD. 1994. Environment and society: The enduring conflict.
St. Martin’s Press.
SMITH, R. E., H. VELDHUIS, G. F. MILLS, R. G. EILERS, W. R. FRASER, AND G. W. LELYK.
1998. Terrestrial ecozones, ecoregions, and ecodistricts of Manitoba. An ecological
stratification of Manitoba’s natural landscapes. Tech Bulletin 98-9E. Land Resource
48
Unit, Brandon Research Centre, Research Branch, Agriculture and Agri-Food Canada.
Winnipeg, Manitoba.
SMITH, V. H. 2003. Eutrophication of freshwater and coastal marine ecosystems – a
global problem. Environ. Sci. Pollut. Res. 10: 126-139.
SMITH, R. V., S. D. LENNOX, C. JORDAN, R. H. FOY, AND E. MCHALE. 1995. Increase in
soluble phosphorus transported in drainflow from a grassland catchment in response to
soil phosphorus accumulation. Soil Use Manag. 11: 204-209.
STATISTICS CANADA. 1871-2006. Census data. Minister of Supply and Services.
Government of Canada, Ottawa.
TER BRAAK, C. J. F. 1986. Canonical correspondence analysis: A new eigenvector
technique for multivariate direct gradient analysis. Ecology 67: 1167-1179.
TER BRAAK, C. J. F. 1988. Partial correspondence analysis. p. 551-558, in H. H. Brock
[ed.], Classification and related methods of data analysis. North Holland.
TER BRAAK, C. J. F. 1990. CANOCO: A FORTRAN program for canonical community
ordination. Microcomputer Power.
THORLEIFSON, H., E. NIELSON [EDS.]. 1996. Lake Winnipeg Project: Cruise report and
scientific results. Geological Survey of Canada – Open File Report 3470.
TRIPLETT, L. D., D. R. ENGSTROM, AND M. B. EDLUND. 2009. A whole-basin stratigraphic
record of sediment and phosphorus loading to the St. Croix River, USA. J. Paleolimnol.
41: 659-677.
UPPER ASSINIBOINE RIVER BASIN STUDY COMMITTEE (UARBSC). 2000. Upper
Assiniboine River basin study: Main report. Environment Canada, Manitoba
Conservation, and SaskWater Corporation. 125 pp.

49
VANDER ZANDEN, M. J., Y. VADEBONCOEUR, M. W. DIEBEL, AND E. JEPPESEN. 2005.
Primary consumer stable isotopes as indicators of nutrient source. Environ. Sci. Technol.
39: 7509-75115.
VENEMA H. 2006. The Canadian Prairies: Biophysical and socio-economic context. P.
79–96, In: Designing policies in a world of uncertainty, change and surprise. International
Institute for Sustainable Development and the Energy and Resources Institute, Winnipeg
and New Delhi, http://www.iisd.org/publications/pub.aspx?pno=840.
VITOUSEK, P. M., AND OTHERS. 1997. Human alteration of the global nitrogen cycle:
Sources and consequences. Ecol. Applic. 7: 737-750.
VOGT, R. J., J. A. RUSAK, A. PATOINE, AND P. R. LEAVITT. 2011. Differential effects of
energy and mass influx on the landscape synchrony of lake ecosystems. Ecology 92:
DOI10.1890/10-1846.1.
WILKINSON, P., AND S. L. SIMPSON. 2003. Radiochemical analysis of Lake Winnipeg 99-
900 cores 4 and 6. p. 91-119, in S. L. Simpson, L. H. Thorleifson, C. F. Michael Lewis,
and J. W. King [eds.], 1999 Lake Winnipeg project: Cruise report and scientific results.
Geological Survey of Canada Open File 4196.
WILLIAMS, J. D., T. MAYER AND J. O. NRIAGU. 1980. Extractability of phosphate minerals
common in soils and sediments. Soil Sci. Soc. Am. J. 44: 462-265.
XU, H., H. W. PAERL , B. Q. QIN, G. W. ZHU, AND G. GAO. 2010. Nitrogen and
phosphorus inputs control phytoplankton growth in eutrophic Lake Taihu, China. Limnol.
Oceanogr. 55: 420-432.
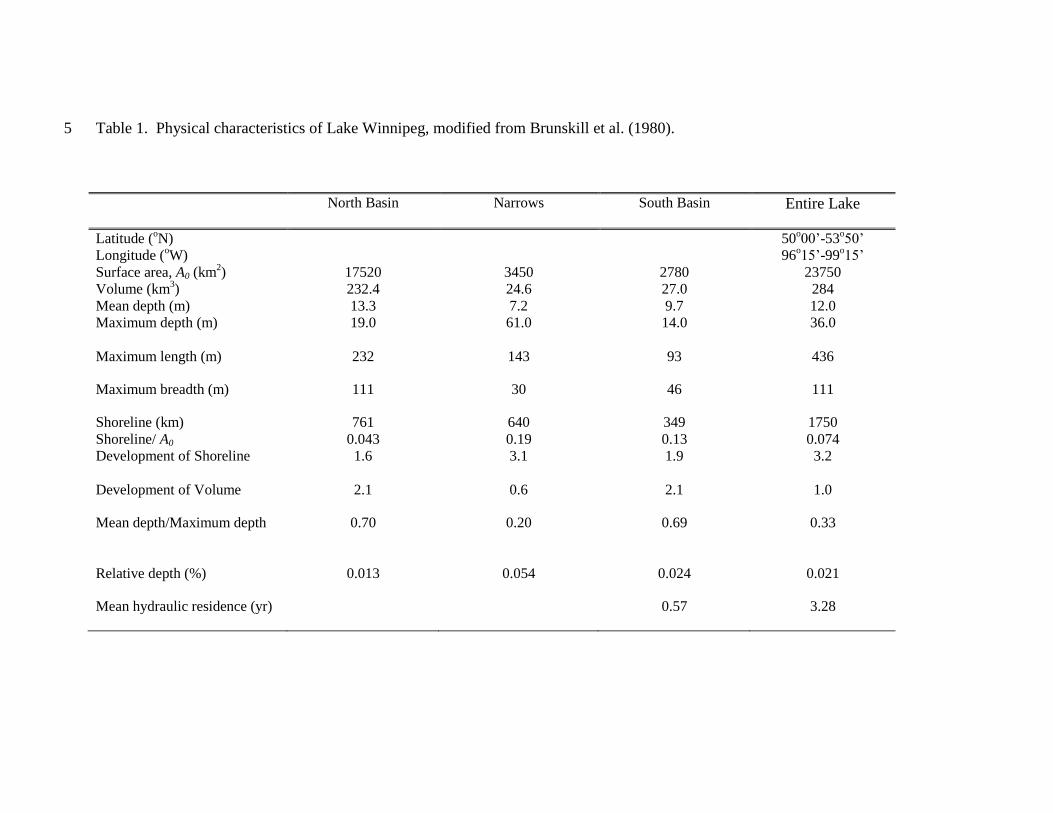
Table 1. Physical characteristics of Lake Winnipeg, modified from Brunskill et al. (1980). 5
North Basin Narrows South Basin Entire Lake
Latitude (oN) 50
o00’-53
o50’
Longitude (oW) 96
o15’-99
o15’
Surface area, A0 (km2) 17520 3450 2780 23750
Volume (km3) 232.4 24.6 27.0 284
Mean depth (m) 13.3 7.2 9.7 12.0
Maximum depth (m) 19.0 61.0 14.0 36.0
Maximum length (m) 232 143 93 436
Maximum breadth (m) 111 30 46 111
Shoreline (km) 761 640 349 1750
Shoreline/ A0 0.043 0.19 0.13 0.074
Development of Shoreline 1.6 3.1 1.9 3.2
Development of Volume 2.1 0.6 2.1 1.0
Mean depth/Maximum depth 0.70 0.20 0.69 0.33
Relative depth (%) 0.013 0.054 0.024 0.021
Mean hydraulic residence (yr) 0.57 3.28
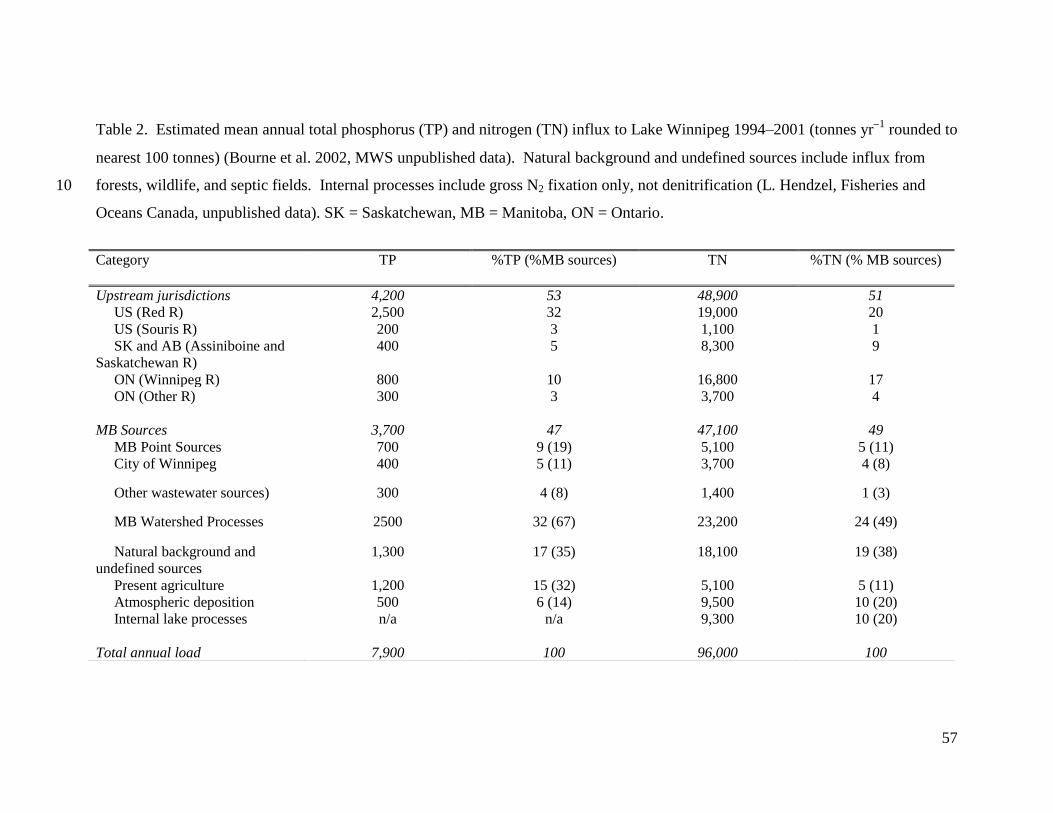
57
Table 2. Estimated mean annual total phosphorus (TP) and nitrogen (TN) influx to Lake Winnipeg 1994–2001 (tonnes yr1
rounded to
nearest 100 tonnes) (Bourne et al. 2002, MWS unpublished data). Natural background and undefined sources include influx from
forests, wildlife, and septic fields. Internal processes include gross N2 fixation only, not denitrification (L. Hendzel, Fisheries and 10
Oceans Canada, unpublished data). SK = Saskatchewan, MB = Manitoba, ON = Ontario.
Category TP %TP (%MB sources) TN %TN (% MB sources)
Upstream jurisdictions 4,200 53 48,900 51
US (Red R) 2,500 32 19,000 20
US (Souris R) 200 3 1,100 1
SK and AB (Assiniboine and
Saskatchewan R)
400 5 8,300 9
ON (Winnipeg R) 800 10 16,800 17
ON (Other R)
300 3 3,700 4
MB Sources 3,700 47 47,100 49
MB Point Sources 700 9 (19) 5,100 5 (11)
City of Winnipeg 400 5 (11) 3,700 4 (8)
Other wastewater sources) 300 4 (8) 1,400 1 (3)
MB Watershed Processes 2500 32 (67) 23,200 24 (49)
Natural background and
undefined sources
1,300 17 (35) 18,100 19 (38)
Present agriculture 1,200 15 (32) 5,100 5 (11)
Atmospheric deposition 500 6 (14) 9,500 10 (20)
Internal lake processes n/a n/a 9,300 10 (20)
Total annual load 7,900 100 96,000 100

Figure Legends
Fig. 1. Catchment area (grey shading) of Lake Winnipeg, Manitoba, Canada. This lake
is the largest water body in Manitoba (MB), and receives drainage mainly from
Canadian provinces of Alberta (AB), Saskatchewan (SK), and Ontario (ON), and
US states of Minnesota (MN) and North Dakota (ND). Urban centers with
>200,000 inhabitants indicated with white open circles, and include the City of
Winnipeg (pop. 750,000) in MB. Lake location within North America in upper
left inset, location of three cores within south basin of Lake Winnipeg in upper
right inset. See Site Description for land use, soil, and hydrological details.
Fig. 2. Specific activities (Bq g-1
dry mass) of (a) 210
Pb and (b) 137
Cs in three cores from
southern Lake Winnipeg as a function of burial depth. (c) Relationship between
sediment age estimates from constant rate of supply calculation and 210
Pb
activities for Cores 1 (closed circle, solid line), 2 (open circle, dashed line), and 3
(open square, fine line). Core locations are separated by 35 km (Fig. 1 inset).
Fig. 3. Time series of whole-sediment (a) nitrogen (N) isotopes (15N, ‰), (b) N content
(% dry mass), (c) carbon (C) isotopes (13C, ‰), and (d) C content (% dry mass)
during 1800-2010 for three sediment cores from southern Lake Winnipeg.
Symbols and lines as in Fig. 2.

59
Fig. 4. Time series of whole-sediment phosphorus (P) concentrations (mg P g-1
dry
mass), including (a) total P (TP), (b) apatite P extracted by HCl, (c) non-apatite
inorganic P extracted by NaOH, (d) exchangeable inorganic P extracted by
NH4Cl, and (e) residual or organic P during 1800-2010 for sediment cores (as Fig.
2) from southern Lake Winnipeg.
Fig. 5. Time series of fossil pigment concentrations (a-e) (nmol pigment g-1
sediment C)
and (f) cyanobacterial akinetes (microfossils g-1
dry mass) during 1800-2010 for
three cores from southern Lake Winnipeg. Core identities as Fig. 2. Pigment
include (a) diatoxanthin mainly from diatoms, (b) alloxanthin from cryptophytes,
(c) pheophytin b from chlorophytes, (d) canthaxanthin from Nostocales
cyanobacteria, and (e) ubiquitous β-carotene from all algae. (f) Fossil akinetes
were quantified only in Core 1 and were derived from species of Anabaena (black
histograms, 105 scale) and Aphanizomenon (grey histograms, 10
4 scale).
Fig. 6. Time series of concentrations of valves from fossil diatom species in Core 1
during 1800-2010. All fossil concentrations are valves x 105 g
-1 dry mass, except
Aulacoseira islandica and total diatom abundance (valves 106 g
-1 dry mass).
Uppermost two panels include results of cluster analysis of diatom species and
estimates of total water column phosphorus concentration (μg TP L-1
) estimated
for the south basin from weighted average regression analysis of relative (%)
diatom species composition.

60
Fig. 7. Percent variation in fossil pigment concentrations (as in Fig. 5), C and N isotopes
(‰), and C and N content (%) in sediments of Core 1 during 1901-1992
explained by redundancy (RDA) analysis of (a) climate variables alone (white
histogram), (b) livestock variables alone (grey histogram), or (c) agriculture
(crop) production variables alone (black histogram), or by (d) variance
partitioning analysis of climate (C, white), crop production (A, black), and
livestock production (L, grey), their first-order (A × L, C × L, A × C), and second
order (A × L ×C) interactions. Note both C × L and A × C interactions explained
<0.3% of historical variation in lake production parameters.
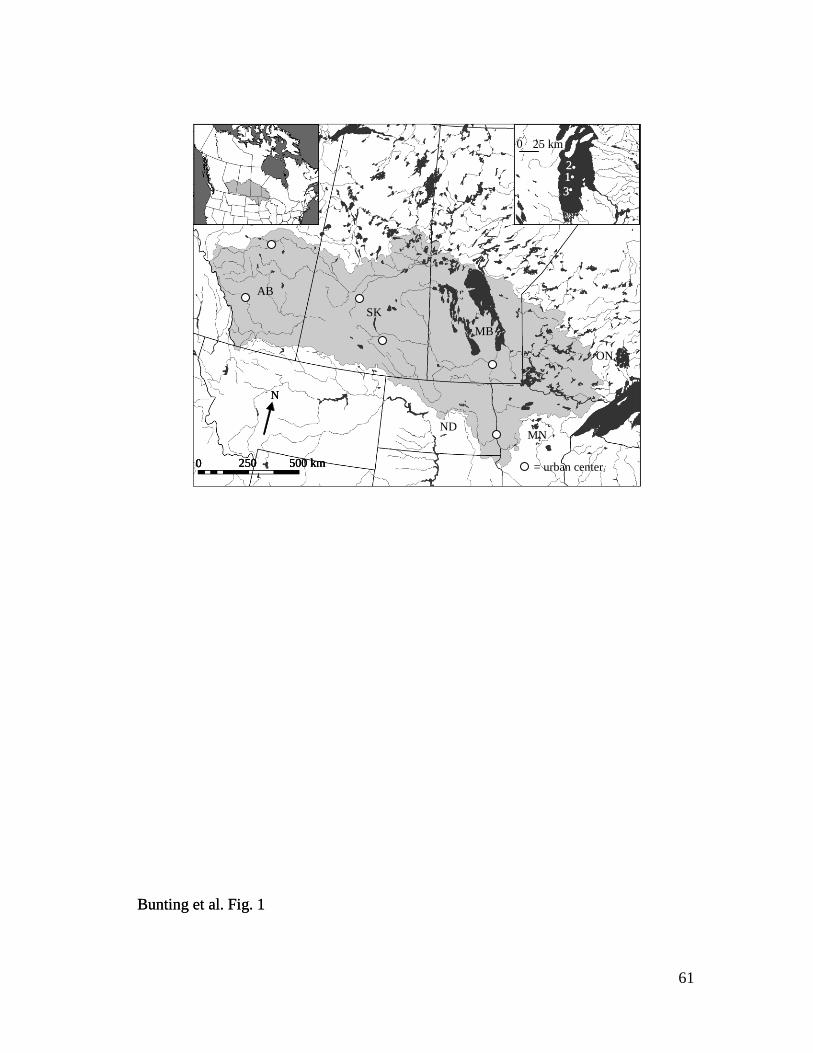
61
Bunting et al. Fig. 1
500 km0 250
N
12
3
AB
SK
MB
ON
NDMN
= urban center
0 25 km
Bunting et al. Fig. 1
500 km0 250
N
12
3
AB
SK
MB
ON
NDMN
= urban center
0 25 km
500 km0 250
N
500 km0 250 500 km0 250
N
12
3
12
3
AB
SK
MB
ON
NDMN
= urban center
0 25 km

62
b) 137Cs activity
0.03
0.06
0.09
0.12
137C
s ac
tiv
ity
(B
q g
1
dry
mas
s)
0 10 20 30 40 50
0.00
a) Excess 210Pb activity
0.00
0.05
0.10
0.15
0.20
0.25
21
0P
be
xac
tivit
y (
Bq
g
1dry
mas
s)
Core 1Core 2Core 3
0 10 20 30 40 50
Depth (cm)
0
1810
1860
1910
1960
2010
Yea
r (C
E)
10 20 30 40 50
c)
Bunting et al. Fig. 2

63 Bunting et al. Fig. 3
Core 1
Core 2Core 3
3
5
7
9a) Sediment 15N
1800 1850 1900 1950 2000
N is
oto
pes
(‰
)b) Sediment N content
0.0
0.1
0.2
0.3
0.4
1800 1850 1950 20001900
N c
on
tent
(% d
ry m
ass)
-29
-28
-27
-26
-25
-24
1900
c) Sediment 13C
1800 1850 1950 2000
C is
oto
pes
(‰
)
0
1
2
3d) Sediment C content
1800 1850 1900 1950 2000
Year
C c
onte
nt
(%
dry
mas
s)

64
Bunting et al. Fig. 4
Ph
osp
ho
rus
con
cen
trat
ion
(m
g p
ho
sph
oru
s g1
dry
mas
s se
dim
ent)
a) Total Phosphorus
1800 1850 1900 1950 20000.0
0.2
0.4
0.6
0.8
1.0
Core 1
Core 3
Core 2
0.0
0.1
0.2
0.3
0.4
1800 1850 1900 1950 2000
c) NaOH-extracted P (non-apatite)
b) HCl-extracted P (apatite)
0.1
0.2
0.3
0.4
1800 1850 1900 1950 2000
d) NH4Cl-extracted P (exchangeable)
1800 1850 1900 1950 20000.0
0.1
0.2
0.3
0.4
e) Residual P (organic)
Year1800 1850 1900 1950 2000
0.0
0.1
0.2
0.3
0.4

65
Bunting et al. Fig. 5
a) Diatoms (Diatoxanthin)
0
40
80
120
1800 1850 1900 1950 2000
Core 1Core 2Core 3
b) Cryptophytes (Alloxanthin)
0
20
40
60
80
100
1800 1850 1900 1950 2000
0
100
200
300
400c) Chlorophytes (Pheophytin b)
1800 1850 1900 1950 2000
20
40
60d) Nostocales Cyanob. (Canthaxanthin)
01800 1850 1900 1950 2000
40
0
10
20
30
1800 1850 1900 1950 2000
e) Total Algae (β-carotene)
Year
Pig
men
t co
nce
ntr
atio
n (
nan
om
ole
sp
igm
ent
g
1to
tal
carb
on
)
Year
0
0.5
1.0
1.5
2.0
2.5
1800 1850 1900 1950 2000
Anabaena spp. (x 105)
Aphanizomenon spp. (x 104)
(micro
fossils g
1
dry
mass sed
imen
t
f) Cyanobacterial akinetes (Core 1)
a) Diatoms (Diatoxanthin)
0
40
80
120
1800 1850 1900 1950 2000
Core 1Core 2Core 3
a) Diatoms (Diatoxanthin)
0
40
80
120
1800 1850 1900 1950 2000
Core 1Core 2Core 3
b) Cryptophytes (Alloxanthin)
0
20
40
60
80
100
1800 1850 1900 1950 2000
b) Cryptophytes (Alloxanthin)
0
20
40
60
80
100
1800 1850 1900 1950 2000
0
100
200
300
400c) Chlorophytes (Pheophytin b)
1800 1850 1900 1950 20000
100
200
300
400
0
100
200
300
400c) Chlorophytes (Pheophytin b)
1800 1850 1900 1950 2000
20
40
60d) Nostocales Cyanob. (Canthaxanthin)
01800 1850 1900 1950 2000
20
40
60d) Nostocales Cyanob. (Canthaxanthin)
01800 1850 1900 1950 200001800 1850 1900 1950 2000
40
0
10
20
30
1800 1850 1900 1950 2000
e) Total Algae (β-carotene)
Year
40
0
10
20
30
1800 1850 1900 1950 2000
e) Total Algae (β-carotene)40
0
10
20
30
1800 1850 1900 1950 2000
40
0
10
20
30
1800 1850 1900 1950 2000
e) Total Algae (β-carotene)
Year
Pig
men
t co
nce
ntr
atio
n (
nan
om
ole
sp
igm
ent
g
1to
tal
carb
on
)
Year
0
0.5
1.0
1.5
2.0
2.5
1800 1850 1900 1950 2000
Anabaena spp. (x 105)
Aphanizomenon spp. (x 104)
(micro
fossils g
1
dry
mass sed
imen
t
f) Cyanobacterial akinetes (Core 1)
Year
0
0.5
1.0
1.5
2.0
2.5
1800 1850 1900 1950 2000
Year
0
0.5
1.0
1.5
2.0
2.5
0
0.5
1.0
1.5
2.0
2.5
1800 1850 1900 1950 2000
Anabaena spp. (x 105)
Aphanizomenon spp. (x 104)
(micro
fossils g
1
dry
mass sed
imen
t
f) Cyanobacterial akinetes (Core 1)
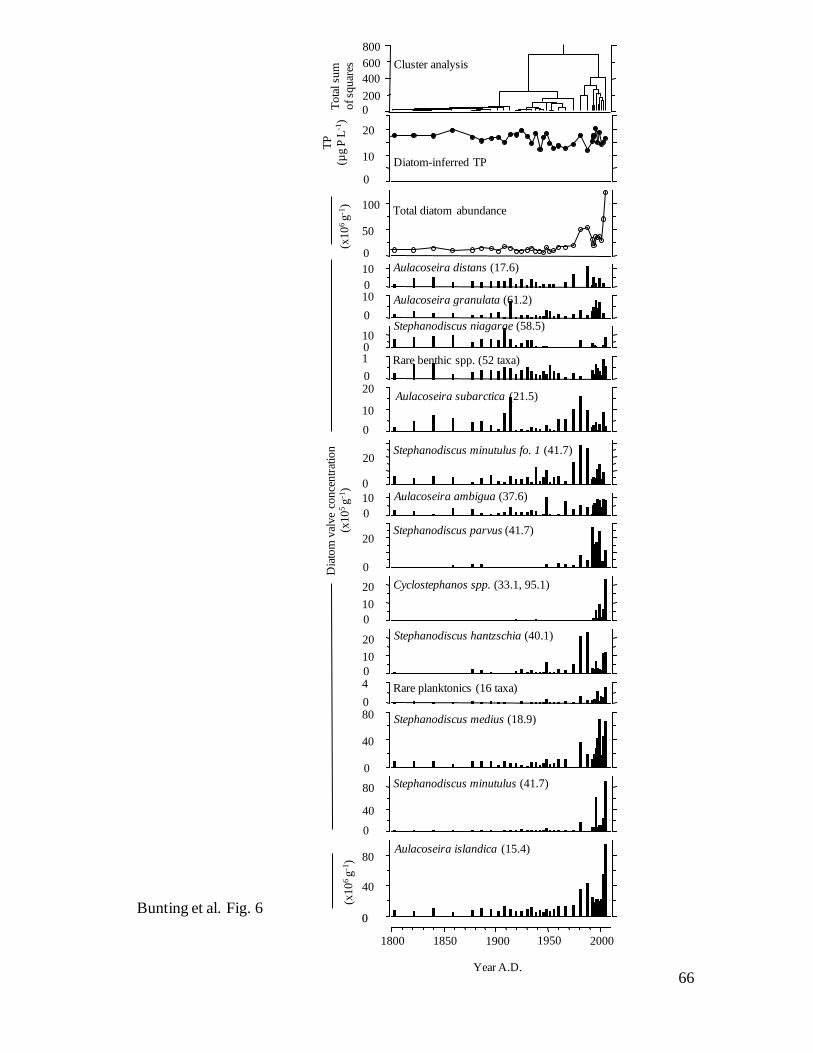
66
Bunting et al. Fig. 6
Aulacoseira islandica (15.4)
Stephanodiscus minutulus (41.7)
Stephanodiscus medius (18.9)
Rare planktonics (16 taxa)
Stephanodiscus hantzschia (40.1)
Cyclostephanos spp. (33.1, 95.1)
Stephanodiscus parvus (41.7)
Aulacoseira ambigua (37.6)
Stephanodiscus minutulus fo. 1 (41.7)
Aulacoseira subarctica (21.5)
Rare benthic spp. (52 taxa)
Stephanodiscus niagarae (58.5)
Aulacoseira granulata (61.2)
Aulacoseira distans (17.6)
Total diatom abundance
Diatom-inferred TP
1800 1850 1900 1950 2000
0
40
80
40
80
40
80
4
10
20
10
20
20
10
20
10
20
1
10
10
10
50
100
10
20
TP
(µg P
L-1
)(x
10
6g
-1)
Dia
tom
val
ve
conce
ntr
atio
n
(x10
5g
-1)
(x1
06
g-1
)
Year A.D.
200
400
600
800
To
tal su
m
of sq
uar
es Cluster analysis
0
0
0
0
0
0
0
0
0
0
0
0
0
0
0
0

67
Bunting et al. Fig. 7
Climate
RDA
Livestock
RDA
Agriculture
RDAVPA
Per
cen
t var
ian
ce e
xp
lain
ed
0
10
20
30
40
50
60
70
80
90
100
C
A
L
A x L
C x A x L
*
Bunting et al. Fig. 7
Climate
RDA
Livestock
RDA
Agriculture
RDAVPA
Per
cen
t var
ian
ce e
xp
lain
ed
0
10
20
30
40
50
60
70
80
90
100
C
A
L
A x L
C x A x L
*
Climate
RDA
Livestock
RDA
Agriculture
RDAVPA
Per
cen
t var
ian
ce e
xp
lain
ed
0
10
20
30
40
50
60
70
80
90
100
0
10
20
30
40
50
60
70
80
90
100
C
A
L
A x L
C x A x L
*
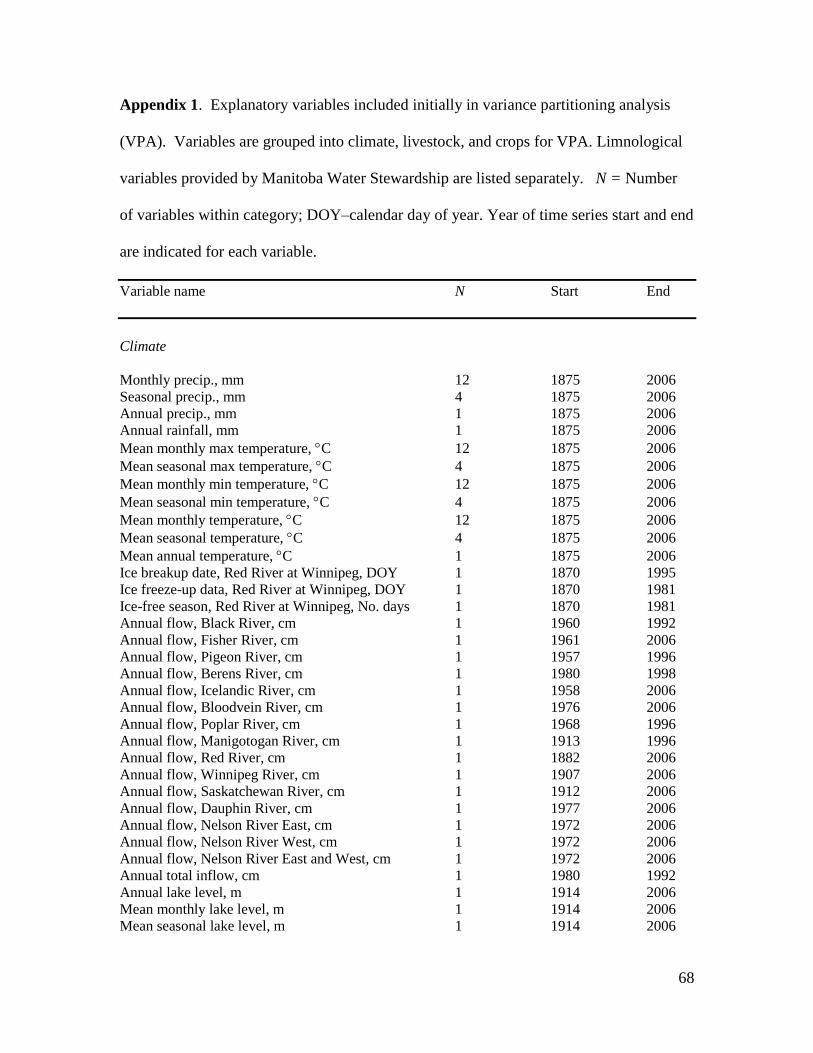
68
Appendix 1. Explanatory variables included initially in variance partitioning analysis
(VPA). Variables are grouped into climate, livestock, and crops for VPA. Limnological
variables provided by Manitoba Water Stewardship are listed separately. N = Number
of variables within category; DOY–calendar day of year. Year of time series start and end
are indicated for each variable.
Variable name N Start End
Climate
Monthly precip., mm 12 1875 2006
Seasonal precip., mm 4 1875 2006
Annual precip., mm 1 1875 2006
Annual rainfall, mm 1 1875 2006
Mean monthly max temperature, C 12 1875 2006
Mean seasonal max temperature, C 4 1875 2006
Mean monthly min temperature, C 12 1875 2006
Mean seasonal min temperature, C 4 1875 2006
Mean monthly temperature, C 12 1875 2006
Mean seasonal temperature, C 4 1875 2006
Mean annual temperature, C 1 1875 2006
Ice breakup date, Red River at Winnipeg, DOY 1 1870 1995
Ice freeze-up data, Red River at Winnipeg, DOY 1 1870 1981
Ice-free season, Red River at Winnipeg, No. days 1 1870 1981
Annual flow, Black River, cm 1 1960 1992
Annual flow, Fisher River, cm 1 1961 2006
Annual flow, Pigeon River, cm 1 1957 1996
Annual flow, Berens River, cm 1 1980 1998
Annual flow, Icelandic River, cm 1 1958 2006
Annual flow, Bloodvein River, cm 1 1976 2006
Annual flow, Poplar River, cm 1 1968 1996
Annual flow, Manigotogan River, cm 1 1913 1996
Annual flow, Red River, cm 1 1882 2006
Annual flow, Winnipeg River, cm 1 1907 2006
Annual flow, Saskatchewan River, cm 1 1912 2006
Annual flow, Dauphin River, cm 1 1977 2006
Annual flow, Nelson River East, cm 1 1972 2006
Annual flow, Nelson River West, cm 1 1972 2006
Annual flow, Nelson River East and West, cm 1 1972 2006
Annual total inflow, cm 1 1980 1992
Annual lake level, m 1 1914 2006
Mean monthly lake level, m 1 1914 2006
Mean seasonal lake level, m 1 1914 2006
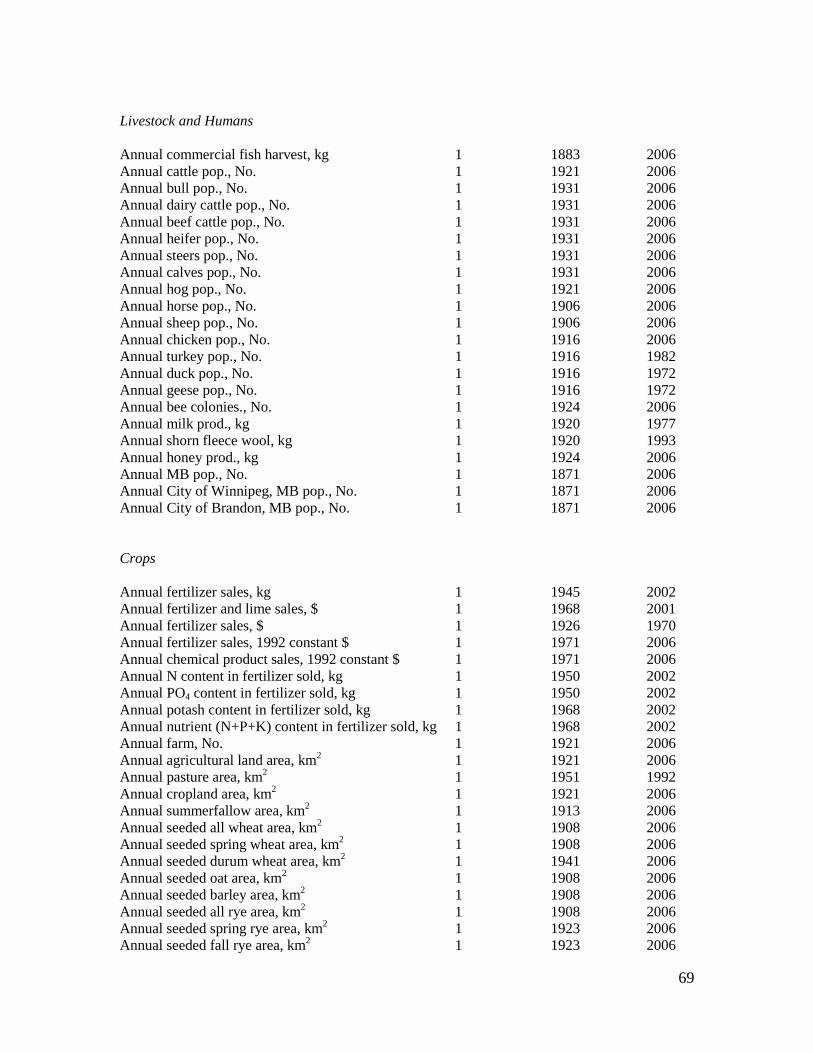
69
Livestock and Humans
Annual commercial fish harvest, kg 1 1883 2006
Annual cattle pop., No. 1 1921 2006
Annual bull pop., No. 1 1931 2006
Annual dairy cattle pop., No. 1 1931 2006
Annual beef cattle pop., No. 1 1931 2006
Annual heifer pop., No. 1 1931 2006
Annual steers pop., No. 1 1931 2006
Annual calves pop., No. 1 1931 2006
Annual hog pop., No. 1 1921 2006
Annual horse pop., No. 1 1906 2006
Annual sheep pop., No. 1 1906 2006
Annual chicken pop., No. 1 1916 2006
Annual turkey pop., No. 1 1916 1982
Annual duck pop., No. 1 1916 1972
Annual geese pop., No. 1 1916 1972
Annual bee colonies., No. 1 1924 2006
Annual milk prod., kg 1 1920 1977
Annual shorn fleece wool, kg 1 1920 1993
Annual honey prod., kg 1 1924 2006
Annual MB pop., No. 1 1871 2006
Annual City of Winnipeg, MB pop., No. 1 1871 2006
Annual City of Brandon, MB pop., No. 1 1871 2006
Crops
Annual fertilizer sales, kg 1 1945 2002
Annual fertilizer and lime sales, $ 1 1968 2001
Annual fertilizer sales, $ 1 1926 1970
Annual fertilizer sales, 1992 constant $ 1 1971 2006
Annual chemical product sales, 1992 constant $ 1 1971 2006
Annual N content in fertilizer sold, kg 1 1950 2002
Annual PO4 content in fertilizer sold, kg 1 1950 2002
Annual potash content in fertilizer sold, kg 1 1968 2002
Annual nutrient (N+P+K) content in fertilizer sold, kg 1 1968 2002
Annual farm, No. 1 1921 2006
Annual agricultural land area, km2 1 1921 2006
Annual pasture area, km2 1 1951 1992
Annual cropland area, km2 1 1921 2006
Annual summerfallow area, km2 1 1913 2006
Annual seeded all wheat area, km2 1 1908 2006
Annual seeded spring wheat area, km2 1 1908 2006
Annual seeded durum wheat area, km2 1 1941 2006
Annual seeded oat area, km2 1 1908 2006
Annual seeded barley area, km2 1 1908 2006
Annual seeded all rye area, km2 1 1908 2006
Annual seeded spring rye area, km2 1 1923 2006
Annual seeded fall rye area, km2 1 1923 2006
70
Annual seeded mixed grain area, km2 1 1910 2006
Annual seeded corn for grain area, km2 1 1941 2006
Annual seeded buckwheat area, km2 1 1925 2006
Annual seeded dry field pea area, km2 1 1908 2006
Annual seeded flaxseed area, km2 1 1908 2006
Annual seeded mustard seed area, km2 1 1952 2004
Annual seeded sunflower area, km2 1 1943 2006
Annual seeded canola area, km2 1 1943 2006
Annual seeded tame hay area, km2 1 1908 2006
Annual seeded sugarbeet area, km2 1 1940 1998
Annual seeded fodder corn area, km2 1 1910 2006
Annual seeded potato area, km2 1 1908 2006
Annual seeded field root area, km2 1 1908 1940
Annual planted tomato area, km2 1 1940 2006
Annual planted cucumber area, km2 1 1940 2006
Annual planted lettuce area, km2 1 1940 2001
Annual planted dry onion area, km2 1 1940 2006
Annual planted asparagus area, km2 1 1940 2006
Annual planted celery area, km2 1 1940 1996
Annual planted beans area, km2 1 1940 2006
Annual planted fresh corn area, km2 1 1940 2006
Annual planted cabbage area, km2 1 1940 2006
Annual planted cauliflower area, km2 1 1940 2006
Annual planted carrot area, km2 1 1940 2006
Annual planted parsnip area, km2 1 1940 1996
Annual planted beet area, km2 1 1940 2006
Annual planted rutabaga and turnip area, km2 1 1940 2006
Spring wheat seeding is general (DOY) 1 1952 1991
Spring wheat heading is general (DOY) 1 1952 1990
Spring wheat swathing is started (DOY) 1 1952 1990
Spring wheat swathing is general (DOY) 1 1952 1989
Spring wheat swathing is completed (DOY) 1 1952 1990
Spring wheat combining is started (DOY) 1 1952 1990
Spring wheat combining is general (DOY) 1 1952 1989
Spring wheat combining is completed (DOY) 1 1952 1990
Annual tame hay prod., kg 1 1908 2006
Annual all wheat prod., kg 1 1908 2006
Annual spring wheat prod., kg 1 1908 2006
Annual durum wheat prod., kg 1 1941 2006
Annual buckwheat prod., kg 1 1925 2006
Annual oat prod., kg 1 1908 2006
Annual all rye prod., kg 1 1908 2006
Annual spring rye prod., kg 1 1923 2006
Annual fall rye prod., kg 1 1923 2006
Annual barley prod., kg 1 1908 2006
Annual mixed grain prod., kg 1 1910 2006
Annual canola prod., kg 1 1943 2006
Annual flaxseed prod., kg 1 1908 2006
Annual mustard seed prod., kg 1 1952 2004
Annual sunflower seed prod., kg 1 1943 2006
Annual potato prod., kg 1 1908 2006
71
Annual carrot prod., kg 1 1940 2006
Annual parsnip prod., kg 1 1940 1996
Annual cauliflower prod., kg 1 1940 1996
Annual cabbage prod., kg 1 1940 2006
Annual beet prod., kg 1 1940 2000
Annual sugarbeet prod., kg 1 1940 1996
Annual rutabaga and turnip prod., kg 1 1940 1995
Annual field root prod., kg 1 1908 1940
Annual asparagus prod., kg 1 1940 2002
Annual cucumber prod., kg 1 1940 2006
Annual lettuce prod., kg 1 1940 2001
Annual tomato prod., kg 1 1940 2006
Annual celery prod., kg 1 1940 1996
Annual dry onion prod., kg 1 1940 2006
Annual corn for grain prod., kg 1 1941 2006
Annual fodder corn prod., kg 1 1910 2006
Annual dry field pea prod., kg 1 1908 2006
Annual fresh corn prod., kg 1 1940 2006
Annual soy bean prod., kg 1 1956 2006
Limnology
Annual Red River mean TN, mg L1
1 1974 2006
Annual Red River mean TP, mg L1
1 1970 2006
Annual Winnipeg River mean TN, mg L1
1 1978 2006
Annual Winnipeg River mean TP, mg L1
1 1978 2006
Annual Saskatchewan River mean TN, mg L1
1 1970 2006
Annual Saskatchewan River mean TP, mg L1
1 1970 2006
Annual Dauphin River mean TN, mg L1
1 1978 2006
Annual Dauphin River mean TP, mg L1
1 1978 2006
Annual Nelson River East mean TN, mg L1
1 1972 2006
Annual Nelson River East mean TP, mg L1
1 1972 2006
Annual South Basin L. Winnipeg mean TN, mg L1
1 1992 2005
Annual South Basin L. Winnipeg mean TP, mg L1
1 1992 2005
Annual Narrows Lake Winnipeg mean TN, mg L1
1 1992 2005
Annual Narrows Lake Winnipeg mean TP, mg L1
1 1992 2005
Annual North Basin Lake Winnipeg mean TN, mg L1
1 1992 2005
Annual North Basin Lake Winnipeg mean TP, mg L1
1 1992 2005
Annual South Basin mean Chl a, mg L1
1 1992 2005
Annual Narrows mean Chl a, mg L1
1 1992 2005
Annual North Basin mean Chl a, mg L1
1 1992 2005
Annual Red River P loading, kg yr1
1 1970 2006
Annual Winnipeg River P loading, kg yr1
1 1970 2006
Annual Saskatchewan River P loading, kg yr1
1 1970 2006
Annual Dauphin River P loading, kg yr1
1 1977 2006
Annual East Side Lake Winnipeg P loading, kg yr1
1 1970 2006
Annual West Side Lake Winnipeg P loading, kg yr1
1 1970 2006
Annual Atmospheric Deposition P loading, kg yr1
1 1970 2006
72
Annual City of Winnipeg P loading, kg yr1
1 1970 2006
Annual Total P loading, kg yr1
1 1970 2006
Annual Outflow P (from Nelson River), kg yr1
1 1972 2006
Annual P load retained, kg yr1
1 1972 2006
Annual % P retention 1 1972 2006
Annual Red River N loading, kg yr1
1 1970 2006
Annual Winnipeg River N loading, kg yr1
1 1970 2006
Annual Saskatchewan River N loading, kg yr1
1 1970 2006
Annual Dauphin River N loading, kg yr1
1 1977 2006
Annual East Side Lake Winnipeg N loading, kg yr1
1 1970 2006
Annual West Side Lake Winnipeg N loading, kg yr1
1 1970 2006
Annual Atmospheric Deposition N loading, kg yr1
1 1970 2006
Annual N Fixation loading, kg yr1
1 1970 2006
Annual City of Winnipeg, N loading, kg yr1
1 1970 2006
Annual total N loading, kg yr1
1 1970 2006
Annual Outflow N (from Nelson River), kg yr1
1 1972 2006
Annual N load retained, kg yr1
1 1972 2006
Annual % N retention 1 1972 2006
Sudden ecosystem state change in Lake Winnipeg, Canada, caused by eutrophication
arising from crop and livestock production during the 20th
century
Bunting, L.,a P.R. Leavitt,
a,*, , B. Wissel,
b K.R. Laird,
c B.F. Cumming,
c A. St. Amand,
d
and D.R. Engstrome
aLimnology Laboratory, Department of Biology, University of Regina, Regina,
Saskatchewan, Canada
bEnvironmental Quality Analysis Laboratory, University of Regina, Regina,
Saskatchewan, Canada
cPaleoecological Environmental Assessment and Research Laboratory, Department of
Biology, Queen’s University, Kingston, Ontario, Canada
dPhycoTech Inc., Saint Joseph, Michigan, USA
eSt. Croix Watershed Research Station, Science Museum of Minnesota, St. Croix,
Minnesota, USA.
*Corresponding Author: [email protected]

2
Acknowledgements
We thank Jill Coleman for sedimentary phosphorus determinations, Zoraida
Quiñones-Riveria for pigment analyses, Derek Donald and Martin Callaghan for core
collection, and Manitoba Water Stewardship for maps and limnological data. We thank
Alex Salki and the Lake Winnipeg Research Consortium for facilitating shiptime on the
MV Namao, as well as sponsors for funding. This project was supported by Manitoba
Water Stewardship, Natural Science and Engineering Research Council of Canada
(NSERC), the Canada Research Chair program, Canada Foundation for Innovation, the
Province of Saskatchewan, and the University of Regina. This manuscript was improved
by reviews from D.E. Schindler, R. Vogt, D.W. Schindler, K. Finlay, D. Williamson, N.
Armstrong, and B. Parker.
3
Abstract
Lake Winnipeg, Canada, has experienced severe blooms of N2-fixing
cyanobacteria since 1990; however, little is known of background limnological
conditions, causes of eutrophication, or whether modern conditions represent a stable
ecosystem state change. To address these issues, sedimentary records of nitrogen (N)
inputs (as 15N, %N), phosphorus (P) influxes (total P, chemical fractions), lake
production (13C, %C), and algal abundance and community composition (pigments,
algal microfossils) were analyzed in three cores from the lake’s south basin. Under
baseline conditions (ca. 1800-1900), the basin was mesotrophic (~15-20 μg P L-1
) with
diazotrophic cyanobacteria (Aphanizomenon, Anabaena), mesotrophic and eutrophic
diatoms (Aulacoseira islandica, Stephanodiscus niagarae), and sedimentary P fractions
characteristic of hardwater prairie lakes. Eutrophication accelerated during a second
phase (1900-1990), when N, P and C contents increased 10-50%, 15N enriched 3-4‰,
and concentrations of most algal pigments increased 300-500%. Nearly 75% of this 20th
century variability was explained by concomitant increases in production of livestock
(mainly cattle and hogs) and crops (wheat, potatoes, canola), but not by variation in
climate. A third phase (1990-present) was marked by 50% declines in pigments from
chlorophtyes and cyanobacteria, a 10-fold increase in concentrations of akinetes from
Aphanizomenon and Anabaena spp., and occurred because of a century of fertilization,
rapid changes in economic policies, and agricultural diversification. We conclude that P
influx must decline by ~50% to suppress N2-fixing cyanobacteria (500% to re-establish
baseline conditions) and that failure to regulate P influx may initiate a fourth phase in
which pollution with N promotes potentially toxic cyanobacteria.

4
Introduction
Eutrophication remains the most significant environmental problem which
threatens the integrity of aquatic resources throughout the world despite 50 years of
research to identify the factors that degrade water quality (Carpenter et al. 1998;
Schindler 2006). In cases where eutrophication has been caused by nutrient influx from
discrete sources (e.g., municipal waste water, factory farms) (Schindler 1977), significant
improvements in water quality have been achieved following diversion of point-source
nutrients (Jeppesen et al. 2005). In contrast, eutrophication by nonpoint nutrient sources
(e.g., agriculture, atmospheric deposition) has been more difficult to quantify and
regulate, because diffuse fluxes are often intermittent (Bennett et al. 2001), derived from
large-scale land-use practices (Carpenter et al. 1998), or are regulated by opposing
management strategies for food production and environmental quality (Bunting et al.
2007). Unfortunately, such diffuse nutrient inputs are now the primary cause of aquatic
pollution in many regions of the world (Smith 2003; Schindler 2006).
Water quality degradation arises from diffuse nutrient sources for several main
reasons. First, agricultural inputs of phosphorus (P) and nitrogen (N) in commercial
fertilizer and animal feed supplements often exceed agricultural outputs (Foy et al. 2002;
Bunting et al. 2007). Second, excessive livestock densities can lead to manure
production that overwhelms both storage capacities and regional requirements of crops.
Third, application of N in commercial fertilizer or manure can lead to ammonia (NH3)
volatilization and N deposition at remote locations (Vitousek et al. 1997). In many
instance, excess fertilization favours soil surpluses of P that are mobile and can leach into

5
downstream aquatic ecosystems (Smith et al. 1995; Bennett et al. 2001). Such surpluses
of soil P can last for millennia (Carpenter 2005), facilitate accumulation of soluble P
within downsteam lakes, and alter mechanisms regulating lake structure and function
(Leavitt et al. 2006; Bunting et al. 2007).
Ecological theory suggests that persistent fertilization of lakes may lead to
potentially-irreversible changes in the structure and function of lake ecosystems (Scheffer
et al. 2001; Scheffer and Carpenter 2003; Carpenter 2003). In particular, analysis of
small shallow lakes suggests that increased variation in water-column parameters (e.g., P
concentration) and regulatory mechanisms are reliable indicators of state change from
irradiance-sufficient mixed assemblages of benthic and planktonic primary producers to
communities in turbid waters composed predominantly of buoyant cyanobacteria
(Cottingham et al. 2000; Carpenter 2003; Carpenter and Brock 2006). Interestingly, the
shift between states may arise from either rapid persistent changes in external forcing
(Leavitt et al. 2009) or comparatively small variation in environmental conditions
(climate, food web) which are reinforced by internal feedback mechanisms within
alternate states (e.g., vertical stratification, internal nutrients, macrophytes, shading)
(Scheffer et al. 2001; Scheffer and Carpenter 2003). However, little is known of whether
these regime shift hypotheses are relevant to large lakes. Similarly, further research is
required to quantify the patterns and controls of ecosystem state change at decadal scales,
as recent studies suggest that surface blooms of N2-fixing cyanobacteria may not
represent the terminal state in the eutrophication sequence (Leavitt et al. 2006; Bunting et
al. 2007; Xu et al. 2010).

6
In this paper, we analyzed profundal sediments for diverse chemical and
biological parameters to test the hypothesis that Lake Winnipeg, Canada, has undergone
sudden ecosystem state change due to cumulative effects of a century of agriculture,
rather than climatic variability. Lake Winnipeg is presently eutrophic (south basin >100
μg TP L-1
); however, little is known of the baseline limnological conditions, the
magnitude, timing or causes of eutrophication, or whether outbreaks of diazotrophic
cyanobacteria (Aphanizomenon, Anabaena spp.) since 1990 represent an externally-
forced increase in production (Carpenter 2003; Leavitt et al. 2009) or a self-reinforcing
change between alternative stable states (Scheffer et al. 2001; Scheffer and Carpenter
2003). To address these issues, we created highly resolved time series of historical N
inputs (as 15N, N content), P influxes (as TP and P fractions), aquatic production (13
C,
C content), and algal abundance and community composition (pigments, microfossils
from cyanobacteria and diatoms) for statistical comparison with coeval records of
climatic variability, crop production, and livestock densities using variance partitioning
analyses (Borcard et al. 1992; Hall et al. 1999). We conclude that while the south basin
of Lake Winnipeg is naturally mesotrophic, a century of crop and livestock development
has increased lake production ~500%, allowed intensification of agricultural practices
after 1980 to initiate a state change, and poised the lake on the threshold of a further shift
to increased biomass and toxicity of cyanobacteria.
Methods
7
Site description – Lake Winnipeg is a large (23,750 km2), shallow (mean depth =
12 m), polymictic, multi-basin, eutrophic lake (>100 μg P L-1
) situated at 217.6 m above
sea level (a.s.l.) in the Province of Manitoba (MB), Canada (Fig. 1, Table 1). The
953,250 km2 lake catchment is located mainly within four Canadian provinces (MB,
Alberta [AB], Saskatchewan [SK], Ontario [ON]), with additional contributions from the
northern United States, primarily North Dakota (ND) and Minnesota (MN). More than
660,000 km2 (70%) of the catchment is used for agriculture, which in Canada is divided
evenly between areas for cultivation of crops (wheat, barley, oats, canola; also potatoes
and corn in MB) and that used for pasture, forage, or zero-tillage management in support
of the production of ~12 million beef cattle and ~15 million hogs per annum (LWIC
2006; MWS 2006). More than 80% of the 6.6 million inhabitants of the watershed are
located in urban areas (Statistics Canada and U.S. Bureau of Census data), although cities
with populations >200,000 are relatively uncommon (Fig. 1).
Climatic conditions vary with location in the catchment, with aridity generally
increasing from east to west and north to south (Pham et al. 2009). Within the central
watershed, the climate is characterized as sub-humid continental, with short warm
summers (mean 19°C in July), cold winters (mean -16°C in January), low mean annual
temperatures (~1oC), and an average of 105 frost-free days (Leavitt et al. 2006). In
addition, this region has experienced an ~3oC increase in mean temperature since the 19
th
century, mainly as pronounced increases in fall, winter, and spring minimum
temperatures. As a result, ice cover in southern MB has declined more than 35 days since
1860 (Hall et al. 1999).
8
Three major river systems flow into Lake Winnipeg, while the sole outflow, the
Nelson River, drains northeast into Hudson Bay (Fig. 1). The Red and Assiniboine rivers
join within City of Winnipeg and enter the lake from the south (~8% of total water
inflow), the Saskatchewan River enters the lake from the northwest (~22%), and the
Winnipeg River enters from the southeast (~40%) (Fig. 1). Well developed Chernozemic
soils predominate throughout the catchments of the Red-Assiniboine and Saskatchewan
river systems (Brunskill et al. 1980), while forest and peatland soil types (regosols,
brunisols, luvisols, gleysols, organic peat) predominate in the Winnipeg River watershed
(Smith et al. 1998).
Land use varies substantially among sub-basins. For example, the Red (~127,000
km2) and Assiniboine river catchments (~41,500 km
2) are composed largely of arable
land that supports cereal, feed and specialty crop production, range and pasture lands, and
intensive cattle and hog operations (UARBSC 2000). These sub-basins also include the
major urban centers of Winnipeg MB (pop. 742,000), Fargo-Moorehead ND, and Regina
SK (each pop. 200,000), livestock processing centers, and several smaller cities (MWS
2006). Agricultural land use is broadly similar within the Saskatchewan River drainage
basin (~416,000 km2) (specialty, cereal, and forage crops; range and pasture lands;
livestock feedlots), while major cities are located in SK (Saskatoon, pop. 200,000) and
AB (Calgary, Edmonton, pop. >750,000 each), and substantial forestry is practiced along
the northern boreal margin of the catchment (Jones and Armstrong 2001). In contrast,
land-use within the Winnipeg River catchment (~137,000 km2) is restricted mainly to
mining, forestry, and recreational activities, with few large population centres (Patalas
and Salki 1992; Smith et al. 1998).

9
Nutrient influx to Lake Winnipeg – At present, Lake Winnipeg receives ~96,000
tonnes N and ~7,900 tonnes P each year, both derived mainly from non-urban sources
(Table 2). Decade-long mass flux estimates suggest that Manitoba represents the largest
source of nutrients to Lake Winnipeg (47% TP, 49% TN), due to a combination of
agricultural runoff, background and undefined sources, atmospheric loading, internal lake
processes, and urban and industrial effluent (Bourne et al. 2002; MWS 2006). The
remaining portion of annual TP and TN influx to the lake is derived from headwater
jurisdictions within the US (35% TP, 21% TN), ON (13% TP, 21% TN), and the
Canadian Prairies (SK and AB, 5% TP, 9% TN) (Bourne et al. 2002; MWS 2006). On
average, ~84% of TP and ~70% of TN is delivered to the south basin of Lake Winnipeg
via the Red (54% TP, 30% TN) and Winnipeg river systems (13% TP, 29% TN) (M.
Stainton, G. McCullough, Fisheries and Oceans Canada [FOC], unpublished data).
Despite these generalities, magnitude and importance of individual sources likely vary
among years, such that TP loading to Lake Winnipeg is highly correlated (r2
= 0.97) to
catchment water yield, particularly from the Red River (Jones and Armstrong 2001;
Bourne et al. 2002; MWS 2006).
Relatively little is known of how nutrient influx to Lake Winnipeg has varied in
the past. Total annual influxes of N and P have risen at least 13% and 10%, respectively,
since the early 1970s, primarily due to increased nutrient inputs from the Red and
Winnipeg river systems (Jones and Armstrong 2001; Bourne et al. 2002; MWS 2006;
LWIC 2006). These latter increases reflect elevated river discharge since the early 1990s,
a 29% increase in flow-adjusted concentrations of TP in both the Red and Winnipeg

10
rivers during the past 40 yr, and a concomitant 58% increase in TN concentrations in the
Red River and possibly the Winnipeg River (Jones and Armstrong 2001). Furthermore,
unpublished hydrologic models have combined these data with continuous measurements
of Red River discharge to predict that mean whole-lake TP concentrations varied from
~12 μg P L-1
during the arid 1930s to ~55 μg P L-1
ca. 2000, assuming constant nutrient
export from land (G. McCullough, R. Hesslein, FOC, unpublished data). In addition,
analysis of P fractions in a sediment core with low temporal resolution suggests that there
have been few large-scale changes in P influx during the past ~500 years, other than a
modest increase (<10%) in TP deposition during the 20th
century (Mayer et al. 2006).
Historical development of eutrophication – Relatively little is known of the
historical changes in limnological conditions within Lake Winnipeg due to its large size,
remote location, and potentially high spatial heterogeneity. Sporadic monitoring of the
south basin during the 20th
century suggests a shift from mesotrophic conditions recorded
in the mid- to late-1920s (Lowe 1924; Bajkov 1930, 1934) and late-1960s (Crowe 1973;
Brunskill 1973; Brunskill and Graham 1979) to a more advanced state of eutrophy
thereafter (Brunskill et al. 1979a, 1979b, 1980), as indicated by elevated concentrations
of TP (~80 μg P L1
) and TN (~700 μg TN L1
) in the south basin during 1992-1996
(Manitoba Water Stewardship [MWS] unpublished data). Similarly, surveys conducted
during 2000-2005 revealed enriched concentrations of TP (>100 μg P L1
) and TN (~750
μg N L1
) throughout the south basin, with soluble reactive P (SRP) accounting for ~50%
of TP (>50 μg P L1
) during fall sampling (M. Stainton, FOC, unpublished data).
Occasional phytoplankton analyses conducted during the 20th
century suggest that a
11
diatom community composed mainly of Stephanodiscus niagarae Ehrenberg in 1920s
(Lowe 1924), 1930a (Bajkov 1930, 1934), and 1969 (Crowe 1973; Brunskill and Graham
1979) was supplemented with, or replaced by, diazotrophic cyanobacteria
(Aphanizomenon, Anabaena) and the diatom genus Aulacoseira by the 1990s (Brunskill
et al. 1979a; Hecky et al. 1986; Kling 1998). Interestingly, paleolimnological analysis of
two sediment cores with low temporal resolution suggests that heterocystous
cyanobacteria and Aulacoseria spp. have been present in Lake Winnipeg for several
millennia (Kling 1998).
Field and laboratory methods – Three sediment cores (62.6–77.6 cm in length)
were collected along a 35-km transect within the south basin of Lake Winnipeg in July
2006 using a Glew gravity corer deployed from the MV Namao (Fig. 1). The cores were
sectioned in 7.5-mm intervals and sediment samples were either refrigerated (4C) or
frozen (-10C) in darkness until analysis of individual strata for measures of sediment age
(210
Pb, 137
Cs activities), past lake nutrient status (C, N, and P contents; 15N, 13
C), algal
abundance and gross community composition (pigments), and for Core 1 alone,
microfossils from diatoms and cyanobacteria.
Sediment chronology was established for each core by gamma spectrometric
analysis of 210
Pb and 137
Cs activities in 15-16 lyophilized (48 h, 0.01 Pa) whole sediment
samples distributed evenly over the length of the core (Appleby et al. 1986; Schelske et
al. 1994). Sediment age and mass accumulation rates (g cm2
yr1
) were calculated using
the constant rate of supply (CRS) calculation (Binford 1990).
12
Stable isotope ratios and elemental composition were determined on whole
sediment samples using a ThermoQuest (F-MAT) DeltaPLUS
XL isotope ratio mass
spectrometer equipped with continuous flow (Con Flo II) unit, an automated Carlo Erba
elemental analyzer as an inlet device, and following standard procedures of Savage et al.
(2004). Stable N (15N) and C (13
C) isotopic compositions were expressed in the
conventional -notation in units of per mil (‰) deviation from atmospheric N2 and an
organic C standard which had been calibrated previously against authentic Vienna Pee
Dee Belemnite. Sample reproducibility was <0.25‰ and <0.10‰ for 15N and 13
C
determinations, respectively.
Sediment TP concentrations and four operationally-defined fractions of P were
measured using the standard protocols of Engstrom and Wright (1984). All extracts were
analyzed with a Lachat QuikChem model 8000 flow-injection auto-analyzer using the
ascorbic acid method. TP was quantified as ortho-P extracted by sequential exposure to
30% H2O2 and 0.5M HCl, while a second aliquot was extracted in 1 M NH4Cl to estimate
chemically-exchangeable P (EP; NH4Cl-P). The residue from the second aliquot was
sequentially extracted with 0.1 M NaOH to measure non-apatite inorganic P (NAI-P;
NaOH-P) composed of Fe- and Al-bound P, and 0.5 M HCl to determine apatite
(carbonate)-bound P (AP; HCl-P). Finally, residual organically-bound P (OP; residual-P)
was estimated as the difference between TP and the sum of the inorganic P fractions. In
general, EP is considered available to biota following release from sediments, AP
includes P bound in crystal lattices of apatite grains and is largely biologically inert
(Mayer et al. 2006), while NAI-P includes orthophosphate adsorbed on Fe and Al-oxides,
Fe and Al minerals such as vivianite or variscite, and Ca-P minerals other than crystalline
13
apatite (Williams et al. 1980) and is considered to be the maximum potential particulate P
that can be rendered soluble by diagenesis (Logan et al. 1979).
Algal abundance and community composition was quantified from analysis of
fossil pigments and their derivatives. Pigments were extracted from lyophilized (48 h,
0.01 Pa) whole sediment samples, filtered (0.2-μm pore), and dried under pure N2 gas
using the standard methods of Leavitt and Hodgson (2001). Carotenoids, chlorophylls
(Chls), and their derivatives were isolated and quantified using an Agilent model 1100
high-performance liquid chromatography (HPLC) system equipped with photo-diode
array and fluorescence detectors, and calibrated with authentic standards. Pigment
analysis was restricted to taxonomically diagnostic carotenoids, including those
characteristic of siliceous algae and some dinoflagellates (fucoxanthin), mainly diatoms
(diatoxanthin), cryptophytes (alloxanthin), chlorophytes (Chl b, pheophytin b),
Nostocales cyanobacteria (canthaxanthin), total cyanobacteria (echinenone), total algae
(β-carotene), as well as ubiquitous Chl a and its derivative pheophytin a. Isomeric
carotenoids from chlorophytes (lutein) and cyanobacteria (zeaxanthin) were inseparable
on our HPLC system and were presented together as lutein-zeaxanthin (potentially
bloom-forming algae). All pigment concentrations were expressed as nmol pigment g1
sediment C, a metric which is linearly correlated to annual algal standing stock in whole-
lake calibration studies (reviewed in Leavitt and Hodgson 2001).
For Core 1 alone, cyanobacterial akinetes (resting stages) were isolated from
refrigerated sediments and prepared for microscopy following the modified protocol of
Crumpton (1987). Whole sediment samples (~1 g) were diluted with 20 mL distilled
water, sonicated three times, and preserved with glutaraldehyde (0.2 mL). Samples were

14
homogenized and ~10 aliquots (~0.10 mL) per interval were individually removed,
diluted with distilled water, and fossils filtered onto a 0.45-μm pore membrane filter.
Filters were mounted on cover slips using hydroxypropyl-methacrylate (HPMA) resin, air
dried for 24 h, and permanently mounted onto glass microscope slides with HPMA resin.
For each sample, ~200 cyanobacterial akinetes were identified and enumerated by
counting random fields using an Olympus BX51 compound microscope equipped with
Nomarski and phase-contrast optics, and epifluorescent detection (λexcitation = 450-480
nm). Microfossil concentrations were estimated as akinetes g1
dry mass of whole
sediment. Taxonomic identities were based on references from Bunting et al. (2007) and
a standard reference collection.
Diatom microfossils (frustules, valves) were isolated from Core 1 sediments and
prepared for microscopy following the standard protocol reviewed in Laird and Cumming
(2009). Whole sediments (0.2–0.3 g) were placed in a 20-mL glass vial with a mixture of
concentrated HNO3 : H2SO4 (50 : 50, by mole), heated for ~6 h at 70°C, and settled for
24 h. Samples were washed repeatedly to constant pH with distilled water. Suspensions
of siliceous microfossils were spiked with known densities of artificial microspheres,
evaporated onto cover slips, and mounted permanently onto glass microscope slides with
Naphrax® medium. For each sample, ~400 diatom valves were identified and
enumerated along transects using a Leica DMRB microscope equipped with a 100
fluotar objective and differential interference contrast optics (1000 magnification; N.A.
= 1.3) to determine species composition, microfossil concentration (valves g1
dry mass
sediment), and relative (%) species abundance. Taxonomy and nomenclature are

15
presented in detail in Laird and Cumming (2009) (boreal lake taxa) and Michels et al.
(2007) (prairie lake taxa).
Historical changes in water-column TP concentrations were reconstructed from
analysis of diatom species assemblages in Core 1 following standard paleolimnological
procedures (Hall and Smol 1992). Nutrient preferences of individual species were
obtained from a survey of diatom composition in surfacial sediments of 140 regional sites
(124 MN lakes, 16 sites from Lake of the Woods, ON). Diatom-inferred TP (DI-TP) was
reconstructed using a robust weighted-average model (r2
bootstrap = 0.75, RMSEP = 0.20)
using the computer program C2 (Juggins 2003) and covered a gradient of 5–364 g P
L1
, as detailed in Hyatt et al. (2011). Principal components analysis (PCA) was
performed on diatom relative abundance with a square-root transformation using the
computer program C2 (Juggins 2003). Local assemblage zones were identified using
stratigraphically constrained cluster analysis of diatom microfossil time series using
CONISS
v. 2.0 (Grimm 1987). Local assemblage zones were estimated using the
Euclidian distance dissimilarity coefficient.
Historical data – Time series of 191 environmental variables from MB were
collected for the 20th
century to both quantify the statistical relationships between fossil
records of lake trophic status (pigments, %N, %C, 15N, 13
C) in the south basin prior to
recent expansion of cyanobacterial blooms and identify potential causal agents related to
regional variation in climate, livestock populations, and crop production (Appendix 1).
Manitoba represents the largest source of nutrients to the lake, but development of
provincial management strategies has been hampered by lack of historical context for

16
recent eutrophication and an understanding of the relative influence of climate, crop
production, and animal husbandry practices (D. Williamson, MWS, pers. comm.).
Consequently, we sought to quantify the statistical relationship between provincial land-
use practices, climate, and water quality during the 20th
century to better prioritize goals
for lake remediation, even though we recognize that this approach will not account for
nutrients influxes from headwater regions in southern and western portions of the
catchment, or the unique effects of the City of Winnipeg. Fortunately, mass balance
studies conducted within the Lake Winnipeg basin demonstrate that most nutrients from
SK and AB are sequestered in intervening lakes and reservoirs prior to transmission to
Lake Winnipeg (Leavitt et al. 2006; Finlay et al. 2010; B. Parker, Environment Canada,
unpublished data), and that City of Winnipeg contributes 5-10% of TN and TP to the lake
in most years. Finally, we used estimates of total agricultural production within MB for
comparison with the fossil time series because agricultural activities within MB are
largely restricted to land within the Lake Winnipeg catchment.
Climate records were obtained from Environment Canada weather stations located
at Winnipeg St. Johns College (1900–1937) and Winnipeg Richardson International
Airport (1938–2006). These records were blended without modification, as comparison
of each with overlapping records from additional stations suggested that there was no
measurable offset between sites for major meteorological time series. Potential climate
predictors included monthly, seasonal, and annual total precipitation (mm; 1875–2006),
annual rainfall (mm; 1875–2006), mean monthly and seasonal temperature (oC; 1875–
2006), and mean minimum and maximum temperatures on monthly, seasonal and annual
scales (C, 1875–2006). In addition, historical records of ice thaw and freeze for the Red
17
River at Winnipeg were used to estimate the regional ice-free season of the western
Canadian plains 1900–1995, as described by Hall et al. (1999). Records of mean annual
lake level (m a.s.l.) and discharge (m3) from the 12 main tributary rivers and the sole
outflow (Nelson River) were obtained from MWS.
Historical records of livestock populations, production, and associated agricultural
products were obtained for MB from Census of Canada reports (Statistics Canada 1871–
2006). Canadian census data have been variously available in MB at annual, 5-yr, and
decadal intervals during the 20th
century. Consequently, annual estimates of all
commercial livestock species density and production (e.g., beef cattle, dairy cattle, hogs,
sheep, chickens, etc.) and their products (e.g., milk, fleece, eggs, etc.) were estimated for
each year 1906–2006 by linear interpolation between census years (Appendix 1).
Similarly, annual estimates of total, urban, and rural human populations were obtained for
MB from Census of Canada reports (Statistics Canada 1871–2006) by linear interpolation
among census data available at annual, 5-yr, or decadal intervals since 1871.
Crop production variables included a combination of areal estimates of diverse
farming activities, fertilizer sales, and direct measurements of agricultural production.
Historical records were obtained from Census of Canada reports (Statistics Canada 1871–
2006) including number of farms (farms yr-1
), area (km2) used for specific activities (e.g.,
cropland, pasture, summer-fallow), area seeded or planted with individual crop species
(km2), calendar day of year [DOY] of agricultural activities (seeding, heading, swathing,
harvest) for major cultivars, and annual mass of products harvested for each crop (kg). In
all cases, estimates of annual production were approximated by linear interpolation
among census data collected at annual, 5- or 10-yr intervals since 1908. Annual fertilizer

18
sales (kg), farm expenditure on fertilizer and lime (CND$), and nutrient content (N, PO4,
K, potash) of purchased fertilizer (kg) were obtained from diverse sources, including
Statistics Canada (1968–1977), fertilizer trade catalogues, the Canadian Fertilizer
Institute, the Potash and Phosphate Institute (1978–2001), and Korol (2002). In general,
chemical fertilizer use was limited prior to 1960.
Although too brief to be used in our statistical analysis, we also compiled annual
records of limnological variables available for 1969 and 1992-2005 from MWS and FOC
for concentrations (μg L1
) of TP (1969, 1992–2005), TN (1992–2005), and Chl a (1992-
2005). Similarly, annual records of commercial fish harvest from Lake Winnipeg (1883–
2006) were obtained from MWS. However, although the lake supports a $20M
commercial fishery, fish production and harvest were viewed, in part, as a response to
eutrophication, rather than predictors of causal relationships, and were not included
subsequent statistical analyses.
Numeric analyses – Constrained and partial canonical ordinations (ter Braak
1988) were used to evaluate the statistical relationships between fossil records of trophic
status (pigments and stable isotopes; diatoms) and time series of explanatory variables
related to climate (C), livestock (L), and crops (A). Specifically, we used the variance
partitioning analysis (VPA) protocol of Borcard et al. (1992), as modified by Hall et al.
(1999) for paleolimnological applications, to estimate the fraction of historical variance
in time series of fossil assemblages explained by categories of predictor variables (C, L,
A) and their first- (C × L, C × A, A × L) and second-order (C × L × A) interactions. In
this procedure, redundancy analysis (RDA) was used to partition variation in fossil

19
assemblages because exploratory detrended correspondence analysis (DCA) suggested
that fossil composition varied along environmental gradients in a linear rather than
unimodal fashion (ter Braak 1986). Separate VPA was conducted for indices of past lake
trophic status (9 biomarker pigments, 13C, 15
N, %C, %N) and diatom community
composition (% relative abundance) for the periods 1901-1992 and 1904-1993,
respectively. All computations were performed using CANOCO v. 4 (ter Braak 1990)
(Microcomputer Power, New York, USA).
VPA is most effective when there are similar numbers of predictors within
explanatory categories and when predictors do not greatly outnumber response variables
(Borcard et al. 1992; Hall et al. 1999). Consequently, several criteria were used to
optimize predictor selection from the 191 candidate time series (Appendix 1). First, we
eliminated time series less than 70 years in duration before interpolation because our
objective was to identify the environmental factors best correlated with inter-decadal
changes in lake production during the 20th
century. Second, we used least-squares
regression analysis of environmental time series within individual categories (e.g., C) to
quantify the correlation among potential predictors. If two candidate time series were
highly correlated, we eliminated a variable if we could assume its effect on mass flux
(e.g., mass harvested, area cultivated) was 10-fold less than that of a well-correlated
predictor (honeybees vs. hogs, minor specialty crops vs. wheat, etc.). Third, forward
selection and Monte Carlo permutation testing was used separately for each category (C,
L, A) within RDA to select the variables that explained significant (P <0.05) independent
variation in fossil time series. Final predictors included six variables from livestock (total
populations of cattle, hogs, horses, sheep, chickens + hens), crop (production of wheat,

20
oats, barley, canola, potatoes, corn), and climate categories (mean summer and winter
temperature, summer and winter precipitation, ice-free period, Red River discharge).
Although rural human population was also retained, we eliminated it from subsequent
analyses because we were interested in the relative importance of individual human
activities caused by elevated populations.
Explanatory and response variables were transformed and harmonized prior to
multivariate analyses. First, all fossil time series were centered (mean = 0), standardized
(variance = 1.0), and inspected for normal distribution, although no transformations were
required. Because many explanatory variables were resolved more highly (annual) than
the fossil time series (2.5-yr sample-1
, separated by 3-5 yr), all predictor time series were
smoothed using a 3-year moving average, before being harmonized to fossil time series
by sampling predictors at time intervals which matched those of the sedimentary records
(17 intervals for pigments and isotopes, 19 for diatoms). In addition, all agricultural
variables, most livestock predictors (except chickens + hens), and few climate variables
(only Red River discharge) required log10 transformation to normalize variance.
Results
Sediment chronology – 210
Pb activity declined monotonically with depth in each
of the Lake Winnipeg sediment cores (Fig. 2a), and suggested only limited mixing of
surface sediments. Similarly, activity profiles for 137
Cs were well defined, with a clear
maximum in 210
Pb-dated intervals corresponding to peak atmospheric nuclear testing in
1964 (Fig. 2b). Application of the CRS calculation also showed that bulk dry sediment
21
accumulation rates (SAR) were high and similar over the length of each core, with mean
( SE) rates of 50.0 0.8, 64.6 1.1, and 83.2 0.9 mg cm2
yr1
for Cores 1, 2 and 3,
respectively, although in each case mean SAR increased slightly after ~1990.
Consequently, depth-age (Fig. 2c) and cumulative mass-depth relationships (not shown)
were nearly linear prior to 1990 (r2 >0.98, P< 0.0001) (Fig. 2c) and sedimentary profiles
encompassed 310, 218 and 185 yr for Cores 1 (77.6 cm), 2 (62.6 cm), and 3 (62.6 cm),
respectively. Mean SAR estimates were very similar to those obtained from previous
studies (63.5–86.1 mg cm2
yr1
) of the south basin (Wilkinson and Simpson 2003).
Sedimentary geochemistry – Although the cores were taken from locations
separated by ~35 km, they exhibited a high degree of similarity in elemental composition
and stable isotope content throughout the past 200 years (Fig. 3). Consistent with the
constant SAR, both N (~0.17% of dry mass) (Fig. 3b) and C contents (~1.5%) (Fig. 3c)
were very stable from ca. 1800–1900, increased gradually by 50%, then rose rapidly in
sediments deposited ca. 2006 (Fig. 3b, d). Similarly, C : N mass ratios (~10:1) varied
little either among cores or with burial depth and were characteristic of algal-derived
material (data not shown). In contrast, 15N values increased linearly from background
depleted levels (~4.5‰) ca. 1900 to an enriched maximum (~8.0‰) in surface sediments
(Fig. 3a). Similarly, although 13C values of whole sediment were consistently ~1-2‰
lower in Core 1 than at other sites (Fig. 3c), C isotope ratios in each core were relatively
enriched and constant from ca. 1800–1900, declined irregularly by ~1‰ until ca. 1990,
then exhibited high temporal variability during the past 20 years, with a maximum ca.
2000 and a further minimum ca. 2006.
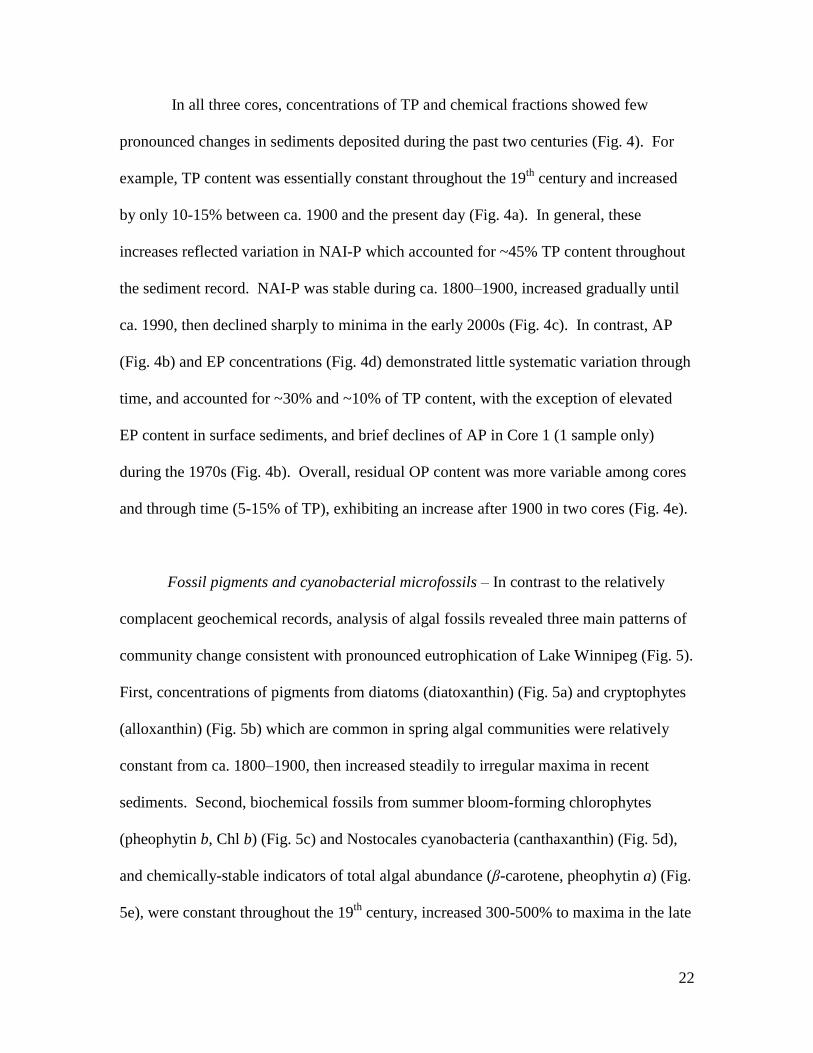
22
In all three cores, concentrations of TP and chemical fractions showed few
pronounced changes in sediments deposited during the past two centuries (Fig. 4). For
example, TP content was essentially constant throughout the 19th
century and increased
by only 10-15% between ca. 1900 and the present day (Fig. 4a). In general, these
increases reflected variation in NAI-P which accounted for ~45% TP content throughout
the sediment record. NAI-P was stable during ca. 1800–1900, increased gradually until
ca. 1990, then declined sharply to minima in the early 2000s (Fig. 4c). In contrast, AP
(Fig. 4b) and EP concentrations (Fig. 4d) demonstrated little systematic variation through
time, and accounted for ~30% and ~10% of TP content, with the exception of elevated
EP content in surface sediments, and brief declines of AP in Core 1 (1 sample only)
during the 1970s (Fig. 4b). Overall, residual OP content was more variable among cores
and through time (5-15% of TP), exhibiting an increase after 1900 in two cores (Fig. 4e).
Fossil pigments and cyanobacterial microfossils – In contrast to the relatively
complacent geochemical records, analysis of algal fossils revealed three main patterns of
community change consistent with pronounced eutrophication of Lake Winnipeg (Fig. 5).
First, concentrations of pigments from diatoms (diatoxanthin) (Fig. 5a) and cryptophytes
(alloxanthin) (Fig. 5b) which are common in spring algal communities were relatively
constant from ca. 1800–1900, then increased steadily to irregular maxima in recent
sediments. Second, biochemical fossils from summer bloom-forming chlorophytes
(pheophytin b, Chl b) (Fig. 5c) and Nostocales cyanobacteria (canthaxanthin) (Fig. 5d),
and chemically-stable indicators of total algal abundance (β-carotene, pheophytin a) (Fig.
5e), were constant throughout the 19th
century, increased 300-500% to maxima in the late

23
1980s, then declined ~50% in sediments deposited since 1990. Third, concentrations of
akinetes from diazotrophic cyanobacteria increased exponentially in Core 1 sediments
from baseline values between ca. 1800–1990 to 10-fold higher abundances since that time
(Fig. 5f). In general, microfossils from Anabaena spp. were always 10-fold more
abundant than those from Aphanizomenon spp. throughout the 200-year record. Such
concomitant changes in pigment and cyanobacterial microfossil deposition ca. 1990
reflect either shading of other algae by positively buoyant N2-fixing cyanobacteria, or a
change in depositional processes as neutrally-buoyant phytoplankton are replaced by
positively-buoyant diazotrophs (Bunting et al. 2007). Regardless, taken together, these
patterns demonstrate that algal abundance increased ~three- to five-fold during the 20th
century, with an ecosystem state change occurring ca. 1990. In contrast, ratios of labile
to chemically-stable pigments (Chl a : pheophytin a) did not change with depth (not
shown), indicating that preservation environments have been relatively constant since
1800 (Leavitt and Hodgson 2001).
Fossil diatoms – Diatoms were well preserved, abundant, and composed of taxa
characteristic of productive waters throughout the past 200 years (Fig. 6). Constrained
cluster analysis of fossil valve concentrations identified three diatom zones in Core 1,
including communities with low concentrations representing baseline conditions (Zone I,
ca. 1800–1915), a period of slowly rising densities (Zone II, ca. 1915–1975), and an era
of greatly increased diatom deposition (Zone III, ca. 1980-present). Although the same
zones were also identified by cluster analysis of diatom relative (%) abundance (data not
shown), there were only modest changes in species composition during the past 200
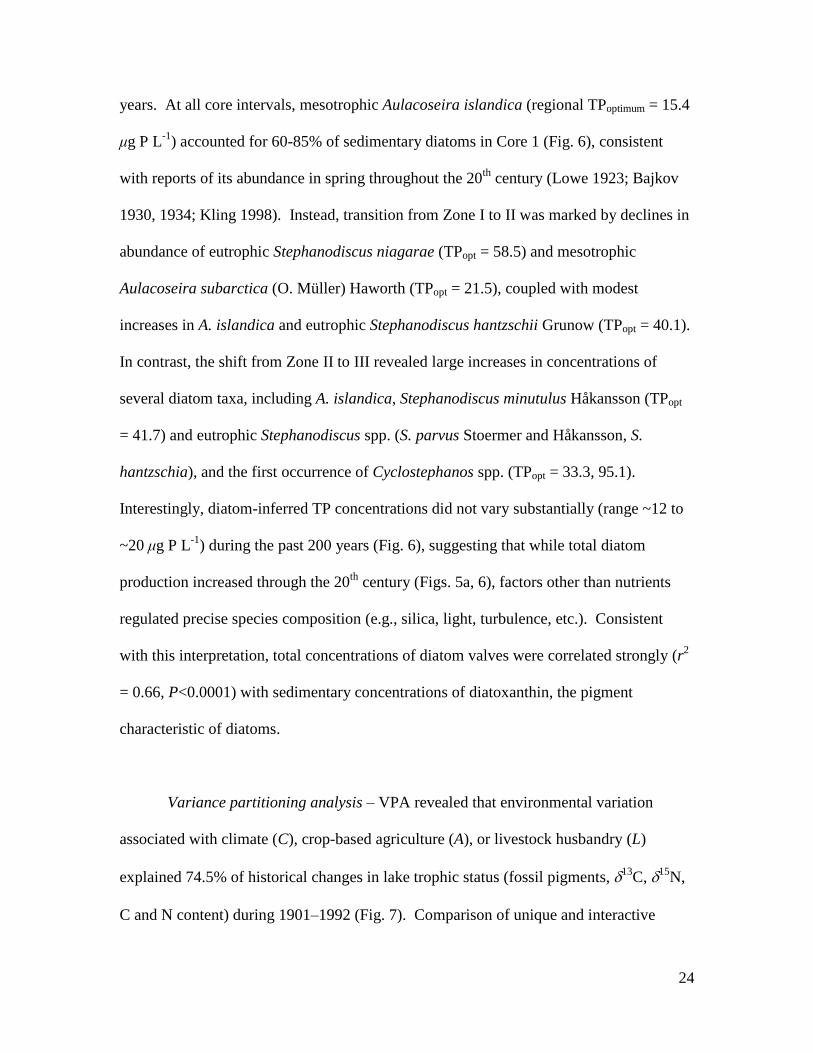
24
years. At all core intervals, mesotrophic Aulacoseira islandica (regional TPoptimum = 15.4
μg P L-1
) accounted for 60-85% of sedimentary diatoms in Core 1 (Fig. 6), consistent
with reports of its abundance in spring throughout the 20th
century (Lowe 1923; Bajkov
1930, 1934; Kling 1998). Instead, transition from Zone I to II was marked by declines in
abundance of eutrophic Stephanodiscus niagarae (TPopt = 58.5) and mesotrophic
Aulacoseira subarctica (O. Müller) Haworth (TPopt = 21.5), coupled with modest
increases in A. islandica and eutrophic Stephanodiscus hantzschii Grunow (TPopt = 40.1).
In contrast, the shift from Zone II to III revealed large increases in concentrations of
several diatom taxa, including A. islandica, Stephanodiscus minutulus Håkansson (TPopt
= 41.7) and eutrophic Stephanodiscus spp. (S. parvus Stoermer and Håkansson, S.
hantzschia), and the first occurrence of Cyclostephanos spp. (TPopt = 33.3, 95.1).
Interestingly, diatom-inferred TP concentrations did not vary substantially (range ~12 to
~20 μg P L-1
) during the past 200 years (Fig. 6), suggesting that while total diatom
production increased through the 20th
century (Figs. 5a, 6), factors other than nutrients
regulated precise species composition (e.g., silica, light, turbulence, etc.). Consistent
with this interpretation, total concentrations of diatom valves were correlated strongly (r2
= 0.66, P<0.0001) with sedimentary concentrations of diatoxanthin, the pigment
characteristic of diatoms.
Variance partitioning analysis – VPA revealed that environmental variation
associated with climate (C), crop-based agriculture (A), or livestock husbandry (L)
explained 74.5% of historical changes in lake trophic status (fossil pigments, 13C, 15
N,
C and N content) during 1901–1992 (Fig. 7). Comparison of unique and interactive

25
categories revealed that most of the explained variation arose from interactions between
crops and livestock (A × L = 39.6%; A × L × C = 17.9% explained variance) rather than
from climate change (C = 3.7%; C × A = 0.3%; C × L = 0.1%). Consistent with this
interpretation, RDA with climate predictors alone explained only 22.0% of fossil change
during the 20th
century, whereas similar analysis using either crops (66.5%) or livestock
alone (62.0%) explained three-fold more variation in pigments and geochemistry (Fig. 7).
Only cattle (correlated positively with hogs, negatively with horses) and chickens + hens
(correlated positively with sheep) were retained by forward selection and Monte Carlo
analysis as unique significant livestock predictors of change in fossil time series.
Similarly, canola and potato production were retained in a RDA of fossils with crop
predictors, although production of both these cultivars was correlated positively with that
of many other crops, particularly wheat. Finally, only winter precipitation (correlated
positively with mean summer temperature, negatively with Red River discharge) was
retained as a predictor in RDA constrained to use only climate variables. Interestingly,
multivariate analyses were unable to explain any significant (P <0.05) variation in past
diatom community composition (% relative abundance) during 1904-1993, either in VPA
or in RDA constrained uniquely to climate, crop, or livestock predictors.
Discussion
Analysis of highly resolved time series of sediment geochemistry and algal fossils
demonstrated that southern Lake Winnipeg has undergone three phases of eutrophication
since 1800. The first phase (ca. 1800-1900) includes baseline conditions prior to
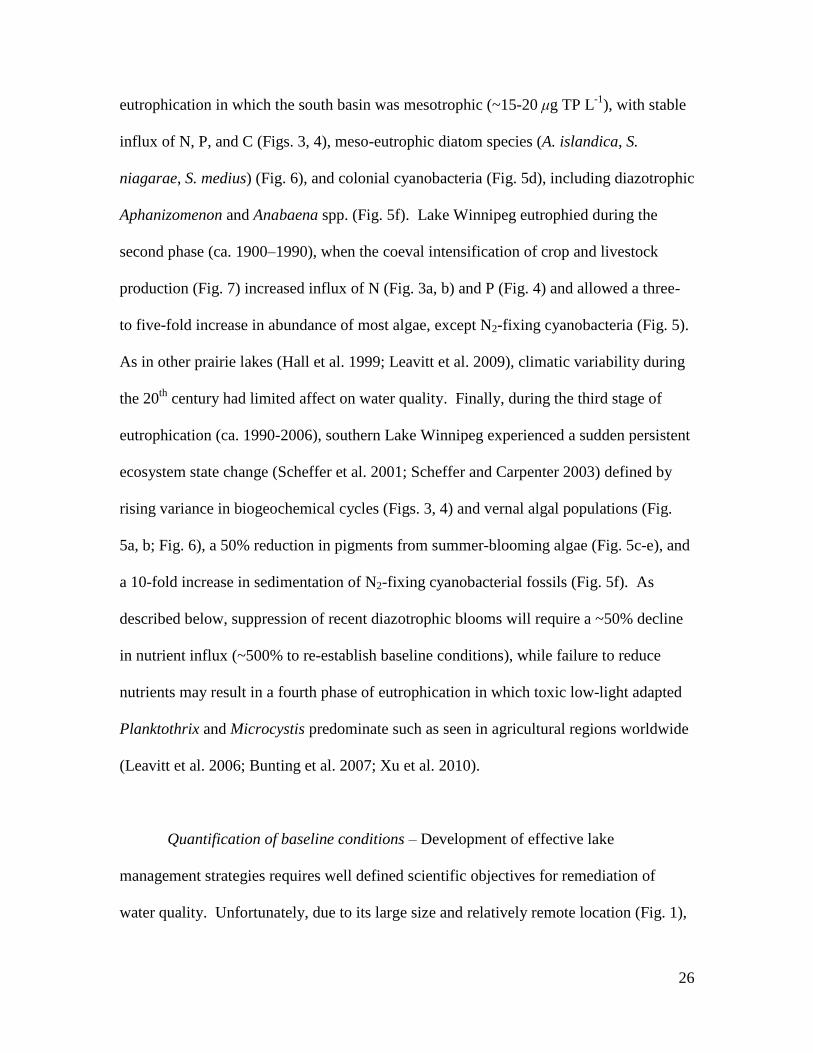
26
eutrophication in which the south basin was mesotrophic (~15-20 μg TP L-1
), with stable
influx of N, P, and C (Figs. 3, 4), meso-eutrophic diatom species (A. islandica, S.
niagarae, S. medius) (Fig. 6), and colonial cyanobacteria (Fig. 5d), including diazotrophic
Aphanizomenon and Anabaena spp. (Fig. 5f). Lake Winnipeg eutrophied during the
second phase (ca. 1900–1990), when the coeval intensification of crop and livestock
production (Fig. 7) increased influx of N (Fig. 3a, b) and P (Fig. 4) and allowed a three-
to five-fold increase in abundance of most algae, except N2-fixing cyanobacteria (Fig. 5).
As in other prairie lakes (Hall et al. 1999; Leavitt et al. 2009), climatic variability during
the 20th
century had limited affect on water quality. Finally, during the third stage of
eutrophication (ca. 1990-2006), southern Lake Winnipeg experienced a sudden persistent
ecosystem state change (Scheffer et al. 2001; Scheffer and Carpenter 2003) defined by
rising variance in biogeochemical cycles (Figs. 3, 4) and vernal algal populations (Fig.
5a, b; Fig. 6), a 50% reduction in pigments from summer-blooming algae (Fig. 5c-e), and
a 10-fold increase in sedimentation of N2-fixing cyanobacterial fossils (Fig. 5f). As
described below, suppression of recent diazotrophic blooms will require a ~50% decline
in nutrient influx (~500% to re-establish baseline conditions), while failure to reduce
nutrients may result in a fourth phase of eutrophication in which toxic low-light adapted
Planktothrix and Microcystis predominate such as seen in agricultural regions worldwide
(Leavitt et al. 2006; Bunting et al. 2007; Xu et al. 2010).
Quantification of baseline conditions – Development of effective lake
management strategies requires well defined scientific objectives for remediation of
water quality. Unfortunately, due to its large size and relatively remote location (Fig. 1),
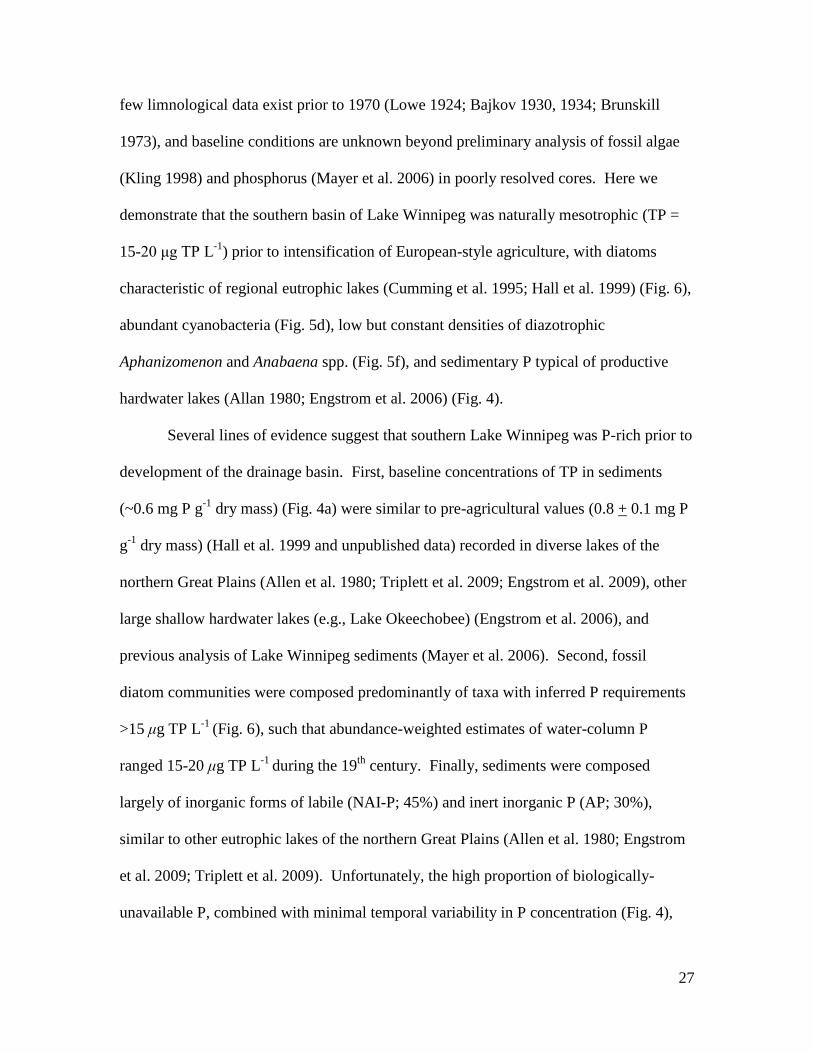
27
few limnological data exist prior to 1970 (Lowe 1924; Bajkov 1930, 1934; Brunskill
1973), and baseline conditions are unknown beyond preliminary analysis of fossil algae
(Kling 1998) and phosphorus (Mayer et al. 2006) in poorly resolved cores. Here we
demonstrate that the southern basin of Lake Winnipeg was naturally mesotrophic (TP =
15-20 μg TP L-1
) prior to intensification of European-style agriculture, with diatoms
characteristic of regional eutrophic lakes (Cumming et al. 1995; Hall et al. 1999) (Fig. 6),
abundant cyanobacteria (Fig. 5d), low but constant densities of diazotrophic
Aphanizomenon and Anabaena spp. (Fig. 5f), and sedimentary P typical of productive
hardwater lakes (Allan 1980; Engstrom et al. 2006) (Fig. 4).
Several lines of evidence suggest that southern Lake Winnipeg was P-rich prior to
development of the drainage basin. First, baseline concentrations of TP in sediments
(~0.6 mg P g-1
dry mass) (Fig. 4a) were similar to pre-agricultural values (0.8 + 0.1 mg P
g-1
dry mass) (Hall et al. 1999 and unpublished data) recorded in diverse lakes of the
northern Great Plains (Allen et al. 1980; Triplett et al. 2009; Engstrom et al. 2009), other
large shallow hardwater lakes (e.g., Lake Okeechobee) (Engstrom et al. 2006), and
previous analysis of Lake Winnipeg sediments (Mayer et al. 2006). Second, fossil
diatom communities were composed predominantly of taxa with inferred P requirements
>15 μg TP L-1
(Fig. 6), such that abundance-weighted estimates of water-column P
ranged 15-20 μg TP L-1
during the 19th
century. Finally, sediments were composed
largely of inorganic forms of labile (NAI-P; 45%) and inert inorganic P (AP; 30%),
similar to other eutrophic lakes of the northern Great Plains (Allen et al. 1980; Engstrom
et al. 2009; Triplett et al. 2009). Unfortunately, the high proportion of biologically-
unavailable P, combined with minimal temporal variability in P concentration (Fig. 4),

28
despite pronounced eutrophication (Fig. 5), suggest that historical changes in sedimentary
P cannot be used to estimate baseline water-quality conditions within the lake.
Calculations based on combined analysis of total algal abundance (as fossil β-
carotene) (Fig. 5e) and modern nutrient content suggest that baseline water-column
concentrations of TP in the south basin ranged 15-20 μg TP L-1
, characteristic of other
mesotrophic prairie lakes (Pham et al. 2008, 2009). Here we assumed that algal
production during the 20th
century was limited by the influx of P (Schindler 1977), that
the relationship between algal density and P concentrations was consistent throughout
1800-1992, and that variations in fossil β-carotene concentrations were correlated linearly
to changes in total algal abundance (Cuddington et al. 1999; Leavitt and Hodgson 2001).
Therefore, given that mean (+ SD) water-column TP in the south basin was 80 + 15 μg P
L-1
during 1992-1996 (MWS unpublished data), and that sedimentary β-carotene
concentrations in the three cores were between 4.33 + 1.10 and 5.53 + 1.74 -fold greater
during the early 1990s than before 1900 (depending on whether mean [1960-1992] or
maximum pigment concentrations were used), we estimate that the south basin contained
14.5 – 18.5 μg TP L-1
prior to eutrophication. These values agree well with the range
inferred from analysis of fossil diatoms (Fig. 6; but see caveats below) and unpublished
hydrological simulations of nutrient export (G. McCullough, R. Hesslein, FOC,
unpublished data), and demonstrate that Lake Winnipeg should be managed for
mesotrophic rather than oligotrophic conditions.
Mechanisms causing water-quality change during the 20th
century – Water quality
in the south basin of Lake Winnipeg was degraded substantially during the 20th
century

29
(Fig. 5), largely due to the combined effects of crop and livestock production, but not
climate change (Fig. 7). Specifically, abundance of all algal groups except diazotrophic
cyanobacteria increased 300-500% (Fig. 5), 15N values increased 3-4 ‰ due to influx of
enriched N (Fig. 3a) (Anderson and Cabana 2005; vander Zanden et al. 2005; Bunting et
al. 2007), and 13C declined 1-2‰ consistent with increased primary production and
reliance on respired CO2 (Leavitt et al. 2006; Bunting et al. 2007). VPA explained almost
75% of historical variation in indices of lake trophic status (pigments, isotopes, %C, %N)
between ca. 1900-1992 due to increased production of cattle, hogs, chicken, and major
crop cultivars (canola, potatoes, wheat, etc.), while the unique effects of climate and its
first-order interactions with crop and livestock production (C, C× L, C× A) explained a
non-significant (P >0.15) fraction (4.1%) of historical change (Fig. 7). Such weak effects
of pronounced warming (~3oC increase, ~35 day decline in ice cover) have been
documented for other lakes within the Lake Winnipeg catchment (Leavitt et al. 2009),
and are consistent with theoretical and empirical expectations that changes in mass (m)
influx (water, solutes, particles) can overwhelm effects on lakes of increased energy (E)
influx (as temperature, irradiance, ice cover, wind energy) (Dröscher et al. 2009; Leavitt
et al. 2009; Vogt et al. 2011).
Intensification of nutrient fluxes due to widespread crop production and animal
husbandry is now the most significant mechanism causing eutrophication of fresh and
coastal waters (Carpenter et al. 1998; Smith 2003). For example, grains such as wheat
(~1×10⁹ kg yr
-1 in 1910s) and barley (0.3-0.5×10
9 kg yr
-1 in 1910s) have dominated
production since regional farming began (Honey and Oleson 2006), but their harvest
increased dramatically following World War II (WWII; 1939-1945), reaching 5×10⁹ kg
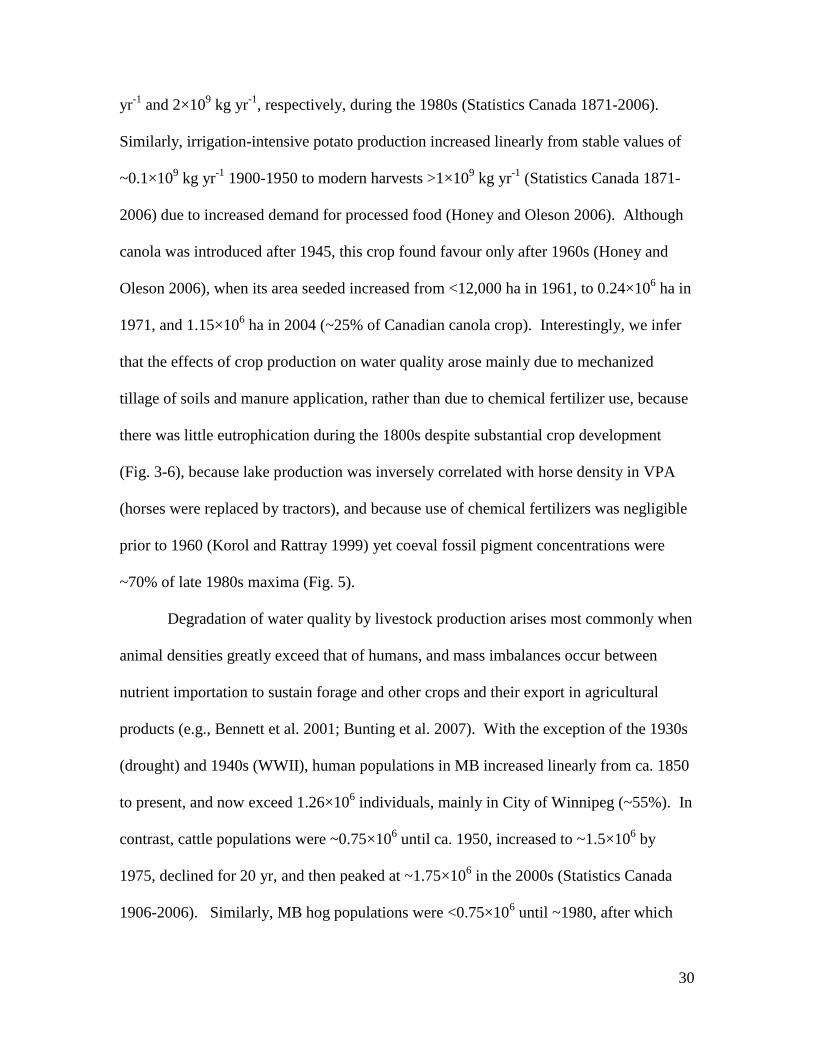
30
yr-1
and 2×10⁹ kg yr
-1, respectively, during the 1980s (Statistics Canada 1871-2006).
Similarly, irrigation-intensive potato production increased linearly from stable values of
~0.1×10⁹ kg yr
-1 1900-1950 to modern harvests >1×10
9 kg yr
-1 (Statistics Canada 1871-
2006) due to increased demand for processed food (Honey and Oleson 2006). Although
canola was introduced after 1945, this crop found favour only after 1960s (Honey and
Oleson 2006), when its area seeded increased from <12,000 ha in 1961, to 0.24×10⁶ ha in
1971, and 1.15×10⁶ ha in 2004 (~25% of Canadian canola crop). Interestingly, we infer
that the effects of crop production on water quality arose mainly due to mechanized
tillage of soils and manure application, rather than due to chemical fertilizer use, because
there was little eutrophication during the 1800s despite substantial crop development
(Fig. 3-6), because lake production was inversely correlated with horse density in VPA
(horses were replaced by tractors), and because use of chemical fertilizers was negligible
prior to 1960 (Korol and Rattray 1999) yet coeval fossil pigment concentrations were
~70% of late 1980s maxima (Fig. 5).
Degradation of water quality by livestock production arises most commonly when
animal densities greatly exceed that of humans, and mass imbalances occur between
nutrient importation to sustain forage and other crops and their export in agricultural
products (e.g., Bennett et al. 2001; Bunting et al. 2007). With the exception of the 1930s
(drought) and 1940s (WWII), human populations in MB increased linearly from ca. 1850
to present, and now exceed 1.26×10⁶ individuals, mainly in City of Winnipeg (~55%). In
contrast, cattle populations were ~0.75×10⁶ until ca. 1950, increased to ~1.5×10
6 by
1975, declined for 20 yr, and then peaked at ~1.75×10⁶ in the 2000s (Statistics Canada
1906-2006). Similarly, MB hog populations were <0.75×10⁶ until ~1980, after which
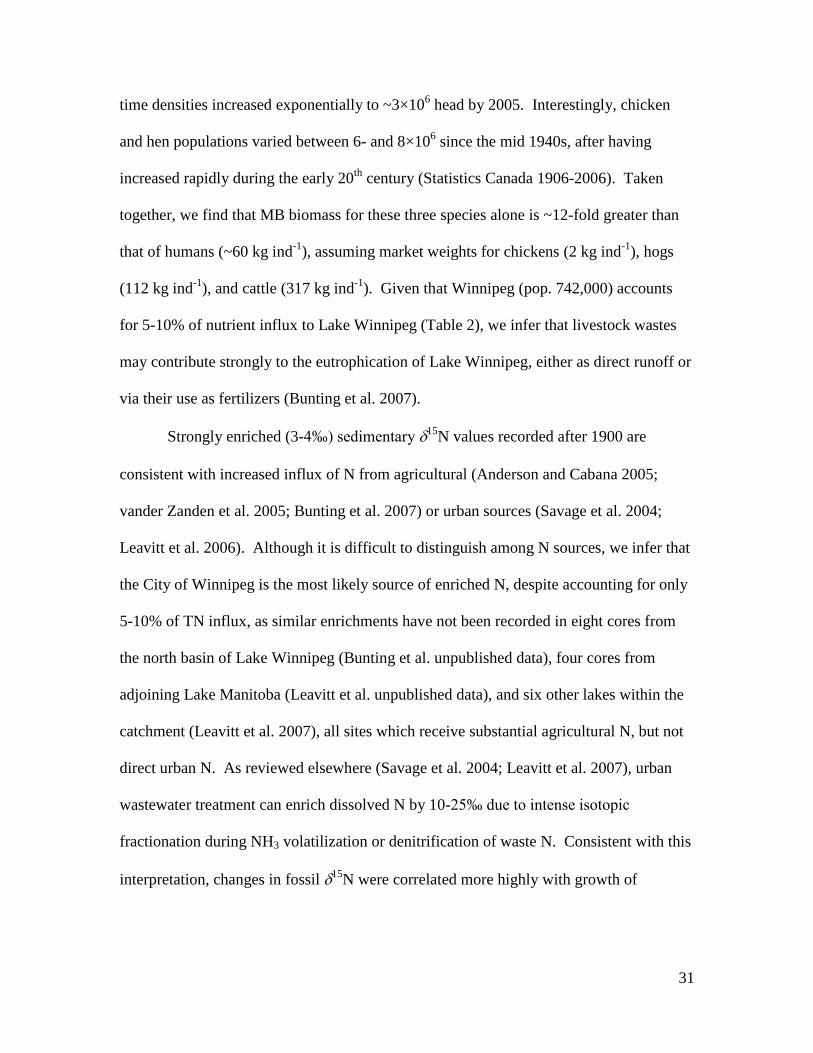
31
time densities increased exponentially to ~3×10⁶ head by 2005. Interestingly, chicken
and hen populations varied between 6- and 8×10⁶ since the mid 1940s, after having
increased rapidly during the early 20th
century (Statistics Canada 1906-2006). Taken
together, we find that MB biomass for these three species alone is ~12-fold greater than
that of humans (~60 kg ind-1
), assuming market weights for chickens (2 kg ind-1
), hogs
(112 kg ind-1
), and cattle (317 kg ind-1
). Given that Winnipeg (pop. 742,000) accounts
for 5-10% of nutrient influx to Lake Winnipeg (Table 2), we infer that livestock wastes
may contribute strongly to the eutrophication of Lake Winnipeg, either as direct runoff or
via their use as fertilizers (Bunting et al. 2007).
Strongly enriched (3-4‰) sedimentary 15N values recorded after 1900 are
consistent with increased influx of N from agricultural (Anderson and Cabana 2005;
vander Zanden et al. 2005; Bunting et al. 2007) or urban sources (Savage et al. 2004;
Leavitt et al. 2006). Although it is difficult to distinguish among N sources, we infer that
the City of Winnipeg is the most likely source of enriched N, despite accounting for only
5-10% of TN influx, as similar enrichments have not been recorded in eight cores from
the north basin of Lake Winnipeg (Bunting et al. unpublished data), four cores from
adjoining Lake Manitoba (Leavitt et al. unpublished data), and six other lakes within the
catchment (Leavitt et al. 2007), all sites which receive substantial agricultural N, but not
direct urban N. As reviewed elsewhere (Savage et al. 2004; Leavitt et al. 2007), urban
wastewater treatment can enrich dissolved N by 10-25‰ due to intense isotopic
fractionation during NH3 volatilization or denitrification of waste N. Consistent with this
interpretation, changes in fossil 15N were correlated more highly with growth of
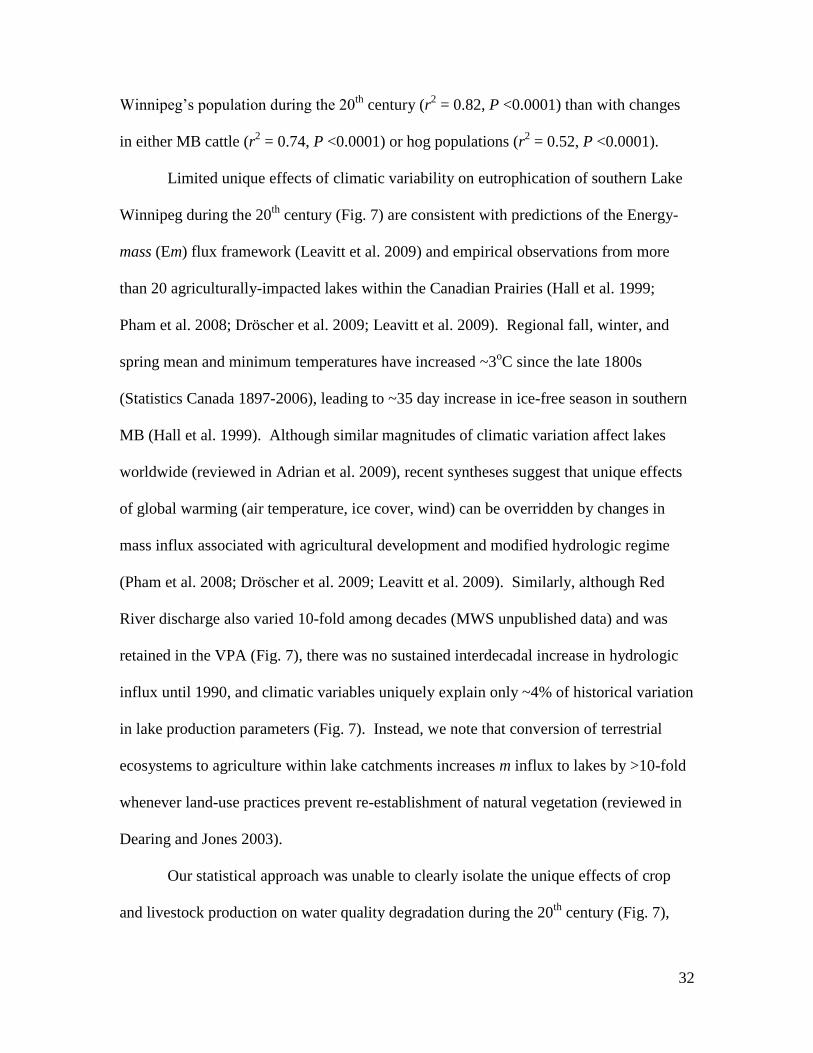
32
Winnipeg’s population during the 20th
century (r2 = 0.82, P <0.0001) than with changes
in either MB cattle (r2 = 0.74, P <0.0001) or hog populations (r
2 = 0.52, P <0.0001).
Limited unique effects of climatic variability on eutrophication of southern Lake
Winnipeg during the 20th
century (Fig. 7) are consistent with predictions of the Energy-
mass (Em) flux framework (Leavitt et al. 2009) and empirical observations from more
than 20 agriculturally-impacted lakes within the Canadian Prairies (Hall et al. 1999;
Pham et al. 2008; Dröscher et al. 2009; Leavitt et al. 2009). Regional fall, winter, and
spring mean and minimum temperatures have increased ~3oC since the late 1800s
(Statistics Canada 1897-2006), leading to ~35 day increase in ice-free season in southern
MB (Hall et al. 1999). Although similar magnitudes of climatic variation affect lakes
worldwide (reviewed in Adrian et al. 2009), recent syntheses suggest that unique effects
of global warming (air temperature, ice cover, wind) can be overridden by changes in
mass influx associated with agricultural development and modified hydrologic regime
(Pham et al. 2008; Dröscher et al. 2009; Leavitt et al. 2009). Similarly, although Red
River discharge also varied 10-fold among decades (MWS unpublished data) and was
retained in the VPA (Fig. 7), there was no sustained interdecadal increase in hydrologic
influx until 1990, and climatic variables uniquely explain only ~4% of historical variation
in lake production parameters (Fig. 7). Instead, we note that conversion of terrestrial
ecosystems to agriculture within lake catchments increases m influx to lakes by >10-fold
whenever land-use practices prevent re-establishment of natural vegetation (reviewed in
Dearing and Jones 2003).
Our statistical approach was unable to clearly isolate the unique effects of crop
and livestock production on water quality degradation during the 20th
century (Fig. 7),

33
mainly because of residual co-linearity among predictors following selection of
environmental time series (see Methods). Additionally, cumulative explained variance
(~75%) was lower than that recorded in VPA of other lakes in the catchment (87-97%)
using identical protocols (Hall et al. 1999; Leavitt et al. 2009), likely because we did not
include urban (~5-10% TP and TN) or US nutrient sources (~34% TP, 21% TN) (Table
2). Similarly, we were unable to partition the unique effects of N and P pollution as has
been done in coastal marine systems (Savage et al. 2010), because TN has been rarely
monitored and because TN in regional lakes includes a high proportion (>70%) of
dissolved organic N of uncertain biological availability (Patoine et al. 2006; Leavitt et al.
2006; Bunting et al. 2010). High colinearity among sedimentary variables also prevented
us from quantifying the unique effects of N and P on southern Lake Winnipeg using
fossil time series, even though historical changes in total algal abundance (as β-carotene)
were correlated strongly with sedimentary concentrations of P (r2 = 0.47 + 0.25, P
<0.02), %N (r2 = 0.81 + 0.08, P <0.0001), and 15
N values (r2 = 0.72 + 0.16, P <0.0001)
in all three cores (1901-1992). Finally, the lack of historical variation in diatoms species
composition prevented VPA of relative abundance data, and complicated interpretations
of diatom-inferred TP concentrations (Fig. 6). Despite these caveats, the observation that
changes in MB crop (wheat, canola, potatoes) and livestock production (cattle, hogs,
chicken + hens) explained ~75% of variation in south basin production 1901-1992 allows
regulatory agencies to develop more effective management strategies, as outlined below.
Ecosystem State Change – Nearly a century of eutrophication combined with
rapid agricultural development during the past ~30 years appears to have initiated an

34
ecosystem state change ca. 1990 (Scheffer et al. 2001; Scheffer and Carpenter 2003),
from diverse productive algal communities to modern assemblages composed mainly of
buoyant diazotrophic Aphanizomenon and Anabaena spp. (Fig. 5) (Kling 1998). As
predicted from theory (Cottingham et al. 2000; Carpenter 2003; Carpenter and Brock
2006), state change was also marked by elevated temporal variation in many lake
characteristics, including production and deposition of diatoms (Fig. 5a, Fig. 6),
cryptophytes (Fig. 5b), and summer bloom-forming algae (Figs 5c-d), carbon cycling
(Fig. 3c), and relative composition of sedimentary P fractions (Fig. 4). At present, it is
unclear whether the 50% decline in concentrations of ubiquitous fossil pigments (β-
carotene, pheophytin a) after 1990 (Fig. 5e) reflects a true reduction in algal abundance
due to shading by floating cyanobacteria (McGowan et al. 2005; Bunting et al. 2007),
lateral transfer of these algae to lakeshores (LWIC 2006), or increased pigment
degradation due to slower sinking of buoyant taxa (Cuddington et al. 1999; Leavitt and
Hodgson 2001). Regardless, we inter that southern Lake Winnipeg has undergone a state
change due to a persistent change in external forcing (Leavitt et al. 2009), rather than a
transition between alternative stable states (Scheffer et al. 2001; Scheffer and Carpenter
2003; Carpenter 2005), because the south basin’s polymictic status and poor light
penetration (Zsecchi <1 m, Zmean 9.7 m) prevent many internal mechanisms (internal
nutrient loading, macrophytes, stratification, benthic algal production) (Fig. 6) needed to
stabilize alternative states (Scheffer and Carpenter 2003). This distinction is important
for managers because stabilizing feedback mechanisms associated with alternative stable
states can substantially delay lake response to declines in external nutrient influx
(Scheffer et al. 2001; Scheffer and Carpenter 2003).
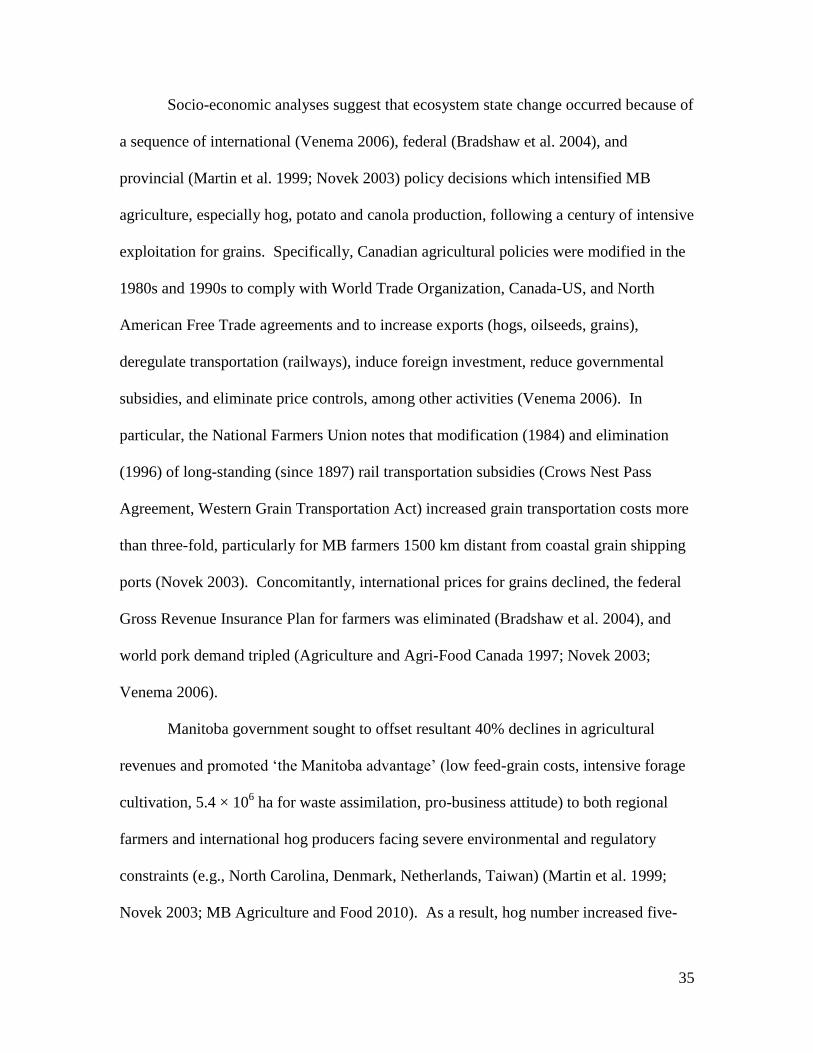
35
Socio-economic analyses suggest that ecosystem state change occurred because of
a sequence of international (Venema 2006), federal (Bradshaw et al. 2004), and
provincial (Martin et al. 1999; Novek 2003) policy decisions which intensified MB
agriculture, especially hog, potato and canola production, following a century of intensive
exploitation for grains. Specifically, Canadian agricultural policies were modified in the
1980s and 1990s to comply with World Trade Organization, Canada-US, and North
American Free Trade agreements and to increase exports (hogs, oilseeds, grains),
deregulate transportation (railways), induce foreign investment, reduce governmental
subsidies, and eliminate price controls, among other activities (Venema 2006). In
particular, the National Farmers Union notes that modification (1984) and elimination
(1996) of long-standing (since 1897) rail transportation subsidies (Crows Nest Pass
Agreement, Western Grain Transportation Act) increased grain transportation costs more
than three-fold, particularly for MB farmers 1500 km distant from coastal grain shipping
ports (Novek 2003). Concomitantly, international prices for grains declined, the federal
Gross Revenue Insurance Plan for farmers was eliminated (Bradshaw et al. 2004), and
world pork demand tripled (Agriculture and Agri-Food Canada 1997; Novek 2003;
Venema 2006).
Manitoba government sought to offset resultant 40% declines in agricultural
revenues and promoted ‘the Manitoba advantage’ (low feed-grain costs, intensive forage
cultivation, 5.4 × 10⁶ ha for waste assimilation, pro-business attitude) to both regional
farmers and international hog producers facing severe environmental and regulatory
constraints (e.g., North Carolina, Denmark, Netherlands, Taiwan) (Martin et al. 1999;
Novek 2003; MB Agriculture and Food 2010). As a result, hog number increased five-

36
fold and operations intensified (~350% fewer farms, 8-fold increase in areal animal
densities) during 1981-2000 (Schnaiberg and Gould 1994; Novek 2003; Venema 2006)
while fodder corn production increased from 0.1 ×10⁹ kg yr
-1 to ~1.2 ×10
9 kg yr
-1
(Statistics Canada 1871-2006). Between 1990 and 2010, agricultural diversification also
increased annual harvest of canola and potatoes by ~2.5 ×10⁹ kg (500%) and ~0.7 ×10
9
kg (275%), respectively, whereas production of other major grains declined slightly
(wheat, barley, mixed grains, corn) or changed little (oats) relative to previous production
(Statistics Canada 1871-2006). Such sudden increases in crop and livestock production
increased nutrient runoff in southern MB, as recorded by elevated nutrient concentrations
in all tributary rivers ( Jones and Armstrong 2001), ~20% increases in water column
concentrations of N and P (MWS unpublished data), and a decline in water column TN :
TP ratios from ~8.5 to 6.3 since 1990 (MWS unpublished data).
Scientific and management implications – Sedimentary analyses provide a unique
opportunity to improve scientifically-based strategies for lake remediation. By assuming
Lake Winnipeg has been regulated mainly by the influx of P prior to regime shift ca.
1990, we propose that modern TP content in the south basin (~100 μg P L-1
) must be
reduced ~five-fold to return the basin to mesotrophic conditions characteristic of the pre-
agricultural era (~15-20 μg P L-1
). These targets are consistent with the P optimum of the
predominant (60-80% of valves) diatom taxon, Aulacoseira islandica (~15.4 μg P L-1
),
determined using a survey of >100 regional lakes, although we caution that factors other
than nutrient influx (e.g., physical mixing, Si, light, etc.) appear to be regulating diatom
species composition in the south basin (Fig. 6). Similarly, we recommend that modern
37
TP concentrations be reduced to ~50 μg P L-1
(50% decrease) to suppress current
outbreaks of diazotrophic cyanobacteria and reduce the present surplus of water column
SRP (~50% of TP), yet allow for the high interannual variability in river discharge which
regulates nutrient influx to the lake. We infer that the lake will not show hysteresis in
response to nutrient reduction because the recent state change appears to lack most
internal mechanisms that would stabilize a turbid, cyanobacteria-rich state (e.g., anoxia,
internal nutrient loading, bioavailable sedimentary P) (Fig. 4). Further, we believe that
these thresholds (50%, 500% reductions) will also apply to the north basin of Lake
Winnipeg, despite ~50% lower ambient TN and TP concentrations (MWS unpublished
data), as most of the nutrients enter that site from the south basin.
Finally, we caution that failure to immediately reduce P influx may initiate a final
transition in lake state from buoyant N2-fixing Aphanizomenon and Anabaena to
potentially toxic, but low-light adapted cyanobacteria (Planktothrix, Microcystis,
Cylindrospermopsis) due to continued pollution with N, as has occurred in the Canadian
Prairies (Patoine et al. 2006; Leavitt et al. 2007), Europe (Scheffer et al. 1990; Bunting et
al. 2007), China (Paerl and Scott 2010; Xu et al. 2010), and elsewhere. These turbid
polymictic lakes usually lie in catchments with P-rich soils due to natural geology or
prolonged agriculture (Carpenter 2005), accumulate >50 μg P L-1
as bioavailable SRP
during summer despite greatly elevated cyanobacterial biomass, and exhibit highly
significant correlations (r2 >0.7) between total algal biomass and N influx, but not P
supply, in long-term (>20 yr) monitoring studies (e.g., Bunting et al. 2007). In addition,
several of these sites have paleolimnological time series which demonstrate that
diazotrophic cyanobacteria are replaced within decades by potentially toxic cyanobacteria
38
due to continued pollution of P-rich systems with N (Leavitt et al. 2006; Bunting et al.
2007). As demonstrated by three years of month-long, large-scale (>3000 L) mesocosm
experiments, pollution of P-rich polymictic lakes with reduced N (urea, NH3) can
suppress N2-fixing Aphanizomonen and Anabaena but increase total biomass and toxicity
of Microcystis and Planktothrix by up to 400% when lakes have >50 μg SRP L-1
and
dissolved N : P <20 : 1 (Finlay et al. 2010). Unfortunately, monitoring since 1992
demonstrates that southern Lake Winnipeg now exhibits these same characteristics,
suggesting that the lake is already subject to damage by N pollution and that there may be
substantial benefits to reducing both N and P influx (Paerl and Scott 2010).
39
References
ADRIAN, R., AND OTHERS. 2009. Lakes as sentinels of climate change. Limnol. Oceanogr.
54: 2283-2297.
AGRICULTURE AND AGRIFOOD CANADA (AAC). 1997. Investing in Canada’s Hog and
Pork Industry. www.aeis.agr.ca/misb/aisd/redmeat.
ALLAN, R. J. 1980. The inadequacy of existing chlorophyll a/phosphorus concentration
correlations for assessing remedial measures of hypertrophic lakes. Environ. Pollut. Ser.
B.1: 217-231.
ANDERSON, C., AND G. CABANA. 2005. 15N in riverine food webs: Effects of N inputs
from agricultural watersheds. Can. J. Fish. Aquat. Sci. 62: 333-340.
APPLEBY, P. G., P. J. NOLAN, D. W. GIFFORD, M. J. GODFREY, F. OLDFIELD, N. J.
ANDERSON, AND R. W. BATTARBEE. 1986. 210
Pb dating by low background gamma
counting. Hydrobiologia 143: 21-27.
BAJKOV, A. 1930. Biological conditions of Manitoba lakes. Contrib. Can. Biol. Fish. 5:
383-422.
BAJKOV, A. 1934. The plankton of Lake Winnipeg drainage system. Int. Rev. Gesamt.
Hydrobiol. Hydrograph 31: 239-272.
BENNETT, E. M., S. R. CARPENTER, AND N. F. CARACO. 2001. Human impact on erodible
phosphorus and eutrophication: A global perspective. Bioscience 51: 227-234.
BINFORD, M.W. 1990. Calculation and uncertainty analysis of 210
Pb dates for PIRLA
project lake sediment cores. J. Paleolimnol. 3: 253-269.
40
BORCARD, D., P. LEGENDRE, AND P. DRAPEAU. 1992. Partialling out the spatial
component of ecological variation. Ecology 73: 1045-1055.
BOURNE, A., N. ARMSTRONG, AND G. JONES. 2002. A preliminary estimate of total
nitrogen and total phosphorus loading to streams in Manitoba, Canada. Manitoba
Conservation Report 2002-04. Winnipeg, MB, Canada. 49pp.
BRADSHAW, B., H. DOLAN, AND B. SMIT. 2004. Farm-level adaptation to climate
variability and change: Crop diversification in the Canadian prairies. Climate Change 67:
119-141.
BRUNSKILL, G. J. 1973. Rates of supply of nitrogen and phosphorus to Lake Winnipeg,
Manitoba, Canada. Int. Verein. Theor. Angew. Limnol. Verhandl. 18: 1755-1759.
BRUNSKILL, G. J., AND B. W. GRAHAM. 1979. The offshore sediments of Lake
Winnipeg. Can. Fish. Mar. Serv. MS Report 1540, 75 p.
BRUNSKILL, G. J., P. CAMPBELL, AND S. E. M. ELLIOTT. 1979. Temperature, oxygen,
conductance and dissolved major elements in Lake Winnipeg. Can. Fish. Mar. Serv. MS
Report 1526, 127 p.
BRUNSKILL, G. J., S. E. M. ELLIOTT, AND P. CAMPBELL. 1980. Morphometry, hydrology,
and watershed data pertinent to the limnology of Lake Winnipeg. Canadian MS Report
Fish. Aquat. Sci. 1556. 39 pp.
BUNTING, L., P. R. LEAVITT, C. E. GIBSON, E. J. MCGEE, AND V. A. HALL. 2007.
Degradation of water quality in Lough Neagh, Northern Ireland, by diffuse nitrogen flux
from a phosphorus-rich catchment. Limnol. Oceanogr. 52: 354-369.
41
BUNTING, L., P. R. LEAVITT, R. P. WEIDMAN, AND R. D. VINEBROOKE. 2010. Regulation
of the nitrogen biogeochemistry of mountain lakes by subsidies of terrestrial dissolved
organic matter and the implications for climate studies. Limnol. Oceanogr. 55: 333-345.
CARPENTER, S. R. 2003. Regime shifts in lake ecosystems: Patterns and variation.
International Ecology Institute, Oldendorf, Germany.
CARPENTER, S. R. 2005. Eutrophication of aquatic ecosystems: Bistability and soil
phosphorus. Proc. Natl. Acad. Sci. USA. 102: 10002-10005.
CARPENTER, S. R., AND W. A. BROCK. 2006. Rising variance: A leading indicator of
ecological transition. Ecol. Lett. 9: 311-318.
CARPENTER, S. R., N. F. CARACO, D. L. CORRELL, R. W. HOWARTH, A. N. SHARPLEY, AND
V. H. SMITH. 1998. Nonpoint pollution of surface waters with phosphorus and nitrogen.
Ecol. Appl. 8: 559-568.
COTTINGHAM, K. L., J. A. RUSAK, AND P. R. LEAVITT. 2000. Increased ecosystem
variability and reduced predictability following fertilization: Evidence from
palaeolimnology. Ecol. Lett. 3: 340-348.
CROWE, J. M. E. 1973. Limnology of the south basin of Lake Winnipeg, March 1965-
March 1969: Manitoba Department of Mines and Environmental Management, Research
Branch MS Report 73-24, 37 p.
CRUMPTON, W. G. 1987. A simple and reliable method for making permanent mounts of
phytoplankton for light and fluorescence microscopy. Limnol. Ocanogr. 32: 1154–1159.
CUDDINGTON, K., AND P. R. LEAVITT. 1999. An individual-based model of pigment flux
in lakes: Implications for organic biogeochemistry and paleoecology. Can. J. Fish. Aquat.
Sci. 56: 1964-1977.

42
CUMMING, B. F., S. E. WILSON, R. I. HALL, AND J. P. SMOL. 1995. Diatoms from British
Columbia (Canada) lakes and their relationship to salinity, nutrients, and other
limnological variables. Biblioth. Diatomol. Band 31. Gebrüder Bornträger, Berlin.
DEARING, J. A., AND R. T. JONES. 2003. Coupling temporal and spatial dimensions of
global sediment flux through lake and marine sediment records. Glob. Planet. Change 39:
147-168.
DRÖSCHER, I., A. PATOINE, K. FINLAY, AND P. R. LEAVITT. 2009. Climate control of the
spring clear-water phase through the transfer of energy and mass to lakes. Limnol.
Oceanogr. 54: 2469-2480.
ENGSTROM, D. R., J. E. ALMENDINGER, AND J. A. WOLIN. 2009. Historical changes in
sediment and phosphorus loading to the upper Mississippi River: Mass-balance
reconstruction from the sediments of Lake Pepin. J. Paleolimnol. 41: 563-588.
ENGSTROM, D. R., AND H. E. WRIGHT. 1984. Chemical stratigraphy of lake sediments as a
record of environmental change. p. 11-67, in E. Y. Haworth and J. W. J. Lund [eds.],
Lake sediments and environmental history. University of Minnesota Press.
ENGSTROM, D. R., S. P. SCHOTTLER, P. R. LEAVITT, AND K. E. HAVENS. 2006. A
reevaluation of the cultural eutrophication of Lake Okeechobee using multi-proxy
sediment records. Ecol. Applic. 16: 1194-1206.
FINLAY, K., A. PATOINE, D. B. DONALD, M. J. BOGARD, AND P. R. LEAVITT. 2010.
Experimental evidence that pollution with urea can degrade water quality in phosphorus-
rich lakes of the Northern Great Plains. Limnol. Oceanogr. 55: 1213-1230.

43
FOY, R. H., J. S. BAILEY, AND S. D. LENNOX. 2002. Mineral balances for the use of
phosphorus and other nutrients by agriculture in Northern Ireland from 1925-2000 –
Methodology, trends, and impacts of losses to water. Ir. J. Agric. Food Res. 41: 247-263.
GRIMM, E. 1987. CONISS: A FORTRAN 77 program for stratigraphically constrained
cluster analysis by the methods of incremental sum of squares. Comp. Geosci. 13: 13-35.
HALL, R. I., AND J. P. SMOL. 1992. A weighted averaging regression and calibration
model for inferring total phosphorus concentration from diatoms in British-Columbia
(Canada) lakes. Freshwat. Biol. 27: 417-434.
HALL, R. I., P. R. LEAVITT, R. QUINLAN, A. S. DIXIT, AND J. P. SMOL. 1999. Effects of
agriculture, urbanization, and climate on water quality in the northern Great Plains.
Limnol. Oceanogr. 44: 739-756.
HECKY, R. E., H. J. KLING, AND G. J. BRUNSKILL. 1986. Seasonality of phytoplankton in
relation to silicon cycling and interstitial water circulation in large, shallow lakes of
central Canada. Hydrobiol. 138: 117-126.
HONEY, J. AND B. OLESON. 2006. A century of agriculture in Manitoba. Department of
Agribusiness and Agricultural Economics, Occasional publication, University of
Manitoba. http://www.umanitoba.ca/afs/agric_economics/Century/
ACenturyofAgriculture.PDF
HYATT, C. V., A. M. PATERSON, K. M. RÜHLAND, AND J. P.SMOL. 2011. Examining 20th
century water quality and ecological changes in the Lake of the Woods, Ontario, Canada:
A paleolimnological investigation. J. Great Lakes Res. 37: In press.

44
JEPPESEN, E., AND OTHERS. 2005. Lake responses to reduced nutrient loading – an
analysis of contemporary long-term data from 35 case studies. Freshwat. Biol. 50:
1747–1771.
JONES, G., AND N. ARMSTRONG. 2001. Long-term trends in total nitrogen and total
phosphorus concentrations in Manitoba streams. Water Quality Management Section,
Water Branch, Manitoba Conservation, Winnipeg, MB. Manitoba Conservation Report
No. 2001-07. 154 pp.
JUGGINS, S. 2003. C2 software for ecological and palaeoecological data analysis and
visualization user guide version 1.3. University of Newcastle.
KLING, H. J. 1998. A summary of past and recent plankton of Lake Winnipeg, Canada
using algal fossil remains. J. Paleolimnol. 19: 297-307.
KOROL, M. 2002. Canadian fertilizer consumption, shipments and trade 2001/2002.
Agriculture and Agri-Food Canada Strategic Policy Branch. www.agr.ca
KOROL, M., AND G. RATTRAY. 1999. Canadian fertilizer consumption, shipping and trade
1997/1998. Agriculture and Agri-Food Canada Strategic Policy Branch. Report.
www.agr.ca
LAIRD, K. R., AND B. F. CUMMING. 2009. Diatom-inferred lake level from near-shore
cores in a drainage lake from the Experimental Lakes Area, northwestern Ontario,
Canada. J. Paleolimnol. 42: 65-80.
LAKE WINNIPEG IMPLEMENTATION COMMITTEE (LWIC). 2006. Restoring the health of
Lake Winnipeg. Main Report and Technical Annex. Lake Winnipeg Implementation
Committee, Winnipeg, Manitoba. 60 pp.

45
LEAVITT, P. R., AND D. A. HODGSON. 2001. Sedimentary pigments. p. 295-325, in J. P.
Smol, H. J. B. Birks, and W. M. Last [eds.], Tracking environmental change using lake
sediments. V. 3: Terrestrial, algal and siliceous indicators. Kluwer.
LEAVITT, P. R., C. S. BROCK, C. EBEL, AND A. PATOINE. 2006. Landscape-scale effects
of urban nitrogen on a chain of freshwater lakes in central North America. Limnol.
Oceanogr. 51: 2262-2277.
LEAVITT, P. R. AND OTHERS. 2009. Paleolimnological evidence of the effects on lakes of
energy and mass transfer from climate and humans. Limnol. Oceanogr. 54: 2330-2348.
LOGAN, T. J., T. O. OLOYA, AND S. YAKSICH. 1979. Phosphate characteristics and
bioavailablity of suspended sediments from streams draining into Lake Erie. J. Great
Lakes Res. 5:112-123.
LOWE, C. W. 1924. The freshwater algae of Canada. Trans. Roy. Soc. Can. XVIII, 48 pp.
MANITOBA AGRICULTURE AND FOOD. 2010. Pork in Manitoba. Government of Manitoba
www.gov.mb.ca/agriculture/livestock.
MANITOBA WATER STEWARDSHIP (MWS). 2006. Questions and answers: Water quality
management zones for nutrients. A proposed regulation under the Water Protection Act.
Manitoba Government.
MARTIN, L., Z. KRUJA, AND A. ALEXIOU. 1999. Prospects of hog production and
processing in Canada: Update. The George Morris Centre. Guelph, Ontario. 46 pp.
http://www.georgemorris.org/aspx/Public/Utils/DbFileViewerPopup.aspx?FileID=79
MAYER, T., S. L. SIMPSON, L. H. THORLEIFSON, W. L. LOCKHART, AND P. WILKINSON.
2006. Phosphorus geochemistry of recent sediments in the South Basin of Lake
Winnipeg. Aquat. Ecosyst. Health Manage. 9: 307-318.

46
MCGOWAN, S., P. R. LEAVITT, R. I. HALL, N. J. ANDERSON, E. JEPPESEN, AND B.V
ODGAARD. 2005. Controls of algal abundance and community composition during
ecosystem state change. Ecology 86: 2200-2211.
MICHELS, A., K. R. LAIRD, S. E. WILSON, D. THOMSON, P. R. LEAVITT, R. J. OGLESBY,
AND B. F. CUMMING. 2007. Multi-decadal to millennial-scale shifts in drought conditions
on the Canadian Prairies over the past six millennia: Implications for future drought
assessment. Global Change Biol. 13: 1295–1307.
NOVEK, J. 2003. Intensive hog farming in Manitoba: Transnational treadmills and local
conflicts. Can. Rev. Sociol. Anthropol. 40: 3-26.
PATALAS, K., AND A. SALKI. 1992. Crustacean plankton in Lake Winnipeg: Variations in
space and time as a function of lake morphology, geology, and climate. Can. J. Fish.
Aquat. Sci. 49: 1035-1059.
PATOINE, A., M., D. GRAHAM, AND P. R. LEAVITT. 2006. Spatial variation in nitrogen
fixation in lakes of the northern Great Plains. Limnol. Oceanogr. 51: 1665-1677.
PAERL, H. W., AND J. T. SCOTT. 2010. Throwing fuel on the fire: Synergistic effects of
excessive nitrogen inputs and global warming on harmful algal blooms. Env. Sci.
Technol. 44: 7756-7758.
PHAM, S. V., P. R. LEAVITT, S. MCGOWAN, AND P. PERES-NETO. 2008. Spatial variability
of climate and land-use effects on lakes of the northern Great Plains. Limnol. Oceanogr.
53: 728-742.
PHAM, S. V., P. R. LEAVITT, S. MCGOWAN, B. WISSEL, AND L. I. WASSENAAR. 2009.
Spatial and temporal variability of prairie lake hydrology as revealed using stable
isotopes of hydrogen and oxygen. Limnol. Oceanogr. 54: 101-118.
47
SAVAGE, C., P. R. LEAVITT, AND R. ELMGREN. 2004. Distribution and retention of sewage
nitrogen in surface sediments of a coastal bay. Limnol. Oceanogr. 49: 1503-1511.
SAVAGE, C., P. R. LEAVITT, AND R. ELMGREN. 2010. Effects of land use, urbanization,
and climate variability on coastal eutrophication in the Baltic Sea. Limnol. Oceanogr. 55:
1033-1046.
SCHEFFER, M., AND S. R. CARPENTER. 2003. Catastrophic regime shifts in ecosystems:
Linking theory to observation. Trends Ecol. Evol. 18: 648-656.
SCHEFFER, M., S. R. CARPENTER, J. A. FOLEY, C. FOLFE, AND B. WALKER. 2001.
Catastrophic shifts in ecosystems. Nature 413: 591-596.
SCHEFFER, M., S. RINALDI, A. GRAGNANI, L. R. MUR, AND E. H. VAN NES. 1990. On the
dominance of filamentous cyanobacteria in shallow, turbid lakes. Ecology 78: 272-282.
SCHELSKE, C. L., A. PEPLOW, M. BRENNER, AND C. N. SPENCER. 1994. Low-background
gamma counting: Applications for 210
Pb dating of sediments. J. Paleolimnol. 10: 115-
128.
SCHINDLER, D.W. 1977. Eutrophication and recovery in experimental lakes: Implications
for lake management. Science 184: 897-899.
SCHINDLER, D. W. 2006. Recent advances in understanding and management of
eutrophication. Limnol. Oceanogr. 51: 377-384.
SCHNAIBERG, A. AND K. GOULD. 1994. Environment and society: The enduring conflict.
St. Martin’s Press.
SMITH, R. E., H. VELDHUIS, G. F. MILLS, R. G. EILERS, W. R. FRASER, AND G. W. LELYK.
1998. Terrestrial ecozones, ecoregions, and ecodistricts of Manitoba. An ecological
stratification of Manitoba’s natural landscapes. Tech Bulletin 98-9E. Land Resource

48
Unit, Brandon Research Centre, Research Branch, Agriculture and Agri-Food Canada.
Winnipeg, Manitoba.
SMITH, V. H. 2003. Eutrophication of freshwater and coastal marine ecosystems – a
global problem. Environ. Sci. Pollut. Res. 10: 126-139.
SMITH, R. V., S. D. LENNOX, C. JORDAN, R. H. FOY, AND E. MCHALE. 1995. Increase in
soluble phosphorus transported in drainflow from a grassland catchment in response to
soil phosphorus accumulation. Soil Use Manag. 11: 204-209.
STATISTICS CANADA. 1871-2006. Census data. Minister of Supply and Services.
Government of Canada, Ottawa.
TER BRAAK, C. J. F. 1986. Canonical correspondence analysis: A new eigenvector
technique for multivariate direct gradient analysis. Ecology 67: 1167-1179.
TER BRAAK, C. J. F. 1988. Partial correspondence analysis. p. 551-558, in H. H. Brock
[ed.], Classification and related methods of data analysis. North Holland.
TER BRAAK, C. J. F. 1990. CANOCO: A FORTRAN program for canonical community
ordination. Microcomputer Power.
THORLEIFSON, H., E. NIELSON [EDS.]. 1996. Lake Winnipeg Project: Cruise report and
scientific results. Geological Survey of Canada – Open File Report 3470.
TRIPLETT, L. D., D. R. ENGSTROM, AND M. B. EDLUND. 2009. A whole-basin stratigraphic
record of sediment and phosphorus loading to the St. Croix River, USA. J. Paleolimnol.
41: 659-677.
UPPER ASSINIBOINE RIVER BASIN STUDY COMMITTEE (UARBSC). 2000. Upper
Assiniboine River basin study: Main report. Environment Canada, Manitoba
Conservation, and SaskWater Corporation. 125 pp.
49
VANDER ZANDEN, M. J., Y. VADEBONCOEUR, M. W. DIEBEL, AND E. JEPPESEN. 2005.
Primary consumer stable isotopes as indicators of nutrient source. Environ. Sci. Technol.
39: 7509-75115.
VENEMA H. 2006. The Canadian Prairies: Biophysical and socio-economic context. P.
79–96, In: Designing policies in a world of uncertainty, change and surprise. International
Institute for Sustainable Development and the Energy and Resources Institute, Winnipeg
and New Delhi, http://www.iisd.org/publications/pub.aspx?pno=840.
VITOUSEK, P. M., AND OTHERS. 1997. Human alteration of the global nitrogen cycle:
Sources and consequences. Ecol. Applic. 7: 737-750.
VOGT, R. J., J. A. RUSAK, A. PATOINE, AND P. R. LEAVITT. 2011. Differential effects of
energy and mass influx on the landscape synchrony of lake ecosystems. Ecology 92:
DOI10.1890/10-1846.1.
WILKINSON, P., AND S. L. SIMPSON. 2003. Radiochemical analysis of Lake Winnipeg 99-
900 cores 4 and 6. p. 91-119, in S. L. Simpson, L. H. Thorleifson, C. F. Michael Lewis,
and J. W. King [eds.], 1999 Lake Winnipeg project: Cruise report and scientific results.
Geological Survey of Canada Open File 4196.
WILLIAMS, J. D., T. MAYER AND J. O. NRIAGU. 1980. Extractability of phosphate minerals
common in soils and sediments. Soil Sci. Soc. Am. J. 44: 462-265.
XU, H., H. W. PAERL , B. Q. QIN, G. W. ZHU, AND G. GAO. 2010. Nitrogen and
phosphorus inputs control phytoplankton growth in eutrophic Lake Taihu, China. Limnol.
Oceanogr. 55: 420-432.

Table 1. Physical characteristics of Lake Winnipeg, modified from Brunskill et al. (1980).
North Basin Narrows South Basin Entire Lake
Latitude (oN) 50
o00’-53
o50’
Longitude (oW) 96
o15’-99
o15’
Surface area, A0 (km2) 17520 3450 2780 23750
Volume (km3) 232.4 24.6 27.0 284
Mean depth (m) 13.3 7.2 9.7 12.0
Maximum depth (m) 19.0 61.0 14.0 36.0
Maximum length (m) 232 143 93 436
Maximum breadth (m) 111 30 46 111
Shoreline (km) 761 640 349 1750
Shoreline/ A0 0.043 0.19 0.13 0.074
Development of Shoreline 1.6 3.1 1.9 3.2
Development of Volume 2.1 0.6 2.1 1.0
Mean depth/Maximum depth 0.70 0.20 0.69 0.33
Relative depth (%) 0.013 0.054 0.024 0.021
Mean hydraulic residence (yr) 0.57 3.28

57
Table 2. Estimated mean annual total phosphorus (TP) and nitrogen (TN) influx to Lake Winnipeg 1994–2001 (tonnes yr1
rounded to
nearest 100 tonnes) (Bourne et al. 2002, MWS unpublished data). Natural background and undefined sources include influx from
forests, wildlife, and septic fields. Internal processes include gross N2 fixation only, not denitrification (L. Hendzel, Fisheries and
Oceans Canada, unpublished data). SK = Saskatchewan, MB = Manitoba, ON = Ontario.
Category TP %TP (%MB sources) TN %TN (% MB sources)
Upstream jurisdictions 4,200 53 48,900 51
US (Red R) 2,500 32 19,000 20
US (Souris R) 200 3 1,100 1
SK and AB (Assiniboine and
Saskatchewan R)
400 5 8,300 9
ON (Winnipeg R) 800 10 16,800 17
ON (Other R)
300 3 3,700 4
MB Sources 3,700 47 47,100 49
MB Point Sources 700 9 (19) 5,100 5 (11)
City of Winnipeg 400 5 (11) 3,700 4 (8)
Other wastewater sources) 300 4 (8) 1,400 1 (3)
MB Watershed Processes 2500 32 (67) 23,200 24 (49)
Natural background and
undefined sources
1,300 17 (35) 18,100 19 (38)
Present agriculture 1,200 15 (32) 5,100 5 (11)
Atmospheric deposition 500 6 (14) 9,500 10 (20)
Internal lake processes n/a n/a 9,300 10 (20)
Total annual load 7,900 100 96,000 100
Figure Legends
Fig. 1. Catchment area (grey shading) of Lake Winnipeg, Manitoba, Canada. This lake
is the largest water body in Manitoba (MB), and receives drainage mainly from
Canadian provinces of Alberta (AB), Saskatchewan (SK), and Ontario (ON), and
US states of Minnesota (MN) and North Dakota (ND). Urban centers with
>200,000 inhabitants indicated with white open circles, and include the City of
Winnipeg (pop. 750,000) in MB. Lake location within North America in upper
left inset, location of three cores within south basin of Lake Winnipeg in upper
right inset. See Site Description for land use, soil, and hydrological details.
Fig. 2. Specific activities (Bq g-1
dry mass) of (a) 210
Pb and (b) 137
Cs in three cores from
southern Lake Winnipeg as a function of burial depth. (c) Relationship between
sediment age estimates from constant rate of supply calculation and 210
Pb
activities for Cores 1 (closed circle, solid line), 2 (open circle, dashed line), and 3
(open square, fine line). Core locations are separated by 35 km (Fig. 1 inset).
Fig. 3. Time series of whole-sediment (a) nitrogen (N) isotopes (15N, ‰), (b) N content
(% dry mass), (c) carbon (C) isotopes (13C, ‰), and (d) C content (% dry mass)
during 1800-2010 for three sediment cores from southern Lake Winnipeg.
Symbols and lines as in Fig. 2.
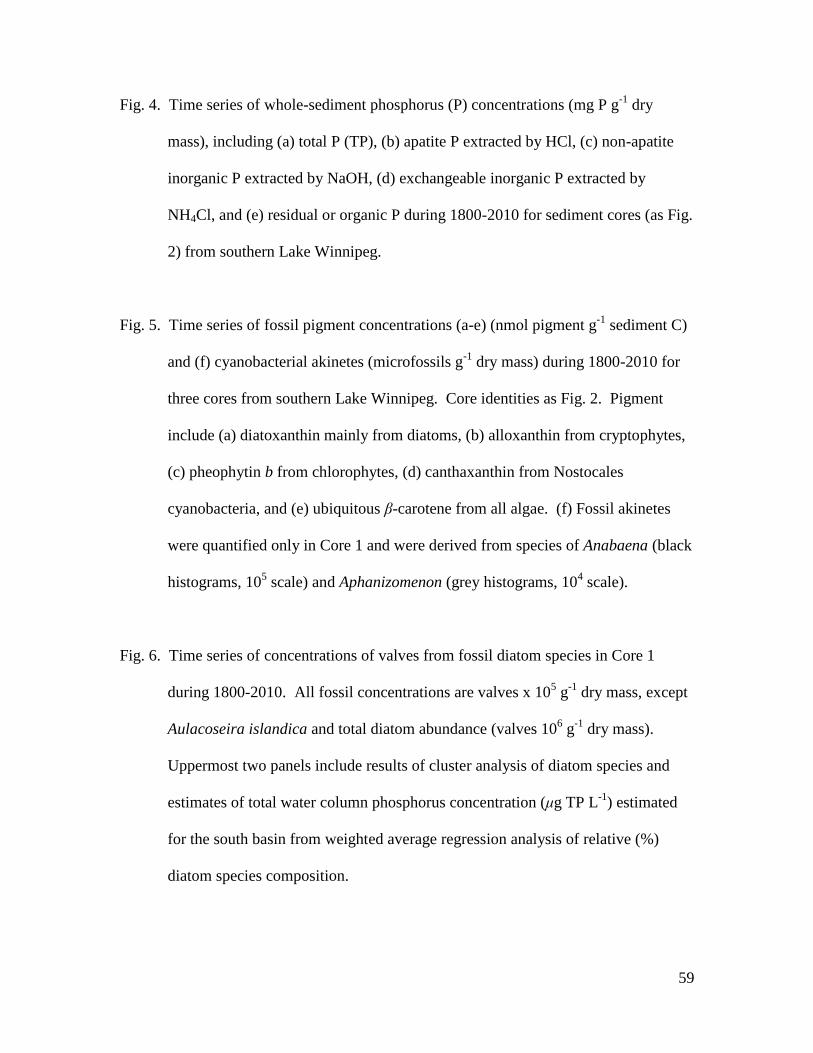
59
Fig. 4. Time series of whole-sediment phosphorus (P) concentrations (mg P g-1
dry
mass), including (a) total P (TP), (b) apatite P extracted by HCl, (c) non-apatite
inorganic P extracted by NaOH, (d) exchangeable inorganic P extracted by
NH4Cl, and (e) residual or organic P during 1800-2010 for sediment cores (as Fig.
2) from southern Lake Winnipeg.
Fig. 5. Time series of fossil pigment concentrations (a-e) (nmol pigment g-1
sediment C)
and (f) cyanobacterial akinetes (microfossils g-1
dry mass) during 1800-2010 for
three cores from southern Lake Winnipeg. Core identities as Fig. 2. Pigment
include (a) diatoxanthin mainly from diatoms, (b) alloxanthin from cryptophytes,
(c) pheophytin b from chlorophytes, (d) canthaxanthin from Nostocales
cyanobacteria, and (e) ubiquitous β-carotene from all algae. (f) Fossil akinetes
were quantified only in Core 1 and were derived from species of Anabaena (black
histograms, 105 scale) and Aphanizomenon (grey histograms, 10
4 scale).
Fig. 6. Time series of concentrations of valves from fossil diatom species in Core 1
during 1800-2010. All fossil concentrations are valves x 105 g
-1 dry mass, except
Aulacoseira islandica and total diatom abundance (valves 106 g
-1 dry mass).
Uppermost two panels include results of cluster analysis of diatom species and
estimates of total water column phosphorus concentration (μg TP L-1
) estimated
for the south basin from weighted average regression analysis of relative (%)
diatom species composition.
60
Fig. 7. Percent variation in fossil pigment concentrations (as in Fig. 5), C and N isotopes
(‰), and C and N content (%) in sediments of Core 1 during 1901-1992
explained by redundancy (RDA) analysis of (a) climate variables alone (white
histogram), (b) livestock variables alone (grey histogram), or (c) agriculture
(crop) production variables alone (black histogram), or by (d) variance
partitioning analysis of climate (C, white), crop production (A, black), and
livestock production (L, grey), their first-order (A × L, C × L, A × C), and second
order (A × L ×C) interactions. Note both C × L and A × C interactions explained
<0.3% of historical variation in lake production parameters.
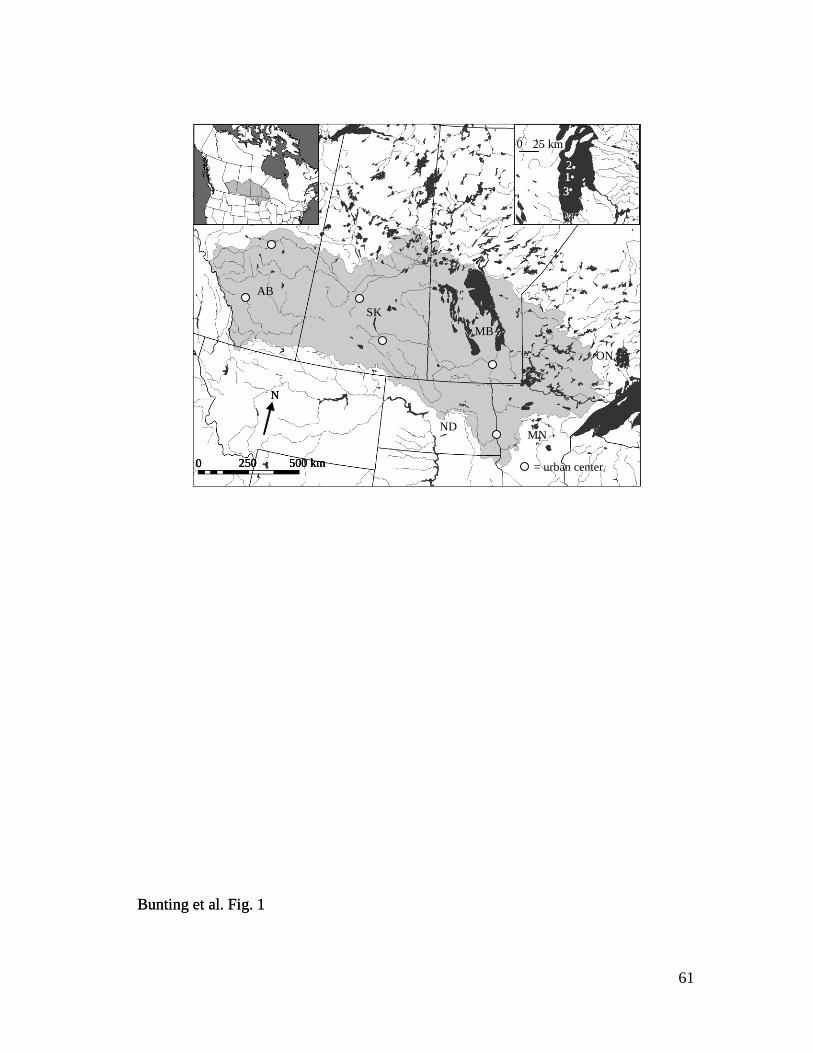
61
Bunting et al. Fig. 1
500 km0 250
N
12
3
AB
SK
MB
ON
NDMN
= urban center
0 25 km
Bunting et al. Fig. 1
500 km0 250
N
12
3
AB
SK
MB
ON
NDMN
= urban center
0 25 km
500 km0 250
N
500 km0 250 500 km0 250
N
12
3
12
3
AB
SK
MB
ON
NDMN
= urban center
0 25 km
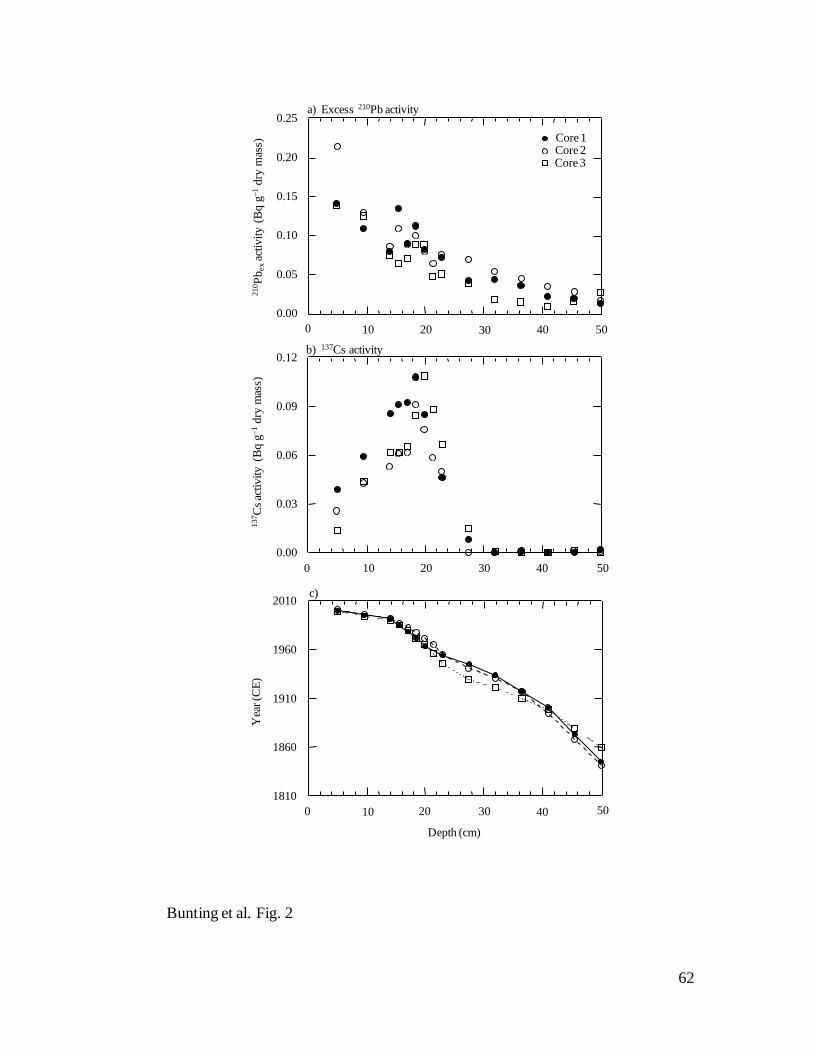
62
b) 137Cs activity
0.03
0.06
0.09
0.12
137C
s ac
tiv
ity
(B
q g
1
dry
mas
s)
0 10 20 30 40 50
0.00
a) Excess 210Pb activity
0.00
0.05
0.10
0.15
0.20
0.25
21
0P
be
xac
tivit
y (
Bq
g
1dry
mas
s)
Core 1Core 2Core 3
0 10 20 30 40 50
Depth (cm)
0
1810
1860
1910
1960
2010
Yea
r (C
E)
10 20 30 40 50
c)
Bunting et al. Fig. 2
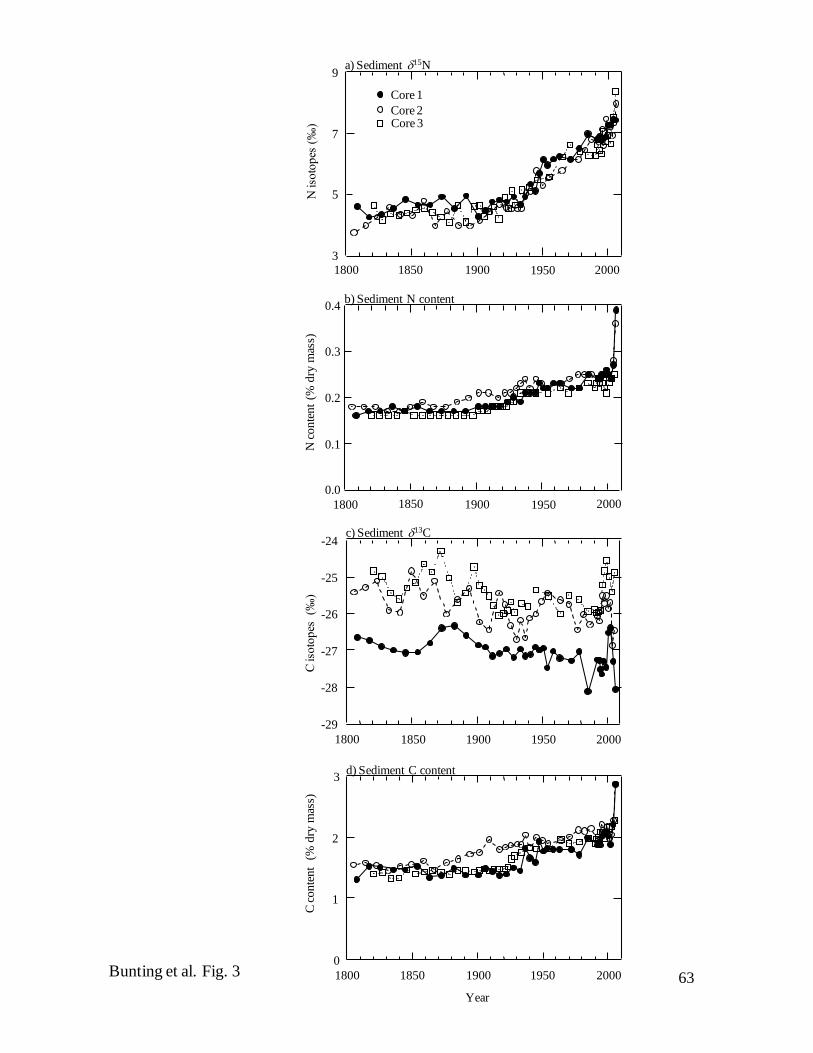
63 Bunting et al. Fig. 3
Core 1
Core 2Core 3
3
5
7
9a) Sediment 15N
1800 1850 1900 1950 2000
N is
oto
pes
(‰
)b) Sediment N content
0.0
0.1
0.2
0.3
0.4
1800 1850 1950 20001900
N c
on
tent
(% d
ry m
ass)
-29
-28
-27
-26
-25
-24
1900
c) Sediment 13C
1800 1850 1950 2000
C is
oto
pes
(‰
)
0
1
2
3d) Sediment C content
1800 1850 1900 1950 2000
Year
C c
onte
nt
(%
dry
mas
s)
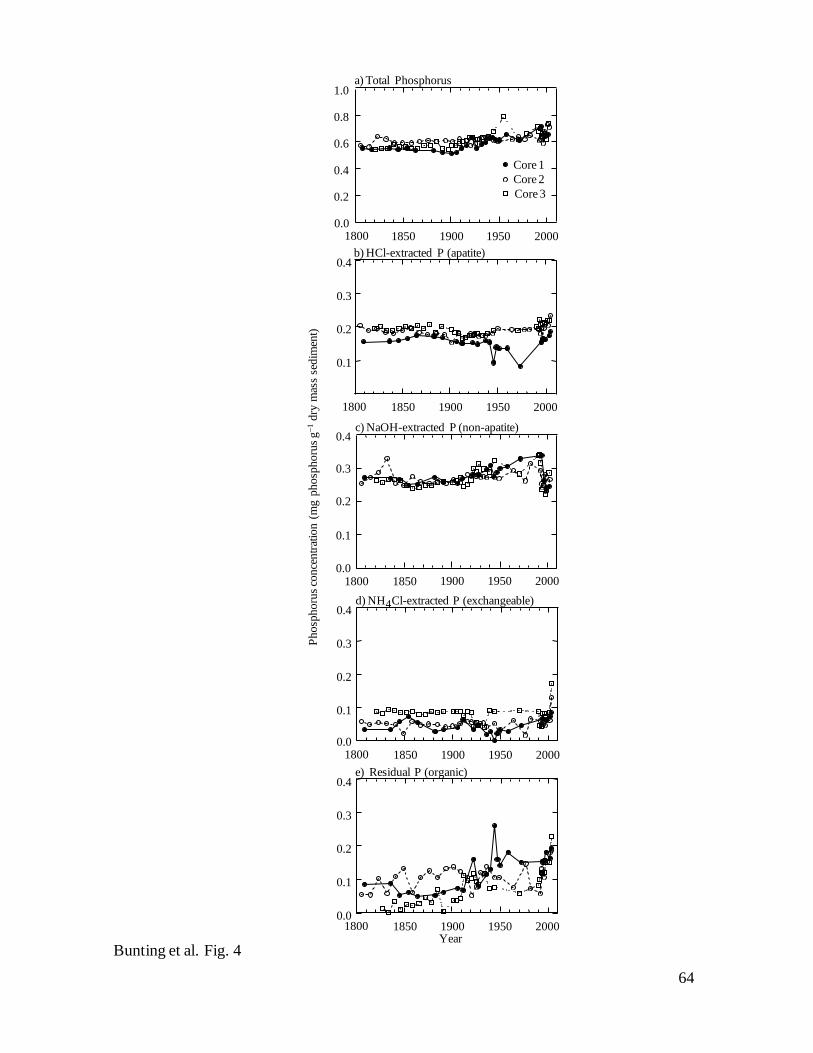
64
Bunting et al. Fig. 4
Ph
osp
ho
rus
con
cen
trat
ion
(m
g p
ho
sph
oru
s g1
dry
mas
s se
dim
ent)
a) Total Phosphorus
1800 1850 1900 1950 20000.0
0.2
0.4
0.6
0.8
1.0
Core 1
Core 3
Core 2
0.0
0.1
0.2
0.3
0.4
1800 1850 1900 1950 2000
c) NaOH-extracted P (non-apatite)
b) HCl-extracted P (apatite)
0.1
0.2
0.3
0.4
1800 1850 1900 1950 2000
d) NH4Cl-extracted P (exchangeable)
1800 1850 1900 1950 20000.0
0.1
0.2
0.3
0.4
e) Residual P (organic)
Year1800 1850 1900 1950 2000
0.0
0.1
0.2
0.3
0.4
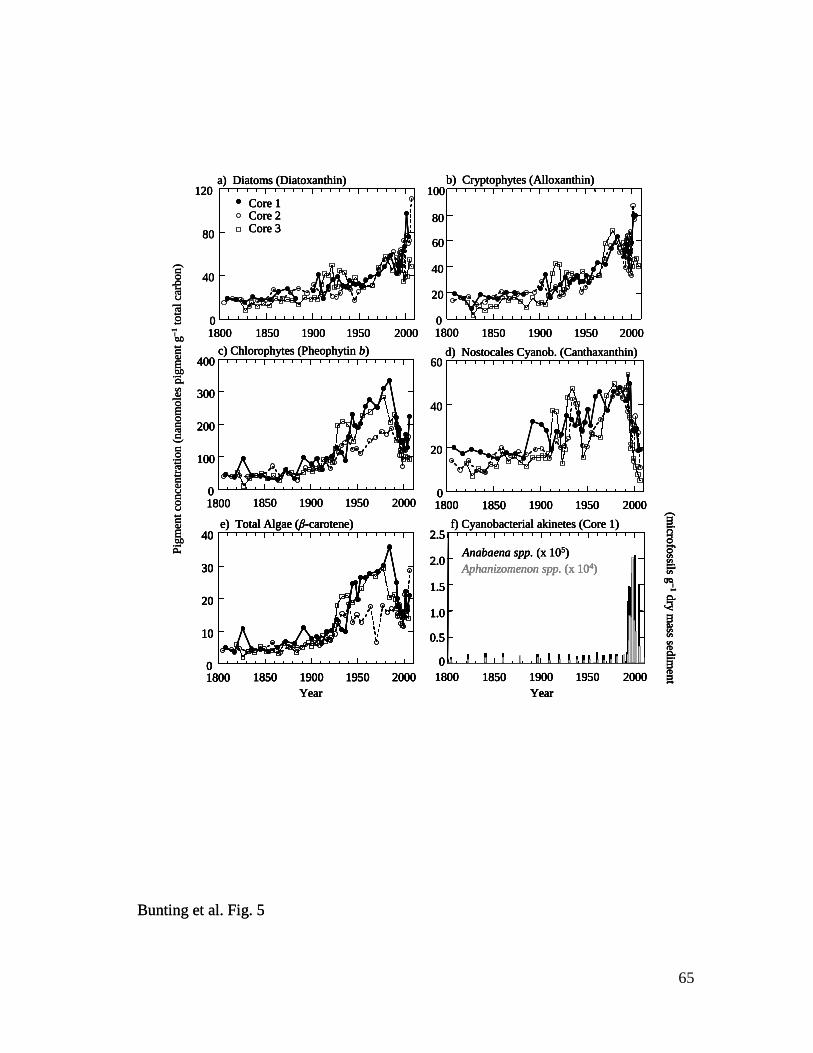
65
Bunting et al. Fig. 5
a) Diatoms (Diatoxanthin)
0
40
80
120
1800 1850 1900 1950 2000
Core 1Core 2Core 3
b) Cryptophytes (Alloxanthin)
0
20
40
60
80
100
1800 1850 1900 1950 2000
0
100
200
300
400c) Chlorophytes (Pheophytin b)
1800 1850 1900 1950 2000
20
40
60d) Nostocales Cyanob. (Canthaxanthin)
01800 1850 1900 1950 2000
40
0
10
20
30
1800 1850 1900 1950 2000
e) Total Algae (β-carotene)
Year
Pig
men
t co
nce
ntr
atio
n (
nan
om
ole
sp
igm
ent
g
1to
tal
carb
on
)
Year
0
0.5
1.0
1.5
2.0
2.5
1800 1850 1900 1950 2000
Anabaena spp. (x 105)
Aphanizomenon spp. (x 104)
(micro
fossils g
1
dry
mass sed
imen
t
f) Cyanobacterial akinetes (Core 1)
Bunting et al. Fig. 5
a) Diatoms (Diatoxanthin)
0
40
80
120
1800 1850 1900 1950 2000
Core 1Core 2Core 3
b) Cryptophytes (Alloxanthin)
0
20
40
60
80
100
1800 1850 1900 1950 2000
0
100
200
300
400c) Chlorophytes (Pheophytin b)
1800 1850 1900 1950 2000
20
40
60d) Nostocales Cyanob. (Canthaxanthin)
01800 1850 1900 1950 2000
40
0
10
20
30
1800 1850 1900 1950 2000
e) Total Algae (β-carotene)
Year
Pig
men
t co
nce
ntr
atio
n (
nan
om
ole
sp
igm
ent
g
1to
tal
carb
on
)
Year
0
0.5
1.0
1.5
2.0
2.5
1800 1850 1900 1950 2000
Anabaena spp. (x 105)
Aphanizomenon spp. (x 104)
(micro
fossils g
1
dry
mass sed
imen
t
f) Cyanobacterial akinetes (Core 1)
a) Diatoms (Diatoxanthin)
0
40
80
120
1800 1850 1900 1950 2000
Core 1Core 2Core 3
a) Diatoms (Diatoxanthin)
0
40
80
120
1800 1850 1900 1950 2000
Core 1Core 2Core 3
b) Cryptophytes (Alloxanthin)
0
20
40
60
80
100
1800 1850 1900 1950 2000
b) Cryptophytes (Alloxanthin)
0
20
40
60
80
100
1800 1850 1900 1950 2000
0
100
200
300
400c) Chlorophytes (Pheophytin b)
1800 1850 1900 1950 20000
100
200
300
400
0
100
200
300
400c) Chlorophytes (Pheophytin b)
1800 1850 1900 1950 2000
20
40
60d) Nostocales Cyanob. (Canthaxanthin)
01800 1850 1900 1950 2000
20
40
60d) Nostocales Cyanob. (Canthaxanthin)
01800 1850 1900 1950 200001800 1850 1900 1950 2000
40
0
10
20
30
1800 1850 1900 1950 2000
e) Total Algae (β-carotene)
Year
40
0
10
20
30
1800 1850 1900 1950 2000
e) Total Algae (β-carotene)40
0
10
20
30
1800 1850 1900 1950 2000
40
0
10
20
30
1800 1850 1900 1950 2000
e) Total Algae (β-carotene)
Year
Pig
men
t co
nce
ntr
atio
n (
nan
om
ole
sp
igm
ent
g
1to
tal
carb
on
)
Year
0
0.5
1.0
1.5
2.0
2.5
1800 1850 1900 1950 2000
Anabaena spp. (x 105)
Aphanizomenon spp. (x 104)
(micro
fossils g
1
dry
mass sed
imen
t
f) Cyanobacterial akinetes (Core 1)
Year
0
0.5
1.0
1.5
2.0
2.5
1800 1850 1900 1950 2000
Year
0
0.5
1.0
1.5
2.0
2.5
0
0.5
1.0
1.5
2.0
2.5
1800 1850 1900 1950 2000
Anabaena spp. (x 105)
Aphanizomenon spp. (x 104)
(micro
fossils g
1
dry
mass sed
imen
t
f) Cyanobacterial akinetes (Core 1)

66
Bunting et al. Fig. 6
Aulacoseira islandica (15.4)
Stephanodiscus minutulus (41.7)
Stephanodiscus medius (18.9)
Rare planktonics (16 taxa)
Stephanodiscus hantzschia (40.1)
Cyclostephanos spp. (33.1, 95.1)
Stephanodiscus parvus (41.7)
Aulacoseira ambigua (37.6)
Stephanodiscus minutulus fo. 1 (41.7)
Aulacoseira subarctica (21.5)
Rare benthic spp. (52 taxa)
Stephanodiscus niagarae (58.5)
Aulacoseira granulata (61.2)
Aulacoseira distans (17.6)
Total diatom abundance
Diatom-inferred TP
1800 1850 1900 1950 2000
0
40
80
40
80
40
80
4
10
20
10
20
20
10
20
10
20
1
10
10
10
50
100
10
20
TP
(µg P
L-1
)(x
10
6g
-1)
Dia
tom
val
ve
conce
ntr
atio
n
(x10
5g
-1)
(x1
06
g-1
)
Year A.D.
200
400
600
800
To
tal su
m
of sq
uar
es Cluster analysis
0
0
0
0
0
0
0
0
0
0
0
0
0
0
0
0
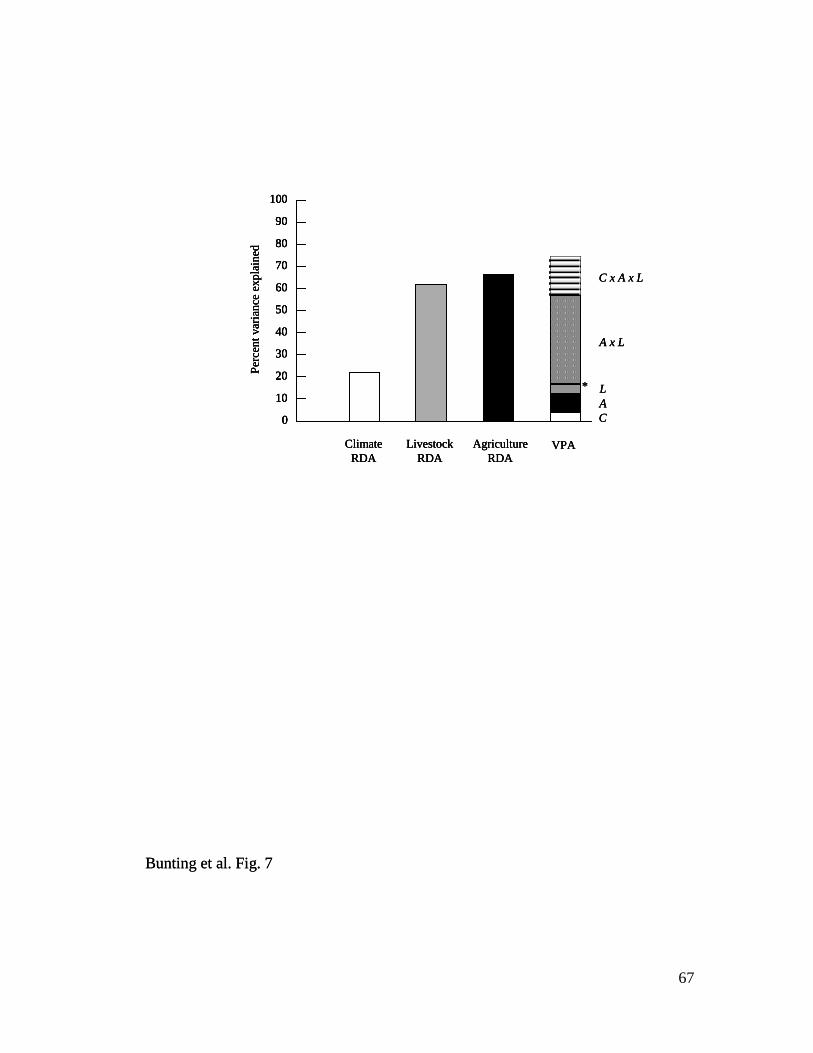
67
Bunting et al. Fig. 7
Climate
RDA
Livestock
RDA
Agriculture
RDAVPA
Per
cen
t var
ian
ce e
xp
lain
ed
0
10
20
30
40
50
60
70
80
90
100
C
A
L
A x L
C x A x L
*
Bunting et al. Fig. 7
Climate
RDA
Livestock
RDA
Agriculture
RDAVPA
Per
cen
t var
ian
ce e
xp
lain
ed
0
10
20
30
40
50
60
70
80
90
100
C
A
L
A x L
C x A x L
*
Climate
RDA
Livestock
RDA
Agriculture
RDAVPA
Per
cen
t var
ian
ce e
xp
lain
ed
0
10
20
30
40
50
60
70
80
90
100
0
10
20
30
40
50
60
70
80
90
100
C
A
L
A x L
C x A x L
*

68
Appendix 1. Explanatory variables included initially in variance partitioning analysis
(VPA). Variables are grouped into climate, livestock, and crops for VPA. Limnological
variables provided by Manitoba Water Stewardship are listed separately. N = Number
of variables within category; DOY–calendar day of year. Year of time series start and end
are indicated for each variable.
Variable name N Start End
Climate
Monthly precip., mm 12 1875 2006
Seasonal precip., mm 4 1875 2006
Annual precip., mm 1 1875 2006
Annual rainfall, mm 1 1875 2006
Mean monthly max temperature, C 12 1875 2006
Mean seasonal max temperature, C 4 1875 2006
Mean monthly min temperature, C 12 1875 2006
Mean seasonal min temperature, C 4 1875 2006
Mean monthly temperature, C 12 1875 2006
Mean seasonal temperature, C 4 1875 2006
Mean annual temperature, C 1 1875 2006
Ice breakup date, Red River at Winnipeg, DOY 1 1870 1995
Ice freeze-up data, Red River at Winnipeg, DOY 1 1870 1981
Ice-free season, Red River at Winnipeg, No. days 1 1870 1981
Annual flow, Black River, cm 1 1960 1992
Annual flow, Fisher River, cm 1 1961 2006
Annual flow, Pigeon River, cm 1 1957 1996
Annual flow, Berens River, cm 1 1980 1998
Annual flow, Icelandic River, cm 1 1958 2006
Annual flow, Bloodvein River, cm 1 1976 2006
Annual flow, Poplar River, cm 1 1968 1996
Annual flow, Manigotogan River, cm 1 1913 1996
Annual flow, Red River, cm 1 1882 2006
Annual flow, Winnipeg River, cm 1 1907 2006
Annual flow, Saskatchewan River, cm 1 1912 2006
Annual flow, Dauphin River, cm 1 1977 2006
Annual flow, Nelson River East, cm 1 1972 2006
Annual flow, Nelson River West, cm 1 1972 2006
Annual flow, Nelson River East and West, cm 1 1972 2006
Annual total inflow, cm 1 1980 1992
Annual lake level, m 1 1914 2006
Mean monthly lake level, m 1 1914 2006
Mean seasonal lake level, m 1 1914 2006

69
Livestock and Humans
Annual commercial fish harvest, kg 1 1883 2006
Annual cattle pop., No. 1 1921 2006
Annual bull pop., No. 1 1931 2006
Annual dairy cattle pop., No. 1 1931 2006
Annual beef cattle pop., No. 1 1931 2006
Annual heifer pop., No. 1 1931 2006
Annual steers pop., No. 1 1931 2006
Annual calves pop., No. 1 1931 2006
Annual hog pop., No. 1 1921 2006
Annual horse pop., No. 1 1906 2006
Annual sheep pop., No. 1 1906 2006
Annual chicken pop., No. 1 1916 2006
Annual turkey pop., No. 1 1916 1982
Annual duck pop., No. 1 1916 1972
Annual geese pop., No. 1 1916 1972
Annual bee colonies., No. 1 1924 2006
Annual milk prod., kg 1 1920 1977
Annual shorn fleece wool, kg 1 1920 1993
Annual honey prod., kg 1 1924 2006
Annual MB pop., No. 1 1871 2006
Annual City of Winnipeg, MB pop., No. 1 1871 2006
Annual City of Brandon, MB pop., No. 1 1871 2006
Crops
Annual fertilizer sales, kg 1 1945 2002
Annual fertilizer and lime sales, $ 1 1968 2001
Annual fertilizer sales, $ 1 1926 1970
Annual fertilizer sales, 1992 constant $ 1 1971 2006
Annual chemical product sales, 1992 constant $ 1 1971 2006
Annual N content in fertilizer sold, kg 1 1950 2002
Annual PO4 content in fertilizer sold, kg 1 1950 2002
Annual potash content in fertilizer sold, kg 1 1968 2002
Annual nutrient (N+P+K) content in fertilizer sold, kg 1 1968 2002
Annual farm, No. 1 1921 2006
Annual agricultural land area, km2 1 1921 2006
Annual pasture area, km2 1 1951 1992
Annual cropland area, km2 1 1921 2006
Annual summerfallow area, km2 1 1913 2006
Annual seeded all wheat area, km2 1 1908 2006
Annual seeded spring wheat area, km2 1 1908 2006
Annual seeded durum wheat area, km2 1 1941 2006
Annual seeded oat area, km2 1 1908 2006
Annual seeded barley area, km2 1 1908 2006
Annual seeded all rye area, km2 1 1908 2006
Annual seeded spring rye area, km2 1 1923 2006
Annual seeded fall rye area, km2 1 1923 2006

70
Annual seeded mixed grain area, km2 1 1910 2006
Annual seeded corn for grain area, km2 1 1941 2006
Annual seeded buckwheat area, km2 1 1925 2006
Annual seeded dry field pea area, km2 1 1908 2006
Annual seeded flaxseed area, km2 1 1908 2006
Annual seeded mustard seed area, km2 1 1952 2004
Annual seeded sunflower area, km2 1 1943 2006
Annual seeded canola area, km2 1 1943 2006
Annual seeded tame hay area, km2 1 1908 2006
Annual seeded sugarbeet area, km2 1 1940 1998
Annual seeded fodder corn area, km2 1 1910 2006
Annual seeded potato area, km2 1 1908 2006
Annual seeded field root area, km2 1 1908 1940
Annual planted tomato area, km2 1 1940 2006
Annual planted cucumber area, km2 1 1940 2006
Annual planted lettuce area, km2 1 1940 2001
Annual planted dry onion area, km2 1 1940 2006
Annual planted asparagus area, km2 1 1940 2006
Annual planted celery area, km2 1 1940 1996
Annual planted beans area, km2 1 1940 2006
Annual planted fresh corn area, km2 1 1940 2006
Annual planted cabbage area, km2 1 1940 2006
Annual planted cauliflower area, km2 1 1940 2006
Annual planted carrot area, km2 1 1940 2006
Annual planted parsnip area, km2 1 1940 1996
Annual planted beet area, km2 1 1940 2006
Annual planted rutabaga and turnip area, km2 1 1940 2006
Spring wheat seeding is general (DOY) 1 1952 1991
Spring wheat heading is general (DOY) 1 1952 1990
Spring wheat swathing is started (DOY) 1 1952 1990
Spring wheat swathing is general (DOY) 1 1952 1989
Spring wheat swathing is completed (DOY) 1 1952 1990
Spring wheat combining is started (DOY) 1 1952 1990
Spring wheat combining is general (DOY) 1 1952 1989
Spring wheat combining is completed (DOY) 1 1952 1990
Annual tame hay prod., kg 1 1908 2006
Annual all wheat prod., kg 1 1908 2006
Annual spring wheat prod., kg 1 1908 2006
Annual durum wheat prod., kg 1 1941 2006
Annual buckwheat prod., kg 1 1925 2006
Annual oat prod., kg 1 1908 2006
Annual all rye prod., kg 1 1908 2006
Annual spring rye prod., kg 1 1923 2006
Annual fall rye prod., kg 1 1923 2006
Annual barley prod., kg 1 1908 2006
Annual mixed grain prod., kg 1 1910 2006
Annual canola prod., kg 1 1943 2006
Annual flaxseed prod., kg 1 1908 2006
Annual mustard seed prod., kg 1 1952 2004
Annual sunflower seed prod., kg 1 1943 2006
Annual potato prod., kg 1 1908 2006

71
Annual carrot prod., kg 1 1940 2006
Annual parsnip prod., kg 1 1940 1996
Annual cauliflower prod., kg 1 1940 1996
Annual cabbage prod., kg 1 1940 2006
Annual beet prod., kg 1 1940 2000
Annual sugarbeet prod., kg 1 1940 1996
Annual rutabaga and turnip prod., kg 1 1940 1995
Annual field root prod., kg 1 1908 1940
Annual asparagus prod., kg 1 1940 2002
Annual cucumber prod., kg 1 1940 2006
Annual lettuce prod., kg 1 1940 2001
Annual tomato prod., kg 1 1940 2006
Annual celery prod., kg 1 1940 1996
Annual dry onion prod., kg 1 1940 2006
Annual corn for grain prod., kg 1 1941 2006
Annual fodder corn prod., kg 1 1910 2006
Annual dry field pea prod., kg 1 1908 2006
Annual fresh corn prod., kg 1 1940 2006
Annual soy bean prod., kg 1 1956 2006
Limnology
Annual Red River mean TN, mg L1
1 1974 2006
Annual Red River mean TP, mg L1
1 1970 2006
Annual Winnipeg River mean TN, mg L1
1 1978 2006
Annual Winnipeg River mean TP, mg L1
1 1978 2006
Annual Saskatchewan River mean TN, mg L1
1 1970 2006
Annual Saskatchewan River mean TP, mg L1
1 1970 2006
Annual Dauphin River mean TN, mg L1
1 1978 2006
Annual Dauphin River mean TP, mg L1
1 1978 2006
Annual Nelson River East mean TN, mg L1
1 1972 2006
Annual Nelson River East mean TP, mg L1
1 1972 2006
Annual South Basin L. Winnipeg mean TN, mg L1
1 1992 2005
Annual South Basin L. Winnipeg mean TP, mg L1
1 1992 2005
Annual Narrows Lake Winnipeg mean TN, mg L1
1 1992 2005
Annual Narrows Lake Winnipeg mean TP, mg L1
1 1992 2005
Annual North Basin Lake Winnipeg mean TN, mg L1
1 1992 2005
Annual North Basin Lake Winnipeg mean TP, mg L1
1 1992 2005
Annual South Basin mean Chl a, mg L1
1 1992 2005
Annual Narrows mean Chl a, mg L1
1 1992 2005
Annual North Basin mean Chl a, mg L1
1 1992 2005
Annual Red River P loading, kg yr1
1 1970 2006
Annual Winnipeg River P loading, kg yr1
1 1970 2006
Annual Saskatchewan River P loading, kg yr1
1 1970 2006
Annual Dauphin River P loading, kg yr1
1 1977 2006
Annual East Side Lake Winnipeg P loading, kg yr1
1 1970 2006
Annual West Side Lake Winnipeg P loading, kg yr1
1 1970 2006
Annual Atmospheric Deposition P loading, kg yr1
1 1970 2006

72
Annual City of Winnipeg P loading, kg yr1
1 1970 2006
Annual Total P loading, kg yr1
1 1970 2006
Annual Outflow P (from Nelson River), kg yr1
1 1972 2006
Annual P load retained, kg yr1
1 1972 2006
Annual % P retention 1 1972 2006
Annual Red River N loading, kg yr1
1 1970 2006
Annual Winnipeg River N loading, kg yr1
1 1970 2006
Annual Saskatchewan River N loading, kg yr1
1 1970 2006
Annual Dauphin River N loading, kg yr1
1 1977 2006
Annual East Side Lake Winnipeg N loading, kg yr1
1 1970 2006
Annual West Side Lake Winnipeg N loading, kg yr1
1 1970 2006
Annual Atmospheric Deposition N loading, kg yr1
1 1970 2006
Annual N Fixation loading, kg yr1
1 1970 2006
Annual City of Winnipeg, N loading, kg yr1
1 1970 2006
Annual total N loading, kg yr1
1 1970 2006
Annual Outflow N (from Nelson River), kg yr1
1 1972 2006
Annual N load retained, kg yr1
1 1972 2006
Annual % N retention 1 1972 2006