Embed Size (px)
Citation preview

Wisconsin
Comprehensive Annual Financial Report
For the fiscal year ended June 30, 2011

STATE OF
WISCONSIN
Comprehensive Annual Financial Report
For the fiscal year ended June 30, 2011
Scott Walker, Governor
Department of Administration Michael Huebsch, Secretary
Stephen J. Censky, State Controller
Prepared by the State Controller’s Office This document is available electronically on the internet at: http://www.doa.state.wi.us/debf

State of WisconsinComprehensive Annual Financial Report For the Fiscal Year Ended June 30, 2011
Table of ContentsPage
INTRODUCTORY SECTIONLetter of Transmittal ……………………………………………………………………………………………………………………………… 2GFOA Certificate of Achievement ……………………………………………………………………………………………………………… 11Organizational Chart ……………………………………………………………………………………………………………………………… 12Principal State Officials …………………………………………………………………………………………………………………………… 13
FINANCIAL SECTIONAuditor's Report .................................................................................................................................................................................. 16
Management's Discussion and Analysis ……………………………………………………………………………………………………… 19
Basic Financial Statements: Government-wide Financial Statements:
Statement of Net Assets ………………………………………………………………………………………………………………… 39Statement of Activities …………………………………………………………………………………………………………………… 40
Fund Financial Statements: Governmental Funds:
Balance Sheet ………………………………………………………………………………………………………………………… 42Statement of Revenues, Expenditures, and Changes in Fund Balances ……………………………………………………… 44
Proprietary Funds: Balance Sheet ………………………………………………………………………………………………………………………… 46Statement of Revenues, Expenses, and Changes in Fund Equity …………………………………………………………… 48Statement of Cash Flows …………………………………………………………………………………………………………… 50
Fiduciary Funds: Statement of Fiduciary Net Assets ………………………………………………………………………………………………… 54Statement of Changes in Fiduciary Net Assets …………………………………………………………………………………… 55
Notes to the Financial Statements Index ……………………………………………………………………………………………… 56Notes to the Financial Statements ……………………………………………………………………………………………………… 58
Required Supplementary Information: Postemployment Benefits - State Health Insurance Program …………………………………………………………………………… 159Infrastructure Assets Reported Using the Modified Approach …………………………………………………………………………… 160Budgetary Comparison Schedule - General Fund ………………………………………………………………………………………… 162Budgetary Comparison Schedule - Transportation Fund ………………………………………………………………………………… 163Notes to Required Supplementary Information - Budgetary Information ……………………………………………………………… 165
Supplementary Information: Nonmajor Governmental Funds:
Combining Balance Sheet ...................................................................................................................................................... 172Combining Statement of Revenues, Expenditures, and Changes in Fund Balances ............................................................. 176Budgetary Comparison Schedule Nonmajor Budgeted Governmental Funds …………………………………......................... 180
Nonmajor Enterprise Funds: Combining Balance Sheet ...................................................................................................................................................... 184Combining Statement of Revenues, Expenses, and Changes in Fund Equity ....................................................................... 186Combining Statement of Cash Flows ...................................................................................................................................... 188
Internal Service Funds: Combining Balance Sheet ...................................................................................................................................................... 194Combining Statement of Revenues, Expenses, and Changes in Fund Equity ....................................................................... 196Combining Statement of Cash Flows ...................................................................................................................................... 198
Fiduciary Funds: Combining Statement of Fiduciary Net Assets - Pension and Other Employee Benefit Trust Funds ..................................... 204Combining Statement of Changes in Fiduciary Net Assets - Pension and Other Employee Benefit Trust Funds …………… 205Combining Statement of Fiduciary Net Assets - Investment Trust Funds .............................................................................. 206Combining Statement of Changes in Fiduciary Net Assets - Investment Trust Funds ........................................................... 207Combining Statement of Fiduciary Net Assets - Private-Purpose Trust Funds ...................................................................... 208Combining Statement of Changes in Fiduciary Net Assets - Private-Purpose Trust Funds ................................................... 209Combining Statement of Fiduciary Net Assets - Agency Funds ............................................................................................. 210Combining Statement of Changes in Assets and Liabilities - Agency Funds ......................................................................... 211
ii

Comprehensive Annual Financial Report For the Fiscal Year Ended June 30, 2011
PageSTATISTICAL SECTION:
Statistical Section Narrative and Table of Contents .............................................................................................................................. 214Net Assets by Component ...............................................................................................................................................................…… 216Changes in Net Assets .......................................................................................................................................................................... 218Fund Balances of Governmental Funds ................................................................................................................................................ 222Changes in Fund Balances of Governmental Funds ............................................................................................................................. 224Personal Income by Industry ................................................................................................................................................................. 226Personal Income Tax Rates .................................................................................................................................................................. 227Personal Income Filers and Liability by Income Level .......................................................................................................................... 228Ratio of Outstanding Debt by Type ....................................................................................................................................................... 229Ratio of General Obligation Bonded Debt and Appropriation Bonds to Personal Income and Per Capita ........................................... 230Legal Debt Margin ................................................................................................................................................................................. 232Department of Transportation Revenue Bond Coverage ...................................................................................................................... 233Environmental Improvement Fund Revenue Bond Coverage ………………………………………………………………………………… 234Petroleum Inspection Fee Revenue Bond Coverage ............................................................................................................................ 235Wisconsin Housing and Economic Development Authority Revenue Bond Coverage ..............................................…………………… 236Demographic and Economic Statistics …………………………………………………………………………………………………………… 238Principal Employers .......................................................................…………………………………………………………………………… 239Full Time Equivalent State Government Employees by Function/Program .......................................................................................... 240Operating Indicators by Function .......................................................................................................................................................... 242Capital Asset Statistics by Function ...................................................................................................................................................... 244Local Government Property Insurance Fund Ten-Year Claims Development Information ................................................................... 246Income Continuation Insurance Risk Pool Ten-Year Claims Development Information ....................................................................... 248Long-term Disability Insurance Risk Pool Ten-Year Claims Development Information ........................................................................ 249Health Insurance Risk Pool (Standard Plan) Ten-Year Claims Development Information .................................................................... 250Health Insurance Risk Pool (Pharmacy Benefit) Seven-Year Claims Development Information ………………………………………… 251
Acknowledgments ...................................................................................................................................................................................... 252
printed on recycled paper
iii

iv

INTRODUCTORY SECTION
1

SCOTT WALKER GOVERNOR MIKE HUEBSCH SECRETARY Division of Executive Budget and Finance State Controller’s Office Post Office Box 7932 Madison, WI 53707-7932 Voice (608) 266-1694 Fax (608) 266-7734 www.doa.state.wi.us/debf/
2
December 21, 2011 The Honorable Scott Walker The Honorable Members of the Legislature Citizens of the State of Wisconsin We are pleased to submit the Comprehensive Annual Financial Report (CAFR) for the State of Wisconsin for the fiscal year ended June 30, 2011. The State’s CAFR is prepared by the Department of Administration, Division of Executive Budget and Finance, State Controller's Office, which is responsible for the completeness and reliability of the information contained in this report, based upon a comprehensive framework of internal controls that it has established for this purpose. Because the cost of internal controls should not exceed anticipated benefits, the objective is to provide reasonable, rather than absolute, assurance that the financial statements are free of any material misstatements. This report has been prepared in accordance with generally accepted accounting principles (GAAP) for governments as promulgated by the Governmental Accounting Standards Board (GASB). To report the State's financial activity, the State's budgetary funds are grouped into the fund types required by GAAP. As a result, the State's 64 budgetary funds have been analyzed, restructured and are currently reported in 59 GAAP funds. The most significant change has been to reclassify certain activities from the budgetary General Fund and present them in proprietary and fiduciary fund types more appropriate for the financial reporting of transactions related to commercial and trust activities. Notes 1-C and 1-D to the financial statements include a more detailed discussion of the GAAP fund types. Independent Audit In compliance with Wis. Stat. Sec. 13.94 (1)(c), the State Legislative Audit Bureau has performed an examination of and has issued an unqualified opinion on the State’s primary government basic financial statements included in this report. The independent auditor’s report is located at the front of the financial section of this report. Management Discussion and Analysis GAAP requires that management provide a narrative introduction, overview, and analysis to accompany the basic financial statements in the form of Management’s Discussion and Analysis (MD&A). This letter of transmittal is designed to complement MD&A and should be read in conjunction with it. The State’s MD&A can be found immediately following the auditor’s report.

3
PROFILE OF THE STATE The State of Wisconsin was admitted to the Union as the 30th state in 1848. Wisconsin, situated between Lake Michigan to the east and the Mississippi River to the west, covers 54,310 square miles and serves a population of 5.7 million. Wisconsin government is divided into three branches. The executive branch, headed by the governor, includes five other elected constitutional officers, as shown on the organization chart on Page 12. The legislative branch includes the Wisconsin Legislature, which is composed of a 33-member senate and a 99-member assembly. The judicial branch includes the Wisconsin Supreme Court, the Court of Appeals, and circuit courts. The State provides a full range of services that include commerce, education, transportation, environmental resources, human relations and resources, judicial, legislative and general administrative services. The financial statements present information on the financial position and operations of State government as a single comprehensive reporting entity. The various agencies, departments, boards, commissions and accounts of the State that constitute the State reporting entity are included in this report. Component Units In accordance with criteria established by the GASB, this report also includes component units which are legally separate organizations for which the State is financially accountable or receives a substantial benefit. Discretely presented component units, which function independently of the State despite the ties between them and are, therefore, presented separately from the data of the State, include the Wisconsin Housing and Economic Development Authority, Wisconsin Health Care Liability Insurance Plan, University of Wisconsin Hospitals and Clinics Authority, and the University of Wisconsin Foundation. Blended component units, which although legally separate entities are, in substance, part of the State’s operations, include the Wisconsin Public Broadcasting Foundation, Inc., Badger Tobacco Asset Securitization Corporation and Celebrate Children Foundation, Inc. Budgetary Process The State's biennial budget is prepared on a mixture of cash and modified accrual bases of accounting and represents departmental appropriations based on agency requests reviewed by the Department of Administration and recommended by the Governor. The Governor's budget is submitted to the State Legislature for approval. Following debate, amendment and approval by the Senate and Assembly, the budget bill is returned to the Governor for his signature or veto in entirety or in part. The State Constitution provides that no money shall be paid out of the Treasury except as appropriated by law. The Statutes require that the Secretary of Administration must approve all payments. The Department of Administration exercises detail allotment control over all agency appropriations and approval authority over all encumbrances. The budgetary basis of accounting required by State law differs materially from the basis used to report revenues and expenditures in accordance with GAAP. The State's biennial budget is developed according to the statutorily required fund structure that, as previously noted, differs extensively from the fund structure used in the financial statements.

4
Wisconsin Retirement System and Accumulated Sick Leave Conversion Credits Program The Wisconsin Retirement System (WRS) is a pension plan administered by the Department of Employee Trust Funds (DETF). The WRS provides coverage to all eligible employees of the State of Wisconsin and other participating local units of government. The most current actuarial valuations of this pension plan indicated that the WRS was funded at 99.8 percent of liabilities for the 572,219 participants of the WRS. The State’s contribution to WRS represents approximately 30.0 percent of total contributions required of all participating entities. The Accumulated Sick Leave Conversion Credits (ASLCC) benefit program, reported in a fiduciary fund and also administered by DETF, allows employees at the time of their retirement to convert the value of their accumulated unused sick leave into an account to be used to pay for post-retirement health insurance. The actuarial value-based funded ratio of this program was 99.3 percent as of December 31, 2010 (the date of the most recent valuation). ECONOMIC CONDITION AND OUTLOOK Wisconsin has mirrored the nation's economic performance in recent years. While most states have been adversely affected by the 2007-09 global recession, Wisconsin coped better than the nation as a whole by several measures. • Wisconsin's unemployment rate remains significantly lower than the national rate. • Wisconsin's growth in gross state product has exceeded the 50-state average since 2007. • Wisconsin's per capita income growth has exceeded the nation's growth. • With 90.6 percent of its population covered, Wisconsin has the third highest insurance coverage rate in the
country. • Wisconsin's median household income, $50,522, is the 24th highest in the country and 2.2 percent above
the national average. In Fiscal Year 2011, Wisconsin's economy began to recover from the nation's worst economic crisis in decades. Total general fund revenues increased by 6.4 percent over Fiscal Year 2010 tax collections with a broad-based improvement in all of Wisconsin's major general fund tax revenue sources. Individual income tax revenues increased 10.0 percent, sales and use tax revenues increased 4.2 percent and corporate tax revenues increased 2.2 percent. This revenue growth helped to maintain spending priorities by replacing federal funding for states that was included in the American Recovery and Reinvestment Act of 2009 (ARRA). In Fiscal Year 2010, Wisconsin was able to use the additional federal funding for states to help offset reduced state revenues due to the recession and, as a result, protect high priority programs, including Medical Assistance, School Aids, Shared Revenue and Youth Aids. While additional federal matching funds for Medical Assistance were available in Fiscal Year 2011, the State had completely allocated Wisconsin's share of the state fiscal stabilization funds in Fiscal Year 2010. This allowed Wisconsin to position the State's budget to better fit within available state revenues. Looking ahead, Wisconsin's economic recovery should continue. Wisconsin gross domestic product should increase 3.0 percent in 2011 and increase 2.5 percent in 2012. Total nonfarm employment in Wisconsin will increase 1.1 percent in 2011 and increase 1.0 percent in 2012. Nationally, nonfarm employment will increase 0.9 percent in 2011 and increase 1.0 percent in 2012. Wisconsin personal income growth should increase 5.2 percent in 2011 and increase 3.3 percent in 2012. This is similar to the expected personal income growth nationally of an increase of 5.3 percent in 2011 and 3.6 percent in 2012. Several actions that occurred in Fiscal Year 2010 were continued in Fiscal Year 2011 to ensure that Wisconsin's priorities of reversing job losses, bringing State spending in line with available resources and protecting the most vulnerable of residents were met. These actions included maintaining spending at the Fiscal Year 2010 levels across state government, no pay increases and furloughs for state employees, and revenue measures to collect delinquent taxes. For Fiscal Years 2010 and 2011, all state programs, with very

5
few exceptions, were cut at least 1 percent from base. Many programs were cut by an additional 5 percent or more. State employees were directed to take 8 furlough days in each fiscal year of the biennium, in addition to rolling back funding related to a planned 2 percent pay increase. The enactment of 2011 Wisconsin Act 10 requires most state and local government employees to contribute 50 percent of their pension benefits and increased the percent of health insurance premium State employees pay. While Act 10 was not effective in Fiscal Year 2011, the cost reductions and flexibilities improve the State's structural balance for Fiscal Years 2012 and beyond. School aid essentially was held flat, increasing only 0.2 percent in Fiscal Year 2011. Similarly, increases were not provided related to property tax control provisions. Medical Assistance funding was reduced through rate reform efforts, including provider rate reductions and restructuring of contracts with managed care organizations. Funding to the University of Wisconsin System, excluding debt service, was increased by 5.4 percent. Growth in tuition was held to approximately 5.5 percent primarily by reducing administrative costs. MAJOR INITIATIVES Economic Development. In early 2011, significant legislation was passed strengthening the State's commitment to economic development and job growth. Created under 2011 Wisconsin Act 7, the Wisconsin Economic Development Corporation's sole mission is to assist the private sector in job creation. A public-private partnership, this authority replaces the Wisconsin Department of Commerce, and focuses exclusively on developing and implementing economic programs to assist companies that are investing and creating jobs in Wisconsin and supporting new business start-ups and business expansion and growth in the State. The State also added additional tax credits and deductions for business expansion. Creation of jobs is a top priority of the State, and 2011 Wisconsin Act 5 created a new tax deduction for businesses which create additional full time positions. Businesses can claim a deduction of either $2,000 or $4,000 for each full time position created per year, depending on the size of the business. In addition, 2011 Wisconsin Act 4 expanded the amount of economic development tax credits that can be issued by $25 million for nonrefundable, nontransferable tax credits to businesses for projects that create jobs, purchase significant capital assets, train employees, or establish or retain a corporate headquarters in Wisconsin. To provide an incentive for businesses to locate in Wisconsin, 2011 Wisconsin Act 3 created a tax deduction or credit for businesses that relocate at least 51 percent of their workforce to the State from another state or another country and begin doing business in the State. The deduction or credit may be claimed for two consecutive tax years, beginning with the tax year the business relocates to and begins doing business in the State. The State also reduced individual income tax liability through tax code changes. Beginning in tax year 2011, amounts contributed by individuals into health savings accounts and earnings on those contributions will be excluded as income for state tax purposes. Previously, Wisconsin had been one of only a few states not to make health savings account contributions and related earnings tax deductible for state income tax purposes. This is expected to save taxpayers $27 million per year. Under 2011 Wisconsin Act 32, the State created an individual income tax deferral for capital gains reinvested in certain qualified Wisconsin based businesses. This tax deferral is expected to save between $16.1 and $20.2 million annually for individuals investing in qualified Wisconsin businesses. In 2011, the State encouraged private investment in entrepreneurial activities by expanding the Angel Investment and Early Stage Seed Investment tax credit programs, which initially became effective for tax years beginning after January 1, 2005. Through the programs, individuals and businesses are eligible for tax credits equal to a portion of the investment made in qualified new business ventures. In calendar year 2009, there were 24 new companies certified as qualified new business ventures and $33.8 million in eligible investments made. In calendar year 2010, there were 32 new companies certified as qualified new business ventures and $30.5 million in eligible investments made. Since the program began, $20.8 million in tax credits have been issued to angel investors.

6
The State also offers a variety of programs that target minority and rural business development, dairy manufacturing, and agricultural production. Through the end of Fiscal Year 2011, 520 businesses had been certified as minority-owned, and loans were awarded to several businesses through the rural economic development microloan program. In 2011, the State encouraged farm modernization efforts by extending the final eligible tax year for the dairy and livestock farm investment credit from tax year 2011 to tax year 2016. The Farmland Preservation Credit provides a refundable credit to about 17,000 farmers who qualify through exclusive agricultural zoning or individual farmland preservation agreements. Wisconsin's Farmland Preservation Credit is one of only two similar state programs in the country. Farmland Preservation Credit expenditures totaled $6.1 million in Fiscal Year 2011. A separate program, implemented in tax year 2010, created a per acre farmland preservation tax credit for new eligible taxpayers who are not under existing agreements. Expenditures under this program totaled $12.4 million in Fiscal Year 2011. The total of the two programs increased by $3.8 million over Fiscal Year 2010. In 2010, Wisconsin continued to grow the State's $26 billion dairy industry through the Dairy Business Initiative's focus on adding value to milk through specialty and artisanal products. Wisconsin leads the nation in cheese production and is home to more than 600 types, styles and varieties. The federally funded partnership between the Department of Agriculture, Trade and Consumer Protection and the Dairy Business Innovation Center has helped more than 200 clients successfully launch more than 65 new types of cheese to market since the initiative began in 2004. Of the State's 140 cheese plants, 99 are now manufacturing at least one type of specialty cheese, accounting for almost 19 percent of the State's total cheese production. Twenty-nine farmstead cheese plants craft a variety of award-winning artisan and specialty cheese from cow, goat and sheep's milk. The Dairy Business Initiative also has been a positive factor in increasing the State's dairy production and processing capacity. From 2002 to 2010, milk production increased from 22 billion to 26 billion pounds, with per cow production rising by 18 percent. In 2010 Wisconsin's $2.4 billion in agricultural exports ranked 17th among U.S. states. Top export markets were Canada, Mexico, Japan, South Korea, Italy and China, and top product categories included cereals, bakery and food ingredients, dairy, skins and leather, and preserved foods. Wisconsin led the nation in exports of flax seed, ginseng roots, canned sweet corn, mustard flour, and mixes and doughs for the baking industry. Wisconsin ranked second among all states in the exportation of cheese and livestock genetics in 2010. In 2011 agricultural exports have continued to grow at record pace. From January through September, Wisconsin exported $2.1 billion worth of agricultural products to over 140 countries, an increase of 24 percent over the same period of the prior year. Agricultural exports to four of our top five markets experienced double-digit growth, signaling the industry's importance in the State's recovering economy. In 2011, the State continued to support the tax relief measures that were enacted in previous years. Beginning with tax year 2008, the portion of taxable income for businesses operating in multiple states has been apportioned to Wisconsin based on a single sales factor apportionment formula for most industries. In prior tax years, taxable income was apportioned to Wisconsin based on sales, property and payroll. Depending on the company's organization, tax liability may be higher or lower under the single sales factor compared to the prior multi-part formula. By removing property and payroll as apportionment factors, companies are not penalized for moving facilities and employment to Wisconsin from other states. To ease the administrative burden of businesses looking to relocate to Wisconsin, the State has continued to modernize its tax policies and increase consistency with other states in treatment of multistate businesses, while not disadvantaging local businesses. Wisconsin is one of 24 full and associate state members of the Streamlined Sales and Use Tax Agreement and one of 25 states that require commonly-owned corporations engaged in a unitary business to file combined reports for the purpose of computing taxable income. By adopting combined reporting, Wisconsin has increased tax fairness for Wisconsin businesses without increasing the overall tax rate. The adoption of combined reporting is estimated to have generated over $100 million in increased tax collections for Fiscal Year 2011.

7
During the recession, Wisconsin experienced record claims for unemployment benefits. In July 2009, Wisconsin administered 240,608 weekly continued claims. The number of continued claims had fallen to 148,079 by the last week of June 2010 and has continued to decrease over the past 16 months as the economy improves and certain benefit extensions expire. As of October 2011, continued claims were 138,188, a 31 percent decrease from June 2010. Transportation. The State continued to make significant investments in transportation infrastructure through expansion in highway capacity and reconstruction of existing highways and bridges. In 2011, 721 miles of State Trunk Highway and local highways were improved and 258 deficient state and local bridges were rehabilitated or replaced. Of these, ARRA funds supported the improvement of 37 miles of state and local highways and the rehabilitation of 40 state and local bridges. Also, in Fiscal Year 2011, the State contributed over $456 million to continue work on the I-94 Southeast Freeway, and $250 million on US 41. In all, more than $1.11 billion in construction projects on state and local road systems was contracted through the Department of Transportation. Wisconsin also distributes State transportation user fee revenues to local governments for transportation infrastructure improvements and transit operating assistance. In Fiscal Year 2011, $616.4 million was transferred to local governments for these purposes. Environment. Wisconsin's Warren Knowles-Gaylord Nelson Stewardship Program and its successor, the Warren Knowles-Gaylord Nelson Stewardship 2000 Program, are available for land acquisition, easements and nature-based outdoor recreational property development activities. The original Stewardship Program committed $250 million through the sale of general obligation bonds and the use of federal grant monies for various resource development and land protection activities, including acquisition of State park lands, protection of urban rivers and assistance to local parks. The program was reauthorized in 2007 Wisconsin Act 20 through Fiscal Year 2020 with an annual bonding authority of $86 million beginning in Fiscal Year 2011. During Fiscal Year 2011, the State used $41.6 million in Stewardship Program financing to acquire over 46,470 acres of public recreational land through acquisition and recreational easements. This total includes Stewardship grants totaling $13.2 million to local governments and nonprofit conservation organizations for the acquisition of easements and title in fee and for the development of recreational properties. In addition to land acquisition through the Stewardship Program, Wisconsin's efforts to protect and enhance its natural resources include partnerships with individual landowners. In November 2001, the State entered into an agreement with the U.S. Department of Agriculture for the authority to enroll up to 100,000 acres of Wisconsin farmland in the Conservation Reserve Enhancement Program. The federal government will provide up to $200 million for the program, which will be matched by the State with up to $28 million from the sale of general obligation bonds. As of October 1, 2011, 43,200 acres had been enrolled in the program, and total State payments to landowners amounted to almost $12.2 million. Wisconsin's Environmental Improvement Fund program provides financial assistance to municipalities for the planning, design and construction of wastewater collection and treatment, and drinking water treatment and distribution facilities. Most communities applying for assistance receive subsidized loans, although some wastewater projects are eligible for partial grants through a hardship component of the program. Funding is provided from a State-matched federal capitalization grant and through State revenue and general obligation bonds and repayments from loans previously made. In Fiscal Year 2011, the Environmental Improvement Fund made awards to municipalities amounting to $188.7 million, bringing the total amount of loans and grants awarded by the program to $3.9 billion since its inception in 1991. The funding has financed high priority infrastructure projects to ensure clean water and safe drinking water across the State. The Petroleum Environmental Cleanup Fund Award program (PECFA) assists owners of leaking petroleum storage tanks with environmental remediation costs and has provided almost $1.52 billion for cleanups at 13,018 locations (12,107 now closed) since 1988. Efforts to minimize claim payment backlogs and improve site closure methodologies have streamlined the program while protecting the environment and public health.

8
In addition to the PECFA program, Wisconsin has made a strong effort to reclaim contaminated properties, or brownfields. Since June 1998, the Blight Elimination and Brownfield Redevelopment program has awarded over $80 million to 211 projects for the redevelopment of brownfields where the environmental clean-up will have a significant economic as well as environmental impact. The completion of these projects will return 1,800 acres of abandoned or under-used environmentally contaminated sites to productive use, increasing taxable property values by over $1.5 billion and creating over 8,000 new jobs. Human Resources. In Fiscal Year 2011, Medical Assistance program expenditures and enrollment continued to grow, although at a slower rate than in prior years. Fiscal Year 2011 expenditures for the Medical Assistance program increased 7 percent over the prior year, totaling $7,144 million all funds. This is lower than the 13 percent increase in total expenditures experienced between Fiscal Years 2009 and 2010. During Fiscal Year 2011, the State continued to claim an enhanced rate of federal Medicaid reimbursement, although at a declining rate between January and June 2011. Federal Medicaid funding grew by 6 percent between Fiscal Years 2010 and 2011, while state funding from all sources increased by 9 percent. As a result of the higher-than-projected expenditures, 2011 Wisconsin Act 13 appropriated an additional $149 million GPR to cover the two-year Medical Assistance deficit. The increase in Medical Assistance expenditures continues to be driven by growing enrollment in the program due to eligibility expansions in Fiscal Years 2009 and 2010 and softness in the State's economic recovery. Overall Medical Assistance enrollment grew by 6 percent between Fiscal Years 2010 and 2011, compared to the 15 percent increase between Fiscal Years 2009 and 2010. By the end of Fiscal Year 2011, Medical Assistance enrollment was 1,078,272 recipients compared to 1,043,967 in June 2010. The State was able to control costs in Fiscal Years 2010 and 2011 by implementing significant changes in how the program purchases health care. Between Fiscal Years 2009 and 2011, the average expenditure per enrollee fell by 1 percent. Based on the success of these cost control initiatives, the Department of Health Services was given authority in 2011 Wisconsin Acts 10 and 32 to implement additional efficiency measures administratively, without the need to pass legislation. These measures are anticipated to reduce Medical Assistance expenditures by over $500 million all funds in Fiscal Years 2012 and 2013. Expenditures for the SeniorCare pharmacy assistance program decreased by 6 percent between Fiscal Years 2010 and 2011. Total SeniorCare expenditures were $108 million all funds, of which $20 million were GPR with the remainder supported by program and federal revenues. The Department of Children and Families continued the State's commitment to seek permanent placements for children referred to the State's child welfare system in Fiscal Year 2011. This included finalizing 751 adoptions for children with special needs. In other program areas, the department continued to eliminate fraud from the Wisconsin Shares program, which provides subsidized child care to low-income working families. The efforts of the department's program integrity unit helped hold Wisconsin Shares program expenditures in Fiscal Year 2011 to $303,696,800, which was $32,647,500 below Fiscal Year 2010 expenditures and $98,800,000 below the amount originally budgeted for Fiscal Year 2011. Under Wisconsin Shares, a monthly average of 54,055 children received subsidies in Fiscal Year 2011. An average of 14,274 families received cash benefits each month under the Wisconsin Works (W-2) program. In calendar year 2010, state and county child support partnership efforts provided full case management services to 387,720 cases and provided financial management services to an additional 114,870 cases. Education. School aids and property tax credits provided to support school districts' 2010-11 costs for elementary and secondary education totaled $6.2 billion. Despite the impact of the global recession, the State was able to increase funding for categorical aids and the first dollar property tax credit by $14.7 million, increasing spending 0.2 percent over Fiscal Year 2010. Wisconsin took several steps in Fiscal Year 2011 to ease the future burden on local property tax payers. Under 2011 Wisconsin Act 10, school district employees are required to pay half of required contributions to the Wisconsin Retirement System, previously contributed by the school district in most cases. Additionally,

9
under Act 10, districts can require employees to contribute a greater amount to health insurance premiums. As a result, districts are likely to experience lower fringe benefit costs and have the ability to set property tax levies accordingly. The State also limited property tax increases by maintaining the allowable annual revenue limit increase per pupil at $200, suspending the annual inflationary increase to the per pupil increment and continuing the freeze at $9,000 on the per pupil revenue threshold, below which school districts are exempt from revenue limit controls. Further, the State-funded per pupil payment to schools participating in the Milwaukee Parental Choice program was maintained at Fiscal Year 2010 levels, as was the per pupil payment to schools participating in the Milwaukee and Racine independent charter schools program. These measures helped hold the net school property tax increase for taxes levied in 2010 to 4.1 percent. Wisconsin continued its commitment to address student financial aid needs at the University of Wisconsin by providing $1.9 million in Fiscal Year 2011 for the Academic Fee Increase Grant program to offset tuition increases for students with family incomes below $60,000 and unmet financial aid needs. The Lawton Minority Undergraduate Grants Program received a 5.6 percent increase in Fiscal Year 2011. Also, the Wisconsin Higher Education Grant program for University of Wisconsin System students was increased by 6.0 percent in Fiscal Year 2011; for technical college students, the program was increased 3.5 percent, and for private school students it was increased 2.0 percent. The State's continued commitment to financial aid for University of Wisconsin students, combined with maintaining low to moderate tuition levels for resident undergraduate students has helped rank the University of Wisconsin-Madison one of the 50 "Best Value Colleges for 2011" by the Princeton Review. In addition, the University of Wisconsin opened the Wisconsin Institutes for Discovery in December 2010. This unique facility houses twin research institutes, one private and one public, under one roof. Additionally, the building contains the Town Center, which includes three embedded teaching labs and other facilities designed to assist in showcasing research and catering to major scientific gatherings. The building is designed to spark collaborations across scientific disciplines, which is expected to accelerate breakthrough discoveries to improve human health. Wisconsin researchers continue to receive major grants for their projects, an indicator of the high quality of research being performed in Wisconsin. Examples in Fiscal Year 2011 include a $9.5 million Health Enhancement Systems Studies grant from the federal Agency for Healthcare Research and Quality, a $5 million grant from the U.S. Department of Agriculture for studies of sustainable food systems, and a $10.7 million grant from the U.S. Department of Energy for fusion experiments. In October 2010, annual research expenditures surpassed the $1 billion milestone.

10
AWARDS AND ACKNOWLEDGEMENTS Award The Government Finance Officers Association of the United States and Canada (GFOA) awarded a “Certificate of Achievement for Excellence in Financial Reporting” to the State of Wisconsin for its Comprehensive Annual Financial Report for the fiscal year ended June 30, 2010. The Certificate of Achievement is a prestigious national award recognizing conformance with the highest standards for preparation of state and local government financial reports. In order to be awarded a Certificate of Achievement, a government unit must publish an easily readable and efficiently organized comprehensive annual financial report whose contents conform to program standards. Such reports must satisfy both generally accepted accounting principles and applicable legal requirements. A Certificate of Achievement is valid for a period of one year only. This is the 15th year the State has received this award. We believe our current report continues to conform to the Certificate of Achievement Program requirements, and we are submitting it to the GFOA. Acknowledgements We wish to express our appreciation to the many individuals whose dedicated efforts have made this report possible. The preparation of this report could not have been accomplished without the professionalism and dedication demonstrated by the financial managers and accountants of the State agencies and component units, along with staff within the State Controller's Office. Sincerely,
Michael Huebsch Stephen J. Censky, CPA Secretary State Controller

11 11

State of Wisconsin
Organizational Chart
WISCONSIN STATE GOVERNMENT ORGANIZATIONJuly 2011
LEGISLATIVE BRANCH EXECUTIVE BRANCH JUDICIAL BRANCH
Headed by a single secretary Headed by a single secretary
Headed by a part-time board Headed by a full-time commission AUTHORITIES
NONPROFIT CORPORATION
Headed by a single commissioner
Headed by a part-time board Headed by a part-time board
KEY: Constitutional Officer Administrative Department Independent Agency Authority Service Agency Nonprofit Corporation
Excludes various units of State government (certain boards, commissions, councils, divisions, and offices), which are attached to agencies for administrative purposes.
Source: Wisconsin Blue Book 2011 - 2012
Supreme CourtGovernorLegislature
JudicialService AgenciesState TreasurerSecretary of StateAttorney GeneralState Superintendent
of Public InstructionAssembly
99 Representatives
Legislative Service Agencies Court ofAppeals
Circuit CourtsJusticePublic Instruction
FinancialInstitutions
Lower Fox River Remediation
Housing and Economic
Development
Health and Educational
Facilities
Health Services
Veterans Affairs
Employee TrustFunds
Administration Tourism WorkforceDevelopmentChildren and Families
NaturalResources Revenue Transportation
TechnicalCollegeSystem
Safety & Professional
Services
UW Hospitalsand Clinics
Insurance
PublicService
Military Affairs(Headed by
Adjutant General)
EmploymentRelations
Universityof Wisconsin
System
HigherEducation
Aids
Government Accountability
EducationalCommu-nications
Agriculture,Trade and Consumer
Protection
Senate33 Senators
BradleyCenter Sports
and EntertainmentCorporation
LieutenantGovernor
StatePublic
Defender
StateHistoricalSociety
State Investment
Board
Corrections
Fox River Navigational
Wisconsin Aerospace
Health Insurance Risk Sharing
Wisconsin Technology
Council (High-Technology
Business Development Corporation)
WI Economic Development Corporation
12

State of Wisconsin Principal State Officials
13
As of June 30, 2011:
EXECUTIVE
Scott Walker Governor Rebecca Kleefisch Lieutenant Governor Douglas J. La Follette Secretary of State Kurt Schuller State Treasurer J. B. Van Hollen Attorney General Tony Evers State Superintendent of Public Instruction
LEGISLATIVE Michael Ellis President of the State Senate Jeff Fitzgerald Speaker of the Assembly
JUDICIAL Shirley S. Abrahamson Chief Justice of the Supreme Court

14

FINANCIAL SECTION
15

16
INDEPENDENT AUDITOR’S REPORT Honorable Members of the Legislature The Honorable Scott Walker, Governor We have audited the accompanying financial statements of the governmental activities, the business-type activities, the aggregate discretely presented component units, each major fund, and the aggregate remaining fund information of the State of Wisconsin as of and for the year ended June 30, 2011, which collectively comprise the State’s basic financial statements as listed in the table of contents. These financial statements are the responsibility of the State of Wisconsin’s management. Our responsibility is to express opinions on these financial statements based on our audit. We did not audit the financial statements for the following: the Wisconsin Department of Transportation Revenue Bond Program and Commercial Paper Program, which represent 12 percent of the liabilities of the governmental activities and 3 percent of the liabilities of the aggregate remaining fund information; the Environmental Improvement Fund, which is a major fund and represents 21 percent of the assets and 16 percent of the liabilities of the business-type activities; or the College Savings Program Trust, which represents 3 percent of the assets of the aggregate remaining fund information. Those financial statements were audited by other auditors whose reports thereon have been furnished to us, and our opinions, insofar as they relate to the amounts audited by others, are based solely upon their reports. In addition, we did not audit the financial statements of the discretely presented component units. Those financial statements were audited by other auditors. Our opinion on the aggregate discretely presented component units is based upon the audit reports of the Wisconsin Housing and Economic Development Authority, the University of Wisconsin Hospitals and Clinics Authority, and the University of Wisconsin Foundation. We conducted our audit in accordance with auditing standards generally accepted in the United States of America and the standards applicable to financial audits contained in Government Auditing Standards, issued by the Comptroller General of the United States. The following financial statements, which were audited by other auditors, were also audited in accordance with these standards: the Wisconsin Department of Transportation Revenue Bond Program and Commercial Paper Program, the Environmental Improvement Fund, the College Savings Program Trust, the Wisconsin Housing and Economic Development Authority, and the University of Wisconsin Hospitals and Clinics Authority. The financial statements of the University of Wisconsin Foundation, which were audited by other auditors, were audited in accordance with auditing standards generally accepted in the United States of America, but not in accordance with Government Auditing Standards. Auditing standards require that we plan and perform the audit to obtain reasonable assurance about whether the financial statements are free of material misstatement. An audit includes examining, on a test basis, evidence supporting the amounts and disclosures in the financial statements. An audit also includes assessing the accounting principles used and significant estimates made by management, as well as evaluating the overall financial statement presentation. We believe that our audit and the reports of other auditors provide a reasonable basis for our opinions. In our opinion, based on our audit and the reports of other auditors, the financial statements referred to in the first paragraph present fairly, in all material respects, the respective financial position of the governmental activities, the business-type activities, the aggregate discretely presented component units, each major fund, and the aggregate remaining fund information of the State of Wisconsin as of June 30, 2011, and the respective changes in financial position and cash flows, where applicable, for the year then ended in conformity with accounting principles generally accepted in the United States of America.
17
For fiscal year 2010-11, the State implemented Governmental Accounting Standards Board Statement Number 54, Fund Balance Reporting and Governmental Fund Type Definitions. This Statement modifies governmental fund balance classifications and clarifies governmental fund type definitions, which are discussed in Notes 1E(14) and 1D, respectively, to the financial statements. As discussed in Note 20A(3) to the financial statements, the Injured Patients and Families Compensation Fund’s loss liabilities are estimates based on recommendations of a consulting actuary. The Fund’s Board of Governors and management believe the estimated loss liabilities are reasonable and represent the most probable estimate of the losses the Fund will pay for the claims incurred to date. However, uncertainties inherent in projecting the frequency and severity of large medical malpractice claims because of the Fund’s unlimited liability coverage and extended reporting and settlement periods make it likely that amounts paid will ultimately differ from the reported estimated loss liabilities. These differences cannot be quantified. In accordance with Government Auditing Standards, we have also issued our report dated December 21, 2011, on our consideration of the State’s internal control over financial reporting; our tests of its compliance with certain provisions of laws, regulations, contracts, and grant agreements; and other matters. The purpose of that report is to describe the scope of our testing of internal control over financial reporting and compliance and the results of that testing, and not to provide an opinion on the internal control over financial reporting or on compliance. That report is an integral part of an audit performed in accordance with Government Auditing Standards and should be considered in assessing the results of our audit. Management’s discussion and analysis, the schedule of funding progress for the state retiree health insurance postemployment benefit plan, the infrastructure narrative, and the budgetary comparison schedule with related notes, as listed in the table of contents, are not required parts of the basic financial statements of the State of Wisconsin but are supplementary information required by accounting principles generally accepted in the United States of America. We have applied certain limited procedures, which consisted principally of inquiries of management regarding the methods of measurement and presentation of the required supplementary information. However, we did not audit the information and express no opinion on it. Our audit was conducted for the purpose of forming opinions on the financial statements that collectively comprise the State’s basic financial statements. The combining statements and schedules in the supplementary information section, as listed in the table of contents, are presented for purposes of additional analysis and are not a required part of the basic financial statements. The combining statements and schedules have been subjected to the auditing procedures applied by us and the other auditors in the audit of the basic financial statements and, in our opinion, based on our audit and the reports of other auditors, are fairly presented in all material respects in relation to the basic financial statements taken as a whole. The introductory and statistical sections, as listed in the table of contents, have not been subjected to the auditing procedures applied by us and the other auditors in the audit of the basic financial statements and, accordingly, we express no opinion on them. LEGISLATIVE AUDIT BUREAU December 21, 2011 by Joe Chrisman State Auditor

18

State of Wisconsin Management Discussion and Analysis
For the Fiscal Year Ended June 30, 2011
19
MANAGEMENT’S DISCUSSION AND ANALYSIS The Management's Discussion and Analysis of the State of Wisconsin’s Comprehensive Annual Financial Report (CAFR) presents a discussion and analysis of the State’s financial performance during the fiscal year that ended June 30, 2011. It should be read in conjunction with the transmittal letter located at the front of this CAFR, and the State’s financial statements, including the note disclosures which are an integral part of the statements, that follow this part of the CAFR. FINANCIAL HIGHLIGHTS -- PRIMARY GOVERNMENT Government-wide (Tables 2 and 3 on Pages 22 and 23) • Net Assets. The assets of the State of Wisconsin exceeded its liabilities at the close of Fiscal Year 2011 by $12.7 billion
(reported as "net assets"). Of this amount, $(10.2) billion was reported as "unrestricted net assets". A positive balance in unrestricted net assets would represent the amount available to be used to meet a government's ongoing obligations to citizens and creditors.
• Changes in Net Assets. The State's total net assets increased by $959.5 million in Fiscal Year 2011. Net assets of governmental activities increased by $301.9 million or 5.4 percent, while net assets of the business-type activities showed an increase of $657.6 million or 10.8 percent.
• Excess of Revenues over (under) Expenses -- Governmental Activities. During Fiscal Year 2011, the State’s total revenues for governmental activities of $27.1 billion were $1.5 billion more than total expenses (excluding transfers) for governmental activities of $25.7 billion. Of these expenses, $12.7 billion were covered by program revenues. General revenues, generated primarily from various taxes, totaled $14.4 billion.
Fund • Governmental Funds -- Fund Balances. As of the close of Fiscal Year 2011, the State's governmental funds reported
combined ending fund balances of $(1,655.0) million, an increase of $153.0 million in comparison with the prior year. Of this total amount, $(4,042.4) million represents the unassigned fund balances.
• General Fund -- Fund Balance. At the end of the current fiscal year, total fund balance was $(2,994.8) million, a change of $(79.4) million from $(2,915.4) million reported in the prior year. The unassigned fund deficit for the General Fund was $(3,336.3) million, or (15.1) percent of total General Fund expenditures.
Additional information regarding individual funds begins on Page 27. Long-term Debt • The State's total long-term debt obligations (bonds and notes payable) increased by $866.4 million during the current fiscal
year which represents the net difference between new issuances, payments and refundings of outstanding debt. The key factors contributing to this increase are the issuance during the fiscal year of $1,175.5 million of general obligation bonds and $353.1 million of revenue bond obligations, and the refunding of general obligation and revenue bonds. Additional detail regarding these activities begins on Page 32.
OVERVIEW OF THE FINANCIAL STATEMENTS The Financial Section of this CAFR consists of four parts: (1) management's discussion and analysis (this section), (2) basic financial statements, (3) additional required supplementary information, and (4) optional other supplementary nformation. Parts (2), (3), and (4) are briefly described on the following pages: i

State of Wisconsin Management Discussion and Analysis
For the Fiscal Year Ended June 30, 2011
20
Basic Financial Statements The basic financial statements include two sets of statements that present different views of the State -- the government-wide financial statements and the fund financial statements. These financial statements also include notes that explain some of the information in the financial statements and provide more detail. • The government-wide financial statements provide a broad view of the State’s operations. The statements provide both
short-term and long-term information about the State’s financial status, which assists in assessing the State’s financial condition at the end of the fiscal year.
• The fund financial statements focus on individual parts of the State government, reporting the State's operations in greater
detail than the government-wide statements. The basic fund financial statements provide more detailed information on the State's most significant funds.
Table 1, below, summarizes the major features of the financial statements.
Table 1 Major Features of State of Wisconsin's Government-wide and Fund Financial Statements
GOVERNMENT-WIDE STATEMENTS
FUND STATEMENTS
Governmental Funds Proprietary Funds Fiduciary Funds Scope Entire State government (except fiduciary
funds) and the State's component units, reported as follows: • Governmental Activities – Most
services generally associated with State government fall into this category, including commerce, education, transportation, environmental resources, human relations and resources, general executive, judicial and legislative.
• Business-Type Activities – Those
operations for which a fee is charged to external users for goods and services are reported in this category.
• Discretely Presented Component
Units – These are operations for which the State has financial accountability but that have certain independent qualities. The State’s discretely presented component units are discussed in Note 1-B to the financial statements.
These funds report activities of the State that are not proprietary or fiduciary in nature. Most of the basic services provided by the State, which are primarily financed through taxes, intergovernmental revenues, and other nonexchange revenues, are reported as governmental funds. Examples of the State’s governmental funds (including the State’s three major governmental funds), as reported within their respective fund types, follow: • General Fund (a major fund) • Special Revenue: -- Transportation (a major fund) • Debt Service: -- Bond Security and Redemption • Capital Projects: -- Capital Improvement • Permanent: -- Common School (a major fund)
The activities the State operates similar to private business. These funds are used to show activities that operate more like those of commercial enterprises. Fees are charged for services provided, both to outside customers and to other units of the State. Examples of the State’s proprietary funds, including the State’s four major enterprise funds, follow: • Enterprise:
-- Injured Patients and Families Compensation (a major fund)
-- Environmental Improvement (a major fund)
-- University of Wisconsin System (a major fund)
-- Unemployment Reserve (a major fund)
-- Lottery • Internal services:
-- Technology Services -- Facilities Operations and
Maintenance
These funds are used to show assets held by the State as trustee or agent for others and cannot be used to support the State’s own programs. Examples of the State’s fiduciary funds, as reported within their respective fund types, follow: • Pension and Other Employee
Benefit Trust Funds: -- Wisconsin Retirement System
• Investment Trust: -- Local Government Pooled
Investment • Private Purpose Trust:
-- College Savings Program Trust • Agency:
-- Support Collection Trust
Required financial statements
• Statement of net assets – Presents all of the government's assets and liabilities, with the difference between the two reported as "net assets". Over time, increases or decreases in the state's net assets are an indicator of whether its financial health is improving or weakening, respectively.
• Statement of activities – Presents a comparison between direct expenses and program revenues for each function of the State’s governmental activities and for different identifiable business-type activities of the State.
• Balance sheet • Statement of revenues, expenditures,
and changes in fund balances
• Balance sheet • Statement of revenues, expenses
and changes in fund equity • Statement of cash flows
• Statement of fiduciary net assets • Statement of changes in fiduciary net
assets Because the State can not use these assets to finance its operations, fiduciary funds are not included in the government-wide financial statements discussed in the left column.
(Table 1, continued)

State of Wisconsin Management Discussion and Analysis
For the Fiscal Year Ended June 30, 2011
21
Table 1 (Continued)
Major Features of State of Wisconsin's Government-wide and Fund Financial Statements
GOVERNMENT-WIDE STATEMENTS
FUND STATEMENTS
Governmental Funds Proprietary Funds Fiduciary Funds Accounting basis and measurement focus
Accrual accounting and economic resource focus The accrual basis of accounting, which is similar to the methods used by most businesses, takes into account all revenues and expenses associated with the fiscal year even if cash involved has not been received or paid.
Modified accrual accounting and current financial resource focus These statements provide a detailed short-term view of the State’s finances that assists in determining whether there will be adequate financial resources available to meet the current needs of the State. Because this information does not encompass the long-term focus of the government-wide statements, reconciliations are provided on the subsequent page of the governmental fund statements.
Accrual accounting and economic resources focus
Accrual accounting and economic resources focus
Type of asset/liability information
All assets and liabilities, both financial and capital, and short-term and long-term
Only assets expected to be used up and liabilities that come due during the year or soon thereafter; no capital assets included
All assets and liabilities, both financial and capital, and short-term and long-term
All assets and liabilities, both short-term and long-term
Type of inflow-outflow information
All revenues and expenses during the year, regardless of when cash is received or paid
• Revenues for which cash is received during or soon after the end of the year
• Expenditures when goods or services have been received and payment is due during the year or soon thereafter
All revenues and expenses during the year, regardless of when cash is received or paid
All revenues and expenses during the year, regardless of when cash is received or paid
Additional Required Supplementary Information In addition to this Management’s Discussion and Analysis, which is required supplementary information, the basic financial statements are followed by a section of required supplemental information that further explains and supports the information in the financial statements. The required supplementary information includes (1) post-employment benefits - state health insurance program, (2) condition and maintenance data regarding the State's infrastructure, and (3) a budgetary comparison schedule of the General and the Transportation funds, including reconciliations between the statutory and GAAP fund balances at fiscal year-end. Other Supplementary Information The Other Supplementary Information includes combining financial statements for nonmajor governmental funds, nonmajor enterprise funds, internal service funds and fiduciary funds, each of which are added together and presented in single columns in the basic financial statements.

State of Wisconsin Management Discussion and Analysis
FINANCIAL ANALYSIS OF THE STATE AS A WHOLE Tables 2 and 3 present summary information of the State’s net assets and changes in net assets. Net Assets As presented in Table 2, total assets of the State on June 30, 2011 were $35.7 billion, while total liabilities were $23.0 billion, resulting in combined net assets (government and business-type activities) of $12.7 billion. The largest component of the State’s total net assets consists of $18.5 billion invested in capital assets (i.e., land, buildings, equipment, infrastructure, and others), less any related debt outstanding that was needed to acquire or construct the assets. Approximately $4.3 billion of net assets were restricted by external sources or the State Constitution or Statutes, and were not available to finance the day-to-day operations of the State. The unrestricted net assets, which, if positive, could be used at the State’s discretion, showed a negative balance of $(10.2) billion. Therefore, based on this measurement, no funds were available for discretionary purposes. A contributing factor to the negative balance is that governments recognize a liability on the government-wide statement of net assets as soon as an obligation is incurred. While financing focuses on when a liability will be paid, accounting is primarily concerned with when a liability is incurred. Accordingly, the State recognizes long-term liabilities (such as general obligation debt, compensated absences, and future benefits and loss liabilities – listed in Note 10 to the financial statements) on the statement of net assets. In addition to the effect of reporting long-term liabilities when incurred, the General Fund’s total deficit fund balance of $(3.0) billion at year-end, as discussed on Page 27, also contributed to the deficit unrestricted net assets reported in the statement of net assets. During Fiscal Year 2011, the State issued $1,175.5 million of general obligation bonds, primarily for the acquisition or improvement of land, water, property, highways, buildings, and equipment. General obligation bonds outstanding at June 30, 2011 totaled $6.7 billion. Outstanding annual appropriation bonds were $3.3 billion at June 30, 2011. Outstanding revenue bonds, which are not considered general obligation debt of the State, totaled $2.9 billion at June 30, 2011.
Table 2Net Assets(in millions)
TotalGovernmental Business-type Percentage
Activities Activities Total Change2011 2010* 2011 2010* 2011 2010* 2011-2010
Current and Other Assets $ 4,848.9 $ 4,654.5 $ 7,150.8 $ 6,915.8 $ 11,999.7 $ 11,570.3 3.7 %Capital Assets 18,309.8 17,481.8 5,409.6 4,991.4 23,719.4 22,473.2 5.5
Total Assets 23,158.6 22,136.3 12,560.4 11,907.3 35,719.1 34,043.5 4.9
Long-term Liabilities 11,062.7 10,382.8 3,669.0 3,475.9 14,731.8 13,858.7 6.3Other Liabilities 6,172.1 6,131.6 2,122.0 2,319.6 8,294.1 8,451.1 (1.9) Total Liabilities 17,234.8 16,514.4 5,791.0 5,795.5 23,025.8 22,309.9 3.2
Net Assets: Invested in Capital Assets Net of Related Debt 14,405.4 13,914.4 4,108.7 3,932.8 18,514.1 17,847.2 3.7 Restricted 1,269.7 1,125.0 3,078.1 2,668.6 4,347.8 3,793.6 14.6 Unrestricted (deficit) (9,751.3) (9,417.5) (417.3) (489.6) (10,168.7) (9,907.1) 2.6 Total Net Assets $ 5,923.8 $ 5,621.9 $ 6,769.4 $ 6,111.8 $ 12,693.2 $ 11,733.7 8.2
* Amounts for the prior fiscal year include prior period adjustments.
For the Fiscal Year Ended June 30, 2011
22
State of Wisconsin Management Discussion and Analysis
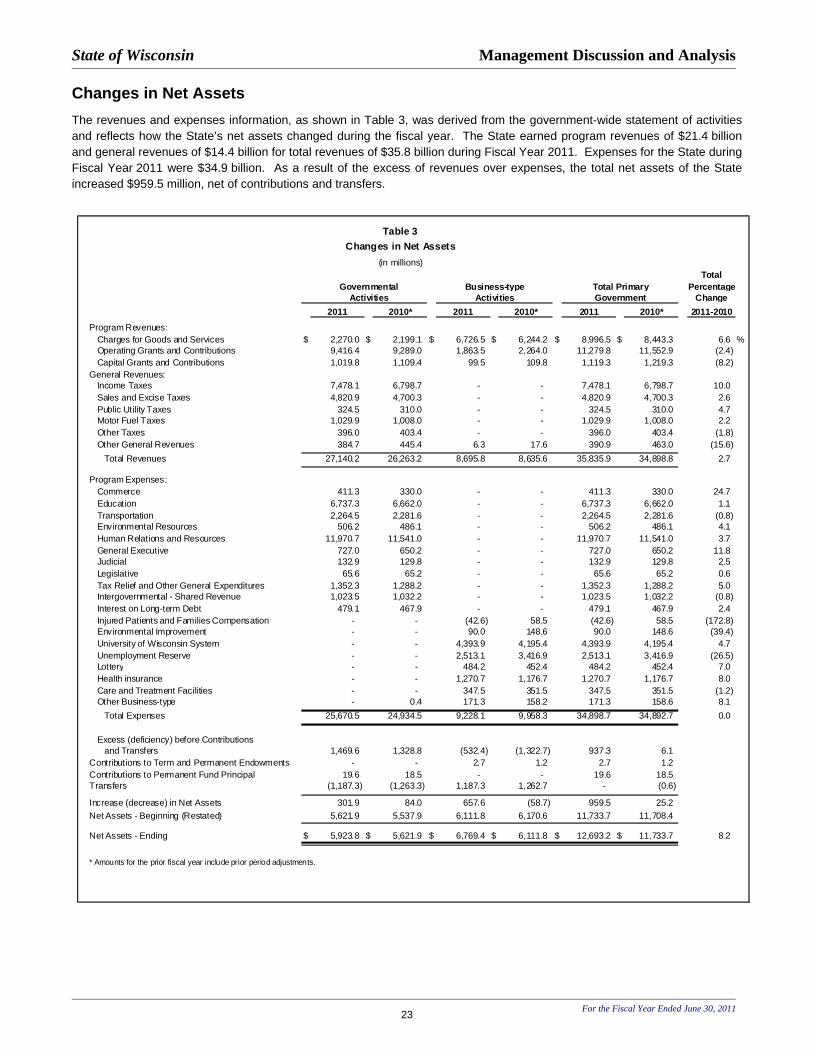
Changes in Net Assets The revenues and expenses information, as shown in Table 3, was derived from the government-wide statement of activities and reflects how the State’s net assets changed during the fiscal year. The State earned program revenues of $21.4 billion and general revenues of $14.4 billion for total revenues of $35.8 billion during Fiscal Year 2011. Expenses for the State during Fiscal Year 2011 were $34.9 billion. As a result of the excess of revenues over expenses, the total net assets of the State increased $959.5 million, net of contributions and transfers.
Table 3Changes in Net Assets
(in millions)Total
Governmental Business-type Total Primary PercentageActivities Activities Government Change
2011 2010* 2011 2010* 2011 2010* 2011-2010
Program Revenues: Charges for Goods and Services $ 2,270.0 $ 2,199.1 $ 6,726.5 $ 6,244.2 $ 8,996.5 $ 8,443.3 6.6 % Operating Grants and Contributions 9,416.4 9,289.0 1,863.5 2,264.0 11,279.8 11,552.9 (2.4) Capital Grants and Contributions 1,019.8 1,109.4 99.5 109.8 1,119.3 1,219.3 (8.2)General Revenues: Income Taxes 7,478.1 6,798.7 - - 7,478.1 6,798.7 10.0 Sales and Excise Taxes 4,820.9 4,700.3 - - 4,820.9 4,700.3 2.6 Public Utility Taxes 324.5 310.0 - - 324.5 310.0 4.7 Motor Fuel Taxes 1,029.9 1,008.0 - - 1,029.9 1,008.0 2.2 Other Taxes 396.0 403.4 - - 396.0 403.4 (1.8) Other General Revenues 384.7 445.4 6.3 17.6 390.9 463.0 (15.6) Total Revenues 27,140.2 26,263.2 8,695.8 8,635.6 35,835.9 34,898.8 2.7
Program Expenses: Commerce 411.3 330.0 - - 411.3 330.0 24.7 Education 6,737.3 6,662.0 - - 6,737.3 6,662.0 1.1 Transportation 2,264.5 2,281.6 - - 2,264.5 2,281.6 (0.8) Environmental Resources 506.2 486.1 - - 506.2 486.1 4.1 Human Relations and Resources 11,970.7 11,541.0 - - 11,970.7 11,541.0 3.7 General Executive 727.0 650.2 - - 727.0 650.2 11.8 Judicial 132.9 129.8 - - 132.9 129.8 2.5 Legislative 65.6 65.2 - - 65.6 65.2 0.6 Tax Relief and Other General Expenditures 1,352.3 1,288.2 - - 1,352.3 1,288.2 5.0 Intergovernmental - Shared Revenue 1,023.5 1,032.2 - - 1,023.5 1,032.2 (0.8) Interest on Long-term Debt 479.1 467.9 - - 479.1 467.9 2.4 Injured Patients and Families Compensation - - (42.6) 58.5 (42.6) 58.5 (172.8) Environmental Improvement - - 90.0 148.6 90.0 148.6 (39.4) University of Wisconsin System - - 4,393.9 4,195.4 4,393.9 4,195.4 4.7 Unemployment Reserve - - 2,513.1 3,416.9 2,513.1 3,416.9 (26.5) Lottery - - 484.2 452.4 484.2 452.4 7.0 Health insurance - - 1,270.7 1,176.7 1,270.7 1,176.7 8.0 Care and Treatment Facilities - - 347.5 351.5 347.5 351.5 (1.2) Other Business-type - 0.4 171.3 158.2 171.3 158.6 8.1 Total Expenses 25,670.5 24,934.5 9,228.1 9,958.3 34,898.7 34,892.7 0.0
Excess (deficiency) before Contributions and Transfers 1,469.6 1,328.8 (532.4) (1,322.7) 937.3 6.1 Contributions to Term and Permanent Endowments - - 2.7 1.2 2.7 1.2 Contributions to Permanent Fund Principal 19.6 18.5 - - 19.6 18.5 Transfers (1,187.3) (1,263.3) 1,187.3 1,262.7 - (0.6)
Increase (decrease) in Net Assets 301.9 84.0 657.6 (58.7) 959.5 25.2 Net Assets - Beginning (Restated) 5,621.9 5,537.9 6,111.8 6,170.6 11,733.7 11,708.4
Net Assets - Ending $ 5,923.8 $ 5,621.9 $ 6,769.4 $ 6,111.8 $ 12,693.2 $ 11,733.7 8.2
* Amounts for the prior fiscal year include prior period adjustments.
For the Fiscal Year Ended June 30, 2011 23
State of Wisconsin Management Discussion and Analysis
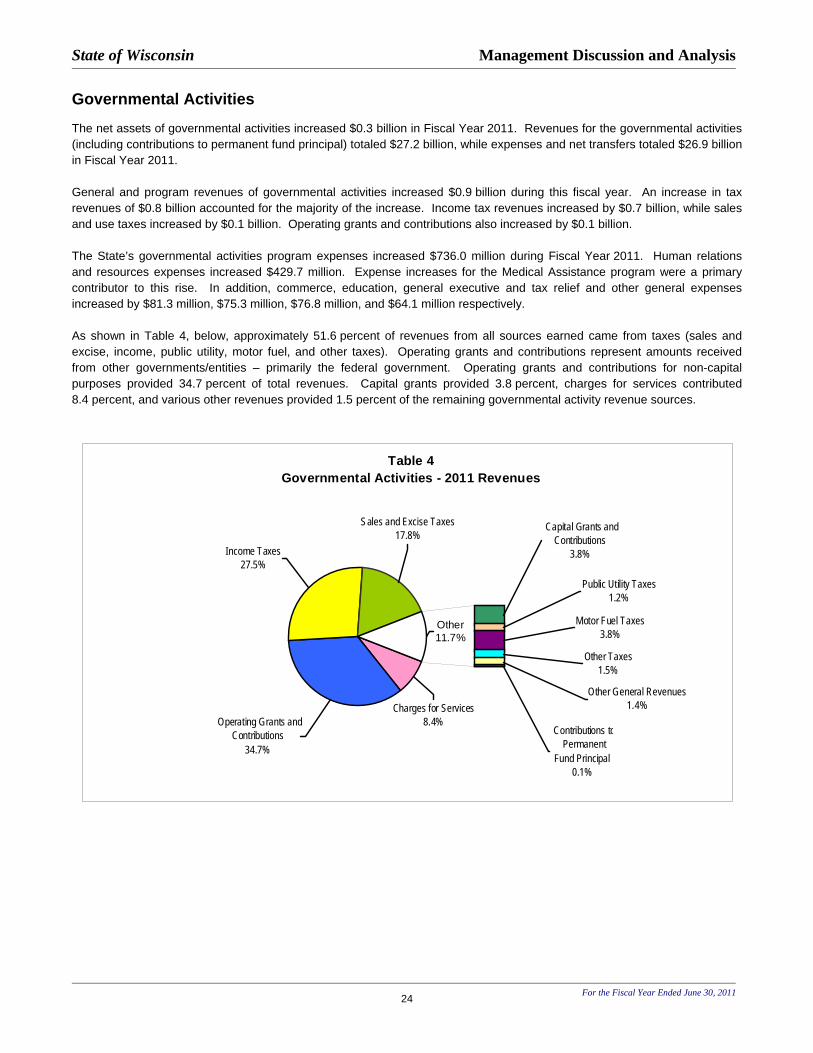
Governmental Activities The net assets of governmental activities increased $0.3 billion in Fiscal Year 2011. Revenues for the governmental activities (including contributions to permanent fund principal) totaled $27.2 billion, while expenses and net transfers totaled $26.9 billion in Fiscal Year 2011. General and program revenues of governmental activities increased $0.9 billion during this fiscal year. An increase in tax revenues of $0.8 billion accounted for the majority of the increase. Income tax revenues increased by $0.7 billion, while sales and use taxes increased by $0.1 billion. Operating grants and contributions also increased by $0.1 billion. The State’s governmental activities program expenses increased $736.0 million during Fiscal Year 2011. Human relations and resources expenses increased $429.7 million. Expense increases for the Medical Assistance program were a primary contributor to this rise. In addition, commerce, education, general executive and tax relief and other general expenses increased by $81.3 million, $75.3 million, $76.8 million, and $64.1 million respectively. As shown in Table 4, below, approximately 51.6 percent of revenues from all sources earned came from taxes (sales and excise, income, public utility, motor fuel, and other taxes). Operating grants and contributions represent amounts received from other governments/entities – primarily the federal government. Operating grants and contributions for non-capital purposes provided 34.7 percent of total revenues. Capital grants provided 3.8 percent, charges for services contributed 8.4 percent, and various other revenues provided 1.5 percent of the remaining governmental activity revenue sources.
Table 4Governmental Activities - 2011 Revenues
Other11.7%
Contributions to Permanent
Fund Principal0.1%
Other General Revenues1.4%
Other Taxes1.5%
Public Utility Taxes1.2%
Motor Fuel Taxes3.8%
Sales and Excise Taxes17.8%
Income Taxes27.5%
Capital Grants andContributions
3.8%
Operating Grants andContributions
34.7%
Charges for Services8.4%
For the Fiscal Year Ended June 30, 2011
24
State of Wisconsin Management Discussion and Analysis
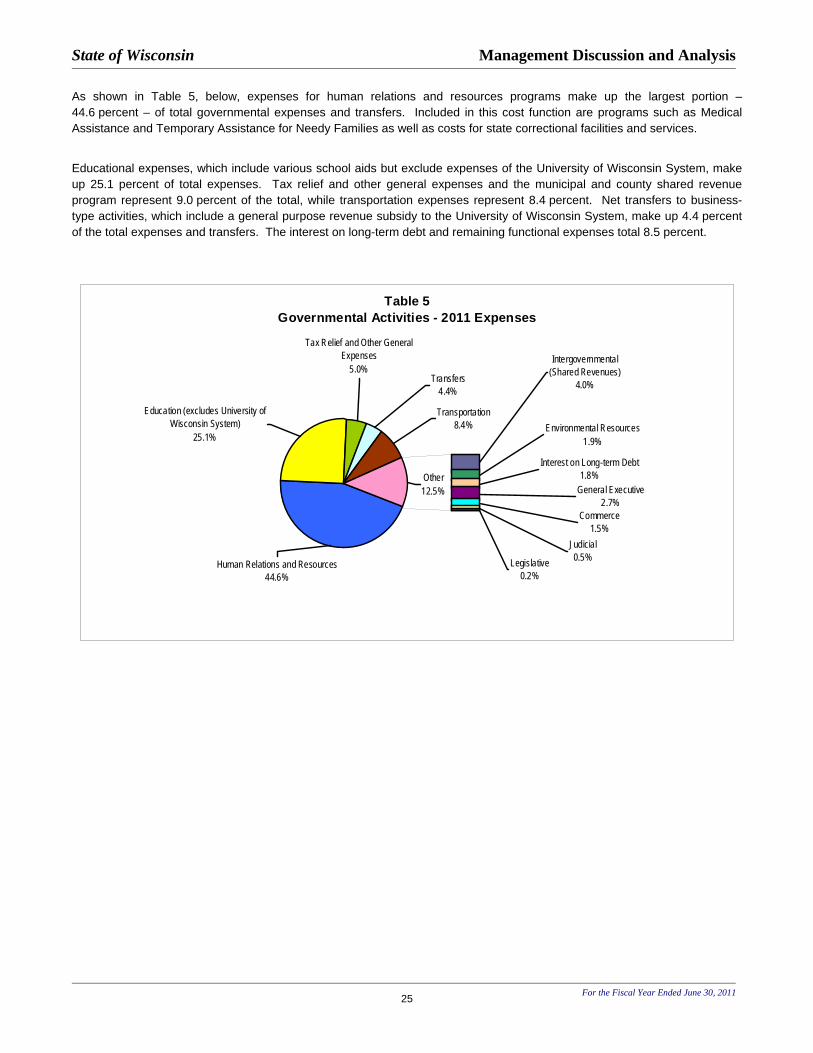
As shown in Table 5, below, expenses for human relations and resources programs make up the largest portion – 44.6 percent – of total governmental expenses and transfers. Included in this cost function are programs such as Medical Assistance and Temporary Assistance for Needy Families as well as costs for state correctional facilities and services.
Educational expenses, which include various school aids but exclude expenses of the University of Wisconsin System, make up 25.1 percent of total expenses. Tax relief and other general expenses and the municipal and county shared revenue program represent 9.0 percent of the total, while transportation expenses represent 8.4 percent. Net transfers to business-type activities, which include a general purpose revenue subsidy to the University of Wisconsin System, make up 4.4 percent of the total expenses and transfers. The interest on long-term debt and remaining functional expenses total 8.5 percent.
Table 5 Governmental Activities - 2011 Expenses
Tax Relief and Other General Expenses
5.0%Intergovernmental
(Shared Revenues)4.0%Transfers
4.4%
Human Relations and Resources44.6%
Education (excludes University of Wisconsin System)
25.1%
General Executive2.7%
Commerce1.5%
Interest on Long-term Debt1.8%
Judicial0.5%
Environmental Resources1.9%
Transportation8.4%
Legislative0.2%
Other12.5%
For the Fiscal Year Ended June 30, 2011
25

State of Wisconsin Management Discussion and Analysis
Business-Type Activities Net assets of the State’s business-type activities increased $657.6 million in Fiscal Year 2011. Total business-type program revenues increased $71.5 million. Two major funds account for most of the change. University of Wisconsin System operating revenues increased $203.4 million due primarily to increases in net student tuition and fees revenue (6.6 percent), federal grants and contracts (8.4 percent), and sales and services of educational activities (5.2 percent). Offsetting this increase were Unemployment Reserve Fund operating revenues which decreased $146.0 million. Revenues of business-type activities totaled $8.7 billion for Fiscal Year 2011. Program revenues consisted of $6.7 billion of charges for services, $1.9 billion of operating grants and contributions, and $99.5 million of capital grants and contributions. General revenues, contributions to endowments and permanent fund principal and net transfers totaled $6.3 million, $2.7 million, and $1,187.3 million, respectively. The total expenses for business-type activities were $9.2 billion. Program expenses decreased $730.1 million from Fiscal Year 2010 to 2011. The largest decrease in program expenses, $903.9 million, related to decreased benefit expenses for the Unemployment Reserve Fund. The Injured Patients and Families Compensation Fund also reported decreased expenses of $101.8 million. However, University of Wisconsin System program expenses increased by $179.8 million. Finally, non-major business-type activities reported an increase of $120.6 million. Table 6, below, compares the program revenues and program expenses of the various State business-type activities. This table does not include the transfer in (subsidy) from the General Fund to the University of Wisconsin System or other business-type activities. (Note: The Injured Patients and Families Compensation Fund reported negative program expenses of $43.3 million for the year. Thus, there are no expenses depicted in the table below.)
Table 6Fiscal Year 2011
Business-Type ActivitiesComparison of Program Revenues to Program Expenses
$0
$500
$1,000
$1,500
$2,000
$2,500
$3,000
$3,500
$4,000
$4,500
$5,000
Injur ed P atientsand Fami lies
Compensation
Envi ronmenta lImprov em ent
University o fWisc onsinSystem
UnemploymentReser ve
Lotter y Heal th Insurance Care andTr eatm ent
Other Business-ty pe
Tota
ls (i
n m
illio
ns)
Program Revenues(excludes generalrevenues)Program Expenses
For the Fiscal Year Ended June 30, 2011
26

State of Wisconsin Management Discussion and Analysis
For the Fiscal Year Ended June 30, 2011 27
FINANCIAL ANALYSIS OF THE STATE'S INDIVIDUAL FUNDS Governmental Funds In Fiscal Year 2011, the State implemented GASB Statement 54, Fund Balance Reporting and Governmental Fund Type Definitions. The statement, which applies to governmental funds, provides new fund balance classifications that comprise a hierarchy based primarily on the extent the State is bound to honor constraints on the specific purpose for which amounts can be spent. The previous reserved and unreserved classifications have been replaced with nonspendable, restricted, committed, and unassigned. Additional information on fund balance classifications is available in Note 1E 14. At the end of Fiscal Year 2011, the State's governmental funds reported a negative combined fund balance of $(1,655.0) million. Funds with significant changes in fund balance are discussed below: General Fund The General Fund is the chief operating fund of the State. At June 30, 2011, the State's General Fund reported a total fund deficit of $(2,994.8) million. The net change in fund balance during Fiscal Year 2011 was $(79.4) million, in contrast to $(166.1) million in Fiscal Year 2010. Major revenue, expenditure and other sources/uses contributing to the change in fund balance are as follows: Revenues
Revenues of the General Fund totaled $23,424.5 million in Fiscal Year 2011, an increase of $946.1 million from Fiscal Year 2010. Factors contributing to this change included the following: • Revenues from taxes increased $791.7 million from Fiscal Year 2010 to Fiscal Year 2011. The most significant
increase relates to income taxes, which increased $692.5 million or 10.2 percent from Fiscal Year 2010. Sales and use taxes increased 2.1 percent over Fiscal Year 2010 while public utility taxes increased approximately 4.7 percent. The largest component of individual income taxes is withholding from wages and salaries.
• Intergovernmental revenues (i.e., federal assistance) increased $78.9 million in Fiscal Year 2011, primarily due to an
increase in costs that were eligible for federal reimbursement. The most significant increase occurred in human relations and resources programs (e.g., Medical Assistance), which increased $184.4 million partially because of the higher federal Medical Assistance (MA) reimbursement rate allowed under ARRA through Fiscal Year 2011. In addition, the general executive function reported increased revenues of $147.0 million. Offsetting these increases was a $200.0 million decrease in education and a $76.1 million decrease in shared revenue functions.
• License and permits revenue increased $48.2 million. The human relations and resources function reported a $54.0
million increase due primarily to the levying of higher hospital assessment fees and increased licensed bed assessments. This was partially offset by general executive decreases.
Expenditures Expenditures of the General Fund totaled $22,145.8 million in Fiscal Year 2011, an increase of $777.0 million from Fiscal Year 2010. The factors contributing to the change included the following: • Human relations and resources expenditures increased $446.5 million in Fiscal Year 2011. Family Care, a MA
program, was the primary contributor due to an increase in the number of participants and additional counties participating in the program.
• The increase in the general executive expenditures of $96.6 million was largely attributable to an increase in
expenditures to localities. • Commerce expenditures increased $80.0 million due to increased aids to localities as well as grants and aids to
individuals and organizations.
• Education expenditures increased $77.4 million due to increased aid payments to schools.
• Tax relief and other general expenditures of the General Fund increased $55.4 million in Fiscal Year 2011.

State of Wisconsin Management Discussion and Analysis
For the Fiscal Year Ended June 30, 2011 28
• Other expenditures, including intergovernmental and the environmental resources and judicial functions, increased by
$14.2 million in Fiscal Year 2011, while capital outlay expenditures increased by $6.8 million.
Other Financing Sources and Uses
Other financing sources/uses and increases/decreases totaled a net $(1,358.2) million in Fiscal Year 2011, a change of $(82.4) million from the prior year. The components of this change included the following: • Transfers in to the General Fund decreased by $118.6 million (from $328.6 million in Fiscal Year 2010 to
$210.0 million in Fiscal Year 2011). This was a result of fewer lapses occurring from the other funds. • Transfers out of the General Fund totaled $1,579.0 million, a decrease of $33.4 million from the prior year. The
general purpose revenue supplement increased by $55.4 million and the transfers out to the nonmajor governmental funds increased by $50.4 million, however, this was offset by a decrease in the transfer out to the Injured Patients and Families Compensation Fund of $171.4 million.
Note 9E provides additional information on transfers in and out of the General Fund.
As of June 30, 2011, the General Fund reported an unassigned fund balance deficit of $(3,336.3) million. This compares to a General Fund unreserved fund balance deficit of $(3,453.4) million as of June 30, 2010. A deficit unassigned fund balance represents the excess of the liabilities of the General Fund over its assets and nonspendable, restricted, and committed fund balance accounts. General Fund Budgetary Highlights Differences between the original budget and the final amended budget were significant and included a $6.3 billion increase in appropriations. The receipt of funds under ARRA was a significant factor that contributed to some appropriation changes during the fiscal year. Also contributing to the variance is the fact that several of the State’s programs and various transfers (including Food Stamps - see the item denoted with *, below) are not included in the original budget. In addition, numerous adjustments to spending estimates were needed as the year progressed because of changing circumstances (spending needs can change dramatically over a one-year period). The largest variances occurred in the following appropriations (in millions):
Program Variance Food Stamps, Electronic Benefit Transfer* $ 1,104.9 Federal Aid Medical Assistance 975.1 UW-System Federal Aid Direct Student Loans (part of Statutory General Fund) 625.0 Administration Federal Aid; Local Assistance 164.1 UW System, Academic Student Fees (part of Statutory General Fund) 163.3 Commerce, Federal Aids; Individual and Organizations 156.9
Actual charges to appropriations (expenditures) were $3.8 billion below the final budgeted estimates. Large positive expenditure variances were reported in the Administration, Federal Aids; Individuals & Organizations ($189.8 million) and the Administration, Federal Aids ($153.0 million) appropriations. During the past fiscal year, the budgetary-based fund balance increased by $197.9 million for the statutory General Fund, in part, because of increased tax revenues, the receipt of additional federal grant reimbursements, and continued transfers/lapses of monies from other funds. Net transfers from other funds totaled $166.6 million in Fiscal Year 2011 compared to $220.2 million in the prior fiscal year.

State of Wisconsin Management Discussion and Analysis
For the Fiscal Year Ended June 30, 2011
29
Transportation Fund In Fiscal Year 2011, the Transportation Fund reported a net increase in fund balance of $118.2 million. This compares to a $143.4 million increase in fund balance in Fiscal Year 2010. This increase resulted primarily from the following factors: • Revenues of this fund decreased $81.1 million, to a total of $2,674.3 million, primarily relating to the ARRA decrease in
federal funding from the U.S. Department of Transportation and Federal Aviation Administration. For Fiscal Year 2010 and 2011, ARRA provided a total of $488.4 million in federal funding for highway projects. ARRA-funded expenditures for highway projects totaled $176.0 million in Fiscal Year 2011 and $312.4 million in Fiscal Year 2010. Expenditures of the fund totaled $2,500.1 million in Fiscal Year 2011 compared to $2,472.2 million in Fiscal Year 2010 (an increase of $27.9 million).
• Transfers out of the Transportation Fund decreased $29.9 million from Fiscal Year 2010 to 2011. Under 2009 Wisconsin
Act 28, $43.0 million was transferred to the General Fund in Fiscal Year 2011. In the prior year, transfers out to the General Fund totaled $84.8 million, a decrease of $41.8 million. At the same time, transfers in to the fund more than doubled in Fiscal Year 2011 to $35.4 million, primarily because of a legislatively mandated transfer of $24.1 million from the Petroleum Inspection Fund.
Capital outlay expenditures funded with general obligation bonds and reported in the Capital Improvement Fund (a capital projects fund) rather than the Transportation Fund, totaled $305.1 million in Fiscal Year 2011, an increase of $95.0 million from Fiscal Year 2010. In addition, capital outlay expenditures of $421.2 million were reported in the Transportation Fund in Fiscal Year 2011, an increase of $53.8 million from Fiscal Year 2010.
Common School Fund The Common School Fund, a permanent fund, provides low cost loans to municipalities and school districts for public purposes. Investment and interest earnings of the fund are primarily distributed to local school districts as library aids. This fund reported a net increase of $26.0 million in fund balance for the year. This compares to a $34.3 million increase in fund balance in Fiscal Year 2010. Significant changes to the accounts of this fund include: • Outstanding loans to local governments showed a decrease of $96.9 million in Fiscal Year 2011 (from $653.8 million in
Fiscal Year 2010 to $556.9 million in the current year). This represents a 14.8 percent decrease in loans over the prior year and is the result of loan prepayments being made by local governments.
• Investments of the fund increased $78.6 million in Fiscal Year 2011, from $48.1 million in Fiscal Year 2010 to $126.7
million in Fiscal Year 2011. Due to the prepayment of loans, additional cash has been available for investment in bonds.
Proprietary Funds The State’s proprietary funds provide the same type of information found in the government-wide financial statements but in more detail. Significant changes to balances of major proprietary funds from Fiscal Year 2010 to Fiscal Year 2011 include the following:
Environmental Improvement The Environmental Improvement Fund issued revenue bonds of $153.1 million in Fiscal Year 2011, of which $39.5 million was used to refund previous bond issues. The new revenue bonds contributed to a net increase of the fund’s liabilities of $53.0 million or approximately 6.0 percent over Fiscal Year 2010. A primary purpose of this fund is to provide loans to local governments for environmental purposes (e.g., clean water projects), therefore loans receivable reported a corresponding increase of $80.4 million or 4.4 percent. Additional Clean Water ARRA funds of $28.7 million were disbursed to municipalities during Fiscal Year 2011. Safe Drinking Water ARRA funds of $10.6 million were also disbursed during the fiscal year.

State of Wisconsin Management Discussion and Analysis
For the Fiscal Year Ended June 30, 2011
30
Injured Patients and Families Compensation Fund equity of the Injured Patients and Families Compensation Fund increased by $161.6 million from $132.8 million to $294.4 million at June 30, 2011. The increase is the result of a reduction in benefit expenses, increased assessment revenue, decreased investment revenue, and an accrued transfer in of $31.1 million from the General Fund. During Fiscal Year 2011, the Wisconsin Supreme Court ruled that a $200 million transfer out from the Fund to the General Fund pursuant to 2007 Wisconsin Act 20 was unconstitutional. As a result, the $200 million transfer out plus accumulated interest and lost earnings of $33.7 million must be returned to the Fund. The Fund reported benefits expense of negative $44.3 million for Fiscal Year 2011. In comparison, benefits expense from the prior year was $57.7 million. The $102.0 million decrease is the result of an actuarial reduction to prior years’ estimated liabilities netted with the increase from the addition of another benefit year. As a result of this actuarial estimate, the total liability for future benefit and loss liabilities also decreased $84.6 million to $636.5 million. Total assets of the Fund increased $79.4 million to $934.5 million. Besides reporting cash and investments of $693.1 million, the Fund also reported an advance to other funds of $233.7 million. The advance represents the total amount owed to the Fund from the General Fund as a result of the Supreme Court decision. Investment and interest income decreased by $13.7 million to $54.3 million primarily due to market factors and changes in the investments held. Assessment income increased by $3.9 million to $33.6 million for Fiscal Year 2011 as a result of an 8.5 percent increase in assessment rates and increases in the number of providers participating in the Fund.
Unemployment Reserve Fund equity of the Unemployment Reserve Fund decreased by $5.8 million during Fiscal Year 2011 from $(920.3) million at June 30, 2010 to $(926.1) million at June 30, 2011. Benefit expenses decreased from $3,416.9 million in Fiscal Year 2010 to $2,513.0 million in Fiscal Year 2011, a decrease of $903.9 million (26.5 percent). The decrease in benefits is the result of the average unemployment rate falling from 8.9 percent during Fiscal Year 2010 to 7.7 percent during Fiscal Year 2011. In addition, benefit periods were reduced from a possible 99 weeks to a possible 86 weeks. Total operating revenues decreased by $146.0 million from $2,659.8 million in Fiscal Year 2010 to $2,513.8 million in Fiscal Year 2011. Federal aids for the unemployment program decreased by $402.7 million to $1,308.8 million in Fiscal Year 2011. Employer contributions increased from $828.6 million in Fiscal Year 2010 to $1,087.3 in Fiscal Year 2011, an increase of $258.7 million. The increase in employer contributions is primarily due to the higher taxable wage base that took effect in calendar year 2011. The advance from the federal government decreased by $101.8 million during Fiscal Year 2011 going from $1,424.8 million at June 30, 2010 to $1,323.0 million at June 30, 2011. Starting in January 2011 the Fund began incurring approximately 4.0 percent annual interest on the amount borrowed and owed $29.7 million in interest as of June 30, 2011. Because the Fund has had a loan balance outstanding on both January 1, 2010 and January 1, 2011, the federal government will begin recovering the loan from employers by incrementally reducing the employers’ federal unemployment tax credit by an additional 0.3 percent each year beginning with the tax due for Calendar Year 2011.
University of Wisconsin System In Fiscal Year 2011, operating revenues of the University of Wisconsin System increased $203.4 million or approximately 6.6 percent. Revenue was enhanced by an increase in federal grants and contracts of $77.0 million (8.4 percent) and sales and services of educational activities which increased by $14.7 million (5.2 percent). Increased student tuition and fees of $67.0 million (6.6 percent) were also reported due primarily to an increase in tuition rates approved by the Board of Regents. Other revenues increased by $44.6 million. Fiscal Year 2011 operating expenses increased $179.8 million or 4.3 percent from Fiscal Year 2010. The increase is due primarily to an increase of personal services, supplies and services, depreciation, and scholarship and fellowships expenses of $104.8 million, $36.1 million, $23.9 million, and $12.3 million respectively.

State of Wisconsin Management Discussion and Analysis
GOVERNMENT-WIDE CAPITAL ASSET AND DEBT ADMINISTRATION
Capital Assets
At the close of Fiscal Year 2011, the State had $23.7 billion invested in capital assets, net of accumulated depreciation of $4.5 billion. This represents an increase of $1,231.5 million, or 5.5 percent, from Fiscal Year 2010. Depreciation charges totaled $118.0 million and $237.7 million for governmental and business-type activities, respectively, in Fiscal Year 2011. The details of these assets are presented in Table 7, below. Additional information about the State’s capital assets is presented in Note 7 to the financial statements.
Table 7 Capital Assets, Net of Depreciation, as of June 30
(in millions)
Governmental Business-Type TotalActivities Activities Primary Government
2011 2010 2011 2010 2011 2010
Land and Land Improvements $ 2,310 $ 2,183 $ 157 $ 137 $ 2,467 $ 2,321 Buildings and Improvements 1,345 1,369 3,273 2,974 4,618 4,342 Library Holdings 84 83 1,124 1,107 1,208 1,189 Machinery and Equipment 328 318 367 277 696 595 Infrastructure 12,789 12,375 - - 12,789 12,375 Construction in Progress 1,454 1,170 488 497 1,943 1,667
Totals $ 18,310 $ 17,497 $ 5,410 $ 4,991 $ 23,719 $ 22,488
The major capital asset additions completed or acquired during Fiscal Year 2011 included the: • Union South Replacement – UW-Madison ($93.2 million), • Institute for Discovery – UW-Madison ($50.3 million), • New Academic Building – UW-Oshkosh ($37.0 million), • New Residence Hall – UW-Whitewater ($34.5 million), • New Academic Building – UW-La Crosse ($33.9 million), • Education Building Renovation – UW-Madison ($32.0 million), • Sterling Hall Renovation – UW-Madison ($18.0 million), • Chadbourne and Barnard Hall – UW-Madison ($13.8 million), • Hovlid Hall Renovation – UW-Stout ($13.7 million), and • Multi-Building Energy Conservation – UW-Milwaukee ($10.1 million).
In addition to these completed projects, construction in progress as of June 30, 2011 for governmental and business-type activities totaled $1,454.1 million and $488.4 million, respectively. A list of construction in progress projects is provided in Note 7. The State’s continuing or proposed major capital projects for Fiscal Year 2011 through 2019 include: • I-94 North South Freeway Project (completion in 2016) $1.9 billion, • US 41 Winnebago and Brown Counties (completion in 2018) $1.5 billion, • Highway 26 Janesville to Watertown (completion in 2014) $469 million, • Highway 12 Lake Delton to Sauk City (completion in 2018) $225 million, • Renovation and Remodeling of the Charter Street Heating Plant (estimated cost $251 million), • Wisconsin Institutes for Medical Research – Center Tower – UW-Madison (estimated cost $135 million), • Wisconsin Energy Institute – UW-Madison (estimated cost $100 million), • UW-Milwaukee Facilities Master Plan ($240 million for various projects), • Joint Historical and Veterans Museum (estimated budget of $75 million), and • UW-Madison Athlete Performance Center (estimated budget of $76.8 million).
For the Fiscal Year Ended June 30, 2011
31

State of Wisconsin Management Discussion and Analysis
For the Fiscal Year Ended June 30, 2011
32
Debt Administration The State of Wisconsin Building Commission, an agency of the State, is empowered by law to consider, act upon, authorize, issue and sell all debt obligations of the State. The total general obligation debt outstanding for the State as of June 30, 2011 was $6.7 billion, as shown in Table 8. During Fiscal Year 2011, $1,175.5 million of general obligation bonds were issued to provide for the acquisition or improvement of land, water, property, highways, buildings, equipment, or facilities for public purposes or to refund outstanding bonds. Of the bonds issued in the current year, $304.2 million was to be used for University of Wisconsin System academic and self-amortizing facilities; $306.4 million for transportation projects, $68.0 million for the Stewardship Program, $48.8 for environmental programs, and $136.4 million for various other projects. In addition, bond proceeds of $311.7 million were used to refund outstanding general obligation bonds. In Fiscal Year 2004, the State issued $1.8 billion of annual appropriation bonds to pay the State’s unfunded accrued prior service (pension) liability and its unfunded accrued liability for sick leave conversion credits. In Fiscal Year 2009, the State issued $1.5 billion of annual appropriation bonds to purchase the future right, title, and interest in the Tobacco Settlement Revenues (TSRs) from Badger Tobacco Asset Securitization Corporation (BTASC) as well as pay any issuance expenses. As of June 30, 2011, $3.3 billion of these bonds were outstanding. Chapter 18 of the Wisconsin Statutes authorizes the State to issue revenue obligations. These obligations, which are not general obligation debt of the State, are secured by a pledge of revenues or property derived from the operations of a program funded by the issuance of the obligations. Revenue bonds of the primary government totaled $2.9 billion outstanding at June 30, 2011, as shown in Table 8. These bonds included $1,796.5 million of Transportation Revenue Bonds, $127.1 million of Petroleum Inspection Revenue Bonds, and $937.0 million of Environmental Improvement Revenue Bonds.

State of Wisconsin Management Discussion and Analysis
For the Fiscal Year Ended June 30, 2011
33
Table 8 Outstanding Debt as of June 30, 2011 and 2010
(in millions)
Governmental Business-Type Activities Activities Total 2011 2010 2011 2010 2011 2010
General obligation bonds $5,337.9 $4,779.7 $1,392.4 $1,235.4 $ 6,730.3 $ 6,015.1 Annual appropriation bonds 3,331.6 3,357.7 -- -- 3,331.6 3,357.7 Revenue bonds 1,923.6 1,801.1 937.0 882.2 2,860.6 2,683.3 Totals $10,593.1 $9,938.5 $2,329.4 $2,117.6 $12,922.5 $12,056.1
Article VIII of the Wisconsin Constitution and Wis. Stat. Sec. 18.05 limit the amount of general obligation bond debt the State can contract in total and in any calendar year. In total, debt cannot exceed five percent of the value of all taxable property in the State. The amount of debt contracted in any calendar year is limited to the lesser of three-quarters of one percent of the aggregate value of taxable property or five percent of the aggregate value of taxable property less net indebtedness at January 1. At June 30, 2011, State of Wisconsin general obligation fixed rate bonds had a rating of Aa2 from Moody's Investors Services, AA from Standard and Poor's Rating Services, and AA from Fitch Ratings. General obligation variable notes had a rating of P-1 from Moody’s, A-1+ from Standard and Poor’s Corporation, and F1+ from Fitch Investors Services, L.P. Detailed information about the State’s long-term debt activity is presented in Note 11 to the financial statements.
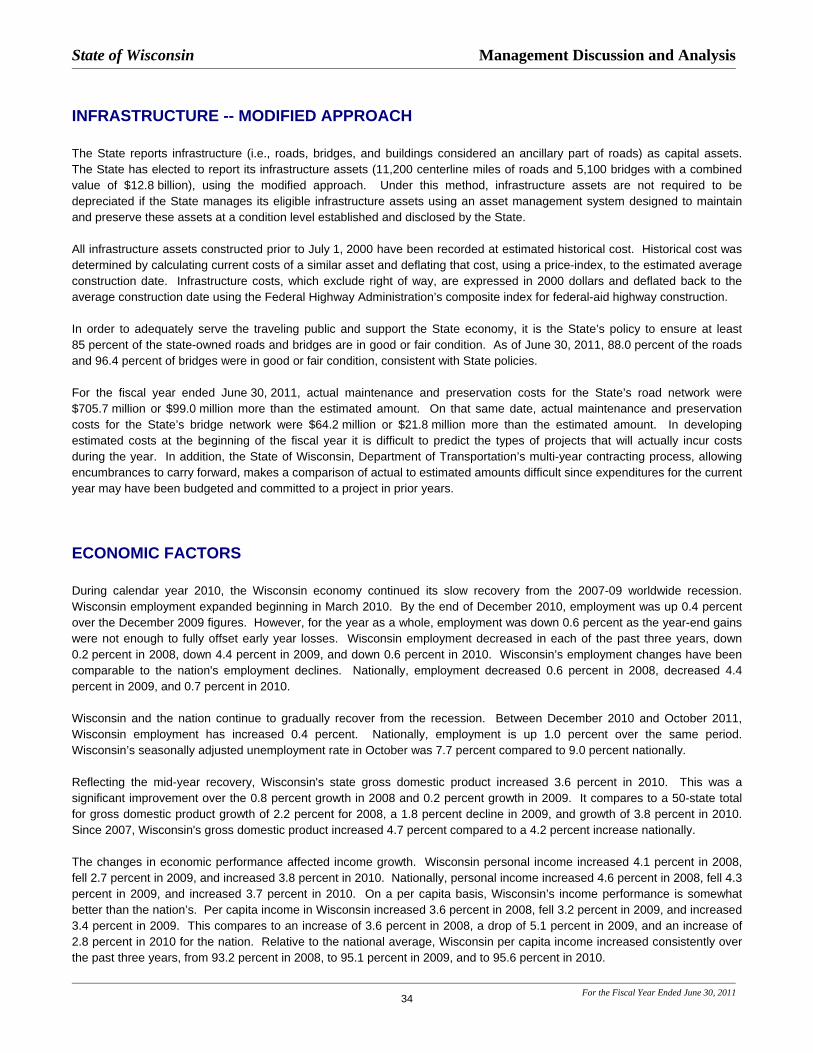
State of Wisconsin Management Discussion and Analysis
For the Fiscal Year Ended June 30, 2011
34
INFRASTRUCTURE -- MODIFIED APPROACH The State reports infrastructure (i.e., roads, bridges, and buildings considered an ancillary part of roads) as capital assets. The State has elected to report its infrastructure assets (11,200 centerline miles of roads and 5,100 bridges with a combined value of $12.8 billion), using the modified approach. Under this method, infrastructure assets are not required to be depreciated if the State manages its eligible infrastructure assets using an asset management system designed to maintain and preserve these assets at a condition level established and disclosed by the State. All infrastructure assets constructed prior to July 1, 2000 have been recorded at estimated historical cost. Historical cost was determined by calculating current costs of a similar asset and deflating that cost, using a price-index, to the estimated average construction date. Infrastructure costs, which exclude right of way, are expressed in 2000 dollars and deflated back to the average construction date using the Federal Highway Administration’s composite index for federal-aid highway construction. In order to adequately serve the traveling public and support the State economy, it is the State’s policy to ensure at least 85 percent of the state-owned roads and bridges are in good or fair condition. As of June 30, 2011, 88.0 percent of the roads and 96.4 percent of bridges were in good or fair condition, consistent with State policies. For the fiscal year ended June 30, 2011, actual maintenance and preservation costs for the State’s road network were $705.7 million or $99.0 million more than the estimated amount. On that same date, actual maintenance and preservation costs for the State’s bridge network were $64.2 million or $21.8 million more than the estimated amount. In developing estimated costs at the beginning of the fiscal year it is difficult to predict the types of projects that will actually incur costs during the year. In addition, the State of Wisconsin, Department of Transportation’s multi-year contracting process, allowing encumbrances to carry forward, makes a comparison of actual to estimated amounts difficult since expenditures for the current year may have been budgeted and committed to a project in prior years.
ECONOMIC FACTORS During calendar year 2010, the Wisconsin economy continued its slow recovery from the 2007-09 worldwide recession. Wisconsin employment expanded beginning in March 2010. By the end of December 2010, employment was up 0.4 percent over the December 2009 figures. However, for the year as a whole, employment was down 0.6 percent as the year-end gains were not enough to fully offset early year losses. Wisconsin employment decreased in each of the past three years, down 0.2 percent in 2008, down 4.4 percent in 2009, and down 0.6 percent in 2010. Wisconsin’s employment changes have been comparable to the nation's employment declines. Nationally, employment decreased 0.6 percent in 2008, decreased 4.4 percent in 2009, and 0.7 percent in 2010. Wisconsin and the nation continue to gradually recover from the recession. Between December 2010 and October 2011, Wisconsin employment has increased 0.4 percent. Nationally, employment is up 1.0 percent over the same period. Wisconsin’s seasonally adjusted unemployment rate in October was 7.7 percent compared to 9.0 percent nationally. Reflecting the mid-year recovery, Wisconsin's state gross domestic product increased 3.6 percent in 2010. This was a significant improvement over the 0.8 percent growth in 2008 and 0.2 percent growth in 2009. It compares to a 50-state total for gross domestic product growth of 2.2 percent for 2008, a 1.8 percent decline in 2009, and growth of 3.8 percent in 2010. Since 2007, Wisconsin's gross domestic product increased 4.7 percent compared to a 4.2 percent increase nationally. The changes in economic performance affected income growth. Wisconsin personal income increased 4.1 percent in 2008, fell 2.7 percent in 2009, and increased 3.8 percent in 2010. Nationally, personal income increased 4.6 percent in 2008, fell 4.3 percent in 2009, and increased 3.7 percent in 2010. On a per capita basis, Wisconsin’s income performance is somewhat better than the nation’s. Per capita income in Wisconsin increased 3.6 percent in 2008, fell 3.2 percent in 2009, and increased 3.4 percent in 2009. This compares to an increase of 3.6 percent in 2008, a drop of 5.1 percent in 2009, and an increase of 2.8 percent in 2010 for the nation. Relative to the national average, Wisconsin per capita income increased consistently over the past three years, from 93.2 percent in 2008, to 95.1 percent in 2009, and to 95.6 percent in 2010.

State of Wisconsin Management Discussion and Analysis
For the Fiscal Year Ended June 30, 2011
35
Wisconsin’s property values reflect the continuing weakness in housing and commercial real estate markets. In 2010, real property values declined 3.2 percent with residential real estate values falling 3.5 percent. Commercial real estate values decreased 2.4 percent in 2010. In 2011, real property values declined 1.8 percent, primarily due to a reduction of 1.6 percent in residential real estate values and a reduction of 2.3 percent in commercial real estate values.
CONTACTING THE STATE'S FINANCIAL MANAGEMENT This financial report is designed to provide Wisconsin's citizens, taxpayers, customers, investors and creditors with a general overview of the State's finances and to demonstrate the State's accountability for the money it receives. Questions about this report or requests for additional financial information should be addressed to: State of Wisconsin, State Controller's Office, 101 E. Wilson Street, 5th Floor, Madison, WI 53707 or by email to: [email protected]. Some state agencies, such as Department of Employee Trust Funds, issue stand-alone audited financial statements for certain state funds. The information contained in those statements may vary from this document due to scope and application of generally accepted accounting principles. Questions about how to obtain the separately issued financial statements should be directed to individual agencies or to the State Controller’s Office. The State’s component units issue their own separate audited financial statements. These statements may be obtained by directly contacting the component unit through their administrative offices identified in Note 1-B.
* * * *

36

Basic Financial Statements
37

38

State of WisconsinStatement of Net Assets June 30, 2011
(In Thousands)
Primary GovernmentGovernmental Business-Type Component
Activities Activities Totals Units
Assets and Deferred Outflows
Cash and Cash Equivalents $ 1,139,529 $ 1,627,205 $ 2,766,734 $ 833,425 Investments 150,026 1,432,788 1,582,813 474,048 Cash and Investments with Other Component Units - - - 265,012 Receivables (net of allowance) 3,372,332 3,100,167 6,472,499 2,539,771 Internal Balances (662,710) 662,710 - - Inventories 32,673 51,522 84,194 8,483 Prepaid Items 323,446 93,583 417,029 6,298 Capital Leases Receivable - Component Units - 4,151 4,151 - Restricted and Limited Use Assets: Cash and Cash Equivalents 168,777 153,496 322,273 82,938 Investments 121,844 - 121,844 2,395,340 Deferred Charges 72,075 18,081 90,156 7,994 Other Assets 26,911 7,120 34,031 79,681 Capital Assets: Depreciable 1,581,050 3,645,422 5,226,472 380,132 Nondepreciable: Infrastructure 12,788,813 - 12,788,813 - Other 3,939,890 1,764,200 5,704,090 27,609
Deferred Outflows of Resources 103,955 - 103,955 91,245
Total Assets and Deferred Outflows 23,158,611 12,560,442 35,719,053 7,191,976
Liabilities
Accounts Payable and Other Accrued Liabilities 916,935 363,025 1,279,960 145,473 Due to Other Governments 2,273,338 48,403 2,321,741 19,117 Tax Refunds Payable 1,466,127 - 1,466,127 - Tax and Other Deposits 37,127 21,019 58,146 72,099 Amounts Held in Trust by Component Unit for Other Component Units - - - 251,702 Amounts Held in Trust by Component Unit for Others - - - 24,698 Unearned Revenue 512,287 291,064 803,350 1,224 Interest Payable 112,209 15,207 127,416 27,477 Short-term Notes Payable 750,128 60,277 810,405 - Other Liabilities 103,955 - 103,955 101,546 Advance from Federal Government - 1,322,974 1,322,974 - Long-term Liabilities: Current Portion 645,983 340,195 986,178 102,872 Noncurrent Portion 10,416,731 3,328,846 13,745,577 2,852,178
Total Liabilities 17,234,819 5,791,009 23,025,829 3,598,386
Net Assets
Invested in Capital Assets, Net of Related Debt 14,405,385 4,108,668 18,514,054 162,923 Restricted for: Human Relations and Resources 52,462 - 52,462 - Conservation Related 55,088 - 55,088 - General Executive 70,537 - 70,537 - Commerce 30,496 - 30,496 - Debt Service 114,526 - 114,526 - Environmental Improvement - 1,609,417 1,609,417 - Permanent Trusts: Expendable 11,038 302,837 313,875 8,924 Nonexpendable 871,627 155,642 1,027,268 1,923 Future Benefits - 592,740 592,740 33,498 Other Purposes 63,972 417,450 481,421 2,691,021 Unrestricted (9,751,338) (417,321) (10,168,659) 695,301
Total Net Assets $ 5,923,792 $ 6,769,433 $ 12,693,225 $ 3,593,590
The notes to the financial statements are an integral part of this statement.
39

State of WisconsinStatement of Activities For the Fiscal Year Ended June 30, 2011
(In Thousands)
Operating Grants, Capital Grants,Contributions Contributions
Charges for and Restricted and RestrictedFunctions/Programs Expenses Services Interest Interest
Primary Government: Governmental Activities:
Commerce $ 411,297 $ 245,893 $ 193,973 $ - Education 6,737,282 21,594 1,036,065 - Transportation 2,264,460 678,493 127,608 1,011,402 Environmental Resources 506,235 231,990 98,606 3,929 Human Relations and Resources 11,970,708 701,312 7,543,276 4,462 General Executive 727,015 271,082 371,771 - Judicial 132,940 63,623 842 - Legislative 65,641 1,831 - - Tax Relief and Other General Expenses 1,352,293 - 44,230 - Intergovernmental - Shared Revenue 1,023,532 54,199 - - Interest on Debt 479,142 - - - Total Governmental Activities 25,670,547 2,270,017 9,416,373 1,019,793
Business-type Activities:Injured Patients and Families Compensation (42,589) 33,648 54,250 - Environmental Improvement 90,037 50,614 101,224 - University of Wisconsin System 4,393,866 3,284,047 278,709 96,343 Unemployment Reserve 2,513,060 1,205,063 1,308,783 - Lottery 484,229 502,960 (1,067) - Health Insurance 1,270,704 1,288,426 39,092 - Care and Treatment Facilities 347,500 276,273 696 3,168 Other Business-type 171,335 85,482 81,766 10 Total Business-type Activities 9,228,143 6,726,514 1,863,453 99,521
Total Primary Government $ 34,898,690 $ 8,996,531 $ 11,279,825 $ 1,119,314
Component Units: Housing and Economic Development Authority $ 316,338 $ 151,525 $ 176,271 $ - Health Care Liability Insurance Plan 1,117 4,220 3,038 - University Hospitals and Clinics Authority 1,012,554 1,080,022 - 3,286 University of Wisconsin Foundation 237,271 278,427 165,668 - State Fair Park Exposition Center, Inc. - - - -
Total Component Units $ 1,567,280 $ 1,514,193 $ 344,976 $ 3,286
General Revenues:Dedicated for General Purposes: Income Taxes Sales and Excise Taxes Public Utility Taxes Other TaxesMotor Fuel/Other Taxes Dedicated for TransportationOther Dedicated TaxesInterest and Investment EarningsMiscellaneous
Contributions to Term and Permanent EndowmentsContributions to Permanent Fund PrincipalTransfers
Total General Revenues, Contributions, and TransfersChange in Net AssetsNet Assets - Beginning
Net Assets - Ending
The notes to the financial statements are an integral part of this statement.
Program Revenues
40

Governmental Business-Type ComponentActivities Activities Total Units
$ 28,569 $ 28,569 (5,679,624) (5,679,624)
(446,957) (446,957) (171,710) (171,710)
(3,721,658) (3,721,658) (84,162) (84,162) (68,474) (68,474) (63,810) (63,810)
(1,308,063) (1,308,063) (969,333) (969,333) (479,142) (479,142)
(12,964,364) (12,964,364)
$ 130,487 130,487 61,801 61,801
(734,767) (734,767) 786 786
17,664 17,664 56,815 56,815
(67,364) (67,364) (4,077) (4,077)
- (538,655) (538,655) (12,964,364) (538,655) (13,503,019)
$ 11,458 6,140
70,754 206,824
-
295,176
7,478,058 - 7,478,058 - 4,820,894 - 4,820,894 -
324,480 - 324,480 - 202,317 - 202,317 -
1,029,857 - 1,029,857 - 193,723 - 193,723 -
2,072 6,286 8,358 32,543 382,580 11 382,591 -
- 2,698 2,698 644 19,592 - 19,592 -
(1,187,273) 1,187,273 - -
13,266,301 1,196,268 14,462,568 33,187 301,937 657,612 959,549 328,363
5,621,855 6,111,821 11,733,676 3,265,227
$ 5,923,792 $ 6,769,433 $ 12,693,225 $ 3,593,590
Primary Government
Net (Expense) Revenue and Changes in Net Assets
41

State of WisconsinBalance Sheet - Governmental Funds June 30, 2011
(In Thousands)
Common Nonmajor TotalGeneral Transportation School Governmental Governmental
Assets Cash and Cash Equivalents $ 10,416 $ 730,941 $ 154,163 $ 231,365 $ 1,126,885 Investments 777 - 126,709 22,540 150,026 Receivables (net of allowance): Taxes 1,106,644 96,916 - 30,810 1,234,370 Loans to Local Governments 1,122 - 556,870 23,543 581,535 Other Loans Receivable 24,515 22,375 - - 46,890 Other Receivables 420,465 8,003 1,051 57,204 486,723 Due from Other Funds 197,523 61,942 776 90,777 351,018 Due from Component Units 225 - - - 225 Due from Other Governments 681,501 236,117 8,326 17,904 943,849 Inventories 11,579 12,937 - 2,702 27,218 Prepaid Items 305,925 4,003 - 12,803 322,731 Advances to Other Funds - - - - - Restricted and Limited Use Assets: Cash and Cash Equivalents - - - 168,777 168,777 Investments - - - 121,844 121,844 Other Assets 26,911 - - - 26,911
Total Assets $ 2,787,604 $ 1,173,234 $ 847,895 $ 780,270 $ 5,589,003
Liabilities and Fund Balances
Liabilities: Accounts Payable and Other Accrued Liabilities $ 624,553 $ 203,301 $ - $ 39,386 $ 867,240 Due to Other Funds 151,810 38,692 1,490 109,254 301,247 Interfund Payables 376,002 - - 18,124 394,126 Due to Other Governments 2,158,406 104,064 - 10,867 2,273,338 Tax Refunds Payable 1,459,971 5,995 - 162 1,466,127 Tax and Other Deposits 26,073 489 - 10,565 37,127 Unearned Revenue 480,099 25,855 - 5,618 511,572 Deferred Revenue 270,745 646 - 9,024 280,415 Interest Payable - - - 46,617 46,617 Advances from Other Funds 234,749 - - 3,451 238,200 Short-term Notes Payable - - - 746,757 746,757 Revenue Bonds and Notes Payable - - - 81,200 81,200
Total Liabilities 5,782,409 379,043 1,490 1,081,025 7,243,967
Fund Balances: Nonspendable 158,629 16,940 835,367 52,020 1,062,955 Restricted 166,256 - 11,038 220,571 397,864 Committed 16,586 781,294 - 128,679 926,559 Assigned - - - - - Unassigned (3,336,276) (4,043) - (702,023) (4,042,342)
Total Fund Balances (2,994,806) 794,192 846,405 (300,754) (1,654,964)
Total Liabilities and Fund Balances $ 2,787,604 $ 1,173,234 $ 847,895 $ 780,270 $ 5,589,003
(Continued)
42

State of WisconsinBalance Sheet - Governmental Funds June 30, 2011
(Continued)
TotalGovernmental
Reconciliation to the Statement of Net Assets:
Total Fund Balances - Governmental Funds (from previous page) $ (1,654,964)
Capital assets used in governmental activities are not financialresources and, therefore, are not reported in the funds:
Infrastructure 12,788,813 Other Capital Assets 6,326,028 Accumulated Depreciation (1,102,396)
18,012,445
Other long-term assets that are not available to pay forcurrent period expenditures and, therefore, are deferredin the funds. 74,656
Some of the State's revenues will be collected after year-endbut are not available soon enough to pay for the currentperiod's expenditures and, therefore, are deferred in the funds. 279,701
Internal service funds are used by management to charge thecosts of certain activities, such as telecommunications and insurance, to individual funds. The assets and liabilities of the internal service funds are included in governmental activitiesin the Statement of Net Assets. 4,353
Long-term liabilities, including bonds payable, are not due and payable in the current period and, therefore, are not reported inthe fund statements. These liabilities, however, are included inthe Statement of Net Assets.
Revenue Bonds Payable (1,842,455) Appropriation Bonds Payable (3,331,570) General Obligation Bonds Payable (5,182,769) Accrued Interest on Bonds (65,592) Capital Leases (39,939) Installment Contracts (265) Compensated Absences (146,272) Pollution Remediation (11,100) Claims and Judgments (2,355) Other Postemployment Benefits Liability (170,081)
(10,792,398)
Net Assets of Governmental Activities as reported on the Statement of Net Assets (See page 39) $ 5,923,792
The notes to the financial statements are an integral part of this statement.
43

State of WisconsinStatement of Revenues, Expenditures, and Changes in Fund Balances - Governmental Funds For the Fiscal Year Ended June 30, 2011
(In Thousands)
Common Nonmajor TotalGeneral Transportation School Governmental Governmental
Revenues: Taxes $ 12,822,887 $ 1,029,734 $ - $ 193,974 $ 14,046,595 Intergovernmental 9,071,207 1,132,544 - 96,889 10,300,640 Licenses and Permits 800,044 475,871 - 600,410 1,876,325 Charges for Goods and Services 308,272 19,715 26 22,149 350,162 Investment and Interest Income (1,037) 167 31,625 5,214 35,969 Fines and Forfeitures 37,845 346 19,591 3,933 61,716 Gifts and Donations 4,814 4 - 12,061 16,878 Miscellaneous: Tobacco Settlement 128,592 - - - 128,592 Other 251,908 15,886 15 3,849 271,657 Total Revenues 23,424,531 2,674,268 51,257 938,478 27,088,534
Expenditures: Current Operating: Commerce 360,015 - - 56,186 416,201 Education 6,661,197 - 33,600 8,125 6,702,922 Transportation 7,662 2,078,911 - 123,585 2,210,158 Environmental Resources 107,256 - - 391,363 498,620 Human Relations and Resources 11,824,579 - - 26,603 11,851,182 General Executive 635,595 - - 88,443 724,037 Judicial 129,100 - - 287 129,386 Legislative 64,777 - - - 64,777 Tax Relief and Other General Expenditures 1,340,633 - - 10,160 1,350,793 Intergovernmental - Shared Revenue 970,340 - - 53,192 1,023,532 Capital Outlay 44,601 421,223 - 497,948 963,772 Debt Service: Principal - - - 187,136 187,136 Interest - - - 501,341 501,341 Other Expenditures - - - 6,089 6,089 Total Expenditures 22,145,755 2,500,134 33,600 1,950,458 26,629,947 Excess of Revenues Over (Under) Expenditures 1,278,777 174,133 17,657 (1,011,981) 458,587
Other Financing Sources (Uses): Long-term Debt Issued - - - 825,903 825,903 Long-term Debt Issued - Refunding Bonds - - - 256,481 256,481 Payments for Refunded Bonds - - - (224,373) (224,373) Payments to Refunding Bond Escrow Agent - - - (69,960) (69,960) Discount on Bonds - - - (144) (144) Premium on Bonds - - - 91,246 91,246 Transfers In 210,045 35,382 10,000 1,025,527 1,280,954 Transfers Out (1,579,044) (95,653) (1,732) (806,509) (2,482,937) Capital Lease Acquisitions 9,588 4,766 - 2,128 16,483 Installment Purchase Acquisitions - - - 308 308 Total Other Financing Sources (Uses) (1,359,411) (55,505) 8,268 1,100,609 (306,039)
Net Change in Fund Balances (80,635) 118,629 25,926 88,628 152,548
Fund Balances, Beginning of Year (2,915,377) 675,956 820,479 (389,013) (1,807,955) Increase (Decrease) in Inventories 1,206 (393) - (369) 443
Fund Balances, End of Year $ (2,994,806) $ 794,192 $ 846,405 $ (300,754) $ (1,654,964)
(Continued)
44

State of WisconsinStatement of Revenues, Expenditures, and Changes in Fund Balances - Governmental Funds For the Fiscal Year Ended June 30, 2011
(Continued)
TotalGovernmental
Reconciliation to the Statement of Activities:Net Change in Fund Balances (from previous page) $ 152,548
Inventories, which are recorded under the purchases method for governmentalfund reporting, are reported under the consumption approach on the Statement ofActivities. As a result of this change, the Increase (Decrease) in Reserve forInventories on the fund statement has been reclassified as functional expenseson the government-wide statement. (775)
Governmental funds report the acquisition or construction of capital assets asexpenditures, while governmental activities report depreciation expense toallocate the cost of these assets over their estimated useful life. Donated assetsare set up at fair value with a corresponding amount of revenue recognized. In thecurrent period, these amounts are:
Capital Outlay/Functional Expenditures 962,896 Depreciation Expense (99,416) Grants and Contributions (Donated Assets) 4,306
867,787
Transfers of capital assets between governmental and business-type activitiesresults in the movement of those assets on the Statement of Net Assets andcorresponding recognition of the related transfer in/out on the Statement of Activities. 61
In the Statement of Activities, only the gain/(loss) on the sale/disposal of capitalassets is reported, while in the governmental funds, any proceeds from the saleincreases financial resources. Thus, the change in net assets differs from thechange in fund balance by the cost of the capital assets sold/disposed. (51,543)
Revenues in the Statement of Activities that do not provide current financialresources are not reported as revenues in the funds. (9,950)
Bond proceeds provide current financial resources to governmental funds, but issuingdebt increases long-term liabilities in the Statement of Net Assets. Repayment ofbond principal is reported as an expenditure in the governmental funds, but therepayment reduces long-term liabilities in the Statement of Net Assets.
Bonds Issued (1,082,385) Payments for Refunded Bonds 294,333 Repayment of Bond Principal 187,136 Bond Premium (91,246) Bonds Discount 144 Bond Issuance Costs (Amortization) 3,494
(688,524)
Some expenses reported in the Statement of Activities do not require the use ofcurrent financial resources and, therefore, are not reported as expenditures ingovernmental funds.
Net Decrease (increase) in Accrued Interest 32,157 Decrease (increase) in Capital Leases (9,388) Decrease (increase) in Installment Contracts 465 Decrease (increase) in Compensated Absences 9,815 Decrease (increase) in Pollution Remediation Liabilities 2,891 Decrease (increase) in Claims and Judgments 865 Decrease (increase) in Postemployment Benefit Liabilities (33,344)
3,462
Internal service funds are used by management to charge the costs of certainactivities, such as insurance and telecommunications to individual funds. The netrevenue (expense) of the internal service funds is reported with governmental activities. 28,873
Changes in Net Assets of Governmental Activities as reported on the Statement of Activities (See page 41) $ 301,937
The notes to the financial statements are an integral part of this statement.
45

State of WisconsinBalance Sheet Proprietary Funds June 30, 2011
(In Thousands)
Injured Patients and Environmental University of UnemploymentFamilies Compensation Improvement Wisconsin System Reserve
AssetsCurrent Assets: Cash and Cash Equivalents $ 9,738 $ 337,569 $ 546,744 $ - Investments 30,807 47,733 - - Loans to Local Governments (net of allowance) - 149,186 - - Other Loans Receivable (net of allowance) - - 31,493 - Other Receivables (net of allowance) 7,319 231 134,875 318,775 Due from Other Funds - 222 18,064 832 Due from Component Units - - 1,124 - Interfund Receivables - - 530,586 - Due from Other Governments - 8,428 90,135 97,530 Inventories 3 - 42,460 - Prepaid Items 8 23 56,704 - Advances to Other Funds 233,747 - - - Capital Leases Receivable - Component Units - - 1,641 - Deferred Charges - - 12,481 - Other Assets - - - - Total Current Assets 281,622 543,393 1,466,306 417,137
Noncurrent Assets: Investments 615,283 172,884 396,030 - Loans to Local Governments (net of allowance) - 1,750,678 - - Other Loans Receivable (net of allowance) - - 159,995 - Other Receivables - - 4,313 81,711 Prepaid Items - 201 - - Advances to Other Funds - 3,451 - - Capital Leases Receivable - Component Units - - 2,510 - Restricted and Limited Use Assets: Cash and Cash Equivalents 37,190 99,785 - 16,521 Deferred Charges - 3,935 - - Other Assets - - - - Depreciable Capital Assets (net of accumulated depreciation) 378 5 3,455,697 - Nondepreciable Capital Assets - - 1,742,952 - Total Noncurrent Assets 652,851 2,030,939 5,761,497 98,232 Total Assets $ 934,473 $ 2,574,331 $ 7,227,804 $ 515,368
Liabilities and Fund EquityCurrent Liabilities: Accounts Payable and Other Accrued Liabilities $ 748 $ 143 $ 158,766 $ 68,724 Due to Other Funds 210 865 69,227 4,880 Due to Component Units - - 2,003 - Interfund Payables - - - - Due to Other Governments - 210 2,340 44,901 Advance from Federal Government - - - 351,412 Tax and Other Deposits - - 2,205 - Unearned Revenue 2,466 - 167,078 - Interest Payable - 3,691 9,591 - Short-term Notes Payable - - 59,193 - Current Portion of Long-term Liabilities: Future Benefits and Loss Liabilities 79,817 - - - Capital Leases - - 6,196 - Compensated Absences 24 46 69,317 - General Obligation Bonds Payable - - 46,667 - Revenue Bonds and Notes Payable - 58,170 - - Total Current Liabilities 83,264 63,124 592,583 469,917
Noncurrent Liabilities: Accounts Payable and Other Accrued Liabilities - - - - Due to Other Governments - 518 - - Advance from Federal Government - - - 971,562 Noncurrent Portion of Long-term Liabilities: Future Benefits and Loss Liabilities 556,686 - - - Capital Leases - - 23,713 - Compensated Absences 44 40 62,630 - Other Postemployment Benefits 39 28 167,393 - General Obligation Bonds Payable - - 1,111,572 - Revenue Bonds and Notes Payable - 878,781 - - Total Noncurrent Liabilities 556,769 879,368 1,365,307 971,562 Total Liabilities 640,033 942,492 1,957,890 1,441,479
Fund Equity: Invested in Capital Assets, Net of Related Debt 378 - 3,951,309 - Restricted for Environmental Improvement - 1,609,417 - - Restricted for Expendable Trusts - - 302,837 - Restricted for Nonexpendable Trusts - - 155,642 - Restricted for Future Benefits 294,062 - - - Restricted for Other Purposes - - 354,012 - Unrestricted - 22,422 506,115 (926,111) Total Fund Equity 294,439 1,631,839 5,269,914 (926,111) Total Liabilities and Fund Equity $ 934,473 $ 2,574,331 $ 7,227,804 $ 515,368
The notes to the financial statements are an integral part of this statement.
Business-type Activities - Enterprise Funds
46

Nonmajor Governmental Activities -Enterprise Totals Internal Service Funds
$ 733,154 $ 1,627,205 $ 12,644 17,828 96,369 -
382 149,568 - 8,042 39,535 -
68,368 529,567 1,277 15,856 34,974 53,773
- 1,124 101 - 530,586 -
7,071 203,164 313 9,058 51,522 4,740
36,647 93,382 714 416 234,163 -
- 1,641 - 94 12,575 102
1,115 1,115 - 898,032 3,606,489 73,665
152,223 1,336,419 - 1,275 1,751,953 -
179,161 339,156 - 50 86,074 -
- 201 - 586 4,037 -
- 2,510 -
- 153,496 - 1,571 5,506 443 6,005 6,005 -
189,342 3,645,422 258,607 21,247 1,764,200 38,702
551,460 9,094,978 297,751 $ 1,449,492 $ 12,701,467 $ 371,416
$ 57,696 $ 286,078 $ 8,649 40,876 116,057 13,850
- 2,003 - 60,823 60,823 75,637
433 47,884 7,628 - 351,412
18,814 21,019 - 121,520 291,064 -
1,925 15,207 1,243 1,084 60,277 3,370
63,731 143,547 32,936 412 6,608 249
4,752 74,138 1,366 11,057 57,724 12,711
9 58,179 - 383,131 1,592,019 157,640
41,066 41,066 - - 518 - - 971,562
271,403 828,089 58,739 1,287 24,999 531 6,551 69,264 2,490
25,617 193,077 3,252 223,063 1,334,635 142,434
- 878,781 - 568,986 4,341,992 207,446 952,117 5,934,012 365,086
156,982 4,108,668 137,474 - 1,609,417 - - 302,837 - - 155,642 -
298,678 592,740 - 63,438 417,450 -
(21,724) (419,298) (131,144) 497,374 6,767,456 6,330
$ 1,449,492 $ 12,701,467 $ 371,416
Total Fund Equity Reported Above $ 6,767,456 Adjustment to Reflect the Consolidation of Internal
Service Activities Related to Enterprise Funds 1,977 Net Assets of Business-type Activities $ 6,769,433
Business-type Activities - Enterprise Funds
47

State of WisconsinStatement of Revenues, Expenses, and Changes in Fund Equity - Proprietary Funds For the Fiscal Year Ended June 30, 2011
(In Thousands)
Injured Patients and Environmental University of UnemploymentFamilies Compensation Improvement Wisconsin System Reserve
Operating Revenues: Charges for Goods and Services $ 33,646 $ - $ - $ - Participant and Employer Contributions - - - 1,087,271 Tuition and Fees - - 1,074,876 - Federal Grants and Contracts - - 989,148 -
Local and Private Grants and Contracts - - 232,201 - Sales and Services of Educational Activities - - 299,962 - Sales and Services of Auxiliary Enterprises - - 350,338 - Sales and Services to UW Hospital Authority - - 53,681 - Investment and Interest Income - 29,350 - - Interest Income Used as Security for Revenue Bonds - 21,220 - - Miscellaneous:
Federal Aid for Unemployment Insurance Program - - - 1,308,783 Reimbursing Financing Revenue - - - 108,660 Other - 45 283,841 9,132
Total Operating Revenues 33,646 50,614 3,284,047 2,513,846
Operating Expenses: Personal Services 542 4,578 2,898,392 - Supplies and Services 396 1,929 1,043,012 - Lottery Prize Awards - - - - Scholarships and Fellowships - - 152,779 - Depreciation 27 4 224,073 - Benefit Expense (44,282) - - 2,513,060 Interest Expense - 41,783 - - Other Expenses 1 - 7,805 -
Total Operating Expenses (43,317) 48,293 4,326,061 2,513,060
Operating Income (Loss) 76,962 2,321 (1,042,014) 786
Nonoperating Revenues (Expenses): Operating Grants - 77,619 - - Investment and Interest Income 54,250 1,227 67,514 - Investment Income Used as Security for Revenue Bonds - 22,419 - - Gain (Loss) on Disposal of Capital Assets - - (10,765) - Interest Expense (26) - (47,057) - Gifts and Donations - - 212,888 - Miscellaneous Revenues 2 - - - Other Expenses: Property Tax Credits - - - - Grants Disbursed - - - - Federal Settlement - - - - Other (691) (41,744) (8,579) -
Total Nonoperating Revenues (Expenses) 53,535 59,521 214,000 -
Income (Loss) Before Contributions and Transfers 130,497 61,842 (828,014) 786
Capital Contributions - - 96,343 - Additions to Endowments - - 2,698 - Transfers In 31,159 23,119 1,209,986 - Transfers Out (15) (9,119) (105,116) (6,545)
Net Change in Fund Equity 161,641 75,841 375,898 (5,759)
Total Fund Equity, Beginning of Year 132,798 1,555,998 4,894,016 (920,352)
Total Fund Equity, End of Year $ 294,439 $ 1,631,839 $ 5,269,914 $ (926,111)
The notes to the financial statements are an integral part of this statement.
Business-type Activities - Enterprise Funds
48

Nonmajor Governmental Activities - Enterprise Totals Internal Service Funds
$ 828,439 $ 862,085 $ 261,940 1,304,218 2,391,489 -
- 1,074,876 - - 989,148 - - 232,201 - - 299,962 - - 350,338 - - 53,681 -
13,067 42,417 - - 21,220 -
- 1,308,783 - - 108,660 -
760 293,778 12
2,146,484 8,028,637 261,952
298,344 3,201,855 50,409 164,317 1,209,655 143,224 290,459 290,459 -
- 152,779 - 13,589 237,692 18,688
1,349,665 3,818,442 24,064 13,172 54,955 - 12,281 20,087 -
2,141,826 8,985,924 236,385
4,658 (957,287) 25,566
14,847 92,466 189 109,455 232,445 25
- 22,419 - (56) (10,821) (49)
(2,213) (49,296) (7,375) 423 213,311 -
6,972 6,974 1,721
(125,441) (125,441) - (3,256) (3,256) -
- 0 (8,578) (81) (51,095) -
650 327,706 (14,066)
5,308 (629,581) 11,500
3,178 99,521 - - 2,698 -
80,413 1,344,676 19,118 (36,534) (157,329) (4,119)
52,365 659,986 26,499
445,010 6,107,470 (20,169)
$ 497,374 $ 6,767,456 $ 6,330
Total Net Change in Fund Equity Reported Above $ 659,986 Consolidation Adjustment of Internal Services
Activities Related to Enterprise Funds (2,373) Change in Net Assets of Business-Type Activities $ 657,612
Business-type Activities - Enterprise Funds
49

State of WisconsinStatement of Cash Flows - Proprietary Funds For the Fiscal Year Ended June 30, 2011
(In Thousands)
Injured Patients and Environmental University of UnemploymentFamilies Compensation Improvement Wisconsin System Reserve
Cash Flows from Operating Activities: Cash Receipts from Customers $ 35,413 $ - $ - $ 1,014,096 Cash Payments to Suppliers for Goods and Services (582) (3,069) (1,063,750) - Cash Payments to Employees for Services (517) (5,553) (2,973,734) - Tuition and Fees - - 1,072,374 - Grants and Contracts - - 1,229,077 - Cash Payments for Lottery Prizes - - - - Cash Payments for Loans Originated - - (25,787) - Collection of Loans - - 25,952 - Interest Income - - - - Cash Payments for Benefits (40,286) - - (2,529,206) Sales and Services of Educational Activities - - 304,163 - Sales and Services of Auxiliary Enterprises - - 348,830 - Sales and Services to UW Hospital Authority - - 56,575 - Scholarships and Fellowships - - (152,779) - Other Operating Revenues - 45 292,777 1,420,519 Other Operating Expenses - - - - Other Sources of Cash - - - - Other Uses of Cash - - - - Net Cash Provided (Used) by Operating Activities (5,972) (8,577) (886,302) (94,591)
Cash Flows from Noncapital Financing Activities: Operating Grants Receipts - 78,488 - - Grants Disbursed - (41,744) - - Proceeds from Issuance of Debt - 172,424 - - Repayment of Bonds and Notes - (110,200) - - Interest Payments - (48,413) - - Property Tax Credit Payments - - - - Noncapital Gifts and Grants - - 215,586 - Interfund Loans Received - - - - Interfund Loans Repaid - - - - Interfund Borrowings to Other Funds - - (138,630) - Repayment of Interfund Borrowings - - - - Interfund Advances Collected - - - - Transfers In - 23,119 1,149,006 - Transfers Out - (9,119) (99,637) (6,980) Student Direct Lending Receipts - - 796,692 - Student Direct Lending Disbursements - - (800,000) - Other Cash Inflows from Noncapital Financing Activities - - 381 664,510 Other Cash Outflows from Noncapital Financing Activities - (973) (14,928) (752,377)
Net Cash Provided (Used) by Noncapital Financing Activities - 63,582 1,108,471 (94,847)
Cash Flows from Capital and Related Financing Activities: Proceeds from Issuance of Debt - - 273,299 - Capital Contributions - - 126,092 - Repayment of Bonds and Notes - - (57,306) - Interest Payments - - (109,986) - Transfers In - - - - Capital Lease Obligations - - - - Proceeds from Sale of Capital Assets - - - - Payments for Purchase of Capital Assets (77) - (631,393) - Other Cash Inflows from Capital Financing Activities - - 97,814 - Other Cash Outflows from Capital Financing Activities - - - -
Net Cash Provided (Used) by Capital and Related Financing Activities (77) - (301,479) -
Cash Flows from Investing Activities: Proceeds from Sale and Maturities of Investment Securities 78,358 159,247 114,611 - Purchase of Investment Securities (106,871) (155,056) (109,741) - Cash Payments for Loans Originated - (251,908) - - Collection of Loans - 171,510 - - Investment and Interest Receipts 28,066 60,241 8,069 - Net Cash Provided (Used) by Investing Activities (447) (15,966) 12,939 -
Net Increase (Decrease) in Cash and Cash Equivalents (6,496) 39,040 (66,371) (189,437) Cash and Cash Equivalents, Beginning of Year 53,424 398,314 613,115 205,958 Cash and Cash Equivalents, End of Year $ 46,928 $ 437,354 $ 546,744 $ 16,521
Business-type Activities - Enterprise Funds
50

Nonmajor Governmental Activities - Enterprise Totals Internal Service Funds
$ 2,121,119 $ 3,170,628 $ 267,573 (138,554) (1,205,954) (145,590) (299,856) (3,279,660) (49,917)
- 1,072,374 - - 1,229,077 -
(295,556) (295,556) - (2,578) (28,365) - 60,445 86,397 - 13,879 13,879 -
(1,321,134) (3,890,627) (27,236) - 304,163 - - 348,830 - - 56,575 - - (152,779) -
4,052 1,717,394 12 (11,367) (11,367) -
7,354 7,354 1,662 (34,559) (34,559) (1,449) 103,244 (892,197) 45,055
14,546 93,034 189 (3,235) (44,978) -
- 172,424 - (79,045) (189,245) - (12,791) (61,204) (4)
(129,130) (129,130) - - 215,586 -
19,294 19,294 12,845 (16,574) (16,574) (15,948)
- (138,630) - - - - - - -
81,211 1,253,336 6,307 (32,409) (148,145) (4,119)
- 796,692 - - (800,000) -
1,728 666,620 - - (768,278) -
(156,404) 920,802 (730)
15,997 289,296 13,695 3,304 129,397 -
(2,936) (60,242) (13,529) (2,173) (112,159) (7,767)
403 403 - (342) (342) (242)
3 3 831 (13,080) (644,550) (31,151)
3,011 100,824 - (13,940) (13,940) -
(9,754) (311,311) (38,162)
19,534 371,750 - (7,955) (379,623) -
(179) (252,087) - 230 171,740 -
112,321 208,698 - 123,952 120,479 -
61,038 (162,227) 6,163 672,116 1,942,927 6,481
$ 733,154 $ 1,780,701 $ 12,644
(Continued)
Business-type Activities - Enterprise Funds
51
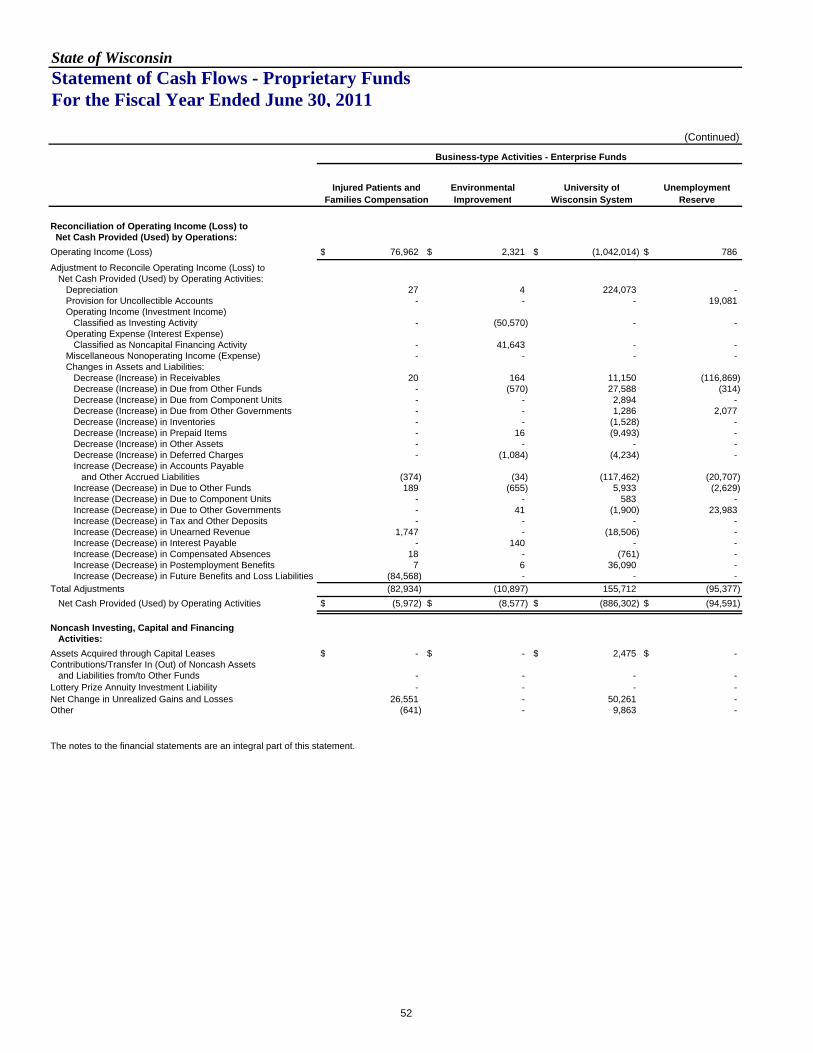
State of Wisconsin Statement of Cash Flows - Proprietary Funds For the Fiscal Year Ended June 30, 2011
(Continued)
Injured Patients and Environmental University of UnemploymentFamilies Compensation Improvement Wisconsin System Reserve
Reconciliation of Operating Income (Loss) to Net Cash Provided (Used) by Operations: Operating Income (Loss) $ 76,962 $ 2,321 $ (1,042,014) $ 786
Adjustment to Reconcile Operating Income (Loss) to Net Cash Provided (Used) by Operating Activities: Depreciation 27 4 224,073 - Provision for Uncollectible Accounts - - - 19,081 Operating Income (Investment Income) Classified as Investing Activity - (50,570) - - Operating Expense (Interest Expense) Classified as Noncapital Financing Activity - 41,643 - - Miscellaneous Nonoperating Income (Expense) - - - - Changes in Assets and Liabilities: Decrease (Increase) in Receivables 20 164 11,150 (116,869) Decrease (Increase) in Due from Other Funds - (570) 27,588 (314) Decrease (Increase) in Due from Component Units - - 2,894 - Decrease (Increase) in Due from Other Governments - - 1,286 2,077 Decrease (Increase) in Inventories - - (1,528) - Decrease (Increase) in Prepaid Items - 16 (9,493) - Decrease (Increase) in Other Assets - - - - Decrease (Increase) in Deferred Charges - (1,084) (4,234) - Increase (Decrease) in Accounts Payable and Other Accrued Liabilities (374) (34) (117,462) (20,707) Increase (Decrease) in Due to Other Funds 189 (655) 5,933 (2,629) Increase (Decrease) in Due to Component Units - - 583 - Increase (Decrease) in Due to Other Governments - 41 (1,900) 23,983 Increase (Decrease) in Tax and Other Deposits - - - - Increase (Decrease) in Unearned Revenue 1,747 - (18,506) - Increase (Decrease) in Interest Payable - 140 - - Increase (Decrease) in Compensated Absences 18 - (761) - Increase (Decrease) in Postemployment Benefits 7 6 36,090 - Increase (Decrease) in Future Benefits and Loss Liabilities (84,568) - - - Total Adjustments (82,934) (10,897) 155,712 (95,377) Net Cash Provided (Used) by Operating Activities $ (5,972) $ (8,577) $ (886,302) $ (94,591)
Noncash Investing, Capital and Financing Activities: Assets Acquired through Capital Leases $ - $ - $ 2,475 $ - Contributions/Transfer In (Out) of Noncash Assets and Liabilities from/to Other Funds - - - - Lottery Prize Annuity Investment Liability - - - - Net Change in Unrealized Gains and Losses 26,551 - 50,261 - Other (641) - 9,863 -
The notes to the financial statements are an integral part of this statement.
Business-type Activities - Enterprise Funds
52
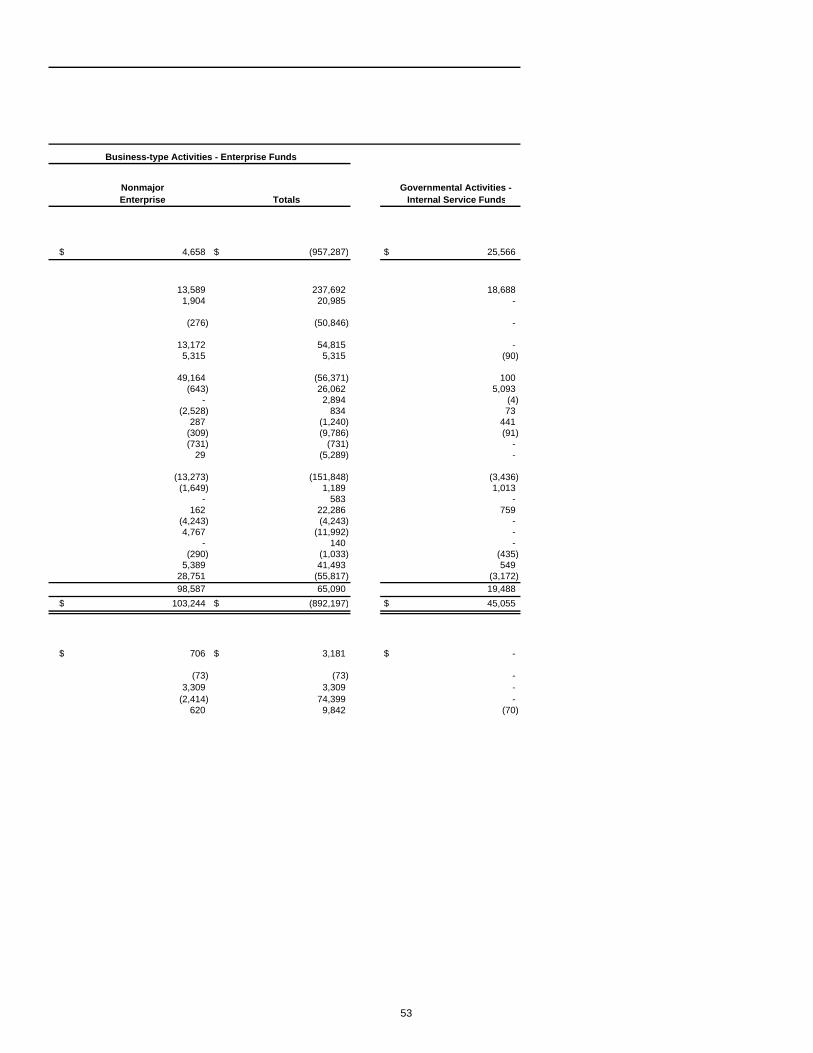
Nonmajor Governmental Activities - Enterprise Totals Internal Service Funds
$ 4,658 $ (957,287) $ 25,566
13,589 237,692 18,688 1,904 20,985 -
(276) (50,846) -
13,172 54,815 - 5,315 5,315 (90)
49,164 (56,371) 100 (643) 26,062 5,093
- 2,894 (4) (2,528) 834 73
287 (1,240) 441 (309) (9,786) (91) (731) (731) -
29 (5,289) -
(13,273) (151,848) (3,436) (1,649) 1,189 1,013
- 583 - 162 22,286 759
(4,243) (4,243) - 4,767 (11,992) -
- 140 - (290) (1,033) (435)
5,389 41,493 549 28,751 (55,817) (3,172) 98,587 65,090 19,488
$ 103,244 $ (892,197) $ 45,055
$ 706 $ 3,181 $ -
(73) (73) - 3,309 3,309 -
(2,414) 74,399 - 620 9,842 (70)
Business-type Activities - Enterprise Funds
53

State of WisconsinStatement of Fiduciary Net Assets June 30, 2011
(In Thousands)
Pensionand Other Private-Employee Investment Purpose
Benefit Trust Trust Trust AgencyAssets
Cash and Cash Equivalents $ 1,773,711 $ 2,473,595 $ 252,333 $ 23,931
Securities Lending Collateral 3,083,019 - - -
Prepaid Items 19,395 - 524 -
Receivables (net of allowance): Loans Receivable - - - - Prior Service Contributions Receivable 118,776 - - - Benefits Overpayment Receivable 4,186 - - - Due from Other Funds 64,816 - - 1,316 Due from Component Units 6,028 - - - Interfund Receivables 782,426 - - - Due from Other Governments 146,319 - 5,252 - Due from Employers - - - 3,788 Interest and Dividends Receivable 241,351 - - - Investment Sales Receivable 353,326 - - - Other Receivables 16,439 - 4,208 5,861
Total Receivables 1,733,667 - 9,460 10,965
Investments: Fixed Income 22,327,022 - - - Stocks 47,408,539 - - - Options (162) - - - Limited Partnerships 8,195,684 - - - Preferred Securities 215,887 - - - Convertible Securities 79,171 - - - Mortgages 22,541 - - - Real Estate 390,778 - - - Investments of Private Purpose Trust Funds - - 2,593,142 - Investments of Agency Funds - - - 646 Multi-asset Investments 1,215,190 - - - External Investment Pool 592,218 - - -
Total Investments 80,446,868 - 2,593,142 646
Inventories 104 - - -
Capital Assets 2,156 - 2 -
Other Assets - - - 315,964
Total Assets 87,058,920 2,473,595 2,855,461 $ 351,507
LiabilitiesAccounts Payable and Other Accrued Liabilities 180,480 - 64 $ 15,064 Securities Lending Collateral Liability 3,083,019 - - - Annuities Payable 281,605 - - - Advance Contributions 146 - - - Due to Other Funds 74,514 224 5 - Interfund Payables 782,426 - - - Due to Other Governments 35,301 - - - Tax and Other Deposits - - - 336,443 Future Benefits and Loss Liabilities - - 5,365 - Financial Futures Contracts (44,001) - - - Investment Payable 401,800 - - - Unearned Revenue 412 - 15,922 - Advances from Other Funds - - - - Compensated Absences Payable 2,214,681 - - - Other Postemployment Benefits 1,068 - - -
Total Liabilities 7,011,451 224 21,357 $ 351,507
Net AssetsHeld in Trust for Pension Benefits, Pool Participants and Other Purposes $ 80,047,469 $ 2,473,372 $ 2,834,104
The notes to the financial statements are an integral part of this statement.
54

State of WisconsinStatement of Changes in Fiduciary Net Assets For the Fiscal Year Ended June 30, 2011
(In Thousands)
Pensionand Other Private-Employee Investment Purpose
Benefit Trust Trust Trust
AdditionsContributions: Employer Contributions $ 817,926 $ - $ - Employee Contributions 866,277 - - Other - - 175 Total Contributions 1,684,203 - 175
Deposits - 10,261,698 307,615 Premiums 193,977 Federal Subsidy 11,598 Investment Income: Net Appreciation (Depreciation) in Fair Value of Investments 14,274,364 - - Interest 657,325 - - Dividends 958,942 - - Securities Lending Income 14,579 - - Other 98,871 - - Investment Income of Investment, Private Purpose, and Other Employee Benefit Trust Funds 506,311 36,385 503,730 Less: Investment Expense (253,705) (561) (5,885) Securities Lending Rebates and Fees (1,990) - - Investment Income Distributed to Other Funds (616,710) - - Net Investment Income 15,637,987 35,824 497,845
Interest on Prior Service Receivable 9,546 - -
Miscellaneous Income 502 - 793
Total Additions 17,332,239 10,297,522 1,012,003
DeductionsRetirement Benefits and Refunds: Retirement, Disability, and Beneficiary 3,960,524 - - Separations 22,595 - - Total Retirement Benefits and Refunds 3,983,119 - -
Distributions 24,278 10,430,324 229,657
Other Benefit Expense 191,424 - 201,269
Administrative Expense 22,483 224 12,650
Miscellaneous Expense - - -
Transfers Out 359 - 4
Total Deductions 4,221,662 10,430,548 443,580
Net Increase (Decrease) 13,110,577 (133,026) 568,423 Net Assets - Beginning of Year 66,936,893 2,606,398 2,265,681 Net Assets - End of Year $ 80,047,469 $ 2,473,372 $ 2,834,104
The notes to the financial statements are an integral part of this statement.
55

State of WisconsinNotes To The Financial Statements
PageSummary of Significant Accounting Policies
Note 1. Summary of Significant Accounting Policies………………………………………………………………………………………… 58A. Basis of Presentation……………………………………………………………………………………………………………… 58B. Financial Reporting Entity………………………………………………………………………………………………………… 58C. Government-wide and Fund Financial Statements……………………………………………………………………………… 60D. Measurement Focus, Basis of Accounting, and Financial Statement Presentation………………………………………… 61E. Assets, Liabilities, and Net Assets/Fund Balances/Fund Equity……………………………………………………………… 63
1. Cash and Cash Equivalents………………………………………………………………………………………………… 632. Investments…………………………………………………………………………………………………………………… 633. Mortgage and Other Loans………………………………………………………………………………………………… 644. Forestation State Tax………………………………………………………………………………………………………… 645. Interfund Assets/Liabilities…………………………………………………………………………………………………… 656. Inventories and Prepaid Items……………………………………………………………………………………………… 657. Capital Assets………………………………………………………………………………………………………………… 658. Restricted and Limited Use Assets………………………………………………………………………………………… 669. Local Assistance Aids………………………………………………………………………………………………………… 66
10. Long-term Debt Obligations………………………………………………………………………………………………… 6711. Compensated Absences…………………………………………………………………………………………………… 6812. Unearned and Deferred Revenue………………………………………………………………………………………… 6813. Self-Insurance………………………………………………………………………………………………………………… 6814. Fund Balance Classification and Restricted Net Assets/Fund Equity………………………………………………… 69
Explanation of Certain Differences Between Governmental Fund Statements and Government-Wide Statements
Note 2. Detailed Reconciliation of the Government-wide and Fund Statements…………………………………………………………… 70A. Explanation of Differences Between the Balance Sheet - Governmental Funds and the Statement of Net Assets…… 70B. Explanation of Differences Between the Statement of Revenues, Expenditures, and Changes in Fund
Balances - Governmental Funds and the Statement of Activities……………………………………...……………………… 72
Stewardship and Compliance Note 3. Budgetary Control………………………………………………………………………………………………………………………… 74
Note 4. Deficit Fund Balance/Fund Equity, Restricted Net Assets, Budget Stabilization Arrangement, Minimum Fund Balance Policy, and Fund Balance of Governmental Funds……………………………………………………… 74
Detailed Disclosures Regarding Assets and RevenuesNote 5. Deposits and Investments……………………………………………………………………………………………………………… 76
A. Deposits……………………………………………………………………………………………………………………………… 761. Primary Government………………………………………………………………………………………………………… 762. Component Units……………………………………………………………………………………………………………… 76
B. Investments………………………………………………………………………………………………………………………… 771. Primary Government………………………………………………………………………………………………………… 772. Component Units……………………………………………………………………………………………………………… 903. State Investment Fund……………………………………………………………………………………………………… 944. Lottery Investments and Related Future Prize Obligations……………………………………………………………… 96
Note 6. Receivables and Net Revenues………………………………………………………………………………………………………… 97A. Receivables………………………………………………………………………………………………………………………… 97B. Net Revenues……………………………………………………………………………………………………………………… 97
Note 7. Capital Assets…………………………………………………………………………………………………………………………… 98
Note 8. Endowments……………………………………………………………………………………………………………………………… 101
Note 9. Interfund Receivables, Payables and Transfers……………………………………………………………………………………… 105A. Due from/to Other Funds…………………………………………………………………………………………………………… 105B. Due from/to Component Units…………………………………………………………………………………………………… 106C. Interfund Receivables/Payables…………………………………………………………………………………………………… 106D. Advances to/from Other Funds…………………………………………………………………………………………………… 106E. Interfund Transfers………………………………………………………………………………………………………………… 107
Index
56

PageDetailed Disclosures Regarding Liabilities and Expenses/Expenditures
Note 10. Changes in Long-term Liabilities……………………………………………………………………………………………………… 108
Note 11. Bonds, Notes and Other Debt Obligations…………………………………………………………………………………………… 110A. General Obligation Bonds………………………………………………………………………………………………………… 110B. Annual Appropriation Bonds……………………………………………………………………………………………………… 113C. Revenue Bonds……………………………………………………………………………………………………………………… 116D. Refundings, Exchanges and Early Extinguishments…………………………………………………………………………… 125E. Short-term Financing……………………………………………………………………………………………………………… 126F. Certificates of Participation………………………………………………………………………………………………………… 128G. Arbitrage Rebate…………………………………………………………………………………………………………………… 128H. Moral Obligation Debt……………………………………………………………………………………………………………… 128I. Credit Agreements………………………………………………………………………………………………………………… 129
Note 12. Lease Commitments and Installment Purchases…………………………………………………………………………………… 130A. Capital Leases……………………………………………………………………………………………………………………… 130B. Operating Leases………………….……………………………………………………………………………………………… 131C. Installment Purchases……………………………………………………………………………………………………………… 131
Note 13. Pollution Remediation Obligations……………………………………………………………………………………………………… 132
Note 14. Retirement Plan………………………………………………………………………………………………………………………… 133
Note 15. Milwaukee Retirement System………………………………………………………………………………………………………… 134
Note 16. Postemployment Benefits - State Health Insurance Program………………………..……………………………………………… 135
Note 17. Other Postemployment Benefit (OPEB) Plans…………………………………………………………….………………………… 137
Note 18. Public Entity Risk Pools Administered by the Department of Employee Trust Funds…………………………………………… 140A. Description of Funds……………………………………………………………………………………………………………… 140B. Accounting Policies for Risk Pools………………………………………………………………………………………………… 140C. Unpaid Claims Liabilities…………………………………………………………………………………………………………… 141D. Trend Information…………………………………………………………………………………………………………………… 141
Note 19. Self-Insurance…………………………………………………………………………………………………………………………… 142
Note 20. Insurance Funds………………………………………………………………………………………………………………………… 143A. Primary Government 143
1. Local Government Property Insurance Fund……………………………………………………….……………………… 1432. State Life Insurance Fund…………………………………………………………………………………………………… 1453. Injured Patients and Families Compensation Fund……………………………………………………………………… 146
B. Component Units 147Wisconsin Health Care Liability Insurance Plan…………………………………………………………………………… 147
Other Note DisclosuresNote 21. Segment Information and Condensed Financial Data……………………………………………………………………………… 149
Note 22. Component Units - Condensed Financial Information............................................................................................................ 150
Note 23. Restatements of Beginning Fund Balances/Fund Equity/Net Assets and Other Changes……………………………………… 151A. Fund Statements - Governmental Funds……………………………………………………..………………………………… 151B. Fund Statements - Proprietary Funds…………………………………………………………………………………………… 151C. Fund Statements - Fiduciary Funds……………………………………………………………………………………………… 152D. Government-wide Statements…………………………………………………………………………………………………… 152
Note 24. Litigation, Contingencies and Commitments………………………………………………………………………………………… 153A. Litigation and Contingencies ……………………………………………………………………………………………………… 153B. Commitments………………………………………………………………………………………………………………………… 154
Note 25. Subsequent Events ……………………………………………………………….…………………………………………………… 155
57

State of Wisconsin Notes To The Financial Statements
For the Fiscal Year Ended June 30, 2011
58
NOTE 1. SUMMARY OF SIGNIFICANT ACCOUNTING POLICIES A. Basis of Presentation The accompanying basic financial statements have been prepared in conformity with generally accepted accounting principles (GAAP) for governments as prescribed by the Governmental Accounting Standards Board (GASB). B. Financial Reporting Entity For GAAP purposes, the State of Wisconsin includes all funds, elected offices, departments and agencies of the State, as well as boards, commissions, authorities and universities. The State has also considered all potential "component units" for which it is financially accountable, and other affiliated organizations for which the nature and significance of their relationship, including their ongoing financial support, with the State are such that exclusion would cause the State's financial statements to be misleading or incomplete. The decision to include a potential component unit in the State’s reporting entity is based on the criteria set forth in GASB Statement No. 14, The Financial Reporting Entity, and GASB Statement No. 39, Determining Whether Certain Organizations Are Component Units, an amendment of GASB Statement No. 14. GASB Statement No. 14 criteria include the ability to appoint a voting majority of an organization's governing body and (1) the ability of the State to impose its will on that organization or (2) the potential for the organization to provide specific financial benefits to, or impose specific financial burdens on, the State. GASB Statement No. 39 provisions relate to separately legal, tax-exempt organizations and include: (1) the economic resources received or held are entirely or almost entirely for the direct benefit of the State, (2) the State is entitled to, or has the ability to otherwise access, a majority of the economic resources received or held by the separate organization, and (3) the economic resources received or held by an individual organization that the State is entitled to, or has the ability to otherwise access, are significant to the State. In addition, GASB Technical Bulletin No. 2004-1 (TB), Tobacco Settlement Recognition and Financial Reporting Entity Issues, clarified guidance on whether a Tobacco Settlement Authority (TSA) that is created to obtain the rights to all or a portion of future tobacco settlement resources is a component unit of the government that created it. This guidance resulted in the Badger Tobacco Asset Securitization Corporation (BTASC) to be reported as a blended component unit in the primary government in a debt
service fund. The State has no legal liability for the obligations of BTASC. Based upon the application of the criteria contained in GASB Statement No. 14, as amended by GASB Statement No. 39 and clarified by GASB Technical Bulletin No. 2004-1, the Wisconsin Public Broadcasting Foundation, Inc., Celebrate Children Foundation, Inc., and the Badger Tobacco Asset Securitization Corporation are reported as blended component units; and the Wisconsin Housing and Economic Development Authority, the Wisconsin Health Care Liability Insurance Plan, the University of Wisconsin Hospitals and Clinics Authority, and the University of Wisconsin Foundation are presented as discrete component units, as discussed below. Complete financial statements of the individual component units that issue separate statements can be obtained from their respective administrative offices: Wisconsin Public Broadcasting Foundation Inc. Wisconsin Educational Communications Board 3319 West Beltline Highway Madison, WI 53702 Celebrate Children Foundation, Inc. 110 East Main Street, Suite 614 Madison, WI 53703 Badger Tobacco Asset Securitization Corporation 10 East Doty Street, Suite 800 Madison, WI 53703 Wisconsin Housing and Economic Development Authority 201 West Washington Avenue, Suite 700 Madison, WI 53702 Wisconsin Health Care Liability Insurance Plan Office of the Commissioner of Insurance 125 South Webster Street Madison, WI 53702 University of Wisconsin Hospitals and Clinics Authority 635 Science Drive, Room 310 Madison, WI 53711 University of Wisconsin Foundation Attn: Finance PO Box 8860 Madison, WI 53708-8860

State of Wisconsin Notes To The Financial Statements
For the Fiscal Year Ended June 30, 2011
59
Blended Component Units Blended component units are entities that are legally separate from the State, but are so intertwined with the State that they are, in substance, the same as the State. The blended component unit serves or benefits the primary government. They are reported as part of the State and blended into the appropriate funds. Wisconsin Public Broadcasting Foundation, Inc. – The Wisconsin Public Broadcasting Foundation, Inc. (Foundation), created in 1983 by the Wisconsin Legislature, is a private, nonstock, nonprofit Wisconsin Corporation, wholly owned by the Wisconsin Educational Communications Board (ECB), a unit of the State. The Foundation solicits funds in the name of, and with the approval of, the ECB. The Foundation's funds are managed by a five-member board of trustees consisting of the executive director of the ECB and four members of the ECB board. The Foundation is reported as a special revenue fund. Celebrate Children Foundation, Inc. (CCF) – The Celebrate Children Foundation, Inc., was organized as a nonstock, nonprofit corporation for the exclusive purposes of soliciting and accepting contributions, grants, gifts and bequests for the State’s Children’s Trust Fund or for deposit into a fund maintained by the CCF. The Child Abuse and Neglect Prevention Board administer the Children’s Trust Fund, a statutory fund included in the State’s CAFR as a special revenue fund. In addition to the State appointing a voting majority of the CCF, the State is able to impose its will on the CCF and a financial benefit/burden relationship exists. The CCF is reported as a special revenue fund. Badger Tobacco Asset Securitization Corporation (BTASC) – A nonstock public corporate entity created under Chapter 181 of the Wisconsin Statutes was created for the purpose of making a one-time purchase of Tobacco Settlement Revenues (TSRs) from the State. In May 2002, BTASC issued bonds to provide sufficient funds for carrying out its purpose. Bonds issued by the BTASC are the sole obligation of the BTASC. The State is not legally liable for payment of principal and interest on these bonds nor is the debt dependent upon any dedicated stream of revenue generated by the State. Directors of the corporation are appointed by the Secretary of Administration for staggered three-year terms. Once appointed, directors can only be removed for cause. At least one of the directors must be determined to be “independent” for federal bankruptcy law purposes. The State appoints the BTASC board and a financial benefit exists. BTASC
reports on a fiscal year ended May 31. BTASC is reported as a debt service fund (Badger Tobacco Asset Securitization). Pursuant to a Purchase and Sale Agreement with the State, BTASC acquired all of the State’s right, title, and interest in the TSRs under the Master Settlement Agreement and the Consent Decree and Final Judgment (MSA). The MSA was entered into on November 23, 1998, among the attorneys general of 46 states, the District of Columbia, the Commonwealth of Puerto Rico, Guam, the U.S. Virgin Islands, American Samoa and the Commonwealth of the Northern Mariana Islands (the “Settling States”) and the four largest United States tobacco manufacturers. On May 23, 2002 the State sold the TSRs to BTASC for $1.3 billion and a residual certificate. Upon discharge of BTASC’s obligations under its May 1, 2002 bond indenture, all subsequent TSRs are owned by the State pursuant to the residual certificate. In April, 2009, BTASC legally defeased its outstanding bonds as a result of a sale of its TSRs to the State. BTASC will remain active to pay remaining costs associated with the defeased bonds held until 2012 when the bonds are scheduled to be paid in full by the trust. Discretely Presented Component Units Discretely presented component units are entities which are legally separate from the State, but are financially accountable to the State, whose relationship with the State is such that exclusion would cause the State's financial statements to be misleading or incomplete. The Wisconsin Housing and Economic Development Authority, the Wisconsin Health Care Liability Insurance Plan, the University of Wisconsin Hospitals and Clinics Authority, and the University of Wisconsin Foundation are reported in a separate column and in separate rows in the government-wide statements to emphasize that they are legally separate. Wisconsin Housing and Economic Development Authority – The Wisconsin Housing and Economic Development Authority (Authority) was established by the Wisconsin Legislature in 1972 to help meet the housing needs of Wisconsin's low and moderate income citizens. The State has significantly expanded the scope of services of the Authority by adding programs that include financing for farmers and for economic development projects. While the Authority receives no State tax dollars for its bond-supported programs and the State is not liable on bonds the Authority issues, the State has the ability to impose its will on the

State of Wisconsin Notes to The Financial Statements
For the Fiscal Year Ended June 30, 2011
60
Authority through legislation. The State appoints the Authority's Board. The Authority reports on a June 30 fiscal year-end. Wisconsin Health Care Liability Insurance Plan – The Wisconsin Health Care Liability Insurance Plan (Plan) was established by rule of the Commissioner of Insurance of the State of Wisconsin to provide health care liability insurance and liability coverage normally incidental to health care liability insurance to eligible health care providers in the State. Eight out of 13 members of the Board of Directors are appointed by the Governor, and the State has the ability to impose its will upon the Plan. The Plan reports on a fiscal year ended December 31. University of Wisconsin Hospitals and Clinics Authority – The University of Wisconsin Hospitals and Clinics Authority (Hospital) is a not-for-profit academic medical center. The Hospital operates an acute-care hospital with approximately 480 available beds, numerous specialty clinics, and seven ambulatory facilities providing comprehensive health care to patients, education programs, research and community service to residents of southern Wisconsin. Prior to June 1996, the Hospital was a unit of the University of Wisconsin-Madison. In June 1996, in accordance with legislation enacted by the State Legislature, the Hospital was restructured as a Public Authority, a public body corporate and politic created by State statutes. The State appoints a majority of the Hospital’s Board of Directors and a financial benefit/burden relationship exists between the Hospital and the State. The Hospital reports on a June 30 fiscal year-end. The legislation that created the Hospital Authority also provided, among other things, for the Board of Regents of the University of Wisconsin System to execute various agreements with the Hospital. These agreements include an Affiliation Agreement, a Lease Agreement, a Conveyance Agreement and a Contractual Services Agreement and Operating and Service Agreement. The Affiliation Agreement requires the Hospital to continue to support the educational, research and clinical activities of the University of Wisconsin-Madison, which are administered by the Hospital. Under the terms of a Lease Agreement, the Hospital leases facilities, which were occupied by the Hospital as of June 29, 1996 (see Note 12A to the financial statements). Under a Conveyance Agreement, certain assets and liabilities related to the Hospital were identified and transferred to the Hospital effective July 1, 1996. Subject to the Contractual Services Agreement and Operating and Service Agreement between the Board of Regents and the Hospital, the two parties have entered into contracts for the continuation of services in support of programs and operations. University of Wisconsin Foundation – The University of Wisconsin Foundation (the Foundation) is a legally separate, tax-exempt component unit of the State. The Foundation acts primarily as a fund-raising organization to supplement the resources that are available to the University of Wisconsin-Madison and several
other units of the University of Wisconsin System (a fund of the State) in support of its programs. These include scientific, literary, athletic and educational program purposes. Although the State does not control the timing or amount of receipts from the Foundation, the majority of resources, or income thereon, that the Foundation holds and invests, are restricted to the activities of the University of Wisconsin-Madison and other units of the University of Wisconsin System by the donors. Because these restricted resources held by the Foundation can only be used by, or for the benefit of, the University of Wisconsin-Madison and several other units of the University of Wisconsin System, the Foundation is considered a component unit of the State. The Foundation reports on a fiscal year ended December 31. Related Organizations These related organizations are excluded from the reporting entity because the State's accountability does not extend beyond appointing a voting majority of the organization's board members. Financial statements are available from the respective organizations. Wisconsin Health and Educational Facilities Authority – a public body politic and corporate that provides financing for capital expenditures and refinancing of indebtedness for Wisconsin health care and educational institutions. Bradley Center Sports and Entertainment Corporation – a public body politic and corporate that operates the Bradley Center. Fox River Navigational System Authority – created under Chapter 237 as a public body corporate and politic to oversee the navigational system on the Fox River after the federal government (the U.S. Army Corps of Engineers) transferred the system to the State. Health Insurance Risk-Sharing Plan Authority – created under 2005 Wisconsin Act 74, Chapter 149, to assume all responsibilities for administration of the health insurance risk-sharing plan. Wisconsin Quality Home Care Authority – created under Wis. Stat. Section 52.05(1) as a public body corporate and politic to establish and maintain one or more registries of home care providers, and provide referral and matching services for consumers in need of home care. C. Government-wide and Fund Financial
Statements The government-wide financial statements consist of the statement of net assets and the statement of activities.

State of Wisconsin Notes to The Financial Statements
For the Fiscal Year Ended June 30, 2011
61
These statements report information on all activities, except for fiduciary activities, of the primary government and its component units. The statement of net assets and the statement of activities distinguish between the governmental and business-type activities of the State. Governmental activities are generally financed through taxes, intergovernmental revenues and other nonexchange revenues. Business-type activities are generally financed in whole or in part by fees charged to external parties for goods and services. The focus of the government-wide statements is the primary government. A separate column on the statement of net assets and the statement of activities reports activities for all discretely presented component units. The fund financial statements provide detailed information on all governmental, proprietary and fiduciary funds. Separate columns are presented for all major governmental and enterprise funds. Nonmajor governmental and enterprise funds are aggregated and presented as a single column on the respective governmental or proprietary statements. Internal service funds are exempt from the major fund reporting requirements and are aggregated and ultimately reported as a single column on the proprietary statement. Fiduciary funds are also exempt from major fund reporting and are aggregated by fund type and ultimately reported as single columns on the fiduciary statements. D. Measurement Focus, Basis of Accounting,
and Financial Statement Presentation The government-wide statement of net assets and statement of activities, as well as the proprietary and fiduciary fund statements, are reported using the economic resources measurement focus and the accrual basis of accounting. With this measurement focus, all assets and liabilities associated with the operation of these funds are included on the balance sheet. Under the accrual basis, revenues are recorded when earned and expenses are recorded when the related liability is incurred. In the University of Wisconsin System's enterprise fund, revenues and expenses of an academic term that spans two fiscal years are recognized in two years based on a proration of summer session days. In reporting the financial activity of its enterprise funds and business-type activities, the State applies all applicable GASB pronouncements as well as the following pronouncements issued on or before November 30, 1989, unless these pronouncements conflict with or contradict GASB pronouncements: Financial Accounting Standards Board (FASB) Statements and Interpretations, Accounting Principles Board Opinions, and Accounting Research Bulletins of the Committee on Accounting Procedure. Further, except for the State Life Insurance Fund, the State has elected not to apply the provisions of relevant pronouncements of FASB issued after November 30, 1989 for its enterprise funds and business-type activities. The State Life Insurance Fund is reported as an insurance enterprise fund and,
accordingly, applies the provisions of relevant pronouncements of FASB, including those issued after November 30, 1989. The University of Wisconsin Foundation, and Wisconsin Health Care Liability Insurance Plan (Plan) are reported as component units, and in applying GAAP, have elected to apply the provisions of relevant pronouncements of FASB including those issued after November 30, 1989. Governmental fund financial statements are accounted for using the current financial resources measurement focus. With this measurement focus, only current assets and current liabilities generally are included on the balance sheet. Operating statements of these funds present increases (i.e., revenues and other financing sources) and decreases (i.e., expenditures and other financing uses) in net available financial resources. Governmental funds are reported on the modified accrual basis of accounting. This basis of accounting recognizes revenues generally when they become measurable and available to pay current reporting period liabilities. For this purpose, the State considers tax revenues to be available if they are collected within 60 days of the end of the current fiscal year end. Other revenues are considered to be available if received within one year after the fiscal year end except for tobacco settlement revenues for which just one-half of revenues expected to be received within one year are recognized. Material revenue sources susceptible to accrual include individual and corporate income taxes, sales taxes, public utility taxes, motor fuel taxes and federal revenues. Expenditures and related liabilities are recognized when obligations are incurred as a result of the receipt of goods and services. However, expenditures related to debt service, compensated absences, and claims and judgments, are recorded only when payment is due. The State reports the following major funds: Major Governmental Funds • General Fund – the primary operating fund of the State,
accounts for all financial transactions except those required to be accounted for in another fund.
• Transportation Fund – a special revenue fund, accounts for the
proceeds from motor fuel taxes, vehicle registrations, licensing fees, and federal and local governments which are used to supply and support safe, efficient and effective transportation in Wisconsin.
• Common School Fund – a permanent fund, accounts for
revenues received from the sale of federally granted land, fines and forfeitures from penal law branches, and the disposal of escheated property. These moneys are used for public purpose loans to municipalities and school districts. Earnings

State of Wisconsin Notes to The Financial Statements
For the Fiscal Year Ended June 30, 2011
62
of this fund are distributed to local school districts and to cover administrative costs incurred by the Public Lands Commission.
Major Enterprise Funds • Injured Patients and Families Compensation Fund – accounts
for the program to provide excess medical malpractice insurance for Wisconsin health care providers. The revenues to finance this insurance are primarily derived from assessments against health care providers.
• Environmental Improvement Fund – accounts for financial
resources generated and used for clean water projects. Federal capitalization grants, interest earnings, revenue bond proceeds, and general obligation bond proceeds are its primary funding sources.
• University of Wisconsin System Fund – accounts for the 13
universities, 13 two-year colleges, the University of Wisconsin Extension and System Administration.
• Unemployment Reserve Fund – accounts for unemployment
contributions made by employers, federal program receipts, benefit payment recoveries and unemployment benefits paid to laid off workers in the State.
In addition, the State reports the following fund types: Governmental Funds • Special Revenue Funds – account for and report the proceeds
of specific revenue sources that are restricted or committed to expenditure for specified purposes other than debt service or capital projects. Examples include the Conservation Fund and the Petroleum Inspection Fund.
• Debt Service Funds – account for and report financial
resources that are restricted, committed, or assigned to expenditure for principal and interest. Financial resources that are being accumulated for future principal and interest are also reported in debt service funds.
• Capital Projects Funds – account for and report financial
resources that are restricted, committed or assigned to expenditure for capital outlays, including the acquisition or construction of capital facilities and other capital assets (other than those financed by proprietary funds or that will be held in trust for individuals, private organizations, or other governments).
• Permanent Funds – account for and report resources that are
restricted to the extent that only earnings, and not principal, may be used for purposes that support the State’s programs – that is, for the benefit of the State or its citizenry.
Proprietary Funds • Enterprise Funds – account for the activities for which fees are
charged to external users for goods or services. Examples include the Lottery Fund and the Veterans Trust Fund.
• Internal Service Funds – account for the operations of State
agencies which provide goods or services to other State units or other governments on a cost-reimbursement basis. These services include technology, fleet management, financial, facilities management, and risk management. Additional goods and services are provided by the inmate work experience program, Badger State Industries.
Fiduciary Funds • Pension and Other Employee Benefit Trust Funds – account for
the Wisconsin Retirement System as well as other employee benefit programs including accumulated sick leave, duty disability, employee reimbursement accounts, life insurance, and retiree life insurance.
• Investment Trust Funds – account for the local government
investment pool managed by the State Treasurer and the Milwaukee Retirement System.
• Private-purpose Trust Funds – account for the State-sponsored
college savings programs and the BadgerRx for Individuals Fund.
• Agency Funds – account for the assets of liquidated insurance
companies to insure payments to claimants, transactions of the retiree health insurance program, assets held by the State for inmates and residents of state facilities, deposits of bank and insurance companies doing business in the state, and the collection and disbursement of court-ordered support payments.

State of Wisconsin Notes to The Financial Statements
For the Fiscal Year Ended June 30, 2011
63
Amounts reported as program revenues on the government-wide statement of activities include (a) charges for services – amounts received from customers or applicants who purchase, use or directly benefit from the goods, services or privileges provided by the State; including interest earnings from various loan funds/ component units, (b) program-specific operating grants, contributions, and restricted interest, and (c) program-specific capital grants, contributions, and restricted interest. General revenues consist of taxes and all other revenues that do not meet the definition of program revenues. Special items, if any, are significant transactions or events within the control of management that are either unusual in nature or infrequent in occurrence. As a general rule, the effect of interfund activity has been eliminated from the government-wide financial statements. This includes all internal service fund activity, as well as, other internal allocations. Exceptions to this general rule are certain charges between various functions of the government, whose elimination would distort the direct costs and program revenues reported for the various functions concerned. The revenues and expenses shown on the proprietary fund statements are identified as either operating or nonoperating. Operating revenues and expenses generally result from providing goods and services in connection with a proprietary fund’s primary mission. The State’s enterprise funds are involved in many diverse fields including patient care, insurance programs, loan programs, the University of Wisconsin System, employee benefit plans, and the lottery. The internal service funds provide services and goods to other State agencies and departments. A significant portion of operating revenues for the proprietary funds is recorded under charges for goods and services. In the case of the State’s loan program enterprise funds, investment and interest income is an important component of operating revenue. Operating revenues of the University of Wisconsin include tuition and fees, certain grants and contracts resulting from exchange transactions, and sales and services of educational activities and auxiliary enterprises. In regards to the employee benefit plans, the primary operating revenue source is participant and employer contributions. Operating expenses for the proprietary funds include the costs of sales and services, benefit expenses, administration expenses and depreciation on capital assets. All revenues and expenses not related to a fund’s primary purpose are reported as nonoperating. Deferred outflow of resources is a consumption of net assets that is applicable to a future reporting period, while a deferred inflow of resources is an acquisition of net assets that is applicable to a future reporting period. Deferred outflows and inflows are reported on the government-wide statement of net assets and the balance sheet of proprietary funds, as applicable, but are not considered either assets or liabilities.
GASB Statement No. 53, Accounting and Financial Reporting for Derivative Instruments, requires that all derivative instruments be measured at fair value and reported on the State’s financial statements. The change in the fair value of derivative instruments classified as effective hedges are presented as a deferred outflow or inflow of resources with an off-setting asset or liability, as applicable, on the government-wide statement of net assets or balance sheet of proprietary funds. If an effective hedge is subsequently classified as ineffective, it is considered an investment derivative instrument. At that time, the change in fair value is no longer deferred but rather is reported as investment revenue in the government-wide statement of activities or as non-operating investment revenue in proprietary statements. When both restricted and unrestricted resources are available for use, it is the State’s policy to use restricted resources first, then unrestricted resources as they are needed. E. Assets, Liabilities, and Net Assets/Fund
Balances/Fund Equity 1. Cash and Cash Equivalents Cash balances of most funds are deposited with the Department of Administration where the available balances beyond immediate needs are pooled in the State Investment Fund for short-term investment purposes. Balances pooled are restricted to legally stipulated investments valued consistent with GASB Statement No. 31, Accounting and Financial Reporting for Certain Investments and for External Investment Pools. Cash balances not controlled by the Department of Administration may be invested where permitted by statute. Cash and cash equivalents, reported on the balance sheet and statement of cash flows, include bank accounts, petty cash, cash in transit, short-term investments with an original maturity of three months or less such as certificates of deposit, money market certificates and repurchase agreements and individual funds' shares in the State Investment Fund. GASB Statement No. 40, Deposit and Investment Risk Disclosures, requires disclosure of risks associated with deposit and investment balances and the policies applied to mitigate such risks. Specific disclosures are included in Note 5, Deposits and Investments. 2. Investments Primary Government The State may invest in direct obligations of the United States and Canada, securities guaranteed by the United States, certificates of deposit issued by banks in the United States and solvent financial institutions in the State, commercial paper and

State of Wisconsin Notes to The Financial Statements
For the Fiscal Year Ended June 30, 2011
64
nonsecured corporate notes and bonds, bankers acceptances, participation agreements, privately placed bonds and mortgages, common and preferred stock and other securities approved by applicable sections of the Wisconsin Statutes, bond resolutions, and various trust indentures (see Note 5 to the financial statements). Generally, investments of the primary government are reported at fair value consistent with the provisions of GASB Statement No. 31, Accounting and Financial Reporting for Certain Investments and for External Investment Pools. Typically, fair value information is determined using quoted market prices. However, when quoted market prices are not available for certain securities, fair values are estimated through techniques such as discounted future cash flows, matrix pricing and multi-tiers. There are a certain number of securities carried at cost. Certain non-public or closely held stocks are carried at cost since no independent quotation is available to price these securities. Further, certain investment agreements are reported on a cost basis because the State cannot readily determine whether these agreements meet the definition of interest-earning investment contracts as defined by GASB Statement No. 31. However, the impact on the financial statements is immaterial. Under Wisconsin Statutes, the investment earnings of certain Permanent Funds are assigned to other funds. The following table shows the funds earning the investment income and the ultimate recipients of that income:
Fund Generating Fund Receiving Investment Income Investment Income
Agricultural College University of Wisconsin System Normal School General and University of
Wisconsin System University University of Wisconsin System Benevolent General Component Units Investments (reported as cash equivalents) of the Badger Tobacco Asset Securitization Corporation, a blended component unit, are reported at fair value. Investments of the Wisconsin Housing and Economic Development Authority (the Authority) are reported at fair value based on quoted market prices. Collateralized and uncollateralized investment agreements are not transferable and are considered nonparticipating contracts. As such, both types of investment agreements are reported at contract value. Investments of the University of Wisconsin Hospitals and Clinics Authority (the Hospital) in equity securities with readily
determinable fair values and all investments in debt securities are reported at fair value based on quoted market prices. Certain investments of the Wisconsin Health Care Liability Insurance Plan are reported on a cost basis; however, the impact on the financial statements is not material. Investments of the University of Wisconsin Foundation are reported at fair value. 3. Mortgage and Other Loans Mortgage loans of the Wisconsin Housing and Economic Development Authority, a component unit, are carried at their unpaid principal balance, less allowance for possible loan losses. Loan origination fees and associated costs are deferred and recognized as income or expenses over the projected life of the loan. Mortgage loans of the Veterans Mortgage Loan Repayment Fund and the Veterans Trust Fund programs, business-type activities, are stated at the outstanding loan balance less an allowance for doubtful accounts. 4. Forestation State Tax The State levies an annual tax of two-tenths of one mill for each dollar of the assessed valuation of the property in the State, as described in Wis. Stat. Sec. 70.58. This tax is levied for the purpose of acquiring, preserving and developing the forests of the state; for forest crop law and county forest law administration and aid payments; and for the acquisition, purchase and development of forests. The proceeds of the tax are paid to the Conservation Fund. This tax, the only property tax levied by the State, is levied to each county on or before the fourth Monday in August of each year on assessed valuation as of January 1 of that year. The tax is due and payable January 31 or on the due dates established through an installment option permitted under Wis. Stat. Sec. 74.12. Consistent with the requirements of GASB Interpretation No. 5, Property Tax Revenue Recognition in Governmental Funds, collections received July 1 through August 31 that were due but unpaid at June 30 are accrued.

State of Wisconsin Notes to The Financial Statements
For the Fiscal Year Ended June 30, 2011
65
5. Interfund Assets/Liabilities During the course of operations, numerous transactions occur between individual funds for goods provided or services rendered. The balance sheet classifies these receivables and payables as "Due from Other Funds" or "Due to Other Funds." Short-term interfund loans are classified as "Interfund Receivables" or "Interfund Payables." Long-term interfund loans are classified as "Advances to Other Funds" and "Advances from Other Funds." Advances to Other Funds, as reported in the governmental fund financial statements, are offset with a fund balance reserve to indicate that they are neither available for appropriation nor expendable available financial resources. Balances that exist between the primary government and component units are classified as “Due to/from Primary Government” and, correspondingly, “Due to/from Component Units”. Further, cash and investments invested by one component unit with another component unit are reported on the statement of net assets as “Cash and Investments with Other Component Units” and “Amounts Held in Trust by Component Units for Other Component Units”. Amounts reported in the funds as interfund assets/liabilities are eliminated in the governmental and business-type columns of the Statement of Net Assets, except for the net residual amount due between governmental and business-type activities which is shown as internal balances. 6. Inventories and Prepaid Items Inventories of governmental and proprietary funds are valued at cost, which approximates market, using the first-in/first-out, last in/first out, or weighted-average method. The costs of governmental fund-type inventories are recorded as expenditures when purchased rather than when consumed. Inventories of the University of Wisconsin System held by central stores are valued at average cost, fuels are valued at market, and other inventories held by individual institutional cost centers are valued using a variety of cost flow assumptions that, for each type of inventory, are consistently applied from year to year. Prepaid items reflect payments for costs applicable to future accounting periods. The fund balances of governmental funds are reported as nonspendable for inventories and prepaid items, except in cases where prepaid items are offset by unearned revenues, to indicate that these accounts do not represent expendable available financial resources.
7. Capital Assets Capital assets, which include property, plant, equipment, intangibles, land and infrastructure assets (roads, bridges, and buildings considered an ancillary part of roads), are reported in the applicable governmental or business-type activities columns in the government-wide financial statements. Assets of the primary government, other than infrastructure and land purchased for the construction of infrastructure assets, are capitalized when they have a unit cost of $5,000 or more (except for a collection of library resources that must have a cumulative value equal to or greater than $5.0 million) and a useful life of two or more years. In addition, internally generated intangible assets are capitalized only if costs equal to or are greater than $1.0 million. Assets of the discretely presented component units are capitalized when they have a unit cost of $5,000 or more, except for the University of Wisconsin Foundation, which capitalizes assets greater than $2,500. Purchased or constructed capital assets are valued at cost or estimated historical cost if actual historical cost is not practicably determinable. Donated capital assets are recorded at their fair value at the time received. The State has elected to report infrastructure assets (roads, bridges and buildings considered an ancillary part of roads) using the modified approach. Under this method infrastructure assets are not required to be depreciated if the State manages its eligible infrastructure assets using an asset management system designed to maintain and preserve its infrastructure assets at a condition level established and disclosed by the State. All infrastructure assets constructed prior to July 1, 2000 have been recorded at estimated historical cost. The estimated historical cost was determined by calculating current cost of a similar asset and deflating that cost through the use of a price-index to the estimated average construction date. Costs are expressed in 2000 dollars and deflated back to the average construction date using the Federal Highway Administration’s composite index for federal-aid highway construction. The costs of maintenance and preservation that do not add to the asset’s capacity or efficiency are not capitalized. Interest incurred during construction is not capitalized. Exhaustible capital assets of the primary government and the component units generally are depreciated on the straight-line method over the asset’s useful life. Select buildings of the University of Wisconsin System are depreciated using the componentized method over the estimated useful life of the related assets. Depreciation expense is recorded in the government-wide financial statements, as well as the proprietary funds and component units. There is no depreciation recorded for land, construction in process, infrastructure, and certain other capital assets including the State Capitol and Executive Residence and associated furnishings, defined as inexhaustible. Generally, estimated useful lives are as follows:

State of Wisconsin Notes to The Financial Statements
For the Fiscal Year Ended June 30, 2011
66
Buildings and improvements 2 - 40 years Equipment, machinery and furnishings 2 - 40 years
Collections of works of art, historical treasures, and similar assets, which are on public display, used in furtherance of historical education, or involved in advancement of artistic or historical research, are not capitalized unless these collections were already capitalized at June 30, 1999. Collections range from memorabilia on display in the Wisconsin Veterans Museum, the Wisconsin Historical Society Museum and other museums to buildings such as the Villa Louis Mansion and the Fur Trade Museum located at the Villa Louis historical site. In addition, works of art or historical treasures on display in the various State office buildings, as well as statues on display outside the State Capitol, also are not capitalized. 8. Restricted and Limited Use Assets Governmental fund and proprietary fund assets required to be held and/or used as specified in bond indentures, bond resolutions, trustee agreements, board resolutions, and donor specifications have been reported as Restricted and Limited Use Assets. Likewise, assets of the Wisconsin Housing and Economic Development Authority, the University of Wisconsin Hospitals and Clinics Authority, and the University of Wisconsin Foundation (discretely presented component units) that meet similar criteria have been reported as Restricted and Limited Use Assets. These assets are classified into four categories: Cash and Cash Equivalents, Investments, Cash and Investments with Other Component Units, and Other Restricted Assets. 9. Local Assistance Aids Municipal and County Shared Revenue Program Through the Municipal and County Shared Revenue Program, the State distributes general revenues collected from general State tax sources to municipal and county governments to be used for providing local government services. State statutes require that payment to local governments be made during July and November. At June 30, 2011, the State was liable to various local governments for unpaid shared revenue aid. To measure the amount of the program allocable to the State's fiscal year, the amount is prorated over portions of recipient local governments’ calendar fiscal years that are within the State's fiscal year. The result is that a liability of $475.4 million representing one-half of the total appropriated amount is reported at June 30, 2011 as Due to Other Governments. State Property Tax Credit Program At June 30, 2011, the State was liable to various taxing jurisdictions for the school levy, the first dollar, and the lottery
property tax credits paid through the State Property Tax Credit Program. The school levy tax credit provides property tax relief in the form of State credits on individual property tax bills. The first dollar tax credit was first established for property taxes levied in 2008, and payable in 2009. This credit is allowed on every taxable real estate parcel containing an improvement in the state. Under the lottery property tax credit, owners of property used as a primary residence receive a tax credit equal to the school property tax on a portion of the dwelling’s value. State statutes require that payment to local taxing jurisdictions for the school levy and first dollar tax credits be made during July. Although the state property tax credit is calculated on the property tax levy for school purposes, the State's July payment is paid to an administering municipality who treats the payment the same as other tax collections and distributes the collections to the various tax levying jurisdictions (e.g., cities, towns, and school districts). The portion of the liability payable to school districts for the school levy and first dollar tax credits represents the amount of the July payment earned over the school districts' previous fiscal year ended June 30. Since the entire school districts' portion of the July payment occurs within the State's fiscal year, 100 percent of the July payment relating to the school taxing jurisdictions' levy is reported as a liability at June 30, 2011. The portion of the liability payable to general government for the school levy and first dollar tax credits represents the amount of the July payment prorated over the portion of the local governments' calendar year which is within the State's fiscal year. The result is that 50 percent of the July payment based on the general government taxing jurisdictions' levy is reported as a liability at June 30, 2011. The aggregated State Property Tax Credit Program liability of $682.8 million is reported in the General Fund as Due to Other Governments. Of that amount, $570.2 million relates to the school levy tax credit and $112.6 million relates to the first dollar tax credit. Beginning with the State’s fiscal year 2010, a portion of the school tax credit is funded by the Lottery Fund. For FY 2011, the Lottery funded $14.9 million of the credit. The lottery tax credit is accounted for in the Lottery Fund, an enterprise fund that records revenues and expenses on the accrual basis. The State pays municipal treasurers for lottery credits who distribute the moneys to the various taxing jurisdictions. For credits reducing the calendar year 2011 property tax bills, the State made this payment in March 2011. A portion of the State’s March payment distributed to the general government taxing jurisdictions applies to their fiscal year that

State of Wisconsin Notes to The Financial Statements
For the Fiscal Year Ended June 30, 2011
67
ends on December 31. Therefore, part of the March distribution represents an expense of the State in Fiscal Year 2011, while the remaining portion represents a prepaid item. The resulting prepaid item reported within the Lottery Fund totals $30.6 million at June 30, 2011. State Aid for Exempt Computers The Aid for Exempt Computers compensates local governments for tax base lost due to the property tax exemption for computers, software and related equipment. Aid payments are calculated using a procedure that results in an aid amount equal to the amount of taxes that would be paid if the property were taxable. Payments to local governments are made on the fourth Monday in July. At June 30, 2011, the State was liable to various local governments and other taxing jurisdictions for unpaid exempt computer aid payments of $58.5 million.
10. Long-term Debt Obligations In the government-wide financial statements, and proprietary fund types in the fund financial statements, long-term debt is reported as a liability. Bond premiums and discounts, as well as issuance costs, are deferred and amortized using the effective interest rate method on a prospective basis beginning in Fiscal Year 2004, except for the annual appropriation bonds that are amortized ratably over the life of the obligations to which they relate. Bonds payable are reported net of the applicable bond premium or discount. Bond issuance costs are reported as deferred charges. In the fund financial statements, governmental fund types recognize bond premiums and discounts, as well as bond issuance costs, during the current period. The face amount of debt issued is reported as other financing sources. Premiums and discounts on debt issuances are reported as other financing sources and other financing uses, respectively. Debt issuance costs, as well as bond premiums and discounts, relating to revenue obligations of the Environmental Improvement Fund, an enterprise fund, were deferred and are being amortized using the effective interest rate method. Debt issuance costs relating to general obligation bonds of the University of Wisconsin System Fund and the Veterans Mortgage Loan Repayment Fund, both enterprise funds, are amortized using the effective interest method. On the government-wide financial statements, bond premiums and discounts, as well as issuance costs, related to the Transportation Revenue Bonds and the Petroleum Inspection Fee Obligation Revenue Bonds (which finance programs in a capital projects fund and a special revenue fund, respectively) are also amortized ratably over the life of the obligations to which they relate. Results from the use of this method do not vary materially from those that would be obtained by use of the effective interest rate method. Debt issuance costs, and bond premiums and discounts, of the Wisconsin Housing and Economic Development Authority and the University of Wisconsin Hospitals and Clinics Authority, both discretely presented component units, are amortized ratably over the life of the obligations to which they relate.

State of Wisconsin Notes to The Financial Statements
For the Fiscal Year Ended June 30, 2011
68
11. Compensated Absences Consistent with the compensated absences reporting standards of GASB Statement No. 16, Accounting for Compensated Absences, an accrual for certain salary-related payments associated with annual leave and an accrual for sick leave is included in the compensated absences liability at year end. Annual Leave Full-time employees' annual leave days are credited on January 1 of each calendar year in general at a minimum of 15 or 13 days per year, depending on Fair Labor Standards Act (FLSA) status. There is no requirement to use annual leave. However, unused leave is lost unless approval to carry over the unused portion is obtained from the employing agency. Generally, compensatory time accumulates for eligible employees for hours worked in excess of forty hours per week. In general, each full-time employee is eligible for four and one-half personal holidays each calendar year, provided the employee is in pay status for at least one day in the year. If a holiday occurs on a Saturday, employees receive leave time proportional to their working status to use at their discretion. The State's compensated absence liability at June 30 consists of accumulated unpaid annual leave, compensatory time, personal holiday hours, and Saturday/legal hours earned and vested during January through June. The liability is reported in the government-wide, proprietary fund types and fiduciary funds. Sick Leave Full-time employees earn sick leave at a rate of five hours per pay period. Unused sick leave is accumulated from year to year without limit until termination or retirement. Accumulated sick leave is not paid. However, at employee retirement the accumulated sick leave may be converted to pay for the retiree's health insurance premiums. The State accumulates resources to pay for the expected health insurance premiums of retired employees. The portion of the health insurance obligation funded through the sick leave conversion and accumulated resources are presented in the Accumulated Sick Leave Fund, a pension and other employee benefit trust fund.
12. Unearned and Deferred Revenue In both the government-wide and fund financial statements unearned revenue represents amounts for which asset recognition criteria have been met, but not revenue recognition criteria. Unearned revenue arises when resources are received by the State before it has a legal claim to them, as when grant moneys are received prior to the incurrence of qualifying expenditures. In subsequent periods, when both revenue recognition criteria are met, or when the State has a legal claim to the resources, the liability for unearned revenue is removed and revenue is recognized. Unearned revenue of the University of Wisconsin System consists of payments received but not earned at June 30, 2011, primarily for summer session tuition, tuition and room deposits for the next fall term, advance ticket sales for upcoming intercollegiate athletic events, and amounts received from grant and contract sponsors that have not yet been earned under the terms of the agreement. Deferred revenue, reported in the governmental fund statements, represents revenues that are unavailable and consequently not susceptible to accrual. Primarily, this relates to items like long-term receivables, which represent amounts owed to the State that will not be collectible for many years. That is, under modified accrual accounting, revenue is not recognized until it is both measurable and available to finance expenditures of the current period. 13. Self-Insurance Consistent with the requirements of GASB Statement No. 10, Accounting and Financial Reporting for Risk Financing and Related Insurance Issues, the State’s risk management activities are reported in an internal service fund, and the claims liabilities associated with that fund are reported therein. The State's policy is generally not to purchase commercial insurance for the risk of losses to which it is exposed. Instead, State management believes it is more economical to manage its own risks internally. The Risk Management Fund, an internal service fund, is used to pay for losses incurred by any State agency and for administrative costs incurred to manage a state-wide risk management program. These losses include damage to property owned by the agencies, personal injury or property damage liabilities incurred by a State officer, agent or employee, and worker's compensation costs for State employees. A limited amount of insurance is purchased to limit the exposure to catastrophic losses. Annually, a charge is allocated to each agency for its proportionate share of the estimated cost attributable to the program per Wis. Stat. Sec. 16.865(8).

State of Wisconsin Notes to The Financial Statements
For the Fiscal Year Ended June 30, 2011
69
14. Fund Balance Classification and Restricted Net Assets/Fund Equity
Fund Balance Classification In the fund financial statements, governmental funds report fund balance classifications that comprise a hierarchy based primarily on the extent to which the state is bound to honor constraints on the specific purposes for which amounts in those funds can be spent. Fund balance is reported as restricted when constraints placed on the use of the resources are either externally imposed by creditors, grantors, contributors, or laws or regulations of other governments; or, imposed by law through constitutional provisions or enabling legislation. Amounts that can only be used for specific purposes pursuant to constraints imposed by formal action of the state legislature are reported as committed fund balance. Those committed amounts cannot be used for any other purpose unless the state legislature removes or changes the specified use by taking the same type of action it employed to commit those amounts. Amounts that are constrained by the state’s intent to be used for specific purposes, but are neither restricted nor committed, are classified as assigned fund balances. Intent is expressed by state officials to whom the state has delegated the authority to assign amounts to be used for specific purposes. Unassigned fund balance represents fund balance that has not been assigned to other funds and that has not been restricted, committed, or assigned to specific purposes within the general fund. Nonspendable fund balances include amounts that cannot be spent because they are either not in spendable form or legally or contractually required to be maintained intact. When both restricted and unrestricted resources are available for use it is the State’s policy to use restricted resources first, and then unrestricted as they are needed. The state has not established a policy for use of unrestricted fund balance. Under the provisions of GASB Statement No. 54, Fund Balance Reporting and Governmental Fund Type Definitions, if a government does not establish a policy for its use of unrestricted fund balance amounts, committed amounts would be reduced first, followed by assigned amounts, and then unassigned amounts.
Restricted Net Assets/Fund Equity Restricted Net Assets (presented in the government-wide statement of net assets) and Restricted Fund Equity (presented in the balance sheet of proprietary funds) are reported when constraints placed on net assets or fund equity use are either (1) externally imposed by creditors (such as through debt covenants), grantors, contributors, or laws or regulations of other governments, or (2) imposed by law through constitutional provisions or enabling legislation. Enabling legislation authorizes the government to assess, levy, charge, or otherwise mandate payment of resources (from external resource providers) and includes a legally enforceable requirement that those resources be used only for the specific purposes stipulated in the legislation. Unrestricted net assets or fund equity may be used at the State’s discretion but may have limitations on use based on State statutes.
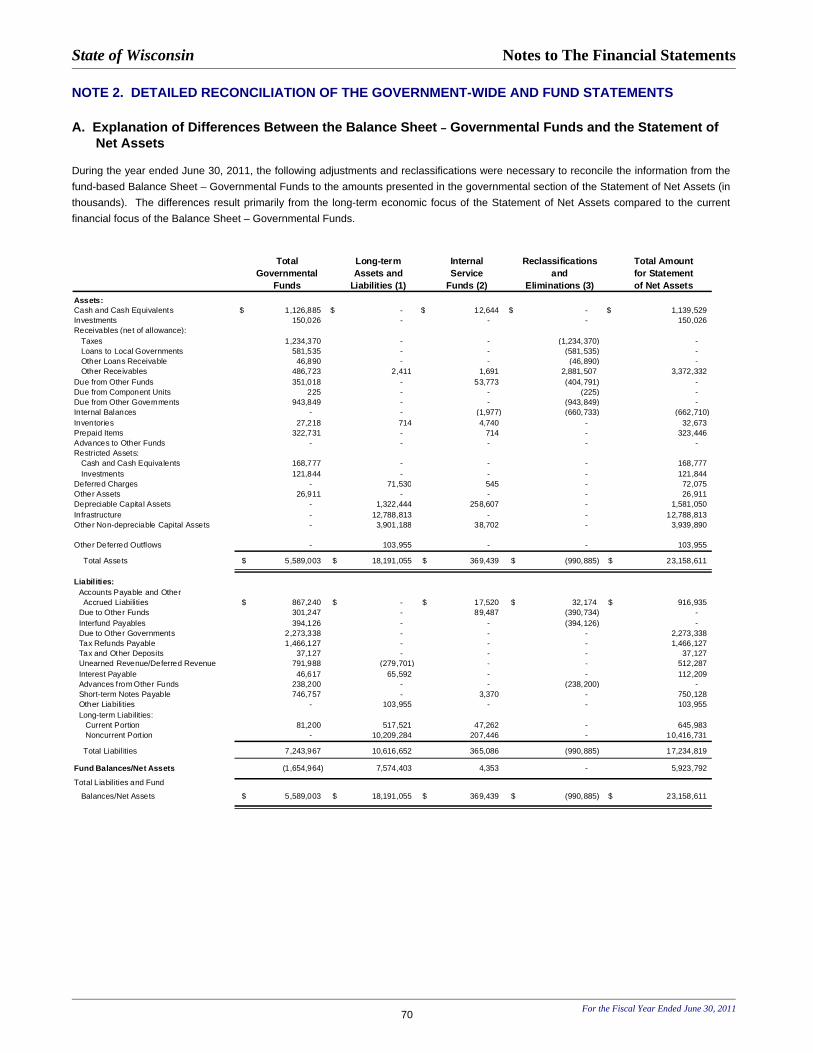
State of Wisconsin Notes to The Financial Statements
NOTE 2. DETAILED RECONCILIATION OF THE GOVERNMENT-WIDE AND FUND STATEMENTS A. Explanation of Differences Between the Balance Sheet – Governmental Funds and the Statement of
Net Assets During the year ended June 30, 2011, the following adjustments and reclassifications were necessary to reconcile the information from the fund-based Balance Sheet – Governmental Funds to the amounts presented in the governmental section of the Statement of Net Assets (in thousands). The differences result primarily from the long-term economic focus of the Statement of Net Assets compared to the current financial focus of the Balance Sheet – Governmental Funds.
Total Long-term Internal Reclassifications Total AmountGovernmental Assets and Service and for Statement
Funds Liabilities (1) Funds (2) Eliminations (3) of Net AssetsAssets: Cash and Cash Equivalents $ 1,126,885 $ - $ 12,644 $ - $ 1,139,529 Investments 150,026 - - - 150,026 Receivables (net of allowance): Taxes 1,234,370 - - (1,234,370) - Loans to Local Governments 581,535 - - (581,535) - Other Loans Receivable 46,890 - - (46,890) - Other Receivables 486,723 2,411 1,691 2,881,507 3,372,332 Due from Other Funds 351,018 - 53,773 (404,791) - Due from Component Units 225 - - (225) - Due from Other Governments 943,849 - - (943,849) - Internal Balances - - (1,977) (660,733) (662,710) Inventories 27,218 714 4,740 - 32,673 Prepaid Items 322,731 - 714 - 323,446 Advances to Other Funds - - - - - Restricted Assets: Cash and Cash Equivalents 168,777 - - - 168,777 Investments 121,844 - - - 121,844 Deferred Charges - 71,530 545 - 72,075 Other Assets 26,911 - - - 26,911 Depreciable Capital Assets - 1,322,444 258,607 - 1,581,050 Infrastructure - 12,788,813 - - 12,788,813 Other Non-depreciable Capital Assets - 3,901,188 38,702 - 3,939,890
Other Deferred Outflows - 103,955 - - 103,955
Total Assets $ 5,589,003 $ 18,191,055 $ 369,439 $ (990,885) $ 23,158,611
Liabilities: Accounts Payable and Other Accrued Liabilities $ 867,240 $ - $ 17,520 $ 32,174 $ 916,935 Due to Other Funds 301,247 - 89,487 (390,734) - Interfund Payables 394,126 - - (394,126) - Due to Other Governments 2,273,338 - - - 2,273,338 Tax Refunds Payable 1,466,127 - - - 1,466,127 Tax and Other Deposits 37,127 - - - 37,127 Unearned Revenue/Deferred Revenue 791,988 (279,701) - - 512,287 Interest Payable 46,617 65,592 - - 112,209 Advances from Other Funds 238,200 - - (238,200) - Short-term Notes Payable 746,757 - 3,370 - 750,128 Other Liabilities - 103,955 - - 103,955 Long-term Liabilit ies: Current Portion 81,200 517,521 47,262 - 645,983 Noncurrent Portion - 10,209,284 207,446 - 10,416,731
Total Liabilities 7,243,967 10,616,652 365,086 (990,885) 17,234,819
Fund Balances/Net Assets (1,654,964) 7,574,403 4,353 - 5,923,792
Total Liabilities and Fund
Balances/Net Assets $ 5,589,003 $ 18,191,055 $ 369,439 $ (990,885) $ 23,158,611
For the Fiscal Year Ended June 30, 2011 70

State of Wisconsin Notes to The Financial Statements
For the Fiscal Year Ended June 30, 2011 71
(1) Long-term asset and liability differences arise because governmental funds focus only on short-term financing (that is, resources
that will be available to pay for current period expenditures). In contrast, the Statement of Net Assets has a long-term economic focus and reports on all capital and financial resources.
(2) The adjustment for internal service funds reflects the reclassification of these funds for the government-wide statement. The assets and liabilities of these funds are reported as proprietary activities on the fund statements, but are included as governmental activities on the Statement of Net Assets
(3) Various reclassifications are necessary due to the differing level of detail needed on each of the statements. Eliminations are done on the Statement of Net Assets to minimize the grossing-up effect on assets and liabilities within the governmental and business-type activities columns of the primary government. The net residual amounts due between governmental and business-type activities are shown as internal balances.

State of Wisconsin Notes to The Financial Statements
B. Explanation of Differences Between the Statement of Revenues, Expenditures, and Changes in Fund Balances – Governmental Funds and the Statement of Activities
During the year ended June 30, 2011, the following adjustments and reclassifications were necessary to reconcile the information from the fund-based Statement of Revenues, Expenditures, and Changes in Fund Balances – Governmental Funds to the amounts presented in the governmental section of the Statement of Activities (in thousands). The differences result primarily from the long-term economic focus of the Statement of Activities compared to the current financial focus of the Statement of Revenues, Expenditures, Changes in Fund Balance – Governmental Funds.
Total Governmental Long-term Revenues Capital-RelatedFunds and Expenses (1) Items (2)
Revenues: Taxes $ 14,046,595 $ - $ - Income Taxes - 7,995 - Sales & Excise Taxes - (5,283) - Public Utility Taxes - - - Other Taxes - 149 - Motor Fuel (Transportation) Taxes - 123 - Other Dedicated Taxes - (251) - Intergovernmental 10,300,640 - - Operating Grants - - 750 Capital Grants - - 3,943 Licenses and Permits 1,876,325 - - Charges for Goods and Services 350,162 3,346 - Investment and Interest Income 35,969 - - Fines and Forfeitures/Contributions to Permanent Fund 61,716 - - Gifts and Donations 16,878 - - Miscellaneous: (16,047) (1,985) Tobacco Settlement 128,592 - - Other 271,657 - - Total Revenues 27,088,534 (9,967) 2,708
Expenditures/Expenses: Current Operating: Commerce 416,201 90 573 Education 6,702,922 641 3,334 Transportation 2,210,158 1,349 55,322 Environmental Resources 498,620 (719) 11,631 Human Relations and Resources 11,851,182 13,333 68,028 General Executive 724,037 (2,429) 8,622 Judicial 129,386 1,190 2,363 Legislative 64,777 711 363 Tax Relief and Other General Expenditures 1,350,793 - - Intergovernmental - Shared Revenue 1,023,532 - - Capital Outlay 963,772 - (963,772) Debt Service: Principal 187,136 - - Interest and Other Charges 507,430 1,573 - Total Expenditures/Expenses 26,629,947 15,740 (813,535) Excess of Revenues Over (Under) Expenditures/Expenses 458,587 (25,707) 816,243 Other Financing Sources (Uses): Net Transfers (1,201,984) 13 61 Long-term Debt Issued 1,082,385 - - Premium/Discount on Bonds 91,103 - - Payments for Refunded Bonds (224,373) - - Payments to Refunding Bond Escrow Agent (69,960) - - Capital Lease Acquisitions 16,483 (16,483) - Installment Purchase Acquisitions 308 (308) - Total Other Financing Sources (Uses) (306,039) (16,778) 61
Net Change in Fund Balance 152,548 $ (42,484) $ 816,304 Change in Inventories 443 Net Change for the Year $ 152,991
(1) Long-term revenue differences arise because governmental funds report revenues only when they are considered “available,” while government-wide
statements report revenues when earned. Long-term expense differences arise because governmental funds report operating expenses (including interest) using the modified accrual basis of accounting, while government-wide statements report using the accrual basis of accounting.
(2) Capital-related adjustments consist of the difference between proceeds for the sales of capital assets and the gain or loss from the sales of capital assets, and from the difference between capital outlay expenditures recorded in the governmental funds and depreciation expense recorded in the government-wide statements.
(3) The adjustment for internal service funds reflects the elimination of these funds from the government-wide statement, which is accomplished by charging/refunding additional amounts to participating governmental activities to completely offset the internal service funds’ cost for the year.
For the Fiscal Year Ended June 30, 2011 72
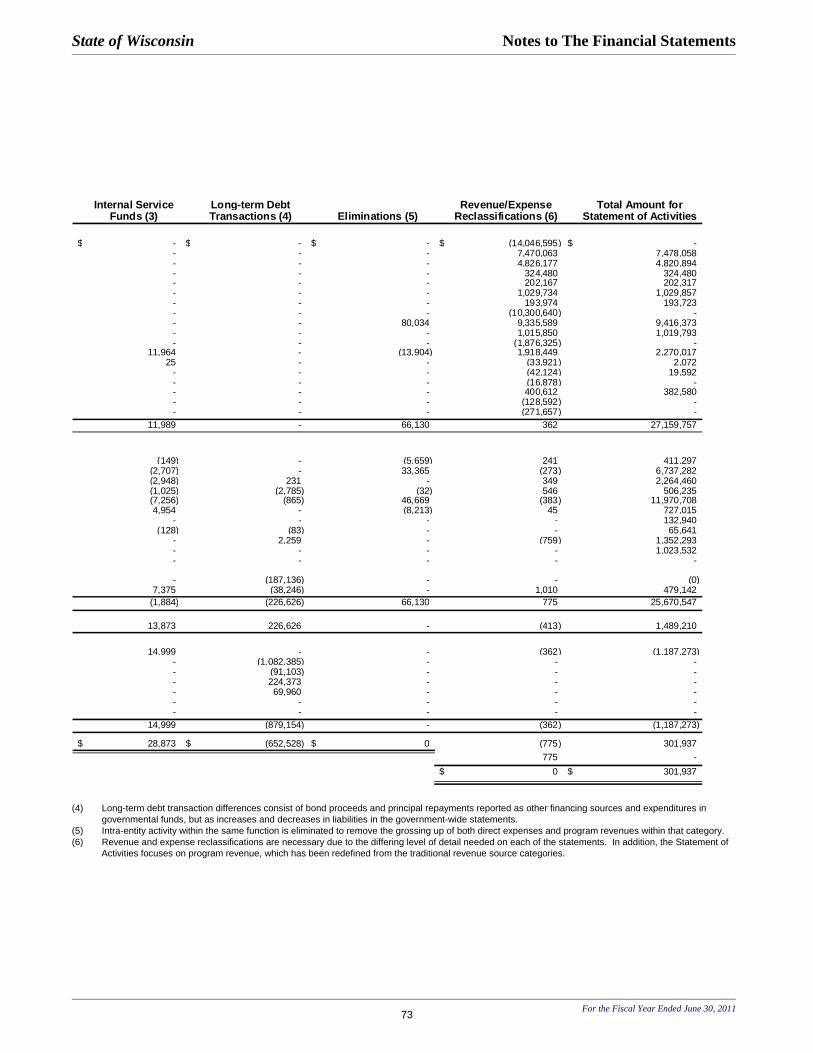
State of Wisconsin Notes to The Financial Statements
Internal Service Long-term Debt Revenue/Expense Total Amount forFunds (3) Transactions (4) Eliminations (5) Reclassifications (6) Statement of Activities
$ - $ - $ - $ (14,046,595) $ - - - - 7,470,063 7,478,058 - - - 4,826,177 4,820,894 - - - 324,480 324,480 - - - 202,167 202,317 - - - 1,029,734 1,029,857 - - - 193,974 193,723 - - - (10,300,640) - - - 80,034 9,335,589 9,416,373 - - - 1,015,850 1,019,793 - - - (1,876,325) -
11,964 - (13,904) 1,918,449 2,270,017 25 - - (33,921) 2,072
- - - (42,124) 19,592 - - - (16,878) - - - - 400,612 382,580 - - - (128,592) - - - - (271,657) -
11,989 - 66,130 362 27,159,757
(149) - (5,659) 241 411,297 (2,707) - 33,365 (273) 6,737,282 (2,948) 231 - 349 2,264,460 (1,025) (2,785) (32) 546 506,235 (7,256) (865) 46,669 (383) 11,970,708 4,954 - (8,213) 45 727,015
- - - - 132,940 (128) (83) - - 65,641
- 2,259 - (759) 1,352,293 - - - - 1,023,532 - - - - -
- (187,136) - - (0) 7,375 (38,246) - 1,010 479,142
(1,884) (226,626) 66,130 775 25,670,547
13,873 226,626 - (413) 1,489,210
14,999 - - (362) (1,187,273) - (1,082,385) - - - - (91,103) - - - - 224,373 - - - - 69,960 - - - - - - - - - - - - -
14,999 (879,154) - (362) (1,187,273)
$ 28,873 $ (652,528) $ 0 (775) 301,937 775 -
$ 0 $ 301,937
(4) Long-term debt transaction differences consist of bond proceeds and principal repayments reported as other financing sources and expenditures in
governmental funds, but as increases and decreases in liabilities in the government-wide statements. (5) Intra-entity activity within the same function is eliminated to remove the grossing up of both direct expenses and program revenues within that category. (6) Revenue and expense reclassifications are necessary due to the differing level of detail needed on each of the statements. In addition, the Statement of
Activities focuses on program revenue, which has been redefined from the traditional revenue source categories.
For the Fiscal Year Ended June 30, 2011 73

State of Wisconsin Notes to The Financial Statements
NOTE 3. BUDGETARY CONTROL The legal level of budgetary control for Wisconsin is at the function, agency, program, appropriation-level. Supplemental appropriations require the approval of the Joint Finance Committee of the Legislature. Routine adjustments, such as pay plan supplements and rent increases, are distributed by the Division of Executive Budget and Finance from non-agency specific appropriations authorized by the Legislature. Various supplemental appropriations were approved during the year and have been incorporated into the budget figures. The budgetary comparison schedule and related disclosures for the General and Transportation funds are reported as Required Supplementary Information. This schedule presents the original budget, the final budget and actual data of the current period. The related disclosures describe the budgetary practices of the State, as well as, provide a detailed reconciliation between the General and Transportation funds’ equity balance on the budgetary basis compared to the GAAP basis as shown on the governmental fund statements.
NOTE 4. DEFICIT FUND BALANCE/FUND EQUITY,
RESTRICTED NET ASSETS, BUDGET STABILIZATION ARRANGEMENT, MINIMUM FUND BALANCE POLICY and FUND BALANCE OF GOVERNMENTAL FUNDS.
A. Deficit Fund Balance/Fund Equity In addition to the General Fund, funds reporting a deficit fund balance, fund equity, or net assets position at June 30, 2011 are (in thousands): Special Revenue: Petroleum Inspection $ 65,709 Dry Cleaner Environmental Response 3,260 Capital Projects: Capital Improvement 545,560 Transportation Revenue Bonds 87,300 Enterprise: Unemployment Reserve 926,111 Northern Developmental Disabilities Center 19,207 Southern Developmental Disabilities Center 20,085 Life Insurance 295 Internal Service: Technology Services 9,718 Risk Management 83,435 Pension and Other Employee Benefit Trust: Accumulated Sick Leave 85,251
For the Fiscal Year Ended June 30, 2011 74
B. Restricted Net Assets GASB Statement No. 46, Net Assets Restricted by Enabling Legislation, which amends GASB Statement No. 34, Basic Financial Statements – and Management’s Discussion and Analysis – for State and Local Governments, provides guidance in determining when net assets have been restricted to a particular use by the passage of enabling legislation and how those net assets should be reported in financial statements when there are changes in the circumstances surrounding such legislation. Net assets restricted by enabling legislation were as follows on June 30, 2011 (in thousands):
Governmental Activities: Net Assets Restricted by Enabling Legislation 33,839 Business-type Activities: Net Assets Restricted by Enabling Legislation 258,498
C. Budget Stabilization Arrangement Wisconsin Statutes 25.60 establishes a stabilization arrangement for monies to be set aside for use if General Fund revenues are less than projected and expenditures exceed budgeted amounts. Wisconsin Statues 16.518 provides for the automatic transfer of 50.0 percent of the excess of General Fund tax revenues over tax estimates to be deposited into a stabilization appropriation. However, the transfer may not be made if the stabilization balance is at least equal to 5.0 percent of estimated General Fund expenditures for the fiscal year. Further, the transfer may not reduce the General Fund balance below the required statutory balance. In addition to the transfer described, under Wisconsin Statutes 13.48(14)(c) and 16.72(4) proceeds from the sale or lease of surplus state land or buildings and net proceeds from the sale of surplus property are also to be deposited into the stabilization appropriation except as otherwise provided by law. Wisconsin Statutes 16.50(7) provides that if the secretary of the Department of Administration determines that previously authorized expenditures under the biennial budget act will exceed revenues in the current or forthcoming fiscal year by more than one-half of one percent of the estimated general purpose revenue appropriations for that fiscal year, he or she shall immediately notify the governor, the presiding officers of each house of the legislature and the joint committee on finance. Following such notification, the governor shall submit a bill containing recommendations for correcting the imbalance between projected revenues and authorized expenditures, including a recommendation as to whether moneys should be transferred from the budget stabilization appropriation to the General Fund. The balance of the budget stabilization arrangement as of June 30, 2011 was $16.6 million.

State of Wisconsin Notes to The Financial Statements
D. Minimum Fund Balance Wisconsin Statutes 20.003(4) establishes a minimum General Fund balance. Under the statutes, no bill directly or indirectly affecting general purpose revenues as defined in Wisconsin Statues 20.001(2)(a) may be enacted by the legislature if the bill would cause the estimated General Fund balance on June 30 of any fiscal year to be an amount equal to or less than the amount specified for that fiscal year. The minimum required balance for the fiscal year ending June 30, 2011 was $65.0 million. E. Fund Balance for Governmental Funds Governmental funds reported the following categories of fund balance as of June 30, 2011 (in thousands): Common Nonmajor Total
General Trans por tat ion Sc hool Gov ernmental Gov ernmental
Nons pendable for : Inventory, Prepaid and Long-term Receivables 158,629 16,940 - 15,506 191,074 Legal or Contractual Purposes - - 835,367 36,514 871,881 (Permanent Fund Principal)Res tr ic ted for : Commerce 30,496 - - 441 30,937 Education 7,001 - 10,756 13,393 31,150 Transportation - - - - - Environmental Resources 5,759 - - 55,088 60,847 Human Relations and Resources 52,462 - - 21,107 73,570 General Executive 70,537 - 282 15,293 86,111 Judicial - - - - - Tax Relief and Other General Expenditures - - - - - Intergovernmental - Shared Revenue - - - 723 723 Debt Service - - - 114,526 114,526 Committed to: Commerce - - - 22,328 22,328 Education - - - 907 907 Transportation - 781,294 - - 781,294 Environmental Resources - - - 40,812 40,812 Human Relations and Resources - - - 12,253 12,253 General Executive - - - 31,606 31,606 Judicial - - - 190 190 Tax Relief and Other General Expenditures 16,586 - - - 16,586 Capital Projects - - - 20,584 20,584 Unas s igned (3,336,276) (4,043) - (702,023) (4,042,342) Total Fund Balanc e (2,994,806) 794,192 846,405 (300,754) (1,654,964)
For the Fiscal Year Ended June 30, 2011 75

State of Wisconsin Notes to The Financial Statements
For the Fiscal Year Ended June 30, 2011 76
NOTE 5. DEPOSITS AND INVESTMENTS The State maintains a short-term investment "pool", the State Investment Fund, for the State, its agencies and departments, and certain other public institutions which elect to participate. The investment "pool" is managed by the State of Wisconsin Investment Board (the Board) which is further authorized to carry out investment activities for certain enterprise, trust and agency funds. A small number of State agencies and the University of Wisconsin System also carry out investment activities separate from the Board. A. Deposits Deposits include cash and cash equivalents on deposit in banks or other financial institutions, and nonnegotiable certificates of deposit. The majority of the State's deposits are under the control of the Department of Administration. The Department of Administration maintains multiple accounts with an agreement with the bank that allows an overdraft in one account if the overdraft is offset by balances in other accounts. Custodial credit risk is the risk that in the event of a bank failure, the government's deposits may not be returned to it. The State's policy regarding custodial credit risk is detailed in Chapter 34 of the State Statutes. In brief, any federal or state bank, credit union or savings bank may be designated a public depository. A surety bond may be required. The State's insured deposits are covered by the Federal Deposit Insurance Corporation (FDIC) and an appropriation for losses on public deposits. In the event of loss, the division of banking makes payments up to $400,000 per depositor for the excess of the payments made by the Federal Deposit Insurance Corporation or the Wisconsin Credit Union Savings Insurance Corporation. Payments are made, until the funds available in the appropriation are exhausted, in the order in which satisfactory proofs of loss are received by the State's Department of Financial Institutions.
1. Primary Government As of June 30, 2011, $135.2 million of the primary government's bank balance of $1.0 billion was exposed to custodial credit risk as follows (in millions):
Uninsured and uncollateralized $ 135.2
Foreign currency risk is the risk that changes in exchange rates will adversely affect the fair value of a deposit. Deposits in foreign currency at June 30, 2011 are immaterial. The primary government does not have a formal policy specifically related to foreign currency risk. The State’s Unemployment Reserve Fund had $16.5 million on deposit with the U.S. Treasury. This amount is presented as Cash and Cash Equivalents and is not included in the carrying amount of deposits nor is it categorized according to risk because it is neither a deposit with a financial institution nor an investment. 2. Component Units The bank balance of deposits of the Wisconsin Housing and Economic Development Authority at June 30, 2011, the Wisconsin Health Care Liability Insurance Plan at December 31, 2010, the University of Wisconsin Hospitals and Clinics Authority at June 30, 2011, and the University of Wisconsin Foundation at December 31, 2010, was $145.3 million. As of their fiscal year end, $142.0 million of the component units' bank balance of $145.3 million was exposed to custodial credit risk as follows (in millions):
Uninsured and uncollateralized $ 142.0
State of Wisconsin Notes to The Financial Statements
For the Fiscal Year Ended June 30, 2011 77
B. Investments 1. Primary Government Wisconsin Statutes, program policy provisions, appropriate governing boards, and general resolutions contained in revenue bond indenture documents define the types of securities authorized as appropriate investments and the conditions for making investment transactions. Investments of the State are managed by various portfolios. For disclosure purposes, the following investment portfolios are discussed separately: • Primary government, excluding the University of Wisconsin
System, the Wisconsin Retirement System and the State Investment Fund. The primary government portfolios include various funds managed by the State of Wisconsin Investment Board consisting of the following:
-- Local Government Property Insurance Fund (LGPIF) -- State Life Insurance Fund (SLF) -- Injured Patients and Families Compensation Fund (IPFCF) -- Historical Society Fund -- Tuition Trust Fund • University of Wisconsin System (UWS) • Wisconsin Retirement System (WRS) • State Investment Fund (SIF) -- functions as the State's cash
management fund by "pooling" the idle cash balances of all State funds and other public institutions. Investments of the SIF are discussed in section B 3 of this note disclosure.
Primary Government (excluding the University of Wisconsin System (UWS), the Wisconsin Retirement System (WRS), and the State Investment Fund (SIF)) For the primary government, except for the various funds discussed later, permitted investments include: direct general obligations of the United States of America and obligations (including obligations of any federal agency or corporation) for which the payment of the principal and interest are unconditionally guaranteed by the full faith and credit of the United States; bonds or other obligations of any state or the United States of America or of any agency, instrumentality or local governmental unit of any such state including the State of Wisconsin; bonds, debentures, participation certificates, notes or similar evidences of indebtedness of any of the Federal Financing Bank, Federal Home Loan Bank System, Federal Farm Credit Bank, Federal National Mortgage Association, Federal Home Loan Mortgage Corporation, Resolution Funding Corporation, Government National Mortgage Association, Student Loan Marketing Association or Tennessee Valley Authority; public housing bonds issued by public agencies or municipalities; commercial paper; interest-bearing time deposits, certificates of deposit or other similar banking arrangements; shares of a diversified open-end management investment company; repurchase agreements; common and preferred stock; bankers acceptances; corporate
commercial paper; bonds issued by a local district created under Wisconsin Act 229; and investment agreements with a bank, bank holding company, insurance company or other financial institution. The State of Wisconsin Investment Board (the Board) has exclusive control over the investments of the Local Government Property Insurance Fund (LGPIF), the State Life Insurance Fund (SLF), the Injured Patients and Families Compensation Fund (IPFCF), the Historical Society Fund, and the Tuition Trust Fund, which are collectively known as the “various funds”. Wisconsin Statutes allows investments of the LGPIF in direct obligations of the United States and Canada, securities guaranteed by the United States, unsecured notes of financial and industrial issuers, Yankee/Euro dollar issues, and certificates of deposit issued by banks in the United States, and solvent financial institutions in this State. Permitted classes of investments of the SLF and the IPFCF include bonds of government units or of corporations, loans secured by mortgages, preferred or common stocks, real property and other investments not specifically prohibited by statutes. Funds available for the Historical Society Fund are managed with an investment objective of maintaining a diversified portfolio of high quality publicly issued equities and fixed income obligations providing long-term growth in capital and income generation. The Board is directed to invest moneys held in the Tuition Trust Fund in investments with maturities and liquidity that are appropriate for the needs of the fund as reported by the State Treasurer. University of Wisconsin System (UWS) The University of Wisconsin System (UWS) investment policies and guidelines are governed and authorized by the Board of Regents. The current approved asset allocation policy for long-term funds sets a general target of 37.5 percent marketable equities, 25.0 percent fixed income, and 37.5 percent alternatives. The approved asset allocation for intermediate term funds is 15.0 percent marketable equities, 65.0 percent fixed income, 10.0 percent alternatives and 10.0 percent cash. These target allocations were last affirmed/approved in December 2010.

State of Wisconsin Notes to The Financial Statements
For the Fiscal Year Ended June 30, 2011 78
Wisconsin Retirement System (WRS) All assets of the WRS are invested by the State of Wisconsin Investment Board (the Board). The WRS consists of shares in the core retirement trust fund and the variable retirement trust fund. The investments of the core retirement trust fund consist of a highly diversified portfolio of securities. Wis. Stat. Sec. 25.182 authorizes the Board to manage the core retirement trust fund in accordance with “prudent investor” standard of responsibility as described in Wis. Stat. Sec. 25.15(2) which requires that the Board manage the funds with the diligence, skill and care that a prudent person acting in a similar capacity and with the same resources would use in managing a large public pension fund. Investments of the variable retirement trust fund are authorized under Wis. Stat. Sec. 25.15 and 25.17. Wis. Stat. Sec. 25.17(5) states assets of the variable retirement trust fund shall be invested primarily in equity securities which shall include common stocks, real estate or other recognized forms of equities whether or not subject to indebtedness, including securities convertible into common stocks and securities of corporations in the venture capital stage. The variable retirement trust fund consists primarily of common stock and bonds convertible into common stock, although, because of existing conditions in the securities market, there may temporarily be other types of investments. Custodial Credit Risk Custodial credit risk is the risk that, in the event of a failure of the counterparty, the State will not be able to recover the value of the investment or collateral securities that are in the possession of an outside party. Primary Government (excluding the University of Wisconsin System (UWS), the Wisconsin Retirement System (WRS), and the State Investment Fund (SIF)) At June 30, 2011, the reported amount of investments of the primary government, including the various funds, was $5,171.9 million, of which $650.3 million is reported as cash equivalents and $340.3 million is reported as “Other Assets”. The primary government, including the various funds, does not have an investment policy specifically for custodial credit risk, however, at June 30, 2011, the primary government had no custodial credit risk exposure for these investments.
University of Wisconsin System (UWS) At June 30, 2011, the UWS investments were $426.2 million, of which $30.1 million is reported as cash equivalents. Wisconsin Retirement System (WRS) At June 30, 2011, the WRS investments were $79.9 billion. The WRS does not have a formal policy for custodial credit risk. As of June 30, 2011, the WRS held eleven tri-party repurchase agreements totaling $1.6 billion. The securities lending collateral account and cash management account participate in repurchase agreement pools, purchasing only a portion of a repurchase agreement in which the manager of these accounts is the buyer-lender. Since the manager that purchased the repurchase agreements is the counterparty, the securities are not held in the WRS’s name. They are held in the counterparty’s name and held by the counterparty’s agent. Interest Rate Risk Interest rate risk is the risk that changes in interest rates of debt investments will adversely affect the fair value of an investment. Primary Government (excluding the University of Wisconsin System (UWS), the Wisconsin Retirement System (WRS), and the State Investment Fund (SIF)) Although the primary government, except for the various funds discussed later, does not have a formal policy on limiting the exposure to changes in interest rates, it is the primary government’s policy to comply with the provisions contained within the general resolutions of revenue bond indentures and other program policy investment criteria. For example, the Lottery Fund acquires investments with maturity dates that significantly coincide with scheduled payment dates of prize annuities. Investments are held to maturity unless an annuitant requests premature termination of an annuity, then any loss or gain due to market fluctuations are passed through to the redeeming annuitant. Therefore, the Lottery Fund has minimal interest rate risk exposure. Further, as a means of limiting its exposure to interest rate risks, certain funds are required to limit at least half of the fund’s investment portfolio to maturities of less than one year. In addition, interest rate risk of certain other funds such as the Retiree Life Insurance Fund is minimized by maintaining a diversified portfolio of investments and monitoring cash flow patterns in order to approximately match the expected maturity of liabilities.

State of Wisconsin Notes to The Financial Statements
For the Fiscal Year Ended June 30, 2011 79
The following table provides information about the interest rate risks associated with the primary government’s investments, except those of the various funds. The investments include certain short-term cash equivalents, and various long-term items. At June 30, 2011, the primary government’s investments were (in millions):
Primary Government (excluding Badger Tobacco Securitization Corporation, the various funds, UWS, WRS, SIF, and investments in an external investment pool)
Investment Maturities Less Than 1 to 5 6 to 10 More Than Fair
Investment Type 1 Year Years years 10 Years Value
U.S. Government and U.S. agency holdings $ 156.1 $ 29.7 $ 22.3 $ 8.1 $ 216.2 State and municipal bonds and notes 14.3 53.4 66.5 168.6 302.8 Negotiable certificates of deposit 16.1 -- -- -- 16.1 Repurchase agreements 7.6 -- -- -- 7.6 Forward delivery agreements 47.7 -- -- -- 47.7 Money market funds 261.2 -- -- -- 261.2 Mutual funds – open ended 10.6 86.0 640.1 .2 736.9 Total $ 513.6 $ 169.1 $ 728.9 $ 176.9 $ 1,588.5
External Investment Pool Investments of the Retiree Life Insurance Fund and the Life Insurance Fund (reported as pension and other employee benefit trust funds) are held in an external investment pool with the investment objective of maintaining levels in its general account sufficient to guarantee principal amounts of reserves. The interest rate exposure of this pool expressed in terms of duration and the weighted average life is 4.75 and 6.2 years respectively.
As of May 31, 2011, the Badger Tobacco Asset Securitization Corporation’s investments were as follows (in millions):
Weighted Average Fair Maturity
Investment Value (Years) Dreyfus Cash Mgmt 288 Inst’l $ 6.8 0.09 Federated Tax-free Obligations Fund 15 1.3 0.01 Total Fair Value $ 8.1
Portfolio weighted average maturity 0.10
The various funds, which are managed by the Board, use the duration method to identify and manage interest rate risk. Three of the various funds have investment guidelines relating to interest rate risk. The LGPIF guidelines provide that a bond’s maturity must not exceed ten years. The SLF guidelines provide the weighted average maturity (WAM), including cash, shall be a minimum of ten years. The IPFCF guidelines provide that the average duration of the aggregate bond portfolio shall be less than ten years.

State of Wisconsin Notes to The Financial Statements
For the Fiscal Year Ended June 30, 2011 80
As of June 30, 2011, the various funds had interest rate risk statistics as detailed below (in millions):
Various Funds
Duration for Fixed Income Securities (in years) LGPIF SLF IPFCF Historical Society Tuition Trust
Fair Fair Fair Fair Fair Value Duration Value WAM Value Duration Value Duration Value Duration
Government/
Agency $ 5.7 1.42 $ 38.4 15.12 $ 198.0 5.39 $ -- -- $ 5.8 3.85
Corporate 10.6 17.15 58.9 17.15 331.0 5.61 -- -- 0.7 4.31
Bond Funds -- -- -- -- -- -- 2.5 5.24 -- --
Total/Average $ 16.3 .89 $ 97.3 16.35 $ 529.0 5.52 $ 2.5 5.24 $ 6.5 3.90
University of Wisconsin System (UWS) The UWS uses the option adjusted duration method to analyze interest rate risk. As of June 30, 2011, the UWS had interest rate risk statistics as detailed below (in millions):
UWS
Fair Modified Fixed Income Sector Value Duration
Corporate and other credit $ 16.9 4.65 Government 4.5 6.34 Collateralized mortgage obligations: U. S. Agencies 14.2 2.22 U.S. private placements 4.8 3.36 Asset backed securities 2.3 .24 Collateralized mortgage obligations: Corporate 1.0 3.91 U.S. Agencies .5 3.18 Commercial mortgage backed securities
3.7 .94
Treasury inflation protected securities 21.8 4.81 Total $ 69.7
Fixed Income Commingled
Seix Advisors High Yield Fund
$ 25.0
4.76
Wisconsin Retirement System (WRS) Generally, analysis of long or intermediate term portfolios’ interest rate risk is performed using various duration calculations. Modified duration, which is stated in years, is the measure of price sensitivity of a fixed income security to an interest rate change of 100 basis points. The calculation is based on the weighted average of present values for all cash flows. Some pooled investments are analyzed using an option adjusted duration calculation which is similar to the modified duration method. Option adjusted duration incorporates the duration shortening effect of any embedded call provisions in the securities. On the other hand, short term portfolios use the weighted average maturity to analyze interest rate risk. Weighted average maturity is the maturity of each position in a portfolio weighted by the dollar value of the position to compute an average maturity for the portfolio as a whole. This measure indicates a portfolio’s sensitivity to interest rate changes: a longer average weighted maturity implies greater volatility in response to interest rate changes. SWIB's investment guidelines related to interest rate risk vary by portfolio. Some fixed income portfolios are required to be managed within a range of a targeted duration, while others are required to maintain a weighted average maturity at or below a specified number of days or years.

State of Wisconsin Notes to The Financial Statements
For the Fiscal Year Ended June 30, 2011 81
Interest rate risk exposure as of June 30, 2011, stated in terms of modified duration and weighted average maturity, is presented below (in millions):
WRS Modified
Investment Type Fair Value* Duration (Years) Asset Backed Securities $ 30.2 3.49 Asset Backed Securities 1.7 N/A Certificates of Deposit 15.3 .24 Commercial Paper 94.4 0.17 Corporate Bonds/Private Placements 5,057.6 4.87 Corporate Bonds/Private Placements 79.4 N/A Futures Contracts 141.6 6.54 Futures Contracts (6.3) N/A Government Agency 595.2 2.58 Government Agency 7.2 N/A Commercial Mortgages 22.5 N/A Municipal Bonds 94.0 11.01 Repurchase Agreements 0.7 0.12 Foreign Gov’t Bonds 3,750.7 6.89 Foreign Gov’t Bonds 3.2 N/A United States Treasury Securities 4,525.6 7.33 $14,413.0
Intermediate and Long Term Collective Trust Funds Fair Value
Modified Duration (Years)
Emerging Market Fixed Income $ 305.9 6.75 Global Fixed Income 463.7 4.73 Domestic Fixed Income 7,547.1 5.24 $8,316.7
Fair Value Weighted Average
Maturity (days) Short Term Collective Trust Funds $ 29.2 1 Securities Lending Collateral Pool Fair Value
Weighted Average Maturity (days)
Certificates of Deposit 292.3 35 Commercial Paper 46.7 31 Corporate Bonds 1,150.7 27 Repurchase Agreements 2,289.7 2 $3,779.4
*Notional amount presented for futures contracts
Credit Quality Risk Credit risk is the risk that an issuer or other counterparty to an investment will not fulfill its obligations. Primary Government (excluding the University of Wisconsin System (UWS), the Wisconsin Retirement System (WRS), and the State Investment Fund (SIF) The primary government, except for the various funds discussed later, follows Wisconsin Statutes, program policy provisions, appropriate governing boards, and general resolutions contained in revenue bond indenture documents limits investments in public housing bonds issued by public agencies or municipalities, the State of Wisconsin, interest-bearing time deposits, certificates of deposit or other similar banking arrangement, shares of a diversified open-end management investment company repurchase agreements and investment agreements to a rating no lower than the rating assigned to the bonds. Investments in all other permitted debt securities are required to bear the highest rating available from each nationally recognized rating agency. In addition, credit risk of certain funds such as the Retiree Life Insurance Fund is minimized by monitoring portfolio diversification by asset class, creditor and industry and by complying with investment limitations governed by insurance laws and regulations. As of June 30, 2011, the above mentioned investments for the primary government including the various funds were rated by Standard and Poor’s, Moody’s Investors Service, and Fitch Ratings and the ratings are presented below using the Standard and Poor’s rating scale (in millions):
Primary Government (excluding the various funds, UWS, WRS and SIF)
Credit Quality Ratings Fair Value
AAA $ 228.5 AA 317.7 A 94.3 BB .3 B .1 Not Rated 1,283.0 Total $ 1,923.9
The various funds’ (except for the Tuition Trust Fund) investments guidelines provide that issues be rated “A-“ or better at the time of purchase based on the minimum credit ratings as issued by nationally recognized rating agencies. IPFCF guidelines provide that at the time of purchase at least 80 percent of the bond portfolio must be rated “A3/A“ or better. The Tuition Trust Fund guidelines do not specifically list a minimum credit quality.

State of Wisconsin Notes to The Financial Statements
For the Fiscal Year Ended June 30, 2011 82
The following schedule displays the credit ratings at June 30, 2011, for the various funds (in millions):
Various Funds LGPIF SLF IPFCF Historical Society Tuition Trust
Fair Value Fair Value Fair Value Fair Value Fair Value
AAA $ 16.3 $ 39.4 $ 211.4 $ -- $ 5.8AA -- 5.1 21.2 -- .1 A -- 32.7 197.3 -- .4 BBB -- 18.0 79.6 -- -- BB -- 1.1 15.0 -- .2 B -- 1.0 4.5 -- -- CCC -- -- -- -- -- Not rated -- -- -- 2.5 --
Totals $ 16.3 $ 97.3 $ 529.0 $ 2.5 $ 6.5
University of Wisconsin System (UWS) Credit Risk is the risk that an issuer or other counterparty to an investment will not fulfill its obligations. For the Long Term Fund, fund-level asset allocation constraints limit exposure to below investment grade debt securities to no more than 10.0 percent; for the Intermediate Term Fund, exposure is limited to 6.0 percent. The UWS currently holds below investment grade securities within commingled vehicles representing 6.0 percent of total assets of the Long Term Fund and 5.5 percent of total assets of the Intermediate Term Fund. In addition, actively-managed, investment grade fixed income separate accounts must maintain an average portfolio quality of AA by Standard & Poor’s and/or Aa by Moody’s, and hold only securities rated BBB- by Standard & Poor’s and/or Baa3 by Moody’s or higher. As of June 30, 2011, the actively-managed, investment grade fixed income separate accounts held a Keystone Owner Trust security in the amount of $4 thousand rated CAA1 by Moody’s and unrated by Standard & Poor’s.
The following schedule displays the credit rating as provided by Moody’s Investor Service on debt securities held as of June 30, 2011 (in millions). Obligations of the United States and obligations explicitly guaranteed by the U.S. government have been included in the AAA rating below although they are considered to be without credit risk.
UWS Ratings Fair Value
Aaa $ 58.3Aa1 .6Aa2 2.5Aa3 3.5A1 1.1A2 3.7A3 3.4Baa1 2.8Baa2 4.2Baa3 .9Ba2 8.8B2 14.0Caa2 .3Unrated and Unrated Pooled Cash 24.7Total $ 128.8

State of Wisconsin Notes to The Financial Statements
For the Fiscal Year Ended June 30, 2011 83
Wisconsin Retirement System (WRS) With the exception of derivative instrument credit risk, there are no fund-wide or system-wide investment guidelines related to credit risk exposures for investments of the WRS. Fixed income credit risk investment guidelines spell out the minimum ratings at the time of purchase by individual portfolios or groups of portfolios based on the portfolios’ investment objectives. In addition, some fixed income portfolios are required to carry a minimum weighted average rating at all times. The following schedule displays the lowest credit rating available as rated by several nationally recognized statistical rating organizations on debt securities held as of June 30, 2011 (in millions). Obligations of the United States and obligations explicitly guaranteed by the U.S. government have been included in the AAA rating below although they are considered to be without credit risk.
WRS Ratings Fair Value
P-1 or A-1 $ 455.5 Aaa or AAA 7,030.0 Aa3 to Aa1 or AA- to AA+ 3,003.8 A3 to A1 or A- to A+ 1,813.0 Baa3 to Baa1 or BBB- to BBB+ 1,580.8 Ba3 to Ba1 or BB- to BB+ 448.2 B3 to B1 or B- to B+ 635.7 Caa1 to Caa3 or CCC- to CCC+ 230.2 Ca1 to Ca3 or CC- to CC+ 8.3 C 10.3 D 3.9 Commingled or pooled 10,295.0 Not rated 2,837.5 Total $ 28,352.2
Reverse Repurchase Agreements SWIB had $134.9 million reverse repurchase agreements outstanding at June 30, 2011. Investment guidelines permit certain portfolios to enter into reverse repurchase agreements, that is, a sale of securities with a simultaneous agreement to repurchase the exact securities in the future at the same price plus a stated rate of interest. The market value of the securities underlying reverse repurchase agreements exceeds the cash received, providing the dealers a margin against a decline in market value of the securities. If the dealers default on their obligations to resell these securities or providing cash equal value, SWIB would suffer an economic loss equal to the difference between the market value plus accrued interest of the underlying securities and the agreement obligation, including accrued interest. This credit exposure at year-end was $2.7 million.
Since the proceeds from reverse repurchase agreements are used for short-term financings, the maturities of the purchases made with the proceeds of reverse repurchase agreements are not matched to the maturities of the agreements. The repurchase agreement transactions as of June 30, 2011, had underlying collateral with fair values of approximately 102 percent of the cost of the repurchase agreements. The agreed-upon yields were between .09 percent and .16 percent with maturity dates through July 26, 2011.
State of Wisconsin Notes to The Financial Statements
For the Fiscal Year Ended June 30, 2011 84
Concentration of Credit Risk Concentration of credit risk is the risk of loss attributed to the magnitude of a government’s investment in a single issuer. Primary Government (excluding the University of Wisconsin System (UWS), the Wisconsin Retirement System (WRS), and the State Investment Fund (SIF) Although the primary government, except for the various funds discussed later, does not have a formal policy on limiting the exposure to concentrations of credit risk, it is the primary government’s policy to comply with the provisions contained within the general resolutions of revenue bond indentures and other program policy investment criteria. For example, the College Savings Program Trust Fund’s exposure to a particular industry is limited to no more than double that industry’s percentage in the ML All Corporate Index (COAO). The primary government’s, except for the various funds, largest concentration by a single issuer is the State of Wisconsin Global Certificates with approximately 3.8 percent and State of Wisconsin general obligation bonds with approximately 3.0 percent of investments. With the exception of the Tuition Trust Fund, the various funds investment guidelines limit concentrations of credit risk by establishing maximum issuer and/or sector exposure limits. Generally, the guidelines provide that no single issuer may exceed 5 percent of the fund investments, with the exception of U.S. Government and its agencies, which may be unlimited. The LGPIF further limits AAA-rated mortgage-backed, AAA-rated asset-backed and individual corporate issuers to 3 percent of the market value of the fund investments. Excluding investments issued or explicitly guaranteed by the U.S. Government, as of June 30, 2011, none of the various funds had more than five percent of their total investments in a single issuer. University of Wisconsin System (UWS) Concentration of credit risk is the risk of loss attributed to the magnitude of an organization’s investment in a single issuer. Actively-managed, fixed income separate accounts are limited to holding no more than 7.0 percent in any one issuer (U.S. Government/Agencies are exempted). During fiscal year 2011, the largest concentration by a non-U.S. Government/Agency was JP Morgan Chase with 0.4 percent of total Trust Funds assets.
Wisconsin Retirement System (WRS) For investments of the WRS, concentration of credit risk is limited by establishing investment guidelines for individual portfolios or groups of portfolios that generally restrict issuer concentrations in any one company or Rule 144A securities below 5 percent of assets. Foreign Currency Risk Foreign currency risk is the risk that changes in exchange rates will adversely affect the fair value of an investment. Primary Government (excluding the University of Wisconsin System (UWS), the Wisconsin Retirement System (WRS), and the State Investment Fund (SIF) The primary government, except for the various funds discussed later, does not have a formal policy to limit foreign currency risk, however, certain funds such as the Environmental Improvement Fund are not permitted to invest in foreign currency based on provisions contained in its bond indenture general resolution. However, foreign currency risk of the Retiree Life Insurance Fund is minimized by utilizing short-duration spot forward contracts to minimize the adverse impact of foreign currency exchange rate risks inherent in the elapsed time between trade processing and trade settlement. At June 30, 2011, the primary government, except for the various funds, did not own any issues denominated in a foreign currency. The various fund’s investment guidelines do not specifically address foreign currency risk with the exception that SLF only allows investments in U.S. dollar denominated instruments. As of June 30, 2011, the various funds did not own any issues denominated in a foreign currency. University of Wisconsin System (UWS) Foreign currency risk is the risk that changes in exchange rates will adversely affect the fair value of an investment. As of June 30, 2011, the Long Term and Intermediate Term Funds held equity securities denominated in foreign currencies within pooled investment vehicles only, with market values totaling $108.9 million and $6.7 million, respectively, compared to prior fiscal year amounts of $87.3 million and $4.6 million, respectively. Some of the trades for such foreign positions will not settle in foreign currencies until after the fiscal year end. For the Long Term and Intermediate Term Funds, it is generally expected and desired that foreign currency exposure is not hedged, as this enhances the diversification benefits from non-U.S. investments.

State of Wisconsin Notes to The Financial Statements
For the Fiscal Year Ended June 30, 2011 85
Wisconsin Retirement System (WRS) The WRS held foreign currency denominated cash and securities directly in designated actively managed portfolios and indirectly through its investment in certain commingled invest funds. As of June 30, 2011, the following assets were denominated in the following currencies (in millions):
Currency Exposure by Investment Type
Cash and Convert- Limited Cash Commercial ible Fixed Financial Multi- Preferred Partner- Real
Currency Equivalents Mortgages Securities Options Stocks Income Futures Asset Securities ships Estate Total
Argentina Peso .5 -- -- -- -- 6.5 -- -- -- -- -- 7.0
Australian Dollar 2.9 -- -- -- 909.5 47.4 .7 -- -- -- -- 960.5 Brazil Real 2.5 -- -- -- 36.1 35.4 -- -- 79.3 -- -- 153.3
British Pound Sterling 23.0 -- -- -- 3,151.5 239.6 3.4 -- -- 96.2 -- 3,513.7
Canadian Dollar 10.4 -- -- -- 1,237.8 109.9 .7 -- -- 39.9 -- 1,398.7
Columbian Peso -- -- -- -- -- 8.9 -- -- -- -- -- 8.9 Chinese Renminbi -- -- -- -- .2 -- -- -- -- -- -- 0.2
Czech Koruna .2 -- -- -- 10.0 -- -- -- -- -- -- 10.2
Danish Krone .4 -- -- -- 116.9 32.8 -- -- -- -- -- 150.1
Euro Currency Unit 72.0 -- .2 -- 4,008.1 1,325.1 6.6 -- 66.8 875.4 -- 6,354.2
Hong Kong Dollar 3.7 -- -- -- 540.6 -- -- -- -- -- -- 544.3
Hungarian Forint .6 -- -- -- .3 5.1 -- -- -- -- -- 6.0
Indian Rupee .6 -- -- -- 140.4 3.8 -- -- -- -- -- 144.8
Indonesian Rupian 0.0 -- -- -- 5.5 22.5 -- -- -- -- -- 28.0
Israeli Shekel .3 -- -- -- 33.2 -- -- -- -- -- -- 33.5
Japanese Yen 27.8 -- .1 -- 2,612.9 1,201.4 5.5 -- -- -- -- 3,847.7
Malaysian Ringgit 3.0 -- -- -- 22.7 48.0 -- -- -- -- -- 73.7
Mexican New Peso 6.1 -- -- -- 37.3 65.1 -- -- -- -- -- 108.5
Moroccan Dirham .1 -- -- -- 2.2 -- -- -- -- -- -- 2.3
New Taiwan Dollar .1 -- -- -- 208.3 -- -- -- -- -- -- 208.4
New Turkish Lira -- -- -- -- 54.5 -- -- -- -- -- -- 54.5
New Zealand Dollar -- -- -- -- 9.8 6.8 -- -- -- -- -- 16.6
Norwegian Krone 1.6 -- -- -- 93.5 17.5 -- -- -- -- -- 112.6
Peruvian Nuevo Sol .2 -- -- -- .1 7.7 -- -- -- -- -- 8.0
Philippines Peso .1 -- -- -- 1.9 9.5 -- -- -- -- -- 11.5
Polish Zloty .2 -- -- -- 49.8 39.9 -- -- -- -- -- 89.9
`South African Rand 1.2 -- -- -- 35.8 27.2 -- -- -- -- -- 64.2
Singapore Dollar .7 -- -- -- 178.7 -- -- -- -- -- -- 179.4
South Korean Won .1 -- -- -- 305.7 18.4 -- -- -- -- -- 324.2
Swedish Krona 1.5 -- -- -- 276.8 36.1 -- -- -- 12.4 -- 326.8
Swiss Franc 7.8 -- -- -- 1,110.3 -- -- -- -- -- -- 1,118.1
Thailand Baht 1.0 -- -- -- 67.1 -- -- -- -- -- -- 68.1
United States Dollar 440.0 22.5 78.9 (0.2) 32,151.1 19,001.7 27.1 1,215.2 69.8 7,171.7 390.8 60,568.6
Uruguayan Peso -- -- -- -- -- 10.7 -- -- -- -- -- 10.7
Total Investments
by Currency Exposure 608.6 22.5 79.2 (0.2) 47,408.6 22,327.0 44.0 1,215.2 215.9 8,195.6 390.8 80,507.2

State of Wisconsin Notes to The Financial Statements
For the Fiscal Year Ended June 30, 2011 86
Securities Lending Transactions Wisconsin Retirement System (WRS) Securities Lending Transactions – State statutes and Board policies permit the use of investments of the WRS to enter into securities lending transactions. These transactions involve the lending of securities to broker-dealers and other entities for collateral, in the form of cash or securities, with the simultaneous agreement to return the collateral for the same securities in the future. The securities custodian is an agent in lending the domestic and international securities. When domestic securities are delivered to a borrower as part of a securities lending agreement, the borrower is required to place collateral equal to 102 percent of the loaned securities' fair value, including interest accrued, as of the delivery date with the lending agent. In the event that foreign securities are loaned, the borrower is required to place collateral totaling 105 percent of the loaned securities’ fair value, including interest accrued, as of the delivery date with the lending agent. Collateral is marked to market daily and adjusted as needed to maintain the required minimum level. The cash collateral is reinvested by the lending agent or its affiliate in accordance with the contractual investment guidelines, which are designed to insure the safety of principal and obtain a moderate rate of return. The investment guidelines include very high credit quality standards and also allow for a portion of the collateral investments to be invested with short-term securities. The earnings generated from the collateral investments, less the amount of rebates paid to the dealers and fees paid to agents, results in the gross earnings from lending activities, which is then split on a percentage basis with the lending agent. In accordance with money market mutual fund industry standards, the cash collateral reinvestment pools are valued at amortized cost. The amortized or book value of a fund’s assets and underlying fair market value of the assets may differ based on market conditions. The pools’ market value relative to its amortized cost is expressed as net asset value (NAV) and is derived by dividing total market value by amortized cost. During Fiscal Year 2011, the securities lending reinvestment pools’ NAVs were below the typical money market fund market floor of $.9950. The NAVs improved by the end of the fiscal year. As of June 30, 2011, the U.S. dollar cash collateral reinvestment pools’ NAV was $.9992 while the foreign reinvestment pool had a NAV of $.9999. At year end, no credit risk exposure to borrowers existed because the amounts owed the borrowers exceeded the amounts the borrowers owed. The contract with the lending agent requires it to indemnify if the borrowers fail to return the loaned securities and the collateral is inadequate to replace the securities lent. Losses resulting from violations of investment guidelines are also indemnified.
The majority of securities loans can be terminated on demand. The average term of the loans is approximately two days, which is shorter than the weighted average maturity of 16 days for investments made with the U.S. dollar cash collateral and the weighted average maturity of 6 days for investments made with foreign cash collateral. Pledging or selling collateral securities cannot be done without a borrower default. The quantity of dollar value of securities lending contracts entered into is not restricted. Derivative Financial Instruments Various Funds Interest Only Strips — Interest only strips are securities that derive cash flow from the payment of interest on underlying debt securities. The Tuition Trust Fund held several interest only strips for yield enhancing purposes. Because the underlying securities are United States Treasury obligations, the credit risk is low. On the other hand, interest only strips are more volatile in terms of pricing, and thus the market risk is higher than traditional United States Treasury obligations. As of June 30, 2011 the Tuition Trust Fund held interest only strips valued at $5.8 million representing approximately 73.4 percent of portfolio investments. Wisconsin Retirement System (WRS) Derivatives may be used to implement investment strategies for the Core and Variable Funds. All derivative instruments are subjected to risk analysis and monitoring processes at the portfolio, asset class and fund levels. Investment guidelines define allowable derivative activity for each portfolio and are based on the investment objectives which have been approved by the Board. Where derivatives are permitted, guidelines stipulate allowable instruments and the manner in which they are to be used. Investment guidelines have been established which provide minimum credit ratings for counterparties. Additionally, policies have been established which, where possible, seek to provide master netting arrangements with counterparties to over-the-counter derivative transactions. Gains and losses for all derivative instruments are reported in the Statement of Changes in Fiduciary Net Assets. Foreign Currency Spot and Forward Contracts — Currency exposure management is permitted through the use of exchange traded currency instruments, and through the use of over-the-

State of Wisconsin Notes to The Financial Statements
For the Fiscal Year Ended June 30, 2011 87
counter spot and forward contracts in foreign currencies. Direct hedging of currency exposure back to the U. S. dollar is permitted when consistent with the strategy of the portfolio. Cross-currency exposure management to transfer out of an exposed currency and into a benchmark currency is permitted. In some portfolios, currencies of non-benchmark countries may be held through the use of forward contracts, provided that the notional value of any single non-benchmark currency does not exceed 5.0 percent of the market value of the portfolio. No cash is exchanged when a foreign exchange spot or forward contract is initiated. Collateral postings are not required for foreign currency spot or forward contract counterparties. Net amounts due are paid or received on the contracted settle date. The net receivable or payable for spot and forward contracts is included in Other Receivables on the Statement of Fiduciary Net Assets. Losses may arise from future changes in the value of the underlying currency, or if the counterparties do not perform under the terms of the contract. Spot and forward contracts are valued daily with the changes in fair value included in the Net Appreciation (Depreciation) in Fair Value of Investments on the Statement of Changes in Fiduciary Net Assets. Discretionary currency overlay strategies at the total fund level may be employed when currency market conditions suggest such strategies are warranted. Only the currencies of developed market countries in the MSCI ex US Index may be used to implement the currency overlay. Exchange-traded currency instruments and over-the-counter spot and forward contracts in foreign currencies are used to execute these strategies. During the fiscal year currency exposure management involved the use of foreign currency spot and forward contracts. The following table presents the fair value of foreign currency spot and forward contract assets and liabilities held as of June 30, 2011 (in millions).
Foreign Currency Spot and Forward Contracts
Currency Notional
(local currency)
Fair Value of Foreign
Currency Contracts
Receivable ($US) Foreign Exchange Contracts Sold AUSTRALIAN DOLLAR 218.5 $ 3.1 BRAZIL REAL 6.1 .1 BRITISH POUND STER. 99.3 (2.0) CANADIAN DOLLAR 303.1 4.5 DANISH KRONE 102.4 .1 EURO CURRENCY UNIT 221.1 2.0 HONG KONG DOLLAR 572.3 -- INDIAN RUPEE 16.3 -- INDONESIAN RUPIAN 3,269.5 -- ISRAELI SHEKEL 16.2 .1 JAPANESE YEN 34,189.6 .8 MALAYSIAN RINGGIT 5.0 -- MEXICAN NEW PESO 206.3 .2 NEW TURKISH LIRA 8.7 -- NEW ZEALAND DOLLAR 3.6 .1 NORWEGIAN KRONE 78.1 .2 PHILIPPINES PESO 366.6 -- POLISH ZLOTY 13.5 -- SOUTH AFRICAN RAND 21.7 -- SINGAPORE DOLLAR 40.7 .2 SOUTH KOREAN WON 2,625.6 -- SWEDISH KRONA 657.3 1.5 SWISS FRANC 34.8 (.2) $ 10.7
Currency Notional
(local currency)
Fair Value of Foreign
Currency Contracts
Payable* ($US) Foreign Exchange Contracts Purchased AUSTRALIAN DOLLAR (26.6) $ (.8) BRAZIL REAL (43.1) (.8) BRITISH POUND STER. (215.5) 2.3 CANADIAN DOLLAR (19.1) (.1) COLOMBIAN PESO (4,941.9) -- CZECH KORUNA (1.4) -- DANISH KRONE (54.9) (.1) EURO CURRENCY UNIT (202.1) (1.6) HONG KONG DOLLAR (132.5) -- HUNGARIAN FORINT (101.8) -- INDIAN RUPEE (150.1) -- ISRAELI SHEKEL (45.7) (.2) JAPANESE YEN (22,996.9) 1.6 MEXICAN NEW PESO (88.4) -- NEW ZEALAND DOLLAR (7.6) (.1) NORWEGIAN KRONE (4.5) -- PERUVIAN NUEVO SOL (15.2) (.1) PHILLIPPINE PESO (.5) -- SOUTH AFRICAN RAND (154.0) (.5) SINGAPORE DOLLAR (1.8) -- SWEDISH KRONA (57.8) (.1) SWISS FRANC (88.3) .8 THAILAND BAHT (11.0) -- $ .3 Net Foreign Exchange Currency Spot and Forward Contracts $ 11.0
* Net effect of cross currency contracts is reflected in the "Foreign Exchange Contracts Purchased" section.

State of Wisconsin Notes to The Financial Statements
For the Fiscal Year Ended June 30, 2011 88
Foreign exchange spot and forward positions are over-the-counter contracts, entered into with various counterparties. Guidelines have been established which provide minimum credit ratings for counterparties. Additionally, policies have been established which, where possible, seek to implement master netting arrangements with counterparties to over-the-counter derivative transactions. The table below details the exposures by counterparties, aggregated by counterparty credit rating, with whom SWIB has
ntered into foreign exchange spot and forward contracts as of une 30, 2011 (in millions).
eJ
Exposure
Counterparty Credit Rating Payable Receivable Net
AAA $ (51.4) $ 52.7 $1.3
AA (895.8) 901.8 6.0
A
(1,740.8) 1,744.4 3.6
Total
$(2,688.0)
$2,698.9
$10.9
Futures Contracts – A financial futures contract is an exchange traded agreement to buy or sell a financial instrument at an agreed upon price and time in the future. Upon entering into a futures contract, collateral is deposited with the broker, in SWIB’s name, in accordance with initial margin requirements. Futures contracts are marked to market daily, based upon the closing market price of the contract at the board of trade or exchange on which they are traded. The resulting gain/loss is typically received/paid the following day until the contract expires. The fair value of futures contracts represents the unrealized gain/loss on the contract and is reflected as Financial Futures Contracts on the Statement of Fiduciary Net Assets. Gains and losses as a result of investments in futures contracts are included in the Net Appreciation (Depreciation) in the Fair Value of Investments on the Statement of Changes in Fiduciary Net Assets. Futures contracts involve, to varying degrees, risk of loss in excess of the variation margin disclosed in the Statement of Fiduciary Net Assets. Losses may arise from future changes in the value of the underlying instrument. Financial futures contracts may be entered into for the following objectives: facilitate asset class rebalancing, protect portfolios against the risk of changing asset values or interest rates, enhance liquidity, aid in cash flow management, manage interest rate exposure, adjust duration, equitize cash and receivable positions or as a substitute for cash market transactions. Futures contracts are secured by collateral deposited with brokers which can be in the form of cash, U.S. Treasuries and equity securities.

State of Wisconsin Notes to The Financial Statements
For the Fiscal Year Ended June 30, 2011 89
The following table presents the investments in futures contracts as of June 30, 2011 (in millions).
Futures Contracts
Description Expiration Notional Amount
Unrealized Appreciation
(Depreciation)*
Interest Rate Future:
3MO EUROYEN TIFF FUTURE (TFX) 12/2011 – 9/2012
$ (5.9) $ --
90DAY BANK ACCEPTED BILL 12/2011 – 6/2012
2.3 --
90DAY STERLING LIBOR FUT (LIF) 12/2011 - 9/2012
(1.4) --
Fixed Income Futures:
AUSTRALIAN 10YR BOND FUT (SFE)
9/2011 26.9 --
AUSTRALIAN 3YR BOND FUR (SFE) 9/2011 .9 -
CANADA 10YR BOND FUTURE (MSE)
9/2011 28.8 --
EURO BUXL 30 YR BOND FUT (EUX)
9/2011 2.8 (.1)
EURO-BOBL FUTURE (EUX) 9/2011 48.3 .1
EURO-BUND FUTURE (EUX) 9/2011 6.5 --
EURO-SCHATZ FUTURE (EUX) 9/2011 182.4 .3
JAPAN 10YR MINI BD FUTURE(SGX)
9/2011 16.6 --
UK LONG GILT FUTURE (LIF) 9/2011 3.9 --
US TREAS BD FUTURE (CBT) 9/2011 1.2 --
US ULTRA BOND (CBT) 9/2011 24.7 (.4)
US 10YR NOTE FUTURE (CBT) 9/2011 (77.6) (.1)
US 2YR TREAS NTS FUT (CBT) 9/2011 (130.9) (.2)
US 5YR TREAS NTS FUT(CBT) 9/2011 5.6 --
Equity Futures:
DJ EURO STOXX 50 FUTURE (EUX) 9/2011 144.1 6.2
DOW JONES MINI FUTURE (CBT) 9/2011 3.3 .1
FTSE 100 INDEX FUTURE (LIF) 9/2011 111.3 3.4
MSCI EAFE EMINI INDEX FUT (CME)
9/2011 2.1 .1
RUSSELL 2000 MINI IND FUT(NYF) 9/2011 166.0 8.3
S&P 500 EMINI INDEX FUT (CME) 9/2011 531.8 17.4
S & P MID 400 EMINI (CME) 9/2011 51.9 2.0
S&P/TSE 60 INDEX FUTURES (MSE)
9/2011 65.0 .7
SPI 200 INDEX FUTURE (SFE) 9/2011 53.3 .7
TOPIX INDEX FUTURE (TSE) 9/2011 106.1 5.5
Total $1,370.0 $44.0
* Unrealized appreciation (depreciation) includes foreign currency gains and losses.
Options – Option contracts give the purchaser of the contract the right to buy (call) or sell (put) the security or index underlying the contract at an agreed upon price on or before the expiration of the option contract. The seller of the contract is subject to market risk, while the purchaser is subject to credit risk and market risk to the extent of the premium paid to enter into the contract. Rebalancing policies and portfolio investment guidelines permit the use of exchange traded options. Options may be used to improve the efficiency or to enhance the expected return of strategic rebalancing procedures. Exchange traded options may be purchased or sold in conjunction with managing asset class exposure if the exercise of the options will move the asset allocation closer to the target established by the Board. The aggregate notional value of the options is limited to 2.0 percent of the market value of the trust fund at the date of purchase. The term of options used for this purpose may not exceed one year. The fair value of option contracts is based upon the closing market price of the contract and reflected as Options on the Statement of Fiduciary Net Assets. Gains and losses as a result of investments in option contracts are included in the Net Appreciation (Depreciation) in the Fair Value of Investments on the Statement of Changes in Fiduciary Net Assets. The table below presents the fair value of option contracts held as of June 30, 2011.

State of Wisconsin Notes to The Financial Statements
For the Fiscal Year Ended June 30, 2011 90
Option Contracts
Security Description Contract
Type Maturity
Number of Contracts
Written Cost Market Value
Unrealized
Gain (Loss)
ALERE INC PUT JUL 11 (350) $ (15,400) $ (8,750) $ 6,650
CEPHALON INC PUT AUG 11 (165) (10,231) (1,650) 8,581 CLIFFS NATURAL RESOURCES INC CALL JUL 11 (50) (5,007) (1,050) 3,957 FREEPORT-MCMORAN COPPER & GOLD PUT JUL 11 (100) (8,707) (1,110) 7,607
INTUITIVE SURGICAL INC CALL OCT 11 (50) (43,099) (71,000) (27,901)
ITT CORP PUT OCT 11 (304) (35,521) (18,240) 17,281
ITT CORP PUT JUL 11 (1,028) (133,036) (10,530) 122,506
MONSANTO CO CALL AUG 11 (100) (11,650) (14,800) (3,150)
NEWMONT MINING CORP PUT JUL 11 (100) (4,901) (950) 3,951
RALCORP HOLDINGS INC PUT JUL 11 (300) (23,215) (12,000) 11,215
RIO TINTO PIC PUT JUL 12 (75) (7,425) (750) 6,675 S&P 500 EOM INDEX FUTURE SEP 11 PUT JUL 13 (159) (138,646) (17,888) 120,759
THORATEC CORP PUT JUL 14 (260) (20,540) (3,250) 17,290
Total $ (457,378) $ (161,968) $ 295,421
Unfunded Capital Commitments University of Wisconsin System (UWS) The UWS has unfunded limited partnership commitments of $26.0 million for the fiscal year ending June 30, 2011. Wisconsin Retirement System (WRS) The Board has committed to fund various limited partnerships and side-by-side agreements related to its private equity and real estate holdings. Commitments that have not been funded as of June 30, 2011 totaled $5.5 billion. 2. Component Units Component Units except for the Wisconsin Health Care Liability Insurance Plan and the University of Wisconsin Foundation (Other Component Units) Wisconsin Housing and Economic Development Authority (Authority) – The Authority is required by statute to invest at least fifty percent of its General Fund funds in obligations of the State, of the United States, or of agencies or instrumentalities of the United States, or obligations, the principal and interest of which are guaranteed by the United States, or agencies or instrumentalities of the United States. Each investment portfolio specifies what constitutes a permitted investment and such investments may include obligations of the U.S. government and agencies securities; corporate bonds and notes; money market
mutual funds; commercial paper; and repurchase agreements and investment agreements. The Authority enters into collateralized investment contracts with various financial institutions. The investment contracts are generally collateralized by obligations of the United States government. The Authority is also authorized to invest its funds in the State Investment Fund. The Authority's aggregate investments at June 30, 2011 were $1,047.4 million of which $771.4 million are reported as cash equivalents. University of Wisconsin Hospitals and Clinics Authority – The University of Wisconsin Hospitals and Clinics Authority’s (the Hospital) aggregate investments at June 30, 2011 were $472.8 million of which $265.0 million (invested with the University of Wisconsin Foundation, see investment disclosure discussion for the University Wisconsin Foundation) are reported as “Cash and Investments with Other Component Units.” The board of directors has authorized management to invest in debt and equity securities. Custodial Credit Risk The component units do not have a formal policy for custodial credit risk. At fiscal year end, the reported amount of investments was $ 1,255.2 million, of which $771.4 million are reported as cash and cash equivalents.
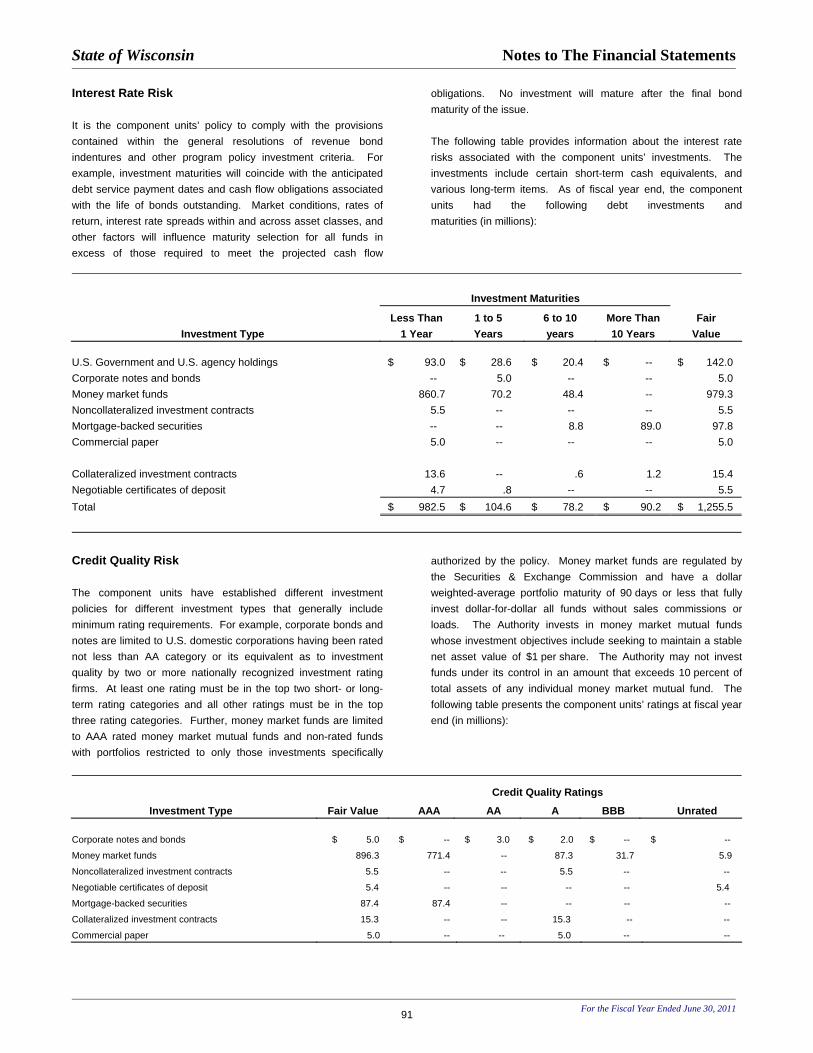
State of Wisconsin Notes to The Financial Statements
For the Fiscal Year Ended June 30, 2011 91
Interest Rate Risk It is the component units’ policy to comply with the provisions contained within the general resolutions of revenue bond indentures and other program policy investment criteria. For example, investment maturities will coincide with the anticipated debt service payment dates and cash flow obligations associated with the life of bonds outstanding. Market conditions, rates of return, interest rate spreads within and across asset classes, and other factors will influence maturity selection for all funds in excess of those required to meet the projected cash flow
obligations. No investment will mature after the final bond maturity of the issue. The following table provides information about the interest rate risks associated with the component units’ investments. The investments include certain short-term cash equivalents, and various long-term items. As of fiscal year end, the component units had the following debt investments and maturities (in millions):
Investment Maturities Less Than 1 to 5 6 to 10 More Than Fair
Investment Type 1 Year Years years 10 Years Value
U.S. Government and U.S. agency holdings $ 93.0 $ 28.6 $ 20.4 $ -- $ 142.0 Corporate notes and bonds -- 5.0 -- -- 5.0 Money market funds 860.7 70.2 48.4 -- 979.3 Noncollateralized investment contracts 5.5 -- -- -- 5.5 Mortgage-backed securities -- -- 8.8 89.0 97.8 Commercial paper 5.0 -- -- -- 5.0 Collateralized investment contracts 13.6 -- .6 1.2 15.4 Negotiable certificates of deposit 4.7 .8 -- -- 5.5 Total $ 982.5 $ 104.6 $ 78.2 $ 90.2 $ 1,255.5
Credit Quality Risk The component units have established different investment policies for different investment types that generally include minimum rating requirements. For example, corporate bonds and notes are limited to U.S. domestic corporations having been rated not less than AA category or its equivalent as to investment quality by two or more nationally recognized investment rating firms. At least one rating must be in the top two short- or long-term rating categories and all other ratings must be in the top three rating categories. Further, money market funds are limited to AAA rated money market mutual funds and non-rated funds with portfolios restricted to only those investments specifically
authorized by the policy. Money market funds are regulated by the Securities & Exchange Commission and have a dollar weighted-average portfolio maturity of 90 days or less that fully invest dollar-for-dollar all funds without sales commissions or loads. The Authority invests in money market mutual funds whose investment objectives include seeking to maintain a stable net asset value of $1 per share. The Authority may not invest funds under its control in an amount that exceeds 10 percent of total assets of any individual money market mutual fund. The following table presents the component units’ ratings at fiscal year end (in millions):
Credit Quality Ratings Investment Type Fair Value AAA AA A BBB Unrated
Corporate notes and bonds $ 5.0 $ -- $ 3.0 $ 2.0 $ -- $ --
Money market funds 896.3 771.4 -- 87.3 31.7 5.9
Noncollateralized investment contracts 5.5 -- -- 5.5 -- --
Negotiable certificates of deposit 5.4 -- -- -- -- 5.4
Mortgage-backed securities 87.4 87.4 -- -- -- --
Collateralized investment contracts 15.3 -- -- 15.3 -- --
Commercial paper 5.0 -- -- 5.0 -- --

State of Wisconsin Notes to The Financial Statements
For the Fiscal Year Ended June 30, 2011 92
Concentration of Credit Risk Investment policies generally limit the concentration of credit risk with an issuer to a predetermined dollar value and/or percent. For example, the investment policy outlined in a general resolution requires that for funds not invested in government securities or money market mutual funds, no more than 5 percent of total portfolio market value can be invested with any issuer or secured by any one guarantor, and not more than 15 percent of the portfolio’s market value will be invested in any municipal or industry sector, and no more than 25 percent of the total portfolio’s value will be invested in bank certificates of deposit. There were no non-government investments that exceeded 5 percent of the total portfolio. Foreign Currency Risk The component units’ policy generally prohibits investments traded in foreign currencies. Although trading in foreign currencies may be acceptable for a limited number of portfolios, no exposure to foreign currency existed at fiscal year end. Securities Lending The Wisconsin Housing and Economic Development Authority‘s (Authority) Finance committee approved the use of a security-lending program with the trust department of a bank acting as an agent. As of June 30, 2011 the Authority had $9.5 million of securities on loan to broker-dealers for a fee. Security lending transactions involve the lending of securities to broker-dealers and other entities for collateral, in the form of cash or securities, with the simultaneous agreement to return the collateral for the same securities in the future. The securities custodian is an agent in lending the domestic and international securities for collateral of 102 percent and 105 percent, respectively, of the loaned securities’ market value. The lending agent in accordance with contractual investment guidelines, which are designed to insure the safety of principal and obtain a moderate rate of return, reinvests the collateral. The investment guidelines include very high credit quality standards and also allow for a portion of the collateral investments to be invested with short-term securities. The Authority has the following types of securities on loan: U.S. agency securities, U.S. government securities and corporate notes. The Authority receives cash collateral for securities lent. The fair value of the investment securities loaned was $9.7 million as of June 30, 2011, and the fair value of the collateral received was $7.6 million. The Authority may request the bank to terminate any loan of securities for any reason at any time.
As of June 30, 2011, no credit risk exposure to borrowers existed because the amounts owed the borrowers exceeded the amounts the borrowers owed. The contract with the lending agent states that in the event that a borrower fails to return the lent security, the bank will indemnify the Authority for the following amounts: a) The difference between the closing market value of security on the date it should have been returned to the account and the cash collateral substituted for the lent securities, or b) in the case of collateral received in kind, the difference between the closing market value of the security on the date it should have been returned to the account and the closing market value of the collateral in kind on the same date. The Authority assumes all risk of loss arising out of collateral investment loss and any resulting collateral deficiencies. The bank expressly assumes the risk of loss arising from negligent or fraudulent operations of its securities lending program. The bank operates the securities lending program as a business trust investment pool with open and matched components. In the matched portion of the investment pool, the maturities of the securities lent and collateral are the same. The open portions of the pool maintain a weighted average maturity of the portfolio at approximately 15 days, with a range from one day to 25 days. The open portions of the pool generally have a 15-day mismatch between the portfolio coverage maturity and the open loans. As of June 30, 2011 approximately 100 percent of the securities lent were in the open portion of the investment pool. No restrictions on the amount of the loans exist or can be made. The earnings generated from the securities lending program is reported as other income. During the year ended June 30, 2011, the Authority received $2 thousand of income related to security lending transactions. Other Component Units Wisconsin Health Care Liability Insurance Plan (WHCLIP) – Aggregate investments of the WHCLIP were $63.2 million, of which $6.1 million are money market and other highly liquid debt instruments reported as cash equivalents. The board of governors is responsible for and establishment of appropriate investment policies relating to the investment of the WHCLIP’s assets. The following investment guidelines are established: a minimum of 30 percent of the loss reserves must be invested in U.S. treasuries or agency securities and AAA rated CMOs, investments must be in the form of marketable debt issues, at the time of purchase all bonds must be rated no lower than A by a major rating bond agency, at least 80 percent of the bond portfolio must be rated A or better, adequate corporate diversification by issuer and sector must be maintained (the securities of any issuer should not exceed 1.5 percent of the bond portfolio based on market value at the time of purchase, excluding government or government agency securities), the average duration of the aggregate bond portfolio shall be less than

State of Wisconsin Notes to The Financial Statements
For the Fiscal Year Ended June 30, 2011 93
10 years, as deemed appropriate by the investment manager(s) and is not permitted to invest in common stock. Excluded investments include: bonds rated below A by a major rating service at the time of purchase, foreign bonds not denominated in U.S. currency, futures transactions, short selling, use of margin, derivatives and hedge funds. The investments of the WHCLIP at December 31, 2010 were $57.1 million consisting of the following (in millions):
Amortized Estimated Investment Type Cost Fair Value
U.S. Treasury securities and obligations of the U.S. government corporations and agencies $ 13.2 $ 14.7 Debt securities issued by foreign governments and corporations 3.0 3.3 Industrial and miscellaneous 23.6 25.5 Loan-backed securities 17.3 18.5 Total $ 57.1 $ 62.0
The custodial credit risk for investments is the risk that in the event of the failure of the counterparty to a transaction, the component units will not be able to recover the value of investments or collateral securities that are in the possession of an outside party. Investments are exposed to custodial credit risk if the securities are uninsured and unregistered and are either held by the counterparty, or by the counterparty’s trust department or agent but not in the name of the WHCLIP. The WHCLIP had no custodial credit risk exposure for these investments. The amortized cost and estimated fair value of bonds at December 31, 2010, by contractual maturity are presented in the table below (in millions):
Amortized Estimated Cost Fair Value
1 to 5 Years $ 15.3 $ 16.2 6 to 10 Years 18.5 20.6 More Than 10 Years 6.0 6.7 39.8 43.5 Loan-backed securities 17.3 18.5 Total $ 57.1 $ 62.0
Mortgage-backed securities (includes residential and commercial MBS) consist of the following (in millions):
Pass-through securities: Issued by FNMA and FHLMC 17.3
The WHCLIP does not hold investments in any one issuer that exceeds 5 percent of total assets. As of December 31, 2010, the WHCLIP did not own any issues denominated in a foreign currency. University of Wisconsin Foundation (the Foundation) - Aggregate investments of the Foundation are $2,328.5 million. The following table summarizes the types of investments of the Foundation at December 31, 2010 (in millions):
Investment Type Fair Value
Bond and debentures $ 493.3 Stocks 675.6 Bond funds 148.1 Stock funds 24.9 Hedge funds 484.9 Limited partnerships 335.3 Real asset funds 163.5 Other funds 2.9 Total $ 2,328.5
Custodial Credit Risk At December 31, 2010, the reported amount of investments was $2,328.5 million. The Foundation had no custodial credit risk exposure for these investments. Securities Lending In late 2010, the Foundation ended its participation in a securities lending program operated by its custodial bank. Under the terms of the related agreement, the program required brokers who borrow securities from the Foundation to provide collateral of a value at least equal to 102 percent of the then fair value of the loaned securities and accrued interest, if any. This collateral was then reinvested on behalf of the Foundation by the custodial bank. The prime considerations of the collateral pool in which the collateral had been reinvested were liquidity and principal preservation. However, stress experienced by the fixed income market environment in recent years, and the fact that all of the securities held in the pool were subject to credit risk, resulted in a decline in the value of the collateral pool. In addition, certain

State of Wisconsin Notes to The Financial Statements
For the Fiscal Year Ended June 30, 2011 94
securities in the pool have defaulted and the collateral backing said securities was placed in a liquidating trust. While the Foundation was still receiving cash flows from this trust, the value of the collateral comprising the trust incurred mark-to-market price declines prior to the Foundation exiting the program. In order to end this arrangement, the Foundation made a payment of $3.8 million, which represented the deficiency at the time. At December 31, 2009, the collateral deficiency liability was approximately $2.4 million. Valuations of the collateral pool were provided to the Foundation by the custodial bank. For purposes of determining the value of collateral investments reflected on the statement of financial position at the end of 2009, the custodial bank used financial models, third-party pricing services, or other inputs where quoted prices in an active market are not available. Such calculations reflected hypothetical transactions, were subject to uncertainties, and accordingly did not reflect the amount that would have been realized in a sale. In addition, in light of the judgment involved in the fair value decisions by the custodial bank, and given the current market conditions at the time, the illiquidity of certain of the securities in the collateral pool, and the credit risk associated with securities in the collateral pool, there was no assurance that a fair value assigned to a particular security by the custodial bank was accurate. At December 31, 2010, the Foundation did not have equity and fixed income securities with fair values on loan. Income from securities lending for the year ended December 31, 2010 was approximately $74 thousand.
3. State Investment Fund The State Investment Fund (SIF) functions as the State's cash management fund by "pooling" the idle cash balances of all State funds and other public institutions. In the State's Comprehensive Annual Financial Report, the SIF is not reported as a separate fund; rather, each State fund's share in the "pool" is reported on the balance sheet as "Cash and Cash Equivalents." Shares of the SIF belonging to other participating public institutions are presented in the Local Government Pooled Investment Fund, an investment trust fund. Wis. Stat. Secs. 25.17(3)(b), (ba), (bd) and (dg) enumerate the various types of securities in which the SIF can invest, which include direct obligations of the United States or its agencies, corporations wholly owned by the Untied States or chartered by an act of Congress, securities guaranteed by the United States, unsecured notes of financial and industrial issuers, direct obligations of or guaranteed by the government of Canada, certificates of deposit issued by banks in the United States and solvent financial institutions in Wisconsin, and bankers acceptances. Other prudent investments may be approved by the State of Wisconsin Investment Board’s (the Board) Board of Trustees. Investments are valued at fair value for financial statement purposes and amortized cost for purposes of calculating income to participants. The custodial bank has compiled fair value information for all securities by utilizing third party pricing services. The fair value of investments is determined at the end of each month. Government and agency securities and commercial paper are priced using matrix pricing. This method estimates a security’s fair value by using quoted market prices for securities with similar interest rates, maturities, and credit ratings. Short-term debt investments with remaining maturities of up to 90 days are valued using amortized costs to estimate fair value, provided that the fair value of those investments is not significantly affected by the impairment of the credit standing of the issuer or by other factors. Repurchase agreements and nonnegotiable certificates of deposit are valued at cost because they are nonparticipating contracts that do not capture interest rate changes in their value.
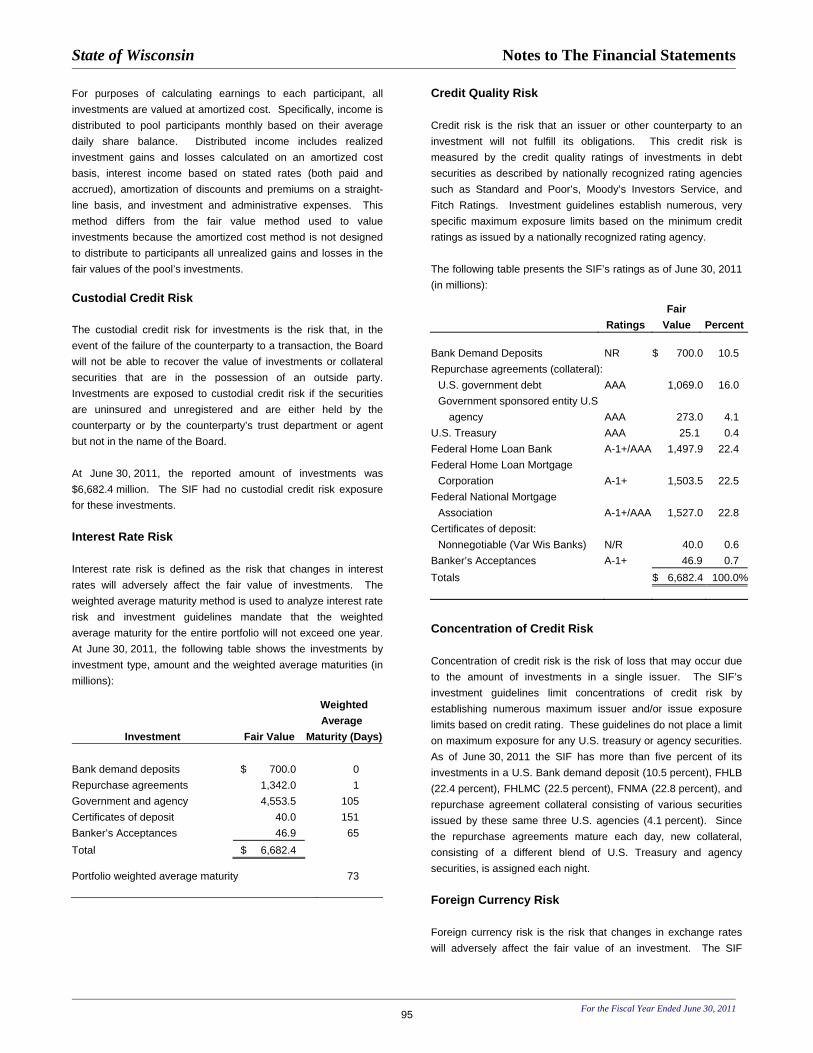
State of Wisconsin Notes to The Financial Statements
For the Fiscal Year Ended June 30, 2011 95
For purposes of calculating earnings to each participant, all investments are valued at amortized cost. Specifically, income is distributed to pool participants monthly based on their average daily share balance. Distributed income includes realized investment gains and losses calculated on an amortized cost basis, interest income based on stated rates (both paid and accrued), amortization of discounts and premiums on a straight-line basis, and investment and administrative expenses. This method differs from the fair value method used to value investments because the amortized cost method is not designed to distribute to participants all unrealized gains and losses in the fair values of the pool’s investments. Custodial Credit Risk The custodial credit risk for investments is the risk that, in the event of the failure of the counterparty to a transaction, the Board will not be able to recover the value of investments or collateral securities that are in the possession of an outside party. Investments are exposed to custodial credit risk if the securities are uninsured and unregistered and are either held by the counterparty or by the counterparty’s trust department or agent but not in the name of the Board. At June 30, 2011, the reported amount of investments was $6,682.4 million. The SIF had no custodial credit risk exposure for these investments. Interest Rate Risk Interest rate risk is defined as the risk that changes in interest rates will adversely affect the fair value of investments. The weighted average maturity method is used to analyze interest rate risk and investment guidelines mandate that the weighted average maturity for the entire portfolio will not exceed one year. At June 30, 2011, the following table shows the investments by investment type, amount and the weighted average maturities (in millions): Weighted
Average Investment Fair Value Maturity (Days)
Bank demand deposits $ 700.0 0 Repurchase agreements 1,342.0 1 Government and agency 4,553.5 105 Certificates of deposit 40.0 151 Banker’s Acceptances 46.9 65 Total $ 6,682.4 Portfolio weighted average maturity 73
Credit Quality Risk Credit risk is the risk that an issuer or other counterparty to an investment will not fulfill its obligations. This credit risk is measured by the credit quality ratings of investments in debt securities as described by nationally recognized rating agencies such as Standard and Poor’s, Moody’s Investors Service, and Fitch Ratings. Investment guidelines establish numerous, very specific maximum exposure limits based on the minimum credit ratings as issued by a nationally recognized rating agency. The following table presents the SIF’s ratings as of June 30, 2011 (in millions):
Fair Ratings Value Percent
Bank Demand Deposits NR $ 700.0 10.5 Repurchase agreements (collateral): U.S. government debt AAA 1,069.0 16.0 Government sponsored entity U.S agency AAA 273.0 4.1 U.S. Treasury AAA 25.1 0.4 Federal Home Loan Bank A-1+/AAA 1,497.9 22.4 Federal Home Loan Mortgage Corporation A-1+ 1,503.5 22.5 Federal National Mortgage Association A-1+/AAA 1,527.0 22.8 Certificates of deposit: Nonnegotiable (Var Wis Banks) N/R 40.0 0.6 Banker’s Acceptances A-1+ 46.9 0.7 Totals $ 6,682.4 100.0%
Concentration of Credit Risk Concentration of credit risk is the risk of loss that may occur due to the amount of investments in a single issuer. The SIF’s investment guidelines limit concentrations of credit risk by establishing numerous maximum issuer and/or issue exposure limits based on credit rating. These guidelines do not place a limit on maximum exposure for any U.S. treasury or agency securities. As of June 30, 2011 the SIF has more than five percent of its investments in a U.S. Bank demand deposit (10.5 percent), FHLB (22.4 percent), FHLMC (22.5 percent), FNMA (22.8 percent), and repurchase agreement collateral consisting of various securities issued by these same three U.S. agencies (4.1 percent). Since the repurchase agreements mature each day, new collateral, consisting of a different blend of U.S. Treasury and agency securities, is assigned each night. Foreign Currency Risk Foreign currency risk is the risk that changes in exchange rates will adversely affect the fair value of an investment. The SIF
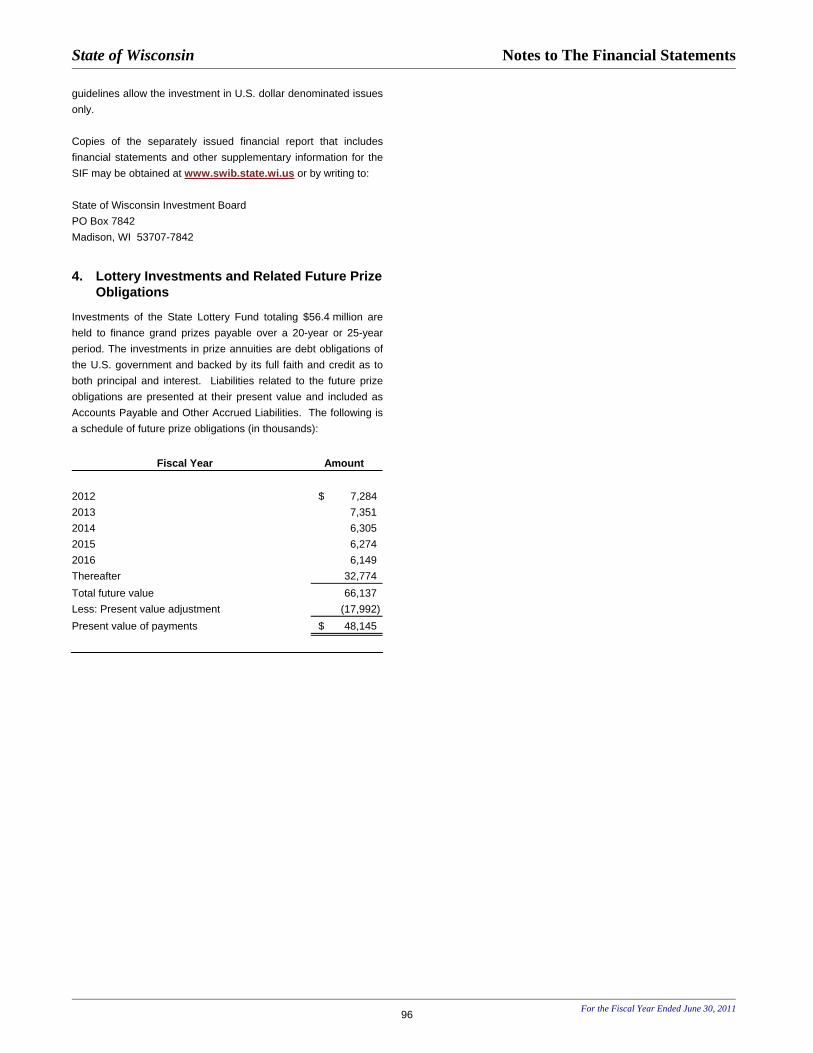
State of Wisconsin Notes to The Financial Statements
For the Fiscal Year Ended June 30, 2011 96
guidelines allow the investment in U.S. dollar denominated issues only. Copies of the separately issued financial report that includes financial statements and other supplementary information for the SIF may be obtained at www.swib.state.wi.us or by writing to: State of Wisconsin Investment Board PO Box 7842 Madison, WI 53707-7842
4. Lottery Investments and Related Future Prize
Obligations Investments of the State Lottery Fund totaling $56.4 million are held to finance grand prizes payable over a 20-year or 25-year period. The investments in prize annuities are debt obligations of the U.S. government and backed by its full faith and credit as to both principal and interest. Liabilities related to the future prize obligations are presented at their present value and included as Accounts Payable and Other Accrued Liabilities. The following is a schedule of future prize obligations (in thousands):
Fiscal Year Amount 2012 $ 7,284 2013 7,351 2014 6,305 2015 6,274 2016 6,149 Thereafter 32,774 Total future value 66,137 Less: Present value adjustment (17,992)Present value of payments $ 48,145
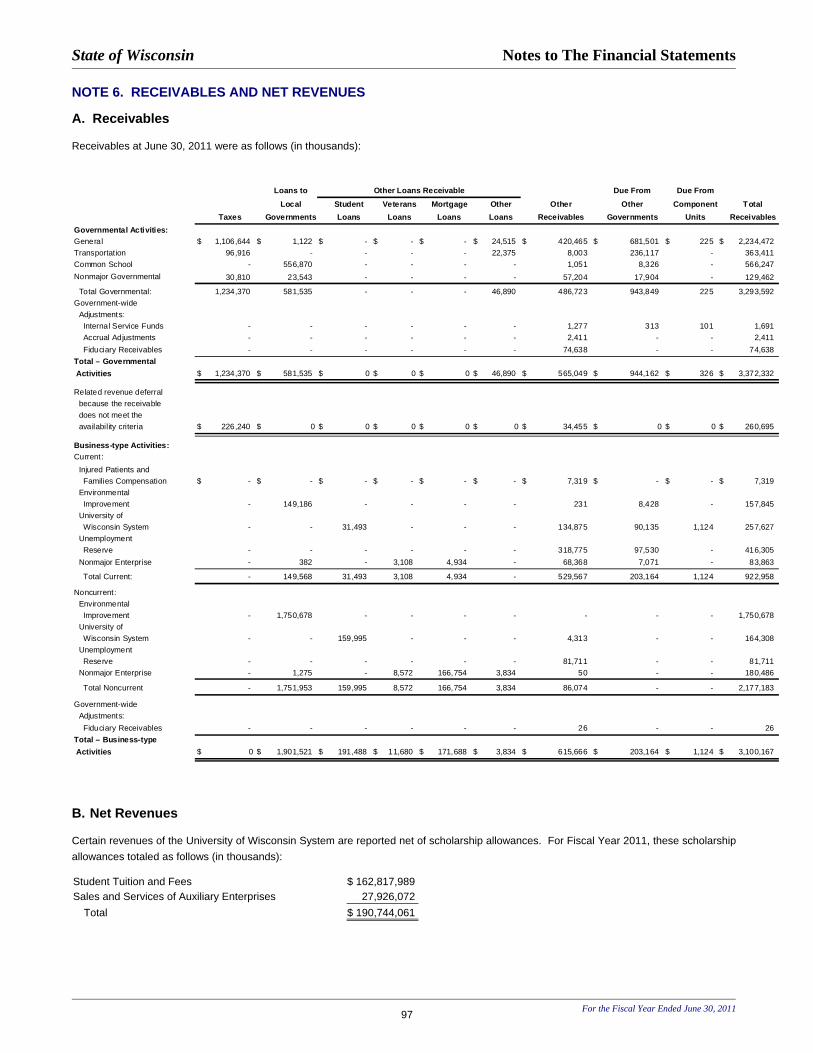
State of Wisconsin Notes to The Financial Statements
NOTE 6. RECEIVABLES AND NET REVENUES A. Receivables Receivables at June 30, 2011 were as follows (in thousands):
Loans to Due From Due FromLocal Student Veterans Mortgage Other Other Other Component Total
Taxes Governments Loans Loans Loans Loans Receivables Governments Units ReceivablesGovernmental Activities:General $ 1,106,644 $ 1,122 $ - $ - $ - $ 24,515 $ 420,465 $ 681,501 $ 225 $ 2,234,472 Transportation 96,916 - - - - 22,375 8,003 236,117 - 363,411 Common School - 556,870 - - - - 1,051 8,326 - 566,247 Nonmajor Governmental 30,810 23,543 - - - - 57,204 17,904 - 129,462
Total Governmental: 1,234,370 581,535 - - - 46,890 486,723 943,849 225 3,293,592 Government-wide Adjustments: Internal Service Funds - - - - - - 1,277 313 101 1,691 Accrual Adjustments - - - - - - 2,411 - - 2,411 Fiduciary Receivables - - - - - - 74,638 - - 74,638 Total – Governmental Activities $ 1,234,370 $ 581,535 $ 0 $ 0 $ 0 $ 46,890 $ 565,049 $ 944,162 $ 326 $ 3,372,332
Related revenue deferral because the receivable does not meet the availability criteria $ 226,240 $ 0 $ 0 $ 0 $ 0 $ 0 $ 34,455 $ 0 $ 0 $ 260,695
Business-type Activities:Current: Injured Patients and Families Compensation $ - $ - $ - $ - $ - $ - $ 7,319 $ - $ - $ 7,319 Environmental Improvement - 149,186 - - - - 231 8,428 - 157,845 University of Wisconsin System - - 31,493 - - - 134,875 90,135 1,124 257,627 Unemployment Reserve - - - - - - 318,775 97,530 - 416,305 Nonmajor Enterprise - 382 - 3,108 4,934 - 68,368 7,071 - 83,863
Total Current: - 149,568 31,493 3,108 4,934 - 529,567 203,164 1,124 922,958
Noncurrent: Environmental Improvement - 1,750,678 - - - - - - - 1,750,678 University of Wisconsin System - - 159,995 - - - 4,313 - - 164,308 Unemployment Reserve - - - - - - 81,711 - - 81,711 Nonmajor Enterprise - 1,275 - 8,572 166,754 3,834 50 - - 180,486
Total Noncurrent - 1,751,953 159,995 8,572 166,754 3,834 86,074 - - 2,177,183
Government-wide Adjustments: Fiduciary Receivables - - - - - - 26 - - 26 Total – Business-type Activities $ 0 $ 1,901,521 $ 191,488 $ 11,680 $ 171,688 $ 3,834 $ 615,666 $ 203,164 $ 1,124 $ 3,100,167
Other Loans Receivable
B. Net Revenues Certain revenues of the University of Wisconsin System are reported net of scholarship allowances. For Fiscal Year 2011, these scholarship allowances totaled as follows (in thousands): Student Tuition and Fees $ 162,817,989Sales and Services of Auxiliary Enterprises 27,926,072 Total $ 190,744,061
For the Fiscal Year Ended June 30, 2011 97

State of Wisconsin Notes to The Financial Statements
NOTE 7. CAPITAL ASSETS Primary Government Capital asset activity for the fiscal year ended June 30, 2011 was as follows (in thousands):
For the Fiscal Year Ended June 30, 2011 98
ng Beginning Endi Primary Government Balance Increases Decreases Balance
Governmental activities:
Capital assets, not being depreciated:Land and Land Improvements $ 2,109,599 $ 128,423 $ - $ 2,238,022 Buildings and Improvements 163,568 49 - 163,618 Library Holdings 82,576 943 (4) 83,515 Equipment 652 - - 652 Construction and Software in Progress 1,152,518 791,399 (489,833) 1,454,084 Infrastructure 12,378,562 459,563 (49,312) 12,788,813
Total capital assets, not being depreciated 15,887,476 1,380,377 (539,150) 16,728,703
Capital assets, being depreciated:Land Improvements 137,256 2,574 - 139,830 Buildings and Improvements 1,954,022 31,062 (565) 1,984,519 Equipment 777,603 74,773 (27,624) 824,751
Totals 2,868,881 108,409 (28,189) 2,949,101
Less accumulated depreciation for:Land Improvements 60,899 6,654 - 67,553 Buildings and Improvements 752,799 50,794 (293) 803,301 Equipment 460,894 60,614 (24,313) 497,196
Totals 1,274,593 118,062 (24,605) 1,368,050
Total Capital Assets, being depreciated, net 1,594,287 (9,653) (3,584) 1,581,050
Governmental activities capital assets, net $ 17,481,764 $ 1,370,724 $ (542,734) $ 18,309,753
Business-type activities:
Capital assets, not being depreciated:Land and Land Improvements $ 135,804 $ 15,833 $ (96) $ 151,541 Library Holdings 1,106,539 23,461 (5,763) 1,124,237 Construction and Software in Progress 497,450 284,224 (293,252) 488,422
Total Capital Assets, not being depreciated 1,739,793 323,518 (299,111) 1,764,200
Capital assets, being depreciated:Land Improvements 10,092 3,323 (5) 13,410 Buildings 5,145,221 457,687 (7,960) 5,594,948 Equipment 1,008,451 172,772 (30,533) 1,150,690
Totals 6,163,764 633,781 (38,497) 6,759,047
Less accumulated depreciation for:Land Improvements 8,024 276 (5) 8,296 Buildings 2,172,253 154,553 (4,697) 2,322,109 Equipment 731,847 82,862 (31,489) 783,221
Totals 2,912,124 237,692 (36,191) 3,113,625
Total Capital Assets, being depreciated, net 3,251,640 396,089 (2,307) 3,645,422
Business-type activities capital assets, net $ 4,991,432 $ 719,606 $ (301,417) $ 5,409,621
In addition to the capital assets reported by governmental and business-type activities, the fiduciary funds reported gross capital assets of $4,960 thousand at June 30, 2011, with accumulated depreciation totaling $2,802 thousand.
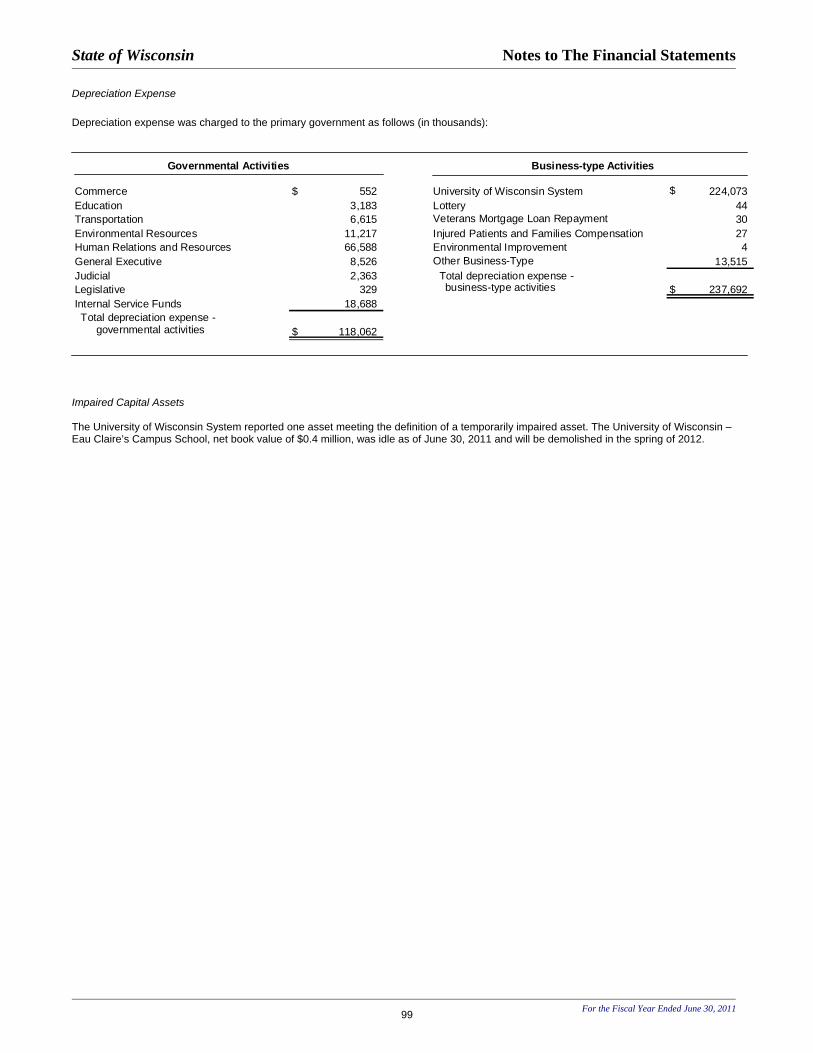
State of Wisconsin Notes to The Financial Statements
Depreciation Expense Depreciation expense was charged to the primary government as follows (in thousands):
Commerce $ 552 University of Wisconsin System $ 224,073 Education 3,183 Lottery 44 Transportation 6,615 Veterans Mortgage Loan Repayment 30 Environmental Resources 11,217 Injured Patients and Families Compensation 27 Human Relations and Resources 66,588 Environmental Improvement 4 General Executive 8,526 Other Business-Type 13,515 Judicial 2,363 Total depreciation expense -Legislative 329 business-type activities $ 237,692 Internal Service Funds 18,688 Total depreciation expense -
governmental activities $ 118,062
Governmental Activities Business-type Activities
Impaired Capital Assets The University of Wisconsin System reported one asset meeting the definition of a temporarily impaired asset. The University of Wisconsin – Eau Claire’s Campus School, net book value of $0.4 million, was idle as of June 30, 2011 and will be demolished in the spring of 2012.
For the Fiscal Year Ended June 30, 2011 99

State of Wisconsin Notes to The Financial Statements
For the Fiscal Year Ended June 30, 2011 100
Construction and Software in Progress Construction and software in progress of the primary government reported in the government-wide statement of net assets at June 30, 2011 included the following projects (in thousands):
Unencumbered Expended to Encumbrances Allotment Allotments June 30, 2011 Outstanding Balance
Governmental Activities: Reported through capital projects funds: Interstate 94 North and South Corridor Reconstruction $ 172,911 $ 172,911 $ - $ - Major Highway Projects 50,148 50,148 - - High Speed Rail 47,500 29,824 - 17,676 State Highway Rehabilitation 42,886 42,886 - - Armed Forces Reserve Center 41,061 31,347 1,198 8,516 Public Health & Ag Lab-Hygiene 28,535 1,329 782 26,424 Preservation Storage Building 28,250 1,537 660 26,053 Capital Heating Power Plant - Facility Renovate and Upgrade 28,103 20,300 2,435 5,368 Wisconsin Resource Center - Female Treatment Center 18,820 13,356 760 4,703 Construction Field Main Shop Wausau 14,059 436 10 13,614 Winnebago Corrections Facility Replacement 13,900 8,823 2,936 2,141 Wisconsin Historical Society - Learning Visitor Center 12,110 715 380 11,015 Other projects with allotments totaling less than $10 million 63,252 Subtotal 436,863
Projects funded through sources other than capital projects funds: Transportation-related 993,725 Department of Natural Resources 13,177 Department of Administration 6,789 Department of Health Services 2,908 Other agency projects 622 Total construction and software in progress – governmental activities $ 1,454,084
Business-type Activities: Reported through capital projects funds - University of Wisconsin System: Charter Heating Plant Rebuild - Madison 248,266 41,792 196,022 10,452 Biochemistry II Building - Madison 112,450 95,287 10,774 6,389 Madison - Wisconsin Energy 57,154 9,625 41,293 6,236 School of Human Ecology Building and Renovation 52,681 30,975 13,068 8,639 Davies Center Redevelopment-Eau Claire 48,727 8,912 33,150 6,665 Lakeshore Hall and Food Service - Madison 48,440 11,973 32,829 3,638 Chazen Museum of Art - Madison 43,799 33,730 4,206 5,863 New Residence Hall - La Crosse 38,418 29,409 1,778 7,231 Communication Arts Renovate and Addition - Parkside 35,256 29,395 3,598 2,264 Gordon Commons Redevelopment - Madison 34,124 8,502 25,076 547 Hockey/Swimming - Madison 34,096 4,088 22,340 7,668 New Residence Hall - Oshkosh 34,000 11,395 19,653 2,951 New Academic Building - Superior 26,703 24,275 2,138 290 Suite Style Residence Hall - Stevens Point 25,550 22,347 1,063 2,139 Chippewa Falls - Wisconsin Veteran Home 20,000 2,588 14,153 3,259 Memorial Union Center - Stout 18,936 7,249 8,598 3,088 South Forks Suite Addition - River Falls 18,935 4,004 13,665 1,265 Multi-Building Energy Conservation - Madison 17,181 4,988 11,209 984 Carlson - Whitewater 17,000 801 - 16,199 Multi-Building Energy Conservation- Milwaukee 10,847 4,441 5,904 502 Fischer and Weller Renovation - Whitewater 10,505 990 8,762 753 Projects with allotments totaling less than $10 million: University of Wisconsin System 77,830 Other 16,368 Total Construction in Progress – business-type activities $ 480,964
Construction and software in progress of the University of Wisconsin System and of the other business-type activities as reported in the financial statements totaled $472 million and $16.4 million as of June 30, 2011, respectively.

State of Wisconsin Notes to The Financial Statements
Component Units Capital Assets balances of the Wisconsin Housing and Economic Development Authority at June 30, 2011, the University of Wisconsin Hospitals and Clinics Authority at June 30, 2011 and the University of Wisconsin Foundation at December 31, 2010 were as follows (in thousands)
Amount
Capital Assets, not being depreciated:
Land and Land Improvements $ 19,431
Construction in Progress 8,178
Total Capital Assets, not being depreciated 27,609
Capital Assets, being depreciated:
Buildings 540,720
Equipment 265,222
Totals 805,942
Less accumulated depreciation for:
Buildings 232,503
Equipment 193,308
Totals 425,811
Total Capital Assets, being depreciated, net 380,131
Component Units Capital Assets, net $ 407,740
NOTE 8. ENDOWMENTS Primary Government University of Wisconsin System The University of Wisconsin System invests its trust funds, principally gifts and bequests designated as endowments or quasi-endowments, in two of its own investment pools: the Long Term Fund and the Intermediate Term Fund. Benefiting University of Wisconsin System entities receive quarterly distributions from the Long Term Fund, principally endowed assets, based on an annual spending rate applied to a 12-quarter moving average market value of the fund. The annual spending rate is currently 4.0 percent. Distributions from the Intermediate Term Fund, principally quasi-endowments and unspent income distributions, consist of interest earnings distributed quarterly. Spending rate and interest distributions from both of these funds are transferred to the State Investment Fund, pending near-term expenditures. At June 30, 2011, net appreciation of $207.6 million was available to meet spending rate distributions, of which $13.4 million was actually authorized for expenditure. For University of Wisconsin System-controlled, donor-restricted endowments, the Uniform Prudent Management of Institutional Funds Act as adopted, permits the Board of Regents of the University of Wisconsin System to appropriate for current spending, an amount of realized and unrealized endowment appreciation as they determine to be prudent. Realized and unrealized appreciation in excess of that amount appropriated for current spending is retained by the endowments. University of Wisconsin System investment policies and guidelines for the Long Term Fund and Intermediate Term Fund are governed and authorized by the Board of Regents. The approved asset allocation policy for the Long Term Fund sets a general target of 37.5 percent marketable equities, 25.0 percent fixed income, and 37.5 percent alternatives The approved asset allocation for the Intermediate Term Fund is 15.0 percent marketable equities, 65.0 percent fixed income, 10.0 percent alternatives, and 10.0 percent cash. The fair value of Endowments as of June 30, 2011 was $428.2 million including an unrealized gain of $57.5 million when fair values as of June 30, 2011 are compared to asset acquisition costs. This compares to a fair value as of June 30, 2010 of $370.7 million. The calculation of realized gains and losses is independent of a calculation of the net change in the fair value of investments since realized gains and losses are based on the difference between the selling price and the acquisition cost of the asset. Therefore, when assets are reported at fair value much of the realized gain or loss may have already been included in prior years as part of the overall change in the fair value of investments.
For the Fiscal Year Ended June 30, 2011 101

State of Wisconsin Notes to The Financial Statements
For the Fiscal Year Ended June 30, 2011 102
At June 30, 2011, the book value and fair value of principal funds under control of the University of Wisconsin System was (in millions):
Original Contributions and Distributed Net Gains $ 168.7 Realized Gains – Undistributed 202.0 Book Value 370.7 Unrealized Net Gains/Losses - Undistributed 57.5 Fair Value $ 428.2
On June 30, 2011, the portfolio at market, for the Long Term Fund, contained 41.4 percent in common stock and convertible securities, 12.3 percent in bonds and preferred stock, 19.0 percent in alternative assets, 19.0 percent in tactical allocation strategies, and 7.7 percent in short-term investments. The total return on the principal Long Term Fund including capital appreciation was 21.2 percent. On June 30, 2011, the portfolio at market, for the Intermediate Fund, contained 16.2 percent in common stock and convertible securities, 79.4 percent in bonds and preferred stock, and 4.4 percent in short-term investments. The total return on the principal Intermediate Fund including capital appreciation was 8.3 percent. External investment counsel was furnished for funds representing 87.9 percent of market value principal. Component Unit University of Wisconsin Foundation The University of Wisconsin Foundation’s (the Foundation) endowment consists of 3,325 individual funds established for a variety of purposes. Its endowment includes both donor-restricted endowment funds and funds designated by the Board of Directors to function as endowments. Net assets associated with endowment funds, including funds designated by the Board of Directors to function as endowments, are classified and reported based on the existence or absence of donor-imposed restrictions. The Board of Directors has interpreted the Uniform Management of Institutional Funds Act (UPMIFA) as requiring the preservation of fair value of the original gift as of the gift date of the donor-restricted endowment funds absent explicit donor stipulations to the contrary. As a result of this interpretation, the Foundation classifies as permanently-restricted net assets (a) the original value of gifts donated to the permanent endowment, (b) the original value of subsequent gifts to the permanent endowment, and (c) accumulations to the permanent endowment made in accordance with the direction of applicable donor gift instrument at the time the accumulation is added to the fund. The remaining portion of the donor-restricted endowment fund that is not
classified in permanently-restricted net assets is classified as temporarily-restricted net assets until those amounts are appropriated for expenditure by the organization in a manner consistent with the standard of prudence prescribed by UPMIFA. In accordance with UPMIFA, the organization considers the following factors in making a determination to appropriate or accumulate donor-restricted endowment funds: • The duration and preservation of the fund • The purpose of the Foundation and the donor-restricted
endowment fund • General economic conditions • The possible effect of inflation and deflation • The expected total return from income and the appreciation
of investments • Other resources of the Foundation • The investment policies of the Foundation
Endowment Net Asset Composition by Type of Fund as of December 31, 2010 (in millions):
Unrestricted Temporarily Restricted
Permanently Restricted
Total
Donor-restricted
$(23.6)
$254.0
$792.2
$1,022.4
Endowment Related Activities by Type of Fund as of December 31, 2010 (in millions):
Un-restricted
Temporarily Restricted
Permanently Restricted
Total
Beginning net assets
$ (38.1)
$175.0
$ 749.4
$886.3 Investment return
14.5
115.9
--
130.4
Contributions
--
--
53.1
53.1
Appropriation of assets for expenditure
--
(36.9)
--
(36.9) Transfers in for matching
--
--
3.1
3.1 Net transfers --
--
(13.4)
(13.4) Ending net assets
$(23.6)
$254.0
$792.2
$1,022.6

State of Wisconsin Notes to The Financial Statements
For the Fiscal Year Ended June 30, 2011 103
Funds with Deficiencies From time to time, the fair value of assets associated with individual donor-restricted endowment funds may fall below the level that the donor or UPMIFA requires the Foundation to retain as a fund of perpetual duration. Deficiencies of this nature that are reported in unrestricted net assets were $23.7 million as of December 31, 2010. These deficiencies resulted from unfavorable market fluctuations that occurred after the investment of permanently restricted contributions and continued appropriation for certain programs that was deemed prudent by the Board of Directors. Return Objectives and Risk Parameters The Foundation has adopted investment and spending policies for endowment assets that attempt to provide a predictable stream of funding to programs supported by its endowment while seeking to maintain the purchasing power of the endowment assets. Endowment assets include those assets of donor-restricted funds that the organization must hold in perpetuity or for a donor-specified period(s) as well as board-designated funds. Under this policy, as approved by the Board of Directors, the endowment assets are invested in a manner that is intended to produce results that exceed the price and yield results of a diversified equity-related benchmark while assuming a moderate level of investment risk. The Foundation expects its endowment funds, over time, to provide an average rate of return that outpaces spending, inflation, and expenses annually. Actual returns in any given year will vary. Strategies Employed for Achieving Objectives To satisfy its long-term rate-of-return objectives, the Foundation relies on a total return strategy in which investment returns are achieved through both capital appreciation (realized and unrealized) and current yield (interest and dividends). The Foundation targets a diversified asset allocation that places a great emphasis on equity-based investments to achieve its long-term return objectives within prudent risk constraints. Spending Policy and How the Investment Objectives Relate to Spending Policy Over the long term, the Foundation expects the current spending policy to allow its endowment to grow at an average of 2.0 to 3.0 percent annually. This is consistent with the organization’s objective to maintain the purchasing power of the endowment assets held in perpetuity or for a specified term as well as to provide additional real growth through new gifts and investment return. The Foundation amended its spending policy effective July 1, 2010. Under the amended policy, the distribution rate will be 4.5 percent of its endowment fund’s average fair value over
the 16 quarters through the quarter-end preceding the quarter in which the distribution is planned. The additional number of quarters used in calculating the average value will be transitioned in over a one-year period beginning on the effective date of the amended policy. Celebrate Children Foundation, Inc The Celebrate Children Foundation Inc., (CCF) endowment includes both donor-restricted funds and funds designated by the Board of Directors to function as endowments. As required by generally accepted accounting principles, net assets associated with endowment funds, including funds designated by the Board of Directors to function as endowments, are classified and reported based on the existence or absence of donor-imposed restrictions. The Board of Directors of the CCF has interpreted the State Prudent Management of Institutional Funds Act (SPMIFA) as requiring the preservation of the fair value of the original gift as of the gift date of the donor-restricted endowment funds absent explicit donor stipulations to the contrary. As a result of this interpretation, the CCF classifies as permanently restricted net assets (a) the original value of gifts donated to the permanent endowment, (b) the original value of subsequent gifts to the permanent endowment, and (c) accumulations to the permanent endowment made in accordance with the direction of the applicable donor gift instrument at the time the accumulation is added to the fund. In accordance with SPMIFA, the CCF considers the following factors in making a determination to appropriate or accumulate donor-restricted endowment funds: (1) the duration and preservation of the various funds, (2) the purposes of the donor-restricted endowment funds, (3) general economic conditions, (4) the possible effect of inflation and deflation, (5) the expected total return from income and the appreciation of investments, (6) other resources of the CCF, and (7) the CCF’s investment policies. Investment Return Objectives, Risk Parameters and Strategies The CCF has adopted investment and spending policies, approved by the Board of Directors, for endowment assets that attempt to provide a predictable stream of funding to programs supported by its endowment funds while also maintaining the purchasing power of those endowment assets over the long-term. Accordingly, the investment process seeks to achieve an after-cost total real rate of return, including investment income as well as capital appreciation, which exceeds the annual distribution with acceptable levels of risk. Endowment assets are invested in a well diversified asset mix, which includes equity and debt securities, that is intended to result in a consistent inflation-protected rate of return that has sufficient liquidity to make an annual distribution of 5 percent once the assets in the board designated fund reach $2.0 million, while growing the funds if possible. Therefore, the CCF expects its endowment assets, over time, to produce an average rate of return of approximately

State of Wisconsin Notes to The Financial Statements
For the Fiscal Year Ended June 30, 2011 104
8 percent annually. Actual returns in any given year may vary from this amount. Investment risk is measured in terms of the total endowment fund; investment assets and allocation between asset classes and strategies are managed to not expose the fund to unacceptable levels of risk. Spending Policy In accordance with the donor’s stipulations, investment return from the permanently restricted endowment assets is unrestricted revenue to the CCF. The CCF chose to place the investment return earned from the permanently restricted assets in a board designated endowment fund. The CCF’s spending policy for its board designated endowment indicates that no funds will be spent until the board designated endowment reaches $2.0 million. Thereafter, no more than 5 percent of the interest accumulated annually may be spent. In establishing this policy, the CCF considered the long-term expected return on its investment assets, the nature and duration of the endowment funds, some of which must be maintained in perpetuity because of donor-restrictions, and the possible effects of inflation. The CCF expects the current spending policy to allow its endowment funds to grow at a nominal average rate of 3 percent annually. This is consistent with the CCF’s objective to maintain the purchasing power of the endowment assets as well as to provide additional real growth through new gifts and investment return. Endowment net asset composition as of June 30, 2011:
Unrestricted
Permanently Restricted
Total
Board designated $ 218,422 $ -- $ 218,422
Donor-restricted -- 1,204,194 1,204,194
Total $ 218,422 $1,204,194 $1,422,616
Changes in endowment net assets as of June 30, 2011 are:
Permanently Restricted
Board-Designated
Total
Balance July 1, 2010 $1,084,564 $(14,812) $1,069,752
Contributions 119,630 -- 119,630
Investment return:
Interest and
dividends
--
31,839
31,839
Unrealized gain -- 182,994 182,994
Realized gain -- 18,401 18,401
End of Year $1,204,194 $218,422 $1,422,616

State of Wisconsin Notes to The Financial Statements
NOTE 9. INTERFUND RECEIVABLES, PAYABLES AND TRANSFERS Interfund balances as of or for the year ended June 30, 2011 consist of the following (in thousands): A. Due from/to Other Funds: Due from Other Funds and the Due to Other Funds represent short-term interfund accounts receivable and payable. The balances in these accounts at June 30, 2011 were as follows (in thousands):
Due to Other Funds:Injured Environ-
Nonmajor Patients mental University of Unemploy-Trans- Common Govern- and Families Improve- Wisconsin ment Nonmajor Internal
General portation School mental Compensation ment System Reserve Enterprise Service FiduciaryDue from Other Funds:
General $ - $ 14,720 $ 1,420 $ 35,178 $ 146 $ 300 $ 34,303 $ 4,880 $ 30,300 $ 2,187 $ 74,089 $ 197,523
Transportation 4,236 - - 57,249 - - 331 - 126 - 61,942
Common School 776 - - - - - - - - - - 776
Nonmajor Governmental 44,269 19,703 71 7,798 50 537 90 - 8,251 10,008 - 90,777
Environmental Improvement 36 - - 187 - - - - - - 222
University of Wisconsin System 14,353 1,707 - 1,922 - 18 - - 2 37 26 18,064
Unemployment Reserve 832 - - - - - - - - - - 832
Nonmajor Enterprise 13,709 2 - 1,439 - - 4 - 367 333 4 15,856
Internal Service 45,894 1,704 - 3,187 6 1 2,197 - 313 115 356 53,773
Fiduciary 27,707 857 - 2,294 7 9 32,301 - 1,645 1,044 269 66,132
Total $ 151,810 $ 38,692 $ 1,490 $ 109,254 $ 210 $ 865 $ 69,227 $ 4,880 $ 40,876 $ 13,850 $ 74,743 $ 505,898
Total
The balances in the Due from Other Funds and Due to Other Funds accounts typically result from the time lag between the dates that (1) interfund goods and services were provided and when the payments occurred, and (2) interfund transfers were accrued and when the liquidations occurred.
For the Fiscal Year Ended June 30, 2011 105
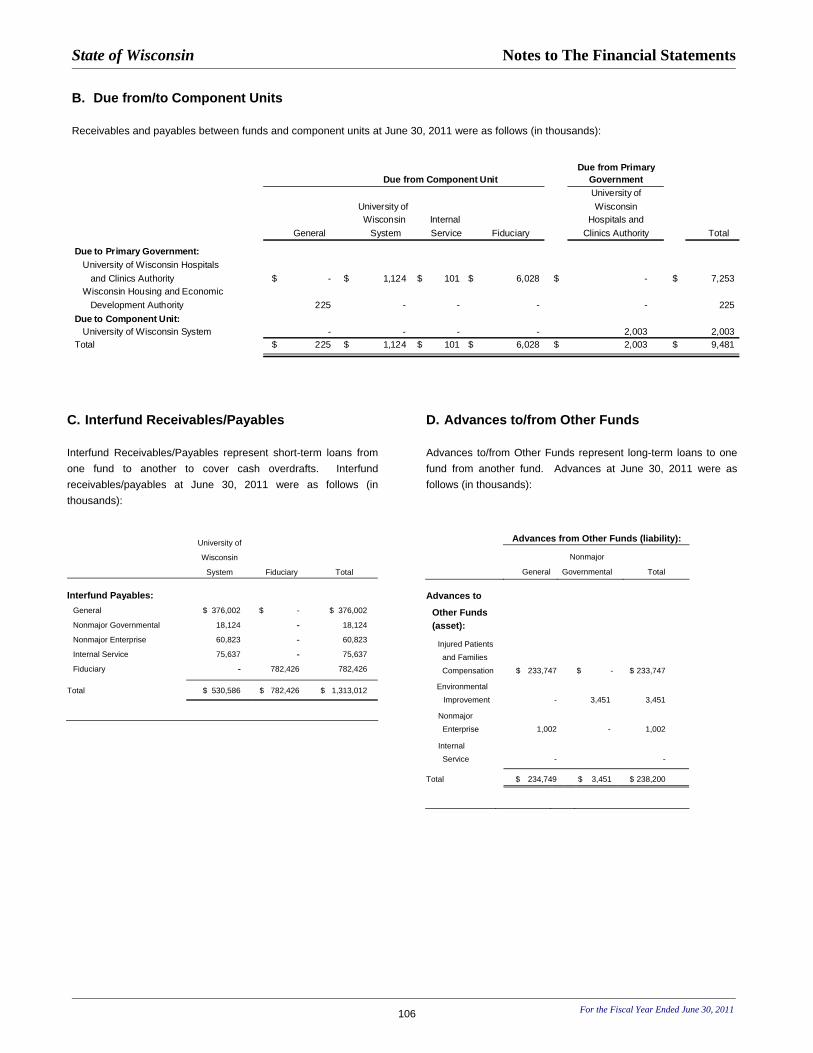
State of Wisconsin Notes to The Financial Statements
B. Due from/to Component Units Receivables and payables between funds and component units at June 30, 2011 were as follows (in thousands):
Due from PrimaryGovernmentUniversity of
University of WisconsinWisconsin Internal Hospitals and
General System Service Fiduciary Clinics Authority Total
Due to Primary Government:University of Wisconsin Hospitals and Clinics Authority $ - $ 1,124 $ 101 $ 6,028 $ - $ 7,253 Wisconsin Housing and Economic Development Authority 225 - - - - 225
Due to Component Unit:University of Wisconsin System - - - - 2,003 2,003
Total $ 225 $ 1,124 $ 101 $ 6,028 $ 2,003 $ 9,481
Due from Component Unit
C. Interfund Receivables/Payables Interfund Receivables/Payables represent short-term loans from one fund to another to cover cash overdrafts. Interfund receivables/payables at June 30, 2011 were as follows (in thousands):
University of
Wisconsin
System Fiduciary Total
Interfund Payables: General $ 376,002 $ - $ 376,002
Nonmajor Governmental 18,124 - 18,124
Nonmajor Enterprise 60,823 - 60,823
Internal Service 75,637 - 75,637
Fiduciary - 782,426 782,426
Total $ 530,586 $ 782,426 $ 1,313,012
For the Fiscal Year Ended June 30, 2011 106
D. Advances to/from Other Funds Advances to/from Other Funds represent long-term loans to one fund from another fund. Advances at June 30, 2011 were as follows (in thousands):
Advances from Other Funds (liability): Nonmajor General Governmental Total
Advances to
Other Funds (asset):
Injured Patients and Families
Compensation
$ 233,747
$ -
$ 233,747
Environmental
Improvement
-
3,451
3,451
Nonmajor Enterprise
1,002
-
1,002
Internal Service
-
-
Total $ 234,749 $ 3,451 $ 238,200

State of Wisconsin Notes to The Financial Statements
E . Interfund Transfers Interfund Transfers in and out that occurred during Fiscal Year 2011 were as follows (in thousands):
Transfers in:Injured Patients University of
Trans- Common Nonmajor and Families Environmental Wisconsin Nonmajor InternalGeneral portation School Governmental Compensation Improvement System Enterprise Service Total
Transfers out: General $ - $ 11,324 $ 10,000 $ 360,518 $ 31,159 $ - $ 1,073,817 $ 73,978 $ 18,249 $ 1,579,044 Transportation 42,953 - - 52,622 - - 77 1 - 95,653 Common School 1,403 - - 298 - - 31 - - 1,732 Nonmajor Governmental 81,136 24,059 - 535,821 - 23,119 136,059 6,315 - 806,509 Injured Patients and Families Compensation - - - 15 - - - - - 15 Environmental Improvement - - - 9,119 - - - - - 9,119 University of Wisconsin System 45,635 - - 59,481 - - - - - 105,116 Unemployment Reserve 6,545 - - - - - - - - 6,545 Nonmajor Enterprise 29,779 - - 6,467 - - 2 119 167 36,534 Internal Service 2,593 - - 824 - - - - 702 4,119 Fiduciary - - - 362 - - - - - 362
Total $ 210,045 $ 35,382 $ 10,000 $ 1,025,527 $ 31,159 $ 23,119 $ 1,209,986 $ 80,413 $ 19,118 $ 2,644,748
Transfers are typically used to move: (1) revenues from the fund that statute or budget requires to collect them to the fund that statute or budget requires to expend them, (2) receipts restricted to debt service from the funds collecting the receipts to the debt service fund as debt service payments become due, (3) unrestricted revenues collected in one fund to finance various programs accounted for in other funds in accordance with statute or budgetary authorizations, and (4) accumulated surpluses from other funds to the General Fund when authorized by statute. Nonroutine and Other Transfers
In the fiscal year ended June 30, 2011, transfers considered non-routine or inconsistent with the fund making the transfer included the following (in thousands): Transfers in to the General Fund:
Funds Reporting the Transfer Out Amount
Transportation $ 40,846 Recycling 30,251 University Wisconsin System 25,000 Environmental 14,285 Petroleum Inspection 14,049 Agrichemical Management 3,023 Universal Service 1,237 Internal Service Funds 1,050 Other Funds 1,211
Transfer out from the General Fund:
Fund Reporting the Transfer In Amount
Environmental 12,864 Transportation 2,334
Transfers out from the Petroleum Inspection Fund:
Funds Reporting the Transfer In Amount
Transportation 24,059Recycling 2,000Environmental 530
Transfer out from the Transportation Fund:
Fund Reporting the Transfer In Amount
Conservation 19,925
For the Fiscal Year Ended June 30, 2011 107

State of Wisconsin Notes to The Financial Statements
NOTE 10. CHANGES IN LONG-TERM LIABILITIES During the year ended June 30, 2011, the following changes occurred in long-term liabilities (in thousands): P rimary Government
AmountsBalance Balance Due Within
Governmental Activities July 1, 2010 Additions Reductions June 30, 2011 One Year
Bonds Payable:General Obligation Bonds for Governmental Funds $ 4,484,181 $ 882,385 $ 372,348 $ 4,994,218 $ 405,533 General Obligation Bonds for Internal Services Funds 148,788 25,108 20,971 152,926 12,711 Annual Appropriation Bonds 3,359,690 - 25,835 3,333,855 32,785 Revenue Bonds 1,714,200 200,000 77,195 1,837,005 90,412 Less Deferred Amounts: Issuance Premiums and Discounts 268,778 91,603 50,480 309,121 - Refundings (36,982) (2,447) (5,444) (33,985) -
Total Bonds Payable 9,938,655 1,196,648 541,385 10,593,139 541,442 Other Liabilities:
Future Benefits and Loss Liability 94,847 28,851 32,023 91,675 32,936 Capital Leases 31,572 16,483 7,337 40,718 11,617 Installment Contracts 729 308 772 265 152 Compensated Absences 160,378 47,091 57,342 150,128 58,336 Other Postemployment Benefits 139,441 33,892 - 173,334 - Claims, Judgments and Commitments 3,220 - 865 2,355 - Pollution Remediation Obligations 13,991 - 2,891 11,100 1,500
Total Governmental Activities Long-term Liabilities $ 10,382,835 $ 1,323,274 $ 642,615 $ 11,062,714 $ 645,983
Repayment of the general obligation bonds is made from the Bond Security and Redemption Fund. The amount presented in this fund represents the liability to be paid from resources accumulated to provide debt service payments in Fiscal Year 2011. Repayment of the revenue bonds principal and interest is made from the appropriate debt service fund with payments secured by registration and inspection fees collected by the appropriate program. The compensated absences liability will be liquidated by the State's governmental and internal service funds. Long-term liabilities for claims, judgments and commitments are generally liquidated with resources of the governmental activities.
For the Fiscal Year Ended June 30, 2011 108
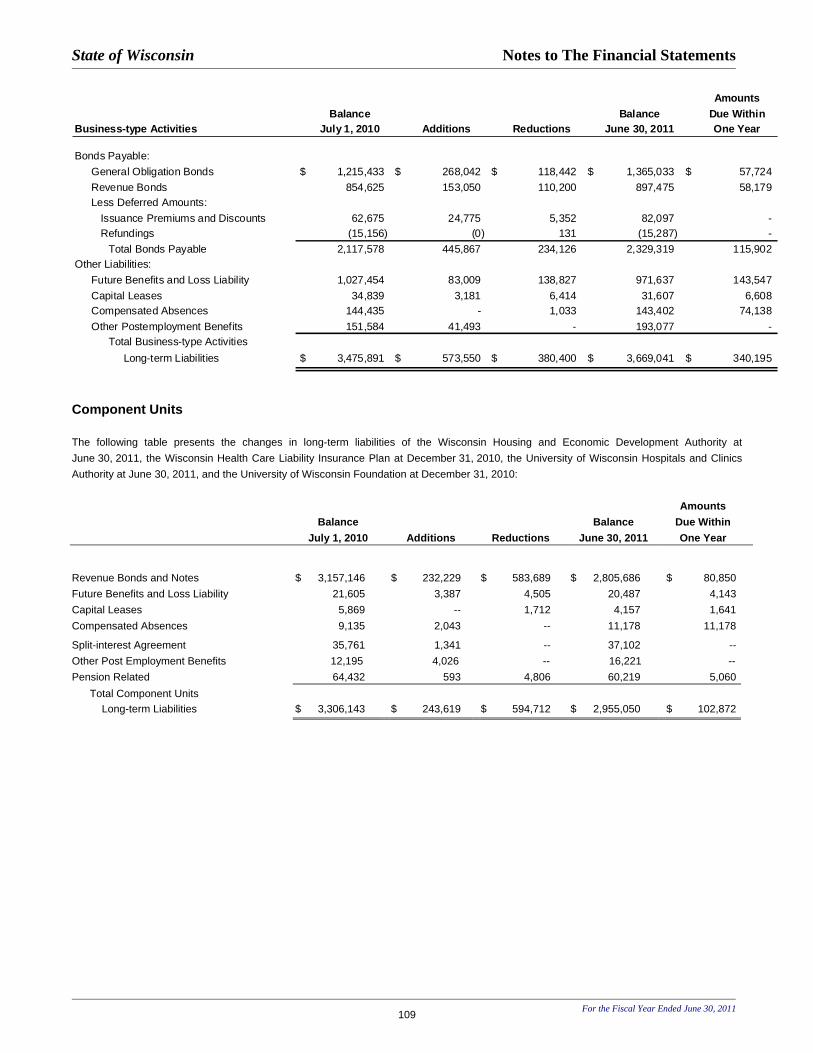
State of Wisconsin Notes to The Financial Statements
Amounts
Balance Balance Due WithinBusiness-type Activities July 1, 2010 Additions Reductions June 30, 2011 One Year
Bonds Payable:General Obligation Bonds $ 1,215,433 $ 268,042 $ 118,442 $ 1,365,033 $ 57,724 Revenue Bonds 854,625 153,050 110,200 897,475 58,179 Less Deferred Amounts: Issuance Premiums and Discounts 62,675 24,775 5,352 82,097 - Refundings (15,156) (0) 131 (15,287) -
Total Bonds Payable 2,117,578 445,867 234,126 2,329,319 115,902 Other Liabilities:
Future Benefits and Loss Liability 1,027,454 83,009 138,827 971,637 143,547 Capital Leases 34,839 3,181 6,414 31,607 6,608 Compensated Absences 144,435 - 1,033 143,402 74,138 Other Postemployment Benefits 151,584 41,493 - 193,077 -
Total Business-type Activities Long-term Liabilities $ 3,475,891 $ 573,550 $ 380,400 $ 3,669,041 $ 340,195
Component Units The following table presents the changes in long-term liabilities of the Wisconsin Housing and Economic Development Authority at June 30, 2011, the Wisconsin Health Care Liability Insurance Plan at December 31, 2010, the University of Wisconsin Hospitals and Clinics Authority at June 30, 2011, and the University of Wisconsin Foundation at December 31, 2010: Amounts
Balance Balance Due Within July 1, 2010 Additions Reductions June 30, 2011 One Year
Revenue Bonds and Notes $ 3,157,146 $ 232,229 $ 583,689 $ 2,805,686 $ 80,850 Future Benefits and Loss Liability 21,605 3,387 4,505 20,487 4,143 Capital Leases 5,869 -- 1,712 4,157 1,641 Compensated Absences 9,135 2,043 -- 11,178 11,178
Split-interest Agreement 35,761 1,341 -- 37,102 -- Other Post Employment Benefits 12,195 4,026 -- 16,221 -- Pension Related 64,432 593 4,806 60,219 5,060 Total Component Units Long-term Liabilities $ 3,306,143 $ 243,619 $ 594,712 $ 2,955,050 $ 102,872
For the Fiscal Year Ended June 30, 2011 109

State of Wisconsin Notes to The Financial Statements
For the Fiscal Year Ended June 30, 2011 110
NOTE 11. BONDS, NOTES AND OTHER DEBT OBLIGATIONS
The following schedule summarizes outstanding long-term bonds and notes payable at June 30, 2011 (in thousands):
Primary Government Governmental Activities: General Obligation Bonds $ 5,337,915 Annual Appropriation Bonds 3,331,570 Revenue Bonds: Transportation 1,796,522 Petroleum Inspection 127,133 Total Governmental Activities 10,593,140 Business-type Activities: General Obligation Bonds: University of Wisconsin System 1,158,239 Other Business-type 234,119 Revenue Bonds: Environmental Improvement 936,951 Total Business-type Activities 2,329,309
Total Primary Government 12,922,449 Component Units: Wisconsin Housing and Economic Development Authority Revenue Bonds 2,571,283 University of Wisconsin Hospitals and Clinics Authority Revenue Bonds 230,564 University of Wisconsin Foundation Note Payable 3,839
Total Component Units 2,805,686 Total at June 30, 2011 $ 15,728,135
A. General Obligation Bonds Primary Government The State of Wisconsin Building Commission, an agency of the State, is empowered by law to consider, act upon, authorize, issue and sell all debt obligations of the State. To date, the Commission has authorized and issued general obligation bonds primarily to provide funds for the acquisition or improvement of land, water, property, highways, buildings, equipment or facilities for public purposes. Occasionally, general obligation bonds are also issued for the purpose of providing funds for veterans housing loans and to refund general obligation bonds. All general obligation bonds authorized and issued by the State are secured by a pledge of the full faith, credit and taxing power of the State of Wisconsin and are customarily repaid over a period of twenty to thirty years. Article VIII of the Wisconsin Constitution and Wis. Stat. Section 18.05 set limits on the amount of debt that the State can contract in total and in any calendar year. In total, debt outstanding cannot exceed five percent of the value of all taxable property in the State. Annual debt issued cannot exceed the lesser of three-quarters of one percent or five percent of the value of all taxable property in the State less net indebtedness at January 1. At June 30, 2011, $4,354.8 million of general obligation bonds were authorized but unissued.
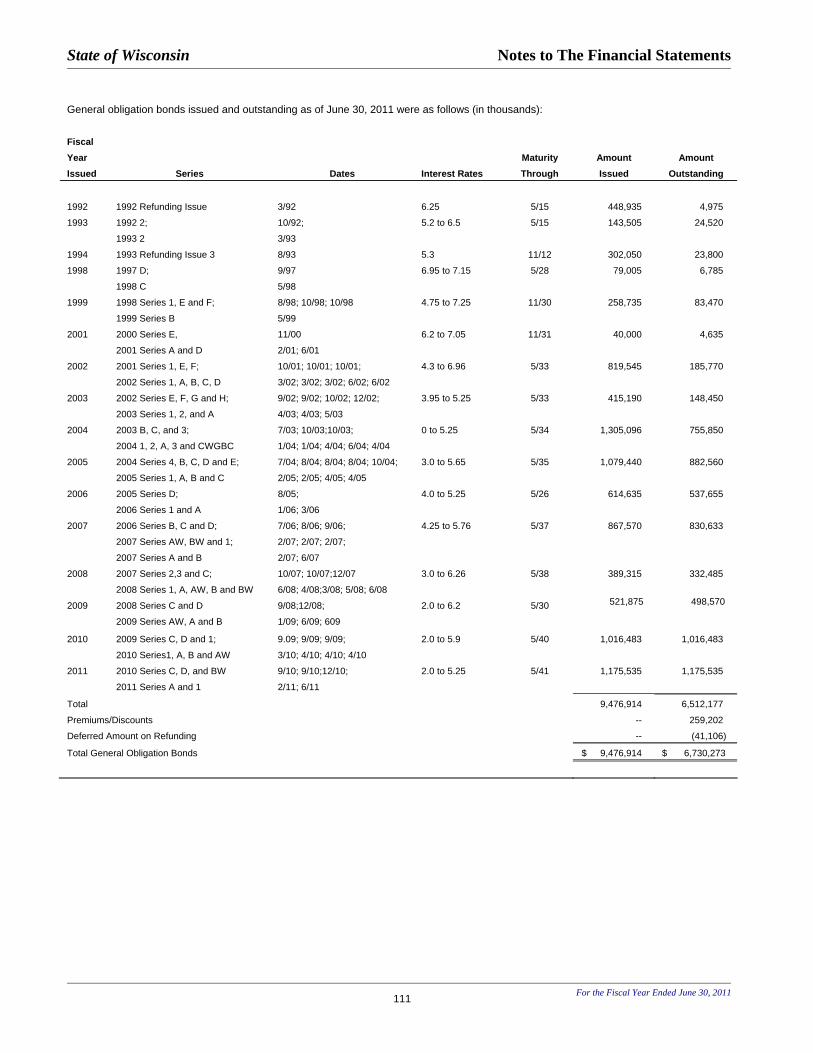
State of Wisconsin Notes to The Financial Statements
For the Fiscal Year Ended June 30, 2011
111
General obligation bonds issued and outstanding as of June 30, 2011 were as follows (in thousands): Fiscal
Year Maturity Amount Amount Issued Series Dates Interest Rates Through Issued Outstanding
1992 1992 Refunding Issue 3/92 6.25 5/15 448,935 4,975
1993 1992 2; 10/92; 5.2 to 6.5 5/15 143,505 24,520
1993 2 3/93
1994 1993 Refunding Issue 3 8/93 5.3 11/12 302,050 23,800
1998 1997 D; 9/97 6.95 to 7.15 5/28 79,005 6,785
1998 C 5/98
1999 1998 Series 1, E and F; 8/98; 10/98; 10/98 4.75 to 7.25 11/30 258,735 83,470
1999 Series B 5/99
2001 2000 Series E,
2001 Series A and D
11/00
2/01; 6/01
6.2 to 7.05 11/31 40,000 4,635
2002 2001 Series 1, E, F; 10/01; 10/01; 10/01; 4.3 to 6.96 5/33 819,545 185,770
2002 Series 1, A, B, C, D 3/02; 3/02; 3/02; 6/02; 6/02
2003 2002 Series E, F, G and H; 9/02; 9/02; 10/02; 12/02; 3.95 to 5.25 5/33 415,190 148,450
2003 Series 1, 2, and A 4/03; 4/03; 5/03
2004 2003 B, C, and 3; 7/03; 10/03;10/03; 0 to 5.25 5/34 1,305,096 755,850
2004 1, 2, A, 3 and CWGBC 1/04; 1/04; 4/04; 6/04; 4/04
2005 2004 Series 4, B, C, D and E; 7/04; 8/04; 8/04; 8/04; 10/04; 3.0 to 5.65 5/35 1,079,440 882,560
2005 Series 1, A, B and C 2/05; 2/05; 4/05; 4/05
2006 2005 Series D; 8/05; 4.0 to 5.25 5/26 614,635 537,655
2006 Series 1 and A 1/06; 3/06
2007 2006 Series B, C and D; 7/06; 8/06; 9/06; 4.25 to 5.76 5/37 867,570 830,633
2007 Series AW, BW and 1; 2/07; 2/07; 2/07;
2007 Series A and B 2/07; 6/07
2008 2007 Series 2,3 and C; 10/07; 10/07;12/07 3.0 to 6.26 5/38 389,315 332,485
2008 Series 1, A, AW, B and BW 6/08; 4/08;3/08; 5/08; 6/08
2009 2008 Series C and D 9/08;12/08; 2.0 to 6.2 5/30 521,875 498,570
2009 Series AW, A and B 1/09; 6/09; 609
2010 2009 Series C, D and 1;
2010 Series1, A, B and AW
9.09; 9/09; 9/09;
3/10; 4/10; 4/10; 4/10
2.0 to 5.9 5/40 1,016,483 1,016,483
2011 2010 Series C, D, and BW
2011 Series A and 1
9/10; 9/10;12/10;
2/11; 6/11
2.0 to 5.25 5/41 1,175,535 1,175,535
Total 9,476,914 6,512,177
Premiums/Discounts -- 259,202
Deferred Amount on Refunding -- (41,106)
Total General Obligation Bonds $ 9,476,914 $ 6,730,273

State of Wisconsin Notes to The Financial Statements
For the Fiscal Year Ended June 30, 2011
112
As of June 30, 2011, general obligation bond debt service requirements for principal and interest for governmental activities and business -type activities are as follows (in thousands):
Fiscal Year Governmental Activities Business-Type Activities Ended June 30 Principal Interest Principal Interest
2012 $ 377,240 $ 247,386 $ 52,512 $ 68,636 2013 394,629 228,373 56,614 64,604 2014 391,138 210,074 56,017 61,950 2015 404,927 191,485 55,452 59,300 2016 390,360 172,462 62,081 56,530 2017-2021 1,668,793 606,347 340,371 235,667 2022-2026 1,011,500 271,577 338,313 152,203 2027-2031 508,557 69,828 283,549 70,982 2032-2036 -- -- 74,275 23,511 2037-2041 -- -- 45,850 6,756 Total 5,147,144 1,997,532 1,365,034 800,139 Premiums/Discounts 224,756 -- 34,446 -- Deferred Amount on Refunding (33,985) -- (7,120) -- Total $ 5,337,915 $ 1,997,532 $ 1,392,360 $ 800,139
Qualified Build America Bonds The State has issued four series of general obligation bonds, in the aggregate amount of $769.2 million, that are “qualified Build America Bonds” pursuant to Section 54AA of the Internal Revenue Code of 1986, as amended (Code). Based on the credit allowed for “qualified Build America Bonds”, the State has elected to receive from the United States Treasury on each payment date a direct payment in the amount of 35 percent of the interest payable by the State with respect to such date, and the credit will not be allowed to the taxpayers holding the bonds. • The interest rates on the 2009 Series B bonds, in the amount
of $54.5 million, range from 5.15 percent to 5.40 percent payable semiannually on May 1 and November 1 beginning with the first interest payment date of November 1, 2009. These bonds are callable at par on May 1, 2019 or any date thereafter. The bonds mature beginning May 1, 2023 through 2030.
• The interest rates on the 2009 Series D bonds, in the
amount of $225.8 million, range from 4.9 percent to 5.9 percent payable semiannually on May 1 and November 1 beginning with the first interest payment date of May 1, 2010. These bonds are callable at par on May 1, 2020 or any date thereafter. The bonds mature beginning May 1, 2023 through 2040.
• The interest rates on the 2010 Series B bonds, in the amount of $179.1 million, range from 4.3 percent to 5.65 percent payable semiannually on May 1 and November 1 beginning with the first interest payment date of November 1, 2010. These bonds are callable at par on May 1, 2020 or any date thereafter. The bonds mature beginning May 1, 2020 through 2030.
• The interest rates on the 2010 Series D bonds, in the
amount of $309.7 million, range from 3.45 percent to 5.1 percent payable semiannually on May 1 and November 1 beginning with the first interest payment date of May 1, 2011. These bonds are callable at par on May 1, 2021 or any date thereafter. The bonds mature beginning May 1, 2020 through 2041.

State of Wisconsin Notes to The Financial Statements
For the Fiscal Year Ended June 30, 2011
113
B. Annual Appropriation Bonds 2003 Annual Appropriation Bonds In December 2003, the State issued $1.8 billion of General Fund Annual Appropriation Bonds consisting of Series A (Taxable Fixed Rate) and Series B (Taxable Auction Rate Certificates). These appropriation obligations were authorized by Wisconsin Statutes to obtain proceeds to pay the State’s anticipated unfunded accrued prior service (pension) liability under Wis. Stat. Section 40.05(2)(b) and its unfunded accrued liability for sick leave conversion credits under Wis. Stat. Section 40.05(4)(b), (bc), and (bw) and Subchapter IX of Chapter 40. In April and June 2008, the State issued $1.0 billion of General Fund Annual Appropriation Refunding Bonds to refund the Series B (Taxable Auction Rate Certificates) that were issued in 2003. The 2008 issuance consisted of Series A (Taxable Fixed Rate) and Series B and C (Taxable Floating Rate Notes). These appropriation obligations are not general obligations of the State, and do not constitute “public debt” of the State as that term is used in the Constitution and in the State Statutes. The payment of the principal of, and premium, if any, and interest on the obligations is subject to annual appropriation; that is, payments due in any fiscal year of the State will be made only to the extent sufficient amounts are appropriated by the Legislature. The State is not legally obligated to appropriate any amounts for payment of debt service. The Legislature, recognizing its moral obligation to make timely appropriations from the General Fund sufficient to pay debt service on such obligations, expresses in Wis. Stat. Section 16.527(10) its expectation and aspiration that it will do so. The Legislature’s recognition of a moral obligation, however, does not create a legally enforceable obligation. The General Fund Annual Appropriation Bonds of 2003, Series A (Taxable Fixed Rate) in the outstanding principal amount of $850.0 million (“2003 Series A Bonds”), bear interest at rates from 4.80 percent to 5.70 percent computed on the basis of a 30 day month and a 360-day year, payable semiannually on each May 1 and November 1 until their maturity dates. The General Fund Annual Appropriation Refunding Bonds of 2008, Series A (Taxable Fixed Rate) in the outstanding principal amount of $464.8 million (“2008 Series A Bonds”), bear interest at rates from 3.799 percent to 5.238 percent computed on the basis of a 30-day month and a 360-day year, payable semiannually on each May 1 and November 1 until their maturity dates. The General Fund Annual Appropriation Bonds of 2008, Series B (Taxable Floating Rate Notes), in the outstanding principal amount of $300.0 million, bear interest at rates 120 basis points over the one-month LIBOR, computed on the basis of a 360-day year and for the number of days actually elapsed, payable monthly on the first business day of the month.
The General Fund Annual Appropriation Bonds of 2008, Series C (Taxable Floating Rate Notes), (“2008 Series C Bonds”) in the outstanding principal amount of $202.0 million, bear interest at rates 110 basis points over the one-month LIBOR computed on the basis of a 360-day year and for the number of days actually elapsed, payable monthly on the first business day of the month. As of June 30, 2011, the debt service requirements for principal and interest on these bonds are as follows (in millions):
Fiscal Year Ended June 30 Principal Interest
2012 $ 26.9 $ 101.02013 286.5 99.82014 72.8 86.32015 10.4 82.92016 17.4 82.42017 - 2021 546.9 333.72022 - 2026 472.7 224.42027 - 2031 347.0 75.42032 – 2036 36.2 2.0
Total 1,816.8 1,087.9Unamortized Prem./Discount (1.4) --
Total, net $ 1,815.4 $ 1,087.9
Derivatives The State has entered into interest rate exchange agreements, or swap agreements, to modify interest rates for nearly all of the 2008 Series B bonds and 2008 Series C bonds. All interest rate agreements at June 30, 2011, are classified as effective cash flow hedges. Since the interest rate exchange agreements qualify as an effective hedge, changes to fair value are not reported in the statement of activities, and, therefore, no restatement of beginning net assets is necessary as a result of implementation of GASB Statement No. 53 in Fiscal Year 2010. The State has contracted with a third party advisor to provide estimates of the fair value of the aggregate swap agreements as of June 30, 2011. Objective – In December 2003, the State entered into four interest rate exchange agreements with four different counterparties in order to reduce the interest rate risk in connection with $595.2 million of the Series B (Taxable Auction Rate Certificates) issued in 2003. In June 2005, the State entered into four additional interest rate exchange agreements with three counterparties in order to reduce the interest rate risk on the balance of the Series B (Taxable Auction Rate Certificates) issued in 2003, ($349.7 million). In April and June 2008, the State issued $509 million of annual appropriation refunding bonds as floating rate notes having variable interest rate set every month (2008 Series B Bonds and 2008 Series C Bonds). In conjunction with issuance in April 2008, at its option the State terminated and made corresponding termination payments in the aggregate amount of $40.0 million on some, and a portion of other, interest rate exchange agreements previously entered into in December 2003 and June 2005. As of June 30, 2011, interest rate

State of Wisconsin Notes to The Financial Statements
For the Fiscal Year Ended June 30, 2011
114
exchange agreements remain to reduce the interest rate risk in connection with $493.0 million in floating rate notes. Terms – Nearly all of the outstanding 2008 Series B Bonds and 2008 Series C Bonds are subject to the interest rate exchange agreements with a notional amount totaling $493.0 million as of June 30, 2011. 2008 Series B Bonds and Series C Bonds mature and a related notional amount of the related interest rate exchange agreements decline from May 1, 2012 through 2032. Based on the interest rate exchange agreements, the State owes to the counterparties an amount calculated at fixed rates ranging from 4.661 percent to 5.47 percent and the counterparties owe the State interest on an amount based on a variable rate, which is the one-month LIBOR. The net amount is paid monthly. Fair Value – As of June 30, 2011, the aggregate fair value of the interest exchange agreements was negative $104.0 million, an increase of $26.7 million compared to the aggregate fair value of negative $130.7 million reported as of June 30, 2010. Since the interest rate exchange agreements qualify as effective cash flow hedges, a deferred outflow of resources and a liability are reported in the statement of net assets for the fair value of the swap agreements. Changes in the fair value are not reported in the statement of activities. The fair value was valued by a third party consultant based on information contained in the broker Interest Rate Swap Confirmations supplied by the three counterparties -- JP Morgan Chase, Citigroup N.A. New York, and UBS AG. The fair value takes into consideration the prevailing interest rate environment and the specific terms and conditions of the interest rate exchange agreement. The fair value was estimated using the zero-coupon discounting method. This method calculates the future payments required by the interest rate exchange agreements, assuming that the current forward rates implied by the yield curve are the market’s best estimate of future spot interest rates. These payments are then discounted using the spot rates implied by the current yield curve for a hypothetical zero-coupon rate bond due on the date of each future net settlement payment on the interest rate exchange agreements. The fair value may vary throughout the life of the swap agreements due to any changes in fixed swap interest rates and swap market conditions. Associated Debt – Using rates as of June 30, 2011, debt service requirements are presented for the 2008 Series B Bonds and 2008 Series C Bonds that are subject to the interest rate exchange agreements and the net swap payments assuming that interest rates remain the same for their term. As rates vary, interest payments on the floating rate notes and net swap payments will vary.
(in millions)
Fiscal Year InterestEnded Rate
June 30 Principal Interest Swaps, Net Totals 2012 $ 4.6 $ 6.7 $ 25.5 $ 36.82013 5.9 6.7 25.2 37.82014 1.1 6.6 25.0 32.72015 1.1 6.6 25.0 32.72016 1.1 6.6 24.9 32.62017 - 2021 12.9 32.6 123.8 169.32022 - 2026 87.4 30.4 116.3 234.12027 - 2031 343.0 15.6 59.7 418.32032 - 2036 35.8 .4 1.6 37.8
$ 492.9 $ 112.2 $ 427.0 $ 1,032.1
Interest Rate Risk – Currently, the State does not have interest rate risk because it is paying a fixed-rate of interest on the interest rate exchange agreements. However, if for some unforeseen reason any of the swap agreements are terminated prior to maturity, the State will have interest rate risk associated with the outstanding 2008 Series B Bonds and 2008 Series C Bonds until their maturity. Credit Risk – As of June 30, 2011, the State was exposed to only a minimal amount of credit risk, as the fair values of all of the four interest rate exchange agreements were negative. Should rates change, the State could have increased exposure in the future. The State has entered into four interest rate agreements with three different counterparties. The lowest rating assigned to these counterparties is, as of June 30, 2011, A1 by Moody’s, A+ by Standard & Poor’s, and A+ by Fitch Ratings. Under the interest rate exchange agreements and to mitigate the potential for credit risk, if any of the counterparties’ credit quality falls below A3 by Moody’s Investors Service or A- by either Standard & Poor’s or Fitch Ratings, the fair value of the interest rate exchange agreement for that respective counterparty will be fully collateralized by that counterparty. In addition, an event of termination occurs if any of the counterparties’ credit quality falls below Baa2 by Moody’s Investors service or BBB by either Standard & Poor’s or Fitch Ratings. Basis Risk – The interest rate exchange agreements expose the State to basis risk (i.e., a shortfall or surplus between the variable interest rate received on the interest rate exchange agreements and the interest rate paid on the floating rate notes), however this risk is fixed at the spreads for the respective series. Termination Risk – The interest rate exchange agreements may be terminated by the State, upon two business days written notice, designating to the counterparty the termination date. In addition, the State or the counterparties may terminate the interest rate exchange agreements if the other party fails to perform under the terms of the interest rate exchange agreements or if other various events occur. As of June 30, 2011, there have
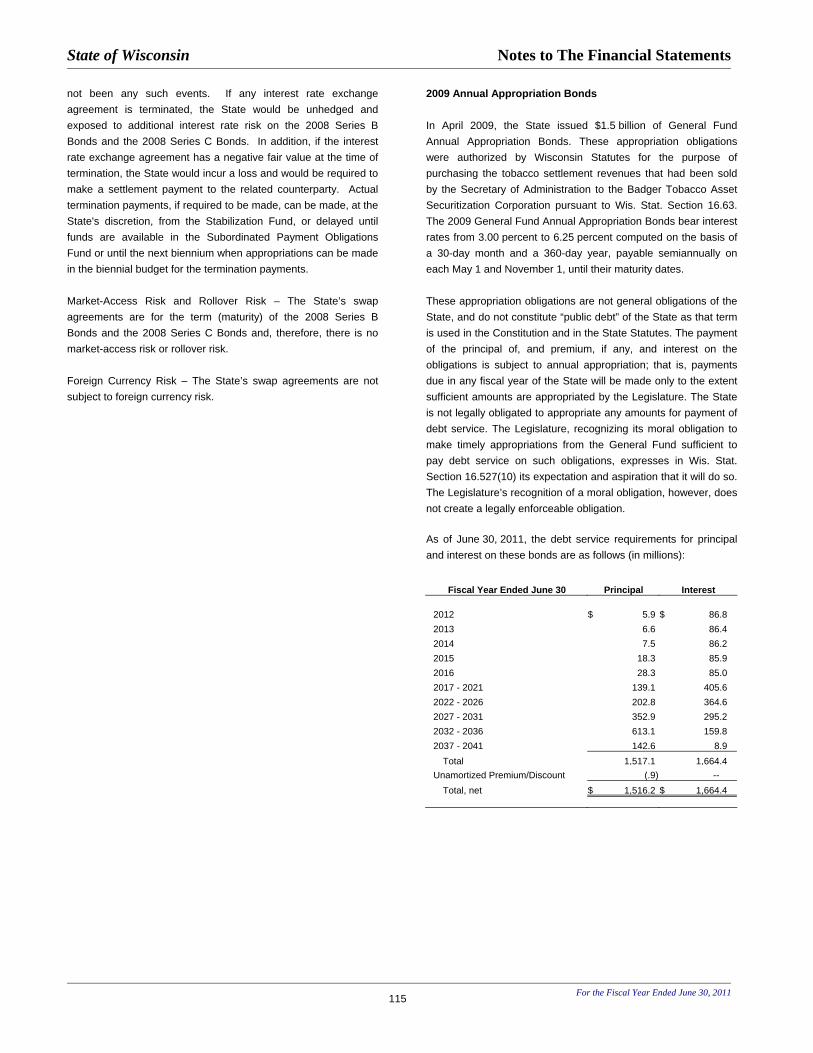
State of Wisconsin Notes to The Financial Statements
For the Fiscal Year Ended June 30, 2011
115
not been any such events. If any interest rate exchange agreement is terminated, the State would be unhedged and exposed to additional interest rate risk on the 2008 Series B Bonds and the 2008 Series C Bonds. In addition, if the interest rate exchange agreement has a negative fair value at the time of termination, the State would incur a loss and would be required to make a settlement payment to the related counterparty. Actual termination payments, if required to be made, can be made, at the State's discretion, from the Stabilization Fund, or delayed until funds are available in the Subordinated Payment Obligations Fund or until the next biennium when appropriations can be made in the biennial budget for the termination payments. Market-Access Risk and Rollover Risk – The State’s swap agreements are for the term (maturity) of the 2008 Series B Bonds and the 2008 Series C Bonds and, therefore, there is no market-access risk or rollover risk. Foreign Currency Risk – The State’s swap agreements are not subject to foreign currency risk.
2009 Annual Appropriation Bonds In April 2009, the State issued $1.5 billion of General Fund Annual Appropriation Bonds. These appropriation obligations were authorized by Wisconsin Statutes for the purpose of purchasing the tobacco settlement revenues that had been sold by the Secretary of Administration to the Badger Tobacco Asset Securitization Corporation pursuant to Wis. Stat. Section 16.63. The 2009 General Fund Annual Appropriation Bonds bear interest rates from 3.00 percent to 6.25 percent computed on the basis of a 30-day month and a 360-day year, payable semiannually on each May 1 and November 1, until their maturity dates. These appropriation obligations are not general obligations of the State, and do not constitute “public debt” of the State as that term is used in the Constitution and in the State Statutes. The payment of the principal of, and premium, if any, and interest on the obligations is subject to annual appropriation; that is, payments due in any fiscal year of the State will be made only to the extent sufficient amounts are appropriated by the Legislature. The State is not legally obligated to appropriate any amounts for payment of debt service. The Legislature, recognizing its moral obligation to make timely appropriations from the General Fund sufficient to pay debt service on such obligations, expresses in Wis. Stat. Section 16.527(10) its expectation and aspiration that it will do so. The Legislature’s recognition of a moral obligation, however, does not create a legally enforceable obligation. As of June 30, 2011, the debt service requirements for principal and interest on these bonds are as follows (in millions):
Fiscal Year Ended June 30 Principal Interest
2012 $ 5.9 $ 86.82013 6.6 86.42014 7.5 86.22015 18.3 85.92016 28.3 85.02017 - 2021 139.1 405.62022 - 2026 202.8 364.62027 - 2031 352.9 295.22032 - 2036 613.1 159.82037 - 2041 142.6 8.9
Total 1,517.1 1,664.4Unamortized Premium/Discount (.9) --
Total, net $ 1,516.2 $ 1,664.4

State of Wisconsin Notes to The Financial Statements
For the Fiscal Year Ended June 30, 2011
116
C. Revenue Bonds Primary Government Chapter 18, Wisconsin Statutes, authorizes the State to issue revenue obligations secured by a pledge of revenues or property derived from the operation of a program funded by the issuance of these obligations. The resulting bond obligations are not general obligations of the State. Transportation Revenue Bonds Transportation Revenue Bonds are issued to finance part of the costs of certain transportation facilities and major highway projects. Chapter 18, Subchapter II of the Wisconsin Statutes as amended, Wis. Stat. Sec. 84.59 and a general bond resolution and series resolutions authorize the issuance of these bonds. The Department of Transportation is authorized to issue a total of $3,009.8 million of revenue bonds. Presently, there are seventeen issues of Transportation Revenue Bonds totaling $1,719.5 million. Debt service payments are secured by driver and vehicle registration fees and also a reserve fund, which will be used in the event that a deficiency exists in the redemption fund. The Transportation Revenue Bonds issued and outstanding as of June 30, 2011 were as follows (in thousands):
Issue Interest Maturity Issue Date Rates Through Issued Outstanding
2010B 12/10 4.7 to 6.0 7/31 $ 123,925 $ 123,925
2010A 12/10 5.0 7/21 76,075 76,075
2009B 10/09 3.5 to 5.8 7/30 147,130 147,130
2009A 10/09 3.5 to 4.0 7/14 17,870 17,870
2008A 8/08 5.0 7/29 185,000 179,405
2007A 3/07 4.25 to 5.0 7/27 148,710 148,710
20071 3/07 4.35 to 5.0 7/22 206,900 206,900
2005B 9/05 4.0 to 5.0 7/25 158,400 128,055
2005A 3/05 3.1 to 5.25 7/25 235,585 233,830
2004 1 9/04 5.25 7/17 95,905 70,920
2003A 11/03 5.0 7/24 166,230 114,805
2002A 10/02 4.6 to 5.0 7/23 119,785 70,540
2002 1& 2 4/02 4.85 to 5.625 7/15 & 7/19 200,080 77,920
2001A 11/01 4.0 to 5.0 7/22 106,450 29,965
1998A 8/98 5.5 7/16 130,590 79,260
1993A 9/93 4.75 to 5.0 7/12 116,450 14,235
2,235,085 1,719,545
Unamortized Prem./Discount -- 76,977
Total $ 2,235,085 $1,796,522
Petroleum Inspection Fee Revenue Bonds Petroleum Inspection Fee (PIF) Revenue Bonds are issued to finance claims made under the Petroleum Environmental Cleanup Fund Award (PECFA) Program for reimbursement of cleanup
costs to soil and groundwater contamination. The program reimburses owners for 75 percent to 99 percent of cleanup costs associated with soil and groundwater contamination. As of June 30, 2011, PIF Bonds outstanding are $117.5 million. Debt service payments are secured by petroleum inspection fees. The PIF revenue bonds issued and outstanding as of June 30, 2011 were as follows (in thousands):
Issue Interest Maturity Issue Date Rates Through Issued Outstanding
2009-1 10.09 2.5 to 5.0 7/17 $ 117,460 $ 117,460
Unamortized Premium -- 9,673
Total $ 117,460 $ 127,133
Clean Water Revenue Bonds The Environmental Improvement Fund (the Fund) provides loans and grants to local municipalities to finance wastewater treatment planning and construction. The Fund is authorized to issue up to $2,363.0 million in Revenue Bonds. At June 30, 2011, there were fifteen issues of Revenue Bonds outstanding totaling $897.5 million. These bonds are secured by payments on program loans and earnings of investments. Bonds issued and outstanding for the Environmental Improvement Fund as of June 30, 2011 were as follows (in thousands):
Issue Interest Maturity Issue Date Rates Through Issued Outstanding
2010-5 11/10 5.0 6/23 $ 36,760 $ 36,760
2010-4 11/10 3.0 to 5.0 6/31 116,290 116,290
2010-3 2/10 3.0 to 5.0 6/25 49,690 49,690
2010-2 2/10 5.0 6/21 14,070 14,070
2010-1 2/10 3.95 to 5.44 6/31 67,415 67,415
2008-3 12/08 3.0 to 5.5 6/26 92,210 86,090
2008-2 2/08 5.0 6/18 27,335 27,335
2008-1 2/08 4.0 to 5.0 6/28 100,000 90,640
2006-2 11/06 4.0 to 5.0 6/27 100,000 86,965
2006-1 3/06 3.5 to 5.0 6/27 80,000 69,575
2004-2 1/05 3.25 to 5.25 6/20 107,025 90,815
2004-1 3/04 4.0 to 5.0 6/24 116,795 76,825
2002-2 8/02 3.0 to 5.5 6/16 85,575 25,055
2002-1 5/02 4.0 to 5.25 6/23 100,000 4,350
1998-2 8/99 4.0 to 5.5 6/17 104,360 55,600
1,197,525 897,475
Unamortized Premium -- 47,643
Less: Unamortized discount and Charge (8,167)
Total, net of discount, charge and premium $1,197,525 $ 936,951

State of Wisconsin Notes to The Financial Statements
For the Fiscal Year Ended June 30, 2011
117
As of June 30, 2011, revenue bond debt service requirements for principal and interest for governmental activities and business-type activities are as follows (in thousands):
Governmental Activities Business-Type Activities Transportation Petroleum Inspection Fee Clean Water
Fiscal Year Revenue Bonds Revenue Bonds Revenue Bonds Ended June 30 Principal Interest Principal Interest Principal Interest
2012 $ 81,200 $ 79,312 $ -- $ 5,597 $ 58,170 $ 44,288 2013 94,715 79,634 -- 5,597 59,170 41,534 2014 99,665 74,686 24,165 5,007 56,250 38,725 2015 104,610 69,431 25,345 3,817 56,930 35,803 2016 102,025 64,118 26,540 2,588 58,550 32,962 2017-2021 535,390 244,109 41,410 1,560 276,365 112,528 2022-2026 472,625 114,203 -- -- 222,965 59,370 2027-2031 214,030 32,439 -- -- 109,075 14,254 2032-2036 15,285 917 -- -- -- -- Total 1,719,545 758,849 117,460 24,166 897,475 379,464 Unamortized Premium 76,977 -- 9,673 -- 47,643 -- Unamortized Discount/Charge -- -- -- -- (8,167) -- Total, net $ 1,796,522 $ 758,849 $ 127,133 $ 24,166 $ 936,951 $ 379,464 Qualified Build America Bonds The State has issued three series of revenue bonds, in the aggregate amount of $320.8 million, that are “qualified Build America Bonds” pursuant to Section 54AA of the Internal Revenue Code of 1986, as amended (Code). Based on the credit allowed for “qualified Build America Bonds”, the State has elected to receive from the United States Treasury on each payment date a direct payment in the amount of 35 percent of the interest payable by the State with respect to such date, and the credit will not be allowed to the taxpayers holding the bonds. The interest rates on the 2009 Series B (taxable) Transportation Revenue Bonds in the amount of $147.0 million range from 3.5 percent to 5.8 percent payable semiannually on January 1 and July 1 beginning with the first interest payment date of July 1, 2010. These bonds are callable at par on July 1, 2019 or any date thereafter. The bonds mature beginning July 1, 2015 through 2030. The interest rates on the 2010 Clean Water Revenue, Series 3 bonds in the amount of $49.7 million bonds range from 3.957 percent to 5.441 percent payable semiannually on June 1 and December 1 beginning with the first interest payment date of June 1, 2010. These bonds are callable at par on June 1, 2020 or any date thereafter. The bonds mature beginning June 1, 2017 through 2025. The interest rates on the 2010 Series B (taxable) Transportation Revenue Bonds in the amount of $123.9 million range from 4.7 percent to 6.0 percent payable semiannually on January 1 and July 1 beginning with the first interest payment date of
July 1, 2011. These bonds are callable at par on July 1, 2020 or any date thereafter. The bonds mature beginning July 1, 2022 through 2031.

State of Wisconsin Notes to The Financial Statements
For the Fiscal Year Ended June 30, 2011
118
Component Units – Discrete Presentation Wisconsin Housing and Economic Development Authority Bonds and notes payable at June 30, 2011 of the Wisconsin Housing and Economic Development Authority (Authority) consisted of the following (in thousands): Revenue bonds and notes $ 2,573,539 Less: Deferred amount on refunding (2,256)Total, net $ 2,571,283 Authority’s Revenue Bonds and Notes The Authority’s revenue bonds and notes are collateralized by the revenues and assets of the Authority, subject to the provisions of resolutions and note agreements which pledge particular revenues or assets to specific bonds or notes. The bonds are subject to mandatory sinking fund requirements and may be redeemed at the Authority’s option at various dates and at prices ranging from 100 percent to 108 percent of par value. Any particular series contains both term bonds and serial bonds which mature at various dates. The Authority’s revenue bonds and notes outstanding at June 30, 2011 consisted of the following (in thousands): Series/ Maturity Issue Date Rates Through Outstanding Housing Revenue Bonds:
1998 A,B&C 2/98 5.3 to 6.88 2032 $ 10,580
2002 A,B&C 5/02 4.5 to 5.6 2033 28,150
2003 A&B 12/03 Variable 2034 5,730
2003 C 12/03 4.0 to 5.25 2043 12,960
2003 D&E 12/03 Variable 2044 19,315
2005 A,B&C 12/05 Variable 2035 9,240
2005 D&E 12/05 3.85 to 5.15 2045 37,285
2005 F 12/05 4.31 2030 113,055
2006 A&B 12/06 3.55 to 4.75 2047 16,550
2006 C&D 12/06 Variable 2037 8,445
2007 A&B 12/07 Variable 2042 17,040
2007 C,D&E 12/07 Variable 2038 8,250
2007 F&G 12/07 Variable 2042 16,020
2008 A,B,C,D,
E, F&G
6/08
Variable
2033
46,605
2009 A 12/09 Variable 2042 14,015
2010 A & B 12/10 .75 to 6.125 2043 42,750
405,990
Home Ownership Revenue Bonds:
1999 F,G&H 7/99 5.65 2024 1,275
2000 F 7/00 Variable 2015 1,750
2000 H 11/00 Variable 2024 8,105
2001 A,B&C 5/01 5.65 to 6.4 2032 8,735
2002 A&C 2/02 4.65 to 5.3 2018 14,570
2002 B 2/02 Variable 2032 4,615
2002 C 2/02 Variable 2016 2,090
2002 E&G 7/02 4.25 to 4.85 2017 10,780
2002 E & F 7/02 Variable 2032 27,030
2002 I 10/02 Variable 2032 34,750
2003 A 4/03 Variable 2033 42,490
2003 B 7/03 Variable 2034 51,170
2003 C 11/03 Variable 2034 38,230
2003 D 11/03 Variable 2028 10,985
2004 A 4/04 Variable 2035 70,760
2004 C&D 7/04 4.2 to 5.1 2024 9,035
2004 D 7/04 Variable 2035 76,035
2004 E 11/04 Variable 2035 62,705
2005 A 4/05 Variable 2036 79,240
2005 C 6/05 Variable 2033 92,285
2005 C 6/05 4.875 2036 17,370
2005 D 9/05 4.875 2036 12,555
2005 D&E 9/05 Variable 2036 87,030
2006 A&B 1/06 Variable 2037 165,295
2006 C&D 5/06 4.85 to 6.0 2037 144,390
2006 E&F 10/06 4.7 to 5.727 2037 127,195
2007 A&B 4/07 4.65 to 5.75 2038 90,680
2007 B 4/07 Variable 2026 28,785
2007 C&D 4/07 Variable 2038 131,370
2007 C 4/07 5.125 2028 17,920
2007 E&F 12/07 4.48 to 6.0 2038 58,675
2007 E&F 12/07 Variable 2038 39,240
2008 A&B 5/08 Variable 2038 99,630
2008 A&B 5/08 5.3 to 5.5 2028 34,455
2009 A 12/09 Variable 2041 195,970
2009&2010 A
&2009 A-1
11/10
.65 to 4.5
2041
100,000
1,997,195
Business Development Bonds:
1995 2, & 6 Various Variable 2015 730
730
Multifamily Housing Bonds:
2006 A&B 7/06 Variable 2036 7,085
2007 A&B 6/07 Variable 2040 11,485
2007 C 8/07 Variable 2048 6,240
2008 A&B 8/08 Variable 2046 13,810
2009 A 6/09 1.5 to3.5 2018 4,115
2009 A 6/09 Variable 2035 15,885
2009 B 12/09 Variable 2043 69,030
127,650
Notes Payable Various Variable Various 30,794
Fac. Refunding 6/09 Variable 2017 11,180
Authority’s Total Revenue Bonds and Notes $2,573,539

State of Wisconsin Notes to The Financial Statements
For the Fiscal Year Ended June 30, 2011
119
Debt service requirements for principal and interest for the Authority at June 30, 2011 are as follows (in thousands):
Fiscal Year Ended Principal Interest 2012 $ 74,354 $ 42,417 2013 43,535 40,218 2014 38,925 39,629 2015 42,835 39,143 2016 52,625 38,611 2017 - 2021 334,375 177,820 2022 - 2026 419,960 138,344 2027 - 2031 544,875 90,079 2032 - 2036 542,315 44,216 2037 - 2041 171,755 7,163 2042 - 2046 301,500 687 Thereafter 6,485 28 Total 2,573,539 658,355 Deferred Amount on Refunding (2,256) -- Total $ 2,571,283 $ 658,355
Under a Business Development Program and a Beginning Farmer Program, revenue bonds are issued which do not constitute indebtedness of the Authority within the meaning of any provision or limitation of the Constitution or Statutes of the State of Wisconsin. They do not constitute or give rise to a pecuniary liability of the Authority or a charge against its general credit. They are payable solely out of the revenues derived pursuant to the loan agreement, or in the event of default of the loan agreement, out of any revenues derived from the sale, releasing or other disposition of the mortgaged property. Therefore, the bonds are not reflected in the financial statements. As of June 30, 2011 the Authority had issued 83 series of such bonds in an aggregate principal amount of $73.9 million for economic projects in Wisconsin. A Construction Plus line of credit bears interest at the rate of 1.68 percent at June 30, 2011, and the Home ownership mortgage Loan Program line of credit bears interest of 4.0 percent at June 30, 2011. Both line of credit rates are based on the 30 day Eurodollar rate. Derivatives The Authority has entered into various interest rate swap agreements. The agreements provide the Authority with synthetic fixed interest rates on a portion of its debt. During the term of the swap agreements, the Authority expects to effectively pay a fixed rate on the debt. In return, the counterparty pays interest based on a contractually agreed upon variable rate. The Authority will
be exposed to variable rates on the outstanding bonds if the counterparty to the swap defaults, the swap is terminated such that the bonds outstanding is greater than the swap notional value or the effective interest rate, determined by the remarketing agent used for bond holder payments, increases over the variable rate index used for calculating the interest received from the counterparty. All interest rate swap agreements at June 30, 2011 are classified as effective cash flow hedges. The Authority does not intend to terminate these agreements other than at par and for purposes of maintaining a match between bonds outstanding and the swap notional value prior to their maturity. Using rates as of June 30, 2011, debt service requirements of the Authority outstanding variable rate debt and net swap payments, assuming current interest rates remain the same for their term, are as follows (in thousands). As rates vary, variable rate bond interest payments and net swap payments will vary. Fiscal Year Interest Rate
Ended Principal Interest Swaps, Net Total
2012 $ 48,985 $ 2,274 $ 47,879 $ 99,138
2013 47,945 1,668 46,278 95,891
2014 58,130 1,591 44,489 104,210
2015 57,030 1,505 42,118 100,653
2016 60,735 1,427 39,971 102,133
2017 - 2021 244,950 5,882 168,537 419,369
2022 - 2026 202,120 4,284 125,724 332,128
2027 - 2031 257,855 2,662 80,179 340,696
2032 - 2036 233,990 1,097 29,638 264,725
2037 - 2041 50,340 121 3,571 54,032
2042 - 2046 3,250 5 176 3,431
Totals $1,265,330 $ 22,516 $ 628,560 $1,916,406

State of Wisconsin Notes to The Financial Statements
For the Fiscal Year Ended June 30, 2011
120
The following table outlines information related to agreements in place as of June 30, 2011 (in thousands):
Swap Notional Swap Counterparty Percent Variable Termination
Program and Value at Effective Termination Credit Fixed Rate Rate/Index Market Value Bond Issue 6/30/11 Date Date Rating Paid Received at 6/30/11
Housing Revenue Bonds 2008 Series G $ 21,920 5/21/2002 11/1/2033 A/A2 4.68 70% of one month London Interbank Offered Rate (LIBOR) $ (781)2003 Series D 8,250 1/5/2005 5/1/2044 AA-/Aa1 4.21 65% of one month LIBOR + 25 basis points (596)2003 Series E 11,065 1/5/2005 5/1/2043 AA-/Aa1 4.05 63.5% of one month LIBOR + 20 basis points (776)2005 Series F 74,840 1/17/2006 11/1/2030 AA-/Aa1 5.21 One month LIBOR (12,836)2006 Series C 3,660 12/14/2006 11/1/2016 AA-/Aa1 3.64 SIFMA + 2 Basis Points (345)2006 Series D 4,785 12/14/2006 11/1/2016 AA-/Aa1 3.64 SIFMA + 2 Basis Points (451)2007 Series A 9,965 12/19/2007 11/1/2042 AA-/Aa1 4.72 SIFMA + 6 Basis Points (136)2007 Series B 7,075 12/19/2007 11/01/2039 AA-/Aa1 4.58 SIFMA + 2 Basis Points (98)2007 Series F 10,880 12/19/2007 11/01/2025 AA-/Aa1 4.01 SIFMA + 6 Basis Points (1,144)2007 Series G 5,140 12/19/2007 11/01/2025 AA-/Aa1 4.01 SIFMA + 6 Basis Points (540)
(17,703)Multifamily Housing Bonds 2006 Series A&B 7,085 7/19/2006 10/1/2013 AA-/Aa1 4.21 SIFMA + 2 Basis Points (552)2007 Series A 7,555 6/29/2007 10/1/2022 AA-/Aa1 4.43 SIFMA + 6 Basis Points (1,104)2007 Series B 3,930 6/29/2007 10/1/2022 AA-/Aa1 5.9 One month LIBOR – 2 Basis Points (935)2007 Series C 6,240 8/2/2007 9/1/2024 AA-/Aa1 4.33 SIFMA + 2 Basis Points (887)2008 Series A 6,870 8/28/2008 10/1/2026 AA/Aa2 3.89 SIFMA + 2 Basis Points (620)2008 Series A 4,415 8/28/2008 10/1/2026 AA/Aa2 3.89 SIFMA + 2 Basis Points (399)2008 Series B 2,525 8/28/2008 10/1/2026 AA/Aa2 5.08 LIBOR + 7 Basis Points (380) (4,877)1987 Home Ownership Revenue Bonds 2002 Series B 4,615 2/6/2002 3/1/2020 AA-/Aa1 5.88 One month LIBOR + 35 Basis Points (519)2002 Series C 2,090 2/6/2002 9/1/2012 AA-/Aa1 3.69 67 percent of one month LIBOR (37)2002 Series I 34,750 10/17/2002 9/1/2032 A+/Aa3 4.07 70 percent of one month LIBOR (1,106)2003 Series B 51,170 7/29/2003 9/1/2034 AA-/Aa1 3.94 65 percent of one month LIBOR + 25 Basis Points (4,611)2004 Series A 31,020 4/29/2004 9/1/2022 AA-/Aa1 4.47 SIFMA + 8 basis points (2,692)2004 Series A 5,535 4/29/2004 9/1/2012 AA-/Aa1 2.87 65 percent of one month LIBOR + 25 Basis Points (84)2004 Series A 34,205 4/29/2004 3/1/2035 AA-/Aa1 4.27 65 percent of one month LIBOR + 25 Basis Points (2,626)2005 Series A 79,240 4/12/2005 3/1/2036 A/A2 3.61 65 percent of one month LIBOR + 25 Basis Points (4,248)2005 Series D 69,185 9/29/2005 9/1/2036 AAA/Aa3 3.54 65 percent of one month LIBOR + 25 Basis Points (3,484)2007 Series B 28,785 4/10/2007 9/1/2026 AAA/Aa3 5.20 One month LIBOR (3,969)2007 Series E 27,980 12/18/2007 9/1/2038 AAA/Aa3 3.96 62 percent of one month LIBOR + 38 Basis Points (2,203)2007 Series F 11,260 12/18/2007 9/1/2014 AAA/Aa3 4.43 One month LIBOR (898)
(26,477)1988 Home Ownership Revenue Bonds 2002 Series E 23,890 7/11/2002 9/1/2032 AA-/Aa1 4.67 70 percent of one month LIBOR (255)2002 Series F 3,140 7/11/2002 9/1/2014 AA-/Aa1 5.20 Three months LIBOR + 40 Basis Points (142)2003 Series A 9,950 4/3/2003 9/1/2014 A/A2 2.98 65 percent one month LIBOR + 25 Basis Points (290)2003 Series A 14,620 4/3/2003 9/1/2030 A/A2 4.26 65 percent one month LIBOR + 25 Basis Points (141)2003 Series A 17,920 4/3/2003 9/1/2033 A/A2 4.17 65 percent one month LIBOR + 25 Basis Points (181)
2003 Series C 24,405 11/4/2003 3/1/2034 A/A2 3.81 65 percent one month LIBOR + 25 Basis Points (679)2003 Series C 13,825 11/4,2003 3/1/2019 A/A2 3.32 65 percent one month LIBOR + 25 Basis Points (511)2004 Series D 76,035 7/27/2004 9/1/2035 A/A2 3.73 65 percent one month LIBOR + 25 Basis Points (4,076)
2004 Series E 62,705 11/23/2004 9/1/2035 AA-/Aa1 3.99 65 percent one month LIBOR + 25 Basis Points (6,885)2005 Series C 69,460 8/3/2005 3/1/2024 AA-/Aa1 3.34 65 percent one month LIBOR + 25 Basis Points (4,319)2005 Series C 22,825 8/3/2005 9/1/2033 AA-/Aa1 4.07 65 percent one month LIBOR + 25 Basis Points (1,044)2006 Series A 81,650 1/19/2006 3/1/2029 AA-/Aa1 3.65 65 percent one month LIBOR + 25 Basis Points (6,077)2006 Series A 52,480 1/9/2006 9/1/2037 AA-/Aa1 4.27 65 percent one month LIBOR + 25 Basis Points (1,199)2007 Series C 18,435 6/28/2007 9/1/2017 AA-/Aa1 4.32 SIFMA + 8 Basis Points (126)2007 Series C 22,575 6/28/2007 9/1/2023 AA-/Aa1 4.63 SIFMA + 8 Basis Points (2,196)2007 Series C 30,180 6/28/2007 9/1/2016 AA-/Aa1 4.11 SIFMA + 8 Basis Points (2,114)

State of Wisconsin Notes to The Financial Statements
For the Fiscal Year Ended June 30, 2011
121
2007 Series D 23,760 6/28/2007 9/1/2027 AA-/Aa1 6.48 One month LIBOR (1,714)2007 Series D 17,690 6/28/2007 9/1/2016 AA-/Aa1 5.62 One month LIBOR (1,820)2007 Series D 18,730 6/28/2007 9/1/2028 AA-/Aa1 6.01 One month LIBOR (3,748)2008 Series A 32,995 5/15/2008 3/1/2019 AA/Aa2 3.35 SIFMA + 8 Basis Points (2,407)2008 Series A 52,025 5/15/2008 9/1/2038 AAA/Aa3 3.86 62 percent of one month LIBOR + 38 Basis Points (2,264)
(42,188) Total Swap Termination Market Value ($91,245)
Swap Valuation — The Swap Termination Market Values presented above were estimated by either the Authority’s counterparties to the swap agreements or by a third-party consultant, using proprietary valuation models based on industry valuation methodology, including the use of forward yield curves, zero curve rates, and market implied volatility assumptions. The synthetic instrument method and the regression analysis method were used to determine whether the derivative was hedgeable or not based on criteria provided by GASB Statement No. 53 “Accounting and Financial Reporting for Derivative Instruments”. The fair values of the hedgeable derivatives are presented in the Statements of Revenue, Expenses and Changes in Fund Net Assets. The market values in the table above represent the termination payments that would have been due had the swaps terminated on June 30, 2011. A positive value represents money due to the Authority by the counterparty upon termination while a negative value represents money payable by the Authority. Termination Risk — Counterparties to the Authority's swap agreements have ordinary termination rights that require a settlement payment by the Authority or the counterparty based on the market value of the swap agreement at the time of termination. As of June 30, 2011, no termination events have occurred. Credit Risk — The Authority is exposed to credit risk, the risk that the counterparty fails to perform according to its contractual obligations, on all swap agreements. To mitigate this risk, the Authority has entered into swap agreements with highly rated counterparties. As of June 30, 2011, the counterparty or counterparty guarantor in 58 percent of the outstanding swaps were rated AA-/Aa1, 20 percent were rated A/A2, 15 percent were rated AAA/Aa3, and the remaining counterparties were rated AA/Aa2 and A+/Aa3 by S&P and Moody’s, respectively. A collateral agreement has been entered into with all but one of the swap counterparties, to help reduce the Authority’s exposure to credit risk. Collateral is required based on the counterparty’s credit rating and the allowed threshold under each credit rating level. As of June 30, 2011, the counterparty rated AA-/Aa1, has collateral requirements starting at BBB+/Baa1 and a posting threshold of $500,000. The counterparty rated A/A2 has collateral requirements starting at AA-/Aa3 and a posting threshold of $50.0 million. Based on the current rating of AA/Aa2 the posting threshold level is lowered to $40.0 million. The counterparty rating of AA/Aa2 has collateral requirements starting at A+/A1 and a posting threshold of $10.0 million. The counterparty rating of A+/Aa3 has collateral requirements starting at BBB+/Baa1 and a posting threshold of $500,000. The counterparty rated AAA/Aa3
does not have a collateral agreement with the Authority. Based on the fair values as of June 30, 2011, no collateral is required from any counterparty. Basis and Interest Rate Risk — This risk arises when the amount that is paid by the swap counterparty is different than the variable rate interest payment due to the bondholders. For the Authority, this can happen when the swap counterparty payment is based on a taxable index (LIBOR) while the underlying bonds are traded in the tax exempt market. Based on market conditions, the relationship between taxable and tax exempt rates may vary. To minimize this risk, the Authority has chosen to use the formula that best represents the relationship between the taxable index and the Authority’s historical bond rates. In addition, even when the swap counterparty payment is based on a tax exempt index (SIFMA) and the underlying bonds are tax exempt, or the swap counterparty payment is based on a taxable index (LIBOR) and the underlying bonds are taxable, the Authority’s variable rate bonds may be traded differently from the market indices. Rollover Risk — The Authority is exposed to rollover risk only on swaps that mature or may be terminated at the counterparty’s option prior to the maturity of the associated bond. The Authority's swap agreements have limited rollover risk. For HORB issues, the swap agreements contain scheduled reductions to the notional amounts that are expected to follow the scheduled and anticipated reductions in the associated bonds under a wide range of mortgage prepayment speeds. In the case of the HRB and MHB issues, the underlying mortgages will adjust at the swap termination date to current market conditions. The following swaps expose the Authority to rollover risk:
Associated Bond SwapDebt Maturity Termination
Issuance Date Date
1987 HORB 2002 Series B 9/1/2032 3/1/2020
1987 HORB 2002 Series C 9/1/2016 9/1/2012
1987 HORB 2004 Series A 9/1/2028 9/1/2012
1987 HORB 2007 Series F 9/1/2018 9/1/2014
1988 HORB 2002 Series F 9/1/2032 9/1/2014
1988 HORB 2003 Series A 3/1/2029 9/1/2014
1988 HORB 2003 Series C 9/1/2033 3/1/2019
1988 HORB 2005 Series C 3/1/2028 3/1/2024
1988 HORB 2006 Series A 9/1/2030 3/1/2029
1988 HORB 2007 Series C 9/1/2035 9/1/2016

State of Wisconsin Notes to The Financial Statements
For the Fiscal Year Ended June 30, 2011
122
1988 HORB 2007 Series D 3/1/2034 9/1/2016
1988 HORB 2007 Series D 3/1/2038 9/1/2028
1988 HORB 2008 Series A 9/1/2038 3/1/2019
1974 HRB 2006 Series C&D 5/1/2037 11/1/2016
1974 HRB 2007 Series F&G 5/1/2042 11/1/2025
2006 MHB 2006 Series A&B 10/1/2036 10/1/2013
2006 MHB 2007 Series A&B 10/1/2040 10/1/2022
2006 MHB 2007 Series C 10/1/2048 9/1/2024
2006 MHB 2008 Series A&B 4/1/2046 10/1/2026
University of Wisconsin Hospitals and Clinics Authority (the Hospital) In March 2000, the Hospital issued $56.5 million of Hospital Revenue Bonds, Series 2000 (“Series 2000 Bonds”). In September 2005, the hospital refunded $52.5 million of the outstanding bonds with Variable Rate Demand Hospital Revenue Bonds, Series 2005. Principal payments on the remaining Series 2000 Bonds were paid in full in April 2010. The effective annual interest rate was 5.5 percent per cent in 2010. In October 2002, the Hospital issued $68.5 million of Hospital Revenue Bonds, Series 2002 (Series 2002 Bonds) consisting of $55.6 million Series 2002A Short-term Adjustable Securities and $12.9 million Series 2002B Fixed Interest Rate Bonds. The bond proceeds are designated to finance qualified capital projects. In March 2009, the Hospital refunded $55.6 million of the outstanding Series 2002A bonds with Variable Rate Demand Revenue Bonds, Series 2009A. The refunding of the Series 2002A bonds resulted in the recognition of a loss of $641 thousand due to the unamortized insurance premium and recognition of a deferred loss of $641 thousand for other unamortized deferred costs of the Series 2002A. Principal payments on the Series 2002B Bonds range from $1.5 million to $1.9 million due annually commencing in April 2011 through April 2013. Interest rates for the Series 2002B Bonds range from 5.25 percent to 5.50 percent and interest is payable semiannually on April 1 and October 1 of each year beginning April 1, 2003. The effective annual interest rate of the Series 2002 Bonds was 6.1 percent in 2011. In October 2002, the Hospital entered into an interest rate swap in order to convert a portion of the Series 2002A Short-term Adjustable Rate Securities to fixed rates. The notional amount of this swap agreement was $21.4 million at June 30, 2011 which matures on April 1, 2022. The terms of the swap agreement are for the Hospital to pay the counterparty a fixed rate of 3.85 percent per annum, payable semiannually, and the Hospital to receive a floating rate of 70.0 percent of one-month LIBOR per annum, payable monthly. As of June 30, 2011 the interest rate received by the Hospital was 0.2 percent. The fair value of the swap agreement was $(2.6) million at June 30, 2011. In November 2004, the Hospital entered into an interest rate swap in order to convert a portion of the Series 1997 Variable Rate
Demand Bonds to fixed rates. The notional amount of this swap agreement was $26.0 million at June 30, 2011, which matures on April 1, 2021. The terms of the swap agreement are for the Hospital to pay the counterparty a fixed rate of 3.45 percent per annum, payable semiannually, and the Hospital to receive a floating rate of 70.0 percent of one-month LIBOR per annum, payable monthly. In 2011, the effective interest rate received by the Hospital was .2 percent. The fair value of the swap agreement was $(2.6) million at June 30, 2011. In September 2005, the Hospital issued $59.8 million of Variable Rate Demand Hospital Revenue Bonds, Series 2005 (“Series 2005 Bonds”). The bond proceeds were designated to refund a portion of the Series 2000 Bonds. As a result of advanced refunding, the Hospital recognized a deferred loss of $7.3 million which is being amortized to interest expense over the term of the debt. There are no amounts outstanding on the defeased bonds at June 30, 2011. In March 2009, the Hospital refunded $58.1 million of the outstanding Series 2005 bonds with Variable Rate Demand Hospital Revenue Bonds, Series 2009B and transferred the April 2009 principal of $495 thousand into escrow. The refunding of the Series 2005 bonds resulted in the recognition of a deferred loss of $423 thousand. In September 2005, the Hospital entered into an interest rate swap in order to convert the Series 2005 Variable Rate Demand Hospital Revenue Bonds to fixed rates. This swap has been applied to the Series 2009B with the refunding of the Series 2005 Bonds. The notional amount of the swap agreement was $56.8 million at June 30, 2011, which matures on April 1, 2029. The terms of the swap agreement are for the Hospital to pay the counterparty a fixed rate of 3.31 percent per annum, payable monthly, and the Hospital will receive a floating rate of 58.3 percent of one-month LIBOR per annum plus 0.36 percent payable monthly. The effective interest rate received by the Hospital was 0.5 percent in 2011. The fair value of the swap agreement was $(5.2) million at June 30, 2011. In March 2009, insurance on the 2005 swap agreement was removed and the collateral posting provisions of the swap agreement became effective. The collateral amount required is determined based on the fair value of the swap, less the applicable threshold of $7.0 million at the Hospital’s current rating. Collateral valuations are performed daily, based on the official market closing curve. While the counterparty holds the collateral, the funds will earn the overnight Federal Funds interest rate, payable monthly. In May 2008, the Hospital issued $50.4 million of Fixed Rate Bonds, Series 2008A (“Series 2008A Bonds”) through a private placement. The bond proceeds were used to refund $50.0 million of Variable Rate Demand Hospital Revenue Bonds, Series 1997. Principal payments on the Series 2008 A Bonds, ranging from $515 thousand to $5.2 million are due annually in April 2011

State of Wisconsin Notes to The Financial Statements
For the Fiscal Year Ended June 30, 2011
123
through April 2026. Interest is payable semi-annually. In 2011, the effective interest rate was 5.3 percent. In June 2008, the Hospital issued $61.0 million of Variable Rate Demand Revenue Refunding Bonds, Series 2008B (“2008B Bonds”). The bonds proceeds were used to refund $60.0 million of Hospital Revenue Bonds consisting of Short-term Adjustable Rate Securities, Series 2004. In 2011, the effective interest rate was 0.2 percent. In May 2011, the Hospital refunded $61.0 million of the outstanding Series 2008B bonds with Revenue Refunding Bonds, Series 2011B. The refunding of the Series 2008B bonds resulted in the recognition of a deferred loss of $474 thousand. In September 2008, the Hospital entered into an equipment financing agreement with GE Government Finance, Inc., in the amount of $9.3 million. Principal and interest payments are made monthly commencing on November 1, 2008, for seven years. In 2011, the effective interest rate was 4.5 percent. In March 2009, the Hospital issued $57.1 million of Variable Rate Demand Revenue Refunding Bonds, Series 2009A (“Series 2009A Bonds”), secured by an irrevocable transferable direct-pay letter of credit issued by a commercial bank. The bond proceeds were used to refund $55.6 million of Hospital Revenue Bonds consisting of Short-Term Adjustable Rate Securities, Series 2002A. In 2011, the hospital refunded the outstanding $57.1 million of the Series 2009A bonds with Revenue Refunding Bonds, Series 2011A and the balance of the Series 2009A Interest Fund. The refunding of the Series 2009A bonds resulted in the recognition of a deferred loss of $488 thousand. In March 2009, the Hospital issued $59.3 million of Variable Rate Demand Revenue Refunding Bonds, Series 2009B (“Series 2009B Bonds”). The bond proceeds were used to refund $58.1 million of Variable Rate Demand Revenue Refunding Bonds, Series 2005. Principal payments on the Series 2009B Bonds ranging from $1.9 million to $8.2 million, are due annually in April 2011 through April 2029. Series 2009B Bonds bear interest at a weekly rate determined by a remarketing agent. Interest is payable monthly. In 2011, the effective interest rate was 0.2 percent. In June 2009, the Hospital issued $5.3 million of Fixed Rate Hospital Revenue Bonds, Series 2009C (“Series 2009C Bonds”) through a private placement. The bond proceeds were designated to finance qualified capital projects. Principal payments on the Series 2009C Bonds, ranging from $248 thousand to $478 thousand, are due bi-annually beginning in April 2011 through October 2024. Series 2009C Bonds bear interest from June 30, 2009 through October 1, 2012, at the initial fixed rate of 5.07 percent per annum. The interest rate will be reset every three years and is payable bi-annually. In 2011, the effective interest rate was 5.1 percent.
In May 2011, the Hospital issued $56.7 million of Revenue Refunding Bonds, Series 2011A to a commercial bank in the form of a direct bond purchase agreement. The bond proceeds were used to refund $57.1 million of Variable Rate Demand Revenue Bonds, Series 2009A. Principal payments on the Series 2011A bonds, ranging from $500 thousand to $3.9 million, are due annually in April 2013 through April 2032. Series 2011A bonds bear interest at 74 percent of LIBOR, plus1.04 percent payable monthly. In 2011, the effective interest rate was 1.2 percent. In May 2011, the Hospital issued $61.0 million of Revenue Refunding Bonds, Series 2011B to a commercial bank in the form of a direct bond purchase agreement. The bond proceeds were used to refund $61.0 million of Variable Rate Demand Bonds, Series 2008B. Principal payments on the Series 2011B Bonds, ranging from $9.9 million to $15.3 million, are due annually in April 2030 through April 2034. Series 2011B bonds bear interest at 74 percent of LIBOR, plus 1.04 percent, payable monthly. In 2011, the effective interest rate was 1.1 percent. The 2011B bond documents include a material adverse effect clause. The bond documents provide specific details as to what constitutes a material adverse effect and that a material adverse effect could constitute an event of default. The Series 2002 Bonds, Series 2008A Bonds, Series 2009B, Series 2011A and 2011B are collateralized by a security interest in substantially all of the Hospital’s revenue. The borrowing agreements contain various covenants and restrictions, including compliance with the terms and conditions of a Lease Agreement and provisions limiting the amount of additional indebtedness that may be incurred. The Hospital is in compliance with all debt covenants at June 30, 2011, and has not incurred a material adverse effect as defined. The 2009B Bonds with variable interest rates are secured by irrevocable transferable direct-pay letters of credit issued by a commercial bank. The initial letter of credit agreements have stated expiration dates of five (5) years. It does not require any principal payments within the first year of the draw; interest payments are due monthly. Outstanding principal payments under the letter of credit would revert to a term out loan after the first year. Any obligations under the term out loans are repayable in equal quarterly installments based on a four year straight-line amortization commencing on the 367th day after the draw with final payments of the outstanding balances on the earliest to occur of: (a) the date on which the letter of credit is replaced or substituted; (b) five years following the date of the draw preceding such Term Out Loan; (c) the date the bonds are successfully remarketed; or (d) the date on which all amounts due have been accelerated pursuant to the letters of credit. The letter of credit agreements include a material adverse effect clause. The agreements provide specific details as to what constitutes a material adverse effect and that a material adverse effect could constitute an event of default under the letter of credit. At June 30, 2011, there were no amounts outstanding under the letter of credit.

State of Wisconsin Notes to The Financial Statements
For the Fiscal Year Ended June 30, 2011
124
Legislation which had limited the Hospital’s total borrowings, exclusive of amounts payable to the State, to $235.0 million, with limited exceptions, was amended in April 2008. The statute now requires the Hospital to obtain approval of additional bond issuance from its Board of Directors, maintain an unenhanced bond rating in the category of “A” or better from Standard and Poor’s Corporation and Moody’s Investor service, Inc., and notify the State Joint Committee on Finance. The Hospital’s current rating from S&P and Moody’s was A+ and A1, respectively. The Hospital will be exposed to variable rates if the counterparty to the swap defaults or if the swap is terminated. The swap agreements include bilateral additional termination event provisions. Under the provisions, either party has the option, but not the obligation, to terminate the swap transaction if the other party gets downgraded below certain thresholds. The Hospital nor the counterparties have been downgraded below these thresholds at June 30, 2011. The Hospital does not intend to terminate these agreements. The swaps expose the Hospital to basis risk should the relationship between LIBOR and variable rate coverage, changing the synthetic rate on the bonds. As of June 30, 2011, the Hospital was not exposed to credit risk because each of the swaps had a negative fair value. However, should interest rates change and any one of the fair value of the swaps become positive, the Hospital would be exposed to credit risk in the amount of the swap’s fair value. Scheduled principal and interest repayments on all of the Hospital’s long-term debt, including the effect of the swaps based on the effective interest rate, are as follows (in thousands):
Interest Fiscal Year Rate
Ended Principal Interest Swap, Net Total 2012 $ 7,840 $ 4,904 $ 3,181 $ 15,925 2013 8,190 4,617 3,098 15,905 2014 8,562 4,333 2,981 15,876 2015 8,931 4,106 2,777 15,814 2016 8,158 3,872 2,553 14,583 2017-2021 43,082 16,220 8,964 68,266 2022-2026 51,268 9,673 3,905 64,846 2027-2031 62,210 4,384 625 67,219 2032-2034 44,460 1,059 -- 45,519 Deferred loss on retirement of 2000 Bonds
(5,544) -- -- (5,544)
Deferred loss on retirement of 1997 Bonds
(228) -- -- (228)
Deferred loss on retirement
(411) -- -- (411)
of 2004 Bonds Deferred loss on retirement of 2002A Bonds
(578) -- -- (578)
Deferred loss on retirement of 2005 Bonds
(374) -- -- (374)
Deferred loss on retirement of 2008B Bonds
(472) -- -- (472)
Deferred loss on retirement of 2009A Bonds
(486) -- -- (486)
Premium on Bonds
113 -- -- 113
$234,721 $ 53,168 $ 28,083 $ 315,973
The revenue bonds of the Hospital do not constitute debt of the State nor is the State liable on those bonds. Debt service requirements for principal and interest for the Hospital’s revenue bonds at June 30, 2011 are as follows (in thousands):
Fiscal Year Ended Principal Interest 2012 $ 6,199 $ 7,901 2013 6,903 7,601 2014 7,899 7,260 2015 8,654 6,854 2016 8,056 6,410 2017-2021 42,930 25,151 2022-2026 51,233 13,576 2027-2031 62,210 5,010 2032-2034 44,460 1,059 Total 238,544 80,822 Deferred loss on refunding (8,093) -- Premium/Discount 113 -- Total $ 230,564 $ 80,822

State of Wisconsin Notes to The Financial Statements
For the Fiscal Year Ended June 30, 2011
125
University of Wisconsin Foundation Long-term debt of the University of Wisconsin Foundation consists of two notes payable. One of the notes is payable in accreting monthly principal installments with a final balloon payment due February 2015. The note is collateralized by certain investments equal to the outstanding loan balance. The outstanding balance as of December 31, 2010 is $1.7 million. Interest of one-month LIBOR plus 1.25 percent on the entire outstanding principal amount. In addition, the notional amount $1.1 million and amortizing thereafter (representing the “notional amount”) is subject to an interest rate swap, converting the floating interest rate to a fixed rate. Interest on the notional amount of the swap effectively changes the one-month LIBOR plus 1.25 percent floating rate to a fixed rate of 5.24 percent. The fair value of the interest rate swap resulted in an unrealized loss of $6.0 thousand as of December 31, 2009. The interest rate swap matured in February 2010, and the note was amended to have a stated interest rate of 5.18 percent. The second note is payable in five annual installments of $532,731, with a final payment due in January 2014. All payments on the note apply to principal. The balance outstanding as of December 31, 2010 is $2.1 million. Future maturities of long-term debt as of December 31, 2010 are as follows:
Year ended December 31 Total Principal
2011 $ 684,690 2012 692,751 2013 701,240 2014 710,179 2015 1,050,065 Total $ 3,838,925
D. Refundings, Exchanges and Early Extinguishments Refunding Provisions of GASB Statement No. 23 The State implemented the provisions of GASB Statement No. 23. Accounting and Financial Reporting for Refunding of Debt Reported by Proprietary Activities beginning with Fiscal Year 1996. This Statement requires proprietary activities to adopt certain accounting and reporting changes for both current refunding and advance refunding resulting in defeasance of debt. GASB Statement No. 23 permits, but does not require, retroactive application of its provisions. The State has chosen not to apply the provisions retroactively to previously issued financial statements. Current Year Refundings/General Obligation Bonds
In April 2011, the State issued $225.5 million of general obligation refunding notes (2011 series 1), the proceeds of which were used to current refund on May 1, 2011 principal of various general obligation bonds in the amount of $218.1 million and to current refund on May 16, 2011 principal of a general obligation bond in the amount of $7.4 million. In June, 2011, the State issued $275.4 million of general obligation refunding bonds (2011 Series 1), the proceeds of $90.5 million which were deposited in an escrow account to provide for future debt service payments and redemption of $86.2 million of various general obligation bonds outstanding at the time of the refunding, and the proceeds of $225.5 million to fund the notes. As a result of the refunding, the $86.2 million of various general obligation bonds for the escrow account provides for future debt service payments and redemption are considered defeased and the associated liability removed from the financial statements. The overall refunding resulted in an increase in total debt service payments by $21.7 million and an economic gain of $12.4 million. Prior Year Refundings/General Obligation Bonds Government Accounting Standards Board Statement No. 7 Advance Refundings Resulting in Defeasance of Debt, provides that refunded debt and assets placed in escrow for the payment of related debt service be excluded from the financial statements. At June 30, 2011, approximately $551.3 million of general obligation bond principal have been defeased. Prior Year Refundings/Revenue Bonds For financial reporting purposes, the following primary government revenue bonds have been defeased, and therefore, removed as a liability from the balance sheet: • Environmental Improvement Fund revenue bonds – At
June 30, 2011, revenue bonds outstanding of $260.8 million have been defeased.

State of Wisconsin Notes to The Financial Statements
For the Fiscal Year Ended June 30, 2011
126
• Transportation revenue bonds – At June 30, 2011, revenue
bonds outstanding of $310.6 million have been defeased. Prior Year Refundings/Component Units Badger Tobacco Asset Securitization Corporation In April, 2009, the Badger Tobacco Asset Securitization Corporation’s (BTASC) deposited securities in an irrevocable trust with an escrow agent to provide for all future debt service payments on the BTASC bonds. As a result, the $1.1 billion of BTASC bonds are considered to be legally defeased and the liability for those bonds has been removed from the financial statements. Any gain or loss on the refunding has not been determined as the future cash flows of the old debt are not estimable due to the uncertainty of future Tobacco Settlement Revenues (TSRs). Wisconsin Housing and Economic Development Authority In 1990 the Wisconsin Housing and Economic Development Authority (the Authority) defeased $48.4 million of Insured Mortgage Revenue Bonds, as of June 30, 2011, the remaining outstanding defeased debt is $18.4 million. Early Extinguishments/Redemptions Component Units Wisconsin Housing and Economic Development Authority During 2011, the Wisconsin Housing and Economic Development Authority (the Authority) redeemed early various outstanding bonds according to the redemption provisions in the bond resolutions. None of these redemptions resulted in extraordinary losses due to the write-off of remaining unamortized deferred debt financing costs. A summary of these early redemptions follows (in thousands):
Redemptions Bond Issue 2011
Home Ownership Revenue Bond Resolutions: 1987 $ 143,315 1988 199,470 All Other 5,590 Home Ownership Mortgage Revenue 60,000 Housing Revenue Bonds 27,350 Multifamily Housing Bonds 200 General Fund 560
E. Short-term Financing The State of Wisconsin Building Commission, an agency of the State, is empowered by law to consider, authorize, issue, and sell debt obligations of the State. To date, the Commission has authorized the issuance of notes. When this short-term debt does not meet long-term financing criteria, it is classified among fund liabilities. General Obligation Commercial Paper Notes The State has authorized General Obligation Commercial Paper Notes for the acquisition, construction, development, extension, enlargement, or improvement of land, waters, property, highway, buildings, equipment or facilities. Periodically, additional commercial paper notes are issued to pay for maturing commercial paper notes. The State intends to make annual May 1 payments on the outstanding commercial paper notes that reflect principal amortization of the notes. The State also intends to make regular deposits to the issuing and paying agent that will be used to pay interest due on maturing notes. At June 30, 2011, the amount of general obligation commercial paper notes outstanding was $188.1 million which had interest rates ranging from .17 percent to .31 percent and maturities ranging from July 7, 2011 to September 7, 2011. Short-term debt activity for the year ended June 30, 2011 for the general obligation commercial paper notes was as follows (in millions):
Balance Balance July 1, 2010 Additions Reductions June 30, 2011
$ 193.5 $ -- $ 5.4 $ 188.1

State of Wisconsin Notes to The Financial Statements
For the Fiscal Year Ended June 30, 2011
127
General Obligation Extendible Municipal Commercial Paper The State has authorized general obligation extendible municipal commercial paper for the acquisition, construction, development, extension, enlargement, or improvement of land, waters, property, highway, buildings, equipment or facilities. Periodically, additional extendible municipal commercial papers are issued to pay for maturing extendible municipal commercial paper. The State intends to make annual May 1 payments on the outstanding extendible commercial paper that reflect principal amortization of the paper. The State also intends to make regular deposits to the issuing and paying agent that will be used to pay interest due on maturing notes. At June 30, 2011, the amount of the general obligation extendible municipal commercial paper outstanding was $404.6 million which had interest rates ranging from .26 percent to .37 percent and maturities ranging from July 15, 2011, to October 3, 2011. Short-term debt activity for the year ended June 30, 2011 for the general obligation extendible municipal commercial paper was as follows (in millions):
Balance Balance July 1, 2010 Additions Reductions June 30, 2011
$ 413.6 $ -- $ 9.0 $ 404.6
Petroleum Inspection Fee Revenue Extendible Municipal Commercial Paper The State has authorized petroleum inspection fee revenue extendible municipal commercial paper to pay the costs of claims under the Petroleum Environmental Cleanup Fund Award (PECFA) Program. Periodically, additional extendible municipal commercial paper is issued to pay for maturing paper. The State may periodically deposit money into the Junior Subordinate Principal Account, which represents principal payments to be made on the extendible municipal commercial paper. The State also intends to make regular deposits to the issuing and paying agent that will be used to pay interest due on maturing paper. At June 30, 2011, the amount of petroleum inspection fee revenue extendible commercial paper outstanding was $71.2 million which had interest rates ranging from .26 percent to .40 percent and maturities ranging from July 11, 2011 to September 7, 2011.
Short-term debt activity for the year ended June 30, 2011 for the petroleum inspection fee revenue extendible municipal commercial paper was as follows (in millions):
Balance Balance July 1, 2010 Additions Reductions June 30, 2011
$ 71.2 $ -- $ -- $ 71.2
Transportation Revenue Commercial Paper Notes The State authorized transportation revenue commercial paper notes to pay the costs of major highway projects and certain State transportation facilities. Periodically, additional commercial paper notes are issued to pay for maturing commercial paper notes. The State intends to make annual July 1 payments on the commercial paper notes that reflect principal amortization of the notes. The State also intends to make regular deposits to the issuing and paying agent that will be used to pay interest due on maturing notes. At June 30, 2011, the amount of transportation revenue commercial paper notes outstanding was $146.6 million which had interest rates ranging from .31 percent to .32 percent and maturities ranging from August 17, 2011 to October 6, 2011. Short-term debt activity for the year ended June 30, 2011 for the transportation revenue commercial paper notes was as follows (in millions):
Balance Balance July 1, 2010 Additions Reductions June 30, 2011
$ 162.5 $ -- $ 15.9 $ 146.6

State of Wisconsin Notes to The Financial Statements
For the Fiscal Year Ended June 30, 2011
128
F. Certificates of Participation The State established a facility in 1992 that provides lease purchase financing for property and certain service items acquired by State agencies. This facility is the Third Amended and Restated Master Lease 1992-1. Pursuant to the terms and conditions of this agreement, the trustee for the facility issues parity Master Lease certificates of participation that evidence proportionate interest of the owners thereof in lease payments. A common pool of collateral ratably secures all Master Lease certificates. Title in the property and service items purchased under the facility remains with the State and the State grants to the Trustee, for the benefit of all Master Lease certificate holders, a first security interest in the leased items. At June 30, 2011, the following parity Master Lease certificates were outstanding: • Master Lease Certificates of Participation of 2006, Series A,
in the amount of $23.4 million. This series of Master Lease certificates has interest rates ranging from 4.0 percent to 5.0 percent and matures semi-annually through September 1, 2016.
• Master Lease Certificates of Participation of 2010, Series A
(Revolving Credit Agreement – Taxable) in the amount of $23.8 million. This Master Lease certificate evidences the State's obligation to repay advances under a Revolving Credit Agreement, dated June 22, 2007, as amended between U.S. Bank National Association (as trustee), the State of Wisconsin, acting by and through its Department of Administration, as lessee, and Dexia Credit Local. The scheduled termination date under the Revolving Credit Agreement, as amended, is September 1, 2013. This Master Lease certificate shall bear interest at the rates and mature on the dates provided for in the Revolving Credit Agreement. The balance of this Master Lease certificate may include some accrued interest that will be payable at the next semi-annual interest payment date.
• Master Lease Certificates of Participation of 2007, Series B
and Master Lease Certificates of Participation of 2008 Series A (Revolving Credit Agreement-Tax Exempt) in the amount of $6.2 million. These Master Lease certificates of participation evidence the State’s obligation to repay certain advances under a Revolving Credit Agreement, dated June 22, 2007, as amended between U.S. Bank National Association, as trustee, the State of Wisconsin, acting by and through its Department of Administration, as lessee, and Dexia Credit Local, as amended. The scheduled termination date under the revolving credit agreement is September 1, 2013. This master lease certificates of participation shall bear interest at the rates and mature on the dates provided for in the Revolving Credit Agreement.
• Master Lease Certificates of Participation of 2010, Series B, in the amount of $18.6 million. This series of Master Lease certificates has interest rates ranging from 2.0 percent to 4.0 percent and matures semi-annually through September 1, 2017.
The Third Amended and Restated Master Lease 1992-1 provides that certain lease schedules to the facility can be terminated if the State deposits with the Trustee an amount that is equal to the outstanding amount of the lease schedule, or in amounts that are sufficient to purchase investments that mature on dates and in amounts to make the lease payments when due. At June 30, 2011, the State has not deposited with the Trustee amounts, that when invested, will terminate lease schedules. G. Arbitrage Rebate The Tax Reform Act of 1986 requires that governmental entities issuing tax-exempt debt subsequent to August 1986, calculate and rebate arbitrage earnings to the federal government. Specifically, the excess of the aggregated amount earned on investments purchased with bond proceeds over the amount that would have been earned if the proceeds were invested at a rate equal to the bond yield, is to be rebated to the federal government. As of June 30, 2011, a liability for arbitrage rebate did not exist. H. Moral Obligation Debt Through legislation enacted in 1999, the State authorized the creation of local districts. These districts (Wisconsin Center District, Southeast Wisconsin Professional Baseball Park District, and the Green Bay/Brown County Professional Football Stadium District) are authorized to issue bonds for their respective purpose, and if the State determines that certain conditions are satisfied, the State may have a moral obligation to appropriate moneys to make up deficiencies in the districts' special debt service reserve funds. To date, the Wisconsin Center District has the authority to issue up to $200.0 million and has issued $125.8 million of bonds that are subject to the moral obligation. The two other local districts each have authority to issue $160.0 million of revenue obligations that, subject to the Secretary of Administration’s determination that certain conditions have been met, could carry a moral obligation of the State. All of the districts have issued revenue obligations that do not carry the moral obligation of the State. Through legislation enacted in 1999, the State authorized the issuance of up to $170.0 million principal amount of bonds to finance the development or redevelopment of sites and facilities to be used for public schools. If certain conditions are satisfied, and if a special debt service reserve fund is created for the bonds, the State will provide a moral obligation pledge, which would restore the special debt reserve fund established for the bonds to an amount not to exceed the maximum annual debt service on the bonds. Three bond issues with an aggregate outstanding balance

State of Wisconsin Notes to The Financial Statements
For the Fiscal Year Ended June 30, 2011
129
of $96.6 million have been issued that have a special debt service reserve fund secured by the State’s moral obligation.
I. Credit Agreements Primary Government The State has, as part of the working bank contract, a letter of credit agreement with the US Bank National Association under which the Bank has agreed to provide to the State an open line of credit in the amount of $50.0 million. The agreement provides for advances in anticipation of bond issuance proceeds. As of June 30, 2011, $50.0 million was unused and available. The State has entered into a credit agreement to provide a line of credit for liquidity support for up to $233.0 million of general obligation commercial paper notes. The line of credit expires in March, 2013, but is subject to renewal as provided for in the credit agreement. The cost of this line of credit is 0.095 percent per year. Also, the State has entered into a credit agreement to provide a line of credit for liquidity support for its transportation revenue commercial paper program. The amount of the line of credit is $207.0 million. This line of credit expires in April, 2013, but is subject to termination and renewal as provided for in the credit agreement. The cost of this line of credit is 0.100 percent per year.
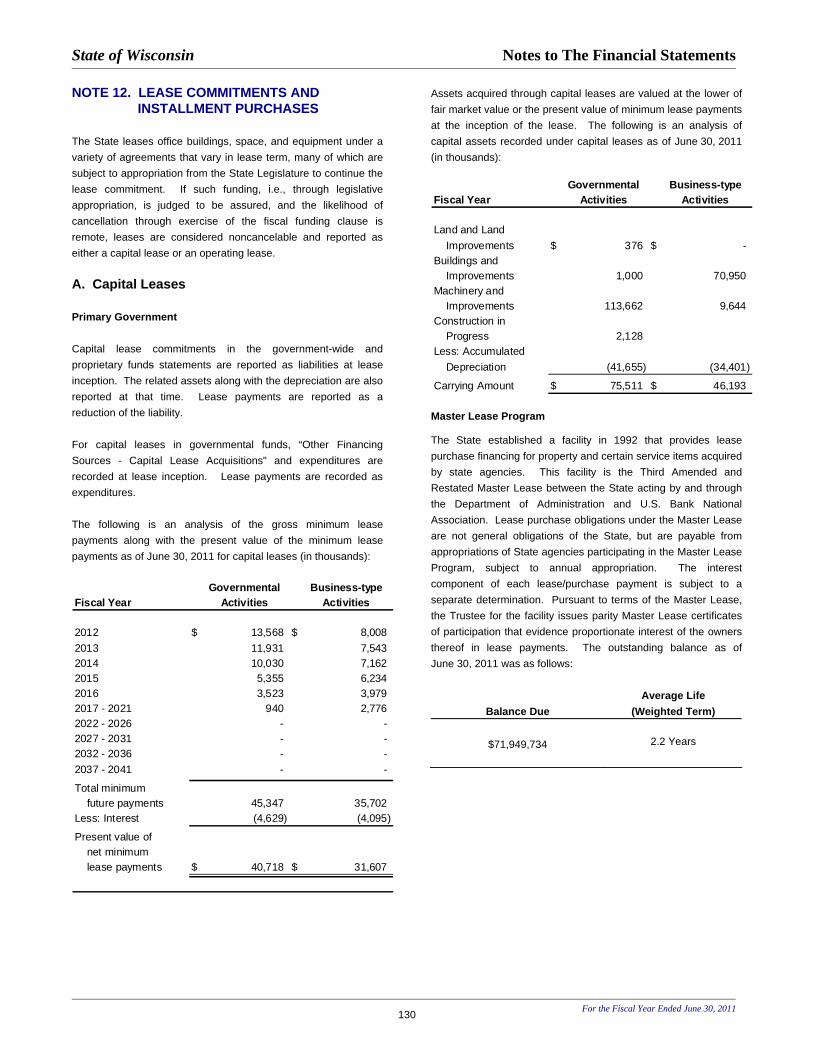
State of Wisconsin Notes to The Financial Statements
NOTE 12. LEASE COMMITMENTS AND INSTALLMENT PURCHASES
The State leases office buildings, space, and equipment under a variety of agreements that vary in lease term, many of which are subject to appropriation from the State Legislature to continue the lease commitment. If such funding, i.e., through legislative appropriation, is judged to be assured, and the likelihood of cancellation through exercise of the fiscal funding clause is remote, leases are considered noncancelable and reported as either a capital lease or an operating lease. A. Capital Leases
Primary Government Capital lease commitments in the government-wide and proprietary funds statements are reported as liabilities at lease inception. The related assets along with the depreciation are also reported at that time. Lease payments are reported as a reduction of the liability. For capital leases in governmental funds, “Other Financing Sources - Capital Lease Acquisitions" and expenditures are recorded at lease inception. Lease payments are recorded as expenditures. The following is an analysis of the gross minimum lease payments along with the present value of the minimum lease payments as of June 30, 2011 for capital leases (in thousands):
Governmental Business-typeFiscal Year Activities Activities
2012 $ 13,568 $ 8,008 2013 11,931 7,543 2014 10,030 7,162 2015 5,355 6,234 2016 3,523 3,979 2017 - 2021 940 2,776 2022 - 2026 - - 2027 - 2031 - - 2032 - 2036 - - 2037 - 2041 - -
Total minimum future payments 45,347 35,702 Less: Interest (4,629) (4,095)
Present value of net minimum lease payments $ 40,718 $ 31,607
For the Fiscal Year Ended June 30, 2011 130
Assets acquired through capital leases are valued at the lower of fair market value or the present value of minimum lease payments at the inception of the lease. The following is an analysis of capital assets recorded under capital leases as of June 30, 2011 (in thousands):
Governmental Business-typeFiscal Year Activities Activities
Land and Land Improvements $ 376 $ - Buildings and Improvements 1,000 70,950 Machinery and Improvements 113,662 9,644 Construction in Progress 2,128 Less: Accumulated Depreciation (41,655) (34,401)
Carrying Amount $ 75,511 $ 46,193 M
aster Lease Program
The State established a facility in 1992 that provides lease purchase financing for property and certain service items acquired by state agencies. This facility is the Third Amended and Restated Master Lease between the State acting by and through the Department of Administration and U.S. Bank National Association. Lease purchase obligations under the Master Lease are not general obligations of the State, but are payable from appropriations of State agencies participating in the Master Lease Program, subject to annual appropriation. The interest component of each lease/purchase payment is subject to a separate determination. Pursuant to terms of the Master Lease, the Trustee for the facility issues parity Master Lease certificates of participation that evidence proportionate interest of the owners thereof in lease payments. The outstanding balance as of June 30, 2011 was as follows:
Average Life Balance Due (Weighted Term)
$71,949,734 2.2 Years

State of Wisconsin Notes to The Financial Statements
Component Unit The following is an analysis of the future minimum rental payments due under operating leases (in thousands):
University of Wisconsin Hospital and Clinics Authority
Govern- Business- Com-Fiscal mental type Fiduciary ponentYear Activities Activities Funds Units
2012 $ 46,100 $ 25,705 $ 63 $ 9,705 2013 36,799 17,113 16 4,901 2014 31,347 15,821 5 2,711 2015 25,671 13,795 - 1,593 2016 21,058 11,538 - 1,264 2017 - 2021 39,801 52,820 - 3,251 2022 - 2026 6,178 39,150 - - 2027 - 2031 444 36,057 - - 2032 - 2036 381 6,851 - - 2037 - 2041 392 - - - 2042 - 2046 428 - - - 2047 - 2051 265 - - - Thereafter 238 - - -
Minimum lease payments $ 209,102 $ 218,849 $ 85 $ 23,426
Under the terms of a lease agreement, the University of Wisconsin Hospitals and Clinics Authority (the Hospital) leases facilities which were occupied by the Hospital as of June, 1996 (see Note 1B to the financial statements). The initial term of the lease is 30 years to be renewed annually with automatic extensions of one additional year on each July 1 until action is taken to stop the extensions. Included in the consideration for the lease is an amount equal to the debt service during the term of the lease agreement on all outstanding bonds issued by the State for the purpose of financing the acquisition, construction or improvement of the leased facilities. The balance at June 30, 2011 for amounts related to this agreement was $4.2 million.
B. Operating Leases Operating leases, those leases not recorded as capital leases as required by FASB Statement No. 13, are not recorded in the statement of net assets. These leases contain various renewal options, the effect of which are reflected in the minimum lease payments only if it is considered that the option will be exercised. Certain other operating leases contain escalation clauses and contingent rentals which are not included in the calculation of the future minimum lease payments. The State has adopted the operating lease scheduled rent increase provisions of FASB Statement No. 13. Operating lease expenditures/expenses are recognized as incurred or paid over the lease term.
C. Installment Purchases The State has entered into installment purchase agreements. The following is an analysis of the gross minimum installment payments, along with the present value of the minimum installment payments, as of June 30, 2011 for installment purchases (in thousands):
Governmental Fiscal Year Activities
2012 $ 158 2013 115
Total minimum future payments 273 Less: Interest (8)
Present value of net minimum installment payments $ 265
Governmental and business-type activities and fiduciary funds rental expenses under operating leases for Fiscal Year 2011 were $78.7 million. Of this amount, $78.2 million relates to minimum rental payments stipulated in lease agreements, $493 thousand relates to contingent rentals, and $164 thousand relates to sublease rental payments received. Component unit rental expenses under operating leases were $16.5 million, of which $16.5 million relates to minimum rental payments stipulated in lease agreements.
For the Fiscal Year Ended June 30, 2011 131
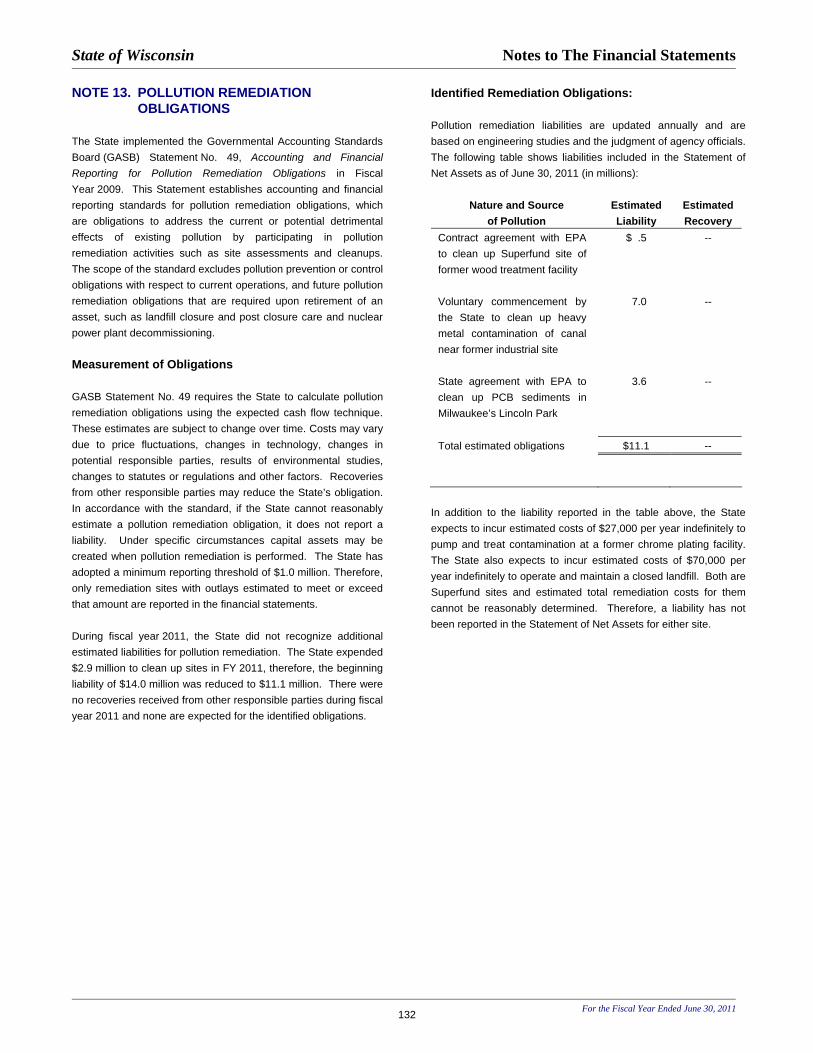
State of Wisconsin Notes to The Financial Statements
For the Fiscal Year Ended June 30, 2011 132
NOTE 13. POLLUTION REMEDIATION OBLIGATIONS The State implemented the Governmental Accounting Standards Board (GASB) Statement No. 49, Accounting and Financial Reporting for Pollution Remediation Obligations in Fiscal Year 2009. This Statement establishes accounting and financial reporting standards for pollution remediation obligations, which are obligations to address the current or potential detrimental effects of existing pollution by participating in pollution remediation activities such as site assessments and cleanups. The scope of the standard excludes pollution prevention or control obligations with respect to current operations, and future pollution remediation obligations that are required upon retirement of an asset, such as landfill closure and post closure care and nuclear power plant decommissioning. Measurement of Obligations GASB Statement No. 49 requires the State to calculate pollution remediation obligations using the expected cash flow technique. These estimates are subject to change over time. Costs may vary due to price fluctuations, changes in technology, changes in potential responsible parties, results of environmental studies, changes to statutes or regulations and other factors. Recoveries from other responsible parties may reduce the State’s obligation. In accordance with the standard, if the State cannot reasonably estimate a pollution remediation obligation, it does not report a liability. Under specific circumstances capital assets may be created when pollution remediation is performed. The State has adopted a minimum reporting threshold of $1.0 million. Therefore, only remediation sites with outlays estimated to meet or exceed that amount are reported in the financial statements. During fiscal year 2011, the State did not recognize additional estimated liabilities for pollution remediation. The State expended $2.9 million to clean up sites in FY 2011, therefore, the beginning liability of $14.0 million was reduced to $11.1 million. There were no recoveries received from other responsible parties during fiscal year 2011 and none are expected for the identified obligations.
Identified Remediation Obligations: Pollution remediation liabilities are updated annually and are based on engineering studies and the judgment of agency officials. The following table shows liabilities included in the Statement of Net Assets as of June 30, 2011 (in millions):
Nature and Source of Pollution
Estimated Liability
Estimated Recovery
Contract agreement with EPA to clean up Superfund site of former wood treatment facility
$ .5 --
Voluntary commencement by the State to clean up heavy metal contamination of canal near former industrial site
7.0 --
State agreement with EPA to clean up PCB sediments in Milwaukee’s Lincoln Park
3.6 --
Total estimated obligations $11.1 --
In addition to the liability reported in the table above, the State expects to incur estimated costs of $27,000 per year indefinitely to pump and treat contamination at a former chrome plating facility. The State also expects to incur estimated costs of $70,000 per year indefinitely to operate and maintain a closed landfill. Both are Superfund sites and estimated total remediation costs for them cannot be reasonably determined. Therefore, a liability has not been reported in the Statement of Net Assets for either site.

State of Wisconsin Notes to The Financial Statements
For the Fiscal Year Ended June 30, 2011 133
NOTE 14. RETIREMENT PLAN The Wisconsin Retirement System (WRS) was established and is administered by the State of Wisconsin to provide pension benefits for State and local government public employees. The WRS consists of the Core Retirement Investment Trust, the Variable Retirement Investment Trust, and the Police and Firefighters Trust. Although separated for accounting purposes, the assets of these trust funds can be used to pay benefits for any member of the WRS, and are reported as one pension plan. The WRS is considered part of the State of Wisconsin’s financial reporting entity. Copies of the separately issued financial report that includes financial statements and required supplementary information for the year ending December 31, 2010, is available at www.etf.wi.gov or may be obtained upon request from: Department of Employee Trust Funds 801 West Badger Road P.O. Box 7931 Madison, WI 53707-7931. Plan Description The WRS, governed by Chapter 40 of the Wisconsin Statutes, is a cost-sharing multiple-employer defined benefit pension plan. It provides coverage to all eligible State of Wisconsin, local government and other public employees. Any employee of a participating employer who is expected to work at least 600 hours per year (440 hours per year for teachers) for at least one year must be covered by the WRS. As of December 31, 2010, the number of participating employers was:
State Agencies 59Cities 152Counties 714th Class Cities 36Villages 258Towns 233School Districts 426Wisconsin Technical College System Board Districts 16Cooperative Educational Service Agencies 12Other 211 Total Employers 1,474
For employees beginning participation on or after January 1, 1990 and no longer actively employed on or after April 24, 1998, creditable service in each of five years is required for eligibility for a retirement annuity. Participants employed prior to 1990 and on or after April 24, 1998 are immediately vested. Employees who retire at or after age 65 (55 for protective occupation employees, 62 for elected officials and State executive participants) are entitled to receive an unreduced retirement benefit. The factors
influencing the benefit are: (1) final average earnings, (2) years of creditable service, and (3) a formula factor. Final average earnings is the average of the participant's three highest years' earnings. Creditable service is the creditable current and prior service expressed in years or decimal equivalents of partial years for which a participant receives earnings and makes contributions as required. The formula factor is a standard percentage based on employment category. Employees may retire at age 55 (50 for protective occupation employees) and receive reduced benefits. Employees terminating covered employment before becoming eligible for a retirement benefit may withdraw their contributions and forfeit all rights to any subsequent benefits. The WRS also provides death and disability benefits for employees. Accounting Policies and Plan Asset Matters The financial statements of the WRS have been prepared in accordance with generally accepted accounting principles, using the flow of economic resources measurement focus and a full accrual basis of accounting. Under the accrual basis of accounting, revenues are recorded when earned and expenses are recorded at the time the liabilities are incurred. Plan member contributions are recognized in the period in which contributions are due. Employer contributions to the plan are recognized when due and the employer has made a formal commitment to provide contributions. Benefits and refunds are recognized when due and payable in accordance with the terms of the plan. All assets of the WRS are invested by the State of Wisconsin Investment Board. The retirement fund assets consist of shares in the Variable Retirement Investment Trust and the Core Retirement Investment Trust. The Variable Retirement Investment Trust consists primarily of equity securities. The Core Retirement Investment Trust is a balanced investment fund made up of fixed income securities and equity securities. Shares in the Core Retirement Investment Trust are purchased as funds are made available from retirement contributions and investment income, and sold when funds for benefit payments and other expenses are needed. The assets of the Core and Variable Retirement Investment Trusts are carried at fair value with all market value adjustments recognized in current operations. Investments are revalued monthly to current market value. The resulting valuation gains or losses are recognized as income, although revenue has not been realized through a market-place transaction.

State of Wisconsin Notes to The Financial Statements
For the Fiscal Year Ended June 30, 2011 134
The WRS does not have any investments (other than those issued or guaranteed by the U.S. Government) in any one organization that represent 5.0 percent or more of plan net assets. State Contributions Required and Contributions Made Covered State employees in the General/Teacher category are required by statute to contribute 5.0 percent of their salary (3.9 percent for Executives and Elected Officials, 5.8 percent for Protective Occupations with Social Security, and 4.8 percent for Protective Occupations without Social Security) to the plan as of June 30, 2011. Employers may make these contributions to the plan on behalf of employees. Employers are required to contribute an actuarially determined amount necessary to fund the remaining projected cost of future benefits. State contributions made for the years ended December 31, 2010, 2009, and 2008 were as follows (in millions):
2010 2009 2008 Employer current service $ 207.8 $ 192.5 $ 196.2 Percent of payroll 5.3% 5.0% 5.1% Employer prior service $ 3.3 $ 3.2 $ 3.1 Percent of payroll 0.1% 0.1% 0.1% Employee required $ 196.4 $ 191.1 $ 191.2 Percent of payroll 5.0% 5.0% 5.0% Benefit adjustment contributions $ 40.6 $ 30.0 $ 33.2 Percent of payroll 1.0% 0.8% 0.9% Percent of Required Contributions 100% 100% 100% The WRS uses the “Entry Age Normal with Frozen Initial Liability” actuarial method in establishing employer contribution rates. Under this method, the unfunded actuarial accrued liability (UAAL) is generally affected only by the monthly amortization payments, compound interest, the added liability created by new employer units, and any liabilities caused by changes in benefit provisions. The UAAL is being amortized over a 40 year period beginning January 1, 1990 for employers in the WRS prior to 2009. Liabilities for employers joining the WRS effective April 5, 2008, are amortized over 30 years. However, periodically, the Employee Trust Funds Board has reviewed and, when appropriate, adjusted the actuarial assumptions used to determine this liability. Changes in the assumptions may affect the UAAL, and the resulting actuarial gains or losses are credited or charged to employers’ unfunded liability accounts. All actuarial gains or losses arising from the difference between actual and assumed experience are reflected in the determination of the normal cost.
As of June 30, 2011 and 2010, the WRS’s unfunded actuarial accrued liability was $0.1 billion and $0.2 billion, respectively. These amounts are presented as Prior Service Contributions Receivable on the financial statements. New prior service liabilities resulting from employers entering the WRS or increasing their prior service coverage are recognized as contributions in the year service is granted and are added to the Prior Service Contributions Receivable. Employer contributions for prior service reduce the receivable. The receivable is increased as of calendar year end with interest at the assumed interest rate of 7.2 percent. NOTE 15. MILWAUKEE RETIREMENT SYSTEM The Milwaukee Retirement System (MRS) is reported as an Investment Trust Fund. MRS participants provide assets to the State of Wisconsin, Department of Employee Trust Funds (DETF) for investing in its Core Retirement Investment Trust (CRIT) and the Variable Retirement Investment Trust (VRIT), funds of the Wisconsin Retirement System (WRS). Participation of the MRS in the CRIT and VRIT is described in the DETF Administrative Code, Chapter 10.12. The State of Wisconsin Investment Board (SWIB) manages the CRIT and VRIT with oversight by a Board of Trustees as authorized in Wis. Stat. 25.14 and 25.17. SWIB is not registered with the Securities and Exchange Commission as an investment company. The investments of the CRIT and VRIT consist of a highly diversified portfolio of securities. Wis. Stat. 25.17(3)(a) allows investments in loans, securities and any other investments as authorized by Wis. Stat. 620.22. Permitted classes of investments include bonds of governmental units or of private corporations, loans secured by mortgages, preferred or common stock, real property and other investments not specifically prohibited by statute. Investments are revalued monthly to fair value, with unrealized gains and losses reflected in income. Monthly, the DETF distributes a pro-rata share of the total CRIT and VRIT earnings less administrative expenses to the MRS accounts. The MRS accounts are adjusted to fair value and gains/losses are recorded directly in the accounts per DETF Administrative Code, Chapter 10.12(2). Neither State statute, a legal provision nor a legally binding guarantee exists to support the value of shares. Copies of the separately issued financial report that includes financial statements along with the accompanying footnote disclosures and supplementary information for the CRIT and the VRIT is available at www.swib.state.wi.us or may be obtained upon request from: State of Wisconsin Investment Board P.O. Box 7842 Madison, Wisconsin 53707-7842

State of Wisconsin Notes to The Financial Statements
For the Fiscal Year Ended June 30, 2011 135
NOTE 16. POSTEMPLOYMENT BENEFITS – STATE HEALTH INSURANCE PROGRAM
Effective Fiscal Year 2008, the State implemented the Governmental Accounting Standards Board (GASB) Statement No. 45, Accounting and Financial Reporting by Employers for Postemployment Benefits Other Than Pensions. This Statement establishes standards for the measurement, recognition, and display of other postemployment benefit expense/expenditures and related liabilities (assets), note disclosures, and, if applicable, required supplementary information in financial reports of state and local governmental employers. Plan Description The State’s Health Insurance Program, a cost-sharing multiple employer, defined benefit plan, is an employer-sponsored program (not administered as a trust) offering group medical coverage to eligible employees and retirees of State and participating local government employers. Created under Chapter 40, of the Wisconsin Statutes, the State Department of Employee Trust Funds and the Group Insurance Board have program administration and oversight responsibilities under Wis. Stat. Sections 15.165(2) and 40.03(6). As of January 2009 (most recent actuarial valuation date), there were 54,598 active, and 20,592 retirees and beneficiaries participating in the plan. Under this plan, retired employees of the State are allowed to pay the same healthcare premium as active employees, creating an implicit rate subsidy for retirees. This implicit rate subsidy, which is calculated to cover pre-age 65 retirees (since at age 65 retirees are required to enroll in Medicare when eligible), is treated as an other postemployment benefit (OPEB). The Department of Employee Trust Funds issues a publicly available financial report. That report is available at www.etf.wi.gov or may be obtained upon request from: The Department of Employee Trust Funds 801 West Badger Road P.O. Box 7931 Madison, Wisconsin 53707-7931 Funding Policy The health insurance plan is currently funded on a “pay-as-you-go” basis. GASB Statement No. 45 does not require funding of the OPEB expense and the State does not currently intend to prefund the OPEB obligation. Under this plan, retirees contribute premiums directly to the plan either through “out-of-pocket” or from unused accumulated sick leave conversion credits. The value of the sick leave benefit is defined as compensated absences and reported under the provisions of GASB Statement No. 16, Accounting for Compensated Absences.
Contribution requirements are established and may be amended by the Group Insurance Board. For retirees that participate in the health insurance plan, premiums, for non-Medicare retirees, are based on an effective rate structure for the health care service provider selected. Rates range from $584.20 to $1,147.60 for single coverage and $1,456.70 to $2,865.60 for family coverage. The annual required contribution of the employer (ARC) is an amount actuarially determined in accordance with the parameters of GASB Statement No. 45. The ARC represents a level of funding that, if paid on an ongoing basis, is projected to cover normal cost each year and amortize any unfunded actuarial liabilities (or funding excess) over a period not to exceed thirty years. At June 30, 2011, the ARC was $136.9 million while the employer contributions were $52.8 million, and the ARC adjustment, with interest, was $20.1 million. Annual OPEB Cost The State’s annual OPEB cost, the percentage of annual OPEB costs contributed to the plan, and the net OPEB obligation were as follows (in thousands):
Fiscal Year
Annual OPEB Cost
Employer Contributions
Percentage ofAnnual OPEB
Cost Contributed
Net
OPEB Obligation
2011 $128,437 $52,826 41.1% $367,486 2010 124,294 46,487 37.4 291,875 2009 158,699 48,795 30.8 214,068 2008 148,497 44,333 29.9 104,164 Interest on the net OPEB obligation was $11.7 million while the net OPEB obligation increased $75.6 million. Funded Status and Funding Progress The funded status of the plan as of January 1, 2009 (most recent actuarial valuation date) was as follows (in thousands): Actuarial accrued liability (AAL) $1,329,526 Actuarial value of plan assets 0 Unfunded actuarial accrued liability (UAAL) $1,329,526
Funded ratio (actuarial value of plan assets/AAL) 0.0% Covered payroll (active plan members) $3,053,972 UAAL as a percentage of covered payroll 43.5% The actuarial accrued liability calculation considers the retiree drug subsidy (RDS) provisions of Medicare Part D as a separate

State of Wisconsin Notes to The Financial Statements
For the Fiscal Year Ended June 30, 2011 136
transaction. Therefore, the actuarial accrued liability, the annual required contribution of the employer (ARC), and the annual OPEB costs are determined without reduction of RDS payments. At January 1, 2009, (most recent actuarial valuation date) the Medicare part D portion included in the actuarial accrued liability is $497.4 million. Actuarial valuations of an ongoing plan involve estimates of the value of reported amounts and assumptions about the probability of occurrence of events far into the future. Examples include assumptions about future employment, mortality, and the healthcare cost trend. Amounts determined regarding the funded status of the plan and the annual required contributions of the employer are subject to continual revision as actual results are compared with past expectations and new estimates are made about the future. Actuarial Methods and Assumptions Projections of benefits for financial reporting purposes are based on the substantive plan (the plan as understood by the employer and plan members) and include the types of benefits provided at the time of each valuation and the historical pattern of sharing of benefit costs between the employer and plan members to that point. The actuarial methods and assumptions used include techniques that are designed to reduce short-term volatility in actuarial accrued liabilities and the actuarial value of assets, consistent with the long-term perspective of the calculations. In the January 1, 2009 actuarial valuation, the entry age normal actuarial cost method was used. Actuarial assumptions included a discount rate of 4.0 percent, determined using an underlying assumption of 3.0 percent for inflation plus 1.0 percent for high quality investments with durations of one year or less, and a 4.1 percent assumed annual payroll growth. The projected annual healthcare cost trend rate is 9.07 percent initially, reduced by decrements to an ultimate rate of 5.0 percent. Other assumptions used, such as mortality, disability and retirement rates for active members, are consistent with an actuarial valuation on the Wisconsin Retirement Plan dated December 31, 2008. In addition, a 30 year, level percent of pay, closed amortization period was used for the initial UAAL, while a 15 year, level percent of pay, closed amortization period was used for any future gains and losses. Currently, the health insurance plan is not funded by assets held in a separate trust. The discount rate (discussed above) was based on the State’s general assets not earmarked for certain uses, such as building funds. The State’s general assets are held in short-term fixed income investments. Therefore, the discount rate reflects that type of investment policy. A Schedule of Funding Progress, presented as required supplementary information following the notes to the financial statements, is designed to present multiyear trend information
about whether the actuarial value of plan assets is increasing or decreasing over time relative to the actuarial accrued liability for benefits.

State of Wisconsin Notes to The Financial Statements
For the Fiscal Year Ended June 30, 2011 137
NOTE 17. OTHER POSTEMPLOYMENT BENEFIT (OPEB) PLANS
The State of Wisconsin, Department of Employee Trust Funds (DETF), administers three postemployment benefit plans other than pension plans – the State Retiree Health Insurance Fund, the Duty Disability Fund, and the Retiree Life Insurance Fund. Plan Descriptions State Retiree Health Insurance Fund The State Retiree Health Insurance Fund is a multiple-employer defined benefit OPEB plan offering group health insurance. Disclosures relating to the plan are provided in Note 16 – Postemployment Benefits of the State Other Than Pensions – Health Insurance Program. Duty Disability Fund The Duty Disability Fund is a cost-sharing multiple-employer defined benefit OPEB plan. The plan offers special disability insurance for state and local participants in protective occupations. The plan is self-insured, and risk is shared between the State and local government employers in the plan. The plan is administered under Wis. Stat. Section 40.65. The plan is reported as a pension and other employee benefit trust fund. Contributions are actuarially determined in accordance with Wis. Stats. Section 40.05 (2)(ar). All contributions are employer paid based on a graduated, experienced-rated formula. During Calendar Year 2010 contribution rates ranged from 1.9 percent to 6.6 percent of covered payroll based on employer experience. Eligibility for program benefits is based upon whether a duty-related injury or disease is likely to be permanent, which causes a protective occupation participant to retire, accept reduced pay or light duty assignment, or in some cases, that impairs promotional opportunities. Benefits approximate 80 percent of salary (75 percent if partially disabled and not a State Employee), less certain offsets such as; social security, unemployment compensation, worker’s compensation and other retirement benefits. Survivor benefits are also offset by certain benefits based on program requirements. Retiree Life Insurance Fund The Retiree Life Insurance Fund is a cost-sharing multiple-employer defined benefit OPEB plan. The plan provides post-employment life insurance coverage to all eligible employees. The plan is administered under Wis. Stats. Section 40.70. The plan is reported as a pension and other employee benefit trust fund. Generally, members may enroll during a 30-day enrollment period once they satisfy a six-month waiting period. They may enroll
after the initial 30-day enrollment period with evidence of insurability. Members under evidence of insurability enrollment must enroll in group life insurance coverage before age 55 to be eligible for Basic or Supplemental coverage. Employers are required to pay the following contributions for active members to provide them with basic coverage after age 65. There are no employer contributions for pre-65 annuitant coverage. All contributions are actuarially determined. State Local 50 percent post retirement coverage
28 percent of the employee
premium
40 percent of employee premium
25 percent post retirement coverage
N/A 20 percent of employee premium
At retirement, the member must have active group life insurance coverage and satisfy one of the following: Wisconsin Retirement System (WRS) coverage prior to
January 1, 1989, or At least one month of group life insurance coverage in each
of five calendar years after 1989 and one of the following: Eligible for an immediate WRS benefit, or At least 20 years from their WRS creditable service as of
January 1, 1990, plus their years of group life insurance coverage after 1989, or
At least 20 years on the payroll of their last employer. In addition, terminating members and retirees must continue to pay the employee premiums until age 65 (age 70 if active). After retirement, basic coverage is continued for life in amounts for the insurance in force before retirement. Additional coverage may be continued until age 65 at 100 percent of the amount of the insurance in force before retirement at the employee’s expense, and spouse and dependent coverage benefits is terminated.
State of Wisconsin Notes to The Financial Statements
For the Fiscal Year Ended June 30, 2011 138
Summary of Significant Accounting Policies Basis of Accounting The OPEB plans are reported in accordance with GASB Statement No. 43, Financial Reporting for Postemployment Benefit Plans Other Than Pension Plans, and accounted for using the flow of economic resources measurement focus and the accrual basis of accounting. Revenues are recorded when earned and expenses are recorded at the time liabilities are incurred. Method Used to Value Investments Duty Disability Fund Investments for the Duty Disability Fund are invested in the Core Retirement Investment Trust, which is managed by the State of Wisconsin Investment Board (SWIB). These investments are valued at fair value. Generally, fair value information represents actual bid prices or the quoted yield equivalent at the end of the year for securities of comparable maturity, quality, and type, as obtained from one or more major investment brokers. If quoted market prices are not available, a variety of third-party pricing methods are used, including appraisals, certifications, pricing models, and other methods deemed acceptable by industry standards. Retiree Life Insurance Fund Investments for the Retiree Life Insurance Fund are held with the insurance carrier (the Company). The Retiree Life Insurance Fund’s investment is a share in the investment pool. Fixed maturity securities, which may be sold prior to maturity, including fixed maturities on loan, are classified as available-for-sale and are carried at fair value. Premiums and discounts are amortized or accreted over the estimated lives of the securities based on the interest yield method. The Company uses book value as cost for applying the retrospective adjustment method to loan-backed fixed maturity securities purchased. Prepayment assumptions for single class and multi-class mortgage-backed securities were obtained from broker/dealer survey values or internal estimates. Marketable equity securities are classified as available-for-sale and are carried at fair value. Mutual funds and exchange traded fund investments in select asset classes that are sub-advised are carried at the fair value of the underlying net assets of the funds. Available-for-sale securities are stated at fair value. Mortgage loans are carried at amortized cost less any valuation allowances. Premiums and discounts are amortized or accreted
over the terms of the mortgage loans based on the effective interest yield method. Private equity investments in limited partnerships are carried at the amount invested, adjusted to recognize the Company’s ownership share of the earnings or losses of the investee after the date of the acquisition, adjusted for any distributions received (equity method accounting). Investments in partnerships, which represent minority interests owned in certain general agencies, are carried at the amount invested, adjusted to recognize the Company’s ownership share of the earnings or losses of the investee after acquisition adjusted for any distributions received (equity method accounting). Fair values of fixed maturity securities are based on quoted market prices where available. Fair values of marketable equity securities are based on quoted market prices. Fair values of private equity investments are obtained from the financial statement valuations of the underlying fund or independent broker bids. For fixed maturity securities not based on quoted market prices, generally private placement securities, securities that do not trade regularly, and embedded derivatives, an internally developed pricing model using a commercial software application is most often used. The internally developed pricing model is developed by obtaining spreads versus the U.S. Treasury yield for corporate securities with varying weighted average lives and bond ratings. Real estate is carried at cost less accumulated depreciation. The Company’s derivative instrument holdings are carried at fair value. All derivatives are recorded as non-hedge transactions. Derivative instrument fair values are based on quoted market prices or dealer quotes. If a quoted market price is not available, fair value is estimated using current market assumptions and modeling techniques, which are then compared with quotes from counterparties. For mortgage-backed securities of high credit quality, excluding interest-only securities, the Company recognizes income using a constant effective yield method based on prepayment assumptions obtained from an outside service provider or upon analyst review of the underlying collateral and the estimated economic life of the securities. Policy loans are carried at the unpaid principal balance. Cash and cash equivalents are carried at cost, which approximates fair value. The Company considers all money market funds and commercial paper with original maturity dates of less than three months to be cash equivalents.

State of Wisconsin Notes to The Financial Statements
For the Fiscal Year Ended June 30, 2011 139
Finance receivables that management has the intent and ability to hold for the foreseeable future or until maturity or payoffs are reported at their outstanding unpaid principal balances reduced by any charge-offs. The Company holds “To-Be-Announced” (TBA) Government National Mortgage Association forward contracts that require the Company to take delivery of a mortgage-backed security at a settlement date in the future. Most of the TBAs are settled at the first available period allowed under the contract. However, the deliveries of some of the Company’s TBA securities happen at a later date, thus extending the forward contract date. These securities are reported at fair value as derivative instruments with the changes in fair value reported in net realized investment gains and losses on the consolidated statements of operations. Required Supplementary Information Required Supplementary Information about the OPEB plans is presented in the Department of Employee Trust Funds audited financial statements. The December 31, 2010 financial report is available at www.etf.wi.gov and on request from:
The Department of Employee Trust Funds 801 West Badger Road P.O. Box 7931 Madison, Wisconsin 53707-7931
State of Wisconsin Notes to The Financial Statements
For the Fiscal Year Ended June 30, 2011 140
NOTE 18. PUBLIC ENTITY RISK POOLS ADMINISTERED BY THE DEPARTMENT OF EMPLOYEE TRUST FUNDS The Department of Employee Trust Funds operates four public entity risk pools: group health insurance, group income continuation insurance, long-term disability insurance, and pharmacy benefits. The information provided in this note applies to the period ending December 31, 2010. A. Description of Funds The Health Insurance Fund offers group health insurance for current employees of the State government and of participating local public employers. All public employers in the State are eligible to participate. Approximately 373 local employers plus the State currently participate. The State and local government portions of the fund are accounted for separately and have separate contribution rates, benefits, and actuarial valuations. The fund includes both a self-insured, fee-for-service plan as well as various prepaid plans, primarily Health Maintenance Organizations (HMO's) and a self-insured plan that provides for pharmacy benefits of covered members. The Income Continuation Insurance Fund offers disability wage continuation insurance for current employees of the State government and of participating local public employers. All public employers in the State are eligible to participate. Approximately 192 local employers plus the State currently participate. The State and local government portions of the fund are accounted for separately and have separate contribution rates, benefits, and actuarial valuations. The plan is self-insured. The Long-term Disability Insurance Fund offers long-term disability benefits to participants in the Wisconsin Retirement System (WRS). The long-term disability benefits provided by this program are an alternative coverage to that currently provided by the WRS. All new WRS participants on or after October 15, 1992, are eligible only for the long-term disability insurance coverage, while participating employees active prior to October 15, 1992, may elect coverage through WRS or the long-term disability insurance program.
B. Accounting Policies for Risk Pools Basis of Accounting - All Public Entity Risk Pools are accounted for in enterprise funds using the full accrual basis of accounting and the flow of economic resources measurement focus. Valuation of Investments - Assets of the Health Insurance Fund Income Continuation Insurance and Long-term Disability Insurance funds are invested in the Core Retirement Investment Trust. Investments are valued at fair value. Unpaid Claims Liabilities - Claims liabilities are based on estimates of the ultimate cost of claims that have been reported but not settled, and of claims that have been incurred but not reported. The estimate includes the effects of inflation and other societal and economic factors. Adjustments to claims liabilities are charged or credited to expense in the periods in which they are made. Unpaid claims liability is presented at face value and is not discounted for health insurance. It is discounted using an interest rate of 7.2 percent for income continuation and long-term disability insurance. The liabilities for income continuation, long-term disability, and health insurance were determined by actuarial methods. Administrative Expenses - All maintenance expenses are expensed in the period in which they are incurred. Acquisition costs are immaterial and are treated as maintenance expenses. Premium deficiencies are not calculated because acquisition costs are immaterial. Claim adjustment expenses are also immaterial. Reinsurance - Health insurance plans provided by HMO's and health insurance for local government annuitants are fully insured by outside insurers. All remaining risk is self-insured with no reinsurance coverage. Risk Transfer - Participating employers are not subject to supplemental assessments in the event of deficiencies. If the assets of the fund were exhausted, participating employers would not be responsible for the fund's liabilities. Premium Setting - Premiums are established by the Group Insurance Board in consultation with actuaries.

State of Wisconsin Notes to The Financial Statements
For the Fiscal Year Ended June 30, 2011 141
C. Unpaid Claims Liabilities As discussed in Section B of this Note, each fund establishes a liability for both reported and unreported insured events, which is an estimate of future payments of losses. The following represents changes in those aggregate liabilities for the nonreinsured portion of each fund during Calendar Year 2010 (in millions):
Income Long-term Health Continuation Disability Pharmacy Insurance Insurance Insurance Benefits 2009 2010 2009 2010 2009 2010 2009 2010
Unpaid claims at beginning of the calendar year $ 4.9 $ 4.3 $ 76.7 $ 72.8 $ 138.6 $ 156.3 $ (2.3) $ (4.3)
Incurred claims: Provision for insured events of the current calendar year 25.9 24.0 33.4 34.3 50.2 54.2 134.8 148.4
Changes in provision for insured events of prior calendar years (2.3) (2.5) (21.8) (17.1) (8.9) (8.6) (0.1) (0.7)
Total incurred claims 23.6 21.5 11.6 17.3 41.3 45.6 134.7 147.7
Payments: Claims and claim adjustment expenses attributable to insured events of the current calendar year 21.6 20.5 5.5 6.0 1.7 1.9 139.1 155.8
Claims and claim adjustment expenses attributable to insured events of prior calendar years 2.6 1.7 10.0 9.9 21.9 24.4 (2.4) (5.0)
Total payments 24.2 22.2 15.5 15.9 23.6 26.3 136.7 150.8
Total unpaid claims expenses at end of the calendar year $ 4.3 $ 3.6 $ 72.8 $ 74.1 $ 156.3 $ 175.6 $ (4.3)* $ (7.4)*
* Total unpaid claims at the end of 2010 is the net of $4.0 million in unpaid claims and $11.4 million in rebates due from pharmaceutical companies; total unpaid claims at the end of 2009 is the net of $3.9 million in unpaid claims and $8.2 million in rebates due from pharmaceutical companies.
D. Trend Information Historical trend information showing revenue and claims development information is presented in the Department of Employee Trust Funds audited financial statements. The separately issued financial report for the year ended December 31, 2010 is available at www.etf.wi.gov and on request from:
The Department of Employee Trust Funds 801 West Badger Road P.O. Box 7931 Madison, Wisconsin 53707-7931

State of Wisconsin Notes to The Financial Statements
For the Fiscal Year Ended June 30, 2011 142
NOTE 19. SELF-INSURANCE It is the general policy of the State not to purchase commercial insurance for the risks of losses to which it is exposed. Instead, the State believes it is more economical to manage its risks internally and set aside assets for claim settlement in its internal service fund, the Risk Management Fund. The fund services most claims for risk of loss to which the State is exposed, including damage to State owned property, liability for property damages and injuries to third parties, and worker's compensation. All funds and agencies of the State participate in the Risk Management Fund. State Property Damage Property damages to State-owned properties are covered by the State's self-funded property program up to $3.0 million per occurrence and $3.2 million annual aggregate. When claims, which exceed $25,000 per occurrence, total $3.2 million, the State's private insurance becomes available. Losses to property occurring after the threshold are first subject to a $25,000 deductible. The amount of loss in excess of $25,000 is covered by the State's private insurance company. During Fiscal Year 2011, the excess insurance limits were written to $300 million. The liabilities for State property damage are reported when it is probable that a loss has occurred and the amount of that loss can be reasonably estimated. The estimate for future benefits and loss liabilities is based on the reserves on open claims and paid claims. Losses incurred but not reported are expected to be immaterial. Claims incurred but not paid as of June 30, 2011 are estimated to total $7.9 million. Property Damages and Bodily Injuries to Third Parties The State is self-funded for third party liability to a level of $4.0 million per occurrence and purchases insurance in excess of this self-funded retention. The policy limit during Fiscal Year 2011 was $49.0 million.
The liabilities for property damages and injuries to third parties are reported when it is probable that a loss has occurred and the amount of that loss can be reasonably estimated. The estimate for future benefits and loss liabilities for the prior fiscal year was the reserves on open claims. The estimate for future benefits and loss liabilities is calculated by an actuary based on the reserves on open claims and prior experience. No liability is reported for environmental impairment liability claims either incurred or incurred but not reported because existing case law makes it unlikely the State would be held liable for material amounts. Because actual claims liabilities depend upon complex factors such as inflation, changes in legal doctrines, and damage awards, the process used in computing claims liability does not
necessarily result in an exact amount. Immaterial non-incremental claims adjustment expenses are not included as part of the liability. Claims incurred but not paid as of June 30, 2011 are estimated to total $21.1 million.
Worker's Compensation
The Worker's Compensation Program was created by Wisconsin Statutes Chapter 102 to provide benefits to workers injured on the job. All employees of the State are included in the program. An injury is covered under worker's compensation if it is caused by an accident that arose out of and in the course of employment.
The responsibility for claiming compensation is on the employee. A claim must be filed with the program within two years from the date of injury; otherwise the claim is not allowable.
The worker's compensation liability has been determined by an actuary using paid claims and current claims reserves. Liabilities include an amount for claims that have been incurred but not reported. Because actual claims liabilities are affected by external factors, the process used in computing claims liabilities does not necessarily result in an exact amount. Claims incurred but not paid as of June 30, 2011 are estimated to total $68.0 million.
Changes in the balances of claims liability for the Risk Management Fund during the current and prior fiscal years are as follows (in thousands): 2011 2010 Beginning of fiscal year liability $ 94,847 $ 103,119 Current year claims and changes in estimates 28,851 21,376 Claim payments (26,743) (28,278) 96,955 96,217 Excess insurance reimbursable (5,280) (1,370) Balance at fiscal year-end $ 91,675 $ 94,847
Settlements have not exceeded coverages for each of the past three fiscal years. Annuity Contracts The Risk Management Fund purchased annuity contracts in various claimants’ names to satisfy claim liabilities. The likelihood that the fund will be required to make future payments on those claims is remote and, therefore, the fund is considered to have satisfied its primary liability to the claimants. Accordingly, the annuity contracts are not reported in, and the related liabilities are removed from, the fund’s balance sheet. The aggregate outstanding amount of liabilities removed from the financial statements at June 30, 2011 is $7.2 million.

State of Wisconsin Notes to The Financial Statements
For the Fiscal Year Ended June 30, 2011 143
NOTE 20. INSURANCE FUNDS A. Primary Government 1. Local Government Property Insurance Fund Created by the Legislature in 1911, the purpose of the Local Government Property Insurance Fund is to provide property insurance coverage to tax-supported local government units such as counties, towns, villages, cities, school districts and library boards. Property insured includes government buildings, schools, libraries and motor vehicles. Coverage is available on an optional basis. As of June 30, 2011 the Local Government Property Insurance Fund insured 1,087 local governmental units. The total amount of insurance in force as of June 30, 2011 was $50.0 billion. Valuation of Cash Equivalents and Investments - All investments of the Local Government Property Insurance Fund are managed by the State of Wisconsin Investment Board, as discussed in Note 5-B to the financial statements. At June 30, 2011, the fund had $21.1 million of shares in the State Investment Fund which are considered cash equivalents. Premium - Unearned premium reported as deferred revenue represents the daily pro rata portion of premium written which is applicable to the unexpired terms of the insurance policies in force. Policies are generally written for annual terms. Unpaid Loss Liabilities - The Local Government Property Insurance Fund establishes the unpaid loss liability titled future benefits and loss liabilities on the financial statements based on estimates of the ultimate cost of losses (including future loss adjustment expenses) that have been reported but not settled, and of losses that have been incurred but not reported. Estimated amounts of excess-of-loss insurance recoverable on unpaid losses are deducted from the liability for unpaid losses. Loss liabilities are recomputed periodically to produce current estimates that reflect recent settlements, loss frequency, and other economic factors. Adjustments to future benefits and loss liabilities are charged or credited to expense in the periods in which they are made.
Policy Acquisition Costs - Since the Local Government Property Insurance Fund has no marketing staff and incurs no sales commissions, acquisition costs are minimal and charged to operations as incurred. Excess-of-Loss Insurance Coverage - The Local Government Property Insurance Fund purchases excess-of-loss insurance coverage, the operation of which is analogous to “reinsurance,” to reduce its exposure to large losses on all types of insured events. Excess-of-loss insurance permits recovery of a portion of losses from the excess-of-loss insurers, although it does not discharge the primary liability of the fund as direct insurer of the risks reinsured. The fund does not report excess-of-loss insured risks as liabilities unless it is probable that those risks will not be covered by excess-of-loss insurers. As of June 30, 2011 the fund had $425.0 million of per occurrence excess of loss reinsurance in force with a $2.0 million combined single limit retention for each occurrence, and an annual aggregate reinsurance contract with a $22.0 million annual aggregate retention plus a per claim retention of $5 thousand once the aggregate is met, as respects occurrences for the term of the agreement. Premiums ceded to excess-of-loss insurers, which is netted against premium revenue (charges for goods and services in the financial statements), amounted to $5.5 million during the fiscal year. Excess-of-loss and adjusting expense recoveries earned would typically reduce claims paid (benefit expense on the financial statements). During the fiscal year the Local Government Property Insurance Fund received $18.8 million in recoveries.

State of Wisconsin Notes to The Financial Statements
For the Fiscal Year Ended June 30, 2011 144
Unpaid Loss Liabilities As discussed above, the Local Government Property Insurance Fund establishes a liability for both reported and unreported insured events, which includes estimates of both future payments of losses and related loss expenses. The following represents changes in those aggregate liabilities for the fund during the past two fiscal years (in thousands):
2011 2010 Unpaid loss liabilities at beginning of the year $6,275 $9,506 Less: Excess-of-loss insurance recoverable
--
(2,716)
Net unpaid loss liabilities at beginning of year 6,275 6,790 Incurred losses and loss expenses: Provision for insured events of the current year 23,963 12,113 Increase (decrease) in provision for insured events of prior years 1,770 4 Total incurred losses and loss expenses 25,733 12,117 Payments: Losses and loss expenses attributable to insured events of the current year 11,426 6,228 Losses and loss expenses attributable to insured events prior years 7,207 6,404 Total payments 18,633 12,632 Net unpaid loss liabilities at end of year 13,375 6,275 Plus: Excess-of-loss liabilities recoverable
1,743
--
Total unpaid loss liabilities at end of year $15,118 $6,275
Trend Information Historical trend information showing revenue and claims development information is presented in the Office of the Commissioner of Insurance June 30, 2011 financial statements. Copies of these statements may be requested from:
Office of the Commissioner of Insurance 125 South Webster Street Madison, Wisconsin 53702

State of Wisconsin Notes to The Financial Statements
For the Fiscal Year Ended June 30, 2011 145
2. State Life Insurance Fund The State Life Insurance Fund was created under Chapter 607, Wisconsin Statutes, to offer life insurance to residents of Wisconsin in a manner similar to private insurers. This fund functions much like a mutual life insurance company and is subject to the same regulatory requirements as any life insurance company licensed to operate in Wisconsin. Premiums are reported as earned when due. Benefits and expenses are associated with earned premiums so as to result in recognition of profits over the life of the contracts. This association is accomplished by means of the provision for liabilities for future benefits and the amortization of acquisition costs. The costs of policy issuance and underwriting, all of which vary with, and are primarily related to, the production of new business, have been deferred. These deferred acquisition costs are amortized over a forty year period, considered representative of the life of the contract. The amortization is in proportion to the ratio of annual in-force business to the amount of business issued. Such anticipated in-force business was estimated using similar assumptions to those used for computing liabilities for future policy benefits.
Deferred Acquisition Cost Assumptions
Issue Interest Lapse Years Rate Rate Mortality
1913-1966 3.0% 2.0% None 1967-1976 3.0 2.0 None 1977-1985 4.0 2.0 None 1986-1994 5.0 2.0 None 1995+ 4.0 2.0 None The State Life Insurance Fund does not pay commissions nor does it incur agent expenses.
Future benefits and loss liabilities have been computed by the net level premium method based upon estimated future investment yield and mortality. The composition of liabilities and the more material assumptions pertinent thereto are presented below (in thousands):
Ordinary Life Amount of Issue Insurance Policy Year in Force Liability 1913-1966 $ 9,326 $ 7,057 1967-1976 30,940 16,593 1977-1985 73,643 23,795 1986-1994 49,928 8,812 1995-2008 41,190 5,484 2009+ 3,533 180 $ 208,560 $ 61,921
Bases of Assumptions Issue Interest Year Rate Mortality
1913-1966 3.0% American Experience, ANB* 1967-1976 3.0 1958 CSO, ALB, Unisex 1977-1985 4.0 1958 CSO, ALB, Female Setback 3 years 1986-1994 5.0 1980 CSO, ALB, Aggregate 1995-2008 4.0 1980 CSO, ALB, Aggregate 2009+ 4.0 2001 CSO, ALB, Aggregate * Age Next Birthday All of the State Life Insurance Fund's life insurance in force is participating. This fund is required by statute to maintain surplus at a level between 7 percent and 10 percent of statutory admitted assets as far as practicably possible. All excess surplus is to be returned to the policyholders in the form of policyholder dividends. Policyholder dividends are declared each year in order to achieve the required level of surplus. The statutory assets at December 31, 2010 were $92.0 million and the statutory capital and surplus was $8.3 million, and the fund equity at June 30, 2011 was $20.0 million.

State of Wisconsin Notes to The Financial Statements
For the Fiscal Year Ended June 30, 2011 146
3. Injured Patients and Families Compensation Fund
The Injured Patients and Families Compensation Fund was created in 1975 for the purpose of providing excess medical malpractice claims exceeding the legal primary insurance limits prescribed in Wis. Stat. Section 655.23(4), or the maximum liability limit for which the health care provided is insured, whichever limit is greater. Management of the Injured Patients and Families Compensation Fund is vested with a 13-member Board of Governors, which is chaired by the Commissioner of Insurance. Most health care providers permanently practicing or operating in the State of Wisconsin are required to pay Injured Patients and Families Compensation Fund operating fees. Risk of loss is retained by the fund. The Future Benefits and Loss Liability account includes individual case estimates for reported losses and estimates for incurred but not reported losses based upon the projected ultimate losses recommended by a consulting actuary. Individual case estimates of the liability for reported losses and net losses paid from inception of the Injured Patients and Families Compensation Fund are deducted from the projected ultimate loss liabilities to determine the liability for incurred but not reported losses as of June 30, 2011 as follows (in thousands):
Projected ultimate loss liability $ 1,427,708 Less: Net loss paid from inception (810,106) Less: Liability for reported losses (7,149) Liability for incurred but not reported losses $ 610,453
The Future Benefits and Loss Liability account also includes a provision for the estimated future payment of the costs to settle claims. The actuary estimates the ultimate loss adjustment expense (LAE) using data available through September 30 of the fiscal year. The actuary estimates LAE at 18 percent of the estimated unpaid loss liabilities as of June 30, 2011. Since the actuary estimate occurs before the end of the fiscal year and are based on an estimate of the cumulative payments, the percentage used by the actuary in determining LAE will differ slightly from the percentages used in financial statements since actual LAE payments are used for financial reporting. The LAE paid from the inception of the Injured Patients and Families Compensation Fund are deducted from the projected ultimate loss adjustment expenses provision to determine the liability for loss adjustment expenses as of June 30, 2011 as follows (in thousands): Projected ultimate loss adjustment expense liability $ 184,300 Less: Loss adjustment expense paid from inception (74,719) Liability for loss adjustment expense $ 109,581
In accordance with Section Ins. 17.27(3), Wis. Adm. Code, the liability for reported losses, liability for incurred but not reported losses, and liability for loss adjustment expense are maintained on a present value basis with the difference from full value being reported as a contra account to these estimated loss liabilities. These estimated loss liabilities are discounted only to the extent that they are matched by cash and invested assets. Using the actuarially determined discount factor of 0.824, which is based on an investment yield assumption of 5.5 percent approved by the Board of Governors, the discounted loss liability would be as follows as of June 30, 2011 (in thousands):
Estimated liability for Incurred But Not Reported (IBNR) $ 610,453 Estimated liability for reported losses 7,149 Estimated unpaid loss adjustment expense 109,581 Total estimated loss liabilities 727,183 Less: Amount representing interest (127,870) Discounted loss liabilities $ 599,313
Included in the above estimates of loss liabilities, both undiscounted and discounted, is a 25 percent risk margin, which was recommended by the actuary and approved by the Board of Governors. Once every three years, the Office of the Commissioner of Insurance contracts for an actuarial audit of the Injured Patients and Families Compensation Fund. This audit includes a review by another actuary of the reasonableness of the actuarial methodology and assumptions used in developing estimates of the Fund’s liabilities. The actuarial audits have concluded that the Fund’s loss liability estimates are reasonable, although conservative. The Fund’s contracted actuary has considered the recommendations made in the actuarial audits and appropriately incorporated any necessary changes based on those recommendations into the actuarial methodology and assumptions used to calculate the Fiscal Year 2011 liabilities estimate. In addition to discounted loss liabilities, the Future Benefit and Loss Liabilities account also includes a future medical expenses liability and a contributions being held liability. The future medical expenses liability consists of those accounts required by Wis. Stat. Sec. 655.015 to be established if a settlement or judgment provides for future medical expense payments in excess of $100,000. The accounts are managed by the Fund and earn a proportionate share of the Fund’s interest. Any account balance remaining when a claimant dies reverts back the Fund. The contributions being held liability consists of nonrefundable payments, generally in amounts equal to the primary coverage in effect for related claims, that primary insurers have voluntarily presented to the fund and which are negotiable with the fund in exchange for a release of payment for any future defense costs

State of Wisconsin Notes to The Financial Statements
For the Fiscal Year Ended June 30, 2011 147
that may be incurred on the claim. This amount is held as a liability to the Fund until a payment on the claim is made. The breakdown of Future Benefit and Loss Liabilities, including the portions that are estimated as current and noncurrent as of June 30, 2011 (in thousands), is as follows:
Discounted loss liabilities $ 599,313 Future medical expense liability 37,190 Contributions being held liability -- Total estimated loss liabilities 636,503 Current portion (79,817) Noncurrent portion $ 556,686
The uncertainties inherent in projecting the frequency and severity of large claims because of the Injured Patients and Families Compensation Fund's unlimited liability coverage and extended reporting and settlement periods makes it likely that the amounts ultimately paid will differ from the recorded estimated loss liabilities. These differences cannot be quantified. The estimated amounts included in the balance of Future Benefits and Loss Liabilities are continually reviewed and adjusted as the Injured Patients and Families Compensation Fund gains additional experience. Such adjustments are reflected in current operations. Because of the changes in these estimates, the benefit expense for the fiscal year is not necessarily indicative of the loss experience for the year. The following is a reconciliation of the change in the balance of Future Benefits and Loss Liabilities during FY 2011 (in thousands):
Liability at the beginning of the year $ 721,071 Incurred claims and related expenses for the current year and the change in estimated amounts for claims incurred in prior years
(44,282)
Less: current year payments attributable to claims incurred in current and prior years
(40,286)
Liability at the end of the year $ 636,503
B. Component Units Wisconsin Health Care Liability Insurance Plan The Wisconsin Health Care Liability Insurance Plan (the Plan) is a statutory unincorporated association established by rule of the Commissioner of Insurance of the State of Wisconsin as mandated by the State of Wisconsin legislature. The Plan provides health care liability insurance and liability coverages normally incidental to health care liability insurance to eligible
health care providers in the State of Wisconsin calling for payment of premium prior to the effective date of the policy. All insurers authorized to write personal injury liability insurance in the State of Wisconsin, with certain minor exceptions, are required to be members of the Plan. The Plan generates its premium written revenue by selling medical malpractice insurance. Rates are calculated in accordance with generally accepted actuarial principles. The rates are set so that the Plan will be self-supporting. Profit is not the intent of the Plan. Since the inception of the Plan in 1975, the health care liability coverage limits have increased from $200 thousand per occurrence and $600 thousand annual aggregate to the current limits of $1.0 million per occurrence and $3.0 million annual aggregate. A general liability coverage is also available to participating health care providers with limits of $1.0 million per occurrence and $3.0 million annual aggregate. The Plan is not covered under any reinsurance contracts. In the event that sufficient funds are not available for the sound financial operation of the Plan, all members shall, on a temporary basis, contribute to the financial needs of the Plan. Members shall participate in the contributions in the proportion of their respective premiums to the aggregate premiums written by all members of the Plan. Such assessments shall be recouped by rate increases applied prospectively. There were no assessments for the year ended December 31, 2010. The future benefits and loss liability includes amounts determined from individual reported losses (case reserves) and an amount, based on past experience, for losses incurred but not reported. Such liabilities are necessarily based on estimates and, while management believes that the amounts are adequate, the ultimate liability will differ from the amounts provided. The methods for making such estimates and for establishing the resulting liability are annually reviewed, and any adjustments are reflected in income currently. Specific account balances as of December 31, 2009, and December 31, 2010, are as follows (in thousands): 2010 2009
Balance at January 1 $ 21,606 $ 17,612 Incurred related to: Current year 4,201 4,594 Prior years (4,317) 630 Total Incurred (116) 5,224 Paid related to: Current year 58 89 Prior years 945 1,141 Total paid 1,003 1,230
Balance at December 31 $ 20,487 $ 21,606
State of Wisconsin Notes to The Financial Statements
For the Fiscal Year Ended June 30, 2011 148
There is inherent uncertainty in medical malpractice claims when establishing the estimates of unpaid losses and unpaid loss adjustment expenses. In 2010, the Plan decreased its estimates of unpaid losses and unpaid loss adjustment expenses related to insured events of prior years. This decrease caused the total of incurred losses and loss adjustment expense to be negative.

State of Wisconsin Notes to The Financial Statements
For the Fiscal Year Ended June 30, 2011 149
NOTE 21. SEGMENT INFORMATION AND CONDENSED FINANCIAL DATA Primary Government The State issues revenue bonds to finance the Leveraged Loan Program, which is accounted for as part of the Environmental Improvement Fund. Investors in those bonds rely solely on the revenue generated within the Leveraged Loan Program. Assets of this program are used primarily for loans for Wisconsin municipal waste water projects. Condensed financial statement information of the Leveraged Loan Program as of and for the year ended June 30, 2011 is presented below (in thousands):
Condensed Balance Sheet
Assets: Current Assets $ 179,714 Other Assets 998,392 Total Assets $ 1,178,106 Liabilities: Due to Other Funds $ 2,052 Other Current Liabilities (Including Current Portion of Long-term Debt) 61,860 Noncurrent Liabilities 879,300 Total Liabilities 943,212
Fund Equity: Restricted 234,894 Total Fund Equity 234,894 Total Liabilities and Fund Equity $ 1,178,106
Condensed Statement of Revenues, Expenses and Changes in Fund Equity
Operating Revenues (Expenses): Interest Income used as Security for Revenue Bonds
$ 21,220
Interest Expense (41,783) Other Operating Expenses (2,163) Operating Income (Loss) (22,726) Nonoperating Revenues (Expenses): Investment Income 23,250 Income (Loss) before Transfers 524 Transfers In (Out) 15,000 Change in Fund Equity 15,524 Beginning Fund Equity 219,369 Ending Fund Equity $ 234,893
Condensed Statement of Cash Flows
Net Cash Provided (Used) by : Operating Activities $ (2,679) Noncapital Financing Activities 28,811 Investing Activities (9,268) Net Increase (Decrease) 16,865 Beginning Cash and Cash Equivalents 148,812 Ending Cash and Cash Equivalents $ 165,677

State of Wisconsin Notes to The Financial Statements
NOTE 22. COMPONENT UNITS – CONDENSED FINANCIAL INFORMATION Significant financial data for the State’s four discretely presented component units for the year ended December 31, 2010 or June 30, 2011 is presented below (in thousands):
Wisconsin Housing Wisconsin University of and Economic Health Care Wisconsin University ofDevelopment Liability Hospitals and Wisconsin
Authority Insurance Plan Clinics Authority Foundation Total
Condensed Balance Sheet
Assets and Deferred Outflows: Cash, Investments and Other Assets $ 3,259,138 $ 64,051 $ 467,211 $ 2,635,576 $ 6,425,976 Due from Primary Governments - - 2,003 - 2,003 Cash and Investments with Other Component Units - - 265,012 - 265,012 Capital Assets, net 15,196 - 385,490 7,054 407,740
Deferred Outflows of Resources 91,245 - - - 91,245 Total Assets and Deferred Outflows $ 3,365,579 $ 64,051 $ 1,119,716 $ 2,642,630 $ 7,191,976
Liabilities: Accounts Payable and Other Current Liabilities $ 130,428 $ 10,067 $ 111,540 $ 30,575 $ 282,610 Due to Primary Government 225 - 7,253 - 7,478 Amounts Held for Other Component Units - - - 251,702 251,702 Other Liabilities 91,245 - 10,301 - 101,546 Long-term Liabilities (Current and Noncurrent portions) 2,571,822 20,487 321,801 40,941 2,955,051 Total Liabilities 2,793,720 30,553 450,895 323,218 3,598,386
Fund Equity: Invested in Capital Assets, Net of Related Debt 4,016 - 151,853 7,054 162,923 Restricted 553,536 33,498 10,847 2,137,485 2,735,366 Unrestricted 14,307 - 506,121 174,873 695,301 Total Fund Equity 571,859 33,498 668,821 2,319,412 3,593,590 Total Liabilities and Fund Equity $ 3,365,579 $ 64,051 $ 1,119,716 $ 2,642,630 $ 7,191,976
Condensed Statement of Revenues, Expenses and Changes in Fund Equity
Program Expenses: Depreciation $ 6,193 $ - $ 45,839 $ 489 $ 52,521 Payments to Primary Government - - 2,500 206,224 208,724 Other 310,145 1,117 964,215 30,558 1,306,035 Total Program Expenses: 316,338 1,117 1,012,554 237,271 1,567,280
Program Revenues: Charges for Goods and Services 6,291 4,210 1,059,550 - 1,070,051 Investment and Interest Income 131,580 3,038 - 278,377 412,995 Operating Grants and Contributions 176,271 - - 165,668 341,939 Capital Grants and Contributions - - 3,286 - 3,286 Miscellaneous 13,654 9 20,472 50 34,185 Total Program Revenues 327,796 7,257 1,083,308 444,095 1,862,456
Net Program Revenue/(Expense) 11,458 6,140 70,754 206,824 295,176
General Revenues: Interest and Investment Earnings 9,043 - 23,500 - 32,543 Miscellaneous - - - - - Loss on Unamortized Bond Insurance Premium - - Contributions to Endowments - - 644 - 644
Change in Fund Equity 20,501 6,140 94,898 206,824 328,363 Fund Equity, Beginning of Year 551,358 27,357 573,923 2,112,588 3,265,227 Fund Equity, End of Year $ 571,859 $ 33,498 $ 668,821 $ 2,319,412 $ 3,593,590
For the Fiscal Year Ended June 30, 2011
150

State of Wisconsin Notes to The Financial Statements
NOTE 23. RESTATEMENTS OF BEGINNING FUND BALANCES/FUND EQUITY/NET ASSETS AND OTHER CHANGES The following reconciliations summarize restatements of the end-of-year fund balance/fund equity/net assets as reported in the 2010 Comprehensive Annual Financial Report to the beginning-of-year amounts reported for Fiscal Year 2011 (in thousands). During Fiscal Year 2011, the State implemented GASB Statement No. 54, Fund Balance Reporting and Governmental Fund Type Definitions. As a result of the implementation of this statement, fund reclassifications and some adjustments to the fund balances reported in the prior year financial statements were required. These adjustments impacted governmental funds as well as an internal service fund. A. Fund Statements – Governmental Funds
Major Funds
Common Nonmajor TotalGeneral Transportation School Funds Governmental
Fund Balances June 30, 2010 as reported in the 2010 Comprehensive Annual Financial Report $ (2,943,303) $ 650,148 $ 820,479 $ (390,557) $ (1,863,233)
Fund structure changes:
Wisconsin Election Campaign to General Fund 1,245 - - (1,245) -
Vendor Net reclassified to proprietary fund 2,789 2,789
Correction of accrual for due from other governments 26,113 25,808 - - 51,921
Other adjustments of assets and liabilities as of June 30, 2010 568 - - - 568
Fund Balances July 1, 2010 as restated $ (2,915,377) $ 675,956 $ 820,479 $ (389,013) $ (1,807,955)
Effect of adjustments on the amount of excess revenues and other sources over expenditures and other uses of Fiscal Year 2010 $ 26,681 $ 25,808 $ - $ - $ 52,489 B. Fund Statements – Proprietary Funds
Major Funds
Injured Patients University of Internaland Families Environmental Wisconsin Unemployment Nonmajor Total Service
Compensation Improvement System Reserve Funds Enterprise Funds
Fund Equity June 30, 2010 as reported in the 2010 Comprehensive Annual Financial Report $ 132,798 $ 1,555,998 $ 4,894,016 $ (920,352) $ 443,372 $ 6,105,832 $ (17,017)
Vendor Net reclassified from governmental fund (2,789)
Other adjustments of assets and liabilities as of June 30, 2010 - - - - 1,638 1,638 (363)
Fund Equity July 1, 2010 as restated $ 132,798 $ 1,555,998 $ 4,894,016 $ (920,352) $ 445,010 $ 6,107,470 $ (20,169)
Effect of adjustments on the amountof net change in fund equityof Fiscal Year 2010
$ - $ - $ - $ - $ 1,638 $ 1,638 $ (363)
For the Fiscal Year Ended June 30, 2011 151

State of Wisconsin Notes to The Financial Statements
C. Fund Statements – Fiduciary Funds
Pension and Other Private Employee Investment Purpose Total
Benefit Trust Trust Trust Fiduciary
Net Assets June 30, 2010 as reported in the 2010 Comprehensive Annual Financial Report $ 66,937,157 $ 2,606,398 $ 2,265,681 $ 71,809,236
Other adjustments of assets and liabilities as of June 30, 2010 (265) - - (265)
Net Assets July 1, 2010 as restated $ 66,936,893 $ 2,606,398 $ 2,265,681 $ 71,808,971
Effect of prior period adjustments on the amount of net increase (decrease) in net assets of Fiscal Year 2010 $ (265) $ - $ - $ (265) D. Government-wide Statements
Primary GovernmentGovernmental Business-type Component
Activities Activities Totals Units
Net Assets June 30, 2010 as reported in the 2010 Comprehensive Annual Financial Report $ 5,583,179 $ 6,110,183 $ 11,693,362 $ 3,265,261
Department of Transportation restatement of capital assets and infrastructure (13,589) - (13,589) -
Correction of accrual for due from other governments 51,921 - 51,921 -
Elimination of the State Fair Park Exposition Center, Inc. as a component unit (34)
Other adjustments of assets and liabilities as of June 30, 2010 344 1,638 1,982
Net Assets July 1, 2010 as restated $ 5,621,855 $ 6,111,821 $ 11,733,676 $ 3,265,227
Effect of adjustments on the amount of net increase (decrease) in net assets of Fiscal Year 2010 $ 51,046 $ 1,638 $ 52,684 $ -
For the Fiscal Year Ended June 30, 2011 152

State of Wisconsin Notes to The Financial Statements
For the Fiscal Year Ended June 30, 2011 153
NOTE 24. LITIGATION, CONTINGENCIES AND COMMITMENTS A. Litigation and Contingencies The State is a defendant in various legal proceedings pertaining to matters incidental to the performance of routine governmental operations. Claims and Judgments Reported in Governmental Activities The State accrues liabilities related to legal proceedings, if a loss is probable and reasonably estimable. Such losses, totaling $2.8 million on June 30, 2011 reported in the governmental activities, are discussed below: Other Claims -- Work Injury Supplemental Benefits - The Work Injury Supplemental Benefit Fund, administered by the Department of Workforce Development, provides compensatory payments to survivors of fatally injured employees or disabled employees with work-related injuries. The liability for annuities to be paid totaled $.8 million at June 30, 2011. The U.S. Department of Agriculture (USDA) determined that certain costs of services for the Supplemental Nutrition Assistance Program (SNAP), administered by the State of Wisconsin Department of Health Services, were not eligible for participation in that program. Therefore, a liability for $2.0 million is reported at June 30, 2011, $1.6 million as a claims and judgments in the government-wide statements and $.4 million as a “Due to Other Governments” in the General Fund. Other Claims, Judgments, and Contingencies The State is also named as a party in other legal proceedings where the ultimate disposition and consequence are not presently determinable. The potential liability amount relating to an unfavorable outcome for certain of these proceedings could not be reasonably determined at this time. However, the ultimate dispositions and consequences of any single legal proceeding or all legal proceedings collectively should not have a material adverse effect on the State's financial position. Notice of Transferee Liability – In September 2008, the Internal Revenue Service (IRS) provided the State of Wisconsin Investment Board (SWIB) a Notice of Transferee Liability. This claim seeks taxes, penalties and interest relating to the sale of Shockley Communications Corporation (SCC) stock in 2001. The IRS asserts that the shareholders’ sale of SCC stock in 2001 should have been characterized as a sale of assets by SCC, on which SCC should have paid income taxes. The IRS asserts that the former SCC shareholders, including SWIB, would be liable for those taxes, plus penalties and interest. The SWIB’s liability, as a putative transferee of SCC assets, would be limited to $28.3 million plus interest.
The SWIB believes that the loss, if any, resulting from the claim being upheld will not have a material impact on net investment assets or net income in future years. Due to uncertainty in predicting an outcome, a liability has not been recorded. Transfer from Injured Patients and Families Compensation Fund – 2007 Wisconsin Act 20, which was signed into law October 2007, required a transfer of $200 million from the Injured Patients and Families Compensation Fund to the General Fund. Subsequent to the signing of this legislation and the initial transfer, the Wisconsin Medical Society filed a lawsuit on behalf of their members challenging the transfer as unconstitutional. After being dismissed, the case was appealed to the Wisconsin Supreme Court. In July, 2010, the Wisconsin Supreme Court ruled that the plaintiffs had a property interest in the transferred funds, and that the transfer therefore, constituted an unlawful taking under the Wisconsin Constitution. The Court ruling required that the $200 million, plus interest and lost earnings, be returned to the Injured Patients and Families Compensation Fund. As a result, the General Fund transferred $233.7 million to the Injured Patients and Families Compensation Fund on August 2, 2011. This amount is included in “Advances From Other Funds” on the General Fund Balance Sheet. Similarly, an “Advance To Other Funds” for $233.7 million is reported in the Injured Patients and Families Compensation Fund.

State of Wisconsin Notes to The Financial Statements
For the Fiscal Year Ended June 30, 2011 154
B. Commitments Primary Government As of June 30, 2011, encumbrances of the General Fund totaled $612.8 million, encumbrances of the Transportation Fund totaled $1.48 billion, and encumbrances of other non-major governmental funds totaled $238.5 million. Obligations at June 30, 2011 representing multi-year, long-term commitments included (in thousands):
Transportation Fund $ 492,821 Transportation Revenue Bonds Capital Projects Fund 54,131 General Fund – Housing Programs 73,798
The Environmental Improvement Fund (the Fund) was established to administer the Clean Water Fund Loan Program. Loans are made to local units of government for wastewater treatment projects for terms of up to 20 years. These loans are made at a number of prescribed interest rates based on environmental priority. The loans contractually are revenue obligations or general obligations of the local governmental unit. Additionally, various statutory provisions exist which provide further security for payment. The Fund has made financial assistance commitments of $199.2 million as of June 30, 2011. These loan commitments are expected to be met through additional federal grants and proceeds from issuance of revenue obligations. In addition, the revenue obligation bonds of the Leveraged Loan Program in the Fund are collateralized by a security interest in all the assets of the Leveraged Loan Program. Neither the full faith and credit nor the taxing power of the State is pledged for the payment of the Fund’s revenue obligation bonds. However, as the loans granted to local units of government are at an interest rate less than the revenue bond rate, the State is obligated by the Fund’s General Resolution to fund, at the time each loan is made, a reserve which subsidizes the Leveraged Loan Program in an amount which offsets this interest disparity. The Injured Patients and Families Compensation Fund may be required to purchase an annuity as a result of a claim settlement. Under specific annuity arrangements, the fund may have ultimate responsibility for annuity payments if the annuity company defaults on annuity payments. One of the fund's annuity providers defaulted on $104 thousand in annuity payments through June 30, 2011, which the fund subsequently paid. The annuity provider is currently making the majority of these annuity payments, but the fund continues to make monthly annuity payments to cover defaulted payments. The fund has received reimbursement for these payments, including interest of $93 thousand through June 30, 2011. It is unclear when the annuity provider will be able to make the remaining annuity
payments and whether the fund will be able to recover the remaining annuity payments made on the behalf of the annuity provider. The total estimated replacement value of the fund’s annuities as of June 30, 2011 was $32.8 million. The replacement value calculation includes only annuities where the Fund remains the owner. Annuities with qualified assignments are no longer included. The fund reserves the right to pursue collection from State guarantee funds. State Public Deposit Guarantee - As required by Wis. Stat. Sec. 34.08, the State is to make payments to public depositors for proofs of loss (e.g., loss resulting from a bank failure) up to $400 thousand per depositor above the amount of federal insurance. This statutory requirement guarantees that the State will make payments in favor of the public depositor that has submitted a proof of loss. Payments would be made in the order in which satisfactory proofs of loss are received by the State's Department of Financial Institutions, until the designated appropriation is exhausted. At June 30, 2011, the appropriation available totaled $45.1 million. Losses become fixed as of the date of the loss. A public depositor experiencing a loss must assign its interest in the deposit, to the extent of the amount paid, to the Department of Financial Institutions. Any recovery made by the Department of Financial Institutions under the assignment is to be repaid to the appropriation. The possibility of a material loss resulting from payments to and recovery from public depositors is remote. Component Units The Wisconsin Housing and Economic Development Authority's mission was expanded since its creation to include administration of the Agricultural and Business Programs. These programs administer funds that are legislatively appropriated to subsidize interest and provide guarantees of principal balances of qualifying loans. At June 30, 2011, outstanding loan guarantees totaled $30.0 million. In April 2003, the Authority approved the Neighborhood Business Revitalization Guarantee program. The guarantee program will provide up to $12.0 million in loan guarantees for revitalization in targeted urban commercial communities with populations greater than 35,000. As of June 30, 2011, $7.5 million of loan guarantees had been approved with outstanding loan guarantees of $5.1 million.
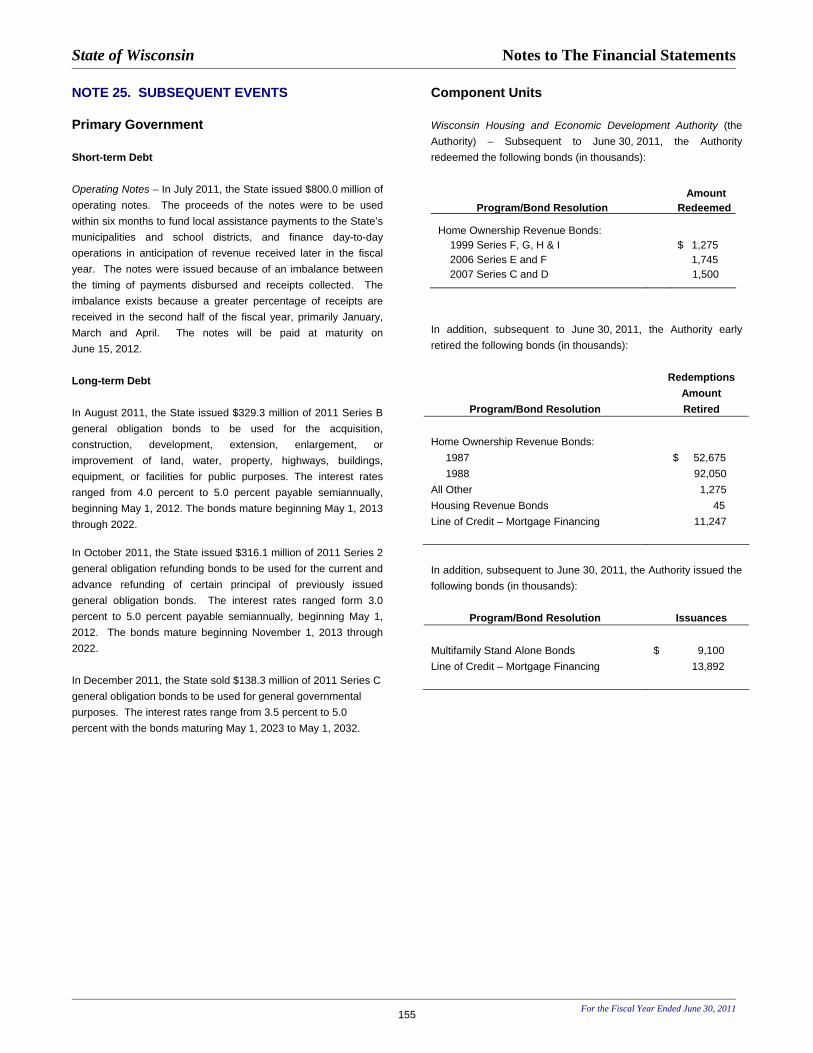
State of Wisconsin Notes to The Financial Statements
For the Fiscal Year Ended June 30, 2011 155
NOTE 25. SUBSEQUENT EVENTS Primary Government Short-term Debt Operating Notes – In July 2011, the State issued $800.0 million of operating notes. The proceeds of the notes were to be used within six months to fund local assistance payments to the State’s municipalities and school districts, and finance day-to-day operations in anticipation of revenue received later in the fiscal year. The notes were issued because of an imbalance between the timing of payments disbursed and receipts collected. The imbalance exists because a greater percentage of receipts are received in the second half of the fiscal year, primarily January, March and April. The notes will be paid at maturity on June 15, 2012. Long-term Debt In August 2011, the State issued $329.3 million of 2011 Series B general obligation bonds to be used for the acquisition, construction, development, extension, enlargement, or improvement of land, water, property, highways, buildings, equipment, or facilities for public purposes. The interest rates ranged from 4.0 percent to 5.0 percent payable semiannually, beginning May 1, 2012. The bonds mature beginning May 1, 2013 through 2022. In October 2011, the State issued $316.1 million of 2011 Series 2 general obligation refunding bonds to be used for the current and advance refunding of certain principal of previously issued general obligation bonds. The interest rates ranged form 3.0 percent to 5.0 percent payable semiannually, beginning May 1, 2012. The bonds mature beginning November 1, 2013 through 2022. In December 2011, the State sold $138.3 million of 2011 Series C general obligation bonds to be used for general governmental purposes. The interest rates range from 3.5 percent to 5.0 percent with the bonds maturing May 1, 2023 to May 1, 2032.
Component Units Wisconsin Housing and Economic Development Authority (the Authority) – Subsequent to June 30, 2011, the Authority redeemed the following bonds (in thousands):
AmountProgram/Bond Resolution Redeemed
Home Ownership Revenue Bonds: 1999 Series F, G, H & I $ 1,2752006 Series E and F 1,745
2007 Series C and D 1,500
In addition, subsequent to June 30, 2011, the Authority early retired the following bonds (in thousands):
Redemptions Amount
Program/Bond Resolution Retired Home Ownership Revenue Bonds: 1987 $ 52,675 1988 92,050 All Other 1,275 Housing Revenue Bonds 45 Line of Credit – Mortgage Financing 11,247 In addition, subsequent to June 30, 2011, the Authority issued the following bonds (in thousands):
Program/Bond Resolution Issuances Multifamily Stand Alone Bonds $ 9,100 Line of Credit – Mortgage Financing 13,892

156

Required Supplementary Information
157

158

State of Wisconsin Required Supplementary Information
For the Fiscal Year Ended June 30, 2011 159
Postemployment Benefits - State Health Insurance Program The funding progress for the State of Wisconsin Health Insurance Plan is provided below (in thousands):
Actuarial Actuarial Accrued UAAL as a
Actuarial Valuation Liability (AAL) – Unfunded AAL Funded Covered Percentage of Valuation Of Assets Entry Age (UAAL) Ratio Payroll Covered Payroll
Date (a) (b) (b – a) (a / b) (c) ((b – a) / c) 1/1/2009 $ 0 $ 1,329,526 $ 1,329,526 0.0% $ 3,053,972 43.5% 1/1/2007 $ 0 $ 1,472,774 $ 1,472,774 0.0% $ 2,842,917 51.8%

State of Wisconsin Required Supplementary Information
For the Fiscal Year Ended June 30, 2011 160
Infrastructure Assets Reported Using the Modified Approach The State has adopted the modified approach for reporting infrastructure assets. Under the modified approach, infrastructure assets are not depreciated as long as the State can demonstrate that these assets are properly managed and are being preserved at or above an established condition level. Instead of depreciation, the costs to maintain and preserve infrastructure assets are expensed, while additions and improvements are capitalized. The State owns approximately 11,200 centerline miles of roads and 5,100 bridges. Road Network Condition assessments are completed on a two-year cycle with the most current results reported for each State road. Numerous measures are used to assess the condition of the State’s road network. The State has adopted the International Roughness Index (IRI), as defined by the Federal Highway Administration, as its primary condition measure. IRI is measured on a scale of 0 to 5, with an IRI of 2.69 or greater being defined as a “poor” ride. Roads with a “poor” IRI assessment cause negative impacts for the traveling public by decreasing driver comfort and increasing the damage to vehicles and goods. It is the State’s policy to ensure no more than 15 percent of its roads receive a “poor” IRI assessment. Recent condition assessment results are as follows:
Year Miles Percent VarianceEnded of Rated Established Favorable/
June 30 Road “Poor” Percent (Unfavorable)
2011 11,200 12.0* 15.0 3.0
2010 11,200 9.3* 15.0 5.7
2009 11,200 6.9 15.0 8.1
2008 11,200 6.9 15.0 8.1
2007 11,200 6.4 15.0 8.6
2006 11,200 5.4 15.0 9.6
2005 11,200 5.8 15.0 9.2
2004 11,200 6.1 15.0 8.9
2003 11,200 4.3 15.0 10.7
2002 11,200 4.6 15.0 10.4
*The increase in the percentage of roads rated poorly is partially attributable to the use of new equipment used in assessing the IRI. For 2011, all the miles were tested using the new equipment.
DOT officials believe the current data collection methods provide a more accurate view of existing ride quality because of improvements in equipment and methodology. Each year the State estimates the costs to maintain and preserve the road network at, or above, the established condition level. Actual maintenance/preservation costs compare to estimates as follows:
VarianceYear Estimated Actual (In millions)
Ended Costs Costs Favorable/June 30 (In millions) (In millions) (Unfavorable)
2011 $ 606.7 $ 705.7 $ (99.0)
2010 660.7 669.1 (8.4)
2009 647.7 624.4 23.3
2008 531.8 537.3 (5.5)
2007 501.8 441.6 60.2
2006 495.7 367.5 128.2
2005 366.6 333.8 32.8
2004 450.8 341.1 109.7
2003 420.9 336.7 84.2
2002 470.7 437.6 33.1
Estimated costs are developed at the beginning of the fiscal year based on projects planned for the current and future years. The types of projects ultimately contracted and incurring costs during the year are often very different. In addition, the State of Wisconsin, Department of Transportation’s multi-year contracting process, allowing encumbrances to carry forward, makes a comparison of actual to estimated amounts difficult since expenditures for the current year may have been budgeted and committed to a project in prior years. Estimated costs for 2005 and actual costs for 2005 through 2008 have been restated from amounts reported in prior years due to an error in classification of costs on a capital project as maintenance/preservation costs. Bridge Network Condition assessments are completed on a two-year cycle, with more frequent inspections completed if warranted. The most current assessment results are reported for each State bridge, making the overall assessment a blend of measures completed in the current fiscal year and those completed in the prior year. The structural condition rating is a broad measure of the condition of a bridge. Each bridge is rated using three National Bridge Inventory (NBI) condition codes and two NBI appraisal ratings.
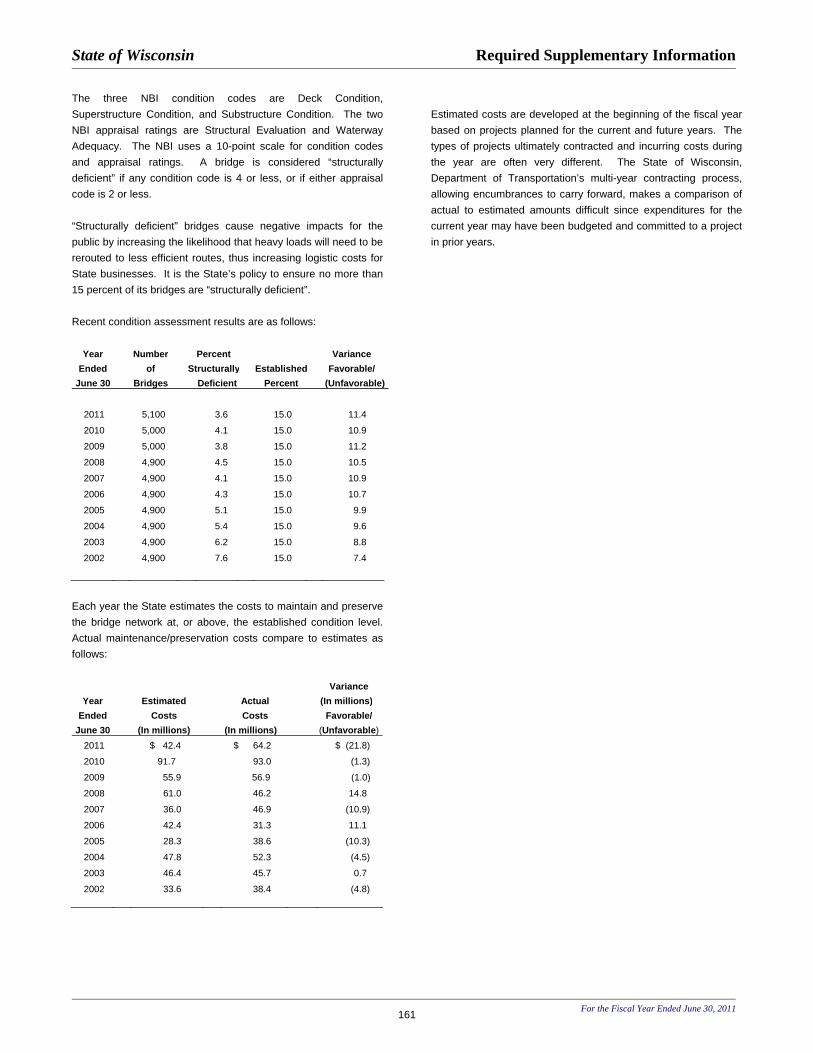
State of Wisconsin Required Supplementary Information
For the Fiscal Year Ended June 30, 2011 161
The three NBI condition codes are Deck Condition, Superstructure Condition, and Substructure Condition. The two NBI appraisal ratings are Structural Evaluation and Waterway Adequacy. The NBI uses a 10-point scale for condition codes and appraisal ratings. A bridge is considered “structurally deficient” if any condition code is 4 or less, or if either appraisal code is 2 or less. “Structurally deficient” bridges cause negative impacts for the public by increasing the likelihood that heavy loads will need to be rerouted to less efficient routes, thus increasing logistic costs for State businesses. It is the State’s policy to ensure no more than 15 percent of its bridges are “structurally deficient”. Recent condition assessment results are as follows:
Year Number Percent VarianceEnded of Structurally Established Favorable/
June 30 Bridges Deficient Percent (Unfavorable)
2011 5,100 3.6 15.0 11.4
2010 5,000 4.1 15.0 10.9
2009 5,000 3.8 15.0 11.2
2008 4,900 4.5 15.0 10.5
2007 4,900 4.1 15.0 10.9
2006 4,900 4.3 15.0 10.7
2005 4,900 5.1 15.0 9.9
2004 4,900 5.4 15.0 9.6
2003 4,900 6.2 15.0 8.8
2002 4,900 7.6 15.0 7.4
Each year the State estimates the costs to maintain and preserve the bridge network at, or above, the established condition level. Actual maintenance/preservation costs compare to estimates as follows:
VarianceYear Estimated Actual (In millions)
Ended Costs Costs Favorable/June 30 (In millions) (In millions) (Unfavorable)
2011 $ 42.4 $ 64.2 $ (21.8)
2010 91.7 93.0 (1.3)
2009 55.9 56.9 (1.0)
2008 61.0 46.2 14.8
2007 36.0 46.9 (10.9)
2006 42.4 31.3 11.1
2005 28.3 38.6 (10.3)
2004 47.8 52.3 (4.5)
2003 46.4 45.7 0.7
2002 33.6 38.4 (4.8)
Estimated costs are developed at the beginning of the fiscal year based on projects planned for the current and future years. The types of projects ultimately contracted and incurring costs during the year are often very different. The State of Wisconsin, Department of Transportation’s multi-year contracting process, allowing encumbrances to carry forward, makes a comparison of actual to estimated amounts difficult since expenditures for the current year may have been budgeted and committed to a project in prior years.

State of WisconsinBudgetary Comparison Schedule General Fund For the Fiscal Year Ended June 30, 2011
(In Thousands)
Original Final ActualBudget Budget Amounts
Unexpended Budgetary Fund Balances, Beginning of Year $ 888,575
Revenues and Transfers (Inflows): Taxes $ 12,907,646 $ 12,950,045 12,937,210 Departmental: Tribal Gaming 22,312 22,330 24,665 Other 16,354,157 (A) 16,365,580 (A) 15,964,643 Transfers from: Transportation Fund (A) (A) 40,846 Nonmajor Governmental Funds (A) (A) 150,398 Nonmajor Enterprise Funds (A) (A) 317
Total Revenues and Transfers (Inflows) 29,284,115 29,337,955 29,118,079
Amounts Available for Appropriation 30,006,654
Appropriations (Outflows): Commerce 298,573 633,011 393,116 Education 11,536,103 12,874,949 12,238,342 Environmental Resources 283,376 328,391 207,412 Human Relations and Resources 10,579,349 14,516,194 12,421,088 General Executive 1,117,347 1,739,512 1,141,626 Judicial 136,818 139,185 134,552 Legislative 73,918 76,808 66,199 Tax Relief and Other General 2,274,007 2,323,129 2,272,267 Transfers to: Nonmajor Governmental Funds 25,000 25,000 39,782
Total Appropriations (Outflows) $ 26,324,491 $ 32,656,179 28,914,384
Fund Balances, End of Year 1,092,270
Less Encumbrances Outstanding at June 30, 2011 (778,451)
Fund Balances, End of Year Budgetary Basis $ 313,819
Reconciliation of the End of Year, Budgetary Basis, Fund Balance to the Detail Reported in the Annual Fiscal Report: General Purpose: Designated $ 8,236 Undesignated 85,567 Total General Purpose 93,803 Program Revenue 220,016 Fund Balances, End of Year Budgetary Basis $ 313,819
(A) Interfund transfers to the General Fund were budgeted under departmental revenue during Fiscal Year 2011.
162

State of WisconsinBudgetary Comparison Schedule Transportation Fund For the Fiscal Year Ended June 30, 2011
(In Thousands)
Original Final ActualBudget Budget Amounts
Unexpended Budgetary Fund Balances, Beginning of Year $ 554,311
Revenues (Inflows): Taxes $ 1,028,911 $ 1,028,911 1,028,911 Departmental 1,905,058 1,905,058 1,905,058 Transfers from: Nonmajor Governmental Funds 17,800 17,800 17,800
Total Revenues (Inflows) 2,951,769 2,951,769 2,951,769
Amounts Available for Appropriation 3,506,080
Appropriations and Transfers (Outflows): Environmental Resources 2,625,925 6,183,172 2,687,282 General Executive 1,764 1,824 1,495 Tax Relief and Other General 24,160 22,240 21,811 Transfers to: General Fund 40,825 40,825 40,846
Total Appropriations and Transfers (Outflows) $ 2,692,674 $ 6,248,061 2,751,434
Fund Balances, End of Year 754,646
Less Encumbrances Outstanding at June 30, 2011 (1,637,392)
Fund Balances, End of Year Budgetary Basis $ (882,746)
163

164
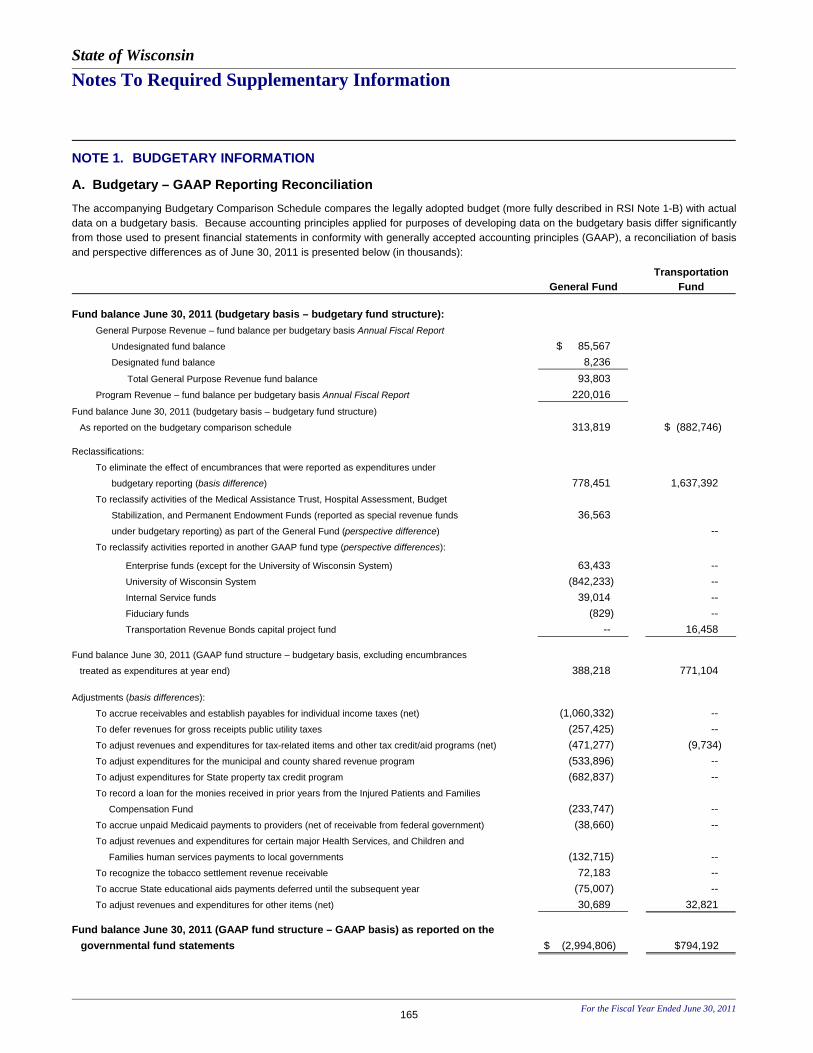
State of Wisconsin Notes To Required Supplementary Information
For the Fiscal Year Ended June 30, 2011 165
NOTE 1. BUDGETARY INFORMATION A. Budgetary – GAAP Reporting Reconciliation The accompanying Budgetary Comparison Schedule compares the legally adopted budget (more fully described in RSI Note 1-B) with actual data on a budgetary basis. Because accounting principles applied for purposes of developing data on the budgetary basis differ significantly from those used to present financial statements in conformity with generally accepted accounting principles (GAAP), a reconciliation of basis and perspective differences as of June 30, 2011 is presented below (in thousands):
General Fund
Transportation Fund
Fund balance June 30, 2011 (budgetary basis – budgetary fund structure): General Purpose Revenue – fund balance per budgetary basis Annual Fiscal Report Undesignated fund balance $ 85,567 Designated fund balance 8,236 Total General Purpose Revenue fund balance 93,803 Program Revenue – fund balance per budgetary basis Annual Fiscal Report 220,016
Fund balance June 30, 2011 (budgetary basis – budgetary fund structure) As reported on the budgetary comparison schedule 313,819 $ (882,746) Reclassifications:
To eliminate the effect of encumbrances that were reported as expenditures under budgetary reporting (basis difference) 778,451 1,637,392 To reclassify activities of the Medical Assistance Trust, Hospital Assessment, Budget Stabilization, and Permanent Endowment Funds (reported as special revenue funds 36,563 under budgetary reporting) as part of the General Fund (perspective difference) -- To reclassify activities reported in another GAAP fund type (perspective differences):
Enterprise funds (except for the University of Wisconsin System) 63,433 -- University of Wisconsin System (842,233) -- Internal Service funds 39,014 -- Fiduciary funds (829) -- Transportation Revenue Bonds capital project fund -- 16,458
Fund balance June 30, 2011 (GAAP fund structure – budgetary basis, excluding encumbrances treated as expenditures at year end) 388,218 771,104 Adjustments (basis differences):
To accrue receivables and establish payables for individual income taxes (net) (1,060,332) -- To defer revenues for gross receipts public utility taxes (257,425) -- To adjust revenues and expenditures for tax-related items and other tax credit/aid programs (net) (471,277) (9,734) To adjust expenditures for the municipal and county shared revenue program (533,896) -- To adjust expenditures for State property tax credit program (682,837) -- To record a loan for the monies received in prior years from the Injured Patients and Families
Compensation Fund
(233,747)
--
To accrue unpaid Medicaid payments to providers (net of receivable from federal government) (38,660) -- To adjust revenues and expenditures for certain major Health Services, and Children and Families human services payments to local governments (132,715) -- To recognize the tobacco settlement revenue receivable 72,183 -- To accrue State educational aids payments deferred until the subsequent year (75,007) -- To adjust revenues and expenditures for other items (net) 30,689 32,821
Fund balance June 30, 2011 (GAAP fund structure – GAAP basis) as reported on the governmental fund statements $ (2,994,806) $794,192

State of Wisconsin Notes to Required Supplementary Information
For the Fiscal Year Ended June 30, 2011 166
B. Budgetary Basis of Accounting The State's biennial budget is prepared using a modified cash basis of accounting. The final budget is primarily a general purpose revenue and expenditure budget. General purpose revenues consist of general taxes and miscellaneous receipts which are paid into the General Fund, lose their identity, and are then available for appropriation by the Legislature. The remaining revenues consist of program revenues, which are credited by law to an appropriation to finance a specified program or State agency, and segregated revenues which are paid into separate identifiable funds. While State departments and agencies are required to submit estimates of expected revenues for program revenue and segregated revenue categories, these estimates are not formally incorporated into the adopted budget except for revenue estimates of the Lottery Fund. As a result, legally budgeted revenues for these categories are not available and, consequently, actual amounts are reported in the budget column of the Budgetary Comparison Schedules. Expenditure budgeting differs for the various types of appropriations. For most appropriations, budgeted expenditures equal the amount from the adopted budget plus any subsequent legislative or administrative revisions. Various supplemental appropriations were approved during the year and have been incorporated into the budget figures. While State statutes prohibit spending beyond budgetary authority, a provision is made to include the value of accounts receivable, inventories and work in process in identifying available revenues. The State also utilizes nonbudget accounts for which no budget is established but expenditures may be incurred. As a result, actual expenditures may exceed budgeted amounts in certain categories. The budgetary basis of accounting required by State law differs materially from the basis used to report revenues and expenditures in accordance with GAAP. Other variances arise because the State's biennial budget is developed according to the statutory required fund structure which differs extensively from the fund structure used in the GAAP basis financial statements. This difference is primarily caused by the elimination of the University of Wisconsin System, and various fiduciary, proprietary and other governmental fund activity from the statutory General and Transportation funds. In addition, funds such as the Medical Assistance Trust, Hospital Assessment, Budget Stabilization and Permanent Endowment, special revenue funds under statutory reporting, are included as part of the General Fund under GAAP reporting. As a consequence of these differences, a reconciliation between budgetary basis and GAAP basis is provided in Note 1-A of the notes to the required supplementary information. The Budgetary Comparison Schedules for the General and the Transportation Fund present both the original and final
appropriated budgets, as well as the actual inflows, outflows, and fund balance on the budgetary basis. The supplementary budget comparison schedule provides this same information (with the exception of the original budget data) for the nonmajor governmental funds with annual budgets. The capital project and debt service funds are excluded from this schedule because no comprehensive budget is approved for these funds. Two special revenue funds, the Wisconsin Public Broadcasting Foundation and the Celebrate Children Foundation, have been excluded from reporting because they are blended component units that are neither budgeted nor included under statutory reporting. Of the permanent funds, only the Historical Society Fund and a portion of the Common School and Normal School funds are budgeted. The State’s biennial budget was enacted and published on June 29, 2009. This legislation is recognized by State officials as the original budget and is treated as such on the Budgetary Comparison Schedules. While the legal level of budgetary control for the reported funds is maintained at the appropriation line as specified by the Legislature in Chapter 20 of the Wisconsin Statutes, this level of detail is impractical for inclusion in the Comprehensive Annual Financial Report. Accordingly, a supplementary report is available upon request which provides budgetary comparisons at the legal level of control. Appropriation unexpended balances lapse at year-end or forward to the subsequent fiscal year depending on the type of appropriation involved:
• Continuing - unexpended balances automatically forward to ensuing
years until fully depleted or repealed by subsequent action of the Legislature.
• Annual: General Purpose Revenue - unencumbered balances lapse at year
end. Program Revenue - unexpended cash balances may be forwarded to
the next fiscal year. • Biennial - unexpended balances or deficits automatically forward to the
second year. At the end of the second year all unencumbered general purpose revenue balances lapse.
• Sum sufficient - moneys are appropriated and expended in the amounts necessary to accomplish the purpose specified.
Encumbrances may be carried over to the next fiscal year as a revision to the budgetary appropriation with Department of Administration approval. Under budgetary reporting, encumbrances are treated like expenditures and are shown as a reduction of fund balance.

Supplementary Information
167

168

State of Wisconsin Nonmajor Governmental Funds
169
SPECIAL REVENUE: Special revenue funds account for the proceeds of specific revenue sources that are legally restricted to expenditures for a specified purpose. The State's special revenue funds are described below: The Conservation Fund accounts for the management of the State's fish, wildlife, parks and other natural resources with funds provided from hunting and fishing licenses, recreational fees and forestry taxes. The Election Administration Fund accounts for federal and State moneys provided to develop, administer and manage a statewide voter registration system; enabling all qualified electors, including those with disabilities, the opportunity to vote while maintaining uniform standards within the voting process and safeguarding the vote of all electors. The Utility Public Benefits Fund accounts for voluntary contributions and public benefits fees collected from customers by utilities to assist in funding low income assistance grants and energy conservation and efficiency grants. The Petroleum Inspection Fund accounts for revenues received from inspection fees on petroleum products shipped into Wisconsin and proceeds received from revenue bonds. These resources are used for petroleum inspection programs, environmental cleanup awards, clean air and water administration and other environmental programs in the State. The Wisconsin Public Broadcasting Foundation Fund accounts for financial resources generated to support the activities of the Educational Communications Board. The primary revenue sources of the fund are from gifts, grants and contributions. The Celebrate Children Foundation Fund is a publicly supported not-for-profit corporation dedicated to obtaining and investing resources in quality childhood and family development experiences to ensure an environment in which all Wisconsin children become healthy and productive citizens. This fund is supported primarily by the transfer of license plate fee contributions. The Other Environmental Special Revenue Funds, in conjunction with the Conservation Fund, account for resources used to provide for the preservation of the State’s parks, forests and environment, and includes the following:
• The Heritage State Parks and Forests Fund accounts for the
funding for operations and maintenance of State parks, southern State forests, and recreation areas either by making partial matching grants to "friends groups" or by accepting expenditure transfers from park and forest programs in the Conservation Fund.
• The Waste Management Fund accounts for the closure and
long-term care of approved landfills from fees imposed on landfill operators.
• The Environmental Fund accounts for the development and
enforcement of groundwater standards, as well as assistance in the emergency response, investigation and clean up of contaminated sites. This assistance is funded by fees on activities or substances which may contaminate groundwater and fees for solid waste tipping, pesticide licenses and oil inspections.
• The Dry Cleaner Environmental Response Fund accounts
for the financial assistance for the remediation of environmental contamination caused by the spillage of dry cleaning solvents. Revenues used to fund this program are dry cleaning facility license and solvent fees.
• The Recycling and Renewable Energy Fund accounts for the
moneys from the recycling surcharge tax and recycling fees, used to reduce the amount of solid waste disposed of in landfills and incinerators.
The Other Special Revenue Funds account for resources that must be used for specific purposes and include the following: • The Wisconsin Election Campaign Fund accounts for
taxpayer donated funding for political candidates. The donations are intended to replace special interest funds.
• The Investment and Local Impact Fund accounts for grants
and loans to municipalities where metalliferous minerals exist to offset the negative effects of mining projects. These grants and loans are funded with taxes which have been imposed on mining activities.
• The Industrial Building Construction Loan Fund accounts
for economic development grants and loans for the construction of industrial buildings. These grants and loans are funded primarily with investment income.
(Continued)

State of Wisconsin Nonmajor Governmental Funds (Continued)
170
• The Self-insured Employers Liability Fund collects fees
assessed from employers who self-insure for workers compensation purposes. The reserve is used to pay judgements owed to employees of insolvent self-insured employers.
• The Work Injury Supplemental Benefit Fund accounts for
compensatory payments to survivors of fatally injured employees or disabled employees with work-related injuries. This compensation is provided with funds collected from State employers and insurance carriers.
• The Workers Compensation Fund accounts for the
expenditures related to administering the worker’s compensation laws in Wisconsin. These expenditures are funded by annual assessments of insurers and self-insured employers doing business in the State.
• The Uninsured Employers Fund accounts for the
administration of insurance enforcement activities and compensation to injured employees of uninsured employers. The revenue is primarily provided by funds collected from uninsured employers.
• The Mediation Fund accounts for the resolution of disputes
regarding medical malpractice. Dispute filing fees and fees charged to health care providers are the primary revenue sources.
• The Police and Fire Protection Fund accounts for the
distribution of fees collected by communication providers and retailers for distribution to counties and municipalities as State shared revenue.
• The Working Land Fund accounts for the deposit of farmland
preservation conversion fees, gifts and grants. Proceeds are used to purchase agriculture conservation easements and to provide grants to counties for farmland preservation plan costs.
• The State Capitol Restoration Fund accounts for moneys
from private donations used to offset the costs of restoration work at the State Capitol.
• The Agricultural Chemical Cleanup Fund accounts for the
portion of the costs responsible persons pay to clean up fertilizer and pesticide spills and historical handling areas. Fertilizer and pesticide licenses and registration fees primarily provide the revenue.
• The Agrichemical Management Fund accounts for the
regulation and enforcement of pesticide, feed and fertilizer industries. The revenue is generated by licenses and fees assessed to these industries.
• The Agricultural Producer Security Fund accounts for fees,
surcharges, assessments, reimbursements and bond proceeds of surety bonds collected from contractors doing business with agricultural producers. Payments are made to producers from the fund if contractors default on amounts owed to producers.
• The Historical Legacy Trust Fund accounts for gifts, grants
and bequests given to commemorate the 200th anniversary of statehood. All moneys received by the State Sesquicentennial Commission after September 30, 1998 are also reported in this fund.
• The History Preservation Partnership Trust Fund accounts
for moneys received from admissions, sales, and other receipts of the Historical Society. The fund is supported primarily by program revenues from daily receipts, site deposits and other generated income from goods and services.
• The Wireless 911 Fund accounted for wireless telephone
customer surcharges used to provide grants to wireless providers and local governments to devise wireless 911 emergency telephone service systems. 2009 Wisconsin Act 28 ended the grant program and most of the remaining resources were provided to local governments through shared revenue under Wisconsin Statutes 20.835(q).
• The Military Family Relief Fund accounts for donations
received via designation on Wisconsin state income tax returns, gifts, and bequests. Resources are used to provide financial assistance to the spouse and dependent children of service members who are residents of this state and serving on active duty in the U.S. armed forces.
• The Universal Service Fund accounts for programs that
ensure that all State residents receive essential telecommunication services at reasonable prices and that they have access to certain advanced telecommunications service capabilities. Assessment of entities in the telecommunications industry is the primary source of revenues.
• The Children's Trust Fund accounts for the program which
provides information and encourages the development of child abuse and neglect prevention programs. This fund is supported primarily with investment income and moneys received as contributions, grants, gifts and bequests.
(Continued)

State of Wisconsin Nonmajor Governmental Funds (Continued)
171
DEBT SERVICE: Debt service funds account for the accumulation of resources for, and the payment of, principal, interest and related costs of general long-term obligations. The Bond Security and Redemption Fund accounts for the accumulation of resources for, and the payment of principal, interest and related costs of, general obligation bond debt. The Annual Appropriation Bonds Fund accounts for the accumulation of resources for, and the payment of principal, interest and related costs of, the appropriation obligations issued in Fiscal Year 2004 to pay the State’s unfunded accrued prior service (pension) liability and its unfunded accrued liability for sick leave conversion credits. The 2009 Annual Appropriation Bonds Fund accounts for the accumulation of resources for, and the payment of principal, interest and related costs of, the appropriation obligations issued in Fiscal Year 2009 to purchase tobacco settlement revenues that were previously sold by the State to the Badger Tobacco Asset Securitization Corporation. The Badger Tobacco Asset Securitization Fund accounts for the accumulation of resources for, and the payment of principal, interest and related costs of bonds issued by the Badger Tobacco Asset Securitization Corporation (BTASC) in Fiscal Year 2002 for the purpose of making a one-time purchase of Tobacco Settlement Revenues from the State. These bonds are revenue obligations of the BTASC secured by, and payable solely and only out of, the moneys, assets or revenues pledged by the BTASC. The Petroleum Inspection Revenue Bonds Fund accounts for the accumulation of resources for, and the payment of principal, interest and related costs of, petroleum inspection fee revenue bond obligations. The Transportation Revenue Bonds Fund accounts for the accumulation of resources for, and the payment of principal, interest and related costs of, transportation revenue bond obligations. CAPITAL PROJECTS: Capital projects funds account for financial resources used for the acquisition, construction, renovation or repair of major capital facilities (other than those financed by proprietary funds and trust funds). The State's capital projects funds are described below: The Building Trust Fund accounts for repair projects of major capital facilities which are funded primarily through General Fund and agency transfers.
The Capital Improvement Fund accounts for revenues from general obligation bond proceeds, General Fund transfers and investment pool interest earnings which are primarily used for the acquisition or construction of major capital facilities and for repair and maintenance projects. The Transportation Revenue Bonds Fund accounts for the accumulation of financing resources for the construction, maintenance, and repair of certain major highway projects and administrative facilities. PERMANENT: Permanent funds are used to report resources that are legally restricted to the extent that only earnings, not principal, may be used to support the State’s programs. The Historical Society Fund accounts for investment income and donations received by the Wisconsin Historical Society to assist in the operations of the State's archives, research and library services, museums, historic preservation, and executive and administrative services. The Other Permanent Fund accounts for various resources with legal restrictions requiring that principal remain intact and only earnings may be spent, including the following: • The Agricultural College and University statutory funds
account for federal land grant revenues used as public purpose loans for municipalities and school districts.
• The Normal School statutory fund accounts for public purpose
loans to municipalities and school districts. These loans are financed with revenues derived from the sale of federally granted land and timber. The interest generated from this fund is used to support and maintain State universities.
• The Benevolent statutory fund accounts for investment income
used for the care, custody and education of residents committed to the Lincoln Hills School.

State of WisconsinCombining Balance Sheet - Nonmajor Governmental Funds June 30, 2011
(In Thousands)
WisconsinUtility Public
Election Public Petroleum BroadcastingConservation Administration Benefits Inspection Foundation
Assets Cash and Cash Equivalents $ 18,086 $ 14,048 $ 38,182 $ 6,566 $ 6,526 Investments - - - - 7,006 Receivables (net of allowance): Taxes 30,469 - - - - Loans to Local Governments 3,588 - - - - Other Receivables 6,196 32 6,866 1 453 Due from Other Funds 8,729 27 1,494 12,687 - Due from Other Governments 15,906 22 - - - Inventories 2,682 - - - 9 Prepaid Items 2,455 18 11 109 69 Restricted and Limited Use Assets: Cash and Cash Equivalents - - - - - Investments - - - - -
Total Assets $ 88,112 $ 14,147 $ 46,553 $ 19,364 $ 14,062
Liabilities and Fund Balances Liabilities: Accounts Payable and Other Accrued Liabilities $ 11,593 $ 124 $ 3,637 $ 8,735 $ 127 Due to Other Funds 11,298 97 9,164 5,049 254 Interfund Payables - - - - - Due to Other Governments 4,327 - 558 139 - Tax Refunds Payable - - - - - Tax and Other Deposits 1,602 - - - - Unearned Revenue 3,313 - 1,576 - 127 Deferred Revenue 247 - - - - Interest Payable - - - - - Advances from Other Funds - - - - - Short-term Notes Payable - - - 71,150 - Revenue Bonds and Notes Payable - - - - -
Total Liabilities 32,379 222 14,936 85,073 508
Fund Balances: Nonspendable 5,137 18 11 109 235 Restricted 46,329 13,907 - 85 13,320 Committed 4,267 - 31,606 - - Assigned - - - - - Unassigned - - - (65,903) -
Total Fund Balance 55,733 13,925 31,617 (65,709) 13,554
Total Liabilities and Fund Balance $ 88,112 $ 14,147 $ 46,553 $ 19,364 $ 14,062
Special Revenue Funds
172

Other TotalCelebrate Environmental Other Special Bond Annual 2009 AnnualChildren Special Special Revenue Security and Appropriation Appropriation
Foundation Revenue Revenue Funds Redemption Bonds Bonds
$ 268 $ 34,634 $ 47,299 $ 165,610 $ 39,870 $ - $ - 1,319 - - 8,324 - - -
- 342 - 30,810 - - - - - - 3,588 - - -
56 13,057 29,803 56,466 - - - - 39,570 1,553 64,060 - - - - 1,973 3 17,904 - - - - - 11 2,702 - - - - 9,737 89 12,488 - - -
- - - - - 26,940 130 - - - - - 7,040 -
$ 1,643 $ 99,313 $ 78,759 $ 361,953 $ 39,870 $ 33,980 $ 130
$ 34 $ 2,406 $ 2,269 $ 28,923 $ - $ - $ - - 17,888 5,083 48,834 3,332 - - - 13,492 4,633 18,124 - - - - 681 - 5,706 - - - - 162 - 162 - - - - 8,938 - 10,540 - - - - 600 2 5,618 - - - - - 8,777 9,024 - - - - - - - - - - - 3,451 - 3,451 - - - - - - 71,150 - - -
- - - - - - -
34 47,617 20,764 201,532 3,332 - -
1,204 9,737 100 16,551 - - - 405 8,674 22,218 104,937 36,537 33,980 130
- 36,545 35,678 108,095 - - - - - - - - - - - (3,260) - (69,163) - - -
1,609 51,696 57,995 160,421 36,537 33,980 130
$ 1,643 $ 99,313 $ 78,759 $ 361,953 $ 39,870 $ 33,980 $ 130 (Continued)
Special Revenue Funds Debt Service Funds
173
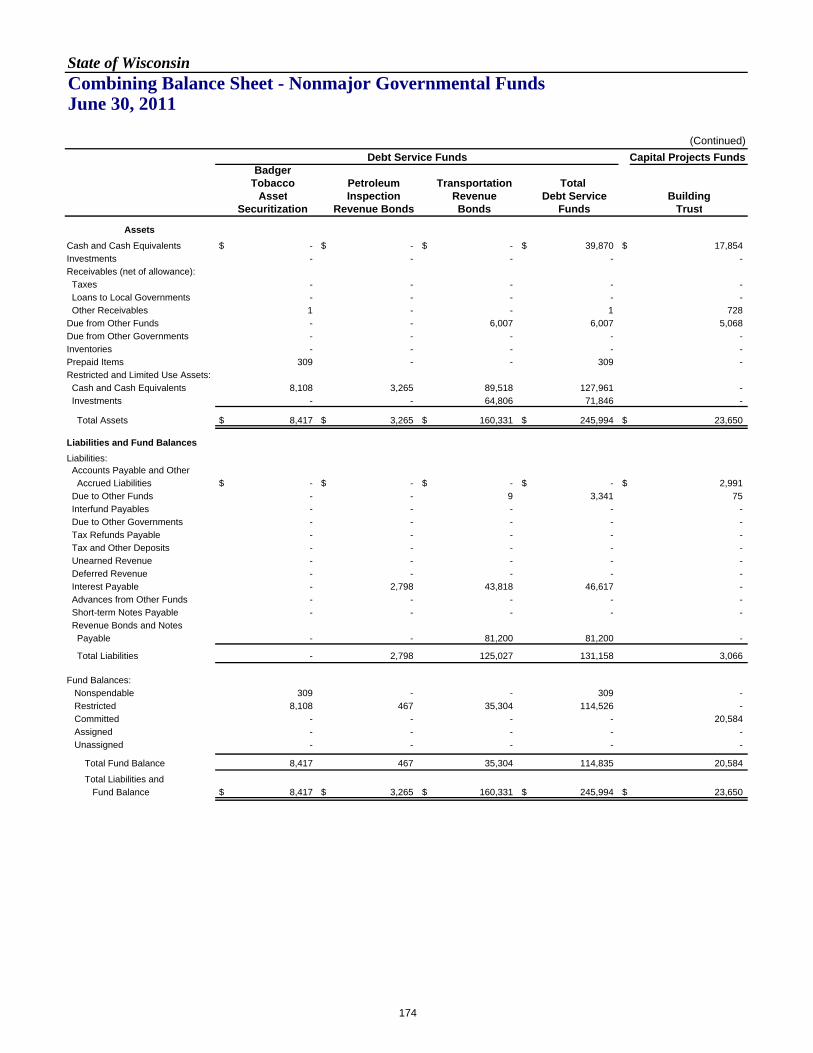
State of WisconsinCombining Balance Sheet - Nonmajor Governmental Funds June 30, 2011
(Continued)Capital Projects Funds
BadgerTobacco Petroleum Transportation Total
Asset Inspection Revenue Debt Service BuildingSecuritization Revenue Bonds Bonds Funds Trust
Assets Cash and Cash Equivalents $ - $ - $ - $ 39,870 $ 17,854 Investments - - - - - Receivables (net of allowance): Taxes - - - - - Loans to Local Governments - - - - - Other Receivables 1 - - 1 728 Due from Other Funds - - 6,007 6,007 5,068 Due from Other Governments - - - - - Inventories - - - - - Prepaid Items 309 - - 309 - Restricted and Limited Use Assets: Cash and Cash Equivalents 8,108 3,265 89,518 127,961 - Investments - - 64,806 71,846 -
Total Assets $ 8,417 $ 3,265 $ 160,331 $ 245,994 $ 23,650
Liabilities and Fund Balances Liabilities: Accounts Payable and Other Accrued Liabilities $ - $ - $ - $ - $ 2,991 Due to Other Funds - - 9 3,341 75 Interfund Payables - - - - - Due to Other Governments - - - - - Tax Refunds Payable - - - - - Tax and Other Deposits - - - - - Unearned Revenue - - - - - Deferred Revenue - - - - - Interest Payable - 2,798 43,818 46,617 - Advances from Other Funds - - - - - Short-term Notes Payable - - - - - Revenue Bonds and Notes Payable - - 81,200 81,200 -
Total Liabilities - 2,798 125,027 131,158 3,066
Fund Balances: Nonspendable 309 - - 309 - Restricted 8,108 467 35,304 114,526 - Committed - - - - 20,584 Assigned - - - - - Unassigned - - - - -
Total Fund Balance 8,417 467 35,304 114,835 20,584
Total Liabilities and Fund Balance $ 8,417 $ 3,265 $ 160,331 $ 245,994 $ 23,650
Debt Service Funds
174

Capital Projects Funds
Transportation Total Capital Total Total NonmajorCapital Revenue Projects Historical Other Permanent Governmental
Improvement Bonds Funds Society Permanent Funds Funds
$ 6,440 $ - $ 24,293 $ 228 $ 1,364 $ 1,592 $ 231,365- - - 11,026 3,190 14,216 22,540
- - - - - - 30,810- - - - 19,955 19,955 23,5431 - 729 9 - 9 57,204
15,099 9 20,176 11 523 533 90,777- - - - - - 17,904- - - - - - 2,702- - - 6 1 7 12,803
- 40,816 40,816 - - - 168,777- 49,998 49,998 - - - 121,844
$ 21,540 $ 90,823 $ 136,012 $ 11,279 $ 25,032 $ 36,312 $ 780,270
$ 7,467 $ - $ 10,458 $ 3 $ 1 $ 4 $ 39,38625,457 31,530 57,062 4 13 17 109,254
- - - - - - 18,1245,162 - 5,162 - - - 10,867
- - - - - - 162- - - - 24 24 10,565- - - - - - 5,618- - - - - - 9,024- - - - - - 46,617- - - - - - 3,451
529,014 146,593 675,607 - - - 746,757
- - - - - - 81,200
567,099 178,123 748,289 7 38 45 1,081,025
- - - 11,272 23,888 35,160 52,020 - - - - 1,107 1,107 220,571 - - 20,584 - - - 128,679 - - - - - - -
(545,560) (87,300) (632,860) - - - (702,023)
(545,560) (87,300) (612,277) 11,272 24,994 36,266 (300,754)
$ 21,540 $ 90,823 $ 136,012 $ 11,279 $ 25,032 $ 36,312 $ 780,270
Permanent Funds
175

State of WisconsinCombining Statement of Revenues, Expenditures, and Changes in Fund Balances - Nonmajor Governmental FundsFor the Fiscal Year Ended June 30, 2011
(In Thousands)
WisconsinUtility Public
Election Public Petroleum BroadcastingConservation Administration Benefits Inspection Foundation
Revenues: Taxes $ 94,815 $ - $ - $ 68,235 $ - $ Intergovernmental 57,093 241 - - - Licenses and Permits 104,496 - 107,661 97 - Charges for Goods and Services 15,584 - - 68 682 Investment and Interest Income (79) 29 54 18 1,057 Fines and Forfeitures 349 - - - - Gifts and Donations 1,165 - - - 10,513 Miscellaneous: Other 734 180 - 18 -
Total Revenues 274,158 450 107,715 68,437 12,252
Expenditures: Current: Commerce - - - - - Education - - - - 2,812 Transportation - - - - - Environmental Resources 262,657 - - 22,747 - Human Relations and Resources - - - - - General Executive - 2,531 85,285 - - Judicial - - - - - Tax Relief and Other General Expenditures - - - - - Intergovernmental - Shared Revenue - - - - - Capital Outlay 8,757 - - - - Debt Service: Principal - - - - - Interest - - - 285 - Other Expenditures - - - - -
Total Expenditures 271,415 2,531 85,285 23,032 2,812 Excess of Revenues Over (Under) Expenditures 2,744 (2,082) 22,430 45,404 9,439
Other Financing Sources (Uses): Long-term Debt Issued - - - - - Long-term Debt Issued - Refunding Bonds - - - - - Payments for Refunded Bonds - - - - - Payments to Refunding Bond Escrow Agent - - - - - Discount on Bonds - - - - - Premium on Bonds - - - - - Transfers In 23,029 68 - - - Transfers Out (28,729) (35) (9,173) (42,517) (7,463) Capital Lease Acquisitions 2,128 - - - - Installment Purchase Acquisitions - - - - -
Total Other Financing Sources (Uses) (3,571) 33 (9,173) (42,517) (7,463)
Net Change in Fund Balances (827) (2,049) 13,256 2,888 1,976
Fund Balances, Beginning of Year 56,924 15,974 18,361 (68,597) 11,580 Increase (Decrease) in Reserve for Inventories (363) - - - (2)
Fund Balances, End of Year $ 55,733 $ 13,925 $ 31,617 $ (65,709) $ 13,554 $
Special Revenue Funds
176

Other Total Celebrate Environmental Other Special Bond Annual 2009 AnnualChildren Special Special Revenue Security and Appropriation Appropriation
Foundation Revenue Revenue Funds Redemption Bonds Bonds
- $ 25,350 $ 2 $ 188,402 $ - $ - $ - - 4,468 - 61,802 9,983 - - - 83,142 125,462 420,858 - - -
- 1,260 3,982 21,577 - - -
236 48 63 1,426 98 194 121 - 1,469 2,115 3,933 - - -
282 - 100 12,060 - - -
- 1,120 306 2,358 - - -
517 116,857 132,030 712,415 10,081 194 121
- - 52,625 52,625 - - - - - 3,445 6,257 - - - - - - - - - - - 68,916 - 354,321 - - -
383 - 17,021 17,404 - - - - - - 87,816 - - - - - 287 287 - - -
- - 5 5 - 15 1
- - 53,192 53,192 - - - - 221 200 9,178 - - -
- - - - 80,101 20,050 5,785 - - - 285 223,531 101,769 86,788 - - - - 3,216 - -
383 69,137 126,774 581,370 306,848 121,834 92,574
135 47,720 5,255 131,045 (296,767) (121,640) (92,452)
- - - - - - -
- - - - 256,481 - -
- - - - (224,373) - -
- - - - (69,960) - - - - - - (144) - - - - - - 80,247 - -
120 17,099 101 40,416 509,166 121,716 92,457 (54) (72,401) (7,102) (167,475) (233,395) - -
- - - 2,128 - - -
- - - - - - -
66 (55,303) (7,002) (124,930) 318,022 121,716 92,457
201 (7,583) (1,746) 6,115 21,255 76 4
1,408 59,279 59,745 154,675 15,282 33,905 126
- (1) (3) (369) - - -
1,609 $ 51,696 $ 57,995 $ 160,421 $ 36,537 $ 33,980 $ 130
(Continued)
Special Revenue Funds Debt Service Funds
177

State of WisconsinCombining Statement of Revenues, Expenditures, and Changes in Fund Balances - Nonmajor Governmental Funds For the Fiscal Year Ended June 30, 2011
(Continued)Capital Projects Funds
BadgerTobacco Petroleum Transportation Total
Asset Inspection Revenue Debt Service BuildingSecuritization Revenue Bonds Bonds Funds Trust
Revenues: Taxes $ - $ 5,572 $ - $ 5,572 $ - $ Intergovernmental - - 4,006 13,990 21,097 Licenses and Permits - - 179,208 179,208 - Charges for Goods and Services - - - - - Investment and Interest Income 12 - 158 583 80 Fines and Forfeitures - - - - - Gifts and Donations - - - - - Miscellaneous: Other - - - - 51
Total Revenues 12 5,572 183,373 199,353 21,229
Expenditures: Current: Commerce - - - - - Education - - - - 36 Transportation - - - - 381 Environmental Resources - - - - 633 Human Relations and Resources - - - - 3,294 General Executive - - - - 197 Judicial - - - - - Tax Relief and Other General Expenditures 159 - - 175 321 Intergovernmental - Shared Revenue - - - - - Capital Outlay - - - - 23,589 Debt Service: Principal - - 81,200 187,136 - Interest - 5,597 81,940 499,625 - Other Expenditures - - - 3,216 -
Total Expenditures 159 5,597 163,140 690,152 28,452 Excess of Revenues Over (Under) Expenditures (147) (24) 20,232 (490,799) (7,223)
Other Financing Sources (Uses): Long-term Debt Issued - - - - - Long-term Debt Issued - Refunding Bonds - - - 256,481 - Payments for Refunded Bonds - - - (224,373) - Payments to Refunding Bond Escrow Agent - - - (69,960) - Discount on Bonds - - - (144) - Premium on Bonds - - - 80,247 - Transfers In - - - 723,339 9,961 Transfers Out - - (15,905) (249,301) (3,537) Capital Lease Acquisitions - - - - - Installment Purchase Acquisitions - - - - -
Total Other Financing Sources (Uses) - - (15,905) 516,290 6,424
Net Change in Fund Balances (147) (24) 4,327 25,491 (799)
Fund Balances, Beginning of Year 8,564 491 30,976 89,344 21,382 Increase (Decrease) in Reserve for Inventories - - - - -
Fund Balances, End of Year $ 8,417 $ 467 $ 35,304 $ 114,835 $ 20,584 $
Debt Service Funds
178

Capital Projects Funds
Transportation Total Capital Total Total NonmajorCapital Revenue Projects Historical Other Permanent Governmental
Improvement Bonds Funds Society Permanent Funds Funds
- $ - $ - $ - $ - $ - $ 193,974- - 21,097 - - - 96,889- 344 344 - - - 600,410
- - - 7 565 572 22,149
777 50 908 2,297 - 2,297 5,214- - - - - - 3,933- - - 1 - 1 12,061
- - 51 - 1,440 1,440 3,849
777 394 22,400 2,304 2,005 4,309 938,478
3,561 - 3,561 - - - 56,1861,376 - 1,412 358 97 455 8,125
97,031 26,173 123,585 - - - 123,58536,410 - 37,043 - - - 391,363
5,905 - 9,200 - - - 26,603429 - 626 - - - 88,443
- - - - - - 287
9,313 346 9,980 - - - 10,160
- - - - - - 53,192343,599 119,520 486,708 51 2,010 2,061 497,948
- - - - - - 187,1361,432 - 1,432 - - - 501,341
577 2,296 2,873 - - - 6,089
499,633 148,336 676,420 409 2,107 2,516 1,950,458
(498,855) (147,942) (654,020) 1,895 (102) 1,793 (1,011,981)
625,903 200,000 825,903 - - - 825,903
- - - - - - 256,481
- - - - - - (224,373)
- - - - - - (69,960)- - - - - - (144)- 11,000 11,000 - - - 91,246
235,608 15,905 261,474 - 298 298 1,025,527(380,701) (5,309) (389,546) (8) (180) (188) (806,509)
- - - - - - 2,128
308 - 308 - - - 308
481,118 221,596 709,139 (8) 117 110 1,100,609
(17,737) 73,654 55,118 1,887 16 1,903 88,628
(527,822) (160,955) (667,395) 9,385 24,978 34,363 (389,013)
- - - - - - (369)
(545,560) $ (87,300) $ (612,277) $ 11,272 $ 24,994 $ 36,266 $ (300,754)
Permanent Funds
179

State of WisconsinBudgetary Comparison Schedule Nonmajor Budgeted Governmental Funds For the Fiscal Year Ended June 30, 2011
(In Thousands)
Budget Actual Budget Actual Budget Actual Budget Actual
Unexpended Budgetary Fund Balances, Beginning of Year $ 51,366 $ 15,974 $ 497 $ 20,638
Revenues (Inflows):
Taxes $ 89,869 89,869 $ - - $ - - $ - - Budgeted Transfers from: General Fund - - - - 25,000 25,000 - - Nonmajor Governmental Funds - - - - 258,484 258,484 - - Departmental 195,697 195,697 517 517 175,634 175,634 414,738 414,738
Total Revenues 285,566 285,566 517 517 459,118 459,118 414,738 414,738
Amounts Available for Appropriation 336,932 16,491 459,615 435,376
Appropriations and Transfers (Outflows):
Commerce 1,591 1,589 - - - - - - Education 1,329 663 - - - - - - Environmental Resources 371,845 292,594 - - - - - - Human Relations and Resources - - - - 454,664 447,615 434,817 215,468 General Executive - - 3,540 2,566 - - - - Judicial - - - - - - - - Tax Relief and Other General 51 45 - - - - - - Budgeted Transfers to: General Fund - - - - 7,021 7,021 1,012 1,012 Transportation Fund - - - - - - - - Nonmajor Governmental Funds - - - - - - 202,312 202,312
Total Appropriations and Transfers $ 374,816 294,892 $ 3,540 2,566 $ 461,685 454,636 $ 638,141 418,792
Fund Balances End of Year 42,040 13,925 4,979 16,584
Less Encumbrances Outstanding at June 30, 2011 (31,215) - (27) (16,354)
Fund Balances, End of Year Budgetary Basis $ 10,825 $ 13,925 $ 4,952 $ 230
Special Revenue
ConservationMedical
Assistance TrustElection
AdministrationHospital
Assessment
180

PetroleumInspection
Budget Actual Budget Actual Budget Actual Budget Actual Budget Actual
$ 11,249 $ (53) $ 1,684 $ - $ 33,860
$ - - $ 67,583 67,583 $ - - $ - - $ 25,865 25,865
- - - - - 14,782 - - - - - - - - - - - - 2,530 2,530
107,992 107,992 202 202 120 120 128,626 128,626 109,663 109,663
107,992 107,992 67,785 67,785 120 14,902 128,626 128,626 138,058 138,058
119,241 67,732 16,586 128,626 171,918
463 395 19,253 17,360 - - - - 59,549 20,638 - - - - - - - - 4,960 4,233 - - 6,290 5,594 - - - - 103,669 66,558
18,279 18,279 1,610 980 - - - - 633 430 116,027 75,614 198 120 - - - - 280 208
- - - - - - - - - - - - 6,909 6,728 - - - - 3 -
- - 14,049 14,049 - - 78,626 78,626 44,540 44,540 - - 17,800 17,800 - - - - - - - - 2,530 2,530 - - 50,000 50,000 - -
$ 134,769 94,288 $ 68,639 65,161 $ - - $ 128,626 128,626 $ 213,634 136,607
24,953 2,571 16,586 - 35,311
(14,954) (69) - - (14,346)
$ 9,999 $ 2,502 $ 16,586 $ 0 $ 20,965
(Continued)
Utility PublicBenefits
Special Revenue
BudgetOther
EnvironmentalSpecial Revenue
PermanentEndowmentStabilization
181

State of WisconsinBudgetary Comparison Schedule Nonmajor Budgeted Governmental Funds For the Fiscal Year Ended June 30, 2011
(Continued)
Other SpecialRevenue
Budget Actual Budget Actual Budget Actual Budget Actual
Unexpended Budgetary Fund Balances, Beginning of Year $ 42,711 $ 810,654 $ 24,349 $ 9,385
Revenues (Inflows):
Taxes $ 2 2 $ - - $ - - $ - - Budgeted Transfers from: General Fund - - - - - - - - Nonmajor Governmental Funds - - - - - - - - Departmental 140,406 140,406 64,668 64,668 370 370 2,301 2,301
Total Revenues 140,408 140,408 64,668 64,668 370 370 2,301 2,301
Amounts Available for Appropriation 183,119 875,322 24,719 11,686
Appropriations and Transfers (Outflows):
Commerce 26,921 15,402 - - - - - - Education 27,373 25,569 39,600 33,600 298 278 610 414 Environmental Resources - - - - - - - - Human Relations and Resources 37,192 20,744 - - - - - - General Executive 19,785 18,342 - 298 - - - - Judicial 768 291 - - - - - - Tax Relief and Other General 61,056 53,196 - - - - - - Budgeted Transfers to: General Fund 4,944 5,150 - - - - - - Transportation Fund - - - - - - - - Nonmajor Governmental Funds 6,172 6,172 - - - - - -
Total Appropriations and Transfers $ 184,211 144,866 $ 39,600 33,898 $ 298 278 $ 610 414
Fund Balances End of Year 38,253 841,424 24,441 11,272
Less Encumbrances Outstanding at June 30, 2011 (4,391) - - (5)
Fund Balances, End of Year Budgetary Basis $ 33,862 $ 841,424 $ 24,441 $ 11,267
Permanent
Historical SocietyCommon School Normal School
Special Revenue
182
State of Wisconsin Nonmajor Enterprise Funds
183
ENTERPRISE: Enterprise funds account for business-like State activities that provide goods and/or services to the public and are financed primarily through user charges. The State's enterprise funds are described below: The Lottery Fund accounts for State managed lottery activities used to provide property tax relief to taxpayers. Revenues from ticket sales are used to pay winners, commissions to retailers, operating expenses and property tax relief. The Income Continuation Insurance Fund accounts for long-term and short-term disability benefits for employees of the State and of participating local public employers and operates on a self-insured basis. Contributions and investment activity provide funding for the benefits. The Long-term Disability Insurance Fund accounts for long-term disability benefits paid to State employees and participating local public employees. Contributions and investment activity provide funding for the benefits. The Health Insurance Fund accounts for group health insurance plans provided on a self-insured, fee for service basis or prepaid basis to current employees of the State and of participating local public employers. The Veterans Trust Fund accounts for various programs for veterans, including loans and grants to individuals and organizations and the operations of the State Veterans Museum. Revenues to finance this program are primarily derived from veteran loan payments and investment income. The Veterans Mortgage Loan Repayment Fund accounts for the issuance and administration of veterans’ first mortgage loans. Funding sources are primarily derived from bond proceeds, mortgage payments, and investment income. The Care and Treatment Facilities Funds, account for various resident facilities including:
• The Mendota Mental Health Institute Fund and the Winnebago Mental Health Institute Fund account for the diagnosis, care and treatment of individuals with mental and emotional disturbances. The services are provided with funds collected from third parties and contributions from the State.
• The Homes For Veterans Fund accounts for nursing home
and assisted living facilities for veterans and their spouses. The costs associated with providing this care are funded by private pay charges, the U.S. Department of Veterans Affairs and Medical Assistance.
• The Northern, Central, and Southern Developmental Disabilities Center Funds account for services provided to developmentally disabled citizens with the goal of ultimately returning such persons to the community if possible. These services are provided with funds collected from third parties and contributions from the State.
The Other Enterprise Funds account for the following programs:
• The State Fair Park Fund accounts for the annual State Fair, and various year round major sports events, agricultural and industrial expositions, and other programs of civic interest. Its revenues are derived from admissions, fees, rents and sales, with no contributions from the State.
• The Institutional Farm Operations Fund accounts for the
revenues and expenses associated with employing inmates in agricultural and other work activities. The associated costs are funded from farm product sales and a General Fund supplement.
• The Correctional Canteen Operations Fund accounts for
the program which provides goods for the education, recreation, and convenience of inmates. Charges made to inmates are the primary source of funds for these activities.
• The Local Government Property Insurance Fund accounts
for property insurance coverage provided to local governments. This insurance is financed with premiums collected from policyholders and income on investments.
• The State Life Insurance Fund accounts for the program to
provide State sponsored life insurance to residents in a manner consistent with private insurers. This insurance is financed with premiums collected from policyholders and investment earnings.
• The Transportation Infrastructure Loan Fund accounts for
the development of innovative financing mechanisms that will more effectively use federal financial transportation resources. Federal Highway Administration funds, and interest from the fund balance and from loan recipients, are the primary revenues for this fund.
• The Life Insurance Fund accounts for the collection and
payment of premiums for State and local participating employees’ group life insurance contracts with a life insurance carrier.

State of WisconsinCombining Balance Sheet - Nonmajor Enterprise Funds June 30, 2011
(In Thousands)
Income Long-termContinuation Disability Health Veterans
Lottery Insurance Insurance Insurance TrustAssets
Current Assets: Cash and Cash Equivalents $ 39,238 $ 92,059 $ 239,888 $ 281,458 $ 19,858 Investments 7,205 - - - - Receivables (net of allowance): Loans to Local Governments - - - - - Loans Receivable - - - - 3,220 Other Receivables 22,986 4,184 83 8,488 184 Due from Other Funds 132 437 - - 158 Due from Other Governments - - - - 76 Inventories 1,846 - - - 69 Prepaid Items 30,948 - - 281 83 Advances to Other Funds - - - - 416 Deferred Charges - - - - - Other Assets 1,115 - - - -
Total Current Assets 103,470 96,680 239,971 290,227 24,064
Noncurrent Assets: Investments 49,240 - - - - Receivables (net of allowance): Loans to Local Governments - - - - - Loans Receivable - - - - 10,018 Other Receivables - - - - - Advances to Other Funds - - - - - Deferred Charges - - - - 1 Other Assets 4,693 - - - - Depreciable Capital Assets (net of accumulated depreciation) 95 - - - 11,912 Nondepreciable Capital Assets - - - - 123 Total Noncurrent Assets 54,028 - - - 22,054 Total Assets $ 157,498 $ 96,680 $ 239,971 $ 290,227 $ 46,118
LiabilitiesCurrent Liabilities: Accounts Payable and Other Accrued Liabilities $ 38,455 $ 120 $ 141 $ 1,884 $ 555 Due to Other Funds 15,251 2 - 42 4,292 Interfund Payables - - - - - Due to Other Governments - - - - - Tax and Other Deposits - - - - 1 Unearned Revenue 906 700 - 109,097 - Interest Payable - - - - 4 Short-term Notes Payable - - - - - Current Portion of Long-term Liabilities: Future Benefits and Loss Liabilities - 15,370 26,260 6,713 - Capital Leases - - - - - Compensated Absences 208 - - - 128 General Obligation Bonds Payable - - - - 63 Revenue Bonds and Note Payable - - - - -
Total Current Liabilities 54,821 16,191 26,401 117,736 5,044
Noncurrent Liabilities: Accounts Payable and Other Accrued Liabilities 41,066 - - - - Noncurrent Portion of Long-term Liabilities: Future Benefits and Loss Liabilities - 58,722 149,331 - - Capital Leases - - - - - Compensated Absences 364 - - - 216 Other Postemployment Benefits 489 - - - 409 General Obligation Bonds Payable - - - - 461
Total Noncurrent Liabilities 41,918 58,722 149,331 - 1,086
Total Liabilities 96,739 74,914 175,731 117,736 6,130
Fund EquityInvested in Capital Assets, Net of Related Debt 95 - - - 11,511 Restricted for Future Benefits - 21,767 64,240 172,491 - Restricted for Other Purposes 60,663 - - - - Unrestricted - - - - 28,477
Total Fund Equity 60,759 21,767 64,240 172,491 39,988
Total Liabilities and Fund Equity $ 157,498 $ 96,680 $ 239,971 $ 290,227 $ 46,118
184

Mendota Winnebago Other Veterans Mental Mental Care and Total
Mortgage Loan Health Health Treatment Other All NonmajorRepayment Institute Institute Facilities Enterprise Funds
$ 28,889 $ 7 $ 182 $ 132 $ 31,443 $ 733,154 - - - - 10,623 17,828
- - - - 382 382 4,822 - - - - 8,042 2,660 2,627 4,694 19,417 3,045 68,368
1 1,387 644 11,348 1,749 15,856 - 7 14 6,485 490 7,071 - 369 623 1,608 4,545 9,058
29 776 787 3,427 315 36,647 - - - - - 416
94 - - - - 94 - - - - - 1,115
36,494 5,174 6,945 42,415 52,592 898,032
- - - - 102,983 152,223
- - - - 1,275 1,275 165,309 - - - 3,834 179,161
- - - - 50 50 586 - - - - 586 919 - - 32 619 1,571
1,312 - - - - 6,005
47 18,600 11,264 75,877 71,545 189,342 - 1,148 3,544 12,368 4,065 21,247
168,173 19,748 14,808 88,277 184,371 551,460 $ 204,668 $ 24,921 $ 21,753 $ 130,692 $ 236,963 $ 1,449,492
$ 104 $ 2,239 $ 1,843 $ 9,524 $ 2,831 $ 57,696 80 2,851 2,782 15,042 532 40,876
- 1,446 - 59,377 - 60,823 26 - 1 406 - 433
- - - 41 18,772 18,814 - 1 - - 10,815 121,520
1,510 - - 94 317 1,925 - - - 1,084 - 1,084
- - - - 15,388 63,731 - 74 44 66 228 412
79 826 683 2,661 167 4,752 7,416 - - 400 3,178 11,057
- - - - 9 9
9,215 7,437 5,354 88,694 52,238 383,131
- - - - - 41,066
- - - - 63,350 271,403 - 236 172 339 541 1,287
225 1,224 870 3,455 198 6,551 144 3,845 4,159 16,166 406 25,617
173,889 - - 11,415 37,297 223,063
174,258 5,304 5,200 31,374 101,791 568,986
183,473 12,742 10,554 120,069 154,030 952,117
47 19,438 14,592 74,974 36,323 156,982 - - - - 40,181 298,678 - - - - 2,775 63,438
21,148 (7,259) (3,394) (64,350) 3,654 (21,724) 21,195 12,180 11,199 10,624 82,933 497,374
$ 204,668 $ 24,921 $ 21,753 $ 130,692 $ 236,963 $ 1,449,492
Care and Treatment Facilities
185

State of WisconsinCombining Statement of Revenues, Expenses, and Changes in Fund Equity - Nonmajor Enterprise Funds For the Fiscal Year Ended June 30, 2011
(In Thousands)
Income Long-termContinuation Disability Health Veterans
Lottery Insurance Insurance Insurance Trust
Operating Revenues: Charges for Goods and Services $ 502,654 $ - $ - $ 1 $ 192 Participant and Employer Contributions - 15,792 - 1,288,426 - Investment and Interest Income 13 - - - 1,075 Miscellaneous - 67 - - - Total Operating Revenues 502,668 15,860 - 1,288,426 1,267
Operating Expenses: Personal Services 6,136 - - - 5,509 Supplies and Services 61,577 1,496 1,659 8,982 3,097 Lottery Prize Awards 290,459 - - - - Depreciation 44 - - - 822 Benefit Expense - 17,780 46,666 1,256,777 - Interest Expense - - - - - Other Expenses 443 476 391 4,945 47 Total Operating Expenses 358,659 19,752 48,716 1,270,704 9,476 Operating Income (Loss) 144,009 (3,892) (48,716) 17,723 (8,209)
Nonoperating Revenues (Expenses): Operating Grants - - - 13,186 1,263 Investment and Interest Income (1,080) 16,742 50,450 39,092 32 Gain (Loss) on Disposal of Capital Assets - - - - (18) Interest Expense - - - - (25) Gifts and Donations - - - - 120 Miscellaneous Revenues 306 - 2 - 21 Other Expenses: Property Tax Credits (125,441) - - - - Grants Disbursed - - - - (2,770) Other - - - - - Total Nonoperating Revenues (Expenses) (126,215) 16,742 50,452 52,278 (1,377)
Income (Loss) before Transfers 17,793 12,850 1,735 70,001 (9,586)
Capital Contributions - - - - 10 Transfers In 126 - - - - Transfers Out (19,061) - - - (141)
Net Change in Fund Equity (1,142) 12,850 1,735 70,001 (9,717)
Total Fund Equity, Beginning of Year 61,900 8,916 62,505 102,490 49,705 Total Fund Equity, End of Year $ 60,759 $ 21,767 $ 64,240 $ 172,491 $ 39,988
186

Mendota Winnebago OtherVeterans Mental Mental Care and Total
Mortgage Loan Health Health Treatment Other All NonmajorRepayment Institute Institute Facilities Enterprise Funds
$ - $ 18,357 $ 38,074 $ 214,513 $ 54,648 $ 828,439 - - - - - 1,304,218
11,678 - - - 301 13,067 - - - - 693 760
11,678 18,357 38,074 214,513 55,642 2,146,484
2,545 53,379 44,676 176,178 9,921 298,344 566 11,599 9,152 40,660 25,529 164,317
- - - - - 290,459 30 1,581 1,039 5,835 4,237 13,589
- - - - 28,442 1,349,665 12,618 - - - 555 13,172 1,111 - - 1,932 2,936 12,281
16,869 66,559 54,867 224,605 71,620 2,141,826 (5,191) (48,202) (16,794) (10,092) (15,978) 4,658
- 67 99 231 - 14,847 122 - - 2 4,094 109,455
- (6) 8 (43) 3 (56) - (15) (11) (480) (1,682) (2,213) - - - 298 5 423
1,286 593 918 3,819 28 6,972
- - - - - (125,441) (328) - - (158) - (3,256)
(8) - - - (74) (81)
1,073 639 1,013 3,670 2,375 650
(4,118) (47,563) (15,780) (6,422) (13,603) 5,308
- - - 3,168 - 3,178 - 42,022 29,821 5,884 2,559 80,413
(57) (1,854) (2,867) (11,402) (1,153) (36,534)
(4,175) (7,395) 11,174 (8,771) (12,197) 52,365
25,370 19,574 24 19,395 95,130 445,010 $ 21,195 $ 12,180 $ 11,199 $ 10,624 $ 82,933 $ 497,374
Care and Treatment Facilities
187

State of WisconsinCombining Statement of Cash Flows - Nonmajor Enterprise Funds For the Fiscal Year Ended June 30, 2011
(In Thousands)
Income Long-termContinuation Disability Health Veterans
Lottery Insurance Insurance Insurance Trust Cash Flows from Operating Activities: Cash Receipts from Customers $ 497,750 $ 15,716 $ - $ 1,293,328 $ 192 Cash Payments to Suppliers for Goods and Services (28,372) (2,058) (2,112) (8,982) (3,019) Cash Payments to Employees for Services (6,108) - - (4,945) (5,539) Cash Payments for Lottery Prizes (295,556) - - - - Cash Payments for Loans Originated - - - - (1,916) Collection of Loans - - - - 6,682 Interest Income - - - - 1,093 Cash Payments for Benefits - (17,035) (27,354) (1,256,834) - Other Operating Revenues - 67 - - - Other Operating Expenses - - - - (149) Other Sources of Cash - - 2 1 - Other Uses of Cash (32,926) - - - -
Net Cash Provided (Used) by Operating Activities 134,789 (3,309) (29,464) 22,568 (2,656)
Cash Flows from Noncapital Financing Activities: Operating Grants Receipts - - - 13,186 1,215 Grants Disbursed - - - - (2,753) Repayment of Bonds and Notes - - - - - Interest Payments - - - - - Property Tax Credit Payments (129,130) - - - - Interfund Loans Received - - - - - Interfund Loans Repaid - - - - - Transfers In 193 - - - 132 Transfers Out (16,110) - - - (344) Other Cash Inflows from Noncapital Financing Activities - - - - 152 Net Cash Provided (Used) by Noncapital Financing Activities (145,046) - - 13,186 (1,599) Cash Flows from Capital and Related Financing Activities: Proceeds from Issuance of Debt - - - - - Capital Contributions - - - - 10 Repayment of Bonds and Notes - - - - (60) Interest Payments - - - - (29) Transfers In - - - - - Capital Lease Obligations - - - - - Proceeds from Sale of Capital Assets - - - - 2 Payments for Purchase of Capital Assets (36) - - - (75) Other Cash Inflows from Capital Financing Activities - - - - - Other Cash Outflows from Capital Financing Activities - - - - - Net Cash Provided (Used) by Capital and Related Financing Activities (36) - - - (152)
Cash Flows from Investing Activities: Proceeds from Sale and Maturities of Investment Securities 9,711 - - - - Purchase of Investment Securities - - - - - Cash Payments for Loans Originated - - - - - Collection of Loans - - - - - Investment and Interest Receipts 126 16,742 50,450 39,092 23 Net Cash Provided (Used) by Investing Activities 9,837 16,742 50,450 39,092 23
Net Increase (Decrease) in Cash and Cash Equivalents (456) 13,433 20,986 74,846 (4,385) Cash and Cash Equivalents, Beginning of Year 39,694 78,626 218,902 206,612 24,243 Cash and Cash Equivalents, End of Year $ 39,238 $ 92,059 $ 239,888 $ 281,458 $ 19,858
188

Mendota Winnebago OtherVeterans Mental Mental Care and Total
Mortgage Loan Health Health Treatment Other All NonmajorRepayment Institute Institute Facilities Enterprise Funds
$ - $ 18,822 $ 39,240 $ 202,772 $ 53,299 $ 2,121,119 (551) (12,767) (9,887) (45,007) (25,800) (138,554)
(2,607) (55,683) (45,703) (169,508) (9,763) (299,856) - - - - - (295,556)
(662) - - - - (2,578) 53,448 - - - 315 60,445 12,749 - - - 37 13,879
- - - - (19,912) (1,321,134) - - - - 3,985 4,052
(1,077) - - - (10,141) (11,367) - 3,574 2,145 1,100 531 7,354 - - - (1,633) - (34,559)
61,300 (46,053) (14,205) (12,275) (7,449) 103,244
- 48 33 65 - 14,546 (324) - - (158) - (3,235)
(79,045) - - - - (79,045) (12,236) - - - (555) (12,791)
- - - - - (129,130) - 1,446 - 17,847 - 19,294 - - (14,131) (1,598) (845) (16,574) - 42,951 30,402 5,377 2,157 81,211
(285) (1,646) (1,236) (11,634) (1,153) (32,409)
1,268 - - 298 10 1,728
(90,622) 42,799 15,068 10,197 (386) (156,404)
- - - 1,538 14,459 15,997 - - - 3,294 - 3,304 - - - (551) (2,324) (2,936) - (15) (11) (531) (1,586) (2,173) - - - - 403 403 - (65) (42) (63) (172) (342) - - - - - 3 - (946) (646) (11,069) (308) (13,080) - 527 - 1,616 868 3,011 - - - (9) (13,931) (13,940)
- (499) (699) (5,776) (2,591) (9,754)
- - - - 9,823 19,534 - - - - (7,955) (7,955) - - - - (179) (179) - - - - 230 230
104 - - 2 5,782 112,321 104 - - 2 7,702 123,952
(29,219) (3,754) 164 (7,852) (2,725) 61,038 58,108 3,761 18 7,984 34,168 672,116
$ 28,889 $ 7 $ 182 $ 132 $ 31,443 $ 733,154
(Continued)
Care and Treatment Facilities
189

State of WisconsinCombining Statement of Cash Flows - Nonmajor Enterprise Funds For the Fiscal Year Ended June 30, 2011
(Continued)
Income Long-termContinuation Disability Health Veterans
Lottery Insurance Insurance Insurance Trust
Reconciliation of Operating Income (Loss) to Net Cash Provided (Used) by Operations:
Operating Income (Loss) $ 144,009 $ (3,892) $ (48,716) $ 17,723 $ (8,209)
Adjustment to Reconcile Operating Income (Loss) to Net Cash Provided (Used) by Operating Activities: Depreciation 44 - - - 822 Provision for Uncollectible Accounts - - - - (103) Operating Income (Investment Income) Classified as Investing Activity - - - - - Operating Expense (Interest Expense) Classified as Noncapital Financing Activity - - - - - Miscellaneous Nonoperating Income (Expense) (42) - 2 - - Changes in Assets and Liabilities: Decrease (Increase) in Receivables (2,838) (571) (7) 1,127 4,707 Decrease (Increase) in Due from Other Funds 6 118 - 9 101 Decrease (Increase) in Due from Other Governments - - - - - Decrease (Increase) in Inventories (44) - - - (10) Decrease (Increase) in Prepaid Items (214) - - (204) 95 Decrease (Increase) in Other Assets (460) - - - - Decrease (Increase) in Deferred Charges - - - - - Increase (Decrease) in Accounts Payable and Other Accrued Liabilities (6,290) (4) 8 56 (59) Increase (Decrease) in Due to Other Funds 274 (82) (62) (641) 26 Increase (Decrease) in Due to Other Governments - - - - (15) Increase (Decrease) in Tax and Other Deposits - - - - (10) Increase (Decrease) in Unearned Revenue 258 (194) - 4,407 - Increase (Decrease) in Compensated Absences (8) - - - (84) Increase (Decrease) in Postemployment Benefits 94 - - - 82 Increase (Decrease) in Future Benefits and Loss Liabilities - 1,316 19,312 91 -
Total Adjustments (9,220) 583 19,253 4,845 5,552
Net Cash Provided (Used) by Operating Activities $ 134,789 $ (3,309) $ (29,464) $ 22,568 $ (2,656)
Noncash Investing, Capital and Financing Activities:
Assets Acquired through Capital Leases $ - $ - $ - $ - $ - Contributions/Transfer In (Out) of Noncash Assets and Liabilities from/to Other Funds - - - - - Change in Investments for Prize Annuities Payable 3,309 - - - - Net Change in Unrealized Gains and Losses (1,181) - - - - Other - - - - -
190

Mendota Winnebago OtherVeterans Mental Mental Care and Total
Mortgage Loan Health Health Treatment Other All NonmajorRepayment Institute Institute Facilities Enterprise Funds
$ (5,191) $ (48,202) $ (16,794) $ (10,092) $ (15,978) $ 4,658
30 1,581 1,039 5,835 4,237 13,589 33 - - 1,932 42 1,904
- - - - (276) (276)
12,618 - - - 555 13,172 - 692 730 3,910 24 5,315
54,314 1,990 2,421 (12,827) 850 49,164
(1) (1,028) (805) 1,229 (273) (643) - - - (2,457) (71) (2,528) - (1) (106) 217 230 287
15 74 57 (201) 69 (309) (271) - - - - (731)
- - - - 29 29
(178) (1,724) (1,446) (2,827) (808) (13,273) (90) 184 (181) (899) (180) (1,649)
4 - - 173 - 162 - - - 23 (4,256) (4,243) - - - - 298 4,767
(3) (387) 3 232 (43) (290) 22 765 876 3,478 71 5,389
- - - - 8,031 28,751
66,491 2,149 2,589 (2,183) 8,529 98,587
$ 61,300 $ (46,053) $ (14,205) $ (12,275) $ (7,449) $ 103,244
$ - $ 64 $ - $ - $ 642 $ 706
- 6 - (5) (74) (73) - - - - - 3,309 - - - - (1,232) (2,414) - - - - 620 620
Care and Treatment Facilities
191

192

State of Wisconsin Internal Service Funds
193
INTERNAL SERVICE: Internal service funds account for the operations of State agencies which render services to other State agencies, institutions, or other governmental units on a cost-reimbursement basis. The State's internal service funds are described below: The Technology Services Fund accounts for computer and telephone services provided to State and local governmental agencies and school systems. The moneys to finance these services come from computing service charges and telephone and data network charges. The Fleet Services Fund accounts for the costs associated with providing vehicle and aircraft services to State agencies. Moneys to finance these services come from user fees and the sale of used vehicles. The Financial Services Fund accounts for the costs associated with providing accounting, auditing, payroll and other financial services to State agencies. Moneys to finance these services come from State agency user fees. The Facilities Operations and Maintenance Fund accounts for the costs of operating State-owned facilities including utilities, heat, protective services, custodial and maintenance services and minor repair projects. The moneys to finance these costs are supplied from rents charged for facility and parking use and a general purpose revenue supplement for maintenance of the capitol and executive residence. The Risk Management Fund accounts for the costs of losses for damage to property owned by agencies, personal injury or property damage liabilities incurred by a State officer, agent or employee, and workers' compensation costs for State employees. Moneys to finance these costs come from charges to State agencies. The Badger State Industries Fund accounts for the program which gives inmates work experience in manufacturing goods and providing services. The sale of goods and services provides the moneys necessary to run the program.

State of WisconsinCombining Balance Sheet - Internal Service Funds June 30, 2011
(In Thousands)
Technology Fleet Financial
Services Services Services
AssetsCurrent Assets: Cash and Cash Equivalents $ - $ - $ 2,517 Receivables (net of allowance): Other Receivables 339 453 - Due from Other Funds 23,368 8,345 997 Due from Component Units - 101 - Due from Other Governments 194 58 - Inventories 1,020 56 - Prepaid Items 334 37 42 Advances to Other Funds - - - Deferred Charges - - - Total Current Assets 25,255 9,050 3,557
Noncurrent Assets: Deferred Charges - - - Depreciable Capital Assets (net of accumulated depreciation) 15,656 30,085 26 Nondepreciable Capital Assets - - - Total Noncurrent Assets 15,656 30,085 26 Total Assets $ 40,910 $ 39,136 $ 3,582
LiabilitiesCurrent Liabilities: Accounts Payable and Other Accrued Liabilities $ 2,962 $ 620 $ 184 Due to Other Funds 798 280 144 Interfund Payables 36,513 30,677 - Due to Other Governments 6,768 12 369 Interest Payable - - - Short-term Notes Payable - - - Current Portion of Long-term Liabilities: Future Benefits and Loss Liabilities - - - Capital Leases 151 - - Compensated Absences 565 70 146 General Obligation Bonds Payable - - - Total Current Liabilities 47,757 31,658 842
Noncurrent Liabilities: Noncurrent Portion of Long-term Liabilities: Future Benefits and Loss Liabilities - - - Capital Leases 392 - - Compensated Absences 1,229 120 307 Other Postemployment Benefits 1,250 176 236 General Obligation Bonds Payable - - - Total Noncurrent Liabilities 2,871 296 543 Total Liabilities 50,628 31,954 1,385
Fund EquityInvested in Capital Assets, Net of Related Debt 15,113 30,085 26 Unrestricted (24,830) (22,904) 2,172 Total Fund Equity (9,718) 7,182 2,197 Total Liabilities and Fund Equity $ 40,910 $ 39,136 $ 3,582
194

Facilities
Operations Badgerand Risk State
Maintenance Management Industries Totals
$ 9,551 $ 572 $ 4 $ 12,644
275 88 122 1,277 6,642 8,371 6,049 53,773
- - - 101 21 - 40 313
105 - 3,560 4,740 175 18 108 714
- - - - 102 - - 102
16,871 9,050 9,882 73,665
440 - 3 443
209,208 - 3,632 258,607 38,660 - 41 38,702
248,309 - 3,676 297,751 $ 265,180 $ 9,050 $ 13,558 $ 371,416
$ 3,557 $ 103 $ 1,223 $ 8,649 11,494 180 954 13,850
- - 8,447 75,637 96 363 21 7,628
1,233 - 10 1,243 3,370 - - 3,370
- 32,936 - 32,936 - - 97 249
430 33 122 1,36612,664 - 47 12,711 32,845 33,615 10,922 157,640
- 58,739 - 58,739 - - 139 531
647 29 159 2,490 946 103 542 3,252
141,701 - 732 142,434 143,294 58,871 1,572 207,446 176,139 92,485 12,494 365,086
89,593 - 2,657 137,474 (553) (83,435) (1,594) (131,144)
89,040 (83,435) 1,063 6,330 $ 265,180 $ 9,050 $ 13,558 $ 371,416
195

State of WisconsinCombining Statement of Revenues, Expenses, and Changes in Fund Equity - Internal Service Funds For the Fiscal Year Ended June 30, 2011
(In Thousands)
Technology Fleet FinancialServices Services Services
Operating Revenues: Charges for Goods and Services $ 128,409 $ 14,321 $ 8,704 Miscellaneous 12 - -
Total Operating Revenues 128,421 14,321 8,704
Operating Expenses: Personal Services 19,979 2,408 3,762 Supplies and Services 88,796 8,101 3,824 Depreciation 3,784 3,383 8 Benefit Expense - - -
Total Operating Expenses 112,559 13,892 7,594
Operating Income (Loss) 15,861 429 1,110
Nonoperating Revenues (Expenses): Operating Grants - - - Investment and Interest Income - - - Gain (Loss) on Disposal of Capital Assets (75) 96 - Interest Expense (60) - - Miscellaneous Revenues 954 129 - Other Expenses: Federal Settlement (7,089) (33) (362)
Total Nonoperating Revenues (Expenses) (6,271) 191 (362)
Net Income (Loss) 9,591 620 748
Transfers In 6,300 5,207 - Transfers Out (1,111) (206) (596)
Net Change in Fund Equity 14,780 5,620 152
Total Fund Equity, Beginning (24,497) 1,562 2,045
Total Fund Equity, Ending $ (9,718) $ 7,182 $ 2,197
196

Facilities
Operations Badger and Risk State
Maintenance Management Industries Totals
$ 59,426 $ 31,936 $ 19,144 $ 261,940 - - - 12
59,426 31,936 19,144 261,952
17,291 1,159 5,810 50,409 23,454 4,342 14,706 143,224 11,086 - 427 18,688
- 24,064 - 24,064
51,831 29,565 20,943 236,385
7,595 2,371 (1,800) 25,566
189 - - 189 25 - 1 25
- - (70) (49) (7,270) - (45) (7,375)
86 493 59 1,721
- (1,093) - (8,578)
(6,970) (600) (54) (14,066)
625 1,770 (1,854) 11,500
5,744 1,000 868 19,118 (2,019) (30) (157) (4,119)
4,350 2,741 (1,143) 26,499
84,691 (86,176) 2,207 (20,169)
$ 89,040 $ (83,435) $ 1,063 $ 6,330
197

State of WisconsinCombining Statement of Cash Flows - Internal Service Funds For the Fiscal Year Ended June 30, 2011
(In Thousands)
Technology Fleet FinancialServices Services Services
Cash Flows from Operating Activities: Cash Receipts from Customers $ 133,554 $ 14,150 $ 10,769
Cash Payments to Suppliers for Goods and Services (90,875) (8,117) (3,490)
Cash Payments to Employees for Services (20,317) (2,396) (3,763) Cash Payments for Benefits - - - Other Operating Revenues 12 - - Other Sources of Cash 954 129 - Other Uses of Cash (321) (35) (362) Net Cash Provided (Used) by Operating Activities 23,007 3,732 3,154
Cash Flows from Noncapital Financing Activities: Operating Grants Receipts - - - Interest Payments (2) - - Interfund Loans Received - 763 - Interfund Loans Repaid (15,907) - (42) Transfers In - 507 - Transfers Out (1,111) (206) (596) Net Cash Provided (Used) by Noncapital Financing Activities (17,019) 1,063 (637)
Cash Flows from Capital and Related Financing Activities: Proceeds from Issuance of Debt - - - Repayment of Bonds and Notes - - - Interest Payments (59) - - Capital Lease Obligations (144) - - Proceeds from Sale of Capital Assets - 827 - Payments for Purchase of Capital Assets (5,785) (5,621) -
Net Cash Provided (Used) by Capital and Related Financing Activities (5,988) (4,795) -
Net Increase (Decrease) in Cash and Cash Equivalents - - 2,517
Cash and Cash Equivalents, Beginning of Year 0 0 -
Cash and Cash Equivalents, End of Year $ 0 $ 0 $ 2,517
198

Facilities Operations Badger
and Risk State Maintenance Management Industries Totals
$ 61,374 $ 31,111 $ 16,615 $ 267,573
(24,041) (4,470) (14,597) (145,590)
(16,594) (1,134) (5,715) (49,917)- (27,236) - (27,236)- - - 12
86 493 - 1,662- (731) - (1,449)
20,825 (1,968) (3,697) 45,055
189 - - 189(1) - - (4)
8,401 - 3,681 12,845- - - (15,948)
5,344 - 456 6,307(2,019) (30) (157) (4,119)
11,914 (30) 3,980 (730)
13,695 - - 13,695(13,476) - (53) (13,529)(7,658) - (50) (7,767)
- - (97) (242)- - 4 831
(19,657) - (87) (31,151)
(27,096) - (284) (38,162)
5,643 (1,997) - 6,163
3,908 2,569 4 6,481
$ 9,551 $ 572 $ 4 $ 12,644
(Continued)
199
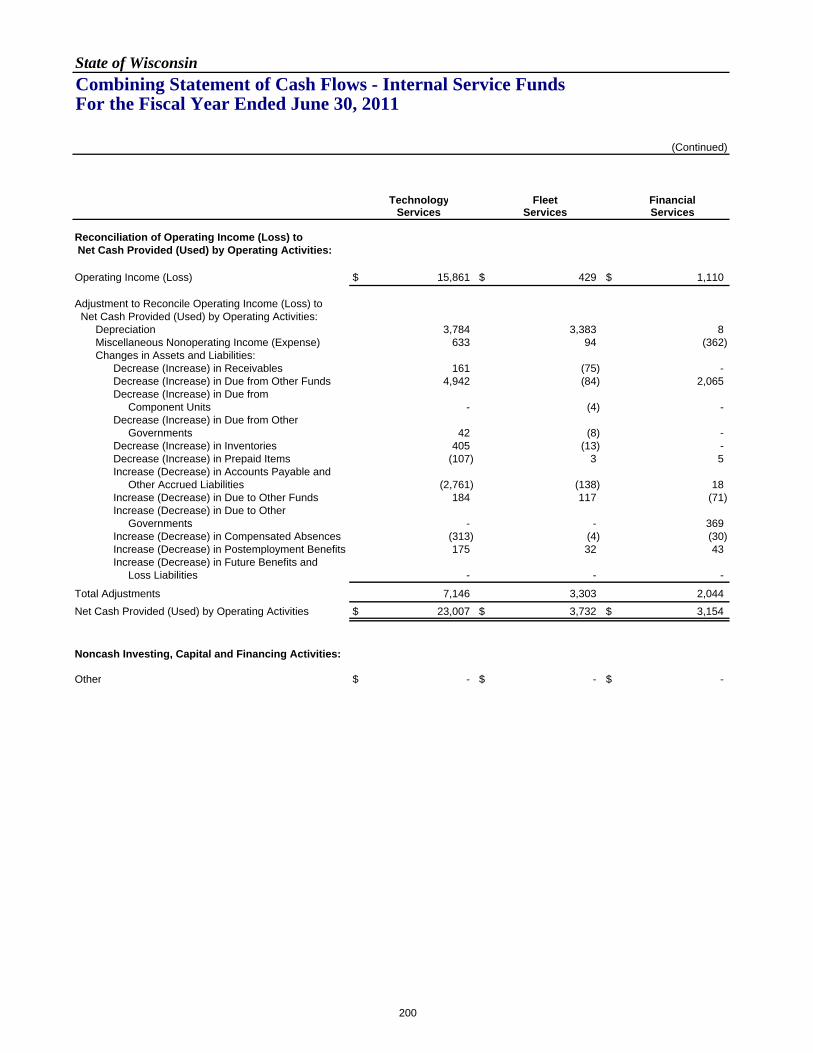
State of WisconsinCombining Statement of Cash Flows - Internal Service Funds For the Fiscal Year Ended June 30, 2011
(Continued)
Technology Fleet FinancialServices Services Services
Reconciliation of Operating Income (Loss) to Net Cash Provided (Used) by Operating Activities:
Operating Income (Loss) $ 15,861 $ 429 $ 1,110
Adjustment to Reconcile Operating Income (Loss) to Net Cash Provided (Used) by Operating Activities: Depreciation 3,784 3,383 8 Miscellaneous Nonoperating Income (Expense) 633 94 (362) Changes in Assets and Liabilities: Decrease (Increase) in Receivables 161 (75) - Decrease (Increase) in Due from Other Funds 4,942 (84) 2,065 Decrease (Increase) in Due from Component Units - (4) - Decrease (Increase) in Due from Other Governments 42 (8) - Decrease (Increase) in Inventories 405 (13) - Decrease (Increase) in Prepaid Items (107) 3 5 Increase (Decrease) in Accounts Payable and Other Accrued Liabilities (2,761) (138) 18 Increase (Decrease) in Due to Other Funds 184 117 (71) Increase (Decrease) in Due to Other Governments - - 369 Increase (Decrease) in Compensated Absences (313) (4) (30) Increase (Decrease) in Postemployment Benefits 175 32 43 Increase (Decrease) in Future Benefits and Loss Liabilities - - -
Total Adjustments 7,146 3,303 2,044 Net Cash Provided (Used) by Operating Activities $ 23,007 $ 3,732 $ 3,154
Noncash Investing, Capital and Financing Activities:
Other $ - $ - $ -
200

Facilities Operations Badger
and Risk State Maintenance Management Industries Totals
$ 7,595 $ 2,371 $ (1,800) $ 25,566
11,086 - 427 18,68886 (600) 59 (90)
61 (38) (9) 1001,847 (787) (2,890) 5,093
- - - (4)
39 - - 73(14) - 63 441
8 1 (1) (91)
(294) (280) 19 (3,436)312 148 322 1,013
7 363 21 759(83) 17 (22) (435)175 10 114 549
- (3,172) - (3,172)
13,230 (4,338) (1,897) 19,488$ 20,825 $ (1,968) $ (3,697) $ 45,055
$ - $ - $ (70) $ (70)
201

202
State of Wisconsin Fiduciary Funds
203
FIDUCIARY: Fiduciary funds are maintained to account for assets held by the State acting in the capacity as a trustee or agent. The State's fiduciary funds, consisting of pension and other employee benefit trust, investment trust, private-purpose trust, and agency funds, are described below: PENSION AND OTHER EMPLOYEE BENEFIT TRUST FUNDS: Pension and other employee benefit trust funds are used to report resources that are required to be held in trust for members and beneficiaries of the public employee retirement system or other employee benefit plans. The Wisconsin Retirement System Fund accounts for the collection of employee and employer contributions, the investment of assets, and the payment of retirement, disability, and death benefits to current and former employees of the State and participating local Wisconsin governments and their beneficiaries. The Accumulated Sick Leave Fund accounts for the collection of employer contributions, the investment of assets, and termination payments of employees’ unused sick leave balances at the time they retire. The Duty Disability Fund accounts for the compensation of protective category employees of the Wisconsin Retirement System for duty-related disabilities, as well as the collection of contributions and investment activity providing funding for the benefits. The Reimbursed Employee Expense Fund accounts for the collection of voluntary payroll deferrals, the investment of assets, and the reimbursement of qualifying medical, dependent care, and transportation expenses of State employees, in compliance with Internal Revenue Code Sections 132 and 425. The Local Retiree Life Insurance Fund accounts for the accumulation of employer contributions, during the course of local government employees working lifetimes, for postretirement life insurance coverage for retired participants. The Retiree Life Insurance Fund accounts for the accumulation of employer contributions, during the course of State employees working lifetimes, for postretirement life insurance coverage for retired participants. INVESTMENT TRUST FUNDS: Investment trust funds account for assets invested on a commingled basis by the State on behalf of other governmental entities. The State's investment trust funds are described below: The Local Government Pooled Investment Fund was established to enable local governments in the State to voluntarily invest any idle local moneys. The sources of this fund are local government investment deposits and their share of the investment earnings of the fund. Deductions occur as withdrawals are requested by local governments.
The Milwaukee Retirement System Fund accounts for funds of the Milwaukee Public Schools invested as part of the fixed and variable investment trusts of the Wisconsin Retirement System. PRIVATE-PURPOSE TRUST: Private-purpose trust funds are used to report all other trust arrangements under which principal and income benefit individuals, private organizations, or other governments. The Tuition Trust Fund accounts for the program that allows participants to invest in order to meet the cost of future tuition expenses. The BadgerRx for Individuals Fund accounts for the program that, through the leveraged bargaining powers established by the State for employee health insurance, provides discounts and rebates on prescription drugs to participating individuals in the State. The College Savings Program Trust Fund accounts for the program that allows participants to invest in a college savings account to cover tuition, fees and the costs of room and board, books, supplies and equipment required for the enrollment or attendance of a beneficiary at an eligible educational institution. The Retiree Health Insurance Fund accounts for the accumulation of premiums for group health insurance plans provided on a self-insured, fee for service basis or prepaid basis to retired employees of the State. AGENCY FUNDS: Agency funds report those assets for which the State acts solely in a custodial capacity. The State's agency funds are described below: The Insurance Company Liquidation Account Fund accounts for the assets of insurance companies that are liquidated. These assets are used to pay claims and administrative costs associated with the liquidation. The Local Retiree Health Insurance Fund accounts for the accumulation of premiums for group health insurance plans provided on a self-insured, fee for service basis or prepaid basis to retired employees of participating local public employers. The Inmate and Resident Fund accounts for the assets of inmates and residents in State institutions. The Bank and Insurance Company Deposits Fund accounts for the statutorily required deposits of securities with the State by banks and insurance companies doing business in the State. The Support Collection Trust Fund accounts for the centralized receipt and disbursement of court ordered temporary or permanent maintenance, child support or family support and related fees.

State of WisconsinCombining Statement of Fiduciary Net Assets - Pension and Other Employee Benefit Trust Funds June 30, 2011
(In Thousands)
LocalWisconsin Reimbursed Retiree RetireeRetirement Accumulated Duty Employee Life Life
System Sick Leave Disability Expense Insurance Insurance Totals
Assets
Cash and Cash Equivalents $ - $ 1,334,061 $ 436,146 $ 3,504 $ - $ - $ 1,773,711
Securities Lending Collateral 3,083,019 - - - - - 3,083,019
Prepaid Items 7,661 10,892 - 842 - - 19,395
Receivables (net of allowance): Prior Service Contributions Receivable 118,776 - - - - - 118,776 Benefits Overpayment Receivable 4,186 - - - - - 4,186 Due from Other Funds 64,581 - - 235 - - 64,816 Due from Component Units 6,028 - - - - - 6,028 Interfund Receivables - 782,426 - - - - 782,426 Due from Other Governments 146,319 - - - - - 146,319 Interest and Dividends Receivable 241,351 - - - - - 241,351 Investment Sales Receivable 353,326 - - - - - 353,326 Other Receivables 13,858 2,051 528 2 - - 16,439
Total Receivables 948,425 784,477 528 237 - - 1,733,667
Investments: Fixed Income 22,327,022 - - - - - 22,327,022 Stocks 47,408,539 - - - - - 47,408,539 Options (162) - - - - - (162) Limited Partnerships 8,195,684 - - - - - 8,195,684 Preferred Securities 215,887 - - - - - 215,887 Convertible Securities 79,171 - - - - - 79,171 Mortgages 22,541 - - - - - 22,541 Real Estate 390,778 - - - - - 390,778 Multi-asset Investments 1,215,190 - - - - - 1,215,190 External Investment Pool - - - - 231,150 361,068 592,218
Total Investments 79,854,650 - - - 231,150 361,068 80,446,868
Inventories 104 - - - - - 104
Capital Assets 2,156 - - - - - 2,156
Total Assets 83,896,015 2,129,430 436,674 4,583 231,150 361,068 87,058,920
Liabilities
Accounts Payable and Other Accrued Liabilities 175,048 - 2,458 2,975 - - 180,480 Securities Lending Collateral Liability 3,083,019 - - - - - 3,083,019 Annuities Payable 281,605 - - - - - 281,605 Advance Contributions 146 - - - - - 146 Due to Other Funds 74,461 - - 53 - - 74,514 Interfund Payables 782,426 - - - - - 782,426 Due to Other Governments 35,301 - - - - - 35,301 Financial Futures Contracts (44,001) - - - - - (44,001) Investment Payable 401,800 - - - - - 401,800 Unearned Revenue - - - 412 - - 412 Compensated Absences Payable - 2,214,681 - - - - 2,214,681 Other Postemployment Benefits 1,068 - - - - - 1,068
Total Liabilities 4,790,872 2,214,681 2,458 3,440 - - 7,011,451
Net Assets
Held in Trust for Pension Benefits and Other Purposes $ 79,105,143 $ (85,251) $ 434,216 $ 1,143 $ 231,150 $ 361,068 $ 80,047,469
204
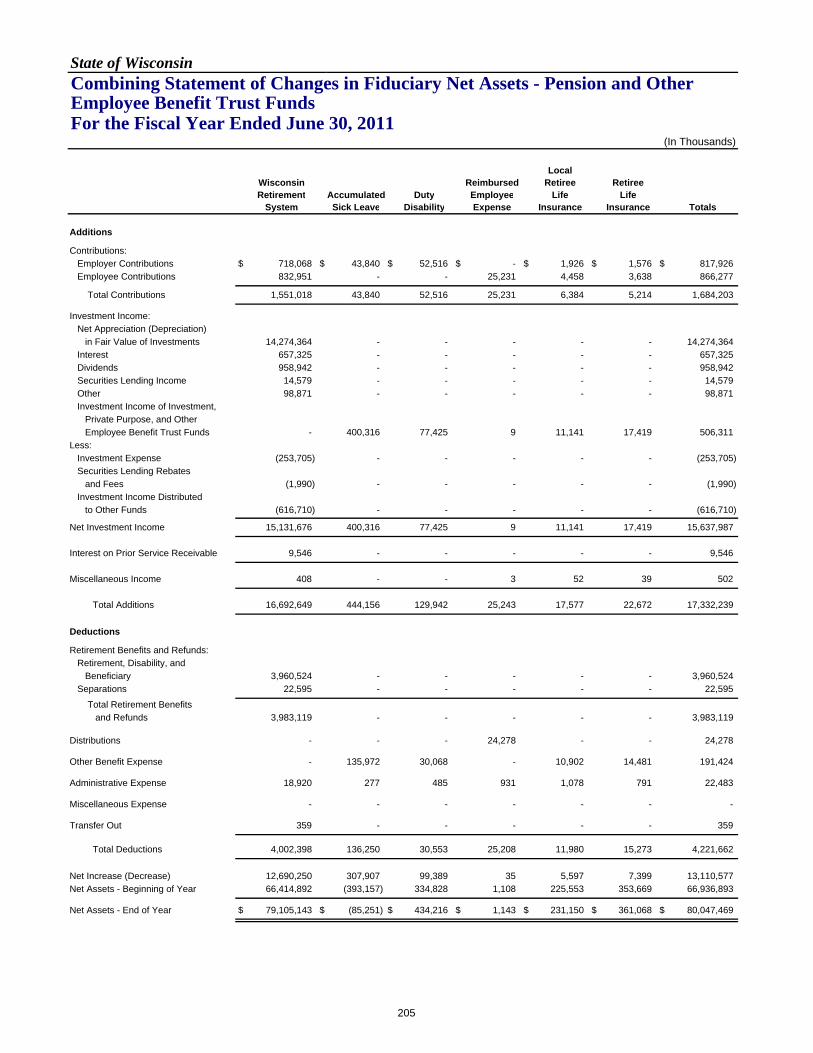
State of WisconsinCombining Statement of Changes in Fiduciary Net Assets - Pension and Other Employee Benefit Trust Funds For the Fiscal Year Ended June 30, 2011
(In Thousands)
LocalWisconsin Reimbursed Retiree RetireeRetirement Accumulated Duty Employee Life Life
System Sick Leave Disability Expense Insurance Insurance Totals
Additions
Contributions: Employer Contributions $ 718,068 $ 43,840 $ 52,516 $ - $ 1,926 $ 1,576 $ 817,926 Employee Contributions 832,951 - - 25,231 4,458 3,638 866,277
Total Contributions 1,551,018 43,840 52,516 25,231 6,384 5,214 1,684,203
Investment Income: Net Appreciation (Depreciation) in Fair Value of Investments 14,274,364 - - - - - 14,274,364 Interest 657,325 - - - - - 657,325 Dividends 958,942 - - - - - 958,942 Securities Lending Income 14,579 - - - - - 14,579 Other 98,871 - - - - - 98,871 Investment Income of Investment, Private Purpose, and Other Employee Benefit Trust Funds - 400,316 77,425 9 11,141 17,419 506,311 Less: Investment Expense (253,705) - - - - - (253,705) Securities Lending Rebates and Fees (1,990) - - - - - (1,990) Investment Income Distributed to Other Funds (616,710) - - - - - (616,710)
Net Investment Income 15,131,676 400,316 77,425 9 11,141 17,419 15,637,987
Interest on Prior Service Receivable 9,546 - - - - - 9,546
Miscellaneous Income 408 - - 3 52 39 502
Total Additions 16,692,649 444,156 129,942 25,243 17,577 22,672 17,332,239
Deductions
Retirement Benefits and Refunds: Retirement, Disability, and Beneficiary 3,960,524 - - - - - 3,960,524 Separations 22,595 - - - - - 22,595
Total Retirement Benefits and Refunds 3,983,119 - - - - - 3,983,119
Distributions - - - 24,278 - - 24,278
Other Benefit Expense - 135,972 30,068 - 10,902 14,481 191,424
Administrative Expense 18,920 277 485 931 1,078 791 22,483
Miscellaneous Expense - - - - - - -
Transfer Out 359 - - - - - 359
Total Deductions 4,002,398 136,250 30,553 25,208 11,980 15,273 4,221,662
Net Increase (Decrease) 12,690,250 307,907 99,389 35 5,597 7,399 13,110,577 Net Assets - Beginning of Year 66,414,892 (393,157) 334,828 1,108 225,553 353,669 66,936,893
Net Assets - End of Year $ 79,105,143 $ (85,251) $ 434,216 $ 1,143 $ 231,150 $ 361,068 $ 80,047,469
205

State of WisconsinCombining Statement of Fiduciary Net Assets - Investment Trust Funds June 30, 2011
(In Thousands)
LocalGovernment Milwaukee
Pooled RetirementInvestment System Totals
Assets
Cash and Cash Equivalents $ 2,308,678 $ 164,917 $ 2,473,595
Total Assets 2,308,678 164,917 2,473,595
Liabilities
Due to Other Funds 224 - 224 Total Liabilities 224 - 224
Net Assets
Held in Trust for Pool Participants and Other Purposes $ 2,308,454 $ 164,917 $ 2,473,372
206
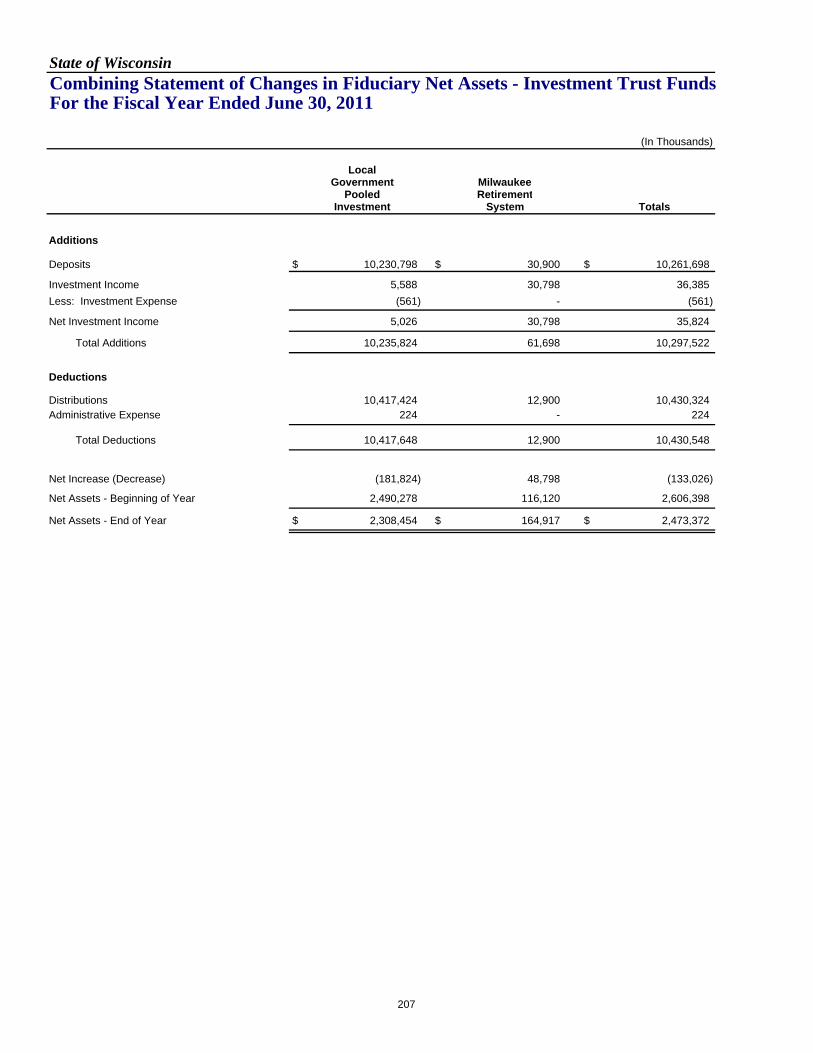
State of WisconsinCombining Statement of Changes in Fiduciary Net Assets - Investment Trust FundsFor the Fiscal Year Ended June 30, 2011
(In Thousands)
LocalGovernment Milwaukee
Pooled RetirementInvestment System Totals
Additions
Deposits $ 10,230,798 $ 30,900 $ 10,261,698
Investment Income 5,588 30,798 36,385 Less: Investment Expense (561) - (561)
Net Investment Income 5,026 30,798 35,824
Total Additions 10,235,824 61,698 10,297,522
Deductions
Distributions 10,417,424 12,900 10,430,324 Administrative Expense 224 - 224
Total Deductions 10,417,648 12,900 10,430,548
Net Increase (Decrease) (181,824) 48,798 (133,026)
Net Assets - Beginning of Year 2,490,278 116,120 2,606,398
Net Assets - End of Year $ 2,308,454 $ 164,917 $ 2,473,372
207
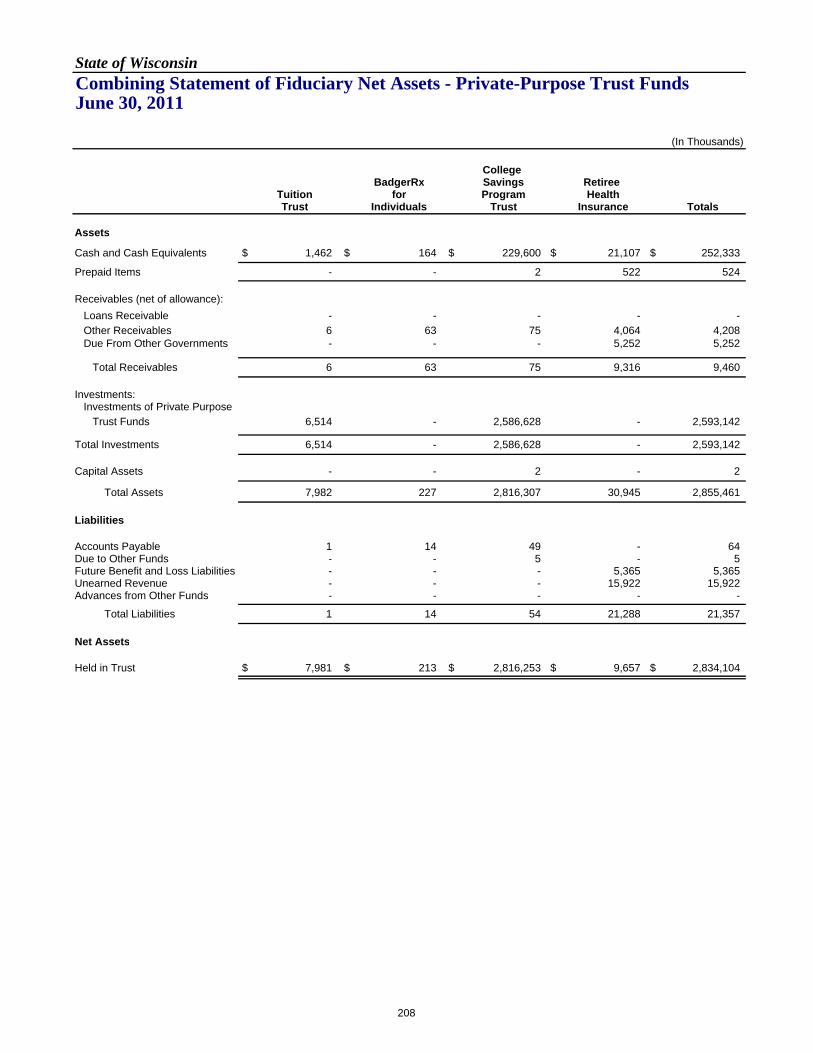
State of WisconsinCombining Statement of Fiduciary Net Assets - Private-Purpose Trust Funds June 30, 2011
(In Thousands)
College BadgerRx Savings Retiree
Tuition for Program HealthTrust Individuals Trust Insurance Totals
Assets
Cash and Cash Equivalents $ 1,462 $ 164 $ 229,600 $ 21,107 $ 252,333
Prepaid Items - - 2 522 524
Receivables (net of allowance): Loans Receivable - - - - - Other Receivables 6 63 75 4,064 4,208 Due From Other Governments - - - 5,252 5,252
Total Receivables 6 63 75 9,316 9,460
Investments: Investments of Private Purpose Trust Funds 6,514 - 2,586,628 - 2,593,142
Total Investments 6,514 - 2,586,628 - 2,593,142
Capital Assets - - 2 - 2
Total Assets 7,982 227 2,816,307 30,945 2,855,461
Liabilities
Accounts Payable 1 14 49 - 64 Due to Other Funds - - 5 - 5 Future Benefit and Loss Liabilities - - - 5,365 5,365 Unearned Revenue - - - 15,922 15,922 Advances from Other Funds - - - - -
Total Liabilities 1 14 54 21,288 21,357
Net Assets
Held in Trust $ 7,981 $ 213 $ 2,816,253 $ 9,657 $ 2,834,104
208

State of WisconsinCombining Statement of Changes in Fiduciary Net Assets - Private-Purpose Trust Funds For the Fiscal Year Ended June 30, 2011
(In Thousands)
College BadgerRx Savings Retiree
Tuition for Program HealthTrust Individuals Trust Insurance Totals
AdditionsContributions: Other $ - $ 175 $ - $ - $ 175
Premiums 193,977 193,977
Federal Subsidy 11,598 11,598
Deposits - - 307,615 - 307,615
Investment Income 275 - 501,130 2,325 503,730 Less: Investment Expense - - (5,885) - (5,885)
Net Investment Income 275 - 495,245 2,325 497,845
Miscellaneous Income - - 792 1 793
Total Additions 275 175 803,652 207,901 1,012,003
Deductions
Distributions 736 - 228,921 - 229,657
Benefit Expense 201,269 201,269
Administrative Expense 30 139 5,951 6,531 12,650
Transfers Out - - 4 - 4
Total Deductions 767 139 234,875 207,800 443,580
Net Increase (Decrease) (492) 36 568,777 101 568,423 Net Assets - Beginning of Year 8,473 177 2,247,475 9,556 2,265,681
Net Assets - End of Year $ 7,981 $ 213 $ 2,816,253 $ 9,657 $ 2,834,104
209

State of WisconsinCombining Statement of Fiduciary Net Assets - Agency Funds June 30, 2011
(In Thousands)
Insurance Local Bank andCompany Retiree Inmate Insurance Support
Liquidation Health and Company CollectionAccount Insurance Resident Deposits Trust Totals
Assets
Cash and Cash Equivalents $ 682 $ - $ 11,312 $ - $ 11,937 $ 23,931
Receivables (net of allowance): Due from Other Funds - - 1,238 - 78 1,316 Due from Employers - 3,788 - - - 3,788 Other Receivables - 282 5,579 - - 5,861
Total Receivables - 4,070 6,817 - 78 10,965
Investments - - 646 - - 646 Other Assets - - - 315,964 - 315,964
Total Assets $ 682 $ 4,070 $ 18,776 $ 315,964 $ 12,015 $ 351,507
Liabilities
Accounts Payable $ 682 $ 2,367 $ - $ - $ 12,015 $ 15,064 Tax and Other Deposits - 1,703 18,776 315,964 - 336,443
Total Liabilities $ 682 $ 4,070 $ 18,776 $ 315,964 $ 12,015 $ 351,507
210
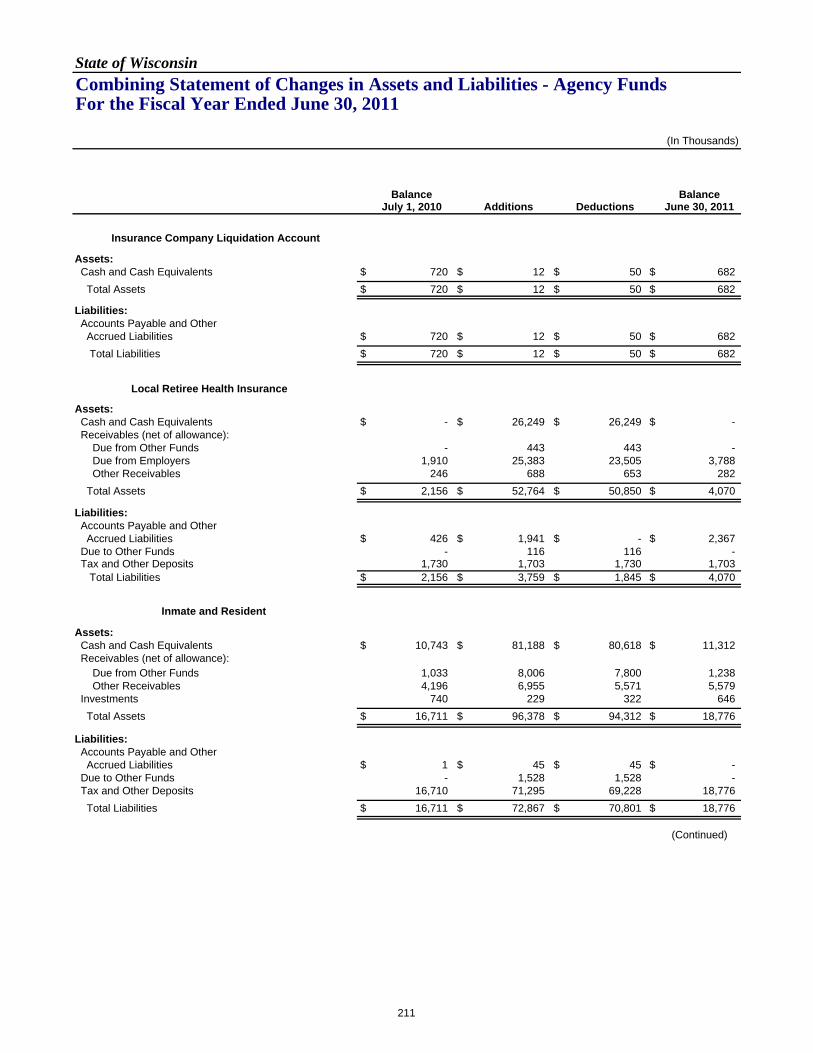
State of Wisconsin
Combining Statement of Changes in Assets and Liabilities - Agency Funds For the Fiscal Year Ended June 30, 2011
(In Thousands)
Balance BalanceJuly 1, 2010 Additions Deductions June 30, 2011
Insurance Company Liquidation Account
Assets: Cash and Cash Equivalents $ 720 $ 12 $ 50 $ 682 Total Assets $ 720 $ 12 $ 50 $ 682
Liabilities: Accounts Payable and Other Accrued Liabilities $ 720 $ 12 $ 50 $ 682 Total Liabilities $ 720 $ 12 $ 50 $ 682
Local Retiree Health Insurance
Assets: Cash and Cash Equivalents $ - $ 26,249 $ 26,249 $ - Receivables (net of allowance): Due from Other Funds - 443 443 - Due from Employers 1,910 25,383 23,505 3,788 Other Receivables 246 688 653 282 Total Assets $ 2,156 $ 52,764 $ 50,850 $ 4,070
Liabilities: Accounts Payable and Other Accrued Liabilities $ 426 $ 1,941 $ - $ 2,367 Due to Other Funds - 116 116 - Tax and Other Deposits 1,730 1,703 1,730 1,703 Total Liabilities $ 2,156 $ 3,759 $ 1,845 $ 4,070
Inmate and Resident
Assets: Cash and Cash Equivalents $ 10,743 $ 81,188 $ 80,618 $ 11,312 Receivables (net of allowance): Due from Other Funds 1,033 8,006 7,800 1,238 Other Receivables 4,196 6,955 5,571 5,579 Investments 740 229 322 646 Total Assets $ 16,711 $ 96,378 $ 94,312 $ 18,776
Liabilities: Accounts Payable and Other Accrued Liabilities $ 1 $ 45 $ 45 $ - Due to Other Funds - 1,528 1,528 - Tax and Other Deposits 16,710 71,295 69,228 18,776 Total Liabilities $ 16,711 $ 72,867 $ 70,801 $ 18,776
(Continued)
211

State of Wisconsin
Combining Statement of Changes in Assets and Liabilities - Agency Funds For the Fiscal Year Ended June 30, 2011
(Continued)
Balance BalanceJuly 1, 2010 Additions Deductions June 30, 2011
Bank and Insurance Company Deposits
Assets: Other Assets: Assets Held in Custody for Others $ 303,730 $ 90,328 $ 78,093 $ 315,964
Total Assets $ 303,730 $ 90,328 $ 78,093 $ 315,964
Liabilities: Tax and Other Deposits $ 303,730 $ 90,328 $ 78,093 $ 315,964
Total Liabilities $ 303,730 $ 90,328 $ 78,093 $ 315,964
Support Collection Trust
Assets: Cash and Cash Equivalents $ 11,447 $ 990,514 $ 990,024 $ 11,937 Receivables (net of allowance): Due from Other Funds 74 78 74 78
Total Assets $ 11,521 $ 990,591 $ 990,098 $ 12,015
Liabilities: Accounts Payable and Other Accrued Liabilities $ 11,521 $ 990,591 $ 990,098 $ 12,015
Total Liabilities $ 11,521 $ 990,591 $ 990,098 $ 12,015
Total - All Agency Funds
Assets: Cash and Cash Equivalents $ 22,910 $ 1,097,962 $ 1,096,941 $ 23,931 Receivables (net of allowance): Due from Other Funds 1,106 8,527 8,317 1,316 Due from Employers 1,910 25,383 23,505 3,788 Other Receivables 4,442 7,643 6,224 5,861 Investments 740 229 322 646 Other Assets: Assets Held in Custody for Others 303,730 90,328 78,093 315,964
Total Assets $ 334,837 $ 1,230,072 $ 1,213,403 $ 351,507
Liabilities: Accounts Payable and Other Accrued Liabilities $ 12,668 $ 992,589 $ 990,193 $ 15,064 Due to Other Funds - 1,643 1,643 - Tax and Other Deposits 322,170 163,325 149,051 336,443
Total Liabilities $ 334,837 $ 1,157,557 $ 1,140,887 $ 351,507
212

STATISTICAL SECTION
213

State of WisconsinStatistical Section Narrative and Table of Contents
Narrative
The statistical section of Wisconsin's Comprehensive Annual Financial Report provides additional historical perspective, context, and detail to assist financial statement users in understanding the government's economic condition. The State's financial trends, revenue capacity, debt capacity, demographic and economic information, and operating information are presented in the following sections:
PageFinancial Trends Information
The following schedules are intended to assist users in understanding and assessing how the State's financial position has changed over time. Information is presented at both the entity wide and fund level perspective.
Entity-Wide Perspective (Accrual Basis of Accounting) Schedule A-1 Net Assets by Component ……………………………………….…………………………………………………………… 216Schedule A-2 Changes in Net Assets ……………………………………….………………………………………………………………… 218
Fund-Level Perspective (Modified Accrual Basis of Accounting) Schedule A-3 Fund Balances of Governmental Funds ……………………………………………………………………………………… 222Schedule A-4 Changes in Fund Balances of Governmental Funds ……………………………………………………………………… 224
Revenue Capacity Information
The following information is intended to assist users in understanding and assessing the factors affecting the State's ability to generate tax revenues to finance its continued operations.
Schedule B-1 Personal Income by Industry ...................................................................................................................................... 226Schedule B-2 Personal Income Tax Rates ....................................................................................................................................... 227Schedule B-3 Personal Income Filers and Liability by Income Level ................................................................................................ 228
Debt Capacity Information
The following information is presented to assist the user in understanding and assessing the State's debt burden and its ability to issue additional debt.
Schedule C-1 Ratio of Outstanding Debt by Type ............................................................................................................................ 229Schedule C-2 Ratio of General Obligation Bonded Debt and Appropriation Bonds to Personal Income and Per Capita…………… 230Schedule C-3 Legal Debt Margin ...................................................................................................................................................... 232Schedule C-4 Department of Transportation Revenue Bond Coverage ........................................................................................... 233Schedule C-5 Environmental Improvement Fund Revenue Bond Coverage ……………………………………………………………… 234Schedule C-6 Petroleum Inspection Fee Revenue Bond Coverage ................................................................................................. 235Schedule C-7 Wisconsin Housing and Economic Development Authority Revenue Bond Coverage ………………………………… 236
Demographic and Economic Information
The following information provides demographic and economic indicators to assist the reader in understanding the socioeconomic environment within which the State's financial activities takes place.
Schedule D-1 Demographic and Economic Statistics ....................................................................................................................... 238Schedule D-2 Principal Employers .................................................................................................................................................... 239
214

State of WisconsinStatistical Section Narrative and Table of Contents
PageOperating Information
The following information relates to the operations, services and resources provided within the State's financial environment.
Schedule E-1 Full Time Equivalent State Government Employees by Function/Program................................................................. 240Schedule E-2 Operating Indicators by Function................................................................................................................................. 242Schedule E-3 Capital Asset Statistics by Function ........................................................................................................................... 244Schedule E-4 Local Government Property Insurance Fund Ten-Year Claims Development Information ........................................ 246Schedule E-5 Income Continuation Insurance Risk Pool Ten-Year Claims Development Information ............................................ 248Schedule E-6 Long-term Disability Insurance Risk Pool Ten-Year Claims Development Information .............................................. 249Schedule E-7 Health Insurance Risk Pool (Standard Plan) Ten-Year Claims Development Information ......................................... 250Schedule E-8 Health Insurance Risk Pool (Pharmacy Benefit) Seven-Year Claims Development Information ............................... 251
215
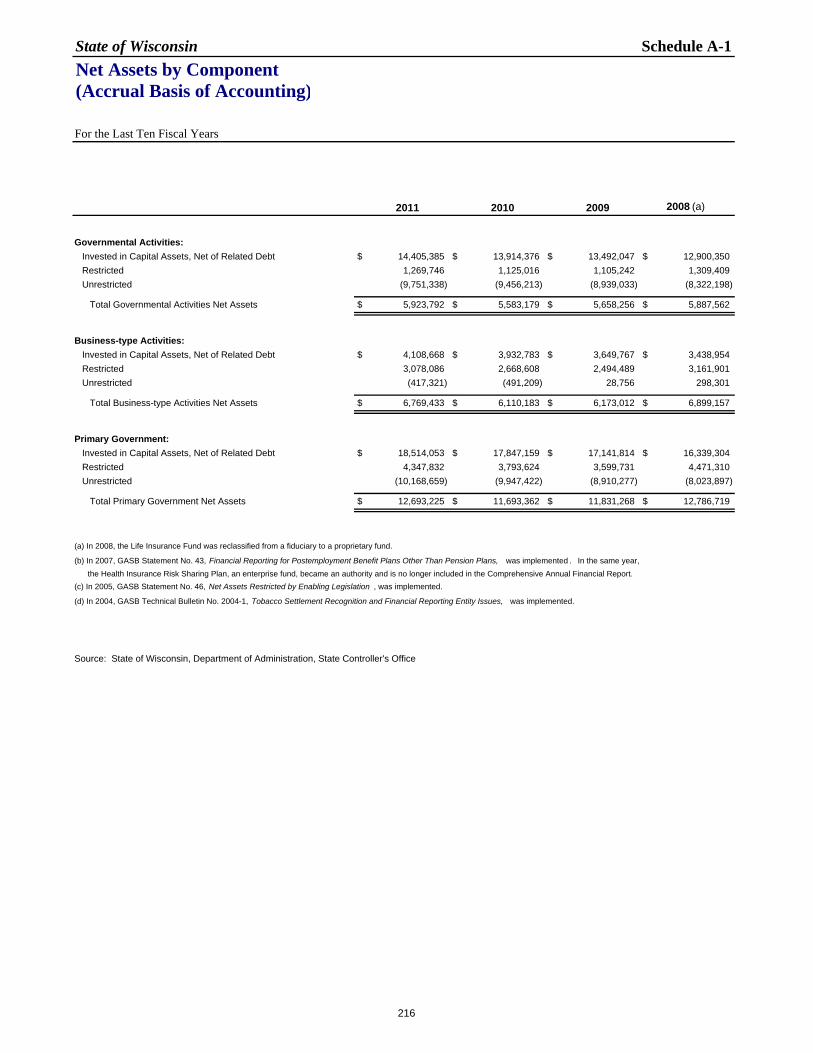
State of Wisconsin Schedule A-1Net Assets by Component(Accrual Basis of Accounting)
For the Last Ten Fiscal Years
2011 2010 2009 2008 (a)
Governmental Activities: Invested in Capital Assets, Net of Related Debt $ 14,405,385 $ 13,914,376 $ 13,492,047 $ 12,900,350 Restricted 1,269,746 1,125,016 1,105,242 1,309,409 Unrestricted (9,751,338) (9,456,213) (8,939,033) (8,322,198)
Total Governmental Activities Net Assets $ 5,923,792 $ 5,583,179 $ 5,658,256 $ 5,887,562
Business-type Activities: Invested in Capital Assets, Net of Related Debt $ 4,108,668 $ 3,932,783 $ 3,649,767 $ 3,438,954 Restricted 3,078,086 2,668,608 2,494,489 3,161,901 Unrestricted (417,321) (491,209) 28,756 298,301
Total Business-type Activities Net Assets $ 6,769,433 $ 6,110,183 $ 6,173,012 $ 6,899,157
Primary Government: Invested in Capital Assets, Net of Related Debt $ 18,514,053 $ 17,847,159 $ 17,141,814 $ 16,339,304 Restricted 4,347,832 3,793,624 3,599,731 4,471,310 Unrestricted (10,168,659) (9,947,422) (8,910,277) (8,023,897)
Total Primary Government Net Assets $ 12,693,225 $ 11,693,362 $ 11,831,268 $ 12,786,719
(a) In 2008, the Life Insurance Fund was reclassified from a fiduciary to a proprietary fund.
(b) In 2007, GASB Statement No. 43, Financial Reporting for Postemployment Benefit Plans Other Than Pension Plans, was implemented . In the same year, the Health Insurance Risk Sharing Plan, an enterprise fund, became an authority and is no longer included in the Comprehensive Annual Financial Report.(c) In 2005, GASB Statement No. 46, Net Assets Restricted by Enabling Legislation , was implemented.
(d) In 2004, GASB Technical Bulletin No. 2004-1, Tobacco Settlement Recognition and Financial Reporting Entity Issues, was implemented.
Source: State of Wisconsin, Department of Administration, State Controller's Office
216

Schedule A-1
(In Thousands)
2007 (b) 2006 2005 (c) 2004 2003 2002
$ 12,275,649 $ 12,291,617 $ 11,499,433 $ 11,146,113 $ 11,090,111 $ 10,684,294 1,331,102 1,218,005 1,314,931 1,321,877 657,578 551,012
(8,168,852) (8,238,766) (7,723,238) (7,776,238) (d) (4,799,930) (3,582,988)
$ 5,437,898 $ 5,270,855 $ 5,091,125 $ 4,691,753 $ 6,947,758 $ 7,652,320
$ 3,225,114 $ 3,243,637 $ 2,997,647 $ 2,870,433 $ 2,828,388 $ 2,626,925 3,503,289 3,336,784 3,222,638 2,852,436 3,012,860 3,038,832
457,089 140,047 178,697 439,290 304,167 483,535
$ 7,185,492 $ 6,720,467 $ 6,398,984 $ 6,162,158 $ 6,145,416 $ 6,149,292
$ 15,500,763 $ 15,535,254 $ 14,497,080 $ 14,016,546 $ 13,918,499 $ 13,311,219 4,834,391 4,554,789 4,537,569 4,174,313 3,670,438 3,589,844
(7,711,763) (8,098,719) (7,544,541) (7,336,948) (4,495,763) (3,099,453)
$ 12,623,390 $ 11,991,322 $ 11,490,109 $ 10,853,911 $ 13,093,174 $ 13,801,612
217

State of Wisconsin Schedule A-2Changes in Net Assets (Accrual Basis of Accounting) For the Last Ten Fiscal Years
2011 2010 2009 2008
Expenses Governmental Activities Commerce $ 411,297 $ 329,954 $ 298,908 $ 293,362 Education 6,737,282 6,662,846 6,707,734 6,477,194 Transportation 2,264,460 2,281,649 2,069,477 1,911,514 Environmental Resources 506,235 487,361 534,850 486,531 Human Relations and Resources 11,970,708 11,539,481 10,398,237 9,078,665 General Executive 727,015 650,196 551,358 536,527 Judicial 132,940 129,753 130,916 125,798 Legislative 65,641 65,232 65,626 65,356 Tax Relief and Other General Expenses 1,352,293 1,288,156 1,274,940 1,135,551 Intergovernmental - Shared Revenue 1,023,532 1,032,162 1,035,050 1,019,275 Interest on Debt 479,142 467,850 665,367 500,270 Total Governmental Activities 25,670,547 24,934,640 23,732,463 21,630,043
Business-type Activities: Injured Patients and Families Compensation (42,589) 58,515 (58,215) 137,747 Environmental Improvement 90,037 148,594 48,486 43,436 University of Wisconsin System 4,393,866 4,195,430 4,016,459 3,920,563 Unemployment Insurance Reserve 2,513,060 3,416,939 2,215,332 950,923 Other Business-type 2,273,768 2,139,171 2,057,077 1,966,242 Total Business-type Activities 9,228,143 9,958,649 8,279,139 7,018,911 Total Primary Government Expenses $ 34,898,690 $ 34,893,289 $ 32,011,602 $ 28,648,954
RevenuesProgram Revenues (All Types Consolidated): Governmental Activities: Charges for Services: Commerce $ 245,893 $ 253,713 $ 173,231 $ 208,363 Education 21,594 21,586 19,859 23,291 Transportation 678,493 684,360 676,871 610,421 Environmental Resources 231,990 214,332 214,277 201,790 Human Relations and Resources 701,312 634,789 562,382 226,343 General Executive 271,082 275,349 244,988 275,298 Judicial 63,623 66,881 67,096 66,165 Intergovernmental - Shared Revenue 54,199 46,090 - - Other 1,831 1,983 1,375 5,800 Operating Grants and Contributions 9,416,373 9,288,956 7,901,598 6,030,638 Capital Grants and Contributions 1,019,793 1,109,437 861,984 726,671 Total Governmental Activities 12,706,183 12,597,476 10,723,661 8,374,780
Business-type Activities: Charges for Services: University of Wisconsin System 3,284,047 3,098,677 2,845,573 2,606,437 Health Insurance 1,288,426 1,183,544 1,075,757 977,165 Unemployment Insurance Reserve 1,205,063 1,037,608 772,779 735,536 Other Activities 948,977 924,374 906,014 918,147 Operating Grants and Contributions 1,863,453 2,263,961 743,051 397,889 Capital Grants and Contributions 99,521 109,829 126,336 70,949 Total Business-type Activities 8,689,487 8,617,993 6,469,510 5,706,123 Total Primary Government Revenues $ 21,395,670 $ 21,215,469 $ 17,193,171 $ 14,080,903
Net (Expense)/Revenue Governmental Activities $ (12,964,364) $ (12,337,164) $ (13,008,802) $ (13,255,263) Business-type Activities (538,656) (1,340,656) (1,809,629) (1,312,788) Total Primary Government Net Expense $ (13,503,019) $ (13,677,818) $ (14,818,431) $ (14,568,050)
(a) In 2004, Annual Appropriation Bonds were issued to payoff the State's unfunded accrued prior service (pension) liability and its unfunded accrued liability for accumulated sick leave. The 2004 balance for Tax Relief and Other General Expenses includes $782.4 million of employee benefit liability expenses.(b) In 2005, the Veterans Mortgage Loan Repayment Fund was no longer considered a major fund.
218

Schedule A-2
(In Thousands)
2007 2006 2005 2004 2003 2002
$ 289,452 $ 267,195 $ 257,112 $ 281,753 $ 224,377 $ 194,927 6,413,120 6,270,218 5,818,372 5,749,391 5,675,138 5,440,440 1,850,586 1,774,161 1,801,595 1,795,548 1,590,710 1,714,215
471,767 466,997 418,616 444,295 474,969 531,983 8,698,915 8,436,702 8,441,099 8,000,799 8,158,215 7,997,351
540,268 542,303 478,782 425,265 489,442 416,294 119,991 114,853 111,690 109,788 107,835 106,954 62,457 59,938 57,047 57,631 59,758 59,948
956,749 857,866 837,970 1,572,126 (a) 843,757 820,618 1,016,313 1,016,718 1,011,052 1,058,182 1,107,958 1,095,991
479,402 477,465 424,217 382,219 292,579 297,572 20,899,020 20,284,418 19,657,549 19,876,997 19,024,739 18,676,293
57,873 (2,307) 77,624 36,094 102,878 72,923 42,671 42,764 39,482 42,246 42,560 42,491
3,663,119 3,519,740 3,425,045 3,278,414 3,075,475 2,935,234 882,622 821,122 844,869 1,068,647 1,186,584 1,071,756
1,862,525 2,082,861 1,959,230 (b) 1,881,562 1,714,540 1,599,244 6,508,810 6,464,181 6,346,250 6,306,963 6,122,037 5,721,648
$ 27,407,830 $ 26,748,598 $ 26,003,799 $ 26,183,959 $ 25,146,777 $ 24,397,940
$ 196,564 $ 181,332 $ 158,494 $ 166,249 $ 148,083 $ 145,118 21,614 21,781 23,298 22,431 22,332 20,187
515,046 520,807 486,406 478,126 436,929 439,574 190,149 198,344 184,416 178,603 177,462 171,185 233,679 203,413 175,584 167,552 130,524 114,293 248,221 325,570 217,128 231,016 191,304 158,693 61,698 60,777 61,377 56,606 46,377 41,494
- - - - - - 5,854 6,612 6,896 6,903 9,817 7,603
5,819,764 5,723,527 5,826,288 5,559,517 5,425,725 4,933,780 717,758 600,681 666,843 635,565 635,402 669,128
8,010,347 7,842,844 7,806,730 7,502,568 7,223,955 6,701,055
2,515,487 2,403,104 2,330,027 2,130,641 1,940,491 1,756,157 907,984 1,009,013 947,530 875,475 769,210 671,545 719,517 729,124 766,985 695,099 614,932 744,891 885,770 1,170,031 1,141,562 1,136,024 1,066,996 930,221 389,004 332,362 356,738 457,859 497,258 297,085 112,773 35,719 34,523 20,799 35,514 61,776
5,530,535 5,679,353 5,577,365 5,315,897 4,924,400 4,461,674 $ 13,540,882 $ 13,522,197 $ 13,384,095 $ 12,818,465 $ 12,148,355 $ 11,162,729
$ (12,888,673) $ (12,441,574) $ (11,850,819) $ (12,374,429) $ (11,800,785) $ (11,975,239) (978,275) (784,827) (768,884) (991,065) (1,197,637) (1,259,974)
$ (13,866,946) $ (13,226,400) $ (12,619,705) $ (13,365,494) $ (12,998,422) $ (13,235,212)
(Continued) 219

State of Wisconsin Schedule A-2Changes in Net Assets (Accrual Basis of Accounting) For the Last Ten Fiscal Years (Continued)
2011 2010 2009 2008
General Revenues and Other Changes in Net Assets Governmental Activities: Taxes: Income Taxes $ 7,478,058 $ 6,798,690 $ 6,809,733 $ 7,503,616 Sales and Excise Taxes 4,820,894 4,700,287 4,755,163 4,809,262 Public Utility Taxes 324,480 309,983 307,552 286,501 Motor Fuel (Transportation-related) Taxes 1,029,857 1,008,047 1,001,921 1,037,740 Other Taxes 396,040 403,369 425,665 575,251 Investment Earnings 2,072 4,847 40,112 75,998 Contributions and Miscellaneous 402,172 406,971 498,044 366,080 Special Items - Sale of Future Tobacco Settlement Revenues - - 1,518,000 - Special Items - Purchase of Future Tobacco Settlement Revenues - - (1,518,000) - Transfers (1,187,273) (1,263,325) (1,051,574) (1,002,000) Total Governmental Activities 13,266,301 12,368,869 12,786,616 13,652,449
Business-type Activities: Investment Earnings 6,286 15,664 8,455 15,460 Contributions and Miscellaneous 2,709 1,236 795 1,283 Transfers 1,187,273 1,262,747 1,052,151 1,002,000 Total Business-type Activities 1,196,268 1,279,648 1,061,401 1,018,743 Total Primary Government $ 14,462,568 $ 13,648,517 $ 13,848,017 $ 14,671,191
Change in Net Assets Governmental Activities $ 301,937 $ 31,706 $ (222,186) $ 397,187 Business-type Activities 657,612 (61,008) (748,227) (294,045) Total Primary Government $ 959,549 $ (29,301) $ (970,414) $ 103,141
Source: State of Wisconsin, Department of Administration, State Controller's Office
220

Schedule A-2
(In Thousands)
2007 2006 2005 2004 2003 2002
$ 7,365,400 $ 6,867,020 $ 6,467,377 $ 5,956,292 $ 5,502,423 $ 5,415,337 4,517,594 4,489,663 4,395,292 4,249,709 4,102,350 4,048,716
271,222 250,088 255,727 254,229 273,892 243,970 1,020,793 990,688 989,638 950,497 924,503 892,162
565,583 565,252 564,583 524,729 483,617 443,449 80,472 72,643 42,710 23,507 22,353 29,019
422,605 405,356 444,184 466,711 920,407 1,358,785
- - - - - 1,275,002
- - - - - - (1,163,529) (1,022,896) (1,008,160) (1,007,395) (1,099,606) (1,059,422) 13,080,141 12,617,813 12,151,349 11,418,280 11,129,938 12,647,018
213,850 49,660 11,484 (4,813) 18,192 10,668 3,062 9,388 678 5,378 2,080 6,511
1,163,529 1,022,896 1,008,160 1,007,395 1,099,606 1,059,422 1,380,441 1,081,945 1,020,323 1,007,961 1,119,877 1,076,600
$ 14,460,582 $ 13,699,757 $ 13,171,672 $ 12,426,241 $ 12,249,815 $ 13,723,618
$ 191,468 $ 176,239 $ 300,529 $ (956,149) $ (670,847) $ 671,779 402,166 297,117 251,438 16,895 (77,760) (183,373)
$ 593,636 $ 473,357 $ 551,967 $ (939,254) $ (748,608) $ 488,405
221

State of Wisconsin Schedule A-3Fund Balances of Governmental Funds(Modified Accrual Basis of Accounting)
For the Last Ten Fiscal Years
2011 2010 2009 2008
General Fund (Per GASB 54) (a) Nonspendable $ 158,629 $ $ $ $ Restricted 166,256 Committed 16,586 Unassigned (3,336,276)
General Fund (Prior to GASB 54) (a) Reserved - 510,083 409,756 349,825 Unreserved - (3,453,386) (3,121,381) (2,852,559) (b)
Total General Fund $ (2,994,806) $ (2,943,303) $ (2,711,626) $ (2,502,734) $
All Other Governmental Funds (per GASB 54) (a) Nonspendable $ 904,327 $ $ $ $ Restricted 231,609 Committed 909,973 Assigned - Unassigned (706,066)
All Other Governmental Funds (prior GASB 54) (a) Reserved $ - $ 1,834,786 $ 1,648,775 $ 1,730,277 $ Unreserved, Reported in: Special Revenue Funds - (177,799) (302,048) (232,826) Debt Service Funds - 80,780 78,222 82,691 Capital Projects Funds - (904,840) (867,803) (888,941) Permanent Funds - 247,142 296,675 337,560
Total All Other Governmental Funds $ 1,339,843 $ 1,080,069 $ 853,821 $ 1,028,761 $
(a) Prior to 2011 and the implementation of GASB Statement No. 54, Fund Balance Reporting and Government Fund Type Definitions , fund balances were classified as Reserved or Unreserved. Under GASB Statement 54, fund balances are classified as Nonspendable, Restricted, Committed, or Unassigned.
(b) In 2008, the Medical Assistance Trust Fund (a special revenue fund with fund balance of $2.7 million at June 30, 2007) was reclassified to be included in the General Fund. Prior years have not been restated.(c) In 2007, the Budget Stabilization Fund (a special revenue fund with fund balance of $.6 million at June 30, 2006) was reclassified to be included in the General Fund. Prior years have not been restated.(d) In 2005, the Unclaimed Property Fund was reclassified from a private purpose trust fund to be included in the General Fund. Prior years have not been restated.(e) In 2003, the fund balance of the Tobacco Settlement Endowment Fund (a special revenue fund) totaling $287.1 million was transferred to the General Fund.(f) In 2002, the Tobacco Settlement Endowment Fund and the Medical Assistance Trust Fund were created and had unreserved fund balances of $283.8 million and $361.0 million, respectively, at June 30, 2002.
Source: State of Wisconsin, Department of Administration, State Controller's Office
222

Schedule A-3
(In Thousands)
2007 2006 2005 2004 2003 2002
$ $ $ $ $
419,680 356,451 337,245 365,739 395,611 392,995 (2,863,822) (c) (2,506,925) (2,459,480) (d) (2,296,847) (2,638,150) (e) (1,877,328) (2,444,142) $ (2,150,474) $ (2,122,235) $ (1,931,108) $ (2,242,539) $ (1,484,333)
$ $ $ $ $
1,619,918 $ 1,761,116 $ 1,500,475 $ 1,481,174 $ 1,055,003 $ 982,544
(158,992) (b) (265,660) (157,366) (526,460) (94,756) (e) 271,321 (f)
62,612 123,093 231,994 314,488 25,991 20,484 (718,729) (667,392) (530,032) (363,325) (433,813) (511,890) 301,394 230,420 241,776 283,939 386,811 324,733
1,106,203 $ 1,181,577 $ 1,286,847 $ 1,189,816 $ 939,236 $ 1,087,192
223

State of Wisconsin Schedule A-4Changes in Fund Balances of Governmental Funds(Modified Accrual Basis of Accounting)For the Last Ten Fiscal Years
2011 2010 2009 2008
Revenues: Taxes $ 14,046,595 $ 13,225,609 $ 13,249,082 $ 14,229,280 Intergovernmental 10,300,640 10,258,850 8,680,730 6,638,741 Licenses and Permits 1,876,325 1,819,994 1,606,833 1,202,109 Charges for Goods and Services 350,162 330,513 316,781 378,769 Investment and Interest Income 35,969 40,413 70,340 109,850 Fines and Forfeitures 61,716 66,140 66,782 58,430 Gifts and Donations 16,878 19,295 19,816 17,447 Miscellaneous: Intergovernmental Transfer - - - - Tobacco Settlement 128,592 136,841 306,179 150,165 Other 271,657 250,139 238,194 191,087 Total Revenues 27,088,534 26,147,794 24,554,736 22,975,877
Expenditures: Current Operating: Commerce 416,201 333,287 301,885 294,650 Education 6,702,922 6,624,497 6,673,017 6,445,647 Transportation 2,210,158 2,244,078 2,029,347 1,857,435 Environmental Resources 498,620 476,613 503,411 471,737 Human Relations and Resources 11,851,182 11,417,637 10,298,086 8,969,935 General Executive 724,037 637,175 559,262 535,493 Judicial 129,386 125,803 126,851 121,720 Legislative 64,777 64,071 63,798 63,964 Tax Relief and Other General Expenditures: Employee Benefit Liability - - - - Other 1,350,793 1,289,265 1,275,882 1,085,775 Intergovernmental - Shared Revenue 1,023,532 1,032,162 1,035,050 1,019,275 Debt Service: Principal 187,136 117,568 1,812,219 420,188 Interest and Other Charges 507,430 487,853 678,052 542,458 Capital Outlay 963,772 780,325 775,189 688,598
Total Expenditures 26,629,947 25,630,333 26,132,047 22,516,874
Excess of Revenues Over (Under) Expenditures 458,587 517,462 (1,577,311) 459,003
Other Financing Sources (Uses): Long-term Debt Issued 825,903 725,132 2,172,974 (a) 284,979 Long-term Debt Issued - Refunding Bonds 256,481 372,980 - 1,007,120 Payments for Refunded Bonds (224,373) (349,907) - - Payment to Refunding Bond Escrow Agent (69,960) - - (944,850) Discount on Bonds (144) (932) (371) (4,377) Premium on Bonds 91,246 63,317 28,843 15,515 Transfers In 1,280,954 850,773 1,157,010 1,003,771 Transfers Out (2,482,937) (2,095,926) (2,196,922) (2,007,375) Capital Leases Acquisitions 16,483 10,044 20,077 8,529 Installment Purchase Acquisitions 308 1,428 671 770 Total Other Financing Sources (Uses) (306,039) (423,092) 1,182,281 (635,918) Net Change in Fund Balances $ 152,548 $ 94,370 $ (395,029) $ (176,915)
Debt Service as a Percentage of Noncapital Expenditures 2.7% 2.4% 9.8% 4.4%
(a) In 2009, the State issued $1,518.0 million of Annual Appropriation Bonds to purchase tobacco settlement revenues that had been sold to the Badger Tobacco Asset Securitization Corporation.(b) In 2005, the Unclaimed Property Fund was reclassified from a private purpose trust fund to the General Fund. Years prior to 2005 have not been restated for this reclassification. Corporation.(c) In 2004, the State issued $1,794.9 million of Annual Appropriation Bonds to pay for the unfunded accrued prior service (pension) liability for sick leave conversion credits. The General Fund reported a related Employee Benefit Liability expenditure of $1,487.6 million.
Source: State of Wisconsin, Department of Administration, State Controller's Office
224

Schedule A-4
(In Thousands)
2007 2006 2005 (b) 2004 2003 2002 (d)
$ 13,743,355 $ 13,170,610 $ 12,647,472 $ 11,913,325 $ 11,270,818 $ 11,050,6586,428,024 6,230,782 6,399,774 6,118,198 5,984,658 5,509,8341,141,117 1,123,956 1,043,742 1,016,729 891,260 855,093
307,449 361,804 230,479 269,649 247,519 224,066116,123 103,482 70,148 47,654 48,838 45,56257,976 72,263 66,764 68,737 55,834 55,39218,881 18,687 17,469 13,006 14,342 38,087
- - 87,300 95,000 598,580 969,886125,908 121,227 132,055 130,110 153,923 1,431,218279,590 274,820 216,117 210,335 139,531 166,569
22,218,423 21,477,631 20,911,320 19,882,743 19,405,303 20,346,365
294,861 270,530 260,077 284,930 226,182 198,2916,385,551 6,245,252 5,792,108 5,726,586 5,649,280 5,417,1361,767,266 1,672,697 1,684,549 1,653,448 1,519,266 1,664,161
462,502 462,841 412,322 439,734 464,479 528,6998,620,586 8,375,997 8,370,108 7,966,656 8,113,457 7,957,774
562,573 549,582 486,351 451,469 490,846 443,114117,289 111,495 108,184 107,423 104,930 103,06961,949 60,169 57,174 58,301 60,175 61,989
- - - 1,487,574 (c) - - 955,796 857,113 837,581 812,498 845,130 822,650
1,016,313 1,016,718 1,011,052 1,058,182 1,107,958 1,095,991
407,677 426,357 337,196 126,358 270,719 173,247493,397 482,815 425,349 381,145 226,469 209,851759,780 787,998 778,510 672,955 691,586 669,704
21,905,540 21,319,565 20,560,561 21,227,259 19,770,477 19,345,676
312,883 158,066 350,759 (1,344,516) (365,174) 1,000,689
454,408 627,497 455,845 2,551,901 (c) 506,524 529,649 436,193 133,829 719,779 524,658 - 596,332
- - - - - -(472,849) (93,592) (780,044) (534,937) - (631,477)
- - - (2,857) - - 48,898 44,896 96,993 98,214 31,640 60,247
1,026,728 1,454,568 1,028,319 1,274,917 1,234,157 2,067,099 (e)
(2,192,666) (2,466,960) (2,038,387) (2,253,763) (2,319,188) (3,135,615) (e)
12,712 5,985 5,875 3,379 17,143 6,039 653 2,457 1,068 1,124 2,863 1,216
(685,924) (291,319) (510,552) 1,662,636 (526,861) (506,510) $ (373,041) $ (133,253) $ (159,793) $ 318,120 $ (892,035) $ 494,179
4.3% 4.4% 3.9% 2.5% 2.6% 2.1%
(d) In 2002, tobacco settlement revenues included $1,275.0 million of revenues reported in the Tobacco Settlement Endowment Fund, which was used to account for the proceeds from the sale of the State's right to receive payments under the Attorney General Master Tobacco Settlement of 1998. (e) In 2002, the Tobacco Settlement Endowment Fund transferred $992.4 million to the General Fund to fund a portion of the shared revenue program, as well as other General Fund programs. Also in that year, the General Fund transferred a net $562.3 million to the Medical Assistance Trust Fund.
225

State of Wisconsin Schedule B-1Personal Income by Industry
For the Last Ten Calendar Years (In Millions)
2010 2009 2008 2007 2006 2005 2004 2003 2002 2001
Personal Income by Source:Farm Earnings $ 1,989 $ 998 $ 1,894 $ 2,067 $ 1,386 $ 1,671 $ 1,881 $ 1,542 $ 1,066 $ 1,171
Forestry, Fishing, Related
Activities 331 368 360 343 328 310 313 303 322 343
Mining 182 243 272 228 247 226 218 188 181 186
Utilities 1,458 1,339 1,298 1,193 1,206 1,158 1,165 1,059 1,055 1,014
Construction 8,266 8,167 9,698 10,193 10,292 9,942 9,650 9,050 8,618 8,454
Manufacturing 30,283 28,733 32,125 31,234 31,069 30,100 29,696 28,802 28,120 27,977
Wholesale Trade 8,284 8,131 8,645 8,459 8,198 7,721 7,225 6,727 6,603 6,283 Retail Trade 9,742 9,386 9,731 9,947 9,861 9,680 9,541 9,329 9,011 8,573 Transportation and Warehousing 5,268 5,565 5,867 5,838 5,718 5,583 5,273 5,008 4,766 4,726 Information 3,272 3,480 3,585 3,417 3,166 3,057 2,984 2,770 2,706 2,698 Finance and Insurance 10,316 9,602 9,640 9,761 9,813 9,037 8,755 8,327 7,852 7,440 Real Estate and Rental and Leasing 1,415 1,501 1,542 1,524 1,768 1,898 1,829 1,715 1,653 1,605 Professional and Technical Services 8,907 9,042 9,356 8,785 8,247 7,656 7,211 6,698 6,544 6,476 Management of Companies and Enterprises 4,851 4,424 4,392 4,456 4,237 3,752 3,703 3,549 3,126 2,922 Administrative and Waste Services 4,795 4,211 4,734 4,631 4,311 4,015 3,743 3,500 3,502 3,354 Educational Services 2,229 2,106 2,015 1,885 1,754 1,628 1,632 1,490 1,400 1,273 Health Care and Social Assistance 20,111 19,712 19,060 17,905 17,166 16,326 15,743 14,644 13,680 12,524 Arts, Entertainment, and Recreation 1,355 1,289 1,346 1,301 1,233 1,137 1,126 1,081 1,061 948 Accommodations and Food
Services 4,092 3,748 3,825 3,943 3,829 3,698 3,623 3,383 3,170 3,049
Other Services, except
Public Administration 5,694 5,554 5,660 5,626 5,562 5,359 5,017 4,801 4,782 4,305
Federal, Civilian 2,741 2,604 2,522 2,442 2,401 2,288 2,252 2,072 2,004 1,928
Military 856 886 801 708 706 742 679 622 454 362
State and Local 19,783 19,607 19,143 18,265 18,230 17,392 16,562 16,874 15,798 15,148
Other (a) 61,046 60,782 55,867 52,228 47,828 42,170 40,483 39,717 40,232 40,012
Total Personal Income $ 217,265 211,478 $ 213,379 $ 206,380 $ 198,556 $ 186,545 $ 180,303 $ 173,248 $ 167,708 $ 162,773
Per Capita Personal Income (in Dollars) $ 38,177 37,398 $ 37,916 $ 36,843 $ 35,637 $ 33,664 $ 32,715 $ 31,633 $ 30,790 $ 30,094
(a) Includes dividends, interest, rental income, residence adjustment, government transfer to individuals, and deductions for social insurance.
Source: U.S. Department of Commerce, Bureau of Economic Analysis
226

State of Wisconsin Schedule B-2Personal Income Tax Rates
For the Last Ten Calendar Years
Single or Head Married Filing Married FilingYear of Household Jointly Seperately
2011 7.75 % $ 224,210 $ 298,940 $ 149,470 (b) %2010 7.75 221,660 295,550 147,770 (b)
2009 6.75 153,280 204,370 102,190 4.452008 6.75 145,460 193,950 96,980 4.432007 6.75 142,650 190,210 95,100 4.472006 6.75 137,410 183,210 91,600 4.442005 6.75 132,580 176,770 88,390 4.482004 6.75 129,150 172,200 86,100 4.472003 6.75 126,420 168,560 84,280 4.412002 6.75 124,200 165,600 82,800 4.38
(a) Average tax rate as a percentage of Wisconsin Adjusted Gross Income (WAGI)(b) Information is currently not available.
Source: Wisconsin Department of Revenue
Top RateAverage
Tax Rate (a)
Top Income Tax Rate is Applied to Taxable Income in Excess of
227

State of Wisconsin Schedule B-3Personal Income Filers and Liability by Income LevelCalendar Year 2009(a) and Ten Years Prior
PersonalIncome Tax
Income Level Liability
$1,000,000 and Higher 2,949 0.10 % $ 496,189,868 8.66 % 6.34 %$500,000 to 999,999 6,738 0.24 300,902,915 5.25 6.61$200,000 to 499,999 38,654 1.37 649,775,801 11.34 5.89$100,000 to 199,999 218,708 7.72 1,481,834,891 25.87 5.22$70,000 to 99,999 287,139 10.14 1,126,279,474 19.66 4.71$50,000 to 69,999 315,934 11.16 785,225,987 13.71 4.18$30,000 to 49,999 487,497 17.22 653,982,738 11.42 3.43$10,000 to 29,999 725,177 25.61 227,162,766 3.97 1.61Less than $10,000 748,677 26.44 6,480,551 0.11 0.69
Total 2,831,473 100.00 % $ 5,727,834,991 100.00 % 4.45 %
PersonalIncome Tax
Income Level Liability
$1,000,000 and Higher 1,968 0.07 % $ 282,935,876 5.34 % 6.36 %$500,000 to 999,999 4,260 0.16 183,483,399 3.46 6.39$200,000 to 499,999 23,121 0.86 419,468,802 7.91 6.25$100,000 to 199,999 100,215 3.72 770,572,726 14.53 5.94$70,000 to 99,999 206,065 7.65 954,106,169 17.99 5.65$50,000 to 69,999 325,827 12.10 1,057,614,849 19.94 5.49$30,000 to 49,999 488,067 18.12 1,012,439,014 19.09 5.28$10,000 to 29,999 794,597 29.50 598,552,055 11.29 3.90Less than $10,000 749,672 27.83 24,034,709 0.45 0.94
Total 2,693,792 100.00 % $ 5,303,207,599 100.00 % 5.29 %
(a) Tax information is gathered on a calendar year basis. Since tax forms are filed in the following year, the information from tax year 2009 is the most current data available.(b) Net income tax rate equals personal income tax liability as a percentage of Wisconsin Adjusted Gross Income (WAGI).
Source: Wisconsin Department of Revenue
Percentage of Total
Percentage Numberof Filers
2009
Net Income Tax Rate (b)
1999
of TotalNumberof Filers
Percentage of Total
Net Income Tax Rate (b)
Percentage
of Total
228

State of Wisconsin Schedule C-1Ratio of Outstanding Debt by Type
For the Last Ten Fiscal Years (In Thousands, except for Net Bonded Debt Per Capita)
2011 2010 2009 2008 2007 (a) 2006 2005 2004 2003 2002
Governmental Activities:
General Obligation Bonds $ 5,337,914 $ 4,779,727 $ 4,244,746 $ 4,080,880 $ 4,066,286 $ 4,041,982 $ 3,763,973 $ 3,560,219 $ 3,090,875 $ 2,962,588
Annual Appropriation Bonds 3,331,570 3,357,795 3,378,300 1,850,802 1,792,686 1,792,488 1,792,290 1,792,092 (b) - -
Transportation Revenue Bonds 1,796,522 1,671,255 1,591,971 1,485,849 1,566,842 1,485,558 1,386,493 1,359,849 1,137,467 965,264
Petroleum Inspection Revenue Bonds 127,133 129,878 89,373 111,142 132,189 190,984 210,446 224,658 188,119 199,797
Badger Tobacco Asset
Securitization Corporation Bonds - - - 1,388,778 1,436,063 1,474,084 1,520,788 1,566,993 (c) - -
Capital Leases 40,718 31,572 32,263 37,830 41,208 36,840 22,856 20,326 40,315 20,690
Installment Contracts 265 729 475 316 451 666 1,571 2,770 3,653 1,249
Business-type Activities:
General Obligation Bonds 1,392,358 1,235,410 1,117,248 1,154,594 1,122,337 896,268 893,196 859,262 913,452 996,238
Environmental Improvement
Revenue Bonds 936,960 882,167 829,269 797,979 746,181 690,873 652,213 692,111 623,418 659,451
Capital Leases 31,607 34,839 110,110 116,439 121,183 47,686 48,427 48,577 40,916 37,779
Total Primary Government $ 12,995,047 $ 12,123,372 $ 11,393,755 $ 11,024,609 $ 11,025,426 $ 10,657,429 $ 10,292,253 $ 10,126,857 $ 6,038,215 $ 5,843,056
Percentage of
Personal Income (d) 5.98% 5.79% 5.29% 5.33% 5.55% 5.71% 5.71% 5.85% 3.60% 3.59%
Per Capita 2,283 2,139 2,020 1,965 1,977 1,922 1,867 1,848 1,109 1,081
(a) 2007 bonds restated to report net of issuance premiums/discounts and refundings and to include internal service funds in governmental activities.
(b) In 2004, the State issued appropriation obligations to obtain proceeds to pay the State's anticipated unfunded accrued prior service (pension) liability and its unfunded accrued liability for sick leave conversion credits.
(c) In 2004, GASB Technical Bulletin No. 2004-1, Tobacco Settlement Recognition and Financial Reporting Entity Issues, was implemented. Prior years have not been restated.
(d) These ratios are calculated using personal income and population for the prior calendar year.
SOURCE: Details regarding the State's outstanding debt can be found in the notes to the financial statements.
Schedule C-2 lists personal income and population data by year.
229

State of Wisconsin Schedule C-2Ratio of General Obligation Bonded Debt and Appropriation Bondsto Personal Income and Per Capita
For the Last Ten Fiscal Years
2011 2010 2009 2008
General Obligation Bonds: Payable from Governmental Funds $ 5,182,769 $ 4,628,075 $ 4,091,223 $ 3,921,719 Payable from Internal Service Funds 155,145 151,652 153,523 159,161 Payable from Enterprise Funds 1,392,358 1,235,410 1,117,248 1,154,594 Total General Obligation Bonds 6,730,272 6,015,137 5,361,994 5,235,474 Annual Appropriation Bonds (c) 3,331,570 3,357,795 3,378,300 1,850,802 Bonded Debt to be Paid with General Resources $ 10,061,842 $ 9,372,932 $ 8,740,294 $ 7,086,276
Personal Income $ 217,265,390 $ 209,347,374 $ 215,207,301 $ 206,647,824 Ratio of Bonded Debt to Personal Income (c) 4.6% 4.5% 4.1% 3.4%
Population 5,691 5,669 5,641 5,611 Bonded Debt per Capita (in Dollars) (c) $ 1,768 $ 1,653 $ 1,549 $ 1,263
(a) 2007 bonds restated to report net of issuance premiums/discounts and refundings.
(b) 2003 Wisconsin Acts 33 and 84 were enacted and authorized the issuance of appropriation obligations to obtain proceeds to pay the State’s anticipated unfunded accrued prior service (pension) liability under Wis. Stat. Section 40.05(2)(b) and its unfunded accrued liability for sick leave conversion credits under Wis. Stat. Section 40.05(4)(b), (bc), and (bw) and Subchapter IX of Chapter 40. The bonds are not general obligations of the State, and do not constitute “public debt” of the State as that term is used in the Constitution and in the State Statutes. The payment of the principal of, and premium, if any, and interest on the Bonds is subject to annual appropriation; that is, payments due in any fiscal year of the State will be made only to the extent sufficient amounts are appropriated by the Legislature. The State is not legally obligated to appropriate any amounts for payment of debt service on the Bonds.
(c) These ratios are calculated using personal income and population for the prior calendar year.
SOURCES: U.S. Department of Commerce, Bureau of Census U.S. Department of Commerce, Bureau of Economic Analysis Wisconsin Department of Administration Wisconsin Department of Revenue
230

Schedule C-2
(In Thousands, except for Net Bonded Debt Per Capita)
2007 (a) 2006 2005 2004 2003 2002
$ 3,907,010 $ 3,879,823 $ 3,596,453 $ 3,389,177 $ 2,917,331 (b) $ 2,802,708 159,276 162,159 167,520 171,042 173,544 159,880
1,122,337 896,267 893,195 859,261 913,452 996,238 5,188,623 4,938,249 4,657,168 4,419,480 4,004,327 3,958,826 1,792,686 1,792,488 1,792,290 1,792,092 - -
$ 6,981,309 $ 6,730,737 $ 6,449,458 $ 6,211,572 $ 4,004,327 $ 3,958,826
$ 198,556,011 $ 186,545,156 $ 180,303,031 $ 173,247,922 $ 167,707,615 $ 162,772,656 3.5% 3.6% 3.6% 3.6% 2.4% 2.4%
5,578 5,546 5,514 5,479 5,445 5,407 $ 1,252 $ 1,214 $ 1,170 $ 1,134 $ 735 $ 732
231

State of Wisconsin Schedule C-3Legal Debt Margin
For the Last Ten Calendar Years (In Thousands)
Legal Debt Annual Total Net Margin as a
Calendar Debt Debt Applicable Legal Debt Percentage of Year Limit to Limit (a) Margin Debt Limit
2011 (b) $ 3,651,482 $ 758,000 $ 2,893,482 79.2 %2010 3,719,281 809,293 2,909,988 78.22009 3,839,340 542,765 3,296,575 85.92008 3,857,955 493,635 3,364,320 87.22007 3,734,403 483,280 3,251,123 87.12006 3,517,374 891,285 2,626,089 74.72005 3,209,502 471,640 2,737,862 85.32004 2,933,909 664,435 2,269,474 77.42003 2,705,327 499,030 2,206,297 81.62002 2,514,949 481,000 2,033,949 80.9
Calculation of Annual Public Debt Limit for 2011:
Wis. Stat. Sec. 18.05 limits the amount of public debt contracted in any calendar year to the lesser of:
(1) Three-fourths of one percent of the aggregate value of taxable property $ 3,651,482
or (2) Five percent of aggregate value of taxable property $ 24,343,212 Less: Net indebtedness at January 1 7,407,431
$ 16,935,781
The lesser of (1) or (2) is: $ 3,651,482
(a) Consists of bonds issued less refundings.
(b) Debt issued through October 15, 2011.
SOURCE: Wisconsin Department of Administration
232

State of Wisconsin Schedule C-4Department of Transportation Revenue Bond Coverage
For the Last Ten Fiscal Years (In Thousands)
Debt Service Pledged Gross Operating Net Total Debt Revenue
Year Revenues (a) Expenses (b) Revenues Principal Interest Service Coverage
2011 $ 603,768 $ 39 $ 603,729 $ 77,195 $ 79,500 $ 156,695 3.852010 610,471 66 610,405 79,395 73,018 152,413 4.002009 603,548 68 603,480 80,395 70,787 151,182 3.992008 544,739 89 544,650 75,065 68,173 143,238 3.802007 458,077 78 457,999 71,640 68,460 140,100 3.272006 467,368 98 467,270 61,120 63,739 124,859 3.742005 436,724 138 436,586 57,885 65,433 123,318 3.542004 425,588 55 425,533 46,870 57,083 103,953 4.092003 326,266 71 326,195 38,115 52,738 90,853 3.592002 324,967 105 324,862 36,560 46,454 83,014 3.91
The State of Wisconsin, Department of Transportation finances certain state highway projects and related transportation facilities through the issuance of revenue bonds. The revenue
bonds, $1,719.5 million outstanding at June 30, 2011, are secured by a pledge of the registration and registration-related fees collected under Wis. Stat. Sec. 341.25 and investments.
(a) Includes revenues from Wis. Stat. Sec. 341.25 registration and registration-related fees including fees collected under the International Registration Plan, a multi-state plan for the
collection of registration fees from interstate trucking, and interest earnings.
Beginning in FY 2003, IRP revenues due Wisconsin were mistakenly recorded as a liability to other states. Gross Revenues are corrected (increased).
(b) Includes administrative operating expenses.
SOURCE: Wisconsin Department of Transportation
233

State of Wisconsin Schedule C-5Environmental Improvement Fund Revenue Bond Coverage
For the Last Ten Fiscal Years (In Thousands)
Debt Service Pledged Gross Operating Net Total Debt Revenue
Year Revenues (a) Expenses (b) Revenues Principal Interest Service Coverage
2011 $ 117,325 $ 2,163 $ 115,162 $ 70,690 $ 41,783 $ 112,473 1.022010 110,429 1,603 108,826 66,865 39,387 106,252 1.022009 106,305 2,346 103,959 60,730 39,282 100,012 1.042008 99,761 2,515 97,246 53,810 36,439 90,249 1.082007 98,288 2,416 95,872 47,085 36,163 83,248 1.152006 86,289 2,348 83,941 44,775 33,197 77,972 1.082005 64,321 2,292 62,029 39,340 33,677 73,017 0.852004 66,741 2,088 64,653 37,545 34,527 72,072 0.902003 72,959 2,065 70,894 36,405 34,646 71,051 1.002002 67,330 2,052 65,278 30,975 32,426 63,401 1.03
(a) Includes operating revenue from loan repayment and interest income from revenue bonds.
(b) Includes allocated administrative and general costs.
SOURCE: Wisconsin Department of Administration
234

State of Wisconsin Schedule C-6Petroleum Inspection Fee Revenue Bond Coverage
For Last Ten Fiscal Years (In Thousands)
Debt Service Pledged Fees Remitted Total Debt Revenue
Year to the Trustees (a) Principal Interest Service Coverage
2011 $ 73,809 $ 0 $ 6,985 $ 6,985 10.572010 72,540 22,350 2,632 24,982 2.902009 73,359 21,280 6,898 28,178 2.602008 76,558 20,270 10,086 30,356 2.52
2007 (b) 75,361 19,775 12,722 32,497 2.322006 114,949 18,205 13,728 31,933 3.602005 115,901 12,735 13,555 26,290 4.412004 116,634 12,070 11,507 23,577 4.952003 117,336 11,440 12,632 24,072 4.872002 110,689 - 11,304 11,304 9.79
(a) The table presents the calculation of revenue bond coverage based on a ratio of petroleum inspection fees remitted to the trustee during the respective
fiscal years, divided by the senior debt service payments made from those fees during each fiscal year.
(b) The 2006-2007 information does not include $37,885,000 in principal or $36,140 interest that were paid with monies transferred from the State's Petroleum Inspection Fund.
Fiscal year 2006-2007 is the first full fiscal year at the reduced rate for petroleum inspection fees. 2005 Wisconsin Acts 25 and 85 amended Wis. Stat. Sec. 168.12 (1) by
reducing the petroleum inspection fee imposed from $0.03 per gallon to $0.02 per gallon, effective April 1, 2006.
235

State of Wisconsin Schedule C-7Wisconsin Housing and Economic Development Authority Revenue Bond Coverage
For the Last Ten Fiscal Years (In Thousands)
Direct Debt Service Pledged Gross Operating Net Total Debt Revenue
Year Revenues (a) Expenses (b) Revenues Principal Interest Service Coverage (c)
Home Ownership Revenue Bonds
2011 $ 396,743 $ 13,690 $ 383,053 $ 324,835 $ 80,506 $ 405,341 0.952010 389,628 15,430 374,198 339,225 (d) 95,116 434,341 0.862009 464,514 13,381 451,133 226,545 125,480 352,025 1.282008 349,724 13,149 336,575 154,885 114,035 268,920 1.252007 291,008 11,359 279,649 138,000 95,035 233,035 1.202006 273,512 11,039 262,473 172,640 75,490 248,130 1.062005 261,337 9,799 251,538 181,650 (f) 62,099 243,749 1.032004 439,960 (e) 9,431 430,529 396,415 (f) 59,809 456,224 0.952003 630,290 8,153 622,137 528,825 78,782 607,607 1.022002 429,838 8,287 421,551 300,645 88,279 388,924 1.08
Housing Revenue Bonds
2011 $ 53,399 $ 5,258 $ 48,141 $ 18,095 $ 18,016 $ 36,111 1.332010 61,141 4,445 56,696 12,965 19,460 32,425 1.752009 88,197 4,692 83,505 43,915 21,892 65,807 1.272008 79,701 4,574 75,127 27,092 22,847 49,939 1.502007 80,325 3,924 76,401 24,945 21,960 46,905 1.622006 87,115 4,313 82,802 44,165 (f) 22,448 66,613 1.252005 72,123 3,381 68,742 40,160 (f) 22,384 62,544 1.102004 70,811 4,099 66,712 32,040 (f) 22,942 54,982 1.232003 66,740 3,772 62,968 22,265 (f) 24,162 46,427 1.352002 66,480 3,449 63,031 16,725 25,884 42,609 1.48
Housing Rehabilitation and Home Improvement Revenue Bonds
2011 $ 1,872 $ 533 $ 1,339 $ - $ - $ - n/a2010 2,379 531 1,848 - - - n/a2009 2,867 482 2,385 - - - n/a2008 2,858 516 2,342 - - - n/a2007 2,826 560 2,266 - - - n/a2006 2,442 370 2,072 - - - n/a2005 2,283 333 1,950 - - - n/a2004 1,941 297 1,644 - - - n/a2003 1,941 145 1,796 - - - n/a2002 2,241 69 2,172 - - - n/a
(Continued)
236

State of Wisconsin Schedule C-7Wisconsin Housing and Economic Development Authority Revenue Bond Coverage
For the Last Ten Fiscal Years (Continued)
Direct Debt Service Pledged Gross Operating Net Total Debt Revenue
Year Revenues (a) Expenses (b) Revenues Principal Interest Service Coverage (c)
Business Development Revenue Bonds
2011 $ 244 $ 6 $ 238 $ 235 $ 7 $ 242 0.982010 2,154 4 2,150 2,125 27 2,152 1.002009 1,260 3 1,257 1,150 105 1,255 1.002008 765 5 760 605 154 759 1.002007 1,521 5 1,516 1,290 224 1,514 1.002006 3,894 6 3,888 3,630 256 3,886 1.002005 2,734 9 2,725 2,450 271 2,721 1.002004 5,240 7 5,233 4,935 288 5,223 1.002003 3,075 8 3,067 2,550 505 3,055 1.002002 3,660 10 3,650 2,990 642 3,632 1.00
Single Family Drawdown Revenue Bonds
2011 (g) 1 $ 2 $ (1) $ 0 $ 0 $ 0 n/a2010 (g) 1 3 (1) 0 18 18 (0.06)2009 80,832 2 80,829 80,257 566 80,823 1.002008 73,891 3 73,888 70,712 3,166 73,878 1.002007 28,461 2 28,459 25,677 2,785 28,462 1.002006 129,329 2 129,327 127,215 2,092 129,307 1.002005 188,601 5 188,596 185,976 2,924 188,900 1.002004 212,366 6 212,360 209,050 3,252 212,302 1.002003 157,155 5 157,150 154,000 3,114 157,114 1.002002 199,567 2 199,565 195,431 4,148 199,579 1.00
(a) Includes mortgage payments received.(b) Includes administrative and general costs, mortgage insurance premiums, lender service fees, and for the Housing Revenue Bonds includes the FAF (financial adjustment factor) expense and that portion of the FAF not yet expensed.(c) Includes gains/losses due to the increases/decreases in fair market value of investments as a result of the implementation of GASB Statement No. 31. The Pledged Revenue Coverage excludes these amounts.(d) Includes $290.0 million of special redemptions, $164.6 million of special redemptions July 1, 2009 through September 30, 2009.(e) Gross revenues include revised mortgage payments that exclude mortgage loans between programs.(f) Revised debt service principal payments exclude debt refunding issues.(g) On October 1, 2008, the Authority purchased $80.3 million, or 100% of the Authority's outstanding Single Family Drawdown Revenue Bonds, at a purchase price of par.
SOURCE: Wisconsin Housing and Economic Development Authority
237
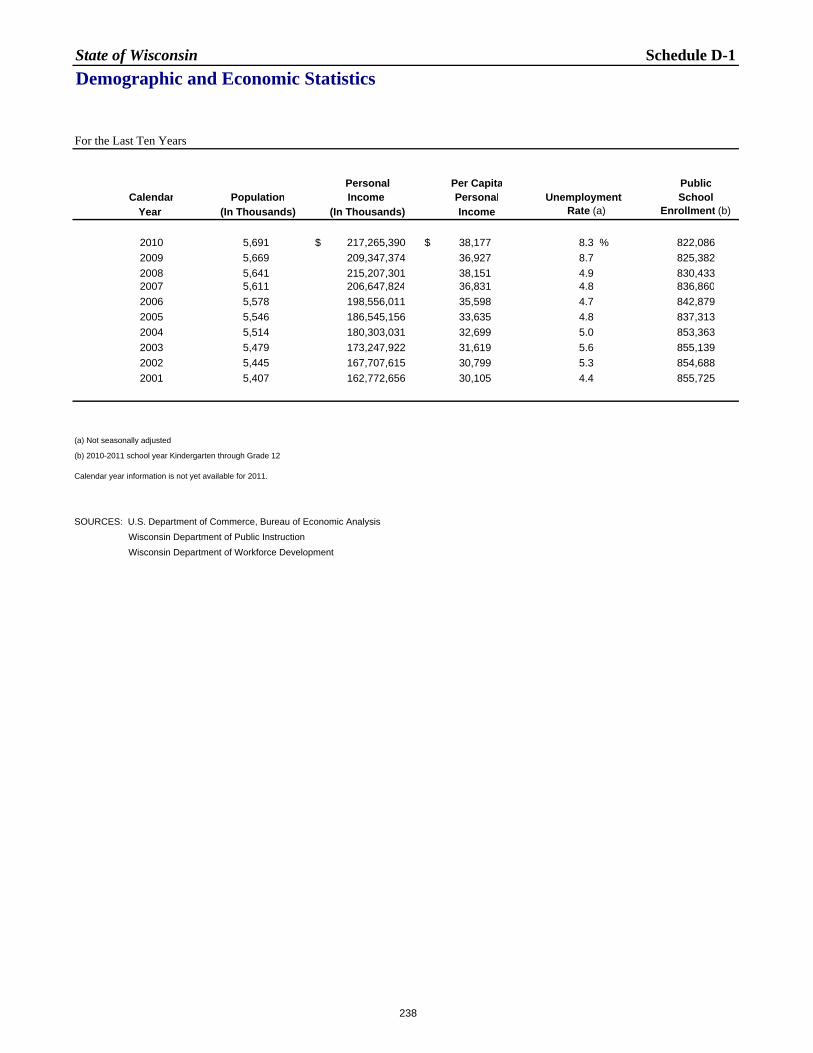
State of Wisconsin Schedule D-1Demographic and Economic Statistics
For the Last Ten Years
Personal Per Capita PublicCalendar Population Income Personal Unemployment School
Year (In Thousands) (In Thousands) Income Rate (a) Enrollment (b)
2010 5,691 $ 217,265,390 $ 38,177 8.3 % 822,0862009 5,669 209,347,374 36,927 8.7 825,3822008 5,641 215,207,301 38,151 4.9 830,4332007 5,611 206,647,824 36,831 4.8 836,8602006 5,578 198,556,011 35,598 4.7 842,8792005 5,546 186,545,156 33,635 4.8 837,3132004 5,514 180,303,031 32,699 5.0 853,3632003 5,479 173,247,922 31,619 5.6 855,1392002 5,445 167,707,615 30,799 5.3 854,6882001 5,407 162,772,656 30,105 4.4 855,725
(a) Not seasonally adjusted
(b) 2010-2011 school year Kindergarten through Grade 12
Calendar year information is not yet available for 2011.
SOURCES: U.S. Department of Commerce, Bureau of Economic Analysis Wisconsin Department of Public Instruction Wisconsin Department of Workforce Development
238

State of Wisconsin Schedule D-2Principal Employers 2011 and Nine Years Prior (a)
2011 2002Employer Employees (b) Rank Employees (b) Rank
Wal-mart Associates Inc. Greater than 9,999 1 Greater than 9,999 1UW-Madison Greater than 9,999 2 Greater than 9,999 3US Postal Service Greater than 9,999 3 Greater than 9,999Milwaukee Public Schools Greater than 9,999 4 2Department of Corrections Greater than 9,999 5 7,500 - 9,999 4Menard Inc. 7,500 - 9,999 6 5,000 - 7,499City of Milwaukee 7,500 - 9,999 7 6Marshfield Clinic 5,000 - 7,499 8Department of Veterans Affairs 5,000 - 7,499 9 7,500 - 9,999Aurora Helath Care Metro, Inc. 5,000 - 7,499 10Shopko Stores Inc. 7,500 - 9,999 5Kohler Co 5,000 - 7,499 7Department of Health and Human Services 5,000 - 7,499 8Kohl's Department Store 5,000 - 7,499 9County of Milwaukee 5,000 - 7,499 10
(a) March data(b) Number of employees per employer and percentage of total employment is confidential information.
SOURCE: Wisconsin Department of Workforce Development
239

State of Wisconsin Schedule E-1Full Time Equivalent State Government Employees by Function/Program
For the Last Ten Fiscal Years
Functions/Programs 2011 2010 2009 2008 2007
Commerce 1,375 1,397 1,424 1,467 1,468 Education University of Wisconsin System 32,882 32,205 31,552 30,982 30,668 Other Education 838 859 859 880 872 Transportation 2,942 3,174 3,238 3,315 3,350 Environmental Resources 2,275 2,470 2,470 2,581 2,586 Human Relations and Resources 19,541 20,163 20,191 19,972 19,656 General Executive 2,774 2,877 2,935 2,953 2,990 Judicial 832 808 804 802 784 Legislative 710 726 734 717 732
Totals 64,168 64,679 64,206 63,670 63,106
Percentage Change -0.79% 0.74% 0.84% 0.89% 0.87%
Totals exclude limited term employees.
Measurement date for most positions is the last full payperiod prior to June 30. In the case of the University of Wisconsin System, the March payroll is used to better capture individualswho do not have full-year appointments.
Sources: State of Wisconsin, Department of Administration, State Controller's Office University of Wisconsin System Wisconsin State Legislature and legislative service agencies
240
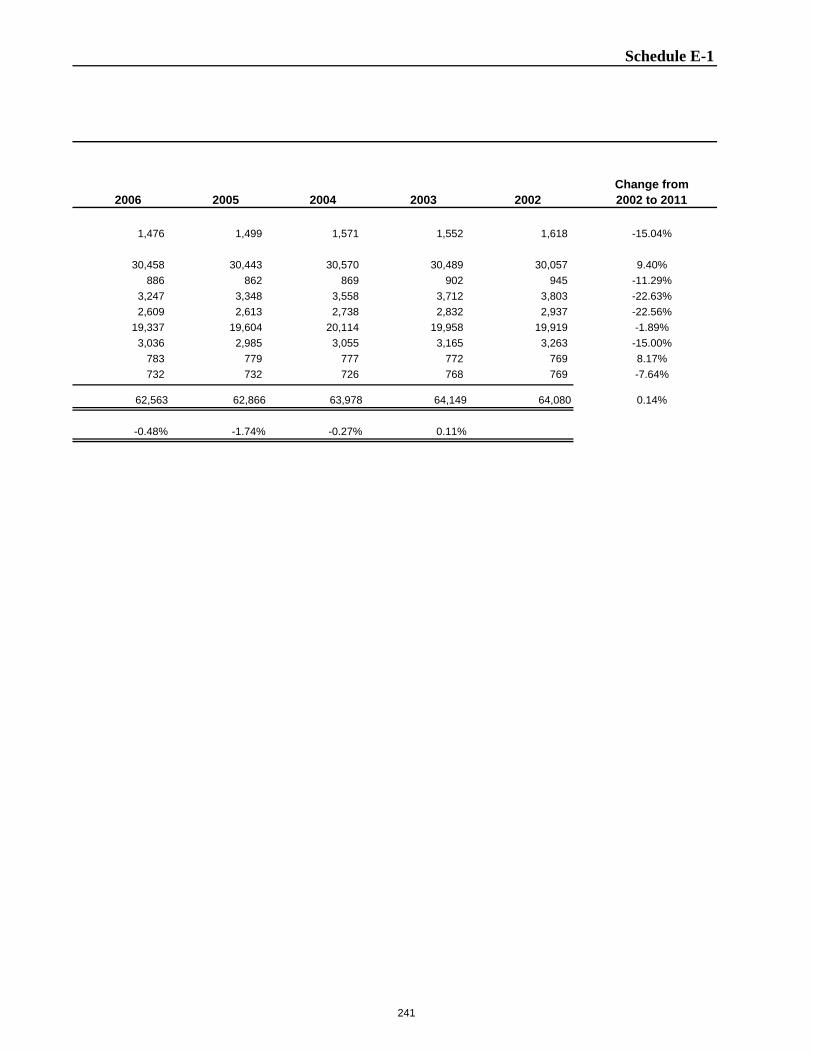
Schedule E-1
Change from2006 2005 2004 2003 2002 2002 to 2011
1,476 1,499 1,571 1,552 1,618 -15.04%
30,458 30,443 30,570 30,489 30,057 9.40%886 862 869 902 945 -11.29%
3,247 3,348 3,558 3,712 3,803 -22.63%2,609 2,613 2,738 2,832 2,937 -22.56%
19,337 19,604 20,114 19,958 19,919 -1.89%3,036 2,985 3,055 3,165 3,263 -15.00%
783 779 777 772 769 8.17%732 732 726 768 769 -7.64%
62,563 62,866 63,978 64,149 64,080 0.14%
-0.48% -1.74% -0.27% 0.11%
241

State of Wisconsin Schedule E-2Operating Indicators by Function
For the Last Ten Fiscal Years
2011 2010 2009 2008Commerce Agriculture Farm Inspections (Calendar Year) (a) 20,835 21,446 21,331 State Fair Park State Fair Attendance (Calendar Year) 911,231 876,020 833,285 872,458 Education Historical Society Visitors to Historic Sites and State Museum 230,001 240,723 248,689 242,121 Public Instruction Licensed School Staff (a) 68,036 68,681 67,939 Ratio of Students to Licensed Staff (a) 12.8 12.7 12.9 State's Share of Spending per Student (a) 5,742 $5,533 $6,018 University of Wisconsin System Enrollment (Full Time Equivalent) 156,039 153,193 149,493 147,955 Number of Degrees Conferred (a) 33,442 33,044 32,475 Technical College System Enrollment (Degree/Career Programs) (a) 199,752 185,878 178,447 Number of Degrees Granted (a) 26,310 24,121 23,617 Transportation Motor Vehicle Registrations (Calendar Year) (a) 5,482,518 5,539,105 5,402,565 Licensed Drivers (Calendar Year) (a) 4,114,622 4,085,833 4,079,562 Environmental Resources Natural Resources Park Visitors (Calendar Year) (Excludes Lakeshore Park) (a) 14,469,998 14,435,928 13,291,541 Annual Park Admission Stickers (Calendar Year) (a) 677,938 579,125 571,844 Fishing and Hunting Licenses (License Year) (a) 4,736,620 4,786,631 4,648,467 State Hatchery Fish Stocked (a) 8,723,781 12,409,996 7,720,740 Human Relations and Resources Corrections (Average Daily Population) Adults in Correctional Facilities 22,491 23,015 23,162 23,341 Juveniles in Detention Facilities 349 466 563 587 Health and Family Services Medicaid Caseload (Average Monthly) 1,158,284 1,094,058 952,175 873,229 Clients in Care and Treatment Centers (d) 1,501 1,571 1,639 1,681 FoodShare Recipients (Average Monthly) 785,300 681,826 507,228 408,360 Children and Families (Calendar Year) Wisconsin Works (W-2) Participants (a) 27,835 20,904 19,030 Workforce Development Unemployment Insurance Initial Claims 949,796 1,209,972 1,206,008 668,665 Unemployment Insurance Benefits (In Thousands) $2,415,151 $3,131,688 $2,093,627 $939,832 Military Affairs National Guard Assigned Strength 9,717 10,180 9,944 9,979 Veterans Affairs (Calendar Year) Residents of Veterans Homes (a) 1,040 891 870 General Executive Administration Construction Projects Initiated (Calendar Year) (a) 787 846 960 State Patrol Troopers/Inspectors (Authorized) 382/112 382/112 382/112 382/112 State Patrol Citations Issued (Calendar Year) 136,671 141,490 146,835 142,363 Employee Trust Funds (Calendar Year) Active Employees in Pension Plan (a) 72,740 72,415 72,165 Active Employees in Group Health Plan (a) 72,313 71,924 71,925
(a) Information is currently not available. (b) Average monthly Medicaid caseload increased due to the start of Family Planning Waiver and SeniorCare. (c) FoodShare Wisconsin replaced the Food Stamp Program in Wisconsin on October 15, 2004. (d) Care and Treatment Center population is based on a daily average, except for the Wisconsin Resource Center from 2002 through 2006 (which is based on a client count on the last day of the month). The Sand Ridge Secure Treatment Center opened in June 2001.
SOURCE: Wisconsin Blue Book, Various State Departments/Agencies
242

Schedule E-2
2007 2006 2005 2004 2003 2002
21,134 23,435 23,539 24,766 25,608 28,670
801,420 861,408 860,078 879,322 809,484 894,709
244,783 234,515 242,931 235,523 238,591 257,244
68,071 68,284 68,853 68,692 70,079 69,354 12.9 12.8 12.5 12.8 12.6 12.7
$5,985 $5,847 $5,500 $5,445 $5,392 $5,231
144,814 144,298 142,209 141,500 140,000 137,730 32,057 30,703 30,976 32,189 29,237 28,894
177,126 175,955 174,894 176,082 172,415 164,912 24,054 23,198 23,355 21,649 19,741 18,110
5,455,985 5,326,693 5,371,800 5,278,402 5,160,673 5,038,541 4,075,764 4,066,273 4,049,450 3,993,348 3,933,924 3,839,930
13,063,165 13,161,106 13,410,803 14,300,000 14,100,000 14,100,000 517,445 516,109 367,251 346,730 371,710 373,140
3,183,074 3,156,267 3,125,816 3,106,580 3,118,324 3,083,839 18,209,232 9,966,000 10,929,000 10,913,000 14,288,000 11,229,000
23,094 22,412 22,596 22,331 21,825 21,025 581 596 658 693 799 836
849,630 834,027 805,702 775,052 677,800 (b) 553,723 1,762 1,775 1,825 1,874 1,895 1,904
379,046 363,678 339,820 320,219 (c) 288,855 251,868
19,289 19,174 24,244 27,754 27,308 25,049
630,013 604,013 615,122 631,263 723,018 721,543 $803,753 $833,284 $846,984 $919,619 $1,209,351 $1,203,352
10,035 9,764 9,777 9,936 9,993 9,885
921 854 730 798 805 744
817 894 780 889 588 822 382/112 382/111 372/111 393/115 401/118 401/118150,053 146,545 158,379 184,220 176,833 173,885
71,162 70,366 70,006 70,933 71,031 71,222 70,119 68,688 68,044 68,758 68,755 68,090
243

State of Wisconsin Schedule E-3Capital Asset Statistics by Function
For the Last Ten Fiscal Years
2011 2010 2009 2008
Commerce State Fair Park Number of Buildings 39 39 42 41 Acres of Land 191 191 191 188 Education Educational Communications Board Communication Tower Sites 16 16 19 19 Historical Society Historic Sites Operated by the Historical Society 9 9 9 9 Public Instruction Residential Schools 2 2 2 2 University of Wisconsin System Number of Campuses 26 26 26 26 Technical College System Number of Districts and Campuses 16 and 49 16 and 48 16 and 47 16 and 47Transportation Miles of State Highways (a) (a) 11,774 11,783 Environmental Resources Natural Resources Number of State Parks and Recreational Areas 55 54 54 54 Acres of State Parks and Recreational Areas 85,424 85,045 85,001 85,001 Number of State Forests 12 12 12 12 Acres of State Forests 518,650 508,734 506,727 506,727 Number of State Trails 41 42 42 42 Miles of State Trails 1,980 1,908 1,898 1,762 Number of Fish Hatcheries 14 14 14 13 Human Relations and Resources Corrections Number of Adult Correctional Institutions 19 19 19 19 Number of Adult Correctional Centers 16 16 16 16 Number of Juvenile Facilities 3 4 4 4 Health and Family Services Number of Care and Treatment Centers 7 7 7 7 Military Affairs National Guard Armories (b) 67 69 69 77 Flight Centers 3 3 3 3 Veterans Affairs Number of Veterans Homes 2 2 2 2 General Executive Administration Number of DOA Owned Buildings 26 26 26 26 Number of General Fleet Vehicles (All Agencies) 5,777 5,762 6,087 6,202 Number of Aircraft 20 19 19 19 Public Lands Acres of Land 76,508 76,292 78,000 75,700
(a) Information is currently not available. (b) Current information is from the Department of Military Affairs, data prior to 2004 is from the Wisconsin Blue Book.
SOURCE: Wisconsin Blue Book, Various State Departments/Agencies
244
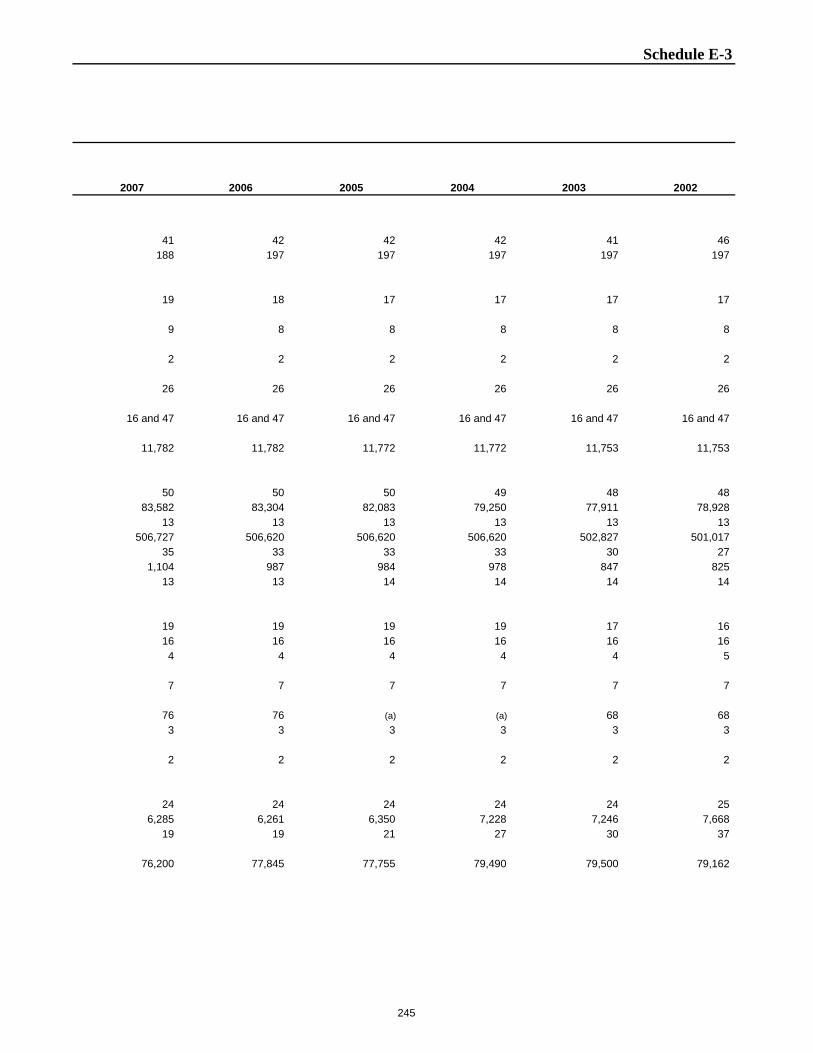
Schedule E-3
2007 2006 2005 2004 2003 2002
41 42 42 42 41 46 188 197 197 197 197 197
19 18 17 17 17 17
9 8 8 8 8 8
2 2 2 2 2 2
26 26 26 26 26 26
16 and 47 16 and 47 16 and 47 16 and 47 16 and 47 16 and 47
11,782 11,782 11,772 11,772 11,753 11,753
50 50 50 49 48 48 83,582 83,304 82,083 79,250 77,911 78,928
13 13 13 13 13 13 506,727 506,620 506,620 506,620 502,827 501,017
35 33 33 33 30 27 1,104 987 984 978 847 825
13 13 14 14 14 14
19 19 19 19 17 16 16 16 16 16 16 16 4 4 4 4 4 5
7 7 7 7 7 7
76 76 (a) (a) 68 68 3 3 3 3 3 3
2 2 2 2 2 2
24 24 24 24 24 25 6,285 6,261 6,350 7,228 7,246 7,668
19 19 21 27 30 37
76,200 77,845 77,755 79,490 79,500 79,162
245

State of Wisconsin Schedule E-4Local Government Property Insurance Fund Ten-Year Claims Development Information
Fiscal and Policy Year Ended June 30 (In Thousands)
2002 2003 2004 2005 2006 2007 2008 2009 2010 2011
1. Premium and investmentrevenues: Earned $ 14,518 $ 18,190 $ 26,920 $ 26,291 $ 27,018 $ 24,732 $ 23,929 $ 22,644 $ 21,919 $ 21,179 Ceded 2,815 4,602 5,710 4,506 3,965 3,956 4,739 4,689 5,207 5,532 Net Earned 11,703 13,588 21,210 21,785 23,053 20,776 19,190 17,955 16,712 15,647
2. Loss expenses 652 629 618 623 522 404 182 247 408 440
3. Estimated incurred claims and allocated expense,
end of policy year Direct incurred 14,837 18,589 11,118 11,367 16,564 22,226 22,037 11,372 12,113 42,174 Ceded 979 4,183 0 1,744 912 5,966 621 0 0 17,115 Net Incurred 13,858 14,406 11,118 9,623 15,652 16,260 21,416 11,372 12,113 25,059
4. Paid (cumulative) as of: End of policy year 7,278 9,040 7,138 6,074 8,790 7,855 9,917 6,896 6,228 11,426 One year later 13,669 12,431 10,841 9,313 16,498 16,387 19,416 11,137 13,033 Two years later 14,814 13,002 11,105 9,983 16,286 16,619 21,353 11,500 Three years later 14,923 13,004 11,105 9,983 16,475 16,740 21,392 Four years later 14,981 13,004 11,105 10,844 16,580 16,740 Five years later 14,981 13,004 11,105 10,844 16,580 Six years later 14,981 13,004 11,105 10,844 Seven years later 14,981 13,004 11,105 Eight years later 14,981 13,004 Nine years later 14,981
The table above illustrates how the Local Government Property Insurance Fund's earned revenues (net of insurance) and investment income compare to related costs of loss (net of loss assumed by reinsurers) and other expenses assumed by the fund as of the end of each of the last ten years. The rows of the table are defined as follows:
(1) These lines show the total of each fiscal year's earned contribution revenues and investment revenues, amount of reinsurance premium ceded and net earned revenues.(2) This line shows each fiscal year's other operating cost of the fund including overhead and claims expense not allocable to individual claims.(3) This section shows the fund's incurred claims and allocated claims adjustment expense (both paid and accrued) as originally reported at the end of the first year in which the event
that triggered coverage under the contract occurred (called policy year).(4) This section of ten rows shows the cumulative amounts paid as of the end of successive years for each policy year.
SOURCE: Wisconsin Office of Commissioner of Insurance
(Continued)
246
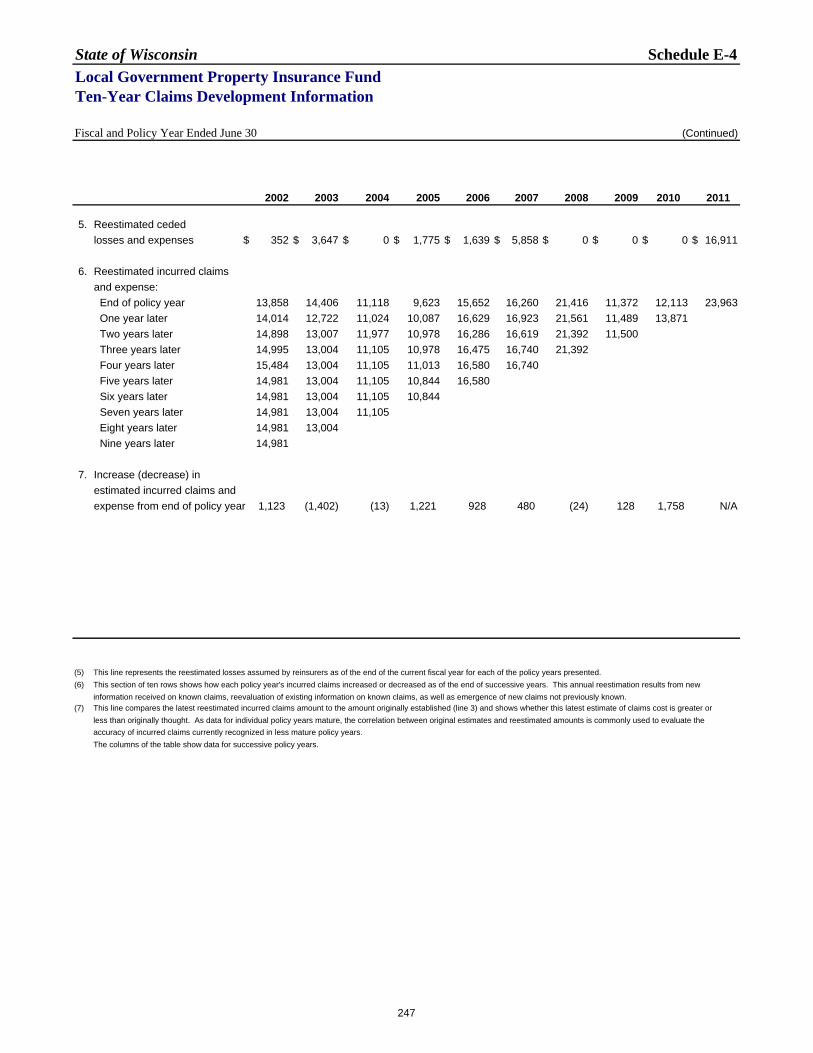
State of Wisconsin Schedule E-4Local Government Property Insurance FundTen-Year Claims Development Information
Fiscal and Policy Year Ended June 30 (Continued)
2002 2003 2004 2005 2006 2007 2008 2009 2010 2011
5. Reestimated ceded losses and expenses $ 352 $ 3,647 $ 0 $ 1,775 $ 1,639 $ 5,858 $ 0 $ 0 $ 0 $ 16,911
6. Reestimated incurred claims and expense:
End of policy year 13,858 14,406 11,118 9,623 15,652 16,260 21,416 11,372 12,113 23,963 One year later 14,014 12,722 11,024 10,087 16,629 16,923 21,561 11,489 13,871 Two years later 14,898 13,007 11,977 10,978 16,286 16,619 21,392 11,500 Three years later 14,995 13,004 11,105 10,978 16,475 16,740 21,392 Four years later 15,484 13,004 11,105 11,013 16,580 16,740 Five years later 14,981 13,004 11,105 10,844 16,580 Six years later 14,981 13,004 11,105 10,844 Seven years later 14,981 13,004 11,105 Eight years later 14,981 13,004 Nine years later 14,981
7. Increase (decrease) in estimated incurred claims and expense from end of policy year 1,123 (1,402) (13) 1,221 928 480 (24) 128 1,758 N/A
(5) This line represents the reestimated losses assumed by reinsurers as of the end of the current fiscal year for each of the policy years presented.(6) This section of ten rows shows how each policy year's incurred claims increased or decreased as of the end of successive years. This annual reestimation results from new
information received on known claims, reevaluation of existing information on known claims, as well as emergence of new claims not previously known.(7) This line compares the latest reestimated incurred claims amount to the amount originally established (line 3) and shows whether this latest estimate of claims cost is greater or
less than originally thought. As data for individual policy years mature, the correlation between original estimates and reestimated amounts is commonly used to evaluate theaccuracy of incurred claims currently recognized in less mature policy years. The columns of the table show data for successive policy years.
247
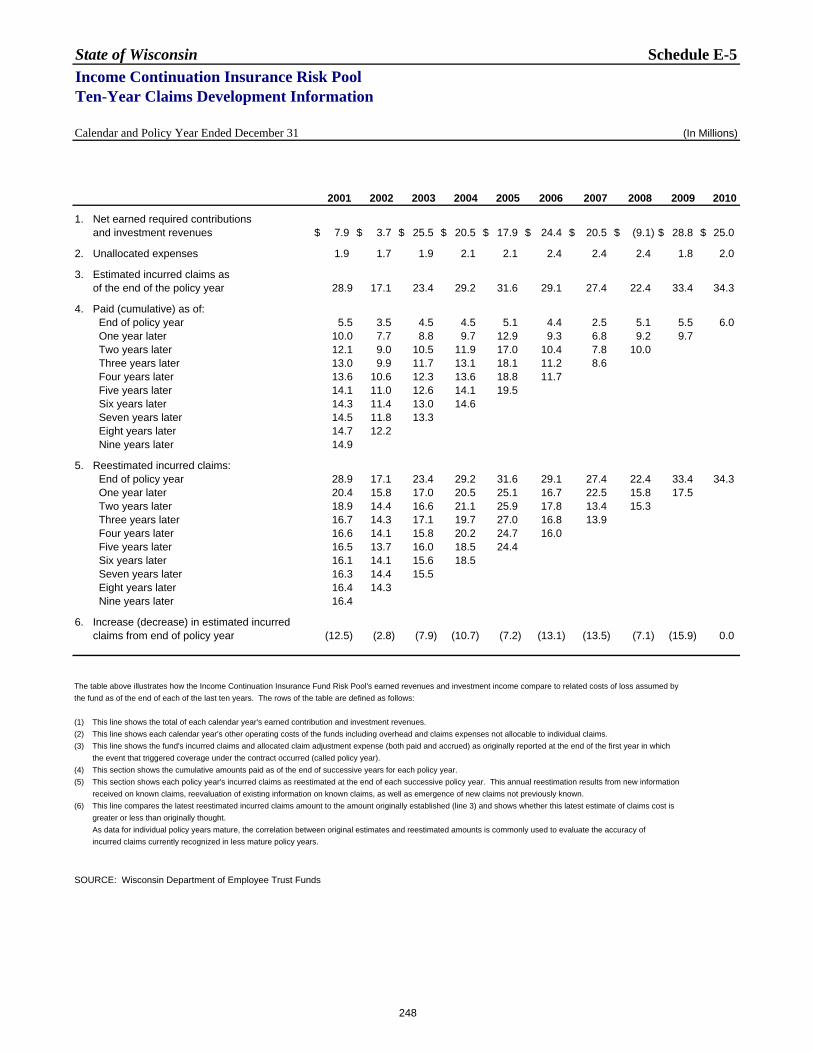
State of Wisconsin Schedule E-5Income Continuation Insurance Risk PoolTen-Year Claims Development Information
Calendar and Policy Year Ended December 31 (In Millions)
2001 2002 2003 2004 2005 2006 2007 2008 2009 2010
1. Net earned required contributions and investment revenues $ 7.9 $ 3.7 $ 25.5 $ 20.5 $ 17.9 $ 24.4 $ 20.5 $ (9.1) $ 28.8 $ 25.0
2. Unallocated expenses 1.9 1.7 1.9 2.1 2.1 2.4 2.4 2.4 1.8 2.0
3. Estimated incurred claims as of the end of the policy year 28.9 17.1 23.4 29.2 31.6 29.1 27.4 22.4 33.4 34.3
4. Paid (cumulative) as of: End of policy year 5.5 3.5 4.5 4.5 5.1 4.4 2.5 5.1 5.5 6.0
One year later 10.0 7.7 8.8 9.7 12.9 9.3 6.8 9.2 9.7 Two years later 12.1 9.0 10.5 11.9 17.0 10.4 7.8 10.0 Three years later 13.0 9.9 11.7 13.1 18.1 11.2 8.6 Four years later 13.6 10.6 12.3 13.6 18.8 11.7 Five years later 14.1 11.0 12.6 14.1 19.5 Six years later 14.3 11.4 13.0 14.6 Seven years later 14.5 11.8 13.3 Eight years later 14.7 12.2 Nine years later 14.9
5. Reestimated incurred claims: End of policy year 28.9 17.1 23.4 29.2 31.6 29.1 27.4 22.4 33.4 34.3 One year later 20.4 15.8 17.0 20.5 25.1 16.7 22.5 15.8 17.5 Two years later 18.9 14.4 16.6 21.1 25.9 17.8 13.4 15.3 Three years later 16.7 14.3 17.1 19.7 27.0 16.8 13.9 Four years later 16.6 14.1 15.8 20.2 24.7 16.0 Five years later 16.5 13.7 16.0 18.5 24.4 Six years later 16.1 14.1 15.6 18.5 Seven years later 16.3 14.4 15.5 Eight years later 16.4 14.3 Nine years later 16.4
6. Increase (decrease) in estimated incurred claims from end of policy year (12.5) (2.8) (7.9) (10.7) (7.2) (13.1) (13.5) (7.1) (15.9) 0.0
The table above illustrates how the Income Continuation Insurance Fund Risk Pool's earned revenues and investment income compare to related costs of loss assumed bythe fund as of the end of each of the last ten years. The rows of the table are defined as follows:
(1) This line shows the total of each calendar year's earned contribution and investment revenues. (2) This line shows each calendar year's other operating costs of the funds including overhead and claims expenses not allocable to individual claims. (3) This line shows the fund's incurred claims and allocated claim adjustment expense (both paid and accrued) as originally reported at the end of the first year in which the event that triggered coverage under the contract occurred (called policy year). (4) This section shows the cumulative amounts paid as of the end of successive years for each policy year. (5) This section shows each policy year's incurred claims as reestimated at the end of each successive policy year. This annual reestimation results from new information received on known claims, reevaluation of existing information on known claims, as well as emergence of new claims not previously known. (6) This line compares the latest reestimated incurred claims amount to the amount originally established (line 3) and shows whether this latest estimate of claims cost is greater or less than originally thought. As data for individual policy years mature, the correlation between original estimates and reestimated amounts is commonly used to evaluate the accuracy of incurred claims currently recognized in less mature policy years.
SOURCE: Wisconsin Department of Employee Trust Funds
248

State of Wisconsin Schedule E-6Long-term Disability Insurance Risk PoolTen-Year Claims Development Information
Calendar and Policy Year Ended December 31 (In Millions)
2001 2002 2003 2004 2005 2006 2007 2008 2009 2010
1 Net earned required contributions and investment revenues $ (6.9) $ (22.9) $ 52.5 $ 33.4 $ 24.1 $ 47.3 $ 27.8 $ (88.3) $ 49.3 $ 29.8
2 Unallocated expenses 1.0 0.8 0.7 1.1 1.0 1.1 1.4 1.3 2.2 2.0
3 Estimated incurred claims as of the end of the policy year 10.0 11.7 15.9 19.4 30.6 34.6 48.3 31.1 50.2 54.2
4 Paid (cumulative) as of: End of policy year 0.5 0.0 0.3 0.1 0.7 1.1 1.4 1.1 1.7 1.9
One year later 1.0 1.1 1.6 1.9 2.8 3.5 5.8 5.7 7.0 Two years later 2.0 2.5 3.9 3.9 5.4 6.8 9.4 9.4 Three years later 3.0 3.9 6.0 6.4 8.0 9.9 12.6 Four years later 3.9 5.1 8.5 8.0 10.3 12.7 Five years later 4.7 6.6 10.6 9.5 12.5 Six years later 5.7 8.0 12.5 10.8 Seven years later 6.5 9.3 14.2 Eight years later 7.3 10.4 Nine years later 8.0 5 Reestimated incurred claims: End of policy year 10.0 11.7 15.9 19.4 30.6 34.6 48.3 31.1 50.2 54.2 One year later 8.7 8.4 12.0 14.1 22.2 26.2 25.6 26.9 32.3 Two years later 8.3 12.7 18.3 14.9 22.1 29.5 29.9 29.5 Three years later 10.2 12.9 19.2 16.1 24.7 27.1 31.0 Four years later 10.0 13.7 20.3 17.7 23.4 28.3 Five years later 10.1 14.3 22.4 19.2 24.5 Six years later 10.8 15.7 24.3 17.8 Seven years later 11.5 17.0 21.3 Eight years later 12.3 15.2 Nine years later 11.4
6 Increase (decrease) in estimated incurred claims from end of policy year 1.4 3.5 5.4 (1.6) (6.1) (6.3) (17.3) (1.6) (17.9) 0.0
The table above illustrates how the Long-term Disability Insurance Fund Risk Pool's earned revenues and investment income compare to related costs of loss assumed by the fund asof the end of each of the last ten years. The rows of the table are defined as follows:
(1) This line shows the total of each calendar year's earned contribution and investment revenues. (2) This line shows each calendar year's other operating costs of the funds including overhead and claims expenses not allocable to individual claims. (3) This line shows the fund's incurred claims and allocated claim adjustment expense (both paid and accrued) as originally reported at the end of the first year in which the event that triggered coverage under the contract occurred (called policy year). (4) This section shows the cumulative amounts paid as of the end of successive years for each policy year. (5) This section shows each policy year's incurred claims as reestimated at the end of each successive policy year. This annual reestimation results from new information received on known claims, reevaluation of existing information on known claims, as well as emergence of new claims not previously known. (6) This line compares the latest reestimated incurred claims amount to the amount originally established (line 3) and shows whether this latest estimate of claims cost is greater or less than originally thought. As data for individual policy years mature, the correlation between original estimates and reestimated amounts is commonly used to evaluate the accuracy of incurred claims currently recognized in less mature policy years.
SOURCE: Wisconsin Department of Employee Trust Funds
249

State of Wisconsin Schedule E-7Health Insurance Risk Pool (Standard Plan)Ten-Year Claims Development Information
Calendar and Policy Year Ended December 31 (In Millions)
2001 2002 2003 2004 2005 2006 (a) 2007 2008 2009 2010
1 Net earned required contributions and investment revenues 77.6 $ 83.8 $ 85.1 $ 90.4 $ 90.9 $ 82.9 $ 42.1 $ 22.5 $ 41.5 $ 36.6
2 Unallocated expenses 4.8 3.9 5.7 6.8 7.7 4.9 3.4 5.3 5.0 5.4
3 Estimated incurred claims as of the end of the policy year 73.7 70.5 73.2 74.6 73.6 60.1 23.7 30.5 25.9 24.0
4 Paid (cumulative) as of: End of policy year 61.1 62.5 65.1 65.2 65.8 51.8 20.3 25.7 21.6 20.5 One year later 68.2 69.3 73.4 72.2 73.6 58.3 23.5 28.3 23.4 Two years later 68.3 69.4 73.7 72.3 73.7 58.2 23.5 28.2 Three years later 68.3 69.4 73.7 72.3 73.7 58.2 23.5 Four years later 68.3 69.4 73.7 72.3 73.7 58.2 Five years later 68.3 69.4 73.7 72.3 73.7 Six years later 68.3 69.4 73.7 72.3 Seven years later 68.3 69.4 73.7 Eight years later 68.3 69.4 Nine years later 68.3
5 Reestimated incurred claims: End of policy year 73.7 70.5 73.2 74.6 73.6 60.1 23.7 30.5 25.9 24.0 One year later 68.3 69.5 73.5 72.2 73.7 58.4 23.6 28.3 23.5 Two years later 68.3 69.4 73.7 72.3 73.7 58.2 23.5 28.2 Three years later 68.3 69.4 73.7 72.3 73.7 58.2 23.5 Four years later 68.3 69.4 73.7 72.3 73.7 58.2 Five years later 68.3 69.4 73.7 72.3 73.7 Six years later 68.3 69.4 73.7 72.3 Seven years later 68.3 69.4 73.7 Eight years later 68.3 69.4 Nine years later 68.3
6 Increase (decrease) in estimated incurred claims from end of policy year (5.4) (1.1) 0.5 (2.3) 0.1 (1.9) (0.2) (2.3) (2.4) 0.0
The table above illustrates how the Health Insurance Fund Risk Pool's earned revenues and investment income compare to related costs of loss assumed by the fund as of the end ofeach of the last ten years. The rows of the table are defined as follows:
(1) This line shows the total of each calendar year's earned contribution and investment revenues. (2) This line shows each calendar year's other operating costs of the funds including overhead and claims expenses not allocable to individual claims. (3) This line shows the fund's incurred claims and allocated claim adjustment expense (both paid and accrued) as originally reported at the end of the first year in which the event that triggered coverage under the contract occurred (called policy year). (4) This section shows the cumulative amounts paid as of the end of successive years for each policy year. (5) This section shows each policy year's incurred claims as reestimated at the end of each successive policy year. This annual reestimation results from new information received on known claims, reevaluation of existing information on known claims, as well as emergence of new claims not previously known. (6) This line compares the latest reestimated incurred claims amount to the amount originally established (line 3) and shows whether this latest estimate of claims cost is greater or less than originally thought. As data for individual policy years mature, the correlation between original estimates and reestimated amounts is commonly used to evaluate the accuracy of incurred claims currently recognized in less mature policy years.
(a) Starting in 2006, in accordance with GASB 43, retiree health is reported separately in an agency fund and is not included with the active health information in this table.
SOURCE: Wisconsin Department of Employee Trust Funds
250

State of Wisconsin Schedule E-8Health Insurance Risk Pool (Pharmacy Benefit)Seven-Year Claims Development Information
Calendar and Policy Year Ended December 31 (In Millions)
2004 2005 2006 (a) 2007 2008 2009 2010
1. Net earned required contributions and investment revenues $ 205.7 $ 191.6 $ 164.7 $ 170.0 $ 138.8 $ 155.5 $ 178.9
2. Unallocated expenses 7.6 9.5 7.4 8.4 8.8 6.4 8.7
3. Estimated incurred claims as of the end of the policy year 158.1 160.6 110.1 116.9 124.0 134.8 148.4
4. Paid (cumulative) as of: End of policy year 162.4 168.8 116.8 118.0 126.3 139.1 155.8 One year later 159.8 159.6 111.0 119.4 123.9 134.1
Two years later 159.8 159.6 111.0 119.4 123.9 Three years later 159.8 159.6 111.0 119.4 Four years later 159.8 159.6 111.0
Five years later 159.8 159.6 Six years later 159.8
5. Reestimated incurred claims: End of policy year 158.1 160.6 110.1 116.9 124.0 134.8 148.4 One year later 159.8 159.6 111.0 119.4 123.9 134.1
Two years later 159.8 159.6 111.0 119.4 123.9 Three years later 159.8 159.6 111.0 119.4 Four years later 159.8 159.6 111.0
Five years later 159.8 159.6 Six years later 159.8
6. Increase (decrease) in estimated incurred claims from end of policy year 1.7 (1.0) 0.9 2.5 (0.1) (0.7) 0.0
The table above illustrates how the BadgerRX for Individuals Fund Risk Pool's earned revenues and investment income compare to related costs of loss assumed by thefund as of the end of the calendar year. The pharmacy benefit plan began operation in 2004. The rows of the table are defined as follows:
(1) This line shows the total of each calendar year's earned contribution and investment revenues. (2) This line shows each calendar year's other operating costs of the funds including overhead and claims expenses not allocable to individual claims. (3) This line shows the fund's incurred claims and allocated claim adjustment expense (both paid and accrued) as originally reported at the end of the first year in which
the event that triggered coverage under the contract occurred (called policy year). (4) This section shows the cumulative amounts paid as of the end of successive years for each policy year. Paid claims include payments expected to be reimbursed as
rebate payments from participating pharmaceutical companies. (5) This section shows each policy year's incurred claims as reestimated at the end of each successive policy year. This annual reestimation results from new information
received on known claims, reevaluation of existing information on known claims, as well as emergence of new claims not previously known. Incurred claims arepresented net of anticipated rebates.
(6) This line compares the latest reestimated incurred claims amount to the amount originally established (line 3) and shows whether this latest estimate of claims cost isgreater or less than originally thought. As data for individual policy years mature, the correlation between original estimates and reestimated amounts is commonly used to evaluate the accuracy.
(a) Starting in 2006, in accordance with GASB 43, retiree health is reported separately in an agency fund and is not included with the active health information in this table.
SOURCE: Wisconsin Department of Employee Trust Funds
251
Acknowledgments The Comprehensive Annual Financial Report was prepared by the Department of Administration, Division of Executive Budget and Finance, State Controller’s Office, Financial Reporting Section:
Cindy Simon, CPA George Kiehl Susan Johnson, CPA Warren Honkola, CPA Wendy Powers
Special acknowledgment goes to:
Scott Miller and other staff in the State Controller’s Office who assisted with the preparation of the report. All fiscal and accounting personnel throughout Wisconsin State government, along with Legislative Audit Bureau staff, whose dedicated efforts and cooperation contributed to the compilation of financial information that appears in the report.
Cover photo of Wisconsin’s State Capitol courtesy of Man M. Le, photographer.
252