Embed Size (px)
Citation preview
2011 CARIS2011 CARIS ResultsResultsBill Lamanna New York Independent System Operator
ESPWGDecember 9, 2011 (update of 11-17-11 posting)Rensselaer, NY
DRAFT – FOR DISCUSSION PURPOSES ONLY© 2011 New York Independent System Operator, Inc. All Rights Reserved.
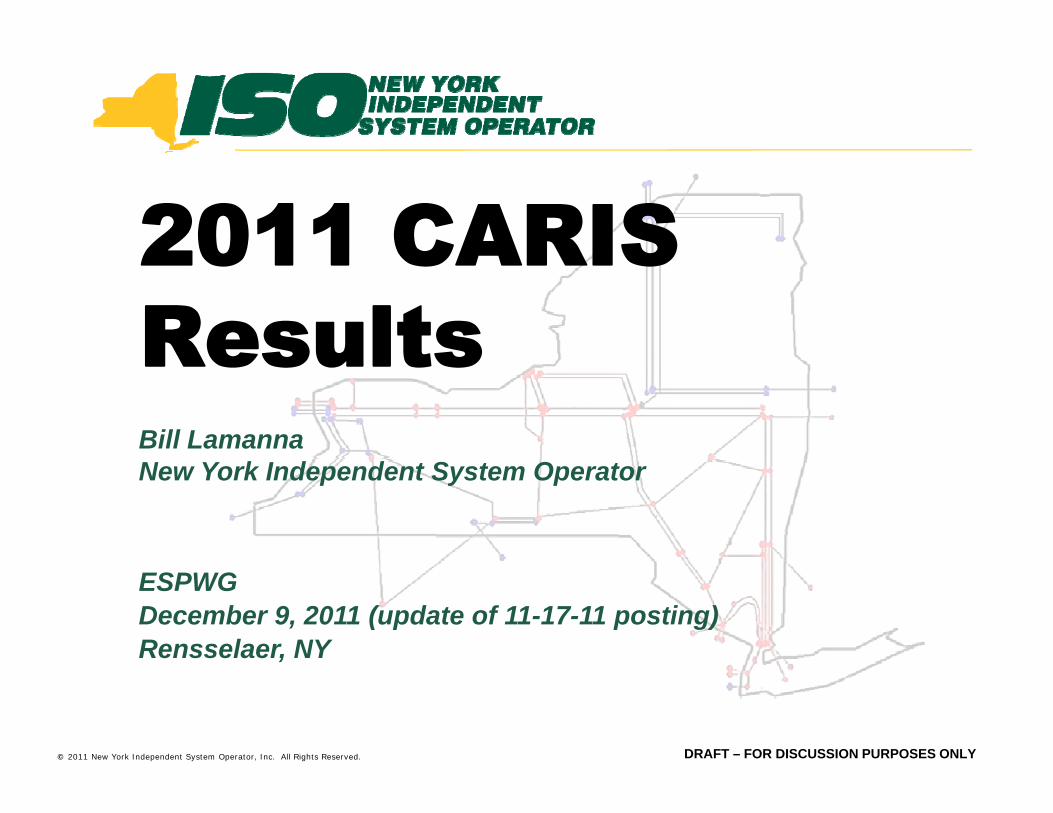
TopicsTopics
NYCA-Wide Cost Savings MethodologyRelaxation ResultsThree CARIS Studies
CongestionCongestionSolution Costs
Scenarios Results (2015 2020)Scenarios Results (2015, 2020)
© 2011 New York Independent System Operator, Inc. All Rights Reserved. 2DRAFT – FOR DISCUSSION PURPOSES ONLY
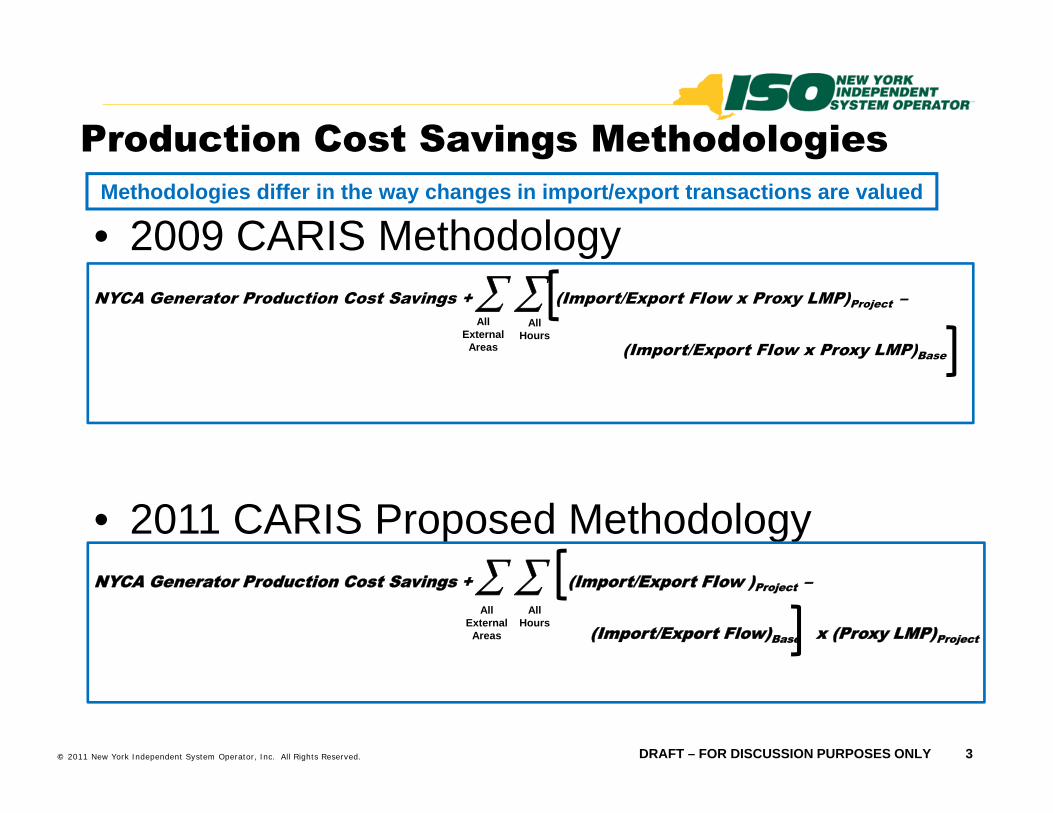
Production Cost Savings MethodologiesProduction Cost Savings Methodologies
• 2009 CARIS MethodologyMethodologies differ in the way changes in import/export transactions are valued
gyNYCA Generator Production Cost Savings + ∑ ∑ (Import/Export FIow x Proxy LMP)Project –
(Import/Export FIow x Proxy LMP)Base
All Hours
All External
Areas ( po t/ po t o o y )Base
• 2011 CARIS Proposed Methodology∑ ∑NYCA Generator Production Cost Savings + ∑ ∑ (Import/Export FIow )Project –
(Import/Export Flow)Base x (Proxy LMP)Project
All Hours
All External
Areas
© 2011 New York Independent System Operator, Inc. All Rights Reserved. 3DRAFT – FOR DISCUSSION PURPOSES ONLY
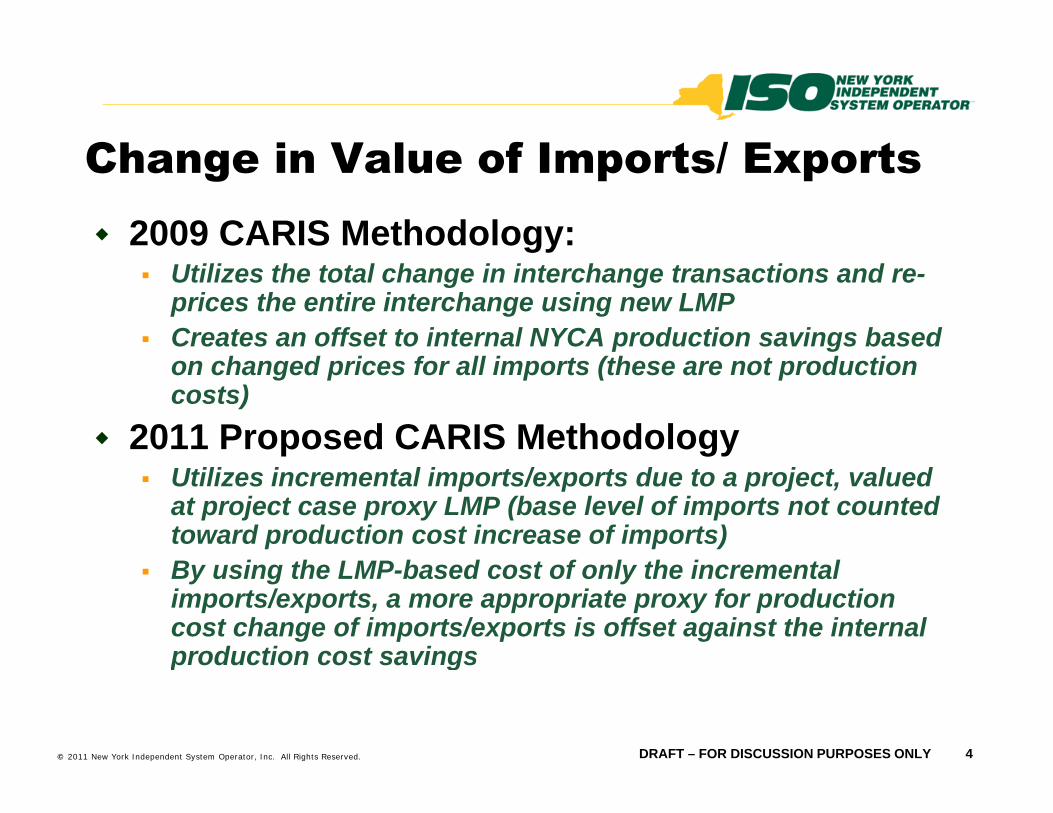
Change in Val e of Imports/ E portsChange in Value of Imports/ Exports
2009 CARIS Methodology: Utilizes the total change in interchange transactions and re-prices the entire interchange using new LMP Creates an offset to internal NYCA production savings based on changed prices for all imports (these are not production costs)
2011 Proposed CARIS MethodologyUtilizes incremental imports/exports due to a project, valued at project case proxy LMP (base level of imports not counted toward production cost increase of imports)B i th LMP b d t f l th i t lBy using the LMP-based cost of only the incremental imports/exports, a more appropriate proxy for production cost change of imports/exports is offset against the internal production cost savings
© 2011 New York Independent System Operator, Inc. All Rights Reserved. 4DRAFT – FOR DISCUSSION PURPOSES ONLY
production cost savings
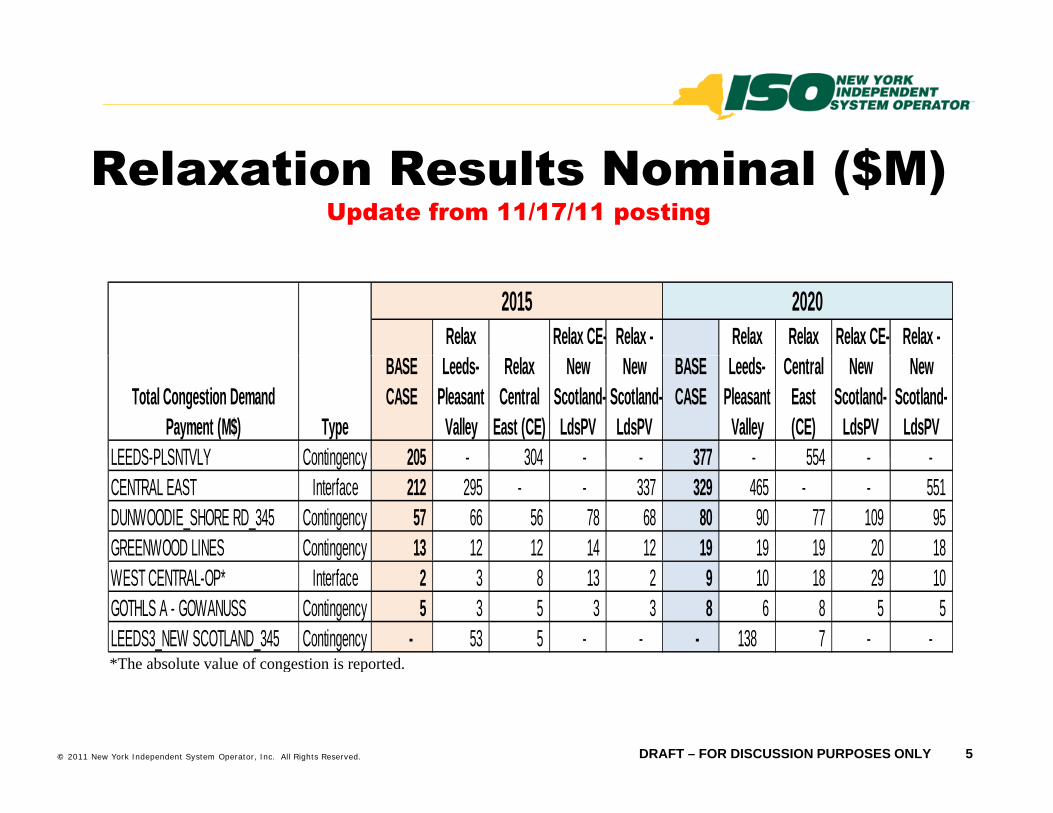
($ )Relaxation Results Nominal ($M) Update from 11/17/11 posting
Relax Relax CE- Relax - Relax Relax Relax CE- Relax - 2015 2020
Total Congestion Demand Payment (M$) Type
BASE CASE
Leeds-Pleasant
Valley
Relax Central
East (CE)
New Scotland-LdsPV
New Scotland-LdsPV
BASE CASE
Leeds-Pleasant
Valley
Central East (CE)
New Scotland-
LdsPV
New Scotland-
LdsPVLEEDS-PLSNTVLY Contingency 205 - 304 - - 377 - 554 - -LEEDS-PLSNTVLY Contingency 205 - 304 - - 377 - 554 - - CENTRAL EAST Interface 212 295 - - 337 329 465 - - 551 DUNWOODIE_SHORE RD_345 Contingency 57 66 56 78 68 80 90 77 109 95 GREENWOOD LINES Contingency 13 12 12 14 12 19 19 19 20 18 WEST CENTRAL-OP* Interface 2 3 8 13 2 9 10 18 29 10 GOTHLS A - GOWANUSS Contingency 5 3 5 3 3 8 6 8 5 5 LEEDS3_NEW SCOTLAND_345 Contingency - 53 5 - - - 138 7 - - *The absolute value of congestion is reported
© 2011 New York Independent System Operator, Inc. All Rights Reserved. 5DRAFT – FOR DISCUSSION PURPOSES ONLY
*The absolute value of congestion is reported.
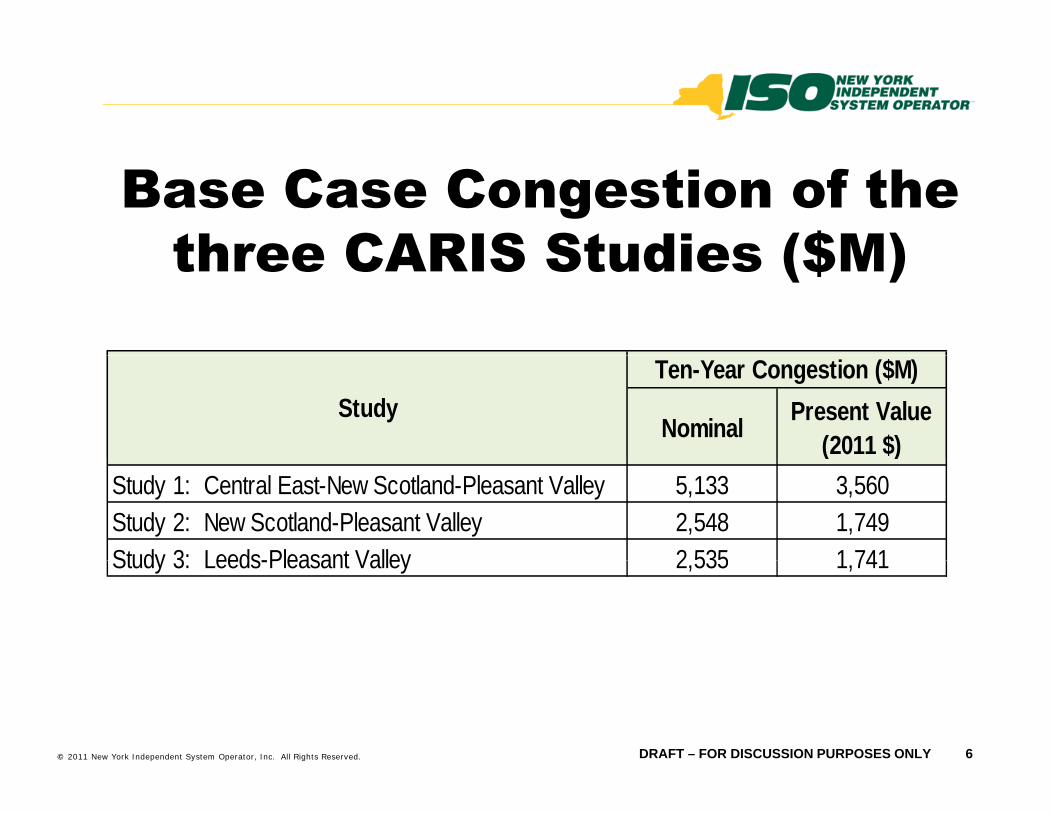
Base Case Congestion of the three CARIS Studies ($M)three CARIS Studies ($M)
Nominal Present Value (2011 $)
StudyTen-Year Congestion ($M)
( )Study 1: Central East-New Scotland-Pleasant Valley 5,133 3,560Study 2: New Scotland-Pleasant Valley 2,548 1,749Study 3: Leeds-Pleasant Valley 2 535 1 741Study 3: Leeds-Pleasant Valley 2,535 1,741
© 2011 New York Independent System Operator, Inc. All Rights Reserved. 6DRAFT – FOR DISCUSSION PURPOSES ONLY
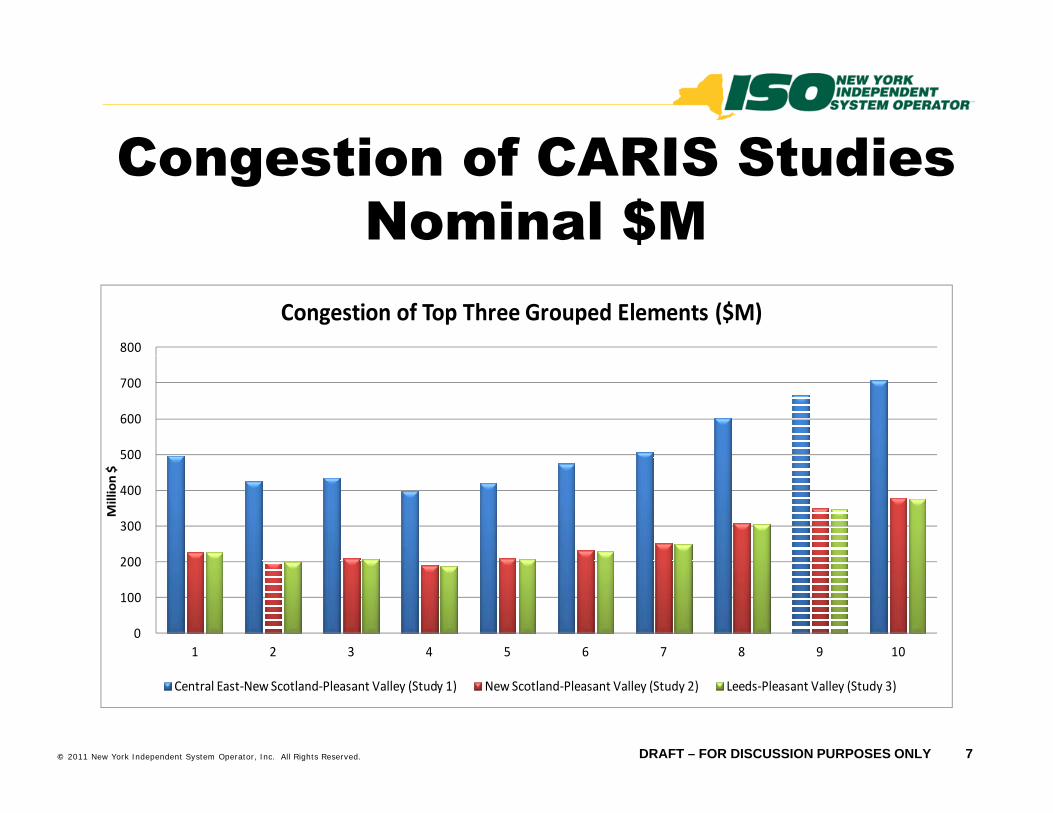
Congestion of CARIS StudiesCongestion of CARIS Studies Nominal $M
800
Congestion of Top Three Grouped Elements ($M)
500
600
700
200
300
400
500
Million $
0
100
200
1 2 3 4 5 6 7 8 9 10
© 2011 New York Independent System Operator, Inc. All Rights Reserved. 7DRAFT – FOR DISCUSSION PURPOSES ONLY
Central East‐New Scotland‐Pleasant Valley (Study 1) New Scotland‐Pleasant Valley (Study 2) Leeds‐Pleasant Valley (Study 3)
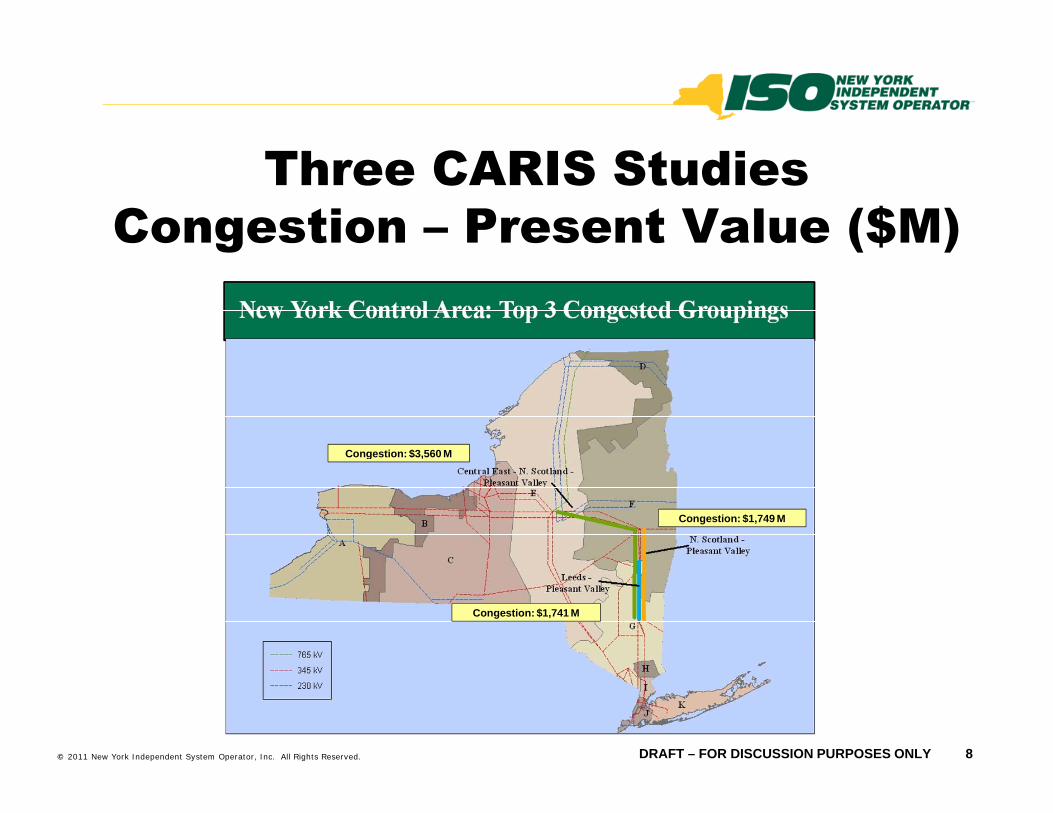
C S SThree CARIS StudiesCongestion – Present Value ($M)
Congestion: $3,560 Mg $ ,
Congestion: $1,749 M
Congestion: $1,741 M
© 2011 New York Independent System Operator, Inc. All Rights Reserved. 8DRAFT – FOR DISCUSSION PURPOSES ONLY
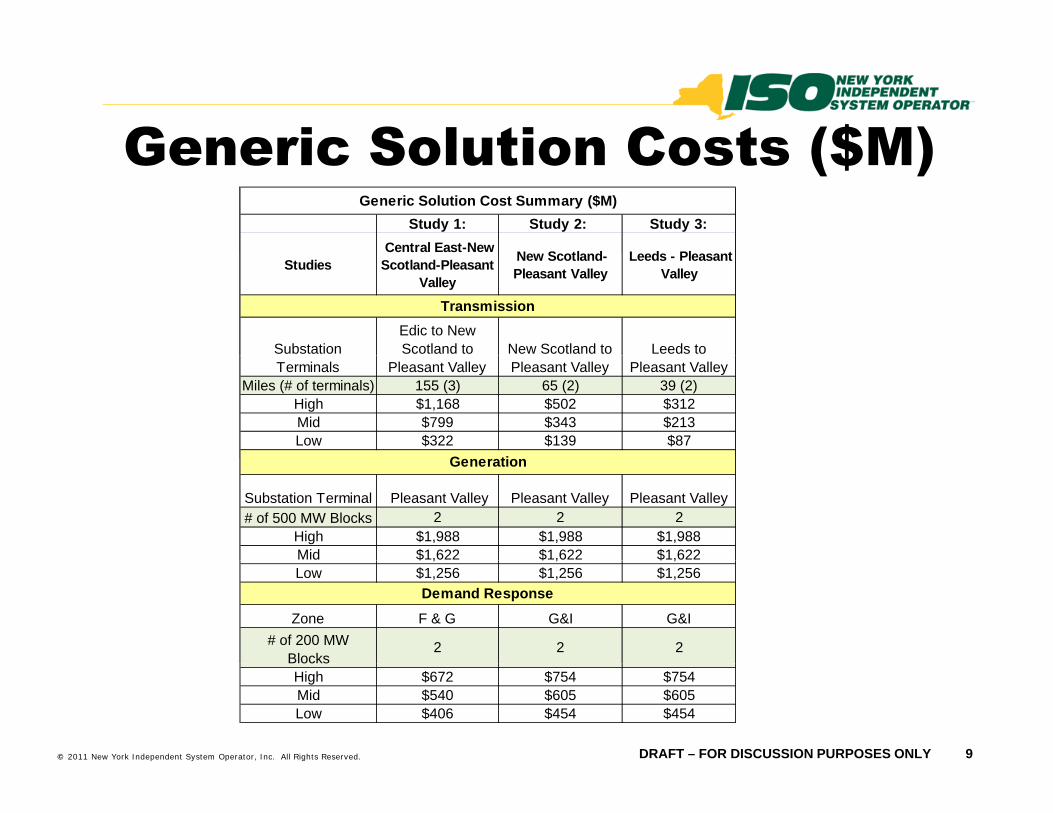
Generic Solution Costs ($M)Generic Solution Costs ($M)Study 1: Study 2: Study 3:
Central East-New N S tl d L d Pl t
Generic Solution Cost Summary ($M)
Studies Scotland-Pleasant Valley
New Scotland-Pleasant Valley
Leeds - Pleasant Valley
Substation Edic to New Scotland to New Scotland to Leeds to
Transmission
Terminals Pleasant Valley Pleasant Valley Pleasant ValleyMiles (# of terminals) 155 (3) 65 (2) 39 (2)
High $1,168 $502 $312Mid $799 $343 $213Low $322 $139 $87
G ti
Substation Terminal Pleasant Valley Pleasant Valley Pleasant Valley# of 500 MW Blocks 2 2 2
High $1,988 $1,988 $1,988Mid $1,622 $1,622 $1,622
Generation
$ , $ , $ ,Low $1,256 $1,256 $1,256
Zone F & G G&I G&I# of 200 MW
Blocks2 2 2
Demand Response
© 2011 New York Independent System Operator, Inc. All Rights Reserved. 9DRAFT – FOR DISCUSSION PURPOSES ONLY
BlocksHigh $672 $754 $754Mid $540 $605 $605Low $406 $454 $454
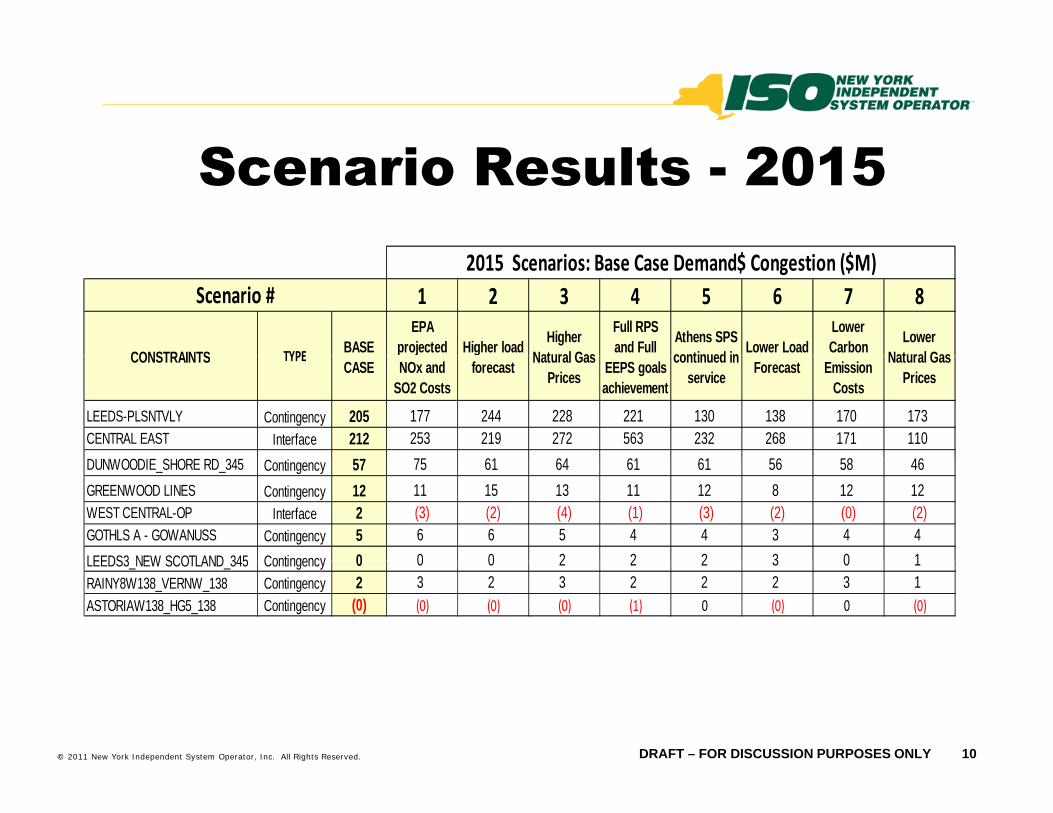
S i R lt 2015Scenario Results - 2015
$ $1 2 3 4 5 6 7 8
CONSTRAINTS TYPE BASE EPA
projected Higher load Higher Natural Gas
Full RPS and Full Athens SPS
continued in Lower Load Lower Carbon Lower
Natural Gas
2015 Scenarios: Base Case Demand$ Congestion ($M)Scenario #
CONSTRAINTS TYPECASE
p jNOx and
SO2 Costs
gforecast Natural Gas
Prices EEPS goalsachievement
continued in service Forecast Emission
Costs
Natural Gas Prices
LEEDS-PLSNTVLY Contingency 205 177 244 228 221 130 138 170 173CENTRAL EAST Interface 212 253 219 272 563 232 268 171 110
7 61 64 61 61 6 8 46DUNWOODIE_SHORE RD_345 Contingency 57 75 61 64 61 61 56 58 46GREENWOOD LINES Contingency 12 11 15 13 11 12 8 12 12WEST CENTRAL-OP Interface 2 (3) (2) (4) (1) (3) (2) (0) (2)GOTHLS A - GOWANUSS Contingency 5 6 6 5 4 4 3 4 4LEEDS3 NEW SCOTLAND 345 Contingency 0 0 0 2 2 2 3 0 1LEEDS3_NEW SCOTLAND_345 Contingency 0 0 0 2 2 2 3 0 1RAINY8W138_VERNW_138 Contingency 2 3 2 3 2 2 2 3 1ASTORIAW138_HG5_138 Contingency (0) (0) (0) (0) (1) 0 (0) 0 (0)
© 2011 New York Independent System Operator, Inc. All Rights Reserved. 10DRAFT – FOR DISCUSSION PURPOSES ONLY
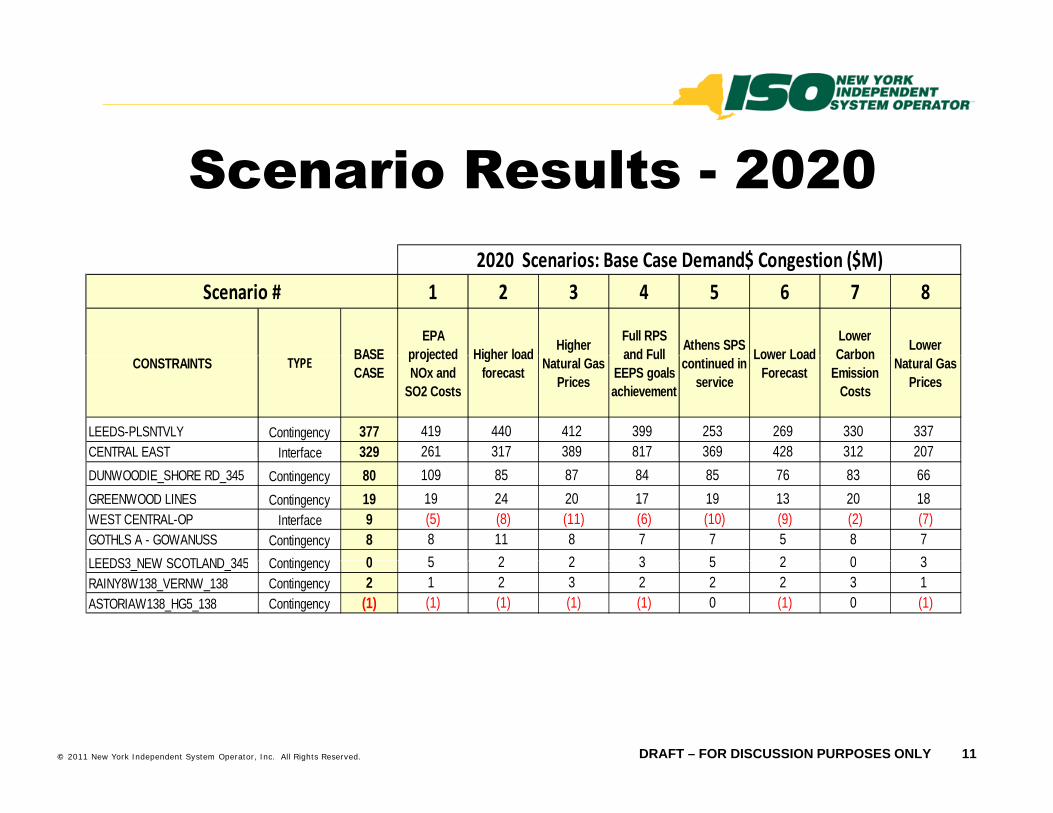
S i R lt 2020Scenario Results - 20202020 S i B C D d$ C i ($M)
1 2 3 4 5 6 7 8
BASEEPA
projected Higher load Higher Full RPS and Full Athens SPS Lower Load
Lower Carbon Lower
2020 Scenarios: Base Case Demand$ Congestion ($M)Scenario #
CONSTRAINTS TYPE BASE CASE
projected NOx and
SO2 Costs
Higher load forecast Natural Gas
Prices
and Full EEPS goalsachievement
continued in service
Lower Load Forecast
Carbon Emission
Costs
Natural Gas Prices
LEEDS-PLSNTVLY Contingency 377 419 440 412 399 253 269 330 337CENTRAL EAST Interface 329 261 317 389 817 369 428 312 207DUNWOODIE_SHORE RD_345 Contingency 80 109 85 87 84 85 76 83 66GREENWOOD LINES Contingency 19 19 24 20 17 19 13 20 18WEST CENTRAL-OP Interface 9 (5) (8) (11) (6) (10) (9) (2) (7)GOTHLS A - GOWANUSS Contingency 8 8 11 8 7 7 5 8 7LEEDS3 NEW SCOTLAND 345 Contingenc 0 5 2 2 3 5 2 0 3LEEDS3_NEW SCOTLAND_345 Contingency 0 5 2 2 3 5 2 0 3RAINY8W138_VERNW_138 Contingency 2 1 2 3 2 2 2 3 1ASTORIAW138_HG5_138 Contingency (1) (1) (1) (1) (1) 0 (1) 0 (1)
© 2011 New York Independent System Operator, Inc. All Rights Reserved. 11DRAFT – FOR DISCUSSION PURPOSES ONLY
The New York Independent System Operator (NYISO) is a not for profitOperator (NYISO) is a not-for-profit
corporation responsible for operating the state’s bulk electricity
grid, administering New York’s competitive wholesale electricitycompetitive wholesale electricity
markets, conducting comprehensive long-term planning for the state’s
electric power system, and advancing the technological
infrastructure of the electric system serving the Empire State.
www nyiso comwww.nyiso.com
12© 2011 New York Independent System Operator, Inc. All Rights Reserved. DRAFT – FOR DISCUSSION PURPOSES ONLY