Embed Size (px)
Citation preview
COLLEGE OF WILLIAM AND MARY
2011 BENCHMARKING STUDY Phase 1
September 2011
2011 BENCHMARKING STUDY Phase 1
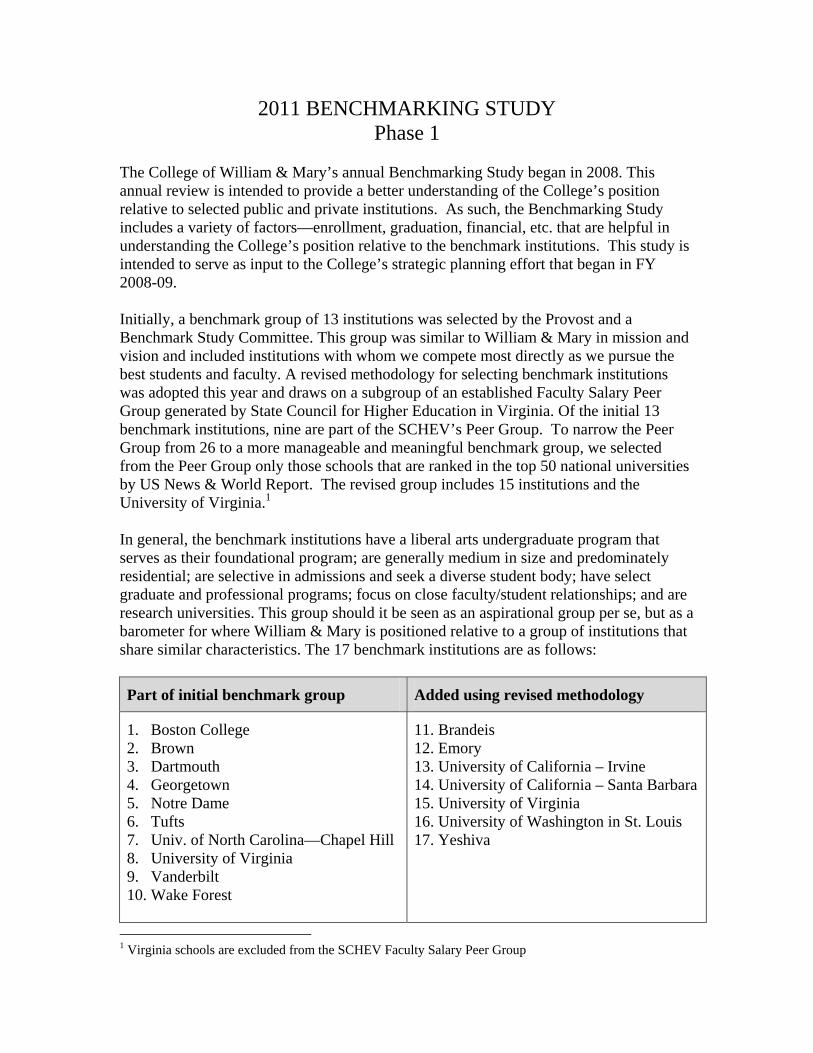
The College of William & Mary’s annual Benchmarking Study began in 2008. This annual review is intended to provide a better understanding of the College’s position relative to selected public and private institutions. As such, the Benchmarking Study includes a variety of factors—enrollment, graduation, financial, etc. that are helpful in understanding the College’s position relative to the benchmark institutions. This study is intended to serve as input to the College’s strategic planning effort that began in FY 2008-09. Initially, a benchmark group of 13 institutions was selected by the Provost and a Benchmark Study Committee. This group was similar to William & Mary in mission and vision and included institutions with whom we compete most directly as we pursue the best students and faculty. A revised methodology for selecting benchmark institutions was adopted this year and draws on a subgroup of an established Faculty Salary Peer Group generated by State Council for Higher Education in Virginia. Of the initial 13 benchmark institutions, nine are part of the SCHEV’s Peer Group. To narrow the Peer Group from 26 to a more manageable and meaningful benchmark group, we selected from the Peer Group only those schools that are ranked in the top 50 national universities by US News & World Report. The revised group includes 15 institutions and the University of Virginia.1 In general, the benchmark institutions have a liberal arts undergraduate program that serves as their foundational program; are generally medium in size and predominately residential; are selective in admissions and seek a diverse student body; have select graduate and professional programs; focus on close faculty/student relationships; and are research universities. This group should it be seen as an aspirational group per se, but as a barometer for where William & Mary is positioned relative to a group of institutions that share similar characteristics. The 17 benchmark institutions are as follows:
Part of initial benchmark group Added using revised methodology
1. Boston College 2. Brown 3. Dartmouth 4. Georgetown 5. Notre Dame 6. Tufts 7. Univ. of North Carolina—Chapel Hill 8. University of Virginia 9. Vanderbilt 10. Wake Forest
11. Brandeis 12. Emory 13. University of California – Irvine 14. University of California – Santa Barbara 15. University of Virginia 16. University of Washington in St. Louis 17. Yeshiva
1 Virginia schools are excluded from the SCHEV Faculty Salary Peer Group
Phase 1 of the study draws baseline data from readily available public sources—federally reported Integrated Postsecondary Education Study (IPEDS), the U. S. News and World Report, the National Association of College and University Business Officers Endowment Study (the NACUBO Study), and the Council for Aid to Education (CAE). These sources were chosen because the data are 1) readily available, and 2) reflect common definitions across institutions. This Phase is updated annually.
Data Analysis: Benchmark Institutions Using the public and private benchmark institutions identified above, the data shows the following: Enrollment
At 8,000 students, the College remains the fifth smallest among the group in total enrollment.
Other than Yeschiva, UVA, Washington-St. Louis, UNC, Boston College, and Georgetown, all institutions have at least 90% full-time enrollment. William & Mary enrollment is 94% full-time.
The College remains in the middle of the group relative to diversity (58% white, 22% mixed or racial/ethnic minority), and slightly more female (54%) than majority of the benchmark institutions.
Admissions, Graduation and Degrees Conferred
The College generally has a slightly higher acceptance rate (32%) and yield (35%), and slightly lower SAT scores than the benchmark group.
At 90%, the College’s graduation rate is fairly competitive overall, but men are slightly lower than most of the benchmark group.
Bachelor’s degrees are generally a larger share of the College’s total degrees conferred (65%) while at 12% we are in the bottom third in the percentage of doctoral degrees awarded.
Staffing
The College ties for the fourth highest ratio of FTE students to Total Staff at 3.4 to 1. Our student to faculty ratio of 12 to 1 is in the middle to middle/high range.
At 89%, the College is somewhat lower than the group relative to the percentage of full-time faculty.
Resources
The College ranks second from the bottom of the group in terms of total revenues per FTE, and total expenses per FTE.
The College ranks below average in terms of number of alumni, in the middle in terms of alumni giving participation, and slightly higher in terms of average donor gift.
The College ranks second to last among the benchmark institutions in total corporate giving and second to last in total foundation giving.
The College ranks third to last in total private support per student and second to last in overall total private support.
Cost to Student and Student Financial Assistance
The College is third lowest among the public institutions included in the benchmark group in terms of total in-state price (tuition, fees, room, board, books, and other campus expenses). All of the public institutions have significant in-state/out-of-state differentials and “sticker price” advantage relative to the private benchmark institutions.
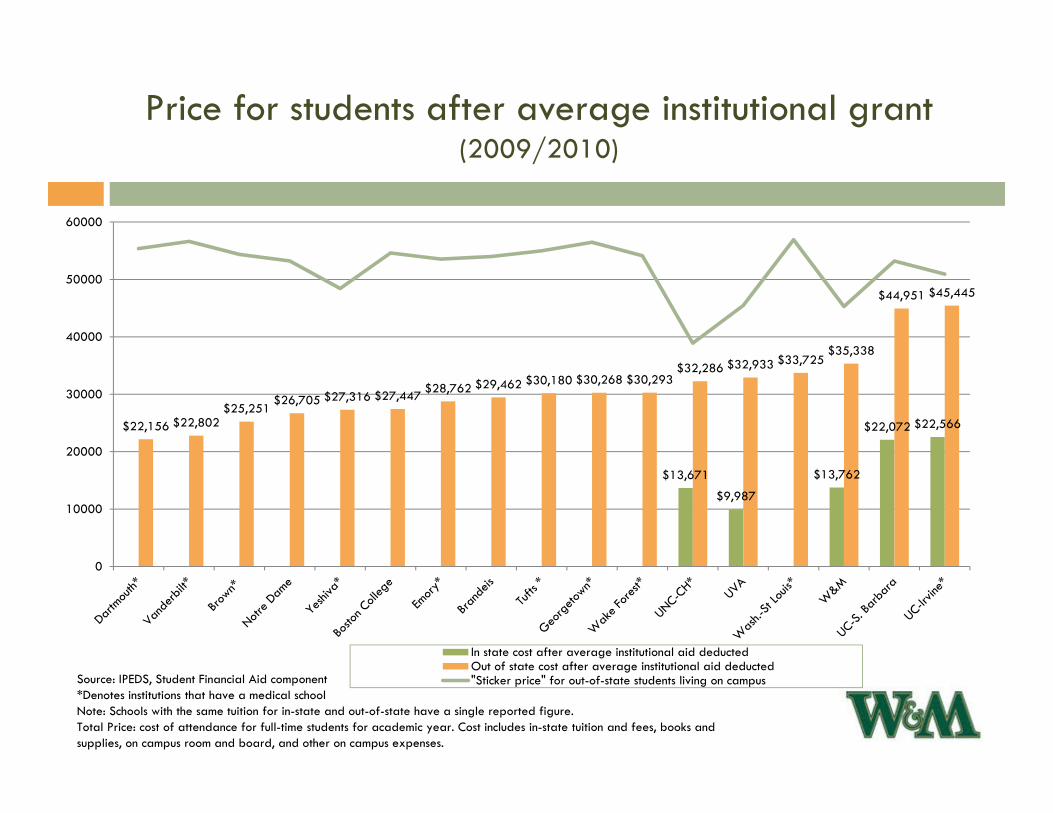
The pricing gap narrows significantly once the average institutional grant is applied at all institutions.
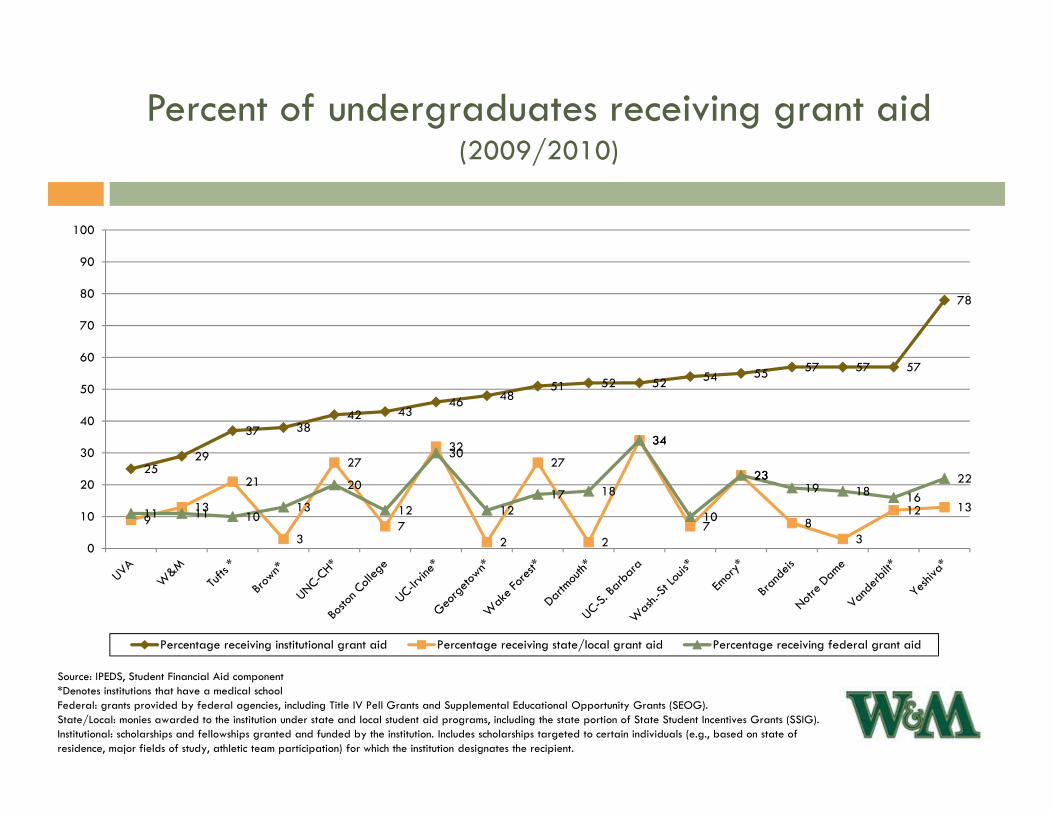
At 57%, the College is significantly lower than the benchmark institutions in the percentage of undergraduates receiving institutional grant aid and in the dollar value of the average institutional grant.
Some Conclusions from the Data Analysis The basic conclusions from this and earlier Phase 1 Benchmark Studies are consistent. These include the following:
The College’s benchmark institutions remain among the best institutions of higher education in the country, public or private.
While there are public institutions with which the College competes for students and faculty, there are no true public benchmark institutions—public institutions that share the College’s mission and vision, size and scope of programs, and quality.
As a result, private institutions continue to be the more appropriate benchmark institutions in terms of these same characteristics—mission and vision, size and scope of programs, and quality.
While competitive among the quality variables included in the annual Benchmark Study, the College is not competitive in terms of resources available to support its programs and activities. Said another way, the College continues to overachieve relative to its resource base.
Enrollment
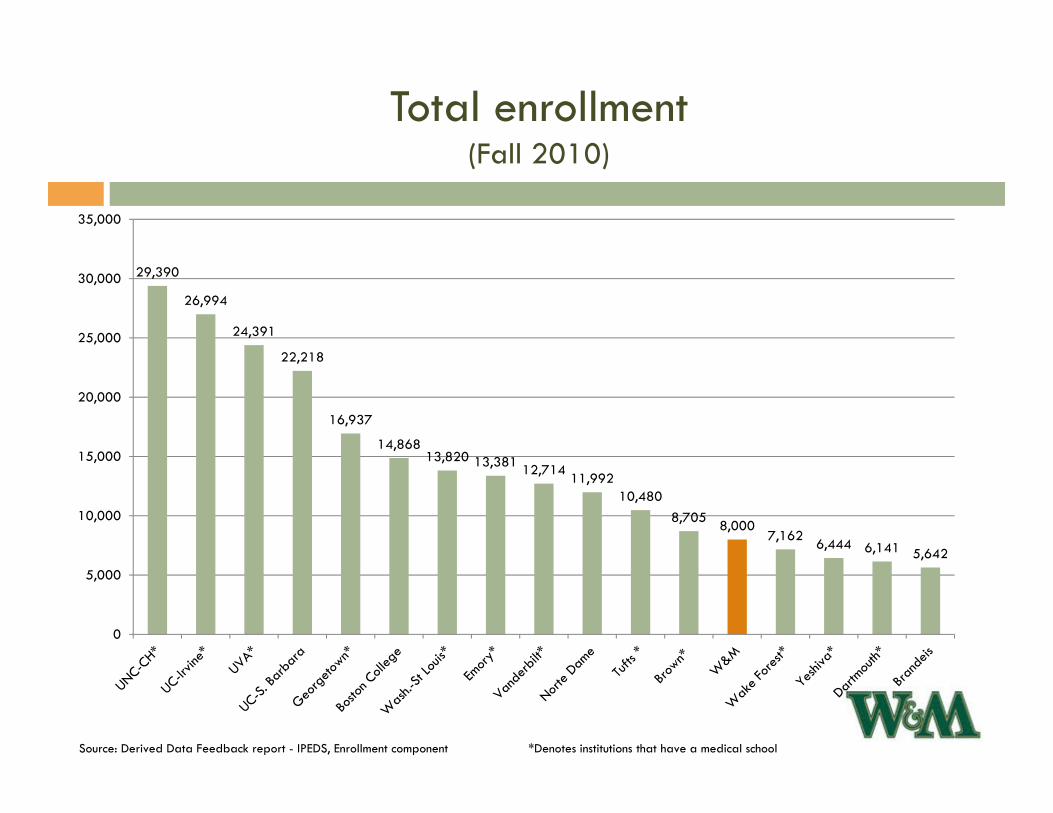
Total enrollment (Fall 2010)
Source: Derived Data Feedback report - IPEDS, Enrollment component *Denotes institutions that have a medical school
29,390
26,994
24,391
22,218
16,937
14,86813,820 13,381 12,714 11,992
10,4808,705 8,000
7,162 6,444 6,141 5,642
0
5,000
10,000
15,000
20,000
25,000
30,000
35,000
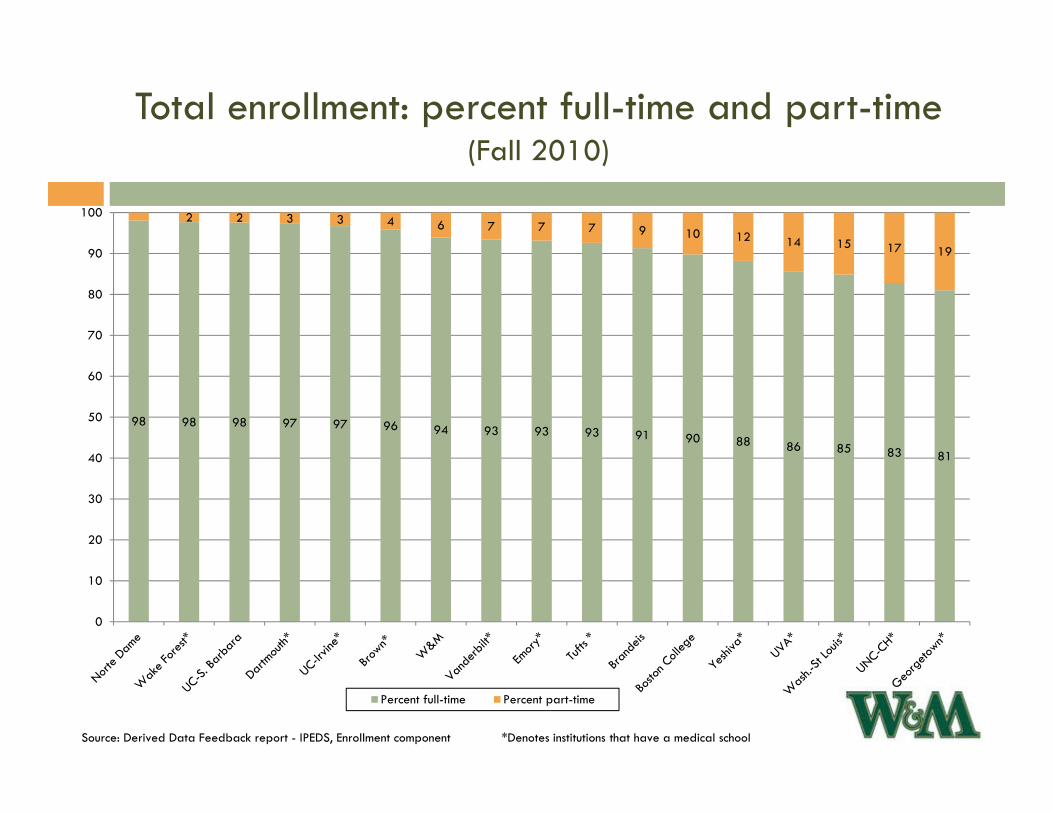
Total enrollment: percent full-time and part-time(Fall 2010)
Source: Derived Data Feedback report - IPEDS, Enrollment component *Denotes institutions that have a medical school
98 98 98 97 97 96 94 93 93 93 91 90 88 86 85 83 81
2 2 3 3 4 6 7 7 7 9 10 12 14 15 17 19
0
10
20
30
40
50
60
70
80
90
100
Percent full-time Percent part-time

Undergraduate enrollment by race/ethnicity(Fall 2010)
Source: IPEDS, Enrollment component *Denotes institutions that have a medical school
7672 71
67 65 63 61 59 58 56 5649 47 47 45 42
25
8
3 3 97
5 76 7
4 6
6 103 5
4
2
4
4 9 8
67 4
6 6
5 4
6 4 21
8
4
14
5
55 5
68
9 9 611 11
1217
16
13
8
45
0
10 1
0 00 0
0 0 00
0
0
0
0
0
0
01
1
0 00 0
1 0 02
0
1
0
0
0
1
22
2
31
1 22
2 22
1
2
3
1
1
28 2
3
5 98 7
1512 7
78
8
10
20
7
4 6 75
9 68 12
510
1414
12
4
1420
6
0
10
20
30
40
50
60
70
80
90
100Nonresident Alien
Unknown
Two or more races
Am. Indian/AlaskaNativeHawaiian or OtherPacific Islander
Asian
Hispanic/Latino
Black or AfricanAmerican White
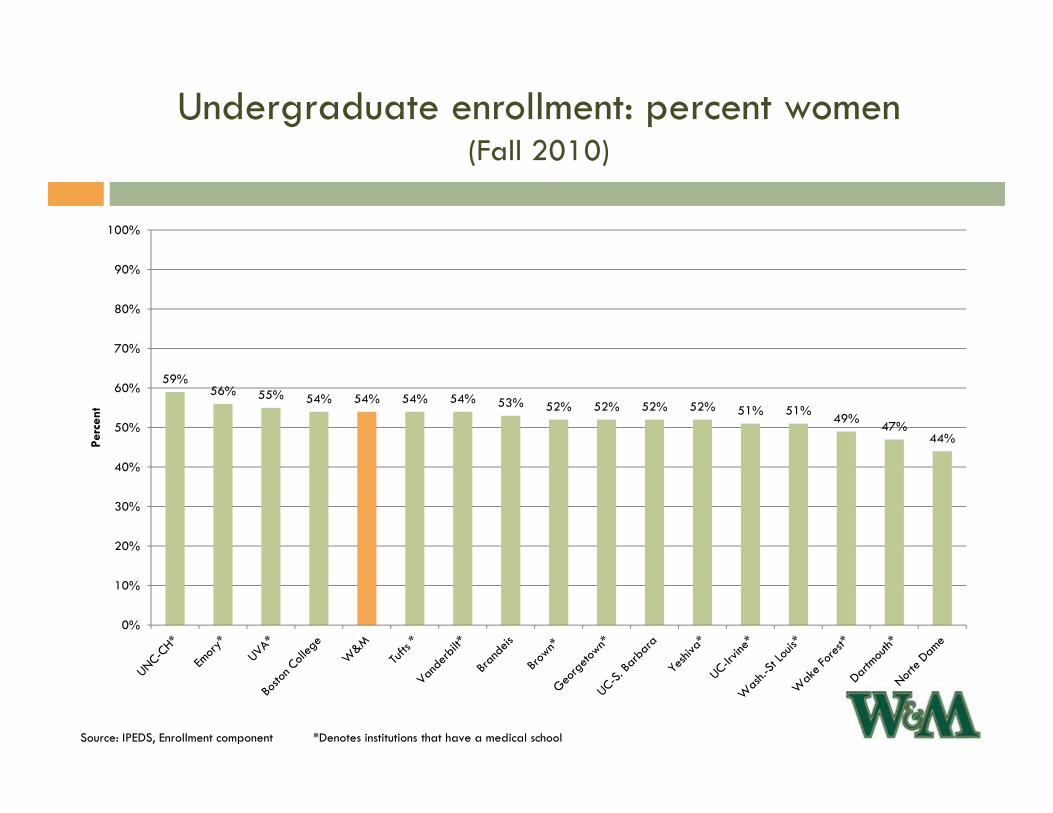
Undergraduate enrollment: percent women(Fall 2010)
Source: IPEDS, Enrollment component *Denotes institutions that have a medical school
59%56% 55% 54% 54% 54% 54% 53% 52% 52% 52% 52% 51% 51% 49% 47%
44%
0%
10%
20%
30%
40%
50%
60%
70%
80%
90%
100%
Perc
ent

Admissions, Graduation and Degrees Conferred

Undergraduate admittance and yield(Fall 2010)
Source: Derived - IPEDS, Institutional Characteristics component *Denotes institutions that have a medical schoolNote: Percent admitted: total number of admissions divided by the total applicants.Admissions yield: number enrolled divided by the number admitted.
72
48
444040
333232313029
2421
2018
139
71
2121
2829
45
35
54
2528
49
3531
4241
4853
0
10
20
30
40
50
60
70
80
90
100
perc
ent
Percent admitted Admissions yield

SAT Scores: 25th -75th Percentile for Reading and Math(Fall 2010)
Source: US News Best Colleges-2012 Edition *Denotes institutions that have a medical schoolNote: ACT scores converted to SAT scores based on College Board concordance table
1570 15301510 1510 1510 1500 1500 1490
1460 1450 1440 14301410 1400
1340 13401320
13601330
14201380
1340 13501310 1300
1270
12201260 1250
1200 1213
11101070
1090
800
900
1000
1100
1200
1300
1400
1500
1600

Undergraduate graduation rate (August 31, 2010)
Source: Derived Data Feedback report - IPEDS Graduation Rates component *Denotes institutions that have a medical school
96 96 95 94 93 93 91 91 91 91 90 89 88 8883 82
79
0
10
20
30
40
50
60
70
80
90
100
Perc
ent
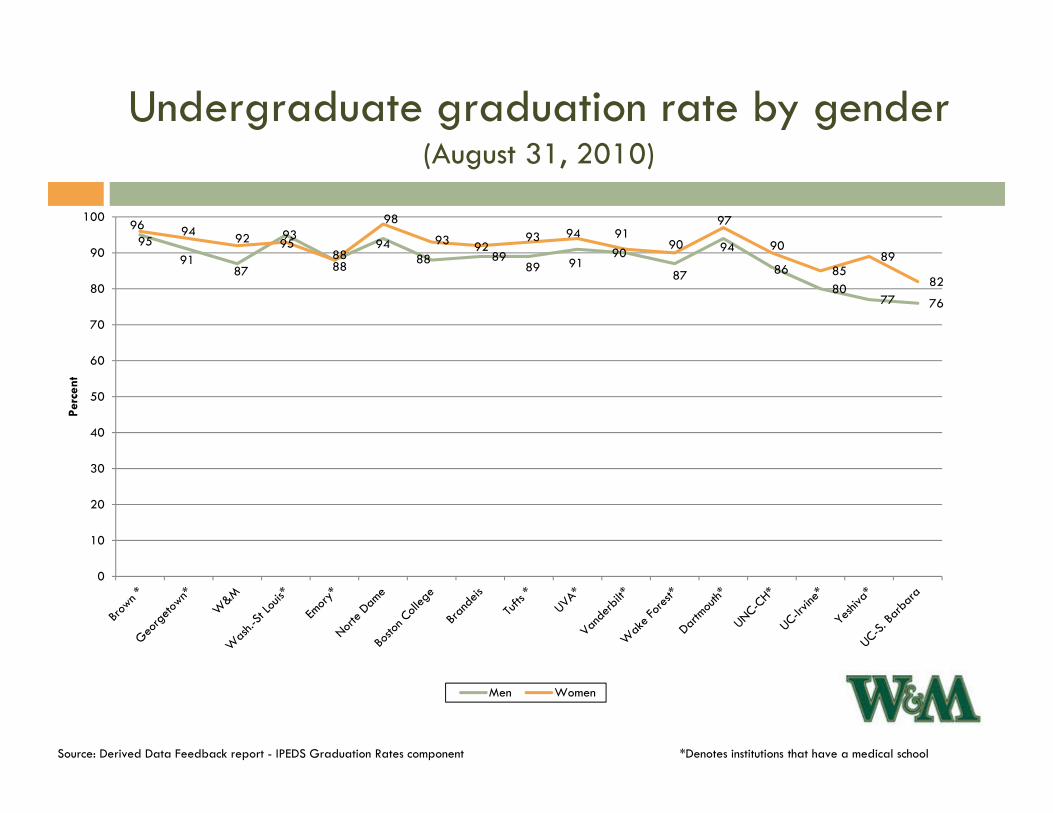
Undergraduate graduation rate by gender(August 31, 2010)
Source: Derived Data Feedback report - IPEDS Graduation Rates component *Denotes institutions that have a medical school
9591
87
95
88
9488 89
89 9190
87
94
8680
77 76
96 94 92 93
88
98
93 9293 94 91
90
97
90
8589
82
0
10
20
30
40
50
60
70
80
90
100
Perc
ent
Men Women
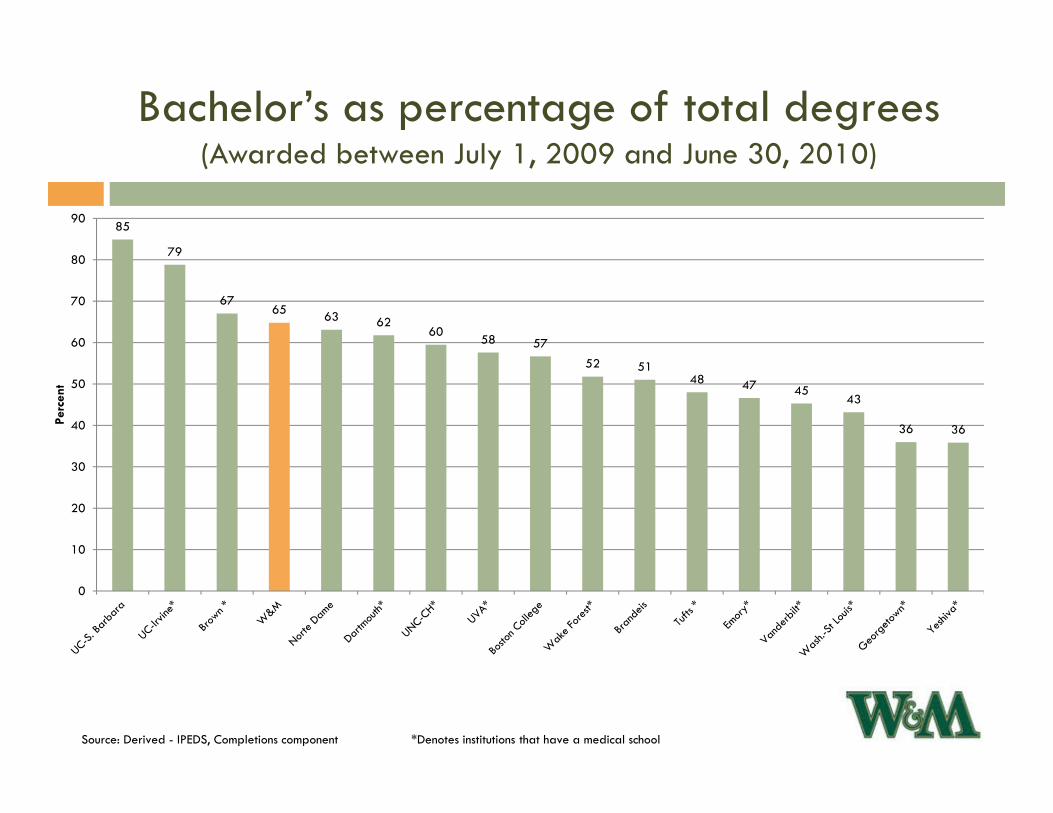
Bachelor’s as percentage of total degrees (Awarded between July 1, 2009 and June 30, 2010)
Source: Derived - IPEDS, Completions component *Denotes institutions that have a medical school
85
79
6765 63 62
60 58 57
52 5148 47 45
43
36 36
0
10
20
30
40
50
60
70
80
90
Perc
ent

Doctorate’s as percentage of total degrees (Awarded between July 1, 2009 and June 30, 2010)
Source: Derived - IPEDS, Completions component *Denotes institutions that have a medical school
7 4 6 72
82
7 6 93 5 3 4 5 5 4
34
15 13 1217
1014
9 8 49 5 6 5 1 0 0
0
10
20
30
40
50
60
70
80
90
100
Perc
ent
Dr: research/scholar. Dr: professional
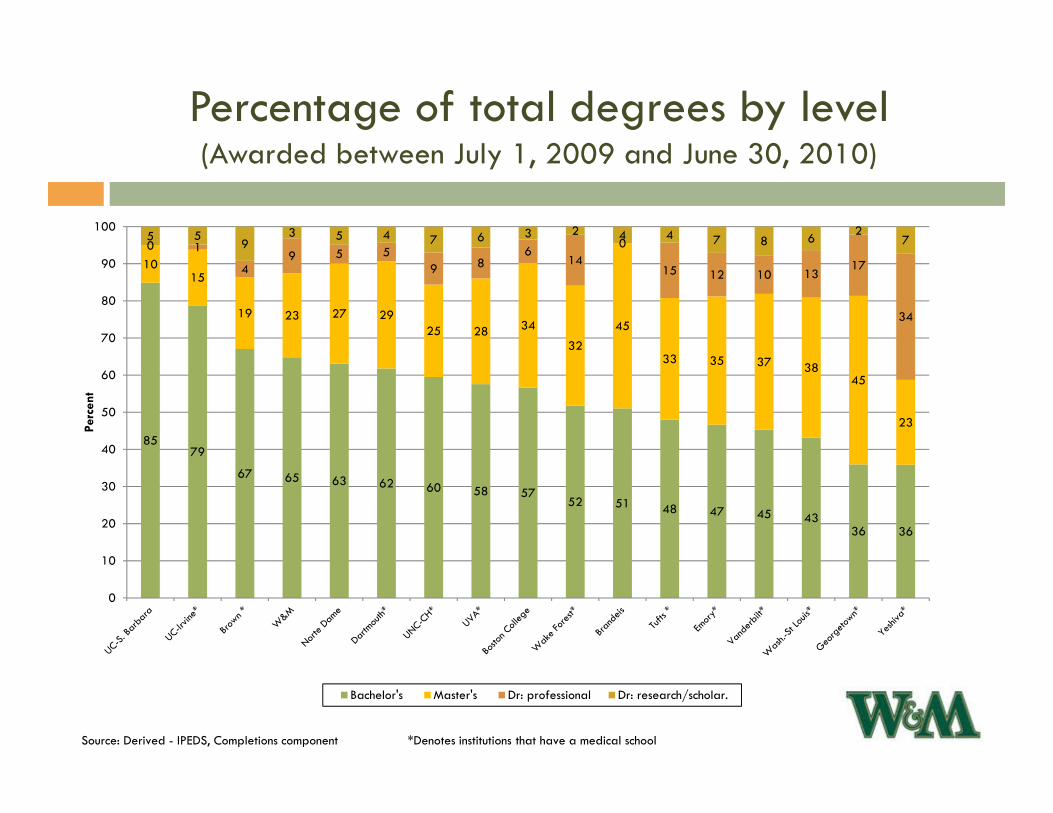
Percentage of total degrees by level(Awarded between July 1, 2009 and June 30, 2010)
Source: Derived - IPEDS, Completions component *Denotes institutions that have a medical school
8579
67 65 63 62 60 58 5752 51 48 47 45 43
36 36
1015
19 23 27 2925 28 34
3245
33 35 37 3845
23
0 1
49 5 5
9 86
140
15 12 10 1317
34
5 59
3 5 4 7 6 3 2 4 4 7 8 6 27
0
10
20
30
40
50
60
70
80
90
100
Perc
ent
Bachelor's Master's Dr: professional Dr: research/scholar.

Staffing
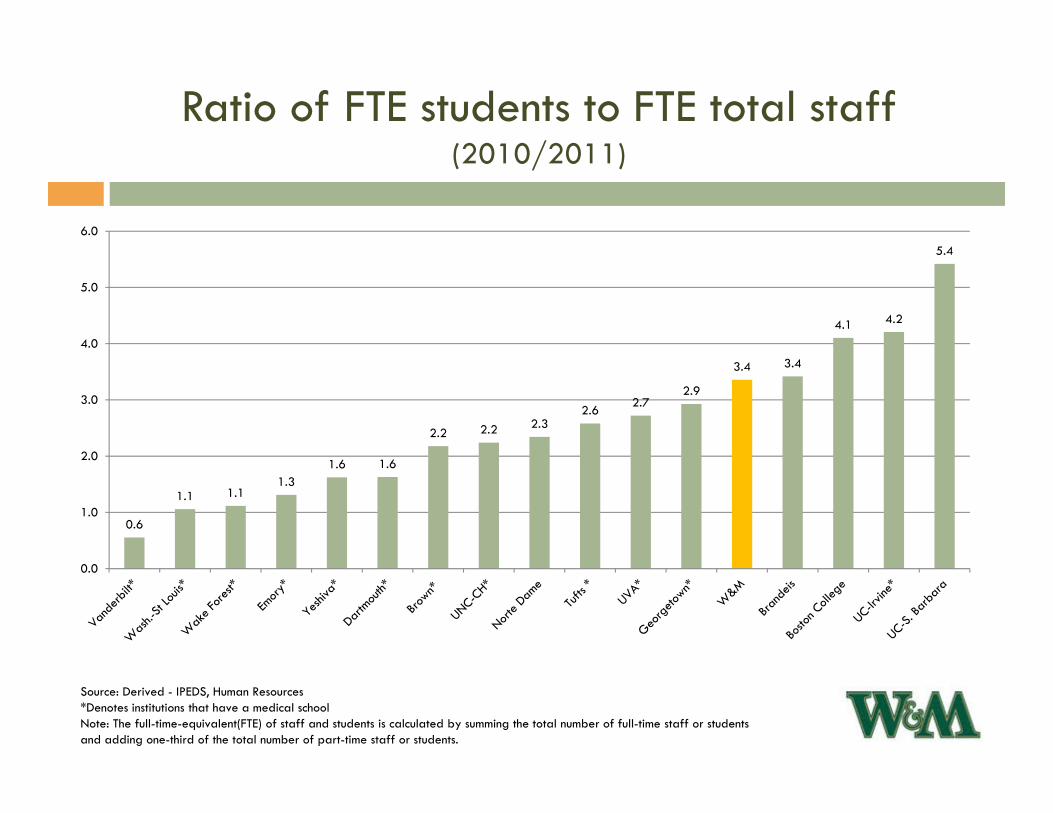
Ratio of FTE students to FTE total staff(2010/2011)
Source: Derived - IPEDS, Human Resources *Denotes institutions that have a medical schoolNote: The full-time-equivalent(FTE) of staff and students is calculated by summing the total number of full-time staff or studentsand adding one-third of the total number of part-time staff or students.
0.6
1.1 1.11.3
1.6 1.6
2.2 2.2 2.32.6 2.7
2.9
3.4 3.4
4.1 4.2
5.4
0.0
1.0
2.0
3.0
4.0
5.0
6.0

Student to faculty ratio(2010/2011)
Source: Derived - IPEDS, Human Resources*Denotes institutions that have a medical schoolNote: The full-time-equivalent(FTE) of staff and students is calculated by summing the total number of full-time staff or studentsand adding one-third of the total number of part-time staff or students.
67
8 89 9 9 9
11 11 1112 12
14 14
16
19
0
2
4
6
8
10
12
14
16
18
20

Percentage of FTE staff by function(Fall 2010)
Source: Derived - IPEDS, Human Resources component *Denotes institutions that have a medical schoolNote: The full-time-equivalent(FTE) of staff is calculated by summing the total number of full-time staff from the Employees by Assigned Position (EAP) Component and adding one-third of the total number of part-time staff
16% 20% 24% 25% 25% 27% 27% 28% 28% 29% 30% 31% 32% 33% 33% 34% 35%6%
9%8% 8% 8% 4%
18%
4%
18% 18%
6% 3% 6% 4%13%
6%
15%33%
33% 32%35%
28% 32%
28%
38%
23% 20%39%
31% 24%
41% 23% 40% 21%
45%38% 37%
32%39% 38%
27% 30% 31% 32%26%
34% 39%
22%31%
21%28%
0%
10%
20%
30%
40%
50%
60%
70%
80%
90%
100%
Non-professional FTE staff
Other professional FTE staff
Executive/administrative andmanagerial FTE staff
Instruction/research and publicservice FTE staff
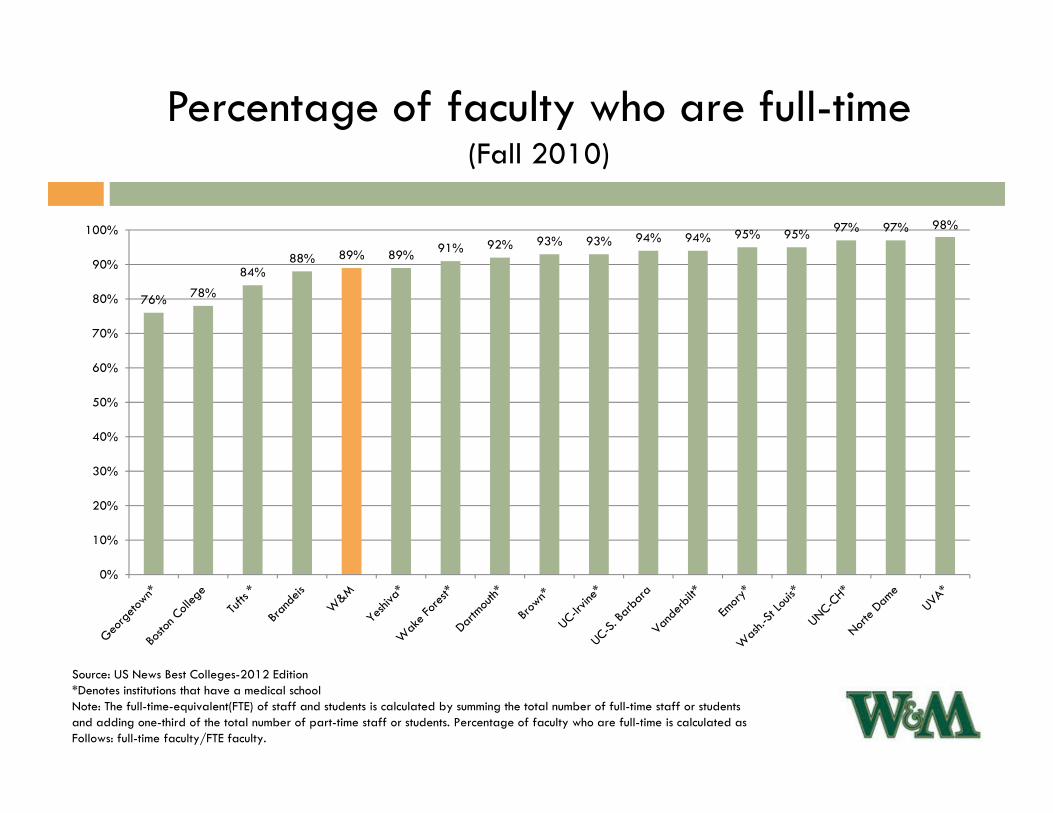
Percentage of faculty who are full-time(Fall 2010)
Source: US News Best Colleges-2012 Edition *Denotes institutions that have a medical schoolNote: The full-time-equivalent(FTE) of staff and students is calculated by summing the total number of full-time staff or studentsand adding one-third of the total number of part-time staff or students. Percentage of faculty who are full-time is calculated as Follows: full-time faculty/FTE faculty.
76% 78%
84%88% 89% 89% 91% 92% 93% 93% 94% 94% 95% 95% 97% 97% 98%
0%
10%
20%
30%
40%
50%
60%
70%
80%
90%
100%

Resources

Total revenues per FTE student(FY2009-10)
Source: IPEDS, Financial Component*Denotes institutions that have a medical school
$296,405
$259,656
$217,428
$174,024
$149,297
$123,774$114,416
$101,454 $100,745 $96,842$81,907
$73,957 $72,667$61,926 $61,218
$48,548$37,954
$0
$50,000
$100,000
$150,000
$200,000
$250,000
$300,000
$350,000
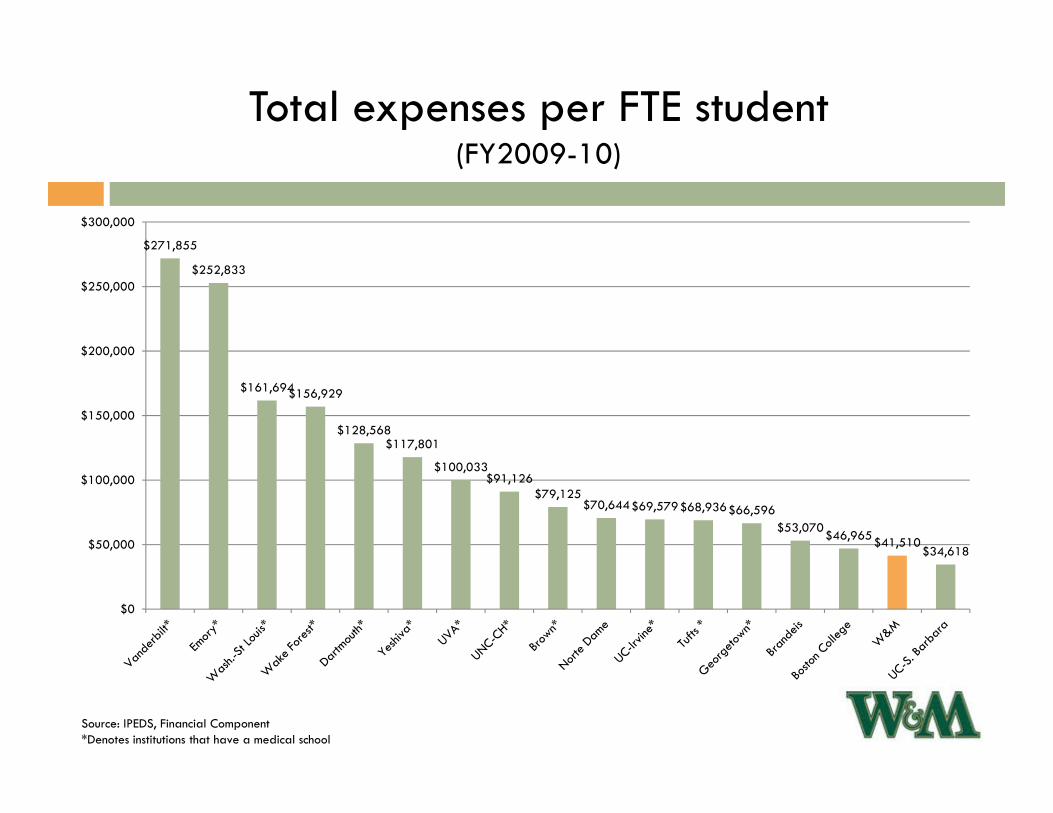
Total expenses per FTE student(FY2009-10)
Source: IPEDS, Financial Component*Denotes institutions that have a medical school
$271,855
$252,833
$161,694$156,929
$128,568$117,801
$100,033$91,126
$79,125$70,644$69,579$68,936$66,596
$53,070$46,965$41,510$34,618
$0
$50,000
$100,000
$150,000
$200,000
$250,000
$300,000
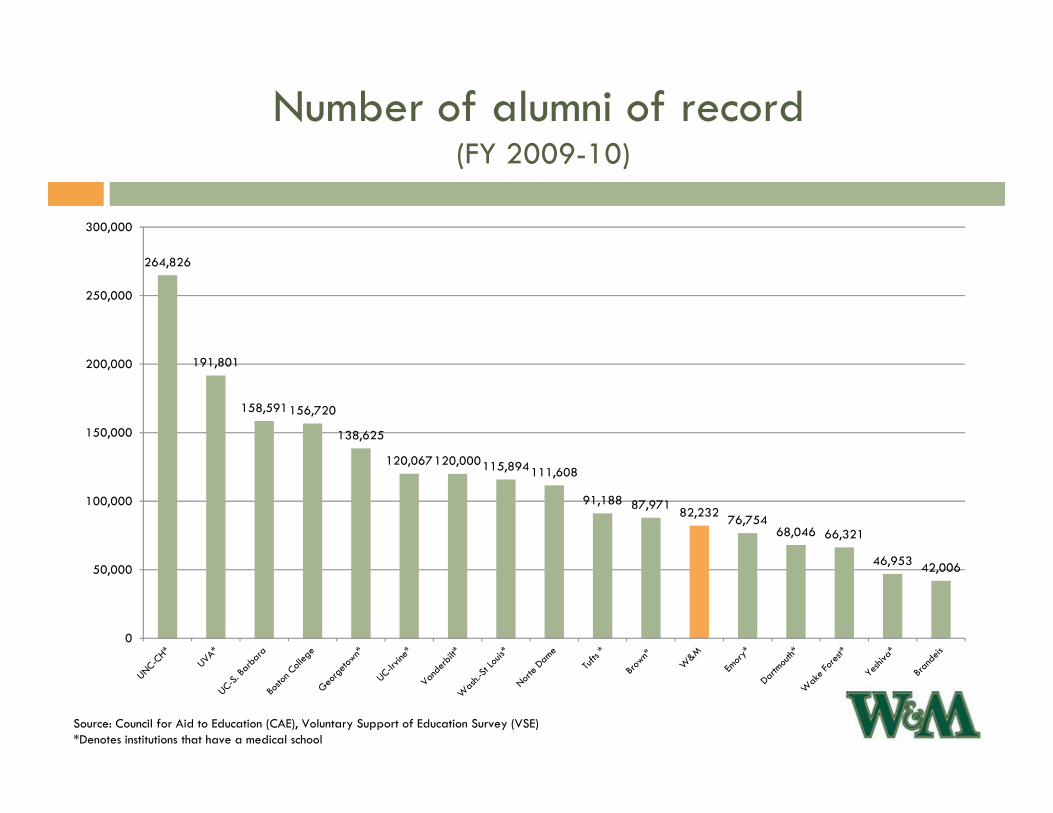
Number of alumni of record(FY 2009-10)
Source: Council for Aid to Education (CAE), Voluntary Support of Education Survey (VSE)*Denotes institutions that have a medical school
264,826
191,801
158,591156,720
138,625
120,067120,000115,894111,608
91,188 87,971 82,232 76,75468,046 66,321
46,953 42,006
0
50,000
100,000
150,000
200,000
250,000
300,000
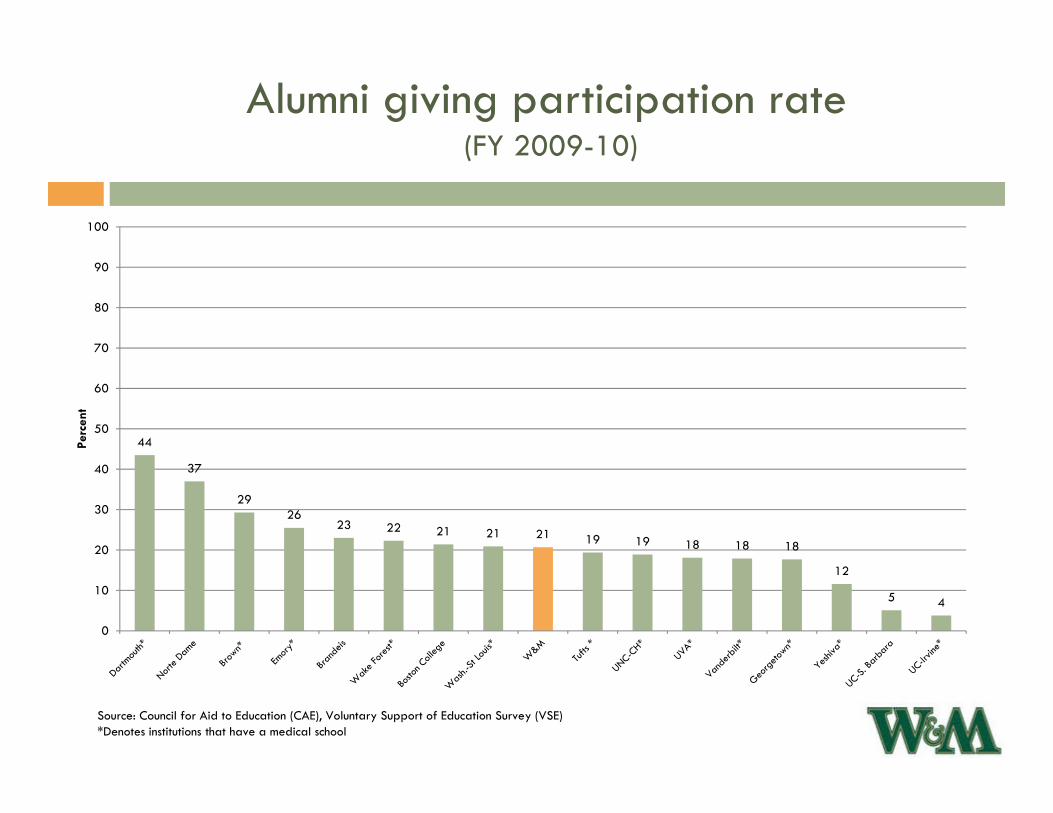
Alumni giving participation rate (FY 2009-10)
Source: Council for Aid to Education (CAE), Voluntary Support of Education Survey (VSE) *Denotes institutions that have a medical school
44
37
2926
23 22 21 21 21 19 19 18 18 18
12
5 4
0
10
20
30
40
50
60
70
80
90
100
Perc
ent
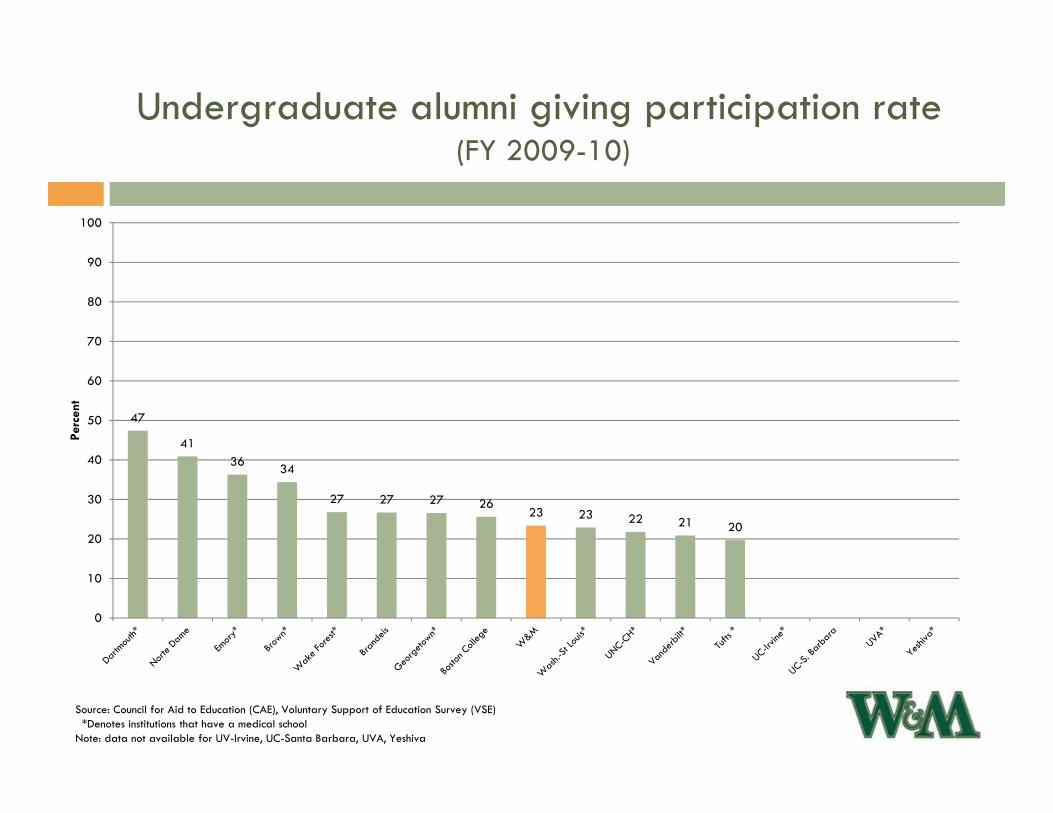
Undergraduate alumni giving participation rate(FY 2009-10)
Source: Council for Aid to Education (CAE), Voluntary Support of Education Survey (VSE)*Denotes institutions that have a medical school
Note: data not available for UV-Irvine, UC-Santa Barbara, UVA, Yeshiva
47
4136 34
27 27 27 2623 23 22 21 20
0
10
20
30
40
50
60
70
80
90
100
Perc
ent
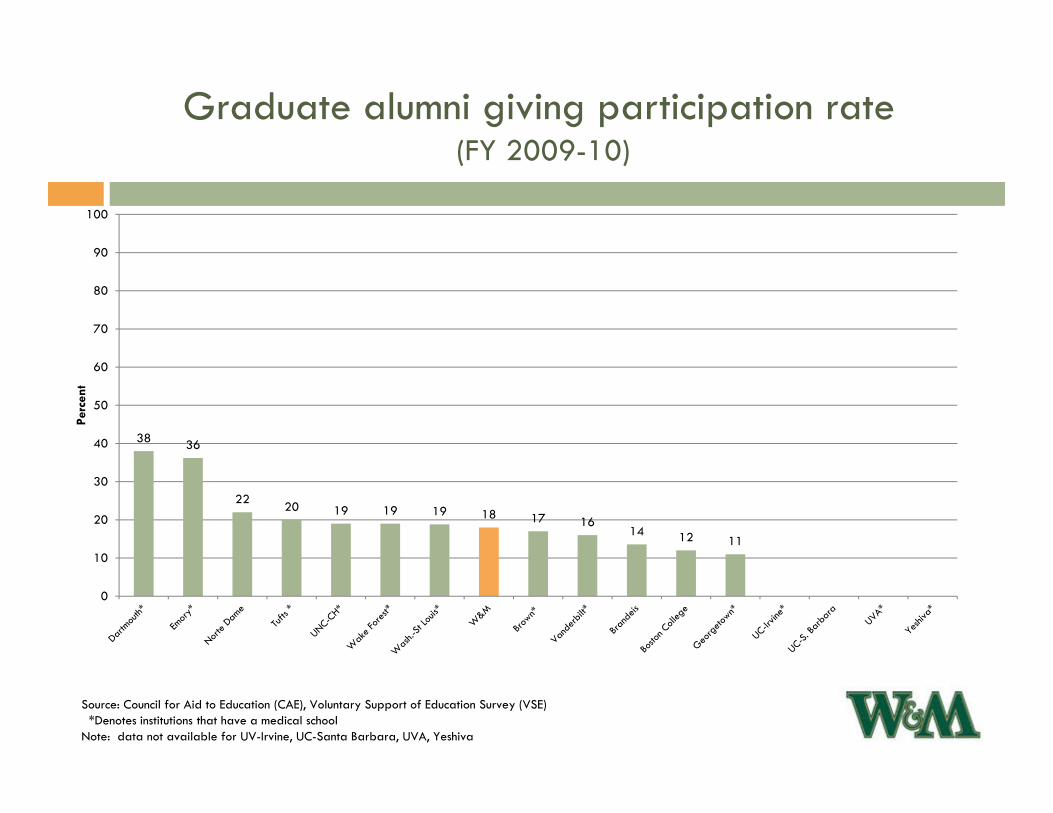
Graduate alumni giving participation rate(FY 2009-10)
Source: Council for Aid to Education (CAE), Voluntary Support of Education Survey (VSE) *Denotes institutions that have a medical school
Note: data not available for UV-Irvine, UC-Santa Barbara, UVA, Yeshiva
38 36
22 20 19 19 19 18 17 1614 12 11
0
10
20
30
40
50
60
70
80
90
100
Perc
ent
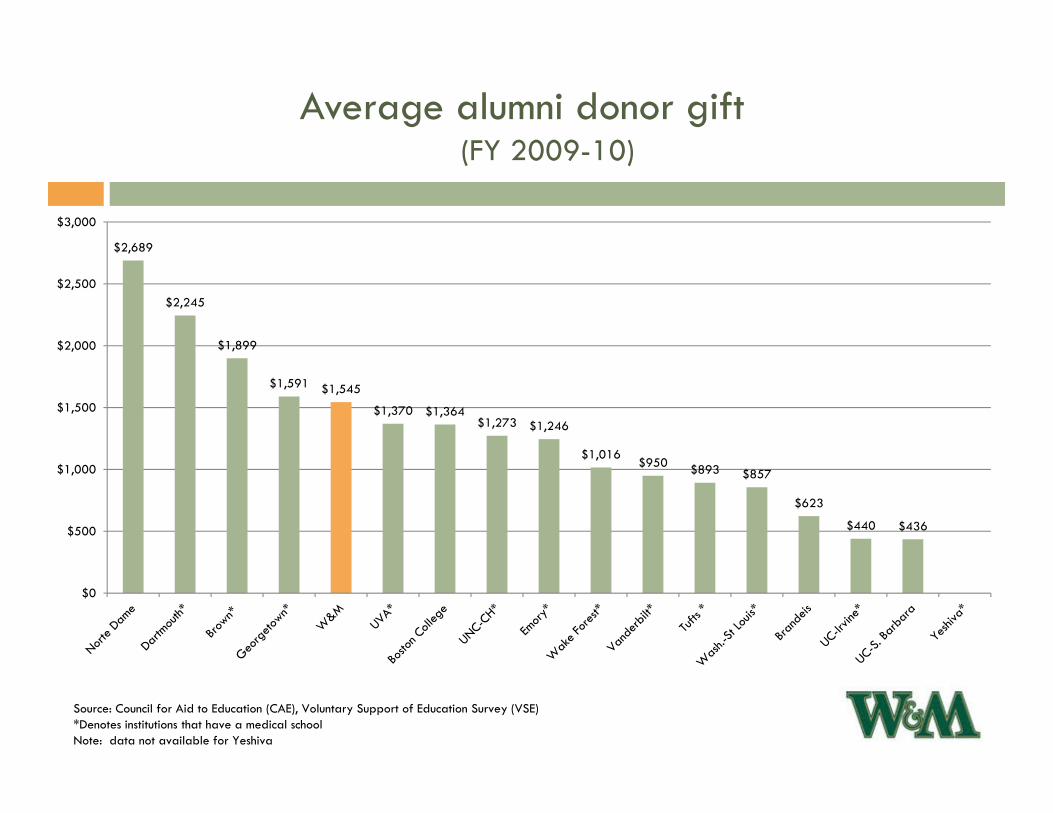
Average alumni donor gift(FY 2009-10)
Source: Council for Aid to Education (CAE), Voluntary Support of Education Survey (VSE) *Denotes institutions that have a medical school Note: data not available for Yeshiva
$2,689
$2,245
$1,899
$1,591 $1,545
$1,370 $1,364$1,273 $1,246
$1,016$950 $893 $857
$623
$440 $436
$0
$500
$1,000
$1,500
$2,000
$2,500
$3,000

Average undergraduate alumni donor gift(FY 2009-10)
Source: Council for Aid to Education (CAE), Voluntary Support of Education Survey (VSE) *Denotes institutions that have a medical schoolNote: data not available for UV-Irvine, UC-Santa Barbara, UVA, Yeshiva
$2,902
$1,979 $1,958
$1,756$1,633
$1,442$1,299
$1,182$1,096 $1,061
$959$856
$700
$0
$500
$1,000
$1,500
$2,000
$2,500
$3,000
$3,500
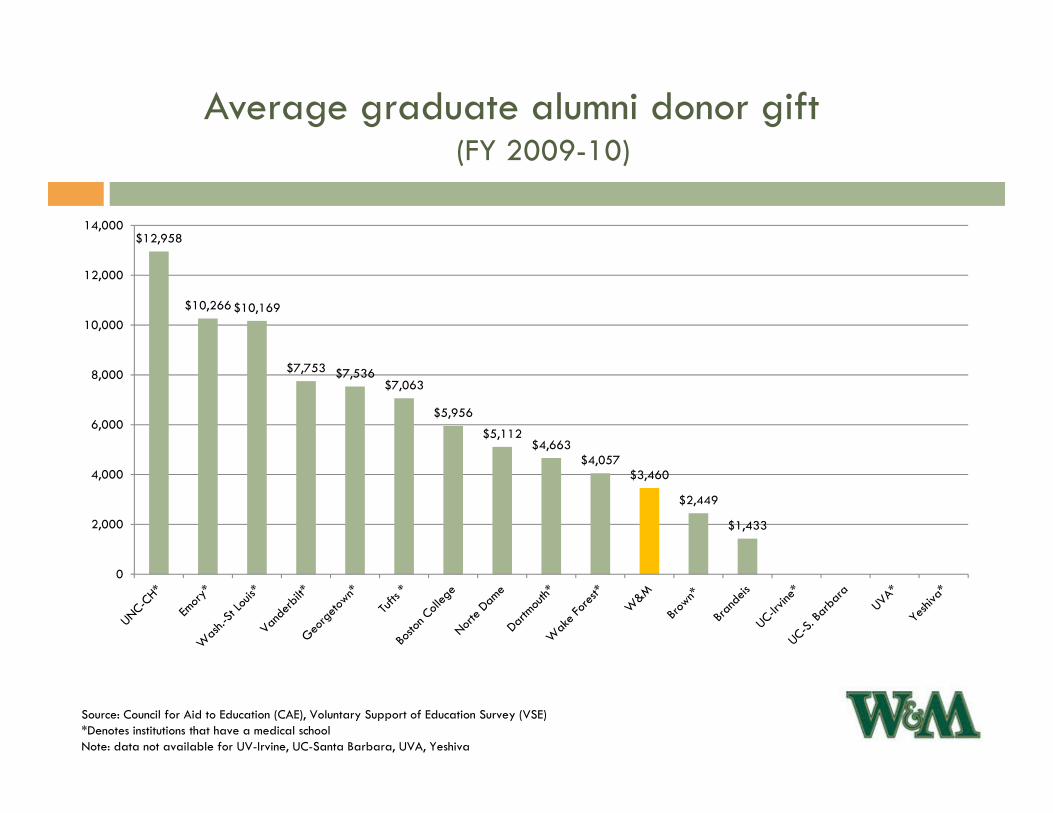
Average graduate alumni donor gift(FY 2009-10)
Source: Council for Aid to Education (CAE), Voluntary Support of Education Survey (VSE)*Denotes institutions that have a medical schoolNote: data not available for UV-Irvine, UC-Santa Barbara, UVA, Yeshiva
$12,958
$10,266 $10,169
$7,753 $7,536$7,063
$5,956
$5,112$4,663
$4,057$3,460
$2,449
$1,433
0
2,000
4,000
6,000
8,000
10,000
12,000
14,000
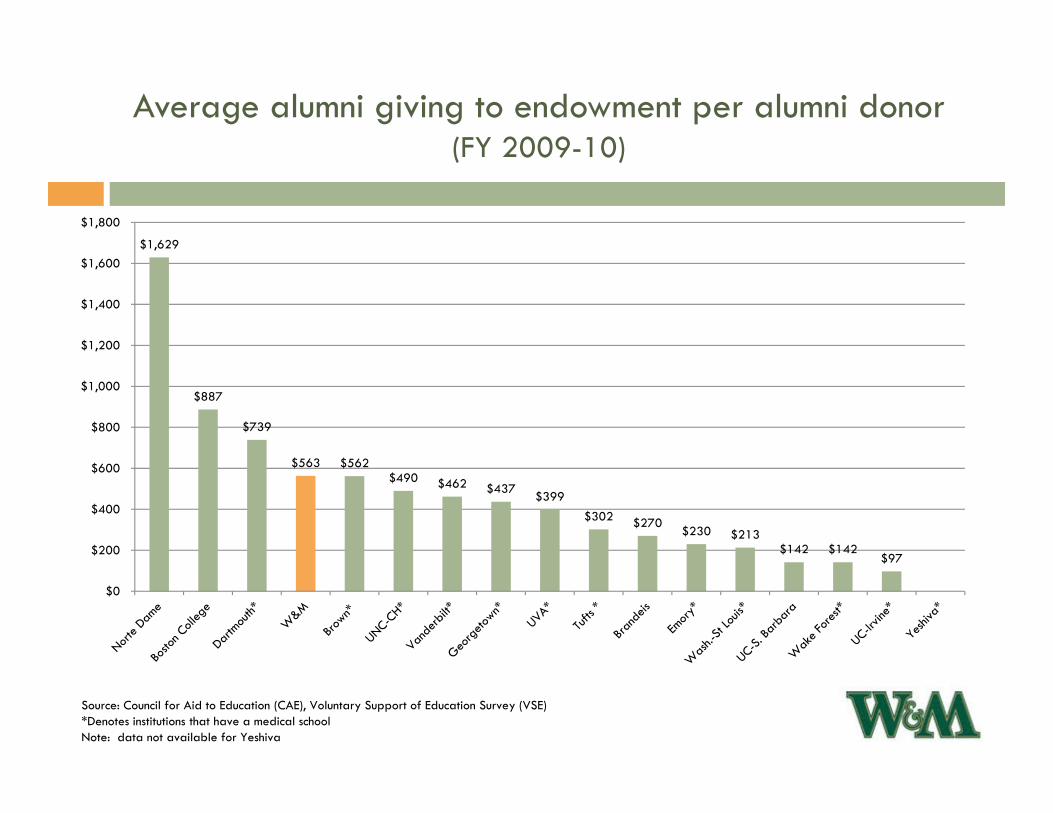
Average alumni giving to endowment per alumni donor(FY 2009-10)
Source: Council for Aid to Education (CAE), Voluntary Support of Education Survey (VSE)*Denotes institutions that have a medical school Note: data not available for Yeshiva
$1,629
$887
$739
$563 $562 $490 $462 $437 $399
$302 $270 $230 $213
$142 $142 $97
$0
$200
$400
$600
$800
$1,000
$1,200
$1,400
$1,600
$1,800
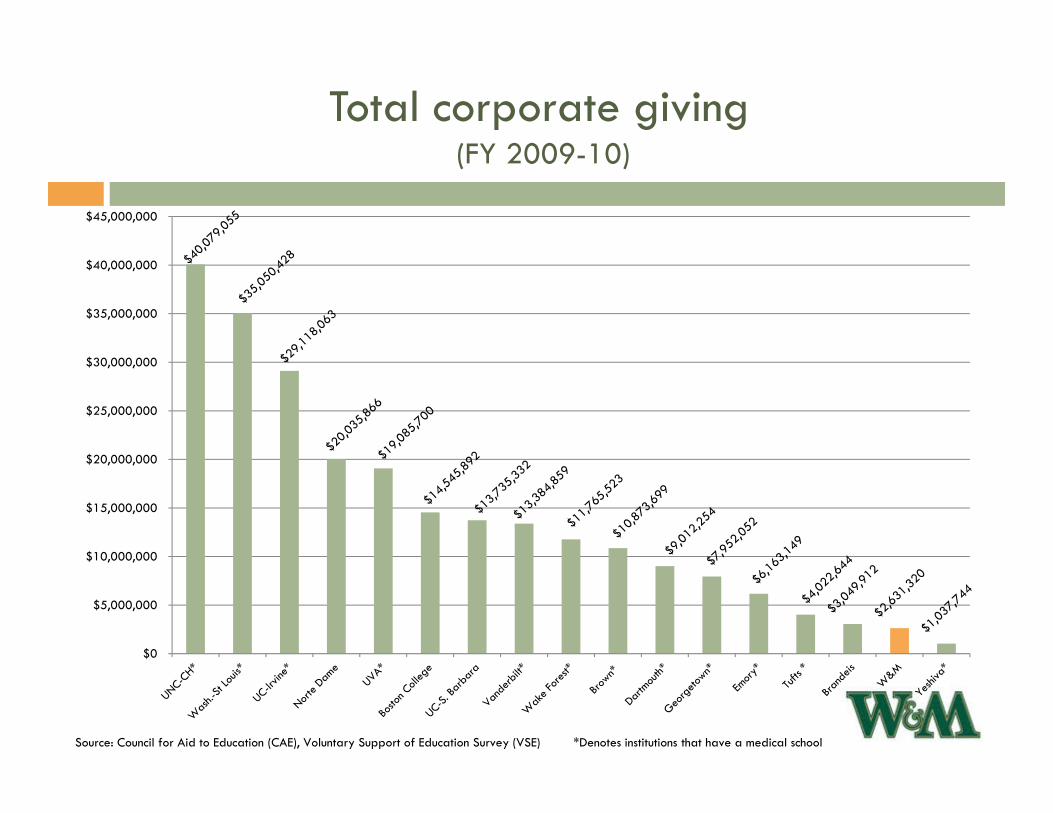
Total corporate giving(FY 2009-10)
Source: Council for Aid to Education (CAE), Voluntary Support of Education Survey (VSE) *Denotes institutions that have a medical school
$0
$5,000,000
$10,000,000
$15,000,000
$20,000,000
$25,000,000
$30,000,000
$35,000,000
$40,000,000
$45,000,000
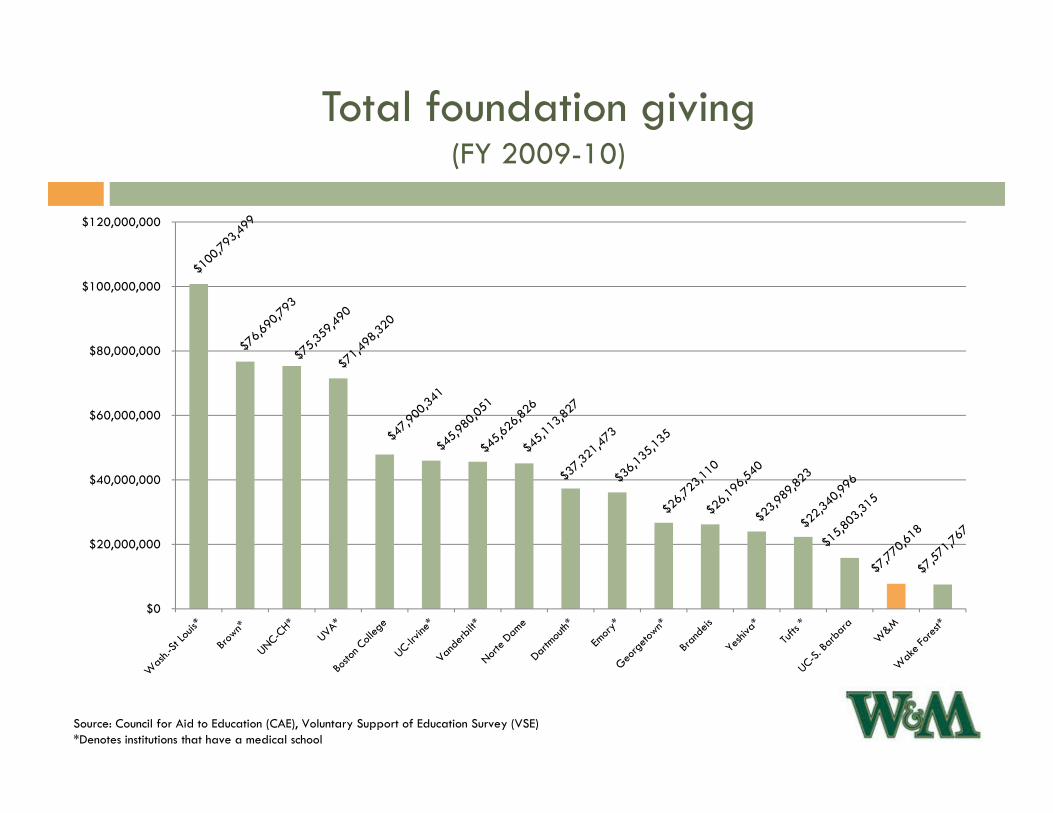
Total foundation giving (FY 2009-10)
Source: Council for Aid to Education (CAE), Voluntary Support of Education Survey (VSE) *Denotes institutions that have a medical school
$0
$20,000,000
$40,000,000
$60,000,000
$80,000,000
$100,000,000
$120,000,000
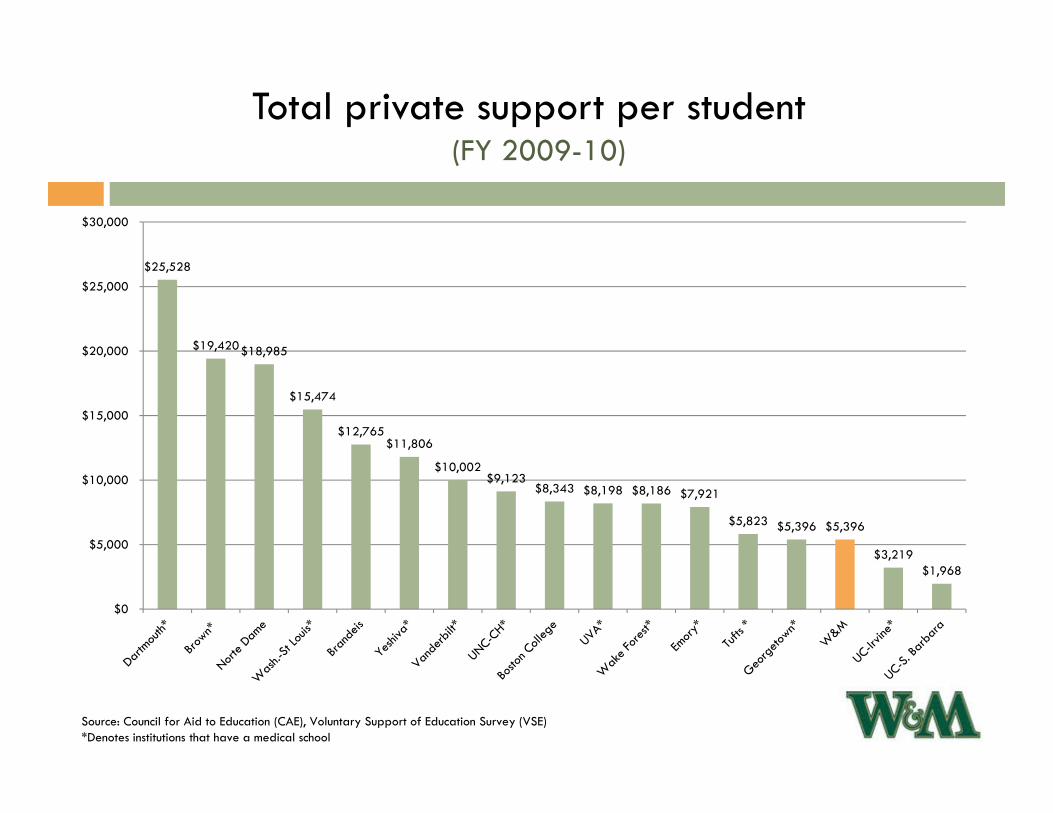
Total private support per student(FY 2009-10)
Source: Council for Aid to Education (CAE), Voluntary Support of Education Survey (VSE)*Denotes institutions that have a medical school
$25,528
$19,420 $18,985
$15,474
$12,765 $11,806
$10,002 $9,123
$8,343 $8,198 $8,186 $7,921
$5,823 $5,396 $5,396
$3,219 $1,968
$0
$5,000
$10,000
$15,000
$20,000
$25,000
$30,000
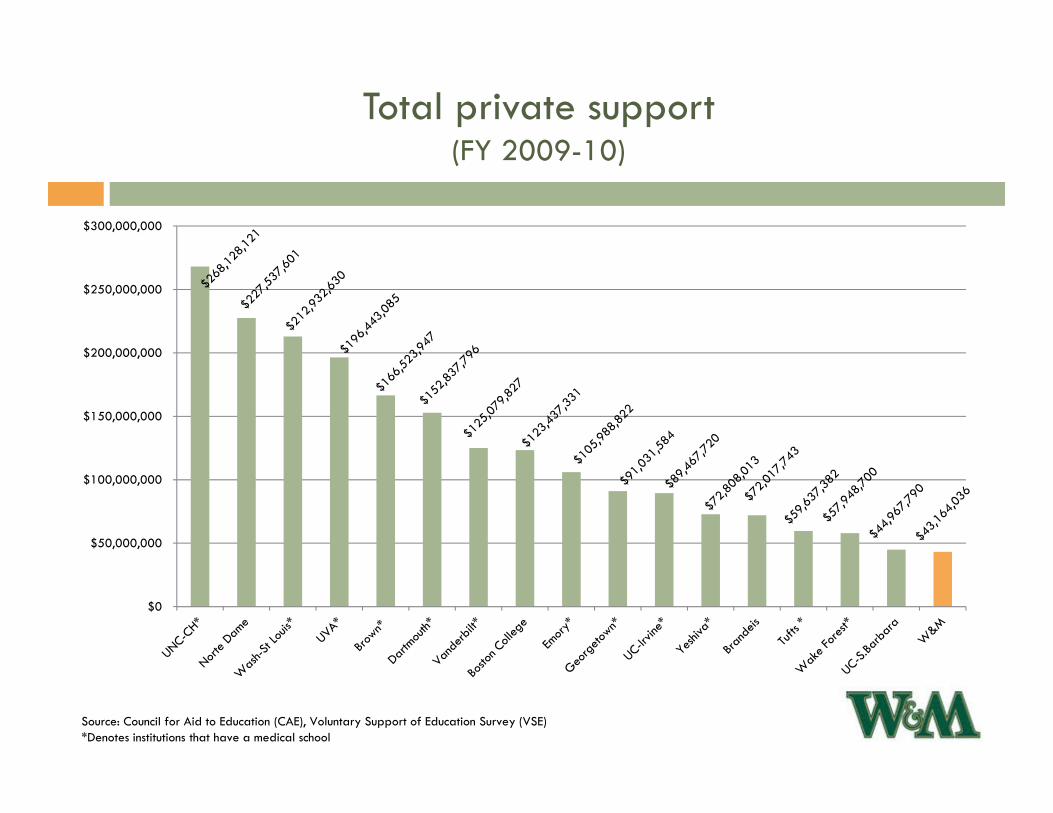
Total private support (FY 2009-10)
Source: Council for Aid to Education (CAE), Voluntary Support of Education Survey (VSE)*Denotes institutions that have a medical school
$0
$50,000,000
$100,000,000
$150,000,000
$200,000,000
$250,000,000
$300,000,000
Cost to Student and Student Financial Assistance

Source: Derived - IPEDS, Institutional Characteristics component *Denotes institutions that have a medical schoolNote: Schools with the same tuition for in-state and out-of-state have a single reported figure. Total Price is cost of attendance for full-time undergraduate students living on campus for the academic year. Cost includes tuition and fees, books and supplies, on campus room and board, and other on campus expenses.
Total price for students living on campus(2010/2011)
$20,305$22,535 $23,722
$28,065$30,341
$48,435
$53,239 $53,556 $54,003 $54,135 $54,370 $54,624 $55,000 $55,386 $56,485 $56,634 $56,930
$38,920
$45,481 $45,298
$50,944$53,220
$0
$10,000
$20,000
$30,000
$40,000
$50,000
$60,000
In-state Out-of-state
Source: IPEDS, Student Financial Aid component*Denotes institutions that have a medical schoolNote: Schools with the same tuition for in-state and out-of-state have a single reported figure.Total Price: cost of attendance for full-time students for academic year. Cost includes in-state tuition and fees, books and supplies, on campus room and board, and other on campus expenses.
Price for students after average institutional grant(2009/2010)
$13,671
$9,987
$13,762
$22,072 $22,566$22,156 $22,802$25,251
$26,705 $27,316 $27,447 $28,762 $29,462 $30,180 $30,268 $30,293$32,286 $32,933 $33,725
$35,338
$44,951 $45,445
0
10000
20000
30000
40000
50000
60000
In state cost after average institutional aid deductedOut of state cost after average institutional aid deducted"Sticker price" for out-of-state students living on campus
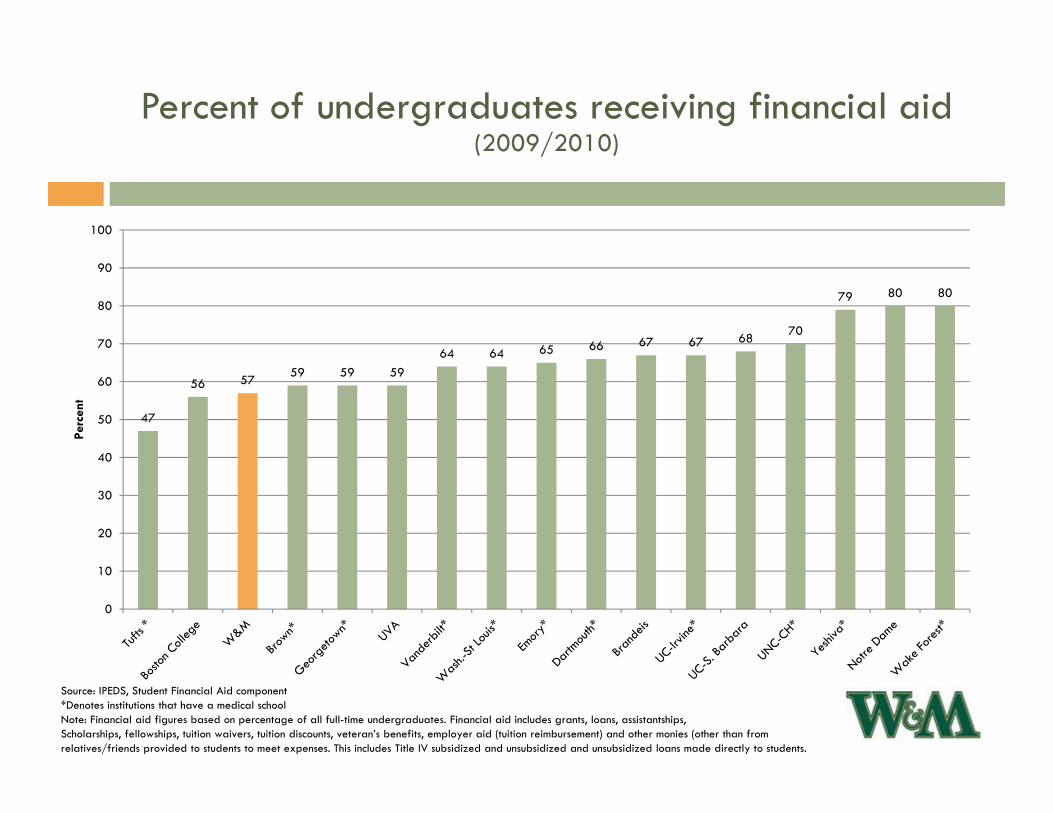
Percent of undergraduates receiving financial aid (2009/2010)
Source: IPEDS, Student Financial Aid component*Denotes institutions that have a medical schoolNote: Financial aid figures based on percentage of all full-time undergraduates. Financial aid includes grants, loans, assistantships,Scholarships, fellowships, tuition waivers, tuition discounts, veteran’s benefits, employer aid (tuition reimbursement) and other monies (other than from relatives/friends provided to students to meet expenses. This includes Title IV subsidized and unsubsidized and unsubsidized loans made directly to students.
47
56 57 59 59 5964 64 65 66 67 67 68 70
79 80 80
0
10
20
30
40
50
60
70
80
90
100
Perc
ent
Source: IPEDS, Student Financial Aid component*Denotes institutions that have a medical schoolFederal: grants provided by federal agencies, including Title IV Pell Grants and Supplemental Educational Opportunity Grants (SEOG). State/Local: monies awarded to the institution under state and local student aid programs, including the state portion of State Student Incentives Grants (SSIG).Institutional: scholarships and fellowships granted and funded by the institution. Includes scholarships targeted to certain individuals (e.g., based on state of residence, major fields of study, athletic team participation) for which the institution designates the recipient.
Percent of undergraduates receiving grant aid(2009/2010)
2529
37 3842 43
46 4851 52 52 54 55 57 57 57
78
913
21
3
27
7
32
2
27
2
34
7
23
83
12 1311 11 1013
20
12
30
1217 18
34
10
2319 18 16
22
0
10
20
30
40
50
60
70
80
90
100
Percentage receiving institutional grant aid Percentage receiving state/local grant aid Percentage receiving federal grant aid
Source: IPEDS, Student Financial Aid component*Denotes institutions that have a medical schoolNote: Financial aid figures based on percentage of all full-time undergraduates.
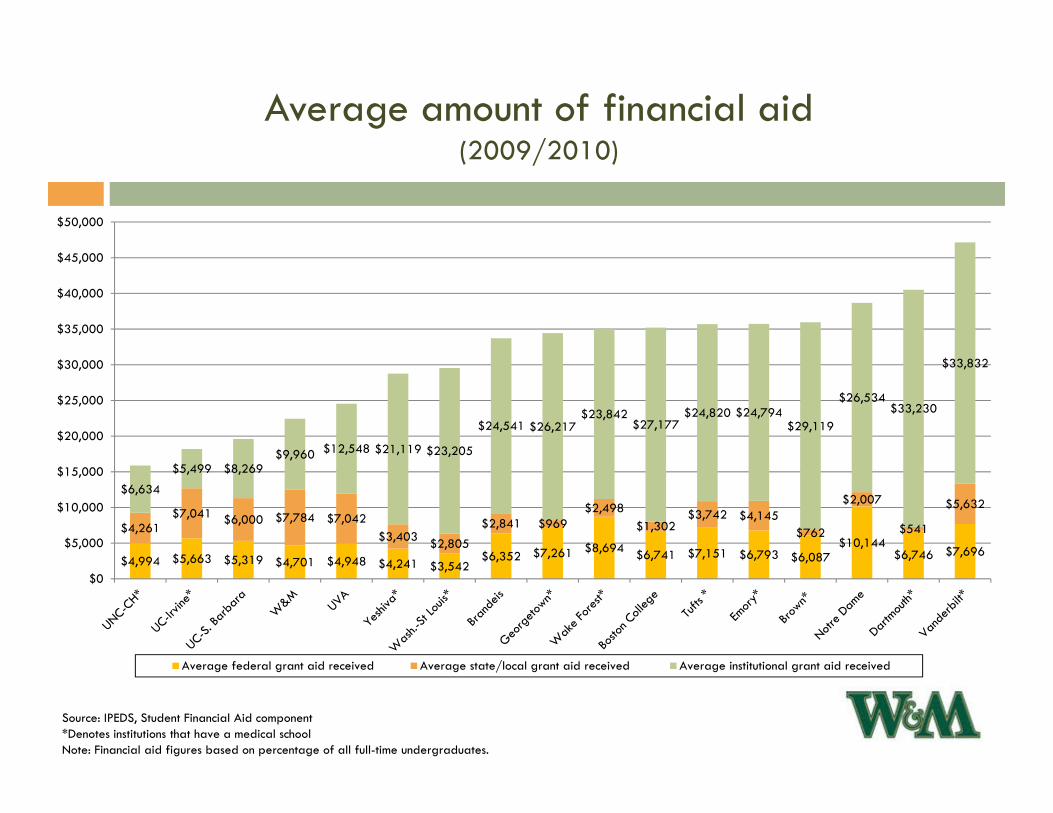
Average amount of financial aid(2009/2010)
$4,994 $5,663 $5,319 $4,701 $4,948 $4,241 $3,542$6,352 $7,261 $8,694 $6,741 $7,151 $6,793 $6,087
$10,144$6,746 $7,696
$4,261$7,041 $6,000 $7,784 $7,042
$3,403 $2,805
$2,841 $969$2,498
$1,302$3,742 $4,145
$762
$2,007
$541
$5,632$6,634
$5,499 $8,269$9,960 $12,548 $21,119 $23,205
$24,541 $26,217$23,842
$27,177$24,820 $24,794
$29,119
$26,534$33,230
$33,832
$0
$5,000
$10,000
$15,000
$20,000
$25,000
$30,000
$35,000
$40,000
$45,000
$50,000
Average federal grant aid received Average state/local grant aid received Average institutional grant aid received