Embed Size (px)
Citation preview
2011 Aggregate Frequency Report
Strategic National Arts Alumni Project
*Institutions excluded from aggregate analyses due to non-standard administrations
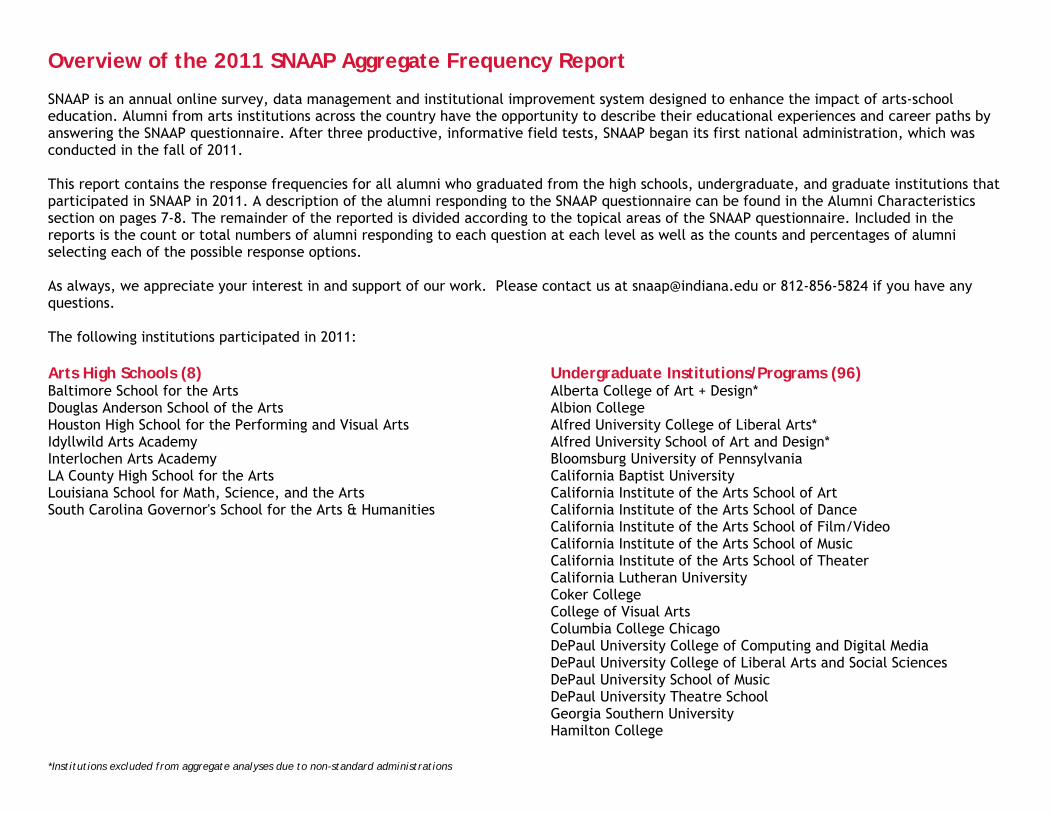
Overview of the 2011 SNAAP Aggregate Frequency Report SNAAP is an annual online survey, data management and institutional improvement system designed to enhance the impact of arts-school education. Alumni from arts institutions across the country have the opportunity to describe their educational experiences and career paths by answering the SNAAP questionnaire. After three productive, informative field tests, SNAAP began its first national administration, which was conducted in the fall of 2011. This report contains the response frequencies for all alumni who graduated from the high schools, undergraduate, and graduate institutions that participated in SNAAP in 2011. A description of the alumni responding to the SNAAP questionnaire can be found in the Alumni Characteristics section on pages 7-8. The remainder of the reported is divided according to the topical areas of the SNAAP questionnaire. Included in the reports is the count or total numbers of alumni responding to each question at each level as well as the counts and percentages of alumni selecting each of the possible response options. As always, we appreciate your interest in and support of our work. Please contact us at [email protected] or 812-856-5824 if you have any questions. The following institutions participated in 2011: Arts High Schools (8)
Baltimore School for the Arts Douglas Anderson School of the Arts Houston High School for the Performing and Visual Arts Idyllwild Arts Academy Interlochen Arts Academy LA County High School for the Arts Louisiana School for Math, Science, and the Arts South Carolina Governor's School for the Arts & Humanities
Undergraduate Institutions/Programs (96) Alberta College of Art + Design* Albion College Alfred University College of Liberal Arts* Alfred University School of Art and Design* Bloomsburg University of Pennsylvania California Baptist University California Institute of the Arts School of Art California Institute of the Arts School of Dance California Institute of the Arts School of Film/Video California Institute of the Arts School of Music California Institute of the Arts School of Theater California Lutheran University Coker College College of Visual Arts Columbia College Chicago DePaul University College of Computing and Digital Media DePaul University College of Liberal Arts and Social Sciences DePaul University School of Music DePaul University Theatre School Georgia Southern University Hamilton College
*Institutions excluded from aggregate analyses due to non-standard administrations
Herron School of Art and Design at Indiana University Purdue University Indianapolis Indiana University Jacobs School of Music James Madison University Kendall College of Art and Design at Ferris State University Kent State University (Art, Music, Theatre, Dance) Kent State University (Fashion Design & Merchandising) Louisiana State University and Agricultural & Mechanical College, College of Music and Dramatics Arts Manhattan School of Music (Composition Majors) Manhattan School of Music (Jazz Majors) Manhattan School of Music (Keyboard Majors) Manhattan School of Music (Orchestral Majors) Manhattan School of Music (Voice Majors) Maryland Institute College of Art Miami University-Oxford (Architecture) Miami University-Oxford (Art) Miami University-Oxford (Music) Miami University-Oxford (Theatre) Milwaukee Institute of Art & Design Moore College of Art and Design* New York University Tisch School of the Arts North Dakota State University (Music) North Dakota State University (Theatre Arts) North Dakota State University (Visual Arts) Northern State University OCAD University* Pacific Lutheran University Purdue University (Art and Design, Theatre) Purdue University (Creative Writing) Rhode Island School of Design* School of the Art Institute of Chicago Seton Hall University Southern Methodist University (Art) Southern Methodist University (Dance) Southern Methodist University (Film and Media Arts) Southern Methodist University (Music) Southern Methodist University (Theatre) St. Cloud State University State University of New York at New Paltz* Syracuse University
The City College of New York (Art)* The City College of New York (Electronic Design and Multimedia)* The City College of New York (Media Communication Arts)* The City College of New York (Music)* The City College of New York (Theatre)* The Ohio State University The University of Texas at Austin Butler School of Music The University of Texas at Austin Department of Art and Art History The University of Texas at Austin Department of Theatre and Dance The University of Texas at Austin School of Architecture University of Alaska Anchorage (Art) University of Alaska Anchorage (Music) University of Alaska Anchorage (Theatre and Dance) University of California-Berkeley University of California-Davis University of California-Irvine University of California-Los Angeles School of the Arts and Architecture University of California-Merced* University of California-Riverside University of California-San Diego University of California-Santa Barbara University of California-Santa Cruz University of Colorado at Boulder College of Music University of Massachusetts Amherst (Art, Architecture, Art History) University of Massachusetts Amherst (Dance) University of Massachusetts Amherst (Music) University of Massachusetts Amherst (Theater) University of Michigan-Ann Arbor School of Art & Design University of North Carolina at Charlotte University of South Carolina Columbia* University of Wisconsin-Whitewater Virginia Commonwealth University Western Michigan University Department of Dance Western Michigan University Department of Theatre Western Michigan University Frostic School of Art Western Michigan University School of Music
*Institutions excluded from aggregate analyses due to non-standard administrations
Graduate Institutions/Programs (79) Alfred University School of Art and Design* Bloomsburg University of Pennsylvania California Baptist University California Institute of the Arts School of Art California Institute of the Arts School of Critical Studies California Institute of the Arts School of Dance California Institute of the Arts School of Film/Video California Institute of the Arts School of Music California Institute of the Arts School of Theater California Lutheran University Columbia College Chicago DePaul University College of Computing and Digital Media DePaul University College of Liberal Arts and Social Sciences DePaul University School of Music DePaul University Theatre School Georgia Southern University Herron School of Art and Design at Indiana University Purdue University Indianapolis Indiana University Jacobs School of Music James Madison University Kendall College of Art and Design at Ferris State University Kent State University (Art, Music, Theatre, Dance) Louisiana State University and Agricultural & Mechanical College, College of Music and Dramatics Arts Manhattan School of Music (Composition Majors) Manhattan School of Music (Jazz Majors) Manhattan School of Music (Keyboard Majors) Manhattan School of Music (Orchestral Majors) Manhattan School of Music (Voice Majors) Maryland Institute College of Art Miami University-Oxford (Architecture) Miami University-Oxford (Art) Miami University-Oxford (Music) Miami University-Oxford (Theatre) New York University Tisch School of the Arts North Dakota State University (Music) North Dakota State University (Theatre Arts) Northern State University OCAD University* Pacific Lutheran University
Purdue University (Art and Design, Theatre) Purdue University (Creative Writing) Rhode Island School of Design* School of the Art Institute of Chicago Seton Hall University Southern Methodist University (Art) Southern Methodist University (Dance) Southern Methodist University (Film and Media Arts) Southern Methodist University (Music) Southern Methodist University (Theatre) St. Cloud State University State University of New York at New Paltz* Syracuse University The City College of New York (Art)* The City College of New York (Media Communication Arts)* The City College of New York (Music)* The Ohio State University The University of Texas at Austin Butler School of Music The University of Texas at Austin Department of Art and Art History The University of Texas at Austin Department of Theatre and Dance The University of Texas at Austin School of Architecture University of Alaska Anchorage (Creative Writing) University of California-Berkeley University of California-Davis University of California-Irvine University of California-Los Angeles School of the Arts and Architecture University of California-Riverside University of California-San Diego University of California-Santa Barbara University of California-Santa Cruz University of Colorado at Boulder College of Music University of Massachusetts Amherst (Art, Architecture, Art History) University of Massachusetts Amherst (Music) University of Massachusetts Amherst (Theater) University of Michigan-Ann Arbor School of Art & Design University of North Carolina at Charlotte University of South Carolina Columbia*
*Institutions excluded from aggregate analyses due to non-standard administrations
University of Wisconsin-Whitewater Virginia Commonwealth University Western Michigan University Frostic School of Art Western Michigan University School of Music
Variable Response Options Count % Count % Count %
part_none I have not supported the arts in the past 12 months 256 76% 382 84% 1,206 80%
part_vol Volunteered at an arts organization 56 17% 76 17% 345 23%
part_brd Served on the board of an arts organization 98 29% 107 23% 556 37%
part_tch Volunteered to teach the arts 93 28% 98 21% 523 35%
part_donate Donated money to an arts organization or an artist 255 76% 273 60% 980 65%
part_attd Attended an arts event 38 11% 112 25% 681 45%
part_oth Other 67 20% 89 19% 178 12%
Totala
- - - - - -Do not make or perform art in personal time 272 20% 215 36% 525 24%
I do not perform or exhibit in public 1 0% 0 0% 1 0%
Less than once a year 74 5% 43 7% 129 6%
1 or 2 times a year 92 7% 52 9% 158 7%
3 or more times a year 372 27% 103 17% 524 24%
Continuously in public or online 563 41% 184 31% 828 38%
Total 1,374 100% 597 100% 2,165 100%
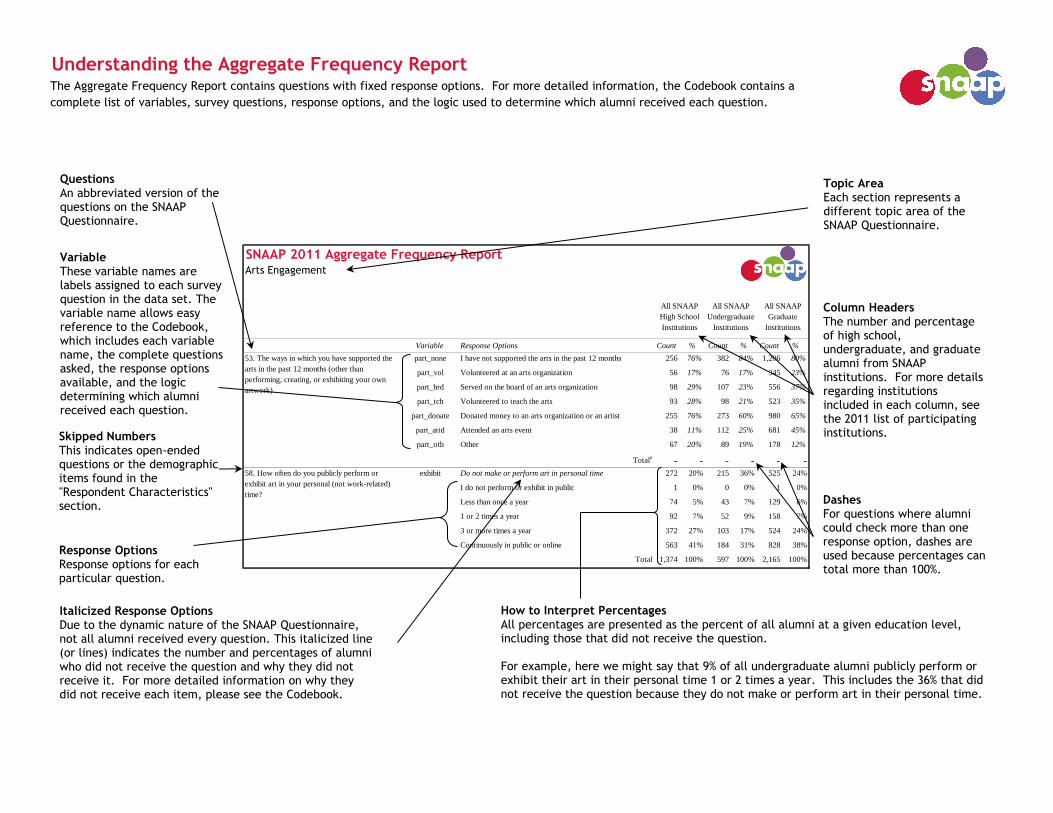
Understanding the Aggregate Frequency ReportThe Aggregate Frequency Report contains questions with fixed response options. For more detailed information, the Codebook contains a
complete list of variables, survey questions, response options, and the logic used to determine which alumni received each question.
SNAAP 2011 Aggregate Frequency ReportArts Engagement
All SNAAP
High School
Institutions
All SNAAP
Undergraduate
Institutions
All SNAAP
Graduate
Institutions
53. The ways in which you have supported the
arts in the past 12 months (other than
performing, creating, or exhibiting your own
artwork)
58. How often do you publicly perform or
exhibit art in your personal (not work-related)
time?
exhibit
Column Headers The number and percentage of high school, undergraduate, and graduate alumni from SNAAP institutions. For more details regarding institutions included in each column, see the 2011 list of participating institutions.
Topic Area Each section represents a different topic area of the SNAAP Questionnaire.
Variable
These variable names are labels assigned to each survey question in the data set. The variable name allows easy reference to the Codebook, which includes each variable name, the complete questions asked, the response options available, and the logic determining which alumni received each question.
Questions An abbreviated version of the questions on the SNAAP Questionnaire.
Response Options Response options for each particular question.
Dashes For questions where alumni could check more than one response option, dashes are used because percentages can total more than 100%.
Italicized Response Options Due to the dynamic nature of the SNAAP Questionnaire, not all alumni received every question. This italicized line (or lines) indicates the number and percentages of alumni who did not receive the question and why they did not receive it. For more detailed information on why they did not receive each item, please see the Codebook.
Skipped Numbers This indicates open-ended questions or the demographic items found in the "Respondent Characteristics" section.
How to Interpret Percentages All percentages are presented as the percent of all alumni at a given education level, including those that did not receive the question. For example, here we might say that 9% of all undergraduate alumni publicly perform or exhibit their art in their personal time 1 or 2 times a year. This includes the 36% that did not receive the question because they do not make or perform art in their personal time.
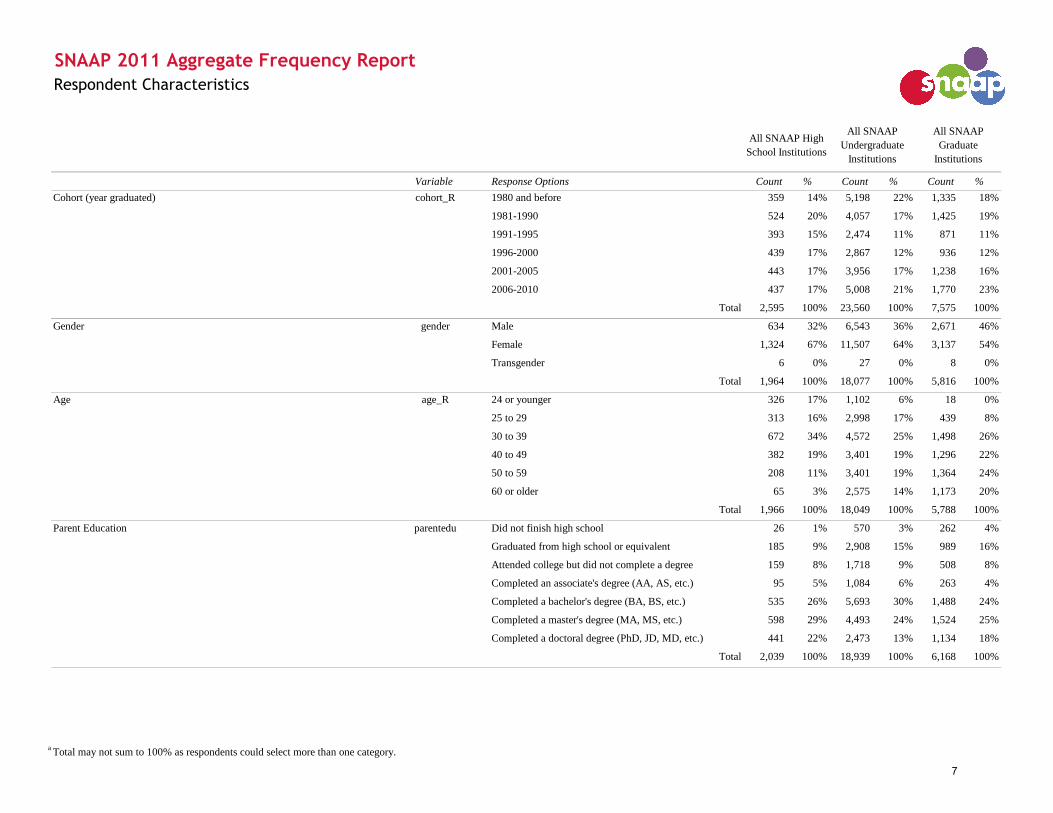
Variable Response Options Count % Count % Count %
Cohort (year graduated) cohort_R 1980 and before 359 14% 5,198 22% 1,335 18%
1981-1990 524 20% 4,057 17% 1,425 19%
1991-1995 393 15% 2,474 11% 871 11%
1996-2000 439 17% 2,867 12% 936 12%
2001-2005 443 17% 3,956 17% 1,238 16%
2006-2010 437 17% 5,008 21% 1,770 23%
Total 2,595 100% 23,560 100% 7,575 100%
Gender gender Male 634 32% 6,543 36% 2,671 46%
Female 1,324 67% 11,507 64% 3,137 54%
Transgender 6 0% 27 0% 8 0%
Total 1,964 100% 18,077 100% 5,816 100%
Age age_R 24 or younger 326 17% 1,102 6% 18 0%
25 to 29 313 16% 2,998 17% 439 8%
30 to 39 672 34% 4,572 25% 1,498 26%
40 to 49 382 19% 3,401 19% 1,296 22%
50 to 59 208 11% 3,401 19% 1,364 24%
60 or older 65 3% 2,575 14% 1,173 20%
Total 1,966 100% 18,049 100% 5,788 100%
Parent Education parentedu Did not finish high school 26 1% 570 3% 262 4%
Graduated from high school or equivalent 185 9% 2,908 15% 989 16%
Attended college but did not complete a degree 159 8% 1,718 9% 508 8%
Completed an associate's degree (AA, AS, etc.) 95 5% 1,084 6% 263 4%
Completed a bachelor's degree (BA, BS, etc.) 535 26% 5,693 30% 1,488 24%
Completed a master's degree (MA, MS, etc.) 598 29% 4,493 24% 1,524 25%
Completed a doctoral degree (PhD, JD, MD, etc.) 441 22% 2,473 13% 1,134 18%
Total 2,039 100% 18,939 100% 6,168 100%
SNAAP 2011 Aggregate Frequency Report
Respondent Characteristics
All SNAAP High
School Institutions
All SNAAP
Undergraduate
Institutions
All SNAAP
Graduate
Institutions
a Total may not sum to 100% as respondents could select more than one category.
7
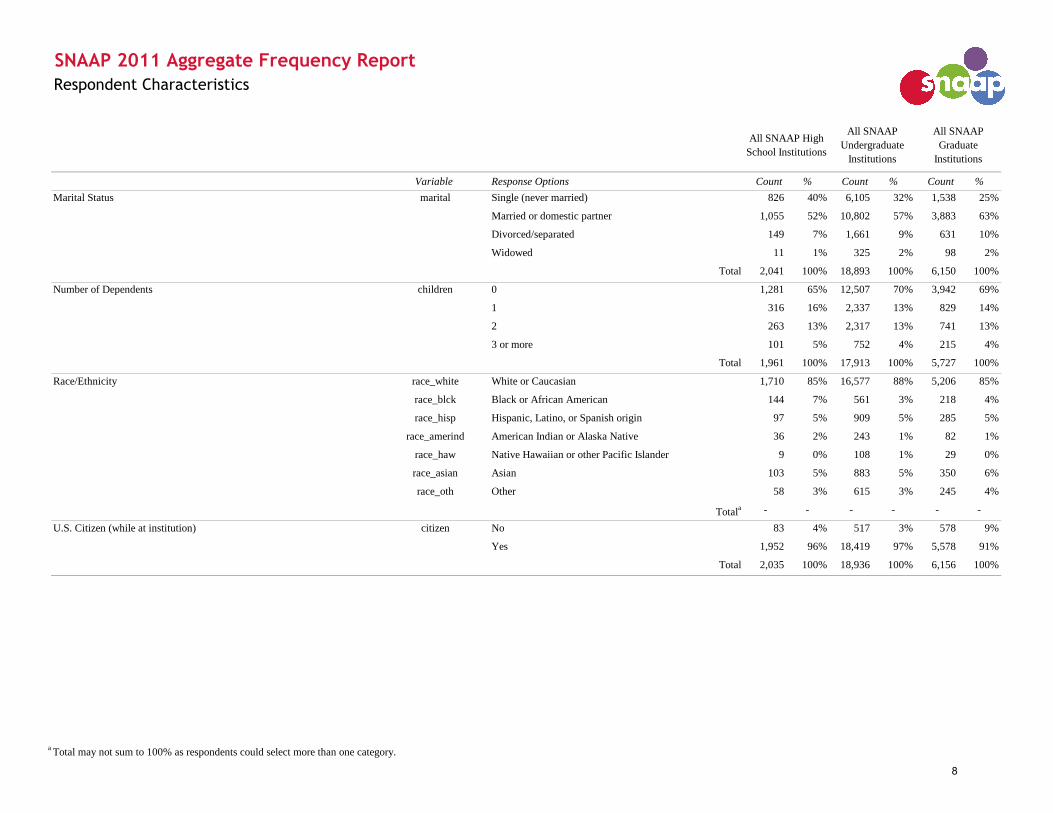
Variable Response Options Count % Count % Count %
SNAAP 2011 Aggregate Frequency Report
Respondent Characteristics
All SNAAP High
School Institutions
All SNAAP
Undergraduate
Institutions
All SNAAP
Graduate
Institutions
Marital Status marital Single (never married) 826 40% 6,105 32% 1,538 25%
Married or domestic partner 1,055 52% 10,802 57% 3,883 63%
Divorced/separated 149 7% 1,661 9% 631 10%
Widowed 11 1% 325 2% 98 2%
Total 2,041 100% 18,893 100% 6,150 100%
Number of Dependents children 0 1,281 65% 12,507 70% 3,942 69%
1 316 16% 2,337 13% 829 14%
2 263 13% 2,317 13% 741 13%
3 or more 101 5% 752 4% 215 4%
Total 1,961 100% 17,913 100% 5,727 100%
Race/Ethnicity race_white White or Caucasian 1,710 85% 16,577 88% 5,206 85%
race_blck Black or African American 144 7% 561 3% 218 4%
race_hisp Hispanic, Latino, or Spanish origin 97 5% 909 5% 285 5%
race_amerind American Indian or Alaska Native 36 2% 243 1% 82 1%
race_haw Native Hawaiian or other Pacific Islander 9 0% 108 1% 29 0%
race_asian Asian 103 5% 883 5% 350 6%
race_oth Other 58 3% 615 3% 245 4%
Totala - - - - - -
U.S. Citizen (while at institution) citizen No 83 4% 517 3% 578 9%
Yes 1,952 96% 18,419 97% 5,578 91%
Total 2,035 100% 18,936 100% 6,156 100%
a Total may not sum to 100% as respondents could select more than one category.
8
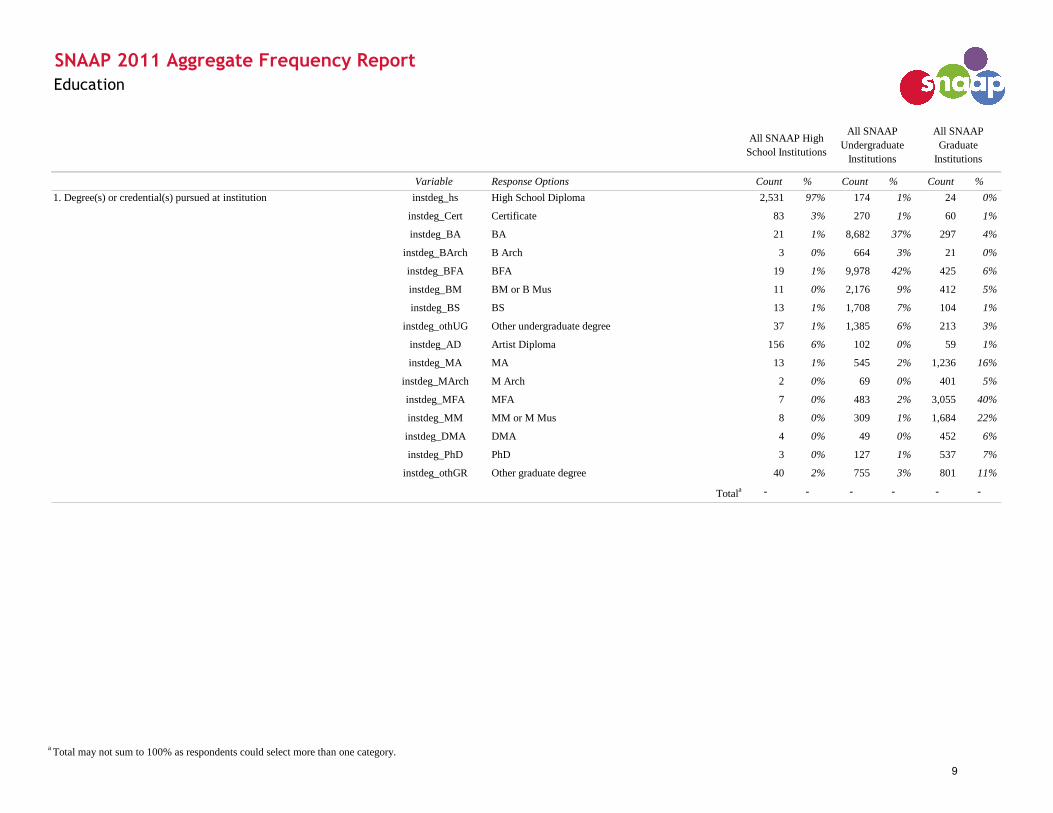
Variable Response Options Count % Count % Count %
instdeg_hs High School Diploma 2,531 97% 174 1% 24 0%
instdeg_Cert Certificate 83 3% 270 1% 60 1%
instdeg_BA BA 21 1% 8,682 37% 297 4%
instdeg_BArch B Arch 3 0% 664 3% 21 0%
instdeg_BFA BFA 19 1% 9,978 42% 425 6%
instdeg_BM BM or B Mus 11 0% 2,176 9% 412 5%
instdeg_BS BS 13 1% 1,708 7% 104 1%
instdeg_othUG Other undergraduate degree 37 1% 1,385 6% 213 3%
instdeg_AD Artist Diploma 156 6% 102 0% 59 1%
instdeg_MA MA 13 1% 545 2% 1,236 16%
instdeg_MArch M Arch 2 0% 69 0% 401 5%
instdeg_MFA MFA 7 0% 483 2% 3,055 40%
instdeg_MM MM or M Mus 8 0% 309 1% 1,684 22%
instdeg_DMA DMA 4 0% 49 0% 452 6%
instdeg_PhD PhD 3 0% 127 1% 537 7%
instdeg_othGR Other graduate degree 40 2% 755 3% 801 11%
Totala - - - - - -
SNAAP 2011 Aggregate Frequency Report
Education
All SNAAP High
School Institutions
All SNAAP
Undergraduate
Institutions
All SNAAP
Graduate
Institutions
1. Degree(s) or credential(s) pursued at institution
a Total may not sum to 100% as respondents could select more than one category.
9
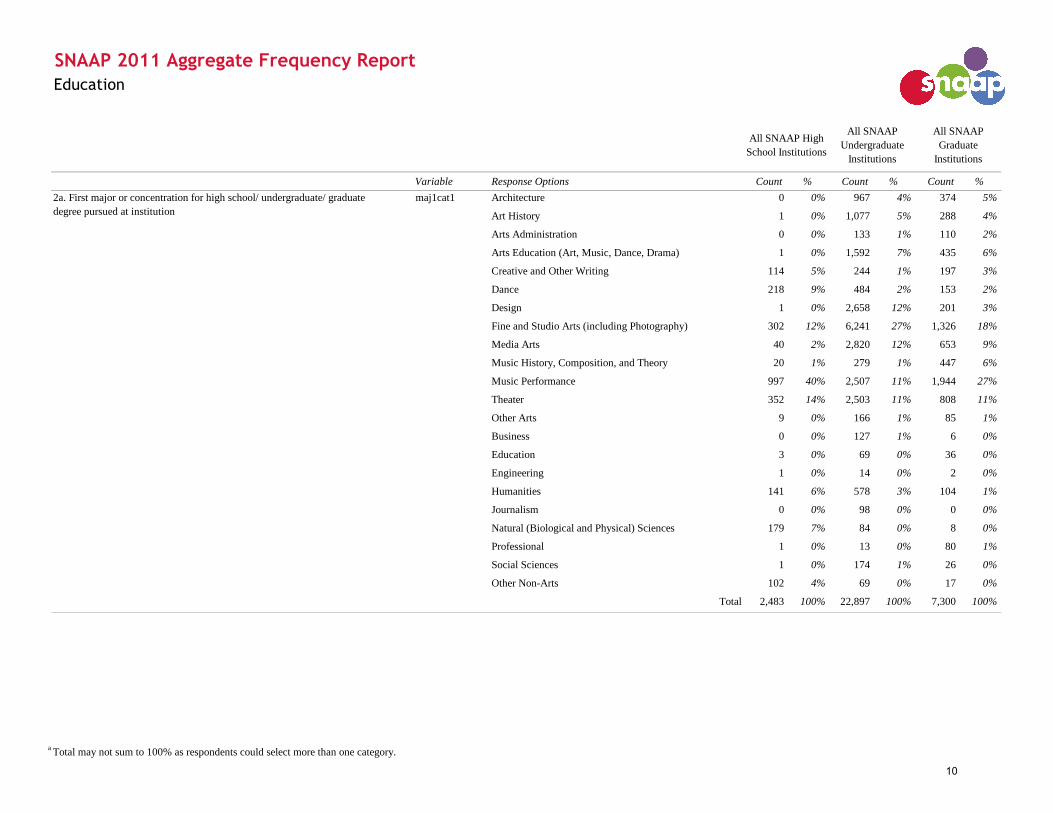
Variable Response Options Count % Count % Count %
SNAAP 2011 Aggregate Frequency Report
Education
All SNAAP High
School Institutions
All SNAAP
Undergraduate
Institutions
All SNAAP
Graduate
Institutions
maj1cat1 Architecture 0 0% 967 4% 374 5%
Art History 1 0% 1,077 5% 288 4%
Arts Administration 0 0% 133 1% 110 2%
Arts Education (Art, Music, Dance, Drama) 1 0% 1,592 7% 435 6%
Creative and Other Writing 114 5% 244 1% 197 3%
Dance 218 9% 484 2% 153 2%
Design 1 0% 2,658 12% 201 3%
Fine and Studio Arts (including Photography) 302 12% 6,241 27% 1,326 18%
Media Arts 40 2% 2,820 12% 653 9%
Music History, Composition, and Theory 20 1% 279 1% 447 6%
Music Performance 997 40% 2,507 11% 1,944 27%
Theater 352 14% 2,503 11% 808 11%
Other Arts 9 0% 166 1% 85 1%
Business 0 0% 127 1% 6 0%
Education 3 0% 69 0% 36 0%
Engineering 1 0% 14 0% 2 0%
Humanities 141 6% 578 3% 104 1%
Journalism 0 0% 98 0% 0 0%
Natural (Biological and Physical) Sciences 179 7% 84 0% 8 0%
Professional 1 0% 13 0% 80 1%
Social Sciences 1 0% 174 1% 26 0%
Other Non-Arts 102 4% 69 0% 17 0%
Total 2,483 100% 22,897 100% 7,300 100%
2a. First major or concentration for high school/ undergraduate/ graduate
degree pursued at institution
a Total may not sum to 100% as respondents could select more than one category.
10
Variable Response Options Count % Count % Count %
SNAAP 2011 Aggregate Frequency Report
Education
All SNAAP High
School Institutions
All SNAAP
Undergraduate
Institutions
All SNAAP
Graduate
Institutions
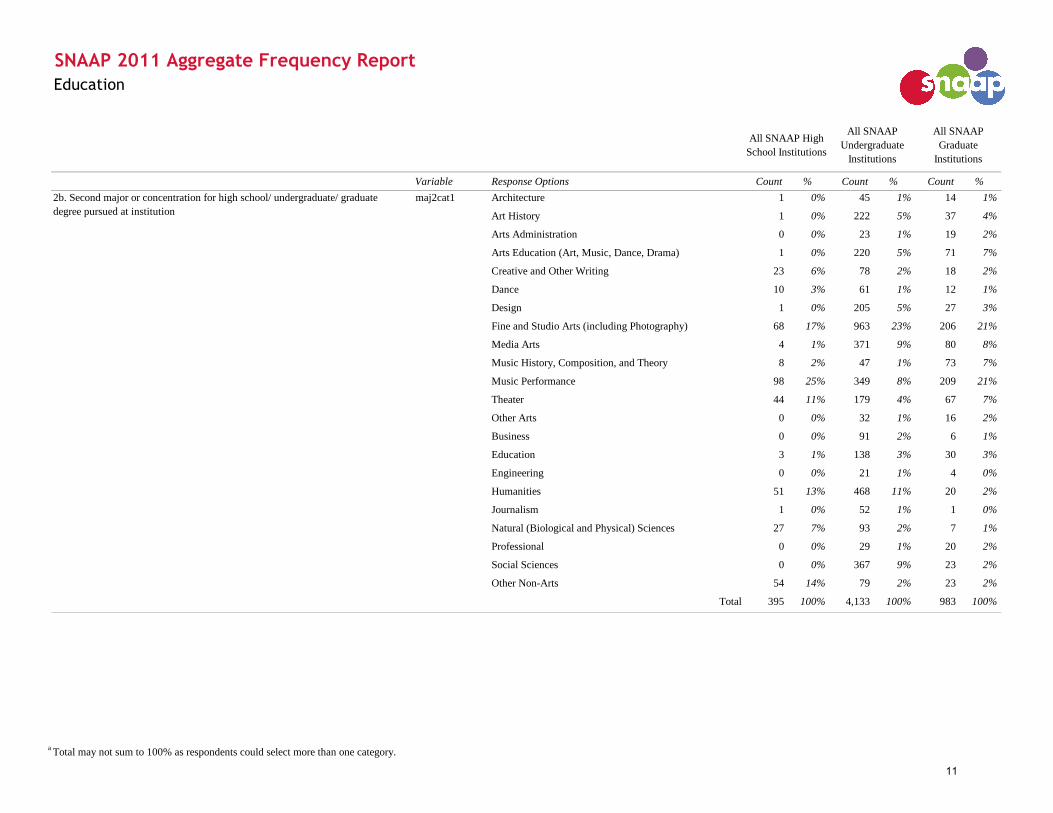
maj2cat1 Architecture 1 0% 45 1% 14 1%
Art History 1 0% 222 5% 37 4%
Arts Administration 0 0% 23 1% 19 2%
Arts Education (Art, Music, Dance, Drama) 1 0% 220 5% 71 7%
Creative and Other Writing 23 6% 78 2% 18 2%
Dance 10 3% 61 1% 12 1%
Design 1 0% 205 5% 27 3%
Fine and Studio Arts (including Photography) 68 17% 963 23% 206 21%
Media Arts 4 1% 371 9% 80 8%
Music History, Composition, and Theory 8 2% 47 1% 73 7%
Music Performance 98 25% 349 8% 209 21%
Theater 44 11% 179 4% 67 7%
Other Arts 0 0% 32 1% 16 2%
Business 0 0% 91 2% 6 1%
Education 3 1% 138 3% 30 3%
Engineering 0 0% 21 1% 4 0%
Humanities 51 13% 468 11% 20 2%
Journalism 1 0% 52 1% 1 0%
Natural (Biological and Physical) Sciences 27 7% 93 2% 7 1%
Professional 0 0% 29 1% 20 2%
Social Sciences 0 0% 367 9% 23 2%
Other Non-Arts 54 14% 79 2% 23 2%
Total 395 100% 4,133 100% 983 100%
2b. Second major or concentration for high school/ undergraduate/ graduate
degree pursued at institution
a Total may not sum to 100% as respondents could select more than one category.
11

Variable Response Options Count % Count % Count %
SNAAP 2011 Aggregate Frequency Report
Education
All SNAAP High
School Institutions
All SNAAP
Undergraduate
Institutions
All SNAAP
Graduate
Institutions
min1cat1 Architecture 0 0% 54 1% 9 1%
Art History 2 1% 652 11% 72 7%
Arts Administration 0 0% 67 1% 18 2%
Arts Education (Art, Music, Dance, Drama) 0 0% 107 2% 57 6%
Creative and Other Writing 19 6% 118 2% 13 1%
Dance 20 6% 49 1% 1 0%
Design 1 0% 236 4% 22 2%
Fine and Studio Arts (including Photography) 51 16% 839 14% 112 11%
Media Arts 10 3% 363 6% 32 3%
Music History, Composition, and Theory 7 2% 52 1% 212 20%
Music Performance 135 41% 377 6% 236 23%
Theater 35 11% 166 3% 35 3%
Other Arts 0 0% 22 0% 10 1%
Business 0 0% 482 8% 7 1%
Education 0 0% 215 3% 20 2%
Engineering 0 0% 19 0% 3 0%
Humanities 16 5% 1,138 18% 63 6%
Journalism 0 0% 39 1% 1 0%
Natural (Biological and Physical) Sciences 11 3% 216 3% 9 1%
Professional 0 0% 46 1% 14 1%
Social Sciences 3 1% 742 12% 34 3%
Other Non-Arts 18 5% 208 3% 55 5%
Total 328 100% 6,207 100% 1,035 100%
3. Minor for high school/ undergraduate/ graduate degree pursued at
institution
a Total may not sum to 100% as respondents could select more than one category.
12

Variable Response Options Count % Count % Count %
SNAAP 2011 Aggregate Frequency Report
Education
All SNAAP High
School Institutions
All SNAAP
Undergraduate
Institutions
All SNAAP
Graduate
Institutions
No 57 2% 340 1% 210 3%
Yes 2,489 98% 22,841 99% 7,228 97%
Total 2,546 100% 23,181 100% 7,438 100%
xtimeinstdeg Did not complete degree pursued at this institution 55 2% 336 1% 208 3%
No 2,431 96% 15,007 65% 5,261 71%
Yes, 1 semester longer 4 0% 3,022 13% 601 8%
Yes, 2 semesters longer 13 1% 2,774 12% 532 7%
Yes, 3 semesters longer 4 0% 671 3% 125 2%
Yes, 2 years longer 10 0% 636 3% 245 3%
Yes, more than 2 years longer 21 1% 691 3% 453 6%
Total 2,538 100% 23,137 100% 7,425 100%
4. Did you complete your high school/ undergraduate/ graduate degree
pursued at institution?
compinstdeg
5. Did you spend more than the recommended time to complete your high
school/ undergraduate/ graduate degree from institution?
a Total may not sum to 100% as respondents could select more than one category.
13
Variable Response Options Count % Count % Count %
SNAAP 2011 Aggregate Frequency Report
Education
All SNAAP High
School Institutions
All SNAAP
Undergraduate
Institutions
All SNAAP
Graduate
Institutions
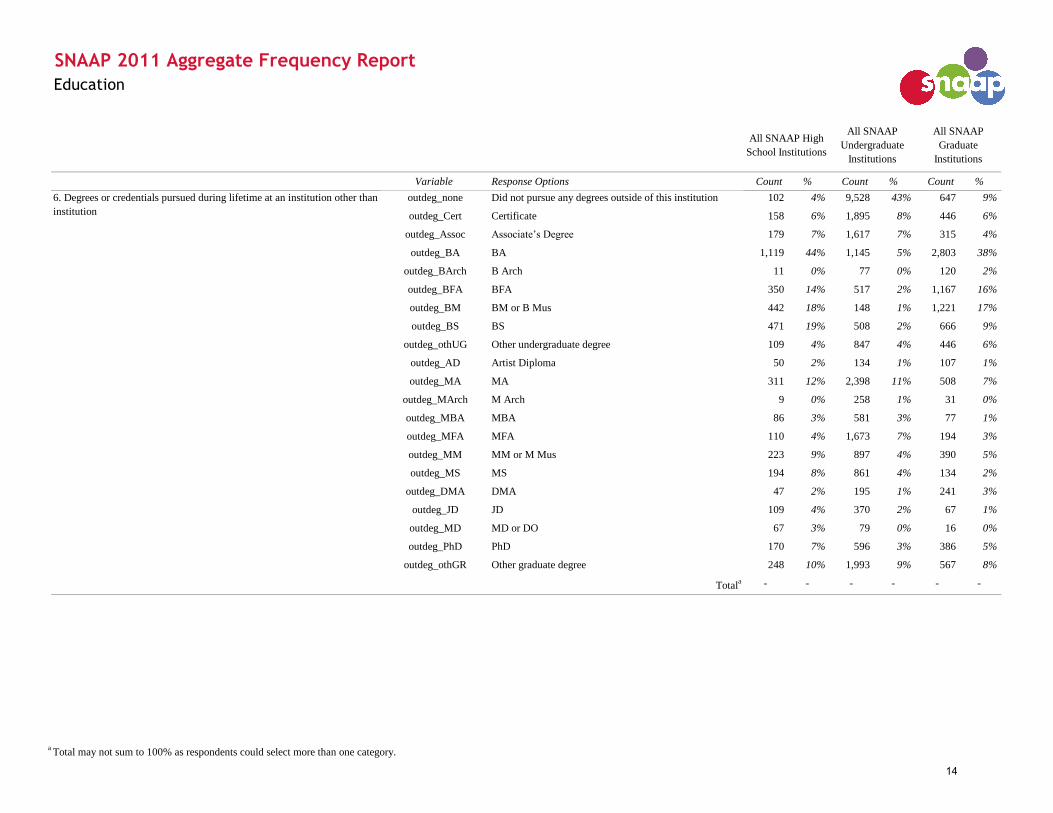
outdeg_none Did not pursue any degrees outside of this institution 102 4% 9,528 43% 647 9%
outdeg_Cert Certificate 158 6% 1,895 8% 446 6%
outdeg_Assoc Associate’s Degree 179 7% 1,617 7% 315 4%
outdeg_BA BA 1,119 44% 1,145 5% 2,803 38%
outdeg_BArch B Arch 11 0% 77 0% 120 2%
outdeg_BFA BFA 350 14% 517 2% 1,167 16%
outdeg_BM BM or B Mus 442 18% 148 1% 1,221 17%
outdeg_BS BS 471 19% 508 2% 666 9%
outdeg_othUG Other undergraduate degree 109 4% 847 4% 446 6%
outdeg_AD Artist Diploma 50 2% 134 1% 107 1%
outdeg_MA MA 311 12% 2,398 11% 508 7%
outdeg_MArch M Arch 9 0% 258 1% 31 0%
outdeg_MBA MBA 86 3% 581 3% 77 1%
outdeg_MFA MFA 110 4% 1,673 7% 194 3%
outdeg_MM MM or M Mus 223 9% 897 4% 390 5%
outdeg_MS MS 194 8% 861 4% 134 2%
outdeg_DMA DMA 47 2% 195 1% 241 3%
outdeg_JD JD 109 4% 370 2% 67 1%
outdeg_MD MD or DO 67 3% 79 0% 16 0%
outdeg_PhD PhD 170 7% 596 3% 386 5%
outdeg_othGR Other graduate degree 248 10% 1,993 9% 567 8%
Totala - - - - - -
6. Degrees or credentials pursued during lifetime at an institution other than
institution
a Total may not sum to 100% as respondents could select more than one category.
14

Variable Response Options Count % Count % Count %
SNAAP 2011 Aggregate Frequency Report
Education
All SNAAP High
School Institutions
All SNAAP
Undergraduate
Institutions
All SNAAP
Graduate
Institutions
compoutCert Did not pursue any degrees outside of this institution 101 4% 9,487 43% 641 9%
Did not pursue a certificate 2,249 90% 10,871 49% 6,226 85%
No 14 1% 192 1% 31 0%
Yes 129 5% 1,532 7% 377 5%
In progress 13 1% 174 1% 28 0%
Total 2,506 100% 22,256 100% 7,303 100%
Did not pursue any degrees outside of this institution 101 4% 9,487 43% 641 9%
Did not pursue an associate's degree 2,230 89% 11,127 50% 6,355 87%
No 19 1% 246 1% 29 0%
Yes 129 5% 1,332 6% 276 4%
In progress 24 1% 63 0% 5 0%
Total 2,503 100% 22,255 100% 7,306 100%
Did not pursue any degrees outside of this institution 101 4% 9,487 43% 641 9%
Did not pursue a BA 1,290 51% 11,593 52% 3,873 53%
No 70 3% 702 3% 86 1%
Yes 911 36% 441 2% 2,719 37%
In progress 136 5% 21 0% 0 0%
Total 2,508 100% 22,244 100% 7,319 100%
Did not pursue any degrees outside of this institution 101 4% 9,487 43% 641 9%
Did not pursue a B Arch 2,389 95% 12,648 57% 6,540 90%
No 4 0% 73 0% 9 0%
Yes 7 0% 25 0% 108 1%
In progress 1 0% 1 0% 0 0%
Total 2,502 100% 22,234 100% 7,298 100%
7.3. BA compoutBA
7. Did you complete this degree pursued at another institution?
7.1. Certificate
7.2. Associate's Degree compoutAssoc
7.4. B Arch compoutBArch
a Total may not sum to 100% as respondents could select more than one category.
15

Variable Response Options Count % Count % Count %
SNAAP 2011 Aggregate Frequency Report
Education
All SNAAP High
School Institutions
All SNAAP
Undergraduate
Institutions
All SNAAP
Graduate
Institutions
Did not pursue any degrees outside of this institution 101 4% 9,487 43% 641 9%
Did not pursue a BFA 2,050 82% 12,210 55% 5,490 75%
No 42 2% 343 2% 51 1%
Yes 252 10% 178 1% 1,112 15%
In progress 53 2% 7 0% 3 0%
Total 2,498 100% 22,225 100% 7,297 100%
Did not pursue any degrees outside of this institution 101 4% 9,487 43% 641 9%
Did not pursue a BM or B Mus 1,954 78% 12,571 57% 5,433 75%
No 44 2% 113 1% 33 0%
Yes 349 14% 50 0% 1,179 16%
In progress 50 2% 1 0% 2 0%
Total 2,498 100% 22,222 100% 7,288 100%
compoutBS Did not pursue any degrees outside of this institution 101 4% 9,487 43% 641 9%
Did not pursue a BS 1,928 77% 12,209 55% 5,981 82%
No 24 1% 205 1% 22 0%
Yes 384 15% 278 1% 636 9%
In progress 55 2% 42 0% 3 0%
Total 2,492 100% 22,221 100% 7,283 100%
Did not pursue any degrees outside of this institution 101 4% 9,487 43% 641 9%
Did not pursue another undergraduate degree 2,287 92% 11,864 54% 6,197 86%
No 8 0% 224 1% 28 0%
Yes 79 3% 524 2% 370 5%
In progress 9 0% 56 0% 6 0%
Total 2,484 100% 22,155 100% 7,242 100%
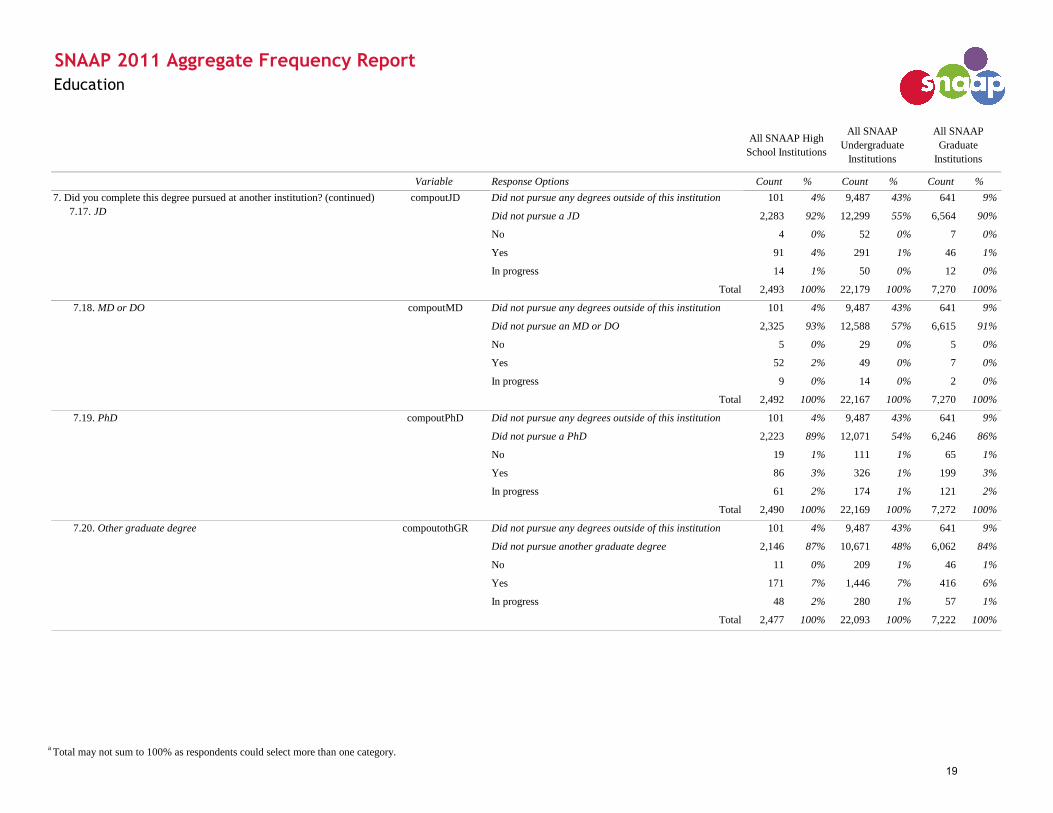
7. Did you complete this degree pursued at another institution? (continued)
7.5. BFA
compoutBFA
7.6. BM or B Mus compoutBM
7.7. BS
7.8. Other undergraduate degree compoutothUG
a Total may not sum to 100% as respondents could select more than one category.
16
Variable Response Options Count % Count % Count %
SNAAP 2011 Aggregate Frequency Report
Education
All SNAAP High
School Institutions
All SNAAP
Undergraduate
Institutions
All SNAAP
Graduate
Institutions
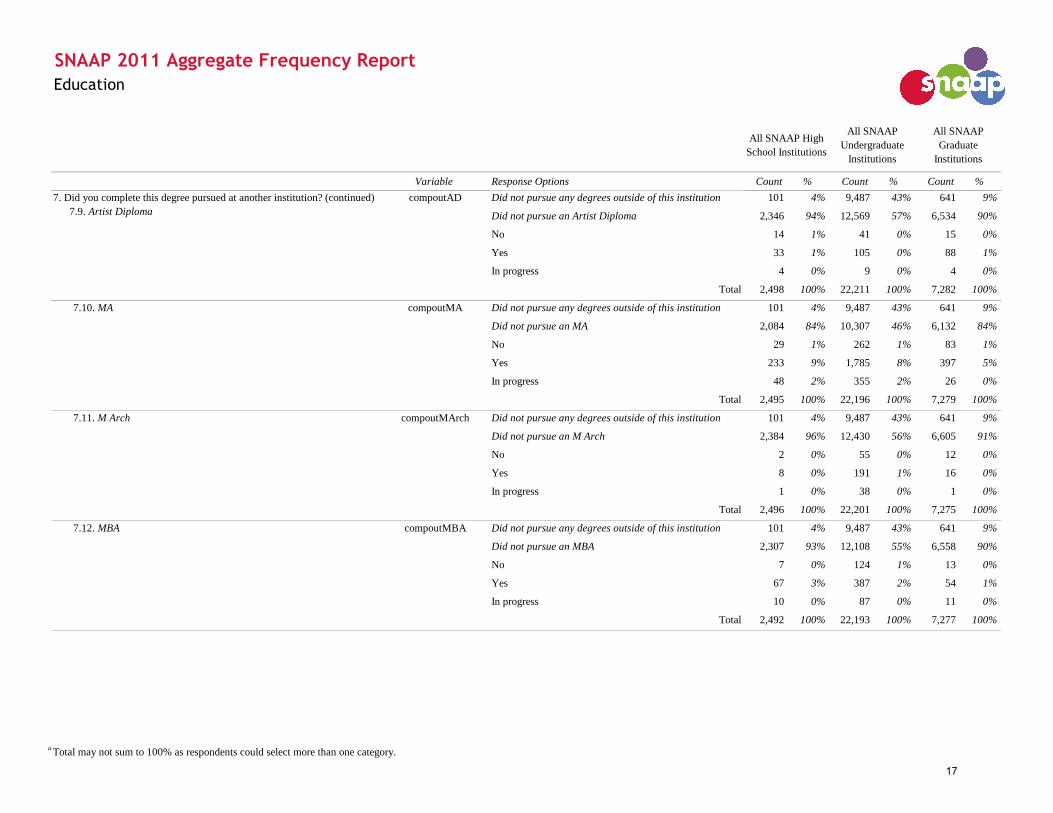
Did not pursue any degrees outside of this institution 101 4% 9,487 43% 641 9%
Did not pursue an Artist Diploma 2,346 94% 12,569 57% 6,534 90%
No 14 1% 41 0% 15 0%
Yes 33 1% 105 0% 88 1%
In progress 4 0% 9 0% 4 0%
Total 2,498 100% 22,211 100% 7,282 100%
Did not pursue any degrees outside of this institution 101 4% 9,487 43% 641 9%
Did not pursue an MA 2,084 84% 10,307 46% 6,132 84%
No 29 1% 262 1% 83 1%
Yes 233 9% 1,785 8% 397 5%
In progress 48 2% 355 2% 26 0%
Total 2,495 100% 22,196 100% 7,279 100%
Did not pursue any degrees outside of this institution 101 4% 9,487 43% 641 9%
Did not pursue an M Arch 2,384 96% 12,430 56% 6,605 91%
No 2 0% 55 0% 12 0%
Yes 8 0% 191 1% 16 0%
In progress 1 0% 38 0% 1 0%
Total 2,496 100% 22,201 100% 7,275 100%
Did not pursue any degrees outside of this institution 101 4% 9,487 43% 641 9%
Did not pursue an MBA 2,307 93% 12,108 55% 6,558 90%
No 7 0% 124 1% 13 0%
Yes 67 3% 387 2% 54 1%
In progress 10 0% 87 0% 11 0%
Total 2,492 100% 22,193 100% 7,277 100%
7.10. MA compoutMA
7. Did you complete this degree pursued at another institution? (continued)
7.9. Artist Diploma
compoutAD
7.11. M Arch compoutMArch
7.12. MBA compoutMBA
a Total may not sum to 100% as respondents could select more than one category.
17
Variable Response Options Count % Count % Count %
SNAAP 2011 Aggregate Frequency Report
Education
All SNAAP High
School Institutions
All SNAAP
Undergraduate
Institutions
All SNAAP
Graduate
Institutions
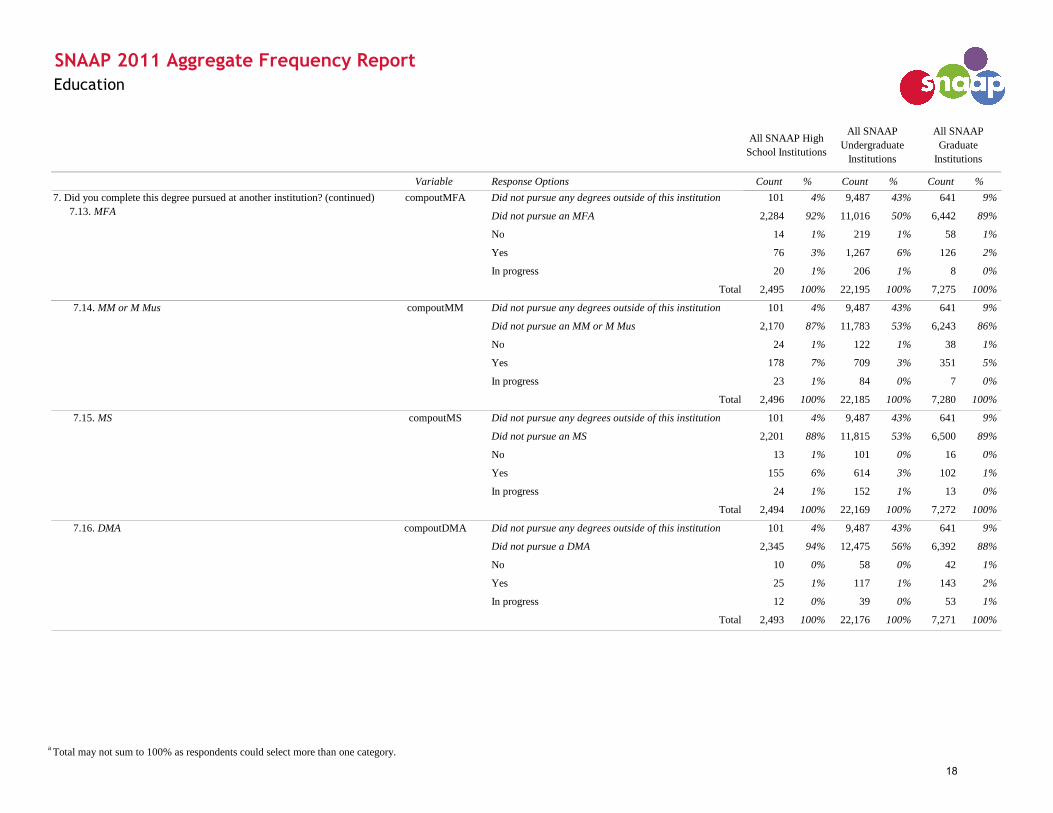
Did not pursue any degrees outside of this institution 101 4% 9,487 43% 641 9%
Did not pursue an MFA 2,284 92% 11,016 50% 6,442 89%
No 14 1% 219 1% 58 1%
Yes 76 3% 1,267 6% 126 2%
In progress 20 1% 206 1% 8 0%
Total 2,495 100% 22,195 100% 7,275 100%
Did not pursue any degrees outside of this institution 101 4% 9,487 43% 641 9%
Did not pursue an MM or M Mus 2,170 87% 11,783 53% 6,243 86%
No 24 1% 122 1% 38 1%
Yes 178 7% 709 3% 351 5%
In progress 23 1% 84 0% 7 0%
Total 2,496 100% 22,185 100% 7,280 100%
Did not pursue any degrees outside of this institution 101 4% 9,487 43% 641 9%
Did not pursue an MS 2,201 88% 11,815 53% 6,500 89%
No 13 1% 101 0% 16 0%
Yes 155 6% 614 3% 102 1%
In progress 24 1% 152 1% 13 0%
Total 2,494 100% 22,169 100% 7,272 100%
Did not pursue any degrees outside of this institution 101 4% 9,487 43% 641 9%
Did not pursue a DMA 2,345 94% 12,475 56% 6,392 88%
No 10 0% 58 0% 42 1%
Yes 25 1% 117 1% 143 2%
In progress 12 0% 39 0% 53 1%
Total 2,493 100% 22,176 100% 7,271 100%
7. Did you complete this degree pursued at another institution? (continued)
7.13. MFA
compoutMFA
7.14. MM or M Mus compoutMM
7.15. MS compoutMS
7.16. DMA compoutDMA
a Total may not sum to 100% as respondents could select more than one category.
18
Variable Response Options Count % Count % Count %
SNAAP 2011 Aggregate Frequency Report
Education
All SNAAP High
School Institutions
All SNAAP
Undergraduate
Institutions
All SNAAP
Graduate
Institutions
Did not pursue any degrees outside of this institution 101 4% 9,487 43% 641 9%
Did not pursue a JD 2,283 92% 12,299 55% 6,564 90%
No 4 0% 52 0% 7 0%
Yes 91 4% 291 1% 46 1%
In progress 14 1% 50 0% 12 0%
Total 2,493 100% 22,179 100% 7,270 100%
Did not pursue any degrees outside of this institution 101 4% 9,487 43% 641 9%
Did not pursue an MD or DO 2,325 93% 12,588 57% 6,615 91%
No 5 0% 29 0% 5 0%
Yes 52 2% 49 0% 7 0%
In progress 9 0% 14 0% 2 0%
Total 2,492 100% 22,167 100% 7,270 100%
Did not pursue any degrees outside of this institution 101 4% 9,487 43% 641 9%
Did not pursue a PhD 2,223 89% 12,071 54% 6,246 86%
No 19 1% 111 1% 65 1%
Yes 86 3% 326 1% 199 3%
In progress 61 2% 174 1% 121 2%
Total 2,490 100% 22,169 100% 7,272 100%
Did not pursue any degrees outside of this institution 101 4% 9,487 43% 641 9%
Did not pursue another graduate degree 2,146 87% 10,671 48% 6,062 84%
No 11 0% 209 1% 46 1%
Yes 171 7% 1,446 7% 416 6%
In progress 48 2% 280 1% 57 1%
Total 2,477 100% 22,093 100% 7,222 100%
7.20. Other graduate degree compoutothGR
7. Did you complete this degree pursued at another institution? (continued)
7.17. JD
compoutJD
7.18. MD or DO compoutMD
7.19. PhD compoutPhD
a Total may not sum to 100% as respondents could select more than one category.
19
Variable Response Options Count % Count % Count %
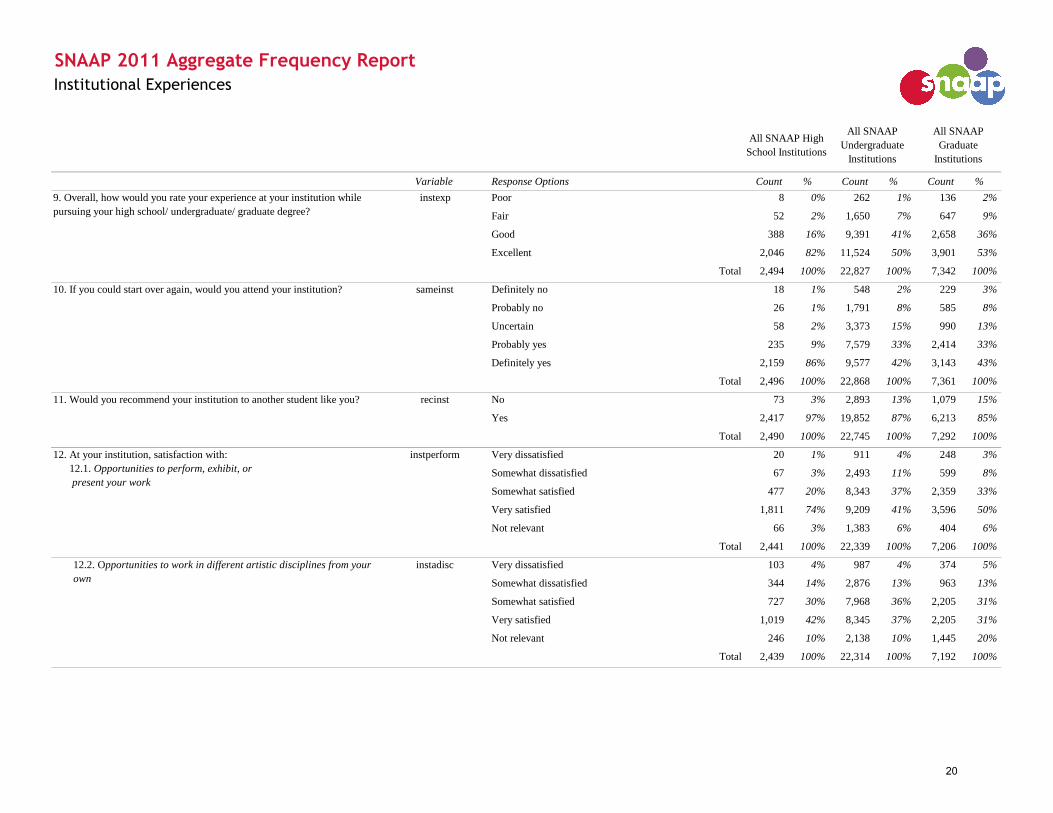
Poor 8 0% 262 1% 136 2%
Fair 52 2% 1,650 7% 647 9%
Good 388 16% 9,391 41% 2,658 36%
Excellent 2,046 82% 11,524 50% 3,901 53%
Total 2,494 100% 22,827 100% 7,342 100%
Definitely no 18 1% 548 2% 229 3%
Probably no 26 1% 1,791 8% 585 8%
Uncertain 58 2% 3,373 15% 990 13%
Probably yes 235 9% 7,579 33% 2,414 33%
Definitely yes 2,159 86% 9,577 42% 3,143 43%
Total 2,496 100% 22,868 100% 7,361 100%
No 73 3% 2,893 13% 1,079 15%
Yes 2,417 97% 19,852 87% 6,213 85%
Total 2,490 100% 22,745 100% 7,292 100%
Very dissatisfied 20 1% 911 4% 248 3%
Somewhat dissatisfied 67 3% 2,493 11% 599 8%
Somewhat satisfied 477 20% 8,343 37% 2,359 33%
Very satisfied 1,811 74% 9,209 41% 3,596 50%
Not relevant 66 3% 1,383 6% 404 6%
Total 2,441 100% 22,339 100% 7,206 100%
Very dissatisfied 103 4% 987 4% 374 5%
Somewhat dissatisfied 344 14% 2,876 13% 963 13%
Somewhat satisfied 727 30% 7,968 36% 2,205 31%
Very satisfied 1,019 42% 8,345 37% 2,205 31%
Not relevant 246 10% 2,138 10% 1,445 20%
Total 2,439 100% 22,314 100% 7,192 100%
9. Overall, how would you rate your experience at your institution while
pursuing your high school/ undergraduate/ graduate degree?
instexp
10. If you could start over again, would you attend your institution? sameinst
SNAAP 2011 Aggregate Frequency Report
Institutional Experiences
All SNAAP High
School Institutions
All SNAAP
Undergraduate
Institutions
All SNAAP
Graduate
Institutions
11. Would you recommend your institution to another student like you?
instadisc12.2. Opportunities to work in different artistic disciplines from your
own
instperform12. At your institution, satisfaction with:
12.1. Opportunities to perform, exhibit, or
present your work
recinst
20
Variable Response Options Count % Count % Count %
SNAAP 2011 Aggregate Frequency Report
Institutional Experiences
All SNAAP High
School Institutions
All SNAAP
Undergraduate
Institutions
All SNAAP
Graduate
Institutions
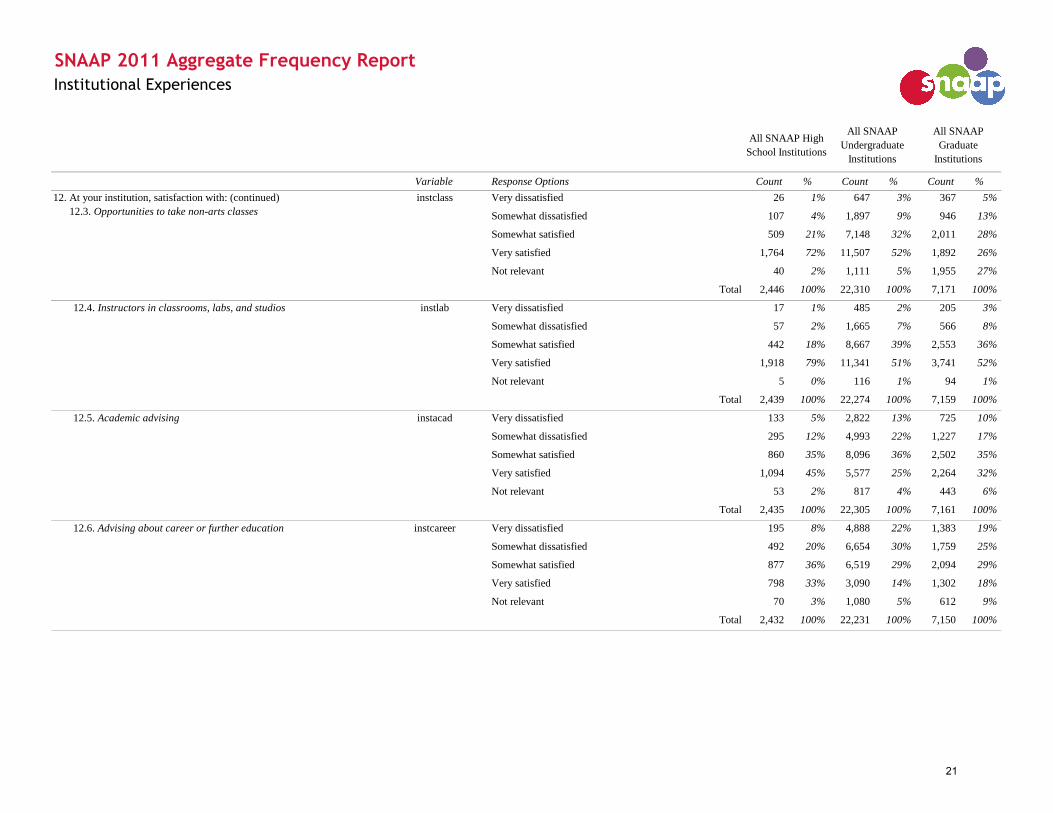
Very dissatisfied 26 1% 647 3% 367 5%
Somewhat dissatisfied 107 4% 1,897 9% 946 13%
Somewhat satisfied 509 21% 7,148 32% 2,011 28%
Very satisfied 1,764 72% 11,507 52% 1,892 26%
Not relevant 40 2% 1,111 5% 1,955 27%
Total 2,446 100% 22,310 100% 7,171 100%
Very dissatisfied 17 1% 485 2% 205 3%
Somewhat dissatisfied 57 2% 1,665 7% 566 8%
Somewhat satisfied 442 18% 8,667 39% 2,553 36%
Very satisfied 1,918 79% 11,341 51% 3,741 52%
Not relevant 5 0% 116 1% 94 1%
Total 2,439 100% 22,274 100% 7,159 100%
Very dissatisfied 133 5% 2,822 13% 725 10%
Somewhat dissatisfied 295 12% 4,993 22% 1,227 17%
Somewhat satisfied 860 35% 8,096 36% 2,502 35%
Very satisfied 1,094 45% 5,577 25% 2,264 32%
Not relevant 53 2% 817 4% 443 6%
Total 2,435 100% 22,305 100% 7,161 100%
Very dissatisfied 195 8% 4,888 22% 1,383 19%
Somewhat dissatisfied 492 20% 6,654 30% 1,759 25%
Somewhat satisfied 877 36% 6,519 29% 2,094 29%
Very satisfied 798 33% 3,090 14% 1,302 18%
Not relevant 70 3% 1,080 5% 612 9%
Total 2,432 100% 22,231 100% 7,150 100%
instcareer
instclass12. At your institution, satisfaction with: (continued)
12.3. Opportunities to take non-arts classes
12.4. Instructors in classrooms, labs, and studios
12.5. Academic advising
12.6. Advising about career or further education
instlab
instacad
21

Variable Response Options Count % Count % Count %
SNAAP 2011 Aggregate Frequency Report
Institutional Experiences
All SNAAP High
School Institutions
All SNAAP
Undergraduate
Institutions
All SNAAP
Graduate
Institutions
Very dissatisfied 224 9% 4,710 21% 1,161 16%
Somewhat dissatisfied 481 20% 6,090 27% 1,508 21%
Somewhat satisfied 529 22% 5,204 23% 1,701 24%
Very satisfied 393 16% 3,628 16% 1,436 20%
Not relevant 809 33% 2,642 12% 1,348 19%
Total 2,436 100% 22,274 100% 7,154 100%
Very dissatisfied 119 5% 3,443 15% 911 13%
Somewhat dissatisfied 388 16% 6,096 27% 1,632 23%
Somewhat satisfied 844 35% 7,218 32% 2,447 34%
Very satisfied 803 33% 3,371 15% 1,462 20%
Not relevant 279 11% 2,156 10% 714 10%
Total 2,433 100% 22,284 100% 7,166 100%
Very dissatisfied 55 2% 1,802 8% 710 10%
Somewhat dissatisfied 84 3% 3,414 15% 1,028 14%
Somewhat satisfied 419 17% 7,765 35% 2,459 34%
Very satisfied 1,870 77% 8,957 40% 2,848 40%
Not relevant 9 0% 365 2% 142 2%
Total 2,437 100% 22,303 100% 7,187 100%
Very dissatisfied 54 2% 1,113 5% 438 6%
Somewhat dissatisfied 134 6% 2,515 11% 728 10%
Somewhat satisfied 504 21% 7,807 35% 2,115 30%
Very satisfied 1,714 70% 10,197 46% 3,618 51%
Not relevant 26 1% 639 3% 261 4%
Total 2,432 100% 22,271 100% 7,160 100%
instnetwk
instattach
12.8. Opportunities to network with alumni and others
12.9. Sense of belonging and attachment
instintn12. At your institution, satisfaction with: (continued)
12.7. Opportunities for degree-related
internships or work
12.10. Freedom and encouragement to take
risks
instfreedom
22
Variable Response Options Count % Count % Count %
SNAAP 2011 Aggregate Frequency Report
Institutional Experiences
All SNAAP High
School Institutions
All SNAAP
Undergraduate
Institutions
All SNAAP
Graduate
Institutions
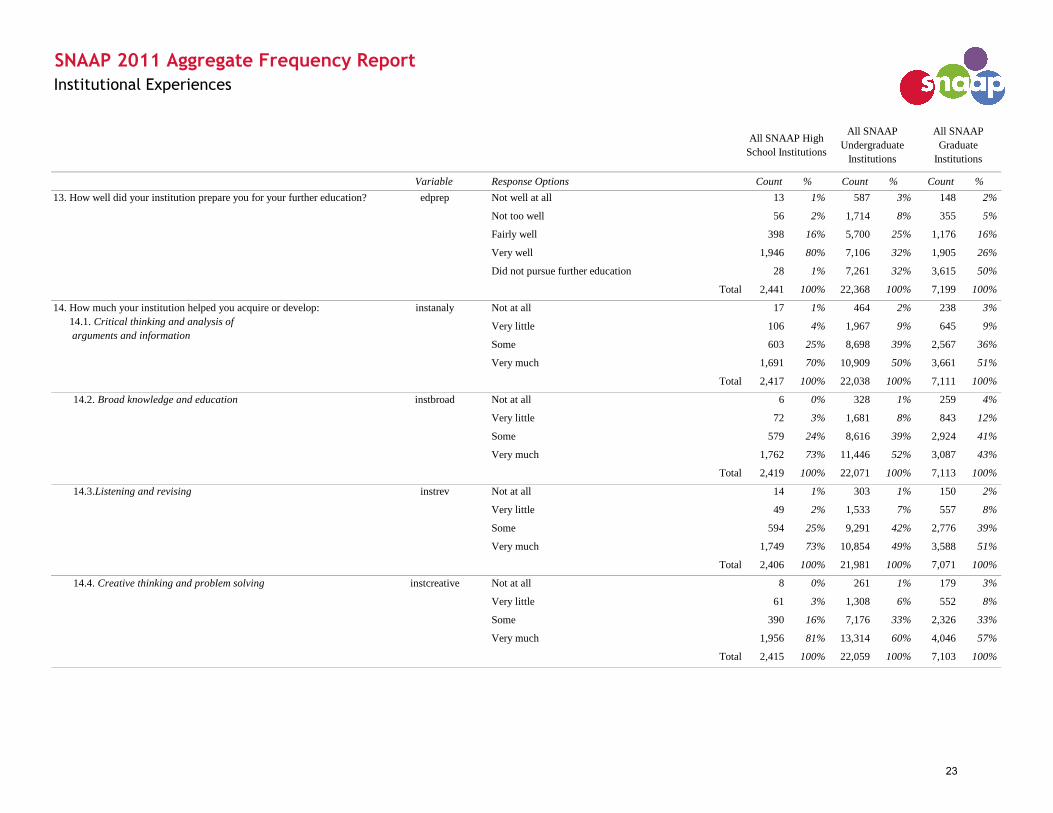
Not well at all 13 1% 587 3% 148 2%
Not too well 56 2% 1,714 8% 355 5%
Fairly well 398 16% 5,700 25% 1,176 16%
Very well 1,946 80% 7,106 32% 1,905 26%
Did not pursue further education 28 1% 7,261 32% 3,615 50%
Total 2,441 100% 22,368 100% 7,199 100%
Not at all 17 1% 464 2% 238 3%
Very little 106 4% 1,967 9% 645 9%
Some 603 25% 8,698 39% 2,567 36%
Very much 1,691 70% 10,909 50% 3,661 51%
Total 2,417 100% 22,038 100% 7,111 100%
Not at all 6 0% 328 1% 259 4%
Very little 72 3% 1,681 8% 843 12%
Some 579 24% 8,616 39% 2,924 41%
Very much 1,762 73% 11,446 52% 3,087 43%
Total 2,419 100% 22,071 100% 7,113 100%
Not at all 14 1% 303 1% 150 2%
Very little 49 2% 1,533 7% 557 8%
Some 594 25% 9,291 42% 2,776 39%
Very much 1,749 73% 10,854 49% 3,588 51%
Total 2,406 100% 21,981 100% 7,071 100%
Not at all 8 0% 261 1% 179 3%
Very little 61 3% 1,308 6% 552 8%
Some 390 16% 7,176 33% 2,326 33%
Very much 1,956 81% 13,314 60% 4,046 57%
Total 2,415 100% 22,059 100% 7,103 100%
13. How well did your institution prepare you for your further education? edprep
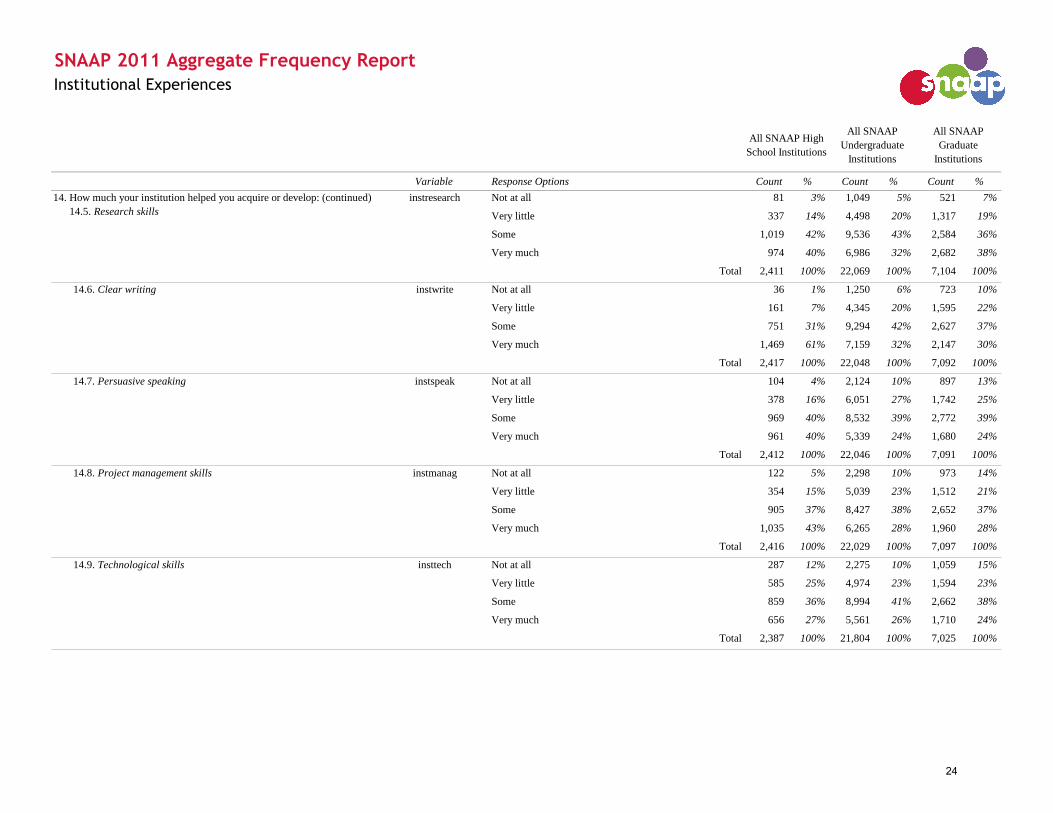
14. How much your institution helped you acquire or develop:
14.1. Critical thinking and analysis of
arguments and information
instanaly
14.2. Broad knowledge and education instbroad
14.3.Listening and revising instrev
14.4. Creative thinking and problem solving instcreative
23
Variable Response Options Count % Count % Count %
SNAAP 2011 Aggregate Frequency Report
Institutional Experiences
All SNAAP High
School Institutions
All SNAAP
Undergraduate
Institutions
All SNAAP
Graduate
Institutions
Not at all 81 3% 1,049 5% 521 7%
Very little 337 14% 4,498 20% 1,317 19%
Some 1,019 42% 9,536 43% 2,584 36%
Very much 974 40% 6,986 32% 2,682 38%
Total 2,411 100% 22,069 100% 7,104 100%
Not at all 36 1% 1,250 6% 723 10%
Very little 161 7% 4,345 20% 1,595 22%
Some 751 31% 9,294 42% 2,627 37%
Very much 1,469 61% 7,159 32% 2,147 30%
Total 2,417 100% 22,048 100% 7,092 100%
Not at all 104 4% 2,124 10% 897 13%
Very little 378 16% 6,051 27% 1,742 25%
Some 969 40% 8,532 39% 2,772 39%
Very much 961 40% 5,339 24% 1,680 24%
Total 2,412 100% 22,046 100% 7,091 100%
Not at all 122 5% 2,298 10% 973 14%
Very little 354 15% 5,039 23% 1,512 21%
Some 905 37% 8,427 38% 2,652 37%
Very much 1,035 43% 6,265 28% 1,960 28%
Total 2,416 100% 22,029 100% 7,097 100%
Not at all 287 12% 2,275 10% 1,059 15%
Very little 585 25% 4,974 23% 1,594 23%
Some 859 36% 8,994 41% 2,662 38%
Very much 656 27% 5,561 26% 1,710 24%
Total 2,387 100% 21,804 100% 7,025 100%
14.7. Persuasive speaking instspeak
14.8. Project management skills instmanag
14. How much your institution helped you acquire or develop: (continued)
14.5. Research skills
instresearch
14.6. Clear writing instwrite
14.9. Technological skills insttech
24
Variable Response Options Count % Count % Count %
SNAAP 2011 Aggregate Frequency Report
Institutional Experiences
All SNAAP High
School Institutions
All SNAAP
Undergraduate
Institutions
All SNAAP
Graduate
Institutions
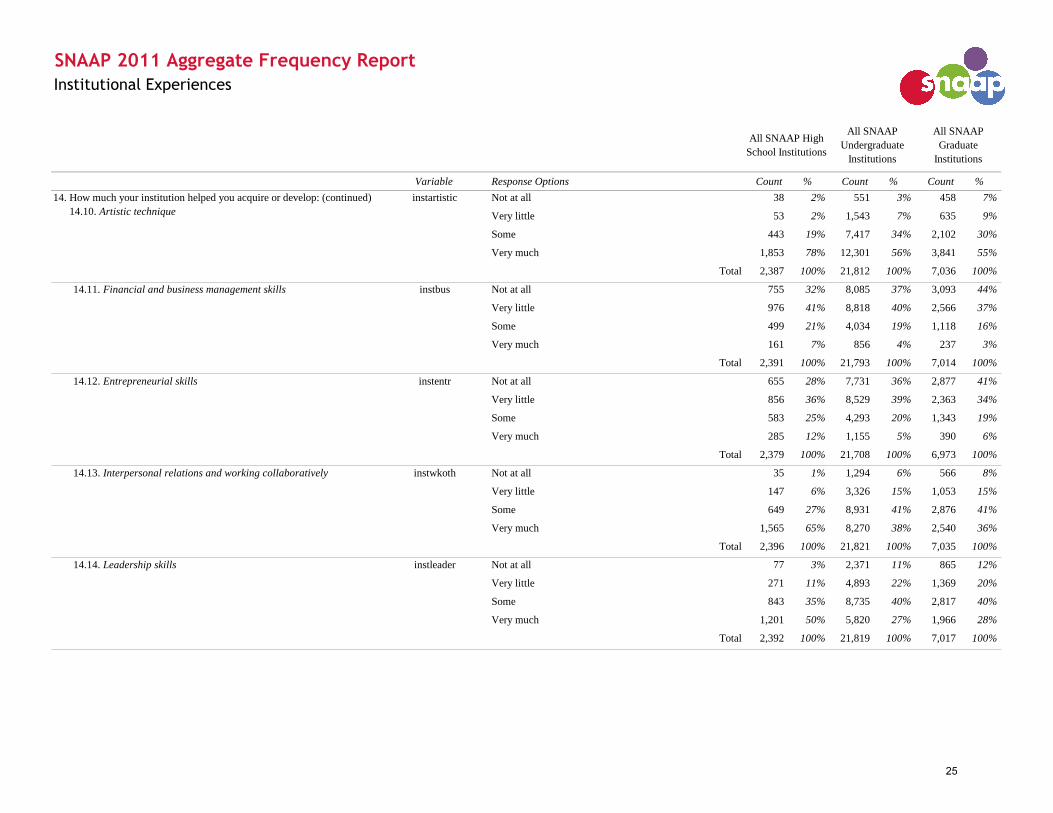
Not at all 38 2% 551 3% 458 7%
Very little 53 2% 1,543 7% 635 9%
Some 443 19% 7,417 34% 2,102 30%
Very much 1,853 78% 12,301 56% 3,841 55%
Total 2,387 100% 21,812 100% 7,036 100%
Not at all 755 32% 8,085 37% 3,093 44%
Very little 976 41% 8,818 40% 2,566 37%
Some 499 21% 4,034 19% 1,118 16%
Very much 161 7% 856 4% 237 3%
Total 2,391 100% 21,793 100% 7,014 100%
Not at all 655 28% 7,731 36% 2,877 41%
Very little 856 36% 8,529 39% 2,363 34%
Some 583 25% 4,293 20% 1,343 19%
Very much 285 12% 1,155 5% 390 6%
Total 2,379 100% 21,708 100% 6,973 100%
Not at all 35 1% 1,294 6% 566 8%
Very little 147 6% 3,326 15% 1,053 15%
Some 649 27% 8,931 41% 2,876 41%
Very much 1,565 65% 8,270 38% 2,540 36%
Total 2,396 100% 21,821 100% 7,035 100%
Not at all 77 3% 2,371 11% 865 12%
Very little 271 11% 4,893 22% 1,369 20%
Some 843 35% 8,735 40% 2,817 40%
Very much 1,201 50% 5,820 27% 1,966 28%
Total 2,392 100% 21,819 100% 7,017 100%
instentr
14.13. Interpersonal relations and working collaboratively instwkoth
14.14. Leadership skills instleader
14. How much your institution helped you acquire or develop: (continued)
14.10. Artistic technique
instartistic
14.11. Financial and business management skills instbus
14.12. Entrepreneurial skills
25
Variable Response Options Count % Count % Count %
SNAAP 2011 Aggregate Frequency Report
Institutional Experiences
All SNAAP High
School Institutions
All SNAAP
Undergraduate
Institutions
All SNAAP
Graduate
Institutions
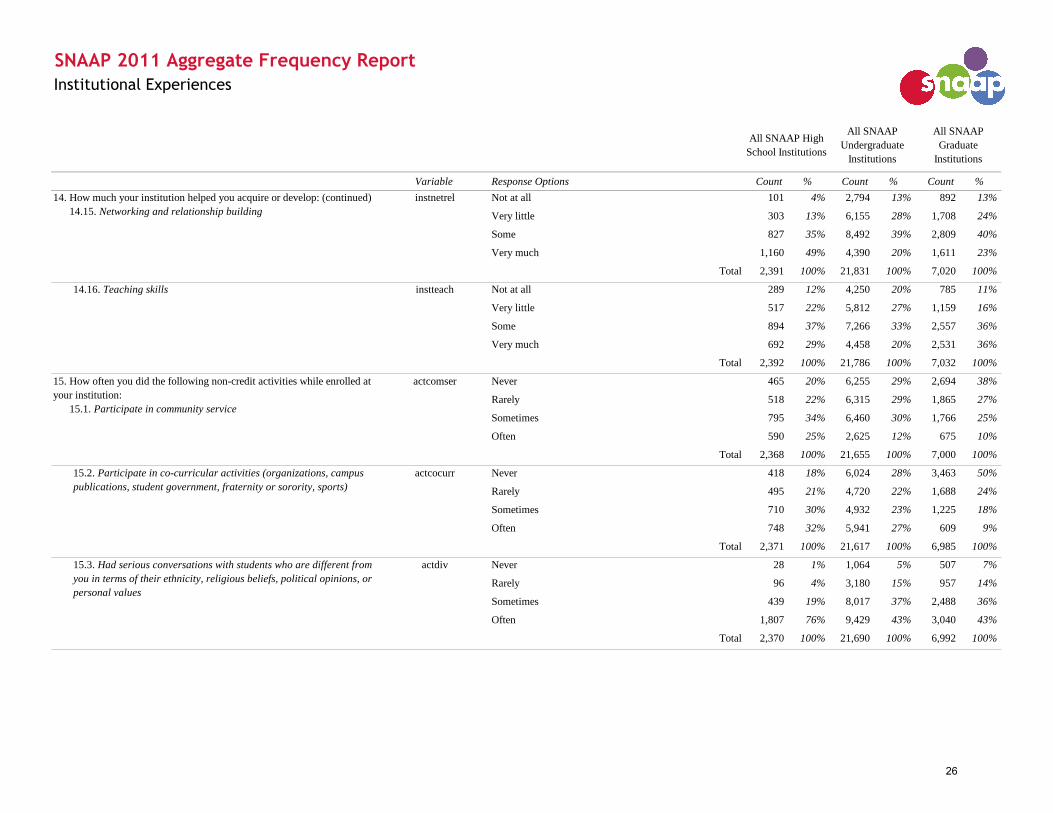
Not at all 101 4% 2,794 13% 892 13%
Very little 303 13% 6,155 28% 1,708 24%
Some 827 35% 8,492 39% 2,809 40%
Very much 1,160 49% 4,390 20% 1,611 23%
Total 2,391 100% 21,831 100% 7,020 100%
Not at all 289 12% 4,250 20% 785 11%
Very little 517 22% 5,812 27% 1,159 16%
Some 894 37% 7,266 33% 2,557 36%
Very much 692 29% 4,458 20% 2,531 36%
Total 2,392 100% 21,786 100% 7,032 100%
Never 465 20% 6,255 29% 2,694 38%
Rarely 518 22% 6,315 29% 1,865 27%
Sometimes 795 34% 6,460 30% 1,766 25%
Often 590 25% 2,625 12% 675 10%
Total 2,368 100% 21,655 100% 7,000 100%
Never 418 18% 6,024 28% 3,463 50%
Rarely 495 21% 4,720 22% 1,688 24%
Sometimes 710 30% 4,932 23% 1,225 18%
Often 748 32% 5,941 27% 609 9%
Total 2,371 100% 21,617 100% 6,985 100%
Never 28 1% 1,064 5% 507 7%
Rarely 96 4% 3,180 15% 957 14%
Sometimes 439 19% 8,017 37% 2,488 36%
Often 1,807 76% 9,429 43% 3,040 43%
Total 2,370 100% 21,690 100% 6,992 100%
14. How much your institution helped you acquire or develop: (continued)
14.15. Networking and relationship building
instnetrel
14.16. Teaching skills instteach
15. How often you did the following non-credit activities while enrolled at
your institution:
15.1. Participate in community service
actcomser
15.2. Participate in co-curricular activities (organizations, campus
publications, student government, fraternity or sorority, sports)
actcocurr
15.3. Had serious conversations with students who are different from
you in terms of their ethnicity, religious beliefs, political opinions, or
personal values
actdiv
26

Variable Response Options Count % Count % Count %
SNAAP 2011 Aggregate Frequency Report
Institutional Experiences
All SNAAP High
School Institutions
All SNAAP
Undergraduate
Institutions
All SNAAP
Graduate
Institutions
No 613 26% 9,460 43% 1,965 28%
Yes 1,765 74% 12,311 57% 5,061 72%
Total 2,378 100% 21,771 100% 7,026 100%
No 1,364 58% 15,063 69% 4,150 59%
Yes 1,006 42% 6,662 31% 2,866 41%
Total 2,370 100% 21,725 100% 7,016 100%
No 2,228 94% 17,734 82% 6,136 88%
Yes 145 6% 3,960 18% 859 12%
Total 2,373 100% 21,694 100% 6,995 100%
No 2,190 93% 14,461 67% 5,351 77%
Yes 170 7% 7,151 33% 1,630 23%
Total 2,360 100% 21,612 100% 6,981 100%
No 1,375 58% 9,947 46% 3,354 48%
Yes 990 42% 11,728 54% 3,637 52%
Total 2,365 100% 21,675 100% 6,991 100%
suptadv Have not used 1,043 45% 13,892 66% 4,722 70%
Used 263 11% 1,668 8% 361 5%
Uncertain if service is available 1,000 43% 5,417 26% 1,658 25%
Total 2,306 100% 20,977 100% 6,741 100%
suptcareer Have not used 1,062 46% 12,638 60% 4,045 60%
Used 123 5% 3,822 18% 1,412 21%
Uncertain if service is available 1,122 49% 4,494 21% 1,302 19%
Total 2,307 100% 20,954 100% 6,759 100%
suptedu Have not used 1,101 48% 14,861 71% 4,794 71%
Used 181 8% 1,974 9% 534 8%
Uncertain if service is available 1,011 44% 4,082 20% 1,397 21%
Total 2,293 100% 20,917 100% 6,725 100%
16. Did you do the following activities while at your institution?
16.1. Work with a faculty member on a project
18. Since leaving your institution, support services that you have used:
18.1. Advising for further education
18.2. Career services
18.3. Continuing education and training
16.5. Complete a portfolio (a document/record of your cumulative
artistic work)
actport
16.4. Internship actintn
actfac
16.2. Work with an artist in the community actartist
16.3. Study abroad actabroad
27
Variable Response Options Count % Count % Count %
SNAAP 2011 Aggregate Frequency Report
Institutional Experiences
All SNAAP High
School Institutions
All SNAAP
Undergraduate
Institutions
All SNAAP
Graduate
Institutions
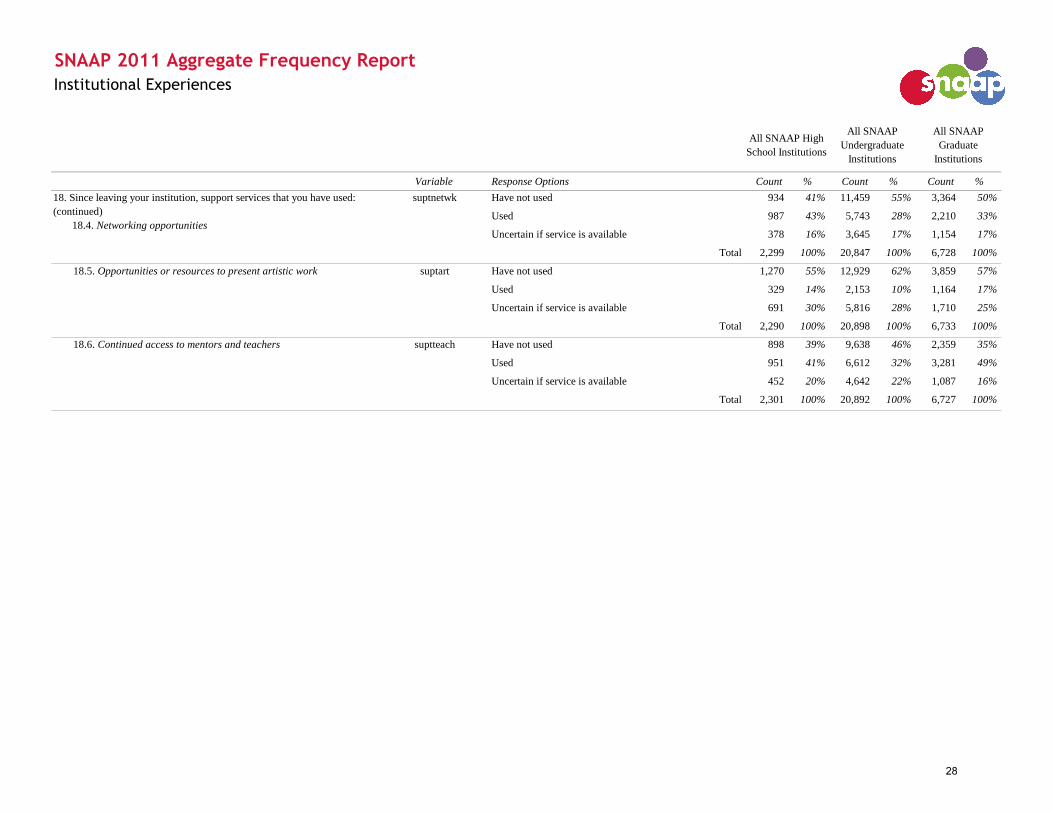
suptnetwk Have not used 934 41% 11,459 55% 3,364 50%
Used 987 43% 5,743 28% 2,210 33%
Uncertain if service is available 378 16% 3,645 17% 1,154 17%
Total 2,299 100% 20,847 100% 6,728 100%
suptart Have not used 1,270 55% 12,929 62% 3,859 57%
Used 329 14% 2,153 10% 1,164 17%
Uncertain if service is available 691 30% 5,816 28% 1,710 25%
Total 2,290 100% 20,898 100% 6,733 100%
suptteach Have not used 898 39% 9,638 46% 2,359 35%
Used 951 41% 6,612 32% 3,281 49%
Uncertain if service is available 452 20% 4,642 22% 1,087 16%
Total 2,301 100% 20,892 100% 6,727 100%
18.6. Continued access to mentors and teachers
18. Since leaving your institution, support services that you have used:
(continued)
18.4. Networking opportunities
18.5. Opportunities or resources to present artistic work
28
Variable Response Options Count % Count % Count %
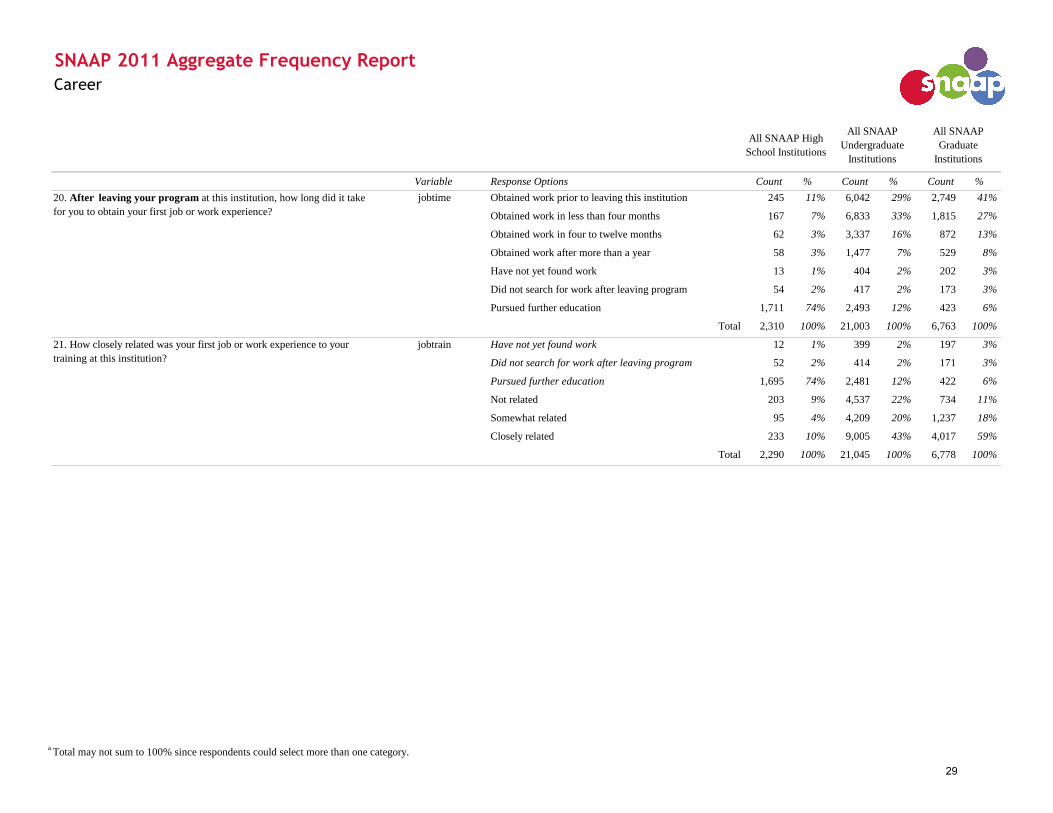
jobtime Obtained work prior to leaving this institution 245 11% 6,042 29% 2,749 41%
Obtained work in less than four months 167 7% 6,833 33% 1,815 27%
Obtained work in four to twelve months 62 3% 3,337 16% 872 13%
Obtained work after more than a year 58 3% 1,477 7% 529 8%
Have not yet found work 13 1% 404 2% 202 3%
Did not search for work after leaving program 54 2% 417 2% 173 3%
Pursued further education 1,711 74% 2,493 12% 423 6%
Total 2,310 100% 21,003 100% 6,763 100%
jobtrain Have not yet found work 12 1% 399 2% 197 3%
Did not search for work after leaving program 52 2% 414 2% 171 3%
Pursued further education 1,695 74% 2,481 12% 422 6%
Not related 203 9% 4,537 22% 734 11%
Somewhat related 95 4% 4,209 20% 1,237 18%
Closely related 233 10% 9,005 43% 4,017 59%
Total 2,290 100% 21,045 100% 6,778 100%
20. After leaving your program at this institution, how long did it take
for you to obtain your first job or work experience?
21. How closely related was your first job or work experience to your
training at this institution?
SNAAP 2011 Aggregate Frequency Report
Career
All SNAAP High
School Institutions
All SNAAP
Undergraduate
Institutions
All SNAAP
Graduate
Institutions
a Total may not sum to 100% since respondents could select more than one category.
29
Variable Response Options Count % Count % Count %
SNAAP 2011 Aggregate Frequency Report
Career
All SNAAP High
School Institutions
All SNAAP
Undergraduate
Institutions
All SNAAP
Graduate
Institutions
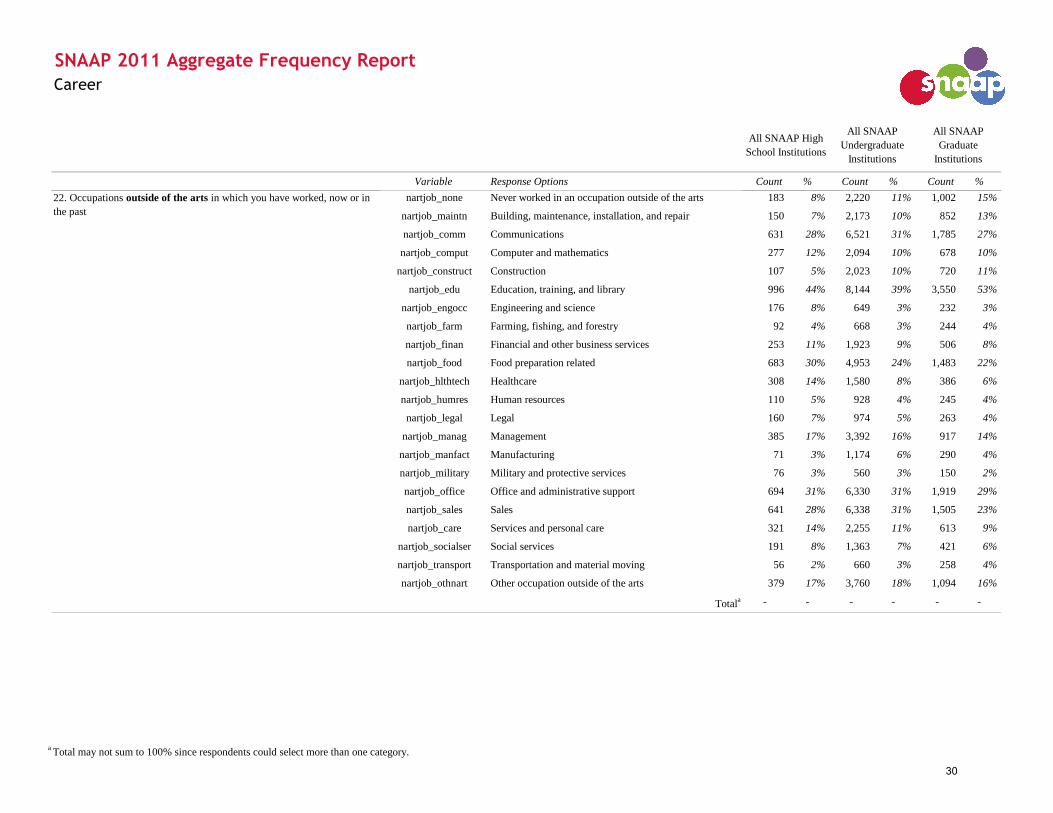
nartjob_none Never worked in an occupation outside of the arts 183 8% 2,220 11% 1,002 15%
nartjob_maintn Building, maintenance, installation, and repair 150 7% 2,173 10% 852 13%
nartjob_comm Communications 631 28% 6,521 31% 1,785 27%
nartjob_comput Computer and mathematics 277 12% 2,094 10% 678 10%
nartjob_construct Construction 107 5% 2,023 10% 720 11%
nartjob_edu Education, training, and library 996 44% 8,144 39% 3,550 53%
nartjob_engocc Engineering and science 176 8% 649 3% 232 3%
nartjob_farm Farming, fishing, and forestry 92 4% 668 3% 244 4%
nartjob_finan Financial and other business services 253 11% 1,923 9% 506 8%
nartjob_food Food preparation related 683 30% 4,953 24% 1,483 22%
nartjob_hlthtech Healthcare 308 14% 1,580 8% 386 6%
nartjob_humres Human resources 110 5% 928 4% 245 4%
nartjob_legal Legal 160 7% 974 5% 263 4%
nartjob_manag Management 385 17% 3,392 16% 917 14%
nartjob_manfact Manufacturing 71 3% 1,174 6% 290 4%
nartjob_military Military and protective services 76 3% 560 3% 150 2%
nartjob_office Office and administrative support 694 31% 6,330 31% 1,919 29%
nartjob_sales Sales 641 28% 6,338 31% 1,505 23%
nartjob_care Services and personal care 321 14% 2,255 11% 613 9%
nartjob_socialser Social services 191 8% 1,363 7% 421 6%
nartjob_transport Transportation and material moving 56 2% 660 3% 258 4%
nartjob_othnart Other occupation outside of the arts 379 17% 3,760 18% 1,094 16%
Totala - - - - - -
22. Occupations outside of the arts in which you have worked, now or in
the past
a Total may not sum to 100% since respondents could select more than one category.
30
Variable Response Options Count % Count % Count %
SNAAP 2011 Aggregate Frequency Report
Career
All SNAAP High
School Institutions
All SNAAP
Undergraduate
Institutions
All SNAAP
Graduate
Institutions
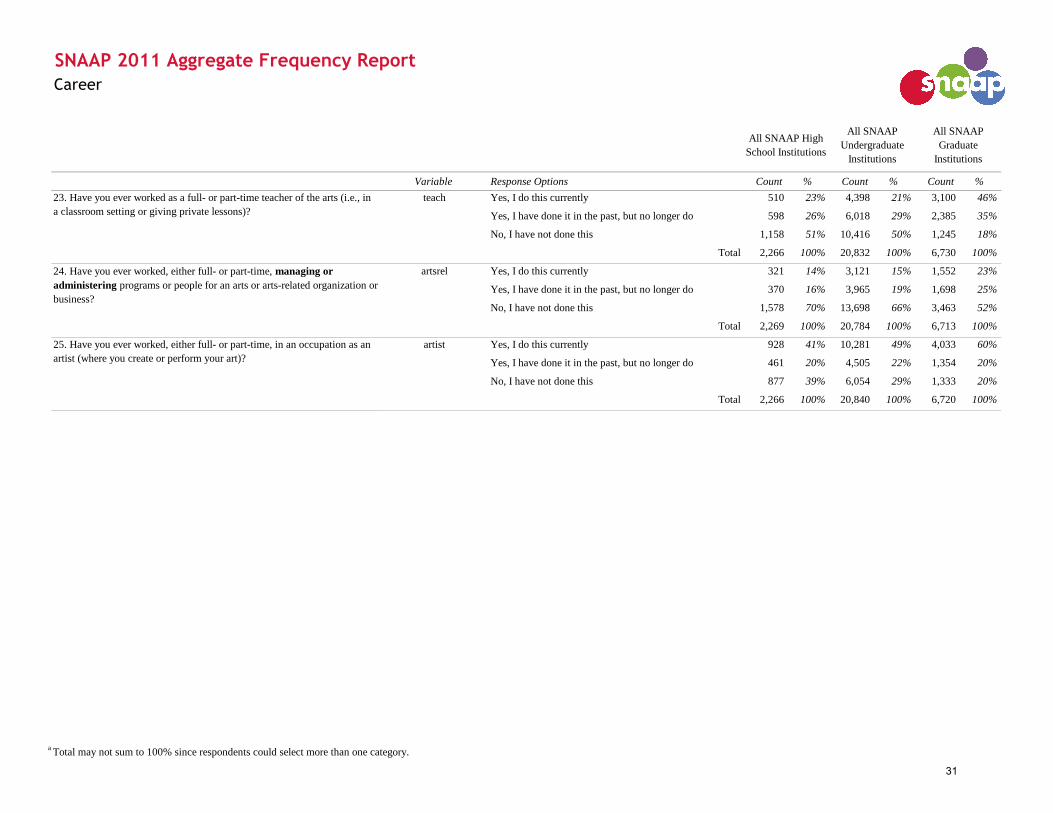
Yes, I do this currently 510 23% 4,398 21% 3,100 46%
Yes, I have done it in the past, but no longer do 598 26% 6,018 29% 2,385 35%
No, I have not done this 1,158 51% 10,416 50% 1,245 18%
Total 2,266 100% 20,832 100% 6,730 100%
Yes, I do this currently 321 14% 3,121 15% 1,552 23%
Yes, I have done it in the past, but no longer do 370 16% 3,965 19% 1,698 25%
No, I have not done this 1,578 70% 13,698 66% 3,463 52%
Total 2,269 100% 20,784 100% 6,713 100%
Yes, I do this currently 928 41% 10,281 49% 4,033 60%
Yes, I have done it in the past, but no longer do 461 20% 4,505 22% 1,354 20%
No, I have not done this 877 39% 6,054 29% 1,333 20%
Total 2,266 100% 20,840 100% 6,720 100%
23. Have you ever worked as a full- or part-time teacher of the arts (i.e., in
a classroom setting or giving private lessons)?
teach
24. Have you ever worked, either full- or part-time, managing or
administering programs or people for an arts or arts-related organization or
business?
artsrel
25. Have you ever worked, either full- or part-time, in an occupation as an
artist (where you create or perform your art)?
artist
a Total may not sum to 100% since respondents could select more than one category.
31

Variable Response Options Count % Count % Count %
SNAAP 2011 Aggregate Frequency Report
Career
All SNAAP High
School Institutions
All SNAAP
Undergraduate
Institutions
All SNAAP
Graduate
Institutions
26. Occupations associated with the arts in which you have worked, now
or in the past artjob_none Never worked in an occupation associated with the arts 508 23% 1,806 9% 200 3%
Architecture: artjob_arch Architect 29 1% 1,196 6% 484 7%
Arts Administration: artjob_artadm Arts administrator or manager 396 18% 3,373 16% 1,637 25%
artjob_curator Museum or gallery worker, including curator 130 6% 2,341 11% 1,016 15%
Design: artjob_graphicdes Graphic designer, illustrator, or art director 189 9% 5,595 27% 1,058 16%
artjob_intdes Interior designer 34 2% 1,337 6% 268 4%
artjob_webdes Web designer 138 6% 2,429 12% 622 9%
artjob_othdes Other designer 104 5% 2,085 10% 610 9%
Education: artjob_tchhied Higher education arts educator 253 11% 2,969 14% 3,134 47%
artjob_tchk12 K-12 arts educator 358 16% 4,112 20% 1,693 25%
artjob_prvttch Private teacher of the arts 580 26% 3,972 19% 2,048 31%
artjob_othtch Other arts educator 169 8% 1,942 9% 691 10%
Fine and Media Arts: artjob_craft Craft artist 98 4% 2,097 10% 484 7%
artjob_finart Fine artist 123 6% 3,562 17% 1,292 19%
artjob_film Film, TV, video artist 199 9% 2,610 13% 841 13%
artjob_animator Multi-media artist or animator 64 3% 1,226 6% 485 7%
artjob_photo Photographer 158 7% 2,672 13% 717 11%
Performance: artjob_actor Actor 303 14% 2,178 11% 770 12%
artjob_choreo Dancer or choreographer 239 11% 1,082 5% 365 5%
artjob_sound Engineer or technician (sound, light, other) 126 6% 895 4% 321 5%
artjob_musician Musician 750 34% 3,917 19% 2,436 36%
artjob_stage Theater and stage director, or producer 185 8% 1,516 7% 777 12%
Writing: artjob_writer Writer, author, or editor 429 19% 4,015 20% 1,775 27%
Other: artjob_othart Other occupation associated with the arts 252 11% 3,150 15% 975 15%
Totala - - - - - -
a Total may not sum to 100% since respondents could select more than one category.
32
Variable Response Options Count % Count % Count %
SNAAP 2011 Aggregate Frequency Report
Career
All SNAAP High
School Institutions
All SNAAP
Undergraduate
Institutions
All SNAAP
Graduate
Institutions
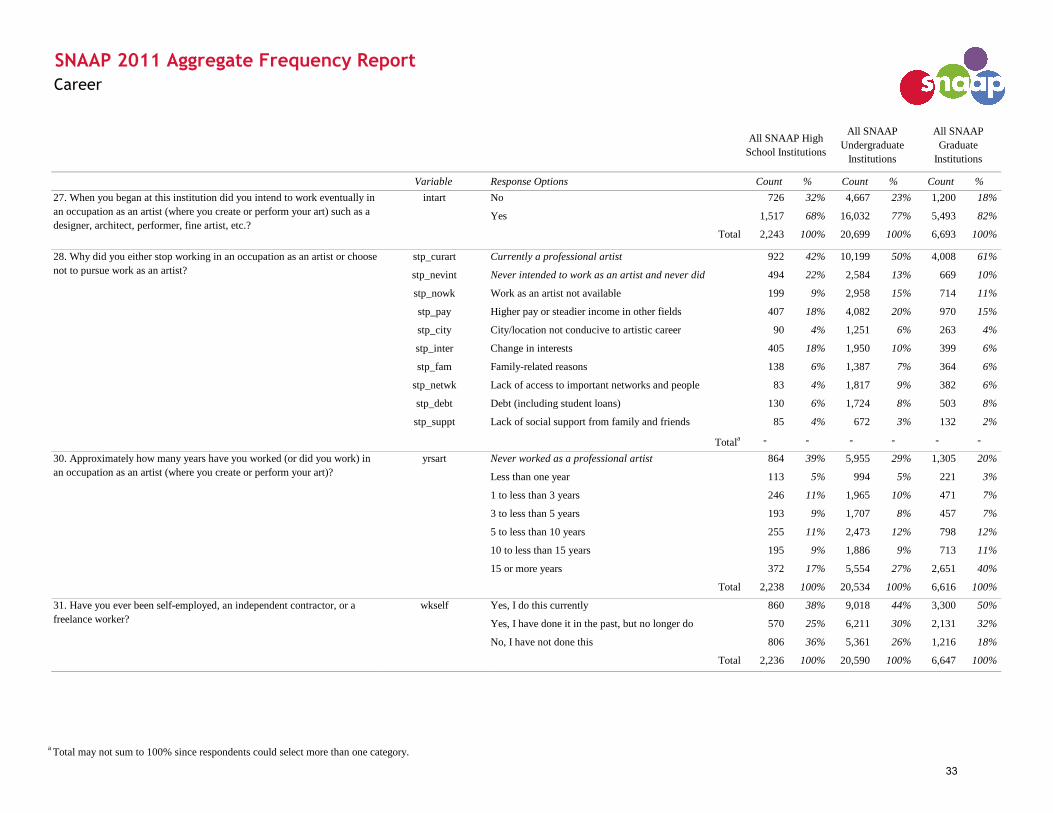
intart No 726 32% 4,667 23% 1,200 18%
Yes 1,517 68% 16,032 77% 5,493 82%
Total 2,243 100% 20,699 100% 6,693 100%
stp_curart Currently a professional artist 922 42% 10,199 50% 4,008 61%
stp_nevint Never intended to work as an artist and never did 494 22% 2,584 13% 669 10%
stp_nowk Work as an artist not available 199 9% 2,958 15% 714 11%
stp_pay Higher pay or steadier income in other fields 407 18% 4,082 20% 970 15%
stp_city City/location not conducive to artistic career 90 4% 1,251 6% 263 4%
stp_inter Change in interests 405 18% 1,950 10% 399 6%
stp_fam Family-related reasons 138 6% 1,387 7% 364 6%
stp_netwk Lack of access to important networks and people 83 4% 1,817 9% 382 6%
stp_debt Debt (including student loans) 130 6% 1,724 8% 503 8%
stp_suppt Lack of social support from family and friends 85 4% 672 3% 132 2%
Totala - - - - - -
yrsart Never worked as a professional artist 864 39% 5,955 29% 1,305 20%
Less than one year 113 5% 994 5% 221 3%
1 to less than 3 years 246 11% 1,965 10% 471 7%
3 to less than 5 years 193 9% 1,707 8% 457 7%
5 to less than 10 years 255 11% 2,473 12% 798 12%
10 to less than 15 years 195 9% 1,886 9% 713 11%
15 or more years 372 17% 5,554 27% 2,651 40%
Total 2,238 100% 20,534 100% 6,616 100%
wkself Yes, I do this currently 860 38% 9,018 44% 3,300 50%
Yes, I have done it in the past, but no longer do 570 25% 6,211 30% 2,131 32%
No, I have not done this 806 36% 5,361 26% 1,216 18%
Total 2,236 100% 20,590 100% 6,647 100%
27. When you began at this institution did you intend to work eventually in
an occupation as an artist (where you create or perform your art) such as a
designer, architect, performer, fine artist, etc.?
30. Approximately how many years have you worked (or did you work) in
an occupation as an artist (where you create or perform your art)?
31. Have you ever been self-employed, an independent contractor, or a
freelance worker?
28. Why did you either stop working in an occupation as an artist or choose
not to pursue work as an artist?
a Total may not sum to 100% since respondents could select more than one category.
33
Variable Response Options Count % Count % Count %
SNAAP 2011 Aggregate Frequency Report
Career
All SNAAP High
School Institutions
All SNAAP
Undergraduate
Institutions
All SNAAP
Graduate
Institutions
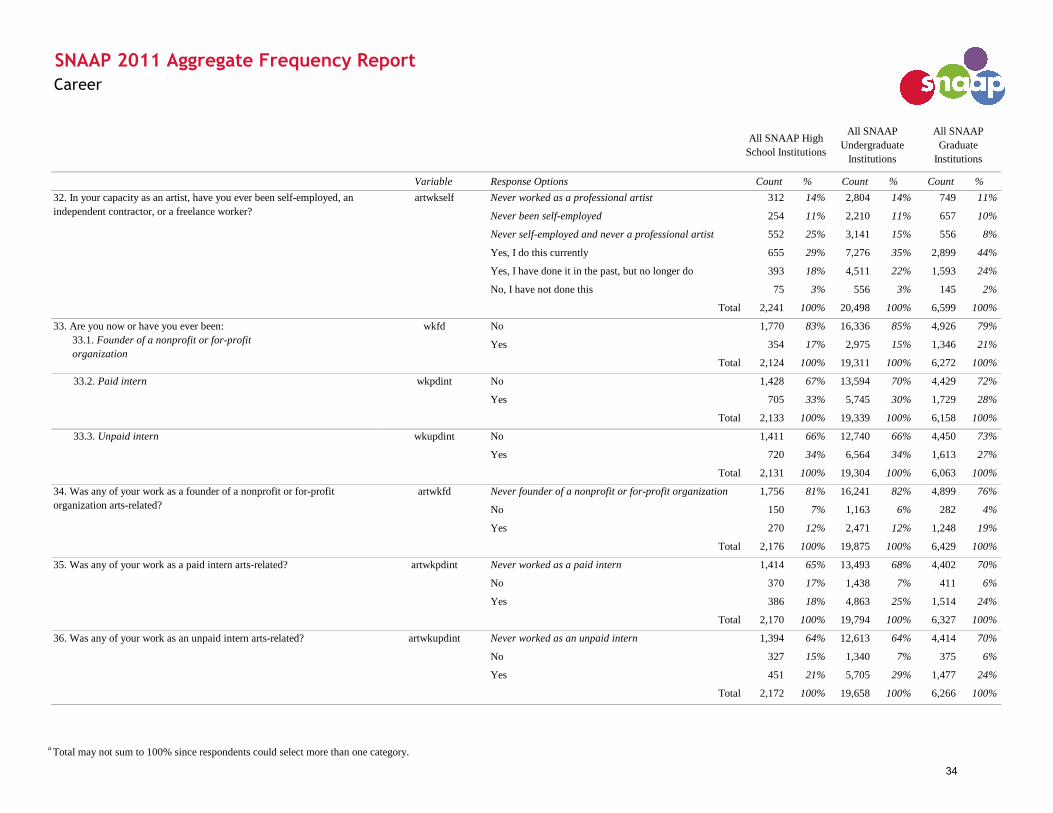
Never worked as a professional artist 312 14% 2,804 14% 749 11%
Never been self-employed 254 11% 2,210 11% 657 10%
Never self-employed and never a professional artist 552 25% 3,141 15% 556 8%
Yes, I do this currently 655 29% 7,276 35% 2,899 44%
Yes, I have done it in the past, but no longer do 393 18% 4,511 22% 1,593 24%
No, I have not done this 75 3% 556 3% 145 2%
Total 2,241 100% 20,498 100% 6,599 100%
wkfd No 1,770 83% 16,336 85% 4,926 79%
Yes 354 17% 2,975 15% 1,346 21%
Total 2,124 100% 19,311 100% 6,272 100%
wkpdint No 1,428 67% 13,594 70% 4,429 72%
Yes 705 33% 5,745 30% 1,729 28%
Total 2,133 100% 19,339 100% 6,158 100%
wkupdint No 1,411 66% 12,740 66% 4,450 73%
Yes 720 34% 6,564 34% 1,613 27%
Total 2,131 100% 19,304 100% 6,063 100%
artwkfd Never founder of a nonprofit or for-profit organization 1,756 81% 16,241 82% 4,899 76%
No 150 7% 1,163 6% 282 4%
Yes 270 12% 2,471 12% 1,248 19%
Total 2,176 100% 19,875 100% 6,429 100%
artwkpdint Never worked as a paid intern 1,414 65% 13,493 68% 4,402 70%
No 370 17% 1,438 7% 411 6%
Yes 386 18% 4,863 25% 1,514 24%
Total 2,170 100% 19,794 100% 6,327 100%
artwkupdint Never worked as an unpaid intern 1,394 64% 12,613 64% 4,414 70%
No 327 15% 1,340 7% 375 6%
Yes 451 21% 5,705 29% 1,477 24%
Total 2,172 100% 19,658 100% 6,266 100%
artwkself
33. Are you now or have you ever been:
33.1. Founder of a nonprofit or for-profit
organization
33.2. Paid intern
33.3. Unpaid intern
34. Was any of your work as a founder of a nonprofit or for-profit
organization arts-related?
35. Was any of your work as a paid intern arts-related?
36. Was any of your work as an unpaid intern arts-related?
32. In your capacity as an artist, have you ever been self-employed, an
independent contractor, or a freelance worker?
a Total may not sum to 100% since respondents could select more than one category.
34

Variable Response Options Count % Count % Count %
SNAAP 2011 Aggregate Frequency Report
Career
All SNAAP High
School Institutions
All SNAAP
Undergraduate
Institutions
All SNAAP
Graduate
Institutions
hlp_dnrq Never worked as a professional artist 849 38% 5,842 29% 1,290 20%
hlp_capital Loans, investment capital 389 18% 3,438 17% 1,665 25%
hlp_grants Prizes, grants, or commissions 562 25% 4,576 22% 2,674 41%
hlp_netwk Strong network of peers and colleagues 935 42% 8,829 43% 3,617 55%
hlp_pub Publicity or acknowledgement of your work 603 27% 6,037 30% 2,756 42%
hlp_space Material resources (e.g., equipment, space) 519 23% 5,145 25% 2,241 34%
hlp_mentor Mentors and teachers 1,005 45% 8,354 41% 3,740 57%
hlp_train Additional training 707 32% 5,369 26% 1,900 29%
hlp_city Opportunity to live in an artistically vital city 810 37% 6,855 34% 2,883 44%
hlp_oth Other 71 3% 1,085 5% 432 7%
hlp_none None of these is/was critically helpful 108 5% 1,583 8% 266 4%
Totala - - - - - -
bar_dnrq Never worked as a professional artist 849 39% 5,842 29% 1,290 20%
bar_capital Loans, investment capital 499 23% 4,853 24% 1,784 27%
bar_grants Prizes, grants, or commissions 536 24% 5,427 27% 2,312 35%
bar_netwk Strong network of peers and colleagues 297 13% 4,303 21% 1,589 24%
bar_pub Publicity or acknowledgement of your work 399 18% 4,494 22% 1,922 29%
bar_space Material resources (e.g., equipment, space) 447 20% 4,949 24% 1,848 28%
bar_mentor Mentors and teachers 252 11% 3,605 18% 1,171 18%
bar_train Additional training 247 11% 3,676 18% 969 15%
bar_city Opportunity to live in an artistically vital city 293 13% 3,006 15% 1,212 19%
bar_oth Other 82 4% 923 5% 342 5%
bar_none None of these is/was lacking 337 15% 3,197 16% 1,040 16%
Totala - - - - - -
37. Which of the following resources have been critically helpful to you in
achieving success in your artistic career (now or in the past)?
38. Please check the resources that have been lacking at times, thereby
presenting significant barriers to your artistic career (now or in the past)
a Total may not sum to 100% since respondents could select more than one category.
35

Variable Response Options Count % Count % Count %
SNAAP 2011 Aggregate Frequency Report
Career
All SNAAP High
School Institutions
All SNAAP
Undergraduate
Institutions
All SNAAP
Graduate
Institutions
wkskillanaly Never worked in any occupation 7 0% 11 0% 4 0%
Not at all important 17 1% 192 1% 52 1%
Only a little important 38 2% 603 3% 174 3%
Somewhat important 243 11% 3,025 15% 830 13%
Very important 1,869 86% 16,193 81% 5,421 84%
Total 2,174 100% 20,024 100% 6,481 100%
wkskillbroad Never worked in any occupation 7 0% 11 0% 4 0%
Not at all important 13 1% 165 1% 37 1%
Only a little important 52 2% 625 3% 141 2%
Somewhat important 424 19% 4,402 22% 1,029 16%
Very important 1,680 77% 14,827 74% 5,276 81%
Total 2,176 100% 20,030 100% 6,487 100%
wkskillrev Never worked in any occupation 7 0% 11 0% 4 0%
Not at all important 10 0% 100 1% 28 0%
Only a little important 14 1% 274 1% 71 1%
Somewhat important 181 8% 2,367 12% 732 11%
Very important 1,957 90% 17,212 86% 5,630 87%
Total 2,169 100% 19,964 100% 6,465 100%
wkskillcreative Never worked in any occupation 7 0% 11 0% 4 0%
Not at all important 5 0% 90 0% 24 0%
Only a little important 19 1% 211 1% 50 1%
Somewhat important 143 7% 1,328 7% 412 6%
Very important 2,003 92% 18,407 92% 5,991 92%
Total 2,177 100% 20,047 100% 6,481 100%
39.4. Creative thinking and problem solving
39.2. Broad knowledge and education
39.3. Listening and revising
39. The importance of the following to perform effectively in your
profession or work life:
39.1. Critical thinking and analysis of
arguments and information
a Total may not sum to 100% since respondents could select more than one category.
36
Variable Response Options Count % Count % Count %
SNAAP 2011 Aggregate Frequency Report
Career
All SNAAP High
School Institutions
All SNAAP
Undergraduate
Institutions
All SNAAP
Graduate
Institutions
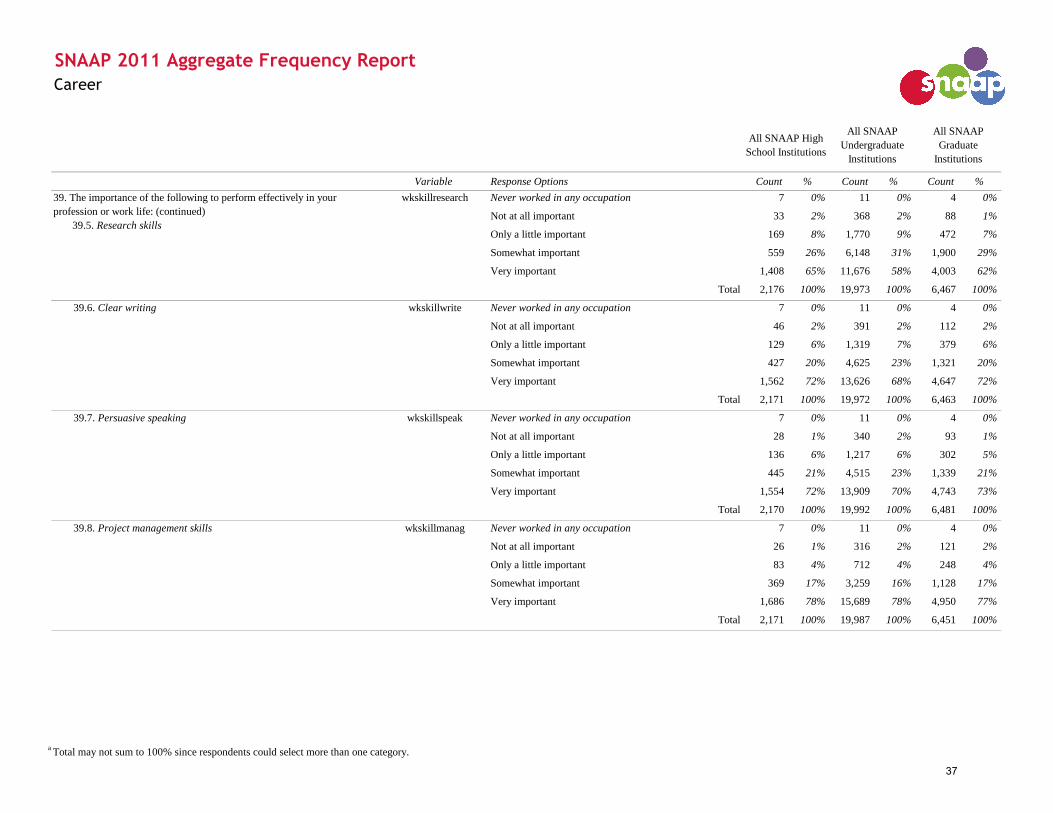
wkskillresearch Never worked in any occupation 7 0% 11 0% 4 0%
Not at all important 33 2% 368 2% 88 1%
Only a little important 169 8% 1,770 9% 472 7%
Somewhat important 559 26% 6,148 31% 1,900 29%
Very important 1,408 65% 11,676 58% 4,003 62%
Total 2,176 100% 19,973 100% 6,467 100%
wkskillwrite Never worked in any occupation 7 0% 11 0% 4 0%
Not at all important 46 2% 391 2% 112 2%
Only a little important 129 6% 1,319 7% 379 6%
Somewhat important 427 20% 4,625 23% 1,321 20%
Very important 1,562 72% 13,626 68% 4,647 72%
Total 2,171 100% 19,972 100% 6,463 100%
wkskillspeak Never worked in any occupation 7 0% 11 0% 4 0%
Not at all important 28 1% 340 2% 93 1%
Only a little important 136 6% 1,217 6% 302 5%
Somewhat important 445 21% 4,515 23% 1,339 21%
Very important 1,554 72% 13,909 70% 4,743 73%
Total 2,170 100% 19,992 100% 6,481 100%
wkskillmanag Never worked in any occupation 7 0% 11 0% 4 0%
Not at all important 26 1% 316 2% 121 2%
Only a little important 83 4% 712 4% 248 4%
Somewhat important 369 17% 3,259 16% 1,128 17%
Very important 1,686 78% 15,689 78% 4,950 77%
Total 2,171 100% 19,987 100% 6,451 100%
39. The importance of the following to perform effectively in your
profession or work life: (continued)
39.5. Research skills
39.7. Persuasive speaking
39.8. Project management skills
39.6. Clear writing
a Total may not sum to 100% since respondents could select more than one category.
37
Variable Response Options Count % Count % Count %
SNAAP 2011 Aggregate Frequency Report
Career
All SNAAP High
School Institutions
All SNAAP
Undergraduate
Institutions
All SNAAP
Graduate
Institutions
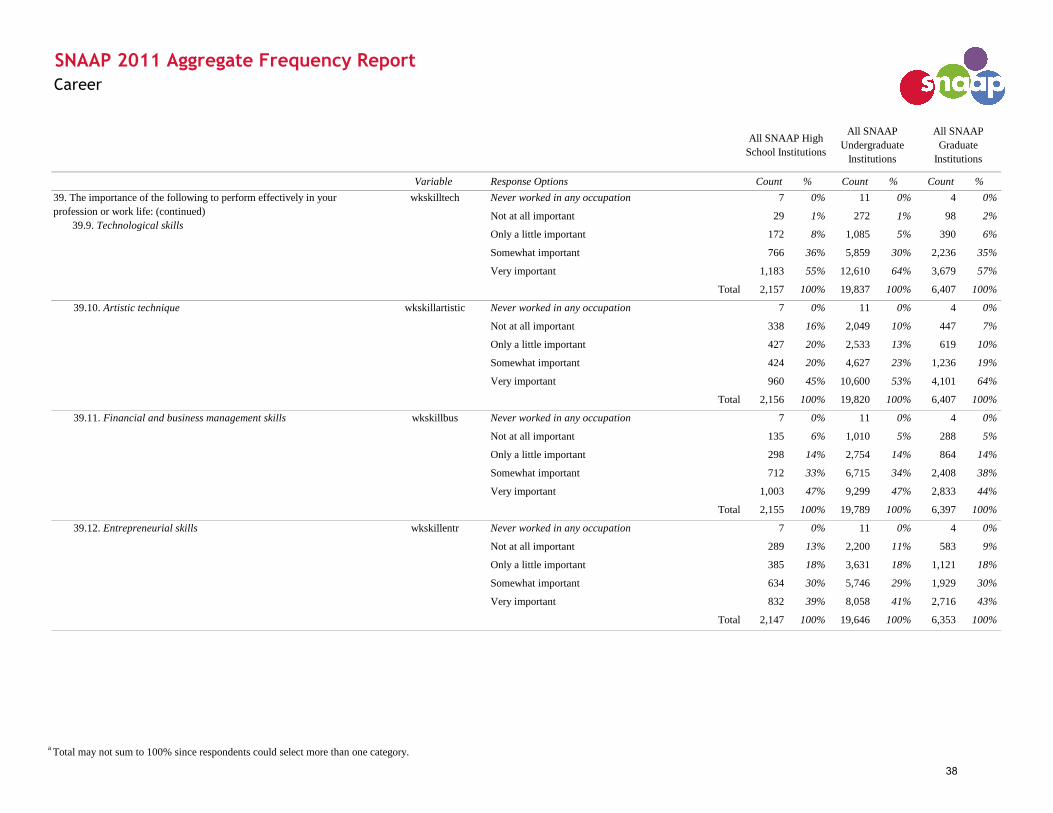
wkskilltech Never worked in any occupation 7 0% 11 0% 4 0%
Not at all important 29 1% 272 1% 98 2%
Only a little important 172 8% 1,085 5% 390 6%
Somewhat important 766 36% 5,859 30% 2,236 35%
Very important 1,183 55% 12,610 64% 3,679 57%
Total 2,157 100% 19,837 100% 6,407 100%
wkskillartistic Never worked in any occupation 7 0% 11 0% 4 0%
Not at all important 338 16% 2,049 10% 447 7%
Only a little important 427 20% 2,533 13% 619 10%
Somewhat important 424 20% 4,627 23% 1,236 19%
Very important 960 45% 10,600 53% 4,101 64%
Total 2,156 100% 19,820 100% 6,407 100%
wkskillbus Never worked in any occupation 7 0% 11 0% 4 0%
Not at all important 135 6% 1,010 5% 288 5%
Only a little important 298 14% 2,754 14% 864 14%
Somewhat important 712 33% 6,715 34% 2,408 38%
Very important 1,003 47% 9,299 47% 2,833 44%
Total 2,155 100% 19,789 100% 6,397 100%
wkskillentr Never worked in any occupation 7 0% 11 0% 4 0%
Not at all important 289 13% 2,200 11% 583 9%
Only a little important 385 18% 3,631 18% 1,121 18%
Somewhat important 634 30% 5,746 29% 1,929 30%
Very important 832 39% 8,058 41% 2,716 43%
Total 2,147 100% 19,646 100% 6,353 100%
39.10. Artistic technique
39. The importance of the following to perform effectively in your
profession or work life: (continued)
39.9. Technological skills
39.11. Financial and business management skills
39.12. Entrepreneurial skills
a Total may not sum to 100% since respondents could select more than one category.
38

Variable Response Options Count % Count % Count %
SNAAP 2011 Aggregate Frequency Report
Career
All SNAAP High
School Institutions
All SNAAP
Undergraduate
Institutions
All SNAAP
Graduate
Institutions
wkskillwkoth Never worked in any occupation 7 0% 11 0% 4 0%
Not at all important 8 0% 118 1% 40 1%
Only a little important 31 1% 433 2% 115 2%
Somewhat important 218 10% 2,779 14% 867 14%
Very important 1,898 88% 16,499 83% 5,390 84%
Total 2,162 100% 19,840 100% 6,416 100%
wkskillleader Never worked in any occupation 7 0% 11 0% 4 0%
Not at all important 21 1% 259 1% 68 1%
Only a little important 107 5% 1,013 5% 267 4%
Somewhat important 419 19% 4,749 24% 1,439 22%
Very important 1,607 74% 13,795 70% 4,640 72%
Total 2,161 100% 19,827 100% 6,418 100%
wkskillnetrel Never worked in any occupation 7 0% 11 0% 4 0%
Not at all important 16 1% 269 1% 64 1%
Only a little important 78 4% 874 4% 217 3%
Somewhat important 372 17% 4,314 22% 1,369 21%
Very important 1,684 78% 14,346 72% 4,752 74%
Total 2,157 100% 19,814 100% 6,406 100%
wkskillteach Never worked in any occupation 7 0% 11 0% 4 0%
Not at all important 93 4% 1,258 6% 275 4%
Only a little important 302 14% 3,653 18% 690 11%
Somewhat important 619 29% 5,999 30% 1,392 22%
Very important 1,134 53% 8,864 45% 4,055 63%
Total 2,155 100% 19,785 100% 6,416 100%
39.16. Teaching skills
39. The importance of the following to perform effectively in your
profession or work life: (continued)
39.13. Interpersonal relations and working
collaboratively
39.14. Leadership skills
39.15. Networking and relationship building
a Total may not sum to 100% since respondents could select more than one category.
39
Variable Response Options Count % Count % Count %
SNAAP 2011 Aggregate Frequency Report
Career
All SNAAP High
School Institutions
All SNAAP
Undergraduate
Institutions
All SNAAP
Graduate
Institutions
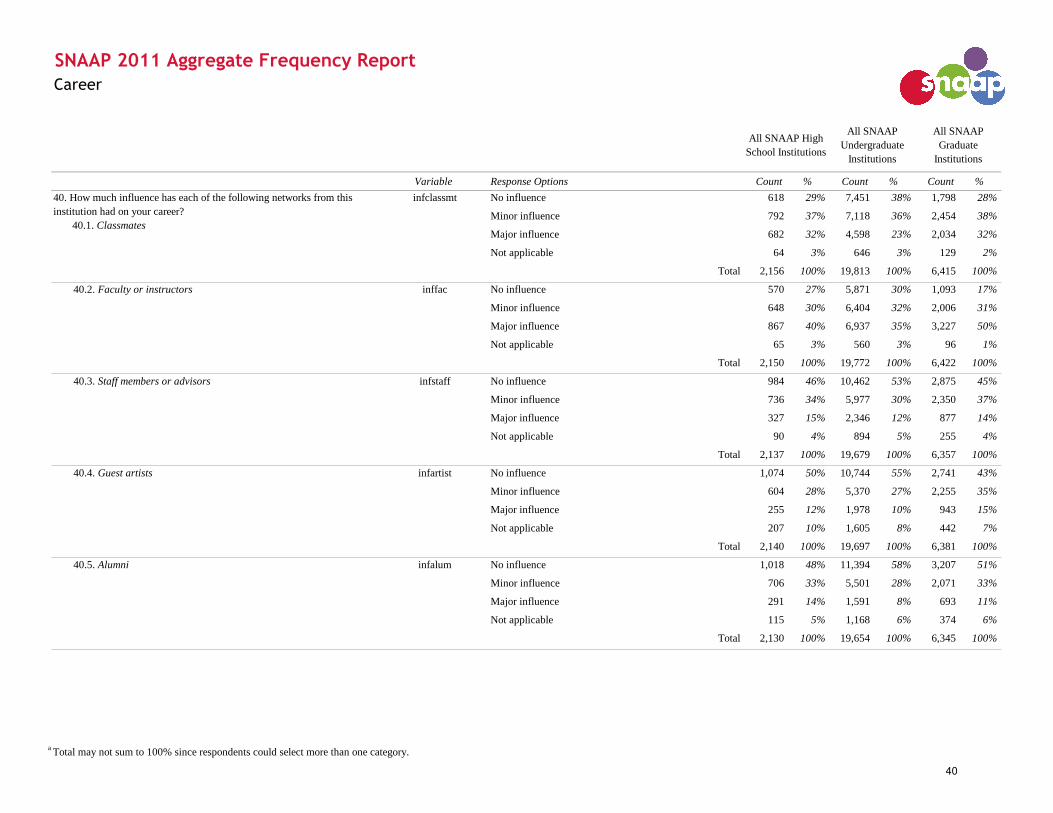
infclassmt No influence 618 29% 7,451 38% 1,798 28%
Minor influence 792 37% 7,118 36% 2,454 38%
Major influence 682 32% 4,598 23% 2,034 32%
Not applicable 64 3% 646 3% 129 2%
Total 2,156 100% 19,813 100% 6,415 100%
inffac No influence 570 27% 5,871 30% 1,093 17%
Minor influence 648 30% 6,404 32% 2,006 31%
Major influence 867 40% 6,937 35% 3,227 50%
Not applicable 65 3% 560 3% 96 1%
Total 2,150 100% 19,772 100% 6,422 100%
infstaff No influence 984 46% 10,462 53% 2,875 45%
Minor influence 736 34% 5,977 30% 2,350 37%
Major influence 327 15% 2,346 12% 877 14%
Not applicable 90 4% 894 5% 255 4%
Total 2,137 100% 19,679 100% 6,357 100%
infartist No influence 1,074 50% 10,744 55% 2,741 43%
Minor influence 604 28% 5,370 27% 2,255 35%
Major influence 255 12% 1,978 10% 943 15%
Not applicable 207 10% 1,605 8% 442 7%
Total 2,140 100% 19,697 100% 6,381 100%
infalum No influence 1,018 48% 11,394 58% 3,207 51%
Minor influence 706 33% 5,501 28% 2,071 33%
Major influence 291 14% 1,591 8% 693 11%
Not applicable 115 5% 1,168 6% 374 6%
Total 2,130 100% 19,654 100% 6,345 100%
40.5. Alumni
40. How much influence has each of the following networks from this
institution had on your career?
40.1. Classmates
40.2. Faculty or instructors
40.3. Staff members or advisors
40.4. Guest artists
a Total may not sum to 100% since respondents could select more than one category.
40
Variable Response Options Count % Count % Count %
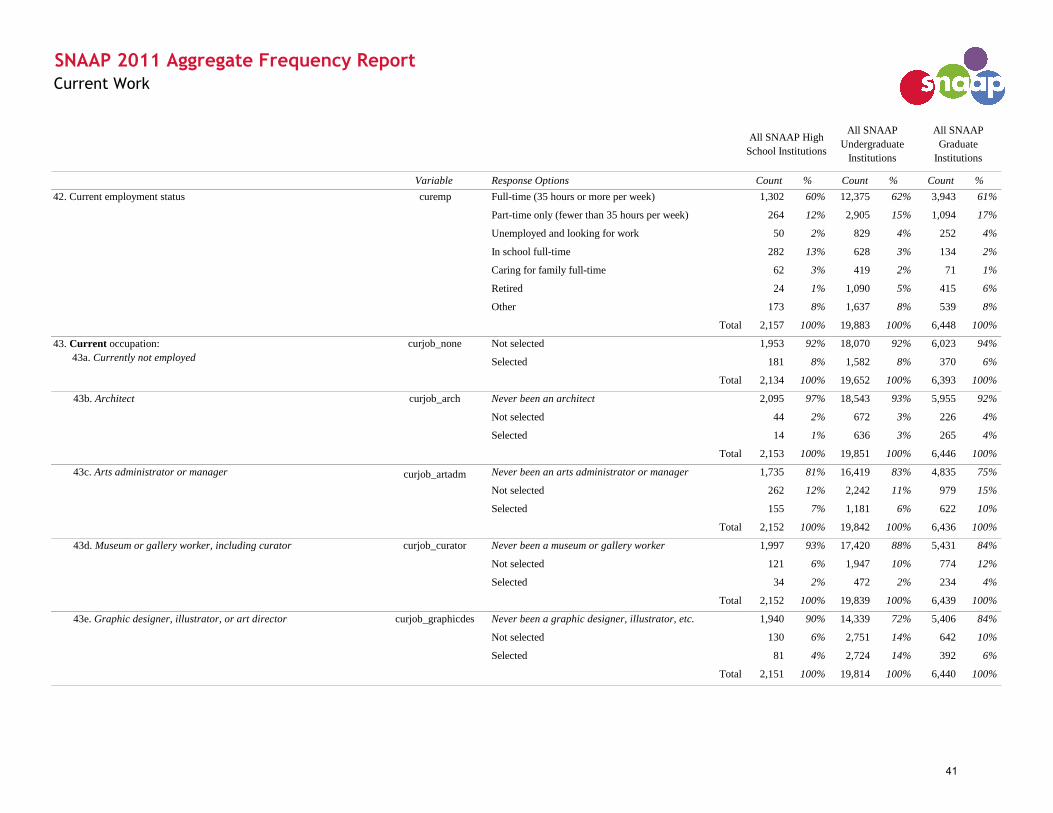
curemp Full-time (35 hours or more per week) 1,302 60% 12,375 62% 3,943 61%
Part-time only (fewer than 35 hours per week) 264 12% 2,905 15% 1,094 17%
Unemployed and looking for work 50 2% 829 4% 252 4%
In school full-time 282 13% 628 3% 134 2%
Caring for family full-time 62 3% 419 2% 71 1%
Retired 24 1% 1,090 5% 415 6%
Other 173 8% 1,637 8% 539 8%
Total 2,157 100% 19,883 100% 6,448 100%
curjob_none Not selected 1,953 92% 18,070 92% 6,023 94%
Selected 181 8% 1,582 8% 370 6%
Total 2,134 100% 19,652 100% 6,393 100%
curjob_arch Never been an architect 2,095 97% 18,543 93% 5,955 92%
Not selected 44 2% 672 3% 226 4%
Selected 14 1% 636 3% 265 4%
Total 2,153 100% 19,851 100% 6,446 100%
curjob_artadm Never been an arts administrator or manager 1,735 81% 16,419 83% 4,835 75%
Not selected 262 12% 2,242 11% 979 15%
Selected 155 7% 1,181 6% 622 10%
Total 2,152 100% 19,842 100% 6,436 100%
curjob_curator Never been a museum or gallery worker 1,997 93% 17,420 88% 5,431 84%
Not selected 121 6% 1,947 10% 774 12%
Selected 34 2% 472 2% 234 4%
Total 2,152 100% 19,839 100% 6,439 100%
curjob_graphicdes Never been a graphic designer, illustrator, etc. 1,940 90% 14,339 72% 5,406 84%
Not selected 130 6% 2,751 14% 642 10%
Selected 81 4% 2,724 14% 392 6%
Total 2,151 100% 19,814 100% 6,440 100%
43b. Architect
43c. Arts administrator or manager
43d. Museum or gallery worker, including curator
43e. Graphic designer, illustrator, or art director
SNAAP 2011 Aggregate Frequency Report
All SNAAP High
School Institutions
All SNAAP
Undergraduate
Institutions
All SNAAP
Graduate
Institutions
42. Current employment status
Current Work
43. Current occupation:
43a. Currently not employed
41
Variable Response Options Count % Count % Count %
SNAAP 2011 Aggregate Frequency Report
All SNAAP High
School Institutions
All SNAAP
Undergraduate
Institutions
All SNAAP
Graduate
Institutions
Current Work
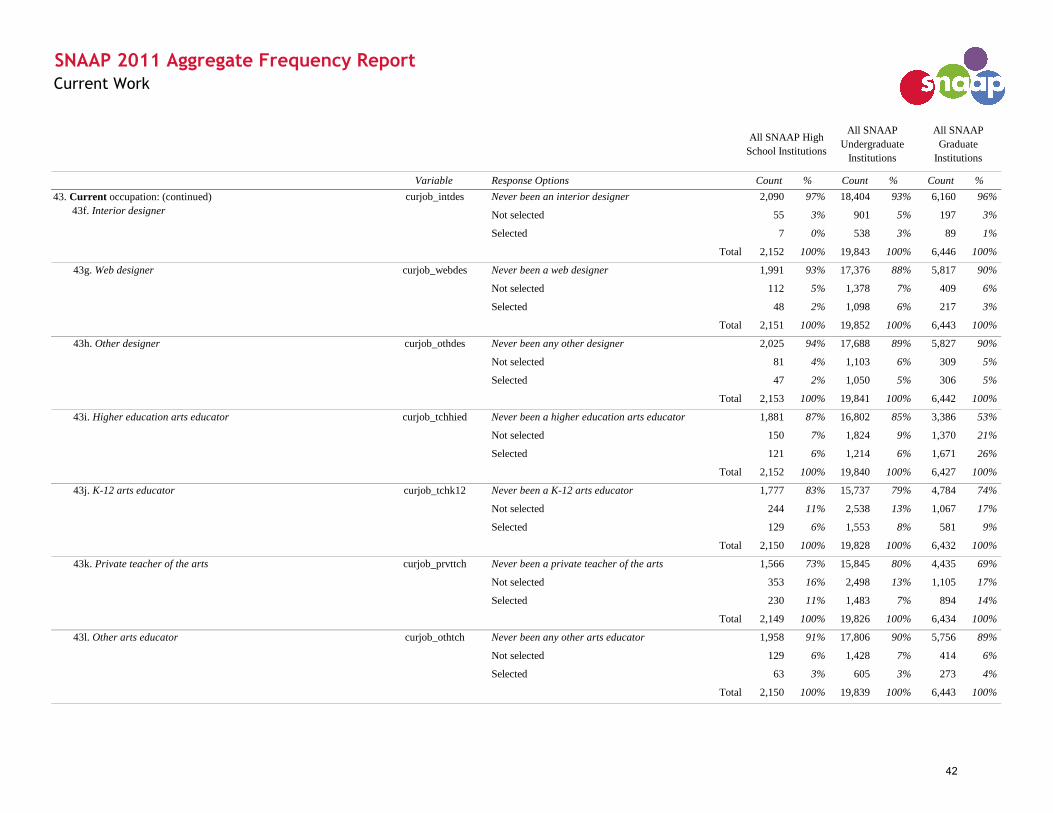
curjob_intdes Never been an interior designer 2,090 97% 18,404 93% 6,160 96%
Not selected 55 3% 901 5% 197 3%
Selected 7 0% 538 3% 89 1%
Total 2,152 100% 19,843 100% 6,446 100%
curjob_webdes Never been a web designer 1,991 93% 17,376 88% 5,817 90%
Not selected 112 5% 1,378 7% 409 6%
Selected 48 2% 1,098 6% 217 3%
Total 2,151 100% 19,852 100% 6,443 100%
curjob_othdes Never been any other designer 2,025 94% 17,688 89% 5,827 90%
Not selected 81 4% 1,103 6% 309 5%
Selected 47 2% 1,050 5% 306 5%
Total 2,153 100% 19,841 100% 6,442 100%
curjob_tchhied Never been a higher education arts educator 1,881 87% 16,802 85% 3,386 53%
Not selected 150 7% 1,824 9% 1,370 21%
Selected 121 6% 1,214 6% 1,671 26%
Total 2,152 100% 19,840 100% 6,427 100%
curjob_tchk12 Never been a K-12 arts educator 1,777 83% 15,737 79% 4,784 74%
Not selected 244 11% 2,538 13% 1,067 17%
Selected 129 6% 1,553 8% 581 9%
Total 2,150 100% 19,828 100% 6,432 100%
curjob_prvttch Never been a private teacher of the arts 1,566 73% 15,845 80% 4,435 69%
Not selected 353 16% 2,498 13% 1,105 17%
Selected 230 11% 1,483 7% 894 14%
Total 2,149 100% 19,826 100% 6,434 100%
curjob_othtch Never been any other arts educator 1,958 91% 17,806 90% 5,756 89%
Not selected 129 6% 1,428 7% 414 6%
Selected 63 3% 605 3% 273 4%
Total 2,150 100% 19,839 100% 6,443 100%
43. Current occupation: (continued)
43f. Interior designer
43g. Web designer
43h. Other designer
43i. Higher education arts educator
43j. K-12 arts educator
43k. Private teacher of the arts
43l. Other arts educator
42

Variable Response Options Count % Count % Count %
SNAAP 2011 Aggregate Frequency Report
All SNAAP High
School Institutions
All SNAAP
Undergraduate
Institutions
All SNAAP
Graduate
Institutions
Current Work
curjob_craft Never been a craft artist 2,032 94% 17,665 89% 5,945 92%
Not selected 76 4% 1,318 7% 311 5%
Selected 44 2% 858 4% 188 3%
Total 2,152 100% 19,841 100% 6,444 100%
curjob_finart Never been a fine artist 2,005 93% 16,268 82% 5,158 80%
Not selected 91 4% 1,524 8% 452 7%
Selected 56 3% 2,027 10% 827 13%
Total 2,152 100% 19,819 100% 6,437 100%
curjob_film Never been a film, TV, or video artist 1,936 90% 17,197 87% 5,607 87%
Not selected 122 6% 1,529 8% 484 8%
Selected 92 4% 1,107 6% 345 5%
Total 2,150 100% 19,833 100% 6,436 100%
curjob_animator Never been a multi-media artist or animator 2,065 96% 18,507 93% 5,951 92%
Not selected 65 3% 893 4% 299 5%
Selected 20 1% 446 2% 198 3%
Total 2,150 100% 19,846 100% 6,448 100%
curjob_photo Never been a photographer 1,971 92% 17,127 86% 5,727 89%
Not selected 123 6% 1,599 8% 425 7%
Selected 56 3% 1,106 6% 288 4%
Total 2,150 100% 19,832 100% 6,440 100%
curjob_actor Never been an actor 1,838 85% 17,600 89% 5,678 88%
Not selected 207 10% 1,585 8% 534 8%
Selected 105 5% 652 3% 232 4%
Total 2,150 100% 19,837 100% 6,444 100%
curjob_choreo Never been a dancer or choreographer 1,891 88% 18,658 94% 6,069 94%
Not selected 175 8% 865 4% 255 4%
Selected 86 4% 331 2% 122 2%
Total 2,152 100% 19,854 100% 6,446 100%
43o. Film, TV, video artist
43p. Multi-media artist or animator
43q. Photographer
43. Current occupation: (continued)
43m. Craft artist
43n. Fine artist
43s. Dancer or choreographer
43r. Actor
43
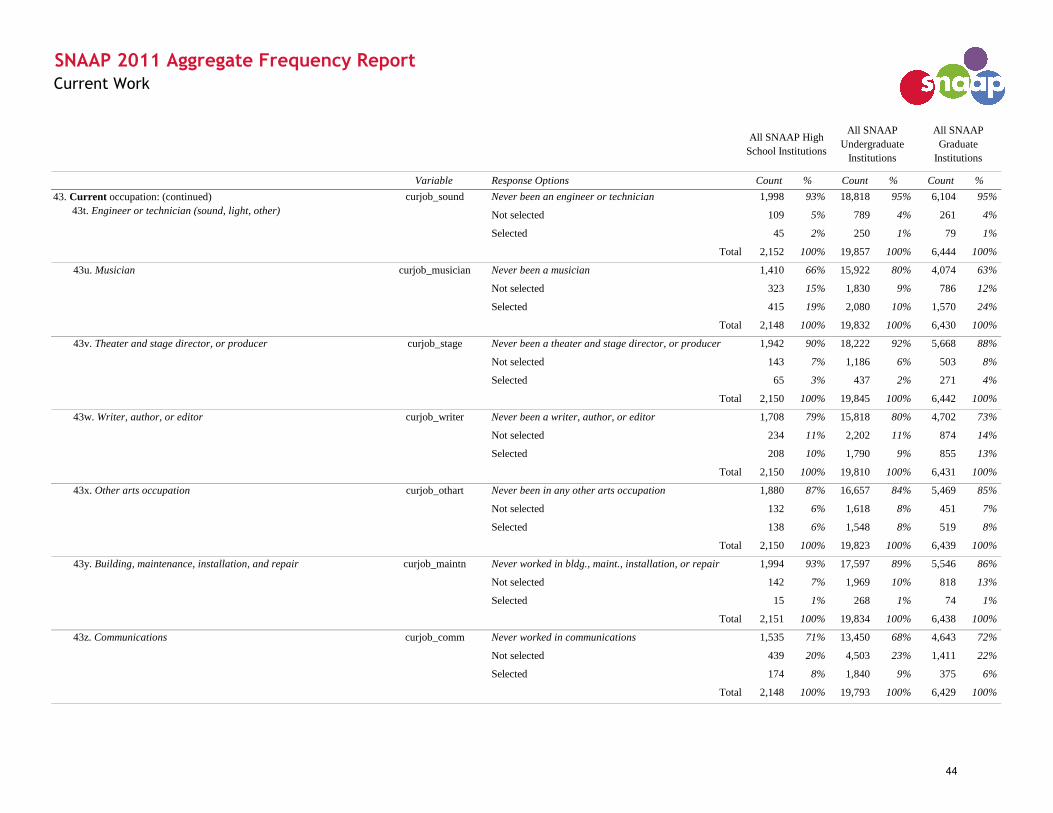
Variable Response Options Count % Count % Count %
SNAAP 2011 Aggregate Frequency Report
All SNAAP High
School Institutions
All SNAAP
Undergraduate
Institutions
All SNAAP
Graduate
Institutions
Current Work
curjob_sound Never been an engineer or technician 1,998 93% 18,818 95% 6,104 95%
Not selected 109 5% 789 4% 261 4%
Selected 45 2% 250 1% 79 1%
Total 2,152 100% 19,857 100% 6,444 100%
curjob_musician Never been a musician 1,410 66% 15,922 80% 4,074 63%
Not selected 323 15% 1,830 9% 786 12%
Selected 415 19% 2,080 10% 1,570 24%
Total 2,148 100% 19,832 100% 6,430 100%
curjob_stage Never been a theater and stage director, or producer 1,942 90% 18,222 92% 5,668 88%
Not selected 143 7% 1,186 6% 503 8%
Selected 65 3% 437 2% 271 4%
Total 2,150 100% 19,845 100% 6,442 100%
curjob_writer Never been a writer, author, or editor 1,708 79% 15,818 80% 4,702 73%
Not selected 234 11% 2,202 11% 874 14%
Selected 208 10% 1,790 9% 855 13%
Total 2,150 100% 19,810 100% 6,431 100%
curjob_othart Never been in any other arts occupation 1,880 87% 16,657 84% 5,469 85%
Not selected 132 6% 1,618 8% 451 7%
Selected 138 6% 1,548 8% 519 8%
Total 2,150 100% 19,823 100% 6,439 100%
curjob_maintn Never worked in bldg., maint., installation, or repair 1,994 93% 17,597 89% 5,546 86%
Not selected 142 7% 1,969 10% 818 13%
Selected 15 1% 268 1% 74 1%
Total 2,151 100% 19,834 100% 6,438 100%
curjob_comm Never worked in communications 1,535 71% 13,450 68% 4,643 72%
Not selected 439 20% 4,503 23% 1,411 22%
Selected 174 8% 1,840 9% 375 6%
Total 2,148 100% 19,793 100% 6,429 100%
43v. Theater and stage director, or producer
43. Current occupation: (continued)
43t. Engineer or technician (sound, light, other)
43u. Musician
43w. Writer, author, or editor
43x. Other arts occupation
43z. Communications
43y. Building, maintenance, installation, and repair
44

Variable Response Options Count % Count % Count %
SNAAP 2011 Aggregate Frequency Report
All SNAAP High
School Institutions
All SNAAP
Undergraduate
Institutions
All SNAAP
Graduate
Institutions
Current Work
curjob_comput Never worked in a computer or mathematics occupation 1,872 87% 17,683 89% 5,715 89%
Not selected 163 8% 1,448 7% 491 8%
Selected 114 5% 714 4% 236 4%
Total 2,149 100% 19,845 100% 6,442 100%
curjob_construct Never worked in construction 2,037 95% 17,736 89% 5,663 88%
Not selected 107 5% 1,792 9% 693 11%
Selected 8 0% 307 2% 81 1%
Total 2,152 100% 19,835 100% 6,437 100%
curjob_edu Never worked in education, training, or library 1,186 55% 11,885 60% 2,981 46%
Not selected 635 30% 5,960 30% 2,665 42%
Selected 321 15% 1,930 10% 769 12%
Total 2,142 100% 19,775 100% 6,415 100%
curjob_engocc Never worked in engineering or science 1,964 91% 19,039 96% 6,144 95%
Not selected 105 5% 613 3% 253 4%
Selected 83 4% 204 1% 49 1%
Total 2,152 100% 19,856 100% 6,446 100%
curjob_farm Never worked in farming, fishing, or forestry 2,050 95% 19,020 96% 6,132 95%
Not selected 85 4% 736 4% 288 4%
Selected 17 1% 100 1% 24 0%
Total 2,152 100% 19,856 100% 6,444 100%
curjob_finan Never worked in financial or other business services 1,893 88% 17,798 90% 5,877 91%
Not selected 172 8% 1,514 8% 458 7%
Selected 84 4% 534 3% 107 2%
Total 2,149 100% 19,846 100% 6,442 100%
curjob_food Never worked in a food preparation related occupation 1,488 69% 14,951 75% 4,947 77%
Not selected 606 28% 4,500 23% 1,430 22%
Selected 55 3% 368 2% 60 1%
Total 2,149 100% 19,819 100% 6,437 100%
43ag. Food preparation related
43ad. Engineering and science
43ae. Farming, fishing, and forestry
43af. Financial and other business services
43. Current occupation: (continued)
43aa. Computer and mathematics
43ab. Construction
43ac. Education, training, and library
45
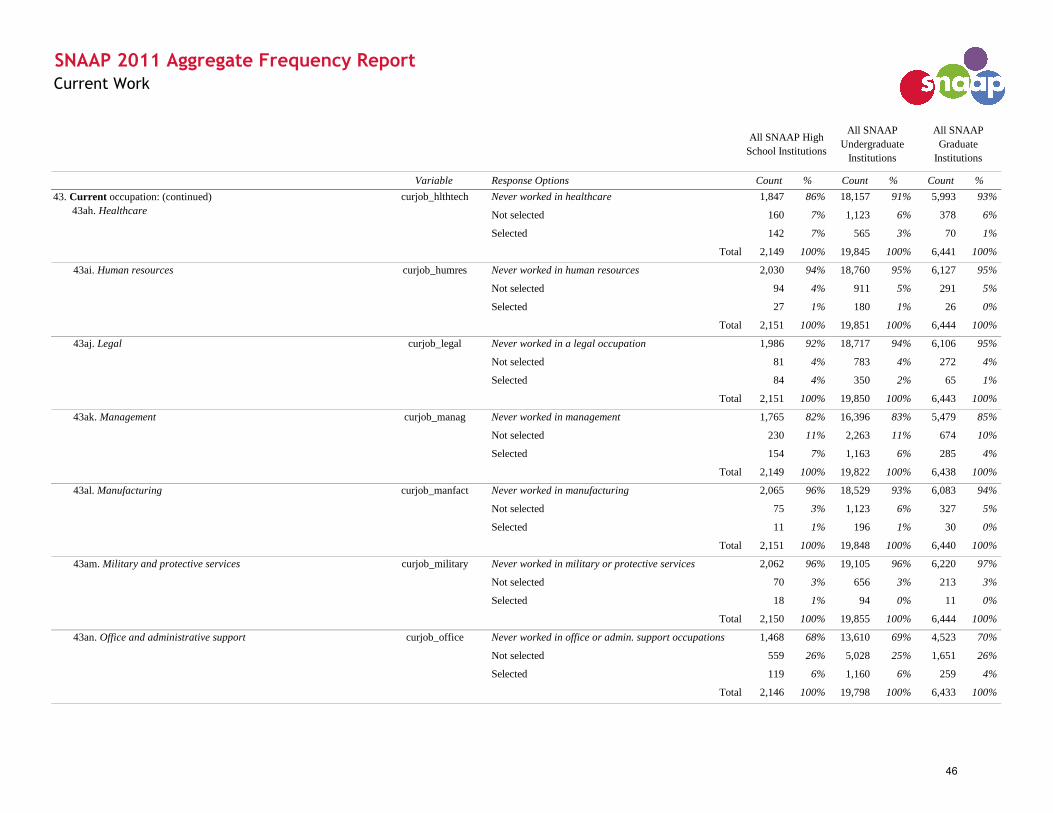
Variable Response Options Count % Count % Count %
SNAAP 2011 Aggregate Frequency Report
All SNAAP High
School Institutions
All SNAAP
Undergraduate
Institutions
All SNAAP
Graduate
Institutions
Current Work
curjob_hlthtech Never worked in healthcare 1,847 86% 18,157 91% 5,993 93%
Not selected 160 7% 1,123 6% 378 6%
Selected 142 7% 565 3% 70 1%
Total 2,149 100% 19,845 100% 6,441 100%
curjob_humres Never worked in human resources 2,030 94% 18,760 95% 6,127 95%
Not selected 94 4% 911 5% 291 5%
Selected 27 1% 180 1% 26 0%
Total 2,151 100% 19,851 100% 6,444 100%
curjob_legal Never worked in a legal occupation 1,986 92% 18,717 94% 6,106 95%
Not selected 81 4% 783 4% 272 4%
Selected 84 4% 350 2% 65 1%
Total 2,151 100% 19,850 100% 6,443 100%
curjob_manag Never worked in management 1,765 82% 16,396 83% 5,479 85%
Not selected 230 11% 2,263 11% 674 10%
Selected 154 7% 1,163 6% 285 4%
Total 2,149 100% 19,822 100% 6,438 100%
curjob_manfact Never worked in manufacturing 2,065 96% 18,529 93% 6,083 94%
Not selected 75 3% 1,123 6% 327 5%
Selected 11 1% 196 1% 30 0%
Total 2,151 100% 19,848 100% 6,440 100%
curjob_military Never worked in military or protective services 2,062 96% 19,105 96% 6,220 97%
Not selected 70 3% 656 3% 213 3%
Selected 18 1% 94 0% 11 0%
Total 2,150 100% 19,855 100% 6,444 100%
curjob_office Never worked in office or admin. support occupations 1,468 68% 13,610 69% 4,523 70%
Not selected 559 26% 5,028 25% 1,651 26%
Selected 119 6% 1,160 6% 259 4%
Total 2,146 100% 19,798 100% 6,433 100%
43. Current occupation: (continued)
43ah. Healthcare
43am. Military and protective services
43al. Manufacturing
43an. Office and administrative support
43ai. Human resources
43aj. Legal
43ak. Management
46

Variable Response Options Count % Count % Count %
SNAAP 2011 Aggregate Frequency Report
All SNAAP High
School Institutions
All SNAAP
Undergraduate
Institutions
All SNAAP
Graduate
Institutions
Current Work
curjob_sales Never worked in a sales related occupation 1,523 71% 13,656 69% 4,915 76%
Not selected 504 24% 5,086 26% 1,359 21%
Selected 117 5% 1,052 5% 155 2%
Total 2,144 100% 19,794 100% 6,429 100%
curjob_care Never worked in a services or personal care occupation 1,832 85% 17,500 88% 5,784 90%
Not selected 265 12% 2,038 10% 597 9%
Selected 51 2% 300 2% 58 1%
Total 2,148 100% 19,838 100% 6,439 100%
curjob_socialser Never worked in social services 1,954 91% 18,356 92% 5,956 92%
Not selected 136 6% 1,090 5% 412 6%
Selected 61 3% 401 2% 72 1%
Total 2,151 100% 19,847 100% 6,440 100%
curjob_transport Never worked in transportation or material moving 2,081 97% 19,019 96% 6,118 95%
Not selected 58 3% 759 4% 307 5%
Selected 12 1% 76 0% 19 0%
Total 2,151 100% 19,854 100% 6,444 100%
curjob_othnart Never worked in any other occupation outside the arts 1,783 83% 16,081 81% 5,306 82%
Not selected 199 9% 2,323 12% 743 12%
Selected 167 8% 1,408 7% 385 6%
Total 2,149 100% 19,812 100% 6,434 100%
curjob_oth Not selected 1,972 92% 17,625 90% 5,762 90%
Selected 162 8% 2,026 10% 631 10%
Total 2,134 100% 19,651 100% 6,393 100%
43at. Other
43. Current occupation: (continued)
43ao. Sales
43ap. Services and personal care
43aq. Social services
43ar. Transportation and material moving
43as. Other occupations outside of the arts
47

Variable Response Options Count % Count % Count %
SNAAP 2011 Aggregate Frequency Report
All SNAAP High
School Institutions
All SNAAP
Undergraduate
Institutions
All SNAAP
Graduate
Institutions
Current Work
multijob Currently not employed 181 9% 1,581 8% 370 6%
No, I do not hold multiple jobs 1,168 55% 11,187 57% 3,148 50%
Yes, I hold 2 jobs 493 23% 4,745 24% 1,833 29%
Yes, I hold 3 jobs 189 9% 1,451 7% 708 11%
Yes, I hold 4 jobs 45 2% 277 1% 149 2%
Yes, I hold more than 4 jobs 38 2% 267 1% 123 2%
Total 2,114 100% 19,508 100% 6,331 100%
majtimejob_R Currently not employed 181 9% 1,581 8% 370 6%
Architect 9 0% 473 2% 191 3%
Arts administrator or manager 58 3% 511 3% 250 4%
Museum or gallery worker, including curator 16 1% 218 1% 104 2%
Graphic designer, illustrator, or art director 28 1% 1,429 7% 107 2%
Interior designer 2 0% 256 1% 22 0%
Web designer 8 0% 239 1% 36 1%
Other designer 18 1% 549 3% 128 2%
Higher education arts educator 59 3% 653 3% 1,134 18%
K-12 arts educator 73 3% 1,176 6% 394 6%
Private teacher of the arts 54 3% 321 2% 223 4%
Other arts educator 15 1% 203 1% 100 2%
Craft artist 7 0% 176 1% 31 0%
Fine artist 15 1% 668 3% 268 4%
Film, TV, video artist 27 1% 504 3% 96 2%
Multi-media artist or animator 3 0% 70 0% 23 0%
Photographer 11 1% 222 1% 39 1%
Actor 38 2% 158 1% 46 1%
Dancer or choreographer 24 1% 65 0% 8 0%
Engineer or technician (light, sound, other) 5 0% 34 0% 4 0%
Musician 165 8% 580 3% 546 9%
Theater and stage director or producer 9 0% 58 0% 40 1%
46. The occupation in which you spend the majority of your work time:
45. Are you currently working at two or more jobs?
48
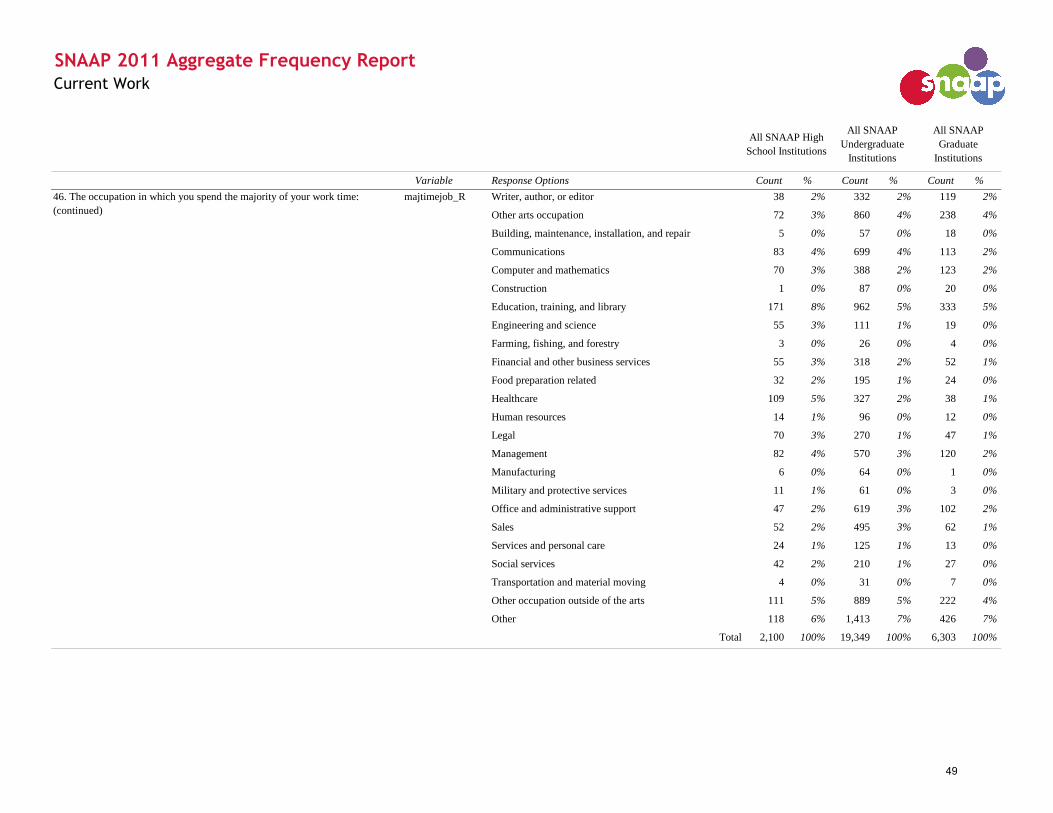
Variable Response Options Count % Count % Count %
SNAAP 2011 Aggregate Frequency Report
All SNAAP High
School Institutions
All SNAAP
Undergraduate
Institutions
All SNAAP
Graduate
Institutions
Current Work
majtimejob_R Writer, author, or editor 38 2% 332 2% 119 2%
Other arts occupation 72 3% 860 4% 238 4%
Building, maintenance, installation, and repair 5 0% 57 0% 18 0%
Communications 83 4% 699 4% 113 2%
Computer and mathematics 70 3% 388 2% 123 2%
Construction 1 0% 87 0% 20 0%
Education, training, and library 171 8% 962 5% 333 5%
Engineering and science 55 3% 111 1% 19 0%
Farming, fishing, and forestry 3 0% 26 0% 4 0%
Financial and other business services 55 3% 318 2% 52 1%
Food preparation related 32 2% 195 1% 24 0%
Healthcare 109 5% 327 2% 38 1%
Human resources 14 1% 96 0% 12 0%
Legal 70 3% 270 1% 47 1%
Management 82 4% 570 3% 120 2%
Manufacturing 6 0% 64 0% 1 0%
Military and protective services 11 1% 61 0% 3 0%
Office and administrative support 47 2% 619 3% 102 2%
Sales 52 2% 495 3% 62 1%
Services and personal care 24 1% 125 1% 13 0%
Social services 42 2% 210 1% 27 0%
Transportation and material moving 4 0% 31 0% 7 0%
Other occupation outside of the arts 111 5% 889 5% 222 4%
Other 118 6% 1,413 7% 426 7%
Total 2,100 100% 19,349 100% 6,303 100%
46. The occupation in which you spend the majority of your work time:
(continued)
49
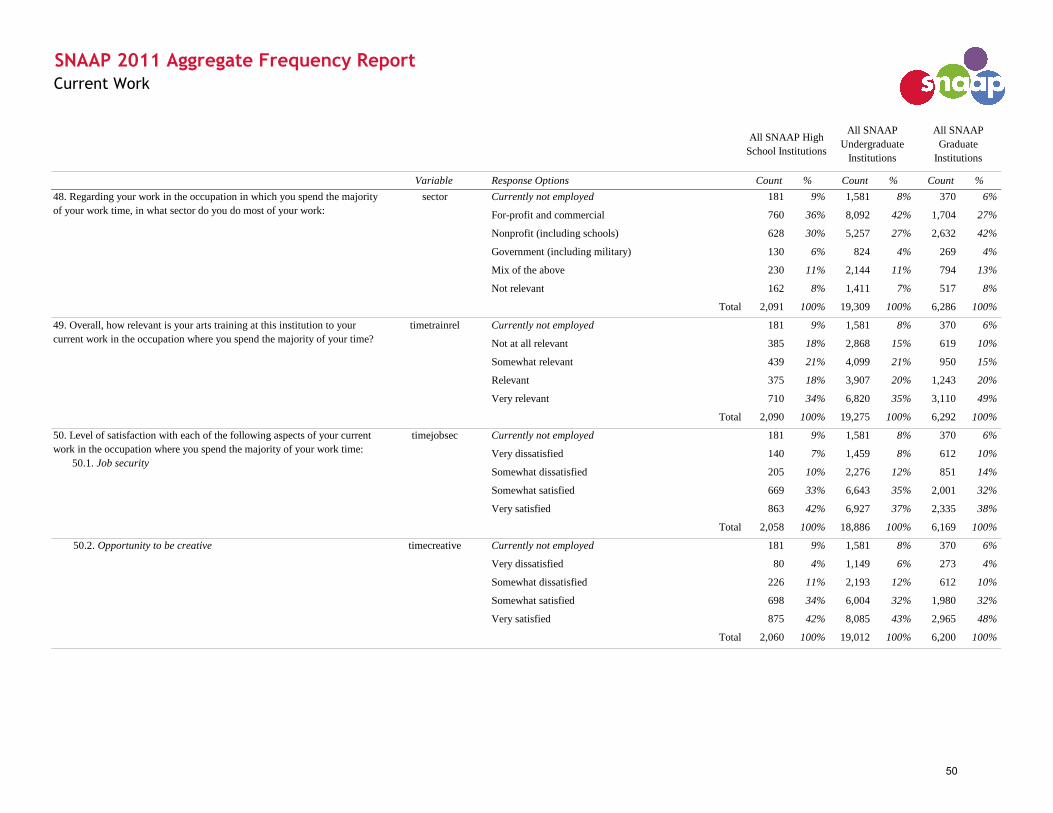
Variable Response Options Count % Count % Count %
SNAAP 2011 Aggregate Frequency Report
All SNAAP High
School Institutions
All SNAAP
Undergraduate
Institutions
All SNAAP
Graduate
Institutions
Current Work
sector Currently not employed 181 9% 1,581 8% 370 6%
For-profit and commercial 760 36% 8,092 42% 1,704 27%
Nonprofit (including schools) 628 30% 5,257 27% 2,632 42%
Government (including military) 130 6% 824 4% 269 4%
Mix of the above 230 11% 2,144 11% 794 13%
Not relevant 162 8% 1,411 7% 517 8%
Total 2,091 100% 19,309 100% 6,286 100%
timetrainrel Currently not employed 181 9% 1,581 8% 370 6%
Not at all relevant 385 18% 2,868 15% 619 10%
Somewhat relevant 439 21% 4,099 21% 950 15%
Relevant 375 18% 3,907 20% 1,243 20%
Very relevant 710 34% 6,820 35% 3,110 49%
Total 2,090 100% 19,275 100% 6,292 100%
timejobsec Currently not employed 181 9% 1,581 8% 370 6%
Very dissatisfied 140 7% 1,459 8% 612 10%
Somewhat dissatisfied 205 10% 2,276 12% 851 14%
Somewhat satisfied 669 33% 6,643 35% 2,001 32%
Very satisfied 863 42% 6,927 37% 2,335 38%
Total 2,058 100% 18,886 100% 6,169 100%
timecreative Currently not employed 181 9% 1,581 8% 370 6%
Very dissatisfied 80 4% 1,149 6% 273 4%
Somewhat dissatisfied 226 11% 2,193 12% 612 10%
Somewhat satisfied 698 34% 6,004 32% 1,980 32%
Very satisfied 875 42% 8,085 43% 2,965 48%
Total 2,060 100% 19,012 100% 6,200 100%
49. Overall, how relevant is your arts training at this institution to your
current work in the occupation where you spend the majority of your time?
48. Regarding your work in the occupation in which you spend the majority
of your work time, in what sector do you do most of your work:
50. Level of satisfaction with each of the following aspects of your current
work in the occupation where you spend the majority of your work time:
50.1. Job security
50.2. Opportunity to be creative
50
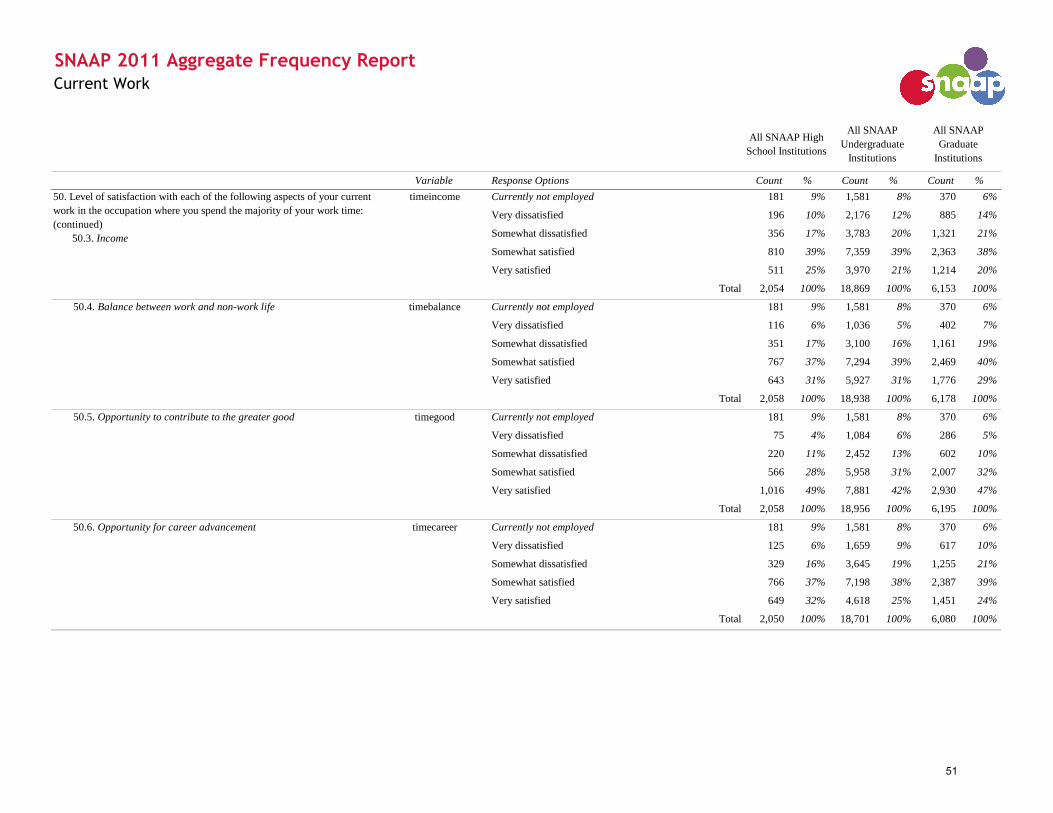
Variable Response Options Count % Count % Count %
SNAAP 2011 Aggregate Frequency Report
All SNAAP High
School Institutions
All SNAAP
Undergraduate
Institutions
All SNAAP
Graduate
Institutions
Current Work
timeincome Currently not employed 181 9% 1,581 8% 370 6%
Very dissatisfied 196 10% 2,176 12% 885 14%
Somewhat dissatisfied 356 17% 3,783 20% 1,321 21%
Somewhat satisfied 810 39% 7,359 39% 2,363 38%
Very satisfied 511 25% 3,970 21% 1,214 20%
Total 2,054 100% 18,869 100% 6,153 100%
timebalance Currently not employed 181 9% 1,581 8% 370 6%
Very dissatisfied 116 6% 1,036 5% 402 7%
Somewhat dissatisfied 351 17% 3,100 16% 1,161 19%
Somewhat satisfied 767 37% 7,294 39% 2,469 40%
Very satisfied 643 31% 5,927 31% 1,776 29%
Total 2,058 100% 18,938 100% 6,178 100%
timegood Currently not employed 181 9% 1,581 8% 370 6%
Very dissatisfied 75 4% 1,084 6% 286 5%
Somewhat dissatisfied 220 11% 2,452 13% 602 10%
Somewhat satisfied 566 28% 5,958 31% 2,007 32%
Very satisfied 1,016 49% 7,881 42% 2,930 47%
Total 2,058 100% 18,956 100% 6,195 100%
timecareer Currently not employed 181 9% 1,581 8% 370 6%
Very dissatisfied 125 6% 1,659 9% 617 10%
Somewhat dissatisfied 329 16% 3,645 19% 1,255 21%
Somewhat satisfied 766 37% 7,198 38% 2,387 39%
Very satisfied 649 32% 4,618 25% 1,451 24%
Total 2,050 100% 18,701 100% 6,080 100%
50.6. Opportunity for career advancement
50. Level of satisfaction with each of the following aspects of your current
work in the occupation where you spend the majority of your work time:
(continued)
50.3. Income
50.4. Balance between work and non-work life
50.5. Opportunity to contribute to the greater good
51
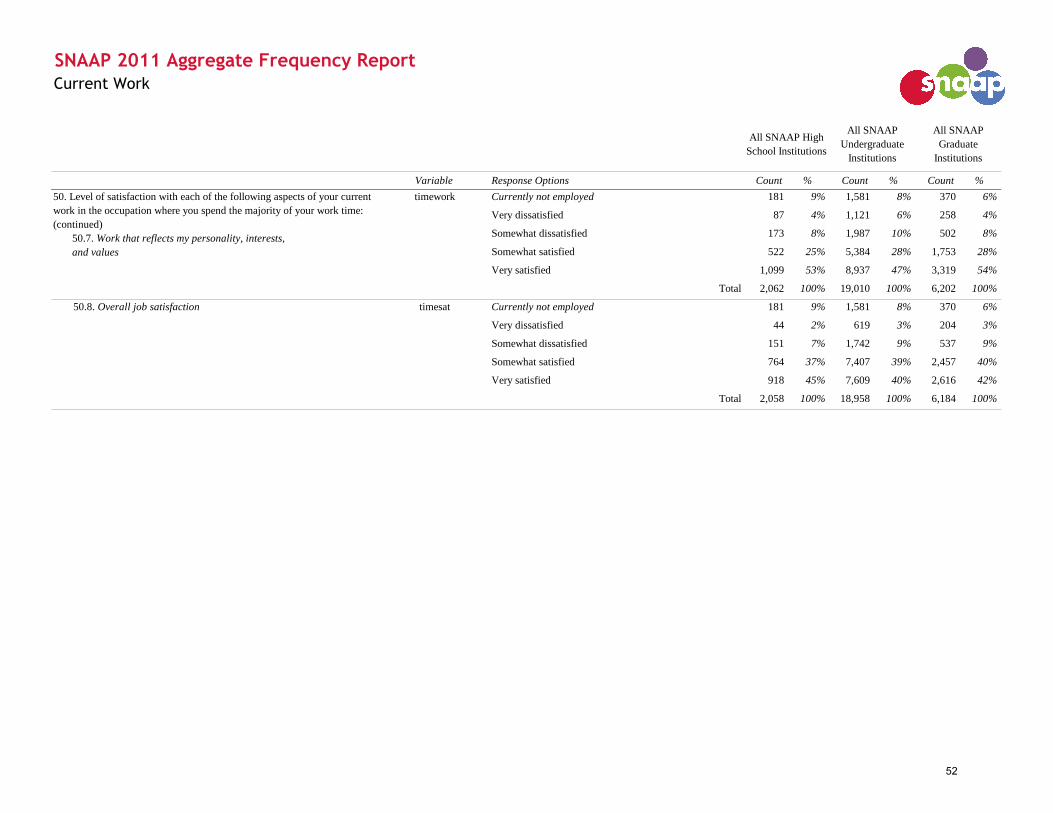
Variable Response Options Count % Count % Count %
SNAAP 2011 Aggregate Frequency Report
All SNAAP High
School Institutions
All SNAAP
Undergraduate
Institutions
All SNAAP
Graduate
Institutions
Current Work
timework Currently not employed 181 9% 1,581 8% 370 6%
Very dissatisfied 87 4% 1,121 6% 258 4%
Somewhat dissatisfied 173 8% 1,987 10% 502 8%
Somewhat satisfied 522 25% 5,384 28% 1,753 28%
Very satisfied 1,099 53% 8,937 47% 3,319 54%
Total 2,062 100% 19,010 100% 6,202 100%
timesat Currently not employed 181 9% 1,581 8% 370 6%
Very dissatisfied 44 2% 619 3% 204 3%
Somewhat dissatisfied 151 7% 1,742 9% 537 9%
Somewhat satisfied 764 37% 7,407 39% 2,457 40%
Very satisfied 918 45% 7,609 40% 2,616 42%
Total 2,058 100% 18,958 100% 6,184 100%
50. Level of satisfaction with each of the following aspects of your current
work in the occupation where you spend the majority of your work time:
(continued)
50.7. Work that reflects my personality, interests,
and values
50.8. Overall job satisfaction
52
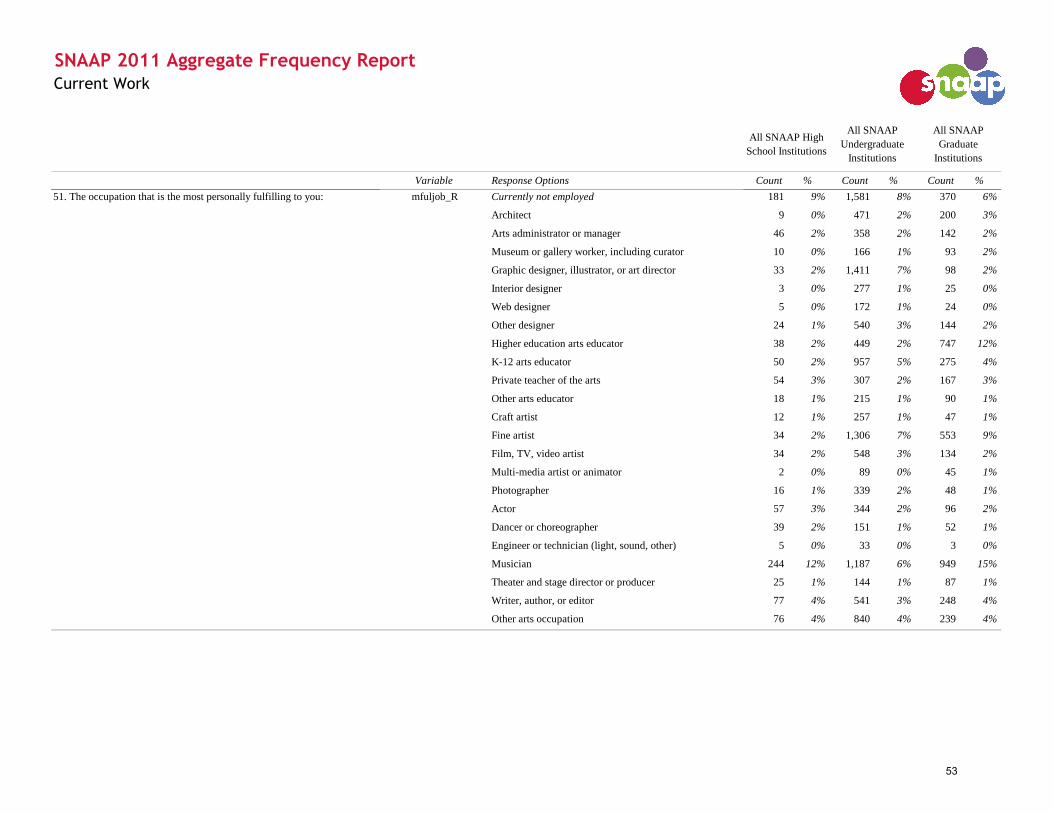
Variable Response Options Count % Count % Count %
SNAAP 2011 Aggregate Frequency Report
All SNAAP High
School Institutions
All SNAAP
Undergraduate
Institutions
All SNAAP
Graduate
Institutions
Current Work
mfuljob_R Currently not employed 181 9% 1,581 8% 370 6%
Architect 9 0% 471 2% 200 3%
Arts administrator or manager 46 2% 358 2% 142 2%
Museum or gallery worker, including curator 10 0% 166 1% 93 2%
Graphic designer, illustrator, or art director 33 2% 1,411 7% 98 2%
Interior designer 3 0% 277 1% 25 0%
Web designer 5 0% 172 1% 24 0%
Other designer 24 1% 540 3% 144 2%
Higher education arts educator 38 2% 449 2% 747 12%
K-12 arts educator 50 2% 957 5% 275 4%
Private teacher of the arts 54 3% 307 2% 167 3%
Other arts educator 18 1% 215 1% 90 1%
Craft artist 12 1% 257 1% 47 1%
Fine artist 34 2% 1,306 7% 553 9%
Film, TV, video artist 34 2% 548 3% 134 2%
Multi-media artist or animator 2 0% 89 0% 45 1%
Photographer 16 1% 339 2% 48 1%
Actor 57 3% 344 2% 96 2%
Dancer or choreographer 39 2% 151 1% 52 1%
Engineer or technician (light, sound, other) 5 0% 33 0% 3 0%
Musician 244 12% 1,187 6% 949 15%
Theater and stage director or producer 25 1% 144 1% 87 1%
Writer, author, or editor 77 4% 541 3% 248 4%
Other arts occupation 76 4% 840 4% 239 4%
51. The occupation that is the most personally fulfilling to you:
53

Variable Response Options Count % Count % Count %
SNAAP 2011 Aggregate Frequency Report
All SNAAP High
School Institutions
All SNAAP
Undergraduate
Institutions
All SNAAP
Graduate
Institutions
Current Work
mfuljob_R Building, maintenance, installation, and repair 2 0% 35 0% 10 0%
Communications 58 3% 540 3% 87 1%
Computer and mathematics 55 3% 289 2% 84 1%
Construction 2 0% 55 0% 15 0%
Education, training, and library 158 8% 859 5% 251 4%
Engineering and science 56 3% 105 1% 16 0%
Farming, fishing, and forestry 6 0% 18 0% 6 0%
Financial and other business services 48 2% 252 1% 36 1%
Food preparation related 15 1% 100 1% 9 0%
Healthcare 105 5% 296 2% 34 1%
Human resources 12 1% 86 0% 5 0%
Legal 62 3% 225 1% 39 1%
Management 55 3% 418 2% 83 1%
Manufacturing 4 0% 35 0% 1 0%
Military and protective services 10 0% 51 0% 2 0%
Office and administrative support 27 1% 315 2% 40 1%
Sales 32 2% 310 2% 36 1%
Services and personal care 18 1% 89 0% 7 0%
Social services 43 2% 194 1% 26 0%
Transportation and material moving 3 0% 16 0% 4 0%
Other occupation outside of the arts 90 4% 743 4% 159 3%
Other 100 5% 1,263 7% 355 6%
Total 2,053 100% 18,977 100% 6,181 100%
51. The occupation that is the most personally fulfilling to you: (continued)
54
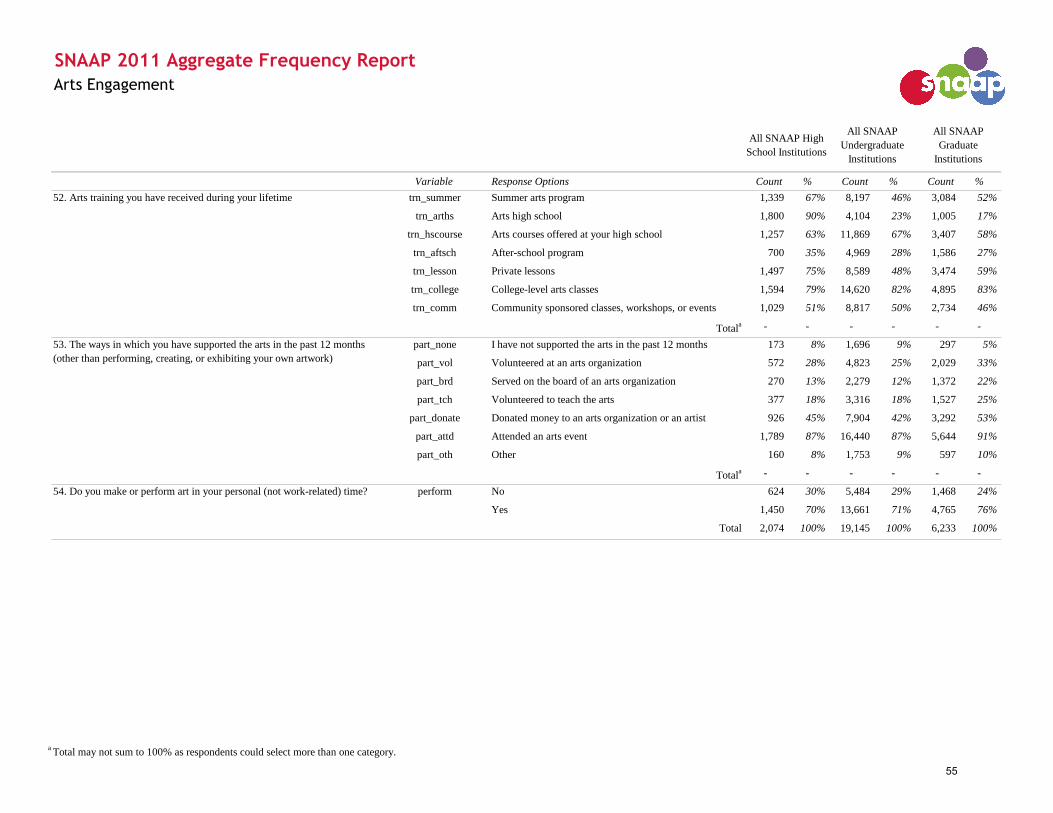
Variable Response Options Count % Count % Count %
trn_summer Summer arts program 1,339 67% 8,197 46% 3,084 52%
trn_arths Arts high school 1,800 90% 4,104 23% 1,005 17%
trn_hscourse Arts courses offered at your high school 1,257 63% 11,869 67% 3,407 58%
trn_aftsch After-school program 700 35% 4,969 28% 1,586 27%
trn_lesson Private lessons 1,497 75% 8,589 48% 3,474 59%
trn_college College-level arts classes 1,594 79% 14,620 82% 4,895 83%
trn_comm Community sponsored classes, workshops, or events 1,029 51% 8,817 50% 2,734 46%
Totala - - - - - -
part_none I have not supported the arts in the past 12 months 173 8% 1,696 9% 297 5%
part_vol Volunteered at an arts organization 572 28% 4,823 25% 2,029 33%
part_brd Served on the board of an arts organization 270 13% 2,279 12% 1,372 22%
part_tch Volunteered to teach the arts 377 18% 3,316 18% 1,527 25%
part_donate Donated money to an arts organization or an artist 926 45% 7,904 42% 3,292 53%
part_attd Attended an arts event 1,789 87% 16,440 87% 5,644 91%
part_oth Other 160 8% 1,753 9% 597 10%
Totala - - - - - -
perform No 624 30% 5,484 29% 1,468 24%
Yes 1,450 70% 13,661 71% 4,765 76%
Total 2,074 100% 19,145 100% 6,233 100%
SNAAP 2011 Aggregate Frequency Report
Arts Engagement
All SNAAP High
School Institutions
All SNAAP
Undergraduate
Institutions
All SNAAP
Graduate
Institutions
52. Arts training you have received during your lifetime
53. The ways in which you have supported the arts in the past 12 months
(other than performing, creating, or exhibiting your own artwork)
54. Do you make or perform art in your personal (not work-related) time?
a Total may not sum to 100% as respondents could select more than one category.
55

Variable Response Options Count % Count % Count %
SNAAP 2011 Aggregate Frequency Report
Arts Engagement
All SNAAP High
School Institutions
All SNAAP
Undergraduate
Institutions
All SNAAP
Graduate
Institutions
prac_dnrq Do not make or perform art in personal time 623 30% 5,477 29% 1,466 24%
prac_craft Craft Arts 461 22% 5,051 26% 1,092 18%
prac_crwri Creative Writing 477 23% 4,018 21% 1,327 21%
prac_cul Culinary Arts 382 18% 3,356 18% 1,006 16%
prac_dance Dance 274 13% 1,336 7% 394 6%
prac_design Design 180 9% 3,983 21% 850 14%
prac_film Film/Media Arts 160 8% 1,977 10% 775 12%
prac_finart Fine Arts (painting, sculpting, drawing) 327 16% 6,312 33% 1,730 28%
prac_music Music 866 42% 4,955 26% 2,340 38%
prac_photo Photography 390 19% 5,362 28% 1,452 23%
prac_thea Theater 209 10% 1,608 8% 649 10%
prac_oth Other 76 4% 974 5% 338 5%
Totala - - - - - -
tmpractice Do not make or perform art in personal time 623 30% 5,477 29% 1,466 24%
A few times a year or less 121 6% 1,687 9% 432 7%
Several times a month 436 21% 4,577 24% 1,240 20%
Several times a week 512 25% 4,652 24% 1,786 29%
Daily 365 18% 2,643 14% 1,282 21%
Total 2,057 100% 19,036 100% 6,206 100%
improduce Do not make or perform art in personal time 623 30% 5,477 29% 1,466 24%
Not at all important 9 0% 98 1% 25 0%
Somewhat important 145 7% 1,328 7% 352 6%
Important 347 17% 3,217 17% 1,001 16%
Very important 933 45% 8,941 47% 3,375 54%
Total 2,057 100% 19,061 100% 6,219 100%
56. About how often do you practice art in your personal (not work-related)
time?
57. How important is it to you to be able to make or produce art in your
personal (not work-related) time?
55. The art forms you practice in your personal (not work-related) time
a Total may not sum to 100% as respondents could select more than one category.
56
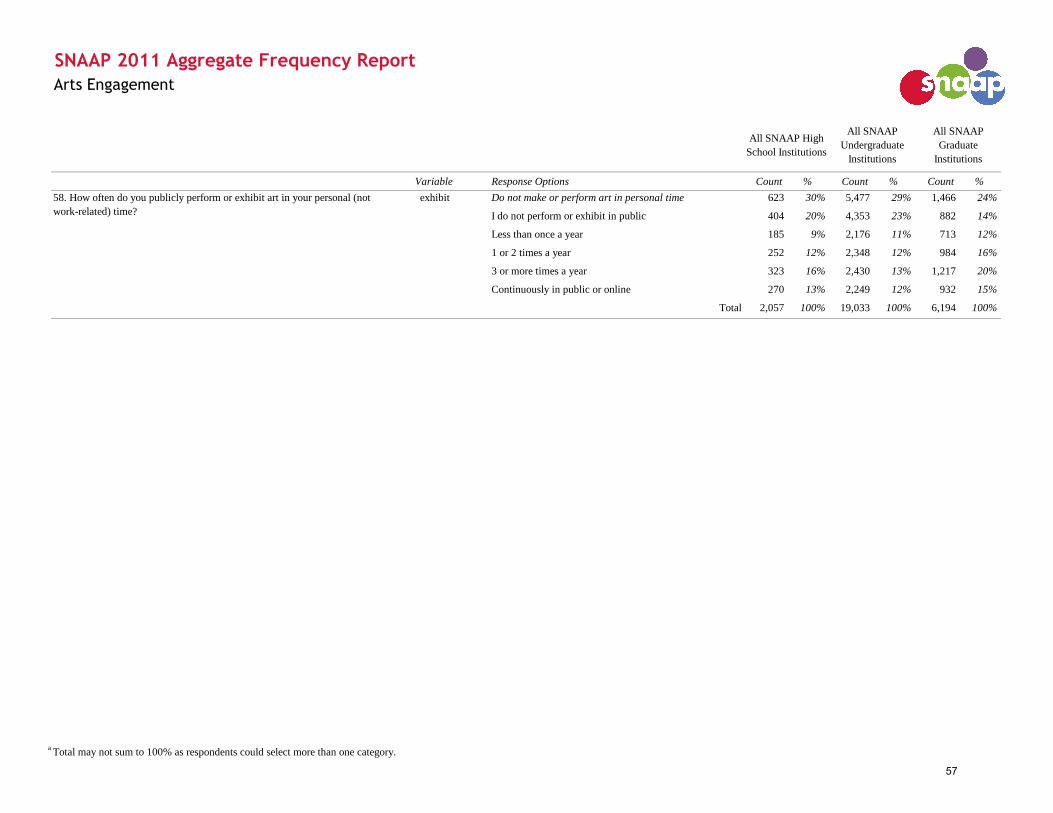
Variable Response Options Count % Count % Count %
SNAAP 2011 Aggregate Frequency Report
Arts Engagement
All SNAAP High
School Institutions
All SNAAP
Undergraduate
Institutions
All SNAAP
Graduate
Institutions
exhibit Do not make or perform art in personal time 623 30% 5,477 29% 1,466 24%
I do not perform or exhibit in public 404 20% 4,353 23% 882 14%
Less than once a year 185 9% 2,176 11% 713 12%
1 or 2 times a year 252 12% 2,348 12% 984 16%
3 or more times a year 323 16% 2,430 13% 1,217 20%
Continuously in public or online 270 13% 2,249 12% 932 15%
Total 2,057 100% 19,033 100% 6,194 100%
58. How often do you publicly perform or exhibit art in your personal (not
work-related) time?
a Total may not sum to 100% as respondents could select more than one category.
57

Variable Response Options Count % Count % Count %
income $10,000 or less 299 15% 2,048 11% 484 8%
$10,001 to $20,000 160 8% 1,807 10% 563 9%
$20,001 to $30,000 188 9% 1,829 10% 553 9%
$30,001 to $40,000 186 9% 2,091 11% 577 9%
$40,001 to $50,000 188 9% 1,932 10% 652 11%
$50,001 to $60,000 160 8% 1,645 9% 655 11%
$60,001 to $70,000 113 6% 1,230 7% 475 8%
$70,001 to $80,000 95 5% 976 5% 412 7%
$80,001 to $90,000 61 3% 596 3% 263 4%
$90,001 to $100,000 50 2% 478 3% 202 3%
$100,001 to $150,000 122 6% 984 5% 352 6%
More than $150,000 96 5% 602 3% 168 3%
I prefer not to answer 318 16% 2,637 14% 784 13%
Total 2,036 100% 18,855 100% 6,140 100%
$10,000 or less 126 6% 770 4% 176 3%
$10,001 to $20,000 98 5% 956 5% 257 4%
$20,001 to $30,000 110 5% 1,049 6% 310 5%
$30,001 to $40,000 124 6% 1,331 7% 359 6%
$40,001 to $50,000 124 6% 1,258 7% 382 6%
$50,001 to $60,000 113 6% 1,196 6% 425 7%
$60,001 to $70,000 109 5% 1,098 6% 427 7%
$70,001 to $80,000 123 6% 1,175 6% 449 7%
$80,001 to $90,000 83 4% 997 5% 355 6%
$90,001 to $100,000 105 5% 1,066 6% 396 7%
$100,001 to $150,000 261 13% 2,543 14% 950 16%
More than $150,000 273 14% 2,027 11% 652 11%
I prefer not to answer 371 18% 3,267 17% 953 16%
Total 2,020 100% 18,733 100% 6,091 100%
59. What was your individual annual income in 2010? (Do not include
spousal income or interest on jointly-owned assets)
60. In 2010, what was your household income from all sources? hhincome
Facts and Figures
SNAAP 2011 Aggregate Frequency Report
All SNAAP High
School Institutions
All SNAAP
Undergraduate
Institutions
All SNAAP
Graduate
Institutions
a Total may not sum to 100% as respondents could select more than one category.
58
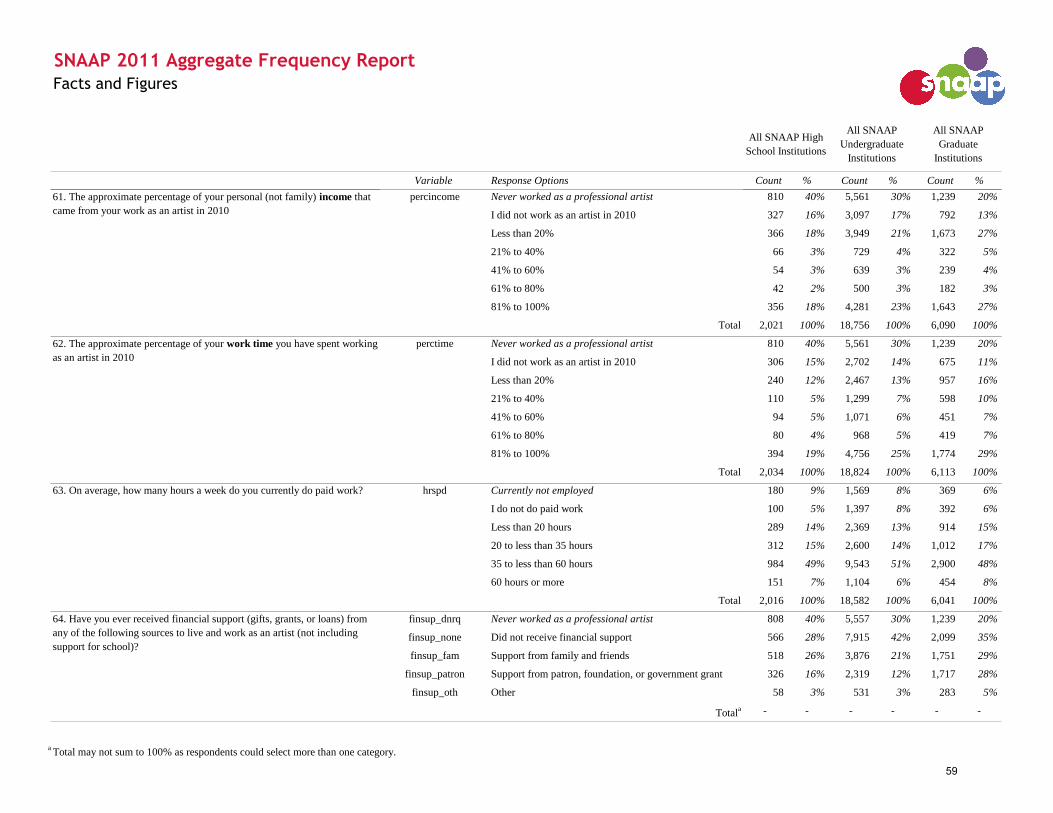
Variable Response Options Count % Count % Count %
Facts and Figures
SNAAP 2011 Aggregate Frequency Report
All SNAAP High
School Institutions
All SNAAP
Undergraduate
Institutions
All SNAAP
Graduate
Institutions
percincome Never worked as a professional artist 810 40% 5,561 30% 1,239 20%
I did not work as an artist in 2010 327 16% 3,097 17% 792 13%
Less than 20% 366 18% 3,949 21% 1,673 27%
21% to 40% 66 3% 729 4% 322 5%
41% to 60% 54 3% 639 3% 239 4%
61% to 80% 42 2% 500 3% 182 3%
81% to 100% 356 18% 4,281 23% 1,643 27%
Total 2,021 100% 18,756 100% 6,090 100%
perctime Never worked as a professional artist 810 40% 5,561 30% 1,239 20%
I did not work as an artist in 2010 306 15% 2,702 14% 675 11%
Less than 20% 240 12% 2,467 13% 957 16%
21% to 40% 110 5% 1,299 7% 598 10%
41% to 60% 94 5% 1,071 6% 451 7%
61% to 80% 80 4% 968 5% 419 7%
81% to 100% 394 19% 4,756 25% 1,774 29%
Total 2,034 100% 18,824 100% 6,113 100%
hrspd Currently not employed 180 9% 1,569 8% 369 6%
I do not do paid work 100 5% 1,397 8% 392 6%
Less than 20 hours 289 14% 2,369 13% 914 15%
20 to less than 35 hours 312 15% 2,600 14% 1,012 17%
35 to less than 60 hours 984 49% 9,543 51% 2,900 48%
60 hours or more 151 7% 1,104 6% 454 8%
Total 2,016 100% 18,582 100% 6,041 100%
finsup_dnrq Never worked as a professional artist 808 40% 5,557 30% 1,239 20%
finsup_none Did not receive financial support 566 28% 7,915 42% 2,099 35%
finsup_fam Support from family and friends 518 26% 3,876 21% 1,751 29%
finsup_patron Support from patron, foundation, or government grant 326 16% 2,319 12% 1,717 28%
finsup_oth Other 58 3% 531 3% 283 5%
Totala - - - - - -
64. Have you ever received financial support (gifts, grants, or loans) from
any of the following sources to live and work as an artist (not including
support for school)?
61. The approximate percentage of your personal (not family) income that
came from your work as an artist in 2010
62. The approximate percentage of your work time you have spent working
as an artist in 2010
63. On average, how many hours a week do you currently do paid work?
a Total may not sum to 100% as respondents could select more than one category.
59
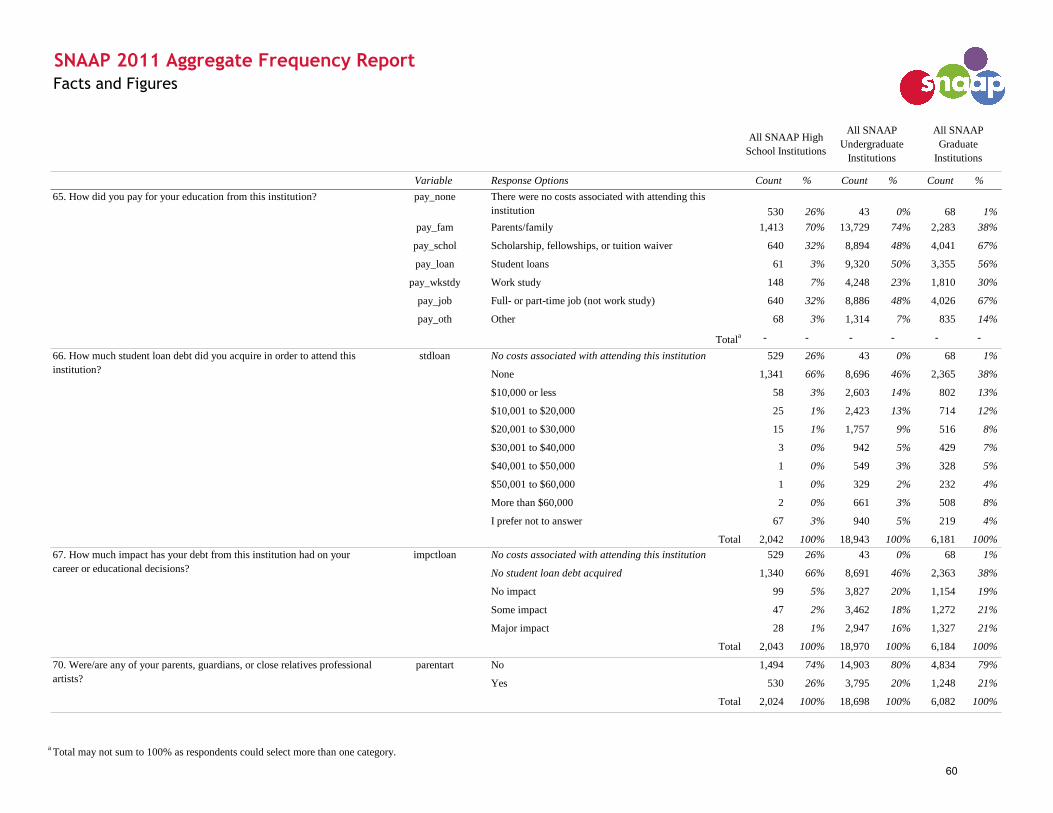
Variable Response Options Count % Count % Count %
Facts and Figures
SNAAP 2011 Aggregate Frequency Report
All SNAAP High
School Institutions
All SNAAP
Undergraduate
Institutions
All SNAAP
Graduate
Institutions
pay_fam Parents/family 1,413 70% 13,729 74% 2,283 38%
pay_schol Scholarship, fellowships, or tuition waiver 640 32% 8,894 48% 4,041 67%
pay_loan Student loans 61 3% 9,320 50% 3,355 56%
pay_wkstdy Work study 148 7% 4,248 23% 1,810 30%
pay_job Full- or part-time job (not work study) 640 32% 8,886 48% 4,026 67%
pay_oth Other 68 3% 1,314 7% 835 14%
Totala - - - - - -
stdloan No costs associated with attending this institution 529 26% 43 0% 68 1%
None 1,341 66% 8,696 46% 2,365 38%
$10,000 or less 58 3% 2,603 14% 802 13%
$10,001 to $20,000 25 1% 2,423 13% 714 12%
$20,001 to $30,000 15 1% 1,757 9% 516 8%
$30,001 to $40,000 3 0% 942 5% 429 7%
$40,001 to $50,000 1 0% 549 3% 328 5%
$50,001 to $60,000 1 0% 329 2% 232 4%
More than $60,000 2 0% 661 3% 508 8%
I prefer not to answer 67 3% 940 5% 219 4%
Total 2,042 100% 18,943 100% 6,181 100%
impctloan No costs associated with attending this institution 529 26% 43 0% 68 1%
No student loan debt acquired 1,340 66% 8,691 46% 2,363 38%
No impact 99 5% 3,827 20% 1,154 19%
Some impact 47 2% 3,462 18% 1,272 21%
Major impact 28 1% 2,947 16% 1,327 21%
Total 2,043 100% 18,970 100% 6,184 100%
parentart No 1,494 74% 14,903 80% 4,834 79%
Yes 530 26% 3,795 20% 1,248 21%
Total 2,024 100% 18,698 100% 6,082 100%
There were no costs associated with attending this
institution
pay_none
0% 68 1%530 26% 43
65. How did you pay for your education from this institution?
70. Were/are any of your parents, guardians, or close relatives professional
artists?
67. How much impact has your debt from this institution had on your
career or educational decisions?
66. How much student loan debt did you acquire in order to attend this
institution?
a Total may not sum to 100% as respondents could select more than one category.
60
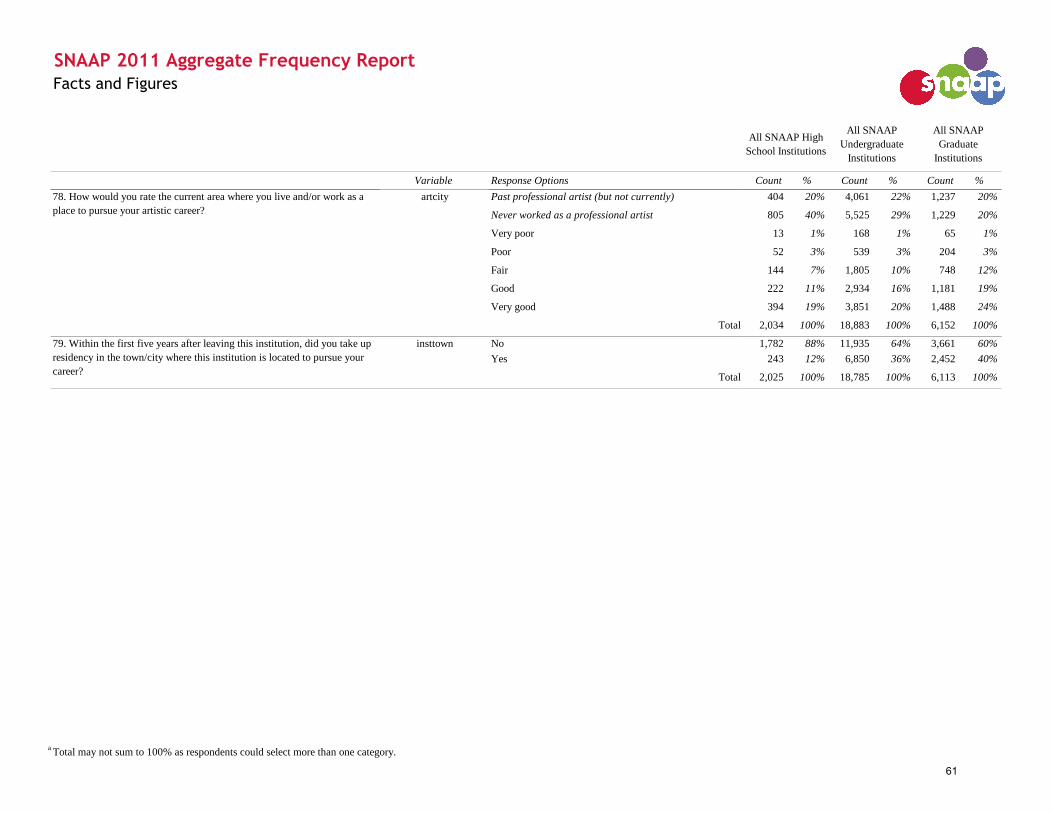
Variable Response Options Count % Count % Count %
Facts and Figures
SNAAP 2011 Aggregate Frequency Report
All SNAAP High
School Institutions
All SNAAP
Undergraduate
Institutions
All SNAAP
Graduate
Institutions
artcity Past professional artist (but not currently) 404 20% 4,061 22% 1,237 20%
Never worked as a professional artist 805 40% 5,525 29% 1,229 20%
Very poor 13 1% 168 1% 65 1%
Poor 52 3% 539 3% 204 3%
Fair 144 7% 1,805 10% 748 12%
Good 222 11% 2,934 16% 1,181 19%
Very good 394 19% 3,851 20% 1,488 24%
Total 2,034 100% 18,883 100% 6,152 100%
insttown No 1,782 88% 11,935 64% 3,661 60%
Yes 243 12% 6,850 36% 2,452 40%
Total 2,025 100% 18,785 100% 6,113 100%
78. How would you rate the current area where you live and/or work as a
place to pursue your artistic career?
79. Within the first five years after leaving this institution, did you take up
residency in the town/city where this institution is located to pursue your
career?
a Total may not sum to 100% as respondents could select more than one category.
61