Embed Size (px)
Citation preview
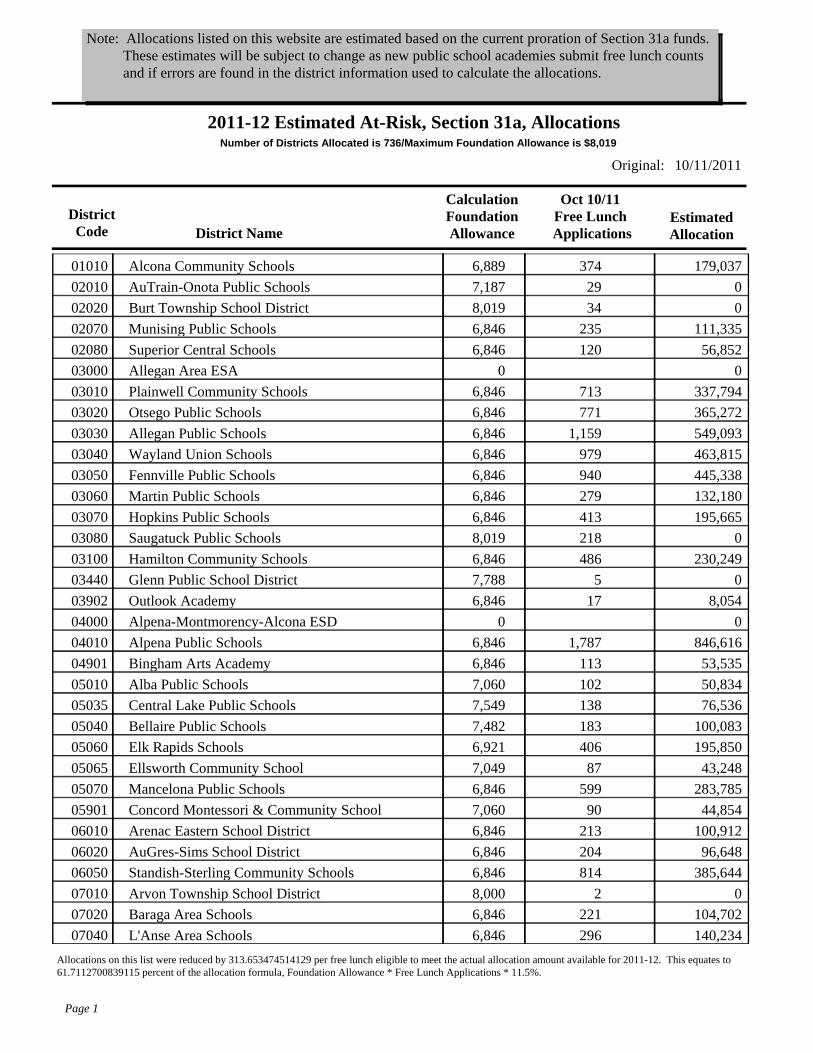
Note: Allocations listed on this website are estimated based on the current proration of Section 31a funds. These estimates will be subject to change as new public school academies submit free lunch counts and if errors are found in the district information used to calculate the allocations.
2011-12 Estimated At-Risk, Section 31a, Allocations
10/11/2011Original:Number of Districts Allocated is 736/Maximum Foundation Allowance is $8,019
DistrictCode District Name
CalculationFoundationAllowance
Oct 10/11Free Lunch
ApplicationsEstimatedAllocation
Alcona Community Schools 6,889 374 179,03701010AuTrain-Onota Public Schools 7,187 29 002010Burt Township School District 8,019 34 002020Munising Public Schools 6,846 235 111,33502070Superior Central Schools 6,846 120 56,85202080Allegan Area ESA 0 003000Plainwell Community Schools 6,846 713 337,79403010Otsego Public Schools 6,846 771 365,27203020Allegan Public Schools 6,846 1,159 549,09303030Wayland Union Schools 6,846 979 463,81503040Fennville Public Schools 6,846 940 445,33803050Martin Public Schools 6,846 279 132,18003060Hopkins Public Schools 6,846 413 195,66503070Saugatuck Public Schools 8,019 218 003080Hamilton Community Schools 6,846 486 230,24903100Glenn Public School District 7,788 5 003440Outlook Academy 6,846 17 8,05403902Alpena-Montmorency-Alcona ESD 0 004000Alpena Public Schools 6,846 1,787 846,61604010Bingham Arts Academy 6,846 113 53,53504901Alba Public Schools 7,060 102 50,83405010Central Lake Public Schools 7,549 138 76,53605035Bellaire Public Schools 7,482 183 100,08305040Elk Rapids Schools 6,921 406 195,85005060Ellsworth Community School 7,049 87 43,24805065Mancelona Public Schools 6,846 599 283,78505070Concord Montessori & Community School 7,060 90 44,85405901Arenac Eastern School District 6,846 213 100,91206010AuGres-Sims School District 6,846 204 96,64806020Standish-Sterling Community Schools 6,846 814 385,64406050Arvon Township School District 8,000 2 007010Baraga Area Schools 6,846 221 104,70207020L'Anse Area Schools 6,846 296 140,23407040
Page 1
Allocations on this list were reduced by 313.653474514129 per free lunch eligible to meet the actual allocation amount available for 2011-12. This equates to 61.7112700839115 percent of the allocation formula, Foundation Allowance * Free Lunch Applications * 11.5%.
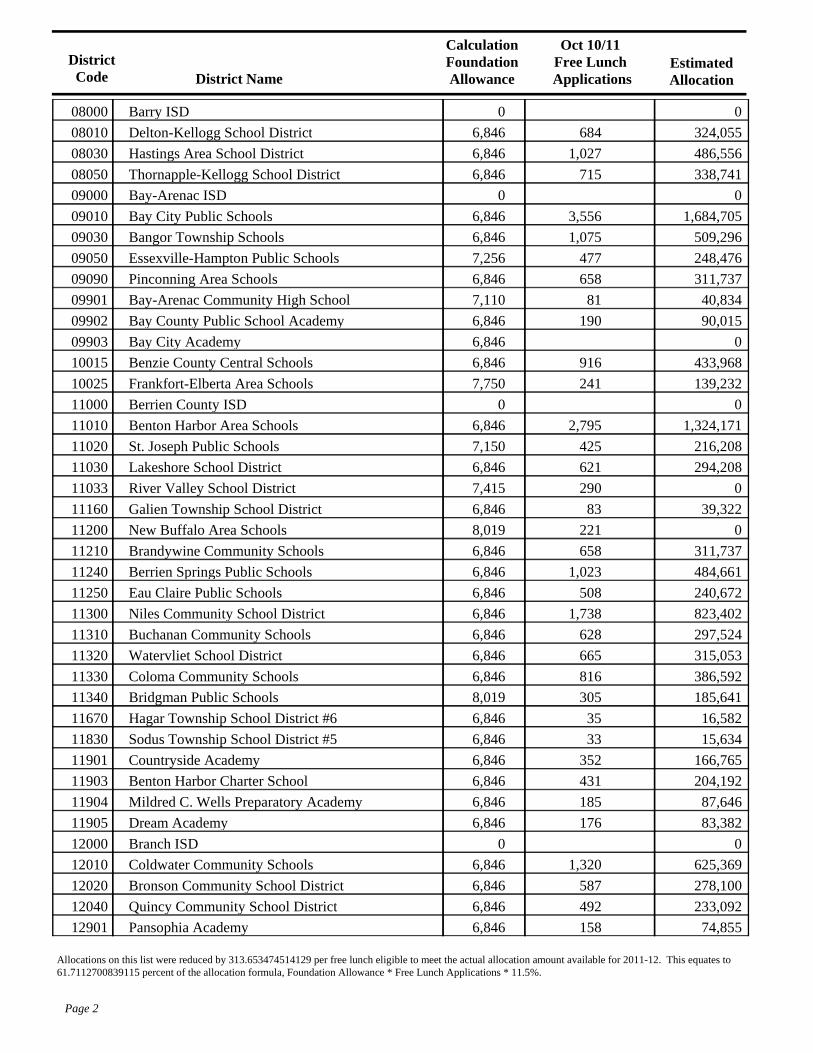
DistrictCode District Name
CalculationFoundationAllowance
Oct 10/11Free Lunch
ApplicationsEstimatedAllocation
Barry ISD 0 008000Delton-Kellogg School District 6,846 684 324,05508010Hastings Area School District 6,846 1,027 486,55608030Thornapple-Kellogg School District 6,846 715 338,74108050Bay-Arenac ISD 0 009000Bay City Public Schools 6,846 3,556 1,684,70509010Bangor Township Schools 6,846 1,075 509,29609030Essexville-Hampton Public Schools 7,256 477 248,47609050Pinconning Area Schools 6,846 658 311,73709090Bay-Arenac Community High School 7,110 81 40,83409901Bay County Public School Academy 6,846 190 90,01509902Bay City Academy 6,846 009903Benzie County Central Schools 6,846 916 433,96810015Frankfort-Elberta Area Schools 7,750 241 139,23210025Berrien County ISD 0 011000Benton Harbor Area Schools 6,846 2,795 1,324,17111010St. Joseph Public Schools 7,150 425 216,20811020Lakeshore School District 6,846 621 294,20811030River Valley School District 7,415 290 011033Galien Township School District 6,846 83 39,32211160New Buffalo Area Schools 8,019 221 011200Brandywine Community Schools 6,846 658 311,73711210Berrien Springs Public Schools 6,846 1,023 484,66111240Eau Claire Public Schools 6,846 508 240,67211250Niles Community School District 6,846 1,738 823,40211300Buchanan Community Schools 6,846 628 297,52411310Watervliet School District 6,846 665 315,05311320Coloma Community Schools 6,846 816 386,59211330Bridgman Public Schools 8,019 305 185,64111340Hagar Township School District #6 6,846 35 16,58211670Sodus Township School District #5 6,846 33 15,63411830Countryside Academy 6,846 352 166,76511901Benton Harbor Charter School 6,846 431 204,19211903Mildred C. Wells Preparatory Academy 6,846 185 87,64611904Dream Academy 6,846 176 83,38211905Branch ISD 0 012000Coldwater Community Schools 6,846 1,320 625,36912010Bronson Community School District 6,846 587 278,10012020Quincy Community School District 6,846 492 233,09212040Pansophia Academy 6,846 158 74,85512901
Page 2
Allocations on this list were reduced by 313.653474514129 per free lunch eligible to meet the actual allocation amount available for 2011-12. This equates to 61.7112700839115 percent of the allocation formula, Foundation Allowance * Free Lunch Applications * 11.5%.
DistrictCode District Name
CalculationFoundationAllowance
Oct 10/11Free Lunch
ApplicationsEstimatedAllocation
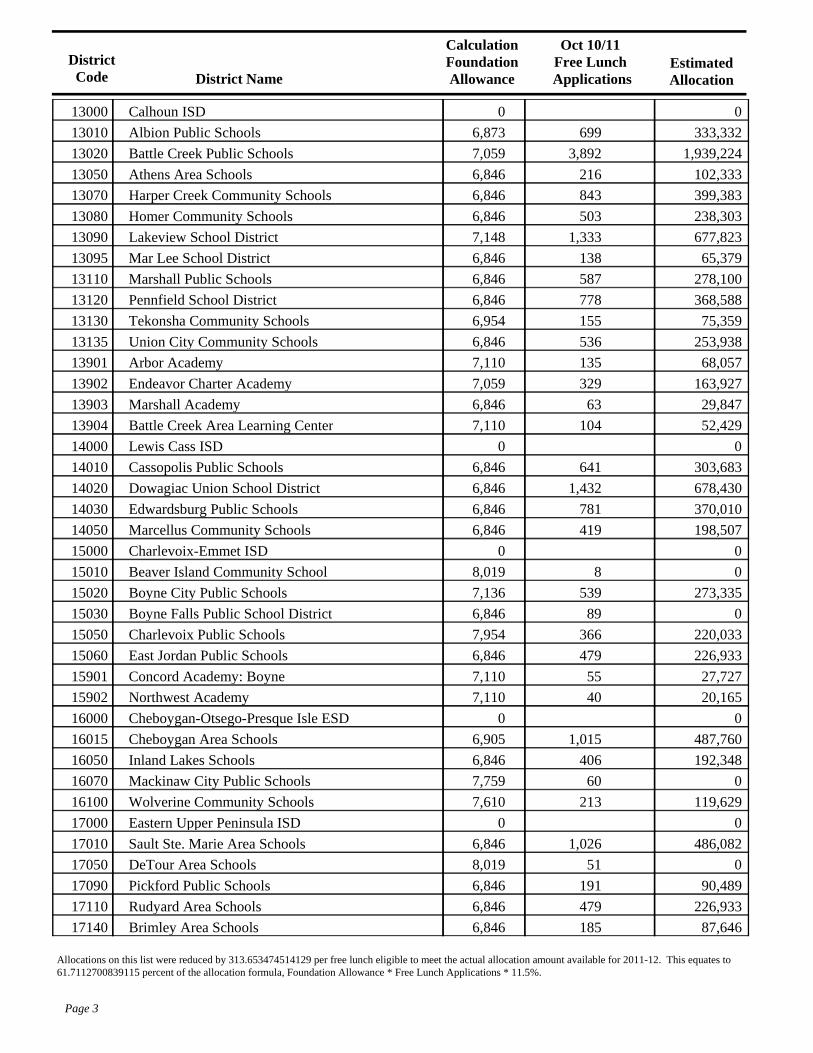
Calhoun ISD 0 013000Albion Public Schools 6,873 699 333,33213010Battle Creek Public Schools 7,059 3,892 1,939,22413020Athens Area Schools 6,846 216 102,33313050Harper Creek Community Schools 6,846 843 399,38313070Homer Community Schools 6,846 503 238,30313080Lakeview School District 7,148 1,333 677,82313090Mar Lee School District 6,846 138 65,37913095Marshall Public Schools 6,846 587 278,10013110Pennfield School District 6,846 778 368,58813120Tekonsha Community Schools 6,954 155 75,35913130Union City Community Schools 6,846 536 253,93813135Arbor Academy 7,110 135 68,05713901Endeavor Charter Academy 7,059 329 163,92713902Marshall Academy 6,846 63 29,84713903Battle Creek Area Learning Center 7,110 104 52,42913904Lewis Cass ISD 0 014000Cassopolis Public Schools 6,846 641 303,68314010Dowagiac Union School District 6,846 1,432 678,43014020Edwardsburg Public Schools 6,846 781 370,01014030Marcellus Community Schools 6,846 419 198,50714050Charlevoix-Emmet ISD 0 015000Beaver Island Community School 8,019 8 015010Boyne City Public Schools 7,136 539 273,33515020Boyne Falls Public School District 6,846 89 015030Charlevoix Public Schools 7,954 366 220,03315050East Jordan Public Schools 6,846 479 226,93315060Concord Academy: Boyne 7,110 55 27,72715901Northwest Academy 7,110 40 20,16515902Cheboygan-Otsego-Presque Isle ESD 0 016000Cheboygan Area Schools 6,905 1,015 487,76016015Inland Lakes Schools 6,846 406 192,34816050Mackinaw City Public Schools 7,759 60 016070Wolverine Community Schools 7,610 213 119,62916100Eastern Upper Peninsula ISD 0 017000Sault Ste. Marie Area Schools 6,846 1,026 486,08217010DeTour Area Schools 8,019 51 017050Pickford Public Schools 6,846 191 90,48917090Rudyard Area Schools 6,846 479 226,93317110Brimley Area Schools 6,846 185 87,64617140
Page 3
Allocations on this list were reduced by 313.653474514129 per free lunch eligible to meet the actual allocation amount available for 2011-12. This equates to 61.7112700839115 percent of the allocation formula, Foundation Allowance * Free Lunch Applications * 11.5%.
DistrictCode District Name
CalculationFoundationAllowance
Oct 10/11Free Lunch
ApplicationsEstimatedAllocation
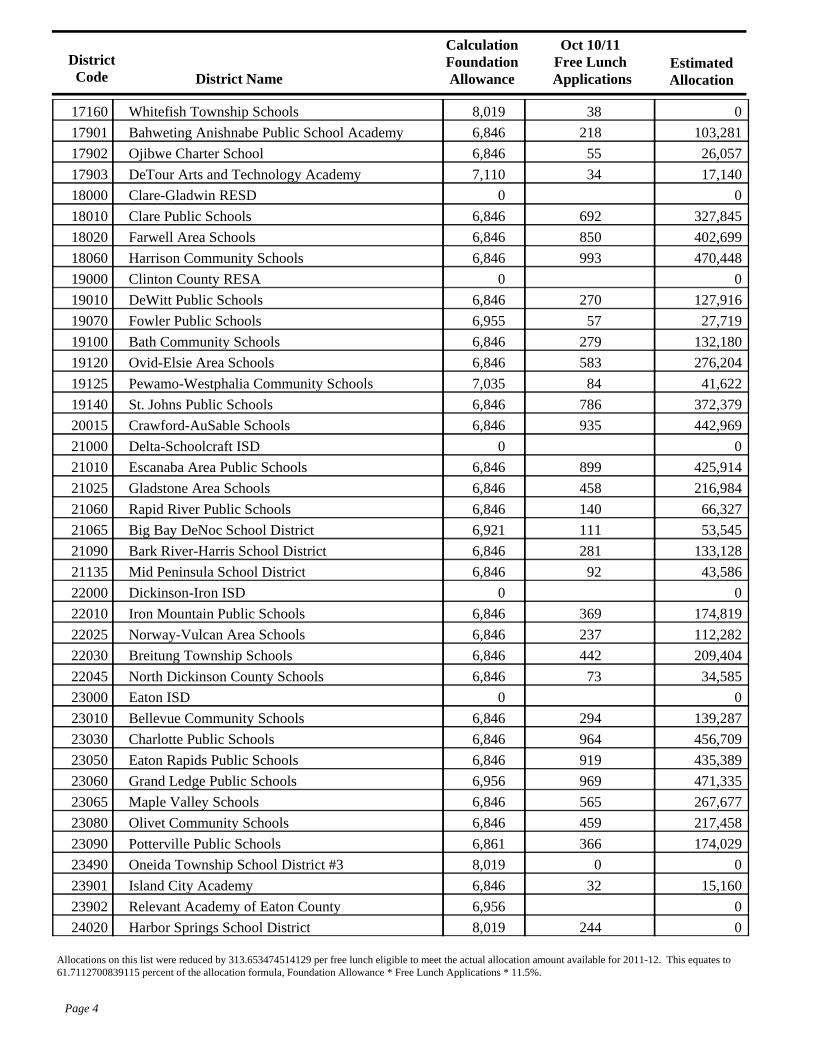
Whitefish Township Schools 8,019 38 017160Bahweting Anishnabe Public School Academy 6,846 218 103,28117901Ojibwe Charter School 6,846 55 26,05717902DeTour Arts and Technology Academy 7,110 34 17,14017903Clare-Gladwin RESD 0 018000Clare Public Schools 6,846 692 327,84518010Farwell Area Schools 6,846 850 402,69918020Harrison Community Schools 6,846 993 470,44818060Clinton County RESA 0 019000DeWitt Public Schools 6,846 270 127,91619010Fowler Public Schools 6,955 57 27,71919070Bath Community Schools 6,846 279 132,18019100Ovid-Elsie Area Schools 6,846 583 276,20419120Pewamo-Westphalia Community Schools 7,035 84 41,62219125St. Johns Public Schools 6,846 786 372,37919140Crawford-AuSable Schools 6,846 935 442,96920015Delta-Schoolcraft ISD 0 021000Escanaba Area Public Schools 6,846 899 425,91421010Gladstone Area Schools 6,846 458 216,98421025Rapid River Public Schools 6,846 140 66,32721060Big Bay DeNoc School District 6,921 111 53,54521065Bark River-Harris School District 6,846 281 133,12821090Mid Peninsula School District 6,846 92 43,58621135Dickinson-Iron ISD 0 022000Iron Mountain Public Schools 6,846 369 174,81922010Norway-Vulcan Area Schools 6,846 237 112,28222025Breitung Township Schools 6,846 442 209,40422030North Dickinson County Schools 6,846 73 34,58522045Eaton ISD 0 023000Bellevue Community Schools 6,846 294 139,28723010Charlotte Public Schools 6,846 964 456,70923030Eaton Rapids Public Schools 6,846 919 435,38923050Grand Ledge Public Schools 6,956 969 471,33523060Maple Valley Schools 6,846 565 267,67723065Olivet Community Schools 6,846 459 217,45823080Potterville Public Schools 6,861 366 174,02923090Oneida Township School District #3 8,019 0 023490Island City Academy 6,846 32 15,16023901Relevant Academy of Eaton County 6,956 023902Harbor Springs School District 8,019 244 024020
Page 4
Allocations on this list were reduced by 313.653474514129 per free lunch eligible to meet the actual allocation amount available for 2011-12. This equates to 61.7112700839115 percent of the allocation formula, Foundation Allowance * Free Lunch Applications * 11.5%.
DistrictCode District Name
CalculationFoundationAllowance
Oct 10/11Free Lunch
ApplicationsEstimatedAllocation
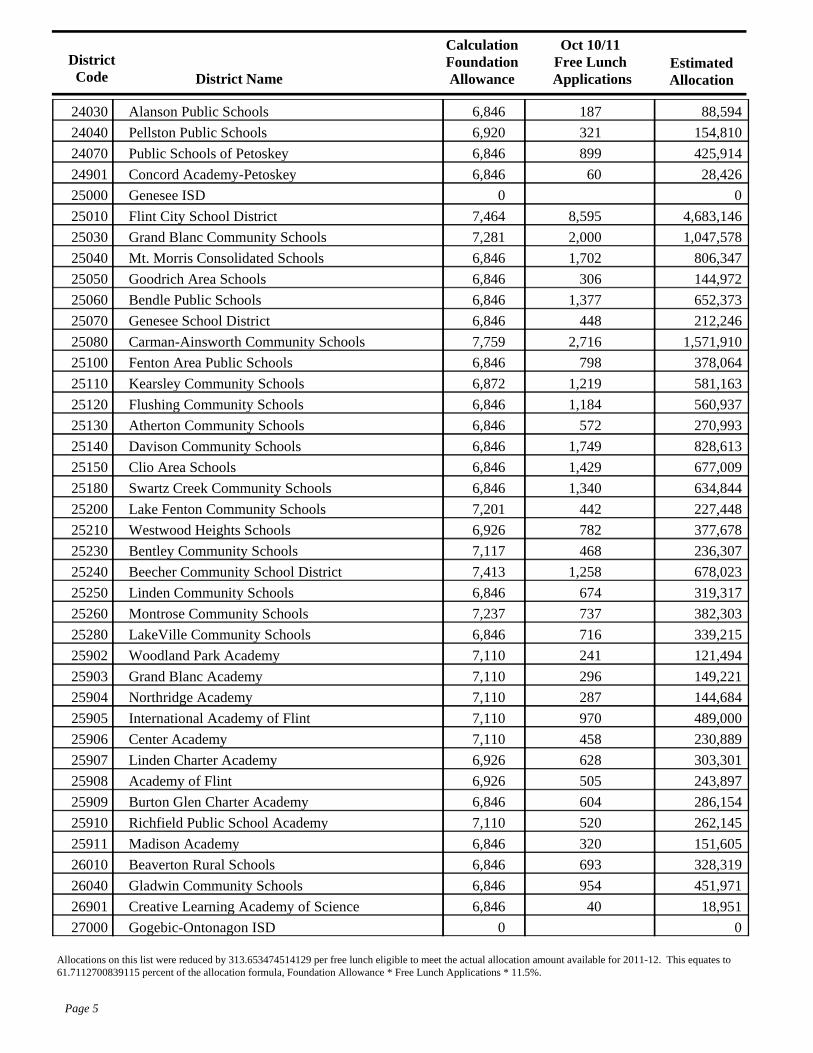
Alanson Public Schools 6,846 187 88,59424030Pellston Public Schools 6,920 321 154,81024040Public Schools of Petoskey 6,846 899 425,91424070Concord Academy-Petoskey 6,846 60 28,42624901Genesee ISD 0 025000Flint City School District 7,464 8,595 4,683,14625010Grand Blanc Community Schools 7,281 2,000 1,047,57825030Mt. Morris Consolidated Schools 6,846 1,702 806,34725040Goodrich Area Schools 6,846 306 144,97225050Bendle Public Schools 6,846 1,377 652,37325060Genesee School District 6,846 448 212,24625070Carman-Ainsworth Community Schools 7,759 2,716 1,571,91025080Fenton Area Public Schools 6,846 798 378,06425100Kearsley Community Schools 6,872 1,219 581,16325110Flushing Community Schools 6,846 1,184 560,93725120Atherton Community Schools 6,846 572 270,99325130Davison Community Schools 6,846 1,749 828,61325140Clio Area Schools 6,846 1,429 677,00925150Swartz Creek Community Schools 6,846 1,340 634,84425180Lake Fenton Community Schools 7,201 442 227,44825200Westwood Heights Schools 6,926 782 377,67825210Bentley Community Schools 7,117 468 236,30725230Beecher Community School District 7,413 1,258 678,02325240Linden Community Schools 6,846 674 319,31725250Montrose Community Schools 7,237 737 382,30325260LakeVille Community Schools 6,846 716 339,21525280Woodland Park Academy 7,110 241 121,49425902Grand Blanc Academy 7,110 296 149,22125903Northridge Academy 7,110 287 144,68425904International Academy of Flint 7,110 970 489,00025905Center Academy 7,110 458 230,88925906Linden Charter Academy 6,926 628 303,30125907Academy of Flint 6,926 505 243,89725908Burton Glen Charter Academy 6,846 604 286,15425909Richfield Public School Academy 7,110 520 262,14525910Madison Academy 6,846 320 151,60525911Beaverton Rural Schools 6,846 693 328,31926010Gladwin Community Schools 6,846 954 451,97126040Creative Learning Academy of Science 6,846 40 18,95126901Gogebic-Ontonagon ISD 0 027000
Page 5
Allocations on this list were reduced by 313.653474514129 per free lunch eligible to meet the actual allocation amount available for 2011-12. This equates to 61.7112700839115 percent of the allocation formula, Foundation Allowance * Free Lunch Applications * 11.5%.
DistrictCode District Name
CalculationFoundationAllowance
Oct 10/11Free Lunch
ApplicationsEstimatedAllocation
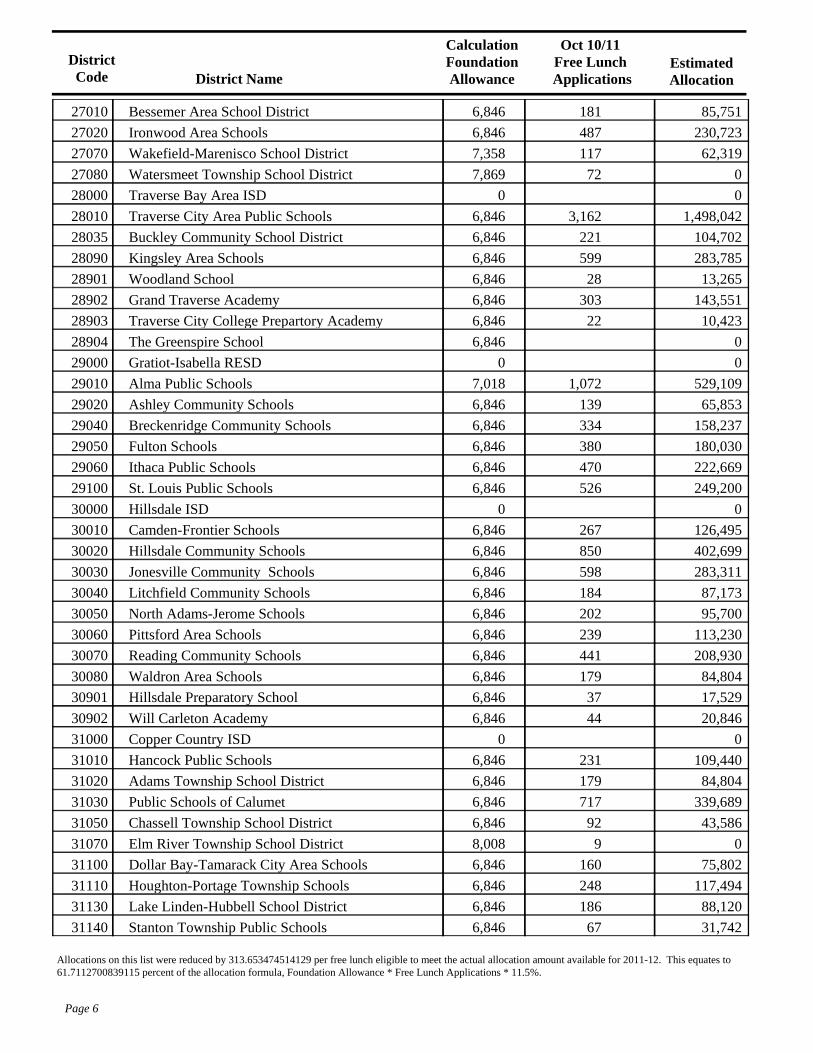
Bessemer Area School District 6,846 181 85,75127010Ironwood Area Schools 6,846 487 230,72327020Wakefield-Marenisco School District 7,358 117 62,31927070Watersmeet Township School District 7,869 72 027080Traverse Bay Area ISD 0 028000Traverse City Area Public Schools 6,846 3,162 1,498,04228010Buckley Community School District 6,846 221 104,70228035Kingsley Area Schools 6,846 599 283,78528090Woodland School 6,846 28 13,26528901Grand Traverse Academy 6,846 303 143,55128902Traverse City College Prepartory Academy 6,846 22 10,42328903The Greenspire School 6,846 028904Gratiot-Isabella RESD 0 029000Alma Public Schools 7,018 1,072 529,10929010Ashley Community Schools 6,846 139 65,85329020Breckenridge Community Schools 6,846 334 158,23729040Fulton Schools 6,846 380 180,03029050Ithaca Public Schools 6,846 470 222,66929060St. Louis Public Schools 6,846 526 249,20029100Hillsdale ISD 0 030000Camden-Frontier Schools 6,846 267 126,49530010Hillsdale Community Schools 6,846 850 402,69930020Jonesville Community Schools 6,846 598 283,31130030Litchfield Community Schools 6,846 184 87,17330040North Adams-Jerome Schools 6,846 202 95,70030050Pittsford Area Schools 6,846 239 113,23030060Reading Community Schools 6,846 441 208,93030070Waldron Area Schools 6,846 179 84,80430080Hillsdale Preparatory School 6,846 37 17,52930901Will Carleton Academy 6,846 44 20,84630902Copper Country ISD 0 031000Hancock Public Schools 6,846 231 109,44031010Adams Township School District 6,846 179 84,80431020Public Schools of Calumet 6,846 717 339,68931030Chassell Township School District 6,846 92 43,58631050Elm River Township School District 8,008 9 031070Dollar Bay-Tamarack City Area Schools 6,846 160 75,80231100Houghton-Portage Township Schools 6,846 248 117,49431110Lake Linden-Hubbell School District 6,846 186 88,12031130Stanton Township Public Schools 6,846 67 31,74231140
Page 6
Allocations on this list were reduced by 313.653474514129 per free lunch eligible to meet the actual allocation amount available for 2011-12. This equates to 61.7112700839115 percent of the allocation formula, Foundation Allowance * Free Lunch Applications * 11.5%.
DistrictCode District Name
CalculationFoundationAllowance
Oct 10/11Free Lunch
ApplicationsEstimatedAllocation
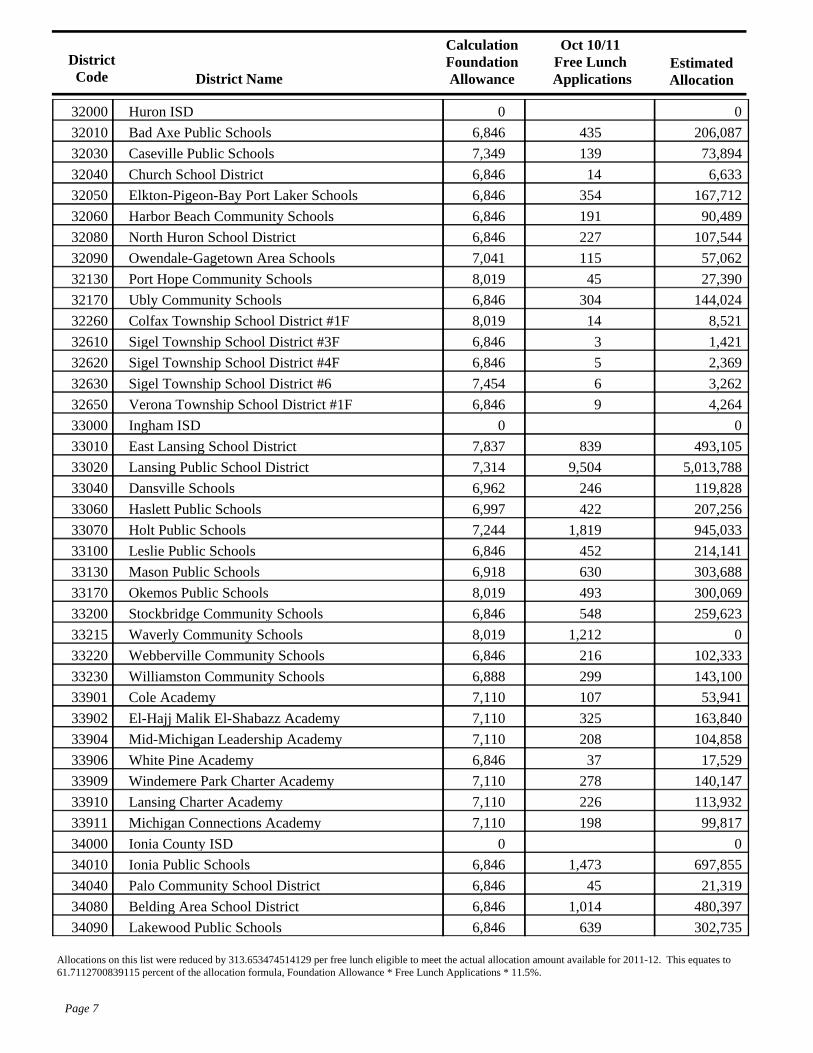
Huron ISD 0 032000Bad Axe Public Schools 6,846 435 206,08732010Caseville Public Schools 7,349 139 73,89432030Church School District 6,846 14 6,63332040Elkton-Pigeon-Bay Port Laker Schools 6,846 354 167,71232050Harbor Beach Community Schools 6,846 191 90,48932060North Huron School District 6,846 227 107,54432080Owendale-Gagetown Area Schools 7,041 115 57,06232090Port Hope Community Schools 8,019 45 27,39032130Ubly Community Schools 6,846 304 144,02432170Colfax Township School District #1F 8,019 14 8,52132260Sigel Township School District #3F 6,846 3 1,42132610Sigel Township School District #4F 6,846 5 2,36932620Sigel Township School District #6 7,454 6 3,26232630Verona Township School District #1F 6,846 9 4,26432650Ingham ISD 0 033000East Lansing School District 7,837 839 493,10533010Lansing Public School District 7,314 9,504 5,013,78833020Dansville Schools 6,962 246 119,82833040Haslett Public Schools 6,997 422 207,25633060Holt Public Schools 7,244 1,819 945,03333070Leslie Public Schools 6,846 452 214,14133100Mason Public Schools 6,918 630 303,68833130Okemos Public Schools 8,019 493 300,06933170Stockbridge Community Schools 6,846 548 259,62333200Waverly Community Schools 8,019 1,212 033215Webberville Community Schools 6,846 216 102,33333220Williamston Community Schools 6,888 299 143,10033230Cole Academy 7,110 107 53,94133901El-Hajj Malik El-Shabazz Academy 7,110 325 163,84033902Mid-Michigan Leadership Academy 7,110 208 104,85833904White Pine Academy 6,846 37 17,52933906Windemere Park Charter Academy 7,110 278 140,14733909Lansing Charter Academy 7,110 226 113,93233910Michigan Connections Academy 7,110 198 99,81733911Ionia County ISD 0 034000Ionia Public Schools 6,846 1,473 697,85534010Palo Community School District 6,846 45 21,31934040Belding Area School District 6,846 1,014 480,39734080Lakewood Public Schools 6,846 639 302,73534090
Page 7
Allocations on this list were reduced by 313.653474514129 per free lunch eligible to meet the actual allocation amount available for 2011-12. This equates to 61.7112700839115 percent of the allocation formula, Foundation Allowance * Free Lunch Applications * 11.5%.
DistrictCode District Name
CalculationFoundationAllowance
Oct 10/11Free Lunch
ApplicationsEstimatedAllocation
Portland Public School District 6,846 510 241,62034110Saranac Community Schools 6,846 378 179,08334120Berlin Township School District #3 6,846 11 5,21134140Easton Township School District #6 6,846 6 2,84334340Ionia Township School District #2 6,846 11 5,21134360Iosco RESA 0 035000Oscoda Area Schools 6,846 824 390,38235010Hale Area Schools 6,846 372 176,24035020Tawas Area Schools 6,846 548 259,62335030Whittemore-Prescott Area Schools 6,846 782 370,48435040Sunrise Education Center 6,846 34 16,10835901Forest Park School District 6,846 170 80,54036015West Iron County Public Schools 6,846 494 234,03936025Mt. Pleasant City School District 6,906 1,107 532,09537010Beal City Public Schools 6,846 183 86,69937040Shepherd Public School District 6,846 639 302,73537060Renaissance Public School Academy 6,906 196 94,21037901Morey Public School Academy 6,906 65 31,24337902Jackson ISD 0 038000Western School District 6,846 897 424,96638010Vandercook Lake Public Schools 6,846 662 313,63238020Columbia School District 6,846 554 262,46538040Grass Lake Community Schools 6,846 227 107,54438050Concord Community Schools 6,846 335 158,71138080East Jackson Community Schools 6,846 684 324,05538090Hanover-Horton Schools 6,846 324 153,50038100Michigan Center School District 6,846 650 307,94738120Napoleon Community Schools 6,846 500 236,88238130Northwest Community Schools 6,846 1,177 557,62038140Springport Public Schools 6,846 476 225,51238150Jackson Public Schools 6,896 3,742 1,794,34238170The da Vinci Institute 6,896 190 91,10838901Paragon Charter Academy 6,896 313 150,08838902Kalamazoo RESA 0 039000Kalamazoo Public School District 7,398 7,933 4,261,91239010Climax-Scotts Community Schools 6,846 172 81,48739020Comstock Public Schools 6,846 1,408 667,06039030Galesburg-Augusta Community Schools 6,944 522 253,18839050Gull Lake Community Schools 6,846 520 246,35739065Parchment School District 6,846 741 351,05939130
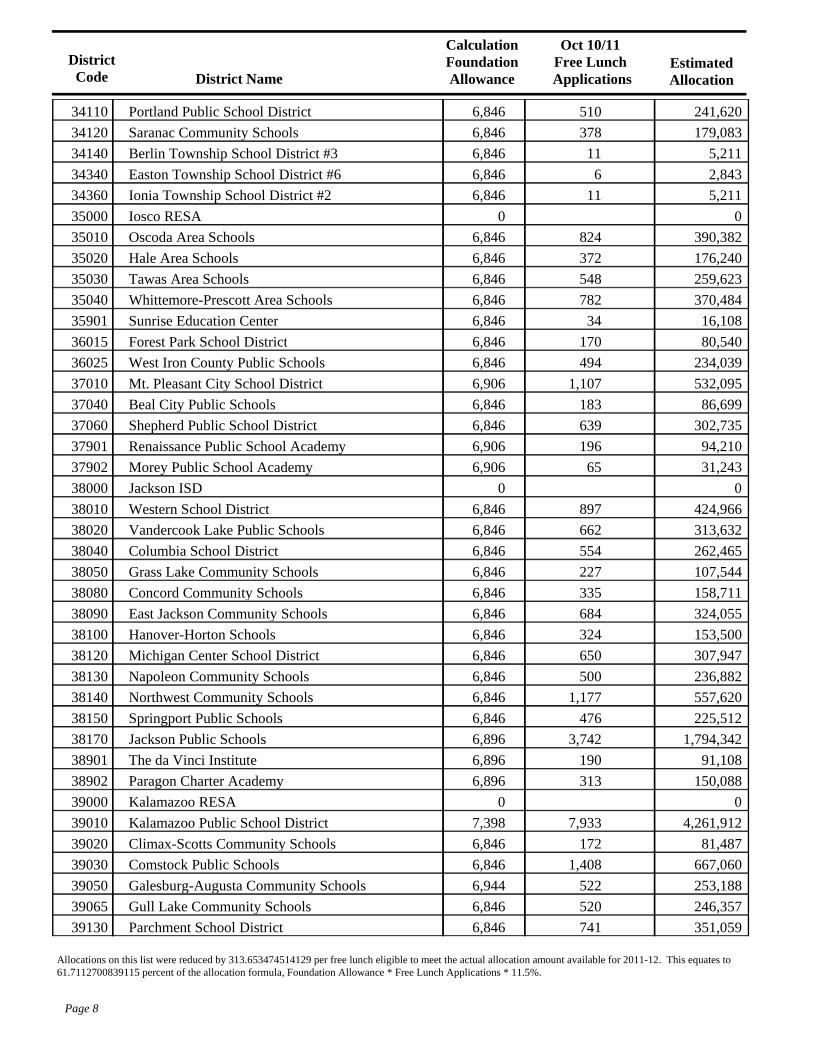
Page 8
Allocations on this list were reduced by 313.653474514129 per free lunch eligible to meet the actual allocation amount available for 2011-12. This equates to 61.7112700839115 percent of the allocation formula, Foundation Allowance * Free Lunch Applications * 11.5%.
DistrictCode District Name
CalculationFoundationAllowance
Oct 10/11Free Lunch
ApplicationsEstimatedAllocation
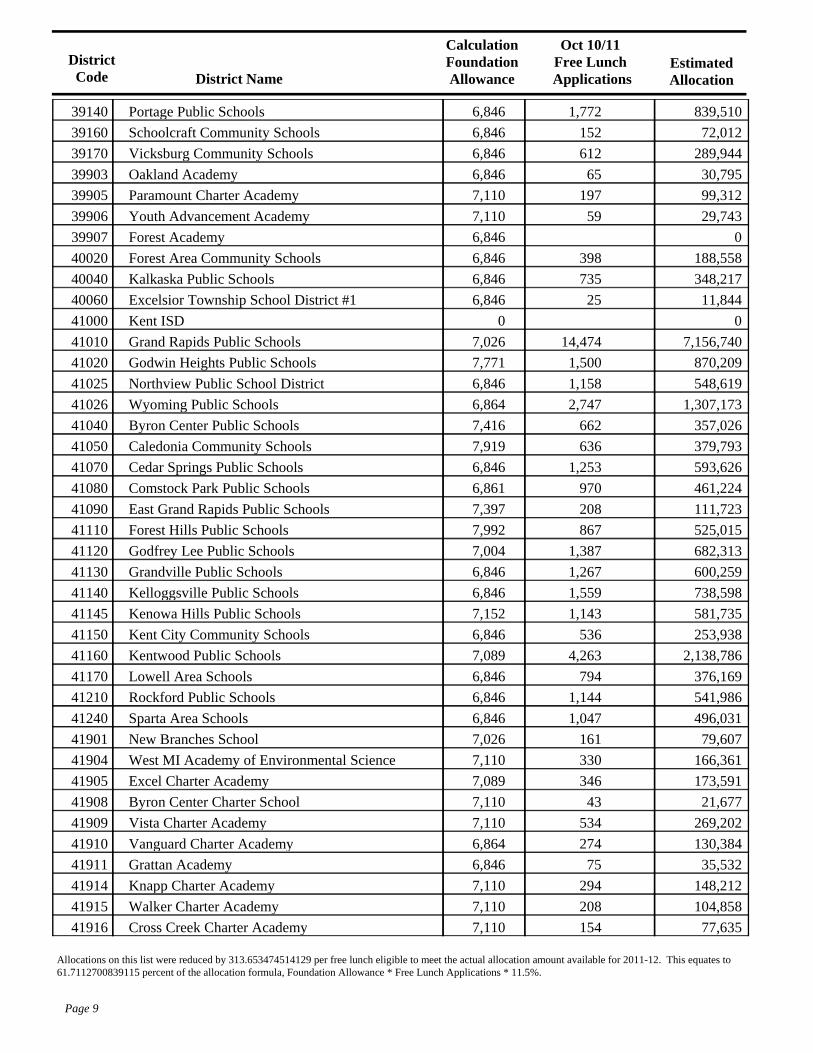
Portage Public Schools 6,846 1,772 839,51039140Schoolcraft Community Schools 6,846 152 72,01239160Vicksburg Community Schools 6,846 612 289,94439170Oakland Academy 6,846 65 30,79539903Paramount Charter Academy 7,110 197 99,31239905Youth Advancement Academy 7,110 59 29,74339906Forest Academy 6,846 039907Forest Area Community Schools 6,846 398 188,55840020Kalkaska Public Schools 6,846 735 348,21740040Excelsior Township School District #1 6,846 25 11,84440060Kent ISD 0 041000Grand Rapids Public Schools 7,026 14,474 7,156,74041010Godwin Heights Public Schools 7,771 1,500 870,20941020Northview Public School District 6,846 1,158 548,61941025Wyoming Public Schools 6,864 2,747 1,307,17341026Byron Center Public Schools 7,416 662 357,02641040Caledonia Community Schools 7,919 636 379,79341050Cedar Springs Public Schools 6,846 1,253 593,62641070Comstock Park Public Schools 6,861 970 461,22441080East Grand Rapids Public Schools 7,397 208 111,72341090Forest Hills Public Schools 7,992 867 525,01541110Godfrey Lee Public Schools 7,004 1,387 682,31341120Grandville Public Schools 6,846 1,267 600,25941130Kelloggsville Public Schools 6,846 1,559 738,59841140Kenowa Hills Public Schools 7,152 1,143 581,73541145Kent City Community Schools 6,846 536 253,93841150Kentwood Public Schools 7,089 4,263 2,138,78641160Lowell Area Schools 6,846 794 376,16941170Rockford Public Schools 6,846 1,144 541,98641210Sparta Area Schools 6,846 1,047 496,03141240New Branches School 7,026 161 79,60741901West MI Academy of Environmental Science 7,110 330 166,36141904Excel Charter Academy 7,089 346 173,59141905Byron Center Charter School 7,110 43 21,67741908Vista Charter Academy 7,110 534 269,20241909Vanguard Charter Academy 6,864 274 130,38441910Grattan Academy 6,846 75 35,53241911Knapp Charter Academy 7,110 294 148,21241914Walker Charter Academy 7,110 208 104,85841915Cross Creek Charter Academy 7,110 154 77,63541916
Page 9
Allocations on this list were reduced by 313.653474514129 per free lunch eligible to meet the actual allocation amount available for 2011-12. This equates to 61.7112700839115 percent of the allocation formula, Foundation Allowance * Free Lunch Applications * 11.5%.
DistrictCode District Name
CalculationFoundationAllowance
Oct 10/11Free Lunch
ApplicationsEstimatedAllocation
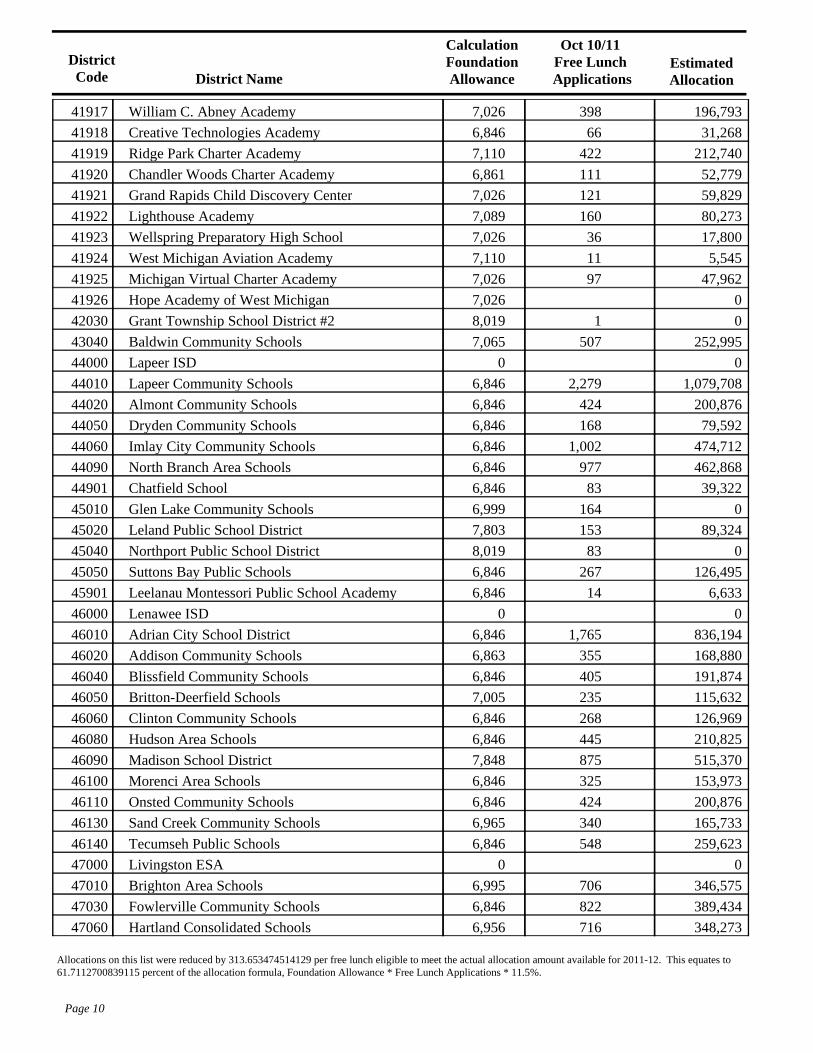
William C. Abney Academy 7,026 398 196,79341917Creative Technologies Academy 6,846 66 31,26841918Ridge Park Charter Academy 7,110 422 212,74041919Chandler Woods Charter Academy 6,861 111 52,77941920Grand Rapids Child Discovery Center 7,026 121 59,82941921Lighthouse Academy 7,089 160 80,27341922Wellspring Preparatory High School 7,026 36 17,80041923West Michigan Aviation Academy 7,110 11 5,54541924Michigan Virtual Charter Academy 7,026 97 47,96241925Hope Academy of West Michigan 7,026 041926Grant Township School District #2 8,019 1 042030Baldwin Community Schools 7,065 507 252,99543040Lapeer ISD 0 044000Lapeer Community Schools 6,846 2,279 1,079,70844010Almont Community Schools 6,846 424 200,87644020Dryden Community Schools 6,846 168 79,59244050Imlay City Community Schools 6,846 1,002 474,71244060North Branch Area Schools 6,846 977 462,86844090Chatfield School 6,846 83 39,32244901Glen Lake Community Schools 6,999 164 045010Leland Public School District 7,803 153 89,32445020Northport Public School District 8,019 83 045040Suttons Bay Public Schools 6,846 267 126,49545050Leelanau Montessori Public School Academy 6,846 14 6,63345901Lenawee ISD 0 046000Adrian City School District 6,846 1,765 836,19446010Addison Community Schools 6,863 355 168,88046020Blissfield Community Schools 6,846 405 191,87446040Britton-Deerfield Schools 7,005 235 115,63246050Clinton Community Schools 6,846 268 126,96946060Hudson Area Schools 6,846 445 210,82546080Madison School District 7,848 875 515,37046090Morenci Area Schools 6,846 325 153,97346100Onsted Community Schools 6,846 424 200,87646110Sand Creek Community Schools 6,965 340 165,73346130Tecumseh Public Schools 6,846 548 259,62346140Livingston ESA 0 047000Brighton Area Schools 6,995 706 346,57547010Fowlerville Community Schools 6,846 822 389,43447030Hartland Consolidated Schools 6,956 716 348,27347060
Page 10
Allocations on this list were reduced by 313.653474514129 per free lunch eligible to meet the actual allocation amount available for 2011-12. This equates to 61.7112700839115 percent of the allocation formula, Foundation Allowance * Free Lunch Applications * 11.5%.
DistrictCode District Name
CalculationFoundationAllowance
Oct 10/11Free Lunch
ApplicationsEstimatedAllocation
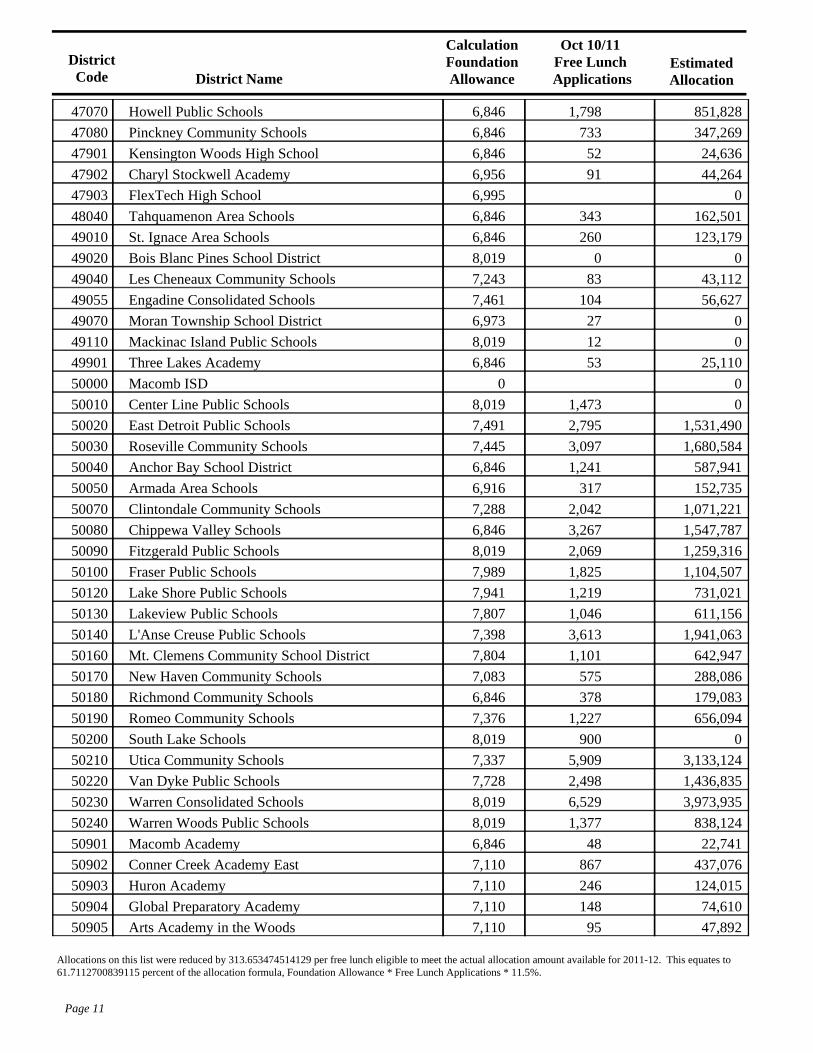
Howell Public Schools 6,846 1,798 851,82847070Pinckney Community Schools 6,846 733 347,26947080Kensington Woods High School 6,846 52 24,63647901Charyl Stockwell Academy 6,956 91 44,26447902FlexTech High School 6,995 047903Tahquamenon Area Schools 6,846 343 162,50148040St. Ignace Area Schools 6,846 260 123,17949010Bois Blanc Pines School District 8,019 0 049020Les Cheneaux Community Schools 7,243 83 43,11249040Engadine Consolidated Schools 7,461 104 56,62749055Moran Township School District 6,973 27 049070Mackinac Island Public Schools 8,019 12 049110Three Lakes Academy 6,846 53 25,11049901Macomb ISD 0 050000Center Line Public Schools 8,019 1,473 050010East Detroit Public Schools 7,491 2,795 1,531,49050020Roseville Community Schools 7,445 3,097 1,680,58450030Anchor Bay School District 6,846 1,241 587,94150040Armada Area Schools 6,916 317 152,73550050Clintondale Community Schools 7,288 2,042 1,071,22150070Chippewa Valley Schools 6,846 3,267 1,547,78750080Fitzgerald Public Schools 8,019 2,069 1,259,31650090Fraser Public Schools 7,989 1,825 1,104,50750100Lake Shore Public Schools 7,941 1,219 731,02150120Lakeview Public Schools 7,807 1,046 611,15650130L'Anse Creuse Public Schools 7,398 3,613 1,941,06350140Mt. Clemens Community School District 7,804 1,101 642,94750160New Haven Community Schools 7,083 575 288,08650170Richmond Community Schools 6,846 378 179,08350180Romeo Community Schools 7,376 1,227 656,09450190South Lake Schools 8,019 900 050200Utica Community Schools 7,337 5,909 3,133,12450210Van Dyke Public Schools 7,728 2,498 1,436,83550220Warren Consolidated Schools 8,019 6,529 3,973,93550230Warren Woods Public Schools 8,019 1,377 838,12450240Macomb Academy 6,846 48 22,74150901Conner Creek Academy East 7,110 867 437,07650902Huron Academy 7,110 246 124,01550903Global Preparatory Academy 7,110 148 74,61050904Arts Academy in the Woods 7,110 95 47,89250905
Page 11
Allocations on this list were reduced by 313.653474514129 per free lunch eligible to meet the actual allocation amount available for 2011-12. This equates to 61.7112700839115 percent of the allocation formula, Foundation Allowance * Free Lunch Applications * 11.5%.
DistrictCode District Name
CalculationFoundationAllowance
Oct 10/11Free Lunch
ApplicationsEstimatedAllocation
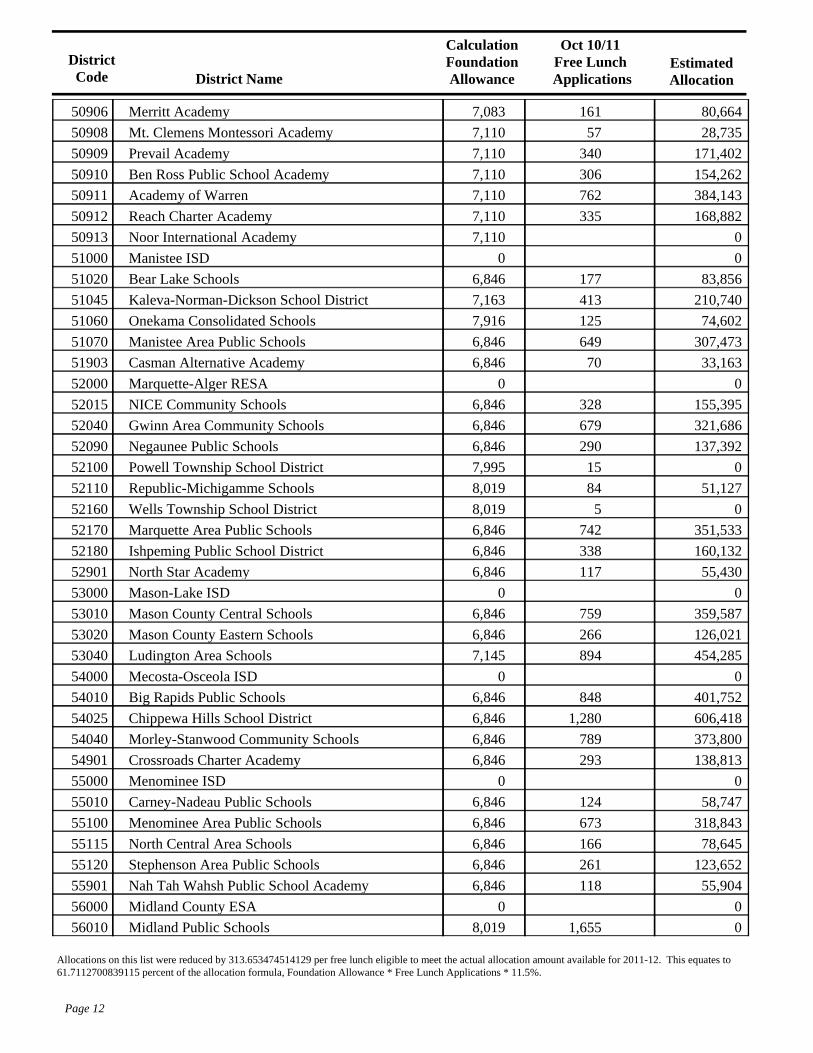
Merritt Academy 7,083 161 80,66450906Mt. Clemens Montessori Academy 7,110 57 28,73550908Prevail Academy 7,110 340 171,40250909Ben Ross Public School Academy 7,110 306 154,26250910Academy of Warren 7,110 762 384,14350911Reach Charter Academy 7,110 335 168,88250912Noor International Academy 7,110 050913Manistee ISD 0 051000Bear Lake Schools 6,846 177 83,85651020Kaleva-Norman-Dickson School District 7,163 413 210,74051045Onekama Consolidated Schools 7,916 125 74,60251060Manistee Area Public Schools 6,846 649 307,47351070Casman Alternative Academy 6,846 70 33,16351903Marquette-Alger RESA 0 052000NICE Community Schools 6,846 328 155,39552015Gwinn Area Community Schools 6,846 679 321,68652040Negaunee Public Schools 6,846 290 137,39252090Powell Township School District 7,995 15 052100Republic-Michigamme Schools 8,019 84 51,12752110Wells Township School District 8,019 5 052160Marquette Area Public Schools 6,846 742 351,53352170Ishpeming Public School District 6,846 338 160,13252180North Star Academy 6,846 117 55,43052901Mason-Lake ISD 0 053000Mason County Central Schools 6,846 759 359,58753010Mason County Eastern Schools 6,846 266 126,02153020Ludington Area Schools 7,145 894 454,28553040Mecosta-Osceola ISD 0 054000Big Rapids Public Schools 6,846 848 401,75254010Chippewa Hills School District 6,846 1,280 606,41854025Morley-Stanwood Community Schools 6,846 789 373,80054040Crossroads Charter Academy 6,846 293 138,81354901Menominee ISD 0 055000Carney-Nadeau Public Schools 6,846 124 58,74755010Menominee Area Public Schools 6,846 673 318,84355100North Central Area Schools 6,846 166 78,64555115Stephenson Area Public Schools 6,846 261 123,65255120Nah Tah Wahsh Public School Academy 6,846 118 55,90455901Midland County ESA 0 056000Midland Public Schools 8,019 1,655 056010
Page 12
Allocations on this list were reduced by 313.653474514129 per free lunch eligible to meet the actual allocation amount available for 2011-12. This equates to 61.7112700839115 percent of the allocation formula, Foundation Allowance * Free Lunch Applications * 11.5%.
DistrictCode District Name
CalculationFoundationAllowance
Oct 10/11Free Lunch
ApplicationsEstimatedAllocation
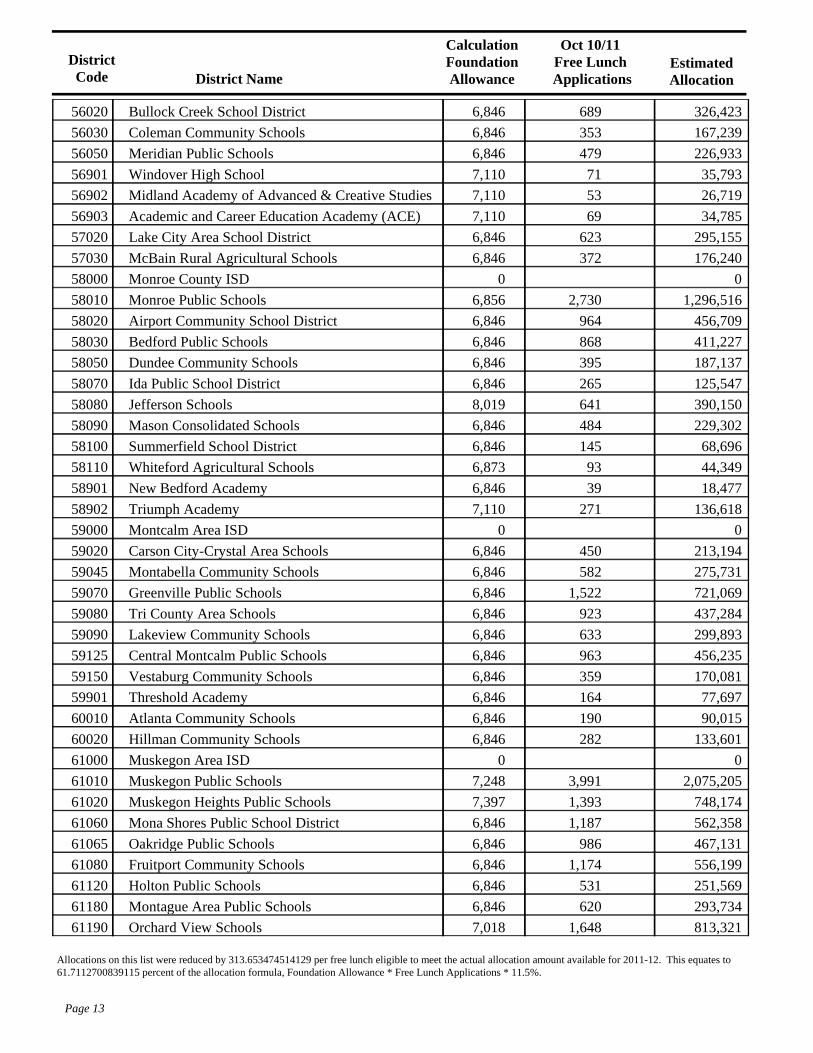
Bullock Creek School District 6,846 689 326,42356020Coleman Community Schools 6,846 353 167,23956030Meridian Public Schools 6,846 479 226,93356050Windover High School 7,110 71 35,79356901Midland Academy of Advanced & Creative Studies 7,110 53 26,71956902Academic and Career Education Academy (ACE) 7,110 69 34,78556903Lake City Area School District 6,846 623 295,15557020McBain Rural Agricultural Schools 6,846 372 176,24057030Monroe County ISD 0 058000Monroe Public Schools 6,856 2,730 1,296,51658010Airport Community School District 6,846 964 456,70958020Bedford Public Schools 6,846 868 411,22758030Dundee Community Schools 6,846 395 187,13758050Ida Public School District 6,846 265 125,54758070Jefferson Schools 8,019 641 390,15058080Mason Consolidated Schools 6,846 484 229,30258090Summerfield School District 6,846 145 68,69658100Whiteford Agricultural Schools 6,873 93 44,34958110New Bedford Academy 6,846 39 18,47758901Triumph Academy 7,110 271 136,61858902Montcalm Area ISD 0 059000Carson City-Crystal Area Schools 6,846 450 213,19459020Montabella Community Schools 6,846 582 275,73159045Greenville Public Schools 6,846 1,522 721,06959070Tri County Area Schools 6,846 923 437,28459080Lakeview Community Schools 6,846 633 299,89359090Central Montcalm Public Schools 6,846 963 456,23559125Vestaburg Community Schools 6,846 359 170,08159150Threshold Academy 6,846 164 77,69759901Atlanta Community Schools 6,846 190 90,01560010Hillman Community Schools 6,846 282 133,60160020Muskegon Area ISD 0 061000Muskegon Public Schools 7,248 3,991 2,075,20561010Muskegon Heights Public Schools 7,397 1,393 748,17461020Mona Shores Public School District 6,846 1,187 562,35861060Oakridge Public Schools 6,846 986 467,13161065Fruitport Community Schools 6,846 1,174 556,19961080Holton Public Schools 6,846 531 251,56961120Montague Area Public Schools 6,846 620 293,73461180Orchard View Schools 7,018 1,648 813,32161190
Page 13
Allocations on this list were reduced by 313.653474514129 per free lunch eligible to meet the actual allocation amount available for 2011-12. This equates to 61.7112700839115 percent of the allocation formula, Foundation Allowance * Free Lunch Applications * 11.5%.
DistrictCode District Name
CalculationFoundationAllowance
Oct 10/11Free Lunch
ApplicationsEstimatedAllocation
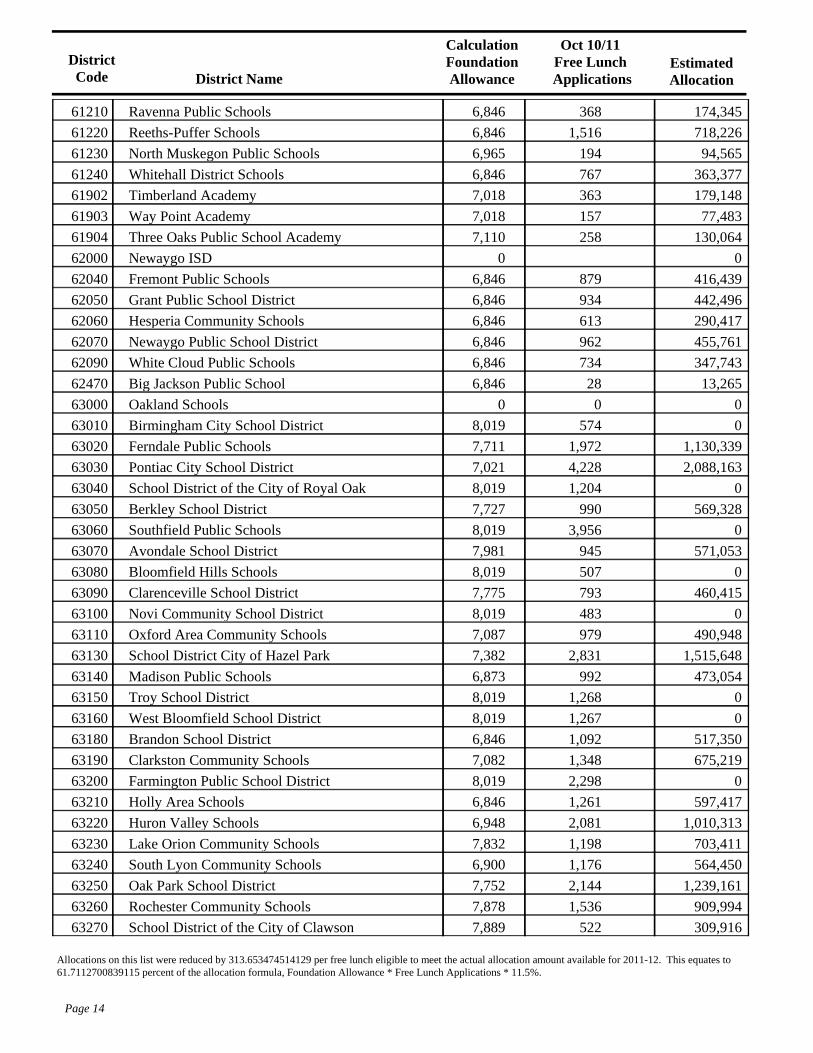
Ravenna Public Schools 6,846 368 174,34561210Reeths-Puffer Schools 6,846 1,516 718,22661220North Muskegon Public Schools 6,965 194 94,56561230Whitehall District Schools 6,846 767 363,37761240Timberland Academy 7,018 363 179,14861902Way Point Academy 7,018 157 77,48361903Three Oaks Public School Academy 7,110 258 130,06461904Newaygo ISD 0 062000Fremont Public Schools 6,846 879 416,43962040Grant Public School District 6,846 934 442,49662050Hesperia Community Schools 6,846 613 290,41762060Newaygo Public School District 6,846 962 455,76162070White Cloud Public Schools 6,846 734 347,74362090Big Jackson Public School 6,846 28 13,26562470Oakland Schools 0 0 063000Birmingham City School District 8,019 574 063010Ferndale Public Schools 7,711 1,972 1,130,33963020Pontiac City School District 7,021 4,228 2,088,16363030School District of the City of Royal Oak 8,019 1,204 063040Berkley School District 7,727 990 569,32863050Southfield Public Schools 8,019 3,956 063060Avondale School District 7,981 945 571,05363070Bloomfield Hills Schools 8,019 507 063080Clarenceville School District 7,775 793 460,41563090Novi Community School District 8,019 483 063100Oxford Area Community Schools 7,087 979 490,94863110School District City of Hazel Park 7,382 2,831 1,515,64863130Madison Public Schools 6,873 992 473,05463140Troy School District 8,019 1,268 063150West Bloomfield School District 8,019 1,267 063160Brandon School District 6,846 1,092 517,35063180Clarkston Community Schools 7,082 1,348 675,21963190Farmington Public School District 8,019 2,298 063200Holly Area Schools 6,846 1,261 597,41763210Huron Valley Schools 6,948 2,081 1,010,31363220Lake Orion Community Schools 7,832 1,198 703,41163230South Lyon Community Schools 6,900 1,176 564,45063240Oak Park School District 7,752 2,144 1,239,16163250Rochester Community Schools 7,878 1,536 909,99463260School District of the City of Clawson 7,889 522 309,91663270
Page 14
Allocations on this list were reduced by 313.653474514129 per free lunch eligible to meet the actual allocation amount available for 2011-12. This equates to 61.7112700839115 percent of the allocation formula, Foundation Allowance * Free Lunch Applications * 11.5%.
DistrictCode District Name
CalculationFoundationAllowance
Oct 10/11Free Lunch
ApplicationsEstimatedAllocation
Lamphere Public Schools 8,019 1,179 063280Walled Lake Consolidated Schools 8,019 2,839 063290Waterford School District 7,175 4,412 2,257,17563300A.G.B.U. Alex & Marie Manoogian School 7,110 184 92,75963901Academy of Southfield 7,110 329 165,85763903Pontiac Academy for Excellence 7,021 1,218 601,55763906Great Lakes Academy 7,021 224 110,63163907Edison Oakland Public School Academy 7,110 566 285,33463910Holly Academy 6,846 118 55,90463911Oakland International Academy 7,110 607 306,00363912Walton Charter Academy 7,021 560 276,57863913Advanced Technology Academy 7,110 929 468,33163914Arts & Technology Academy of Pontiac 7,021 322 159,03263915Academy of Waterford 7,110 171 86,20563916Bradford Academy 7,110 950 478,91863917Laurus Academy 7,110 432 217,78263918Woodmont Academy 7,110 266 134,09763919Life Skills Center of Pontiac 7,021 139 68,65163920Crescent Academy 7,110 326 164,34463921Great Oaks Academy 7,110 511 257,60763922Four Corners Montessori Academy 6,873 104 49,59463923Michigan Math and Science Academy 7,110 137 69,06563924Taylor International Academy 7,110 64 32,26463925Oceana ISD 0 064000Hart Public School District 6,925 723 349,09564040Pentwater Public Schools 7,749 135 064070Shelby Public Schools 7,022 865 427,34864080Walkerville Public Schools 6,846 252 119,38964090West Branch-Rose City Area Schools 6,846 1,146 542,93465045Ewen-Trout Creek Cons. School District 6,846 110 52,11466045Ontonagon Area Schools 6,973 180 87,90666050Evart Public Schools 6,846 610 288,99667020Marion Public Schools 6,846 333 157,76367050Pine River Area Schools 6,846 604 286,15467055Reed City Public Schools 6,846 658 311,73767060Mio-AuSable Schools 6,846 379 179,55768010Fairview Area Schools 6,846 161 76,27668030Gaylord Community Schools 6,846 1,291 611,62969020Johannesburg-Lewiston Area Schools 7,318 344 181,64769030Vanderbilt Area Schools 6,846 90 42,63969040
Page 15
Allocations on this list were reduced by 313.653474514129 per free lunch eligible to meet the actual allocation amount available for 2011-12. This equates to 61.7112700839115 percent of the allocation formula, Foundation Allowance * Free Lunch Applications * 11.5%.
DistrictCode District Name
CalculationFoundationAllowance
Oct 10/11Free Lunch
ApplicationsEstimatedAllocation
Ottawa Area ISD 0 070000Grand Haven Area Public Schools 7,234 1,622 840,81970010Holland City School District 6,978 2,320 1,134,35070020Allendale Public Schools 6,846 506 239,72570040West Ottawa Public School District 6,846 3,218 1,524,57370070Coopersville Area Public Schools 6,846 688 325,95070120Jenison Public Schools 6,846 906 429,23070175Hudsonville Public Schools 6,846 974 461,44670190Spring Lake Public Schools 6,880 367 175,30670300Zeeland Public Schools 6,846 1,142 541,03970350Walden Green Montessori 7,110 56 28,23170901West MI Academy for Arts & Academics 7,110 96 48,39670902Black River Public School 6,978 94 45,96170904Vanderbilt Charter Academy 6,978 289 141,30570905Eagle's Crest Charter Academy 6,846 222 105,17670906Wavecrest Career Academy 6,978 93 45,47270907Onaway Area Community School District 6,846 361 171,02971050Posen Consolidated School District 6,846 109 51,64071060Rogers City Area Schools 6,846 210 99,49071080Presque Isle Academy II 6,846 43 20,37271902COOR ISD 0 072000Roscommon Area Public Schools 6,846 770 364,79872010Houghton Lake Community Schools 6,846 994 470,92272020Saginaw ISD 0 073000Saginaw School District 7,094 6,022 3,024,75573010Carrollton Public Schools 6,846 1,332 631,05473030Saginaw Township Community Schools 6,846 1,787 846,61673040Buena Vista School District 7,776 770 447,15073080Chesaning Union Schools 6,846 644 305,10473110Birch Run Area School District 6,846 624 295,62973170Bridgeport-Spaulding Comm. School District 7,053 1,044 519,45373180Frankenmuth School District 7,473 153 83,51873190Freeland Community School District 6,846 312 147,81473200Hemlock Public Schools 6,846 293 138,81373210Merrill Community Schools 6,846 271 128,39073230St. Charles Community Schools 6,846 397 188,08473240Swan Valley School District 6,846 477 225,98573255Saginaw County Transition Academy 7,094 102 51,23373905Saginaw Preparatory Academy 7,110 370 186,52673908Francis Reh Public School Academy 7,094 353 177,30673909
Page 16
Allocations on this list were reduced by 313.653474514129 per free lunch eligible to meet the actual allocation amount available for 2011-12. This equates to 61.7112700839115 percent of the allocation formula, Foundation Allowance * Free Lunch Applications * 11.5%.
DistrictCode District Name
CalculationFoundationAllowance
Oct 10/11Free Lunch
ApplicationsEstimatedAllocation
North Saginaw Charter Academy 7,094 356 178,81373910Saginaw Learn to Earn Academy 6,846 104 49,27173911International Academy of Saginaw 7,053 218 108,46873912St. Clair County RESA 0 074000Port Huron Area School District 6,914 4,647 2,237,88474010Algonac Community Schools 6,846 719 340,63674030Capac Community Schools 6,846 540 255,83374040East China Township School District 7,494 1,292 708,38374050Marysville Public Schools 6,846 580 274,78374100Memphis Community Schools 6,846 285 135,02374120Yale Public Schools 6,846 696 329,74074130St. Clair County Learning Academy 6,914 18 8,66874901Landmark Academy 6,914 358 172,40474903Blue Water Learning Academy 6,846 19 9,00274906Academic Transitional Academy 6,914 0 074908St. Clair County Academy of Style 6,846 0 074910St. Clair County Intervention Academy 6,914 44 21,18974911Virtual Learning Academy of St. Clair 6,846 75 35,53274912St. Clair County Career Prep Academy 6,914 0 074913Blue Water Middle College Academy 6,914 074914St. Joseph ISD 0 075000Sturgis Public Schools 6,846 1,804 854,67075010Burr Oak Community Schools 6,846 214 101,38675020Centreville Public Schools 6,846 344 162,97575030Colon Community Schools 6,846 324 153,50075040Constantine Public Schools 6,846 780 369,53675050Mendon Community Schools 6,846 266 126,02175060White Pigeon Community Schools 6,846 472 223,61775070Three Rivers Community Schools 6,846 1,340 634,84475080Nottawa Community Schools 6,846 52 24,63675100Sanilac ISD 0 076000Brown City Community Schools 6,846 457 216,51076060Carsonville-Port Sanilac Schools 6,846 314 148,76276070Croswell-Lexington Community Schools 6,846 953 451,49776080Deckerville Community School District 6,846 340 161,08076090Marlette Community Schools 6,846 481 227,88176140Peck Community Schools 6,846 218 103,28176180Sandusky Community Schools 6,846 486 230,24976210Manistique Area Schools 6,846 365 172,92477010Shiawassee RESD 0 078000
Page 17
Allocations on this list were reduced by 313.653474514129 per free lunch eligible to meet the actual allocation amount available for 2011-12. This equates to 61.7112700839115 percent of the allocation formula, Foundation Allowance * Free Lunch Applications * 11.5%.
DistrictCode District Name
CalculationFoundationAllowance
Oct 10/11Free Lunch
ApplicationsEstimatedAllocation
Byron Area Schools 6,846 419 198,50778020Durand Area Schools 6,846 742 351,53378030Laingsburg Community Schools 6,846 220 104,22878040Morrice Area Schools 6,846 203 96,17478060New Lothrop Area Public Schools 6,846 164 77,69778070Perry Public Schools 6,846 563 266,72978080Corunna Public Schools 6,846 911 431,59978100Owosso Public Schools 6,846 1,652 782,65878110Tuscola ISD 0 079000Akron-Fairgrove Schools 6,846 168 79,59279010Caro Community Schools 6,846 884 418,80779020Cass City Public Schools 6,846 489 231,67179030Kingston Community Schools 6,846 292 138,33979080Mayville Community School District 6,846 443 209,87879090Millington Community Schools 6,846 605 286,62779100Reese Public Schools 6,846 324 153,50079110Unionville-Sebewaing Area Schools 6,846 288 136,44479145Vassar Public Schools 6,846 758 359,11379150Van Buren ISD 0 080000South Haven Public Schools 6,846 1,042 493,66280010Bangor Public Schools 6,926 822 396,96280020Covert Public Schools 8,019 527 080040Decatur Public Schools 6,846 488 231,19780050Bloomingdale Public School District 6,846 1,067 505,50680090Gobles Public Schools 6,846 364 172,45080110Hartford Public Schools 7,021 1,147 566,48880120Lawrence Public School District 6,846 358 169,60880130Lawton Community School District 6,846 511 242,09380140Mattawan Consolidated School 6,846 549 260,09680150Paw Paw Public Schools 6,846 846 400,80480160Bangor Township School District 8 8,019 3 080240Washtenaw ISD 0 081000Ann Arbor Public Schools 8,019 3,325 081010School District of Ypsilanti 7,513 2,340 1,288,09881020Chelsea School District 7,180 266 136,23881040Dexter Community School District 7,468 288 157,04581050Lincoln Consolidated School District 6,846 2,035 964,11081070Manchester Community Schools 7,043 197 97,79581080Milan Area Schools 6,846 689 326,42381100Saline Area Schools 7,173 417 213,24181120
Page 18
Allocations on this list were reduced by 313.653474514129 per free lunch eligible to meet the actual allocation amount available for 2011-12. This equates to 61.7112700839115 percent of the allocation formula, Foundation Allowance * Free Lunch Applications * 11.5%.
DistrictCode District Name
CalculationFoundationAllowance
Oct 10/11Free Lunch
ApplicationsEstimatedAllocation
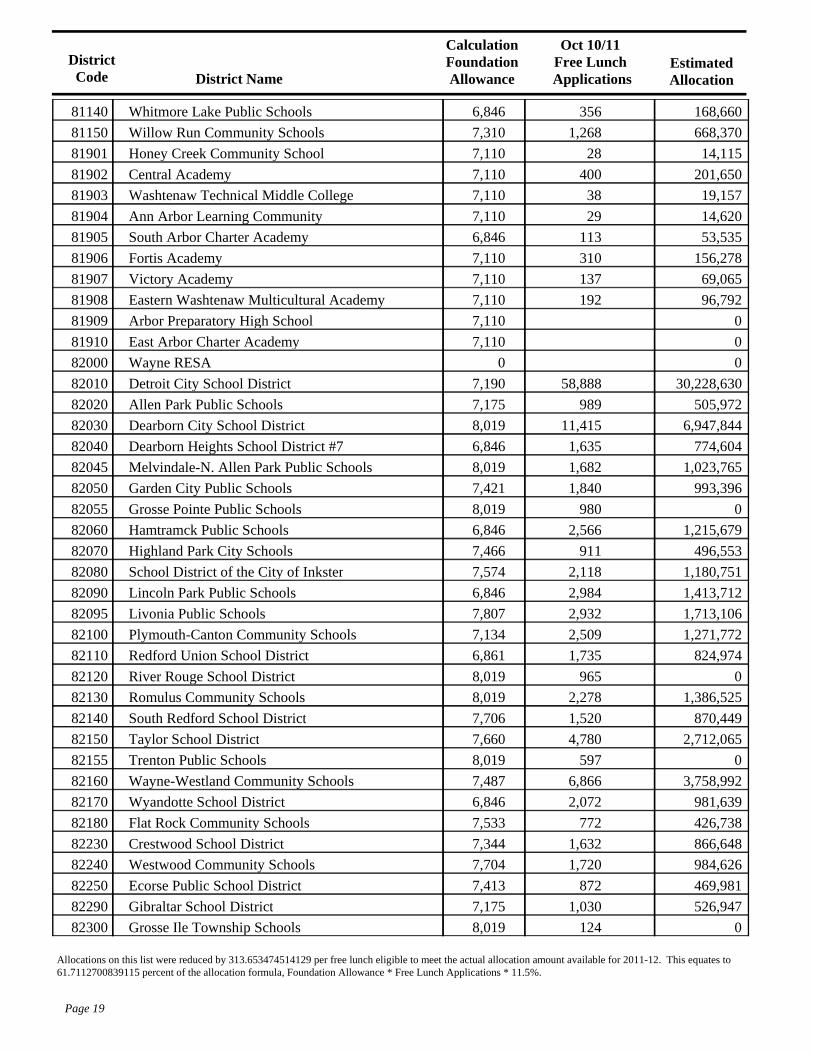
Whitmore Lake Public Schools 6,846 356 168,66081140Willow Run Community Schools 7,310 1,268 668,37081150Honey Creek Community School 7,110 28 14,11581901Central Academy 7,110 400 201,65081902Washtenaw Technical Middle College 7,110 38 19,15781903Ann Arbor Learning Community 7,110 29 14,62081904South Arbor Charter Academy 6,846 113 53,53581905Fortis Academy 7,110 310 156,27881906Victory Academy 7,110 137 69,06581907Eastern Washtenaw Multicultural Academy 7,110 192 96,79281908Arbor Preparatory High School 7,110 081909East Arbor Charter Academy 7,110 081910Wayne RESA 0 082000Detroit City School District 7,190 58,888 30,228,63082010Allen Park Public Schools 7,175 989 505,97282020Dearborn City School District 8,019 11,415 6,947,84482030Dearborn Heights School District #7 6,846 1,635 774,60482040Melvindale-N. Allen Park Public Schools 8,019 1,682 1,023,76582045Garden City Public Schools 7,421 1,840 993,39682050Grosse Pointe Public Schools 8,019 980 082055Hamtramck Public Schools 6,846 2,566 1,215,67982060Highland Park City Schools 7,466 911 496,55382070School District of the City of Inkster 7,574 2,118 1,180,75182080Lincoln Park Public Schools 6,846 2,984 1,413,71282090Livonia Public Schools 7,807 2,932 1,713,10682095Plymouth-Canton Community Schools 7,134 2,509 1,271,77282100Redford Union School District 6,861 1,735 824,97482110River Rouge School District 8,019 965 082120Romulus Community Schools 8,019 2,278 1,386,52582130South Redford School District 7,706 1,520 870,44982140Taylor School District 7,660 4,780 2,712,06582150Trenton Public Schools 8,019 597 082155Wayne-Westland Community Schools 7,487 6,866 3,758,99282160Wyandotte School District 6,846 2,072 981,63982170Flat Rock Community Schools 7,533 772 426,73882180Crestwood School District 7,344 1,632 866,64882230Westwood Community Schools 7,704 1,720 984,62682240Ecorse Public School District 7,413 872 469,98182250Gibraltar School District 7,175 1,030 526,94782290Grosse Ile Township Schools 8,019 124 082300
Page 19
Allocations on this list were reduced by 313.653474514129 per free lunch eligible to meet the actual allocation amount available for 2011-12. This equates to 61.7112700839115 percent of the allocation formula, Foundation Allowance * Free Lunch Applications * 11.5%.
DistrictCode District Name
CalculationFoundationAllowance
Oct 10/11Free Lunch
ApplicationsEstimatedAllocation
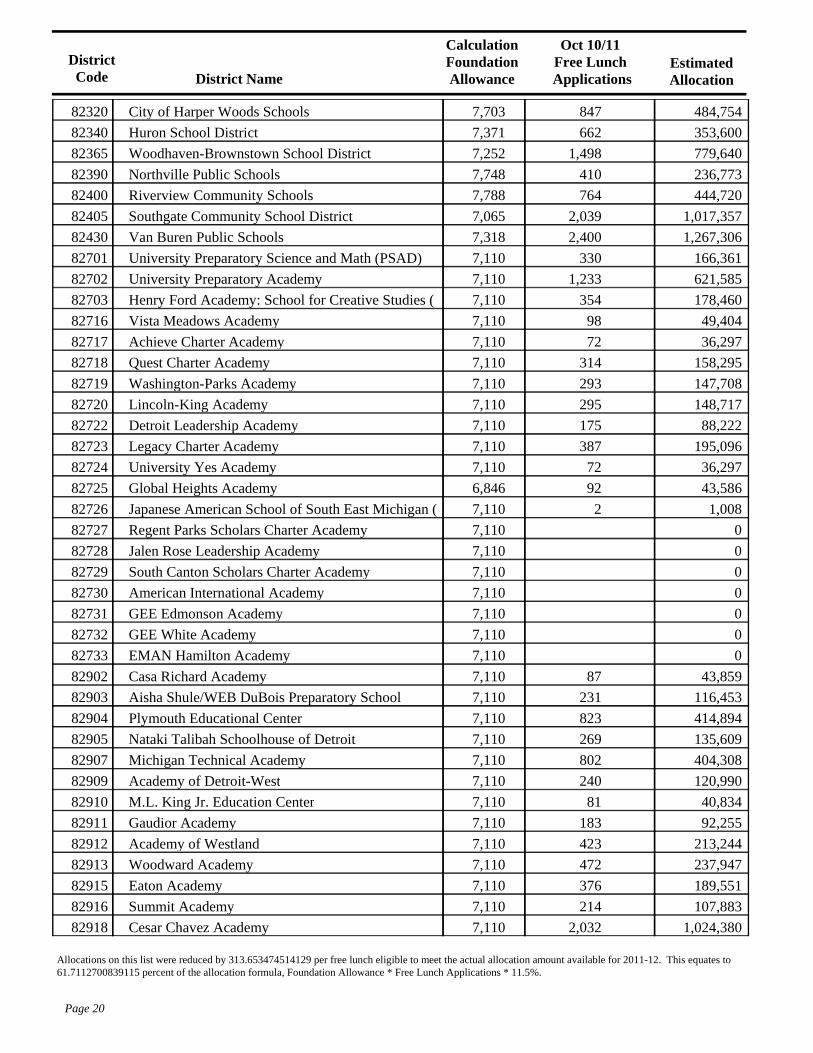
City of Harper Woods Schools 7,703 847 484,75482320Huron School District 7,371 662 353,60082340Woodhaven-Brownstown School District 7,252 1,498 779,64082365Northville Public Schools 7,748 410 236,77382390Riverview Community Schools 7,788 764 444,72082400Southgate Community School District 7,065 2,039 1,017,35782405Van Buren Public Schools 7,318 2,400 1,267,30682430University Preparatory Science and Math (PSAD) 7,110 330 166,36182701University Preparatory Academy 7,110 1,233 621,58582702Henry Ford Academy: School for Creative Studies ( 7,110 354 178,46082703Vista Meadows Academy 7,110 98 49,40482716Achieve Charter Academy 7,110 72 36,29782717Quest Charter Academy 7,110 314 158,29582718Washington-Parks Academy 7,110 293 147,70882719Lincoln-King Academy 7,110 295 148,71782720Detroit Leadership Academy 7,110 175 88,22282722Legacy Charter Academy 7,110 387 195,09682723University Yes Academy 7,110 72 36,29782724Global Heights Academy 6,846 92 43,58682725Japanese American School of South East Michigan ( 7,110 2 1,00882726Regent Parks Scholars Charter Academy 7,110 082727Jalen Rose Leadership Academy 7,110 082728South Canton Scholars Charter Academy 7,110 082729American International Academy 7,110 082730GEE Edmonson Academy 7,110 082731GEE White Academy 7,110 082732EMAN Hamilton Academy 7,110 082733Casa Richard Academy 7,110 87 43,85982902Aisha Shule/WEB DuBois Preparatory School 7,110 231 116,45382903Plymouth Educational Center 7,110 823 414,89482904Nataki Talibah Schoolhouse of Detroit 7,110 269 135,60982905Michigan Technical Academy 7,110 802 404,30882907Academy of Detroit-West 7,110 240 120,99082909M.L. King Jr. Education Center 7,110 81 40,83482910Gaudior Academy 7,110 183 92,25582911Academy of Westland 7,110 423 213,24482912Woodward Academy 7,110 472 237,94782913Eaton Academy 7,110 376 189,55182915Summit Academy 7,110 214 107,88382916Cesar Chavez Academy 7,110 2,032 1,024,38082918
Page 20
Allocations on this list were reduced by 313.653474514129 per free lunch eligible to meet the actual allocation amount available for 2011-12. This equates to 61.7112700839115 percent of the allocation formula, Foundation Allowance * Free Lunch Applications * 11.5%.
DistrictCode District Name
CalculationFoundationAllowance
Oct 10/11Free Lunch
ApplicationsEstimatedAllocation
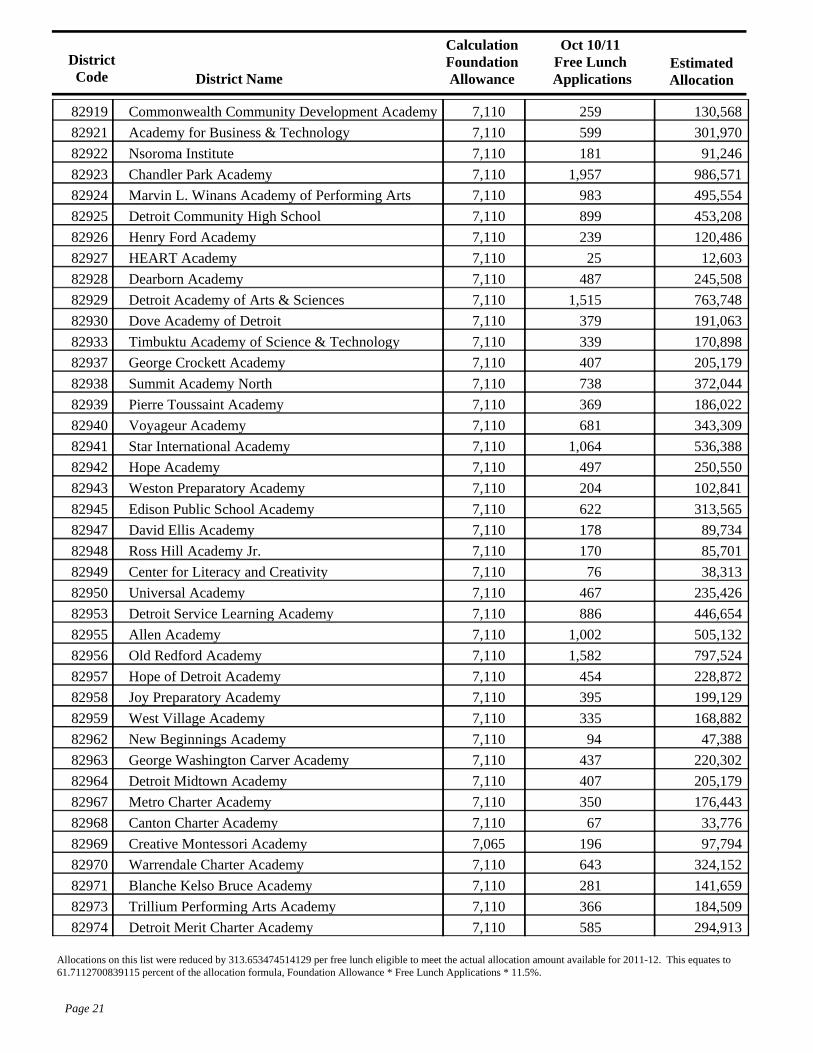
Commonwealth Community Development Academy 7,110 259 130,56882919Academy for Business & Technology 7,110 599 301,97082921Nsoroma Institute 7,110 181 91,24682922Chandler Park Academy 7,110 1,957 986,57182923Marvin L. Winans Academy of Performing Arts 7,110 983 495,55482924Detroit Community High School 7,110 899 453,20882925Henry Ford Academy 7,110 239 120,48682926HEART Academy 7,110 25 12,60382927Dearborn Academy 7,110 487 245,50882928Detroit Academy of Arts & Sciences 7,110 1,515 763,74882929Dove Academy of Detroit 7,110 379 191,06382930Timbuktu Academy of Science & Technology 7,110 339 170,89882933George Crockett Academy 7,110 407 205,17982937Summit Academy North 7,110 738 372,04482938Pierre Toussaint Academy 7,110 369 186,02282939Voyageur Academy 7,110 681 343,30982940Star International Academy 7,110 1,064 536,38882941Hope Academy 7,110 497 250,55082942Weston Preparatory Academy 7,110 204 102,84182943Edison Public School Academy 7,110 622 313,56582945David Ellis Academy 7,110 178 89,73482947Ross Hill Academy Jr. 7,110 170 85,70182948Center for Literacy and Creativity 7,110 76 38,31382949Universal Academy 7,110 467 235,42682950Detroit Service Learning Academy 7,110 886 446,65482953Allen Academy 7,110 1,002 505,13282955Old Redford Academy 7,110 1,582 797,52482956Hope of Detroit Academy 7,110 454 228,87282957Joy Preparatory Academy 7,110 395 199,12982958West Village Academy 7,110 335 168,88282959New Beginnings Academy 7,110 94 47,38882962George Washington Carver Academy 7,110 437 220,30282963Detroit Midtown Academy 7,110 407 205,17982964Metro Charter Academy 7,110 350 176,44382967Canton Charter Academy 7,110 67 33,77682968Creative Montessori Academy 7,065 196 97,79482969Warrendale Charter Academy 7,110 643 324,15282970Blanche Kelso Bruce Academy 7,110 281 141,65982971Trillium Performing Arts Academy 7,110 366 184,50982973Detroit Merit Charter Academy 7,110 585 294,91382974
Page 21
Allocations on this list were reduced by 313.653474514129 per free lunch eligible to meet the actual allocation amount available for 2011-12. This equates to 61.7112700839115 percent of the allocation formula, Foundation Allowance * Free Lunch Applications * 11.5%.
DistrictCode District Name
CalculationFoundationAllowance
Oct 10/11Free Lunch
ApplicationsEstimatedAllocation
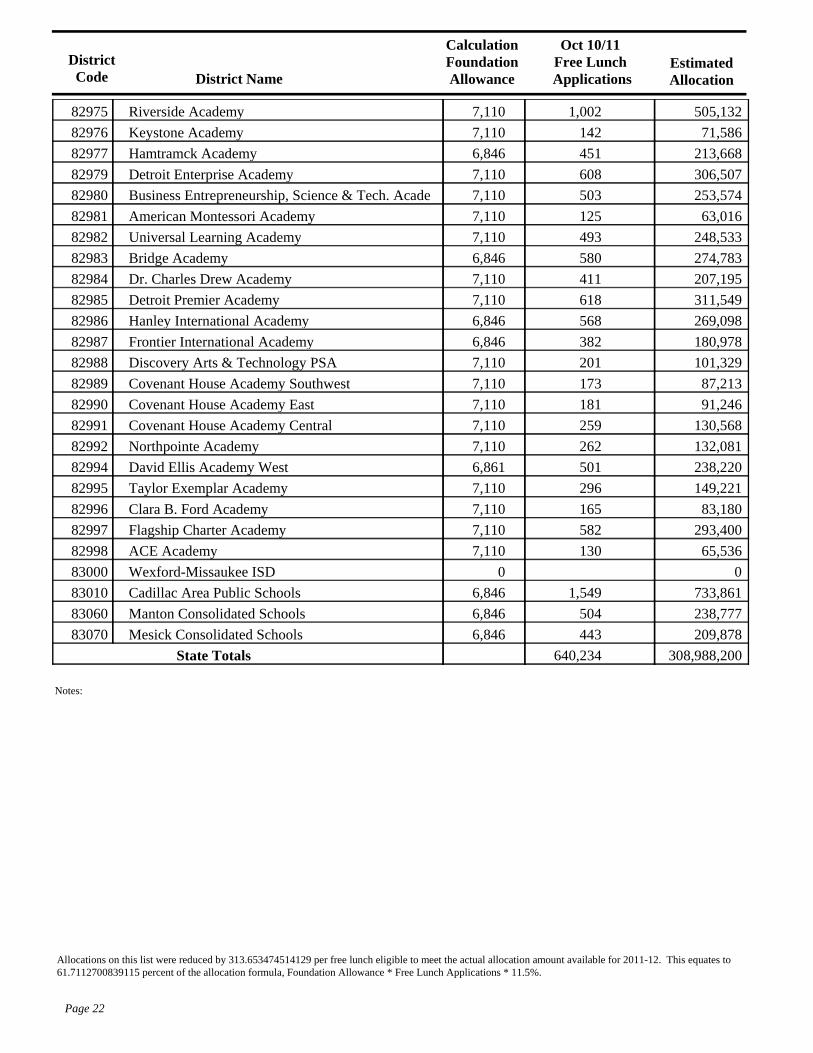
Riverside Academy 7,110 1,002 505,13282975Keystone Academy 7,110 142 71,58682976Hamtramck Academy 6,846 451 213,66882977Detroit Enterprise Academy 7,110 608 306,50782979Business Entrepreneurship, Science & Tech. Acade 7,110 503 253,57482980American Montessori Academy 7,110 125 63,01682981Universal Learning Academy 7,110 493 248,53382982Bridge Academy 6,846 580 274,78382983Dr. Charles Drew Academy 7,110 411 207,19582984Detroit Premier Academy 7,110 618 311,54982985Hanley International Academy 6,846 568 269,09882986Frontier International Academy 6,846 382 180,97882987Discovery Arts & Technology PSA 7,110 201 101,32982988Covenant House Academy Southwest 7,110 173 87,21382989Covenant House Academy East 7,110 181 91,24682990Covenant House Academy Central 7,110 259 130,56882991Northpointe Academy 7,110 262 132,08182992David Ellis Academy West 6,861 501 238,22082994Taylor Exemplar Academy 7,110 296 149,22182995Clara B. Ford Academy 7,110 165 83,18082996Flagship Charter Academy 7,110 582 293,40082997ACE Academy 7,110 130 65,53682998Wexford-Missaukee ISD 0 083000Cadillac Area Public Schools 6,846 1,549 733,86183010Manton Consolidated Schools 6,846 504 238,77783060Mesick Consolidated Schools 6,846 443 209,87883070
State Totals 308,988,200
Notes:
640,234
Page 22
Allocations on this list were reduced by 313.653474514129 per free lunch eligible to meet the actual allocation amount available for 2011-12. This equates to 61.7112700839115 percent of the allocation formula, Foundation Allowance * Free Lunch Applications * 11.5%.