Embed Size (px)
Citation preview
2010/11Report Card for the Ontario Drug Benefit
Program

2
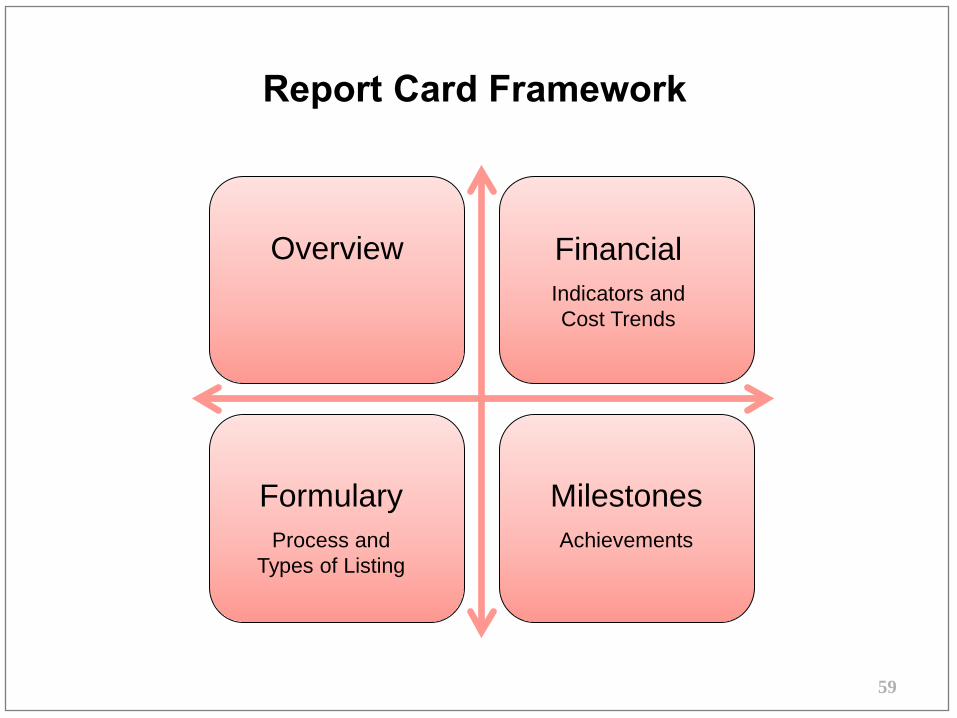
Report Card Framework
Overview Financial Indicators and Cost Trends
Formulary Process and
Types of Listing
Milestones Achievements
3
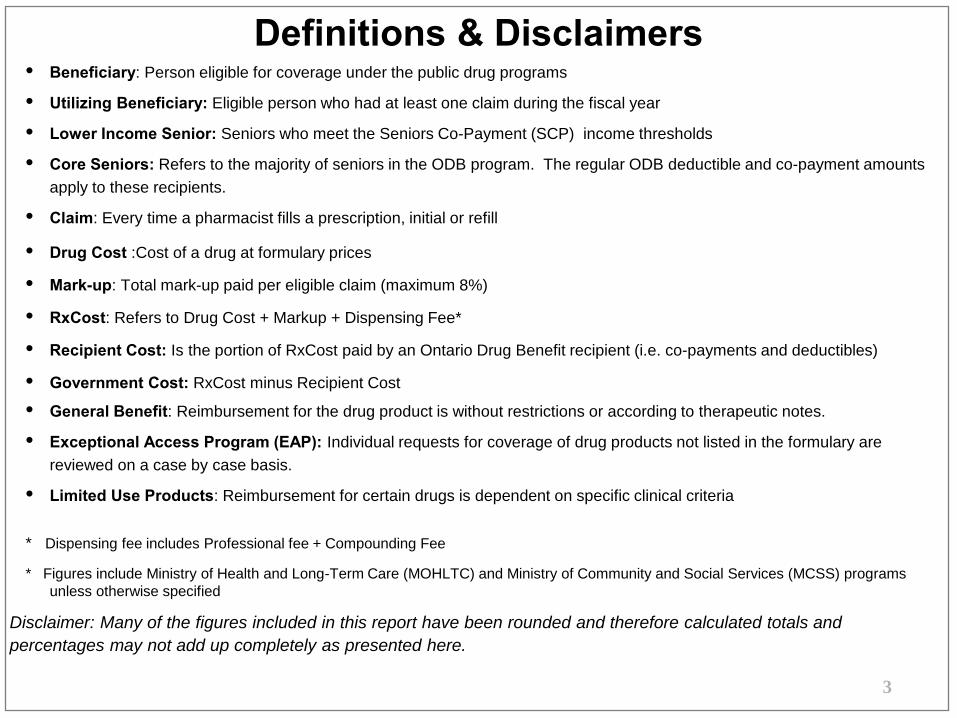
Definitions & Disclaimers • Beneficiary: Person eligible for coverage under the public drug programs
• Utilizing Beneficiary: Eligible person who had at least one claim during the fiscal year
• Lower Income Senior: Seniors who meet the Seniors Co-Payment (SCP) income thresholds
• Core Seniors: Refers to the majority of seniors in the ODB program. The regular ODB deductible and co-payment amounts apply to these recipients.
• Claim: Every time a pharmacist fills a prescription, initial or refill
• Drug Cost :Cost of a drug at formulary prices
• Mark-up: Total mark-up paid per eligible claim (maximum 8%)
• RxCost: Refers to Drug Cost + Markup + Dispensing Fee*
• Recipient Cost: Is the portion of RxCost paid by an Ontario Drug Benefit recipient (i.e. co-payments and deductibles)
• Government Cost: RxCost minus Recipient Cost
• General Benefit: Reimbursement for the drug product is without restrictions or according to therapeutic notes.
• Exceptional Access Program (EAP): Individual requests for coverage of drug products not listed in the formulary are reviewed on a case by case basis.
• Limited Use Products: Reimbursement for certain drugs is dependent on specific clinical criteria
* Dispensing fee includes Professional fee + Compounding Fee
* Figures include Ministry of Health and Long-Term Care (MOHLTC) and Ministry of Community and Social Services (MCSS) programs unless otherwise specified
Disclaimer: Many of the figures included in this report have been rounded and therefore calculated totals and percentages may not add up completely as presented here.
4
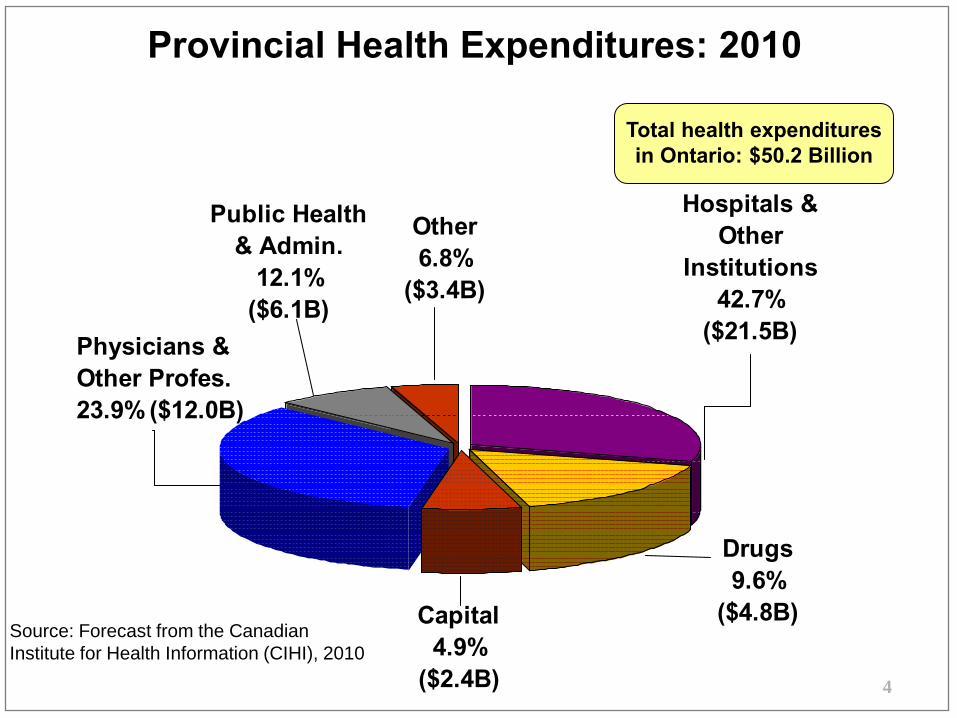
Hospitals & Other
Institutions42.7%
($21.5B)
Drugs9.6%
($4.8B)Capital4.9%
($2.4B)
Public Health & Admin.
12.1%($6.1B)
Other 6.8%
($3.4B)
Physicians & Other Profes.23.9% ($12.0B)
Provincial Health Expenditures: 2010
Total health expenditures in Ontario: $50.2 Billion
Source: Forecast from the Canadian Institute for Health Information (CIHI), 2010
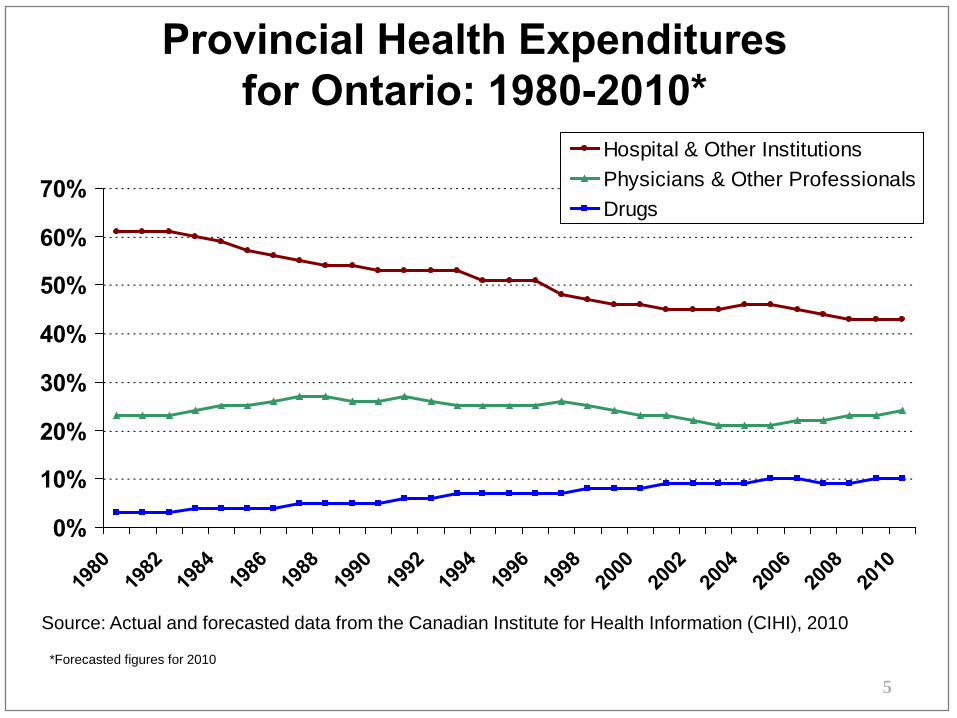
Provincial Health Expenditures for Ontario: 1980-2010*
Source: Actual and forecasted data from the Canadian Institute for Health Information (CIHI), 2010
*Forecasted figures for 2010
5
0%
10%
20%
30%
40%
50%
60%
70%
1980
1982
1984
1986
1988
1990
1992
1994
1996
1998
2000
2002
2004
2006
2008
2010
Hospital & Other InstitutionsPhysicians & Other ProfessionalsDrugs
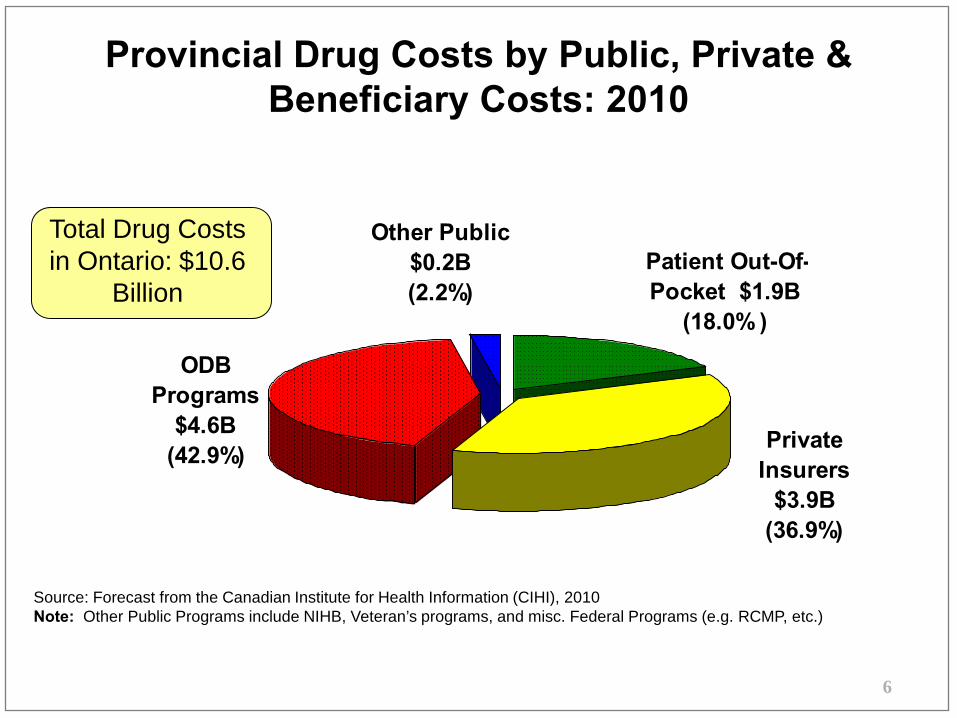
Provincial Drug Costs by Public, Private & Beneficiary Costs: 2010
Total Drug Costs in Ontario: $10.6
Billion
Source: Forecast from the Canadian Institute for Health Information (CIHI), 2010 Note: Other Public Programs include NIHB, Veteran’s programs, and misc. Federal Programs (e.g. RCMP, etc.)
6
Patient Out-Of-Pocket $1.9B
(18.0% )
Private Insurers
$3.9B(36.9%)
ODB Programs
$4.6B(42.9%)
Other Public$0.2B(2.2%)
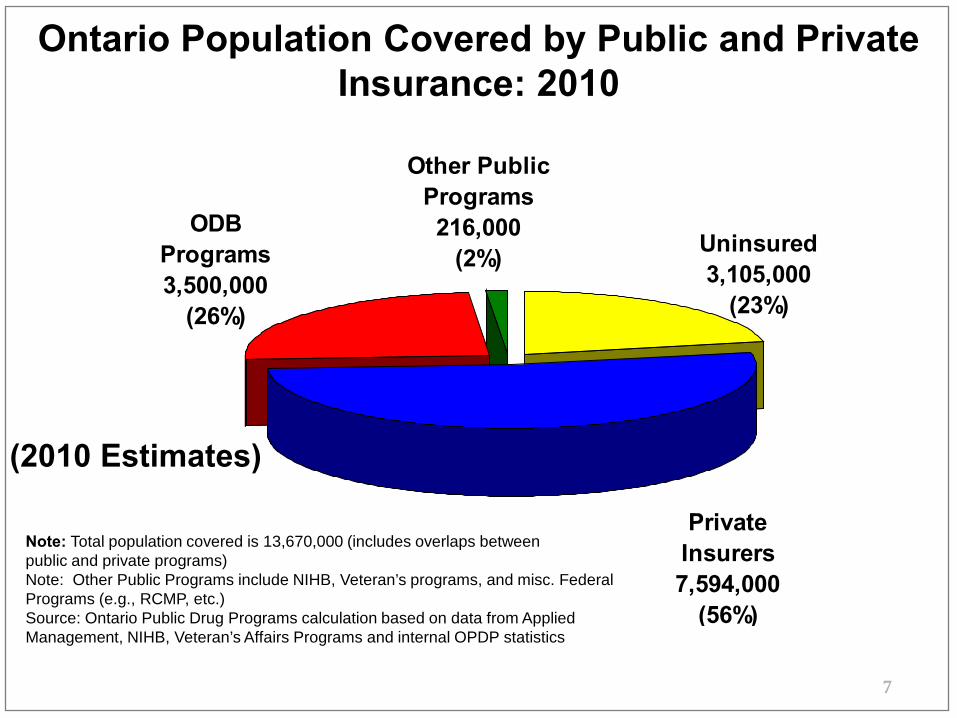
Ontario Population Covered by Public and Private Insurance: 2010
Note: Total population covered is 13,670,000 (includes overlaps between public and private programs) Note: Other Public Programs include NIHB, Veteran’s programs, and misc. Federal Programs (e.g., RCMP, etc.) Source: Ontario Public Drug Programs calculation based on data from Applied Management, NIHB, Veteran’s Affairs Programs and internal OPDP statistics
7
Other Public Programs 216,000
(2%)ODB
Programs3,500,000
(26%)
Private Insurers7,594,000
(56%)
Uninsured3,105,000
(23%)
(2010 Estimates)
8
1.8M
2.0M
2.2M
2.4M
2.6M
2.8MBeneficiaries
0M
20M
40M
60M
80M
100M
120M
140MClaims
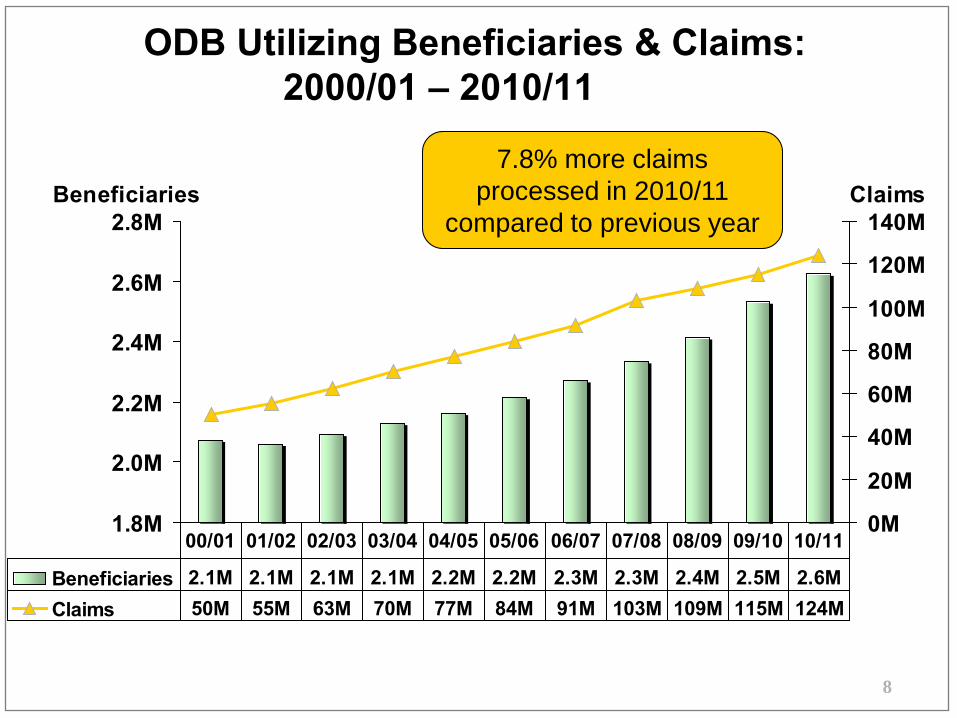
Beneficiaries 2.1M 2.1M 2.1M 2.1M 2.2M 2.2M 2.3M 2.3M 2.4M 2.5M 2.6MClaims 50M 55M 63M 70M 77M 84M 91M 103M 109M 115M 124M
00/01 01/02 02/03 03/04 04/05 05/06 06/07 07/08 08/09 09/10 10/11
ODB Utilizing Beneficiaries & Claims: 2000/01 – 2010/11
7.8% more claims processed in 2010/11
compared to previous year
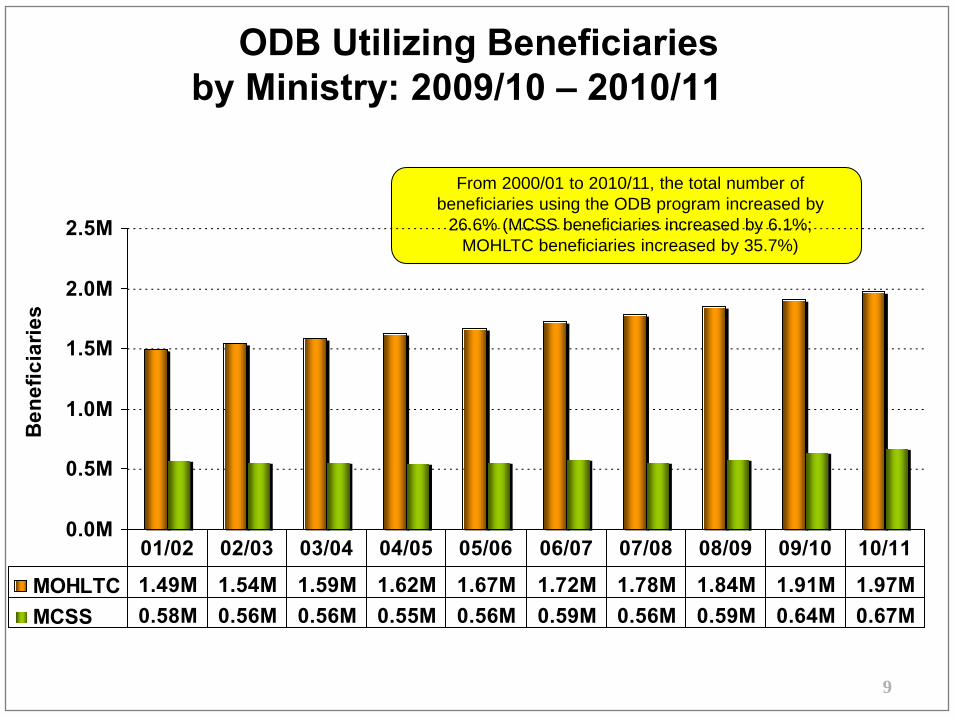
ODB Utilizing Beneficiaries by Ministry: 2009/10 – 2010/11
From 2000/01 to 2010/11, the total number of beneficiaries using the ODB program increased by
26.6% (MCSS beneficiaries increased by 6.1%; MOHLTC beneficiaries increased by 35.7%)
9
0.0M
0.5M
1.0M
1.5M
2.0M
2.5M
Ben
efic
iarie
s
MOHLTC 1.49M 1.54M 1.59M 1.62M 1.67M 1.72M 1.78M 1.84M 1.91M 1.97MMCSS 0.58M 0.56M 0.56M 0.55M 0.56M 0.59M 0.56M 0.59M 0.64M 0.67M
01/02 02/03 03/04 04/05 05/06 06/07 07/08 08/09 09/10 10/11
10
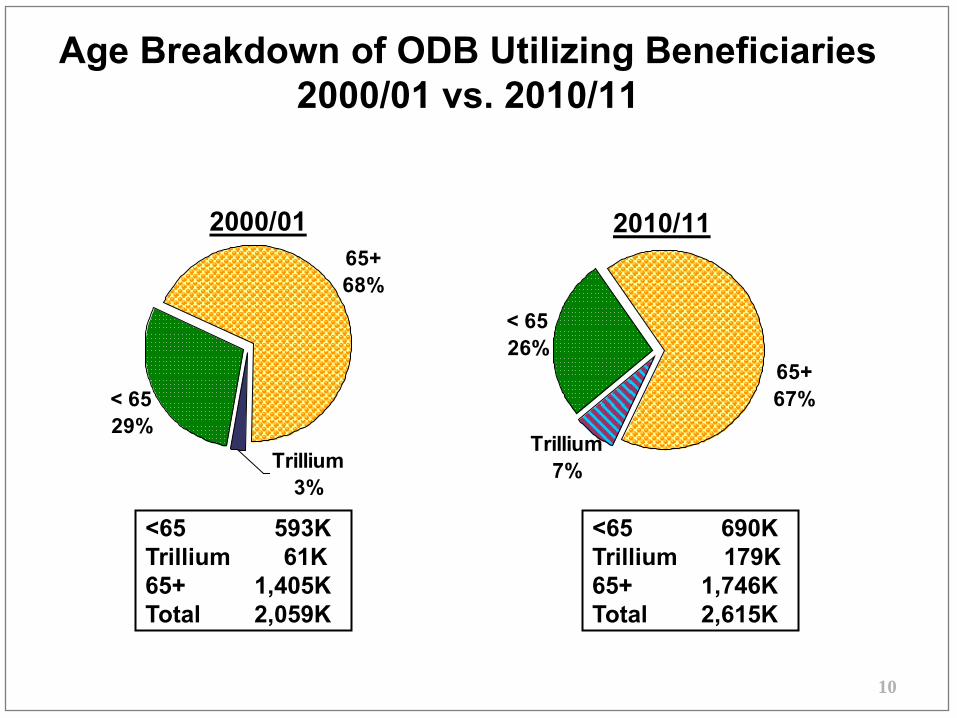
< 6526%
65+67%
Trillium7%
< 6529%
65+68%
Trillium3%
Age Breakdown of ODB Utilizing Beneficiaries 2000/01 vs. 2010/11
2000/01
<65 593KTrillium 61K 65+ 1,405K Total 2,059K
2010/11
<65 690K Trillium 179K65+ 1,746K Total 2,615K
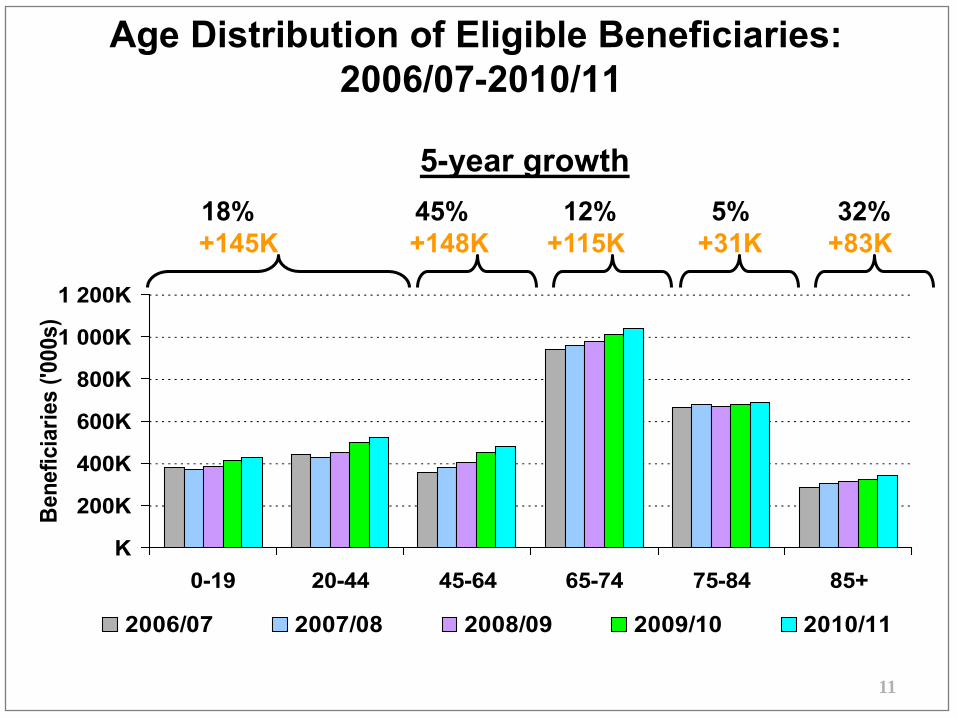
Age Distribution of Eligible Beneficiaries: 2006/07-2010/11
5-year growth
11
18% 45% 12% 5% 32% +145K +148K +115K +31K +83K
K
200K
400K
600K
800K
1 000K
1 200K
0-19 20-44 45-64 65-74 75-84 85+
Bene
ficia
ries
('000
s)
2006/07 2007/08 2008/09 2009/10 2010/11
12
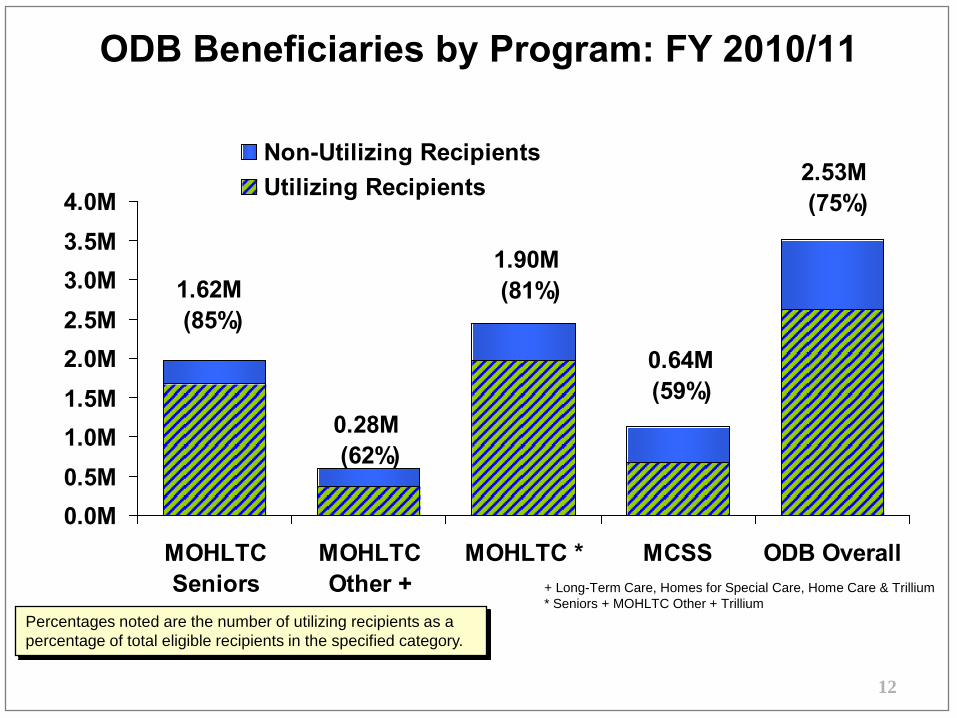
0.28M (62%)
1.90M (81%)
0.64M (59%)
1.62M (85%)
2.53M (75%)
0.0M0.5M1.0M1.5M2.0M2.5M3.0M3.5M4.0M
ODB OverallMCSSMOHLTC *MOHLTCOther +
MOHLTCSeniors
Non-Utilizing RecipientsUtilizing Recipients
+ Long-Term Care, Homes for Special Care, Home Care & Trillium * Seniors + MOHLTC Other + Trillium
ODB Beneficiaries by Program: FY 2010/11
Percentages noted are the number of utilizing recipients as a percentage of total eligible recipients in the specified category.
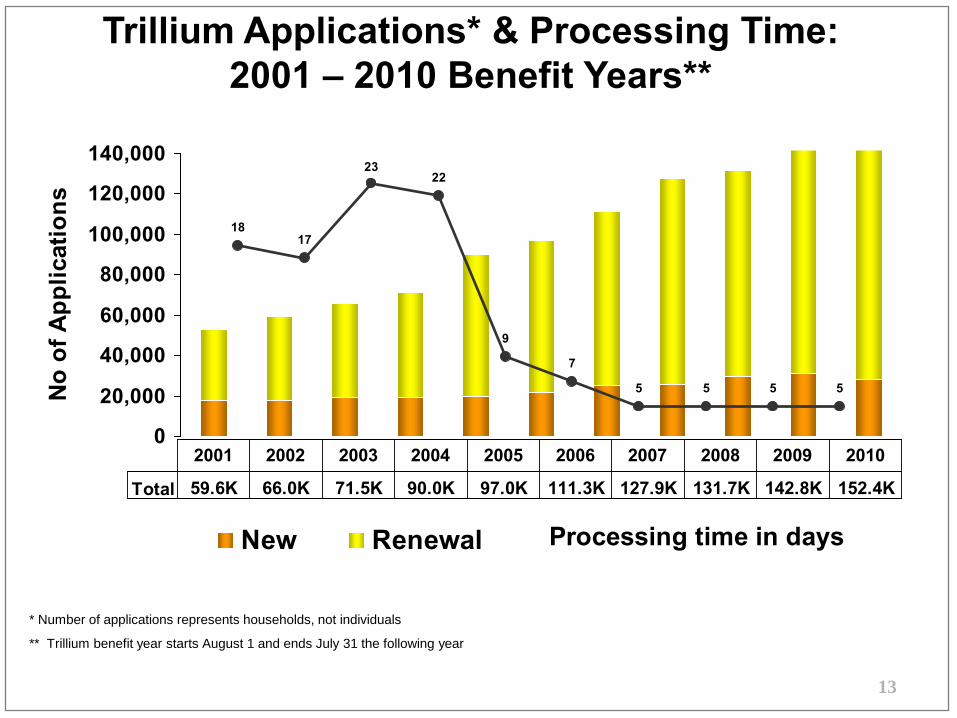
Trillium Applications* & Processing Time: 2001 – 2010 Benefit Years**
* Number of applications represents households, not individuals
** Trillium benefit year starts August 1 and ends July 31 the following year
13
0
20,000
40,000
60,000
80,000
100,000
120,000
140,000
No
of A
pplic
atio
ns
New Renewal
Total 59.6K 66.0K 71.5K 90.0K 97.0K 111.3K 127.9K 131.7K 142.8K 152.4K
2001 2002 2003 2004 2005 2006 2007 2008 2009 2010
1817
2322
9
5 5 5 5
7
Processing time in days
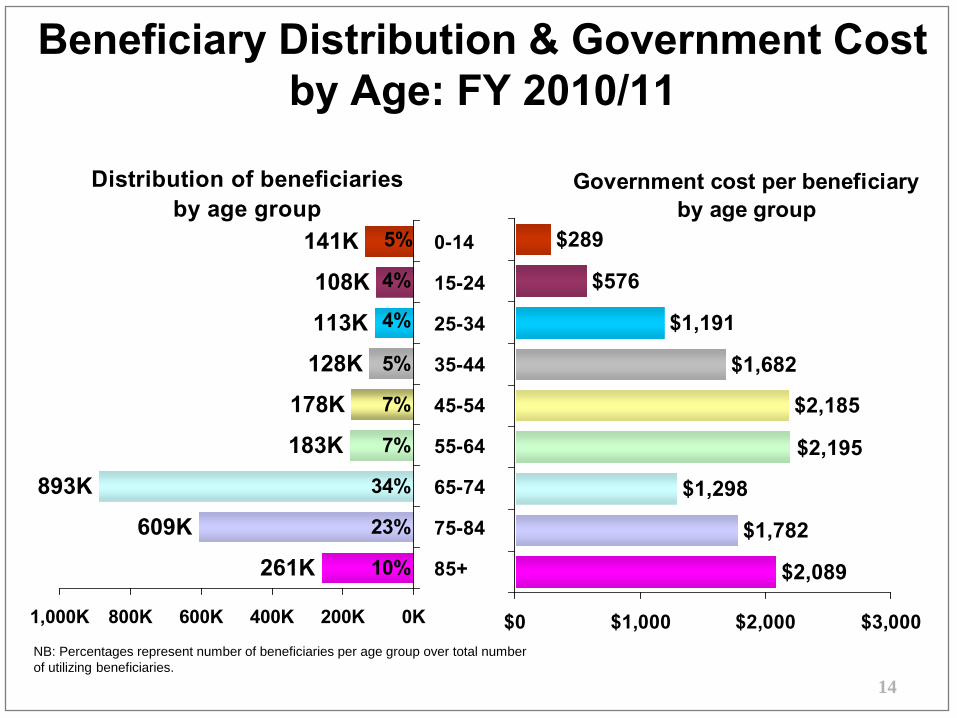
Beneficiary Distribution & Government Cost by Age: FY 2010/11
Distribution of beneficiariesby age group
Government cost per beneficiary by age group
NB: Percentages represent number of beneficiaries per age group over total number of utilizing beneficiaries.
14
141K
108K
113K
128K
178K
183K
893K
609K
261K
5%
7%
7%
34%
23%
10%
4%
4%
5%
0K200K400K600K800K1,000K
0-14
15-24
25-34
35-44
45-54
55-64
65-74
75-84
85+
$289
$576
$1,191
$1,682
$2,185
$1,298
$1,782
$2,089
$2,195
$0 $1,000 $2,000 $3,000
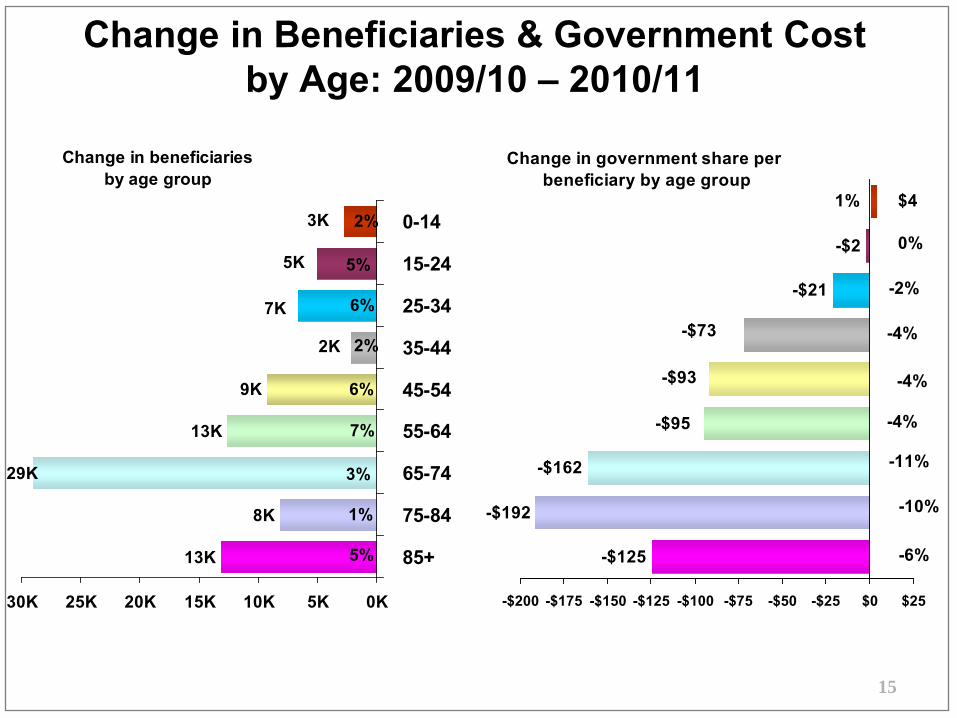
Change in Beneficiaries & Government Cost by Age: 2009/10 – 2010/11
Change in beneficiariesby age group
%
Change in government share per beneficiary by age group
15
9K
13K
8K
13K
3K
5K
7K
2K
29K
6%
2
5%
6%
7%
3%
1%
5%
2%
0K5K10K15K20K25K30K
0-14
15-24
25-34
35-44
45-54
55-64
65-74
75-84
85+
-$2
-$21
-$162
-$192
-$125
$4
-$73
-$93
-$95
1%
0%
-2%
-4%
-4%
-4%
-11%
-10%
-6%
-$200 -$175 -$150 -$125 -$100 -$75 -$50 -$25 $0 $25
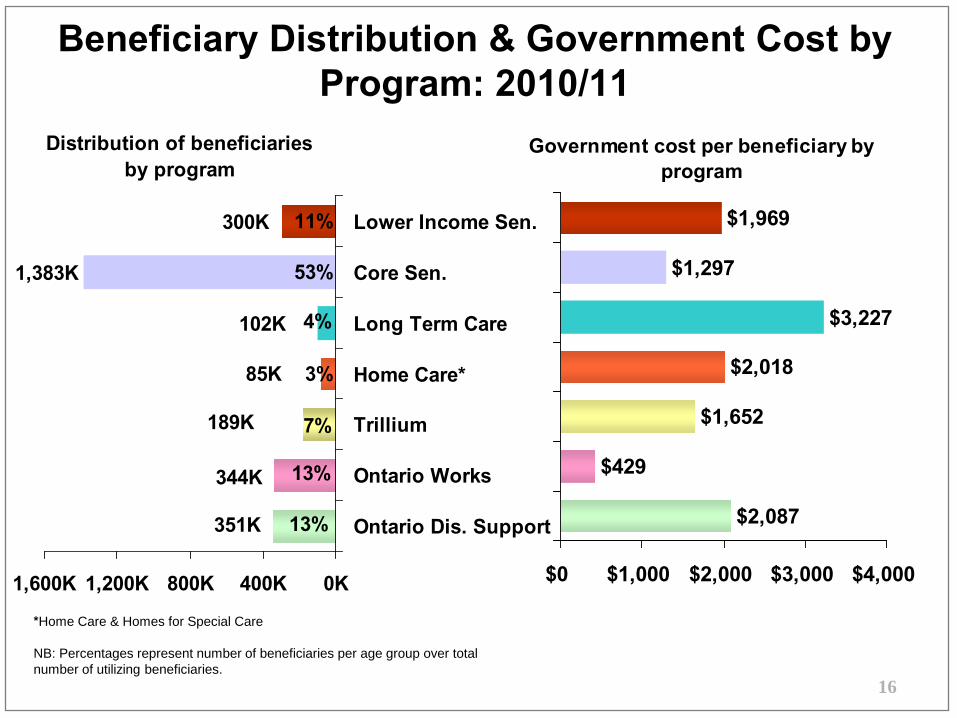
Beneficiary Distribution & Government Cost by Program: 2010/11
Distribution of beneficiariesby program
Government cost per beneficiary by program
NB: Percentages represent number of beneficiaries per age group over total number of utilizing beneficiaries.
*Home Care & Homes for Special Care
16
1,383K
102K
85K
300K
344K
351K
189K
11%
53%
3%
4%
7%
13%
13%
0K400K800K1,200K1,600K
Lower Income Sen.
Core Sen.
Long Term Care
Home Care*
Trillium
Ontario Works
Ontario Dis. Support
$1,969
$1,297
$3,227
$2,018
$1,652
$429
$2,087
$0 $1,000 $2,000 $3,000 $4,000
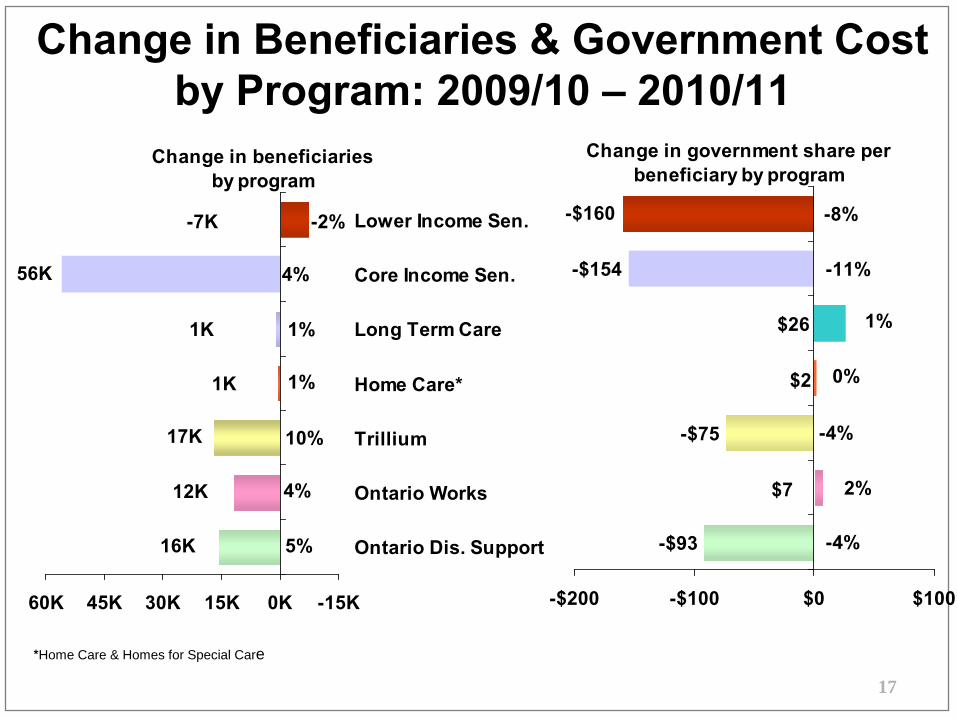
Change in Beneficiaries & Government Cost by Program: 2009/10 – 2010/11
Change in beneficiariesby program
Change in government share per beneficiary by program
-
*Home Care & Homes for Special Care
17
1K
17K
-7K
1K
56K
16K
12K
-2%
5%
4%
10%
1%
1%
4%
-15K0K15K30K45K60K
Lower Income Sen.
Core Income Sen.
Long Term Care
Home Care*
Trillium
Ontario Works
Ontario Dis. Support
-$75
-$93
-$154
-$160
$7
$2
$26
4%
2%
-4%
-11%
-8%
0%
1%
-$200 -$100 $0 $100
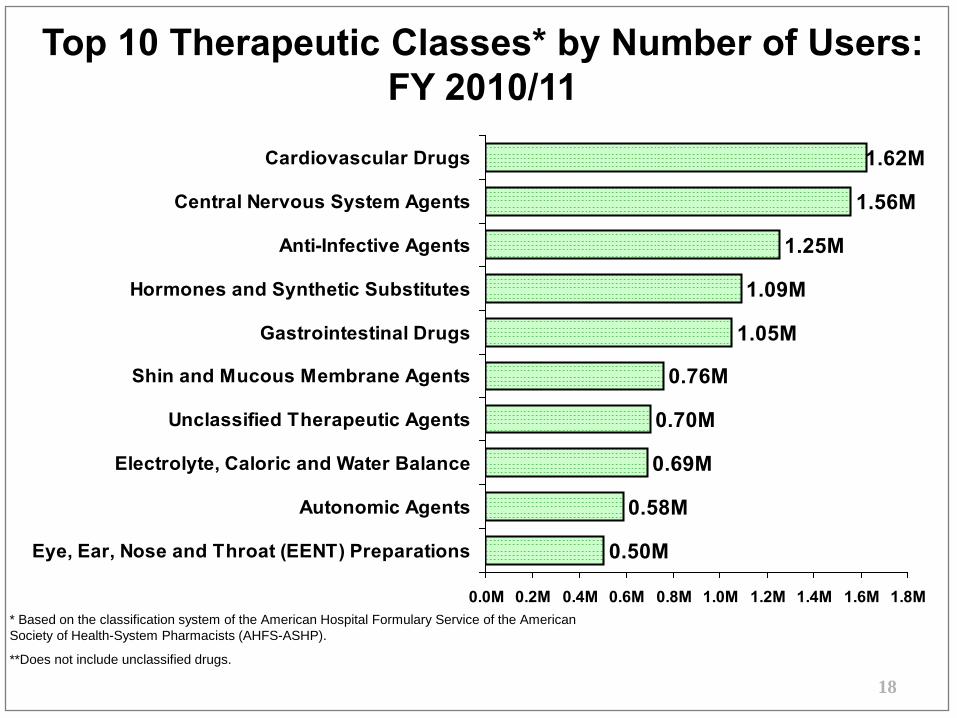
Top 10 Therapeutic Classes* by Number of Users: FY 2010/11
* Based on the classification system of the American Hospital Formulary Service of the American Society of Health-System Pharmacists (AHFS-ASHP).
**Does not include unclassified drugs.
18
1.56M
1.25M
1.09M
1.05M
0.76M
0.70M
0.69M
0.58M
0.50M
1.62M
0.0M 0.2M 0.4M 0.6M 0.8M 1.0M 1.2M 1.4M 1.6M 1.8M
Cardiovascular Drugs
Central Nervous System Agents
Anti-Infective Agents
Hormones and Synthetic Substitutes
Gastrointestinal Drugs
Shin and Mucous Membrane Agents
Unclassified Therapeutic Agents
Electrolyte, Caloric and Water Balance
Autonomic Agents
Eye, Ear, Nose and Throat (EENT) Preparations
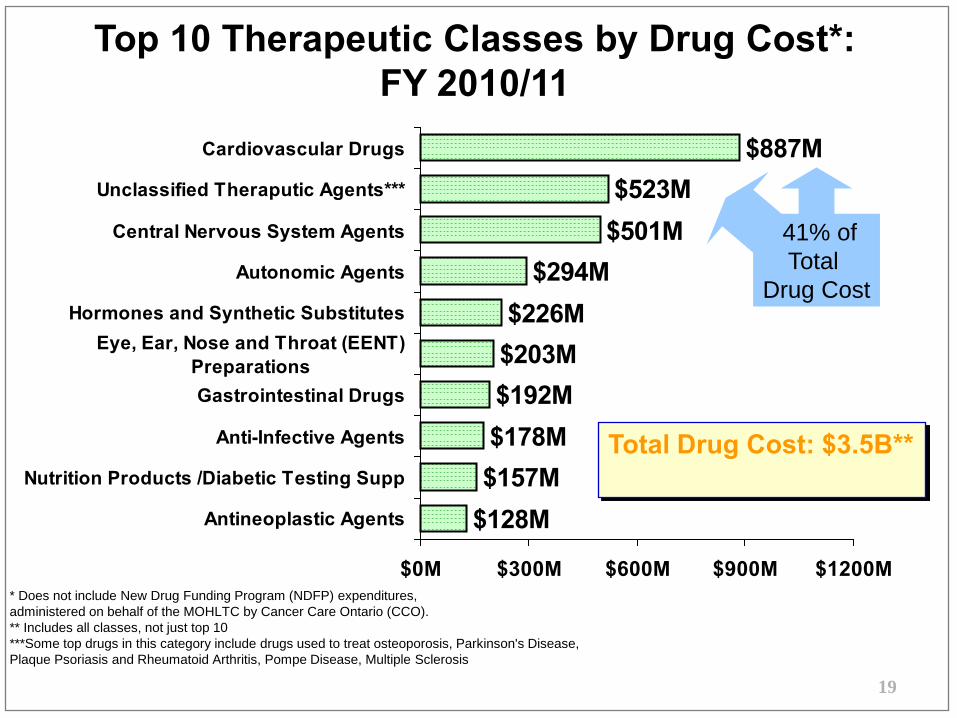
Top 10 Therapeutic Classes by Drug Cost*: FY 2010/11
* Does not include New Drug Funding Program (NDFP) expenditures, administered on behalf of the MOHLTC by Cancer Care Ontario (CCO). ** Includes all classes, not just top 10 ***Some top drugs in this category include drugs used to treat osteoporosis, Parkinson's Disease, Plaque Psoriasis and Rheumatoid Arthritis, Pompe Disease, Multiple Sclerosis
19
$887M$523M
$501M$294M
$226M$203M$192M$178M$157M
$128M
$0M $300M $600M $900M $1200M
Cardiovascular Drugs
Unclassified Theraputic Agents***
Central Nervous System Agents
Autonomic Agents
Hormones and Synthetic SubstitutesEye, Ear, Nose and Throat (EENT)
PreparationsGastrointestinal Drugs
Anti-Infective Agents
Nutrition Products /Diabetic Testing Supp
Antineoplastic Agents
Total Drug Cost: $3.5B**
41% of Total
Drug Cost
20
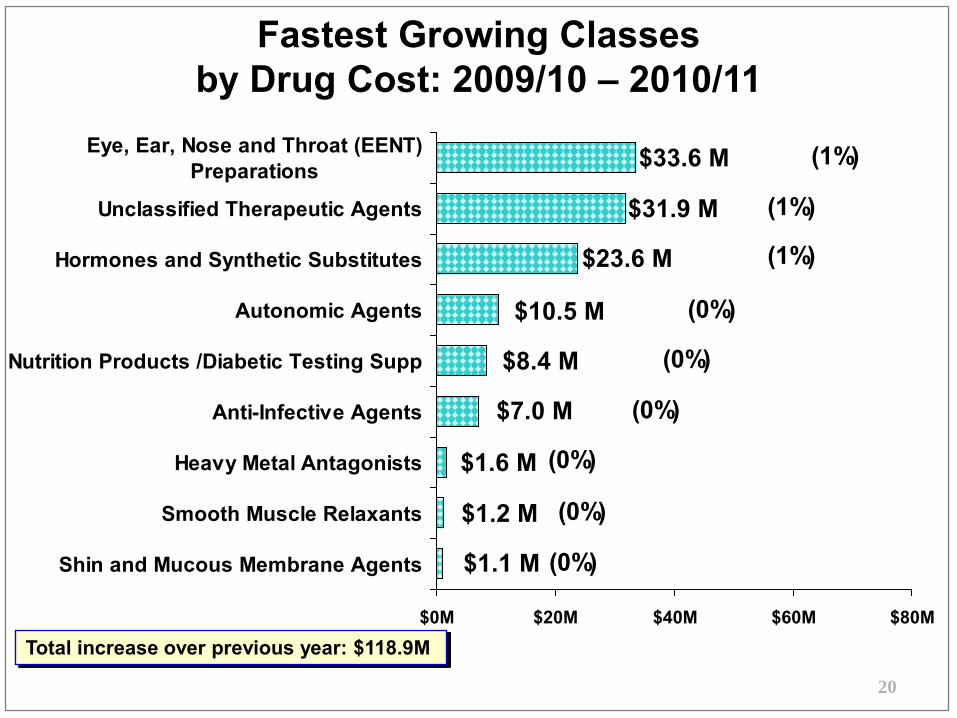
$33.6 M
$31.9 M
$23.6 M
$10.5 M
$8.4 M
$7.0 M
$1.6 M
$1.2 M
$1.1 M (0%)
(0%)
(0%)
(0%)
(0%)
(0%)
(1%)
(1%)
(1%)
$0M $20M $40M $60M $80M
Eye, Ear, Nose and Throat (EENT)Preparations
Unclassified Therapeutic Agents
Hormones and Synthetic Substitutes
Autonomic Agents
Nutrition Products /Diabetic Testing Supp
Anti-Infective Agents
Heavy Metal Antagonists
Smooth Muscle Relaxants
Shin and Mucous Membrane Agents
Fastest Growing Classes by Drug Cost: 2009/10 – 2010/11
Total increase over previous year: $118.9M
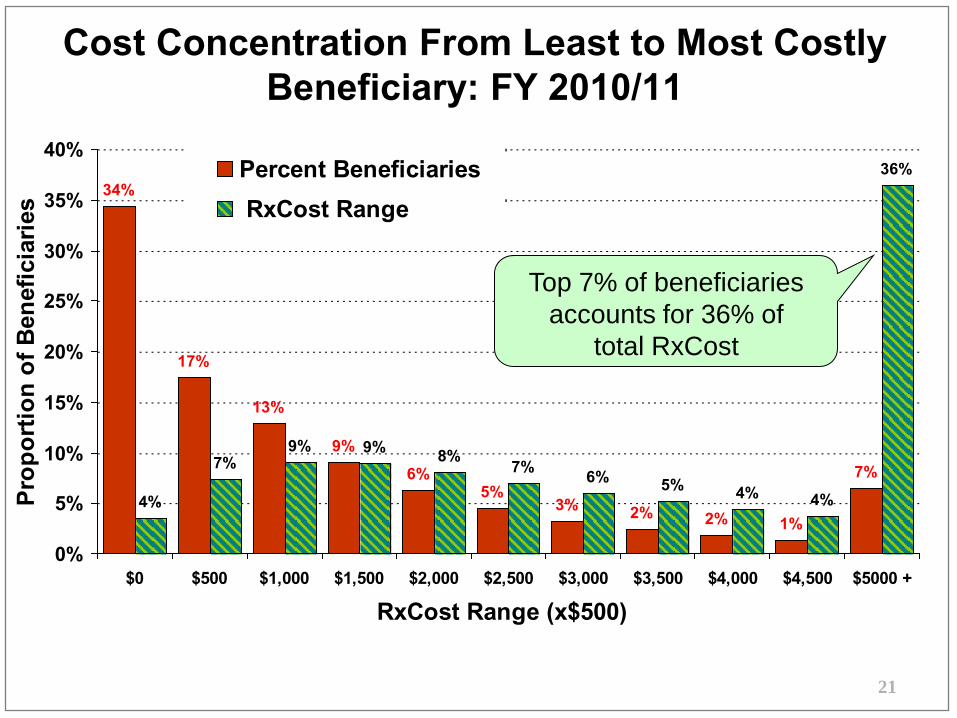
Cost Concentration From Least to Most Costly Beneficiary: FY 2010/11
21
34%
17%
13%
9%
6%5%
3% 2% 2% 1%4%
7%9% 9% 8% 7% 6% 5% 4% 4%
36%
7%
0%
5%
10%
15%
20%
25%
30%
35%
40%
$0 $500 $1,000 $1,500 $2,000 $2,500 $3,000 $3,500 $4,000 $4,500 $5000 +
RxCost Range (x$500)
Prop
ortio
n of
Ben
efic
iarie
s
Percent Beneficiaries RxCost Range
Top 7% of beneficiaries accounts for 36% of
total RxCost
22
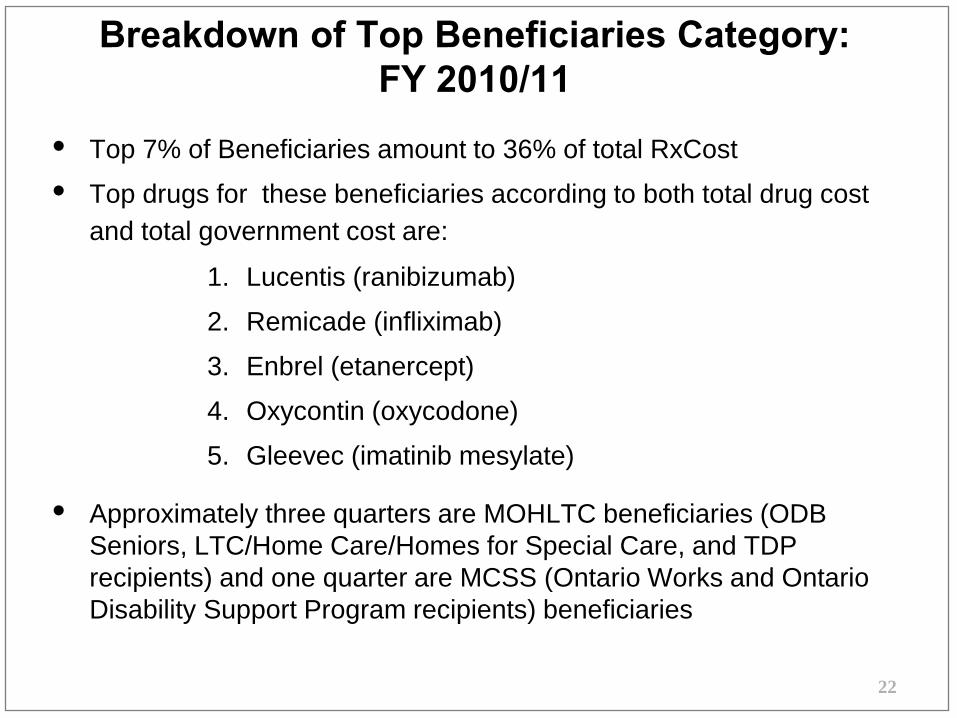
Breakdown of Top Beneficiaries Category: FY 2010/11
• Top 7% of Beneficiaries amount to 36% of total RxCost
• Top drugs for these beneficiaries according to both total drug cost and total government cost are:
1. Lucentis (ranibizumab)
2. Remicade (infliximab)
3. Enbrel (etanercept)
4. Oxycontin (oxycodone)
5. Gleevec (imatinib mesylate)
• Approximately three quarters are MOHLTC beneficiaries (ODB Seniors, LTC/Home Care/Homes for Special Care, and TDP recipients) and one quarter are MCSS (Ontario Works and Ontario Disability Support Program recipients) beneficiaries
23
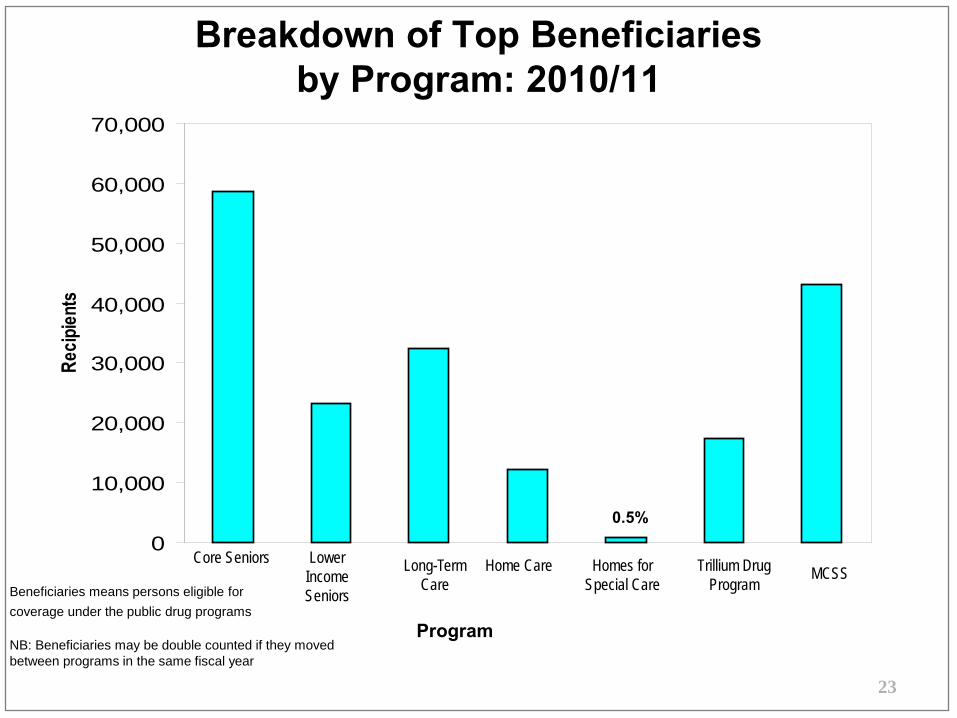
0
10,000
20,000
30,000
40,000
50,000
60,000
70,000
Recip
ients
35%
14%
19%
7%
0.5%
10%
25%
Program
Core Seniors Lower Income Seniors
Long-Term Care
Home Care Homes for Special Care
Trillium Drug Program
MCSS
Breakdown of Top Beneficiaries by Program: 2010/11
Beneficiaries means persons eligible for coverage under the public drug programs
NB: Beneficiaries may be double counted if they moved between programs in the same fiscal year
24
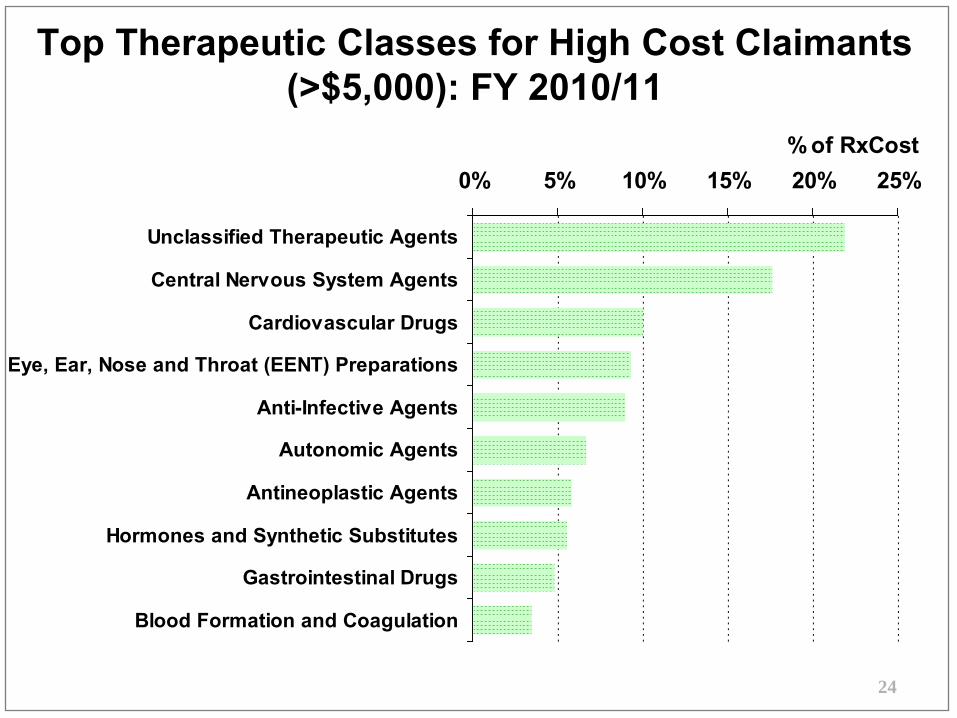
0% 5% 10% 15% 20% 25%
Unclassified Therapeutic Agents
Central Nervous System Agents
Cardiovascular Drugs
Eye, Ear, Nose and Throat (EENT) Preparations
Anti-Infective Agents
Autonomic Agents
Antineoplastic Agents
Hormones and Synthetic Substitutes
Gastrointestinal Drugs
Blood Formation and Coagulation
% of RxCost
Top Therapeutic Classes for High Cost Claimants (>$5,000): FY 2010/11
25
2,500
3,000
3,500
2005/06 2006/07 2007/08 2008/09 2009/10 2010/11
Fiscal Year
Ret
ail P
harm
acy
Cou
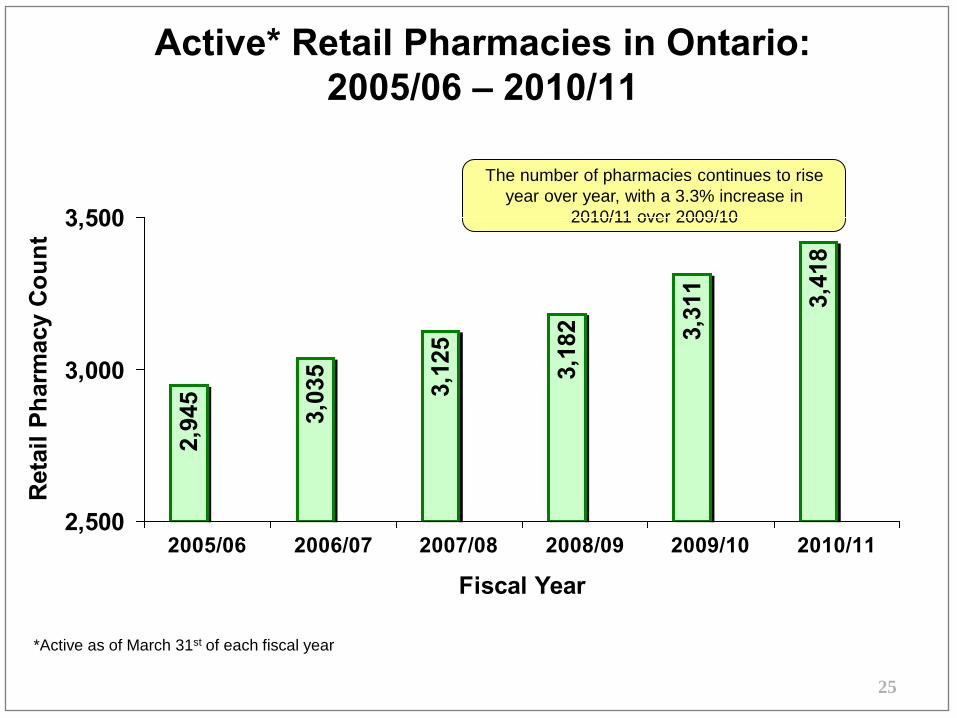
ntActive* Retail Pharmacies in Ontario:
2005/06 – 2010/11
The number of pharmacies continues to rise year over year, with a 3.3% increase in
2010/11 over 2009/10
3,41
8
*Active as of March 31st of each fiscal year
2,94
5
3,03
5
3,12
5
3,18
2 3,31
1
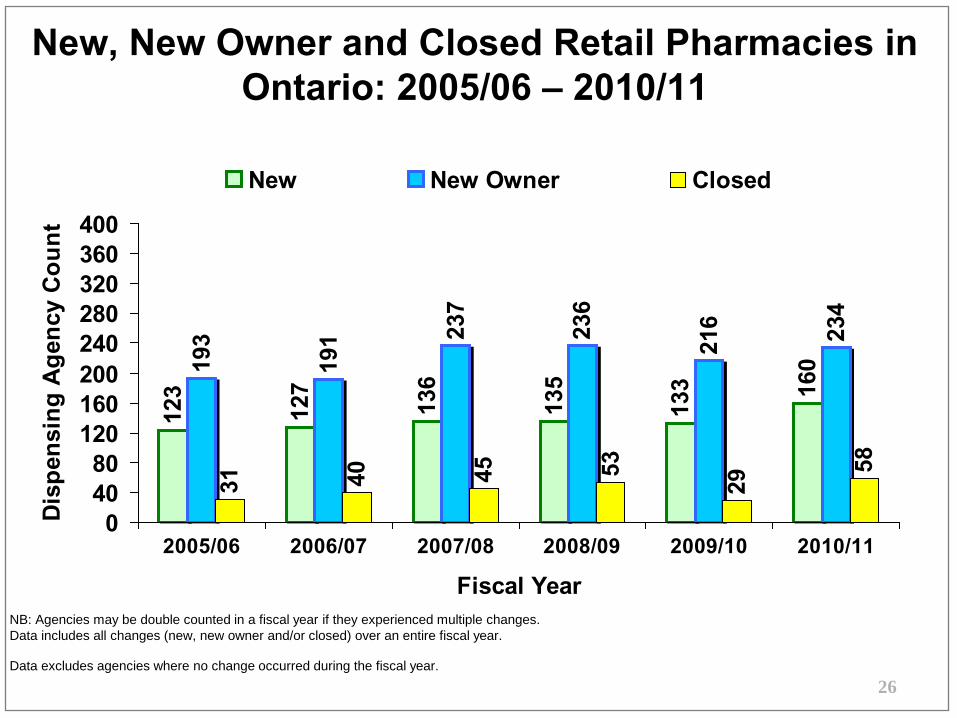
New, New Owner and Closed Retail Pharmacies in
NB: Agencies may be double counted in a fiscal year if they experienced multiple changes. Data includes all changes (new, new owner and/or closed) over an entire fiscal year.
Data excludes agencies where no change occurred during the fiscal year.
Ontario: 2005/06 – 2010/11
26
123
127
136
135
133 16
0193
191 23
7
236
216 234
31 40 45 53
29
58
04080
120160200240280320360400
2005/06 2006/07 2007/08 2008/09 2009/10 2010/11
Fiscal Year
Dis
pens
ing
Age
ncy
Cou
nt
New New Owner Closed
27
Highlights of Overview
• Drugs represented about 10% of public expenditures in 2010/11.
• The number of ODB beneficiaries and claims continues to rise: almost 7.8% more claims processed in 2010/11 over 2009/10.
• The top 7% of beneficiaries (determined by RxCost) accounted for a large proportion of expenditures (36%) in 2010/11.
• Cardiovascular drugs and Central Nervous system drugs are the top two classes of drugs in terms of number of users in 2010/11.
• The total number of ODB recipients continues to increase on annually. Over the past 10 years, the total number of beneficiaries has increased 26.6%, with MOHLTC beneficiaries increasing almost 6 times more than MCSS beneficiaries.

28
Report Card Framework
Overview Financial Indicators and Cost Trends
Formulary Process and
Types of Listing
Milestones Achievements
29
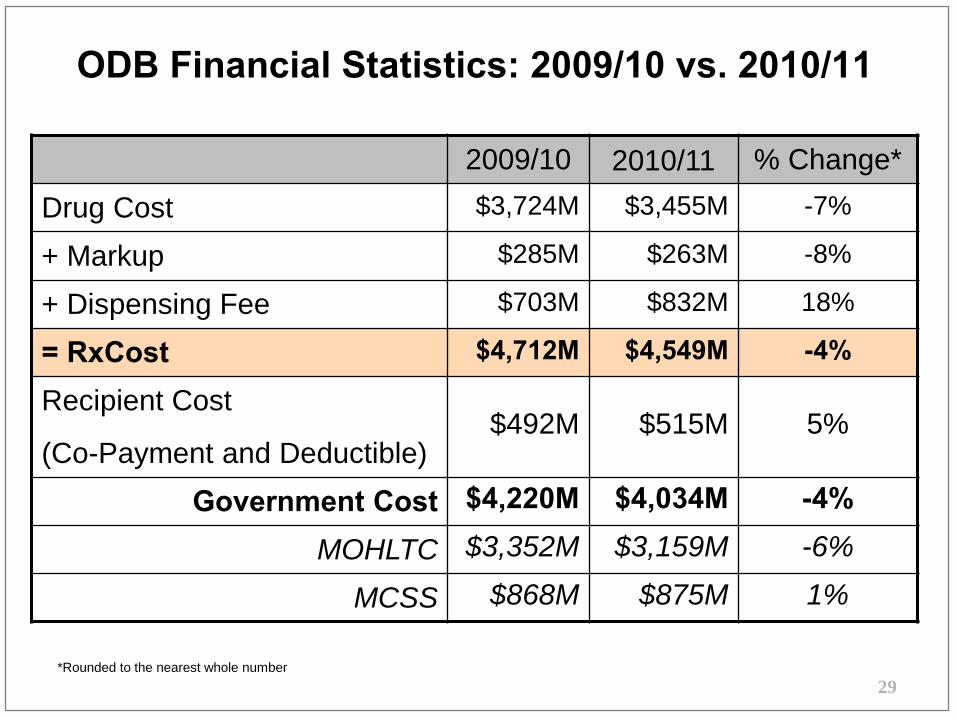
ODB Financial Statistics: 2009/10 vs. 2010/11
2009/10 2010/11 % Change*Drug Cost $3,724M $3,455M -7%
+ Markup $285M $263M -8%
+ Dispensing Fee $703M $832M 18%
= RxCost $4,712M $4,549M -4%
Recipient Cost
(Co-Payment and Deductible) $492M $515M 5%
Government Cost $4,220M $4,034M -4%
MOHLTC $3,352M $3,159M -6%
MCSS $868M $875M 1%
*Rounded to the nearest whole number
30
2009/10 2010/11 % Change*
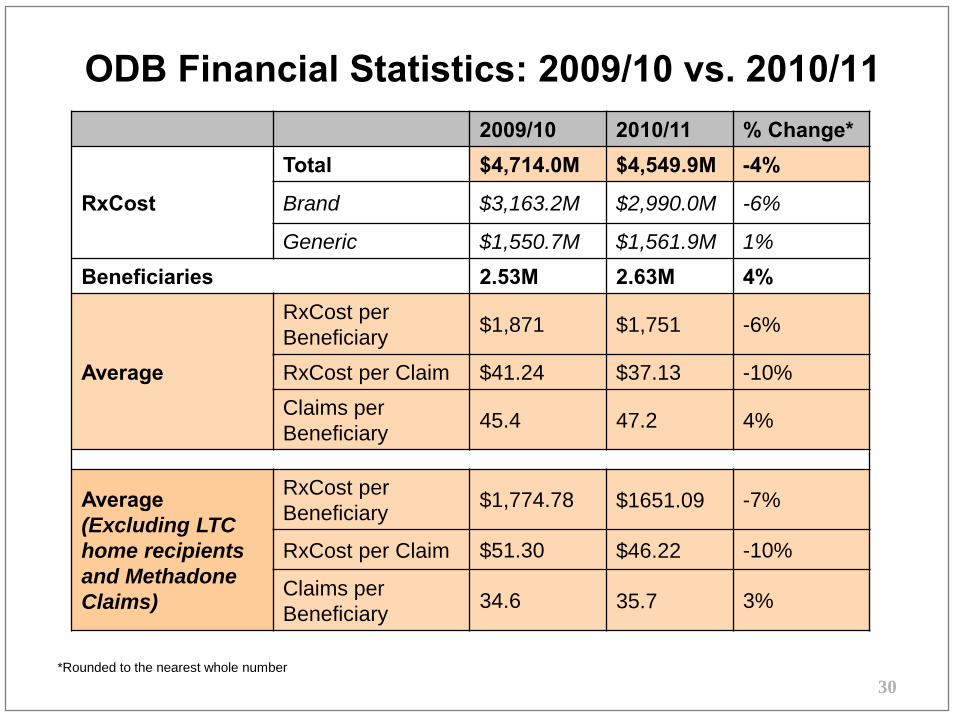
ODB Financial Statistics: 2009/10 vs. 2010/11
RxCost
Total $4,714.0M $4,549.9M -4%
Brand $3,163.2M $2,990.0M -6%
Generic $1,550.7M $1,561.9M 1% Beneficiaries 2.53M 2.63M 4%
Average
RxCost per Beneficiary $1,871 $1,751 -6%
RxCost per Claim $41.24 $37.13 -10% Claims per Beneficiary 45.4 47.2 4%
Average (Excluding LTC home recipients and Methadone Claims)
RxCost per Beneficiary $1,774.78 $1651.09 -7%
RxCost per Claim $51.30 $46.22 -10%
Claims per Beneficiary 34.6 35.7 3%
*Rounded to the nearest whole number
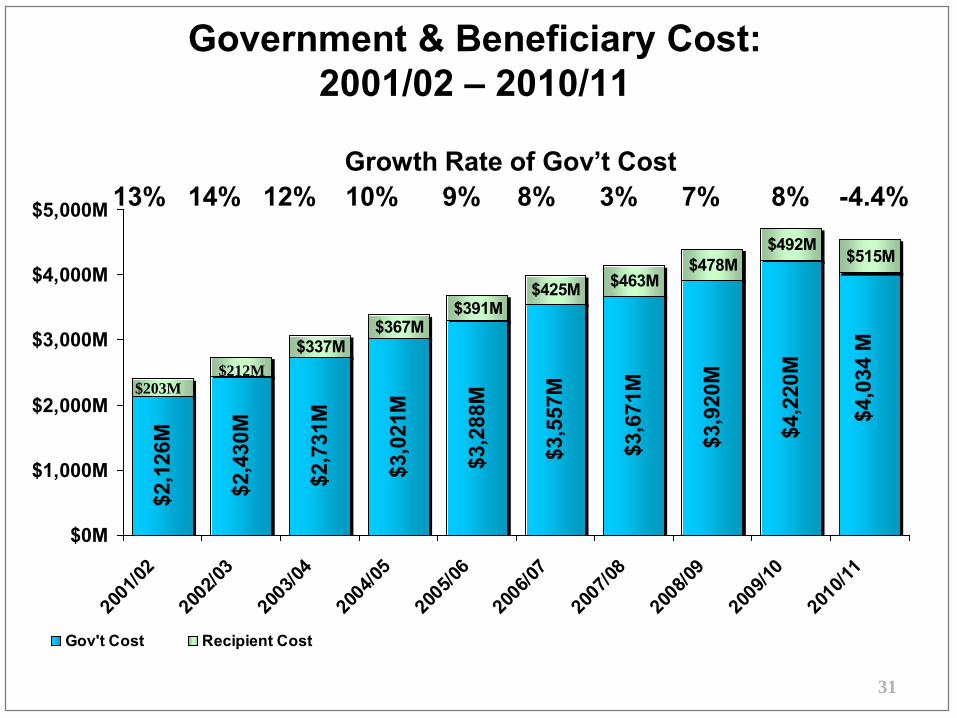
Government & Beneficiary Cost: 2001/02 – 2010/11
31
$2,1
26M
$2,4
30M
$2,7
31M
$3,0
21M
$3,2
88M
$3,5
57M
$3,6
71M
$3,9
20M
$337M$367M
$391M$425M $463M
$478M$492M
$515M
$4,2
20M
$4,0
34 M
$0M
$1,000M
$2,000M
$3,000M
$4,000M
$5,000M
2001
/02
2002
/03
2003
/04
2004
/05
2005
/06
2006
/07
2007
/08
2008
/09
2009
/10
2010
/11
Gov't Cost Recipient Cost
$212M$203M
Growth Rate of Gov’t Cost 13% 14% 12% 10% 9% 8% 3% 7% 8% -4.4%
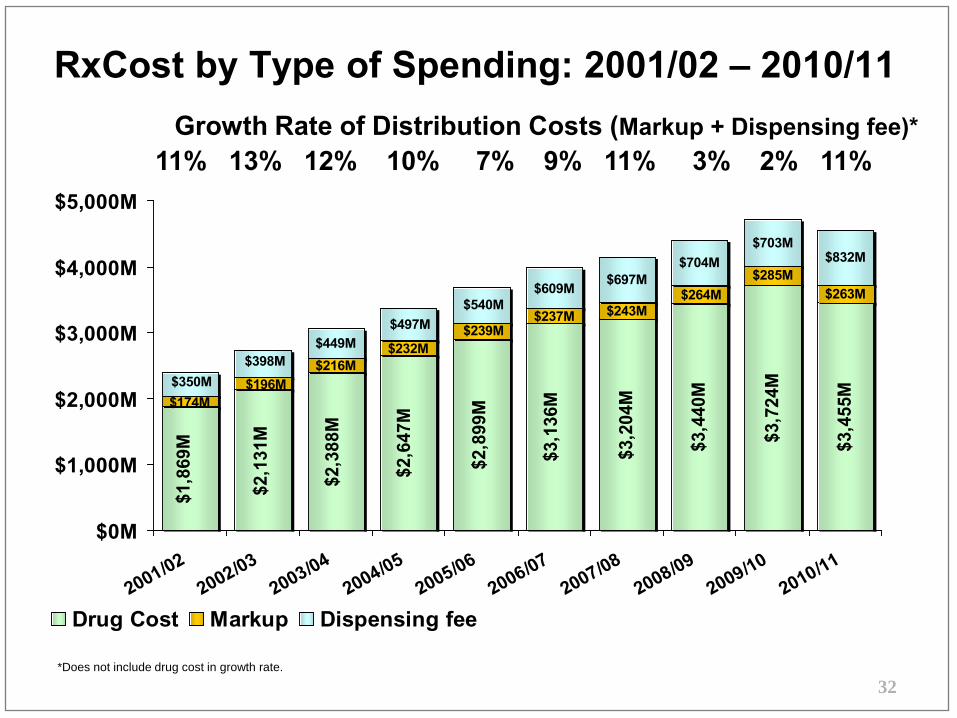
RxCost by Type of Spending: 2001/02 – 2010/11
*Does not include drug cost in growth rate.
32
$3,2
04M
$3,4
40M
$3,7
24M
$3,4
55M
$285M$263M
$697M$704M
$703M$832M
$2,1
31M
$2,3
88M
$2,6
47M
$2,8
99M
$3,1
36M
$1,8
69M
$264M$243M$237M
$239M$232M
$216M$196M
$174M
$398M$350M
$540M$609M
$497M$449M
$0M
$1,000M
$2,000M
$3,000M
$4,000M
$5,000M
2001/022002/03
2003/042004/05
2005/062006/07
2007/082008/09
2009/102010/11
Drug Cost Markup Dispensing fee
Growth Rate of Distribution Costs (Markup + Dispensing fee)* 11% 13% 12% 10% 7% 9% 11% 3% 2% 11%
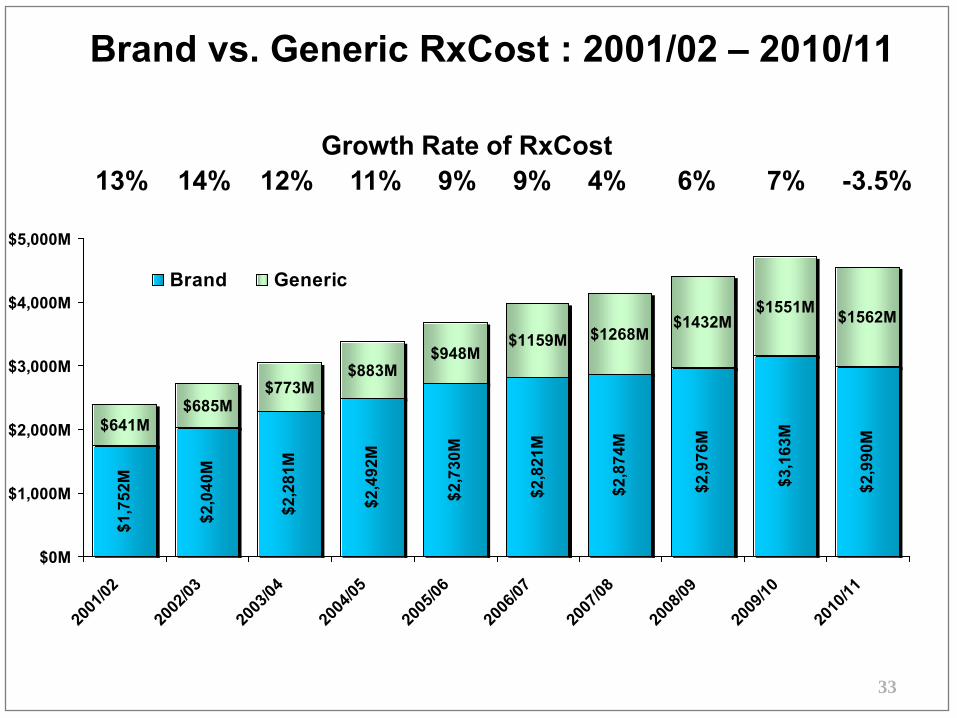
Brand vs. Generic RxCost : 2001/02 – 2010/11
33
$1,7
52M
$2,0
40M
$2,2
81M
$2,4
92M
$2,7
30M
$2,8
21M
$2,8
74M
$2,9
76M
$3,1
63M
$2,9
90M
$641M$685M
$773M$883M
$948M$1159M $1268M
$1432M$1551M $1562M
$0M
$1,000M
$2,000M
$3,000M
$4,000M
$5,000M
2001
/02
2002
/03
2003
/04
2004
/05
2005
/06
2006
/07
2007
/08
2008
/09
2009
/10
2010
/11
Brand Generic
Growth Rate of RxCost 13% 14% 12% 11% 9% 9% 4% 6% 7% -3.5%
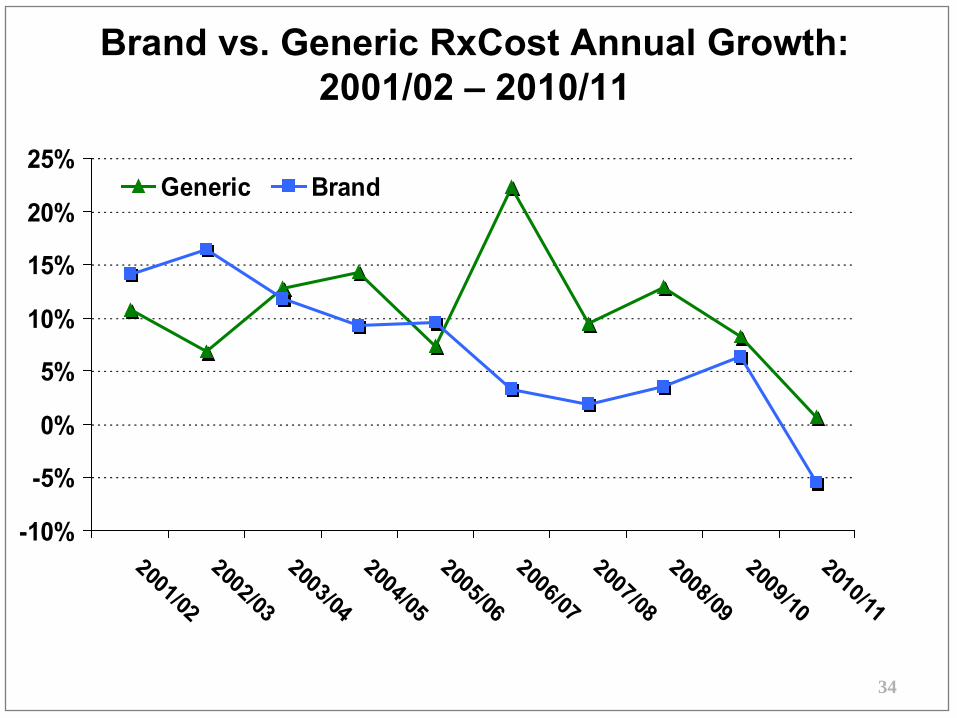
Brand vs. Generic RxCost Annual Growth: 2001/02 – 2010/11
34
-10%
-5%
0%
5%
10%
15%
20%
25%
2001/02
2002/03
2003/04
2004/05
2005/06
2006/07
2007/08
2008/09
2009/10
2010/11
Generic Brand
35
0M10M20M30M40M50M60M70M80M90M
2001
/02
2002
/03
2003
/04
2004
/05
2005
/06
2006
/07
2007
/08
2008
/09
2009
/10
2010
/11
Generic Brand
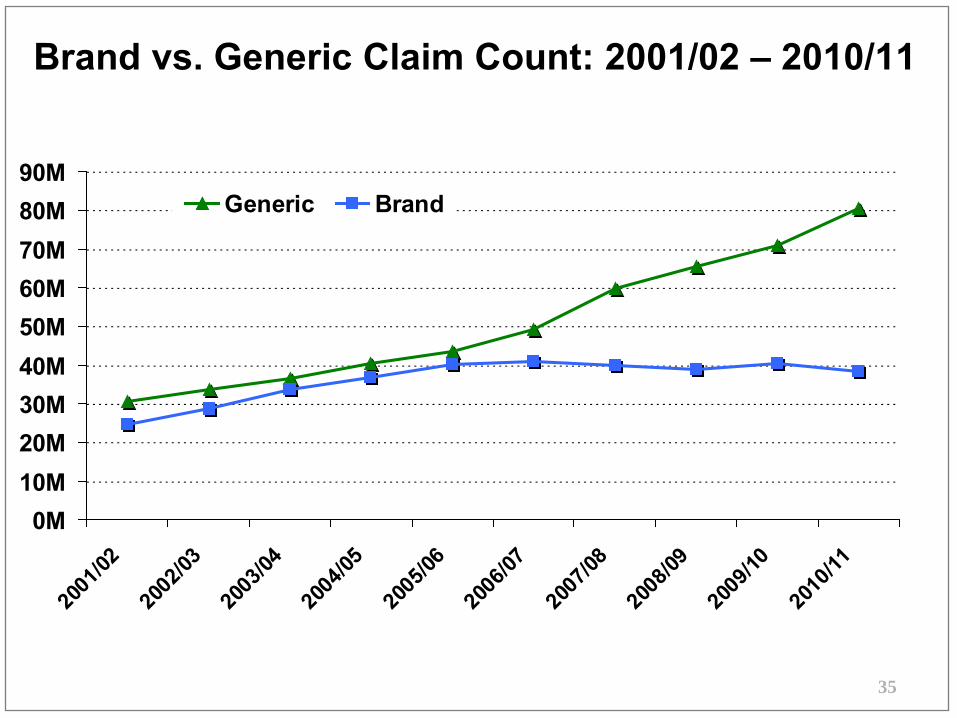
Brand vs. Generic Claim Count: 2001/02 – 2010/11
36
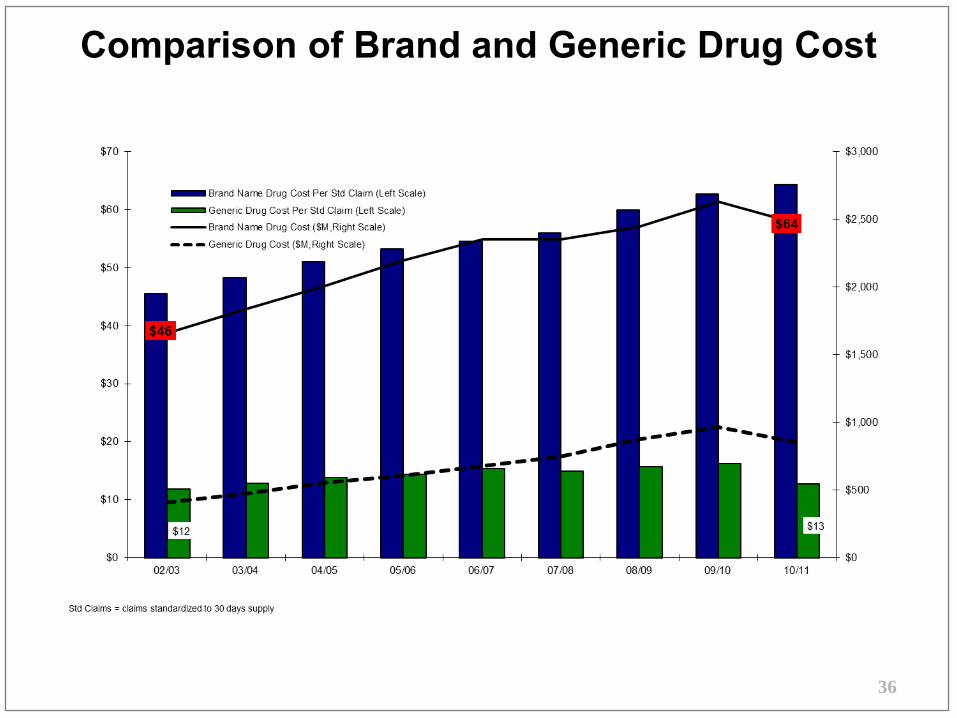
Comparison of Brand and Generic Drug Cost
37
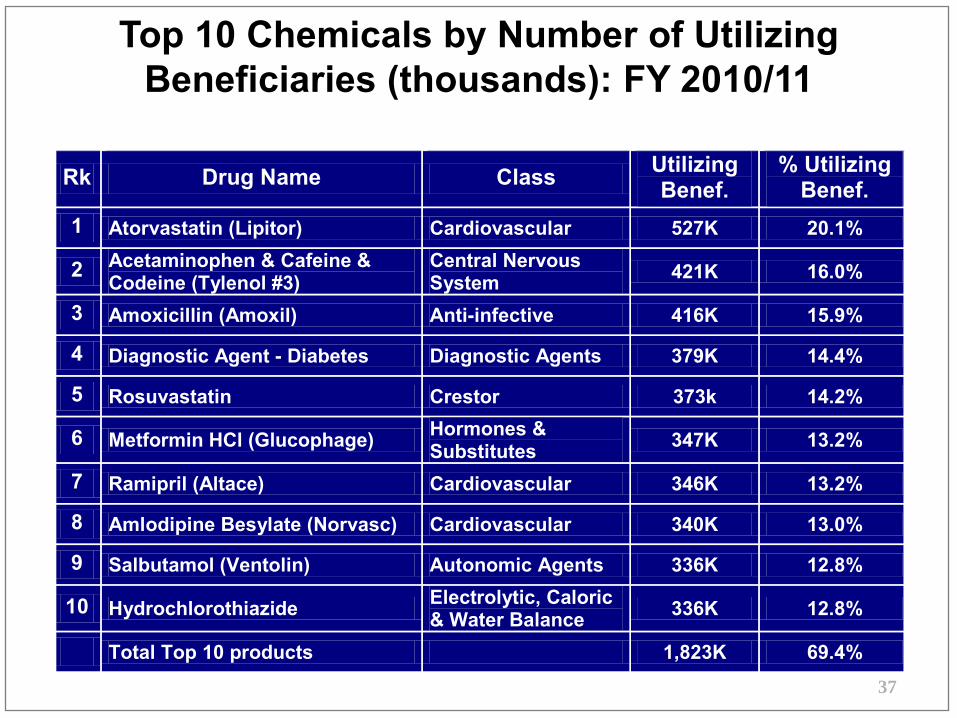
Top 10 Chemicals by Number of Utilizing Beneficiaries (thousands): FY 2010/11
Rk Drug Name Class Utilizing Benef.
% Utilizing Benef.
1 Atorvastatin (Lipitor) Cardiovascular 527K 20.1%
2 Acetaminophen & Cafeine & Codeine (Tylenol #3)
Central Nervous System 421K 16.0%
3 Amoxicillin (Amoxil) Anti-infective 416K 15.9%
4 Diagnostic Agent - Diabetes Diagnostic Agents 379K 14.4%
5 Rosuvastatin Crestor 373k 14.2%
6 Metformin HCl (Glucophage) Hormones & Substitutes 347K 13.2%
7 Ramipril (Altace) Cardiovascular 346K 13.2%
8 Amlodipine Besylate (Norvasc) Cardiovascular 340K 13.0%
9 Salbutamol (Ventolin) Autonomic Agents 336K 12.8%
10 Hydrochlorothiazide Electrolytic, Caloric & Water Balance 336K 12.8%
Total Top 10 products 1,823K 69.4%
38
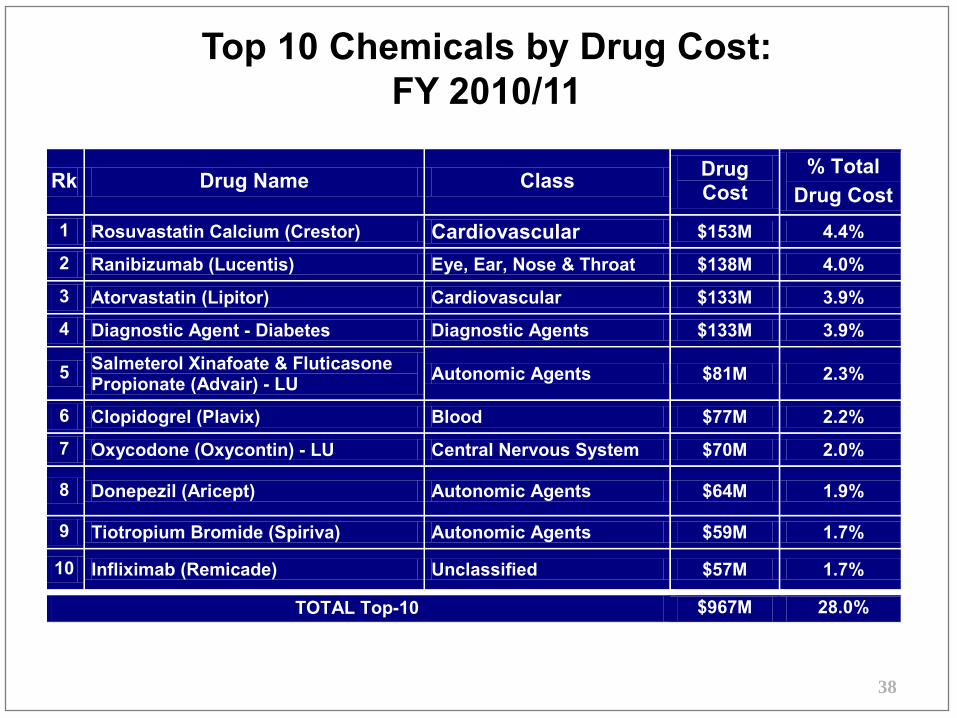
Top 10 Chemicals by Drug Cost: FY 2010/11
Rk Drug Name Class Drug Cost
% Total Drug Cost
1 Rosuvastatin Calcium (Crestor) Cardiovascular $153M 4.4%
2 Ranibizumab (Lucentis) Eye, Ear, Nose & Throat $138M 4.0%
3 Atorvastatin (Lipitor) Cardiovascular $133M 3.9%
4 Diagnostic Agent - Diabetes Diagnostic Agents $133M 3.9%
5 Salmeterol Xinafoate & Fluticasone Propionate (Advair) - LU Autonomic Agents $81M 2.3%
6 Clopidogrel (Plavix) Blood $77M 2.2%
7 Oxycodone (Oxycontin) - LU Central Nervous System $70M 2.0%
8 Donepezil (Aricept) Autonomic Agents $64M 1.9%
9 Tiotropium Bromide (Spiriva) Autonomic Agents $59M 1.7%
10 Infliximab (Remicade) Unclassified $57M 1.7%
TOTAL Top-10 $967M 28.0%
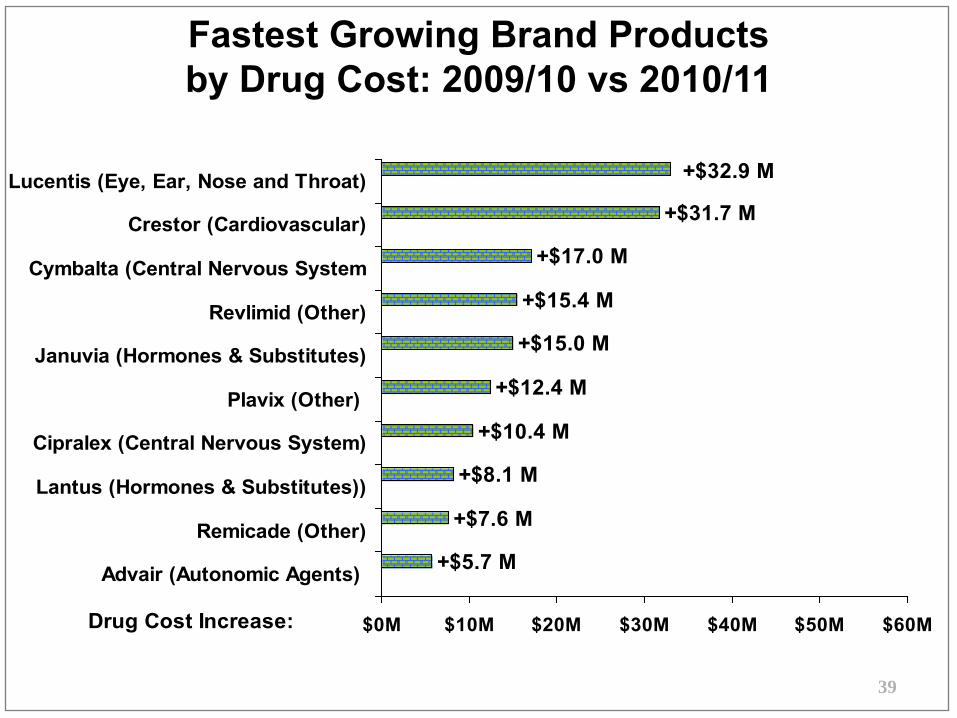
Fastest Growing Brand Products by Drug Cost: 2009/10 vs 2010/11
39
+$31.7 M
+$17.0 M
+$15.4 M
+$15.0 M
+$10.4 M
+$8.1 M
+$7.6 M
+$5.7 M
+$12.4 M
+$32.9 M
$0M $10M $20M $30M $40M $50M $60M
Lucentis (Eye, Ear, Nose and Throat)
Crestor (Cardiovascular)
Cymbalta (Central Nervous System
Revlimid (Other)
Januvia (Hormones & Substitutes)
Plavix (Other)
Cipralex (Central Nervous System)
Lantus (Hormones & Substitutes))
Remicade (Other)
Advair (Autonomic Agents)
Drug Cost Increase:
40
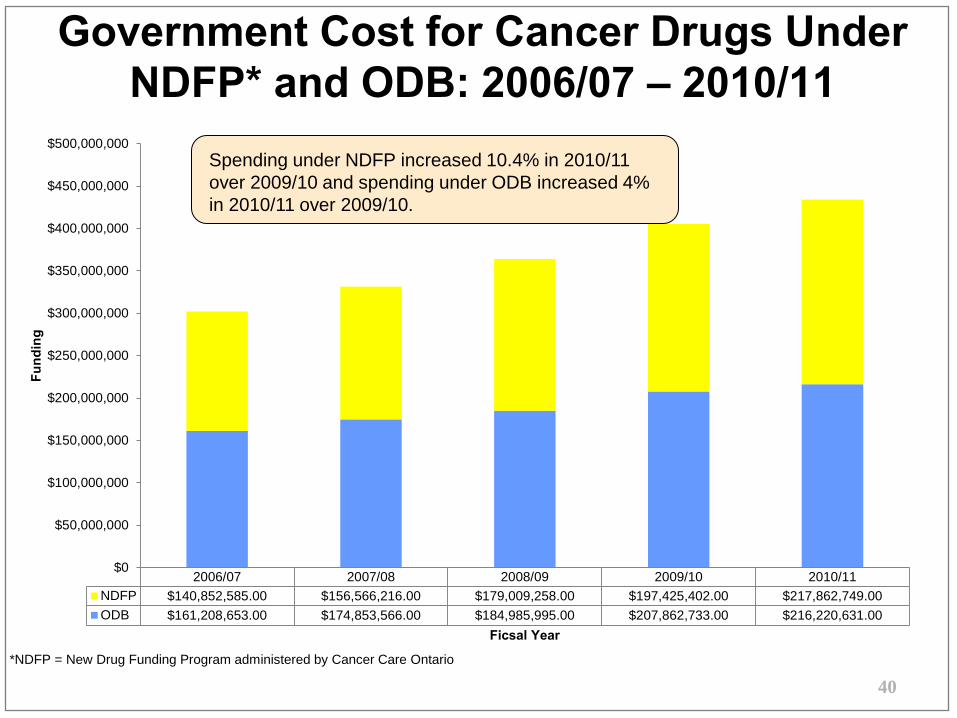
2006/07 2007/08 2008/09 2009/10 2010/11NDFP $140,852,585.00 $156,566,216.00 $179,009,258.00 $197,425,402.00 $217,862,749.00ODB $161,208,653.00 $174,853,566.00 $184,985,995.00 $207,862,733.00 $216,220,631.00
$0
$50,000,000
$100,000,000
$150,000,000
$200,000,000
$250,000,000
$300,000,000
$350,000,000
$400,000,000
$450,000,000
$500,000,000
Fund
ing
Ficsal Year
Government Cost for Cancer Drugs Under NDFP* and ODB: 2006/07 – 2010/11
Spending under NDFP increased 10.4% in 2010/11 over 2009/10 and spending under ODB increased 4% in 2010/11 over 2009/10.
*NDFP = New Drug Funding Program administered by Cancer Care Ontario
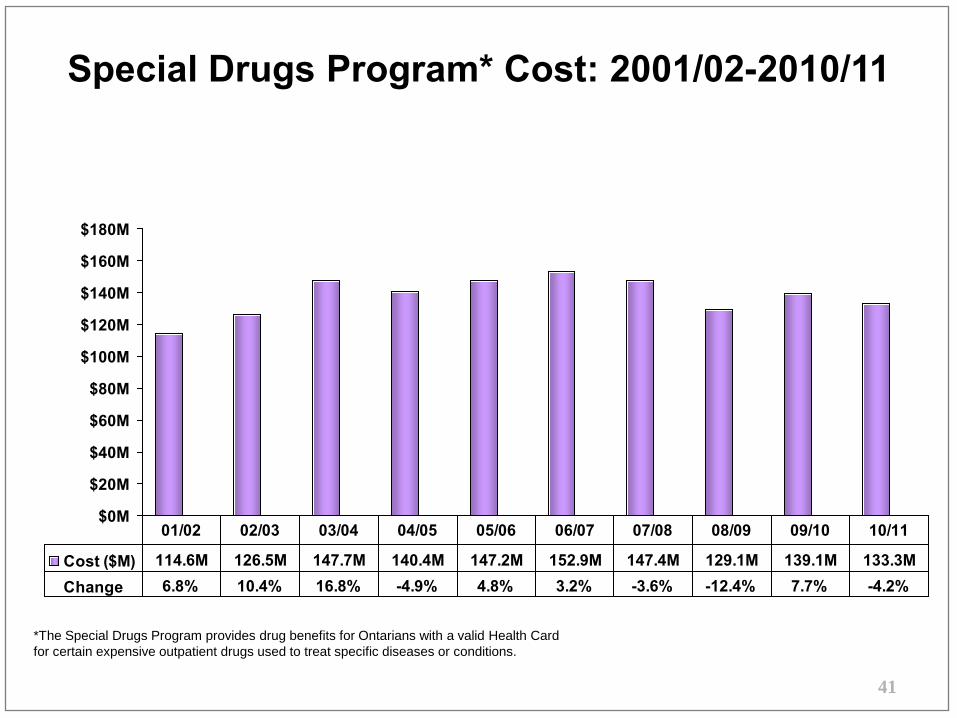
Special Drugs Program* Cost: 2001/02-2010/11
*The Special Drugs Program provides drug benefits for Ontarians with a valid Health Card for certain expensive outpatient drugs used to treat specific diseases or conditions.
41
$0M
$20M
$40M
$60M
$80M
$100M
$120M
$140M
$160M
$180M
Cost ($M) 114.6M 126.5M 147.7M 140.4M 147.2M 152.9M 147.4M 129.1M 139.1M 133.3MChange 6.8% 10.4% 16.8% -4.9% 4.8% 3.2% -3.6% -12.4% 7.7% -4.2%
01/02 02/03 03/04 04/05 05/06 06/07 07/08 08/09 09/10 10/11
42
Highlights of Financials
• Drug program spending declined in 2010/11: Government cost totalled $4,034M in 2010/11,
a 5.8% decrease over 2009/10, even though the number of beneficiaries covered under the
program rose by 3.7%.
• The average RxCost per beneficiary declined by about 6% in 2010/11 over previous year.
• Total RxCost decreased for brand products (-5.5%) due to a number of brand patent expiries
and only increased slightly for generic products (.7%). Claims for generic drugs continued to
increased in 2010/11, while claims for brand products decreased over 2009/10.
• Even though total RxCost and claims for brand products decreased in 2010/11 over
2009/10, the brand drug cost per standard claim continues to increase over time. In 2002/03
the brand drug cost per standard claim was $46 and in 2010/11 it had increased to $64.
• The top chemical by number of utilizing beneficiaries was Atorvastatin (Lipitor), the same as
2009/10.
• The top chemical by drug cost for 2010/11 was Rosuvastatin Calcium (Crestor).
43
Report Card Framework
Overview Financial Indicators and Cost Trends
Formulary Process and
Types of Listing
Milestones Achievements
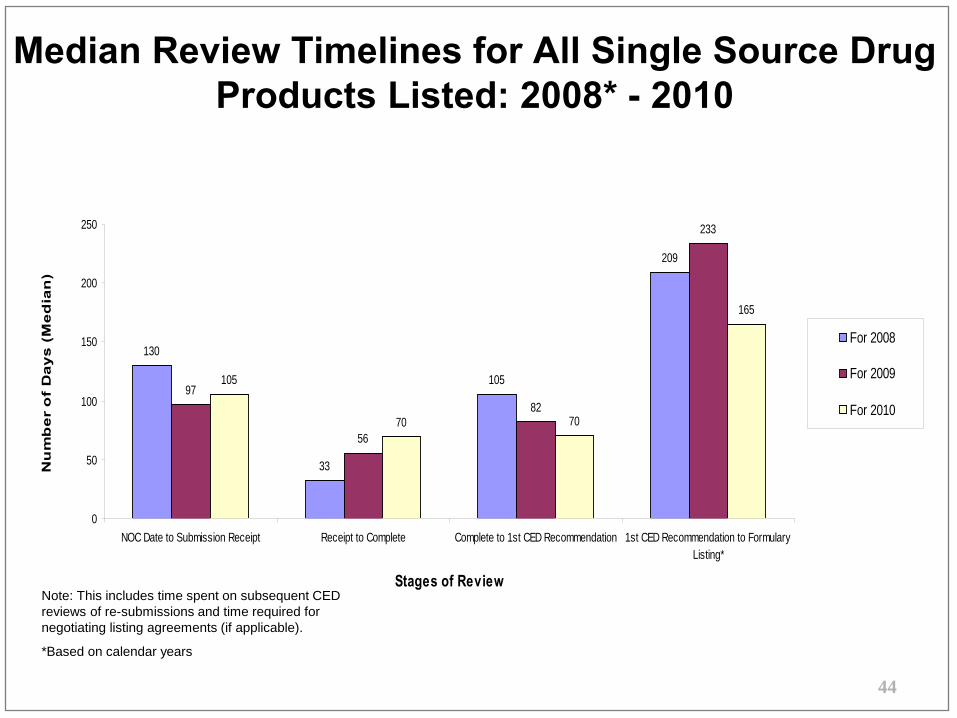
Median Review Timelines for All Single Source Drug Products Listed: 2008* - 2010
Note: This includes time spent on subsequent CED reviews of re-submissions and time required for negotiating listing agreements (if applicable).
*Based on calendar years
44
130
33
105
209
97
56
82
233
105
70 70
165
0
50
100
150
200
250
NOC Date to Submission Receipt Receipt to Complete Complete to 1st CED Recommendation 1st CED Recommendation to FormularyListing*
Stages of Review
Nu
mb
er
of
Da
ys
(M
ed
ian
)
For 2008
For 2009
For 2010
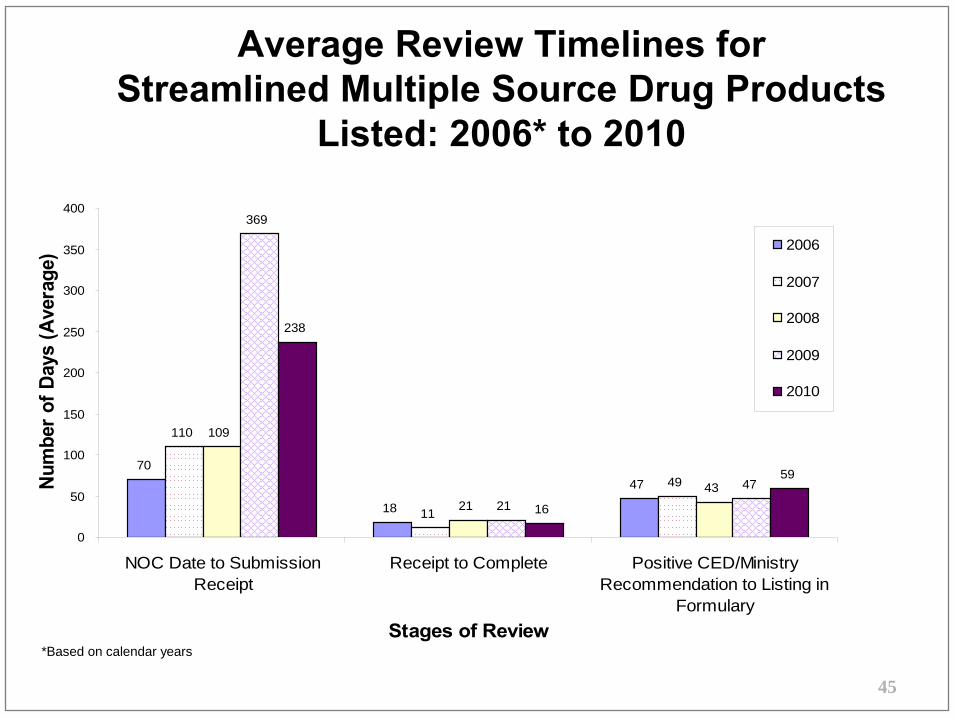
Average Review Timelines for Streamlined Multiple Source Drug Products
Listed: 2006* to 2010
*Based on calendar years
45
70
18
47
110
11
49
109
2143
369
21
47
238
16
59
0
50
100
150
200
250
300
350
400
NOC Date to SubmissionReceipt
Receipt to Complete Positive CED/MinistryRecommendation to Listing in
FormularyStages of Review
Num
ber o
f Day
s (A
vera
ge) 2006
2007
2008
2009
2010
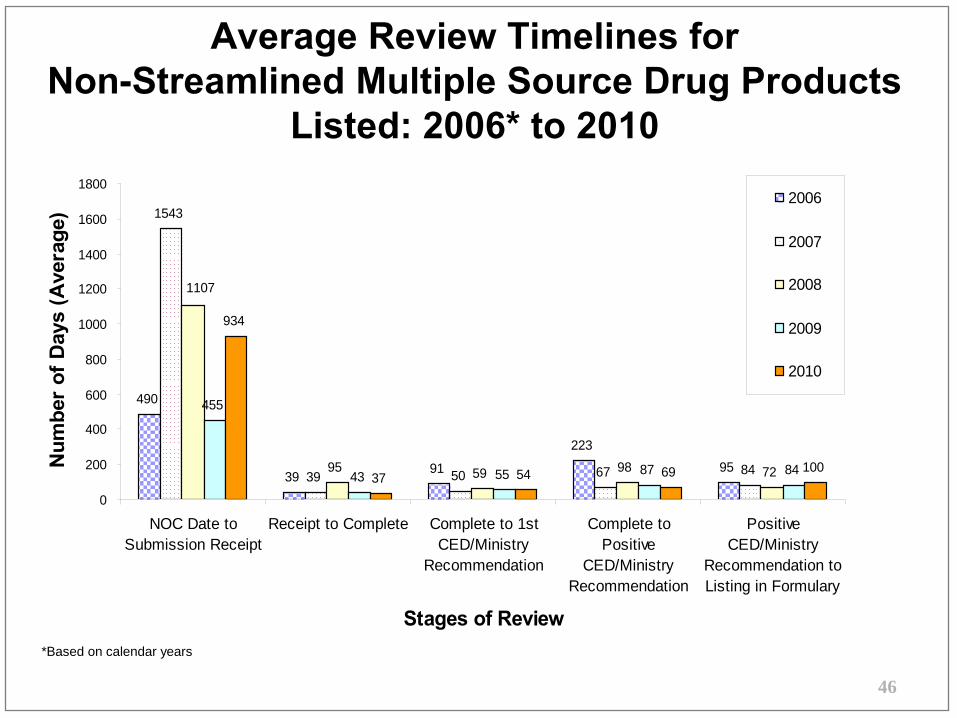
Average Review Timelines for Non-Streamlined Multiple Source Drug Products
Listed: 2006* to 2010
*Based on calendar years
46
490
39 91
22395
1543
39 50 67 8495 59 98 72
455
43 55 87 84
934
37 54 69 100
1107
0
200
400
600
800
1000
1200
1400
1600
1800
NOC Date toSubmission Receipt
Receipt to Complete Complete to 1stCED/Ministry
Recommendation
Complete toPositive
CED/MinistryRecommendation
PositiveCED/Ministry
Recommendation toListing in Formulary
Stages of Review
Num
ber
of D
ays
(Ave
rage
)
2006
2007
2008
2009
2010
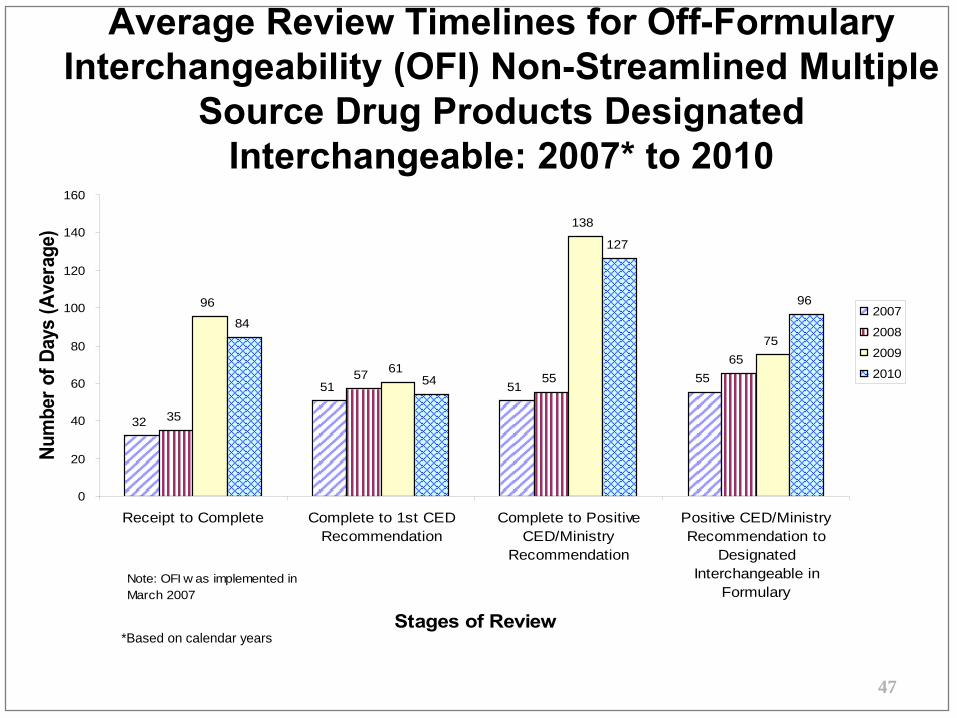
Average Review Timelines for Off-Formulary Interchangeability (OFI) Non-Streamlined Multiple
Source Drug Products Designated Interchangeable: 2007* to 2010
Note: OFI w as implemented in March 2007
*Based on calendar years
47
32
51 5155
35
57 5565
96
61
138
7584
54
127
96
0
20
40
60
80
100
120
140
160
Receipt to Complete Complete to 1st CEDRecommendation
Complete to PositiveCED/Ministry
Recommendation
Positive CED/MinistryRecommendation to
DesignatedInterchangeable in
Formulary
Stages of Review
Num
ber o
f Day
s (A
vera
ge)
2007
2008
2009
2010
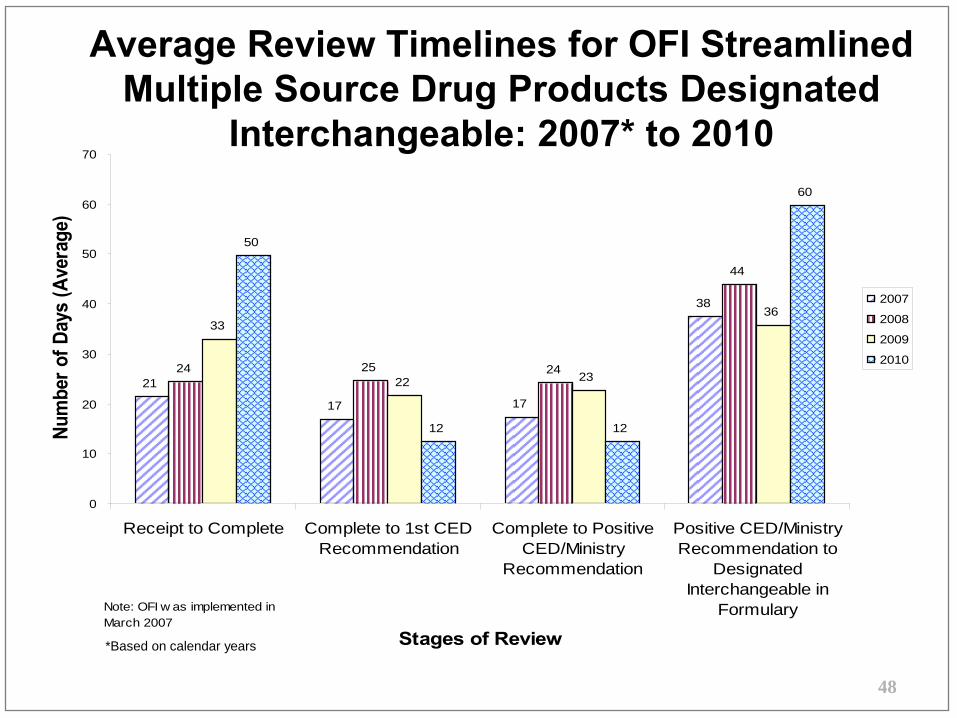
Average Review Timelines for OFI Streamlined Multiple Source Drug Products Designated
70Interchangeable: 2007* to 2010
Note: OFI w as implemented in March 2007
*Based on calendar years
48
21
17 17
38
24 25 24
44
33
22 23
36
50
12 12
60
0
10
20
30
40
50
60
Receipt to Complete Complete to 1st CEDRecommendation
Complete to PositiveCED/Ministry
Recommendation
Positive CED/MinistryRecommendation to
DesignatedInterchangeable in
Formulary
Stages of Review
Num
ber o
f Day
s (A
vera
ge)
2007
2008
2009
2010
49
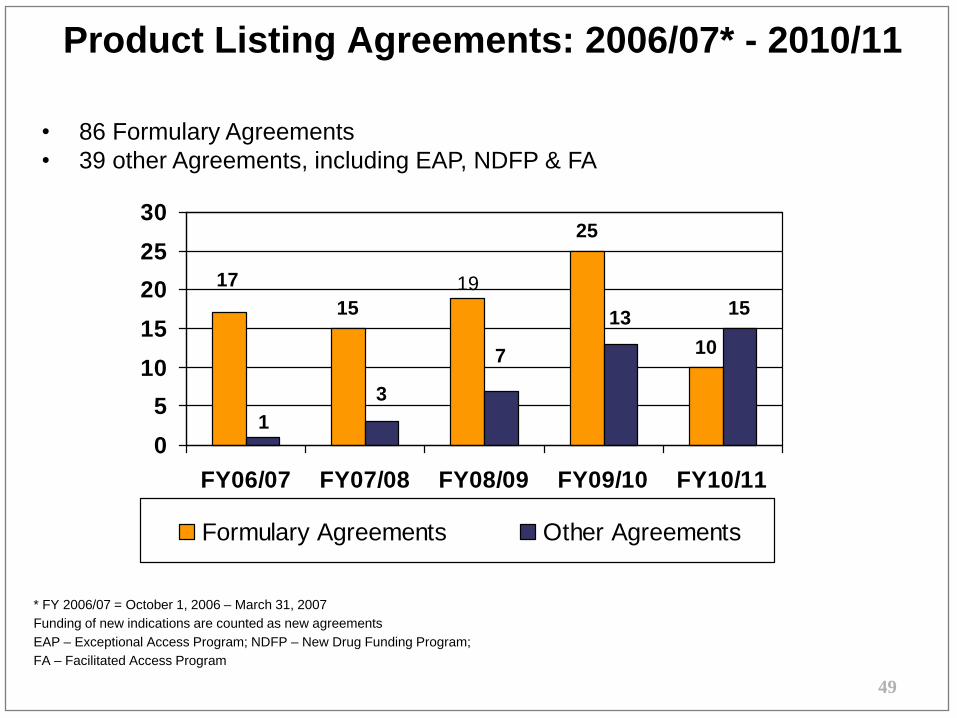
Product Listing Agreements: 2006/07* - 2010/11
• 86 Formulary Agreements
• 39 other Agreements, including EAP, NDFP & FA
15
25
10
15
17 19
1
7
13
3
0
5
10
15
20
25
30
FY06/07 FY07/08 FY08/09 FY09/10 FY10/11
Formulary Agreements Other Agreements
* FY 2006/07 = October 1, 2006 – March 31, 2007
Funding of new indications are counted as new agreements
EAP – Exceptional Access Program; NDFP – New Drug Funding Program;
FA – Facilitated Access Program
50
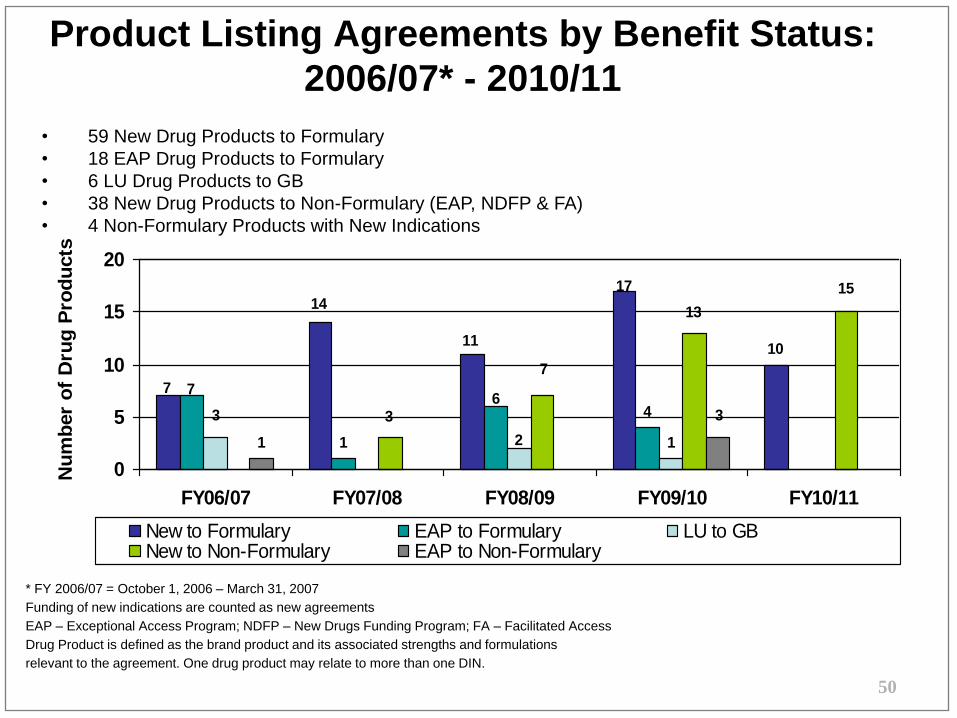
Product Listing Agreements by Benefit Status:
2006/07* - 2010/11
• 59 New Drug Products to Formulary
• 18 EAP Drug Products to Formulary
• 6 LU Drug Products to GB
• 38 New Drug Products to Non-Formulary (EAP, NDFP & FA)
• 4 Non-Formulary Products with New Indications
10
1
4
11
11
17
7
14
76
2
3
15
13
7
3 3
0
5
10
15
20
FY06/07 FY07/08 FY08/09 FY09/10 FY10/11
Nu
mb
er
of
Dru
g P
rod
ucts
New to Formulary EAP to Formulary LU to GBNew to Non-Formulary EAP to Non-Formulary
* FY 2006/07 = October 1, 2006 – March 31, 2007
Funding of new indications are counted as new agreements
EAP – Exceptional Access Program; NDFP – New Drugs Funding Program; FA – Facilitated Access
Drug Product is defined as the brand product and its associated strengths and formulations
relevant to the agreement. One drug product may relate to more than one DIN.
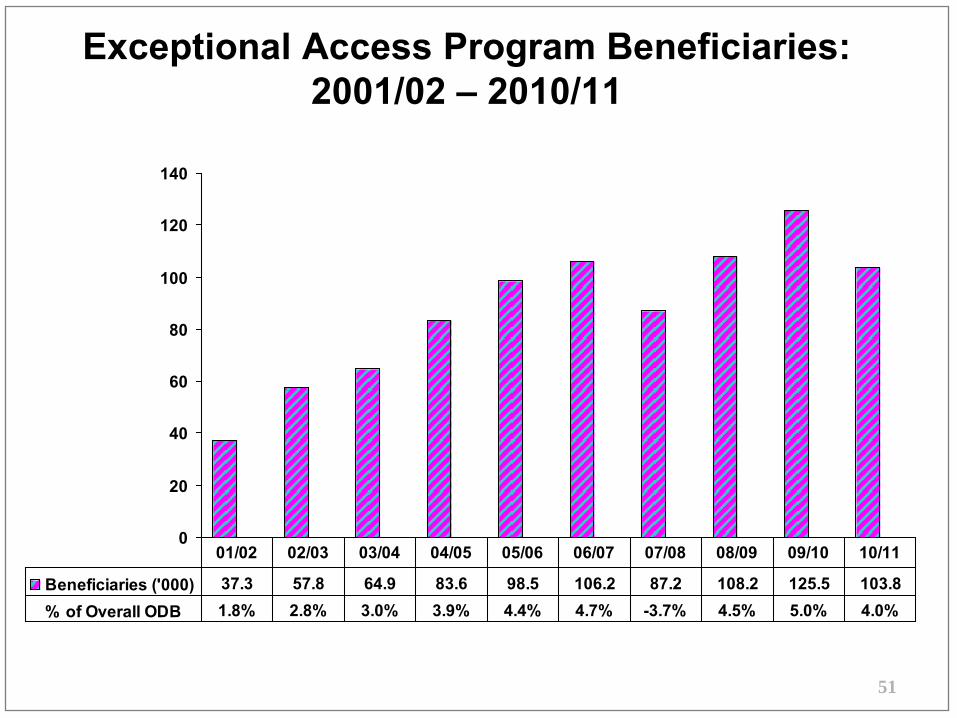
Exceptional Access Program Beneficiaries: 2001/02 – 2010/11
51
0
20
40
60
80
100
120
140
Beneficiaries ('000) 37.3 57.8 64.9 83.6 98.5 106.2 87.2 108.2 125.5 103.8% of Overall ODB 1.8% 2.8% 3.0% 3.9% 4.4% 4.7% -3.7% 4.5% 5.0% 4.0%
01/02 02/03 03/04 04/05 05/06 06/07 07/08 08/09 09/10 10/11
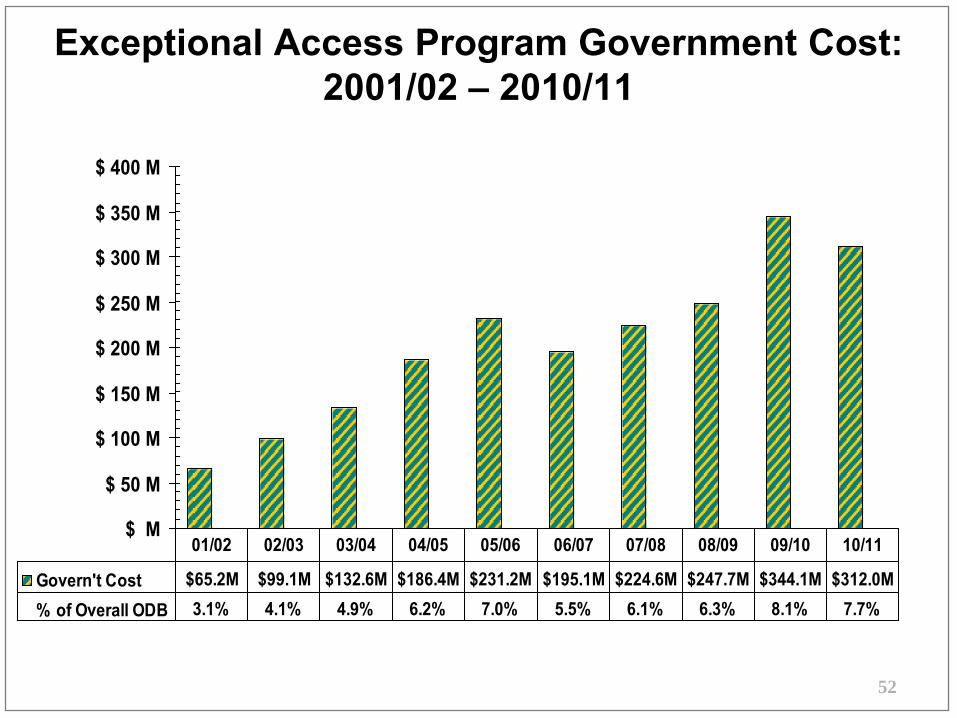
Exceptional Access Program Government Cost: 2001/02 – 2010/11
52
$ M
$ 50 M
$ 100 M
$ 150 M
$ 200 M
$ 250 M
$ 300 M
$ 350 M
$ 400 M
Govern't Cost $65.2M $99.1M $132.6M $186.4M $231.2M $195.1M $224.6M $247.7M $344.1M $312.0M% of Overall ODB 3.1% 4.1% 4.9% 6.2% 7.0% 5.5% 6.1% 6.3% 8.1% 7.7%
01/02 02/03 03/04 04/05 05/06 06/07 07/08 08/09 09/10 10/11
53
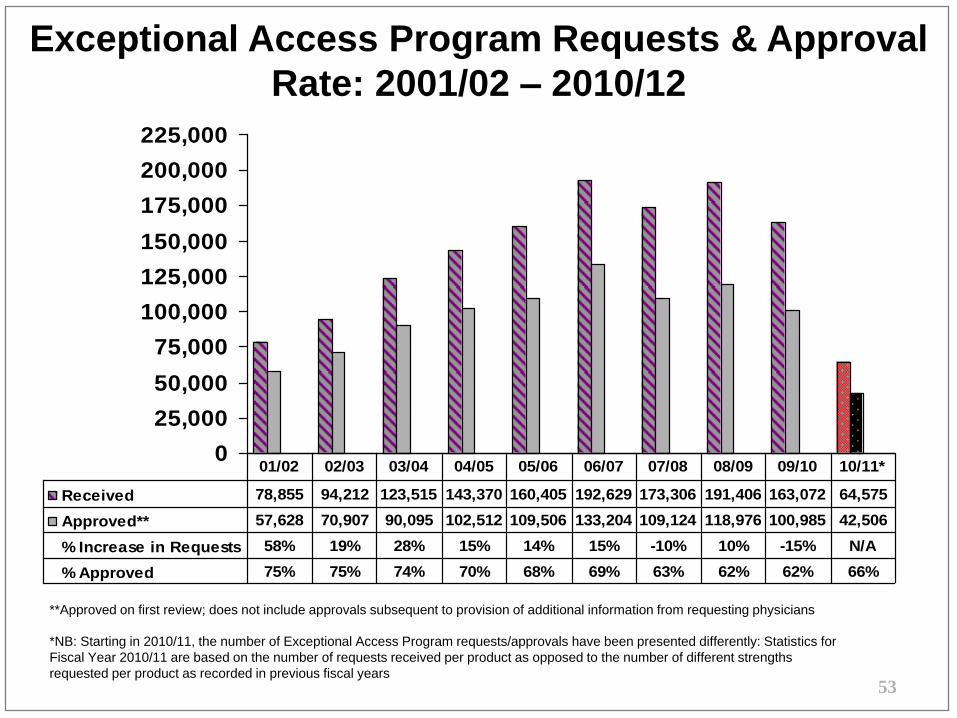
Exceptional Access Program Requests & Approval
Rate: 2001/02 – 2010/12
0
25,000
50,000
75,000
100,000
125,000
150,000
175,000
200,000
225,000
Received 78,855 94,212 123,515 143,370 160,405 192,629 173,306 191,406 163,072 64,575
Approved** 57,628 70,907 90,095 102,512 109,506 133,204 109,124 118,976 100,985 42,506
% Increase in Requests 58% 19% 28% 15% 14% 15% -10% 10% -15% N/A
% Approved 75% 75% 74% 70% 68% 69% 63% 62% 62% 66%
01/02 02/03 03/04 04/05 05/06 06/07 07/08 08/09 09/10 10/11*
**Approved on first review; does not include approvals subsequent to provision of additional information from requesting physicians
*NB: Starting in 2010/11, the number of Exceptional Access Program requests/approvals have been presented differently: Statistics for
Fiscal Year 2010/11 are based on the number of requests received per product as opposed to the number of different strengths
requested per product as recorded in previous fiscal years
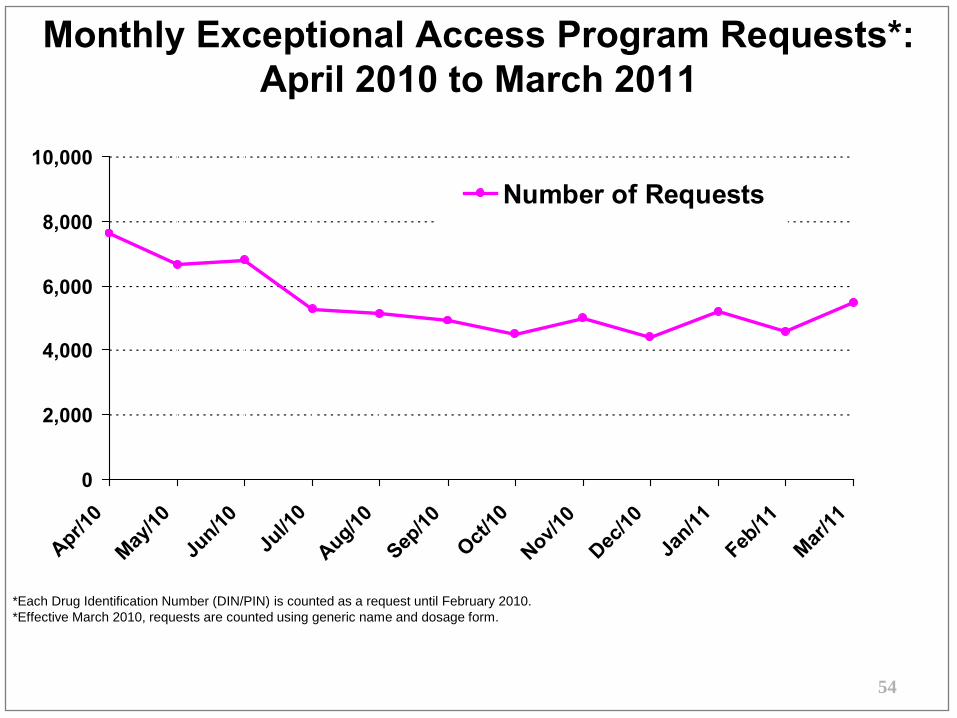
Monthly Exceptional Access Program Requests*: April 2010 to March 2011
*Each Drug Identification Number (DIN/PIN) is counted as a request until February 2010. *Effective March 2010, requests are counted using generic name and dosage form.
54
0
2,000
4,000
6,000
8,000
10,000
Apr/10
May/10
Jun/10
Jul/1
0
Aug/10
Sep/10
Oct/10
Nov/10
Dec/10
Jan/11
Feb/11
Mar/11
Number of Requests
55
57%
43%36%
64%
Within 1
month39%
Over 1 Month61%
36%
64%
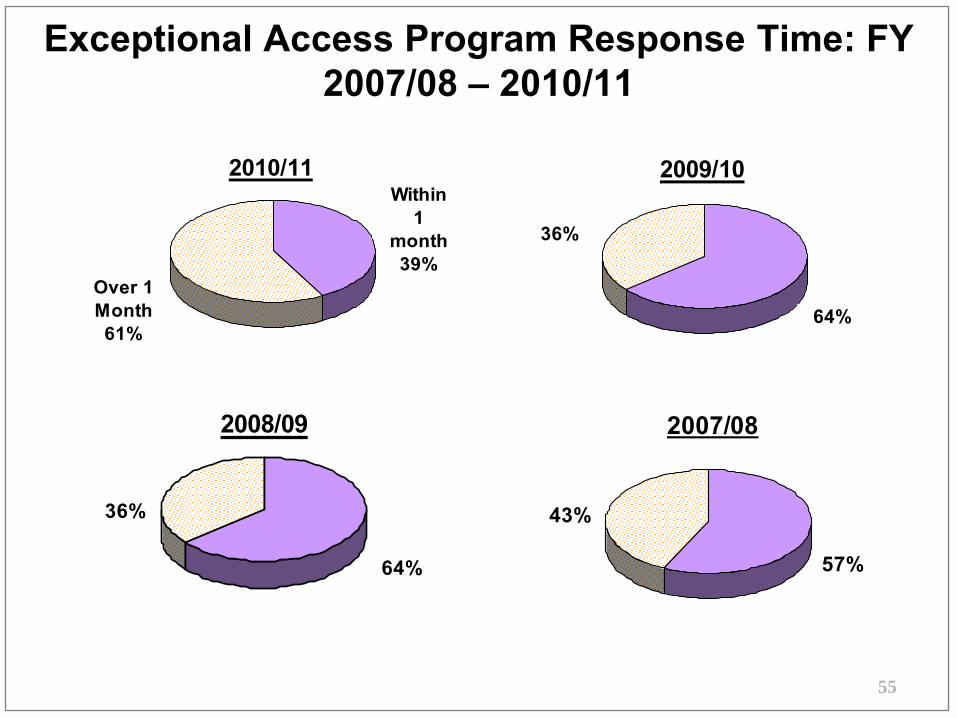
Exceptional Access Program Response Time: FY 2007/08 – 2010/11
2010/11 2009/10
2008/09 2007/08
56
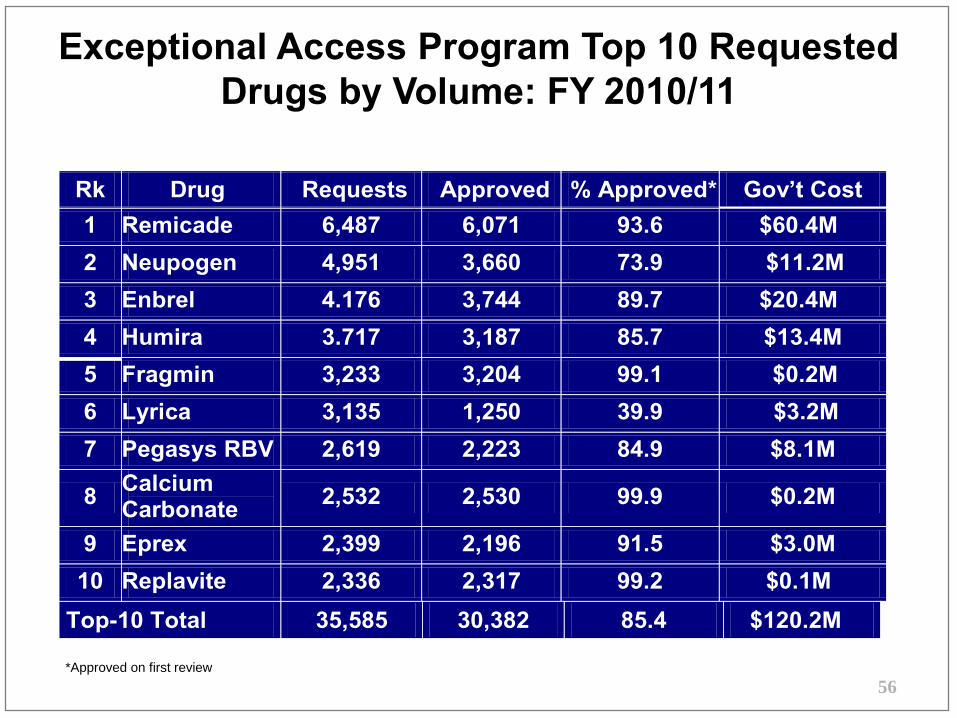
Exceptional Access Program Top 10 Requested Drugs by Volume: FY 2010/11
*Approved on first review
Rk Drug Requests Approved % Approved* Gov’t Cost1 Remicade 6,487 6,071 93.6 $60.4M 2 Neupogen 4,951 3,660 73.9 $11.2M 3 Enbrel 4.176 3,744 89.7 $20.4M 4 Humira 3.717 3,187 85.7 $13.4M 5 Fragmin 3,233 3,204 99.1 $0.2M 6 Lyrica 3,135 1,250 39.9 $3.2M 7 Pegasys RBV 2,619 2,223 84.9 $8.1M
8 Calcium Carbonate 2,532 2,530 99.9 $0.2M
9 Eprex 2,399 2,196 91.5 $3.0M 10 Replavite 2,336 2,317 99.2 $0.1M
Top-10 Total 35,585 30,382 85.4 $120.2M
57
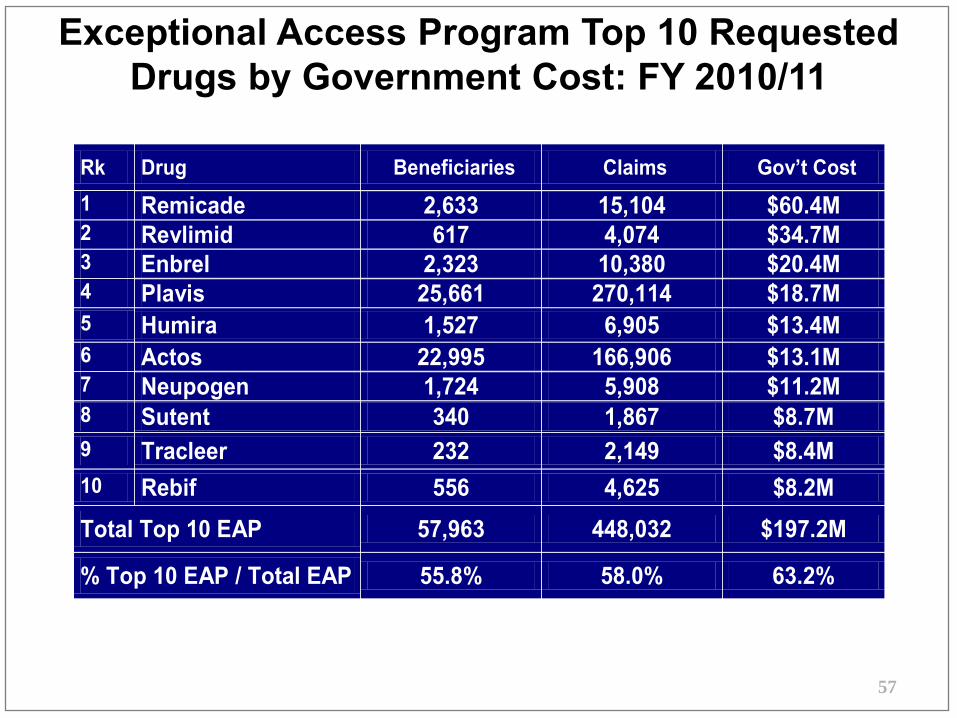
Exceptional Access Program Top 10 Requested Drugs by Government Cost: FY 2010/11
Rk Drug Beneficiaries Claims Gov’t Cost 1 Remicade 2,633 15,104 $60.4M 2 Revlimid 617 4,074 $34.7M 3 Enbrel 2,323 10,380 $20.4M 4 Plavis 25,661 270,114 $18.7M 5 Humira 1,527 6,905 $13.4M 6 Actos 22,995 166,906 $13.1M 7 Neupogen 1,724 5,908 $11.2M 8 Sutent 340 1,867 $8.7M 9 Tracleer 232 2,149 $8.4M 10 Rebif 556 4,625 $8.2M Total Top 10 EAP 57,963 448,032 $197.2M
% Top 10 EAP / Total EAP 55.8% 58.0% 63.2%
58
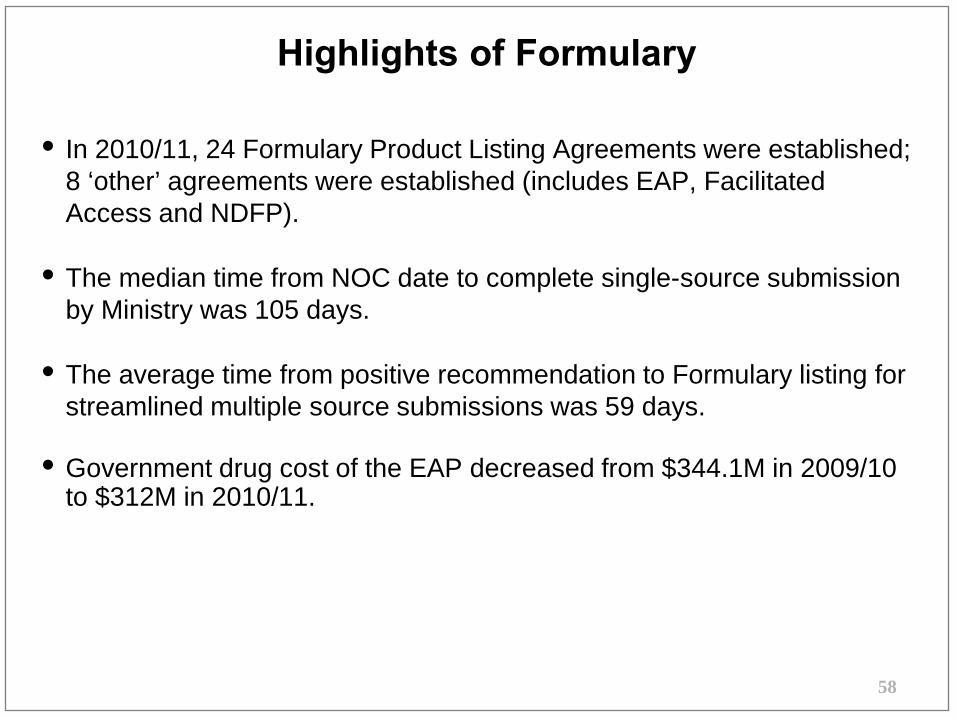
Highlights of Formulary
• In 2010/11, 24 Formulary Product Listing Agreements were established; 8 ‘other’ agreements were established (includes EAP, Facilitated Access and NDFP).
• The median time from NOC date to complete single-source submission by Ministry was 105 days.
• The average time from positive recommendation to Formulary listing for streamlined multiple source submissions was 59 days.
• Government drug cost of the EAP decreased from $344.1M in 2009/10 to $312M in 2010/11.
59
Report Card Framework
Overview Financial Indicators and Cost Trends
Formulary Process and
Types of Listing
Milestones Achievements
60
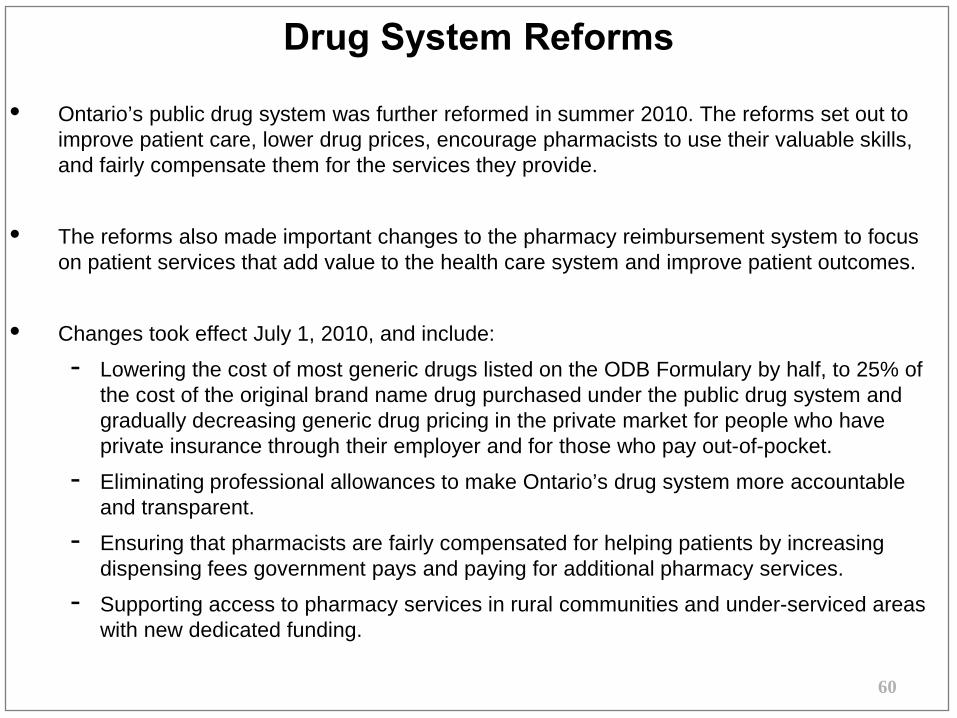
Drug System Reforms
• Ontario’s public drug system was further reformed in summer 2010. The reforms set out to improve patient care, lower drug prices, encourage pharmacists to use their valuable skills, and fairly compensate them for the services they provide.
• The reforms also made important changes to the pharmacy reimbursement system to focus on patient services that add value to the health care system and improve patient outcomes.
• Changes took effect July 1, 2010, and include:
- Lowering the cost of most generic drugs listed on the ODB Formulary by half, to 25% of the cost of the original brand name drug purchased under the public drug system and gradually decreasing generic drug pricing in the private market for people who have private insurance through their employer and for those who pay out-of-pocket.
- Eliminating professional allowances to make Ontario’s drug system more accountable and transparent.
- Ensuring that pharmacists are fairly compensated for helping patients by increasing dispensing fees government pays and paying for additional pharmacy services.
- Supporting access to pharmacy services in rural communities and under-serviced areas with new dedicated funding.
61
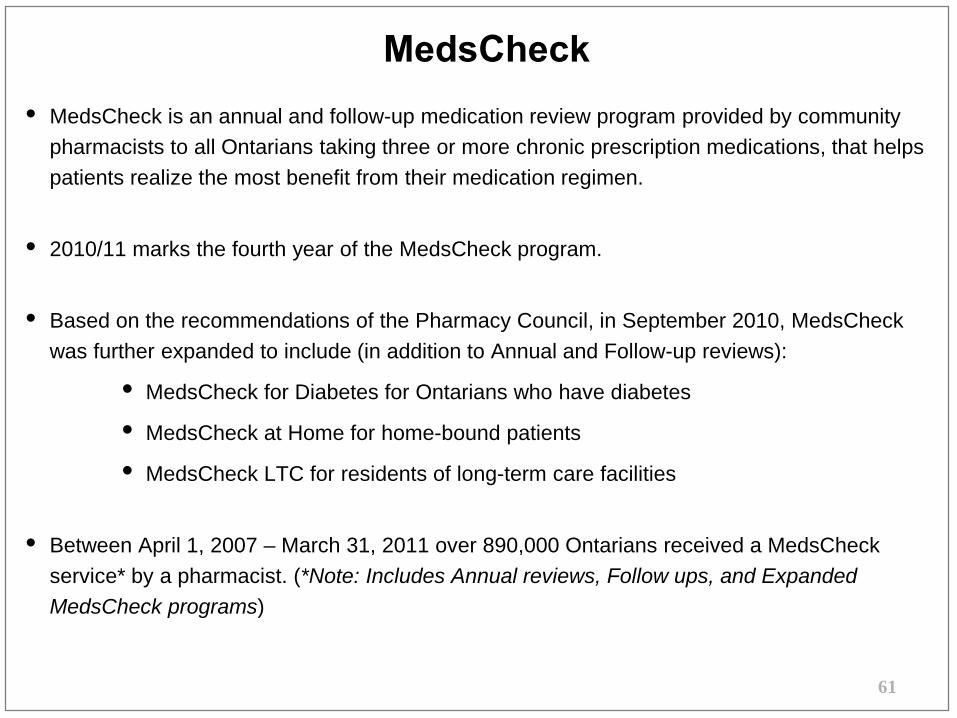
MedsCheck • MedsCheck is an annual and follow-up medication review program provided by community
pharmacists to all Ontarians taking three or more chronic prescription medications, that helps patients realize the most benefit from their medication regimen.
• 2010/11 marks the fourth year of the MedsCheck program.
• Based on the recommendations of the Pharmacy Council, in September 2010, MedsCheck was further expanded to include (in addition to Annual and Follow-up reviews):
• MedsCheck for Diabetes for Ontarians who have diabetes
• MedsCheck at Home for home-bound patients
• MedsCheck LTC for residents of long-term care facilities
• Between April 1, 2007 – March 31, 2011 over 890,000 Ontarians received a MedsCheck service* by a pharmacist. (*Note: Includes Annual reviews, Follow ups, and Expanded MedsCheck programs)
62
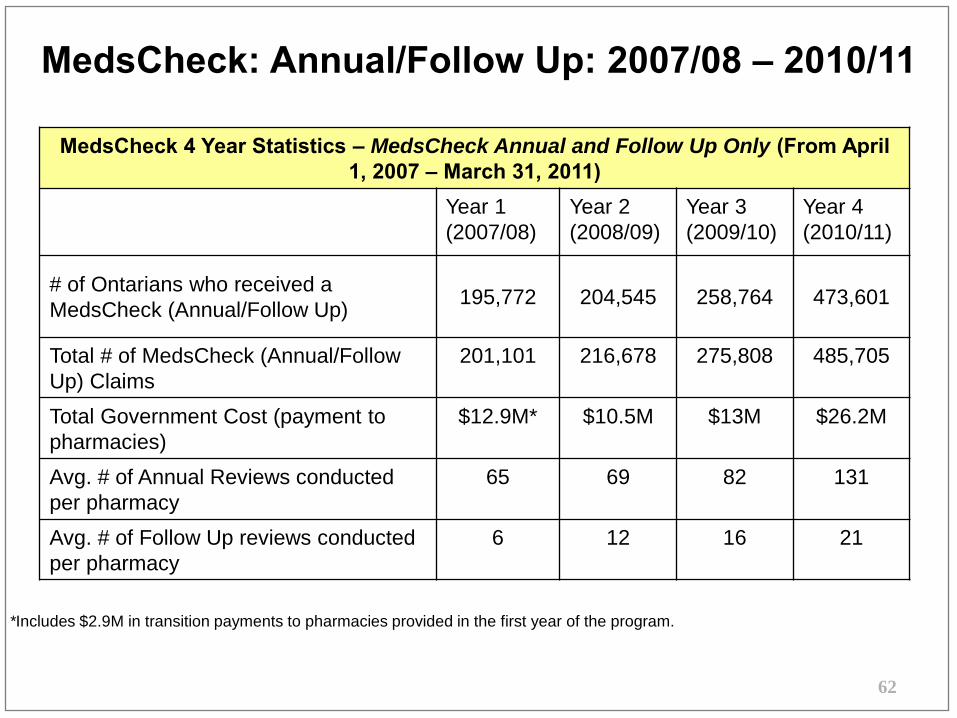
MedsCheck: Annual/Follow Up: 2007/08 – 2010/11
MedsCheck 4 Year Statistics – MedsCheck Annual and Follow Up Only (From April 1, 2007 – March 31, 2011)
Year 1 (2007/08)
Year 2 (2008/09)
Year 3 (2009/10)
Year 4 (2010/11)
# of Ontarians who received a MedsCheck (Annual/Follow Up) 195,772 204,545 258,764 473,601
Total # of MedsCheck (Annual/Follow Up) Claims
201,101 216,678 275,808 485,705
Total Government Cost (payment to pharmacies)
$12.9M* $10.5M $13M $26.2M
Avg. # of Annual Reviews conducted per pharmacy
65 69 82 131
Avg. # of Follow Up reviews conducted per pharmacy
6 12 16 21
*Includes $2.9M in transition payments to pharmacies provided in the first year of the program.
63
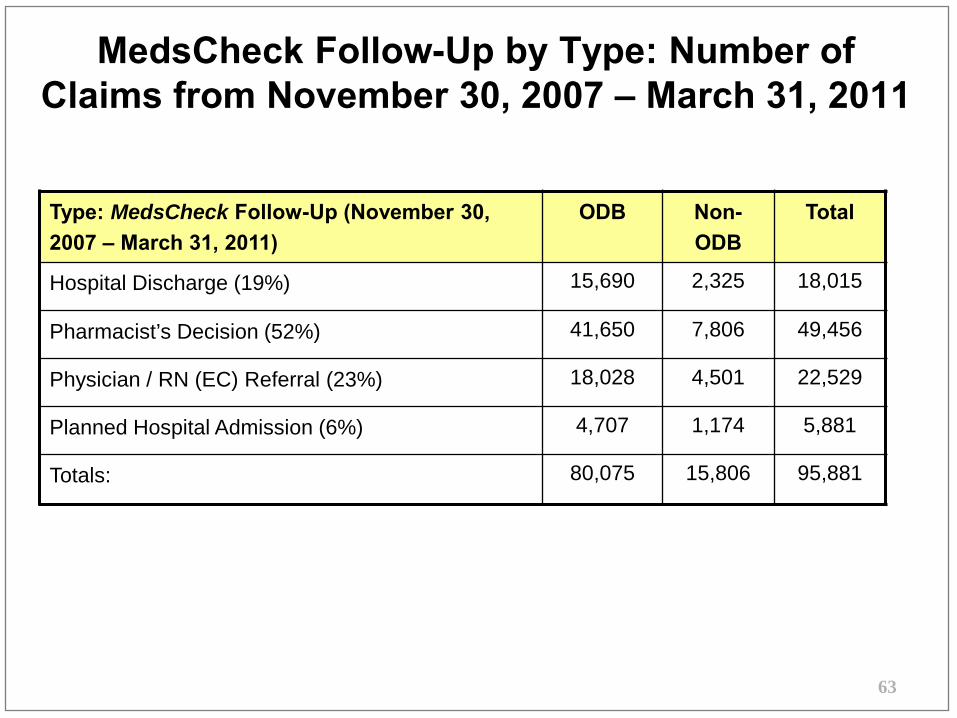
MedsCheck Follow-Up by Type: Number of Claims from November 30, 2007 – March 31, 2011
Type: MedsCheck Follow-Up (November 30, 2007 – March 31, 2011)
ODB Non-ODB
Total
Hospital Discharge (19%) 15,690 2,325 18,015
Pharmacist’s Decision (52%) 41,650 7,806 49,456
Physician / RN (EC) Referral (23%) 18,028 4,501 22,529
Planned Hospital Admission (6%) 4,707 1,174 5,881
Totals: 80,075 15,806 95,881
64
Narcotics Strategy • The Ministry launched the Narcotic Strategy on August 27, 2010 to reduce the misuse,
addiction, unlawful activities and deaths related to these medications.
• There are five key elements to the Narcotics Strategy:
- New legislation to support the development of a narcotics monitoring.
- Partnering with the health care sector to educate on appropriate prescribing
- Partnering with the health care sector to educate on appropriate dispensing.
- Education to prevent excessive use of prescription narcotics.
- Treatment of addictions.
• As part of the first key element, the Ontario government introduced legislation, the Narcotics Safety and Awareness Act, 2010, on September 15, 2010, that allows the ministry to track narcotics and other controlled substances dispensed in Ontario through a new provincial database. The legislation was passed on November 29, 2010.
• A monitoring system is now being developed to collect and store information on prescribing and dispensing activities for these medications. The information collected by the monitoring system will be used for improving prescribing and dispensing practices and stopping the use of prescription drugs for improper purposes.
65
Compassionate Review Policy
• The Compassionate Review Policy (CRP) mechanism allows for funding of requests under the EAP in cases where there are rare clinical circumstances in immediately life-, limb-, or organ-threatening conditions.
• In January 2011, the Executive Officer of OPDP approved revisions to the existing CRP allowing for consideration of requests in situations where a product has been reviewed by the CED and the ministry is in protracted negotiations with the manufacturer but the EO has not made a final funding decision. These requests will be considered on a case-by-case basis for those individuals who have been hospitalized due to an immediate life-, limb-, or organ threatening complication. The request must be for a drug therapy that is directly related to the clinical condition that has resulted in the hospitalization and the drug in question is under negotiation.
• The changes to the CRP mean that even more patients with rare clinical circumstances can potentially benefit from the policy.
• 2010/11, approximately 285 applications were reviewed (and 72.3% were approved).
66
Patient Evidence Submission Process • Effective April 1, 2010, a formal process was established for patient advocacy groups to
submit evidence for new drugs undergoing funding review, to systematically incorporate patient evidence into the drug review and funding process.
• The information provided in these submissions is collated by the ministry and reviewed and presented by a patient member of the CED.
• Patient impact is a key consideration for drug funding recommendations and decisions. By prioritizing the most important aspects of the illness and treatment outcomes, patient evidence can help set the context for weighing the clinical and economic data and understanding therapeutic gaps that may exist.
• Ontario is the second province in Canada to have a formal process for soliciting patient input in the drug review process.
• Facts:
- 42 patient groups registered in 2010/11
- In 2010/11, OPDP received 29 patient evidence submissions from 25 of patient groups