Embed Size (px)
Citation preview
2010 NSAA IT Conference
Gaining Audit Efficiency and Insight Through Risk Metrics & Data Analytics
_____________________________________
September 29, 2010April Gunn, CPA, CISAVirginia Auditor of Public Accounts

2010 NSAA IT Conference
Speaker Biography
Virginia Auditor of Public Accounts Audit Director Data Analysis Director Judicial Director
Commonwealth Data Point James Madison University Alumni CPA, CISA Wife, mother of two boys

2010 NSAA IT Conference
Objectives
Provide ways to pinpoint risks of non-compliance using data
How to achieve efficiency through reviewing data as a whole instead of individually
How to automate assigning risk factors to data
Challenges of implementing a risk-based audit approach

2010 NSAA IT Conference
Background
207 District Courts – including General District, Juvenile and Domestic Relations, and Combined
Goal was to visit each court a maximum of every 24 months
Same audit program for years – including only revenue cycle
TONS of data not being used No link between central oversight and local
courts

2010 NSAA IT Conference
Challenge
Incorporate other audit cycles – Expenditures, Payroll
Develop audit using manuals and data analytics combined
Visit ALL District Courts in 9 months Relate to central audit of the Supreme Court Make big picture recommendations to improve
oversight
2010 NSAA IT Conference
Answer
Develop risk metrics using data in addition to known risks
Perform a risk analysis of all courts Determine which courts to test in detail vs.
those to test minimally Create new programs to focus test work
only where necessary

2010 NSAA IT Conference
Process
Determine Risks
Gather Data
Develop reports/queries
Assign risks and Accumulate data
Write new programs

2010 NSAA IT Conference
Risk FactorsRisk Factor Points Assigned
Staff Size Variable
Turnover Variable
Prior year audit findings 4 pts per written finding2 pts per verbal finding
Fraud 10 pts
New Clerk 3 pts
Case to Staff Ratio Variable
Exception Reports 3 pts for cash over/short report2 pts for extended due dates and payroll1 pt for all others
Dismissed Cases Test work performed at all high risk (top 5%)

2010 NSAA IT Conference
Example Script – Staff Size
Open Staff_Count
DEFINE FIELD Staff_Count_RF COMPUTED
5 IF BETWEEN(Staff_Count,0,1.99)
4 IF BETWEEN(Staff_Count,2,2.99)
3 IF BETWEEN(Staff_Count,3,3.99)
2 IF BETWEEN(Staff_Count,4,4.99)
0
END

2010 NSAA IT Conference

2010 NSAA IT Conference
OPEN Staff_Count
DEFINE FIELD Case_to_Staff_RF COMPUTED
1 IF (BETWEEN(Ratio_Cases_to_Staff,439,2619) AND Court_type = 'G')
3 IF (BETWEEN(Ratio_Cases_to_Staff,0,440) AND Court_type = 'G')
3 IF (BETWEEN(Ratio_Cases_to_Staff,2618,5000) AND Court_type = 'G')
0
END
Example Script – Case to Staff
2010 NSAA IT Conference
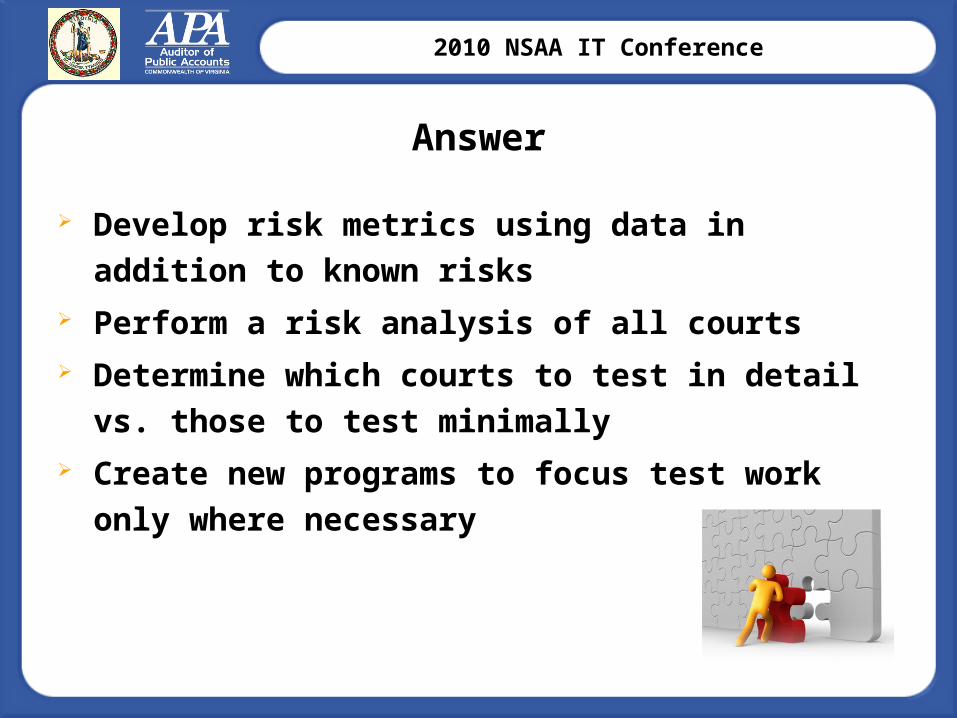
Court Code
Count of Cases
Staff Count Staff Count RF
Ratio Case to Staff
Case to Staff RF
001G 7105 4 2 1776.25 1
003G 13379 8.5 0 1574 1
005G 7878 5 0 1575.6 1
007G 4568 2 4 2984 3
Results Example

2010 NSAA IT Conference

2010 NSAA IT Conference
Example Script – Turnover Ratio
Open turnover
DEFINE FIELD Turnover_RF COMPUTED
1 IF BETWEEN(Percent_Turnover_2009,2.8,12.4)
2 IF BETWEEN(Percent_Turnover_2009,12.3,21.8)
3 IF BETWEEN(Percent_Turnover_2009,21.7,31.2)
4 IF BETWEEN(Percent_Turnover_2009,31.1,40.6)
5 IF BETWEEN(Percent_Turnover_2009,40.5,50.1)
0
END

2010 NSAA IT Conference
Exception Report Descriptions
Revenue Specific accounts codes = code mandated
amount Cash over/short Extended due dates
Expenses Fees paid out = code mandated amount
Experts Court Appointed Attorney Fees Involuntary Mental Commitments

2010 NSAA IT Conference
Exception Report Descriptions
Payroll Bonuses Overtime Leave
Other Systems Access

2010 NSAA IT Conference
Risk Accumulation
Exception reports combined into one table on a summary level
Created script to assign risks 3 pts for Cash Over/Under 2 pts for Payroll and Extended Due Dates 1 pt for all others
Combined all risks into one table by court Calculated a total risk score

2010 NSAA IT Conference
2010 NSAA IT Conference
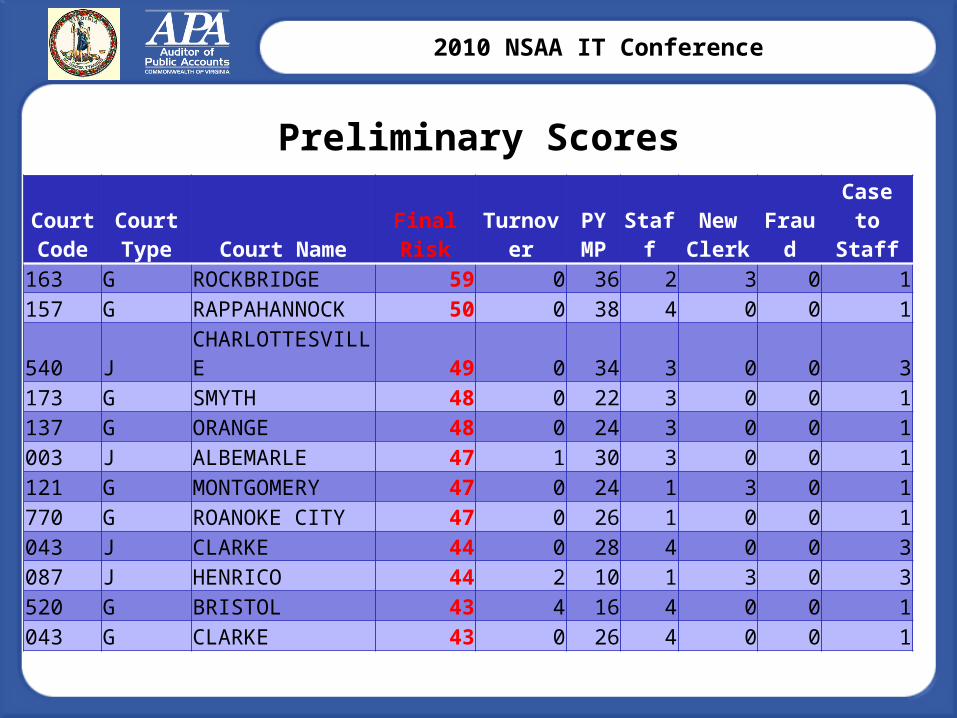
Preliminary Scores
Court Code
Court Type Court Name
Final Risk
Turnover
PY MP
Staff
New Clerk
Fraud
Case to
Staff163 G ROCKBRIDGE 59 0 36 2 3 0 1157 G RAPPAHANNOCK 50 0 38 4 0 0 1
540 JCHARLOTTESVILLE 49 0 34 3 0 0 3
173 G SMYTH 48 0 22 3 0 0 1137 G ORANGE 48 0 24 3 0 0 1003 J ALBEMARLE 47 1 30 3 0 0 1121 G MONTGOMERY 47 0 24 1 3 0 1770 G ROANOKE CITY 47 0 26 1 0 0 1043 J CLARKE 44 0 28 4 0 0 3087 J HENRICO 44 2 10 1 3 0 3520 G BRISTOL 43 4 16 4 0 0 1043 G CLARKE 43 0 26 4 0 0 1

2010 NSAA IT Conference
Additional Considerations
Lapse or Over Coverage Combined Courts splitting Other

2010 NSAA IT Conference
Final Scores/Moving Forward
Established two different audit types Full Audit Internal Control Questionnaire
Tracked findings centrally during audit cycle of six months
Conducted central audit and any follow-up on local findings necessary at same time

2010 NSAA IT Conference
Findings
Leave approvals – questionnaire only No log with cases transferred Weaknesses in transition/payment of
expenses from local to central Data entry errors Many miscommunications from central
oversight
2010 NSAA IT Conference
Lessons Learned
Getting data in a usable format Prepare for “fires” Expect hesitation from client and/or staff Allow time, time, time, and more time

2010 NSAA IT Conference
Other possible applications
Small Purchase Charge Cards Any program where risks can be quantified
Eligibility programs Decentralized clients Internal audit identification – grant awards,
etc Can be supplied to clients for monitoring
internally