Embed Size (px)
Citation preview

©2010
Jennifer A. Jacobs
ALL RIGHTS RESERVED
UNDERGRADUATES’ (MIS) UNDERSTANDING OF PERCENTAGES
by
JENNIFER A. JACOBS
A thesis submitted to the
Graduate School – New Brunswick
Rutgers, The State University of New Jersey
in partial fulfillment of the requirements
for the degree of
Master of Science
Graduate Program in Psychology
written under the direction of
Dr. Rochel Gelman
and approved by
___________________________
___________________________
___________________________
New Brunswick, New Jersey
May 2010
ii
ABSTRACT OF THE THESIS
Undergraduates’ (Mis) Understanding of Percentages
by JENNIFER A. JACOBS
Thesis Director: Dr. Rochel Gelman
Children and adults alike continue to have difficulty with rational numbers, and, as
shown in this study, percentages. Adult undergraduate students (N = 27) completed an
untimed open-ended study that had a pretest-training-posttest design. Questions in the
pretest and posttest focused on percent increases and decreases (e.g., The price x was
increased by 20%). They were formatted in one of three representations: decimal,
fraction, or bar graph. Subjects were randomly assigned to one of two training groups
(decimal or fraction) that involved guiding them through the conceptual and procedural
component processes that contribute to the solutions to problems within a given
representation (i.e., decimal or fraction). Additional questions were asked in the pretest
and posttest pertaining to successive percent increases and decreases. Overall, students
performed best on bar graph representations. While decimal training had no effect on
performance, fraction training improved performance from pretest to posttest in every
category (decimal, fraction and bar graph). Students who had not yet taken Calculus
were shown to have benefited more from the fraction training than those students who
had taken that course. In contrast, prior math experience did not seem to have any effect
on those questions dealing with two percent changes within one problem; less than 25%
of these types of problems were answered correctly by the undergraduate students.
iii
Acknowledgments
I would like to thank my advisor, Dr. Rochel Gelman, and my committee members, Dr.
Gretchen B. Chapman and Dr. Julien Musolino, for their guidance and support. I am so
appreciative of the invaluable feedback given and the time put in by all of the members of
the Gelman Cognitive Development and Learning Lab relating to my design and in
discussing my results. I am especially grateful to Dr. Chapman, Jennifer Cooper, Natalie
Obrecht-Lindemann, Dr. Dana Chesney, and Katharine Saunders for their assistance with
statistical analysis and interpretation. Rony Patel’s insight was vital to the organization
of the training task in this experiment. Finally, I would like to thank my family and
friends- especially Meryl Jacobs, Glenn Jacobs, Lisa Jacobs, and Ilan Danan- for their
unwavering support and their patient understanding of my time spent completing this
thesis.
iv
Table of Contents Abstract ………………………………………………………………………………... ii Acknowledgments ……………………………………………………….……………. iii Table of Contents …………………………………..………………………………….. iv List of Tables …………………………………………….…………………….………. v List of Figures …………………………………………………………………………. vi Introduction ………………………………………………………………………..……. 1 Method ……………………………………………………………………….................. 7 Results …………………………………………………...........……………………...... 14 Discussion ……………………………………..……………..……………………....... 21 References …………………………..………………………............…………………. 25 Appendix …………………………………………………………….………………… 27

v
List of Tables
Table 1. Confounded variable: Uneven distribution of participants ……………......... 18 Table 2. Performance on 50% increase/decrease questions …………………………... 21 Table 3. Percent correct across direction ………………………………………............ 22
vi
List of Figures
Figure 1. Examples of formats used in experiment …………………………………… 6 Figure 2. Pretest/Posttest Questions …………………………………………………… 8 Figure 3. Scoring ………………………………………………………………………. 13 Figure 4. Performance on directional problems across Pretest and Posttest…................ 15 Figure 5. Overall performance across all representations …………………………...... 16 Figure 6. Decimal Training ……………………………………………………………. 17 Figure 7. Fraction Training ……………………………………………………………. 17 Figure 8. Decimal Training- Low math group ………………………………………… 19 Figure 9. Fraction Training- Low math group ………………………………………... 19 Figure 10. Average
€
Δ in performance from Pretest to Posttest-Low math group ……. 20
1
Undergraduates’ (Mis) Understanding of Percentages
Individuals differ radically from each other in the way they choose to approach
and solve problems, especially those of a mathematical nature. Admittedly, there is
usually one theoretically correct answer, but that answer can almost always be
represented in numerous mathematical formats and can be derived using multiple
algorithms.
To begin, consider the following problem:
The cost $x of a pair of skis has increased by 50%. When the ski season is over,
that new cost is then decreased by 50%. What is the final cost of the skis after
this reduction, in terms of x?
What would your response be? Are you be surprised to learn that a sample of
undergraduate Psychology majors (N=27) answered less than 25% of 54 of these types of
problems correctly? If you arrived at an answer of 75% of the original cost, .75x, (¾)x,
or some variation of that, then you were correct. However, even many more educated
individuals make the same mistakes as these undergraduates. Throughout the paper, this
type of problem will be referred to as the “50% increase/decrease problem”.
Every day, people are inundated with rational numbers all around them, from the
“% Daily Values” on nutrition labels to sales and discounts in our favorite stores to the
constant ups and downs of gas prices. And yet, there is a great deal of evidence
demonstrating that students of all ages continue to have difficulty with fractions and
rational numbers (Humberstone & Reeve, 2007). This is relevant to the professional and
educational communities’ concern about the rather high levels of math illiteracy. My
earlier pilot data has shown that not only do college students persistently make
2
mathematical errors, but they also have difficulty recognizing errors across different
representations of a rational number. Some mistakes are due to computational errors, but
many reflect the absence of conceptual understanding or a failure of learning. If one has
difficulty with rational number representations, what do they understand about the rise
and fall of the stock market, the interest on their loans, and the degree of risk associated
with their choices? My research falls within the realm of both perceptual and conceptual
understanding. In everyday life, how do people calculate cost increases or decreases so
that they are able to make educated decisions in comparing products out on the market?
School math practices
School math practices are informed by the discipline, by psychological theories
concerning how math is learned, and by the conventions of the school, at least in the
United States. Exams influence what is taught. As a result, school math has an uneven
relationship with meaning. Teaching to the stated curriculum or to the test can stand in
the way of a student’s ability to represent concepts in multiple representations. For
example, if an instructor is concentrating primarily on teaching students the most time-
efficient way to solve a problem, (s)he will be encouraging repetition through practice
with the mechanics, not necessarily the concepts involved. It limits what educators might
feel is necessary to teach, particularly when time constraints become an issue.
In the classroom, the steps to solve a math word problem are commonly outlined
as follows: 1) read the problem, 2) use variables to represent known quantities, 3) use
these symbols to write an expression to satisfy the conditions stated in the problem, 4)
solve for unknown variables, 5) respond to the question asked (which may involve
multiple steps after solving for the variables), and 6) verify the solution by substituting
3
values into the equation (Hawkes, Luby, & Touton, 1929; Koedinger & MacLaren,
1997). It is almost as important to make sure that the answer makes SENSE in the
context of the problem as it is to arrive at the correct answer. In the study presented here,
a participant should confirm that her answer to a percent decrease question yields a value
less than the original value. For instance, if a $200 dollar item is on sale for 10% off the
original price, then the participant should anticipate a value less than $200. Checking
that an answer makes sense emerges in other mathematical contexts as well (e.g. a
negative number multiplied by a negative number yields a positive answer; the square of
a negative number is positive; a correlation cannot be greater than 1.00, a sum of squares
cannot be negative; etc.).
Math equations and information processing theories
The processes used in configuring mathematical algorithms can sometimes be
described in information processing terms. Paige (1966) suggests the move to
“postulat[ing] in detail a precise set of mechanisms to account for the observed
behavior”. It certainly would be ideal to be able to identify the mechanisms with which
adults solve problems, especially in the area of mathematics. In solving any type of
mathematical problem, there are multiple steps to be taken. The more complex the
problem is, the more steps that are usually involved. In the classroom, traditional
textbooks teach students to first translate sentences from word problems into equations
before attempting to solve those equations (Hawkes, Luby, & Touton, 1929, as cited in
Paige, 1966; Zhu & Simon, 1987).
Previous research
While little attention has been paid to problems with percentages, there has been
4
some research on problems with fractions, which is one of the representations I am
studying. Researchers have found results emphasizing the importance of understanding
the concept of a unit. Activities relating the unit to fractions can strengthen this concept
(Stafylidou & Vosniadou, 2004). We already know that proportions dealing with a
fraction of ½ are much easier for children than other proportions (Spinillo & Bryant,
1991). Most work focuses on proper fractions such as ½, but not on problems with
improper fractions and mixed numbers (Humberstone & Reeve, 2007). The latter requires
understanding the concepts of proper fractions and the ability to use fractions in roles
other than fraction addition tasks. Understanding alternative representational formats,
such as fractions, is critical for effectively working with algebraic techniques. Yet, it has
been shown that children acquire knowledge about natural numbers and their successors
much more easily than with numbers containing fractional notation (Hartnett & Gelman,
1998). This evidence conveys the difficulties that exist in understanding equivalent
forms of mathematical representations.
Recognizing multiple representations to a solution of a problem is relevant to both
the acquisition of understanding and the pedagogy for teaching mathematical concepts.
Past studies have led participants to ask questions and discuss responses with others,
which, in turn, enabled them to evaluate their own existing concepts. Rittle-Johnson &
Star (2007) have also shown that comparing alternative solution methods has great value
conceptually and procedurally for seventh-grade students. This articulation accounts for
higher-order thinking (Zaslavsky & Shir, 2005), which entails critical thinking and
problem solving skills. Furthermore, providing explanations allows for recognition of
gaps in knowledge; acknowledging these missing links paves the path toward achieving a
5
greater understanding of the concept (Mills & Keil, 2004).
Teaching students to recognize different methods for solving a problem helps
them develop a greater understanding of concepts (Gelman, 1986), as has been a long-
held common practice in high-performing countries like Japan and Hong Kong. There,
instructors allow time for students to produce and discuss various ways to problem solve
amongst each other (Stigler & Hiebert, 1999, Rittle-Johnson & Star, 2007). While the
solution processes might be different, they must share the common mathematical
principles that underlie understanding. It therefore would seem to follow that students
should be taught to share and compare multiple representations. This recommendation is
slowly becoming part of the curriculum recommended in the United States by the
National Council of Teachers of Mathematics Standards (1989, 2000), although it was
not based on evidence. Nevertheless, there is surprisingly little relevant research. In fact,
Piñon (2000) failed to show an advantage of teaching a graphic and algebraic format for
multiplying two equations. This aside, other researchers have shown that students of all
ages become more proficient at understanding concepts when examples accompany
practice problems (Atkinson, Derry, Renkl, & Wortham, 2000, as cited by Rittle-Johnson
& Star, 2007).
Current study
How do people calculate cost increases or decreases so that they are able to make
educated decisions in their daily life? By presenting problems of the kind that occur
every day, I explored the extent of difficulty undergraduates have with percentages that
have equivalent fraction and decimal formats. In examining the approaches to problems,
kinds of errors and the patterns of these, I expected to gain insight into the kinds of
6
syntax of the mathematics that are at risk. By syntax, I refer to the rules and principles
that help us construct mathematical models and algorithms. This syntax is about
“representing one structure in terms of another and figuring out what relationships obtain
among elements of structures” (Kaput, 1987, as cited in Lampert, 1991).
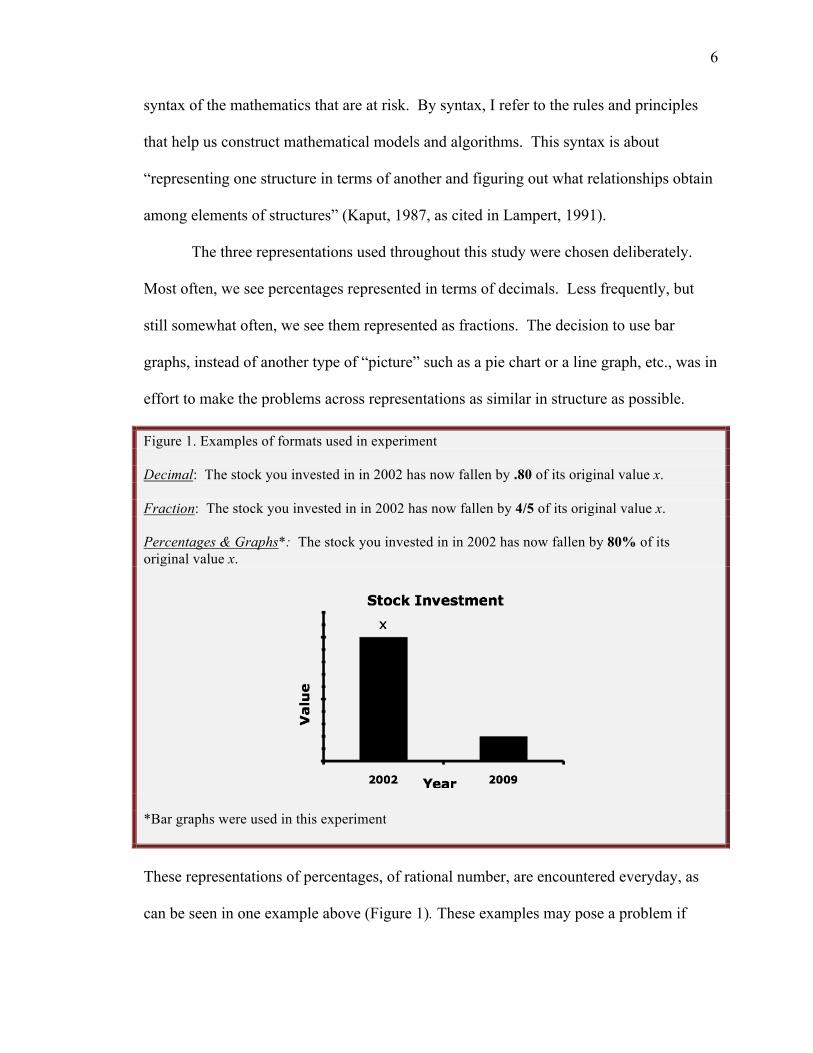
The three representations used throughout this study were chosen deliberately.
Most often, we see percentages represented in terms of decimals. Less frequently, but
still somewhat often, we see them represented as fractions. The decision to use bar
graphs, instead of another type of “picture” such as a pie chart or a line graph, etc., was in
effort to make the problems across representations as similar in structure as possible.
Figure 1. Examples of formats used in experiment Decimal: The stock you invested in in 2002 has now fallen by .80 of its original value x. Fraction: The stock you invested in in 2002 has now fallen by 4/5 of its original value x. Percentages & Graphs*: The stock you invested in in 2002 has now fallen by 80% of its original value x.
*Bar graphs were used in this experiment
These representations of percentages, of rational number, are encountered everyday, as
can be seen in one example above (Figure 1). These examples may pose a problem if
7
there is a lack of understanding. Some formats might, in fact, be easier to understand
than others.
Errors committed might indicate a weakness in the facility for one representation
over another. Or they might only identify a preference for a specific representation.
Thus, it would be ideal to pinpoint whether there exists a lack in ability versus kinds of
preferences.
Method
Participants
Twenty-eight adult volunteers were recruited from undergraduate Psychology
laboratory courses at Rutgers University in New Brunswick, New Jersey. One subject
was excluded due to her incomplete data, leaving N = 27. For the analyses, age was not a
grouping factor as all subjects were within 19-24 years old, with the exception of one 35
year old female (M = 22, Md = 21, [25 females]). Human subjects’ approval and all
relevant consents were obtained before the study began.
Materials and Design
A pretest-training-posttest design was used. Subjects completed an untimed paper
and pencil task. For the pretest and posttest, they were asked to follow a series of
questions in order. The training materials and the relevant features of the pre- and
posttests are as follows:
Formats of the pretest and posttest: Each consisted of six percentage problems.
Of these, there were three representations of problems: (a) decimal, (b) fraction, and (c)
bar graph. In the pretest and posttest, each representation appeared twice in the form of
an increase problem and a decrease problem.
8
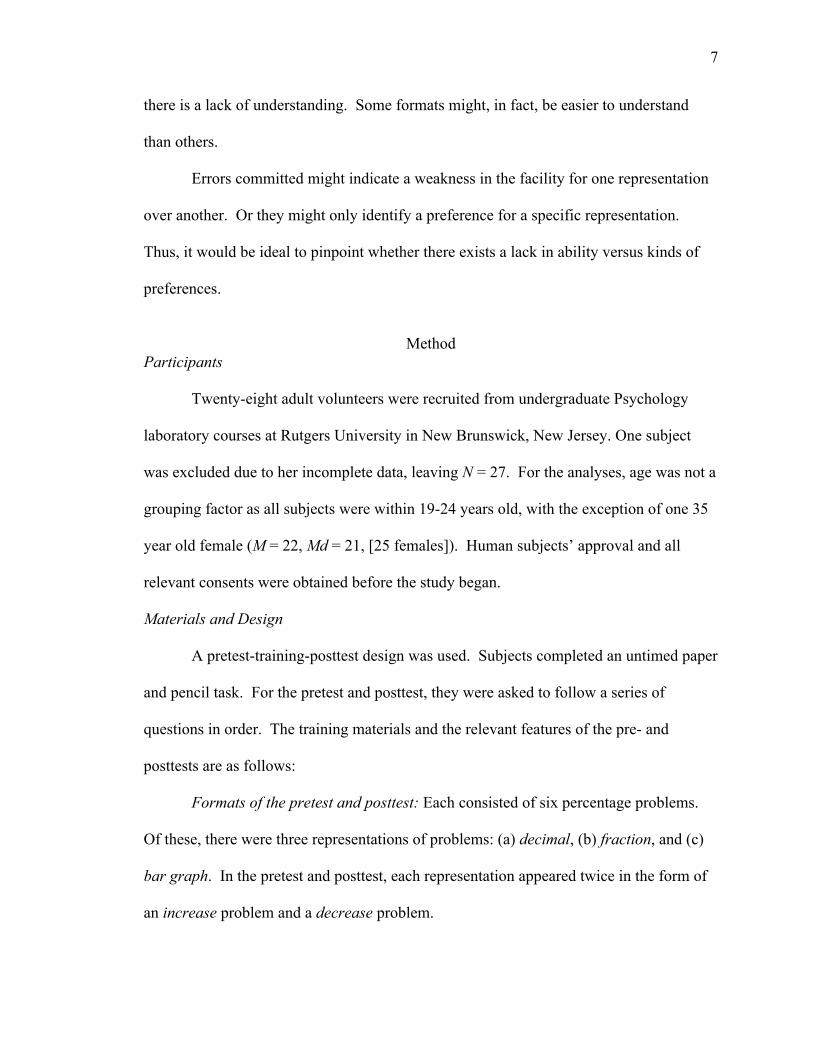
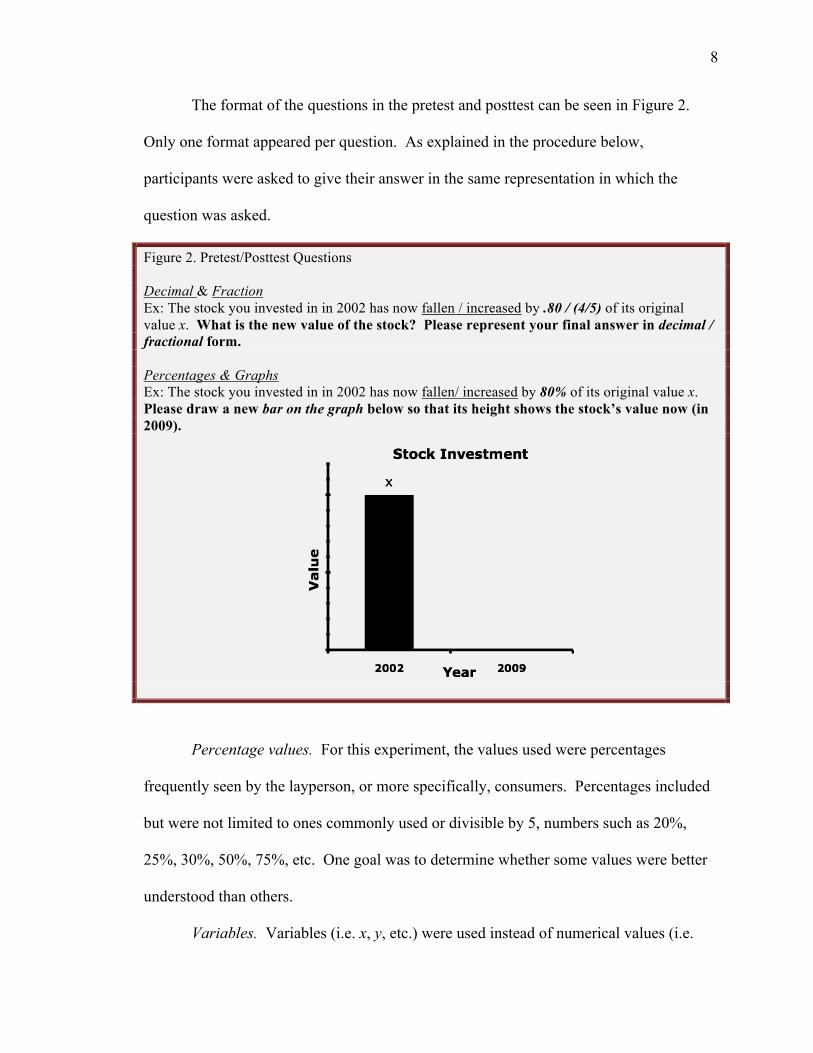
The format of the questions in the pretest and posttest can be seen in Figure 2.
Only one format appeared per question. As explained in the procedure below,
participants were asked to give their answer in the same representation in which the
question was asked.
Figure 2. Pretest/Posttest Questions Decimal & Fraction Ex: The stock you invested in in 2002 has now fallen / increased by .80 / (4/5) of its original value x. What is the new value of the stock? Please represent your final answer in decimal / fractional form. Percentages & Graphs Ex: The stock you invested in in 2002 has now fallen/ increased by 80% of its original value x. Please draw a new bar on the graph below so that its height shows the stock’s value now (in 2009).
Percentage values. For this experiment, the values used were percentages
frequently seen by the layperson, or more specifically, consumers. Percentages included
but were not limited to ones commonly used or divisible by 5, numbers such as 20%,
25%, 30%, 50%, 75%, etc. One goal was to determine whether some values were better
understood than others.
Variables. Variables (i.e. x, y, etc.) were used instead of numerical values (i.e.
9
$350, 168 beats/second, 471 miles). This decision was intentional. An objective of the
design was to lessen the “burden” on both the subjects and the experimenter. A pilot
study showed that, when responding with number to open-ended questions, raw data were
more difficult to code and error patterns were much harder to find. It was also important
that subjects stay focused on the conceptual process instead of getting caught up in the
mechanics of the procedural process. With numerical values, there most likely would
have been more individual differences and more room to err.
Direction. Analyses of previous pilot data also demonstrated that there were little
if no performance differences between problems involving percent increase and problems
involving percent decrease. However, as earlier data primarily used natural numbers
instead of variables, the possibility of a direction effect here could not be ruled out.
Therefore, it was included.
Additional “word problem” outside of main design. Another type of problem that
appeared in the pretest and in the posttest was the 50% increase/decrease problem
mentioned at the beginning of this paper. Psychology undergraduate students (N=27, 25
females) were presented problems (1 increase, 1 decrease) similar to the ski problem in
two forms: 1) 50% increase followed by a 50% decrease, and 2) 50% decrease followed
by a 50% increase. Unlike the original three types of questions, this type dealt with two
successive percentage processes within one problem.
General Instructions.
Participants were asked to complete the “workbook” packet sequentially; they
were strongly discouraged from returning to a previously completed section (especially
after completing the Training task). The directions were:
10
“The purpose of this study is to give the experimenter an idea of undergraduates’
general knowledge about percentage problems. We are not testing your individual
abilities, but instead we are interested in what information Rutgers students as a GROUP
can provide. This experiment consists of several sections. It is very important that you
take your time and do not rush through the material- you are not being timed!”
Pretest. Participants received 6 questions: 1 decimal-increase, 1 decimal-
decrease, 1 fraction-increase, 1 fraction-decrease, 1 bar graph-increase, 1 bar graph-
decrease. They also received 1 problem dealing with a 50% increase followed by a
decrease or vice versa.
Training. Students were randomly assigned to one of two groups (decimal or
fraction). A student assigned to the “decimal” training condition received two “guided
practice” lessons (one decrease and one increase) with corresponding examples. The
format was that of fill-in-the-blanks and incorporated concrete & generic information (i.e.
numbers) with algebraic information (i.e. variables). The nature of the explanations
provided was conceptual and procedural.
Each lesson was structured as follows: A question was asked (i.e. A t-shirt is 25%
off. What is the final cost of the t-shirt?); subjects were then guided through “workbook-
type” questions as paper and pencil tasks. These questions were organized in seven parts.
1) Preparation of generic information (see Appendix: Section B: Parts I & II:
Question 1) 2) Application of generic information (Appendix: Section B: Parts I & II:
Question 2) 3) Representation of algebraic information (Appendix: Section B: Parts I & II:
Question 3)
11
4) Application of algebraic information (Appendix: Section B: Parts I & II:
Question 4)
5) Comparison of generic and algebraic information (Appendix: Section B:
Parts I & II: Question 5) 6) Outline of the overall algorithm (Appendix: Section B: Parts I & II:
Question 6) 7) Corresponding increase or decrease practice problem (Appendix: Section
B: Parts I & II: “Now Try This”)
At the end of each lesson, subjects were asked and encouraged to check their work.
Answers were given (upside-down) at the bottom of the end of the lesson section.
Posttest. Participants received 6 questions very similar in format, but by no
means identical, to the questions in the pretest: 1 decimal-increase, 1 decimal-decrease, 1
fraction-increase, 1 fraction-decrease, 1 bar graph- increase, 1 bar graph- decrease. A
different ordering of the problems was presented and the word problems differed in
content and percentage values. They also received 1 problem dealing with a 50%
increase followed by a decrease or vice versa (whichever one they had not seen in the
pretest).
Coding
Training Condition. Participants were in the “decimal lesson” training condition
or the “fraction lesson” training condition.
Previous Math Knowledge. Participants’ previous mathematical knowledge was
obtained for subsequent data analyses. Students were grouped in one of two categories:
below Calculus 1 (considered “lower level math courses” here) or Calculus 1 and above.
If a student only listed a basic statistics course as a previous mathematics course (such as
the Quantitative Methods course offered by the Rutgers Psychology department), (s)he
12
was placed into the low math knowledge group.
Group (*confounded variable). The ordering of the questions was
counterbalanced between the pretest and the posttest sections. 14 of the participants
received the questions in Section A as their pretest and the questions in Section B as their
posttest. 13 of the participants received the opposite: Section B as their pretest and
Section A as their posttest. It was later realized that this variable was confounded: The
first group (A/B) was comprised of Psychology students enrolled in a Behavioral
Neuroscience laboratory course, and the second group (B/A) was comprised of
Psychology students enrolled in an Infant & Child Development laboratory course.
Math SAT scores. 14 of the 27 subjects did not report their Math SAT I scores so,
unfortunately, that information could not be used.
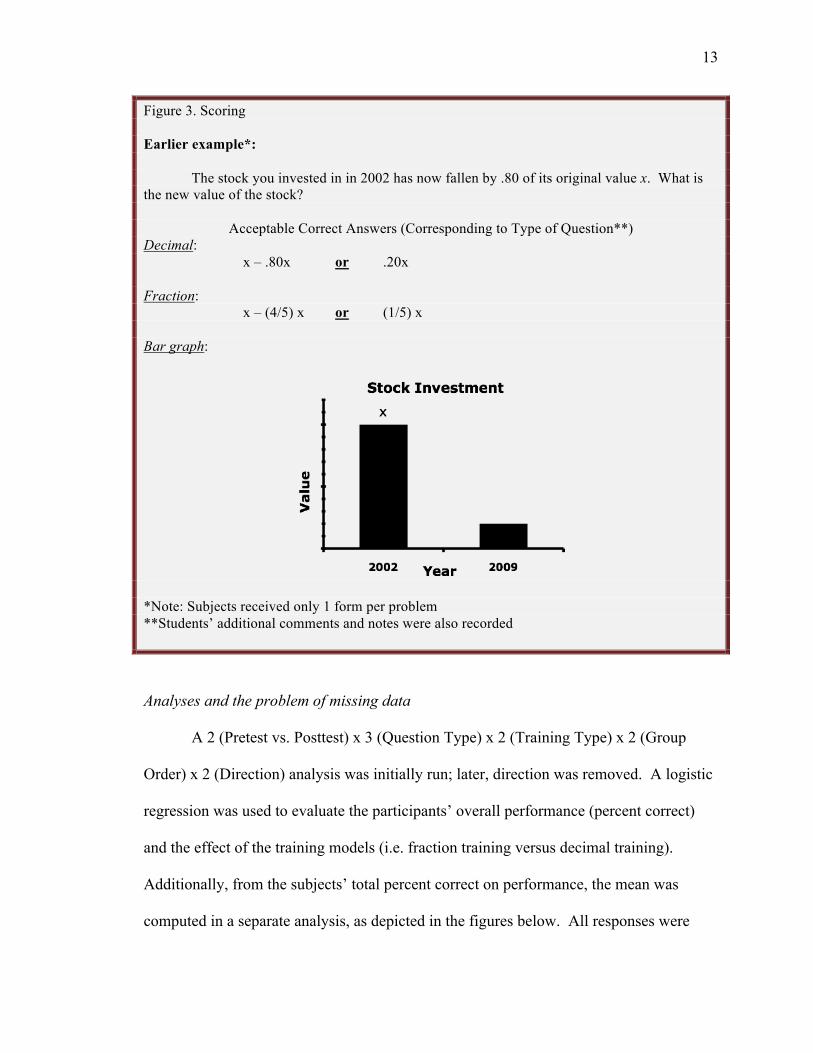
Scoring. All open-ended responses on the pretest and posttest were sorted as
correct or incorrect answers. As mentioned earlier, students were asked to respond using
the same representation in which the question was posed. If a correct response was given
in a different representation, the subject was not penalized; a note was simply recorded
by the experimenter. While subjects’ often responded with mathematically lengthy or
“showy” responses, an effort was made to score the answers as simply correct or
incorrect. Using the same example as seen earlier, Figure 3 aims to briefly denote what
the experimenter deemed as acceptable correct answers; please note that it is not an
exhaustive list. Other representational variations of these responses also fit the criteria
for “correct”.
13
Figure 3. Scoring Earlier example*: The stock you invested in in 2002 has now fallen by .80 of its original value x. What is the new value of the stock?
Acceptable Correct Answers (Corresponding to Type of Question**)
Decimal: x – .80x or .20x Fraction: x – (4/5) x or (1/5) x Bar graph:
*Note: Subjects received only 1 form per problem **Students’ additional comments and notes were also recorded
Analyses and the problem of missing data
A 2 (Pretest vs. Posttest) x 3 (Question Type) x 2 (Training Type) x 2 (Group
Order) x 2 (Direction) analysis was initially run; later, direction was removed. A logistic
regression was used to evaluate the participants’ overall performance (percent correct)
and the effect of the training models (i.e. fraction training versus decimal training).
Additionally, from the subjects’ total percent correct on performance, the mean was
computed in a separate analysis, as depicted in the figures below. All responses were
14
coded as 0 (Incorrect), 1 (Correct), or left blank. We planned to collapse the factors of
Direction and Group Order unless initial analyses revealed a difference on these fronts.
Cases of missing data. Missing data was accounted for by extrapolating data
where possible. For example, Subject Z was missing the data for both bar graph
problems in the posttest. Data was extrapolated from the pretest where the subject was
correct for both questions.
In other cases, data were collapsed when finding correlations with no significant
difference between them. Doing so allowed us to compensate for the fact that some
participants (n = 3) did not answer some of the questions in pretest and/or posttest.
Results
There were three major findings in this study. First, undergraduates performed
significantly better on questions with bar graph representations than on those with
decimals or fractions across pretest and posttest (bar graphs: M =80.6% correct,
decimals: M = 53.3%, fractions: M = 60.1%). Second, upon looking at students with
lower math knowledge, only training on fraction tasks significantly improved
performance across all representations from pretest to posttest (on decimal
representations: M =27.3% to M = 45.5%, on fraction: M = 36.4% to M = 59.1%, on bar
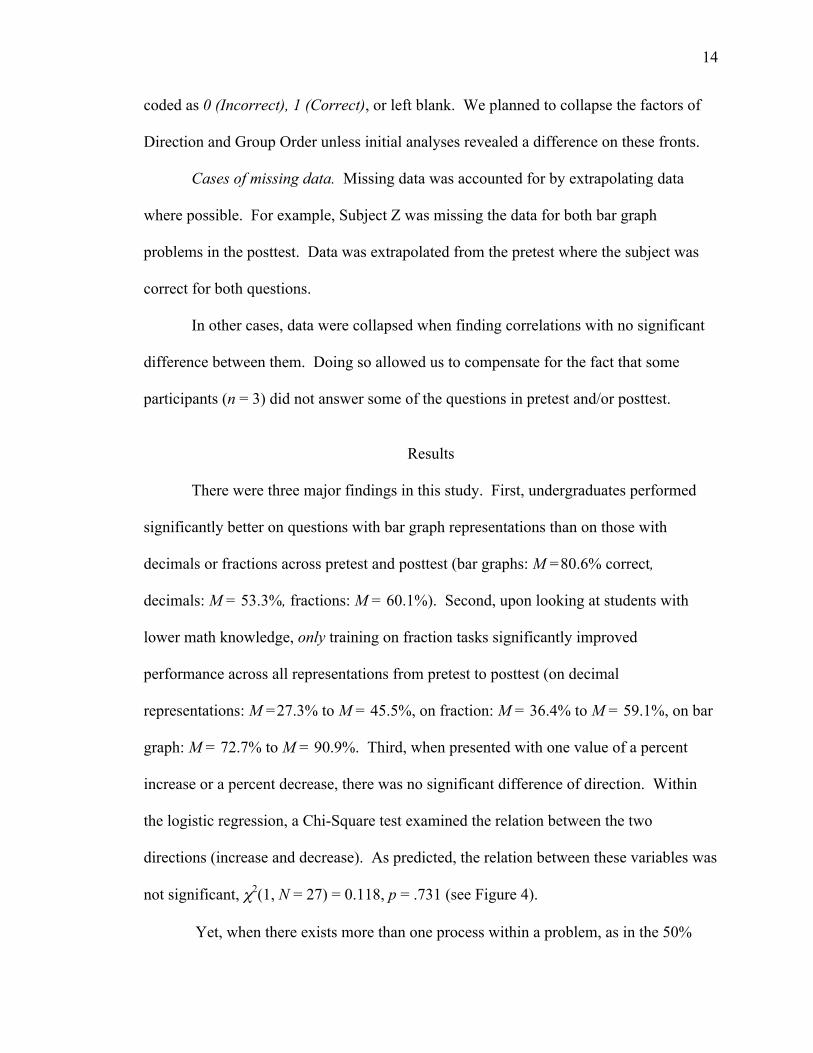
graph: M = 72.7% to M = 90.9%. Third, when presented with one value of a percent
increase or a percent decrease, there was no significant difference of direction. Within
the logistic regression, a Chi-Square test examined the relation between the two
directions (increase and decrease). As predicted, the relation between these variables was
not significant, χ2(1, N = 27) = 0.118, p = .731 (see Figure 4).
Yet, when there exists more than one process within a problem, as in the 50%
15
increase/decrease problem, participants encounter a significantly greater deal of trouble
(i.e. less than 25% of these problems were answered correctly).
All subjects
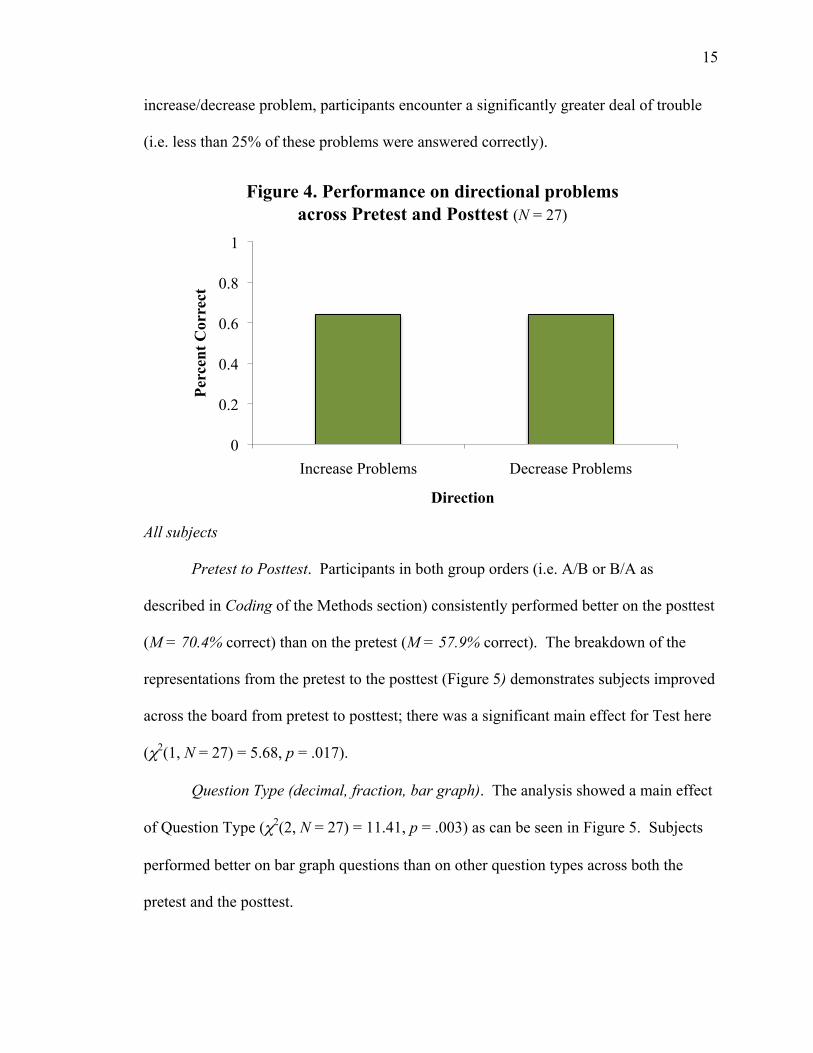
Pretest to Posttest. Participants in both group orders (i.e. A/B or B/A as
described in Coding of the Methods section) consistently performed better on the posttest
(M = 70.4% correct) than on the pretest (M = 57.9% correct). The breakdown of the
representations from the pretest to the posttest (Figure 5) demonstrates subjects improved
across the board from pretest to posttest; there was a significant main effect for Test here
(χ2(1, N = 27) = 5.68, p = .017).
Question Type (decimal, fraction, bar graph). The analysis showed a main effect
of Question Type (χ2(2, N = 27) = 11.41, p = .003) as can be seen in Figure 5. Subjects
performed better on bar graph questions than on other question types across both the
pretest and the posttest.
0
0.2
0.4
0.6
0.8
1
Increase Problems Decrease Problems
Perc
ent C
orre
ct
Direction
Figure 4. Performance on directional problems across Pretest and Posttest (N = 27)
16
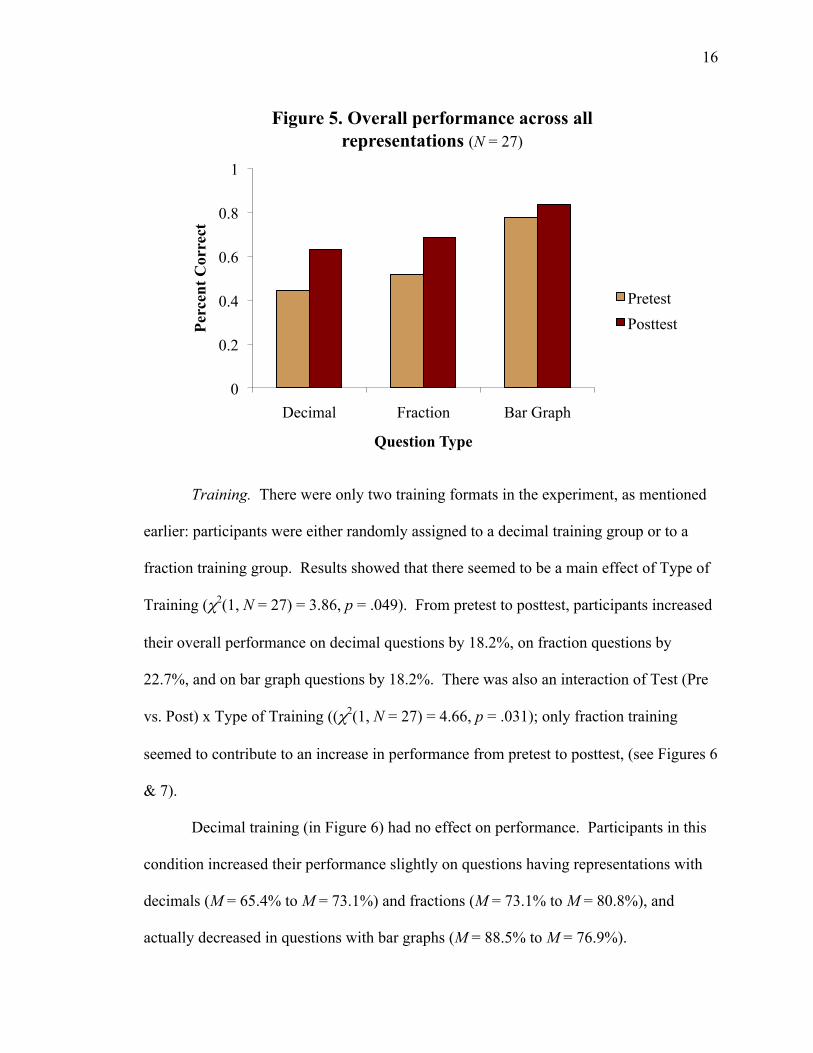
Training. There were only two training formats in the experiment, as mentioned
earlier: participants were either randomly assigned to a decimal training group or to a
fraction training group. Results showed that there seemed to be a main effect of Type of
Training (χ2(1, N = 27) = 3.86, p = .049). From pretest to posttest, participants increased
their overall performance on decimal questions by 18.2%, on fraction questions by
22.7%, and on bar graph questions by 18.2%. There was also an interaction of Test (Pre
vs. Post) x Type of Training ((χ2(1, N = 27) = 4.66, p = .031); only fraction training
seemed to contribute to an increase in performance from pretest to posttest, (see Figures 6
& 7).
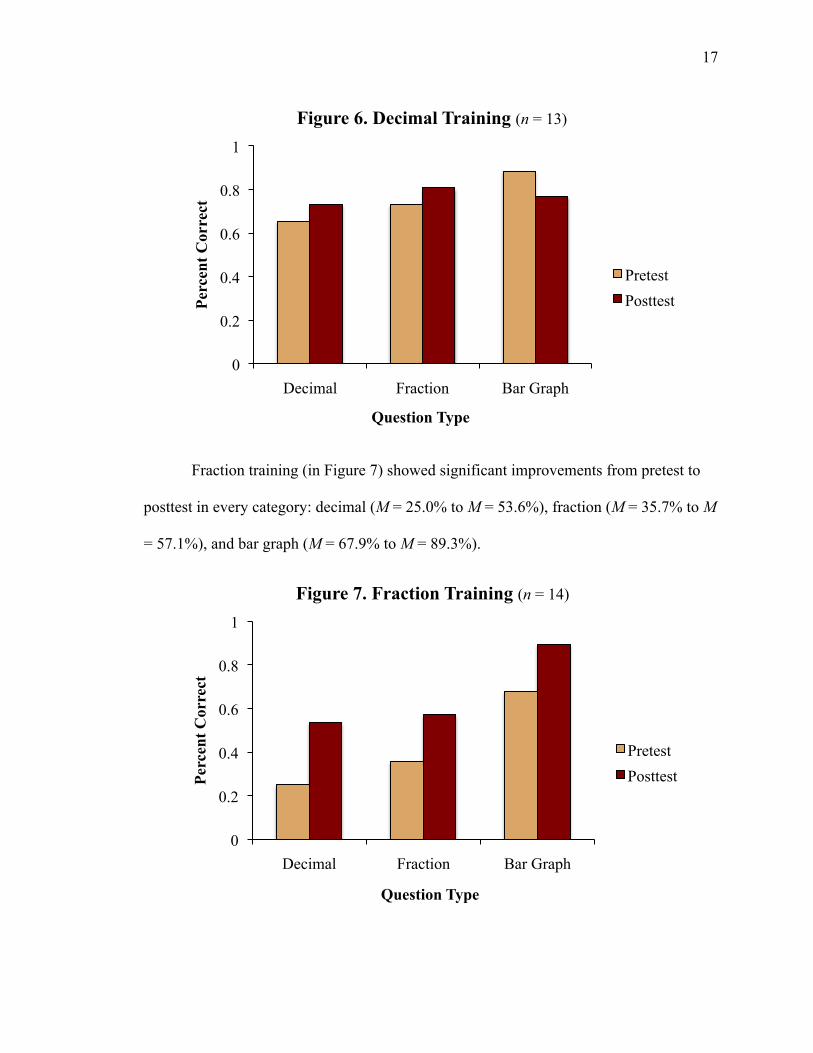
Decimal training (in Figure 6) had no effect on performance. Participants in this
condition increased their performance slightly on questions having representations with
decimals (M = 65.4% to M = 73.1%) and fractions (M = 73.1% to M = 80.8%), and
actually decreased in questions with bar graphs (M = 88.5% to M = 76.9%).
0
0.2
0.4
0.6
0.8
1
Decimal Fraction Bar Graph
Perc
ent C
orre
ct
Question Type
Figure 5. Overall performance across all representations (N = 27)
Pretest Posttest
17
Fraction training (in Figure 7) showed significant improvements from pretest to
posttest in every category: decimal (M = 25.0% to M = 53.6%), fraction (M = 35.7% to M
= 57.1%), and bar graph (M = 67.9% to M = 89.3%).
0
0.2
0.4
0.6
0.8
1
Decimal Fraction Bar Graph
Perc
ent C
orre
ct
Question Type
Figure 6. Decimal Training (n = 13)
Pretest Posttest
0
0.2
0.4
0.6
0.8
1
Decimal Fraction Bar Graph
Perc
ent C
orre
ct
Question Type
Figure 7. Fraction Training (n = 14)
Pretest Posttest
18
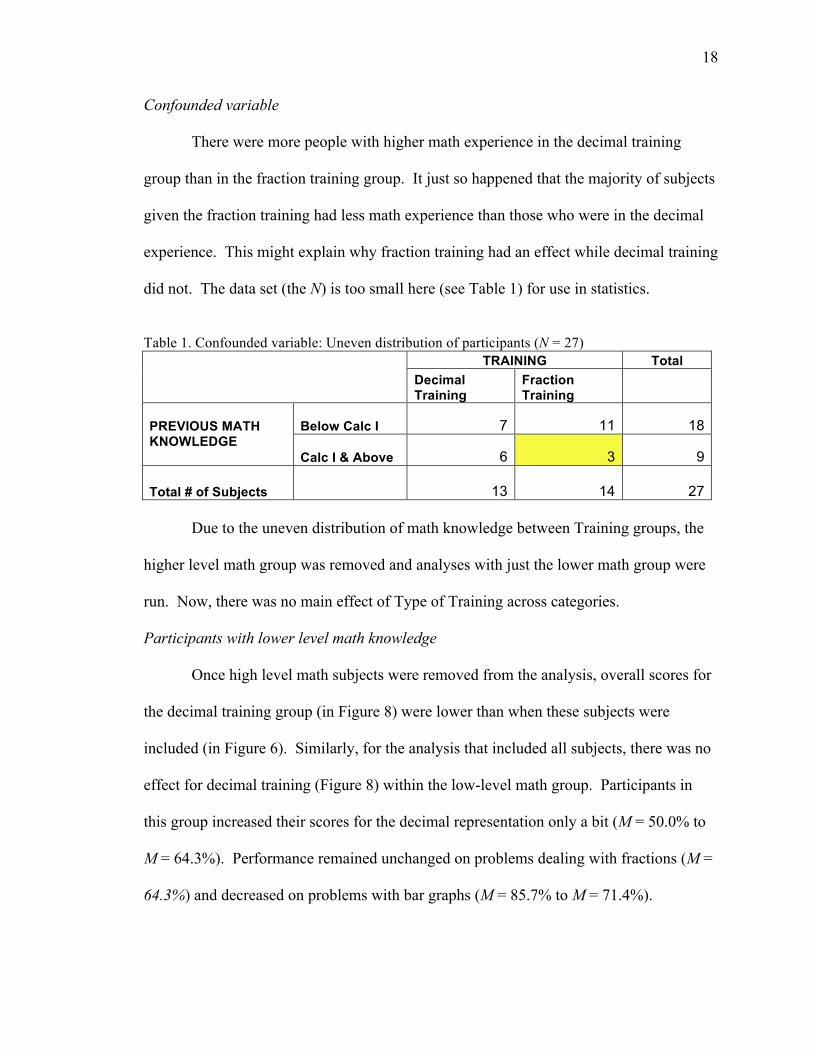
Confounded variable
There were more people with higher math experience in the decimal training
group than in the fraction training group. It just so happened that the majority of subjects
given the fraction training had less math experience than those who were in the decimal
experience. This might explain why fraction training had an effect while decimal training
did not. The data set (the N) is too small here (see Table 1) for use in statistics.
Table 1. Confounded variable: Uneven distribution of participants (N = 27) TRAINING Total
Decimal Training
Fraction Training
Below Calc I 7 11 18 PREVIOUS MATH
KNOWLEDGE
Calc I & Above 6 3 9
Total # of Subjects
13 14 27 Due to the uneven distribution of math knowledge between Training groups, the
higher level math group was removed and analyses with just the lower math group were
run. Now, there was no main effect of Type of Training across categories.
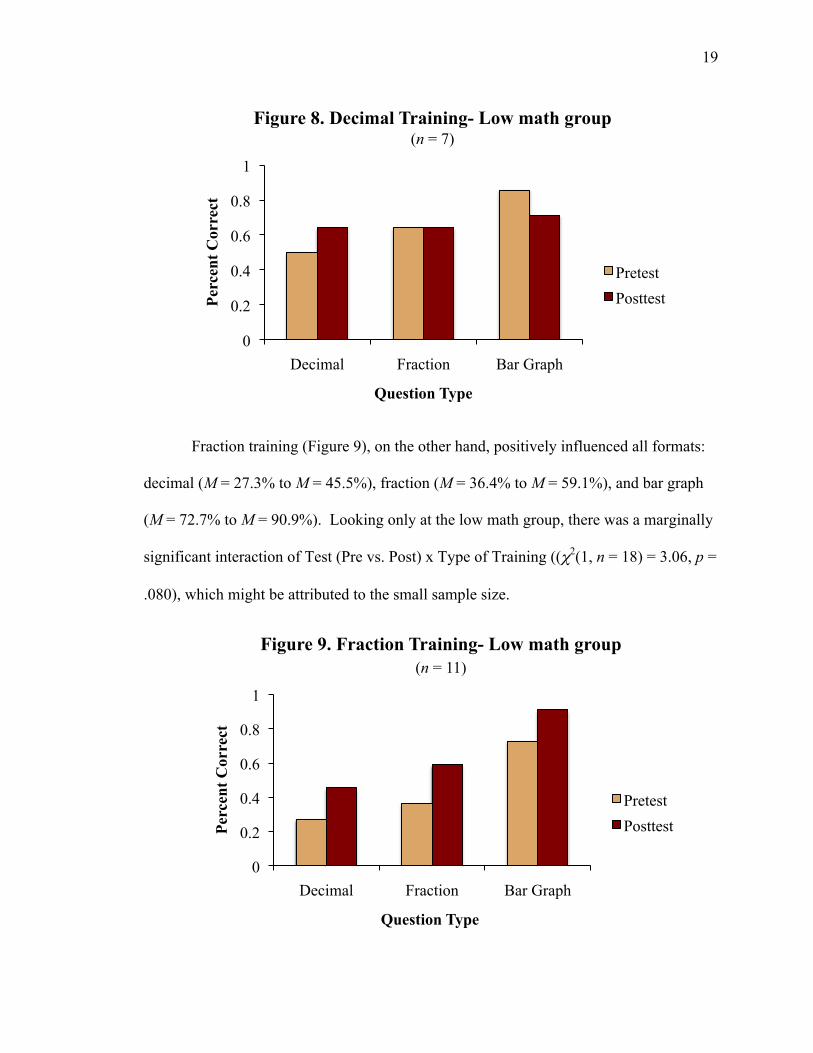
Participants with lower level math knowledge
Once high level math subjects were removed from the analysis, overall scores for
the decimal training group (in Figure 8) were lower than when these subjects were
included (in Figure 6). Similarly, for the analysis that included all subjects, there was no
effect for decimal training (Figure 8) within the low-level math group. Participants in
this group increased their scores for the decimal representation only a bit (M = 50.0% to
M = 64.3%). Performance remained unchanged on problems dealing with fractions (M =
64.3%) and decreased on problems with bar graphs (M = 85.7% to M = 71.4%).
19
Fraction training (Figure 9), on the other hand, positively influenced all formats:
decimal (M = 27.3% to M = 45.5%), fraction (M = 36.4% to M = 59.1%), and bar graph
(M = 72.7% to M = 90.9%). Looking only at the low math group, there was a marginally
significant interaction of Test (Pre vs. Post) x Type of Training ((χ2(1, n = 18) = 3.06, p =
.080), which might be attributed to the small sample size.
0
0.2
0.4
0.6
0.8
1
Decimal Fraction Bar Graph
Perc
ent C
orre
ct
Question Type
Figure 8. Decimal Training- Low math group (n = 7)
Pretest Posttest
0
0.2
0.4
0.6
0.8
1
Decimal Fraction Bar Graph
Perc
ent C
orre
ct
Question Type
Figure 9. Fraction Training- Low math group (n = 11)
Pretest Posttest
20
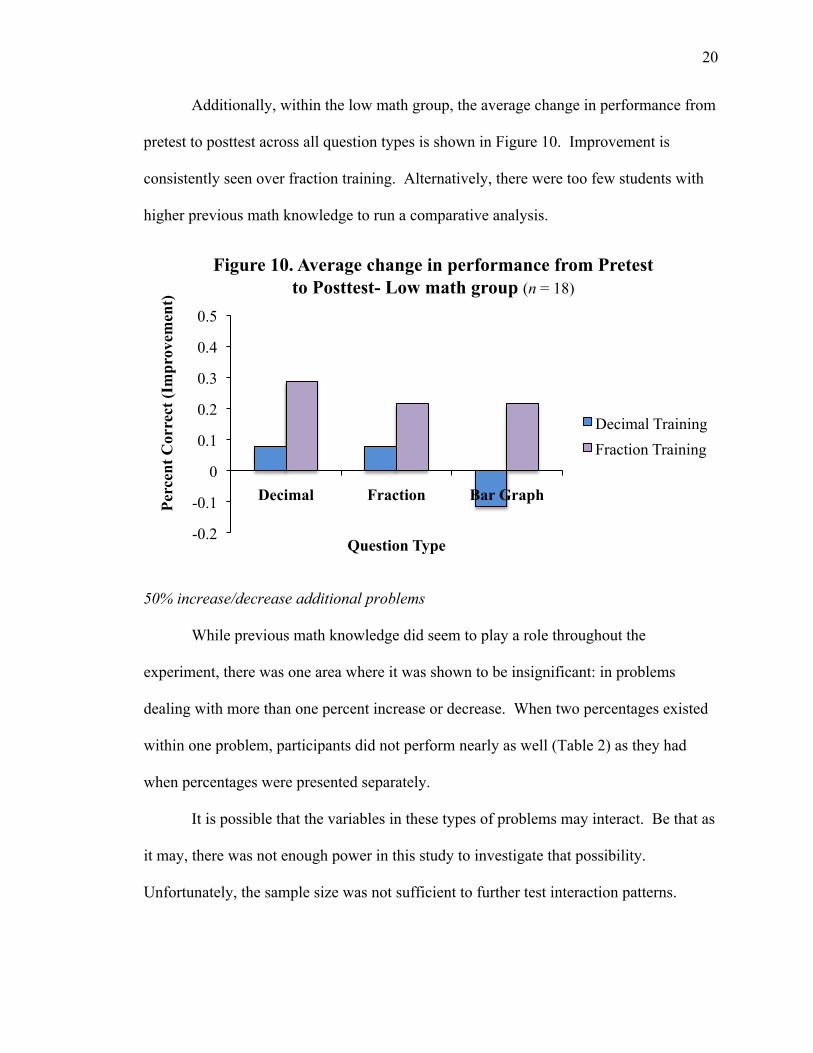
Additionally, within the low math group, the average change in performance from
pretest to posttest across all question types is shown in Figure 10. Improvement is
consistently seen over fraction training. Alternatively, there were too few students with
higher previous math knowledge to run a comparative analysis.
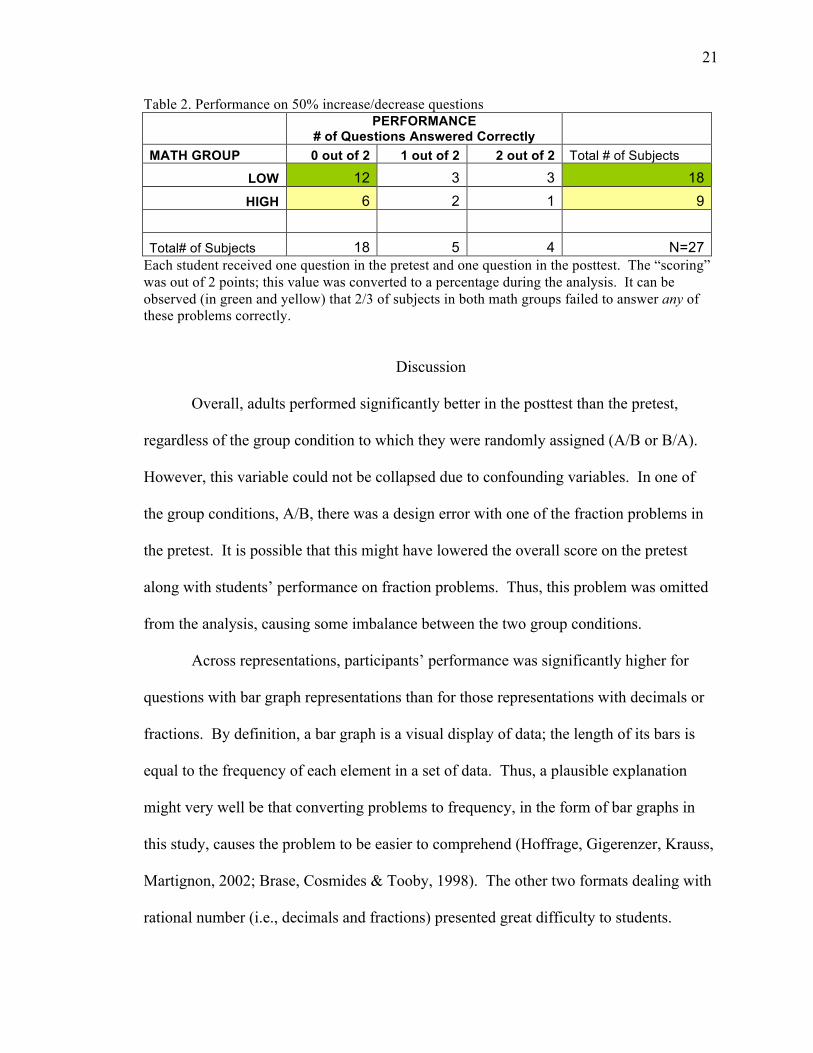
50% increase/decrease additional problems
While previous math knowledge did seem to play a role throughout the
experiment, there was one area where it was shown to be insignificant: in problems
dealing with more than one percent increase or decrease. When two percentages existed
within one problem, participants did not perform nearly as well (Table 2) as they had
when percentages were presented separately.
It is possible that the variables in these types of problems may interact. Be that as
it may, there was not enough power in this study to investigate that possibility.
Unfortunately, the sample size was not sufficient to further test interaction patterns.
-0.2
-0.1
0
0.1
0.2
0.3
0.4
0.5
Decimal Fraction Bar Graph
Perc
ent C
orre
ct (I
mpr
ovem
ent)
Question Type
Figure 10. Average change in performance from Pretest to Posttest- Low math group (n = 18)
Decimal Training Fraction Training
21
Table 2. Performance on 50% increase/decrease questions
PERFORMANCE
# of Questions Answered Correctly MATH GROUP 0 out of 2 1 out of 2 2 out of 2 Total # of Subjects
LOW 12 3 3 18 HIGH 6 2 1 9
Total# of Subjects 18 5 4 N=27
Each student received one question in the pretest and one question in the posttest. The “scoring” was out of 2 points; this value was converted to a percentage during the analysis. It can be observed (in green and yellow) that 2/3 of subjects in both math groups failed to answer any of these problems correctly.
Discussion
Overall, adults performed significantly better in the posttest than the pretest,
regardless of the group condition to which they were randomly assigned (A/B or B/A).
However, this variable could not be collapsed due to confounding variables. In one of
the group conditions, A/B, there was a design error with one of the fraction problems in
the pretest. It is possible that this might have lowered the overall score on the pretest
along with students’ performance on fraction problems. Thus, this problem was omitted
from the analysis, causing some imbalance between the two group conditions.
Across representations, participants’ performance was significantly higher for
questions with bar graph representations than for those representations with decimals or
fractions. By definition, a bar graph is a visual display of data; the length of its bars is
equal to the frequency of each element in a set of data. Thus, a plausible explanation
might very well be that converting problems to frequency, in the form of bar graphs in
this study, causes the problem to be easier to comprehend (Hoffrage, Gigerenzer, Krauss,
Martignon, 2002; Brase, Cosmides & Tooby, 1998). The other two formats dealing with
rational number (i.e., decimals and fractions) presented great difficulty to students.
22
Together, these results confirm the idea that many adults are treating rational numbers as
novel cases for natural number (Hartnett & Gelman, 1998).
When increase and decrease problems were presented individually, there was no
significant difference in participants’ performances (see Figure 4). However, the results
from the 50% successive increase and decrease problems hint at more difficulty with
problems involving multiple processes. What are the reasons for this discrepancy?
On the one hand, if a student is asked to increase x by a given percent, he simply
needs to tack on that number to 100%. For example, if he is increasing a cost by 40%,
the new amount will be 140% of the original cost. The final answer bears some
resemblance to the percent of increase. In contrast, if a student is decreasing a cost by
40%, the new amount will be 60% of the original cost, which may not be as easily linked
to the percent of decrease. For this reason, I had anticipated that percent decrease
problems might be more difficult than percent increase problems when presented as
percentages. For that very same reason, I chose to represent the percentages as various
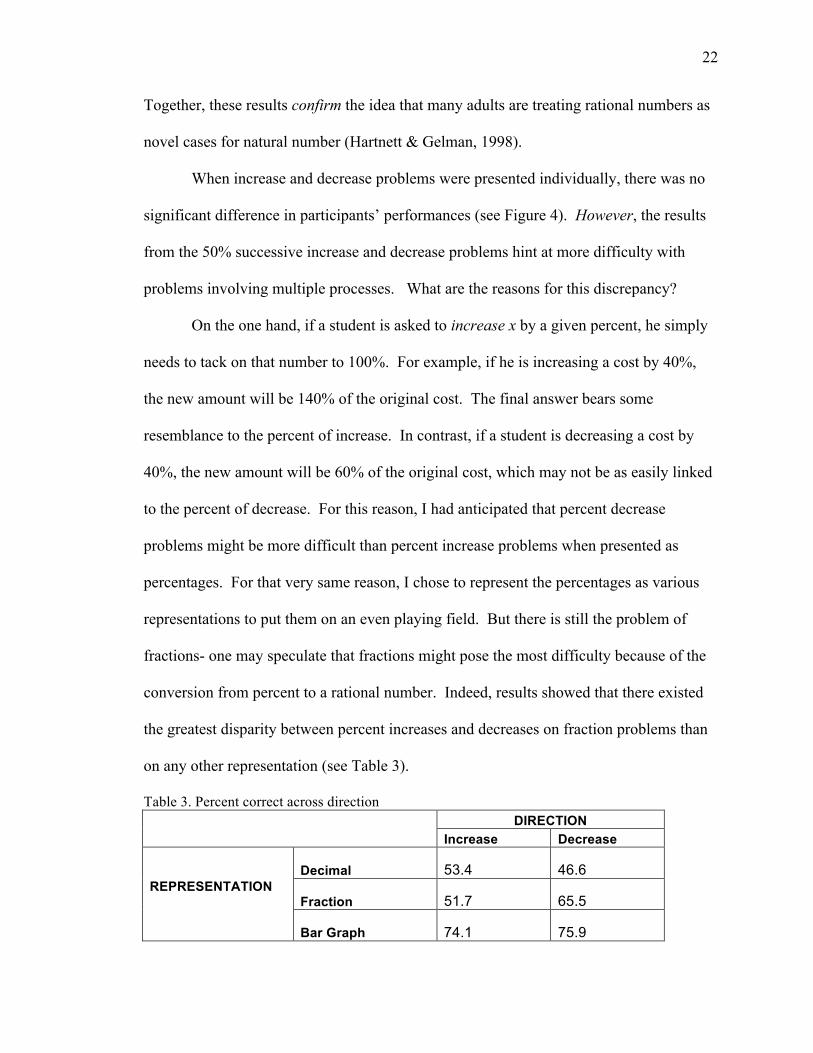
representations to put them on an even playing field. But there is still the problem of
fractions- one may speculate that fractions might pose the most difficulty because of the
conversion from percent to a rational number. Indeed, results showed that there existed
the greatest disparity between percent increases and decreases on fraction problems than
on any other representation (see Table 3).
Table 3. Percent correct across direction DIRECTION Increase Decrease
Decimal 53.4 46.6 Fraction 51.7 65.5
REPRESENTATION
Bar Graph 74.1 75.9
23
Perhaps this result helps to demonstrate the complications that arise when dealing
with more than one percent increase or decrease. The final answer rarely looks like the
percent of increase/decrease. Let us say that an item’s cost increases by 40% of the
original cost during the first week of September. Then, in October, that new price has
been spiraled downwards by 40% due to the supply and demand of the market. The first
part of the problem seems simple because it “contains” 40% within it: The new cost is
140% of the original cost. Yet, when it is time to apply a percent decrease to this
amount, that 40% is still in mind and the tendency to subtract is an all-too-common
mistake among many adults.
For this type of problem that I have referred to as the 50% increase/decrease
problem in the study, the most frequent incorrect responses given were “x”, “It remains
‘x’ dollars, the original cost at the start of [season]”, or “Back to the original price”. An
interpretation of this result stems from subjects incorrectly treating these problems as
natural number arithmetic problems where x + y – y = x, or more specifically, x + 50 – 50
= x . This error was illustrated in some students’ incorrect raw answers:
“ x – .50 + .50 = x ”
“ x + (1/5)x – (1/5)x = x ”
“x – (1/2)x = (1/2)x ” then “ (1/2)x + (1/2)x = 1x ”
These results provide a very strong clue that these adults would not be very good
at dealing with a form of the problem: (cost) decreased by x% and (cost) increased by
x%. In addition, the amount of previous math knowledge does not seem to matter here.
The answers given to the 50% increase/decrease problems are quite astounding.
This kind of example occurs in everyday life and yet, the results here strongly suggest a
24
lack of understanding, quite possibly due to the influence of simple rules of arithmetic.
The errors committed reflect a real problem with comprehending figures about the stock
market, a budget and almost anything that is numerically-related to a person’s daily life.
It is also a significant demonstration of failure to understand the logic of multiplying and
dividing by a percent.
Future Directions
The participants in this study were from a very narrow population: female,
Psychology undergraduate students. I expect to follow up on this experiment in
classrooms enrolling a more heterogeneous population, such as an undergraduate Pre-
calculus course. The version of this experiment will also contain a bar graph training
task, as this is the representation in which subjects performed best. Certain aspects of the
experiment (i.e. where there were design errors or variable confounds) will be remedied
and more closely controlled.
I also plan to collect additional data with a heterogeneous population on
percentage problems with successive increases and/or decreases as in the 50%
increase/decrease finding. In this realm, I will be using different values across problems
(not only 50%) but the same values within a problem (i.e. increase by 40% then decrease
by 40%) to detect if the same types of errors are made.
25
References
Brase, G.L., Cosmides, L., & Tooby, J. (1998). Individuation, Counting, and Statistical Inference: The Role of Frequency and Whole-Object Representations in Judgment Under Uncertainty. Journal of Experimental Psychology: General, 127(1), 3-21.
Gelman, R. (1986). Toward an understanding-based theory of mathematics learning and instruction, or, in praise of Lampert on teaching multiplication. Cognition and Instruction, 3(4), 349-355.
Hartnett, P., & Gelman, R. (1998). Early understandings of numbers: Paths or barriers to the construction of new understandings? Learning and Instruction, 8(4), 341-374.
Hawkes, H.E., Luby, W.A., and Touton, F.C. (1929). New second course in Algebra (enlarged ed.) Boston: Ginn& Co.
Hoffrage, U., Gigerenzer, G., Krauss, S., & Martignon, L. (2002). Representation facilitates reasoning: what natural frequencies are and what they are not. Cognition, 84, 343-352.
Humberstone, J., & Reeve, R.A. (2007). Conceptual changes in the acquisition of fractional number understanding. Proceedings of the European Cognitive Science Conference. University of Melbourne.
Kaput, J. (1987). Representation systems and mathematics. In C.Janvier (Ed.). Problems of representation in the teaching and learning of mathematics (pp. 19-26). Hillsdale, NJ: Lawrence Erlbaum Associates.
Koedinger, K. R., & MacLaren, B. A. (1997). Implicit strategies and errors in an improved model of early algebra problem solving. In Proceedings of the Nineteenth Annual Conference of the Cognitive Science Society (pp. 382–387). Hillsdale, NJ: Erlbaum.
Lampert, M. (1991). Connecting mathematical teaching and learning. In E. Fennema, T.P. Carpenter, & S.J. Lamo (Eds.), Integrating Research on Teaching and Learning Mathematics (pp. 121-152). Albany, NY: State University of New York Press.
Mills, C.M., & Keil, F.C. (2004). Knowing the limits of one’s understanding: The development of an awareness of an illusion of explanatory depth. Journal of Experimental Child Psychology, 87, 1-32.
National Council of Teachers of Mathematics. (1989). Curriculum and evaluation standards for school mathematics. Reston, VA: Author.
National Council of Teachers of Mathematics. (2000). Principles and standards for scholl mathematics. Reston, VA: Author.
Paige, Jeffrey M. (1966). Cognitive processes in solving algebra word problems. In H.A.Simon (Ed.), Models of Thought. vol. 1 (pp. 201-229). New Haven: Yale University Press.
Piñon, D.E. (2000). Teaching and learning about high school algebra with two different representational formats. Abstract retrieved from ProQuest Digital Dissertations. (AAT 9976227)
Rittle-Johnson, B. & Star, J.R. (2007). Does comparing solution methods facilitate conceptual and procedural knowledge? An Experimental Study on Learning to Solve Equations. Journal of Educational Psychology, 99(3), 561-574.

26
Stafylidou, S., & Vosniadou, S. (2004). The development of students’ understanding of the numerical value of fractions. Learning and Instruction, 14, 503-518.
Spinillo, A.G., & Bryant, P. (1991). Children’s proportional judgments: The importance of “half”, Child Development, 62, 427-440.
Zaslavsky, O., & Shir, K. (2005). Students’ conceptions of a mathematical definition. Journal for Research in Mathematics Education, 36(4), 317-346.
Zhu, X., & Simon, H.A. (1987). Learning mathematics from examples and by doing. Cognition and Instruction, 4(3) 137-166.
27
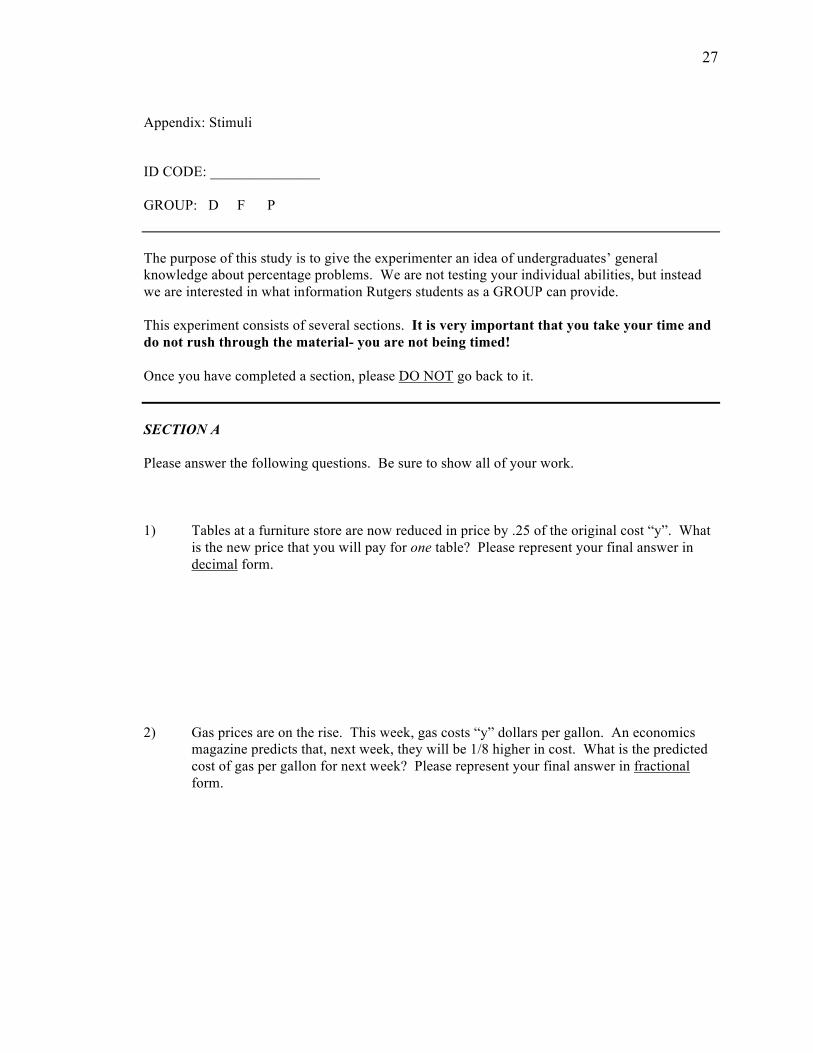
Appendix: Stimuli ID CODE: _______________ GROUP: D F P The purpose of this study is to give the experimenter an idea of undergraduates’ general knowledge about percentage problems. We are not testing your individual abilities, but instead we are interested in what information Rutgers students as a GROUP can provide. This experiment consists of several sections. It is very important that you take your time and do not rush through the material- you are not being timed! Once you have completed a section, please DO NOT go back to it. SECTION A Please answer the following questions. Be sure to show all of your work. 1) Tables at a furniture store are now reduced in price by .25 of the original cost “y”. What
is the new price that you will pay for one table? Please represent your final answer in decimal form.
2) Gas prices are on the rise. This week, gas costs “y” dollars per gallon. An economics
magazine predicts that, next week, they will be 1/8 higher in cost. What is the predicted cost of gas per gallon for next week? Please represent your final answer in fractional form.
28
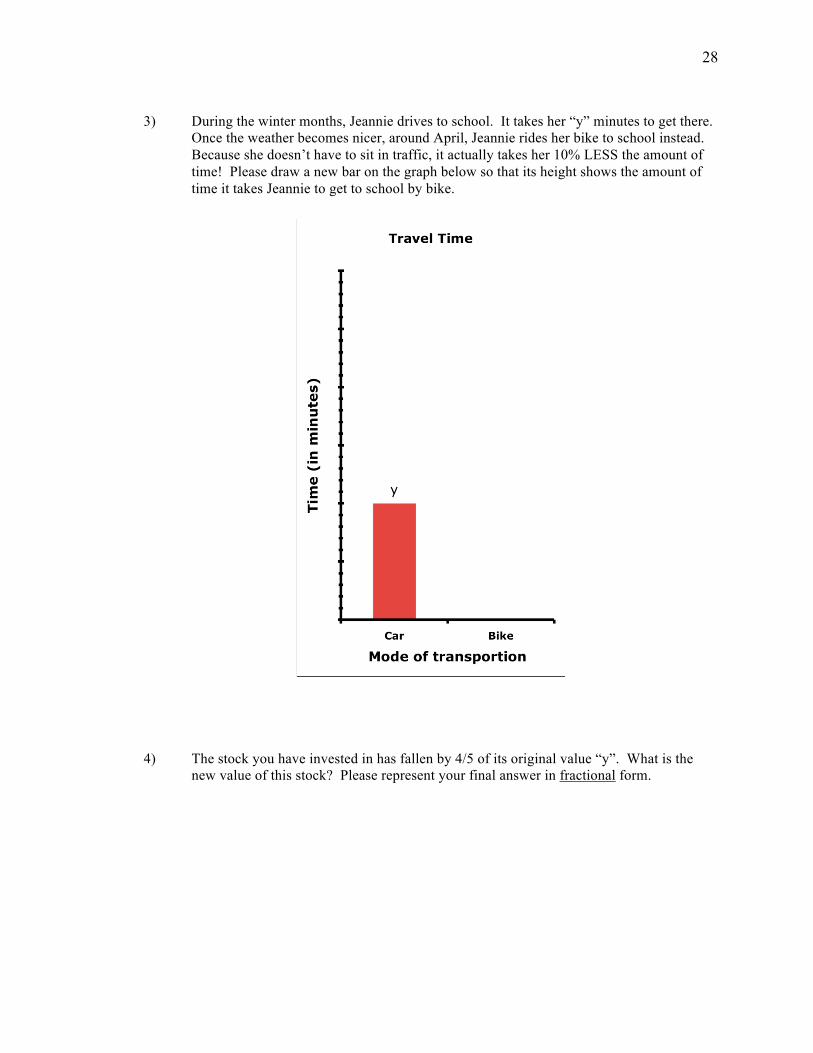
3) During the winter months, Jeannie drives to school. It takes her “y” minutes to get there.
Once the weather becomes nicer, around April, Jeannie rides her bike to school instead. Because she doesn’t have to sit in traffic, it actually takes her 10% LESS the amount of time! Please draw a new bar on the graph below so that its height shows the amount of time it takes Jeannie to get to school by bike.
4) The stock you have invested in has fallen by 4/5 of its original value “y”. What is the
new value of this stock? Please represent your final answer in fractional form.
29
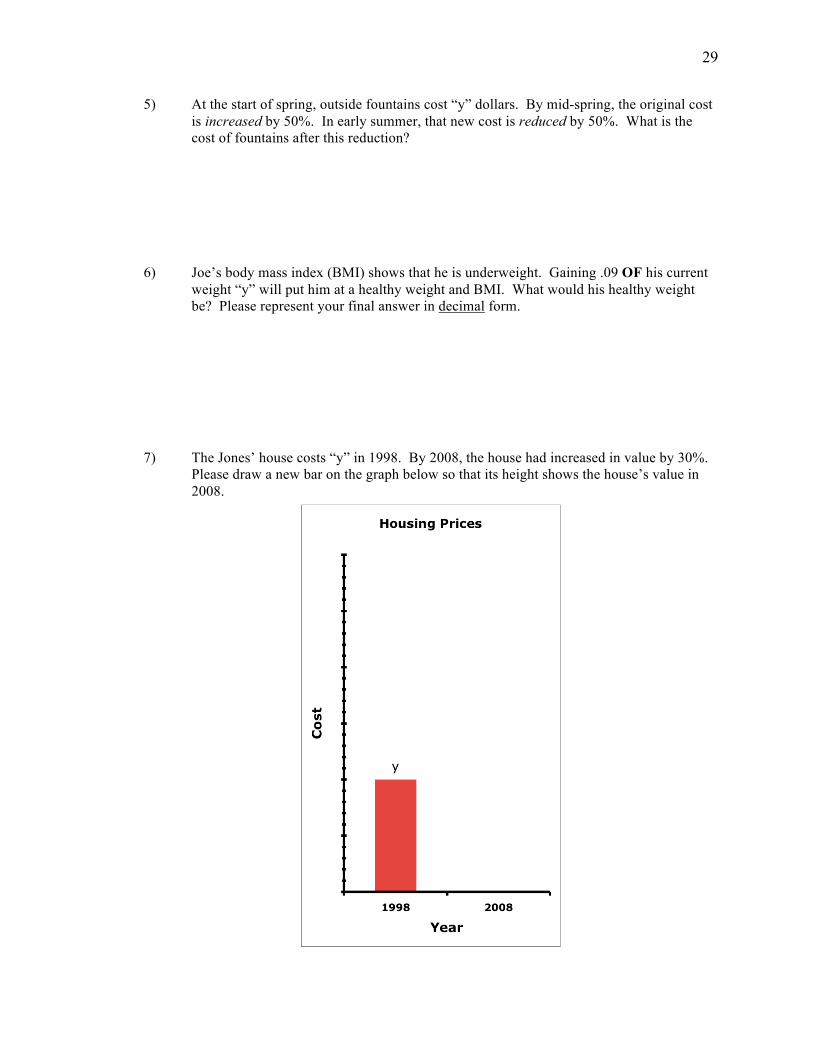
5) At the start of spring, outside fountains cost “y” dollars. By mid-spring, the original cost is increased by 50%. In early summer, that new cost is reduced by 50%. What is the cost of fountains after this reduction?
6) Joe’s body mass index (BMI) shows that he is underweight. Gaining .09 OF his current
weight “y” will put him at a healthy weight and BMI. What would his healthy weight be? Please represent your final answer in decimal form.
7) The Jones’ house costs “y” in 1998. By 2008, the house had increased in value by 30%.
Please draw a new bar on the graph below so that its height shows the house’s value in 2008.

30
SECTION B (‘Lesson D’) Part I In this section, please follow along with the lesson and do the guided tasks that go along with it. (Please do not go back to another section.)
A t-shirt is on sale at 25% off. What is the final cost of the t-shirt? Guided Tasks: Check your answers at the bottom of the page when you are done. 1) a) Should the final cost of the t-shirt be greater than or less than the original amount?
Please use a plus sign (+) to show “greater than” OR a minus sign (–) to show “less than”. _____________
b) 100% is the WHOLE cost before the percent decrease. What is 100% in decimal
form? ______________ c) 25% OF a WHOLE means there is a change in original cost, more specifically a
decrease. What is 25% in decimal form? ______________ 2) If you have 100% of an amount (1b), which decreases (1a) by 25% (1c), how much is
left? Represent your answer in decimal form. (Hint. Use the corresponding answers in question 1 to fill out the table below.)
(1b) (1a) (1c) ________ ___________ __________ = ___________ Whole (+/ – sign) % change in decimal form Simplify
3) If y = original cost of the t-shirt, then the change to the original cost “y” is:
(1a) x (1c) _____ x _____________ y = ___________ (+/ – sign) % change in decimal form Simplify
31
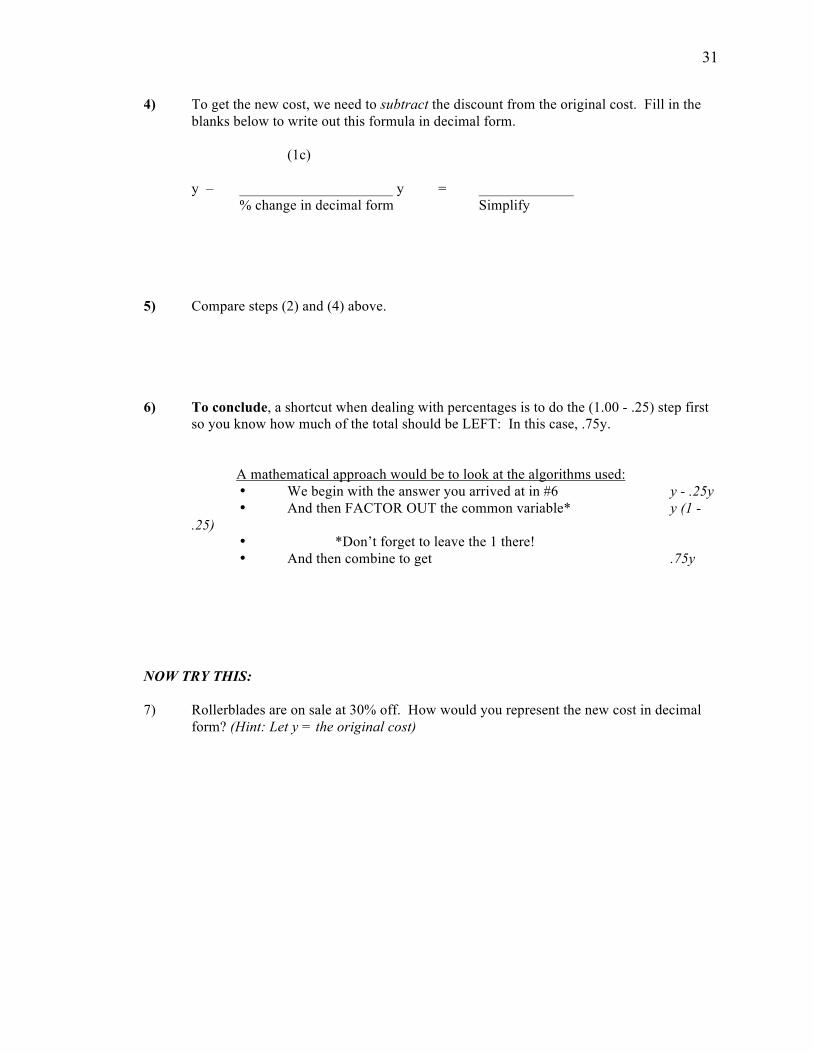
4) To get the new cost, we need to subtract the discount from the original cost. Fill in the blanks below to write out this formula in decimal form.
(1c) y – _____________________ y = _____________ % change in decimal form Simplify
5) Compare steps (2) and (4) above. 6) To conclude, a shortcut when dealing with percentages is to do the (1.00 - .25) step first
so you know how much of the total should be LEFT: In this case, .75y.
A mathematical approach would be to look at the algorithms used: • We begin with the answer you arrived at in #6 y - .25y • And then FACTOR OUT the common variable* y (1 -
.25) • *Don’t forget to leave the 1 there! • And then combine to get .75y
NOW TRY THIS: 7) Rollerblades are on sale at 30% off. How would you represent the new cost in decimal
form? (Hint: Let y = the original cost)
32
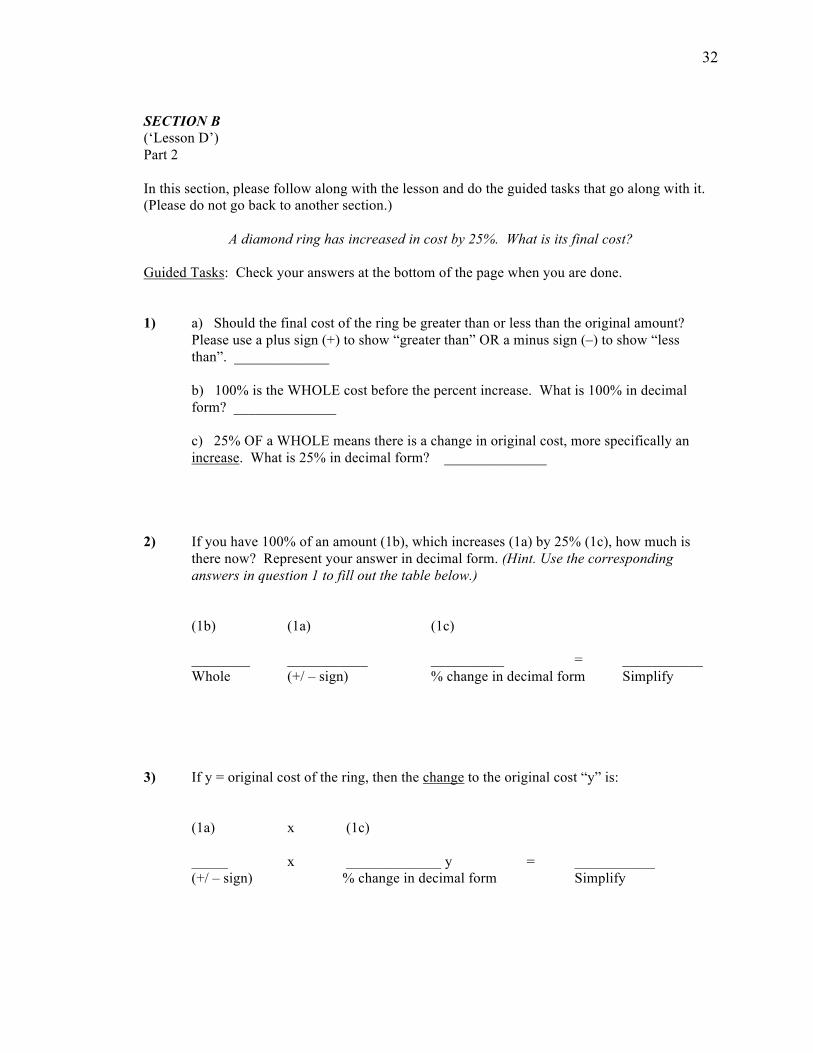
SECTION B (‘Lesson D’) Part 2 In this section, please follow along with the lesson and do the guided tasks that go along with it. (Please do not go back to another section.)
A diamond ring has increased in cost by 25%. What is its final cost? Guided Tasks: Check your answers at the bottom of the page when you are done. 1) a) Should the final cost of the ring be greater than or less than the original amount?
Please use a plus sign (+) to show “greater than” OR a minus sign (–) to show “less than”. _____________
b) 100% is the WHOLE cost before the percent increase. What is 100% in decimal
form? ______________ c) 25% OF a WHOLE means there is a change in original cost, more specifically an
increase. What is 25% in decimal form? ______________ 2) If you have 100% of an amount (1b), which increases (1a) by 25% (1c), how much is
there now? Represent your answer in decimal form. (Hint. Use the corresponding answers in question 1 to fill out the table below.)
(1b) (1a) (1c) ________ ___________ __________ = ___________ Whole (+/ – sign) % change in decimal form Simplify
3) If y = original cost of the ring, then the change to the original cost “y” is:
(1a) x (1c) _____ x _____________ y = ___________ (+/ – sign) % change in decimal form Simplify
33
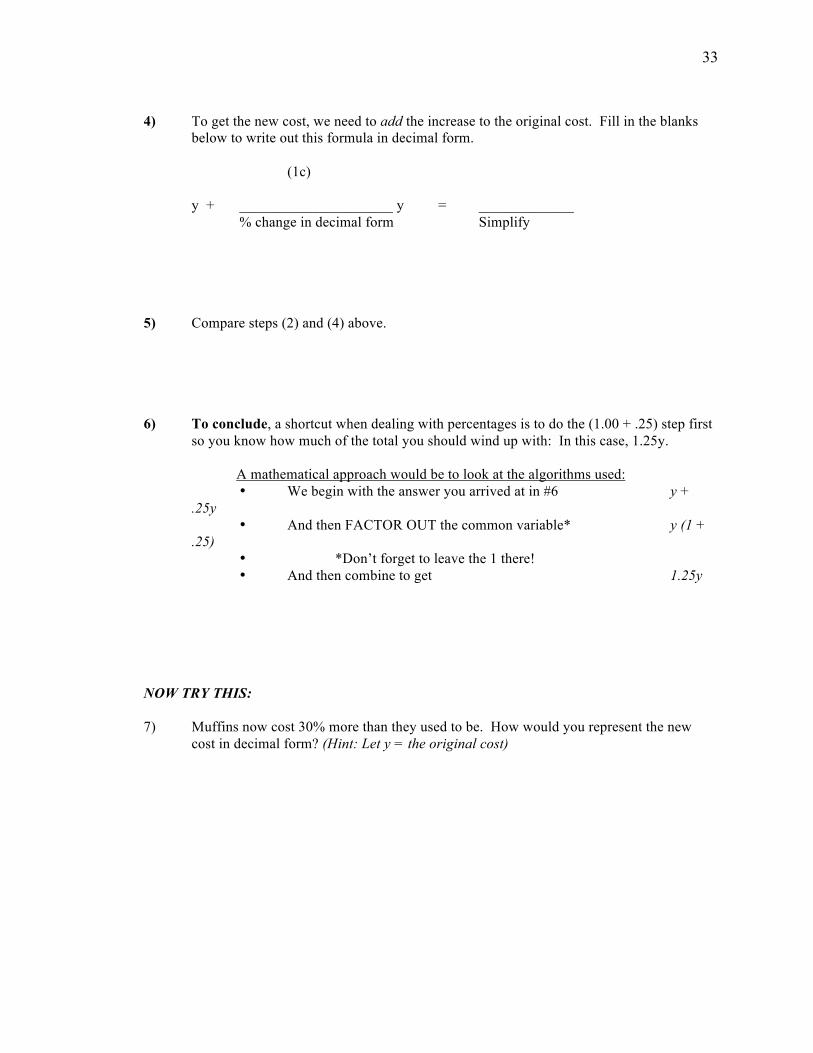
4) To get the new cost, we need to add the increase to the original cost. Fill in the blanks
below to write out this formula in decimal form.
(1c) y + _____________________ y = _____________ % change in decimal form Simplify
5) Compare steps (2) and (4) above. 6) To conclude, a shortcut when dealing with percentages is to do the (1.00 + .25) step first
so you know how much of the total you should wind up with: In this case, 1.25y.
A mathematical approach would be to look at the algorithms used: • We begin with the answer you arrived at in #6 y +
.25y • And then FACTOR OUT the common variable* y (1 +
.25) • *Don’t forget to leave the 1 there! • And then combine to get 1.25y
NOW TRY THIS: 7) Muffins now cost 30% more than they used to be. How would you represent the new
cost in decimal form? (Hint: Let y = the original cost)
34
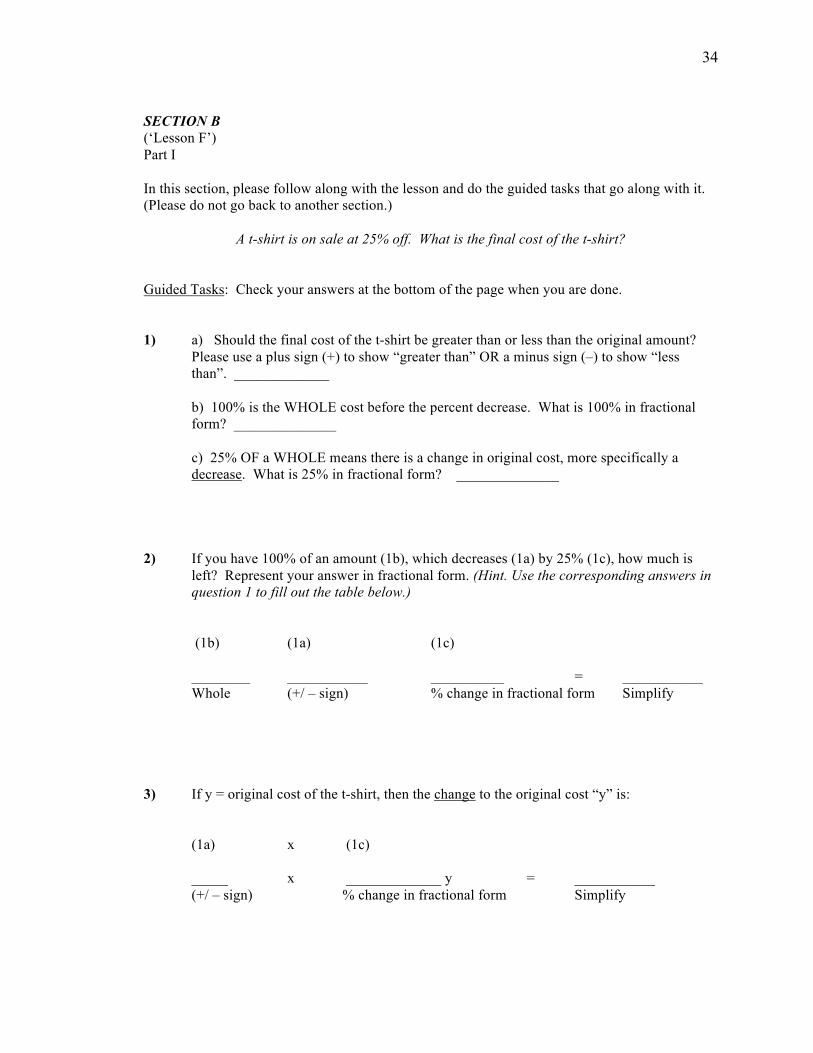
SECTION B (‘Lesson F’) Part I In this section, please follow along with the lesson and do the guided tasks that go along with it. (Please do not go back to another section.)
A t-shirt is on sale at 25% off. What is the final cost of the t-shirt? Guided Tasks: Check your answers at the bottom of the page when you are done. 1) a) Should the final cost of the t-shirt be greater than or less than the original amount?
Please use a plus sign (+) to show “greater than” OR a minus sign (–) to show “less than”. _____________
b) 100% is the WHOLE cost before the percent decrease. What is 100% in fractional
form? ______________ c) 25% OF a WHOLE means there is a change in original cost, more specifically a
decrease. What is 25% in fractional form? ______________ 2) If you have 100% of an amount (1b), which decreases (1a) by 25% (1c), how much is
left? Represent your answer in fractional form. (Hint. Use the corresponding answers in question 1 to fill out the table below.)
(1b) (1a) (1c) ________ ___________ __________ = ___________ Whole (+/ – sign) % change in fractional form Simplify
3) If y = original cost of the t-shirt, then the change to the original cost “y” is:
(1a) x (1c) _____ x _____________ y = ___________ (+/ – sign) % change in fractional form Simplify
35
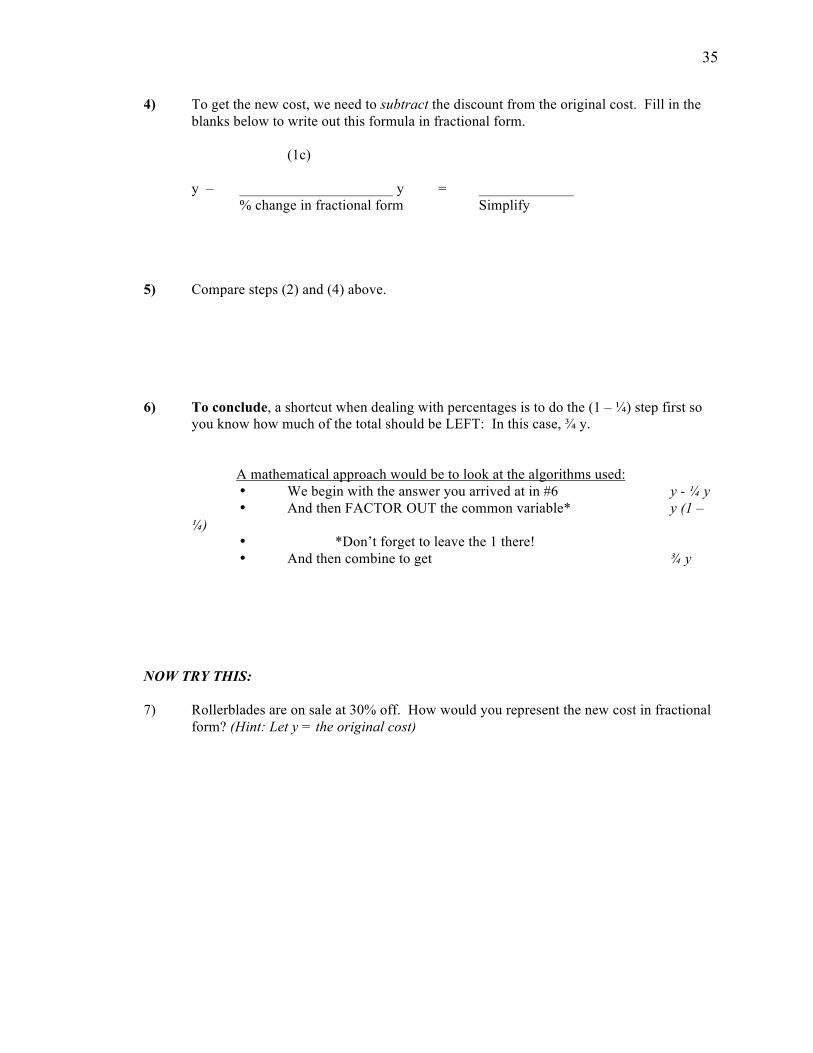
4) To get the new cost, we need to subtract the discount from the original cost. Fill in the blanks below to write out this formula in fractional form.
(1c) y – _____________________ y = _____________ % change in fractional form Simplify
5) Compare steps (2) and (4) above. 6) To conclude, a shortcut when dealing with percentages is to do the (1 – ¼) step first so
you know how much of the total should be LEFT: In this case, ¾ y.
A mathematical approach would be to look at the algorithms used: • We begin with the answer you arrived at in #6 y - ¼ y • And then FACTOR OUT the common variable* y (1 –
¼) • *Don’t forget to leave the 1 there! • And then combine to get ¾ y
NOW TRY THIS: 7) Rollerblades are on sale at 30% off. How would you represent the new cost in fractional
form? (Hint: Let y = the original cost)
36
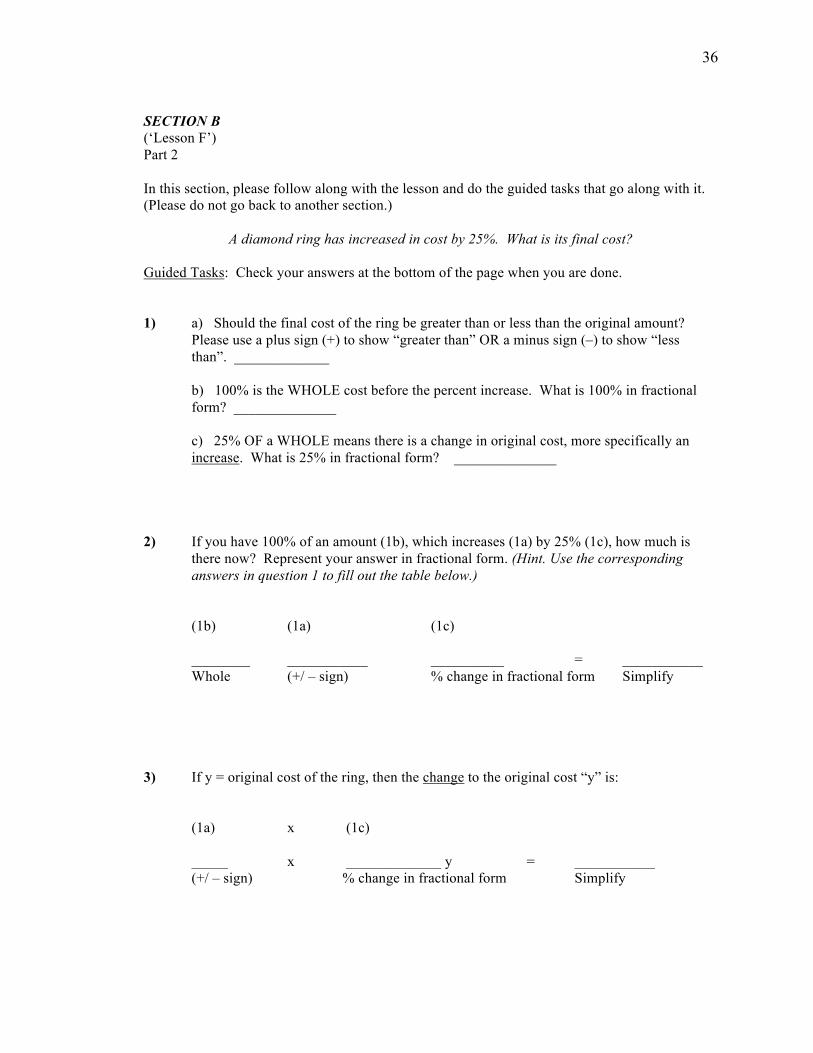
SECTION B (‘Lesson F’) Part 2 In this section, please follow along with the lesson and do the guided tasks that go along with it. (Please do not go back to another section.)
A diamond ring has increased in cost by 25%. What is its final cost? Guided Tasks: Check your answers at the bottom of the page when you are done. 1) a) Should the final cost of the ring be greater than or less than the original amount?
Please use a plus sign (+) to show “greater than” OR a minus sign (–) to show “less than”. _____________
b) 100% is the WHOLE cost before the percent increase. What is 100% in fractional
form? ______________ c) 25% OF a WHOLE means there is a change in original cost, more specifically an
increase. What is 25% in fractional form? ______________ 2) If you have 100% of an amount (1b), which increases (1a) by 25% (1c), how much is
there now? Represent your answer in fractional form. (Hint. Use the corresponding answers in question 1 to fill out the table below.)
(1b) (1a) (1c) ________ ___________ __________ = ___________ Whole (+/ – sign) % change in fractional form Simplify
3) If y = original cost of the ring, then the change to the original cost “y” is:
(1a) x (1c) _____ x _____________ y = ___________ (+/ – sign) % change in fractional form Simplify
37
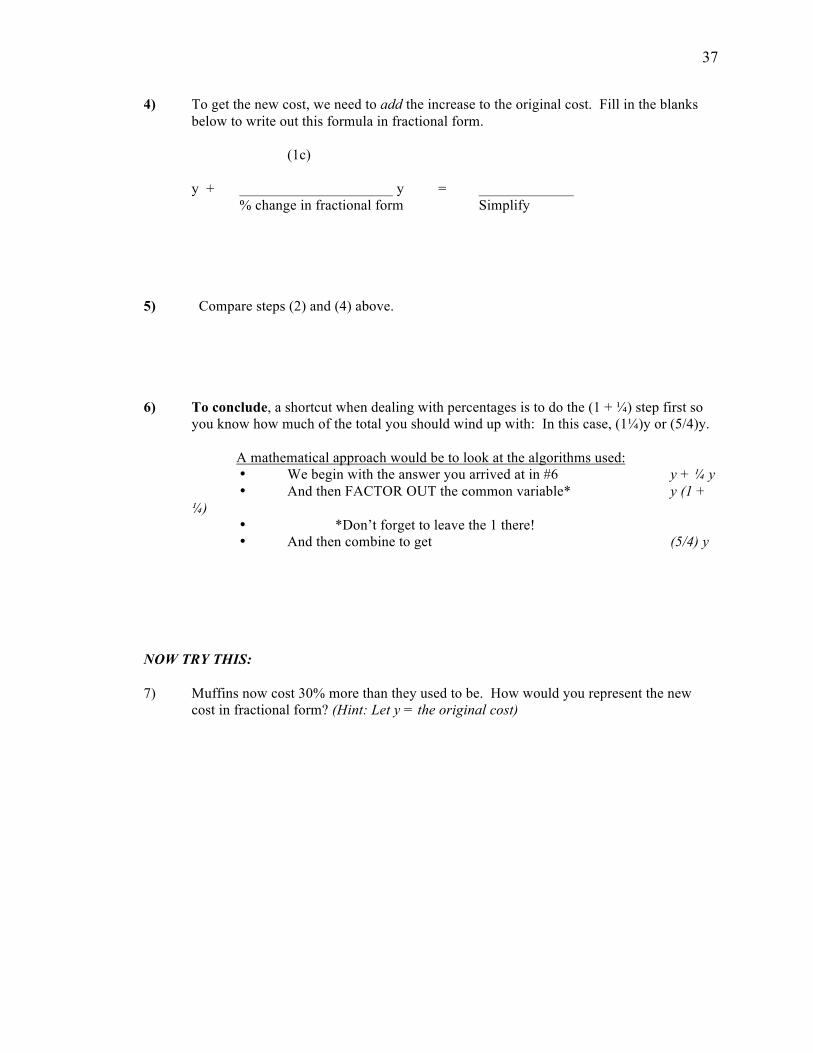
4) To get the new cost, we need to add the increase to the original cost. Fill in the blanks below to write out this formula in fractional form.
(1c) y + _____________________ y = _____________ % change in fractional form Simplify
5) Compare steps (2) and (4) above. 6) To conclude, a shortcut when dealing with percentages is to do the (1 + ¼) step first so
you know how much of the total you should wind up with: In this case, (1¼)y or (5/4)y.
A mathematical approach would be to look at the algorithms used: • We begin with the answer you arrived at in #6 y + ¼ y • And then FACTOR OUT the common variable* y (1 +
¼) • *Don’t forget to leave the 1 there! • And then combine to get (5/4) y
NOW TRY THIS: 7) Muffins now cost 30% more than they used to be. How would you represent the new
cost in fractional form? (Hint: Let y = the original cost)
38
SECTION C Please answer the following questions. Be sure to show all of your work. 1) The original price “x” of a watch is reduced by .20. What is the new price that you will
pay for this watch? Please represent your final answer in decimal form. 2) Sean has finished law school. He now puts in “x” hours per week studying for his BAR
exam. In another month, he plans on increasing that amount of time by 2/5. By the end of next month, how much study time will he be putting in per week, in terms of “x”? Please represent your final answer in fractional form.
3) In the winter, snowboarding equipment costs “y” dollars. By early spring, the original
cost is reduced by 50%. But by the time fall arrives, that new cost has increased by 50%. What is the cost of snowboarding equipment by the fall?
39
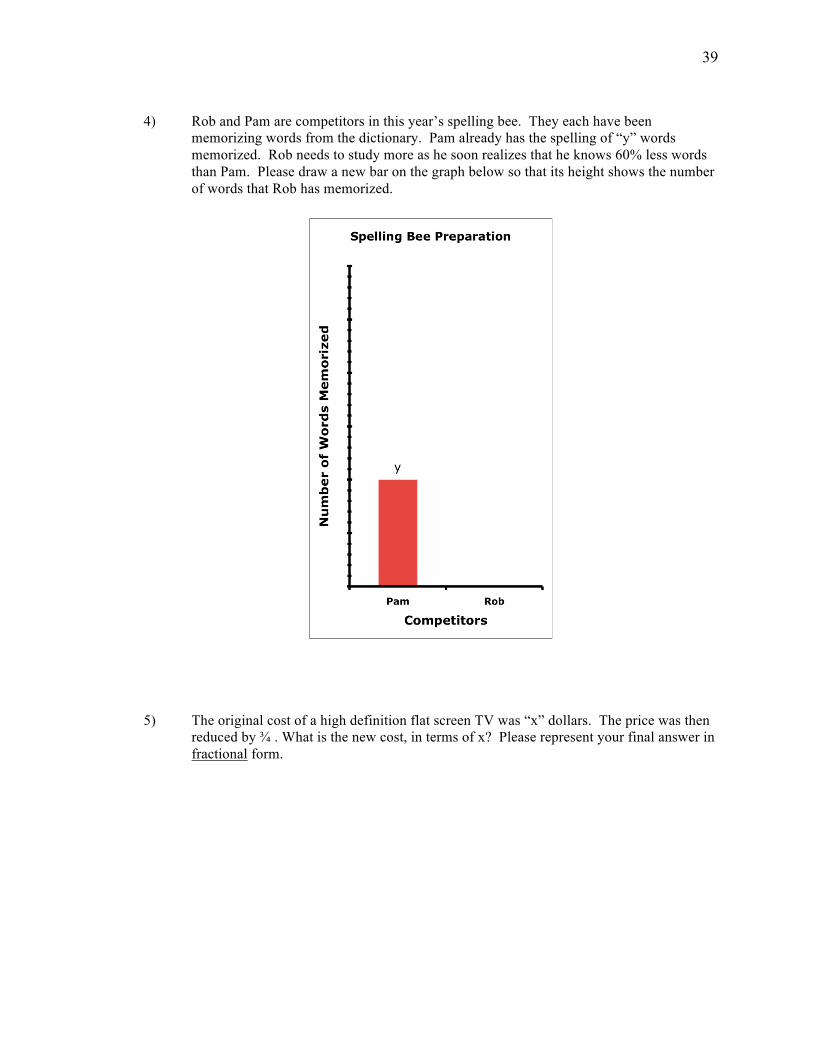
4) Rob and Pam are competitors in this year’s spelling bee. They each have been
memorizing words from the dictionary. Pam already has the spelling of “y” words memorized. Rob needs to study more as he soon realizes that he knows 60% less words than Pam. Please draw a new bar on the graph below so that its height shows the number of words that Rob has memorized.
5) The original cost of a high definition flat screen TV was “x” dollars. The price was then
reduced by ¾ . What is the new cost, in terms of x? Please represent your final answer in fractional form.
40
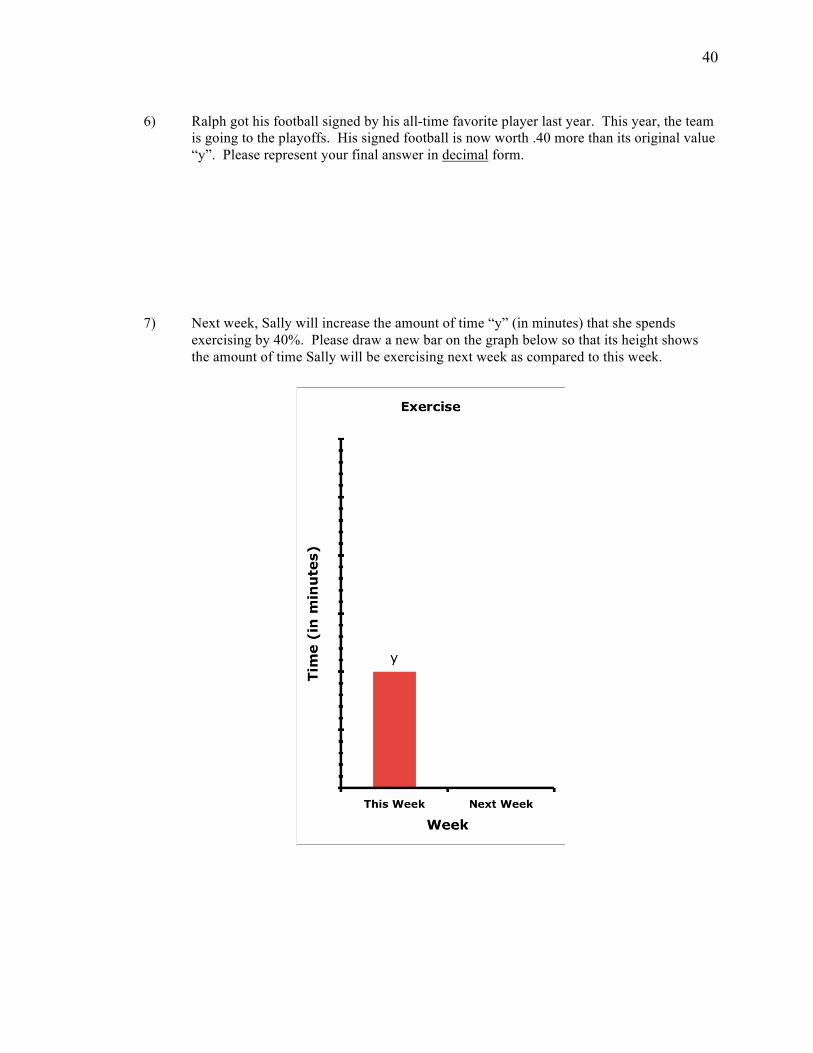
6) Ralph got his football signed by his all-time favorite player last year. This year, the team
is going to the playoffs. His signed football is now worth .40 more than its original value “y”. Please represent your final answer in decimal form.
7) Next week, Sally will increase the amount of time “y” (in minutes) that she spends
exercising by 40%. Please draw a new bar on the graph below so that its height shows the amount of time Sally will be exercising next week as compared to this week.

41
SECTION D Now please answer the following questions about yourself. (Please do not go back to another section.)
1) Sex (M/F): ______
2) Age: _______
3) What was your Math SAT I score? ____________ 4) Number of semesters completed at Rutgers so far (do not count this summer semester):
___________________________ 5) List the math/ statistics courses you are currently taking or have taken as an
undergraduate. If you have not taken any at Rutgers, please list the last high school math course you took. (For example: Pre-calculus, Calculus, Statistics, etc.)
____________________________ ____________________________
____________________________ ____________________________
____________________________ ____________________________
6) What is your major or intended major? ________________________
7) Is English your native/primary language? _______________________
8) Did you learn anything new in this experiment? If yes, what was it?
_________________________________________________________________
_________________________________________________________________
_________________________________________________________________
Thank you for your participation.