Embed Size (px)
Citation preview
1Proprietary and Confidential
AUTOMOTIVE
BEAUTY
COMMERCIAL TECHNOLOGY
CONSUMER TECHNOLOGY
ENTERTAINMENT
FASHION
FOOD & BEVERAGE
FOODSERVICE
HOME
OFFICE SUPPLIES
SOFTWARE
SPORTS
TOYS & KIDS
WIRELESS
Toys & KIDS
Snapshot
Copyright 2011. The NPD Group, Inc. All Rights Reserved. This presentation is Proprietary and Confidential and may not be disclosed in any manner, in whole or in part, to any third party without the express written consent of NPD.
2Proprietary and Confidential
U.S. retail sales of toys generated $21.87 billion in 2010 compared to $21.46 billion in 2009, an increase of 2 percent. Strong fourth quarter (Oct.'10 - Dec.'10) sales, which experienced an increase of 3 percent over fourth quarter 2009, saw revenues top $10.2 billion, representing close to half of the year-end total, with December 2010 generating $5.64 billion, a 4 percent increase over December 2009.
There is much optimism coming off the strong holiday performance for toys. We know that toys is one of the top categories kids are spending their holiday gift cards on and is, by far, the number 1 category kids put on their holiday wish lists. With an improving economy, several movie releases, and a wide array of innovative product coming to market, 2011 looks to be another solid year for toy sales.
Anita FrazierToys & Video Games
Industry AnalystThe NPD Group
3Proprietary and Confidential
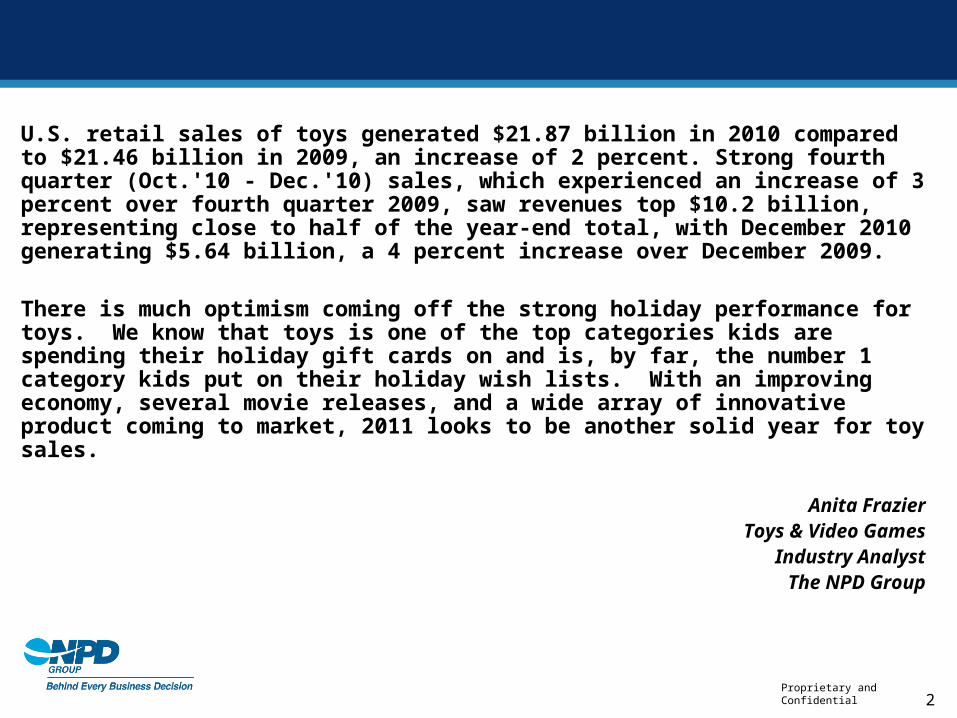
During November, Toys Was The #1 Category On Kids’ Holiday Wish Lists
Source: The NPD Group/KIDS Industry Data Service – November 2010
"What is on your child's wish list for the upcoming holiday season?“Kids Ages 14 and younger
1%
2%
3%
5%
8%
8%
15%
39%
0% 10% 20% 30% 40% 50%
Accessories
Footwear
Books
Sporting Goods
Clothing
Consumer Electronics
Video Games
Toys
% of Mentions
During 4 weeks in November 2010, nearly 2,600 out of a total of 6,500 wish list items were toys - more than twice as much as any other category.
4Proprietary and Confidential
1%
1%
1%
1%
1%
2%
3%
3%
3%
4%
4%
4%
5%
5%
8%
9%
11%
15%
18%
0% 5% 10% 15% 20%
Stationery
Music
School Gear
Party Supplies
Arts & Crafts
Halloween
Health & Beauty
Sporting Goods
Books
Items for the Home
Gift Cards
Baby/Infant
Consumer Electronics*
Videos
Footwear
VG Software
VG Hardware
Toys/Board Games
Apparel/Access
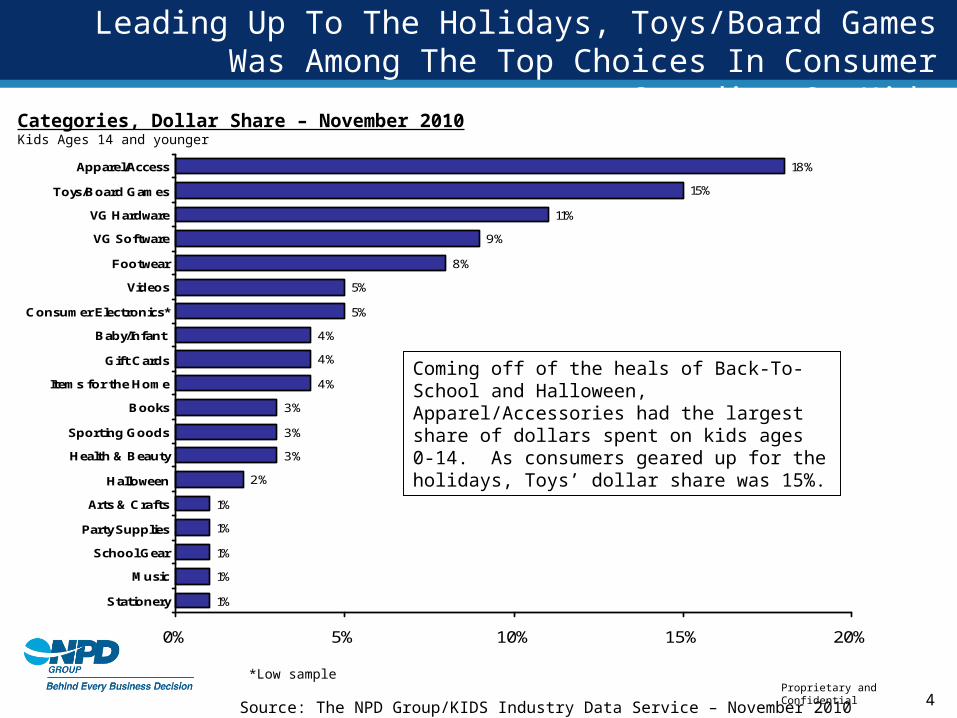
Categories, Dollar Share – November 2010Kids Ages 14 and younger
*Low sample
Source: The NPD Group/KIDS Industry Data Service – November 2010
Leading Up To The Holidays, Toys/Board Games Was Among The Top Choices In Consumer Spending On Kids
Coming off of the heals of Back-To-School and Halloween, Apparel/Accessories had the largest share of dollars spent on kids ages 0-14. As consumers geared up for the holidays, Toys’ dollar share was 15%.
5Proprietary and Confidential
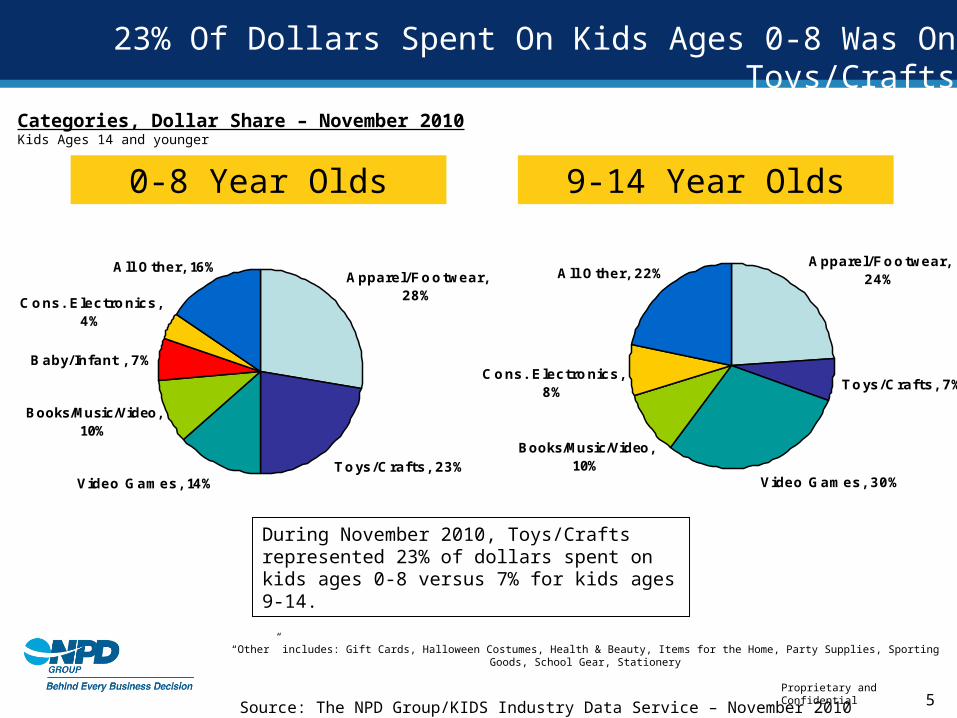
23% Of Dollars Spent On Kids Ages 0-8 Was On Toys/Crafts
Toys/Crafts, 23%Video Games, 14%
Baby/Infant , 7%
All Other, 16%
Cons. Electronics, 4%
Books/Music/Video, 10%
Apparel/Footwear, 28%
Toys/Crafts, 7%
Video Games, 30%
All Other, 22%
Cons. Electronics, 8%
Books/Music/Video, 10%
Apparel/Footwear, 24%
0-8 Year Olds 9-14 Year Olds
Categories, Dollar Share – November 2010Kids Ages 14 and younger
Source: The NPD Group/KIDS Industry Data Service – November 2010
“Other” includes: Gift Cards, Halloween Costumes, Health & Beauty, Items for the Home, Party Supplies, Sporting Goods, School Gear, Stationery
During November 2010, Toys/Crafts represented 23% of dollars spent on kids ages 0-8 versus 7% for kids ages 9-14.
6Proprietary and Confidential
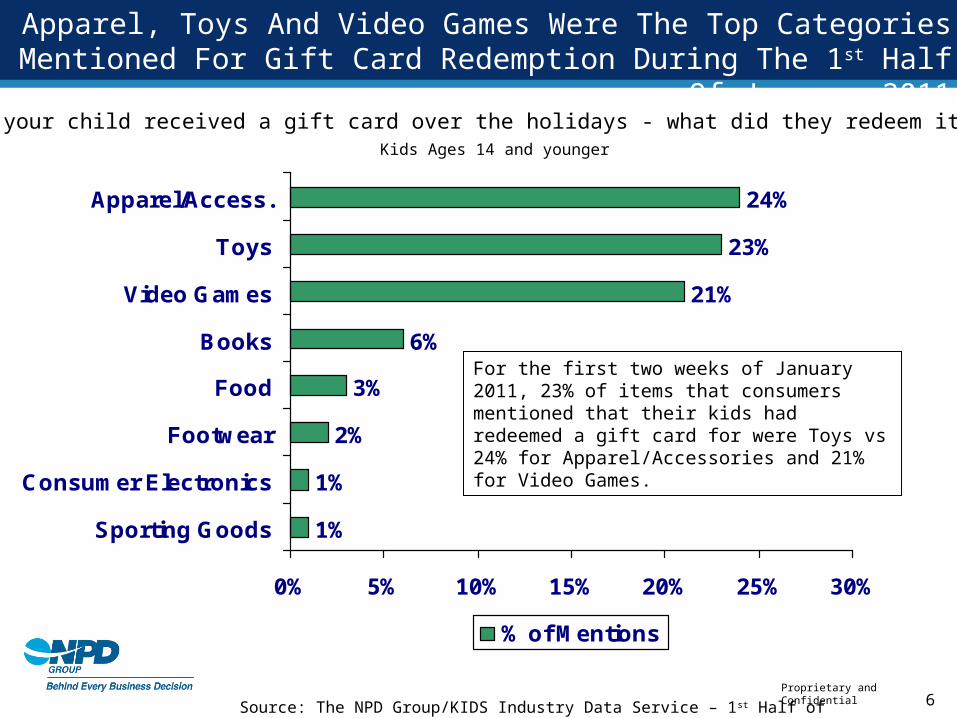
Apparel, Toys And Video Games Were The Top Categories Mentioned For Gift Card Redemption During The 1st Half Of January 2011
Source: The NPD Group/KIDS Industry Data Service – 1st Half of January 2011
“If your child received a gift card over the holidays - what did they redeem it for?”Kids Ages 14 and younger
1%
1%
2%
3%
6%
21%
23%
24%
0% 5% 10% 15% 20% 25% 30%
Sporting Goods
Consumer Electronics
Footwear
Food
Books
Video Games
Toys
Apparel/Access.
% of Mentions
For the first two weeks of January 2011, 23% of items that consumers mentioned that their kids had redeemed a gift card for were Toys vs 24% for Apparel/Accessories and 21% for Video Games.
7Proprietary and Confidential
Methodology
NPD’s Kids Industry Data Service (KIDS) provides the only holistic view of purchases made for kids aged 0-14 across categories and retailers with a focus on licensing.
NPD's Kids Industry Data Service Tracker information is based on results of an online survey of a nationally representative sample of U.S. adults aged 18+. Participants are surveyed weekly, capturing past 7-day purchases made for children ages 0-14. Results are then aggregated into monthly increments.
Responses are weighted on age, income, education, region, household size and composition, and race/Hispanic and projected to total US population.
Information provided on Holiday Wish Lists and Gift Card Redemption is based on raw responses from an unaided open-end question. Responses were standardized and aggregated into categories.
For more information, please contact Charles Camaroto
1.866.444.1411Email: [email protected]