Embed Size (px)
Citation preview

2010 half-year results2010 half-year results26 July 201026 July 2010
Forward-looking statements
Except for the historical information contained herein, the matters discussed in this presentation include forward-looking statements. In particular, all statements that express forecasts, expectations and projections with respect to future matters, including trends in results of operations, margins, growth rates, overall market trends, the impact of interest or exchange rates, the availability of financing, anticipated costs savings and synergies and the execution of Pearson's strategy, are forward looking statements. By their nature, forward looking statements involve risks and uncertainties because they relate to events and depend on circumstances that will occur in future.
There are a number of factors which could cause actual results and developments to differ materially from those expressed or implied by these forward looking statements, including a number of factors outside Pearson's control. These include international, national and local conditions, as well as competition. They also include other risks detailed from time to time in the company's publicly-filed documents.
Any forward looking statements speak only as of the date they are made, and Pearson gives no undertaking to update forward-looking statements to reflect any changes in its expectations with regard thereto or any changes to events, conditions or circumstances on which any such statement is based.

2010 half-year results2010 half-year results26 July 201026 July 2010

Agenda
Overview Marjorie
Results and outlook Robin
Markets and plans CEOs
Q&A
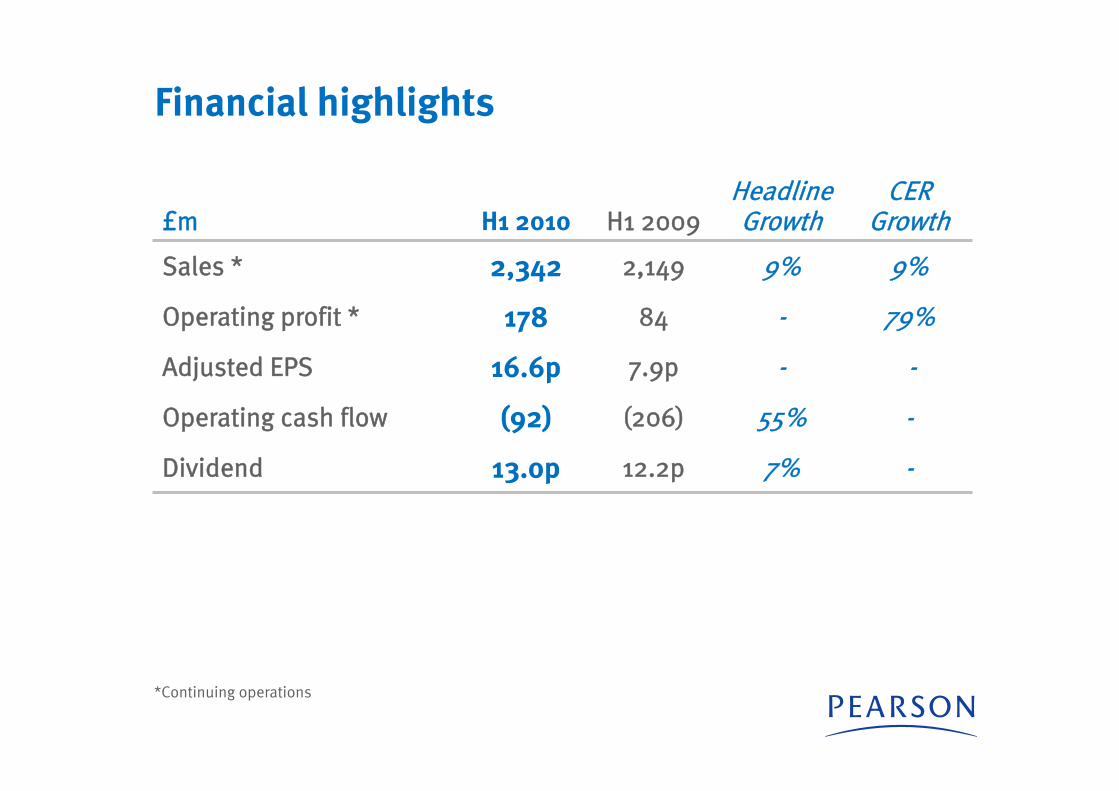
Financial highlights
£m H1 2010 H1 2009Headline Growth
CER Growth
Sales * 2,342 2,149 9% 9%
Operating profit * 178 84 - 79%
Adjusted EPS 16.6p 7.9p - -
Operating cash flow (92) (206) 55% -
Dividend 13.0p 12.2p 7% -
*Continuing operations
Economic environment uncertain
Public funding shrinking
Demand for learning and information vigorous
Commitment to education reform urgent
Digital innovation and adoption accelerating
Our world in 2010
Our investments are producing:
1. Growth
2. Share gains
3. Change
4. Returns
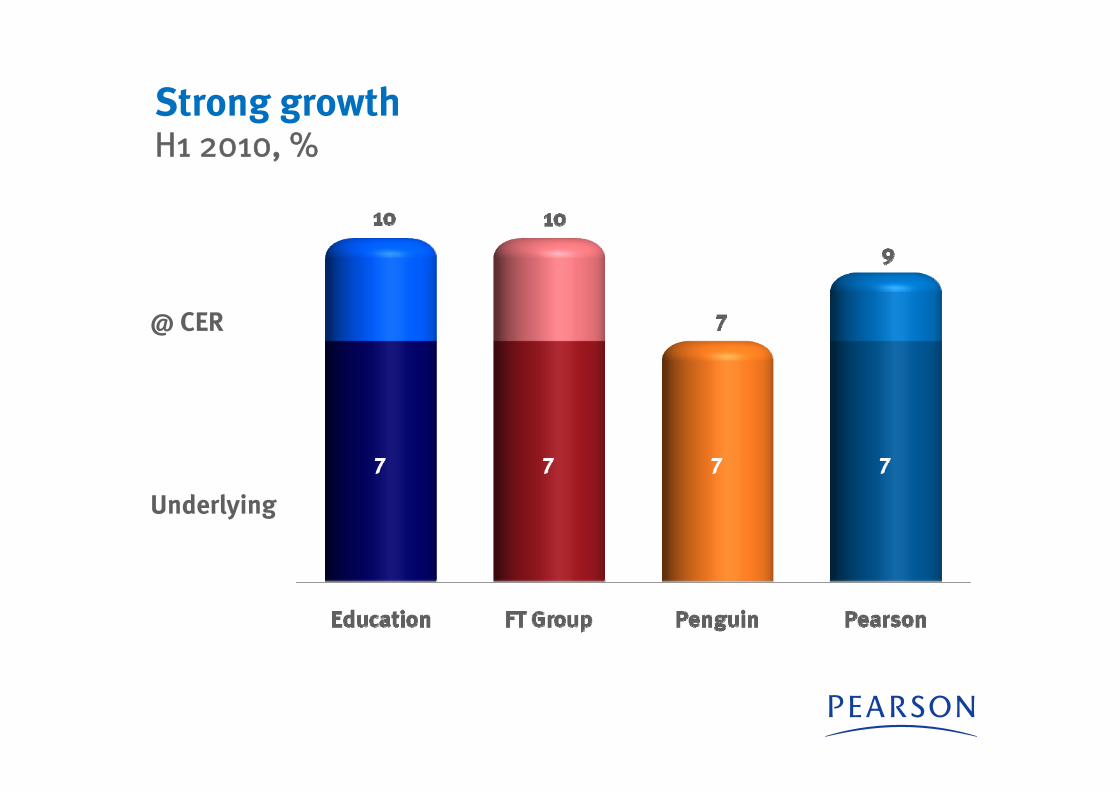
Strong growthH1 2010, %
Underlying
@ CER
7 77
7
7
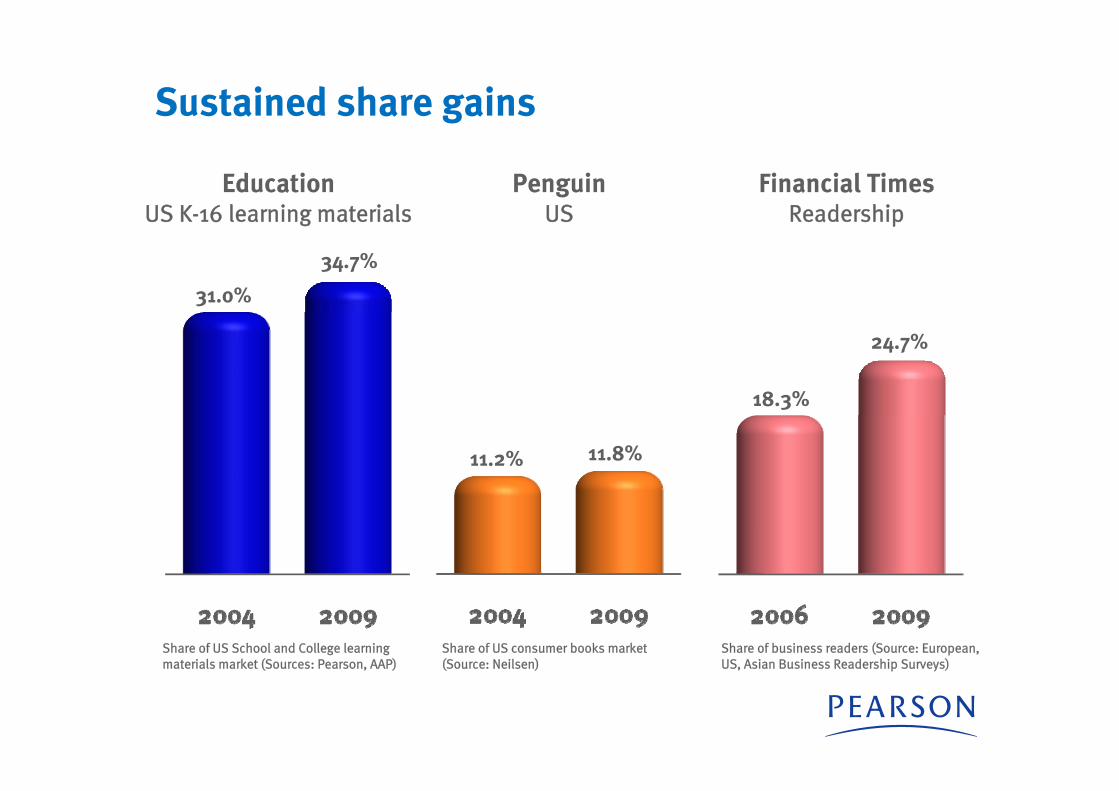
Sustained share gains
EducationUS K-16 learning materials
Financial TimesReadership
PenguinUS
Share of US School and College learning materials market (Sources: Pearson, AAP)
Share of US consumer books market (Source: Neilsen)
Share of business readers (Source: European, US, Asian Business Readership Surveys)
31.0%
34.7%
11.2% 11.8%
18.3%
24.7%
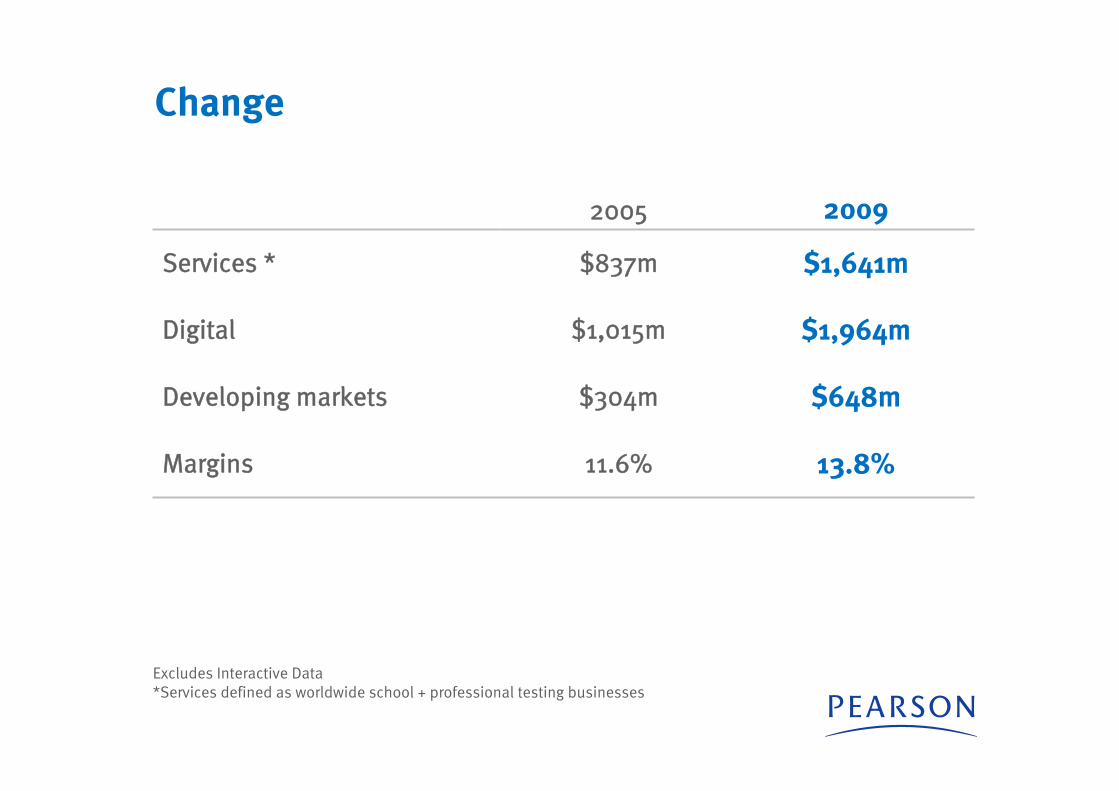
Change
2005 2009
Services * $837m $1,641m
Digital $1,015m $1,964m
Developing markets $304m $648m
Margins 11.6% 13.8%
Excludes Interactive Data*Services defined as worldwide school + professional testing businesses
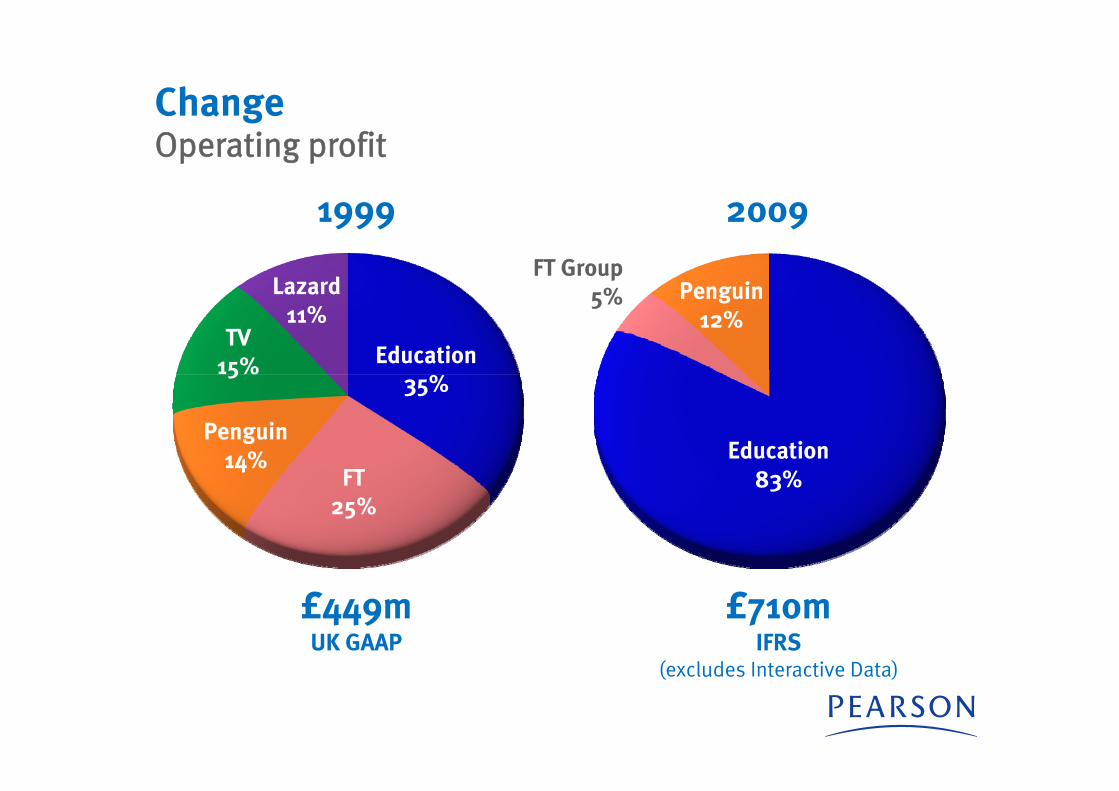
ChangeOperating profit
2009
£710mIFRS
(excludes Interactive Data)
1999
£449mUK GAAP
Education35%
FT25%
Penguin14%
TV15%
Lazard11%
Education83%
FT Group5% Penguin
12%
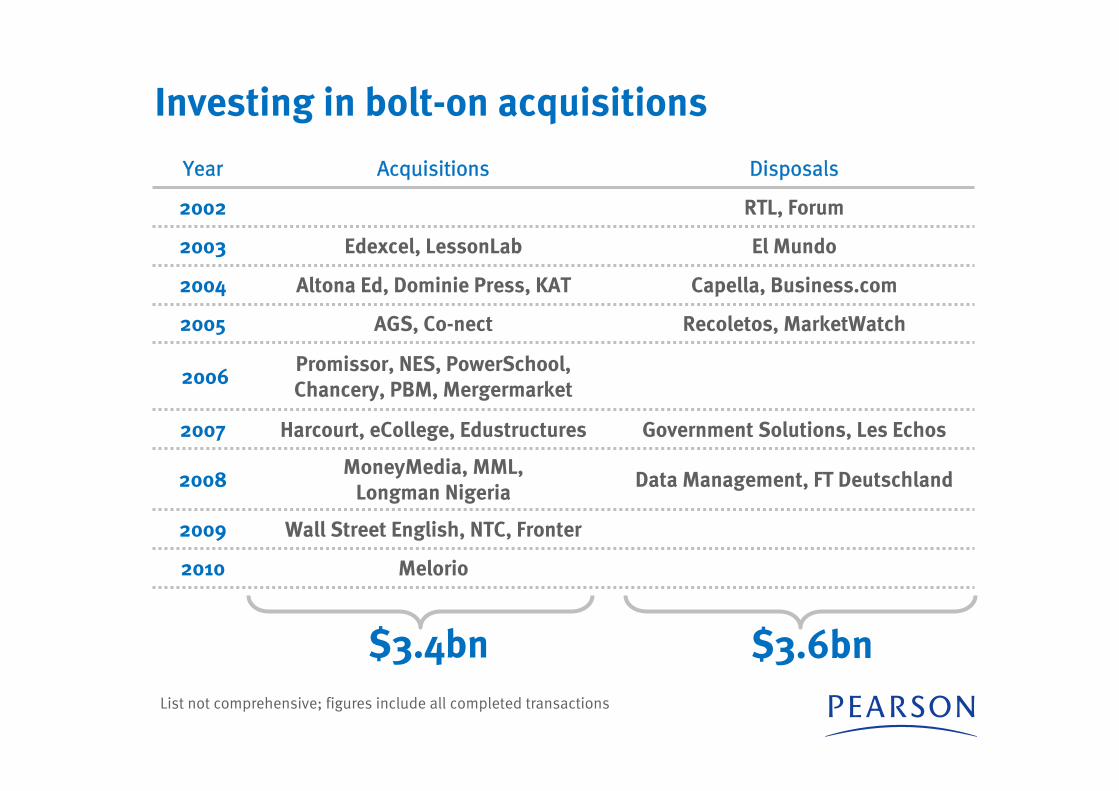
Investing in bolt-on acquisitions
Year Acquisitions Disposals
2002 RTL, Forum
2003 Edexcel, LessonLab El Mundo
2004 Altona Ed, Dominie Press, KAT Capella, Business.com
2005 AGS, Co-nect Recoletos, MarketWatch
2006Promissor, NES, PowerSchool, Chancery, PBM, Mergermarket
2007 Harcourt, eCollege, Edustructures Government Solutions, Les Echos
2008MoneyMedia, MML,
Longman NigeriaData Management, FT Deutschland
2009 Wall Street English, NTC, Fronter
2010 Melorio
$3.4bn $3.6bnList not comprehensive; figures include all completed transactions


Financial reviewFinancial review
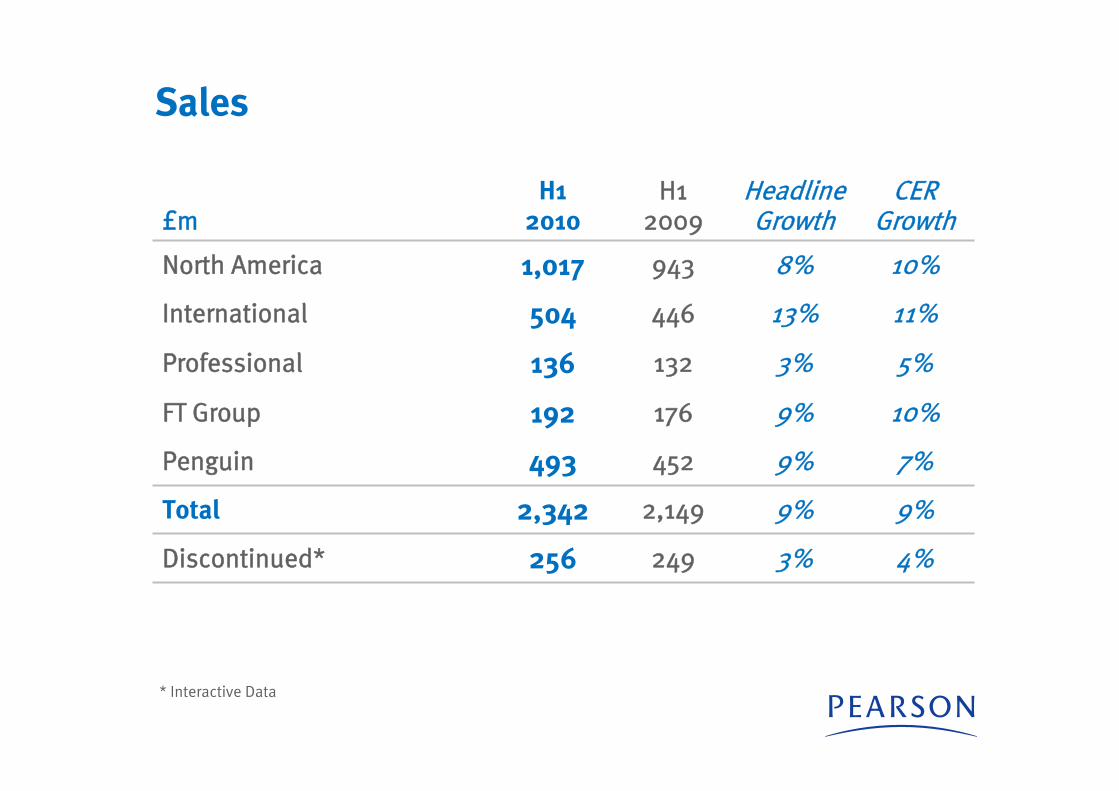
Sales
£mH1
2010H1
2009HeadlineGrowth
CERGrowth
North America 1,017 943 8% 10%
International 504 446 13% 11%
Professional 136 132 3% 5%
FT Group 192 176 9% 10%
Penguin 493 452 9% 7%
Total 2,342 2,149 9% 9%
Discontinued* 256 249 3% 4%
* Interactive Data
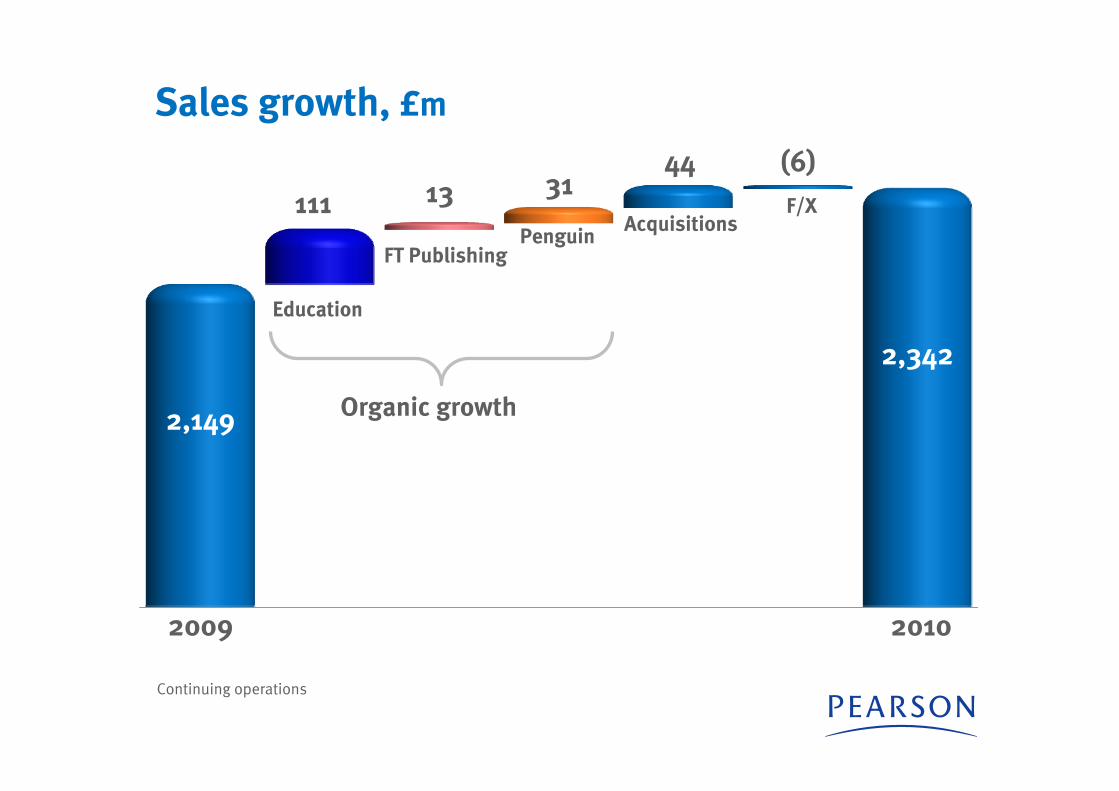
Continuing operations
Sales growth, £m
2009 2010
2,149
F/X31
(6)111
Education
2,342
FT Publishing Penguin
Acquisitions
4413
Organic growth
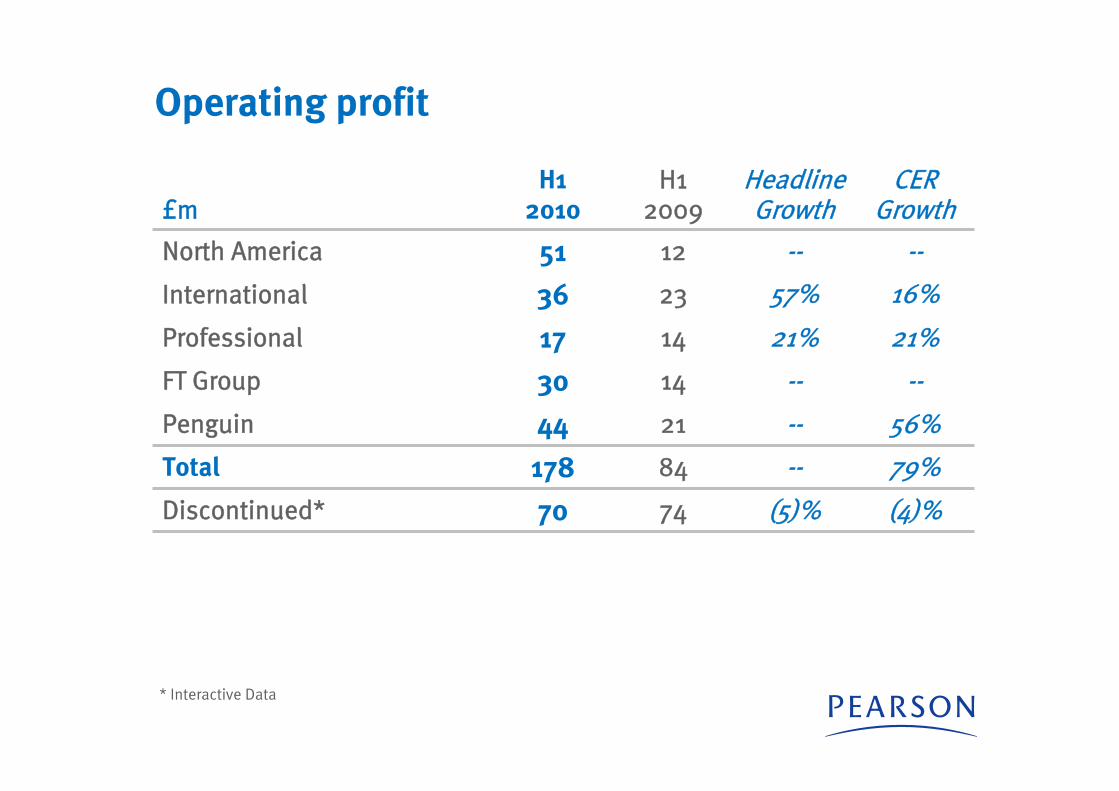
Operating profit
£mH1
2010H1
2009HeadlineGrowth
CERGrowth
North America 51 12 -- --
International 36 23 57% 16%
Professional 17 14 21% 21%
FT Group 30 14 -- --
Penguin 44 21 -- 56%
Total 178 84 -- 79%
Discontinued* 70 74 (5)% (4)%
* Interactive Data
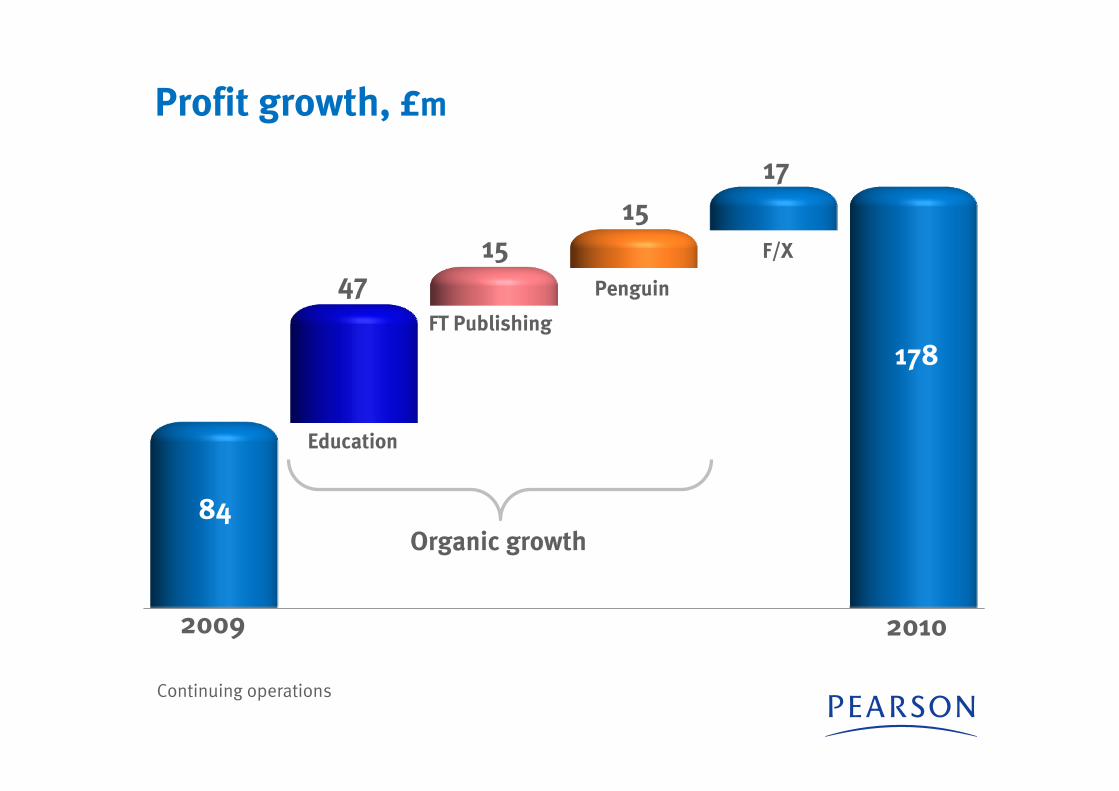
Profit growth, £m
Continuing operations
2009 2010
84
F/X
1517
47
Education
178FT Publishing
Penguin
15
Organic growth
Summary phasing effects
Earlier purchasing in US School
Earlier marking completion in UK testing
Penguin publishing schedule & restructuring
Helpful H1 comparatives, tougher in H2
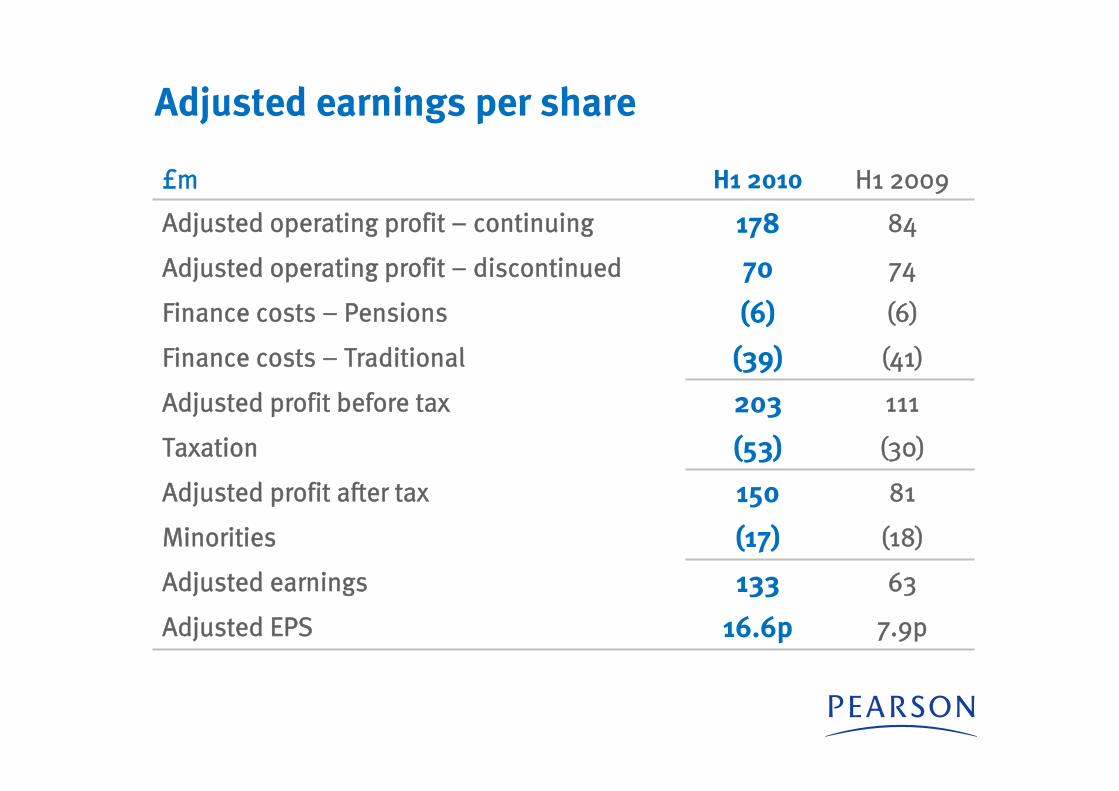
Adjusted earnings per share
£m H1 2010 H1 2009
Adjusted operating profit – continuing 178 84
Adjusted operating profit – discontinued 70 74
Finance costs – Pensions (6) (6)
Finance costs – Traditional (39) (41)
Adjusted profit before tax 203 111
Taxation (53) (30)
Adjusted profit after tax 150 81
Minorities (17) (18)
Adjusted earnings 133 63
Adjusted EPS 16.6p 7.9p
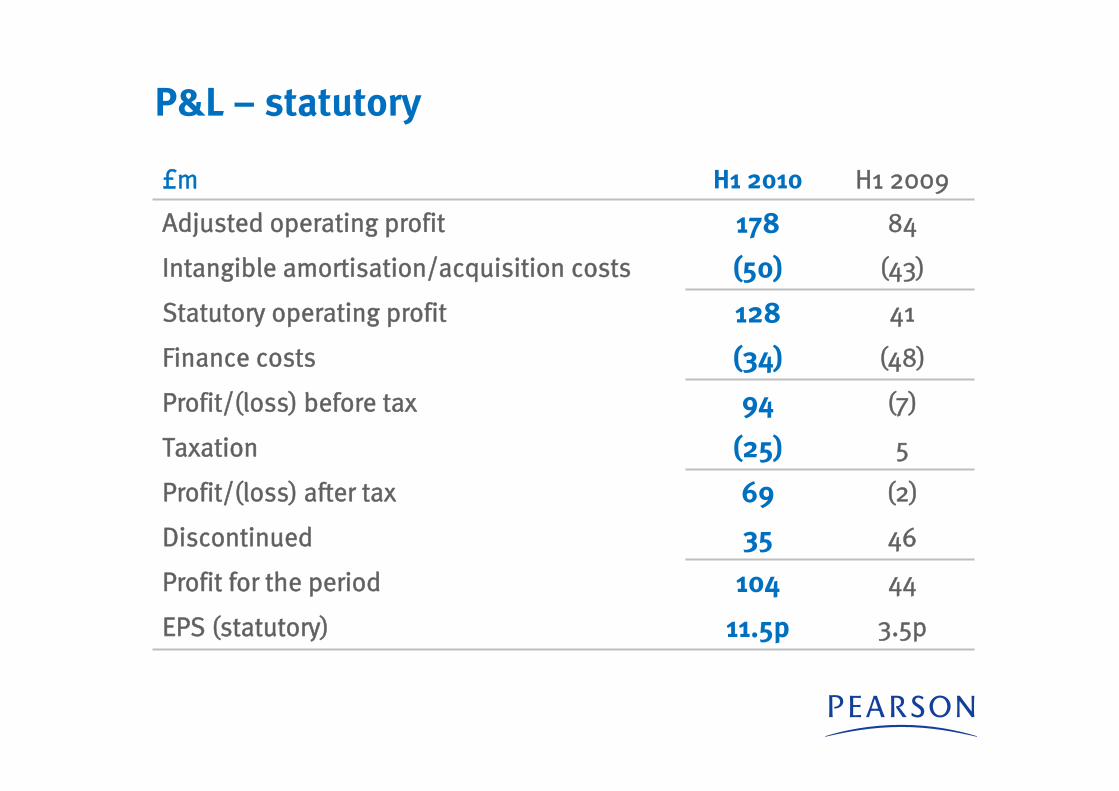
P&L – statutory
£m H1 2010 H1 2009
Adjusted operating profit 178 84
Intangible amortisation/acquisition costs (50) (43)
Statutory operating profit 128 41
Finance costs (34) (48)
Profit/(loss) before tax 94 (7)
Taxation (25) 5
Profit/(loss) after tax 69 (2)
Discontinued 35 46
Profit for the period 104 44
EPS (statutory) 11.5p 3.5p
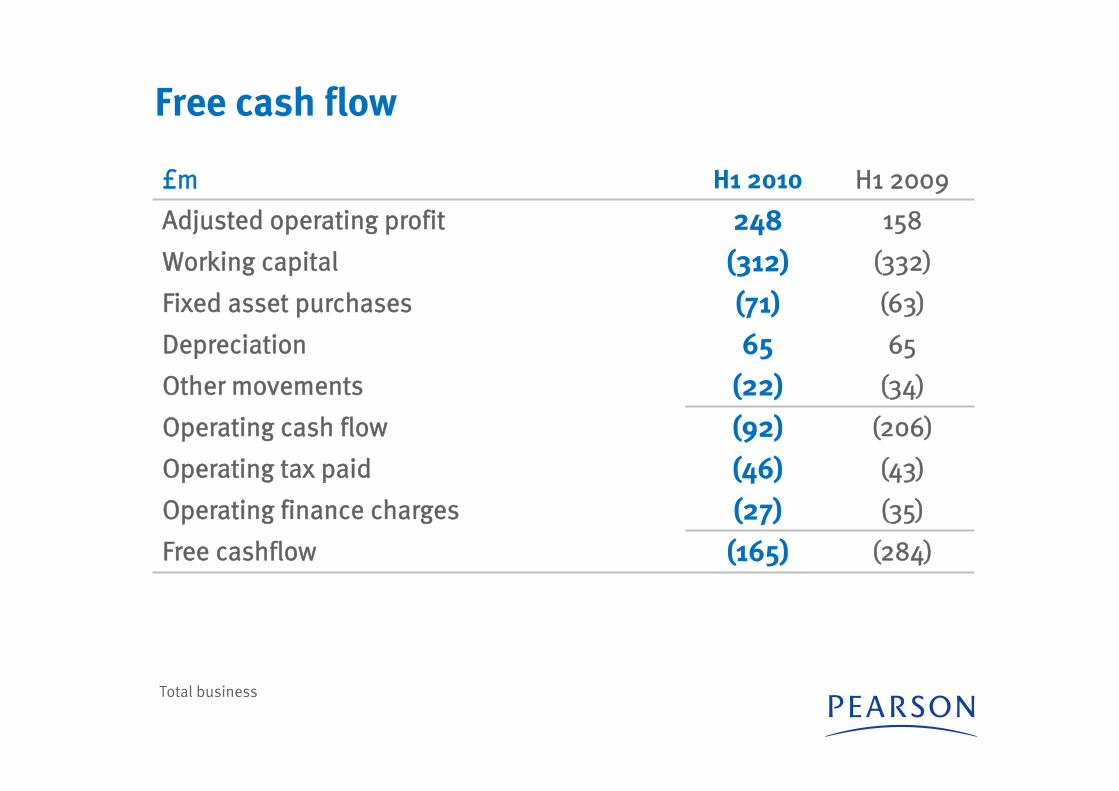
Free cash flow
£m H1 2010 H1 2009
Adjusted operating profit 248 158
Working capital (312) (332)
Fixed asset purchases (71) (63)
Depreciation 65 65
Other movements (22) (34)
Operating cash flow (92) (206)
Operating tax paid (46) (43)
Operating finance charges (27) (35)
Free cashflow (165) (284)
Total business
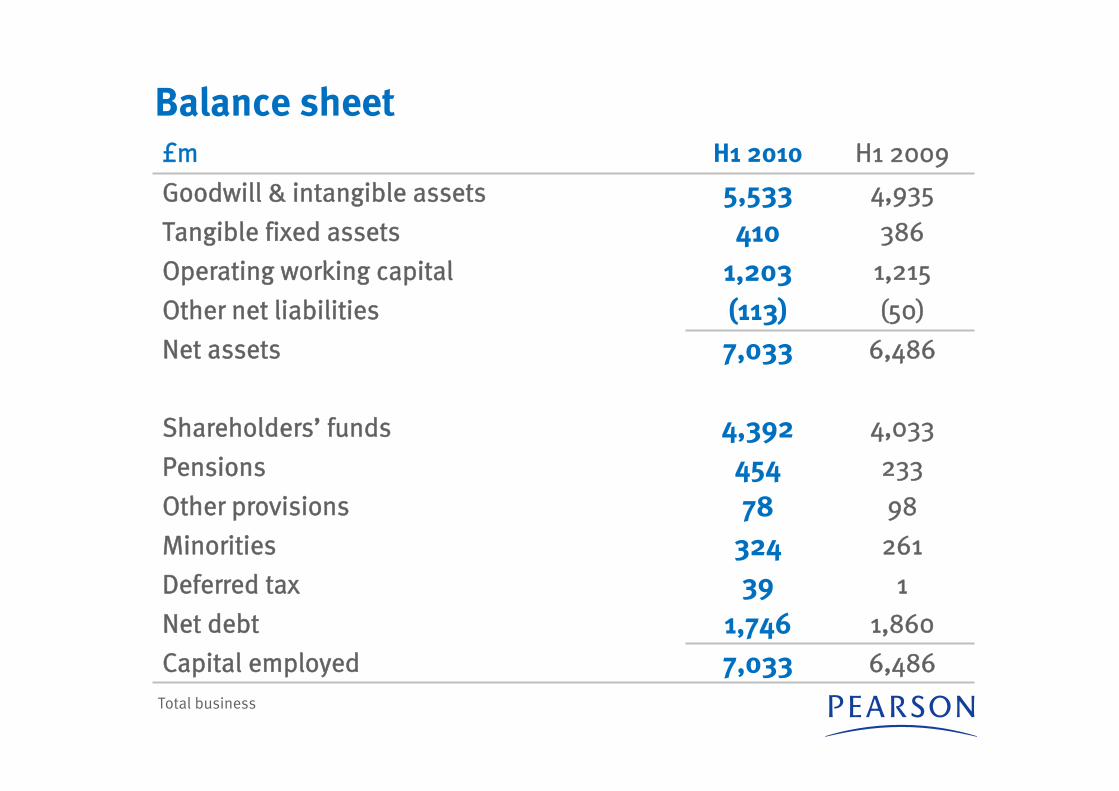
Balance sheet
Total business
£m H1 2010 H1 2009
Goodwill & intangible assets 5,533 4,935
Tangible fixed assets 410 386
Operating working capital 1,203 1,215
Other net liabilities (113) (50)
Net assets 7,033 6,486
Shareholders’ funds 4,392 4,033
Pensions 454 233
Other provisions 78 98
Minorities 324 261
Deferred tax 39 1
Net debt 1,746 1,860
Capital employed 7,033 6,486

OutlookOutlook

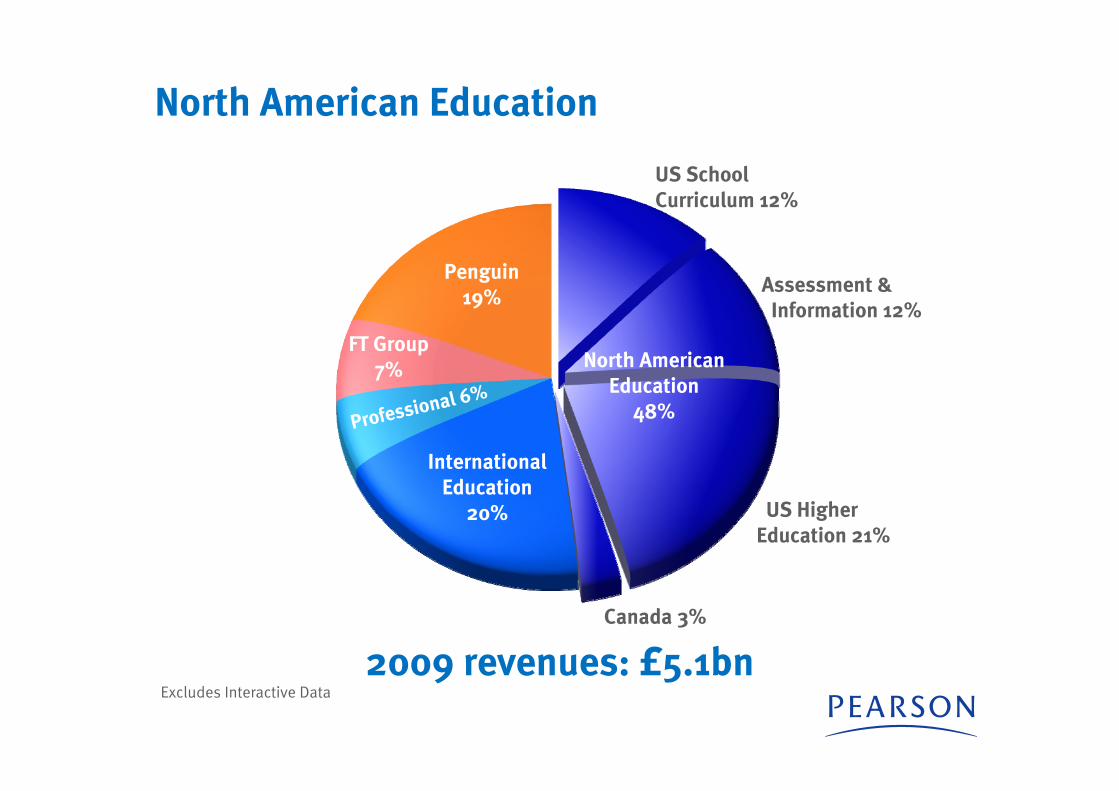
North American Education
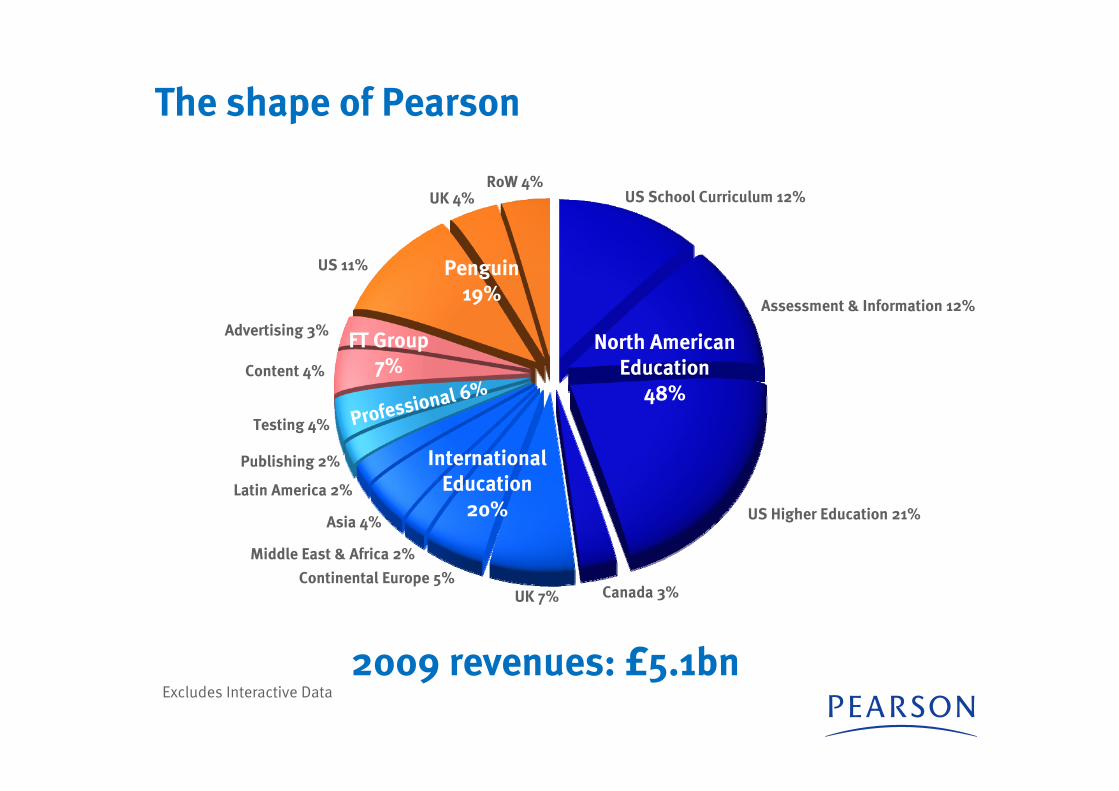
2009 revenues: £5.1bnExcludes Interactive Data
Assessment & Information 12%
US Higher Education 21%
US School Curriculum 12%
Canada 3%
FT Group7%
Penguin19%
Professional 6%
International Education
20%
North AmericanEducation
48%
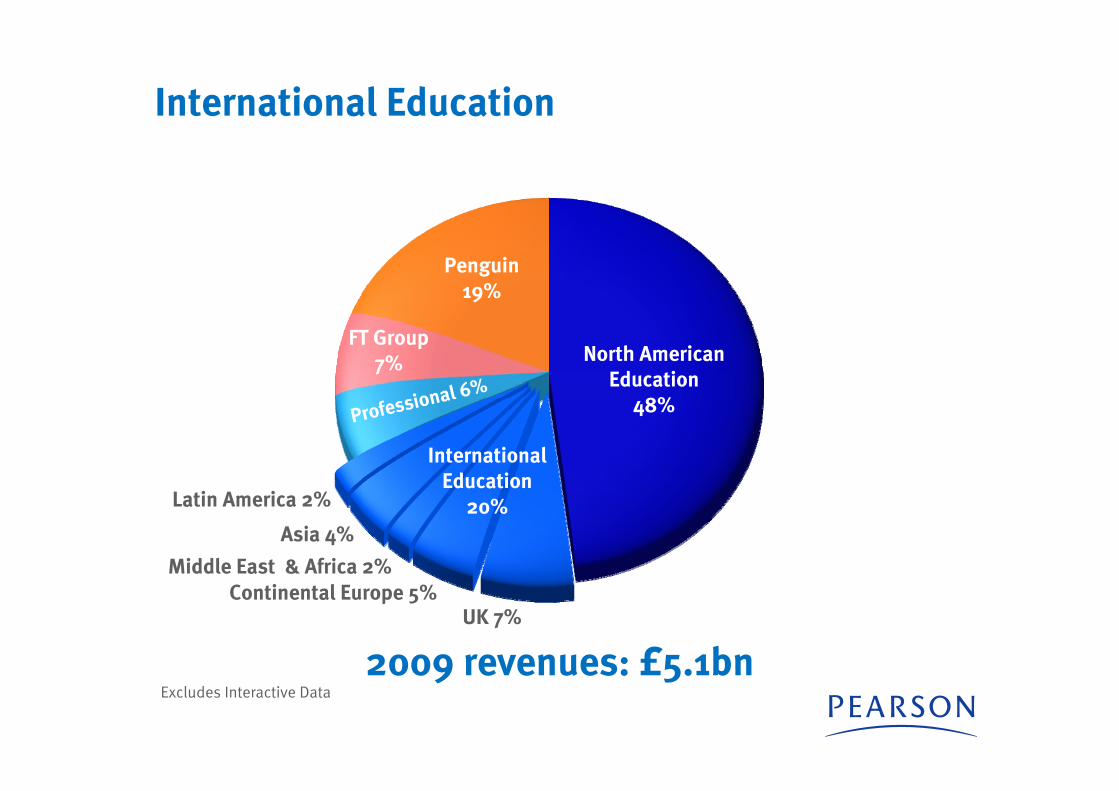
International Education
Continental Europe 5%UK 7%
FT Group7%
Penguin19%
Professional 6%
International Education
20%
North AmericanEducation
48%
Middle East & Africa 2%
Asia 4%
Latin America 2%
2009 revenues: £5.1bnExcludes Interactive Data
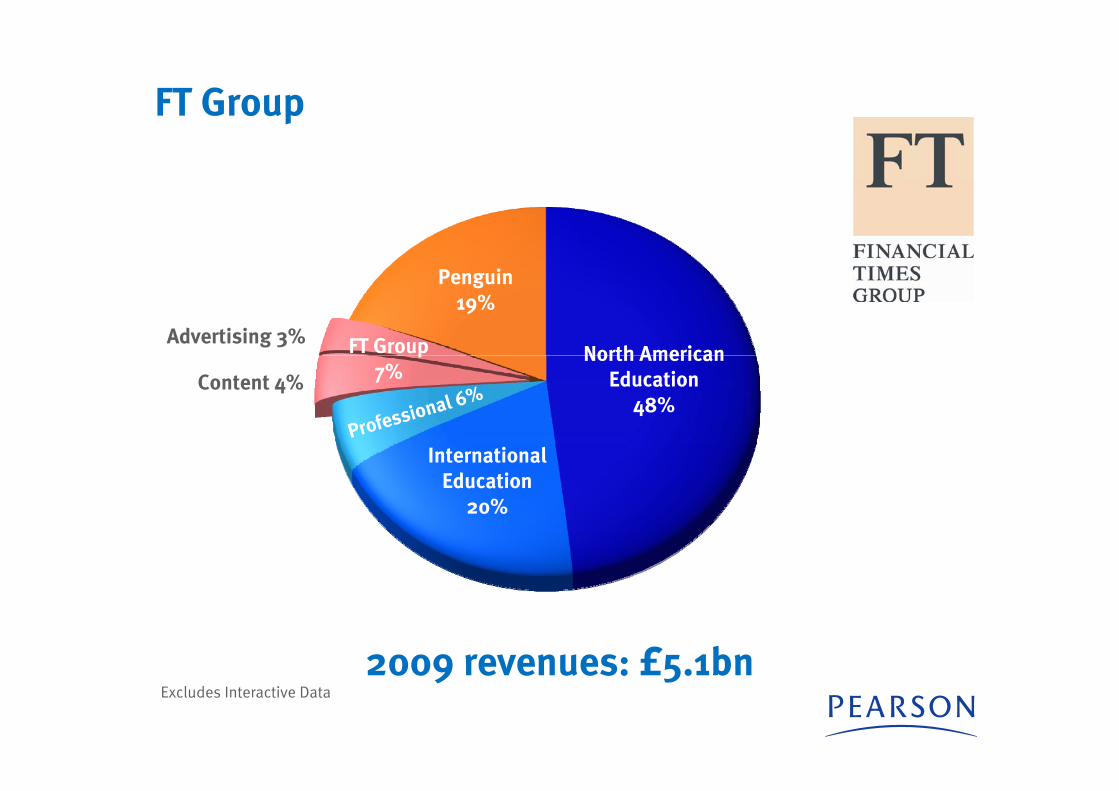
FT Group
FT Group7%
Penguin19%
Professional 6%
International Education
20%
North AmericanEducation
48%Content 4%
Advertising 3%
2009 revenues: £5.1bnExcludes Interactive Data
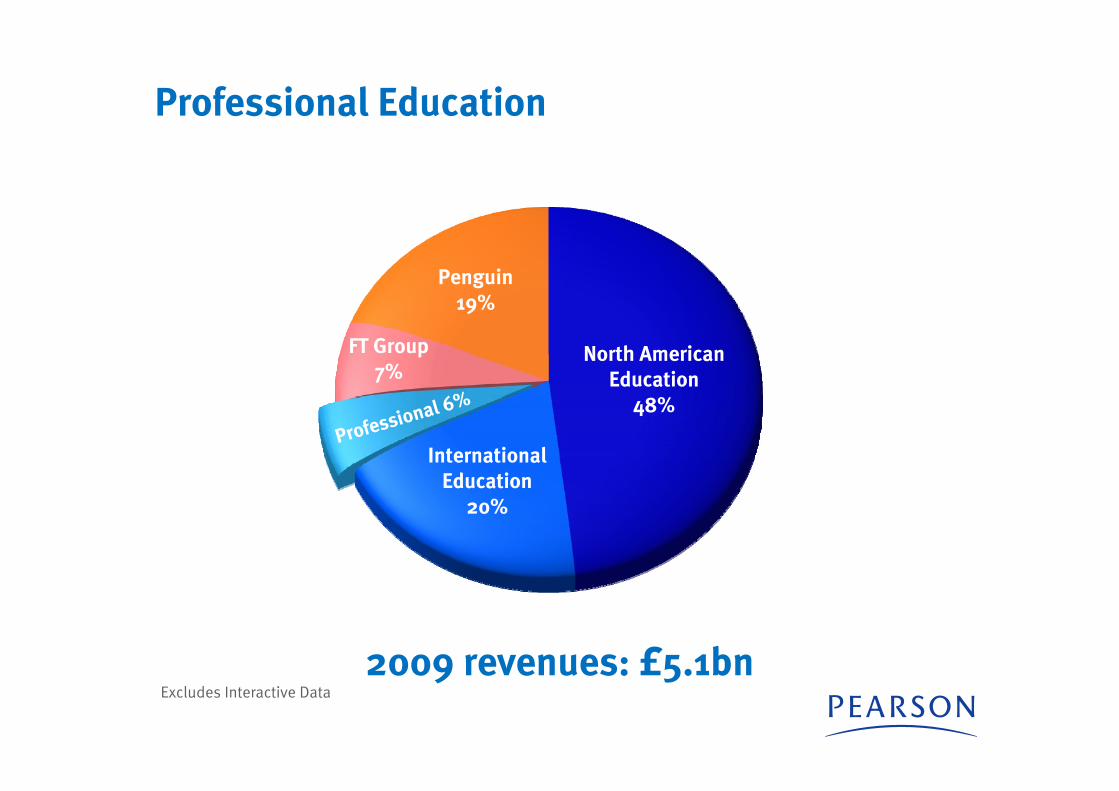
Professional Education
FT Group7%
Penguin19%
Professional 6%
International Education
20%
North AmericanEducation
48%
2009 revenues: £5.1bnExcludes Interactive Data
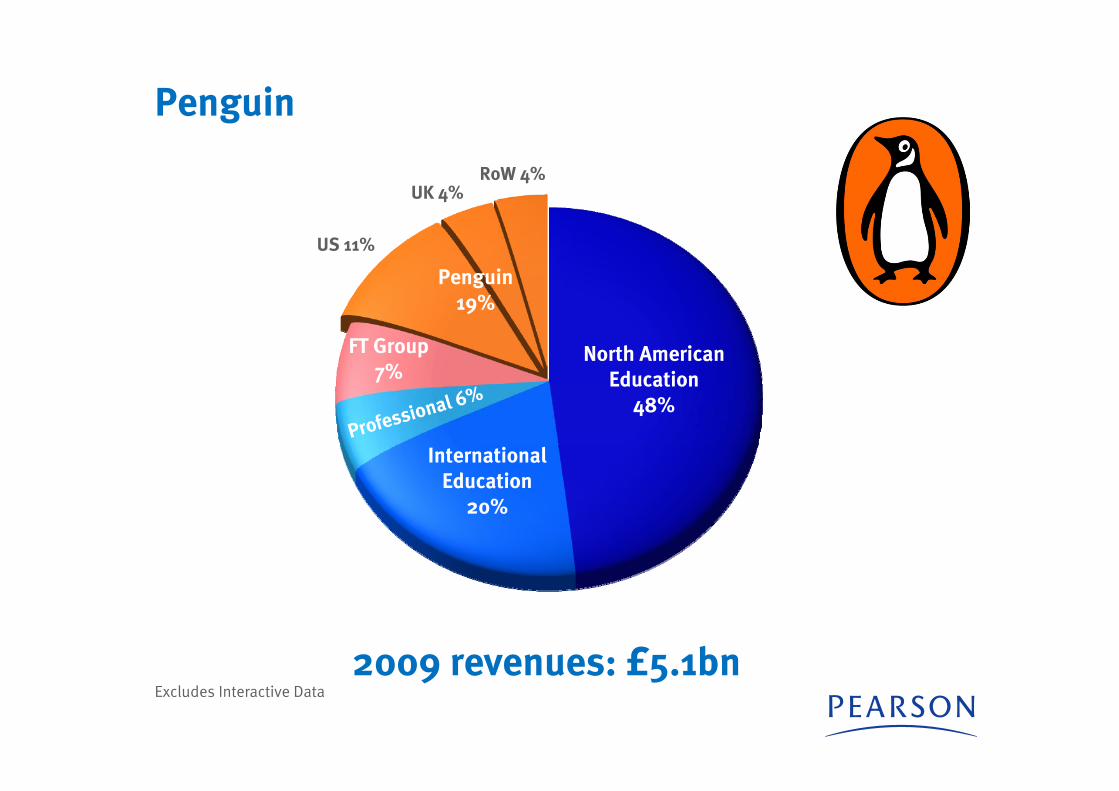
Penguin
2009 revenues: £5.1bnExcludes Interactive Data
FT Group7%
Penguin19%
Professional 6%
International Education
20%
North AmericanEducation
48%
US 11%
UK 4%RoW 4%
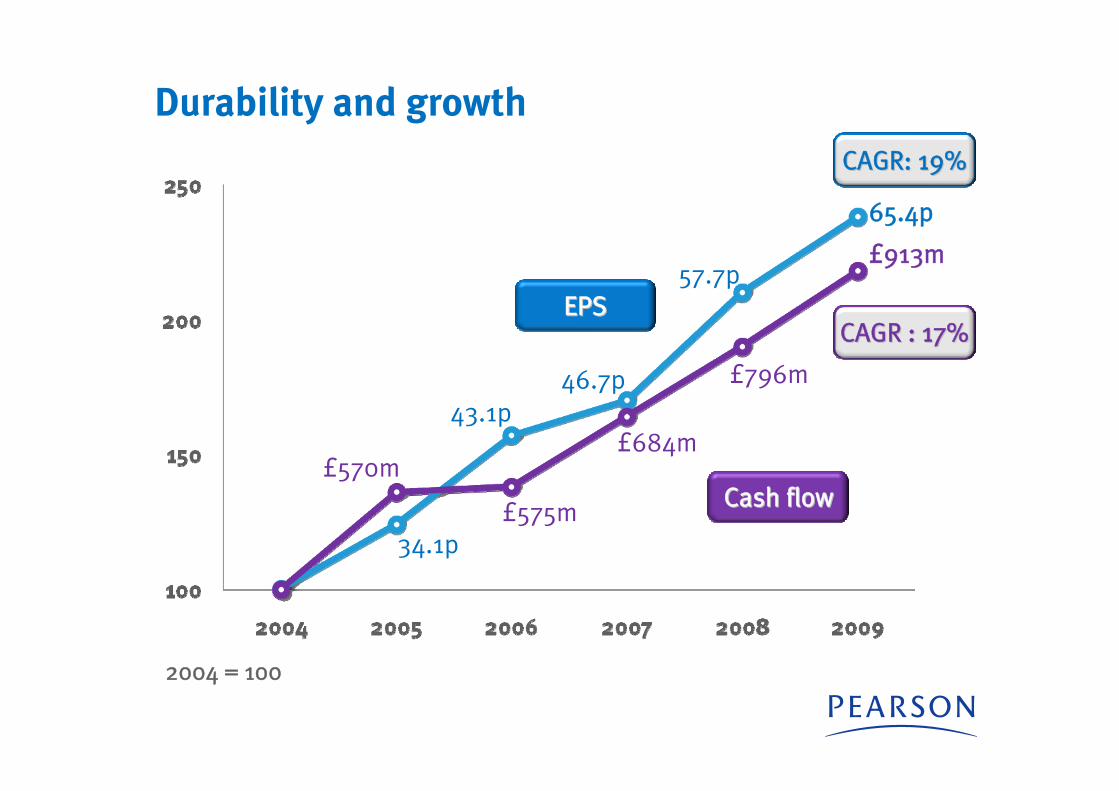
Durability and growth
2004 = 100
£913m
65.4p
£796m
£684m
£575m
£570m
57.7p
46.7p43.1p
34.1p
Cash flowCash flow
EPSEPS
CAGR: 19%CAGR: 19%
CAGR : 17%CAGR : 17%
AppendicesAppendices
The shape of Pearson
2009 revenues: £5.1bnExcludes Interactive Data
FT Group7%
Penguin19%
Professional 6%
International Education
20%
North AmericanEducation
48%
US School Curriculum 12%
Assessment & Information 12%
US Higher Education 21%
Canada 3%UK 7%Continental Europe 5%
Middle East & Africa 2%
Asia 4%
Latin America 2%
Publishing 2%
Testing 4%
Content 4%
Advertising 3%
US 11%
UK 4%RoW 4%
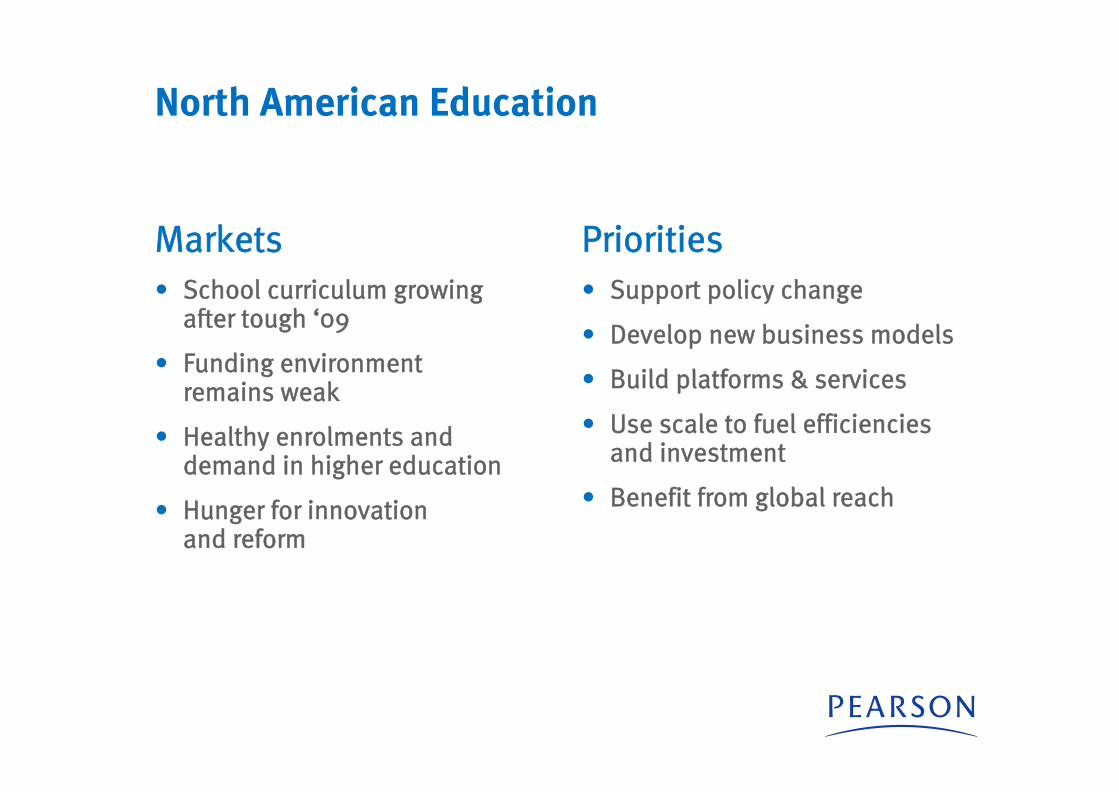
North American Education
Markets • School curriculum growing
after tough ‘09
• Funding environment remains weak
• Healthy enrolments and demand in higher education
• Hunger for innovation and reform
Priorities• Support policy change
• Develop new business models
• Build platforms & services
• Use scale to fuel efficiencies and investment
• Benefit from global reach
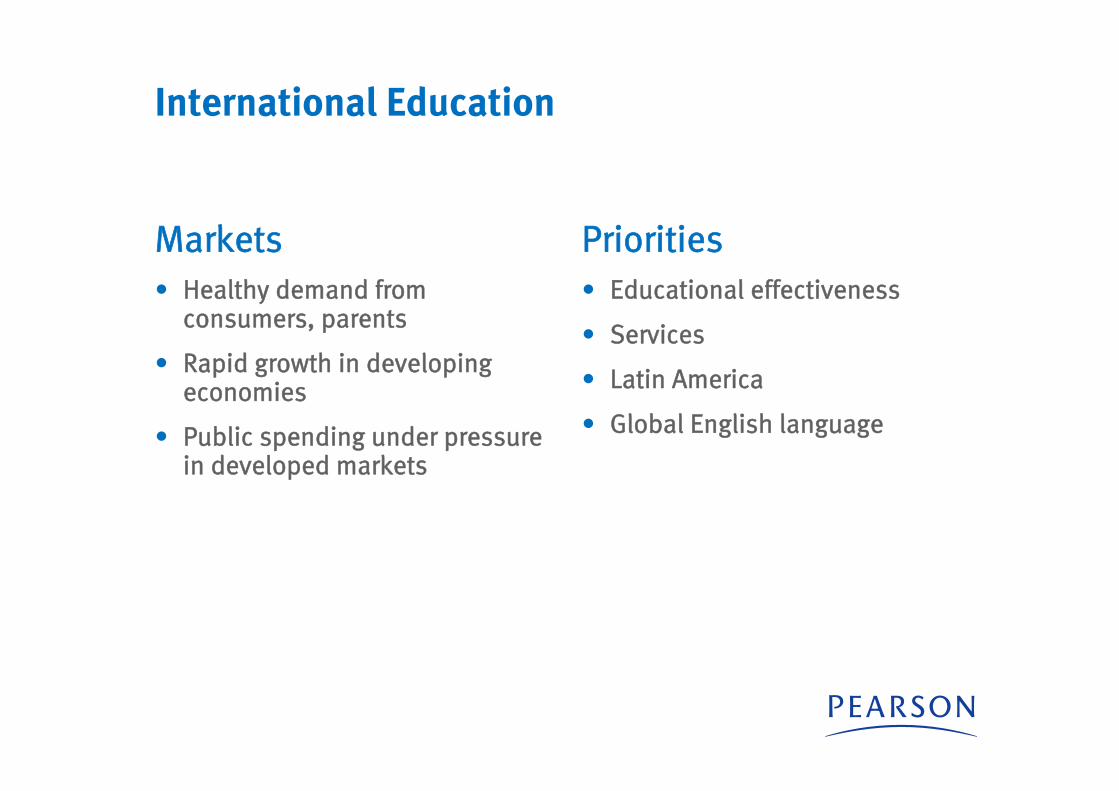
International Education
Markets • Healthy demand from
consumers, parents
• Rapid growth in developing economies
• Public spending under pressure in developed markets
Priorities• Educational effectiveness
• Services
• Latin America
• Global English language
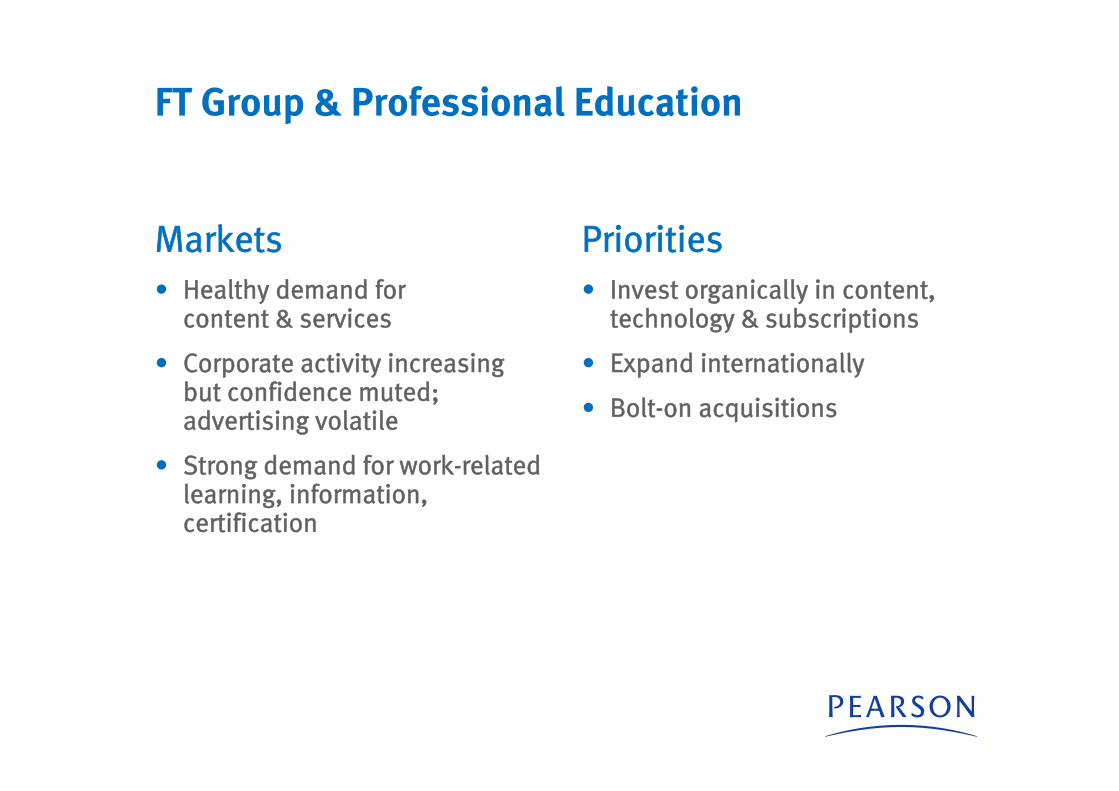
FT Group & Professional Education
Markets • Healthy demand for
content & services
• Corporate activity increasing but confidence muted; advertising volatile
• Strong demand for work-related learning, information, certification
Priorities• Invest organically in content,
technology & subscriptions
• Expand internationally
• Bolt-on acquisitions
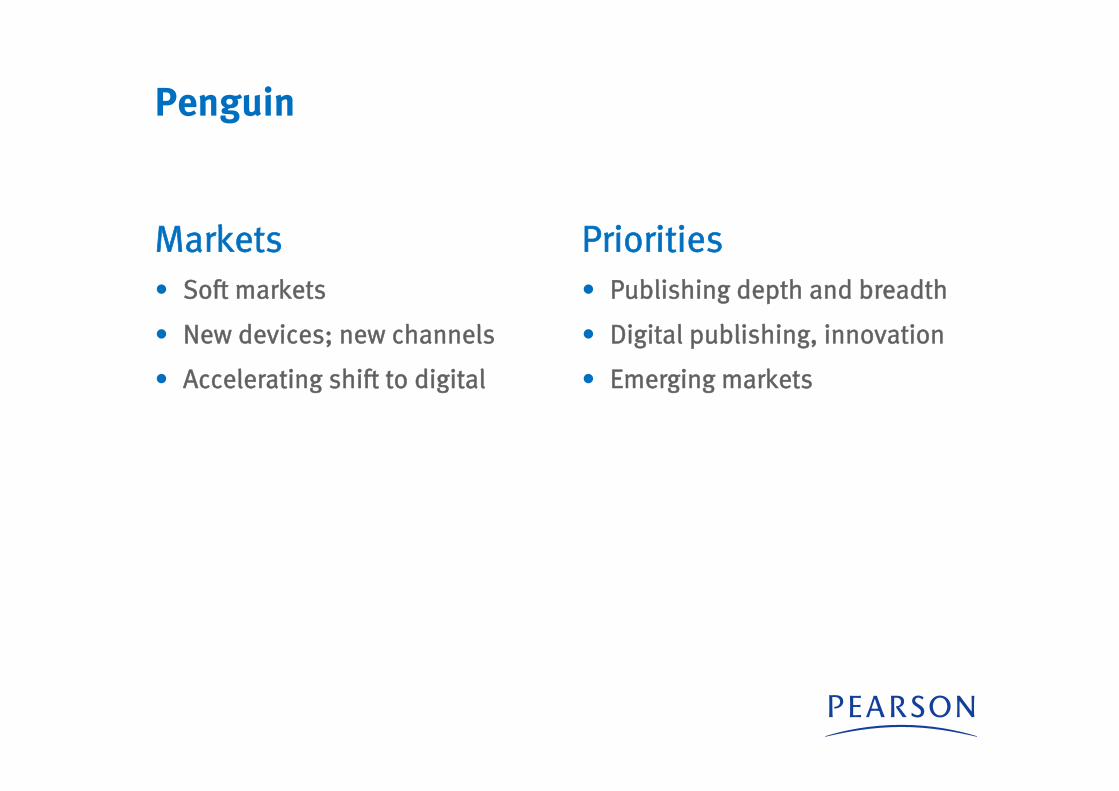
Penguin
Markets • Soft markets
• New devices; new channels
• Accelerating shift to digital
Priorities• Publishing depth and breadth
• Digital publishing, innovation
• Emerging markets
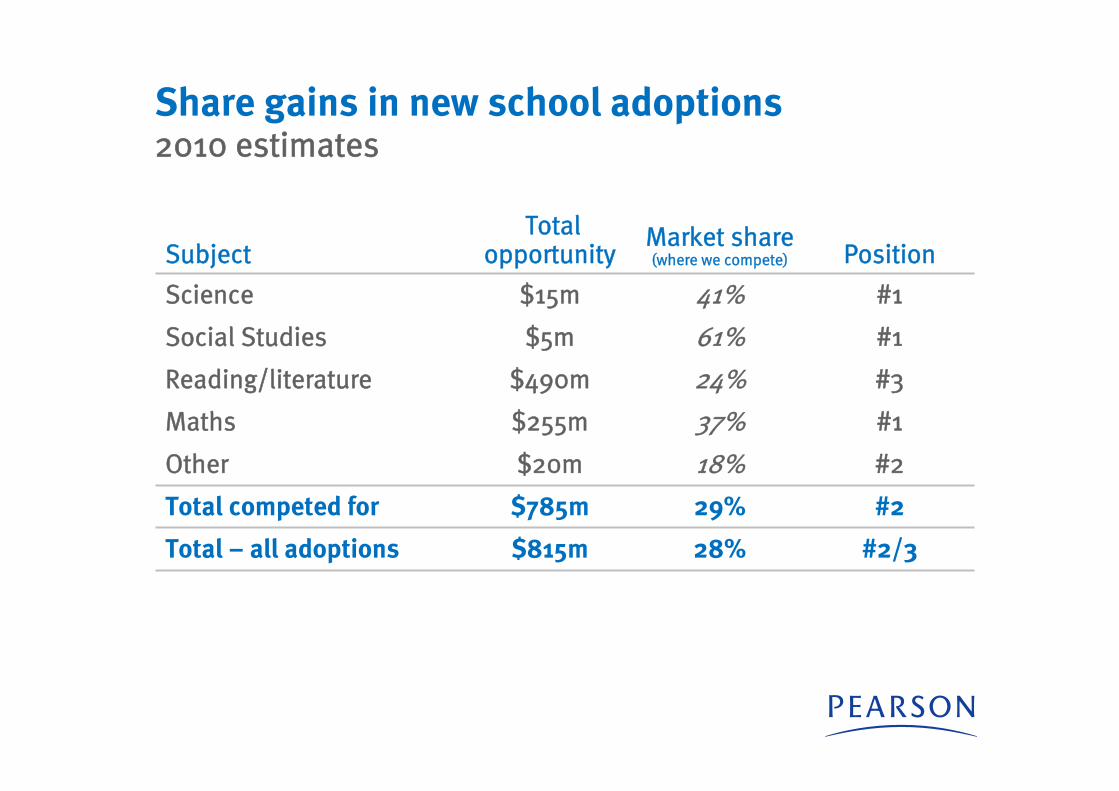
Share gains in new school adoptions2010 estimates
SubjectTotal
opportunityMarket share (where we compete) Position
Science $15m 41% #1
Social Studies $5m 61% #1
Reading/literature $490m 24% #3
Maths $255m 37% #1
Other $20m 18% #2
Total competed for $785m 29% #2
Total – all adoptions $815m 28% #2/3
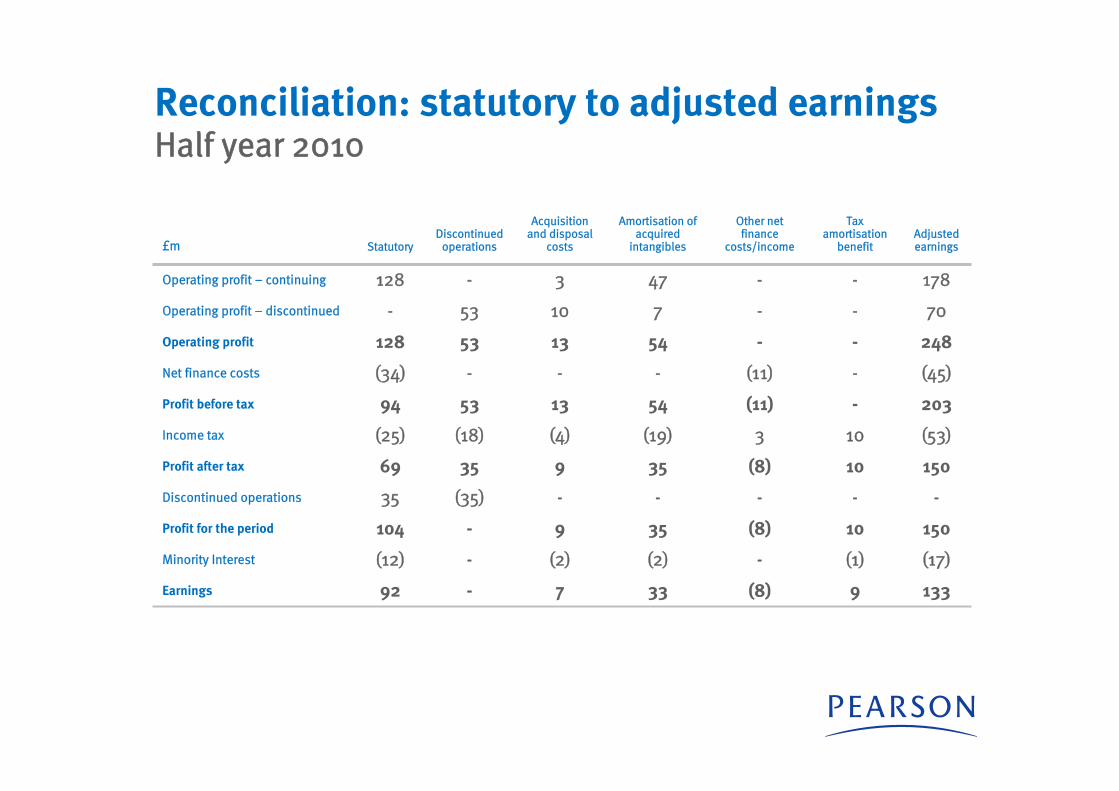
Reconciliation: statutory to adjusted earningsHalf year 2010
£m StatutoryDiscontinued
operations
Acquisition and disposal
costs
Amortisation of acquired
intangibles
Other net finance
costs/income
Tax amortisation
benefitAdjusted earnings
Operating profit – continuing 128 - 3 47 - - 178
Operating profit – discontinued - 53 10 7 - - 70
Operating profit 128 53 13 54 - - 248
Net finance costs (34) - - - (11) - (45)
Profit before tax 94 53 13 54 (11) - 203
Income tax (25) (18) (4) (19) 3 10 (53)
Profit after tax 69 35 9 35 (8) 10 150
Discontinued operations 35 (35) - - - - -
Profit for the period 104 - 9 35 (8) 10 150
Minority Interest (12) - (2) (2) - (1) (17)
Earnings 92 - 7 33 (8) 9 133
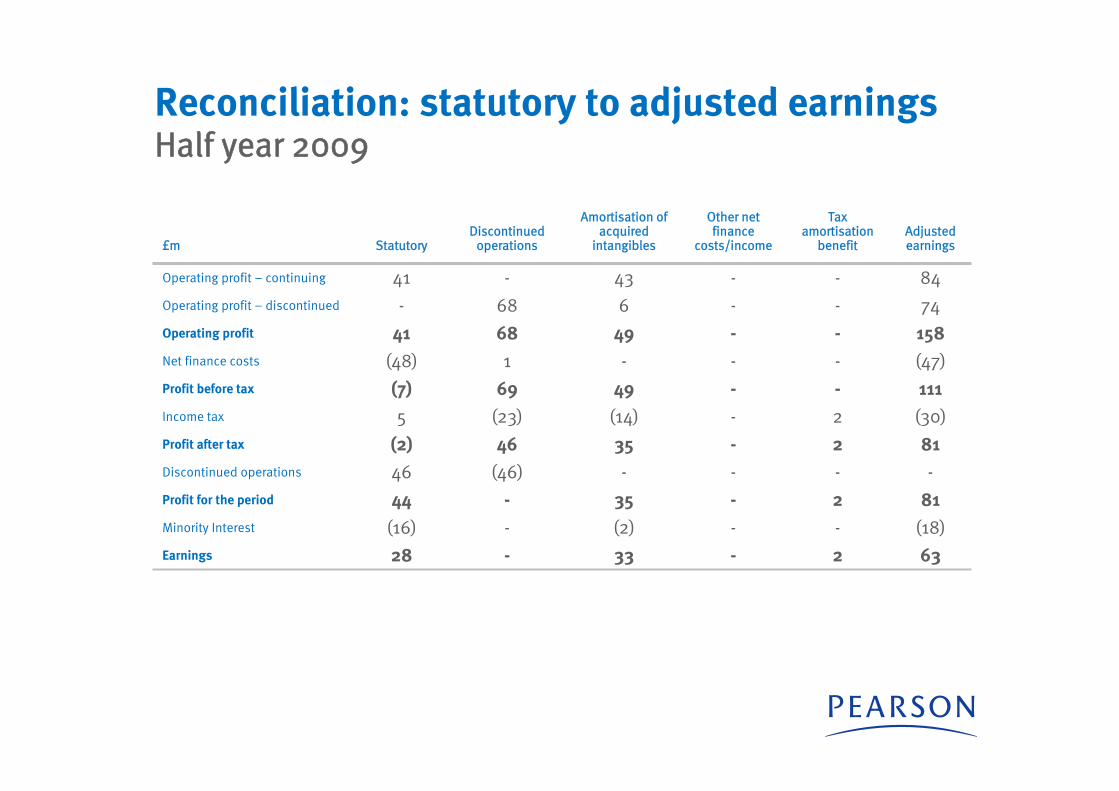
Reconciliation: statutory to adjusted earningsHalf year 2009
£m StatutoryDiscontinued
operations
Amortisation of acquired
intangibles
Other net finance
costs/income
Tax amortisation
benefitAdjusted earnings
Operating profit – continuing 41 - 43 - - 84Operating profit – discontinued - 68 6 - - 74Operating profit 41 68 49 - - 158Net finance costs (48) 1 - - - (47)Profit before tax (7) 69 49 - - 111Income tax 5 (23) (14) - 2 (30)Profit after tax (2) 46 35 - 2 81Discontinued operations 46 (46) - - - -Profit for the period 44 - 35 - 2 81Minority Interest (16) - (2) - - (18)Earnings 28 - 33 - 2 63
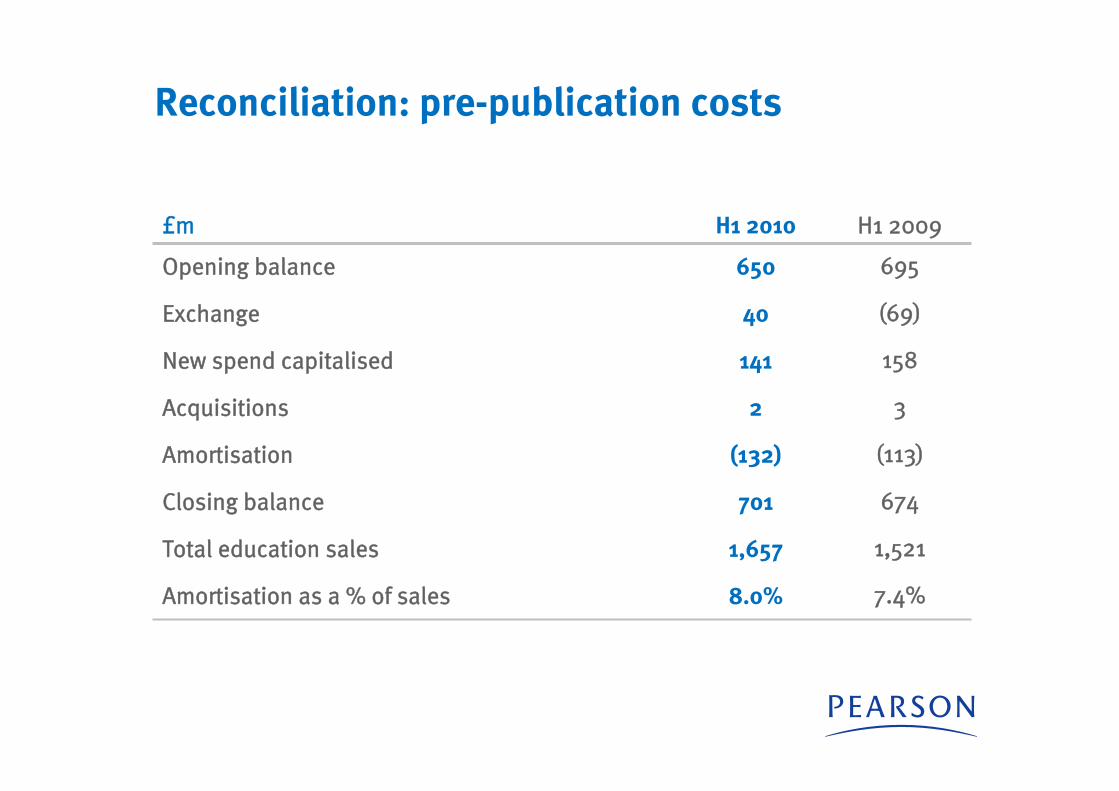
Reconciliation: pre-publication costs
£m H1 2010 H1 2009
Opening balance 650 695
Exchange 40 (69)
New spend capitalised 141 158
Acquisitions 2 3
Amortisation (132) (113)
Closing balance 701 674
Total education sales 1,657 1,521
Amortisation as a % of sales 8.0% 7.4%
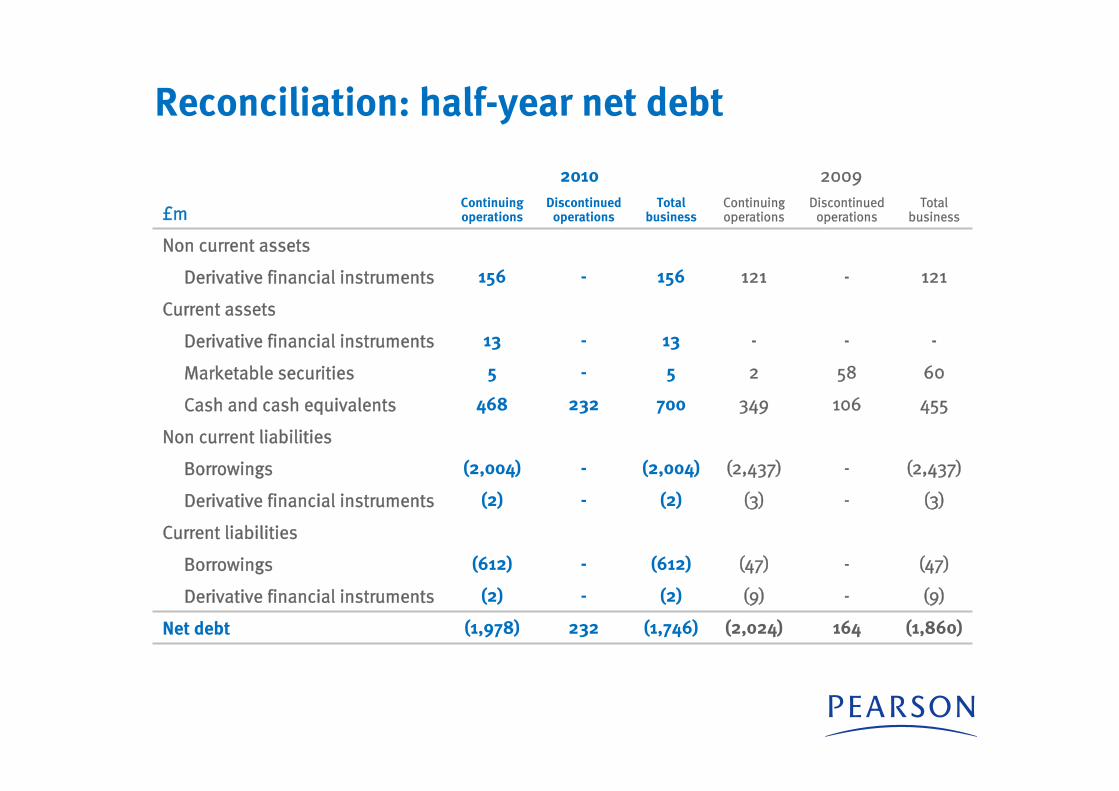
Reconciliation: half-year net debt
£m
2010 2009Continuing operations
Discontinued operations
Total business
Continuing operations
Discontinued operations
Total business
Non current assets
Derivative financial instruments 156 - 156 121 - 121
Current assets
Derivative financial instruments 13 - 13 - - -
Marketable securities 5 - 5 2 58 60
Cash and cash equivalents 468 232 700 349 106 455
Non current liabilities
Borrowings (2,004) - (2,004) (2,437) - (2,437)
Derivative financial instruments (2) - (2) (3) - (3)
Current liabilities
Borrowings (612) - (612) (47) - (47)
Derivative financial instruments (2) - (2) (9) - (9)
Net debt (1,978) 232 (1,746) (2,024) 164 (1,860)
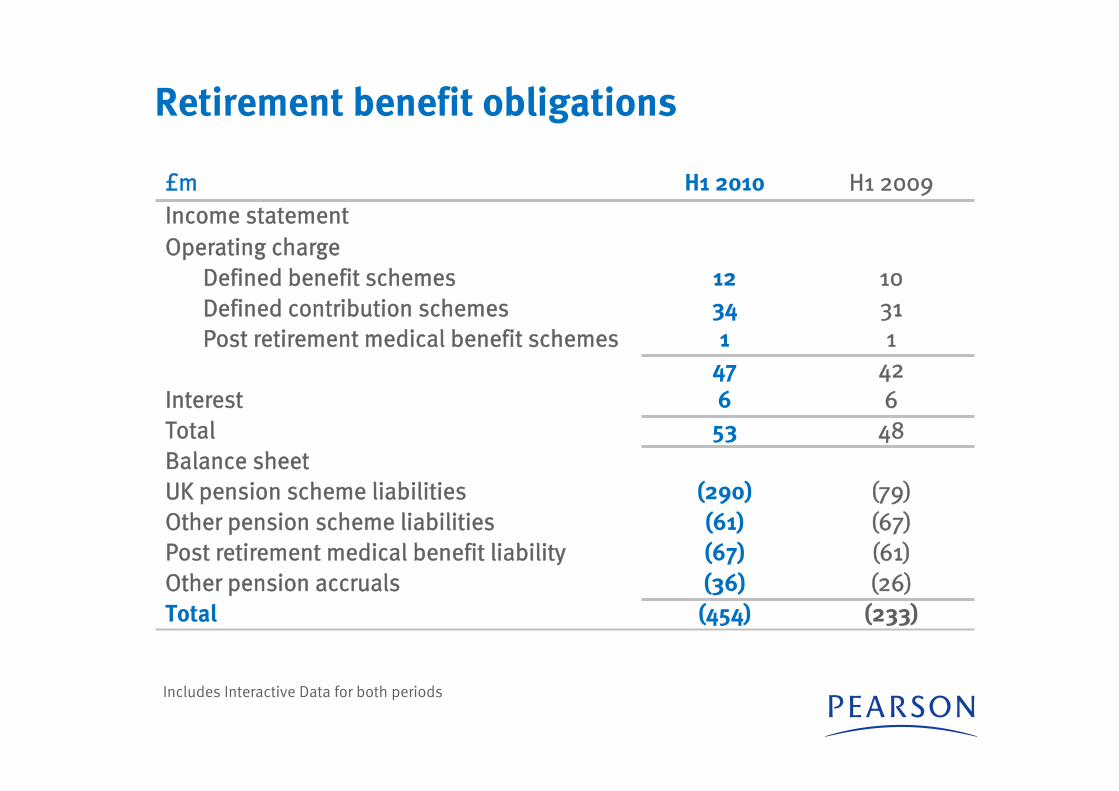
Retirement benefit obligations
£m H1 2010 H1 2009Income statementOperating charge
Defined benefit schemes 12 10Defined contribution schemes 34 31Post retirement medical benefit schemes 1 1
47 42Interest 6 6Total 53 48Balance sheetUK pension scheme liabilities (290) (79)Other pension scheme liabilities (61) (67)Post retirement medical benefit liability (67) (61)Other pension accruals (36) (26)Total (454) (233)
Includes Interactive Data for both periods