Embed Size (px)
Citation preview
130 THE PLANT GENOME NOVEMBER 2010 VOL. 3, NO. 3
ORIGINAL RESEARCH
Genome-size Variation in Switchgrass (Panicum virgatum): Flow Cytometry and Cytology Reveal Rampant Aneuploidy
Denise E. Costich,* Bernd Friebe, Moira J. Sheehan, Michael D. Casler, and Edward S. Buckler
AbstractSwitchgrass (Panicum virgatum L.), a native perennial dominant of the prairies of North America, has been targeted as a model herbaceous species for biofeedstock development. A fl ow-cytometric survey of a core set of 11 primarily upland polyploid switchgrass accessions indicated that there was considerable variation in genome size within each accession, particularly at the octoploid (2n = 8X = 72 chromosome) ploidy level. Highly variable chromosome counts in mitotic cell preparations indicated that aneuploidy was more common in octoploids (86.3%) than tetraploids (23.2%). Furthermore, the incidence of hyper- versus hypoaneuploidy is equivalent in tetraploids. This is clearly not the case in octoploids, where close to 90% of the aneuploid counts are lower than the euploid number. Cytogenetic investigation using fl uorescent in situ hybridization (FISH) revealed an unexpected degree of variation in chromosome structure underlying the apparent genomic instability of this species. These results indicate that rapid advances in the breeding of polyploid biofuel feedstocks, based on the molecular-genetic dissection of biomass characteristics and yield, will be predicated on the continual improvement of our understanding of the cytogenetics of these species.
“Species therefore evidently vary in their fundamental chro-
mosome organization or, as we may say, genetic structure. In
some this structure is less rigid, more fl exible, better buff ered,
than in others: and it is clear that where it is more fl exible,
where the chromosomes are more nearly neutral, changes in
the basic number by gain, and less oft en by loss, of whole chro-
mosomes will more readily come about…” (Darlington, 1956)
“From a practical standpoint, a varietal improvement pro-
gram can be outlined more intelligently when the cytogenetical
behavior of the species is understood.” (Myers and Hill, 1940)
THE GENETIC STRUCTURE of an organism has profound eff ects on all aspects of its basic biology. Th e man-
ner in which its genes are distributed, whether in few or many chromosomes, the numbers of whole sets of chromosomes (ploidy levels) present, and the presence or absence of individual copies of chromosomes, all contribute to its phenotype. Ploidy diff erences among individuals in a population will determine mating pat-terns and gene fl ow, aff ecting the distribution of genetic variation both within and among individuals. In natural populations, the resulting phenotypic variation is the foundation for ecotype formation, and, ultimately, over time, can lead to speciation. In a breeding program, it is the raw material for cultivar development and improve-ment of the crop. Th us, a thorough knowledge of the extent of any form of genome-size variation in a study organism is a critical fi rst step for any type of genetics or genomics research program.
Switchgrass (Panicum virgatum L.) has been the subject of intensive and extensive agronomic and breed-ing research for biofeedstock production since it was
Published in The Plant Genome 3:130–141. Published 16 Nov. 2010.doi: 10.3835/plantgenome2010.04.0010© Crop Science Society of America5585 Guilford Rd., Madison, WI 53711 USAAn open-access publication
All rights reserved. No part of this periodical may be reproduced or transmitted in any form or by any means, electronic or mechanical, including photocopying, recording, or any information storage and retrieval system, without permission in writing from the publisher. Permission for printing and for reprinting the material contained herein has been obtained by the publisher.
D.E. Costich and E.S. Buckler, USDA-ARS, Robert Holley Center, Ithaca, NY. D.E. Costich, M.J. Sheehan, and E.S. Buckler, Inst. for Genomic Diversity, Cornell Univ., Ithaca, NY. B. Friebe, Dep. of Plant Pathology, Kansas State Univ., Manhattan, KS. M.D. Casler, USDA-ARS, U.S. Dairy Forage Research Center, Madison, WI. Received 30 Apr. 2010. *Corresponding author ([email protected]).
COSTICH ET AL.: GENOME-SIZE VARIATION IN SWITCHGRASS 131
identifi ed by the United States Department of Energy (US-DOE) as the model herbaceous species for biofeed-stock development (McLaughlin and Kszos, 2005). As part of the fi rst phase of an association mapping study of this known polyploid, we reviewed the literature per-taining to chromosome-number variation in switchgrass cultivars and natural populations, and determined that there was suffi cient potential for a high diversity in chro-mosome numbers to warrant an in-depth study of the germplasm in our own association and linkage popula-tions. Of the 22 grass species screened by Oak Ridge National Laboratory as potential biofeedstock candidates (Turhollow et al., 1988), virtually all were polyploid, and switchgrass held the dubious distinction of having not only one of the highest numbers of known ploidy levels, but also the highest observed incidence of aneuploidy among the candidate species (Supplemental Table 1).
Th e extent of the chromosome-number variation found in switchgrass is illustrated by the long list of veg-etative chromosome numbers (2n) given in its description in the most recent Flora of North America: 18, 21, 25, 30, 32, 35, 36, 54–60, 67–72, 74, 77, 90, 108 (Barkworth et al., 2003). Th e majority of these have been confi rmed by con-sultation of the primary literature (Supplemental Table 2). With a base chromosome number of 9, the species-wide range in ploidy levels found in natural populations is diploid (2X) to duodecaploid (12X) (Nielsen, 1944). Aneuploid counts have been reported sporadically in the older literature (Brown, 1948; Barnett and Carver, 1967; Brunken and Estes, 1975). Populations containing plants of multiple ploidies were regularly discovered (Church, 1940; Nielsen, 1944; McMillan and Weiler, 1959; Porter, 1966). In the most extensive cytological survey of chromo-some number variation in switchgrass to date, McMillan and Weiler (1959) counted chromosomes in pollen mother cells from clones originating from 43 populations span-ning the central Midwest, from southern Canada to north-ern Texas. Of the 29 populations where they sampled more than two plants, 31% contained plants from three ploidy levels (2n = 4X = 36 chromosomes; 6X = 54; 8X = 72), 31% with two, and 38% with one (either 2n = 36 or 72). Th e pat-tern of chromosome number variation that was revealed by all of these studies was eventually incorporated in the descriptions of ecotypes in switchgrass: it was determined that the lowland type is exclusively tetraploid, whereas the upland type can vary in ploidy (4X, 6X, and 8X), both within and among populations (Porter, 1966).
Cultivars appear to refl ect their ecotype of origin, gen-erally being described as tetraploid, hexaploid, octoploid, or some combination of these. Th erefore, particularly in the cultivars derived from upland populations, the chro-mosome number of individual clones can vary. A survey of the cytogenetic information available for the primarily upland cultivars included in this study supports this: dif-ferent authors give diff erent chromosome numbers for the same cultivar, usually based on meiotic chromosome counts in pollen mother cells or mitotic counts in shoot or root meristematic cells from a few individual plants (Table
1). In some cases, ploidy is estimated by fl ow cytometry, which provides a measure of the nuclear DNA content in leaf cells, without any chromosome count data to confi rm the assigned ploidy level (Hultquist et al., 1996; Casler et al., 2006). Th is practice has lead to some confusion in the past, particularly with the identifi cation of hexaploids versus octoploids (Wullschleger et al., 1996), and also has required caveats about the potential for the presence of aneuploids and hexaploids (as opposed to octoploids) in the germplasm being characterized (Casler et al., 2006).
In polyploids, the copy number of functional poly-morphisms (i.e., allele dosage) may be an important fac-tor underlying trait variation. In addition, switchgrass is an outcrossing, highly heterozygous species. To deal with potentially 16 diff erent alleles per locus, we are developing genetic markers that quantitatively score polymorphism frequency within an individual. However, to facilitate the application of the newest genotyping by sequencing technologies in highly diverse polyploid spe-cies, such as switchgrass and other perennial grasses, it will be highly advantageous to work initially with germ-plasm in which the copy-number of individual chromo-somes in the sequenced genomes is fully known. In this study we conduct a fl ow-cytometric survey of a core set of switchgrass cultivars and follow this with a cytologi-cal study of chromosome-number variation in a subset of this germplasm. We address the following questions:
1. What is the extent of genome-size variation within and
among switchgrass accessions?
2. How is this variation related to chromosome-number
variation?
3. Is fl ow cytometry an accurate predictor of chromosome
number?
Materials and Methods
Germplasm and CultivationAll seed and clones were provided by MDC, unless oth-erwise indicated in Table 2. All plants were grown in a greenhouse at Cornell University, Ithaca, NY, in Cornell potting mix, under ambient light conditions, watered as needed, and fertilized once weekly with 300 ppm 21–5–20 solution. Germination of seed was enhanced by incubation in damp soil in a 40°F cold room for 2 to 6 wk before transfer to the greenhouse.
Flow CytometryTh e protocol for the preparation of leaf samples for fl ow cytometry used in this study is based on that of Arumuga-nathan and Earle (1991), with various modifi cations. One leaf per plant was harvested the evening before or the morn-ing of the experiment and kept refrigerated until prepara-tion of samples. A 1 cm2 piece of leaf was fi nely chopped in 600 uL of MgSO
4 buff er solution (Solution “A”) in a Petri
dish kept on ice. Solution A is prepared fresh on the day of the experiment as follows (per sample): 585 μL MgSO
4
stock buff er [10 mmol L–1 MgSO4.7H
2O,50 mmol L–1 KCl,
132 THE PLANT GENOME NOVEMBER 2010 VOL. 3, NO. 3
5 mmol L–1 Hepes, pH adjusted to 8.0] + 0.6 mg DTT + 15 μL Triton X-100 solution (Sigma-Aldrich no. 93443). Th e resulting slurry was poured through a 30-μm fi lter [Partec CellTrics no.04-0042-2316]. Final volume of fi ltrate for each sample was adjusted to 425 μL. Two solutions were then added to each sample: 7.5 μL propidium iodide-RNase solution [5 μL PI (5 mg mL–1) + 0.25 μL RNase stock (100 mg mL–1) + 2.25 μL Solution A] and 5 μL Size Standard Solution. Th e size standard used for this experiment was Triploid Trout nuclei from BioSure, Inc. (Product no. 1014). Triploid trout was chosen as the size standard because it did not require additional chopping time during sample preparation, as a plant standard would, and its size was only slightly larger, but not overlapping, octoploid switchgrass, making it an appropriate standard for both tetraploids and octoploids. A stock solution was made fresh the day of the experiment as follows: 1 drop of standard cells + 150 μL Solution A (enough for 30 samples). Samples were kept in a light-protected cooler and transported to the fl ow cytom-eter. Th e samples were placed on the instrument within 2 h aft er completion of sample preparation.
Th e instrument used for the cultivar survey (Experi-ment 1) was a FACS Calibur (BD Biosciences, San Jose, CA), while subsequent work was performed on an LSRII (BD Biosciences). Th e stained nuclei samples were excited by a 488 nm laser. Propidium iodide fl uorescence was measured with a 610/20 nm band pass fi lter and dou-blets were excluded using a linear PI fl uorescence area and width plot. Th e order that samples were run on the instrument was randomized.
Genome sizes were calculated for all samples for which the numbers of both trout standard nuclei and plant nuclei exceeded 500 (in the majority of samples, these numbers exceeded 1000). Th e genome size of the triploid trout standard is 7.8 pg DNA (Biosure, 2010), so the formula used to calculate genome size in switchgrass was (mean fl uorescence
plant nuclei/mean
fl uorescencestd nuclei
) × 7.8. Genome size data were ana-lyzed using the SAS statistical soft ware (SAS Institute, 2002) general linear models procedure (Proc GLM) to examine the eff ects of ploidy, experimental block, and cultivar.
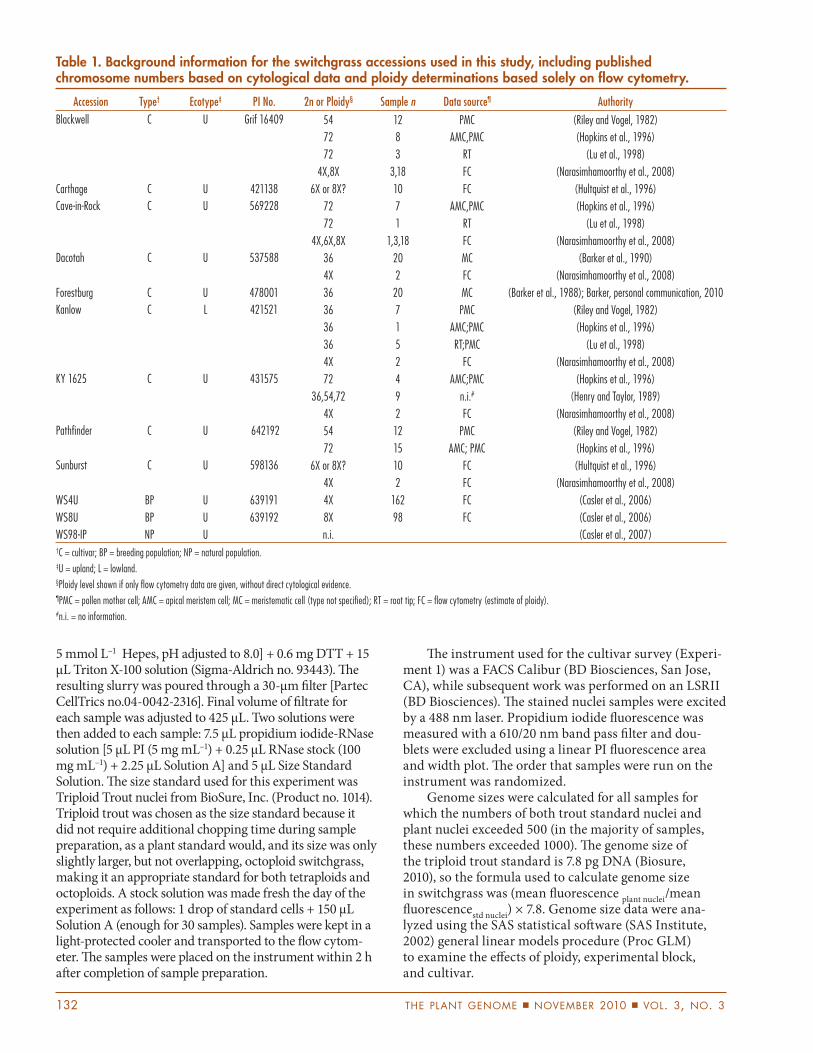
Table 1. Background information for the switchgrass accessions used in this study, including published chromosome numbers based on cytological data and ploidy determinations based solely on fl ow cytometry.
Accession Type† Ecotype‡ PI No. 2n or Ploidy§ Sample n Data source¶ Authority
Blackwell C U Grif 16409 54 12 PMC (Riley and Vogel, 1982)
72 8 AMC,PMC (Hopkins et al., 1996)
72 3 RT (Lu et al., 1998)
4X,8X 3,18 FC (Narasimhamoorthy et al., 2008)
Carthage C U 421138 6X or 8X? 10 FC (Hultquist et al., 1996)
Cave-in-Rock C U 569228 72 7 AMC,PMC (Hopkins et al., 1996)
72 1 RT (Lu et al., 1998)
4X,6X,8X 1,3,18 FC (Narasimhamoorthy et al., 2008)
Dacotah C U 537588 36 20 MC (Barker et al., 1990)
4X 2 FC (Narasimhamoorthy et al., 2008)
Forestburg C U 478001 36 20 MC (Barker et al., 1988); Barker, personal communication, 2010
Kanlow C L 421521 36 7 PMC (Riley and Vogel, 1982)
36 1 AMC;PMC (Hopkins et al., 1996)
36 5 RT;PMC (Lu et al., 1998)
4X 2 FC (Narasimhamoorthy et al., 2008)
KY 1625 C U 431575 72 4 AMC;PMC (Hopkins et al., 1996)
36,54,72 9 n.i.# (Henry and Taylor, 1989)
4X 2 FC (Narasimhamoorthy et al., 2008)
Pathfi nder C U 642192 54 12 PMC (Riley and Vogel, 1982)
72 15 AMC; PMC (Hopkins et al., 1996)
Sunburst C U 598136 6X or 8X? 10 FC (Hultquist et al., 1996)
4X 2 FC (Narasimhamoorthy et al., 2008)
WS4U BP U 639191 4X 162 FC (Casler et al., 2006)
WS8U BP U 639192 8X 98 FC (Casler et al., 2006)
WS98-IP NP U n.i. (Casler et al., 2007)†C = cultivar; BP = breeding population; NP = natural population.‡U = upland; L = lowland. §Ploidy level shown if only fl ow cytometry data are given, without direct cytological evidence.¶PMC = pollen mother cell; AMC = apical meristem cell; MC = meristematic cell (type not specifi ed); RT = root tip; FC = fl ow cytometry (estimate of ploidy).#n.i. = no information.
COSTICH ET AL.: GENOME-SIZE VARIATION IN SWITCHGRASS 133
Cytological Preparation and MicroscopyRoot tips for cytogenetics were harvested multiple times over the course of 6 mo from greenhouse-grown plants that had their roots cut back and were transplanted into wet vermiculite. Th ey were left for about 2 wk on the bench in the greenhouse to allow for root re-growth. Th e tips were then removed from the new, actively growing roots and given a 24-hour cold water pretreatment before fi xing in 3:1 ethanol/glacial acetic acid. Root tips were stained with 1% carmine in 45% acetic acid following squash preparation. Photomicrographs were taken with an Olympus DP71 cam-era. For more details, see the protocol described at the Kan-sas State University Wheat Genetic and Genomic Resources Center website (http://www.k-state.edu/wgrc/Protocols/labbook.html [verifi ed 6 Oct. 2010]).
Fluorescence in situ hybridization analysis was performed using clone pTa71 derived from common wheat, Triticum aestivum L. Clone pTa71 is a 9 kb EcoRI fragment of the 18S-25S rDNA containing the coding sequences of the 18S, 5.8S, and 25S rRNA genes and the intergenic spacer sequence (Gerlach and Bedbrook, 1979). To generate a FISH probe, pTa71 was labeled by nick translation with rhodamine-6 dUTP according to the manufacturer’s protocol (Roche Applied Sci-ence, Indianapolis, IN). Hybridization conditions and post-hybridization washes were performed according to Zhang et al. (2001). Chromosomes were counterstained with 4’, 6 diamidino-2-phenylindol (DAPI). Slides were analyzed with an epifl uorescence Zeiss Axioplan 2 microscope. Images were captured with a SPOT 2.1 CCD (charge coupled device) camera (Diagnostic Instruments, Inc., Sterling Heights, MI) and processed with Photoshop v5.5 soft ware (Adobe Systems, San Jose, CA).
Image AnalysisImages of metaphase chromosome spreads were examined by three people (DEC, BF, MJS), using two methods: (i) manual counts from images and (ii) automated counts using ImageJ (NIH, Bethesda, MD) soft ware. Images were processed with ImageJ as follows: Raw images were converted to grayscale, then converted to black and white threshold images. When necessary, cellular debris was eliminated from threshold images to allow accurate count-ing. In addition, chromosomes that laid over or touched other chromosomes were separated by clearing pixels between them to allow accurate counting. Automated chromosome counts were generated using the Analyze Particles function and tracings were outputted as num-bered ROIs (regions of interest). For quality control, all automated counts were compared against raw images and reiterated if they did not agree. Final chromosome count outlines were then overlaid on raw images.
Two sets of counts were generated, and the cases where the counts were nonconcordant were re-examined by DEC and MJS to determine what the discrepancies were. If an image was deemed too ambiguous, for exam-ple, due to overlapping chromosomes or pre-metaphase stage, it was discarded. For this study, we applied a high level of quality control—a total of 180 images were exam-ined, with only 136 used in the subsequent analysis.
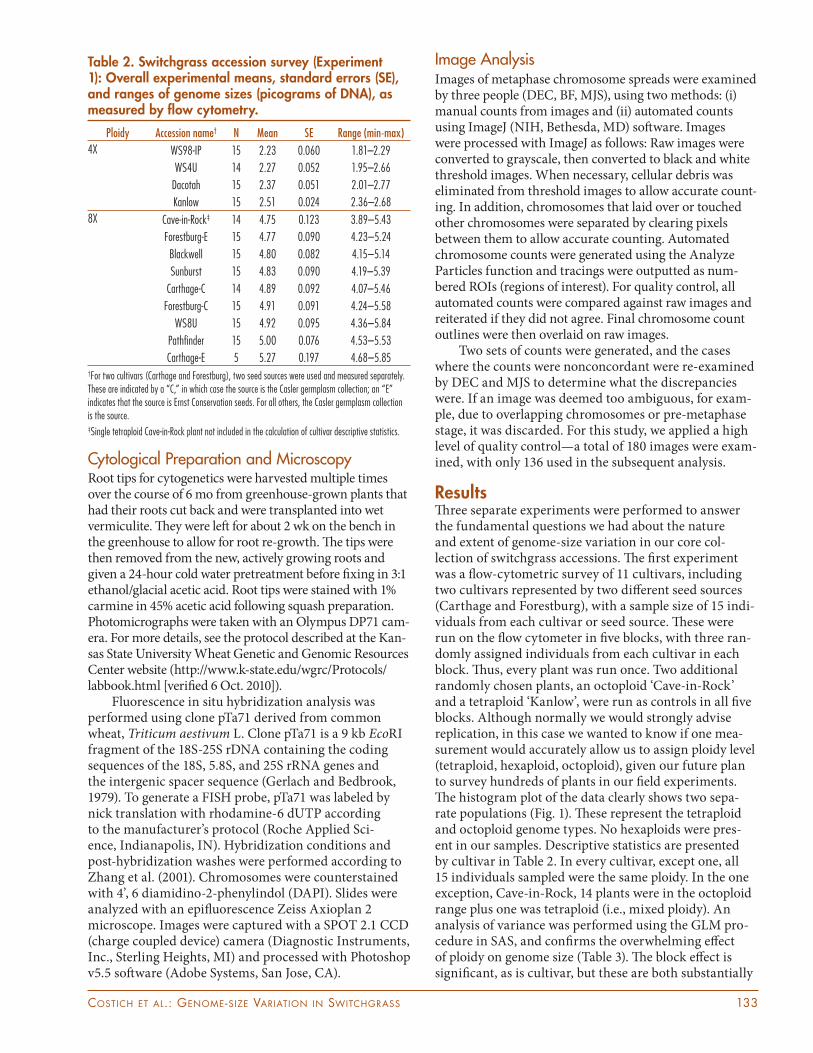
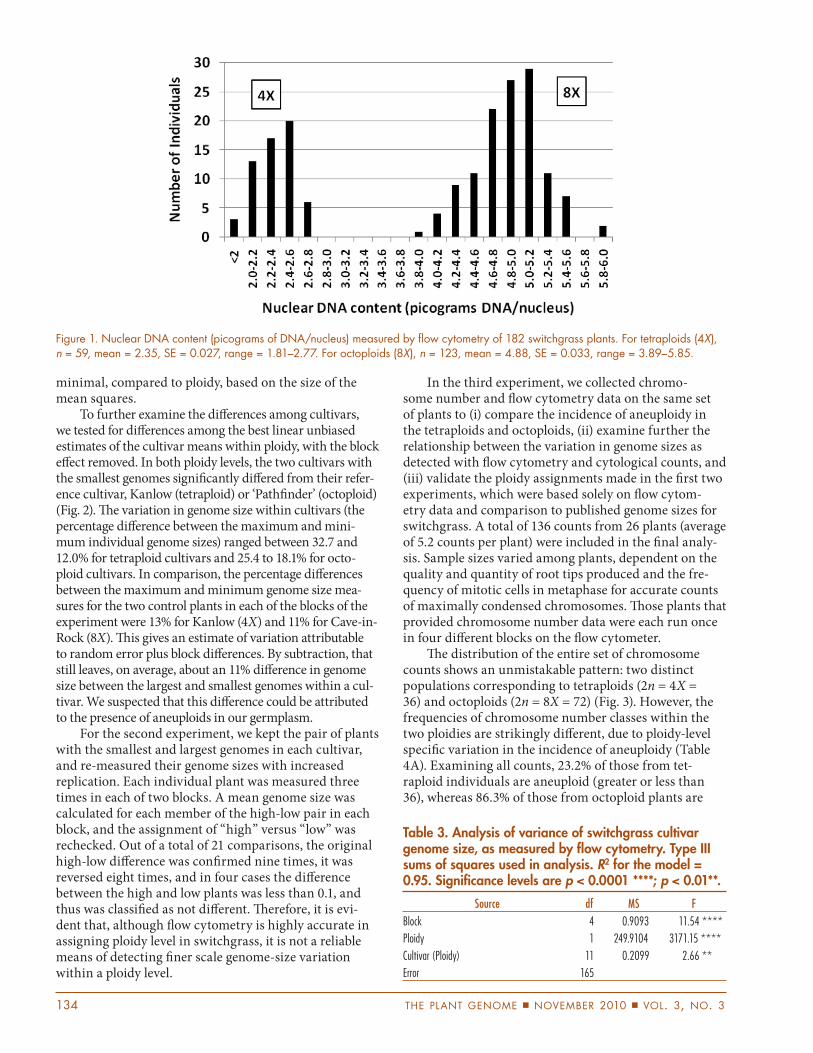
ResultsTh ree separate experiments were performed to answer the fundamental questions we had about the nature and extent of genome-size variation in our core col-lection of switchgrass accessions. Th e fi rst experiment was a fl ow-cytometric survey of 11 cultivars, including two cultivars represented by two diff erent seed sources (Carthage and Forestburg), with a sample size of 15 indi-viduals from each cultivar or seed source. Th ese were run on the fl ow cytometer in fi ve blocks, with three ran-domly assigned individuals from each cultivar in each block. Th us, every plant was run once. Two additional randomly chosen plants, an octoploid ‘Cave-in-Rock’ and a tetraploid ‘Kanlow’, were run as controls in all fi ve blocks. Although normally we would strongly advise replication, in this case we wanted to know if one mea-surement would accurately allow us to assign ploidy level (tetraploid, hexaploid, octoploid), given our future plan to survey hundreds of plants in our fi eld experiments. Th e histogram plot of the data clearly shows two sepa-rate populations (Fig. 1). Th ese represent the tetraploid and octoploid genome types. No hexaploids were pres-ent in our samples. Descriptive statistics are presented by cultivar in Table 2. In every cultivar, except one, all 15 individuals sampled were the same ploidy. In the one exception, Cave-in-Rock, 14 plants were in the octoploid range plus one was tetraploid (i.e., mixed ploidy). An analysis of variance was performed using the GLM pro-cedure in SAS, and confi rms the overwhelming eff ect of ploidy on genome size (Table 3). Th e block eff ect is signifi cant, as is cultivar, but these are both substantially
Table 2. Switchgrass accession survey (Experiment 1): Overall experimental means, standard errors (SE), and ranges of genome sizes (picograms of DNA), as measured by fl ow cytometry.
Ploidy Accession name† N Mean SE Range (min-max)
4X WS98-IP 15 2.23 0.060 1.81–2.29
WS4U 14 2.27 0.052 1.95–2.66
Dacotah 15 2.37 0.051 2.01–2.77
Kanlow 15 2.51 0.024 2.36–2.68
8X Cave-in-Rock‡ 14 4.75 0.123 3.89–5.43
Forestburg-E 15 4.77 0.090 4.23–5.24
Blackwell 15 4.80 0.082 4.15–5.14
Sunburst 15 4.83 0.090 4.19–5.39
Carthage-C 14 4.89 0.092 4.07–5.46
Forestburg-C 15 4.91 0.091 4.24–5.58
WS8U 15 4.92 0.095 4.36–5.84
Pathfi nder 15 5.00 0.076 4.53–5.53
Carthage-E 5 5.27 0.197 4.68–5.85†For two cultivars (Carthage and Forestburg), two seed sources were used and measured separately. These are indicated by a “C,” in which case the source is the Casler germplasm collection; an “E” indicates that the source is Ernst Conservation seeds. For all others, the Casler germplasm collection is the source.‡Single tetraploid Cave-in-Rock plant not included in the calculation of cultivar descriptive statistics.
134 THE PLANT GENOME NOVEMBER 2010 VOL. 3, NO. 3
minimal, compared to ploidy, based on the size of the mean squares.
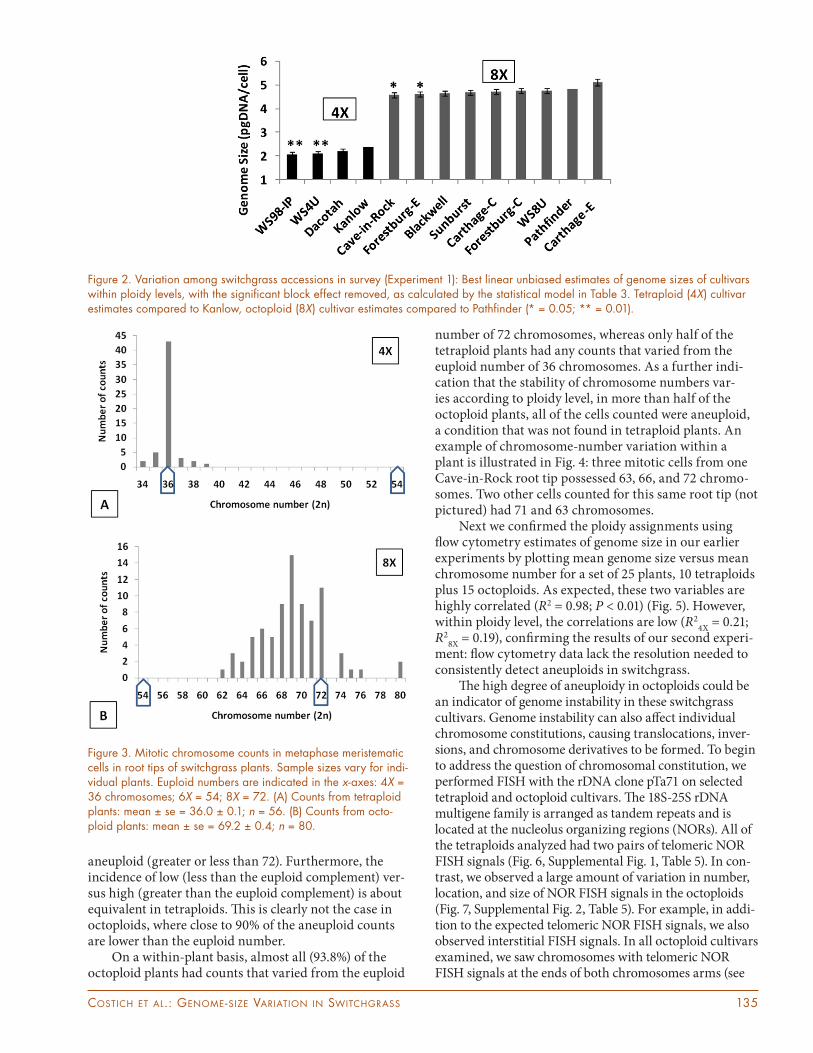
To further examine the diff erences among cultivars, we tested for diff erences among the best linear unbiased estimates of the cultivar means within ploidy, with the block eff ect removed. In both ploidy levels, the two cultivars with the smallest genomes signifi cantly diff ered from their refer-ence cultivar, Kanlow (tetraploid) or ‘Pathfi nder’ (octoploid) (Fig. 2). Th e variation in genome size within cultivars (the percentage diff erence between the maximum and mini-mum individual genome sizes) ranged between 32.7 and 12.0% for tetraploid cultivars and 25.4 to 18.1% for octo-ploid cultivars. In comparison, the percentage diff erences between the maximum and minimum genome size mea-sures for the two control plants in each of the blocks of the experiment were 13% for Kanlow (4X) and 11% for Cave-in-Rock (8X). Th is gives an estimate of variation attributable to random error plus block diff erences. By subtraction, that still leaves, on average, about an 11% diff erence in genome size between the largest and smallest genomes within a cul-tivar. We suspected that this diff erence could be attributed to the presence of aneuploids in our germplasm.
For the second experiment, we kept the pair of plants with the smallest and largest genomes in each cultivar, and re-measured their genome sizes with increased replication. Each individual plant was measured three times in each of two blocks. A mean genome size was calculated for each member of the high-low pair in each block, and the assignment of “high” versus “low” was rechecked. Out of a total of 21 comparisons, the original high-low diff erence was confi rmed nine times, it was reversed eight times, and in four cases the diff erence between the high and low plants was less than 0.1, and thus was classifi ed as not diff erent. Th erefore, it is evi-dent that, although fl ow cytometry is highly accurate in assigning ploidy level in switchgrass, it is not a reliable means of detecting fi ner scale genome-size variation within a ploidy level.
In the third experiment, we collected chromo-some number and fl ow cytometry data on the same set of plants to (i) compare the incidence of aneuploidy in the tetraploids and octoploids, (ii) examine further the relationship between the variation in genome sizes as detected with fl ow cytometry and cytological counts, and (iii) validate the ploidy assignments made in the fi rst two experiments, which were based solely on fl ow cytom-etry data and comparison to published genome sizes for switchgrass. A total of 136 counts from 26 plants (average of 5.2 counts per plant) were included in the fi nal analy-sis. Sample sizes varied among plants, dependent on the quality and quantity of root tips produced and the fre-quency of mitotic cells in metaphase for accurate counts of maximally condensed chromosomes. Th ose plants that provided chromosome number data were each run once in four diff erent blocks on the fl ow cytometer.
Th e distribution of the entire set of chromosome counts shows an unmistakable pattern: two distinct populations corresponding to tetraploids (2n = 4X = 36) and octoploids (2n = 8X = 72) (Fig. 3). However, the frequencies of chromosome number classes within the two ploidies are strikingly diff erent, due to ploidy-level specifi c variation in the incidence of aneuploidy (Table 4A). Examining all counts, 23.2% of those from tet-raploid individuals are aneuploid (greater or less than 36), whereas 86.3% of those from octoploid plants are
Figure 1. Nuclear DNA content (picograms of DNA/nucleus) measured by fl ow cytometry of 182 switchgrass plants. For tetraploids (4X), n = 59, mean = 2.35, SE = 0.027, range = 1.81–2.77. For octoploids (8X), n = 123, mean = 4.88, SE = 0.033, range = 3.89–5.85.
Table 3. Analysis of variance of switchgrass cultivar genome size, as measured by fl ow cytometry. Type III sums of squares used in analysis. R2 for the model = 0.95. Signifi cance levels are p < 0.0001 ****; p < 0.01**.
Source df MS F
Block 4 0.9093 11.54 ****
Ploidy 1 249.9104 3171.15 ****
Cultivar (Ploidy) 11 0.2099 2.66 **
Error 165
COSTICH ET AL.: GENOME-SIZE VARIATION IN SWITCHGRASS 135
aneuploid (greater or less than 72). Furthermore, the incidence of low (less than the euploid complement) ver-sus high (greater than the euploid complement) is about equivalent in tetraploids. Th is is clearly not the case in octoploids, where close to 90% of the aneuploid counts are lower than the euploid number.
On a within-plant basis, almost all (93.8%) of the octoploid plants had counts that varied from the euploid
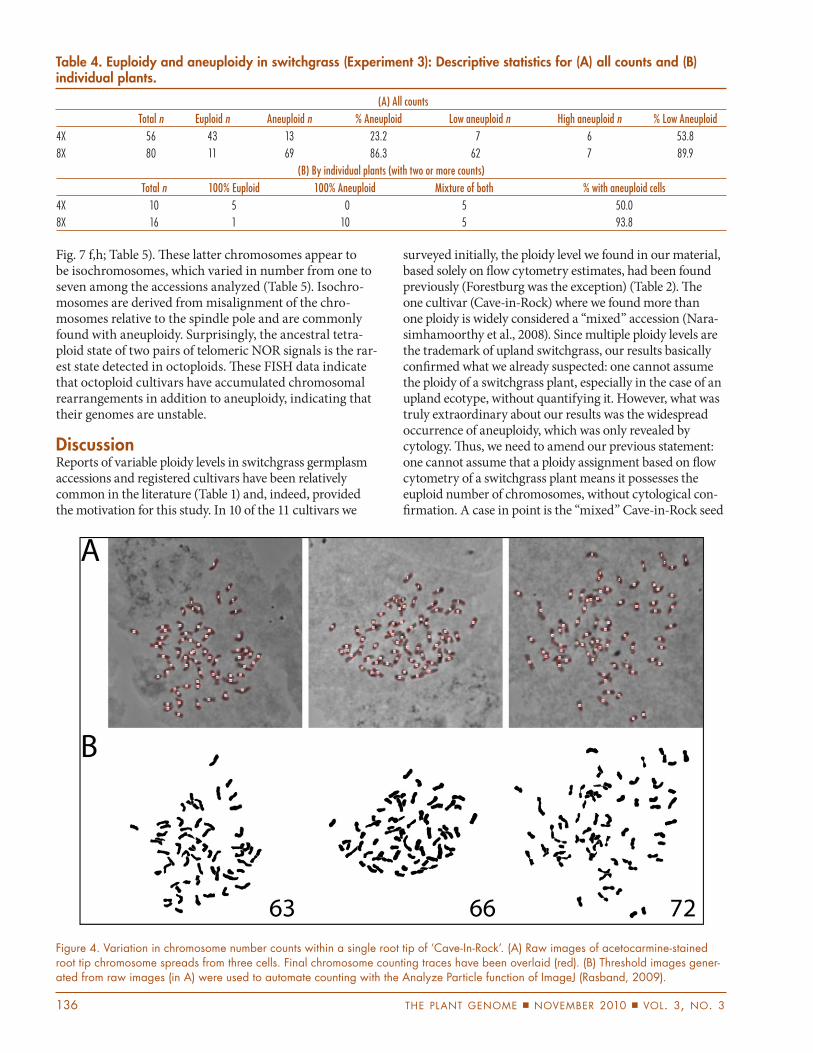
number of 72 chromosomes, whereas only half of the tetraploid plants had any counts that varied from the euploid number of 36 chromosomes. As a further indi-cation that the stability of chromosome numbers var-ies according to ploidy level, in more than half of the octoploid plants, all of the cells counted were aneuploid, a condition that was not found in tetraploid plants. An example of chromosome-number variation within a plant is illustrated in Fig. 4: three mitotic cells from one Cave-in-Rock root tip possessed 63, 66, and 72 chromo-somes. Two other cells counted for this same root tip (not pictured) had 71 and 63 chromosomes.
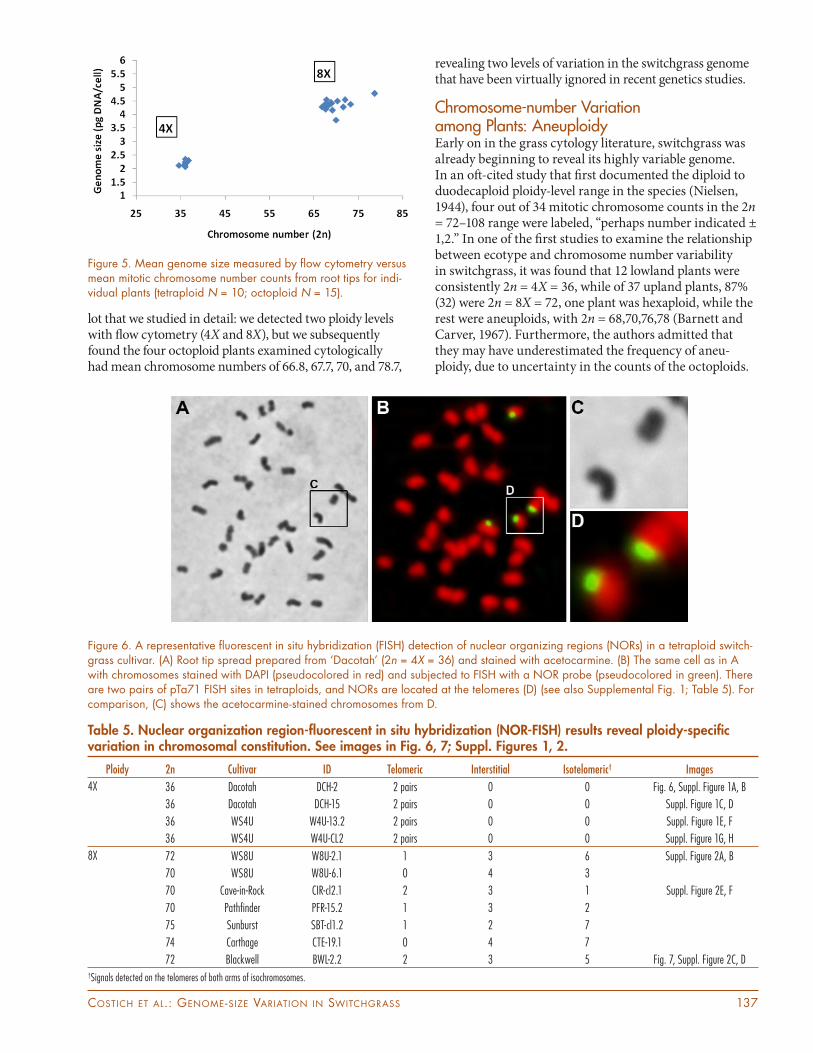
Next we confi rmed the ploidy assignments using fl ow cytometry estimates of genome size in our earlier experiments by plotting mean genome size versus mean chromosome number for a set of 25 plants, 10 tetraploids plus 15 octoploids. As expected, these two variables are highly correlated (R2 = 0.98; P < 0.01) (Fig. 5). However, within ploidy level, the correlations are low (R2
4X = 0.21;
R28X
= 0.19), confi rming the results of our second experi-ment: fl ow cytometry data lack the resolution needed to consistently detect aneuploids in switchgrass.
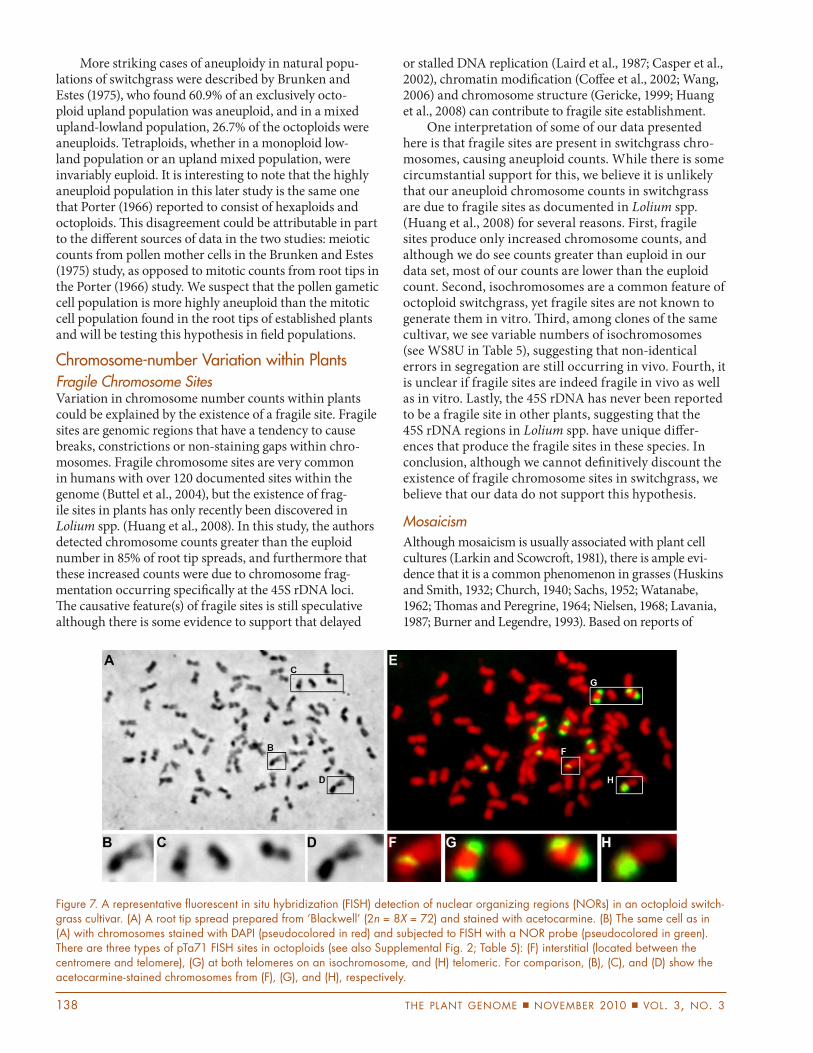
Th e high degree of aneuploidy in octoploids could be an indicator of genome instability in these switchgrass cultivars. Genome instability can also aff ect individual chromosome constitutions, causing translocations, inver-sions, and chromosome derivatives to be formed. To begin to address the question of chromosomal constitution, we performed FISH with the rDNA clone pTa71 on selected tetraploid and octoploid cultivars. Th e 18S-25S rDNA multigene family is arranged as tandem repeats and is located at the nucleolus organizing regions (NORs). All of the tetraploids analyzed had two pairs of telomeric NOR FISH signals (Fig. 6, Supplemental Fig. 1, Table 5). In con-trast, we observed a large amount of variation in number, location, and size of NOR FISH signals in the octoploids (Fig. 7, Supplemental Fig. 2, Table 5). For example, in addi-tion to the expected telomeric NOR FISH signals, we also observed interstitial FISH signals. In all octoploid cultivars examined, we saw chromosomes with telomeric NOR FISH signals at the ends of both chromosomes arms (see
Figure 2. Variation among switchgrass accessions in survey (Experiment 1): Best linear unbiased estimates of genome sizes of cultivars within ploidy levels, with the signifi cant block effect removed, as calculated by the statistical model in Table 3. Tetraploid (4X) cultivar estimates compared to Kanlow, octoploid (8X) cultivar estimates compared to Pathfi nder (* = 0.05; ** = 0.01).
Figure 3. Mitotic chromosome counts in metaphase meristematic cells in root tips of switchgrass plants. Sample sizes vary for indi-vidual plants. Euploid numbers are indicated in the x-axes: 4X = 36 chromosomes; 6X = 54; 8X = 72. (A) Counts from tetraploid plants: mean ± se = 36.0 ± 0.1; n = 56. (B) Counts from octo-ploid plants: mean ± se = 69.2 ± 0.4; n = 80.
136 THE PLANT GENOME NOVEMBER 2010 VOL. 3, NO. 3
Fig. 7 f,h; Table 5). Th ese latter chromosomes appear to be isochromosomes, which varied in number from one to seven among the accessions analyzed (Table 5). Isochro-mosomes are derived from misalignment of the chro-mosomes relative to the spindle pole and are commonly found with aneuploidy. Surprisingly, the ancestral tetra-ploid state of two pairs of telomeric NOR signals is the rar-est state detected in octoploids. Th ese FISH data indicate that octoploid cultivars have accumulated chromosomal rearrangements in addition to aneuploidy, indicating that their genomes are unstable.
DiscussionReports of variable ploidy levels in switchgrass germplasm accessions and registered cultivars have been relatively common in the literature (Table 1) and, indeed, provided the motivation for this study. In 10 of the 11 cultivars we
surveyed initially, the ploidy level we found in our material, based solely on fl ow cytometry estimates, had been found previously (Forestburg was the exception) (Table 2). Th e one cultivar (Cave-in-Rock) where we found more than one ploidy is widely considered a “mixed” accession (Nara-simhamoorthy et al., 2008). Since multiple ploidy levels are the trademark of upland switchgrass, our results basically confi rmed what we already suspected: one cannot assume the ploidy of a switchgrass plant, especially in the case of an upland ecotype, without quantifying it. However, what was truly extraordinary about our results was the widespread occurrence of aneuploidy, which was only revealed by cytology. Th us, we need to amend our previous statement: one cannot assume that a ploidy assignment based on fl ow cytometry of a switchgrass plant means it possesses the euploid number of chromosomes, without cytological con-fi rmation. A case in point is the “mixed” Cave-in-Rock seed
Table 4. Euploidy and aneuploidy in switchgrass (Experiment 3): Descriptive statistics for (A) all counts and (B) individual plants.
(A) All counts
Total n Euploid n Aneuploid n % Aneuploid Low aneuploid n High aneuploid n % Low Aneuploid
4X 56 43 13 23.2 7 6 53.8
8X 80 11 69 86.3 62 7 89.9
(B) By individual plants (with two or more counts)
Total n 100% Euploid 100% Aneuploid Mixture of both % with aneuploid cells
4X 10 5 0 5 50.0
8X 16 1 10 5 93.8
Figure 4. Variation in chromosome number counts within a single root tip of ‘Cave-In-Rock’. (A) Raw images of acetocarmine-stained root tip chromosome spreads from three cells. Final chromosome counting traces have been overlaid (red). (B) Threshold images gener-ated from raw images (in A) were used to automate counting with the Analyze Particle function of ImageJ (Rasband, 2009).
COSTICH ET AL.: GENOME-SIZE VARIATION IN SWITCHGRASS 137
lot that we studied in detail: we detected two ploidy levels with fl ow cytometry (4X and 8X), but we subsequently found the four octoploid plants examined cytologically had mean chromosome numbers of 66.8, 67.7, 70, and 78.7,
revealing two levels of variation in the switchgrass genome that have been virtually ignored in recent genetics studies.
Chromosome-number Variation among Plants: AneuploidyEarly on in the grass cytology literature, switchgrass was already beginning to reveal its highly variable genome. In an oft -cited study that fi rst documented the diploid to duodecaploid ploidy-level range in the species (Nielsen, 1944), four out of 34 mitotic chromosome counts in the 2n = 72–108 range were labeled, “perhaps number indicated ± 1,2.” In one of the fi rst studies to examine the relationship between ecotype and chromosome number variability in switchgrass, it was found that 12 lowland plants were consistently 2n = 4X = 36, while of 37 upland plants, 87% (32) were 2n = 8X = 72, one plant was hexaploid, while the rest were aneuploids, with 2n = 68,70,76,78 (Barnett and Carver, 1967). Furthermore, the authors admitted that they may have underestimated the frequency of aneu-ploidy, due to uncertainty in the counts of the octoploids.
Table 5. Nuclear organization region-fl uorescent in situ hybridization (NOR-FISH) results reveal ploidy-specifi c variation in chromosomal constitution. See images in Fig. 6, 7; Suppl. Figures 1, 2.
Ploidy 2n Cultivar ID Telomeric Interstitial Isotelomeric† Images
4X 36 Dacotah DCH-2 2 pairs 0 0 Fig. 6, Suppl. Figure 1A, B
36 Dacotah DCH-15 2 pairs 0 0 Suppl. Figure 1C, D
36 WS4U W4U-13.2 2 pairs 0 0 Suppl. Figure 1E, F
36 WS4U W4U-CL2 2 pairs 0 0 Suppl. Figure 1G, H
8X 72 WS8U W8U-2.1 1 3 6 Suppl. Figure 2A, B
70 WS8U W8U-6.1 0 4 3
70 Cave-in-Rock CIR-cl2.1 2 3 1 Suppl. Figure 2E, F
70 Pathfi nder PFR-15.2 1 3 2
75 Sunburst SBT-cl1.2 1 2 7
74 Carthage CTE-19.1 0 4 7
72 Blackwell BWL-2.2 2 3 5 Fig. 7, Suppl. Figure 2C, D†Signals detected on the telomeres of both arms of isochromosomes.
Figure 5. Mean genome size measured by fl ow cytometry versus mean mitotic chromosome number counts from root tips for indi-vidual plants (tetraploid N = 10; octoploid N = 15).
Figure 6. A representative fl uorescent in situ hybridization (FISH) detection of nuclear organizing regions (NORs) in a tetraploid switch-grass cultivar. (A) Root tip spread prepared from ‘Dacotah’ (2n = 4X = 36) and stained with acetocarmine. (B) The same cell as in A with chromosomes stained with DAPI (pseudocolored in red) and subjected to FISH with a NOR probe (pseudocolored in green). There are two pairs of pTa71 FISH sites in tetraploids, and NORs are located at the telomeres (D) (see also Supplemental Fig. 1; Table 5). For comparison, (C) shows the acetocarmine-stained chromosomes from D.
138 THE PLANT GENOME NOVEMBER 2010 VOL. 3, NO. 3
More striking cases of aneuploidy in natural popu-lations of switchgrass were described by Brunken and Estes (1975), who found 60.9% of an exclusively octo-ploid upland population was aneuploid, and in a mixed upland-lowland population, 26.7% of the octoploids were aneuploids. Tetraploids, whether in a monoploid low-land population or an upland mixed population, were invariably euploid. It is interesting to note that the highly aneuploid population in this later study is the same one that Porter (1966) reported to consist of hexaploids and octoploids. Th is disagreement could be attributable in part to the diff erent sources of data in the two studies: meiotic counts from pollen mother cells in the Brunken and Estes (1975) study, as opposed to mitotic counts from root tips in the Porter (1966) study. We suspect that the pollen gametic cell population is more highly aneuploid than the mitotic cell population found in the root tips of established plants and will be testing this hypothesis in fi eld populations.
Chromosome-number Variation within PlantsFragile Chromosome SitesVariation in chromosome number counts within plants could be explained by the existence of a fragile site. Fragile sites are genomic regions that have a tendency to cause breaks, constrictions or non-staining gaps within chro-mosomes. Fragile chromosome sites are very common in humans with over 120 documented sites within the genome (Buttel et al., 2004), but the existence of frag-ile sites in plants has only recently been discovered in Lolium spp. (Huang et al., 2008). In this study, the authors detected chromosome counts greater than the euploid number in 85% of root tip spreads, and furthermore that these increased counts were due to chromosome frag-mentation occurring specifi cally at the 45S rDNA loci. Th e causative feature(s) of fragile sites is still speculative although there is some evidence to support that delayed
or stalled DNA replication (Laird et al., 1987; Casper et al., 2002), chromatin modifi cation (Coff ee et al., 2002; Wang, 2006) and chromosome structure (Gericke, 1999; Huang et al., 2008) can contribute to fragile site establishment.
One interpretation of some of our data presented here is that fragile sites are present in switchgrass chro-mosomes, causing aneuploid counts. While there is some circumstantial support for this, we believe it is unlikely that our aneuploid chromosome counts in switchgrass are due to fragile sites as documented in Lolium spp. (Huang et al., 2008) for several reasons. First, fragile sites produce only increased chromosome counts, and although we do see counts greater than euploid in our data set, most of our counts are lower than the euploid count. Second, isochromosomes are a common feature of octoploid switchgrass, yet fragile sites are not known to generate them in vitro. Th ird, among clones of the same cultivar, we see variable numbers of isochromosomes (see WS8U in Table 5), suggesting that non-identical errors in segregation are still occurring in vivo. Fourth, it is unclear if fragile sites are indeed fragile in vivo as well as in vitro. Lastly, the 45S rDNA has never been reported to be a fragile site in other plants, suggesting that the 45S rDNA regions in Lolium spp. have unique diff er-ences that produce the fragile sites in these species. In conclusion, although we cannot defi nitively discount the existence of fragile chromosome sites in switchgrass, we believe that our data do not support this hypothesis.
Mosaicism
Although mosaicism is usually associated with plant cell cultures (Larkin and Scowcroft , 1981), there is ample evi-dence that it is a common phenomenon in grasses (Huskins and Smith, 1932; Church, 1940; Sachs, 1952; Watanabe, 1962; Th omas and Peregrine, 1964; Nielsen, 1968; Lavania, 1987; Burner and Legendre, 1993). Based on reports of
Figure 7. A representative fl uorescent in situ hybridization (FISH) detection of nuclear organizing regions (NORs) in an octoploid switch-grass cultivar. (A) A root tip spread prepared from ‘Blackwell’ (2n = 8X = 72) and stained with acetocarmine. (B) The same cell as in (A) with chromosomes stained with DAPI (pseudocolored in red) and subjected to FISH with a NOR probe (pseudocolored in green). There are three types of pTa71 FISH sites in octoploids (see also Supplemental Fig. 2; Table 5): (F) interstitial (located between the centromere and telomere), (G) at both telomeres on an isochromosome, and (H) telomeric. For comparison, (B), (C), and (D) show the acetocarmine-stained chromosomes from (F), (G), and (H), respectively.
COSTICH ET AL.: GENOME-SIZE VARIATION IN SWITCHGRASS 139
mosaicism in root tips available at the time, Church (1940) proposed that through this mechanism, autopolyploids could be produced vegetatively. Th e fi rst report of mosaics in upland switchgrass roots (cells with chromosome counts of 54, 72, 90 in two root tips and 54, 90, 108 in one root tip) came much later (Porter, 1966). Th e chromosome-count variation we observed could be attributed to mosaicism; however, more data are needed to unequivocally support its occurrence in switchgrass. Mosaicism is still a largely unex-plored, but potentially widespread, condition in polyploids in natural populations. Th e phenomenon of mitotic fi delity in allopolyploids has been examined in detail only recently, in the model genus Arabidopsis, where mosaicism was found to be prevalent in two tetraploids, A. suecica and A. arenosa. However, stable and novel cytotypes with chromo-some numbers other than euploid have yet to be discovered (Wright et al., 2009).
The Road to Genome StabilitySpeciation in plants oft en occurs aft er global changes to the genome, such as polyploidization or hybridization (as reviewed by Hegarty and Hiscock [2007] and Sobel et al. [2010]). Both types of global genomic change induce instability into a genome, thereby causing changes in gene expression, meiotic pairing disorders, and altered develop-mental patterns (Hegarty et al., 2008). Survival of the plant requires some measure of genome stabilization (Li and Ge, 2007; Sipiczki, 2008). For example, modern maize would not exist today had it not been for the dramatic diploidiza-tion event(s) that reorganized the allotetraploid genome, thereby allowing it to undergo regular, error-free meiosis (Gaut, 2001). Th is has been the case for many crop species.
Aneuploidy causes greater genome instability than polyploidy for organisms by adding or subtracting the gene dosage of a single chromosome to or from the euploid genome (Birchler et al., 2001; Fodde and Smits, 2002; Birchler, 2010). Aneuploidy is caused by segregation errors and nondisjunction during cell division via meiosis and/or mitosis. Some types of segregation errors generate chromosomal breaks and rearrangements (Griffi n, 1996), which can lead to speciation (Ramsey and Schemske, 1998). Here we use rDNA as a FISH probe to show that, not only are there structural rearrangements in octoploids, but the nature and number of the rearrangements diff er by individual examined. Th is is in stark contrast to the lack of chromosome rearrangements in tetraploids, where aneu-ploidy is low. Unlike reciprocal translocation that results in no net loss of genic material between daughter cells, aneuploidy will always present an unbalanced genic dis-tribution. Th e presence of extra or missing chromosomes, or segments, as in the case of isochromosomes, has been shown to cause changes in DNA methylation in cancer cells (Matzke et al., 1999; Matzke et al., 2003).
Switchgrass octoploids demonstrate a large amount of genome instability, as evidenced by the swarm of aneu-ploidy surrounding the euploid 72-chromosome count. Furthermore, we found that the range of chromosome counts surrounding the octoploids did not extend past
one haploid level. For instance, the lowest counts were close or at the septaploid (7X = 63) level and the high-est counts were at the nonaploid (9X = 81) level. It is not known if these odd-numbered ploidy levels represent some form of genome stability or a genome still in fl ux. Th e fact that the swarm is biased toward the ~7x end of the curve suggests that hexaploids could be produced through octoploid reduction, thereby improving the stability of the genome. Th eoretically, hexaploids could be produced via an intermating between tetraploid and octoploid, but a postfertilization incompatibility system prevents this (Martinez-Reyna and Vogel, 2002). It remains to be seen whether hexaploids can be produced through an alterna-tive mechanism, such as genome reduction.
Combining Flow Cytometry with Chromosome CountsAlthough this research focused exclusively on switchgrass, it is likely that these fi ndings will not be unique. Many perennial grasses have multiple and high ploidy levels, for example, Phalaris arundinacea L., reed canarygrass, is 4X to 6X, and Andropogon gerardii, big bluestem, has ploidy levels ranging from 6X to 9X (see Supplemental Table 1). In Pennisetum species, not only does the ploidy vary from 2X to 8X, but the base chromosome number varies from x = 5, to 7, 8, and 9 (Martel et al., 1997). Th e genome of modern sugarcane cultivars is characterized by both high ploidy lev-els and aneuploidy (Grivet and Arruda, 2001), two features it shares with switchgrass. In addition, the high ploidy states may provide a “genetic buff er” for aneuploidy. Based on the results presented here, we recommend that fl ow cytometry always be coupled with a method to determine chromo-some counts in a sample of individuals from the entire range of genome sizes found in the population under study, as the standard practice for characterizing switchgrass and other polyploid perennial grass cultivars in future germ-plasm characterization and breeding projects.
Phenotypic Consequences of AneuploidyPolyploidy and aneuploidy are usually deleterious to animals, causing the kind of genomic instability associ-ated with infertility, tumor formation, disease suscep-tibility and lethality (Matzke et al., 2003; Huettel et al., 2008; Torres et al., 2008). However, in plants, polyploidy is present in nearly 80% of all living plants, and nearly 100% of all plant lineages have undergone a paleopoly-ploidy event in their history (Otto and Whitton, 2000; Blanc and Wolfe, 2004). Recent studies on aneuploidy in plants have shown that it can occur without serious detriment to the plant, and can sometimes even enhance phenotypes (Henry et al., 2005; Henry et al., 2007; Huang et al., 2008). Detection and quantifi cation of the eff ects of these phenomena are clearly critical to any studies of the genetic basis of phenotypic traits in switchgrass, as well as its future as the primary biofeedstock for the biofuels industry. In a prescient comment in the germplasm regis-tration of KY 1625 switchgrass, Henry and Taylor (1989) noted, “Apparently, both polyploidy and aneuploidy …
140 THE PLANT GENOME NOVEMBER 2010 VOL. 3, NO. 3
may be present in this germplasm. Th is variability in chromosome number may account in part for the poor viable seed set.” All aspects of the life cycle of switchgrass are likely to be aff ected by genome size and structure.
Th e sugarcane species and hybrid complex (genus Saccharum) are perhaps the most genetically complex crop taxa in the world. Interspecifi c hybridization, mei-otic irregularities, multiple, high ploidy levels, aneu-ploidy, and chromosomal mosaicism are characteristics of this group (Burner and Legendre, 1993; Aljanabi, 1998; Cuadrado et al., 2004). Th e wild species, Saccharum spontaneum, shows the most similarities to switchgrass, with an extensive range of 2n chromosome numbers (40–128) and rampant aneuploidy. In a study of six cytotypes of this species, with 2n = 40, 42, 44, 54, 56, 72, consider-able morphological variation was detected among them, which was attributed to both numerical and structural diff erences among the chromosomes (Mehra and Sood, 1974). Th is will likely be the case with switchgrass cyto-types. Cuadrado et al. (2004) point out that the accumu-lation of numerical and structural chromosome changes in sugarcane is caused by the reliance on vegetative prop-agation, which allows for a bypass of the “meiotic fi lter.” Aneuploid switchgrass clones could likewise persist in prairies via vigorous vegetative growth and eventually be selected for breeding programs. Th e sugarcane genet-ics/genomics community has developed a diverse set of resources and complementary approaches that switch-grass workers should emulate in molecular cytogenetics (D’Hont, 2005), breeding (Burner and Legendre, 1994), tissue culture (Rajeswari et al., 2009), and mapping (Le Cunff et al., 2008). Rapid advances in the breeding of polyploid biofuel feedstocks, based on the molecular-genetic dissection of biomass characteristics and yield, will be predicated on the continual improvement of our understanding of the cytogenetics of these species.
AcknowledgmentsFlow cytometry support was provided by R.G. Getchell, Jim Smith and
Lavanya Gowri Sayam. Z. Zhang and F. Vermeylen gave statistical advice.
C. Th omas and K. Goodwin provided greenhouse support. M.A. Gore
provided comments on the manuscript. We thank them for their con-
tributions to this research. Th is research was funded by a United States
Department of Energy-Department of Agriculture Plant Feedstock
Genomics for Bioenergy Program grant (DE-A102-07ER64454).
ReferencesAljanabi, S.M. 1998. Genetics, phylogenetics, and comparative genetics of
Saccharum L., a polysomic polyploid Poales. Andropogoneae. Bio-
technol. Annu. Rev. 4:285–319.
Arumuganathan, K., and E. Earle. 1991. Estimation of nuclear DNA con-
tent of plants by fl ow cytometry. Plant Mol. Biol. Rep. 9:217–229.
Barker, R.E., R.J. Haas, E.T. Jacobson, and J.D. Berdahl. 1988. Registration
of “Forestburg” switchgrass. Crop Sci. 28:192–193.
Barker, R.E., R.J. Haas, J.D. Berdahl, and E.T. Jacobson. 1990. Registration
of “Dacotah” switchgrass. Crop Sci. 30:1158.
Barkworth, M.E., K.M. Capels, S. Long, and M.B. Piep (ed.) 2003. Mag-
noliophyta: Commelinidae (in part): Poaceae, part 2. Oxford Univ.
Press, New York.
Barnett, F.L., and R.F. Carver. 1967. Meiosis and pollen stainability in
switchgrass, Panicum virgatum L. Crop Sci. 7:301–304.
Biosure. 2010. Product Data Sheet. Available at https://biosure-best.
securesites.com/rpages/controls.htm (verifi ed 6 Oct. 2010). Biosure,
Grass Valley, CA.
Birchler, J.A. 2010. Refl ections on studies of gene expression in aneu-
ploids. Biochem. J. 426:119–123.
Birchler, J.A., U. Bhadra, M.P. Bhadra, and D.L. Auger. 2001. Dosage-
dependent gene regulation in multicellular eukaryotes: Implications
for dosage compensation, aneuploid syndromes, and quantitative
traits. Dev. Biol. 234:275–288.
Blanc, G., and K.H. Wolfe. 2004. Widespread paleopolyploidy in model
plant species inferred from age distributions of duplicate genes.
Plant Cell 16:1667–1678.
Brown, W.V. 1948. A cytological study in the Gramineae. Am. J. Bot.
35:382–395.
Brunken, J.N., and J.R. Estes. 1975. Cytological and morphological varia-
tion in Panicum virgatum L. Southwest. Nat. 19:379–385.
Burner, D.M., and B.L. Legendre. 1993. Chromosome transmission and
meiotic stability of sugarcane (Saccharum spp.) hybrid derivatives.
Crop Sci. 33:600–606.
Burner, D.M., and B.L. Legendre. 1994. Cytogenetic and fertility charac-
teristics of elite sugarcane. Sugar Cane 1:6–10.
Buttel, I., A. Fechter, and M. Schwab. 2004. Common fragile sites and
cancer: Targeted cloning by insertional mutagenesis. Ann. N. Y.
Acad. Sci. 1028:14–27.
Casler, M.D., K.P. Vogel, and A.C. Beal. 2006. Registration of WS4U and
WS8U switchgrass germplasms. Crop Sci. 46:998–999.
Casler, M.D., K.P. Vogel, C.M. Taliaferro, N.J. Ehlke, J.D. Berdahl, E.C.
Brummer, R.L. Kallenbach, C.P. West, and R.B. Mitchell. 2007.
Latitudinal and longitudinal adaptation of switchgrass populations.
Crop Sci. 47:2249–2260.
Casper, A.M., P. Nghiem, M.F. Arlt, and T.W. Glover. 2002. ATR regulates
fragile site stability. Cell 111:779–789.
Church, G.L. 1940. Cytotaxonomic studies in the Gramineae Spartina,
Andropogon, and Panicum. Am. J. Bot. 27:263–271.
Coff ee, B., F. Zhang, S. Ceman, S.T. Warren, and D. Reines. 2002. Histone
modifi cations depict an aberrantly heterochromatinized FMR1 gene
in fragile x syndrome. Am. J. Hum. Genet. 71:923–932.
Cuadrado, A., R. Acevedo, S. Moreno Diaz de la Espina, N. Jouve, and C.
de la Torre. 2004. Genome remodelling in three modern S. offi cina-
rum x S. spontaneum sugarcane cultivars. J. Exp. Bot. 55:847–854.
D’Hont, A. 2005. Unraveling the genome structure of polyploids using
FISH and GISH; examples of sugarcane and banana. Cytogenet.
Genome Res. 109:27–33.
Darlington, C.D. 1956. Chromosome botany. George Allen & Unwin
Ltd, London.
Fodde, R., and R. Smits. 2002. Cancer biology. A matter of dosage. Science
298:761–763.
Gaut, B. 2001. Patterns of chromosomal duplication in maize and their
implications for comparative maps of the grasses. Genome Res.
11:55.
Gericke, G.S. 1999. Chromosomal fragility may be indicative of altered
higher-order DNA organization as the underlying genetic diathesis
in complex neurobehavioural disorders. Med. Hypoth. 52:201–208.
Gerlach, W.L., and J.R. Bedbrook. 1979. Cloning and chracterization of
ribosomal RNA genes from wheat and barley. Nucleic Acids Res.
7:1869–1885.
Griffi n, D.K. 1996. Th e incidence, origin, and etiology of aneuploidy. Int.
Rev. Cytol. 167:263–296.
Grivet, L., and P. Arruda. 2001. Sugarcane genomics: Depicting the com-
plex genome of an important tropical crop. Curr. Opin. Plant Biol.
5:122–127.
Hegarty, M.J., G.L. Barker, A.C. Brennan, K.J. Edwards, R.J. Abbott, and
S.J. Hiscock. 2008. Changes to gene expression associated with hybrid
speciation in plants: Further insights from transcriptomic studies in
Senecio. Philos. Trans. R. Soc. Lond. B Biol. Sci. 363:3055–3069.
Hegarty, M., and S. Hiscock. 2007. Polyploidy: Doubling up for evolution-
ary success. Curr. Biol. 17:R927–R929.
Henry, I.M., B.P. Dilkes, and L. Comai. 2007. Genetic basis for dosage
sensitivity in Arabidopsis thaliana. PLoS Genet. 3:593–602.
COSTICH ET AL.: GENOME-SIZE VARIATION IN SWITCHGRASS 141
Henry, I.M., B.P. Dilkes, K. Young, B. Watson, H. Wu, and L. Comai.
2005. Aneuploidy and genetic variation in the Arabidopsis thaliana
triploid response. Genetics 170:1979–1988.
Henry, D.S., and T.H. Taylor. 1989. Registration of KY 1625 switchgrass
germplasm. Crop Sci. 29:1096.
Hopkins, A.A., C.M. Taliaferro, C.D. Murphy, and D.A. Christian. 1996.
Chromosome number and nuclear DNA content of several switch-
grass populations. Crop Sci. 36:1192–1195.
Huang, J., L. Ma, F. Yang, S.Z. Fei, and L. Li. 2008. 45S rDNA regions are
chromosome fragile sites expressed as gaps in vitro on metaphase
chromosomes of root-tip meristematic cells in Lolium spp. PLoS
One 3:e2167.
Huettel, B., D.P. Kreil, M. Matzke, and A.J.M. Matzke. 2008. Eff ects of
aneuploidy on genome structure, expression, and interphase organi-
zation in Arabidopsis thaliana. PLoS Genet. 4:1–13.
Hultquist, S.J., K.P. Vogel, D.J. Lee, K. Arumuganathan, and S. Kaep-
pler. 1996. Chloroplast DNA and nuclear DNA content variations
among cultivars of switchgrass, Panicum virgatum L. Crop Sci.
36:1049–1052.
Huskins, C.L., and S.G. Smith. 1932. A cytological study of the genus
Sorghum Pers. I. Th e somatic chromosomes. J. Genet. 25:241–249.
Laird, C., E. Jaff e, G. Karpen, M. Lamb, and R. Nelson. 1987. Fragile sites
in human chromosomes as regions of late-replicating DNA. Trends
Genet. 3:274–281.
Larkin, P.J., and W.R. Scowcroft . 1981. Somaclonal variation–a novel
source of variability from cell cultures for plant improvement.
Th eor. Appl. Genet. 60:197–214.
Lavania, U.C. 1987. Chromosomal instability in lemon grass, Cymbo-
pogon fl exuosus (Steudel) Wats. Genetica (Th e Hague) 72:211–215.
Le Cunff , L., O. Garsmeur, L.M. Raboin, J. Pauquet, H. Telismart, A.
Selvi, L. Grivet, R. Philippe, D. Begum, M. Deu, L. Costet, R. Wing,
J.C. Glaszmann, and A. D’Hont. 2008. Diploid/polyploid syntenic
shuttle mapping and haplotype-specifi c chromosome walking
toward a rust resistance gene (Bru1) in highly polyploid sugarcane
(2n~12x~115). Genetics 180:649–660.
Li, Z.-y., and X.-h. Ge. 2007. Unique chromosome behavior and genetic
control in Brassica x Orychophragmus wide hybrids: A review. Plant
Cell Rep. 26:701–710.
Lu, K., S.W. Kaeppler, K. Vogel, K. Arumuganathan, and D.J. Lee. 1998.
Nuclear DNA content and chromosome numbers in switchgrass.
Great Plains Res. 8:269–280.
Martel, E., D. De Nay, S. Siljak-Yakovlev, S. Brown, and A. Sarr. 1997.
Genome size variation and basic chromosome number in Pearl mil-
let and fourteen related Pennisetum species. J. Hered. 88:139–143.
Martinez-Reyna, J.M., and K.P. Vogel. 2002. Incompatibility systems in
switchgrass. Crop Sci. 42:1800–1805.
Matzke, M., M. Florian Mette, T. Kanno, and A. Matzke. 2003. Does the
intrinsic instability of aneuploid genomes have a causal role in can-
cer? Trends Genet. 19:253–256.
Matzke, M., O. Scheid, and A. Matzke. 1999. Rapid structural and epi-
genetic changes in polyploid and aneuploid genomes. Bioessays
21:761–767.
McLaughlin, S.B., and L.A. Kszos. 2005. Development of switchgrass
(Panicum virgatum) as a bioenergy feedstock in the United States.
Biomass Bioenergy 28:515–535.
McMillan, C., and J. Weiler. 1959. Cytogeography of Panicum virgatum in
central North America. Am. J. Bot. 46:590–593.
Mehra, P.N., and O.P. Sood. 1974. Floating chromosomal populations in
Saccharum spontaneum L. Cytologia (Tokyo) 39:681–696.
Myers, W.M., and H.D. Hill. 1940. Studies of chromosomal association
and behavior and occurrence of aneuploidy in autotetraploid grass
species, orchard grass, tall oat grass, and crested wheatgrass. Bot.
Gaz. 102:236–255.
Narasimhamoorthy, B., M.C. Saha, T. Swaller, and J.H. Bouton. 2008.
Genetic diversity in switchgrass collections assessed by EST-SSR
markers. Bioenergy Res. 1:136–146.
Nielsen, E.L. 1944. Analysis of variation in Panicum virgatum. J. Agric.
Res. 69:327–353.
Nielsen, E.L. 1968. Intraplant morphological variations in grasses. Am. J.
Bot. 55:116–122.
Otto, S.P., and J. Whitton. 2000. Polyploid incidence and evolution.
Annu. Rev. Genet. 34:401–437.
Porter, C.L. 1966. An analysis of variation between upland and lowland
switchgrass, Panicum virgatum L., in central Oklahoma. Ecology
47:980–992.
Rajeswari, S., S. Th irugnanakumar, A. Anandan, and M. Krishnamurthi.
2009. Somaclonal variation in sugarcane through tissue culture and
evaluation for quantitative and quality traits. Euphytica 168:71–80.
Ramsey, J., and D. Schemske. 1998. Pathways, mechanisms, and rates
of polyploid formation in fl owering plants. Annu. Rev. Ecol. Syst.
29:467–501.
Rasband, W.S. 2009. ImageJ. Available at http://rsb.info.nih.gov/ij/ (veri-
fi ed 13 Oct. 2010). U.S. National Institutes of Health, Bethesda, MD.
Riley, R.D., and K.P. Vogel. 1982. Chromosome numbers of released cul-
tivars of switchgrass, indiangrass, big bluestem, and sand bluestem.
Crop Sci. 22:1082–1083.
Sachs, L. 1952. Chromosome mosaics in experimental amphiploids in the
Triticinae. Heredity 6:157–170.
SAS Institute. 2002. SAS for Windows. SAS Inst., Cary NC.
Sipiczki, M. 2008. Interspecies hybridization and recombination in Sac-
charomyces wine yeasts. FEMS Yeast Res. 8:996–1007.
Sobel, J.M., G.F. Chen, L.R. Watt, and D.W. Schemske. 2010. Th e biology
of speciation. Evolution Int. J. Org. Evolution 64:295–315.
Th omas, H., and W.T.H. Peregrine. 1964. Chromosome mosaics in syn-
thetic amphiploids in the Avenae. Chromosoma 15:123–131.
Torres, E.M., B.R. Williams, and A. Amon. 2008. Aneuploidy: Cells losing
their balance. Genetics 179:737–746.
Turhollow, A.F., J.H. Cushman, and J.W. Johnston. 1988. Herbaceous
Energy Crops Program: Annual progress report for FY 1988. Oak
Ridge National Laboratory–6639. Oak Ridge National Lab., Oak
Ridge, TN.
Wang, Y.H. 2006. Chromatin structure of human chromosomal fragile
sites. Cancer Lett. 232:70–78.
Watanabe, Y. 1962. Chromosome-mosaics observed in a variety of wheat,
“Shirahada.” Jpn. J. Genet. 37:194–206.
Wright, K.M., J.C. Pires, and A. Madlung. 2009. Mitotic instability in
resynthesized and natural polyploids of the genus Arabidopsis (Bras-
sicaceae). Am. J. Bot. 96:1656–1664.
Wullschleger, S.D., M.A. Sanderson, S.B. McLaughlin, D.P. Biradar, and
A.L. Rayburn. 1996. Photosynthetic rates and ploidy levels among
populations of switchgrass. Crop Sci. 36:306–312.
Zhang, P., B. Friebe, A.J. Lukaszewski, and B.S. Gill. 2001. Th e centromere
structure in Robertsonian wheat-rye translocation chromosomes
indicates that centric breakage-fusion can occur at diff erent posi-
tions within the primary constriction. Chromosoma 110:335–344.