Embed Size (px)
Citation preview
2010Fish Toxics MonitoringPublic Request Surveys
pumpkinseedLepomis gibbosus
Massachusetts Department of Environmental ProtectionDivisions of Watershed Management
and Environmental Analysis
Robert J. MaiettaJane Ryder
Richard F. ChaseEnvironmental Analysts
Division of Watershed Management
February 2011
CN 359.0
2
Introduction
Public Request Surveys (Interagency Committee on Freshwater Fish Toxics Monitoring andAssessment )
Due in part to an increasing public demand for fish toxics data, a formal protocol for the public to requestfish toxics monitoring surveys of the Commonwealth’s waterbodies was initiated in 1993/94. While publicrequests for fish testing had been fulfilled prior to this time, increased requests beyond the scope of theresources available made formal prioritization necessary. The following protocol is the result of acollaborative effort between the Massachusetts Department of Environmental Protection (MassDEP), theMassachusetts Department of Public Health (MDPH), and the Massachusetts Department of Fish andGame (MDFG). It consists of a Memorandum of Understanding (MOU) (Appendix B), a form forrequesting fish testing (Appendix C), and the criteria used for ranking testing requests (Appendix D).
The process is as follows: completed request forms are sent to the MassDEP Division of WatershedManagement (DWM) in Worcester. Representatives of the aforementioned agencies make up theInteragency Committee on Freshwater Fish Toxics Monitoring and Assessment (Interagency Committee).The Interagency Committee meets each year in February to prioritize all requests received betweenFebruary 1st of the previous year and February 1st of the current year. Variables used to prioritize requestsinclude fishing pressure (determined by Division of Fisheries and Wildlife (DFW) and the requester) andthe presence of known or potential point and non-point sources of pollution (determined by MassDEP,DFW, and the requester). The number of requests fulfilled during any given year is determined by theamount of field and laboratory resources available in that year. All requesters are notified regarding thestatus of their request. If a request is denied, re-application in following years is allowed. Request formsare available through each of the agencies involved in the MOU, at the following locations:
Massachusetts Department of Environmental ProtectionDivision of Watershed Management627 Main Street, 2nd FloorWorcester, MA 01608(508) 792-7470
Division of Environmental AnalysisSenator William X. Wall Experiment Station37 Shattuck StreetLawrence, MA 01843(978) 682-5237
Office of Research and StandardsOne Winter StreetBoston, MA 02108(617) 292-5510
Massachusetts Department of Public HealthBureau of Environmental Health Assessment
250 Washington Street, 7th FloorBoston, MA 02108-4619
(617) 624-5757
Massachusetts Department of Fish and GameDivision of Fisheries and Wildlife (DFW)
Field HeadquartersOne Rabbit Hill Road
Westborough, MA 01581(508) 389-6300
3
Objective and Scope
The objective of Public Request Surveys is to screen edible fillets of fishes for potential contaminants (i.e.mercury and/or other metals, polychlorinated biphenyls (Aroclors), and organochlorine pesticides). The list ofcontaminants for which tissue samples are analyzed is determined on a case-by-case basis. All data are sentto the MDPH and the MassDEP Office of Research and Standards (ORS) for assessment and advisoryissuance if appropriate.
PCB Arochlors analyzed for include, Arochlors 1232, 1242, 1248, 1254, and 1260. Organochlorine pesticidesanalyzed for include, Chlordane, Toxaphene, a-BHC, b-BHC, d-BHC, Lindane, Hexachlorocyclopentadiene,Trifluralin, Hexachlorobenzene, Heptachlor, Heptachlor Epoxide, Methoxychlor, DDD, DDE, DDT, Aldrin,Endrin, and Endosulfan I. All organics analyses include lipid determination. Mercury is the only metal whichis currently being routinely analyzed for. All analyses for variables listed above are performed at the SenatorWilliam X. Wall Experiment Station (WES). Additional variables are addressed on a site-specific basis.
In order to assess the level of contamination present in fish of different trophic guilds and habitat types, fishspecies targeted include at a minimum; largemouth bass, Micropterus salmoides, and/or chain pickerel, Esoxniger, (predators); yellow perch, Perca flavescens, and/or white perch, Morone americana, (water columninvertivores/omnivores); and bullhead, Ameiurus sp. and/or common carp, Cyprinus carpio, (bottom feedingomnivores). Average-sized fish (above legal length limit when applicable) are analyzed as compositesamples. Additional species or substitute species are chosen on a site-by-site basis.
During 2010, a total of five locations were sampled as a result of recommendations from the InteragencyCommittee. A list of all of the sampling sites with pertinent locational information is presented in thefollowing table.
1 Interim PALIS# = Pond and Lake Identification System number (Mar 16, 2000)
Waterbody Watershed Town USGS QuadrangleJamaica PondPALIS#1 72052 Charles River Boston Boston South MASSACHSETTS.
Leverett PondPALIS#1 72060 Charles River Brookline/Boston Boston South MASSACHSETTS
Lake MattawaPALIS#1 35112 Millers River Orange Orange MASSACHUSETTS.
Moores PondPALIS#1 35048 Millers River Warwick Northfield MASSACHUSETTS.
Pleasant PondPALIS#1 92049 Ipswich River Wenham/Hamilton Salem MASSACHUSETTS.
4
Field Methods
Waterbodies were sampled using an electrofishing boat. Electrofishing was performed by maneuvering theboat through the littoral zone and shallow water habitat of a given waterbody, and collecting most fishshocked. Fish collected by electrofishing were stored in a live well until the completion of sampling. Fish to beincluded in the sample were dispatched, stored on ice, and transported to the Massachusetts Department ofEnvironmental Protection (MassDEP) Division of Watershed Management (DWM) laboratory in Worcesterwhere they were prepared (filleted and composited) and frozen. In all cases, live fish that were not includedas part of the sample, were released.
Field ResultsThe collection method used during the 2010 season was limited to boat electrofishing. The collection dates,species retained for analysis, and other species observed can be found in the following table.
Waterbody Sampling Date CollectionMethod(s)
Species Retained1 Other speciesobserved1
Jamaica Pond 5/28/2010 boat electrofishing LMB, YB, YP,B AE, P, RT,ASLeverett Pond 5/21/2010 boat electrofishing C, YP, B, WP, LMB not recordedLake Mattawa 6/10/2010 boat electrofishing LMB, B, BB, YB AE, CP, P, BC, YPMoores Pond 5/26/2010 boat electrofishing AE, BB, B, CP not recordedPleasant Pond 6/16/2010 boat electrofishing LMB, YP, B, BB P, BC, CP
1Species codes are defined in Table 1 of Appendix A
Laboratory Methods
Fish transported to the MassDEP DWM laboratory in Worcester were processed using protocols designedto assure accuracy and prevent cross-contamination of samples. Specimen lengths and weights wererecorded along with notes on tumors, lesions, or other anomalies noticed during an external visualinspection. Scales and spines were obtained for use in age determination. Species, length, and weightdata can be found in Appendix A Table 1. Fish were filleted (skin off) on glass cutting boards and preparedfor freezing. All equipment used in the filleting process was rinsed in tap water and then rinsed twice inde-ionized water before and after each sample. All samples were placed in VWR high densitypolyethylene (HDPE) cups with covers. Composite samples were composed of portions of two or threefillets from like-sized individuals of the same species (occasionally the same genus). Samples prepared atDWM in Worcester were tagged and frozen for subsequent delivery to the Department’s Wall ExperimentStation (WES).
Methods used at WES for metals analysis include the following: Mercury was analyzed by ThermalDecomposition, Amalgamation, and Atomic Absorption Spectrophotometry using EPA method 7473.(Batdorf 2009). PCB Aroclor, and organochlorine pesticide analyses were performed on a gaschromatograph equipped with an electron capture detector “according to the modified AOAC 983.21procedure for the analysis of PCB Aroclors, and Organochlorine Pesticides.”(MassDEP 2002). Additionalinformation on analytical techniques used at WES is available from the laboratory.
5
Laboratory Results
Twenty one samples were delivered to WES for analysis. All fish tissue data passed WES QC acceptancelimits, however, seventeen (80 %) of the mercury results were reported with “qualification” (See QualityControl Section). Mercury (MDL 0.0020 mg/kg) was detected in all twenty one samples analyzed.Concentrations ranged from 0.044 mg/kg to 0.83 mg/kg. Mercury concentrations varied greatly betweenwaterbodies and species. Waterbody mean mercury concentrations and ranges are detailed below.Complete results of the mercury analysis can be found in Appendix A Table 1.
Nine samples were analyzed for PCB Aroclors, and organochlorine pesticides. PCB Aroclors weredetected in one sample and DDT and/or it’s metabolites DDE and DDD were detected in three of the ninesamples analyzed (33%). Complete results for PCB Aroclors and organochlorine pesticides analysis canbe found in Appendix A Table 1.
Waterbody Mean Total Hg (mg/kg wet weight) Total Hg Range (mg/kg(min-max))
Jamaica Pond 0.20 (n=4) 0.066-0.35Leverett Pond 0.11 (n=5) 0.068-0..16Lake Mattawa 0.28 (n=4) 0.14-0.41Moores Pond 0.35 (n=4) 0.16-0.53Pleasant Pond 0.29 (n=4) 0.044-0.83
Quality Control
Eighty percent of the mercury data were reported with “qualification”. The qualification in all cases involved“EPA holding time” exceedances. Mercury was analyzed after the U.S. Environmental Protection Agency(EPA) recommended holding time of 28 days and samples were qualified as “Holding time not met butprevious studies by WES show that frozen fish samples are stable for mercury for at least one year.” Itshould be noted that three sets of samples were delivered to WES after the USEPA 28 day holding time.One set of samples was delivered within 15 days of collection and one set was delivered within 21 days ofcollection.
In addition to holding time exceedences, four of the mercury results were qualified due to duplicate resultRPDs which were out of the acceptance range of 0 - 20 RPD. For the rest of the mercury results, labduplicate precision estimates for mercury were within the acceptance criteria range of 0 – 20 RPD. Labaccuracy estimates for mercury using lab-fortified matrix samples were within the acceptable range from 70-130 % recovery. Mercury quality control sample recoveries were within the acceptable range of 70-130 %recovery. Lab fortified blank recoveries for mercury were within the acceptable range of 85-115% recovery.Lab blanks were all acceptable at ND (analyzed for, but not detected above MDL). Complete quality controldata for mercury are available upon request from WES or DWM.
PCB Aroclor and organochlorine pesticide results which were “qualified” as being greater than the MethodDetection Limit but less than the Minimum Reporting Limit (>MDL but< MRL) were flagged by WES andappear so designated in the data tables (See Appendix A, Table 1).All laboratory blanks for organics resulted in non-detectable concentrations. Duplicate samples analyzed forPCB Aroclors, and organochlorine pesticides in all cases had resultant RPDs within the acceptance criteriarange of 0-35%. The laboratory fortified blank sample recoveries for PCB Aroclors and laboratory fortifiedmatrix sample recoveries for organochlorine pesticides were within the acceptance criteria range of 60-140% recovery. All surrogate PCNB analyses resulted in percent recoveries within the acceptance criteria of60-140 % recovery. Complete quality control data for PCB Aroclors, and organochlorine pesticides areavailable upon request from WES or DWM.
6
Discussion
Edible tissue total mercury continues to be both widespread and detectable at concentrations that at timescan exceed the USEPA water quality criterion (0.3 µg/g methyl mercury), the MDPH trigger level (0.5 g/gtotal mercury) and/or the USFDA Action level (1.0 g/g methyl mercury). (USEPA 2005 and USFDA2009). Mercury concentrations are addressed in the individual waterbody discussions that follow. MDPHis currently assessing the 2010 mercury data with regard to the need for waterbody specific advisoryissuance where warranted.
PCB Aroclors and organochlorine pesticides are occasionally found in freshwater fishes fromMassachusetts. They are usually found in fishes from waterbodies that have received historical dischargesor are associated with known waste sites. As such, they are mostly found in rivers, although theirpresence in fishes from lakes and ponds can’t be entirely ruled out. Current USFDA Action Levels (forfish, edible portion) include chlordane, and mirex, (0.3 g/g for each individually), aldrin and dieldrin (0.3µg/g combined) and for DDT and its metabolites DDE and DDD (5.0 g/g combined) (USFDA 2009).Historic USFDA “Action Levels” were also available for PCBs (2.0 g/g), however these were not listed inthe current reference document. In addition, the MDPH has “trigger levels” for PCBs (1.0 g/g totalAroclors) and DDT and/or its metabolites (0.06 g/g). PCB Aroclors and organochlorine pesticides (DDTand its metabolites) were found in a thirty three percent of the samples analyzed in 2010. Concentrationswere generally below levels of concern with the exception of one sample from Leverett Pond (2010150-001 for DDT and its metabolites). These data and the mercury results are addressed in the individualwaterbody discussions that follow.
Jamaica Pond: Jamaica Pond is a 63 acre (25.4 hectare ha) kettle hole, great pond located in the City ofBoston (Ackerman 1989). The immediate shoreline is mostly parklands with paved walking paths. Land usewithin the pond’s watershed is almost entirely developed with high density residential, commercial, andtransportation infrastructure. There are a number of storm drains which discharge into Jamaica Pond and itappears that fishing pressure is very heavy, especially in the spring. The pond is stocked by MassWildlifewith both trout and Atlantic salmon broodstock.
Mercury was below the MDPH “trigger level” of 0.5 mg/kg in the four samples analyzed (including largemouthbass, a predatory species). PCBs and organochlorine pesticides were not detected in fish samples fromJamaica Pond. It should be noted that common carp, which are usually worst- case when it comes to PCBsand organochlorine pesticides, were not collected or analyzed from Jamiaca Pond. Although the 2010 dataset will most likely not result in any type of advisory from the MDPH, it would be interesting to analyzecommon carp in order to assess the worst-case potential for PCBs and organochlorine pesticides.
Leverett Pond: Leverett Pond is a 7 acre (2.8 ha.) shallow impoundment of the Muddy River located justdownstream from Jamaica Pond between Brookline and Boston. The immediate shoreline is mostlyparklands with paved and unpaved walking paths and access roads. Land use within the pond’s watershed isalmost entirely developed with high density residential, commercial, and transportation infrastructure. Itshould be noted that there are a number of storm drains which discharge into Leverett Pond. Although therewas some evidence of fishing pressure, no fishermen (or women) were observed fishing on either the day ofthe reconnaissance survey or the sampling date.
Mercury was below the MDPH “trigger level” of 0.5 mg/kg in the five samples analyzed (includinglargemouth bass, a top level predator). PCB Aroclor 1260 was detected in common carp (0.051 mg/Kg)but concentrations were well below the MDPH trigger level of 1.0 mg/Kg. Total concentrations of DDT(and it’s metabolites DDD and DDE) exceeded the MDPH trigger level in common carp but were below thetrigger level in bluegill and white perch. It should be noted that common carp are considered worst-casefor PCBs and organochlorine pesticides due to their bottom feeding behavior as well as the high lipid (fat)content of their edible fillets. PCBs and pesticides are lipophilic compounds which accumulate in fattytissue.
7
Although it is unclear where the organochlorine pesticides might be originating, given the incredibleamount of residential and commercial development within the watershed, sources are most likely fromhistorical pesticide use. Observed concentrations do not appear to be indicative of ongoing point sourcecontamination. The presence of DDT (and or it’s metabolites) in common carp will most likely result in theissuance of a MDPH fish consumption advisory.
Lake Mattawa: Lake Mattawa is a 112 acre (45.3.4 ha.) mesotrophic lake located in the Town of Orange.The lake is primarily spring fed and flows via North Pond Brook to the Millers River, and via an unnamedtributary, to the Middle Branch Swift River. The water is clear and the bottom substrate is predominantly sandand gravel and only sparsely vegetated (MDFW 1993).
The shoreline is approximately eighty to ninety percent developed with residences and there is a road whichruns along the entire western shoreline of the lake. Land use within the lakes watershed is mostly forested,with residential landuse limited primarily to the immediate shoreline. State Route 2 also passes within thelakes watershed.
Mercury was below the MDPH “trigger level” of 0.5 mg/kg in all four samples analyzed, including twolargemouth bass samples. It should be noted that although all largemouth bass analyzed were longer thanthe legal length limit, none were larger than approximately two pounds. All mercury results were qualifiedby the laboratory due to exceedances in the “USEPA 28 day holding time” as well as problems withduplicate result RPDs as described in the Quality Control section.
Moores Pond: Moores Pond is a 31 acre (12.5 ha.) great pond located in the town of Warwick. (Ackerman1989). The shoreline is approximately thirty-five percent developed residentially. Land-use within the pond’swatershed is a mix of low (and very low) density residential and forested land-uses.
Although this is a great pond, the pond to some extent impounds Grace Brook and there is a large vegetatedwetland on it’s northern (upstream) end. The water is fairly clear and vegetation is confined to the shallowerareas. The pond is stocked with trout annually and 21 percent of the water is considered to be “trout water”by the MassWildlife (MDFW 1993).
Composite samples of American eel and chain pickerel were found to contain mercury in excess of theMDPH trigger level of 0.5 g/g. All mercury results were qualified by the laboratory due to exceedances inthe “USEPA 28 day holding time” as described in the Quality Control section. It should be noted thatalthough the American eel were fairly large, the chain pickerel were below the legal length limit of 15inches and still exceeded the trigger level. In light of the high mercury in smaller pickerel it is highlyprobable that other predatory species such as largemouth bass also contain mercury concentrationswhich may be elevated.
The MDPH will most likely issue an advisory with regard to the consumption of chain pickerel andAmerican eel from Morres Pond.
Pleasant Pond: Pleasant Pond is a 43 ( 17.4 ha.) mesotrophic great pond located in the Town of Wenham(Ackerman 1989). The immediate shoreline is approximately sixty to seventy percent developed residentiallyand land-use within the watershed is primarily a mix of medium density residential and forested. The water isrelatively clear but aquatic vegetation is dense in the shallower areas of the pond. Public access for shorefishing and boats is available via town owned property along the western shoreline. The pond is stocked withtrout annually (spring and fall) by the MDFW and some of these trout are reported to “holdover” (MDFW1993).
Mercury exceeded the MDPH “trigger level” of 0.5 g/g in largemouth bass. All other fish were below theMDPH trigger level for mercury. The MDPH will most likely issue an advisory with regard to theconsumption of largemouth bass from Pleasant Pond.
8
Conclusions
While mercury concentrations were mostly below the MDPH trigger level, the 2010 Public Request andWatershed Surveys data set supports previous findings that bioaccumulation of mercury is a widespreadproblem, and that, although individual ponds or regions may be at higher risk, it is primarily a problem inpredatory or piscivorous species. It is presumed that the mercury present in freshwater fish is due mainly toatmospheric deposition (near and far field emissions from incinerators and coal burning power plants) andpossibly bedrock sources. Reducing direct human health risks associated with eating freshwater fish can onlybe accomplished through educating the public with regard to both fish bioaccumulation patterns as well asthe implications of various levels of fish consumption.
It should be noted that although the fish toxics monitoring program addresses the human health riskassociated with the consumption of freshwater fishes, the mercury problem also poses threats with regard toecological risks to piscivorous wildlife (Eisler 1987). Studies have shown that mercury poses a health risk toeagles, loons, and ospreys as well as many other species. Reductions in the amount of mercury in themunicipal waste stream and the emissions noted above will also reduce the environmental consequences ofthis contaminant. It is unclear how rapidly mercury concentrations will respond to recent changes in airemissions standards, however, recent studies of sediment cores from lakes suggest that mercury depositionrates may be decreasing. (MassDEP 2005)
PCBs remain essentially a problem in rivers or other waterbodies that have received historic PCB discharges.With regard to organochlorine pesticides however, it appears that certain species of fish do bioaccumulatesignificant levels of DDT (and/or it’s metabolites DDD and DDE) from rivers and/or lakes where thesecontaminants have been historically used. These historic uses appear to include general residential use.
The DWM will continue to screen for contaminants in freshwater fishes as part of Public Request and Year 2watershed surveys, as resources allow. DWM will also continue to cooperate with other state and federalagencies in an effort to better understand not only the distribution of fish tissue contaminants, but alsotemporal changes that may be taking place with regard to fish tissue contaminant levels.
This report has been forwarded to the departments involved with the Interagency Committee, the individualsrequesting work, and DEP’s regional offices. Additional copies of this report are available from the MassDEP,Division of Watershed Management, 627 Main Street 2nd Floor, Worcester, MA 01608. They will alsoeventually be available online at http://www.mass.gov/dep/.
9
REFERENCES
Batdorf. C. ([email protected]) 2009. Re: Method 7473 Massachusetts Department ofEnvironmental Protection, Wall Experiment Station, Lawrence, MA. Email to Robert Maietta,Massachusetts Department of Environmental Protection, Division of Watershed Management, Worcester,MA dated 22 February 2009.
Eisler, R. 1987. Mercury Hazards to Fish, Wildlife, and Invertebrates: A Synoptic Review. Patuxent WildlifeResearch Center, U.S. Fish and Wildlife Service, Laurel, MD
Halliwell, D. B., Kimball, W. A., Screpetis, A. J. 1982. Massachusetts Stream Classification Program Part IInventory of Rivers and Streams. . Technical Services Branch, Massachusetts Division of Water PollutionControl, Department of Environmental Quality Engineering,
MassDEP , 2011. Working version PALIS, originally, Ackerman, M.T.1989, Compilation of Lakes, Ponds,Reservoirs, and Impoundments Relative to the Massachusetts Clean Lakes Program. Publication: #15901-171-50-4-89-C.R. Technical Services Branch, Massachusetts Division of Water Pollution Control,Department of Environmental Quality Engineering, Westborough, MA.
MassDEP. 2007. Standard Operating Procedure for USEPA Method 7473. Wall Experiment Station,Lawrence, MA.
MassDEP. 2002. Standard Operating Procedure for AOAC Method 983.21. Wall Experiment Station,Lawrence, MA.
MassDEP. 2005. DRAFT FINAL REPORT MASSACHUSETTS FISH TISSUE MERCURY STUDIES:LONG-TERM MONITORING RESULTS,1999-2004. Massachusetts Department of EnvironmentalProtection Office of Research and Standards, Boston, MA and Wall ExperimentStation Lawrence, MA.
McVoy, R.S. 1992. Commonwealth of Massachusetts Summary of Water Quality 1992. Appendix II –Massachusetts Lake Classification Program. Massachusetts Department of Environmental Protection,Division of Water Pollution Control, Technical Services Branch, North Grafton, MA.
MDPH. 2009. Freshwater Fish Consumption Advisory List. Massachusetts Department of Public Health,Bureau of Environmental Health, Boston.
MDFW. 1993. Pond Maps of Massachusetts. Massachusetts Division of Fisheries and Wildlife.Westborough, MA.
Nelson, J.S., E.J. Crossman, H. Espinosa-Pérez, L.T. Findley, C.R. Gilbert, R.N. Lea, and J.D. Williams.2004. Common and scientific names of fishes from the United States, Canada, and Mexico. AmericanFisheries Society, Special Publication 29, Bethesda, MD.
USEPA, 2005. National Recommended Water Quality Criteria [online] United States EnvironmentalProtection Agency. http://www.epa.gov/waterscience/criteria/wqctable/

10
USFDA, August 2000. Guidance for Industry: Action Levels for Poisonous or Deleterious Substances inHuman Food and Animal Feed. [Online] United States Food and Drug Administration,http://www.fda.gov/Food/GuidanceComplianceRegulatoryInformation/GuidanceDocuments/ChemicalContaminantsandPesticides/ucm077969.htm(updated 2009)
Tetra Tech Inc. 1986. Guidance Manual for Health Risk Assessment of Chemically Contaminated Seafood.U.S. Environmental Protection Agency. Region 10. Office of Puget Sound, Seattle, WA
11
LIST OF APPENDICES
Appendix A: Data TablesTable 1. Analytical Results for 2010 Fish Toxics Monitoring Public Request Surveys.Table 2. 2010 Fish Toxics Analytical Methods, Project Quantitation Limits, MethodDetection and Reporting Detection Limits.
Appendix B: Interagency Committee on Freshwater Fish Toxics Monitoring and AssessmentMemorandum of Understanding April 1994
Appendix C: Form For Requesting Fish Testing
Appendix D: Criteria For Ranking Fish Toxics Testing Requests
12
APPENDIX A
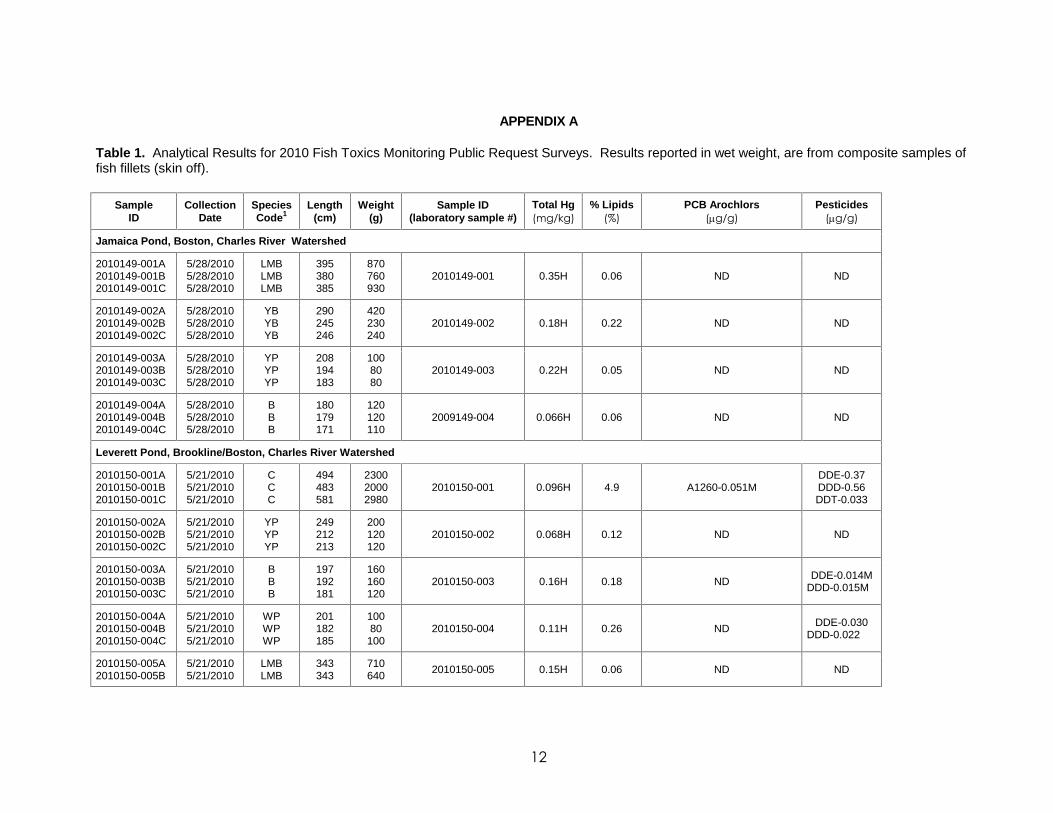
Table 1. Analytical Results for 2010 Fish Toxics Monitoring Public Request Surveys. Results reported in wet weight, are from composite samples offish fillets (skin off).
SampleID
CollectionDate
SpeciesCode1
Length(cm)
Weight(g)
Sample ID(laboratory sample #)
Total Hg(mg/kg)
% Lipids(%)
PCB Arochlors(g/g)
Pesticides(g/g)
Jamaica Pond, Boston, Charles River Watershed
2010149-001A2010149-001B2010149-001C
5/28/20105/28/20105/28/2010
LMBLMBLMB
395380385
870760930
2010149-001 0.35H 0.06 ND ND
2010149-002A2010149-002B2010149-002C
5/28/20105/28/20105/28/2010
YBYBYB
290245246
420230240
2010149-002 0.18H 0.22 ND ND
2010149-003A2010149-003B2010149-003C
5/28/20105/28/20105/28/2010
YPYPYP
208194183
1008080
2010149-003 0.22H 0.05 ND ND
2010149-004A2010149-004B2010149-004C
5/28/20105/28/20105/28/2010
BBB
180179171
120120110
2009149-004 0.066H 0.06 ND ND
Leverett Pond, Brookline/Boston, Charles River Watershed
2010150-001A2010150-001B2010150-001C
5/21/20105/21/20105/21/2010
CCC
494483581
230020002980
2010150-001 0.096H 4.9 A1260-0.051MDDE-0.37DDD-0.56DDT-0.033
2010150-002A2010150-002B2010150-002C
5/21/20105/21/20105/21/2010
YPYPYP
249212213
200120120
2010150-002 0.068H 0.12 ND ND
2010150-003A2010150-003B2010150-003C
5/21/20105/21/20105/21/2010
BBB
197192181
160160120
2010150-003 0.16H 0.18 ND DDE-0.014MDDD-0.015M
2010150-004A2010150-004B2010150-004C
5/21/20105/21/20105/21/2010
WPWPWP
201182185
10080
1002010150-004 0.11H 0.26 ND DDE-0.030
DDD-0.022
2010150-005A2010150-005B
5/21/20105/21/2010
LMBLMB
343343
710640 2010150-005 0.15H 0.06 ND ND
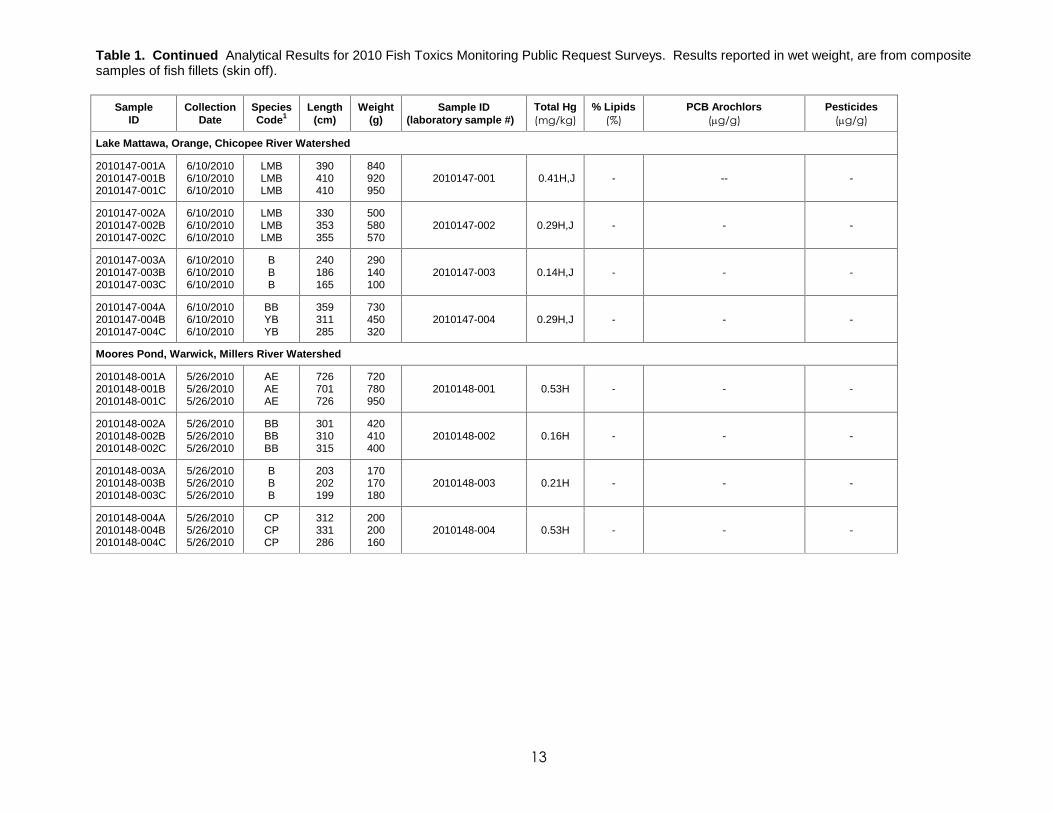
Table 1. Continued Analytical Results for 2010 Fish Toxics Monitoring Public Request Surveys. Results reported in wet weight, are from compositesamples of fish fillets (skin off).
13
SampleID
CollectionDate
SpeciesCode1
Length(cm)
Weight(g)
Sample ID(laboratory sample #)
Total Hg(mg/kg)
% Lipids(%)
PCB Arochlors(g/g)
Pesticides(g/g)
Lake Mattawa, Orange, Chicopee River Watershed
2010147-001A2010147-001B2010147-001C
6/10/20106/10/20106/10/2010
LMBLMBLMB
390410410
840920950
2010147-001 0.41H,J - -- -
2010147-002A2010147-002B2010147-002C
6/10/20106/10/20106/10/2010
LMBLMBLMB
330353355
500580570
2010147-002 0.29H,J - - -
2010147-003A2010147-003B2010147-003C
6/10/20106/10/20106/10/2010
BBB
240186165
290140100
2010147-003 0.14H,J - - -
2010147-004A2010147-004B2010147-004C
6/10/20106/10/20106/10/2010
BBYBYB
359311285
730450320
2010147-004 0.29H,J - - -
Moores Pond, Warwick, Millers River Watershed
2010148-001A2010148-001B2010148-001C
5/26/20105/26/20105/26/2010
AEAEAE
726701726
720780950
2010148-001 0.53H - - -
2010148-002A2010148-002B2010148-002C
5/26/20105/26/20105/26/2010
BBBBBB
301310315
420410400
2010148-002 0.16H - - -
2010148-003A2010148-003B2010148-003C
5/26/20105/26/20105/26/2010
BBB
203202199
170170180
2010148-003 0.21H - - -
2010148-004A2010148-004B2010148-004C
5/26/20105/26/20105/26/2010
CPCPCP
312331286
200200160
2010148-004 0.53H - - -
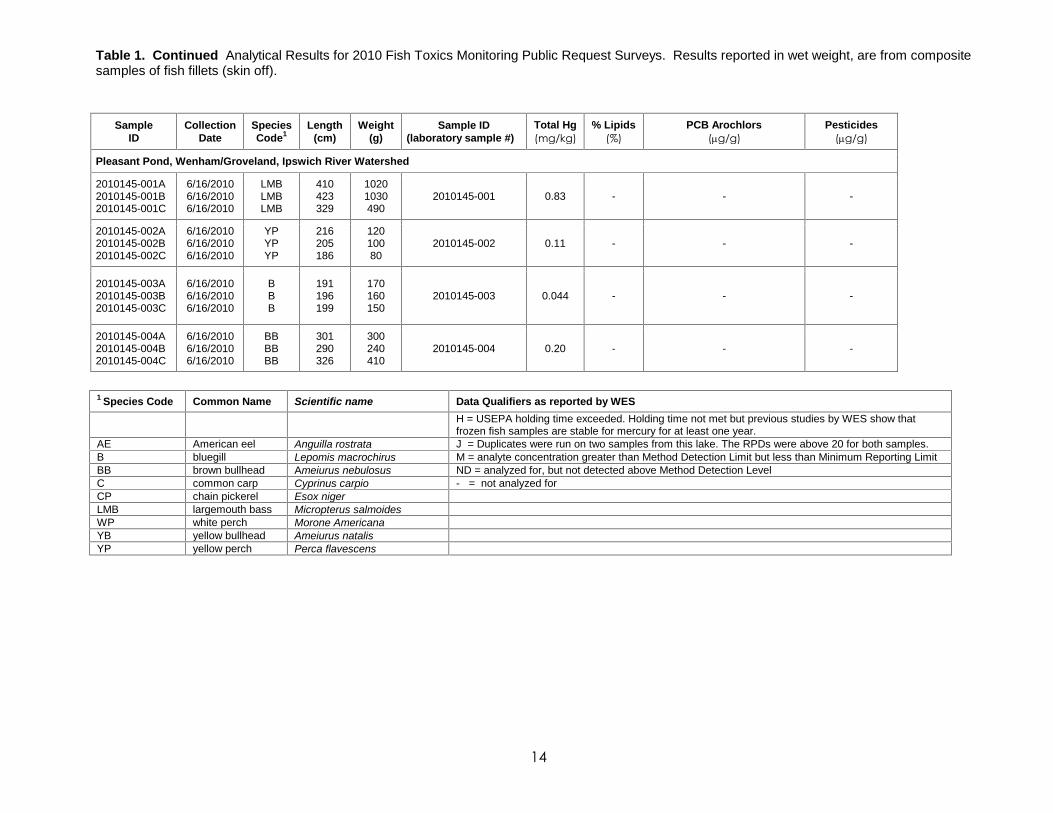
Table 1. Continued Analytical Results for 2010 Fish Toxics Monitoring Public Request Surveys. Results reported in wet weight, are from compositesamples of fish fillets (skin off).
14
SampleID
CollectionDate
SpeciesCode1
Length(cm)
Weight(g)
Sample ID(laboratory sample #)
Total Hg(mg/kg)
% Lipids(%)
PCB Arochlors(g/g)
Pesticides(g/g)
Pleasant Pond, Wenham/Groveland, Ipswich River Watershed
2010145-001A2010145-001B2010145-001C
6/16/20106/16/20106/16/2010
LMBLMBLMB
410423329
10201030490
2010145-001 0.83 - - -
2010145-002A2010145-002B2010145-002C
6/16/20106/16/20106/16/2010
YPYPYP
216205186
12010080
2010145-002 0.11 - - -
2010145-003A2010145-003B2010145-003C
6/16/20106/16/20106/16/2010
BBB
191196199
170160150
2010145-003 0.044 - - -
2010145-004A2010145-004B2010145-004C
6/16/20106/16/20106/16/2010
BBBBBB
301290326
300240410
2010145-004 0.20 - - -
1 Species Code Common Name Scientific name Data Qualifiers as reported by WESH = USEPA holding time exceeded. Holding time not met but previous studies by WES show thatfrozen fish samples are stable for mercury for at least one year.
AE American eel Anguilla rostrata J = Duplicates were run on two samples from this lake. The RPDs were above 20 for both samples.B bluegill Lepomis macrochirus M = analyte concentration greater than Method Detection Limit but less than Minimum Reporting LimitBB brown bullhead Ameiurus nebulosus ND = analyzed for, but not detected above Method Detection LevelC common carp Cyprinus carpio - = not analyzed forCP chain pickerel Esox nigerLMB largemouth bass Micropterus salmoidesWP white perch Morone AmericanaYB yellow bullhead Ameiurus natalisYP yellow perch Perca flavescens
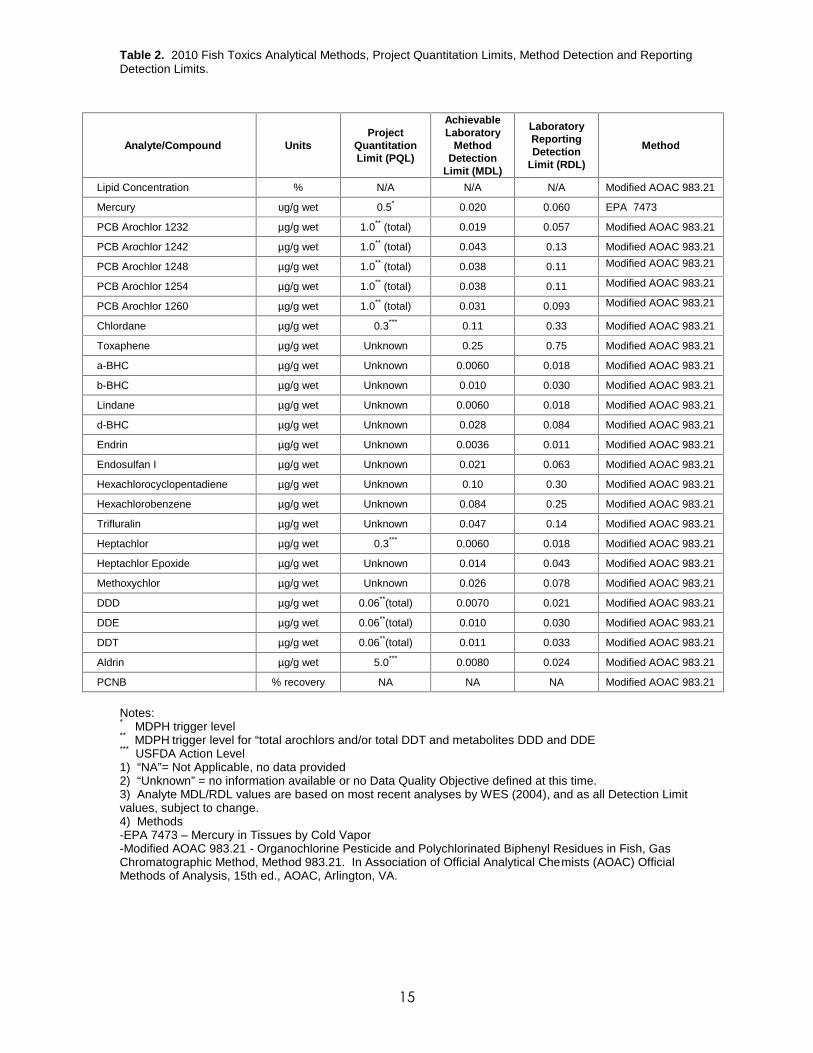
Table 2. 2010 Fish Toxics Analytical Methods, Project Quantitation Limits, Method Detection and ReportingDetection Limits.
15
Analyte/Compound UnitsProject
QuantitationLimit (PQL)
AchievableLaboratory
MethodDetection
Limit (MDL)
LaboratoryReportingDetection
Limit (RDL)
Method
Lipid Concentration % N/A N/A N/A Modified AOAC 983.21
Mercury ug/g wet 0.5* 0.020 0.060 EPA 7473
PCB Arochlor 1232 µg/g wet 1.0** (total) 0.019 0.057 Modified AOAC 983.21
PCB Arochlor 1242 µg/g wet 1.0** (total) 0.043 0.13 Modified AOAC 983.21
PCB Arochlor 1248 µg/g wet 1.0** (total) 0.038 0.11 Modified AOAC 983.21
PCB Arochlor 1254 µg/g wet 1.0** (total) 0.038 0.11 Modified AOAC 983.21
PCB Arochlor 1260 µg/g wet 1.0** (total) 0.031 0.093 Modified AOAC 983.21
Chlordane µg/g wet 0.3*** 0.11 0.33 Modified AOAC 983.21
Toxaphene µg/g wet Unknown 0.25 0.75 Modified AOAC 983.21
a-BHC µg/g wet Unknown 0.0060 0.018 Modified AOAC 983.21
b-BHC µg/g wet Unknown 0.010 0.030 Modified AOAC 983.21
Lindane µg/g wet Unknown 0.0060 0.018 Modified AOAC 983.21
d-BHC µg/g wet Unknown 0.028 0.084 Modified AOAC 983.21
Endrin µg/g wet Unknown 0.0036 0.011 Modified AOAC 983.21
Endosulfan I µg/g wet Unknown 0.021 0.063 Modified AOAC 983.21
Hexachlorocyclopentadiene µg/g wet Unknown 0.10 0.30 Modified AOAC 983.21
Hexachlorobenzene µg/g wet Unknown 0.084 0.25 Modified AOAC 983.21
Trifluralin µg/g wet Unknown 0.047 0.14 Modified AOAC 983.21
Heptachlor µg/g wet 0.3*** 0.0060 0.018 Modified AOAC 983.21
Heptachlor Epoxide µg/g wet Unknown 0.014 0.043 Modified AOAC 983.21
Methoxychlor µg/g wet Unknown 0.026 0.078 Modified AOAC 983.21
DDD µg/g wet 0.06**(total) 0.0070 0.021 Modified AOAC 983.21
DDE µg/g wet 0.06**(total) 0.010 0.030 Modified AOAC 983.21
DDT µg/g wet 0.06**(total) 0.011 0.033 Modified AOAC 983.21
Aldrin µg/g wet 5.0*** 0.0080 0.024 Modified AOAC 983.21
PCNB % recovery NA NA NA Modified AOAC 983.21
Notes:* MDPH trigger level** MDPH trigger level for “total arochlors and/or total DDT and metabolites DDD and DDE*** USFDA Action Level1) “NA”= Not Applicable, no data provided2) “Unknown” = no information available or no Data Quality Objective defined at this time.3) Analyte MDL/RDL values are based on most recent analyses by WES (2004), and as all Detection Limitvalues, subject to change.4) Methods-EPA 7473 – Mercury in Tissues by Cold Vapor-Modified AOAC 983.21 - Organochlorine Pesticide and Polychlorinated Biphenyl Residues in Fish, GasChromatographic Method, Method 983.21. In Association of Official Analytical Chemists (AOAC) OfficialMethods of Analysis, 15th ed., AOAC, Arlington, VA.
16
Appendix B
Interagency Committee on Freshwater Fish Toxics Monitoring and Assessment
MEMORANDUM OF UNDERSTANDINGApril 1994
MEMBERSHIP: The Committee is comprised of representatives from the followingDepartments and programs:
o Department of Environmental Protection -Office of Watershed Management (OWM)Division of Water Pollution Control (DWPC)Office of Research and Standards (ORS)Division of Environmental Analysis (DEA)
o Department of Public HealthEnvironmental Toxicology Program (ETP)Physician Education Unit (PEU)Community Assessment Unit (CAU)Environmental Laboratory (EL)
o Department of Fisheries, Wildlife and Environmental LawEnforcement
Division of Fisheries and Wildlife (DFW)
INTRODUCTION: The freshwater fish toxics testing efforts of Massachusetts areheaded by the MA Department of Environmental Protection (DEP) incooperation with the MA Department of Public Health (DPH), the Department ofFisheries, Wildlife and Environmental Law Enforcement (DFWELE). The DPH leadsefforts to determine the public health impacts of consuming contaminated fishfrom various locations. These collaborative efforts ensure the state’s ability toconduct limited testing and evaluation of contaminants in fish tissue for purposesof protecting public health and the environment. This Memorandum ofUnderstanding (MOU) is limited to the freshwater environment.
PURPOSE: This Memorandum of Understanding is issued by the InteragencyCommittee to formalize and communicate its goals, objectives andresponsibilities for monitoring and assessing toxic contaminants in fresh water fishin Massachusetts.
AUTHORITY: Specific legal mandates do not exist for testing freshwater fish fortoxic contaminants. This work, however, is viewed as desirable by the threeagencies relative to their respective authorities and mandates, including but notlimited to, protecting public health, controlling toxic substances in theenvironment and protecting wildlife resources. This committee does not haveresponsibility to direct testing of fish for contaminants at hazardous material sites,but does participate in the process as part of the Superfund programs.
OBJECTIVES: The primary objective of the MOU is to establish a formalinteragency mechanism to facilitate the communication, coordination and
17
dissemination of information pertaining to contaminants in freshwater fish. Theobjectives of the fish monitoring efforts are described below. Monitoring andassessment activities are planned annually and are based on the agencies’respective available resources. Therefore, in any given year, the scope of themonitoring and assessment efforts may or may not fulfill some or all of thefollowing objectives.
o To determine the public health impacts from human consumptionof contaminated fish species from various freshwater bodies in theCommonwealth.
o To develop appropriate technical support documents and publichealth advisories.
o To develop outreach strategies and environmental educationprograms for health care professionals, local health agencies andthe potentially exposed target populations.
o To coordinate posting efforts with appropriate local, state andfederal agencies.
o To provide information useful in managing and controlling toxicpollutants.
o To provide fish monitoring data for use as part of the overallassessment of the health of ecosystems.
o To respond to public requests for fish testing through astandardized questionnaire and ranking process to identify prioritysites to be tested.
o To establish and maintain a statewide toxics-in-fish database foruse by state and federal agencies, research and educationalinstitutions and other interested parties.
o To conduct research and development projects to enhance fishmonitoring activities and the overall health of the fish populationsand associated ecosystems of the Commonwealth.
RESPONSIBILITIES: Each of the three agencies named in this MOU haveresponsibilities unique to its mission. Specific responsibilities that relate to currentactivities are described below:
o All members of the Interagency Committee participate in theoverall planning of the Massachusetts fish toxics program, includingthe prioritization of testing sites, publication of fish toxics data andtheir use in assessing the health of ecosystems in Massachusetts.
o The Director of the Office of Research and Standards chairs andcoordinates the activities of the Interagency Committee.
o DPH-ETP will formalize a protocol for evaluating the public healthrisks of consuming contaminated fish. DEP-ORS will work closelywith DPH on this protocol to ensure that DEP’s risk analysis programis considered.
o DPH-ETP will develop a standard interim protocol for developmentof fish advisories by spring of 1994. DPH is responsible for decisionsregarding the need for public health advisories and forimplementing them.
18
o DPH-ETP in conjunction with DPH-CAU will identify & notify humanpopulations whose health may be affected due to consumption ofcontaminated fish.
o DPH-ETP in conjunction with DPH-PEU will provide relevant healthinformation to health professionals (Boards of Health, medicalcommunity, etc.) and the public regarding potential hazardsrelated to consumption of contaminated fish.
o DEP-OWM will plan and conduct annual fish sampling efforts inconjunction with DFWELE-DFW. DEP-OWM will collect and preparefish samples, manage data and report results to the committee.
o DEP-OWM will utilize monitoring results for decisions on NPDESpermits, for managing nonpoint pollution sources and to provideinformation for the Chapter 21E site discovery program in caseswhere oil and hazardous material contaminant levels are found infish.
o DEP-DWPC will use monitoring results for determining compliancewith Surface Water Quality Criteria and water use impairments.
o DFW is responsible for managing and regulating fishing as well asprotecting, maintaining, and restorating the Commonwealth’sfreshwater fish populations.
o DEP-DEA provides QA/QC technical support to the OWM and theInteragency Committee dealing with fish sampling and samplemanagement.
o DEP-DEA analyzes fish and related samples for toxic chemicals andother contaminants, and provides the validated data to the OWMand the Interagency Committee. DPH-EL will provide review andcomment on analytical laboratory issues.
o In cooperation with the OWM and the Interagency Committee,DEP-DEA & ORS conduct and publish research dealing with thedevelopment and improvement of methods for the analysis oftoxic and other contaminants in fish and other aquatic organisms;this includes evaluation of methods for assessing the exposure offish populations to toxicants (e.g., approaches involving biomarkersand toxicity testing).
o DEP-DEA & ORS advise the OWM and the Interagency Committeeon all matters related to the laboratory analysis of fish samples.
MEETINGS: Meetings are scheduled as needed. Meetings in the fall and earlywinter months generally focus on planning annual sampling activities. Springmeetings generally focus on the evaluations of laboratory analyses andappropriate agency responses.
This MOU will be reviewed and revised as necessary on an annual basis. Thefollowing signatures indicate that the three participating agencies view theirwork duties as set forth in this Memorandum of Understanding as being part oftheir respective responsibilities for controlling toxic contaminants in theenvironment, protecting the public health and protecting wildlife resources.
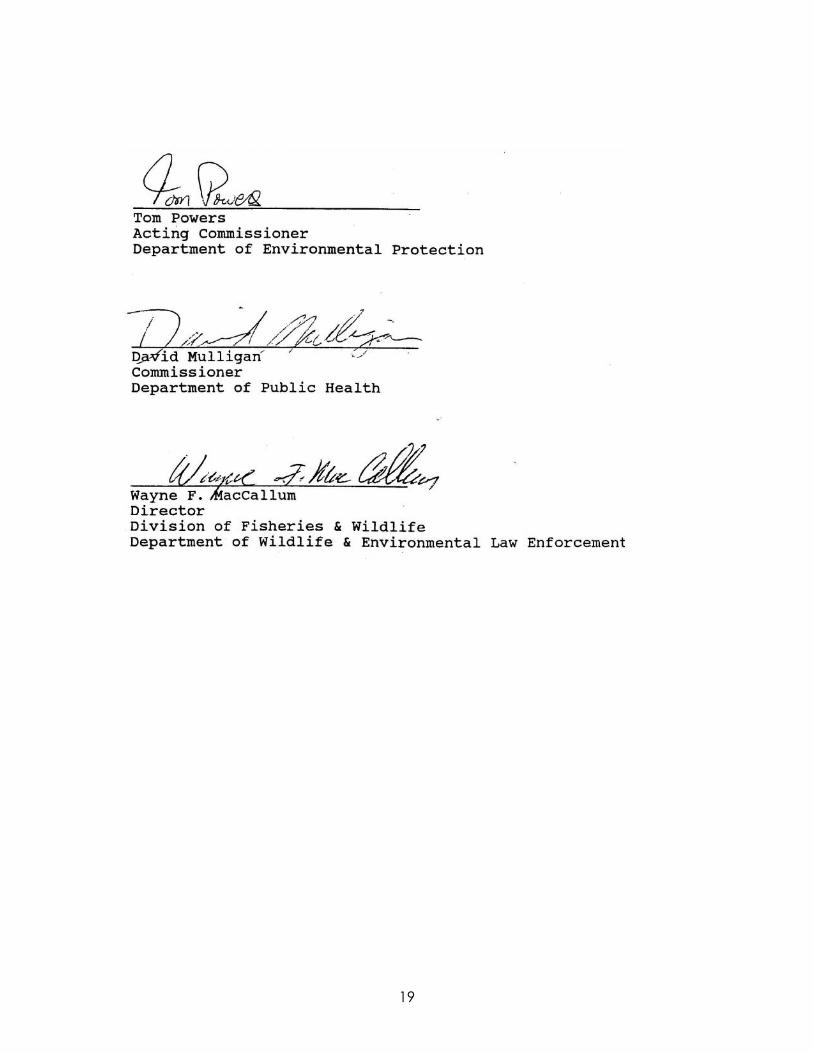
19
20
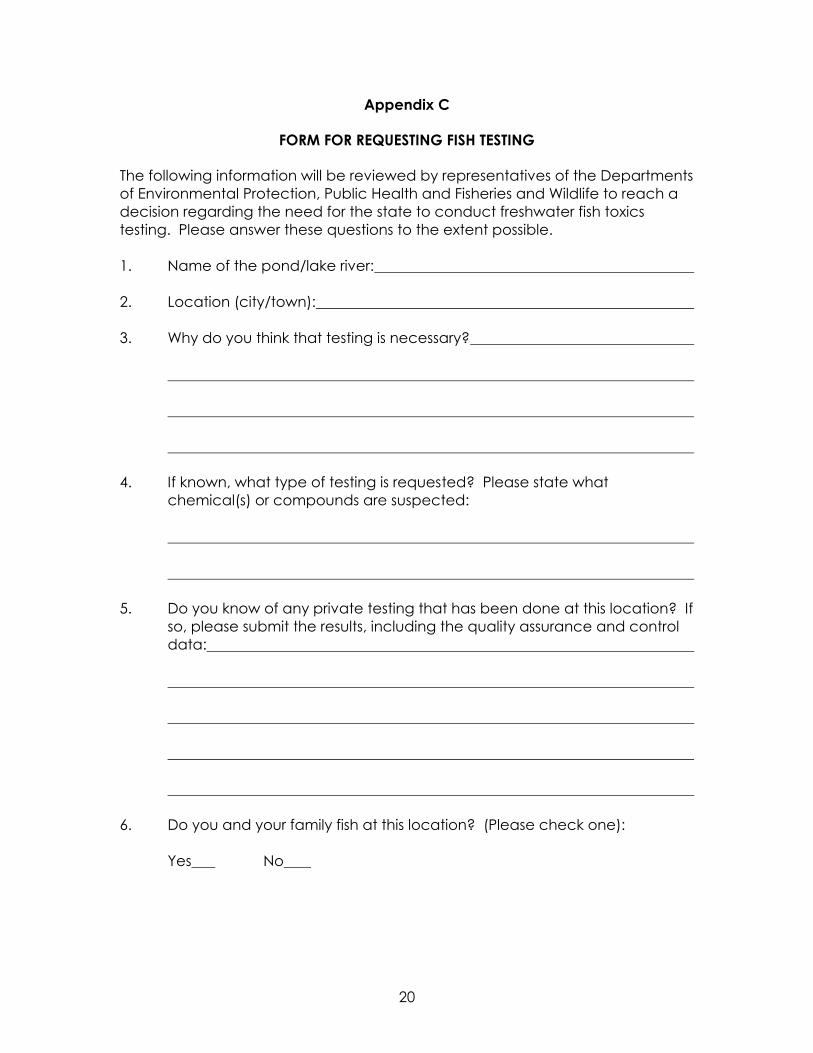
Appendix C
FORM FOR REQUESTING FISH TESTING
The following information will be reviewed by representatives of the Departmentsof Environmental Protection, Public Health and Fisheries and Wildlife to reach adecision regarding the need for the state to conduct freshwater fish toxicstesting. Please answer these questions to the extent possible.
1. Name of the pond/lake river:
2. Location (city/town):
3. Why do you think that testing is necessary?
4. If known, what type of testing is requested? Please state whatchemical(s) or compounds are suspected:
5. Do you know of any private testing that has been done at this location? Ifso, please submit the results, including the quality assurance and controldata:
6. Do you and your family fish at this location? (Please check one):
Yes No
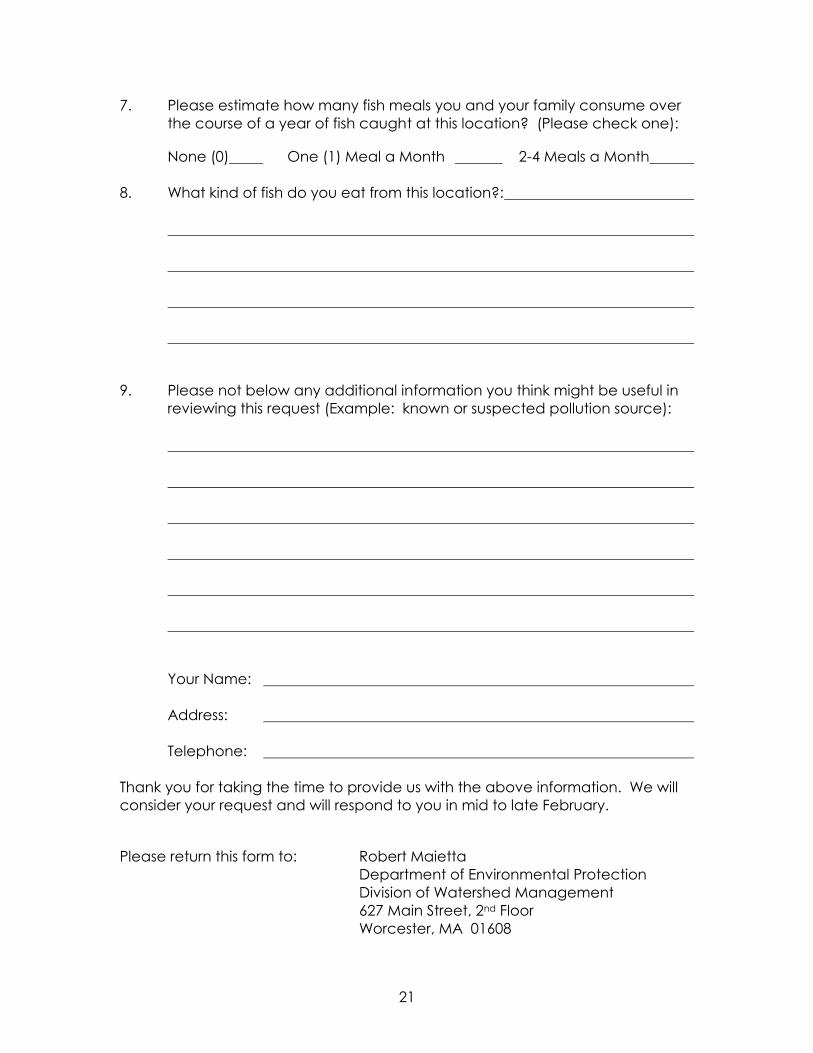
21
7. Please estimate how many fish meals you and your family consume overthe course of a year of fish caught at this location? (Please check one):
None (0) One (1) Meal a Month 2-4 Meals a Month
8. What kind of fish do you eat from this location?:
9. Please not below any additional information you think might be useful inreviewing this request (Example: known or suspected pollution source):
Your Name:
Address:
Telephone:
Thank you for taking the time to provide us with the above information. We willconsider your request and will respond to you in mid to late February.
Please return this form to: Robert MaiettaDepartment of Environmental ProtectionDivision of Watershed Management627 Main Street, 2nd FloorWorcester, MA 01608
22
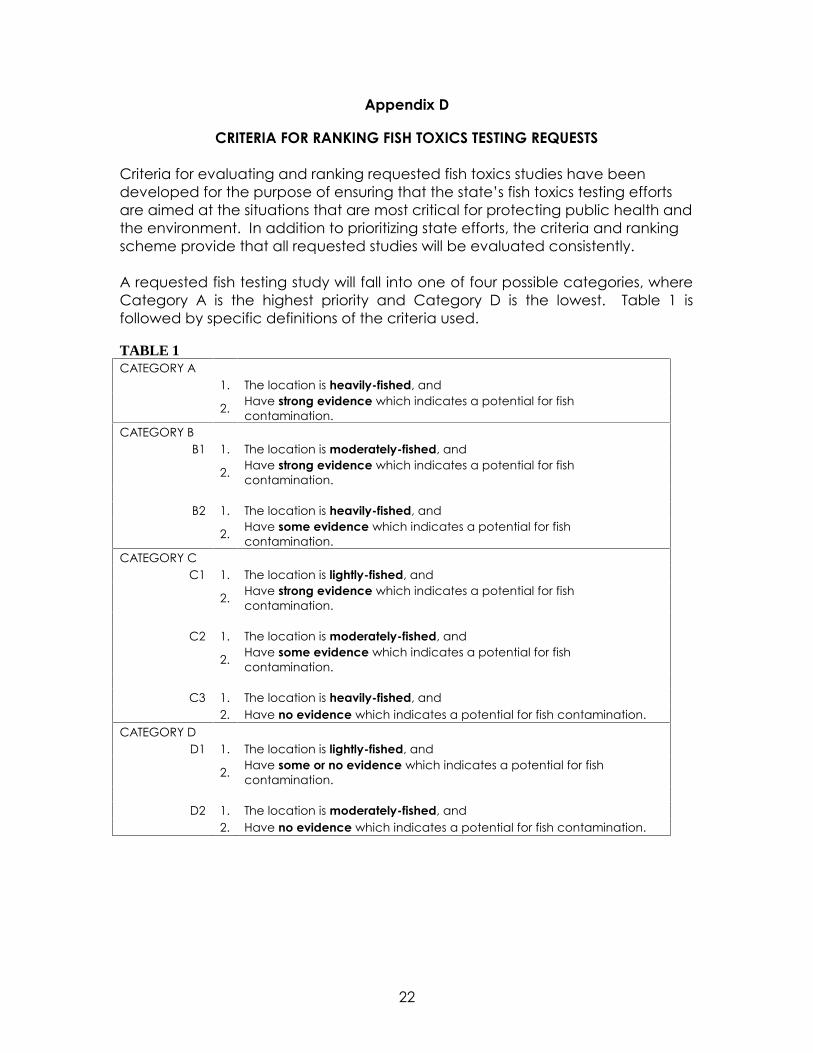
Appendix D
CRITERIA FOR RANKING FISH TOXICS TESTING REQUESTS
Criteria for evaluating and ranking requested fish toxics studies have beendeveloped for the purpose of ensuring that the state’s fish toxics testing effortsare aimed at the situations that are most critical for protecting public health andthe environment. In addition to prioritizing state efforts, the criteria and rankingscheme provide that all requested studies will be evaluated consistently.
A requested fish testing study will fall into one of four possible categories, whereCategory A is the highest priority and Category D is the lowest. Table 1 isfollowed by specific definitions of the criteria used.
TABLE 1CATEGORY A
1. The location is heavily-fished, and
2. Have strong evidence which indicates a potential for fishcontamination.
CATEGORY BB1 1. The location is moderately-fished, and
2. Have strong evidence which indicates a potential for fishcontamination.
B2 1. The location is heavily-fished, and
2. Have some evidence which indicates a potential for fishcontamination.
CATEGORY CC1 1. The location is lightly-fished, and
2. Have strong evidence which indicates a potential for fishcontamination.
C2 1. The location is moderately-fished, and
2. Have some evidence which indicates a potential for fishcontamination.
C3 1. The location is heavily-fished, and2. Have no evidence which indicates a potential for fish contamination.
CATEGORY DD1 1. The location is lightly-fished, and
2. Have some or no evidence which indicates a potential for fishcontamination.
D2 1. The location is moderately-fished, and2. Have no evidence which indicates a potential for fish contamination.
23
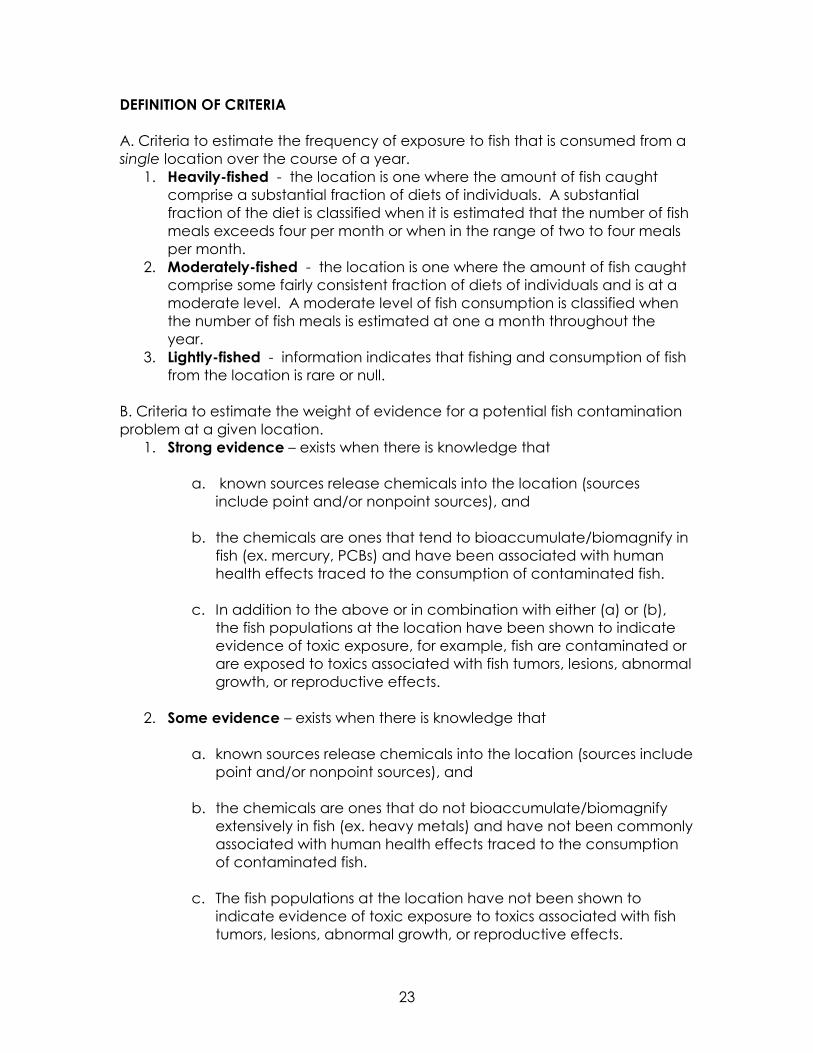
DEFINITION OF CRITERIA
A. Criteria to estimate the frequency of exposure to fish that is consumed from asingle location over the course of a year.
1. Heavily-fished - the location is one where the amount of fish caughtcomprise a substantial fraction of diets of individuals. A substantialfraction of the diet is classified when it is estimated that the number of fishmeals exceeds four per month or when in the range of two to four mealsper month.
2. Moderately-fished - the location is one where the amount of fish caughtcomprise some fairly consistent fraction of diets of individuals and is at amoderate level. A moderate level of fish consumption is classified whenthe number of fish meals is estimated at one a month throughout theyear.
3. Lightly-fished - information indicates that fishing and consumption of fishfrom the location is rare or null.
B. Criteria to estimate the weight of evidence for a potential fish contaminationproblem at a given location.
1. Strong evidence – exists when there is knowledge that
a. known sources release chemicals into the location (sourcesinclude point and/or nonpoint sources), and
b. the chemicals are ones that tend to bioaccumulate/biomagnify infish (ex. mercury, PCBs) and have been associated with humanhealth effects traced to the consumption of contaminated fish.
c. In addition to the above or in combination with either (a) or (b),the fish populations at the location have been shown to indicateevidence of toxic exposure, for example, fish are contaminated orare exposed to toxics associated with fish tumors, lesions, abnormalgrowth, or reproductive effects.
2. Some evidence – exists when there is knowledge that
a. known sources release chemicals into the location (sources includepoint and/or nonpoint sources), and
b. the chemicals are ones that do not bioaccumulate/biomagnifyextensively in fish (ex. heavy metals) and have not been commonlyassociated with human health effects traced to the consumptionof contaminated fish.
c. The fish populations at the location have not been shown toindicate evidence of toxic exposure to toxics associated with fishtumors, lesions, abnormal growth, or reproductive effects.