Embed Size (px)
Citation preview

2010 ENVIRONMENTAL PERFORMANCE INDEX
January 2010 1
2010 ENVIRONMENTAL PERFORMANCE INDEX
PRELIMINARY RESULTS FINAL REPORT WILL BE DISSEMINATED ON 12 FEBRUARY. Yale Center for Environmental Law & Policy Yale University http://envirocenter.research.yale.edu Center for International Earth Science Information Network (CIESIN) Columbia University http://ciesin.columbia.edu In collaboration with
World Economic Forum Geneva, Switzerland Joint Research Centre of the European Commission Ispra, Italy

2010 ENVIRONMENTAL PERFORMANCE INDEX
January 2010 2
ACKNOWLEDGMENTS AUTHORS Yale Center for Environmental Law & Policy, Yale University http://www.yale.edu/envirocenter Jay Emerson Daniel C. Esty Christine Kim Principal Investigator Director Research Director
Tanja Srebotnjak Statistician Center for International Earth Science Information Network, Columbia University http://ciesin.columbia.edu Marc A. Levy Valentina Mara Alex de Sherbinin Deputy Director Research Associate Senior Research Associate Malanding Jaiteh GIS Specialist IN COLLABORATION WITH World Economic Forum http://www.weforum.org Joint Research Centre (JRC), European Commission http://www.jrc.ec.europa.eu/
Andrea Saltelli Unit Head Michaela Saisana Researcher Files and data can be found online at:
http://epi.yale.edu © Yale Center for Environmental Law & Policy

2010 ENVIRONMENTAL PERFORMANCE INDEX
January 2010 3
EXPERT CONTRIBUTORS John van Aardenne Joint Research Centre, EC Matthias Bruckner UN Department of Economic and Social Affairs Geneviève Carr UNEP GEMS/Water Programme Tom Damassa World Resources Institute Adrian Deveny Resources for the Future Monique Dubé UNEP GEMS/Water Samah Elsayed World Resources Institute Majid Ezzati Harvard University James Galloway University of Virginia Thomas Gumbricht International Center for Research on Agro-Forestry Tomáš Hák Charles University Matthew Hansen University of South Dakota Kelly Hodgson
UNEP GEMS/Water Bart Holvoet Forest Stewardship Council-Belgium Richard Houghton Woods Hole Research Center Jonathan Koomey Lawrence Berkeley Laboratory Mette Loyche-Wilkie Food and Agriculture Organization of the UN Erin Madeira Resources for the Future Emilio Mayorga University of Washington), Denise Mauzerall Princeton University Sascha Müller-Kraenner The Nature Conservancy Freddy Nachtergaele Food and Agriculture Organization of the UN John O’Connor OconEco Daniel Pauly
University of British Columbia László Pintér International Institute for Sustainable Development Annette Prüss-Ustün World Health Organization Carmen Revenga The Nature Conservancy Carrie Rickwood UNEP GEMS/Water Richard Robarts Matthew Rodell NASA’s Goddard Space Flight Center Phil Ross Statistical Consultant Lee Schipper Precourt Energy Efficiency Center, Stanford University Helga Willer Research Institute of Organic Agriculture Louisa Wood International Union for Conservation of Nature). John Volpe University of Victoria

2010 ENVIRONMENTAL PERFORMANCE INDEX
January 2010 4
RESEARCH STAFF Yale Center for Environmental Law & Policy William E. Dornbos Associate Director Ysella Edyvean Outreach Coordinator Rachel Easton Administrative Assistant Jessica Jiang Research Associate
Research Assistants Diana Connett Jacob Meyer Alyssa Go Brian Irving Rebecca Kagan Jeremy Lent Brent Peich Mariana Sarmiento Alice Song Lucy Sorensen Dylan Walsh Jennifer Wang Melissa Wu
Center for International Earth Science Information Network Research Assistants Paola Kim Mimi Stith Suggested Citation Emerson, J., D. C. Esty, M.A. Levy, C.H. Kim, V. Mara, A. de Sherbinin, and T. Srebotnjak. 2010. 2010 Environmental Performance Index. New Haven: Yale Center for Environmental Law and Policy. Disclaimers The 2010 Environmental Performance Index (EPI) tracks national environmental results on a quantitative basis, measuring proximity to an established set of policy targets using the best data available. Data constraints and limitations in methodology make this a work in progress. Further refinements will be undertaken over the next few years. Comments, suggestions, feedback, and referrals to better data sources are welcome at: http://epi.yale.edu or [email protected]. The word “country” is used loosely in this report to refer both to countries and other administrative or economic entities. Similarly the maps presented are for illustrative purposes and do not imply any political preference in cases where territory is under dispute. Acknowledgments The 2010 Environmental Performance Index (EPI) represents the result of extensive consultations with subject-area specialists, statisticians, and policymakers around the world. Since any attempt to measure environmental performance requires both an in-depth knowledge of each dimension as well as the relationships between dimensions and the application of sophisticated statistical techniques to each, we have drawn on the expertise of a network of individuals, including: John van Aardenne, Matthias Bruckner, Geneviève Carr, Tom Damassa ,

2010 ENVIRONMENTAL PERFORMANCE INDEX
January 2010 5
Adrian Deveny, Monique Dubé, Samah Elsayed, Majid Ezzati, James Galloway, Thomas Gumbricht, Tomáš Hák, Matthew Hansen, Kelly Hodgson, Bart Holvoet, Richard Houghton, Jonathan Koomey, Mette Loyche-Wilkie, Erin Madeira, Emilio Mayorga, Denise Mauzerall, Sascha Müller-Kraenner, Freddy Nachtergaele, John O’Connor, Daniel Pauly, László Pintér, Annette Prüss-Ustün, Carmen Revenga, Richard Robarts, Carrie Rickwood, Matthew Rodell, Phil Ross, Lee Schipper, Helga Willer, Louisa Wood, and John Volpe. We are particularly indebted to the staff and research assistants at the Yale Center for Environmental Law and Policy and the Center for International Earth Science Information Network, notably: Diana Connett, Jessica Jiang, Paola Kim, Jacob Meyer, Mariana Sarmiento, and Mimi Stith. The 2010 EPI is built upon the work of a range of data providers, including our own prior data development work for the Pilot 2006 EPI, 2008 EPI, and the 2005 Environmental Sustainability Index. The data are drawn primarily from international, academic, and research institutions with subject-area expertise, success in delivering operational data, and the capacity to produce policy-relevant interdisciplinary information tools. We are indebted to the data collection agencies listed in the Methodology Section. We wish to acknowledge with gratitude the financial support of FedEx, The Summit Foundation, and The Samuel Family Foundation.

2010 ENVIRONMENTAL PERFORMANCE INDEX
January 2010 6
TABLE OF CONTENTS
ACKNOWLEDGMENTS ..................................................................................................2 TABLE OF CONTENTS...................................................................................................6 EXECUTIVE SUMMARY .................................................................................................7
Policy Conclusions ............................................................................................................................... 8 1. THE PURPOSE OF THE ENVIRONMENTAL PERFORMANCE INDEX ...............11 2. THE EPI FRAMEWORK..........................................................................................14
2.1. Indicator Selection .................................................................................................................... 16 2.2. Targets ....................................................................................................................................... 16 2.3. Data Sources and Types .......................................................................................................... 17 2.4. Data Gaps and Country Data Coverage .................................................................................. 17 Box 2.1 Missing Data .......................................................................................................................... 18 2.4. Calculating the EPI.................................................................................................................... 21 2.5. Data Aggregation and Weighting ............................................................................................ 23
3. RESULTS AND ANALYSIS ....................................................................................25 3.1. Overall EPI Results ..................................................................................................................... 25 3.2. Results by Peer Groupings ........................................................................................................ 33 3.3. Cluster Analysis .......................................................................................................................... 39 3.4. EPI Drivers ................................................................................................................................... 43
5. THE 2010 EPI, 2008 EPI, PILOT 2006 EPI, AND ENVIRONMENTAL SUSTAINABILITY INDEX..............................................................................................46
Comparison of the 2010 Environmental Performance Index and the 2008 Environmental Performance Index .............................................................................................................................. 46 Comparison of the Environmental Sustainability Index and the Environmental Performance Index ..................................................................................................................................................... 48
6. TREND DATA ........................................................................................................54 6.1. Water (effects on human health)................................................................................................ 54 6.2. Climate Change ........................................................................................................................... 57 6.3. Other trends................................................................................................................................. 59 6.4. Conclusions from the Trend Analysis....................................................................................... 60
REFERENCES...............................................................................................................61
2010 ENVIRONMENTAL PERFORMANCE INDEX
January 2010 7
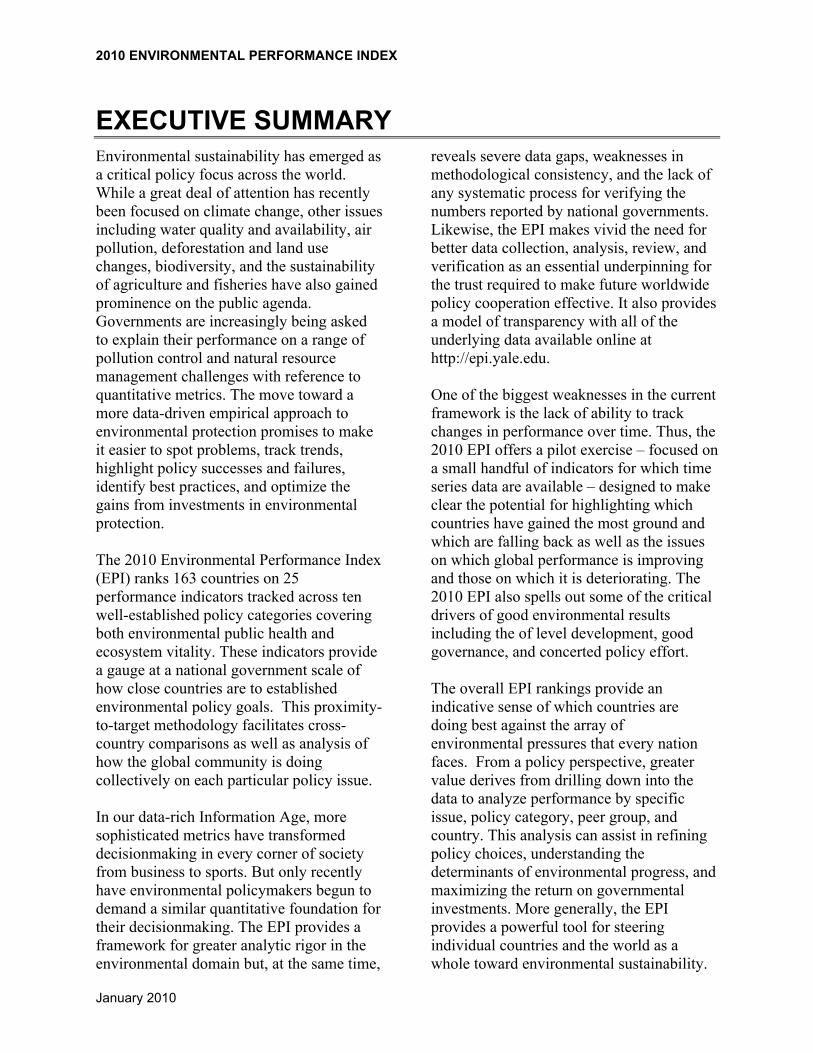
EXECUTIVE SUMMARY Environmental sustainability has emerged as a critical policy focus across the world. While a great deal of attention has recently been focused on climate change, other issues including water quality and availability, air pollution, deforestation and land use changes, biodiversity, and the sustainability of agriculture and fisheries have also gained prominence on the public agenda. Governments are increasingly being asked to explain their performance on a range of pollution control and natural resource management challenges with reference to quantitative metrics. The move toward a more data-driven empirical approach to environmental protection promises to make it easier to spot problems, track trends, highlight policy successes and failures, identify best practices, and optimize the gains from investments in environmental protection. The 2010 Environmental Performance Index (EPI) ranks 163 countries on 25 performance indicators tracked across ten well-established policy categories covering both environmental public health and ecosystem vitality. These indicators provide a gauge at a national government scale of how close countries are to established environmental policy goals. This proximity-to-target methodology facilitates cross-country comparisons as well as analysis of how the global community is doing collectively on each particular policy issue. In our data-rich Information Age, more sophisticated metrics have transformed decisionmaking in every corner of society from business to sports. But only recently have environmental policymakers begun to demand a similar quantitative foundation for their decisionmaking. The EPI provides a framework for greater analytic rigor in the environmental domain but, at the same time,
reveals severe data gaps, weaknesses in methodological consistency, and the lack of any systematic process for verifying the numbers reported by national governments. Likewise, the EPI makes vivid the need for better data collection, analysis, review, and verification as an essential underpinning for the trust required to make future worldwide policy cooperation effective. It also provides a model of transparency with all of the underlying data available online at http://epi.yale.edu. One of the biggest weaknesses in the current framework is the lack of ability to track changes in performance over time. Thus, the 2010 EPI offers a pilot exercise – focused on a small handful of indicators for which time series data are available – designed to make clear the potential for highlighting which countries have gained the most ground and which are falling back as well as the issues on which global performance is improving and those on which it is deteriorating. The 2010 EPI also spells out some of the critical drivers of good environmental results including the of level development, good governance, and concerted policy effort. The overall EPI rankings provide an indicative sense of which countries are doing best against the array of environmental pressures that every nation faces. From a policy perspective, greater value derives from drilling down into the data to analyze performance by specific issue, policy category, peer group, and country. This analysis can assist in refining policy choices, understanding the determinants of environmental progress, and maximizing the return on governmental investments. More generally, the EPI provides a powerful tool for steering individual countries and the world as a whole toward environmental sustainability.
2010 ENVIRONMENTAL PERFORMANCE INDEX
January 2010 8
Policy Conclusions * Environmental decisionmaking can be made more fact-based and empirical. A data-driven approach to policymaking promises to make decisionmaking more analytically rigorous and yield systematically better results. * While the 2010 EPI demonstrates the potential for better metrics and more refined policy analysis, it also highlights the fact that significant data gaps and methodological limitations hamper movement in this direction. * Policymakers should move to establish better data collection, methodologically consistent reporting, mechanisms for verification, and a commitment to environmental data transparency. * Policymakers need to set clear policy targets and shift toward more analytically rigorous environmental protection efforts at the global, regional, national, state/provincial, local, and corporate scales. * Wealth correlates highly with EPI scores. In particular, wealth has a strong association with environmental health results. But at every level of development, some countries fail to keep up with their income-group peers while others achieve outstanding results. Statistical analysis suggests that in many cases good governance contributes to better environmental outcomes.
* Environmental challenges come in several forms, varying with wealth and development. Some issues arise from the resource and pollution impacts of industrialization – including greenhouse gas emissions and rising levels of waste – and largely affect developed countries. Other challenges, such as access to safe drinking water and basic sanitation, derive from poverty and under-investment in basic environmental amenities – and primarily affect developing nations. Limited endowments in water and forest resources constrain choices but need not necessarily impair performance. * The EPI uses the best available global data sets on environmental performance. However, the overall data quality and availability is alarmingly poor. The lack of time-series data for most countries and the absence of broadly-collected and methodologically-consistent indicators for basic concerns, such as water quality, still hamper efforts to shift pollution control and natural resource management onto more empirical grounds. *The 2010 EPI represents a work-in-progress. It aims not only to inform but also to stimulate debate on defining the appropriate metrics and methodologies for evaluating environmental performance. Feedback, comments, suggestions, and criticisms are all welcome in the Comments section at http://epi.yale.edu.

2010 ENVIRONMENTAL PERFORMANCE INDEX
January 2010 9
Table 1.1: EPI scores (by rank)
Rank Country Score Rank Country Score Rank Country Score 1 Iceland 93.5 56 Syria 64.6 111 Tajikistan 51.3 2 Switzerland 89.1 57 Estonia 63.8 112 Mozambique 51.2 3 Costa Rica 86.4 58 Sri Lanka 63.7 113 Kuwait 51.1 4 Sweden 86.0 59 Georgia 63.6 114 Solomon Islands 51.1 5 Norway 81.1 60 Paraguay 63.5 115 South Africa 50.8 6 Mauritius 80.6 61 United States 63.5 116 Gambia 50.3 7 France 78.2 62 Brazil 63.4 117 Libya 50.1 8 Austria 78.1 63 Poland 63.1 118 Honduras 49.9 9 Cuba 78.1 64 Venezuela 62.9 119 Uganda 49.8
10 Colombia 76.8 65 Bulgaria 62.5 120 Madagascar 49.2 11 Malta 76.3 66 Israel 62.4 121 China 49.0 12 Finland 74.7 67 Thailand 62.2 122 Qatar 48.9 13 Slovakia 74.5 68 Egypt 62.0 123 India 48.3 14 United Kingdom 74.2 69 Russia 61.2 124 Yemen 48.3 15 New Zealand 73.4 70 Argentina 61.0 125 Pakistan 48.0 16 Chile 73.3 71 Greece 60.9 126 Tanzania 47.9 17 Germany 73.2 72 Brunei 60.8 127 Zimbabwe 47.8 18 Italy 73.1 73 Macedonia 60.6 128 Burkina Faso 47.3 19 Portugal 73.0 74 Tunisia 60.6 129 Sudan 47.1 20 Japan 72.5 75 Djibouti 60.5 130 Zambia 47.0 21 Latvia 72.5 76 Armenia 60.4 131 Oman 45.9 22 Czech Republic 71.6 77 Turkey 60.4 132 Guinea-Bissau 44.7 23 Albania 71.4 78 Iran 60.0 133 Cameroon 44.6 24 Panama 71.4 79 Kyrgyzstan 59.7 134 Indonesia 44.6 25 Spain 70.6 80 Laos 59.6 135 Rwanda 44.6 26 Belize 69.9 81 Namibia 59.3 136 Guinea 44.4 27 Antigua & Barbuda 69.8 82 Guyana 59.2 137 Bolivia 44.3 28 Singapore 69.6 83 Uruguay 59.1 138 Papua New Guinea 44.3 29 Serbia & Montenegro 69.4 84 Azerbaijan 59.1 139 Bangladesh 44.0 30 Ecuador 69.3 85 Viet Nam 59.0 140 Burundi 43.9 31 Peru 69.3 86 Moldova 58.8 141 Ethiopia 43.1 32 Denmark 69.2 87 Ukraine 58.2 142 Mongolia 42.8 33 Hungary 69.1 88 Belgium 58.1 143 Senegal 42.3 34 El Salvador 69.1 89 Jamaica 58.0 144 Uzbekistan 42.3 35 Croatia 68.7 90 Lebanon 57.9 145 Bahrain 42.0 36 Dominican Republic 68.4 91 Sao Tome & Principe 57.3 146 Equatorial Guinea 41.9 37 Lithuania 68.3 92 Kazakhstan 57.3 147 North Korea 41.8 38 Nepal 68.2 93 Nicaragua 57.1 148 Cambodia 41.7 39 Suriname 68.2 94 South Korea 57.0 149 Botswana 41.3 40 Bhutan 68.0 95 Gabon 56.4 150 Iraq 41.0 41 Luxembourg 67.8 96 Cyprus 56.3 151 Chad 40.8 42 Algeria 67.4 97 Jordan 56.1 152 United Arab Emirates 40.7 43 Mexico 67.3 98 Bosnia & Herzegovina 55.9 153 Nigeria 40.2 44 Ireland 67.1 99 Saudi Arabia 55.3 154 Benin 39.6 45 Romania 67.0 100 Eritrea 54.6 155 Haiti 39.5 46 Canada 66.4 101 Swaziland 54.4 156 Mali 39.4 47 Netherlands 66.4 102 Côte d'Ivoire 54.3 157 Turkmenistan 38.4 48 Maldives 65.9 103 Trinidad and Tobago 54.2 158 Niger 37.6 49 Fiji 65.9 104 Guatemala 54.0 159 Togo 36.4 50 Philippines 65.7 105 Congo 54.0 160 Angola 36.3 51 Australia 65.7 106 Dem. Rep. Congo 51.6 161 Mauritania 33.7 52 Morocco 65.6 107 Malawi 51.4 162 Central African Rep. 33.3 53 Belarus 65.4 108 Kenya 51.4 163 Sierra Leone 32.1 54 Malaysia 65.0 109 Ghana 51.3 55 Slovenia 65.0 110 Myanmar 51.3
2010 ENVIRONMENTAL PERFORMANCE INDEX
January 2010 10
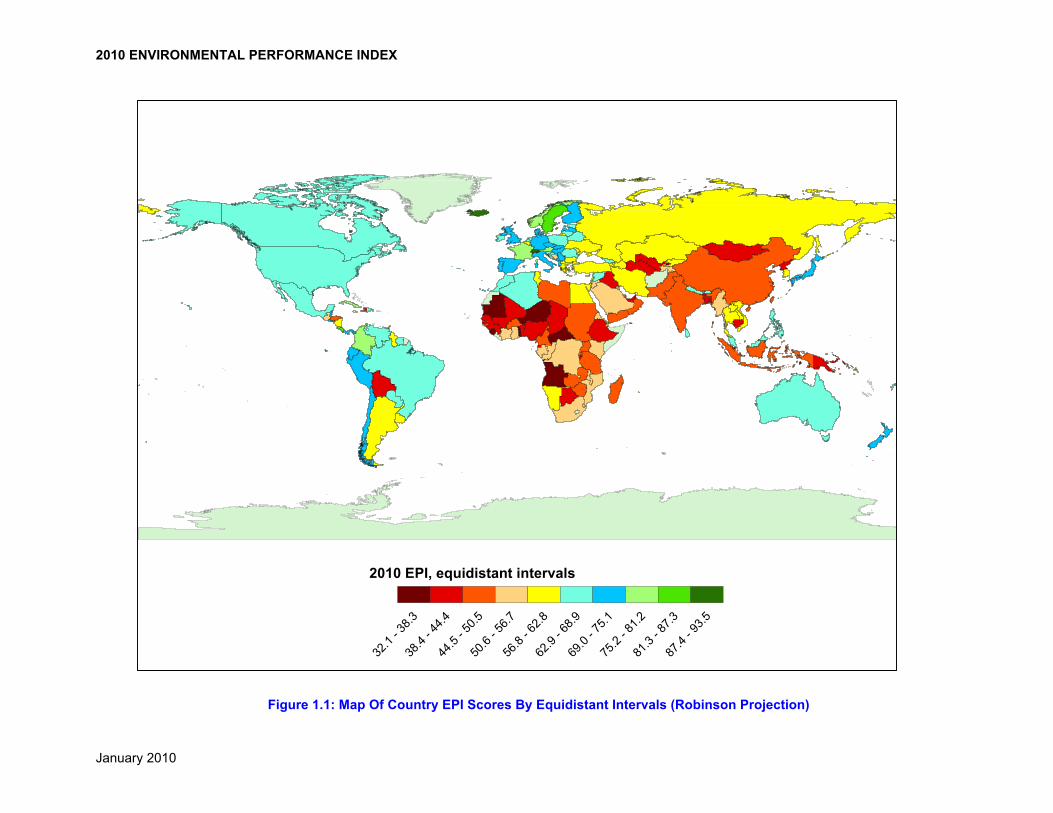
Figure 1.1: Map Of Country EPI Scores By Equidistant Intervals (Robinson Projection)
2010 EPI, equidistant intervals
32.1
- 38.3
38.4
- 44.4
44.5
- 50.5
50.6
- 56.7
56.8
- 62.8
62.9
- 68.9
69.0
- 75.1
75.2
- 81.2
81.3
- 87.3
87.4
- 93.5

2010 ENVIRONMENTAL PERFORMANCE INDEX
January 2010 11
1. THE PURPOSE OF THE ENVIRONMENTAL PERFORMANCE INDEX There has never been a more pressing need for effective environmental policies as there is today. Nonetheless, policymakers trying to parse through the growing body of environmental data face complex challenges such as incomplete and conflicting data, causal complexity, varying values and preferences, and uncertainty. The 2010 Environmental Performance Index (EPI) addresses these difficulties by providing a structure that grounds environmental policymaking in a set of quantitative indicators, permitting comparative analysis via peer-group benchmarking and a mechanism identifying leaders, laggards, and best practices. The 2010 Environmental Performance Index is a compilation of carefully selected indicators gleaned from an extensive review of the scientific literature and consultations with experts in different domains. To this end, the 2010 EPI covers a comprehensive yet manageable body of information about core pollution and resource management issues. While there is no widely-accepted answer to the proper scope of an environmental index, we believe that our set of 25 indicators presents the most relevant and pressing issues with precise methodology and critical transparency. The 2010 EPI draws upon ten years of research and six reports (from the pilot Environmental Sustainability Index in the year 2000 to the 2008 EPI) as well as feedback from more than 70 governments and hundreds of policymakers to present a refined analysis of current environmental issues. The 2010 EPI seeks to offer an indispensible tool for enhanced environmental policymaking. Through its proximity-to-target approach that uses
current environmental status relative to a policy target, the EPI seeks to meet the need to track on-the-ground environmental results. Specifically, the 2010 EPI: • highlights current environmental
problems and high-priority issues; • tracks pollution control and natural
resource management trends at regional, national, and international levels;
• identifies policies currently producing good results;
• identifies where ineffective efforts can be halted and funding redeployed;
• provides a baseline for cross-country and cross-sectoral performance comparisons;
• facilitates benchmarking and offers decision-making guidance;
• spotlights best practices and successful policy models.
The 2010 EPI also elucidates linkages between environmental policy and other issue areas such as public health, revealing new, effective leverage points for change. As more accurate information – particularly time-series data – becomes available, policymakers will soon be able to track their country’s progress toward policy targets. If investments are made in data and monitoring, future EPIs will be able to gauge the trajectory of the global community toward stronger environmental performance. The EPI is, in part, a response to the 2000 Millennium Declaration and the Millennium Development Goals (MDGs). Major global efforts are underway in education improvement, healthcare expansion, and poverty reduction. Meanwhile, the achievement of environmental sustainability

2010 ENVIRONMENTAL PERFORMANCE INDEX
January 2010 12
goals has fallen behind. This lag is partially due to the lack of clearly-defined environmental goals which would help to illuminate the problems we face, quantify the burdens imposed by environmental degradation, measure policy progress, and assure private and public funders of the return on their investments. Any multi-issue environmental performance measurement system can be characterized largely in terms of how it achieves two core functions: (1) specifying an architecture that identifies high-priority issues; and (2) calculating metrics on a common scale. The Ecological Footprint,1 for example, is based on an architecture that includes natural resources that are related to consumption but omits non-consumption issues such as pollution and waste management. Its core metric is land area associated with consumption processes. On the other hand, Green GDP2 or Environmental Accounts are based on environmental assets that are commercially exploited and quantify that in terms of economic value expressed in units of currency. The EPI, by contrast, incorporates all high-priority issues, including resource consumption, depletion of environmental assets, pollution, waste management, species loss, and so on. It is flexible enough to incorporate almost any issue deemed to be a high priority. It is flexible in this regard because the metric it relies on is proximity-to-target, as opposed to land area or economic value. None of these three approaches is uniformly superior to the others. They function best in complement to each other.
1 http://www.footprintnetwork.org 2 http://en.wikipedia.org/wiki/Green_gross_domestic_product
Given the billions spent on environmental programs and remediation, there is a need for robust metrics to guide policy. The Yale Center for Environmental Law and Policy and the Center for International Earth Science Information Network at Columbia University’s Earth Institute offer the 2010 EPI as a path to set explicit environmental targets, measure quantitative progress toward these goals, and undertake policy evaluation. We hope that by being transparent about the limitations of this exercise and the data that underpin it, the 2010 EPI will encourage more rigorous and transparent data collection and analysis around the globe.

2010 ENVIRONMENTAL PERFORMANCE INDEX
January 2010 13
Table 1.2: EPI scores (alphabetical) Rank Country Score Rank Country Score Rank Country Score
23 Albania 71.4 59 Georgia 63.6 5 Norway 81.1 42 Algeria 67.4 17 Germany 73.2 131 Oman 45.9
160 Angola 36.3 109 Ghana 51.3 125 Pakistan 48.0 27 Antigua & Barbuda 69.8 71 Greece 60.9 24 Panama 71.4 70 Argentina 61.0 104 Guatemala 54.0 138 Papua New Guinea 44.3 76 Armenia 60.4 136 Guinea 44.4 60 Paraguay 63.5 51 Australia 65.7 132 Guinea-Bissau 44.7 31 Peru 69.3 8 Austria 78.1 82 Guyana 59.2 50 Philippines 65.7
84 Azerbaijan 59.1 155 Haiti 39.5 63 Poland 63.1 145 Bahrain 42.0 118 Honduras 49.9 19 Portugal 73.0 139 Bangladesh 44.0 33 Hungary 69.1 122 Qatar 48.9 53 Belarus 65.4 1 Iceland 93.5 45 Romania 67.0 88 Belgium 58.1 123 India 48.3 69 Russia 61.2 26 Belize 69.9 134 Indonesia 44.6 135 Rwanda 44.6
154 Benin 39.6 78 Iran 60.0 91 Sao Tome & Principe 57.3 40 Bhutan 68.0 150 Iraq 41.0 99 Saudi Arabia 55.3
137 Bolivia 44.3 44 Ireland 67.1 143 Senegal 42.3 98 Bosnia & Herz. 55.9 66 Israel 62.4 29 Serbia & Montenegro 69.4
149 Botswana 41.3 18 Italy 73.1 163 Sierra Leone 32.1 62 Brazil 63.4 89 Jamaica 58.0 28 Singapore 69.6 72 Brunei Darussalam 60.8 20 Japan 72.5 13 Slovakia 74.5 65 Bulgaria 62.5 97 Jordan 56.1 55 Slovenia 65.0
128 Burkina Faso 47.3 92 Kazakhstan 57.3 114 Solomon Islands 51.1 140 Burundi 43.9 108 Kenya 51.4 115 South Africa 50.8 148 Cambodia 41.7 113 Kuwait 51.1 94 South Korea 57.0 133 Cameroon 44.6 79 Kyrgyzstan 59.7 25 Spain 70.6 46 Canada 66.4 80 Laos 59.6 58 Sri Lanka 63.7
162 Central Afr. Republic 33.3 21 Latvia 72.5 129 Sudan 47.1 151 Chad 40.8 90 Lebanon 57.9 39 Suriname 68.2 16 Chile 73.3 117 Libya 50.1 101 Swaziland 54.4
121 China 49.0 37 Lithuania 68.3 4 Sweden 86.0 10 Colombia 76.8 41 Luxembourg 67.8 2 Switzerland 89.1
105 Congo 54.0 73 Macedonia 60.6 56 Syria 64.6 3 Costa Rica 86.4 120 Madagascar 49.2 111 Tajikistan 51.3
102 Côte d'Ivoire 54.3 107 Malawi 51.4 126 Tanzania 47.9 35 Croatia 68.7 54 Malaysia 65.0 67 Thailand 62.2 9 Cuba 78.1 48 Maldives 65.9 159 Togo 36.4
96 Cyprus 56.3 156 Mali 39.4 103 Trinidad and Tobago 54.2 22 Czech Republic 71.6 11 Malta 76.3 74 Tunisia 60.6
106 Dem. Rep. Congo 51.6 161 Mauritania 33.7 77 Turkey 60.4 32 Denmark 69.2 6 Mauritius 80.6 157 Turkmenistan 38.4 75 Djibouti 60.5 43 Mexico 67.3 119 Uganda 49.8 36 Dominican Republic 68.4 86 Moldova 58.8 87 Ukraine 58.2 30 Ecuador 69.3 142 Mongolia 42.8 152 United Arab Emirates 40.7 68 Egypt 62.0 52 Morocco 65.6 14 United Kingdom 74.2 34 El Salvador 69.1 112 Mozambique 51.2 61 United States 63.5
146 Equatorial Guinea 41.9 110 Myanmar 51.3 83 Uruguay 59.1 100 Eritrea 54.6 81 Namibia 59.3 144 Uzbekistan 42.3 57 Estonia 63.8 38 Nepal 68.2 64 Venezuela 62.9
141 Ethiopia 43.1 47 Netherlands 66.4 85 Viet Nam 59.0 49 Fiji 65.9 15 New Zealand 73.4 124 Yemen 48.3 12 Finland 74.7 93 Nicaragua 57.1 130 Zambia 47.0 7 France 78.2 158 Niger 37.6 127 Zimbabwe 47.8
95 Gabon 56.4 153 Nigeria 40.2 116 Gambia 50.3 147 North Korea 41.8

2010 ENVIRONMENTAL PERFORMANCE INDEX
January 2010 14
2. THE EPI FRAMEWORK The 2010 EPI measures the effectiveness of national environmental protection efforts in 163 countries. Reflecting our contention that on-the-ground results are the best gauge of environmental policy, EPI indicators focus on measurable outcomes such as emissions loads or deforestation rates rather than policy inputs, such as money spent. Each indicator can be linked to well-established policy targets. The EPI measures two core objectives of environmental policy:
1. Environmental Health, which measures environmental stresses to human health; and
2. Ecosystem Vitality, which measures ecosystem health and natural resource management.
The 2010 EPI relies on 25 indicators that capture the best worldwide environmental data available on a country scale. We chose the indicators through a careful analytical process that included a broad-based review of the environmental science literature, in-depth consultation with scientific experts in each policy category, evaluation of candidate data sets, identification of proxy variables where necessary, and expert judgment. The EPI also incorporates criteria from other policy assessments, including the Millennium Ecosystem Assessment, the Intergovernmental Panel on Climate Change, the Biodiversity Indicator Partnership, and the Global Environmental Outlook-4. Although several significant issue gaps remain, the 2010 EPI offers a comprehensive look across the pollution control and natural resource management challenges every country faces. The 25 indicators reflect state-of-the-art data and the best current thinking in environmental
health and ecological science. Some of these metrics track an issue of interest quite specifically. Others are proxy variables that offer a rougher gauge of policy progress by tracking a correlated variable. Each indicator corresponds to a long-term public health or ecosystem sustainability target. For each country and each indicator, a proximity-to-target value is calculated based on the gap between a country’s current results and the policy target. These targets are drawn from four sources: (1) treaties or other internationally agreed upon goals; (2) standards set by international organizations; (3) leading national regulatory requirements; or (4) expert judgment based on prevailing scientific consensus. The structure of the EPI has changed in recent years as a result of methodological refinements, so a comparison of EPI rankings across years is of indicative value only. The data matrix covers all of the countries for which an EPI can be calculated. In a few cases – such as for the water quality index and the carbon-dioxide emissions per electricity generation metric – imputation methods were used to fill gaps (documented in the accompanying spread sheet). These data gaps mean that approximately 30 countries cannot be ranked in the 2010 EPI. Using the 25 indicators, scores are calculated at three levels of aggregation, allowing analysts to drill down to better understand the underlying causes of high or low performance (see Figure 2.1).

2010 ENVIRONMENTAL PERFORMANCE INDEX
January 2010 15
The aggregation process proceeds in the following steps:
1. Scores are calculated for each of the ten core policy categories based on two to eight underlying indicators. Each underlying indicator represents a discrete data set. The ten areas are as follows: (1) Environmental Burden of Disease; (2) Water Resources for Human Health; (3) Air Quality for Human Health; (4) Air Quality for Ecosystems; (5) Water Resources for Ecosystems; (6) Biodiversity and Habitat; (7) Forestry; (8) Fisheries; (9) Agriculture; and (10) Climate Change. Each indicator’s weight is shown in Table 2, and the process of
establishing the weights is discussed in Section 2.5 below. This level of aggregation permits analysts to track countries’ relative performance within these well-established policy areas or at the disaggregated indicator level.
2. Scores are next calculated for the
objectives of Environmental Health and Ecosystem Vitality with weights allocated as shown in Table 2.1.
3. The overall Environmental
Performance Index is then calculated, based on the mean of the two broad objective scores. The rankings are based on these Index scores
Figure 2.1: Construction of the EPI

2010 ENVIRONMENTAL PERFORMANCE INDEX
January 2010 16
2.1. Indicator Selection For each of the major policy categories identified, we sought indicators to cover the full spectrum of the underlying issues. The following four criteria were used to determine the most appropriate metrics: Relevance: The indicator tracks the
environmental issue in a manner that is applicable to countries under a wide range of circumstances.
Performance orientation: The indicator
provides empirical data on ambient conditions or on-the-ground results for the issue of concern, or is a “best available data” proxy for such outcome measures.
Transparency: The indicator is based on peer
reviewed scientific data or data from the United Nations or other institutions charged with data collection.
Data quality: The data represent the best
measures available. All potential data sets were reviewed for quality and verifiability. Those that did not meet baseline quality standards were discarded.
Performance indicators ideally track a given country’s state of environment compared to targets. This would be the “states” category of the widely-used DSPIR (driving forces, pressures, states, impacts, responses) environmental assessment framework. However, data gaps forced us to use non-performance indicators in some cases. Examples include S02, NOx, and NMVOC emissions per populated land area, which are “pressure” indicators, and Pesticide Regulation and Biome Protection, which are “response” indicators.
Figure 2.2: DSPIR Framework for environmental assessment 2.2. Targets
Drivers e.g. Electricity production,
Transportation
Pressures e.g. CO2 emissions, waste
byproducts
States e.g. Water or soil quality
Impacts e.g. Adverse human health effects, lowered crop yields
Responses e.g. Regulations, Taxes,
Investments
DPSIR Framework

2010 ENVIRONMENTAL PERFORMANCE INDEX
January 2010 17
The EPI measures environmental performance using a carefully chosen set of policy targets (see last column of Table 2.1). Whenever possible, targets are based on international treaties and agreements. For issues with no international agreements, targets are derived from environmental and public health standards developed by international organizations and national governments, the scientific literature, and expert opinion. The source of targets for each indicator is found in the Indicator Profiles in Chapter 8. Where targets could not be established based on any scientific criteria, we set relative targets based on measures such as our estimation of best performance among peer countries or that
were sufficiently ambitious that all countries had some room to improve. Some targets, such as the Convention on Biological Diversity’s recommended 10% of national territory under protected areas, represent political compromises. We recognize that such targets do not necessarily reflect environmental performance required for full sustainability. Note that only a few of the indicators have explicit targets established by consensus at a global scale. This suggests that there is a need for the international and national policy communities to be clearer about the long-term goals of environmental policies set at all levels.
2.3. Data Sources and Types The indicators of the EPI are based on a wide range of data sets from international organizations, NGOs, government agencies, and academia. The data include:
• official statistics that are measured and formally reported by governments to international organizations (but which are not independently verified);
• modeled data; and • observations from monitoring stations.
In the spirit of prioritizing real-time output-based indicators, the EPI seeks to improve the
measurements of on-the-ground policy results, withstand appropriate data review and verification, and eventually employ spatial data derived from remote sensing. Spatial data processing was required for the development of some indicators (Ecosystem Ozone, Water Stress Index, and Biome Protection). More detail on the underlying data can be found in the forthcoming Chapter 4 and Indicator Profiles. At present we judged that these preliminary methods and results were not sufficiently mature to merit incorporation in the 2010 EPI.
2.4. Data Gaps and Country Data Coverage The 2010 EPI uses the best environmental data available, but exhaustive country analysis is precluded by limits in both quality and quantity in data sources. Of a possible 192 UN-recognized countries, the 2010 EPI covers 163, which is up from the 149 covered in the
2008 EPI. Still, almost 30 countries and dozens of other jurisdictions cannot be included in the EPI because data are not available in one or more of the ten policy categories.

2010 ENVIRONMENTAL PERFORMANCE INDEX
January 2010 18
Due to a lack of data, limited country coverage, methodological inconsistencies, lack of identifiable targets, or otherwise poor quality metrics, some policy relevant and scientifically important issues cannot be included in the EPI. Box 2.1 covers some of these issues, and Chapter 4 addresses others.
We would prefer not to use unverified country reported data or modeled data since they may not reliably capture what is happening on the ground. Yet, given the lack of data based on direct monitoring, the EPI contains a mixture of some “measured” data sets (most of which are unverified by independent parties) and some “modeled” indicators with a degree of imputation for missing data.
Box 2.1 Missing Data After more than a decade of work on environmental indicators, significant gaps in environmental data and monitoring remain. Environmental data and monitoring gaps include insufficient information related to the following: toxic chemical exposures; heavy metals (lead, cadmium, mercury) exposure; ambient air quality concentrations; municipal and toxic waste management; nuclear safety; pesticide safety; wetlands loss; species loss; freshwater ecosystems health; agricultural soil quality and erosion; and comprehensive greenhouse gas emissions. As data become available, future iterations of the EPI may be able to track these areas, but considerable resources will need to be invested in new data collection efforts to make this possible. Missing data is also an issue in terms of country coverage in particular data sets. To allow some data sets to be used and thus the issue tracked in the 2010 EPI, some data was imputed. These imputed figures are noted in the spreadsheet file available at http://epi.yale.edu/files. The scope of these gaps shows the seriousness of problems in international sustainability reporting. We hope that international data collectors strive to achieve greater and more accurate coverage as the technological tools and financial resources become available.

2010 ENVIRONMENTAL PERFORMANCE INDEX
January 2010 19
Table 2.1: Weights (as % of total EPI score), Sources, and Targets of EPI Objectives, Categories, Subcategories, and Indicators
Index Objectives Policy Categories Indicators Data Source Target
EPI Environmental Health (50%)
Environmental burden of disease (25%) Environmental burden of disease (25%) World Health Organization 10 DALYs (Disability Life Adjusted Years)
per 1,000 population
Air pollution (effects on humans) (12.5%) Indoor air pollution* (6.3%) World Development Indicators 0%population using solid fuels
Outdoor air pollution* (6.3%) World Development Indicators 20 ug/m3 of PM10
Water (effects on humans) (12.5) Access to water* (6.3%) World Development Indicators 100% population with access
Access to sanitation* (6.3%) World Development Indicators 100% population with access
Ecosystem Vitality (50%)
Air Pollution (effects on ecosystem) (4.2%)
Sulfur dioxide emissions per populated land area (2.1%)
Emissions Database for Global Atmospheric Research (EDGAR) v3.2, United National Framework Convention on Climate Change (UNFCCC), Regional Emissions Inventory in Asia (REAS)
0.01 Gg SO2/sq km
Nitrogen oxides emissions per populated land area* (0.7%) EDGARv3.2, UNFCCC, REAS 0.01 Gg NOx /sq km
Non-methane volatile organic compound emissions per populated land area* (0.7%) EDGARv3.2, UNFCCC, REAS 0.01 Gg NMVOC /sq km
Ecosystem ozone* (0.7%) Model for OZone and Related chemical Tracers (MOZART) II model
0 ppb exceedance above 3000 AOT40. AOT40 is cumulative exceedance above 40 ppb during daylight summer hours
Water (effects on ecosystem) (4.2%) Water quality index (2.1%)
United Nations Environment Programme (UNEP) Global Environmental Monitoring System (GEMS)/Water
Dissolved oxygen: 9.5mg/l (Temp<20ºC), 6mg /l (Temp>=20ºC); pH: 6.5 - 9mg/l; Conductivity: 500µS; Total Nitrogen: 1mg/l; Total phosphorus: 0.05mg/l; Ammonia: 0.05mg/l

2010 ENVIRONMENTAL PERFORMANCE INDEX
January 2010 20
Water stress index* (1%) University of New Hampshire Water Systems Analysis 0% territory under water stress
Water scarcity index* (1%) Fand and Agricilture Organization (FAO)of the UN 0 fraction of water overuse
Biodiversity & Habitat (4.2%) Biome protection (2.1%)
International Union for Conservation of Nature (IUCN), CIESIN
10% weighted average of biome areas
Marine protection* (1%) Sea Around Us Project, Fisheries Centre, University of British Columbia
10% of Exclusive Economic Zone (EEZ)
Critical habitat protection* (1%) Alliance for Zero Extinction, The Nature Conservancy 100% AZE sites protected
Forestry (4.2%) Growing stock change* (2.1%) FAO ratio >=1 n cubic meters / hectare Forest cover change* (2.1%) FAO % no decline
Fisheries* (4.2%) Marine trophic index (2.1%) UBC, Sea Around Us Project no decline of slope in trend line
Trawling intensity (2.1%) UBC, Sea Around Us Project 0% area with combined bottom trawl or dredge catch within declared EEZ areas
Agriculture (4.2%) Agricultural water intensity* (0.8%) FAO 10% water resources
Agricultural subsidies (1.3%)
Yale Center for Environmental Law & Policy, World Development Report, Organization of Economic Cooperation and Development (OECD)
0 Nominal Rate of Assistance (NRA)
Pesticide regulation (2.1%) UNEP-Chemicals 22 points
Climate Change (25%) Greenhouse gas emissions per capita (including land use emissions) (12.5%)
World Resources Institute (WRI) Climate Analysis Indicator Tool (CAIT), Houghton 2009, World Development Indicators (WDI) 2009
2.5 Mt CO2 eq. (Estimated value associated with 50% reduction in global GHG emissions by 2050, against 1990 levels)
CO2 emissions per electricity generation (6.3%) International Energy Agency 0 g CO2 per kWh
Industrial greenhouse gas emissions intensity (6.3%)
WRI-CAIT, WDI, Central Intelligence Agency
36.3 tons of CO2 per $mill (USD, 2005, PPP) of industrial GDP (Estimated value associated with 50% reduction in global GHG emissions by 2050, against 1990 levels)

2010 ENVIRONMENTAL PERFORMANCE INDEX
January 2010 21
2.4. Calculating the EPI To standardize all of the 25 indicators, each country score builds on an analysis of the raw data on national performance to a proximity-to-target-measure, which we spread across a scale of zero to 100. We examine the distribution of each indicator to identify whether extreme values might skew the aggregation of the indicator. Extreme outliers (greater than or equal to three standard deviations from the mean) are more likely to be the result of data processing (especially for modeled data) than actual performance. Accordingly, we adjust outliers using a recognized statistical technique called “winsorization” – in this case trimming at the 95th or 97th percentile of the distribution. In a small number of cases even this level of winsorization left significant outliers, and in such cases, we winsorized at a greater level based on a comparison of the two alternative values.
After those adjustments, an arithmetic transformation was undertaken so that the observed values were scaled from zero to 100, where 100 corresponds to the target and zero to the worst observed value. The resulting proximity-to-target scores are calculated using this formula: [100 - (target value - winsorized value)] x 100/(100 - minimum winsorized value) One important change in the 2010 EPI from previous iterations of the EPI involves the use of logarithmic transformation for many of the indicators – Disability Life Adjusted Years, Urban Particulates, Sulfur Dioxide, Nitrogen Dioxide, Volatile Organic Compounds, Ozone Exceedance, Water Stress, Marine Protected Areas, Irrigation Stress, Greenhouse Gas Emissions/Capita, Carbon Intensity of Electrical Protection, and Industrial Greenhouse Gas Intensity. This methodological refinement serves one primary purpose. Most of the indicators have a sizeable number of countries very
close to target, and we used logarithmic scales to more clearly differentiate among the best environmental performers. Using raw (untransformed) data, as we did in 2008, caused the EPI to ignore small differences among top-performing countries and only acknowledge the more substantial differences between leaders and laggards. The use of the log transformation has the effect of “spreading out” these leading countries, allowing the EPI to reflect important differences not only between the leaders and laggards, but among best-performing leaders as well. Logarithmic transformation also improves the interpretation of differences between countries at opposite ends of the scale. For example, consider two comparisons of particulate matter (PM10): top-performers Venezuela and Grenada (having PM10 values of 10.54 and 20.54, respectively), and low performers Libya and Kuwait (87.63 and 97.31, respectively). Both comparisons involve differences of 10 units on the raw scale (µg/m3), but we acknowledge that they are substantively different. Venezuela is an order of magnitude better than Grenada, while Libya and Kuwait differ by a much smaller amount in percentage terms. Compared to the use of the raw measurement scale, the log scale somewhat downplays the differences between the leaders and laggards, while more accurately reflecting the nature of differences at all ranges of performance. Thus, the 2010 EPI encourages continued improvements by the leaders, where even small improvements can be difficult to make, but provides relatively fewer rewards for the same amount of improvement among the laggards. Such improvements by the leaders would be rewarded by increasing scores in future EPIs. The impact of this change on the EPI can be seen in the PM10 policy category, where each of the underlying performance

2010 ENVIRONMENTAL PERFORMANCE INDEX
January 2010 22
indicators have been logarithmically transformed. Figure 2.3 shows the 2008 proximity to target values on the x-axis, with the 2010 air performance indicator on the y-axis. Note the large number of countries awarded proximity to target values above 95% in 2008. In comparison, the 2010 EPI performance indicators for this leading group are now spread over a range of values between 50 and 100. Finland is highlighted
with a red star, and the other European countries are highlighted with red country codes. In 2008, Sweden, Finland, and France, for example, all had virtually identical proximity to target values above 95%, and the 2008 EPI essentially ignored the differences. The 2010 EPI now provides meaningful separation between these leading countries.
Figure 2.3: 2008 EPI and 2010 EPI Air Quality for Ecosystems Proximity to Target Values

2010 ENVIRONMENTAL PERFORMANCE INDEX
January 2010 23
2.5. Data Aggregation and Weighting In the environmental indicator arena, aggregation is an area of methodological controversy. While the field of composite index construction has become a well-recognized subset of statistical analysis, there is no clear consensus on how best to construct composite indices that combine disparate issues. Various aggregation methods exist, and the choice of an appropriate method depends on the purpose of the composite indicator as well as the nature of the subject being measured. While we have assigned explicit weights in the construction of the EPI, the actual implicit weights differ slightly owing to the country score distributions and variances in each policy category. We began with some of the basic categories that policymakers must consider in environmental decisionmaking (see Figure 2.1). After an exhaustive analysis we settled on 25 indicators for the 10 policy categories, with 1 to 4 indicators per category. The Environmental Health and Ecosystem Vitality subcategories each represent 50% of the total EPI score. This equal division of the EPI into sub-scores related to humans and nature is not a matter of science but rather a policy judgment. Yet this even weighting of the two overarching objectives reflects a widely-held intuition that both humans and nature matter. This choice (used in the 2008 and 2006 Pilot EPIs) has been widely accepted. Indeed, for every deep ecologist who favors more weight being placed on Ecosystem Vitality, there is a “humans first” environmental policymaker who prefers that the tilt go the other way. Within the Environmental Health objective, the Environmental Burden of Disease indicator is weighted 50% and accordingly contributes 25% of the overall EPI score. This prominence reflects its widely regarded
status as the most comprehensive and carefully-defined measure of environmental health burdens. The effects of Water and Air Pollution on human health comprise the remainder of the Environmental Health objective and are each allocated a quarter of the total score. Within Air Pollution (effects on humans) and Water (effects on humans), the constituent indicators are equally weighted. If the Environmental Burden of Disease score was missing, Environmental Health or EPI Score was calculated. If one of two indicators in Air Pollution or Water were missing (but not both), and averaged around them was used to calculate the policy category score. Within the Ecosystem Vitality objective, the Climate Change indicator carries 50% of the weight (i.e., 25% within the total EPI). This focus on greenhouse gas emissions reflects the increasing importance attached to climate change in policy discussions and its potential to have far reaching impacts across all aspects of ecosystem health and natural resource management. The remaining policy categories – Air, Water, Biodiversity, Forestry, Fisheries, and Agriculture – are each evenly weighted to cover the remaining 50% of the Ecosystem Vitality objective. In the case of land-locked countries, an average around the Fisheries policy category was used. Otherwise, if a country was missing any policy category score it was dropped from the overall EPI (though indicators for that country are still available for download in a separate spreadsheet). For the Air Pollution (effects on ecosystems) category, ozone was available for all countries, and Sulfur Dioxide (SO2) was considered mandatory (owing to the damage caused by acid rain). If Nitrogen Oxides (NOx) was missing, then the weight of NOx

2010 ENVIRONMENTAL PERFORMANCE INDEX
January 2010 24
was evenly allocated to the remaining three air indicators. For the Water (effects on ecosystems) category, the Water Quality Index (WQI) score was deemed mandatory and the other two indicators were averaged around when missing. The Water Stress Index was available for all but the smallest countries, in terms of geographic area, owing to the grid cell size of the original data source. No Water Quality Index was reported for several countries that had surface water areas of less then 10 square kilometers. For the Biodiversity & Habitat category, if the Marine Protected Areas (MPAEEZ) and Critical Habitat Protection (AZE) indicators were missing, then the Biome Protection (PACOV) indicator received 100% of the weight. Landlocked countries have no marine protected areas, and countries without alliance for zero extinction sites (see Metadata) could not receive a score for Critical Habitat Protection. If AZE or MPAEEZ were missing, then PACOV was given 75% of the weight and the other indicator received the remaining 25%. If all three Biodiversity & Habitat indicators were present, then PACOV received 50% of the category weight, and AZE and MPAEEZ received 25% each.
For the Forestry category, if one of the two constituent indicators was missing, we substituted the other value due to the very high correlation between Forest Cover Change and Growing Stock Change. If both indicators were available, then a simple average was calculated. For the Fisheries category, all non-landlocked countries were required to have both the Marine Trophic Index and Trawling Intensity indicators, which received an equal weight. Principal Component Analysis (PCA) was used to determine the weighting for the Agriculture category indicators. Pesticide Regulation (PEST) encompassed 50% of the policy category weight, Agricultural Subsidies (AGSUB) was assigned 30%, and Agriculture Water Intensity (AGWAT) the remaining 20%. PEST and AGSUB indicators were required in order to calculate the policy category score. All three Climate Change indicators were necessary in order to arrive at the policy category score. The weightings given were 50% to Greenhouse Gas Emissions/Capita, 25% Carbon Intensity of Electricity Protection, and 25% Industrial Greenhouse Gas Emissions.

2010 ENVIRONMENTAL PERFORMANCE INDEX
January 2010 25
3. RESULTS AND ANALYSIS The 2010 EPI provides policymakers, scientists, and other experts with a quantitative basis for comparing, analyzing, and understanding environmental performance and underlying performance drivers for more than 160 countries. It reveals a set of environmental problems where progress is being made and others where it is not. It also highlights points of policy leverage. While some policy and performance correlations are well established – e.g. the strong relationship
between national income and environmental health outcomes – the reality is that they are not uniform within and across country peer groups. But, for every issue, some countries rank more highly on the index than their economic circumstances would suggest. This result means that other factors, such as good governance, also shape outcomes. The 2010 EPI provides a basis for identifying best practices linked to strong environment and development policy, highlighting performance leaders, laggards, and outliers.
3.1. Overall EPI Results The EPI is comprised of 163 countries with sufficient data for inclusion in the 2010 EPI. Iceland ranked highest, with a score of 93.5, followed by Switzerland (89.1), Costa Rica (86.4), Sweden (86.1), and Norway (81.1). As expected, developed countries with sufficient financial resources, a commitment to environmental management, and sophisticated policy systems make up a large portion of top performers. European countries constitute more than half of the countries ranked in the top 30 (Figure 3.1). Exceptions exist, however. Costa Rica, a middle-income country, outperforms most developed countries, and Cuba, with strong Environmental Health scores and low levels of industrial pollution, ranks ninth.
The countries with the worst environmental performance are Sierra Leone (32.1), the Central African Republic (33.3), Mauritania (33.7), Angola (36.4), and Togo (36.4). These sub-Saharan African countries are among the poorest in the world, lack resources for health care or basic environmental investments, and have weak policy capacity. Some hyper-arid but wealthy countries also make it into the bottom third of countries, owing largely to lack of water resources (though in 2010 we
include desalinated water as part of renewable water resources) and high greenhouse gas emissions.
The middle ranks represent a more diverse set of countries. Some developed countries with strong performances on Environmental Health objectives have poor performance on climate change and emissions, while some developing countries have moderate scores on both Environmental Health and Ecosystem Vitality objectives. Canada (66.4) is ranked at 46, the Philippines (65.7) is ranked at 50, Poland (63.1) is ranked at 63, and Laos (59.6) is ranked at 80.
Most of the world’s largest economies find themselves lagging behind the top performers. The US (63.5) is ranked at 61 – just outside the first tercile – penalized mostly for poor performance on the Climate Change and Air Pollution (effects on ecosystems) policy categories. Better, but also not among the top 10 are Germany (73.2, rank 17) and Japan (72.5, rank 20). Again, the problem areas for these countries are environmental air quality, climate change, and – in the case of Germany – fisheries management.

2010 ENVIRONMENTAL PERFORMANCE INDEX
January 2010 26
The BRIC countries – Brazil, Russia, India, and China – occupy the ranks 62 (just behind the US), 69, 123, and 121, respectively. These countries struggle with the pressures of large populations, previous pollution and mismanagement, as well as the environmental externalities associated with rapid economic growth and resource extraction. Although these countries score similarly low on the Ecosystem Vitality objective, their health care systems cannot compete with those of the US, Germany,
and Japan to reduce the Environmental Burden of Disease. Overall, their environmental problems are more diverse and require all-encompassing strategies to remedy, including ramped-up environmental investments, regulatory overhaul, more efficient and transparent institutions, and more effective enforcement of environmental laws and regulations.
Other country groupings are discussed in detail in Section 3.3 on the Cluster Analysis.
Figure 3.1 EPI performance by Region and GDP per capita

2010 ENVIRONMENTAL PERFORMANCE INDEX
January 2010 27
The EPI considers good environmental performance to be the result of good environmental policy and management practices that protect human health and preserve ecosystem vitality – the two core objectives (see Table 3.1 for correlation of the 2010 with its components). Historically, the first objective has received the bulk of attention, resources, and monitoring. As a result, Environmental Health as measured by the Environmental Burden of Disease indicator (which constitutes 25% of the overall EPI score) is a complicated mixture of:
• past and current investments in protecting human health, including availability and access to public health infrastructure;
• environmental stressors such as poor air and water quality;
• natural conditions, including weather and susceptibility to natural disasters; and
• societal and behavioral risk factors such as obesity and cardiovascular health.
Economic development correlates with all three aspects but the link is most direct with respect to the extent and quality of the health care system. The strong correlation is evident in the ranking of countries in the Ecosystem Health objective and underlying policy categories. The top 25 countries in this category are all industrialized, high-income countries, perhaps with the exception of Qatar, which uses its oil and gas revenues to provide a free health care system.
Since the EPI allocates 50% of the overall weight to the Environmental Health objective, it is not surprising that these countries benefit greatly from their ability to manage environmental health. We use the term “manage” because the Environmental Burden of Disease (EBD) can mask the true exposure of people to harmful environmental substances. EBD, measured in DALYs (disability-adjusted life years), is essentially a health gap measure, which can be influenced in two ways.
The environmental threat can be reduced or removed, or the health care system can be advanced enough to address the threat through treatment. In wealthy countries, the latter may mitigate the negative environmental effects of air and water pollution.
To correct for this, the Environmental Health objective also includes indicators that account for indoor and outdoor air pollution as well as access to clean water and sanitation. Low-performing countries have not been able to make or simply have not made the investments necessary to curtail environmental pollutants, provide adequate water and sanitation to their citizens, or build effective health care systems.
Overall, the Environmental Health objective conveys the strong message that economic development generates good public health (Figure 3.2), but with certain exceptions. Although relatively few countries perform well above expectations compared to their income level, quite a number perform well below.

2010 ENVIRONMENTAL PERFORMANCE INDEX
January 2010 28
Table 3.1: Kendall’s tau correlation coefficient between the 2010 EPI and various components
Component EPI10 Environmental Health 0.58 Ecosystem Vitality 0.20 DALYs 0.52 Air pollution (human health effects) 0.56 Water pollution (human health effects) 0.51 Air pollution (ecosystem effects) -0.08 Water pollution (ecosystem effects) 0.28 Biodiversity 0.11 Forests 0.36 Fisheries 0.11 Agriculture 0.25 Climate change 0.01
Figure 3.2 Environmental Health by log GDP per capita (gray in scatter plot represents approximately 2 standard deviations)

2010 ENVIRONMENTAL PERFORMANCE INDEX
January 2010 29
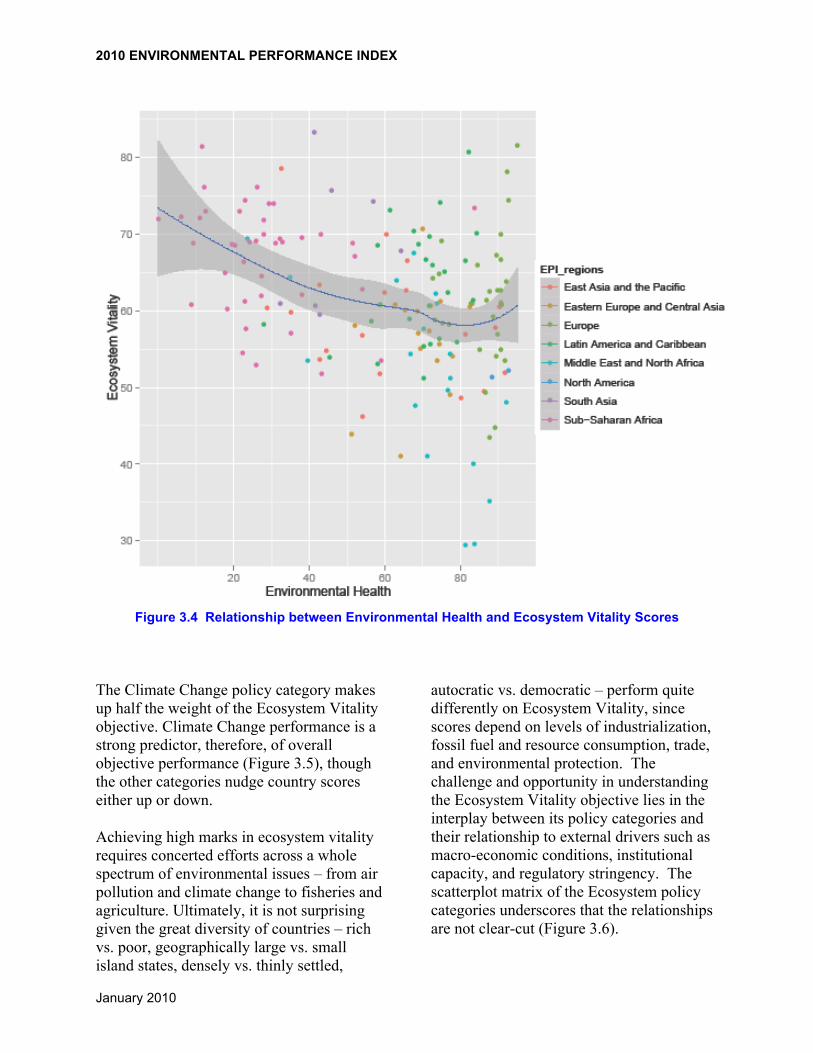
For the Ecosystem Vitality objective the effect of income is much more difficult to decipher (Figure 3.3) and requires unpacking at the policy category and indicator level. The scores in the Ecosystem Vitality objective are concentrated in a narrower range (ranging from about 30-83) than in the Environmental Health objective (ranging from 0-95) (Figure 3.4). This reflects the larger number of indicators in the objective and that some countries score
high on one policy category (e.g. Biodiversity & Habitat) but low on another (e.g. Climate Change). Bad performance in one category cancels good performance in another, dampening the overall score in this category. Forestry, which is heavily skewed towards high scores, appears to be the category that is most consistently sending a signal that is “opposite” that of the other categories (Figure 3.6).
Figure 3.3 Ecosystem Vitality by log GDP per capita (gray in scatter plot represents approximately 2 standard deviations)
2010 ENVIRONMENTAL PERFORMANCE INDEX
January 2010 30
Figure 3.4 Relationship between Environmental Health and Ecosystem Vitality Scores
The Climate Change policy category makes up half the weight of the Ecosystem Vitality objective. Climate Change performance is a strong predictor, therefore, of overall objective performance (Figure 3.5), though the other categories nudge country scores either up or down.
Achieving high marks in ecosystem vitality requires concerted efforts across a whole spectrum of environmental issues – from air pollution and climate change to fisheries and agriculture. Ultimately, it is not surprising given the great diversity of countries – rich vs. poor, geographically large vs. small island states, densely vs. thinly settled,
autocratic vs. democratic – perform quite differently on Ecosystem Vitality, since scores depend on levels of industrialization, fossil fuel and resource consumption, trade, and environmental protection. The challenge and opportunity in understanding the Ecosystem Vitality objective lies in the interplay between its policy categories and their relationship to external drivers such as macro-economic conditions, institutional capacity, and regulatory stringency. The scatterplot matrix of the Ecosystem policy categories underscores that the relationships are not clear-cut (Figure 3.6).

2010 ENVIRONMENTAL PERFORMANCE INDEX
January 2010 31
The components of the Ecosystem Vitality objective all represent relevant aspects in environmental protection and anagement. It is, however, far less clear how they tie together, what the synergies and potentially negative feedback mechanisms are. The scatterplot matrixin Figure 3.6 sheds some light on the relationships between biodiversity protection, sustainable forestry and fisheries, air and water quality management as well as climate change protection. The matrix shows each component plotted against all others while the main diagonal shows the distribution of each policy category. The mostly random scatter indicates that, contrary to the Environmental Health components, no clear-cut and simple relationships exist. It is more
likely -- but further research is necessary -- that the pathways linking, for example, agricultural management to ecological water quality are not captured well by the EPI indicators. Thus, while the
EPI gives a snapshot of the overall ability of a country to manage its environmental resources and to protect the health of its citizens from environmental pollution, it requires digging deep into the underlying policy objectives and indicators to begin to understand how sectoral practices affect outcomes in other areas. One important aspect in this context is the need for higher resolution spatial and time series since country-level aggregates cannot show how local conditions change over time.
Figure 3.5 Relationship of the Climate Change policy category to Ecosystem Vitality (gray in scatter plot represents approximately 2 standard deviations)

2010 ENVIRONMENTAL PERFORMANCE INDEX
January 2010 32
Figure 3.6 Scatter plot matrix of country scores in the seven Ecosystem Vitality policy categories

2010 ENVIRONMENTAL PERFORMANCE INDEX
January 2010 33
Countries that scored well in Ecosystem Vitality often did so for very different reasons. Of the two countries with the best objective scores, Iceland’s performance can primarily be attributed to good environmental management and a low-carbon economy. Nepal’s high score, however, arises from limited development and lower environmental stresses on the land, air, and water.
Countries varied considerably with respect to the influence of Environmental Health or Ecosystem Vitality on their overall rank. Some low-ranked countries, such as the United Arab Emirates (rank 152) have high Environmental Health scores. This result
suggests they have on-going challenges with one or more of the Ecosystem Vitality policy categories. Nepal, despite its top Ecosystem Vitality score, ranks at 88 in the EPI because of a very low Environmental Health score.
Because so many countries had high Environmental Health scores, poor performance in Ecosystem Vitality played a critical role in the overall rankings. Belgium, South Korea, and the United States exemplify countries ranked well below many members of their peer groups due to substantially lower Ecosystem Vitality scores.
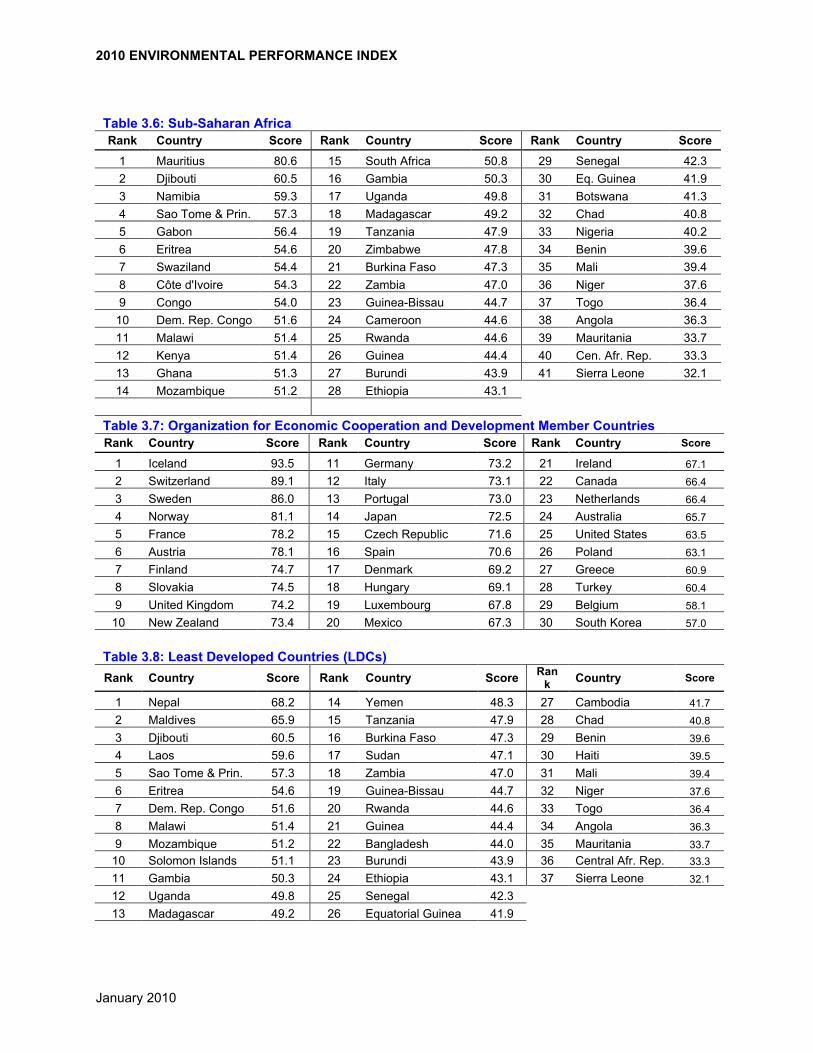
3.2. Results by Peer Groupings Although overall country ranking on the EPI is of interest, experience has shown that analysts are most interested in understanding how their countries rank within relevant regional, economic, and political peer groups. Peer group analysis gives policymakers a way to contextualize their policy choices in light of the performance of other countries with similar socioeconomic or geographic situations. The policies and programs of peer group leaders provide insight into best practices and illuminate the most efficient approaches to improving Environmental Health and Ecosystem Vitality among countries facing similar challenges and opportunities. To facilitate this analysis, Tables 3.1 through 3.6 provide the within-region ranks and overall EPI scores for major world regions.
Organization for Economic Cooperation and Development (OECD) countries occupy four of the top five ranks in the 2010 EPI (Tables 3.7 and 1.1). All of the OECD countries are in the top half of the index, and most are in
the top quarter. All of these relatively wealthy countries score highly in the Environmental Health category. But their scores for the various metrics of Ecosystem Vitality vary widely. Some of these nations, notably those in Scandinavia, have distinct geographic advantages such as large land areas and low population densities. But their success is also a function of concerted policy effort and deep commitment to environmental values across their public and business communities.
The Least Developed Countries (LDCs) (Table 3.8), score much lower than OECD countries on the EPI. None of the LDCs fall in the top half, and the bottom 18 countries in the EPI are all from this group. With little access to financial resources for immediate needs like nutrition and disease, many of these countries struggle to make even baseline efforts on environmental health. Their lack of development translates into limited pollution stress and thus contributes to relatively strong scores on ecosystem-

2010 ENVIRONMENTAL PERFORMANCE INDEX
January 2010 34
related air pollution and climate change. Many also make admirable efforts on biodiversity conservation.
High population density countries are spread throughout the EPI (Table 3.18). Germany, for example, sits in the 14th position while Burundi ranks 147th. High population density generates special challenges, but the high-ranked performers in this category demonstrate that population density is not an insurmountable barrier to good environmental quality. Many of the lower-ranked countries in this grouping face challenges, but can look to their higher-ranking peers for guidance on how to develop in an environmentally sustainable manner.
Other peer groups, such as the African Union (Table 3.14), the Alliance of Small Island States (Table 3.15), the Desert Countries (Table 3.17), and the Newly Independent States (Table 3.16), are spread across the EPI. Each of these peer groups is largely populated by developing countries that experience a number of challenges. The Desert Countries peer grouping reveals the ecological difficulties these countries face. The top ten countries in this peer group are in the second tercile of the total EPI ranking. And the bottom two – Mauritania, and Niger
– fall in the bottom 5% of the overall ranking.
The Free Trade Areas of the Americas peer group (Table 3.13) overlaps with most of the America regional grouping, with the exception of Cuba. The member countries fall in a wide range, from Costa Rica, which ranks 4th in the overall EPI, to Haiti, which ranks 151st. Still, more than half of the countries are in the top third of the EPI. For the European Union member countries, however, the spread is much narrower. All the countries fall in the top half of overall ranking, with seven making the top ten.
Overall, geographic peer groups show much more diversity than do groupings like the OECD and the LDCs. This result implies that countries in the midst of economic transitions vary widely in how well they fold environmental protection into their development strategies. Population density is not a determinant of EPI score, as can be seen in Table 3.18. Mauritius ranks 35th in the overall EPI, and a number of other densely settled countries have relatively high EPI scores in spite of low resource to population ratios. Further analysis of these peer groups and of countries grouped by income deciles can be found at the website: http://epi.yale.edu
Table 3.1: Americas Rank Country Score Rank Country Score Rank Country Score
1 Costa Rica 86.4 11 Dominican Republic 68.4 21 Uruguay 59.1
2 Cuba 78.1 12 Suriname 68.2 22 Jamaica 58.0 3 Colombia 76.8 13 Mexico 67.3 23 Nicaragua 57.1 4 Chile 73.3 14 Canada 66.4 24 Trinidad & Tob. 54.2 5 Panama 71.4 15 Paraguay 63.5 25 Guatemala 54.0 6 Belize 69.9 16 United States 63.5 26 Honduras 49.9 7 Antigua & Barb. 69.8 17 Brazil 63.4 27 Bolivia 44.3 8 Ecuador 69.3 18 Venezuela 62.9 28 Haiti 39.5 9 Peru 69.3 19 Argentina 61.0
10 El Salvador 69.1 20 Guyana 59.2

2010 ENVIRONMENTAL PERFORMANCE INDEX
January 2010 35
Table 3.2: Asia and Pacific Rank Country Score Rank Country Score Rank Country Score
1 New Zealand 73.4 10 Malaysia 65.0 19 China 49.0 2 Japan 72.5 11 Sri Lanka 63.7 20 India 48.3 3 Singapore 69.6 12 Thailand 62.2 21 Pakistan 48.0 4 Nepal 68.2 13 Brunei 60.8 22 Indonesia 44.6 5 Bhutan 68.0 14 Laos 59.6 23 Papua N. G. 44.3 6 Maldives 65.9 15 Viet Nam 59.0 24 Bangladesh 44.0 7 Fiji 65.9 16 South Korea 57.0 25 Mongolia 42.8 8 Philippines 65.7 17 Myanmar 51.3 26 North Korea 41.8 9 Australia 65.7 18 Solomon Islands 51.1 27 Cambodia 41.7
Table 3.3: Eastern Europe and Central Asia Rank Country Score Rank Country Score Rank Country Score
1 Albania 71.4 7 Macedonia 60.6 13 Ukraine 58.2 2 Serbia & Monte. 69.4 8 Armenia 60.4 14 Kazakhstan 57.3 3 Croatia 68.7 9 Turkey 60.4 15 Bosnia & Herze. 55.9 4 Belarus 65.4 10 Kyrgyzstan 59.7 16 Tajikistan 51.3 5 Georgia 63.6 11 Azerbaijan 59.1 17 Uzbekistan 42.3 6 Russia 61.2 12 Moldova 58.8 18 Turkmenistan 38.4
Table 3.4: Europe Rank Country Score Rank Country Score Rank Country Score
1 Iceland 93.5 16 Albania 71.4 31 Poland 63.1 2 Switzerland 89.1 17 Spain 70.6 32 Bulgaria 62.5 3 Sweden 86.0 18 Serbia & Monte. 69.4 33 Russia 61.2 4 Norway 81.1 19 Denmark 69.2 34 Greece 60.9 5 France 78.2 20 Hungary 69.1 35 Macedonia 60.6 6 Austria 78.1 21 Croatia 68.7 36 Armenia 60.4 7 Malta 76.3 22 Lithuania 68.3 37 Turkey 60.4 8 Finland 74.7 23 Luxembourg 67.8 38 Azerbaijan 59.1 9 Slovakia 74.5 24 Ireland 67.1 39 Moldova 58.8
10 United Kingdom 74.2 25 Romania 67.0 40 Ukraine 58.2 11 Germany 73.2 26 Netherlands 66.4 41 Belgium 58.1 12 Italy 73.1 27 Belarus 65.4 42 Cyprus 56.3 13 Portugal 73.0 28 Slovenia 65.0 43 Bosnia & Herze. 55.9 14 Latvia 72.5 29 Estonia 63.8 15 Czech Republic 71.6 30 Georgia 63.6
Table 3.5: Middle East and North Africa Rank Country Score Rank Country Score Rank Country Score
1 Algeria 67.4 8 Lebanon 57.9 15 Sudan 47.1 2 Morocco 65.6 9 Jordan 56.1 16 Oman 45.9 3 Syria 64.6 10 Saudi Arabia 55.3 17 Bahrain 42.0 4 Israel 62.4 11 Kuwait 51.1 18 Iraq 41.0 5 Egypt 62.0 12 Libya 50.1 19 United Ar. Em 40.7 6 Tunisia 60.6 13 Qatar 48.9 7 Iran 60.0 14 Yemen 48.3
2010 ENVIRONMENTAL PERFORMANCE INDEX
January 2010 36
Table 3.6: Sub-Saharan Africa Rank Country Score Rank Country Score Rank Country Score
1 Mauritius 80.6 15 South Africa 50.8 29 Senegal 42.3 2 Djibouti 60.5 16 Gambia 50.3 30 Eq. Guinea 41.9 3 Namibia 59.3 17 Uganda 49.8 31 Botswana 41.3 4 Sao Tome & Prin. 57.3 18 Madagascar 49.2 32 Chad 40.8 5 Gabon 56.4 19 Tanzania 47.9 33 Nigeria 40.2 6 Eritrea 54.6 20 Zimbabwe 47.8 34 Benin 39.6 7 Swaziland 54.4 21 Burkina Faso 47.3 35 Mali 39.4 8 Côte d'Ivoire 54.3 22 Zambia 47.0 36 Niger 37.6 9 Congo 54.0 23 Guinea-Bissau 44.7 37 Togo 36.4
10 Dem. Rep. Congo 51.6 24 Cameroon 44.6 38 Angola 36.3 11 Malawi 51.4 25 Rwanda 44.6 39 Mauritania 33.7 12 Kenya 51.4 26 Guinea 44.4 40 Cen. Afr. Rep. 33.3 13 Ghana 51.3 27 Burundi 43.9 41 Sierra Leone 32.1 14 Mozambique 51.2 28 Ethiopia 43.1
Table 3.7: Organization for Economic Cooperation and Development Member Countries Rank Country Score Rank Country Score Rank Country Score
1 Iceland 93.5 11 Germany 73.2 21 Ireland 67.1 2 Switzerland 89.1 12 Italy 73.1 22 Canada 66.4 3 Sweden 86.0 13 Portugal 73.0 23 Netherlands 66.4 4 Norway 81.1 14 Japan 72.5 24 Australia 65.7 5 France 78.2 15 Czech Republic 71.6 25 United States 63.5 6 Austria 78.1 16 Spain 70.6 26 Poland 63.1 7 Finland 74.7 17 Denmark 69.2 27 Greece 60.9 8 Slovakia 74.5 18 Hungary 69.1 28 Turkey 60.4 9 United Kingdom 74.2 19 Luxembourg 67.8 29 Belgium 58.1
10 New Zealand 73.4 20 Mexico 67.3 30 South Korea 57.0
Table 3.8: Least Developed Countries (LDCs) Rank Country Score Rank Country Score Ran
k Country Score
1 Nepal 68.2 14 Yemen 48.3 27 Cambodia 41.7 2 Maldives 65.9 15 Tanzania 47.9 28 Chad 40.8 3 Djibouti 60.5 16 Burkina Faso 47.3 29 Benin 39.6 4 Laos 59.6 17 Sudan 47.1 30 Haiti 39.5 5 Sao Tome & Prin. 57.3 18 Zambia 47.0 31 Mali 39.4 6 Eritrea 54.6 19 Guinea-Bissau 44.7 32 Niger 37.6 7 Dem. Rep. Congo 51.6 20 Rwanda 44.6 33 Togo 36.4 8 Malawi 51.4 21 Guinea 44.4 34 Angola 36.3 9 Mozambique 51.2 22 Bangladesh 44.0 35 Mauritania 33.7
10 Solomon Islands 51.1 23 Burundi 43.9 36 Central Afr. Rep. 33.3 11 Gambia 50.3 24 Ethiopia 43.1 37 Sierra Leone 32.1 12 Uganda 49.8 25 Senegal 42.3 13 Madagascar 49.2 26 Equatorial Guinea 41.9

2010 ENVIRONMENTAL PERFORMANCE INDEX
January 2010 37
Table 3.9: European Union (EU) Member Countries Rank Country Score Rank Country Score Rank Country Score
1 Sweden 86.0 10 Portugal 73.0 19 Romania 67.0 2 France 78.2 11 Latvia 72.5 20 Netherlands 66.4 3 Austria 78.1 12 Czech Republic 71.6 21 Slovenia 65.0 4 Malta 76.3 13 Spain 70.6 22 Estonia 63.8 5 Finland 74.7 14 Denmark 69.2 23 Poland 63.1 6 Slovakia 74.5 15 Hungary 69.1 24 Bulgaria 62.5 7 United Kingdom 74.2 16 Lithuania 68.3 25 Greece 60.9 8 Germany 73.2 17 Luxembourg 67.8 26 Belgium 58.1 9 Italy 73.1 18 Ireland 67.1 27 Cyprus 56.3
Table 3.10: Association of Southeast Asian Nations (ASEAN) and China, Japan, and South Korea Rank Country Score Rank Country Score Rank Country Score
1 Japan 72.5 6 Brunei 60.8 11 China 49.0 2 Singapore 69.6 7 Laos 59.6 12 Indonesia 44.6 3 Philippines 65.7 8 Viet Nam 59.0 13 Cambodia 41.7 4 Malaysia 65.0 9 South Korea 57.0 5 Thailand 62.2 10 Myanmar 51.3
Table 3.11: Asian Pacific Economic Cooperation Member Countries Rank Country Score Rank Country Score Rank Country Score
1 New Zealand 73.4 8 Philippines 65.7 15 Viet Nam 59.0 2 Chile 73.3 9 Australia 65.7 16 South Korea 57.0 3 Japan 72.5 10 Malaysia 65.0 17 China 49.0 4 Singapore 69.6 11 United States 63.5 18 Indonesia 44.6 5 Peru 69.3 12 Thailand 62.2 19 Papua N.G. 44.3 6 Mexico 67.3 13 Russia 61.2 7 Canada 66.4 14 Brunei 60.8
Table 3.12: Organization of the Petroleum Exporting Countries (OPEC) Member Countries Rank Country Score Rank Country Score Rank Country Score
1 Ecuador 69.3 5 Saudi Arabia 55.3 9 Iraq 41.0 2 Algeria 67.4 6 Kuwait 51.1 10 United Ar. Em. 40.7 3 Venezuela 62.9 7 Libya 50.1 11 Nigeria 40.2 4 Iran 60.0 8 Qatar 48.9 12 Angola 36.3
Table 3.13: Free Trade Area of the Americas (FTAA) Member Countries Rank Country Score Rank Country Score Rank Country Score
1 Costa Rica 86.4 10 Dominican Rep. 68.4 19 Guyana 59.2 2 Colombia 76.8 11 Suriname 68.2 20 Uruguay 59.1 3 Chile 73.3 12 Mexico 67.3 21 Jamaica 58.0 4 Panama 71.4 13 Canada 66.4 22 Nicaragua 57.1 5 Belize 69.9 14 Paraguay 63.5 23 Trinidad & Tob. 54.2 6 Antigua & Barb. 69.8 15 United States 63.5 24 Guatemala 54.0 7 Ecuador 69.3 16 Brazil 63.4 25 Honduras 49.9 8 Peru 69.3 17 Venezuela 62.9 26 Bolivia 44.3 9 El Salvador 69.1 18 Argentina 61.0 27 Haiti 39.5

2010 ENVIRONMENTAL PERFORMANCE INDEX
January 2010 38
Table 3.14: African Union Member Countries Rank Country Score Rank Country Score Rank Country Score
1 Mauritius 80.6 17 Mozambique 51.2 33 Ethiopia 43.1 2 Algeria 67.4 18 South Africa 50.8 34 Senegal 42.3 3 Egypt 62.0 19 Gambia 50.3 35 Eq. Guinea 41.9 4 Tunisia 60.6 20 Libya 50.1 36 Botswana 41.3 5 Djibouti 60.5 21 Uganda 49.8 37 Chad 40.8 6 Namibia 59.3 22 Madagascar 49.2 38 Nigeria 40.2 7 Sao Tome & Prin. 57.3 23 Tanzania 47.9 39 Benin 39.6 8 Gabon 56.4 24 Zimbabwe 47.8 40 Mali 39.4 9 Eritrea 54.6 25 Burkina Faso 47.3 41 Niger 37.6
10 Swaziland 54.4 26 Sudan 47.1 42 Togo 36.4 11 Côte d'Ivoire 54.3 27 Zambia 47.0 43 Angola 36.3 12 Congo 54.0 28 Guinea-Bissau 44.7 44 Mauritania 33.7 13 Dem. Rep. Congo 51.6 29 Cameroon 44.6 45 Cen. Afr. Rep. 33.3 14 Malawi 51.4 30 Rwanda 44.6 46 Sierra Leone 32.1 15 Kenya 51.4 31 Guinea 44.4 16 Ghana 51.3 32 Burundi 43.9
Table 3.15: Alliance of Small Island States Rank Country Score Rank Country Score Rank Country Score
1 Mauritius 80.6 7 Suriname 68.2 13 Trinidad & Tob. 54.2
2 Cuba 78.1 8 Maldives 65.9 14 Solomon Islands 51.1
3 Belize 69.9 9 Fiji 65.9 15 Guinea-Bissau 44.7 4 Antigua & Barb. 69.8 10 Guyana 59.2 16 Papua N.G. 44.3 5 Singapore 69.6 11 Jamaica 58.0 17 Haiti 39.5
6 Dominican Republic 68.4 12 Sao Tome & Prin. 57.3
Table 3.16: Russia and Newly Independent States (NIS) Member Countries that were Republics of the Former Soviet Union Rank Country Score Rank Country Score Rank Country Score
1 Belarus 65.4 5 Kyrgyzstan 59.7 9 Tajikistan 51.3 2 Georgia 63.6 6 Azerbaijan 59.1 10 Uzbekistan 42.3 3 Russia 61.2 7 Ukraine 58.2 11 Turkmenistan 38.4 4 Armenia 60.4 8 Kazakhstan 57.3
Table 3.17: Desert Countries Rank Country Score Rank Country Score Rank Country Score
1 Antigua & Barbuda 69.8 10 Kazakhstan 57.3 19 Uzbekistan 42.3 2 Algeria 67.4 11 Jordan 56.1 20 Bahrain 42.0 3 Morocco 65.6 12 Saudi Arabia 55.3 21 Iraq 41.0 4 Israel 62.4 13 Kuwait 51.1 22 United Ar. Em. 40.7 5 Egypt 62.0 14 Libya 50.1 23 Turkmenistan 38.4 6 Djibouti 60.5 15 Qatar 48.9 24 Niger 37.6 7 Iran 60.0 16 Yemen 48.3 25 Mauritania 33.7 8 Namibia 59.3 17 Pakistan 48.0 9 Azerbaijan 59.1 18 Oman 45.9

2010 ENVIRONMENTAL PERFORMANCE INDEX
January 2010 39
Table 3.18: High Population Density Rank Country Score Rank Country Score Ran
k Country Score
1 Mauritius 80.6 10 Maldives 65.9 19 India 48.3 2 Malta 76.3 11 Philippines 65.7 20 Rwanda 44.6 3 Germany 73.2 12 Sri Lanka 63.7 21 Bangladesh 44.0 4 Antigua & Barb. 69.8 13 Belgium 58.1 22 Burundi 43.9 5 Singapore 69.6 14 Jamaica 58.0 23 Bahrain 42.0 6 Serbia & Monte. 69.4 15 Lebanon 57.9 24 North Korea 41.8 7 El Salvador 69.1 16 Sao Tome & Prin. 57.3 25 Haiti 39.5 8 Nepal 68.2 17 South Korea 57.0 9 Netherlands 66.4 18 Trinidad & Tobago 54.2
3.3. Cluster Analysis Countries that have similar EPI scores may still have very different patterns of environmental results across the 10 policy categories and 25 indicators. To help governments identify peer countries that are similarly situated with respect to their pollution control and natural resource management challenges, we performed a statistical procedure known as cluster analysis (for further information, refer to the Methodology section). This process allows grouping of countries in terms of overall similarity across the 25 indicators,
generating seven country clusters that can be useful as a way to help countries look beyond their income-level or geographic peer groups for models of environmental success in countries facing similar challenges. The following tables show the country clusters, and Figure 3.7 shows the relative performance of each cluster across the 25 indicators.
Table 3.19: Cluster Group Analysis Results and Attributes
Cluster One Attributes Countries in Cluster This cluster is comprised largely of Middle Eastern, South Asian, and African developing countries. They perform poorly on environmental health indicators but about average on ecosystem performance indicators, except biome protection. Along with cluster three, they have low greenhouse gas emissions per capita.
Bangladesh Djibouti Eritrea Gambia India Iraq Mauritania
Pakistan Sao Tome and Principe Senegal Sri Lanka Sudan Swaziland Yemen
Cluster Two Attributes Countries in Cluster

2010 ENVIRONMENTAL PERFORMANCE INDEX
January 2010 40
These predominantly Middle Eastern and Asian nations perform well in terms of environmental burden of disease and indoor air pollution. They have roughly average results on most other indicators, but poor air pollution performance. Their scores on urban particulates and industrial carbon dioxide performance scores fall far below other clusters.
Bulgaria China Egypt Iran Jordan Kyrgyzstan Lebanon Morocco Moldova
North Korea Syria Tajikistan Thailand Tunisia Turkey Uzbekistan Vietnam
Cluster Three Attributes Countries in Cluster
These mostly undeveloped, African nations perform very poorly on environmental health indicators but well on the climate change indicators due to their low greenhouse gas per capita. Low income helps explain poor health infrastructure and limited fossil fuel-based development.
Benin Burkina Faso Burundi Chad Cote d'Ivoire DR Congo Ethiopia Ghana Guinea Guinea-Bissau Haiti Kenya
Madagascar Malawi Mali Mozambique Nepal Niger Nigeria Rwanda Sierra Leone Tanzania Togo Uganda
Cluster Four Attributes Countries in Cluster These geographically disparate countries tend to feature rich natural resources with limited development. These countries tend toward average performance on many indicators while tracking closer to the strong performers in environmental health.
Albania Algeria Antigua and Barbuda Azerbaijan Belarus Belize Bhutan Bosnia and Herzegovina Colombia Costa Rica Cuba Dominican Republic Ecuador El Salvador Fiji Georgia Guatemala Guyana Honduras Jamaica
Kazakhstan Latvia Lithuania Macedonia Maldives Mauritius Mexico Nicaragua Panama Paraguay Peru Philippines Romania Russian Federation Serbia and Montenegro Solomon Islands South Africa Suriname Ukraine Venezuela
Cluster Five Attributes Countries in Cluster

2010 ENVIRONMENTAL PERFORMANCE INDEX
January 2010 41
Many of these countries have productive natural resources but have experienced political strife. They perform poorly on environmental health. Their climate change scores are generally below average. However, they have low greenhouse gas and air pollution emissions.
Angola Bolivia Botswana Cambodia Cameroon Central African Republic Congo Equatorial Guinea Gabon
Indonesia Laos Mongolia Myanmar Namibia Papua New Guinea Zambia Zimbabwe
Cluster Six Attributes Countries in Cluster
This small cluster is comprised of mainly fossil fuel producing and processing nations. They perform very well on the environmental burden of disease but poorly on outdoor air pollution. Their scores are among the lowest in some of the water indicators, but most notably, they have the worst greenhouse gas per capita performance of all the clusters.
Argentina Armenia Bahrain Brunei Darussalam Kuwait Libya Oman
Qatar Saudi Arabia Trinidad and Tobago Turkmenistan United Arab Emirates Uruguay
Cluster Seven Attributes Countries in Cluster
These mostly developed, wealthy nations perform the best in the environmental health categories. While generally trending toward the top of the pack on most indicators, they have the lowest score for agricultural subsidies and the second-lowest performance on greenhouse gas emissions per capita.
Australia Austria Belgium Brazil Canada Chile Croatia Cyprus Czech Republic Denmark Estonia Finland France Germany Greece Hungary Iceland Ireland Israel
Italy Japan Luxembourg Malaysia Malta Netherlands New Zealand Norway Poland Portugal Singapore Slovakia Slovenia South Korea Spain Sweden Switzerland United Kingdom United States

2010 ENVIRONMENTAL PERFORMANCE INDEX
January 2010 42
Figure 3.7 Cluster Analysis Derived Centers of 2010 EPI Indicators
The cluster center (y-axis) shows the standardized difference between the cluster’s average and the EPI average on each indicator.
Table 3.20: Kendall’s tau correlation coefficients between the 2010 EPI and potential drivers of environmental performance.
Variable EPI10 Per capita GDP (2007) 0.59 Population density (2006) 0.13 Percent of population in urban areas (2006) 0.44 2009 Ecological Footprint (accounts for 2007) -0.31 World Bank CPIA Stringency of business regulatory environment (2006) 0.27 World Bank CPIA Institutions and policies for environmental sustainability (2006) 0.23 World Bank CPIA Accountability, transparency and corruption of the public sector (2006) 0.26
Trade as percent of GDP (2006) 0.13 Taxes as percent of international revenue (2006) -0.43 Climate change policy score (0,1,2 for cap and trade and/or carbon tax policies) 0.45 Transparency Internationals Corruption Perception Index (2006) 0.54

2010 ENVIRONMENTAL PERFORMANCE INDEX
January 2010 43
3.4. EPI Drivers Among a selection of potential drivers for good environmental performance that include income, population density, urbanization, ecological footprint, corruption, institutional and regulatory system variables, trade openness, and climate change policies, three stand out for
their clear correlation: per capita income, corruption (the accountability, transparency, and corruption of the public sector), and government effectiveness. Table 3.20 shows the correlations of the 2010 EPI with these potential drivers.
3.4.1. GDP Per Capita As mentioned earlier, per capita GDP is correlated with higher performance on the EPI (Figure 3.8). The overall R-square between the 2010 EPI and log of GDP is0.59 The spread in EPI scores is greater at
higher levels of income, reflecting disparate performance on Ecosystem Vitality. Poorer countries tend to have more uniformly low scores below 50.
Figure 3.8 Relationship of 2010 EPI and GDP per capita (log scale)

2010 ENVIRONMENTAL PERFORMANCE INDEX
January 2010 44
3.4.2. Corruption The control of corruption measure is aggregated from a number of indicators gauging perceptions of corruption, conventionally defined as the exercise of public power for private gain (Kaufmann et al. 2007). Environmental performance is correlated with corruption as measured by the Corruption Perceptions Index (Figure
3.9). Countries with high levels of perceived corruption tend to have low levels of environmental performance, whereas countries with low levels perform better on the EPI. This relationship is particularly marked for the Environmental Health objective and the Water Quality Index indicator.
Figure 3.9 Relationship of 2010 EPI and Control of Corruption
3.4.3. Government Effectiveness Government effectiveness measures the competence of the bureaucracy, the quality of policymaking, and public service delivery (Kaufmann et al. 2007). A slight positive relationship exists between government effectiveness and EPI performance (Figure 3.10). Particularly, government effectiveness
positively correlates with performance on the greenhouse gas emissions per capita, health ozone, growing stock, and water quality indicators. Government effectiveness shows a slight negative correlation with performance on the sulfur dioxide indicator.

2010 ENVIRONMENTAL PERFORMANCE INDEX
January 2010 45
Figure 3.10 Relationship of 2010 EPI and Regulatory Rigor
Figure 3.10 Relationship of 2010 EPI and Government Effectiveness

2010 ENVIRONMENTAL PERFORMANCE INDEX
January 2010 46
5. THE 2010 EPI, 2008 EPI, PILOT 2006 EPI, AND ENVIRONMENTAL SUSTAINABILITY INDEX Comparison of the 2010 Environmental Performance Index and the 2008 Environmental Performance Index Both the 2010 EPI and the 2008 EPI are outcome-oriented performance indices. Like the 2008 EPI, the 2010 EPI is an attempt to assess current environmental conditions to provide policymakers with information they can use now in forming and assessing policy responses to environmental challenges through a data-driven approach. Both indices use a proximity-to-target approach to assess countries’ performance on accepted targets for environmental sustainability where governments can have an immediate effect on improving environmental conditions. While following the same general principles of construction and interpretation (i.e., a multi-tier aggregation of proximity-to-target indicators), the 2010 EPI differs from the previous index in both structure and content. Structurally, like the 2008 EPI, the 2010 EPI’s indicators are aggregated into policy categories that reflect their thematic similarities. These policy categories are aggregated into two broad policy objectives that policymakers strive for - Environmental Health and Ecosystem Vitality. In the 2010 EPI, however, the weighting and substance of some indicators have changed. Notably, Greenhouse Gas Emissions Per Capita in the Climate Change policy category now accounts for 12.5 percent of the total EPI score. Except for Climate Change, each of the policy categories’ weights under the Ecosystem Vitality objective have been reduced from 7.5 percent to 4.2 percent, while Forestry, Fisheries, and Agriculture have been extended to their own, equally-
weighted policy categories. This also means that the weight on Ecosystem Air Pollution has been increased from 2.5 to 4.2 percent. While there are still 25 indicators overall, some of the indicators within the policy categories have been modified. The 2008 EPI measure of Local Ozone in the Environmental Health objective has been eliminated. The 2010 EPI adds Nitrogen Oxide Emissions and Non-Methane Volatile Organic Compounds in the Ecosystem Air Pollution policy category, and a Water Scarcity Index has been added to the Ecosystems Water policy category. The Effective Conservation and Conservation Risk Index indicators have been dropped from the Biodiversity and Habitat policy category, while Biome Protection has been added. Forestry gains a Forest Cover Change measure, and Burned Land Area and Intensive Cropland have been eliminated from the Agriculture policy category. Within the Climate Change policy category, updated data sources from the World Resources Institute’s Climate Analysis Indicator Tools (CAIT), land use change emissions data from Richard Hougton’s research, and the latest data from the International Energy Agency were used to refine the measurements of the indicators. These changes help the 2010 EPI present a more thorough inclusion of data that provide more accurate information on environmental indicators.

2010 ENVIRONMENTAL PERFORMANCE INDEX
January 2010 47
One important change in the 2010 EPI is the use of the logarithmic transformation for the calculation of many of the indicators, including: Environmental Burden of Disease, Urban Particulates, Sulfur Dioxide Emissions, Nitrogen Oxide Emissions, Non-Methane Volatile Organic Compounds, Ozone Exceedance, Water Stress, Marine Protected Areas, Agricultural Water Stress, Greenhouse Gas Emissions Per Capita, Electricity Carbon Intensity, and Industrial Carbon Intensity. Most of these performance measures have a sizeable number of countries very close to the targets. On the raw scale of measurement, as was used in 2008, the EPI would essentially ignore small differences among these top-performing countries, only acknowledging the more substantial differences between leaders and laggards. The use of the logarithmic transformation has the effect of “spreading out” these leading countries, allowing the EPI to reflect important differences not only between the leaders and laggards, but also among leaders who achieve different degrees of high-end performance. A secondary benefit of the logarithmic transformation is to improve the interpretation of differences between countries at different ends of the scale. For example, consider the Urban Particulates (PM10) indicator. On a raw scale (µg/m3), Venezuela and South Africa differ by 10 units (having PM10 values of 10.54 and 20.54, respectively), as do Libya and Kuwait (87.63 and 97.31, respectively). However, we naturally acknowledge that they are substantively different; Venezuela is an order of magnitude better than South Africa, while Libya and Kuwait differ by a much smaller amount in percentage terms. Compared to the use of the raw scale of measurement, the logarithmic transformation somewhat downplays the differences between the leaders and laggards,
while more accurately reflecting the nature of differences at all ranges of performance. A third methodological divergence from the 2008 EPI is the process of filling data gaps. The 2008 EPI employed limited and strategic use of data imputation, while the 2010 EPI gives preference to averaging around gaps, as well as using imputation. Changing the weights surrounding missing data to compensate for that missing data allows the 2010 EPI broader coverage of countries – 163 as opposed to 149 in 2008. Since one of our guiding principles is to offer a globally relevant and globally applicable performance assessment tool, data coverage is of paramount importance. Unfortunately, the inclusion of more advanced indicators often comes at the expense of geographical coverage. For this reason, we have used a suite of imputation methods, including regression and correlation analysis, to increase country coverage in these indicators: Access to Sanitation, Access to Drinking Water, Indoor Air Pollution, Water Quality Index, Greenhouse Gas Emissions Per Capita, Electricity Carbon Intensity, and Industrial Carbon Intensity. Since these imputed values may reflect the true but unknown values to varying degrees of accuracy, we have clearly marked them in the data tables. The 2010 EPI demonstrates our commitment to identifying the best available, and developing the best possible, environmental performance indicators at the global level. We believe that the new 2010 EPI is a continued improvement and makes a significant contribution to environmental performance assessment. Specifically, the 2010 EPI has improved upon the 2008 EPI by refining the basis on which the Environmental Health category is tracked. In particular, we have reduced redundancy by removing the 2008 Local
2010 ENVIRONMENTAL PERFORMANCE INDEX
January 2010 48
Ozone indicator. The ozone measurement relies heavily on modeled data, and so the inclusion in only one category reduces the overall weight of that data. The 2010 EPI also more fully captures the effects of air pollution on the environment, adding indicators for Nitrogen Oxide Emissions and Non-Methane Volatile Organic Compounds. We have further strengthened the water indicators by including the Water Scarcity Index as an indicator. The 2010 EPI has refined the Biodiversity and Habitat policy category by concatenating the Effective Conservation and Conservation Risk Index indicators into the more efficient Biome Protection indicator. New technology and approaches to measuring vegetative cover using satellite imagery have allowed the EPI to expand the important performance measures around forests to include the Change in Forest Cover indicator. One of the more significant changes in the 2010 EPI indicators concerns the Greenhouse Gas Emissions Per Capita indicator. This indicator has been given more weight, accounting for 12.5 percent of the overall 2010 EPI. The prioritization of this indicator reflects the diversity of important greenhouse gas sources, which are often not accessible through global data sets. While a proper deconstruction of the drivers
of greenhouse gas emissions in each country would offer a better suite of indicators, weighting the per capita emissions more heavily points to the importance of total emissions and serves as a target for a potential international agreement. Despite the progress made in indicator development and data availability, the 2010 EPI once again highlights the glaring gaps in global environmental data. Several important environmental concerns such as population exposure to toxics and heavy metals (such as lead, mercury, and cadmium), loss of wetlands, waste management, transnational outsourcing and spill-over effects of “dirty” industries, cannot be measured adequately at the global level because of lack of data, targets, or scientific certainty. Although the 2010 EPI contains 163 countries, dozens of countries are not included because of the lack of information about key indicators. Our efforts to produce meaningful imputations fell short in these cases. These data limits make tracking and monitoring of both environmental progress and the success of policy and management efforts difficult. Although the 2010 EPI improves upon the 2008 EPI, much work remains to be done in establishing consistent data collection and monitoring of environmental metrics.
Comparison of the Environmental Sustainability Index and the Environmental Performance Index Between 1999 and 2005 the Yale and Columbia team published four Environmental Sustainability Index reports (http://sedac.ciesin.columbia.edu/es/esi/) aimed at gauging countries’ overall progress towards “environmental sustainability.” These indices covered up to 76 different elements of sustainability across economic, social and environmental issues. Since then our focus has shifted to environmental
performance, measuring the ability of countries to actively manage and protect their environmental systems and shield their citizens from harmful environmental pollution. This focus avoids the problem of comparing apples to oranges that inevitably occurs when one takes a “triple bottom line” approach – and centers the analysis on environmental performance issues for which
2010 ENVIRONMENTAL PERFORMANCE INDEX
January 2010 49
all national governments can be held accountable. Why this shift in our work? While sustainability research continues at a fast pace across the world, a commonly accepted and measurable definition of environmental sustainability remains elusive. Distinct approaches have emerged and consolidated within different disciplines, and cross-disciplinary exchange has promoted new advances, but the challenges are still formidable. In addition, the immediate value to policymakers was limited by the complexity of the problem; scientific uncertainties about cause-effect relationships; and the intricate and competing linkages between policy actions and the social, economic, and environmental aspects of sustainable development. In contrast, environmental performance offers a more relevant and easily measured approach to reducing our environmental impacts. The possibility of selecting outcome-oriented indicators for which policy drivers can be identified and quantified is an appealing scenario for policymakers, environmental scientists and advocates, and the public alike. This method promotes action, accountability, and broad participation. The EPI’s proximity-to-target approach in particular highlights a country’s shortcomings and strengths compared to its peers in a transparent and easily visualized manner. These signals can be acted on through policy processes more quickly, more effectively, and with broader consensus than most sustainability metrics. In some cases, the EPI targets can already be viewed as sustainability targets, while other indicators represent the most widely accepted or most widely agreed-upon policy goals. This partly reflects the varying degree of certainty regarding the scientific consensus of what a truly sustainable performance on a given indicator would be.
Aside from these main conceptual and structural differences, how exactly do the EPI and ESI differ from each other? A summary of the differences is shown in Table A for the 2005 ESI, Pilot 2006 EPI, 2008 EPI, and 2010 EPI. In contrast to the relative measurements of the ESI, the EPI focuses on measuring performance rather than considering resource endowments and future trajectories. The sustainability thresholds of many environmental and socio-economic aspects are extremely difficult to determine and, given the dynamics of human and ecological change, might not exist in an absolute sense. The ESI evaluates environmental sustainability relative to the paths of other countries. The EPI, on the other hand, uses the distance to performance targets as the main criteria, acknowledging that these targets represent imperfect goal posts and can depend on local circumstances. Although both the EPI and ESI are multi-tier, average-based indices, they significantly differ in the categories of which they are composed. In line with sustainability research, the ESI considers not only environmental systems, but also adapts the Pressure-State-Response framework to reflect institutional, social, and economic conditions. The EPI, in contrast, considers only ecological and human health outcomes regardless of the auxiliary factors influencing them. The basic premise of the EPI is therefore normative. Each country is held to the same basic conditions necessary to protect human and environmental health now and in the future. The benchmarks for these conditions are enshrined in the 25 indicator targets. As a result of the EPI’s narrowed scope, the categories and indicators tracked are both different and smaller in number. Data quality and coverage play important roles in both the EPI and ESI. We believe

2010 ENVIRONMENTAL PERFORMANCE INDEX
January 2010 50
that the value of a sustainability or a performance index is diminished if only a handful of countries can be included and compared. Yet, while the ESI makes relatively extensive use of imputation techniques to fill data gaps, the availability of actual ‘real’ data was given much higher weight in the EPI to reflect the relevance of observed data in the policy process (the
2010 and 2008 EPIs do make limited use of imputing missing values in selected variables to maintain country coverage). As our knowledge of cause-effect relationships and statistical methods for data imputation continues to increase, however, it is likely that model-based imputations will gain more credibility in the future and in some cases even outperform observations in accuracy.

2010 ENVIRONMENTAL PERFORMANCE INDEX
January 2010 51
Table A: Comparison of ESI and EPI objectives and design Category 2005 ESI 2006 EPI 2008 EPI 2010 EPI Objective Gauges the long term
environmental trajectory of countries by focusing on “environmental sustainability”
Assesses current environmental conditions
Design Provides a relative measure of past, current, and likely future environmental, socio-economic, and institutional conditions relevant to environmental sustainability
Provides an absolute measure of performance by assessing countries on a proximity-to-target basis
Design and theoretical framework
Tracks a broad range of factors that affect sustainability using an adaptation of Pressure-State-Response framework
Focuses narrowly on areas within governmental control using a framework of absolute, fixed targets
Structure Multi-tier consisting of 5 components: Environmental systems, Reducing environmental stresses, Reducing human vulnerability, Social and institutional capacity, Global stewardship undergirded by 21 indicators and 76 variables (Note: the variables in the ESI can be compared with indicators in the EPI and indicators in the ESI are more reflective of the policy categories in the EPI)
Multi-tier consisting of 2 objectives: Environmental health and Ecosystem vitality, 6 categories: environmental health, air quality, water resources, biodiversity and habitat, productive natural resources, and sustainable energy, 16 indicators
Multi-tier consisting of 2 objectives: Environmental health and Ecosystem vitality, 6 categories: environmental health, air quality, water resources, biodiversity and habitat, productive natural resources, and climate change, 25 indicators
Multi-tier consisting of 2 objectives: Environmental health and Ecosystem vitality, 10 categories: environmental burden of disease, air quality (effects on humans), water (effects on humans), air pollution (effects on ecosystems), water quality and quantity (ecosystems), biodiversity and habitat, forestry, fisheries, agriculture, and climate change, 25 indicators
Data quality and coverage
Stringent grading system; flexible data requirements allow for missing data to be imputed
Stringent data quality requirements, no imputation of missing data
Stringent data quality requirements; imputation of missing data in selected indicators
Environmental Health (EPI objective, ESI indicator)
Indicators compare mortality rates of environmentally related diseases using proxy indicators: child mortality, child death from respiratory diseases, and intestinal infectious diseases
Estimates environmentally-related impacts on health through child mortality, indoor air pollution, urban particulates concentration, access to drinking water, and adequate sanitation
Estimates environmental burden of disease directly using WHO-developed disability adjusted life year (DALYs), local ground-level ozone and urban particulate concentrations, indoor air pollution, access to drinking water, adequate sanitation
Estimates environmental burden of disease directly using WHO-developed disability adjusted life year (DALYs), urban particulate concentrations, indoor air pollution, access to drinking water, access to sanitation

2010 ENVIRONMENTAL PERFORMANCE INDEX
January 2010 52
Air Pollution Measures effects of air pollution as well as levels of air pollution: Coal consumption per capita, anthropogenic NO2, SO2, and VOC emissions per populated land area, and vehicles in use per populated land area
Measures air quality: Percent of households using solid fuels, urban particulates and regional ground-level ozone concentration
Measures atmospheric conditions pertaining to both human and ecological health: Health – Indoor air pollution, urban particulates, local ozone Ecosystems – Regional ozone, sulfur dioxide emissions (as proxy for its ecosystem impacts when deposited)
Measures atmospheric conditions pertaining to both human and ecological health: Health – Indoor air pollution, and urban particulates Ecosystems – Regional ozone, sulfur dioxide, nitrogen oxides, and NMVOC emissions (as proxy for its ecosystem impacts when deposited)
Water Resources and Stress
Measures both water resources and stress: Quantity - Freshwater per capita and internal groundwater per capita Reducing stress – BOD emissions per freshwater, fertilizer and pesticides consumption per hectare arable land, percentage of country under water stress
Measures both water resources and stress: water consumption and nitrogen loading
Measures water stress through water stress index
Measures water stress through water stress index and overuse through water scarcity
Water Quality Key water quality indicators: dissolved oxygen, electrical conductivity, phosphorus concentration, suspended solids
Proxy for water quality: nitrogen loading
Assesses water quality through composite Water Quality Index, which incorporates dissolved oxygen, pH, electrical conductivity, total nitrogen and total phosphorous concentrations
Assesses water quality through composite Water Quality Index, which incorporates dissolved oxygen, pH, electrical conductivity, total nitrogen and total phosphorous concentrations
Climate Change / Energy
Tracks emissions per capita and per GDP Eco-efficiency indicator includes a measure of energy efficiency and renewable energy
Links energy to climate change via CO2 emissions per GDP, percent of renewable energy and energy efficiency
Explicitly assesses contributions to climate change through emissions per capita, emissions per electricity generated, and industrial carbon intensity
Explicitly assesses contributions to climate change through emissions per capita, emissions per electricity generated, and industrial carbon intensity
Biodiversity & Habitat
Focuses on species protection: Percentage of threatened birds, mammals, and amphibians in a country, the National Biodiversity Index (measures species richness and abundance), and threatened ecoregions
Focuses on biome and resource protection: wilderness protection, ecoregion protection, timber harvest rate, and water consumption
Focuses on biome protection, including marine areas, and species conservation through Effective conservation, Conservation Risk Index, and critical habitat protection, indicators
Focuses on biome protection, including marine areas, and species conservation through critical habitat protection, and critical habitat protection, indicators

2010 ENVIRONMENTAL PERFORMANCE INDEX
January 2010 53
Forests Proxies for sustainable forest management: Annual change in forest cover and Percentage of total forest area that is certified for sustainable management
Proxy for sustainable forest management: Timber harvest rate
Proxy for sustainable forest management: Change in growing stock
Proxy for sustainable forest management: Change in growing stock and Forest Cover
Agriculture Proxy for sustainable agriculture: Agricultural subsidies
Proxy for sustainable agriculture: Agricultural subsidies
Proxies for sustainable agriculture: Agricultural subsidies, Intensive cropland usage, Pesticide regulations, and Burned land area
Proxies for sustainable agriculture: Agricultural subsidies, Irrigation Stress, and Pesticide regulation
Fisheries Proxy for sustainable fisheries management: Overfishing
Proxy for sustainable fisheries management: Overfishing
Proxy for sustainable fisheries management: Trawling intensity, Marine Trophic Index
Proxy for sustainable fisheries management: Trawling intensity, Marine Trophic Index

2010 ENVIRONMENTAL PERFORMANCE INDEX
January 2010 54
6. TREND DATA For the 2010 EPI we sought to obtain trend data for all indicators. Experience has shown that EPI country scores and ranks change from year to year for reasons that can largely – though not exclusively – be attributed to changes in the underlying index framework, methods, and data sources. Consistent trend data offer one of the few possible means to examine whether countries are making progress towards higher levels of environmental performance or slipping behind. Apart from the Water (effects on humans) and Climate Change policy categories, we could not find data with sufficiently long time series to conduct a trend analysis. Hence, our focus in this chapter is on these two categories, with brief treatment of shorter time series in the last chapter section. With trend data it is important to recognize that when countries start from very low baselines, it is possible to register very large percentage growth improvements that may not be terribly meaningful. A country with only 3% coverage in the Access to Drinking Water and Access to Sanitation indicators could double its coverage by moving to 6% (a 100% improvement), and triple it by moving to 9% (a 200% improvement). This is true of most of the countries that have seen the most dramatic percentage growth improvements in water and sanitation coverage. By the same token, declines from 4% to 2% would represent a 50% decrease, though the population difference between these two coverage rates may not be very significant. In terms of greenhouse gas emissions, the signal is the opposite – declines are “positive” from an environmental viewpoint, and increases are “negative” – but the same principle applies. Many of the countries that have seen dramatic increases in emissions also started at a low base, and hence their percentage changes need to be understood in that light. 6.1. Water (effects on human health)
Consistent trend data on Access to Drinking Water and Access to Sanitation exist from 1990 to 2006. The trend data for access to improved water supplies (Figure X.1) show generally positive results, with 97 countries raising their Access to Drinking Water coverage, and four countries (Cambodia, Ethiopia, Burkina Faso, and Chad) more than doubling their access. Fifty-five countries saw improvements in coverage of 10 percent or more.
Unfortunately, there were also retrenchments. With water supply it is not sufficient to “tread water.” Any country that does not actively increase coverage, whether by government efforts or increases in income that result in people investing in their own water and sanitation infrastructure, will inevitably score lower on the Access to Drinking Water indicator as population grows. The countries that have seen declines are generally among the poorest, although some negative changes, such as that seen in Algeria (-9.6%) may be artifacts of the data rather actual declines in coverage. A number of the countries in this group have seen prolonged armed conflicts or social unrest – among them Sierra Leone, Iraq, and the Occupied Palestinian Territory.
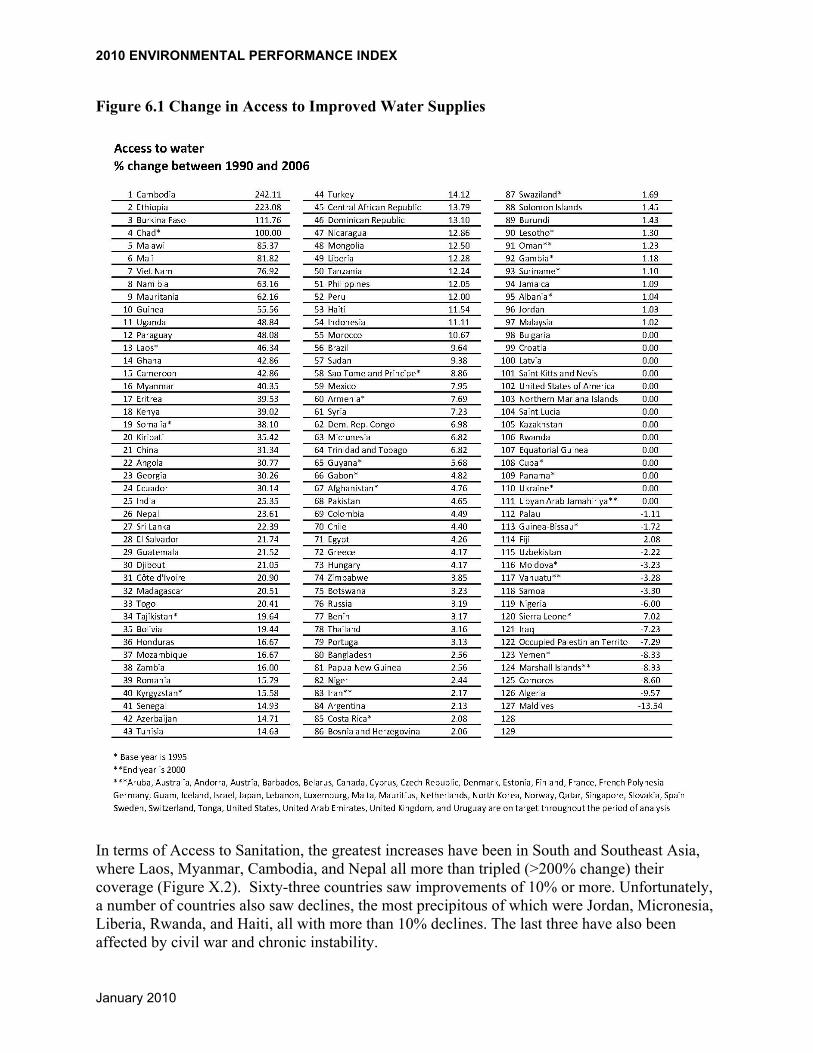
2010 ENVIRONMENTAL PERFORMANCE INDEX
January 2010 55
Figure 6.1 Change in Access to Improved Water Supplies
In terms of Access to Sanitation, the greatest increases have been in South and Southeast Asia, where Laos, Myanmar, Cambodia, and Nepal all more than tripled (>200% change) their coverage (Figure X.2). Sixty-three countries saw improvements of 10% or more. Unfortunately, a number of countries also saw declines, the most precipitous of which were Jordan, Micronesia, Liberia, Rwanda, and Haiti, all with more than 10% declines. The last three have also been affected by civil war and chronic instability.

2010 ENVIRONMENTAL PERFORMANCE INDEX
January 2010 56
Figure 6.2 Change in Access to Improved Sanitation
Between water and sanitation, we see a number of Asian and sub-Saharan African countries making significant progress. Laos, Cambodia, and Burkina Faso are among those countries that have seen significant improvements in coverage (and now have above 60% of their populations with Access to Drinking Water), and if they continue on a similar trajectory they may well be on target to meet the MDGs.

2010 ENVIRONMENTAL PERFORMANCE INDEX
January 2010 57
6.2. Climate Change The signal from the Climate Change trend data is even more difficult to discern than that of the Access to Drinking Water and Access to Sanitation indicators. This may be because of deficiencies in the underlying data, especially those dating to the early 1990s. Here we present trends for two indicators – Industrial Carbon Intensity and Electricity Carbon Intensity. The third, Greenhouse Gas Emissions/Capita (including land use emissions), cannot be reliably assessed due to the fact that the land use emissions were imputed in some cases. The trend data for Industrial Carbon Intensity (carbon emissions from industry per industrial GDP) from 1990-2005 are found in Table X.3. This is a measure of the carbon intensity of industrial production, and declines in intensity show that more goods are produced with fewer emissions. If the numbers are taken at face value, approximately 47 countries are improving, and 68 countries are either stagnant or seeing declines in industrial energy efficiency. For a few countries, improvements in efficiency can clearly be attributed to increases in either efficiency (improved plants, more efficient production systems – e.g. for Norway, Netherlands, and the UK) or to the use of renewable energy sources (e.g. Ghana). For others, such as the Democratic Republic of Congo, Bahrain, and Turkmenistan, the reasons for the increases in the energy efficiency of production are more opaque, and cannot be easily explained. For the countries at the other end that are seeing increases in Industrial Carbon Intensity, it is possible that some of them saw declines in real dollar values of production while retaining level emissions. Under this scenario, a country would see decreasing efficiency. In terms of large industrialized countries, the United States has seen a 24% increase in Industrial Carbon Intensity, whereas China has seen an increase of only 3.1%. China’s industrial production has skyrocketed since 1990, and it appears that efficiency has largely kept pace, perhaps because of China’s massive investment in energy-saving technology. Germany and Russia both saw significant improvements in efficiency of 20% and 7.9%, respectively. In the first instance, Germany has invested heavily in more efficient production methods, and in the other many inefficient Communist era factories have been shut down. In any case, these improvements are to be lauded. For changes in Electricity Carbon Intensity (CO2 emissions per kilowatt hour of energy produced) from 1992-2007 (Table X.4), some countries have invested heavily in hydroelectric energy and consequently have seen a decrease in emissions per unit of energy produced (e.g., Mozambique, Nepal, Colombia, and Zambia). As for the other top ranked countries such as Luxemburg and Tajikistan, it is unclear what is driving their improved performance. Most industrialized countries have seen declines of -4% to -40%. On the other end of the spectrum, some countries have seen preposterous increases of greater than 1,000% in Electricity Carbon Intensity, which are most likely artifacts of the data. Beyond these outliers, there are some surprising countries in the list of countries that have seen increases – including Iceland (heavily dependent on thermal energy), Chile, and New Zealand.

2010 ENVIRONMENTAL PERFORMANCE INDEX
January 2010 58
Figure 6.3 Changes in carbon emissions from industry per industrial GDP

2010 ENVIRONMENTAL PERFORMANCE INDEX
January 2010 59
Figure 6.4 Trends in emissions per kilowatt hour of energy produced
6.3. Other trends We limited our analysis of change in other indicators to a subset of European and OECD countries. There are data for 36 countries showing declines in Urban Particulates (PM10 concentrations) of between 14% and 77% from 1990 and 2006. The former Soviet Bloc countries of Georgia, Belarus, Ukraine and Estonia have seen the greatest improvements, owing, most likely, to the shuttering of inefficient Soviet era industries. But all of Western Europe and Canada have seen declines that average 20% or more. In terms of NOx emissions, again the former Soviet Bloc and Eastern European countries have seen heavy declines since 1990, with

2010 ENVIRONMENTAL PERFORMANCE INDEX
January 2010 60
Moldova and Georgia seeing greater than 75% reductions. On the other hand, several countries saw increases, including Austria (+14%), Spain (+20%), Cyprus, and Greece (+25% each). Finally, recycling rates – for those few western European countries with data – have also increased dramatically and across the board from 1995-2007. We have a shorter time series, from 2006-2009, for Biome Protection (weighted average percentage of biome area covered by protected areas). Although there have been changes in scores, the results may reflect improvements in the underlying protected areas database (the World Database of Protected Areas), which has been consistently improved since an international agency consortium effort re-launched the database in 2005. Thus, Albania, Swaziland, Romania, and the United Kingdom all apparently saw increases of 90% or more. On the opposite end, countries like the United States saw apparent decreases of 24%, yet there is no evidence of any protected areas having been degazetted during this period. (Such a move would trigger widespread protest in the U.S., particularly by NGOs.) 6.4. Conclusions from the Trend Analysis This preliminary trend analysis has perhaps raised more questions than it has answered, revealing that even with trend data, which in theory should enable one to tease out the countries with improving environmental performance, interpretation of results can be difficult. Nonetheless, we see this as a profitable area for further exploration, and hope that in the future sufficient high-quality data may be available to generate more reliable trends.
2010 ENVIRONMENTAL PERFORMANCE INDEX
January 2010 61
REFERENCES Adriaanse, A. 1993. Environmental Policy Performance Indicators: A Study of the Development of Indicators for Environmental
Policy in the Netherlands. The Hague: SDU Publishers. Adriaanse, A., and R. Reiling 1988. Towards a National Reference Center for Environmental Information in the Netherlands: A
Review. Environmental Management 13(3):145-149. Adrianto, L. and Y. Matsuda. 2004. Study on Assessing Economic Vulnerability of Small Island Regions. Environment,
Development and Sustainability 6:317-336. Alabaster J.S., and R. Lloyd. 1982. Water Quality Criteria for Freshwater Fish. 2nd Edition. Food and Agriculture Organization
of the United Nations. London: Butterworth's. Albert, M. and J.D. Parke. 1991. Indices of Environmental Quality: The Search for Credible Measures. Environmental Impact
Assessment Review 11(2):95-101. Alfieri, A. and P. Bartelmus. 1998. "Implementation of Environmental Accounting: Towards an Operational Manual." In Uno, K.
and P. Bartelmus (Ed). Environmental Accounting in Theory and Practice. Dordrecht: Kluwer Academic Publishers. Alfsen, K.H. and V.S. Hans. 1993. Environmental Quality Indicators: Background, Principles and Examples from Norway.
Environmental and Resource Economics 3:415-435. Allison, P.D. 1999. Multiple Imputation for Missing Data: A Cautionary Tale. Philadelphia: University of Pennsylvania. American Public Health Association (APHA). 1995. Standard Methods for the Examination of Water and Wastewater, 19th
edition. Washington, DC: APA. Angelsen, A. and Wunder, S. 2003. Exploring the Forest – Poverty Link: Key Concepts, Issues and Research Implications. Bogor,
Indonesia: Center for International Forestry Research. Asian Development Bank. 1997. Emerging Asia: Changes and Challenges. Manila: Asian Development Bank. Australian Agency for International Development (AusAID). 2003. Environmental Management Guide for Australia's Aid
Program 2003. Available at: www.ausaid.gov.au/publications/pdf/Environmental_Management_Guide.pdf. Australian and New Zealand Environment and Conservation Council (ANZECC). 1992. Australian Water Quality Guidelines for
Fresh and Marine Waters. Canberra: ANZECC. Ayres, R.U., J. Bergh and J.M. Gowdy. 2000. Viewpoint: Weak Versus Strong Sustainability. Fontainebleau, France: INSEAD. Azzone, G. and M. Raffaella. 1994. Measuring Strategic Environmental Performance. Business Strategy and the Environment
3:114. Backhaus, R., M. Bock and S. Weiers. 2002. The Spatial Dimension of Landscape Sustainability. Environment, Development and
Sustainability 4:237-251. Balmford, A., L. Bennun, B. Brink, D. Cooper, I.M. Côté, P. Crane, A. Dobson, N. Dudley, I. Dutton, R.E. Green, R.D. Gregory,
J. Harrison, E.T. Kennedy, C. Kremen, N. Leader-Williams, T.E. Lovejoy, G. Mace, Robert May, P. Mayaux, P. Morling, J. Phillips, K. Redford, T.H. Ricketts, J.P. Rodríguez, M. Sanjayan, P.J. Schei, A.S. v. Jaarsveld and B.A.Walther. 2005. The Convention on Biological Diversity’s 2010 Target. Science 307:212-213.
Bandura, R. 2005. Measuring Country Performance and State Behavior: A Survey of Composite Indices. New York: Office of Development Studies, United Nations Development Programme (UNDP).
Barnard, J., W. Myers, J. Pearce, F. Ramsey, M. Sissenwine and W. Smith. 1985. Surveys for Monitoring Changes and Trends in Renewable Resources: Forests and Marine Fisheries. The American Statistician 39(4, Part 2):363-373.
Barnett, V. 1998. Discussion at the Meeting on 'Alternatives to Economic Statistics as Indicators of National Well-Being.' Journal of the Royal Statistical Society, Series A (Statistics in Society) 161(3):303-311.
Barnett, V. and K.F. Turkman (Ed.). 1994. Statistics for the Environment: Water Related Issues. Chichester: Wiley. Barrett, J., R. Birch, N. Cherrett and T. Wiedmann. 2005. Exploring the Application of the Ecological Footprint to Sustainable
Consumption Policy. Journal of Environmental Policy & Planning 7(4):303-316. Barton, B.A. & B.R. Taylor. 1996. Oxygen Requirements of Fishes in Northern Alberta Rivers with a General Review of the
Adverse Effects of Low Dissolved Oxygen. Water Qual. Res. J. Can. 31:361–409. Bass, S. 2001. "Policy Inflation, Capacity Constraints: Can Criteria and Indicators Bridge the Gap?" In Raison, R.J., A.G. Brown
and D.W. Flinn (Eds). Criteria and Indicators for Sustainable Forest Management. IUFRO Research Series; 7. Wallingford, U.K.: CABI Publishing.
Booysen, F. 2002. An Overview and Evaluation of Composite Indices of Development. Social Indicators Research 59:115-151. Bossel, H. 1999. Indicators for Sustainable Development: Theory, Method, Applications. Winnipeg: International Institute for
Sustainable Development. Boumans, M. 2001. Fisher's Instrumental Approach to Index Numbers. Supplement to the History of Political Economy 33:313-
344. Brand, S. 2007. Whole Earth Comes Into Focus. Nature 450(6):797. Brekke, K.A. 1997. Economic Growth and the Environment: On the Measurement of Income and Welfare. Cheltenham: Edward
Elgar. Briggs, D., C. Corvalan and M. Nurminen (Ed). 1996. Linkage Methods for Environment and Health Analysis: General
Guidelines. Geneva: Office of Global and Integrated Environmental Health, World Health Organization. Briggs, D.J. 1995. Environmental Statistics for Environmental Policy Data Genealogy and Quality. Journal of Environmental
Management 44:39-54. Bringezu, S. and F. Schmidt-Bleek. 1992. Proposal for a Standard Method of Ecobalancing Procedures: Compulsary Categories
of Ecological Indicators. Fresenius Environment Bulletin 1:488-493.

2010 ENVIRONMENTAL PERFORMANCE INDEX
January 2010 62
Buck, L.E., J.C. Milder, T.A. Gavin, and I. Mukherjee. 2006. Understanding Ecoagriculture: A Framework for Measuring Landscape Performance, Discussion Paper Number 1. Washington, D.C: Ecoagriculture Partners.
Buckland, S.T., A.E. Magurran, R.E. Green and R.M. Fewster. 2005. Monitoring Change in Biodiversity Through Composite Indices. Philosophical Transactions of the Royal Society 360:243-254.
Butchart, S.H.M., A.J. Stattersfield, L.A. Bennun, S.M. Shutes, H.R. Akcakaya, J.E.M. Baillie, S.N. Stuart, C.Hilton-Taylor and G.M. Mace. 2004. Measuring Global Trends in the Status of Biodiversity: Red List Indices for Birds. PLoS Biology 2(12):2294-2304.
Canadian Council of Ministers of the Environment (CCME). 1999. Canadian Environmental Quality Guidelines. Winnipeg: CCME.
Castañeda, F. 2001. "Collaborative Action and Technology Transfer as Means of Strengthening the Implementation of National-level Criteria and Indicators." In Raison, Brown and Flinn (eds): Criteria and Indicators for Sustainable Forest Management. IUFRO Research Series; 7.
Castillo, E.D., D.C. Montgomery and D.R. McCarville. 1996. Modified Desirability Functions for Multiple Response Optimization. Journal of Quality Technology 28(3):337-344.
CCME. 2001. "Canadian Water Quality Guidelines for the Protection of Aquatic Life: CCME Water Quality Index 1.0, User’s manual". In: Canadian Council of Ministers of the Environment. 1999. Canadian Environmental quality guidelines. Winnipeg, Manitoba. Available at: http://www.ccme.ca/assets/pdf/wqi_usermanualfctsht_e.pdf.
Center for Environmental Systems Research. 2008. Website. Available at: http://www.usf.uni-kassel.de/usf/archiv/daten/irriareamap.en.htm.
Center for International Earth Science Information Network (CIESIN). 2000. Gridded Population of the World, Version 2 alpha. Palisades, NY: Columbia University, International Food Policy Research Institute (IFPRI), World Resources Institute (WRI). Data available at: http://sedac.ciesin.org/plue/gpw.
Chapman, D. (Ed.) 1992. Water Quality Assessments: A Guide to the Use of Biota, Sediments and Water in Environmental Modeling. London: Published on behalf of UNESCO, WHO and UNEP. E & FN Spon.
Chapman, D. (Ed.) 1996. Water Quality Assessments. A Guide to the Use of Biota, Sediments and Water in Environmental Monitoring. Second Edition. Published on behalf of UNESCO, WHO, and UNEP. London: Chapman and Hall.
Cheng, P.E. 1994. Nonparametric Estimation of Mean Functionals With Data Missing at Random. Journal of the American Statistical Association (JASA) 89(425):81-87.
Chess, C., B.B. Johnson and G. Gibson. 2005. Communicating About Environmental Indicators. Journal of Risk Research 8(1):63-75.
Cochrane, M.A., A. Alencar, M.D. Schulze, C.M. Souza, D.C. Nepstad, P. Lefebvre and E.A. Davidson. 1999. Positive Feedbacks in the Fire Dynamic of Closed Canopy Tropical Forests. Science 284:1832–35.
Cointreau, S. 2007. Draft Discussion Paper on Livestock Waste Management Issues. Unpublished. Colfer, C.J.P., Kaimowitz, D., Kishi, M., and D. Sheild. 2006. Forests and Human Health in the Tropics: Some Important
Connections. Unasylva 224:3-10. Collaborative Partnership on Forests. 2006. Streamlining forest-related reporting – Joint information framework. Commission for Environmental Cooperation. 2000. Guidance Document. Improving Environmental Performance and
Compliance: 10 Elements of Effective Environmental Management Systems. Available at: http://www.epa.gov/region3/innovation/ems-guide.htm.
Comolet, A. 1991. How OECD Countries Respond to State-of-the Environment Reports. International Environmental Affairs 4(1):3.
Comprehensive Assessment of Water Management in Agriculture. 2007. Water for Food, Water for Life: A Comprehensive Assessment of Water Management in Agriculture. London: Earthscan and Colombo: International Water Management Institute.
Cook, S., H. Turral and F. Gichuki. 2006. Draft Version: Working Paper on Water Productivity Paper 1. CGIAR Challenge Program on Water and Food.
Copas, A.J. and V.T. Farewell. 1998. Dealing with Non-Ignorable Non-Response by Using an 'Enthusiasm-to-Respond' Variable. Journal of the Royal Statistical Society, Series A (Statistics in Society) 161(3):385-396.
Corbier-Nicolliere, T., Y. Ferrari, C. Jemelin and O. Jolliet. 2003. Assessing Sustainability: An Assessment Framework to Evaluate Agenda 21 Actions at the Local Level. International Journal of Sustainable Development and World Ecology 10:225-237.
Cormack, R.M. 1988. Statistical Challenges in the Environmental Sciences: A Personal View. Journal of the Royal Statistical Society, Series A (Statistics in Society) 151(1):201-210.
Correll D.L. 1998. The Role of Phosphorus in the Eutrophication of Receiving Waters: A Review. J. Environ. Qual. 27:261-266. Costanza, R. and W. Lisa. 1991. Ecological Economics. Business Economics 26:45-48. Crump, A. 1993. Dictionary of Environment and Development: People, Places, Ideas and Organizations. Cambridge, MA: MIT
Press. Cude C.G. 2001. Oregon Water Quality Index: A Tool for Evaluating Water Quality Management Effectiveness. Journal of the
American Water Research Association 37:125–137. Cui, Y., L. Hens, Y. Zhu and J. Zhao. 2004. Environmental Sustainability Index of Shandong Province, China. International
Journal of Sustainable Development and World Ecology 11:227-234. Custance, J. and H. Hillier. 1998. Statistical Issues in Developing Indicators of Sustainable Development. Journal of the Royal
Statistical Society, Series A (Statistics in Society) 161(3):281-290.

2010 ENVIRONMENTAL PERFORMANCE INDEX
January 2010 63
Daily, G.C., P.R. Ehrlich, G.A. Sanchez-Azofeifa. 2001. Countryside Biogeography: Use of Human-Dominated Habitats by the Avifauna of Southern Costa Rica. Ecological Applications 11(1):1-13.
Dasgupta, S., A. Mody, S. Roy and D. Wheeler. 1995. Environmental Regulation and Development: A Cross-Country Empirical Analysis. Policy Research Working Paper Series. 1448. Washington D.C.: World Bank.
Dauber, J., M. Hirsch, D. Simmering, R. Waldhardt, A. Otte, and V. Wolters. 2003. Landscape Structure as an Indicator of Biodiversity: Matrix Effects on Species Richness. Agriculture, Ecosystems and Environment 98:321-29.
Davidson, E.A. 1999. Positive Feedbacks in the Fire Dynamic of Closed Canopy Tropical Forests. Science 284:1832–35. Davis J.C. 1975. Minimal Dissolved Oxygen Requirements of Aquatic Life with Emphasis on Canadian species: A Review. J.
Fish. Res. Board Canada 32:2295-2332. Demirtas, H. 2004. Modeling Incomplete Longitudinal Data. Journal of Modern Applied Statistical Methods 3(2):305-321. Department of Sustainability and Environment. 2005. Index of Stream Condition: The Second Benchmark of Victorian River.
Melbourne: Victorian Government Department of Sustainability and Environment. Available at: www.vicwaterdata.net. Derringer, G.C. and D. Suich. 1980. Simultaneous Optimization of Several Response Variables. Journal of Quality Technology
12(4):214-219. Derry A.M., E.E. Prepas, P.D.N. Hebert. 2003. A Comparison of Zooplankton Communities in Saline Lakewater with Variable
Anion Composition. Hydrobiologia 505:199-215. Diewert, E. 2004. Index Number Theory: Past Progress and Future Challenges. Vancouver, BC: SSHRC Conference on Price
Index Concepts and Measurement, June 30 - July 3, 2004. Divisia, F. 1926. L’indice Monetaire et la Theorie de la Monnaie. Paris: Societe Anonyme du Recueil Sirey. Dodds, W.K. 2003. Misuse of Inorganic N and Soluble Reactive P Concentrations to Indicate Nutrient Status of Surface Waters.
Journal of the North American Benthological Society 22:171-181. Dodds, W.K., J.R. Jones, and E.B. Welch. 1998. Suggested Classification of Stream Trophic State: Distributions of Temperate
Stream Types by Chlorophyll, Total Nitrogen, and Phosphorus. Water Research 32:1455-1462. Dodds, Walter K. 2002. Freshwater Ecology: Concepts and Environmental Applications. Orlando: Academic Press. Döll, P. and S. Siebert. 2000. Digital Global Map of Irrigated Areas. CID Journal 49(2):55-66. Drasson, S., J.J. Corhrssen and Morrison (ed.). 1987. Environmental Monitoring, Assessment and Management: the Agenda for
Long-term Research and Development. Westport, CT: Praeger Publishers. Duinker, P.N. and M.P. Ronald. 1994. Measuring Up: Indicators of Forest Sustainability. Thunder Bay: Lakehead University
School of Forestry. Dumanski, J., S. Gameda and C. Pieri. 1998. Indicators of Land Quality and Sustainable Land Management. Washington, D.C.:
World Bank. Efron, B. 1994a. Missing Data, Imputation, and the Bootstrap. Journal of the American Statistical Association (JASA).
89(426):463-475. Efron, B. 1994b. Rejoinder. Journal of the American Statistical Association (JASA). 89(426). Ellis, R.N., P.M. Kroonenberg, B.D. Harch and K.E. Basford. 2006. Non-Linear Principal Components Analysis: An Alternative
Method for Finding Patterns in Environmental Data. Environmetrics 17:1-11. Engleman, R., R.P. Cincotta, B. Dye, T. Gardner-Outlaw, and J. Wisnewski. 2000. People in the Balance. Washington, D.C.:
Population Action International. Environment Canada. 1991. A Report on Canada's Progress Toward a National Set of Environmental Indicators. State of the
Environment Report 91-1. Ottawa: Supply & Services. Estrada, A. and R. Coates-Estrada. 2001. Bat Species Richness in Live Fences and in Corridors of Residual Rain Forest
Vegetation at Los Tuxtlas, Mexico. Ecography 24(1):94-102. Esty, D.C. 2001. Toward Data-Driven Environmentalism: The Environmental Sustainability Index. The Environmental Law
Reporter 31(5):10603-10613. Esty, D.C. 2002. "Why Measurement Matters." In Esty D.C. and P. Cornelius. Environmental Performance Measurement: The
Global 2001-2002 Report. New York: Oxford University Press. Esty, D.C., M. Levy, T. Srebotnjak and A. de Sherbinin. 2005. The 2005 Environmental Sustainability Index: Benchmarking
National Environmental Stewardship. New Haven: Yale Center for Environmental Law and Policy. Esty, D.C., M.A. Levy, T. Srebotnjak, A. de Sherbinin, C.H. Kim and B. Anderson. 2006. Pilot 2006 Environmental Performance
Index. New Haven: Yale Center for Environmental Law & Policy. European Commission, Directorate-General for the Environment. 2007. European Union Environment-Related Indicators 2007:
Measuring Environmental Progress. Brussels, Belgium: European Commission. European Digital Archive on Soil Maps of the World (EuDASM). 2006. European Digital Archive on Soil Maps of the World.
Joint Research Center. Available at: http://eusoils.jrc.it/esdb_archive/EuDASM/EUDASM.htm. European Environment Agency (EEA). 2006. Directive 2006/44/EC of 6 September 2006 on the Quality of Fresh Waters
Needing Protection or Improvement in Order to Support Fish Life. Official Journal of the European Union L 264/31. European Environment Agency. 2004. EEA Signals 2004 - A European Environment Agency Update on Selected Issues.
Copenhagen: European Environment Agency. European Environment Agency. 2004. EEA Strategy 2004-2008. Copenhagen: European Environment Agency. European Environment Agency. 2008. Ozone Pollution Across Europe. Website. Available at:
http://www.eea.europa.eu/maps/ozone. European Environmental Agency. 2008. Indicators: Air Quality. Website. Available at:
http://www.eea.europa.eu/themes/air_quality/indicators.

2010 ENVIRONMENTAL PERFORMANCE INDEX
January 2010 64
Ezzati, M., and D. M. Kammen. 2002. The Health Impacts of Exposure to Indoor Air Pollution from Solid Fuels in Developing Countries: Knowledge, Gaps, and Data Needs. Environmental Health Perspectives 110 (11):1057-1068.
Falkenmark, M, J. Lundqvist, and C. Widstrand. 1989. Macro-Scale Water Scarcity Requires Micro-Scale Approaches: Aspects of Vulnerability in Semi-Arid Development. Natural Resources Forum 13(4):258-267.
Falkenmark, M. 1990. Global Water Issues Confronting Humanity. Journal of Peace Research 27(2)177-190. Falkenmark, M. 1991. Living at the Mercy of the Water Cycle. Water Resources in the Next Century. Stockholm Water
Symposium Proceedings. 12-15 August 1991, Stockholm, Sweden. Falkenmark, M. and G. Lindh. 1974. Impact of Water Resources on Population. Paper submitted by the Swedish Delegation to
the UN World Population Conference, Bucharest, 19-30 August 1974. Färe, R., S. Grosskopf and F. Hernandez-Sancho. 2004. Environmental Performance: An Index Number Approach. Resource and
Energy Economics 26:343-352. Fehr, M., K.A. Sousa, A.F.N. Pereira and L.C. Pelizer. 2004. Proposal of Indicators to Assess Urban Sustainability in Brazil.
Environment, Development and Sustainability 6:355-366. Fonkych, K. 2005. Assessment of Environmental Kuznets Curves and Socioeconomic Drivers in IPCC's SRES Scenarios. The
Journal of Environment and Development 14(1):27-47. Food and Agriculture Organization (FAO). 1986. Yield Response to Water. Irrigation and Drainage Paper 33. Rome, Italy: FAO. Food and Agriculture Organization (FAO). 1998. Crop Evapotranspiration - Guidelines for Computing Crop Water Requirements.
Irrigation and Drainage Paper 56. Rome, Italy: FAO Available at: http://www.fao.org/docrep/X0490E/x0490e00.htm. Food and Agriculture Organization (FAO). 2002. World Agriculture: Towards 2015/2030. An FAO perspective. Available at:
http://www.fao.org/documents/show_cdr.asp?url_file=/docrep/005/y4252e/y4252e00.htm. Food and Agriculture Organization (FAO). 2008. Aquastat. Available at: http://www.fao.org/nr/water/aquastat/main/index.stm. Food and Agriculture Organization. 2000. Global Forest Resources Assessment 2000. Rome: FAO. Food and Agriculture Organization. 2007. State of the World's Forests 2007. Rome: FAO. Food and Agriculture Organization. 2006. Global Forest Resources Assessment 2005. Rome: FAO. Food and Agriculture Organization. 2006. Responsible Management of Planted Forests: Voluntary Guidelines. Planted Forests
and Trees Working Paper 37/E. Rome: FAO. Food and Agriculture Organization. 2007. Biological Diversity in Food and Agriculture – Forest Biodiversity. Available at:
http://www.fao.org/biodiversity/Forests_eco_en.asp. Food and Agriculture Organization. 2007. Roles of Forests in Climate Change. Available at:
http://www.fao.org/forestry/site/climatechange/en/. Forman, R.T.T. and S.K. Collinge. 1996. "The “Spatial Solution” To Conserving Biodiversity in Landscapes and Regions." In
R.M. DeGraaf and R.I. Miller (Eds). Conservation of Faunal Diversity in Forested Landscapes. London: Chapman and Hall.
Fraiture, C. de. 2007. Integrated Water and Food Analysis at the Global and Basin Level. An Application of WATERSIM. Water Resources Management 21:185-198.
Frankenberger, T.R. and D.M. Goldstein. 1990. Food Security, Coping Strategies and Environmental Degradation. Arid Lands Newsletter 30:21-27.
Freeman, A.M. 2003. The Measurement of Environmental and Resource Values. Theory and Methods. 2nd ed. Washington D.C.: RFF Press.
Freudenberg, M. 2003. Composite Indicators of Country Performance: A Critical Assessment. DSTI/IND(2003)5. Paris: Directorate For Science, Technology And Industry, Committee On Industry And Business Environment, Organisation for Economic Co-operation and Development (OECD).
Frisvold, G.B. 2000. Data, Information, and Rural Environmental Policy: What Will the Next Ten Years Bring? Review of Agricultural Economics 22(1):237-244.
Fromm, P. 1980. A Review of Some Physiological and Toxicological Responses of Freshwater Fish to Acid Stress. Env. Biol. Fish 5:79-93.
Gatzer, P.E. and R.C. McMillan. 1972. The Use of Experimental Design and Computerized Data Analysis in Elastomer Development Studies. Cincinatti, Ohio: Division of Rubber Chemistry, American Chemical Society, Fall Meeting.
Gerber, P., P. Chilonda, G. Franceschini and H. Menzi. 2004. Geographical Determinants and Environmental Implications of Livestock Production Intensification in Asia. Bioresource Technology 96:13.
Giampietro, M., K. Mayumi and S.G.F. Bukkens. 2001. Multiple-Scale Integrated Assessment of Societal Metabolism: An Analytical Tool to Study Development and Sustainability. Environment, Development and Sustainability 3:275-307.
Gilbert, R.O. 1987. Statistical Methods for Environmental Pollution Monitoring. New York: Van Nostrand Reinhold Co. Gilpin, A. 1976. Dictionary of Environment Terms. London: Routledge and Paul Kregan. Glasby, G.P. 2003. Sustainable Development: The Need for a New Paradigm. Environment, Development and Sustainability
4:333-345. Gleick, P.H. 1990. "Vulnerability of Water Systems." In P.E. Waggoner (Ed). Climate Change and U.S. Water Resources. New
York: John Wiley and Sons, Inc. Gleick, P.H. 1996. Basic Water Requirements for Human Activities: Meeting Basic Needs. Water International 21:83-92. Gleick, P.H. 1998. The World’s Water 1998-1999. Island Press, Washington, D.C. Gleick, P.H. 2006. The World’s Water 2006-2007: The Biennial Report on Freshwater Resources. Island Press, Washington,
D.C. (see also, previous versions.) Global Environmental Management Initiative. 1998. Measuring Environmental Performance: A Primer and Survey of Metrics in
Use. Washington D.C.: Global Environmental Performance Measurement Initiative.

2010 ENVIRONMENTAL PERFORMANCE INDEX
January 2010 65
Gosselin, P., D. Belanger, J.-F. Bebeault and A. Webster. 1993. Indicators for a Sustainable Society. Canadian Journal of Public Health 84:197-200.
Grafton, R.Q. and S. Knowles. 2004. Social Capital and National Environmental Performance: A Cross-Sectional Analysis. Journal of Environment & Development 13(4):336-370.
Grainger, A. 2007. Difficulties in Tracking the Long-Term Global Trend in Tropical Forest Area. Proceedings of The National Academy of Sciences 105(2):818-823.
Group of Experts on the Scientific Aspects of Marine Environmental Protection (GESAMP) (1990). The State of the Marine Environment. Oxford, UK: Blackwell Scientific Publishers.
Gunther, O. 1998. Environmental Informantion Systems. Berlin: Springer Verlag. Gurka, M.J. 2006. Extending the Box-Cox Transformation to the Linear Mixed Model. Journal of the Royal Statistical Society,
Series A (Statistics in Society) 169(2):273-288. Guttorp, P. 2000. Environmental statistics. Journal of the American Statistical Association (JASA) 95(449):289-292. Haas, P.M. and H. Hveem, (ed.) 1994. Complex Cooperation: Institutions and Processes in International Resource Management.
Oslo: Scandanavian University Press. Haas, P.M., R.O. Keohane and M.A. Levy. 1993. Institutions for the Earth: Sources of Effective International Environmental
Protection. Cambridge, MA: MIT Press. Hahn, G. and R. Hoerl. 1998. Key Challenges for Statisticians in Business and Industry. Technometrics 40(3):195-200. Hajer, M.A. 1992. "The Politics of Environment Performance Reviews: Choices in Design." In Lykke, E. (Ed). Achieving
environmental goals: the concept and performance of environmental performance review. London: Belhaven Press. Hajjar, R., D.I. Jarvis., B. Gemmill-Herrren. 2007. The Utility of Crop Genetic Diversity in Maintaining Ecosystem Services.
Agriculture, Ecosystems and Environment. 123:261-270. Hall, B. and M.L. Kerr. 1991. Green Index: A State-By-State Guide to the Nation's Environmental Health. Washington, D.C.:
Island Press. Hamilton, K. 2003. Sustaining Economic Welfare: Estimating Changes in Total and Per Capita Wealth. Environment,
Development and Sustainability 5:419-436. Hammond, A., A. Adriaanse, E. Rodenburg, D. Bryant and R. Woodward. 1995. Environmental Indicators: A Systematic
Approach to Measuring and Reporting on Environmental Policy Performance in the Context of Sustainable Development. Washington D.C.: World Resources Institute.
Hardi, P. and L. Pinter. 1994. Measuring Sustainable Development Performance: Canadian Initiatives: First Survey. Winnipeg: International Institute for Sustainable Development.
Harper, J.L. and D.L. Hawksworth. 1994. Biodiversity: Measurement and Estimation. Phisophical Transactions of the Royal Society of London 345:5-12.
Harrington, J. 1965. The Desirability Function. Industrial Quality Control 21(10):494-498. Hart, B.T., P. Bailey, R. Edwards, K. Hortle, K. James, A. McMahon, C. Meredith, and K. Swadling. 1991. A Review of the Salt
Sensitivity of the Australian Freshwater Biota. Hydrobiologia 210:105-144. Harvey, C. 2007. "Designing Agricultural Landscapes for Biodiversity Conservation." In Scherr, S.J. and J.A. McNeely, eds.
Farming with Nature: The Science and Practice of Ecoagriculture. Washington, D.C.: Island Press. Hassan, R.M. 2003. Measuring Asset Values and Flow Benefits of Non-Traded Produvcts and Ecosystems Services of Forest and
Woodland Resources in South Africa. Environment, Development and Sustainability 5:403-418. Hastings, P. and C. Boonralasa. 1990. Integrated Information for Natural Resource Management. The 1990 TDRI year-end
conference. Chong Buri, Thailand: Thailand Research Institute. Henderson, H. 1990. Beyond Economics: New Indicators for Culturally Specific, Sustainable Development. Development 3/4:60-
68. Hendrey, G.R., K. Baalsrud, T.S. Traaen, M. Laake, G. Raddum. 1976. Acid Precipitation: Some Hydrobiological Changes.
Ambio 5-6:224-227. Hendriks, M.M., J.H. deBoer, A.K. Smilde and D.A. Doornbos. 1992. Multicriteria Decisionmaking. Chemometrics and
Intelligent Laboratory Systems 16:175-191. Herman, B. 2004. How Well Do Measurements of an Enabling Domestic Environment for Development Stand Up?
g242004UNCTAD. Geneva: UNCTAD. Heyes, C., W. Schöpp, M. Amann, I. Bertok, J. Cofala, F. Gyarfas, Z. Klimont, M. Makowski and S. Shibayev. 1997. A Model
for Optimizing Strategies for Controlling Ground-Level Ozone in Europe (Interim Report). Laxenburg: International Institute for Applied Systems Analysis.
Hietala-Koivu, R., T. Jarvenpaa, and J. Helenius. 2004. Value of Semi-Natural Areas as Biodiversity Indicators in Agricultural Landscapes. Agriculture, Ecosystems & Environment 101:9-19.
Hill, M.O. 1973. Diversity and Evenness: A Unifying Notation and its Consequences. Ecology 54:427-432. Holmgren, P. & L-G. Marklund. 2007. "National Forest Monitoring Systems - Purposes, Options and Status." In Freer-Smith,
P.H., M.S.J. Broadmeadow & J.M. Lynch. (Eds). Forestry and Climate Change. Wallingford, U.K.: CAB International. Hondraki-Birbili, C. and N.J.D. Lucas. 1996. A Novel Methodology for Environmental Policy Analysis - The Concept of
Environmental Activity Elasticities and an Application to the CAP. Journal of Environmental Management 46:255-269. Hope, C. and J. Parker. 1991. A Pilot Environmental Index for the United Kingdom: Results for the Last Decade. Statistical
Journal of the United Nations 8:85-107. Horowitz, L.W., Walters, S., Mauzerall, D.L., et al. 2003. A Global Simulation of Tropospheric Ozone and Related Tracers:
Description and Evaluation of MOZART, Version 2. Journal of Geophysical Research 108:D24.

2010 ENVIRONMENTAL PERFORMANCE INDEX
January 2010 66
Hortensius, D. and S. Nortcliff. 1991. International Standardization of Soil Quality Measurement Procedures for the Purpose of Soil Protection. Soil Use and Management 7(3):163-166.
Hurd, B., J. Smith, and R. Jones. 1999. Water and Climate Change: A National Assessment of Regional Vulnerability. Boulder, Colorado: Stratus Consulting.
Hurlbert, S.H. 1971. The Nonconcept of Species Diversity: A Critique and Alternative Parameters. Ecology 52(4):577-586. Hutchinson, G.E. 1953. The Concept of Pattern in Ecology. Proceedings of the Academy of Natural Sciences of Philadelphia
105:1-12. Hutchinson, G.E. 1959. Homage to Santa Rosalia, or Why Are There So Many Kinds of Animals?. American Naturalist 93:145-
159. Ibrahim, J.G., M.-H. Chen, S.R. Lipsitz and A.H. Herring. 2005. Missing-Data Methods for Generalized Linear Models: A
Comparative Review. Journal of the American Statistical Association (JASA) 100:332-346. Index of Human Insecurity (IHI). 2000. AVISO Issue No. 6. Inhaber, H. 1976. Environmental Indices. London: Wiley & Sons. International Energy Agency. 1976. Indicators of Energy Use and Efficiency. Paris: Organization for Economic Co-operation and
Development. International Institute for Sustainable Development (IISD). 1993. Indicators for the Sustainable Management of Tourism.
Winnipeg: IISD. International Institute for Sustainable Development (IISD). 2002a. Compendium: A Global Directory to Indicator Initiatives.
Winnipeg: IISD. Available at: http://www.iisd.org/measure/compendium/. International Institute for Sustainable Development (IISD). 2002b. IISDnet, Measurement and Indicators for Sustainable
Development. Winnipeg: IISD. Available at: http://www.iisd.org/measure/. International Network for Environmental Compliance and Enforcement (INECE). 2005. Environmental Enforcement Indicators.
Available at: http://www.inece.org/forumsindicators_introduction.html#_edn1. International Organization for Standardization. 2004. ISO14001 Standards and Environmental Management Systems. Available
at: http://www.iso14000.com. International Union of Local Authorities (IULA). 1991. Glossary of Environmental Terms. Istanbul: IULA. International Water Management Institute. 2008. Water and Climate Atlas. Available at:
http://www.iwmi.cgiar.org/WAtlas/atlas.htm. Irland, L.C. 2006. “Perspectives on the National Report on Sustainable Forests– 2003”. In Society of American Foresters,
Perspectives on America’s forest. Available at: http://www.safnet.org/periodicals/multipleperspectives. Jackson, D. and L. Jackson. 2002. The Farm as Natural Habitat: Reconnecting Food Systems with Ecosystems. Washington, D.C.:
Island Press. Jacobs, R., P. Smith and M. Goddard. 2004. Measuring Performance: An Examination of Composite Performance Indicators.
CHE Technical Paper Series. 29. York, U.K.: Centre for Health Economics, University of York. Jessenberger, J. and C. Weihs. 2004. Desirability to Characterize Process Capability. Technical Report-Reihe des
Sonderforschungsbereichs 475:73/04. Dortmund: Dortmund University. Jørgensen, S.E., R. Costanza and F.-L. Xu. 2005. Handbook of Ecological Indicators for Assessment of Ecosystem Health. Boca
Raton, FL: CRC Press. Karkkainen, B.C. 2001. Information as Environmental Regulation: TRI and Performance Benchmarking, Precursor to a New
Paradigm? Georgetown Law Journal 89(257). Karlsson, S. 2002. "The North-South Knowledge Divide: Consequences for Global Environmental Governance." In Esty, D.C.,
and M. Ivanova (Ed). Global Environmental Governance; Options and Opportunities. New Haven: Yale Center for Environmental Law & Policy.
Katz, M. and D. Thornton. 1997. Environmental Management Tools on the Internet: Accessing the World of Environmental Information. Delray Beach: St. Lucie Press.
Kaufman, L. and P.J. Rousseeuw. 1990. Finding Groups in Data: An Introduction to Cluster Analysis. Wiley Series in Probability and Mathematical Statistics. 1st ed. New York: John Wiley & Sons, Inc.
Keith, L.H. 1991. Environmental Sampling and Analysis: A Practical Guide. Chelsea: Lewis Publishers Inc. Khan, F., T. Husain, and A. Lumb. 2003. Water Quality Evaluation and Trend Analysis in Selected Watersheds of the Atlantic
region of Canada. Environmental Monitoring and Assessment 88:221-242. King J.A., R.I. Bradley, R. Harrison. 2005. Current Trends of Soil Organic Carbon in English Arable Soils. Soil Use and
Management 21 (2), 189–195. Kjellstrom, T. and C. Corvalan. 1995. Frameworks for the Development of Environmental Health Indicators. World Health
Statistics Quarterly 48(2):144-154. Kolsky, P.J. and U.J. Blumenthal. 1995. Environmental Health Indicators and Sanitation-Related Disease in Developing
Countries: Limitations to the Use of Routine Data Sources. World Health Statistics Quarterly 48(2):132-139. Kong, A., J.S. Liu and W.H. Wong. 1994. Sequential Imputations and Bayesian Missing Data Problems. Journal of the American
Statistical Association (JASA) 89(425):278-288. Kovacs, M. 1992. Biological Indicators in Environmental Protection. New York: Elis Harwood. Krajnc, D. and P. Glavic. 2005. A Model for Integrated Assessment of Sustainable Development. Resources, Conservation and
Recycling 43:189-208. Kreisel, W.E. 1984. Representation of the Environmental Quality Profile of a Metropolitan Area. Environmental Monitoring and
Assessment 4:15-33. Kriz, M. 2005. Out of the Loop. National Journal 5 February 2005.

2010 ENVIRONMENTAL PERFORMANCE INDEX
January 2010 67
Krupnick, A.J. and D. Farrell. 1996b. Six Steps to a Healthier Ambient Ozone Policy. Discussion paper. 96-13. Washington D.C.: Resources for the Future.
Krupnick, A.J. and J.W. Anderson. 1996a. Revising the Ozone Standard Resources. Washington, D.C.: Resources for the Future. Kuik, O. and H. Verbruggen, (Ed.). 1991. In Search of Indicators of Sustainable Development. Boston: Kluwer Academic
Publishers. Kunte, A., K. Hamilton, J. Dixon and M. Clemens. 1998. Estimating National Wealth: Methodology and Results. Washington,
D.C.: World Bank. Laycock, P.J. 1983. Interpreting Multivariate Data Journal of the Royal Statistical Society, Series A (General) 146(1):90-91. LeBlond, J.B. and L.K. Duffy. 2001. Toxicity Assessment of Total Dissolved Solids in Effluent of Alaskan Mines Using 22-h
Chronic Microtox® and Selenastrum Capricornutum Assays. Sci. Tot. Environ. 1-3:49-59. Lee, I.-N., W.-C. Chang, Y.-J. Hong and S.-C. Liao. 2006. Discovering Meaningful Information From Large Amounts of
Environment and Health Data to Reduce Uncertainties in Formulating Environmental Policies. Journal of Environmental Management. 81(4):434-440.
Leff, B., N. Ramankutty, and J.A. Foley. 2004. Geographic Distribution of Major Crops Across the World. Global Biogeochemical Cycles 18(1):16. Available at: http://www.sage.wisc.edu/download/majorcrops/majorcrops.html.
Leitmann, J. 1993a. Rapid Urban Environmental Assessment: Lessons from Cities in the Developing World. Discussion paper 14. Washington, D.C.: World Bank.
Leitmann, J. 1993b. Rapid Urban Environmental Assessment: Lessons from Cities in the Developing World: Tools and Outputs. Discussion paper 14. Washington, D.C.: World Bank.
Levett, R. 1998. Sustainability Indicators - Integrating Quality of Life and Environmental Protection. Journal of the Royal Statistical Society, Series A (Statistics in Society) 161(3):291-302.
Lindsey, J.K. 1999. Some Statistical Heresies. The Statistician 48:1-40. Linster, M. and F. Zegel. 2003. Pollution Abatement and Control Expenditure in OECD Countries. ENV/EPOC/SE(2003)1. Paris:
Organisation for Economic Co-operation and Development (OECD). Liou, S.M., S.L. Lo, and S.H. Wang. 2004. A Generalised Water Quality Index for Taiwan. Environmental Monitoring and
Assessment 96:35-32. Lohani, B.N. 1980. An Air Pollution Index Based on Factor Analysis. Journal of the IPHE 3:31-34. Lohani, B.N. and G. Todino. 1984. Water Quality Index of Chao Phraya River. Journal of Environmental Engineering
110(6):1163-1176. Ludwig, J.A. and J.F. Reynolds. 1988. Statistical Ecology: A Primer on Methods and Computing. New York: Wiley & Sons. Lumb, A., D. Halliwell, and T. Sharma. 2006. Application of the CCME Water Quality Index to Monitor Water Quality: A Case
Study of the Mackenzie River Basin, Canada. Environmental Monitoring and Assessment 113:411-429. Lumley, S. and P. Armstrong. 2004. Some of the Nineteenth Century Origins of the Sustainability Concept. Environment,
Development and Sustainability 6:367-378. Magurran, A.E. 1989. Diversidad Ecológica y su Medición. Barcelona: Vedra. Marchettini, N., M. Panzieri, V. Niccolucci, S. Bastianoni and S. Borsa 2003. Sustainability Indicators for Environmental
Performance and Sustainability Assessment of the Productions of Four Fine Italian Wines. International Journal of Sustainable Development and World Ecology 10:275-282.
Margalef, R. 1958. Information Theory in Ecology. General Systematics 3:36-71. Mayer, A.L. 2007. Strengths and Weaknesses of Common Sustainability Indices for Multidimensional Systems. Environ.Int. (in
press). McGarry, D. 2006. A Methodology of Visual-Soil Field Assessment Tool to Support, Enhance, and Contribute to the LADA
program. Rome, Italy: Food and Agriculture Organization. Menhinick, E.F. 1964. A Comparison of Some Species-Individuals Diversity Indices Applied to Samples of Field Insects.
Ecology 45:859-861. Michael, G.Y. 1991. Environmental Databases: Design, Implementation and Maintenance. Chelsea: Lewis Publishers. Michener, W.K., J.W. Brunt and S.G. Staffard. 1994. Environmental Information Management and Analysis: Ecosystem to
Global Scales. London: Taylor and Francis. Millard, E. 2007. "Restructuring the Supply Chain.” in Farming with Nature: the Science and Practice of Ecoagriculture, edited
by S.J. Scherr and J.A. McNeely. Island Press: Washington DC. Millennium Challenge Corporation (MCC). 2005. Website. Available at: http://www.mca.gov/. Millennium Ecosystem Assessment. 2005. Millennium Ecosystem Assessment Synthesis Reports. Island Press, Washington DC. Millimet, D.L., J.A. List and T. Stengos. 2005. The Environmental Kuznets Curve: Real Progress or Misspecified Models? The
Review of Economics and Statistics 85(4):1038-1047. Minguillón, M.C., Querol, X., Alastuey, A. et al. 2007. PM10 Speciation and Determination of Air Quality Target Levels. A
Case Study in a Highly Industrialized Area of Spain. Sci Total Environ. 372(2-3):382-96. Mitchell, B. 2007. Private Protected Areas. IUCN World Commission on Protected Areas. Prepared as Part of a Series for a
Summit on the IUCN categories in Andalusia, Spain, May 7-11 2007. Moldan, B., S. Billharz and R. Matravers. 1997. Sustainability Indicators. New York: Wiley. Mood, A.M., F.A. Graybill and D.C. Boes. 1974. Introduction to the Theory of Statistics. 3rd ed. Singapore: McGraw-Hill. Munda, G. and M. Nardo. 2003. On the Methodological Foundations of Composite Indicators Used for Ranking Countries. Ispra,
Italy: Joint Research Centre of the European Communities. Murray, C.J.L. and A.D. Lopez. 1996. The Global Burden of Disease. Cambridge, MA: Harvard University Press. Mutters, R. 1999. Statewide Potential Crop Yield Losses from Ozone Exposure. Sacramento: California Air Resources Board.

2010 ENVIRONMENTAL PERFORMANCE INDEX
January 2010 68
Nagels J.W., R.J. Davies-Colley, and D.G. Smith. 2001. A Water Quality Index for Contact Recreation in New Zealand. Water Science and Technology 43:285-292.
Nardo, M., M. Saisana, A. Saltelli and S. Tarantola. 2005a. Handbook on Constructing Composite Indicators: Methodology and User Guide. Directorate, OECD Statistics. OECD Statistics Working Paper Series. Paris: Organization for Economic Development and Co-operation (OECD).
Nardo, M., M. Saisana, A. Saltelli and S. Tarantola. 2005b. Tools for Composite Indicators Building. EUR 21682 EN. Ispra: Econometrics and Statistical Support to Antifraud Unit, Institute for the Protection and Security of the Citizen, Joint Research Centre (JRC).
Nas, P.J.M. and R. Jaffe. 2004. Informal Waste Management: Shifting the Focus from Problem to Potential. Environment, Development and Sustainability 6:337-353.
National Environment Protection Council (NEPC). 2005. National Environment Protection (Ambient Air Quality) Measure: Preliminary Work on Ozone for the Review of the Ambient Air Quality. Adelaide: NEPC.
National Geographic. 2001, 2006. EarthPulse: World of Water – Enough For All? 199:4. (See also, updated NG maps for water.) Nelson, K.P. 2002. Generalized Linear Mixed Models: Development and Comparison of Different Estimation Methods. Doctoral
Dissertation. Department of Statistics. Seattle: University of Washington. Netherland Environment Assessment Agency. 2008. Website. Available at: http://www.mnp.nl/edgar/model/. Niemeyer, D. 2002. Developing Indicators for Environmental Policy: Data-Driven and Theory-Driven Approaches Examined by
Example. Environmental Science & Policy 5(2):91-103. Nisbet, E. 2007. Cinderella Science. Nature 450(6):789-790. Nychka, D. and L. Cox. 1998. Case Studies in Environmental Statistics. Berlin: Springer Verlag. OECD Working Group on Environmental Information and Outlook. 2004. OECD Workshop on Material Flows and Related
Indicators: Chair's Summary. ENV/EPOC/SE(2004)2. Paris: Organisation for Economic Co-operation and Development.
Oldeman, L.R. and E.M. Bridges. 1991. Global Assessment of Human Induced Soil Degradation. Wageningen: International Soil Reference and Information Centre.
Oppenheimer, C.H., D. Oppenheimer and W.B. Brogden (Ed.). 1976. Environmental Data Management. London: Wykeham Publications.
Organisation for Economic Co-operation and Development (OECD). Environmental Country Reviews. Available at: http://www.oecd.org/department/0,2688,en_2649_34307_1_1_1_1_1,00.html. Paris: OECD.
Organisation for Economic Co-operation and Development. 1993a. Indicators for the Integration of Environmental Concerns into Energy Policies. Monograph. Paris: Environment Directorate, OECD.
Organisation for Economic Co-operation and Development. 1993b. Indicators for the Integration of Environmental Concerns into Transport Policies. Monograph 42. Paris: Environment Directorate, OECD.
Organisation for Economic Co-operation and Development. 1993c. OECD Core Set of Indicators for Environmental Performance. Monograph. Paris: Environment Directorate, OECD.
Organisation for Economic Co-operation and Development. 1995. Environment Indicators: OECD Core Set. Paris: OECD. Organisation for Economic Co-operation and Development. 1996. Environmental Performance in OECD Countries: Progress in
the 1990s. Paris: OECD. Organisation for Economic Co-operation and Development. 1997a. Better Understanding Our Cities: Role of Urban Indicators.
Paris: OECD. Organisation for Economic Co-operation and Development. 1997b. Environmental Indicators for Agriculture. Paris: OECD. Organisation for Economic Co-operation and Development. 1997c. OECD Environmental Data Compendium 1997. Paris: OECD. Organisation for Economic Co-operation and Development. 1997d. OECD Environmental Performance Review: A Practical
Introduction. Monograph OECD/GD (97) 35. 60. Paris: OECD. Organisation for Economic Co-operation and Development. 1997e. Transfrontier Movements of Hazardous Wastes 1992/1993:
Statistics. 1997 edition. Paris: OECD. Organisation for Economic Co-operation and Development. 1998. Towards Sustainable Development: Environmental Indicators.
Paris: OECD. Organisation for Economic Co-operation and Development. 2003. Environmental Performance Review of Austria. Paris: OECD. Organisation for Economic Co-operation and Development. 2004a. Environmental Performance Review of Canada - Good
Progress, Much to be Done. Paris: OECD. Organisation for Economic Co-operation and Development. 2004b. Environmental Performance Review of Spain. Paris: OECD. Organisation for Economic Co-operation and Development. 2004c. Environmental Performance Review of Sweden. Paris:
OECD. Organisation for Economic Co-operation and Development. 2005. Environmental Performance Review of France - A Positive but
Demanding Assessment. Paris: OECD. Organization for Economic Development and Co-operation (OECD). 2007. Environment Directorate. OECD Key Environmental
Indicators. Paris: OECD. Orwin, K.H. and D.A. Wardle. 2004. New Indices for Quantifying the Resistance and Resilience of Soil Biota to Exogenous
Disturbances. Soil Biology & Biochemistry 36:1907-1912. Ostrom, E. 1990. Governing the Commons: The Evolution of Institutions for Collective Action. 10th ed. New York: Cambridge
University Press. Ott, W.R. 1978. Environmental Indices: Theory and Practice. Ann Arbor: Science Publishers, Inc. Ott, W.R. 1978. Environmental Indices: Theory and Practice. Ann Arbor: Ann Arbor Science.

2010 ENVIRONMENTAL PERFORMANCE INDEX
January 2010 69
Ott, W.R. 1995. Environmental Data and Statistics. Boca Raton: Lewis Publishers. Park, T. and M.B. Brown. 1994. Models for Catgeorical Data With Nonignorable Nonresponse. Journal of the American
Statistical Association (JASA) 89(425):44-52. Parker, J. and C. Hope. 1992. The State of the Environment: A Survey of Reports from Around the World" Environment
34(1):39-45. Parris, T.M. and R.W. Kates. 2003. Characterizing and Measuring Sustainable Development. Annual Review of Environment and
Resources 28:559-586. Patching Together a World View. 2007. Nature 450(7171):761. Patil, G.P. and C. Taillie. 1982. Diversity as a Concept and a Measurement Journal of the American Statistical Association (JASA)
77(379):548-567. Patil, G.P. and C. Taillie. 2004. Multiple Indicators, Partially Ordered Sets, and Linear Extensions: Multi-Criterion Ranking and
Prioritization" Environmental and Ecological Statistics 11:199-228. Pearce, D.W. and G. Atkinson. 1995. "Measuring Sustainable Development," in The Handbook of Environmental Economics,
edited by D.W. Bromley. Oxford: Blackwell. Peet, R.K. 1974. The measurement of species diversity. Annual Review of Ecology and Systematics 5:285-307. Peet, R.K. 1975. Relative Diversity Indices. Ecology 56:496-498. Peng, R.D., F. Dominici and T.A. Louis. 2006. Model Choice in Time Series Studies of Air Pollution and Mortality. Journal of
the Royal Statistical Society, Series A (Statistics in Society) 169(2):179-203. Pesce, S.F. and D.A. Wunderlin. 2000. Use of Water Quality Indices to Verify the Impact of Cordoba City (Argentina) on
Suquia River. Water Research 34:2915-2926. Peskin, H.M. 1998. "Alternative Resource and Environmental Accounting Approaches and their Contribution to Policy." In
Environmental Accounting in Theory and Practice. Edited by K. Uno and Peter Bartelmus. Dordrecht: Kluwer Academic Publishers.
Peterka, J.J. 1972. Effects of Saline Waters Upon Survival of Fish Eggs and Larvae and Upon the Ecology of the Fathead Minnow in North Dakota. PB-223 017, National Technical Information Service, Springfield, Va. 22161.
Petersen, P.J. 1997. Indicators of Sustainable Development in Industrializing Countries. Bangi, Malaysia: Penerbit Universiti Kebangsaan.
Pfannkuch, M. and C.J. Wild. 2000. Statistical Thinking and Statistical Practice: Themes Gleaned from Professional Statisticians. Statistical Science 15(2):132-152.
Pielou, E.C. 1966. The Measurement of Diversity in Different Types of Biological Collections. Journal of Theoretical Biology 13:131-144.
Pielou, E.C. 1974. Population and Community Ecology. New York: Gordon and Breach. Pielou, E.C. 1975. Ecological Diversity. New York: John Wiley & Sons. Pieri, C., J. Dumanski, A. Hamblin and A. Young. 1995. Land Quality Indicators. Discussion paper 315. Washington, D.C.:
World Bank. Pinter, L. 1994. Measuring Sustainability: Bibliography and Indicator Matrices. Winnipeg: International Institute for Sustainable
Development (IISD). Pinter, L., P. Hardi and P. Bartelmus. 2005. Indicators of Sustainable Development: Proposals for a Way Forward. Expert Group
Meeting on Indicators of Sustainable Development. New York. 13-15 December 2005. New York: United Nations Division for Sustainable Development.
Polfeldt, T. 2006. Making Environment Statistics Useful: A Third World Perspective. Environmetrics 17:219-226. Pollock, M.S., L.M.J. Clarke, M.G. Dube. 2007. The Effects of Hypoxia on Fishes: From Ecological Relevance to Physiological
Effects. Environ. Rev. 15:1-14. Population Action International. 1993. Sustaining Water: Population and the Future of Renewable Water Supplies. Washington,
D.C.: PAI. Population Action International. 1997. Sustaining Water, Easing Scarcity: A Second Update. Washington: PAI. Porter, T.M. 1995. Trust in Numbers: The Pursuit of Objectivity in Science and Public Life. Princeton, NJ: Princeton University
Press. Porter, T.M. 2001. Economics and the History of Measurement" Supplement to the History of Political Economy 33:4-22. Postel, S. 2001. More Food with Less Water. Scientific American 284(2):46. Raskin, P. 1997. Comprehensive Assessment of the Freshwater Resources of the World Water Futures: Assessment of Long-
Range Patterns and Problems. Stockholm: Stockholm Environmental Institute. REGIONET. 2003. Strategies for Regional Sustainable Development: An Integrated Approach beyond Best Practice. Regional
Sustainable Development - Evaluation Methods and Tools. Manchester, U.K.: European Commission, DG Research. Resources for the Future. 1997. The Implementation of the New National Ambient Air Quality Standards (NAAQS) for Ozone
and Fine Particles (Panel 2). Testimony to the Subcommittee on Clean Air, Wetlands, Private Property and Nuclear Safety Committee on Environment and Public Works, 24 April 1997. Washington, D.C.: Resources for the Future.
Ricotta, C. 2004. A Parametric Diversity Measure Combining the Relative Abundances and Taxonomic Distinctiveness of Species. Diversity and Distributions 10:143-146.
Rogers, P.P., K.F. Jalal, B.N. Lohani, G.M. Owens, C.-C. Yu, C.M. Dufournaud and J. Bi. 1997. Measuring Environmental Quality in Asia. Cambridge, MA: Harvard University Press.
Rosegrant, M.W., X. Cai and S.A. Cline. 2002. World Water and Food to 2025: Dealing with Scarcity. Washington, D.C.: International Food Policy Research Institute.
Rosenthal, E. "Europe's Appetite for Seafood Propels Illegal Trade." New York Times January 15, 2008.

2010 ENVIRONMENTAL PERFORMANCE INDEX
January 2010 70
Rothwell, C.J., C.N. Hamilton and P.E. Leavertan. 1991. Identification of Sentinel Health Events as Indicators of Environmental Contamination. Environmental Health Perspectives 94:261-263.
Rubin, D.B. 1994. Comment on Bradley Efron's Article: Missing Data, Imputation, and the Bootstrap. Journal of the American Statistical Association (JASA) 89(426):475.
Rubin, D.B. 1996. Multiple Imputation After 18+ Years. Journal of the American Statistical Association (JASA) 91(434):473-489. Ruis, B.M.G.S. 2001. No Forest Convention But Ten Tree Treaties. Unasylva 206:3-13. Saisana, M. and S. Tarantola. 2002. State-of-the-Art Report on Current Methodologies and Practices for Composite Indicator
Development. EUR 20408 EN. Ispra: Applied Statistics Group, Institute for the Protection and Security of the Citizen, Joint Research Centre (JRC).
Sanderson, E.W., et al. 2002. The human footprint and the last of the wild. Bioscience 52(10):891–904. Sanderson, E.W., M. Jaiteh, M.A. Levy, K.H. Redford, A.V. Wannebo, and G. Woolmer. 2002. The Human Footprint and the
Last of the Wild. Bioscience 52(10):891–904. Schafer, J.L. 1997. Analysis of Incomplete Multivariate Data. Monographs on Statistics and Applied Probability 72. 1st ed.
London: Chapman & Hall/CRC. Scheehle, E. and Kruger, D. 2006. Global Anthropogenic Methane and Nitrous Oxide Emissions. Energy Journal Sp. Issue
3:33-44. Scherr and McNeely. 2007. Farming with Nature: The Science and Practice of EcoAgriculture. Washington, D.C.: Island Press. Schoerers, P.J. 1983. The Need for an Ecological Quality Concept. Environmental Monitoring and Assessment 3:219. Schofield, C.L. 1976. Acid Precipitation: Effects on Fish. Ambio 5-6:228-210. Schulze, P.C. (Ed). 1999. Measures of Environmental Performance and Ecosystem Condition. Washington, D.C.: National
Academy Press. Schumann, R.W. 1995. Eco-Data: Using Your PC to Obtain Free Environmental Information. Rockville: Government Institutes,
Inc. Schwartz, J. 2003. The Impact of State Capacity on Enforcement of Environmental Policies: The Case of China. Journal of
Environment & Development 12(1):50-81. Scott, S., B. Nolan and T. Fahey. 1996. Formulating Environmental and Social Indicators for Sustainable Development. Dublin:
Economic and Social Research Institute. Seckler, D., U. Amarasinghe, D. Molden, R. de Silva, and R. Barker. 1998. World Water Demand and Supply, 1990 to 2025:
Scenarios and Issues. Research Report 19. Colombo, Sri Lanka: International Water Management Institute. Segnestam, L. 1999. Environmental Performance Indicators: A Second Edition Note. Environment Department Papers. 71.
Washington D.C.: World Bank. Shannon, C.E. and W. Weaver. 1949. The Mathematical Theory of Communication. Urbana, IL: University of Illinois Press. Shepherd, K.D., and M.G. Walsh. Development of reflectance spectral libraries for characterization of soil properties. Soil
Science Society of America Journal 66(3):988-998. Sheram, K. 1993. The Environmental Databook: A Guide to Statistics on the Environment and Development. Washington, D.C.:
World Bank. Shih, J.-S., A.J. Krupnick, M.S. Bergin and A.G. Russell. 2004. Source-Receptor Relationships for Ozone and Fine Particulates
in the Eastern United States. Discussion paper. 04–25. Washington D.C.: Resources for the Future. Shih, J.-S., S.M. Bergin, A.J. Krupnick and A.G. Russell. 2003. Controlling Ozone and Fine Particulates: Cost Benefit Analysis
with Meteorological Variability. Discussion paper. 03-55. Washington D.C.: Resources for the Future. Shlisky, A., J. Waugh, P. Gonzalez, M. Gonzalez, M. Manta, H. Santoso, E. Alvarado, A. Ainuddin Nuruddin, D.A. Rodríguez-
Trejo, R. Swaty, D. Schmidt, M. Kaufmann, R. Myers, A. Alencar, F. Kearns, D. Johnson, J. Smith, D. Zollner and W. Fulks. 2007. Fire, Ecosystems and People: Threats and Strategies for Global Biodiversity Conservation. GFI Technical Report. 2007-2. Arlington, VA: The Nature Conservancy.
Simpson, E. H. 1949. Measurement of Diversity. Nature 163:688. Sinha, B.K. and K.R. Shah. 2003. On Some Aspects of Data Integration Techniques with Environmental Applications.
Environmetrics 14:409-416. Siracusa, G., A.D.L. Rosa and S.E. Sterlini. 2004. A New Methodology to Calculate the Environmental Protection Index (EPI): A
Case Study Applied to a Company Producing Composite Materials. Journal of Environmental Management 73:275-284. Skillius, Å. and U. Wennberg. 1998. Continuity, Credibility and Comparability - Key Challenges for Corporate Environmental
Performance Measurement and Communication. A report commissioned by the European Environment Agency. Lund, Sweden: The International Institute for Industrial Environmental Economics at Lund University.
Smakhtin, V.U. and D.A. Hughes. 2004. Review, Automated Estimation and Analyses of Drought Indices in South Asia. Working Paper. 83. Colombo, Sri Lanka: International Water Management Institute.
Smjyth, A.J. and J. Dumanski. 1995. A Framework for Evaluating Sustainable Development. Canadian Journal of Soil Science 75(4):41-46.
Sorensen, D.L., M. McCarthy, E.J. Middlebrooks and D.B. Porcella. 1977. Suspended and Dissolved Solids Effects on Freshwater Biota: A Review. US Environmental Protection Agency, EPA-600/3-77-042.
Stakeholder Forum for Our Common Future. 2002. International Environmental Governance: A Briefing Paper. Available at: http://www.unedforum.org/publications/reports/IEG-SFpaper.pdf.
Statistical Commission. 2002. Reports Presented to the Statistical Commission on the Harmonization of Indicators on Development and the Coordination of Statistical Data Collection Activities from Member Countries. Available at: http://unstats.un.org/unsd/statcom/sc2002.htm.

2010 ENVIRONMENTAL PERFORMANCE INDEX
January 2010 71
Steinfeld, H., P. Gerber, T. Wassenaar, V. Castel, M. Rosales, and C. de Haan. 2006. Livestock’s Long Shadow: Environmental Issues and Options. Rome: Food and Agriculture Organization of the United Nations.
Steuer, D. 1999. Multi-Criteria-Optimization and Desirability Indices. Technical Report-Reihe des Sonderforschungsbereichs 475. 20/99. Dortmund: Dortmund University.
Steuer, D. 2000. An Improved Optimization Procedure for Desirability Indices. Technical Report-Reihe des Sonderforschungsbereichs 475. 27/00. Dortmund: Dortmund University.
Stigler, S. 1999. Statistics on the Table: The History of Statistical Concepts and Methods. Cambridge, MA: Harvard University Press.
Sullivan, C. (ed.). 2001. The Development of a Water Poverty Index: A Feasibility Study. Wallingford, U.K.: Centre for Ecology & Hydrology.
Syers, J.K., A. Hamblin and E. Pushparajah. 1995. Indicators and Thesholds for the Evaluation of Sustainable Land Management. Canadian Journal of Soil Science 75(4):423-428.
Taam, W., P. Subbaiah and J.W. Liddy. 1993. A Note on Multivariate Capability Indices. Journal of Applied Statistics 20(3):229-351.
Tao, C.-C. and C.-C. Hung. 2003. A Comparative Approach of the Quantitative Models for Sustainable Transportation. Journal of the Eastern Asia Society for Transportation Studies 5:3329-3344.
The H. John Heinz III Center for Science, Economics, and the Environment. 2002. The State of the Nation’s Ecosystems: Measuring the Lands, Waters, and Living Resources of the United States. Cambridge: Cambridge U Press. Updates Available at http://www.heinzctr.org/ecosystems/intro/indicators1.shtml.
The Ozone Hole Inc. 2008. The Ozone Hole History. Available at: http://www.theozonehole.com/ozoneholehistory.htm. Theil, H. 1967. Economics and Information Theory. Amsterdam: North-Holland. Thomas, W. A. (Ed.). 1972. Indicators of Environmental Quality. Plenum Publishing Corporation. Törnqvist, L. 1936. The Bank of Finland's Consumption Price Index. Bank of Finland Monthly Bulletin 10:1-8. Trautmann, H. 2004. Qualitätskontrolle in der Industrie anhand von Kontrollkarten für Wünschbarkeitsindizes - Anwendungsfeld
Lagerverwaltung. Dissertation. Graduate School of Production Engineering and Logistics, Department of Statistics. Dortmund: Dortmund University.
Tropospheric Emission Monitoring Internet Service. 2008. Website. Available at: http://www.temis.nl/airpollution/so2.php. Tschirley, J.B. 1992. The Use of Indicators for Sustainable Agriculture and Rural Development. Rome: Food and Agricultural
Organization of the United Nations. Tsuji, N. and Y. Tsubaki. 2004. Three New Algorithms to Calculate the Irreplaceability Index for Presence/Absence Data.
Biological Conservation 119:487-494. Tyteca, D. 1996. On the Measurement of the Environmental Performance of Firms - A Literature Review and a Productive
Efficiency Perspective. Journal of Environmental Management 46:281-308. Tyteca, D. 1997. Linear Programming Models for the Measurement of Environmental Performance of Firms - Concepts and
Empirical Results. Journal of Productivity Analysis 8:183-197. U.S. Environmental Protection Agency (USEPA). 2008. Website. Available at: http://www.epa.gov/air/criteria.html#6. U.S. Environmental Protection Agency. 2005. Global Earth Observation System of Systems (GEOSS). Available at:
http://www.epa.gov/geoss/. UN Millennium Project. 2005. Environment and Human Well-Being: A Practical Strategy. Summary Version of the Report of the
Task Force on Environmental Sustainability. New York: The Earth Institute at Columbia University. UNEP GEMS/Water. 2006. Water Quality for Ecosystem and Human Health. Burlington, Canada. A publication of the UNEP
GEMS/Water Programme. UNEP GEMS/Water. 2007. Water Quality Outlook. A publication of the United Nations Environment Programme Global
Environment Monitoring System (GEMS)/Water Pogramme. UNEP/RIVM. 1994. An Overview of Environmental Indicators: State of the Art and Perspectives. Nairobi: United Nations
Environment Programme. UNEP/RIVM. 1995. Scanning the Global Environment: A Framework and Methodology for Integrated Environmental Reporting
and Assessment. Nairobi: United Nations Environment Programme. UNEP/WHO. 1993. Gems/Air - Global Environmental Monitoring System: A Global Programme for Urban Air Quality
Monitoring and Assessment. Document No. WHO/PEP 93.7, UNEP/GEMS/93.A.I. United Nations Environment Programme.
UNESCO-SCOPE. 2006. Indicators of Sustainability: Reliable Tools for Decision Making. UNESCO-SCOPE. United Nations Commission for Sustainable Development. 2001. Indicators of Sustainable Development. Available at:
http://www.un.org/esa/sustdev/natlinfo/indicators/isd.htm. New York: United Nations. United Nations Development Program. 2002. Human Development Report 2002 - Deepening Democracy in a Fragmented World.
Human Development Reports. New York: UNDP. United Nations Development Programme (UNDP). 1997. Human Development Report 1997. New York: Oxford University
Press. United Nations Development Programme (UNDP). 2006. Human Development Report 2006. New York: Oxford University
Press. United Nations Economic Commission for Europe (UNECE). 1995. Definitions of Terms Used in ECE Standard Classifications
for the Environment. Geneva: United Nations Economic Commission for Europe. United Nations Economic Commission for Europe (UNECE). 2008. Environmental Performance Reviews. Available at:
http://www.unece.org/env/epr/welcome.htm. Geneva: UNECE

2010 ENVIRONMENTAL PERFORMANCE INDEX
January 2010 72
United Nations Educational Scientific and Cultural Organization. 2003. The United Nations World Water Development Report. Paris: UNESCO and Berghahn Books.
United Nations Environment Programme (UNEP). 1990. Thesaurus of Environmental Terms. Nairobi: United Nations Environment Programme.
United Nations General Assembly. 2000. United Nations Millennium Declaration. 55th Session. A/Res/55/2. New York: United Nations.
United Nations. 1984. Framework for the Development of Environment Statistics. Statistics Paper, Series M, No. 78. New York: United Nations.
United Nations. 1987. Energy Statistics: Definitions, Units of Measure, and Conversion Factors. New York: United Nations. United Nations. 1988a. ACCIS Guide to United Nations Information Sources on the Environment. New York: United Nations. United Nations. 1988b. Concepts and Methods of Environment Statistics: Human Settlements Statistics. Studies in Methods,
Series F, No. 51. New York: United Nations. United Nations. 1991. Concepts and Methods of Environment Statistics: Statistics of the Natural Environment. Studies in
Methods, series F, No. 57. New York: United Nations. United Nations. 1992. Agenda 21. Programme of Action for Sustainable Development. United Nations Conference on
Environment and Development (UNCED), 3-14 June, Rio de Janeiro, Brazil. New York: United Nations. United Nations. 1993a. Integrated Environmental and Economic Accounting: Handbook of National Accounting. New York:
United Nations. United Nations. 1993b. Readings in International Environment Statistics. New York: United Nations. United Nations. 1994a. Recommendation on Tourism Statistics. Statistical Papers, Series M, No. 83. New York: United Nations. United Nations. 1994b. Towards a Framework for Indicators of Sustainable Development. Working paper ST/ESA/1994/WP.7.
15. New York: United Nations. United Nations. 1995. Compendium of Human Settlement Statistics. New York: United Nations. United Nations. 1996a. Indicators of Sustainable Development: Framework and Methodologies. New York: United Nations. United Nations. 1996b. State of the Environment Reporting: Source Book of Methods and Approaches. New York: United
Nations. United Nations. 1997a. Accounting and Valuation of Environment Volume 1: A Primer for Developing Countries. Bangkok:
United Nations Economic and Social Commission for Asia and the Pacific. United Nations. 1997b. Glossary of Environment Statistics. Studies in Methods, Series F, No. 67. New York: United Nations. United Nations. 1997c. Spatial Data Sets for Environment Assessment: Towards Bridging the Data Gap. New York: United
Nations. United Nations. 2000. United Nations Millennium Development Goals. Available at: http://www.un.org/millenniumgoals/. United Nations. 2004. Report of the Interagency Working Group on Environment Statistics to the 35th Session of the Statistical
Commission. New York: United Nations. United Stated Department of Agriculture (USDA). 2000. Farm Income and Financial Conditions. Available at:
http://www.ers.usda.gov/ Briefing/baseline/1999/income.htm#income.
United States Department of Agriculture (USDA). 1986. A Primer on Integrating Resource Inventories. Washington, D.C.: United States Department of Agriculture.
United States Department of Agriculture. 2008. ERS/USDA Briefing Room - Farm Income and Costs. Available online at: http://www.ers.usda.gov/Briefing/FarmIncome/
United States Environmental Protection Agency (USEPA). 1994. Terms of Environment: Glossary, Abbreviations, and Acronyms. Washington, D.C.: United States Environmental Protection Agency.
University of Maryland. 1999. Rain Use Efficiency and Net Primary Production Database. Prepared for WRI as part of the PAGE project. College Park, MD: UMD Department of Geography.
Van Ardenne, J.A., F.J. Dentener, J.F.J. Olivier, et al. The EDGAR 3.2 Fast Track 2000 dataset (32FT2000), Emission Database for Global Atmospheric Research: Description of 32 FT2000 Document.
Van Noordijk, M., F. Agus, B. Verbist, K. Hairiah, T.P. Tomich. 2007. "Watershed Management." In Scherr, S.J. and J.A. McNeely, (eds). Farming with Nature: The Science and Practice of Ecoagriculture. Washington, D.C.: Island Press.
Victor, P.A. 1991. Indicators of Sustainable Development: Some Lessons From Capital Theory. Ecological Economics 4:191-213. Vo¨ro¨smarty, Charles J., Christian Le´veˆque and Carmen Revenga. 2005. "Chapter 7: Freshwater Ecosystem Services." In
Millennium Ecosystem Assessment, Ecosystems and Human Well-Being: Current State and Trends. Washington, D.C.: Island Press.
Walford, N. 1995. Geographical Data Analysis. New York: Wiley. Walmsley, D., T. Havenga, E. Braune, C. Schmidt, K. Prasad and B.V. Koppen. 2004. An Evaluation of World Water
Programme Indicators for Use in South Africa. Working Paper 90. Colombo, Sri Lanka: International Water Management Institute.
Washington, H.G. 1984. Diversity, Biotic and Similarity Indices: A Review with Special Relevance to Aquatic Ecosystems. Water Research 18(6):653-694.
Watson, R, I.R. Noble, B. Bolin, N.H. Ravindranath, D.J. Verardo, D.J. Dokken (eds.). 2000. Land Use, Land-Use Change, and Forestry. Cambridge: Intergovernmental Panel on Climate Change (IPCC) and Cambridge University Press. Summary available at: http://www.ipcc.ch/pub/SPM_SRLULUCF.pdf.
Weber-Scannell, P.K., and L.K. Duffy. 2007. Effects of Total Dissolved Solids on Aquatic Organisms: A Review of Literature and Recommendation for Salmonid Species. Amer. J. Environ. Sci. 3:1-6

2010 ENVIRONMENTAL PERFORMANCE INDEX
January 2010 73
Weinstein, E. 2005. MathWorld. Wolfram Research. Available at: http://mathworld.wolfram.com/. Wetzel, R.G. 2001. Limnology, Third Edition. Burlington, MA: Academic Press. Whittaker, R. H. 1965. Dominance and Diversity in Land Plant Communities. Science 147:250-260. Whittaker, R.H. 1972. Evolution and Measurement of Species Diversity. Taxon. 21:213-251. Willer, H. and M. Yussefi, (eds.). 2007. The World of Organic Agriculture - Statistics and Emerging Trends. International
Federation of Organic Agriculture Movements and Research Institute of Organic Agriculture FiBL, Bonn, Germany, and Frick, Switzerland.
Wills, J.T. and D.J. Briggs. 1995. Developing Indicators for Environment and Health. World Health Statistics Quarterly 48(2):155-163.
Wilson, J., P. Tyedmers and R. Pelot. 2006. Contrasting and Comparing Sustainable Development Indicator Metrics. Ecological Indicators 7(2)299-314.
Wise, N.M. 1995. The Value of Precision. Princeton, NJ: Princeton University Press. Wood, S., K. Sebastian, and S. Scherr. 2000. Pilot Analysis of Global Ecosystems: Agroecosystems. Washington, D.C.: The
International Food Policy Research Institute and the World Resources Institute. World Bank. 1992. World Development Report 1992: Development and the Environment. Washington, D.C.: World Bank. World Bank. 1995. Monitoring Environmental Progress. Washington, D.C.: World Bank. World Bank. 1996. Environmental Performance Indicators: A First Edition Note. Washington, D.C.: Environment Department,
World Bank. World Bank. 1998a. 1998 World Development Indicators. Washington, D.C.: World Bank. World Bank. 1998b. Expanding the Measure of Wealth: Indicators of Environmentally Sustainable Development. Monograph.
Washington, D.C.: World Bank. World Commission on Environment and Development. 1987. Our Common Future. Oxford: Oxford University Press. World Health Organization (WHO). 1980. Analysing and Interpreting Air Monitoring Data. Geneva: WHO. World Health Organization (WHO). 1982. Rapid Assessment of Sources of Air, Water and Land Pollution. Geneva: WHO. World Health Organization (WHO). 1992. Water Supply and Sanitation Sector Monitoring Report 1990: Baseline Year.
WHO/UNICEF Joint Monitoring Program. New York, United States and Geneva, Switzerland. World Health Organization (WHO). 1993. Water Supply and Sanitation Sector Monitoring Report 1993: Sector Status as of 31
December 1991. WHO/UNICEF Joint Monitoring Program. New York, United States and Geneva, Switzerland. World Health Organization (WHO). 1996. Water Supply and Sanitation Sector Monitoring Report 1996: Sector Status as of 31
December 1994. WHO/UNICEF Joint Monitoring Program WHO/EOS/96.15. New York, United States and Geneva, Switzerland.
World Health Organization (WHO). 2000. WHO Air Quality Guidelines for Europe. Copenhagen: WHO. World Health Organization (WHO). 2000a. Global Water Supply and Sanitation Assessment 2000 Report.
http://www.who.int/water_sanitation_health/Globassessment/GlobalTOC.htm. World Health Organization (WHO). 2000b. Improving Performance. Geneva, Switzerland: WHO. World Health Organization (WHO). 2000b. World Health Report 2000: Health Systems. Geneva: WHO. World Health Organization (WHO). 2004. Guidelines for Drinking-Water Quality. Third Edition Volume 1: Recommendations.
Geneva: World Health Organisation. World Health Organization (WHO). 2005. WHO Air Quality Guidelines for Particulate Matter, Ozone, Nitrogen Dioxide and
Sulfur Dioxide. Global Update 2005, Summary of Risk Assessment. Available at: http://www.who.int/phe/health_topics/outdoorair_aqg/en/index.html.
World Health Organization (WHO) and Food and Agriculture Organization of the United Nations (FAO). 2003. Diet, Nutrition, and the Prevention of Chronic Disease. Geneva: WHO.
World Resources Institute (Ed.). 2007. Nature’s Benefits in Kenya, An Atlas of Ecosystems and Human Well-Being. World Resources Institute, Washington, DC and Nairobi.
World Resources Institute (WRI). 1995. World Directory of Country Environmental Studies. Washington, D.C.: WRI. World Wildlife Fund (WWF), Zoological Society of London (ZSL), and Global Footprint Network. 2006. Living Planet Report
2006. Gland, Switzerland: WWF. Yale Center for Environmental Law & Policy. 2005. Yale Environment Poll 2005. New Haven, CT: Yale Center for
Environmental Law & Policy. Available at: http://www.yale.edu/envirocenter/environmentalpoll.htm. Young, O.R. 1999. The Effectiveness of International Environmental Regimes: Causal Connections and Behavioral Mechanisms.
Cambridge: MIT Press. Zellner, A. (n.d.). Keep It Sophisticatedly Simple. Chicago: University of Chicago Press. Zellner, A. 1992. Statistics, Science and Public Policy. Journal of the American Statistical Association (JASA) 87(417):1-6. Zidek, J.V. 2006. Post-Normal Statistical Science. Journal of the Royal Statistical Society, Series A (Statistics in Society)
169(1):1-4. Kaufmann, Daniel, Kraay, Aart and Mastruzzi, Massimo, “Governance Matters VI: Governance Indicators for 1996-2006” (July 2007). World Bank Policy Research Working Paper No. 4280 Available at SSRN: http://ssrn.com/abstract=999979