Embed Size (px)
Citation preview


The information contained herein is based on sources we believe reliable and should be
understood to be general risk management and insurance information only. The information
is not intended to be taken as advice with respect to any individual situation and cannot be
relied upon as such.
© Copyright 2010 Marsh Ltd All rights reserved
In the United Kingdom, Marsh Ltd is authorised and regulated by the Financial Services
Authority for insurance mediation activities only

2010 EMEA business continuity benchmark report

In 2008, Marsh completed the first European wide Business Continuity Management (BCM) survey. This survey highlighted the growing acceptance of BCM throughout a wide range of organisations and the advantages that could be gained by integrating it into their organisations. In 2010, Marsh conducted another survey, using a similar question set but incorporating a wider array of responses from the Middle East. These results give an insight into the current state of the market as well as allowing the identification of trends over the past two years.
The main body of information shows that BCM continues to grow in a linear progression, further embedding itself in organisations and being utilised as a strategic tool to help them in their day-to-day operations. This was the major discovery of the 2008 survey, as prior to that BCM was driven by regulatory and compliance issues and thus was more of a ‘tick in the box’ solution. As organisations started to adopt BCM and integrate it into their organisations, they realised its potential for improving their operational efficiency and risk resilience.
The main discovery in this year’s result is around the integrated nature of risk, with BCM now as a component part of an enterprise risk management (ERM) programme. This integration allows firms to leverage the synergies of combined risk management and BCM information when analysing their risks.
The anomaly in the results was a reduction in the perceived benefits of BCM and the drivers for implementing it. These results are in contrast to the general findings of the survey, with an uptake in BCM implementation and maturity. The most likely explanation for this is that BCM is now not perceived as an optional extra service, but rather as core to a business. Thus, managers do not perceive as many discrete benefits from it, nor do they see tangible drivers for implementing it, as it is just part of their day-to-day operations.
Executive Summary

1. Methodology .................................................................................................................................................... 6
2. Respondent details .......................................................................................................................................... 7
3. BCM maturity ................................................................................................................................................... 8
4. Supply chain risks .......................................................................................................................................... 12
5. Incidents and losses ......................................................................................................................................... 15
6. BCM drivers .................................................................................................................................................... 16
7. Barriers to BCM ............................................................................................................................................. 18
8. Benefits of BCM .............................................................................................................................................. 20
9. BCM plan purpose .......................................................................................................................................... 21
10. BS 25999 Collaboration .................................................................................................................................. 23
11. BCM as a strategic influence ........................................................................................................................... 25
Contents

The question set used for this analysis was designed by Marsh BCM experts and was based on the previous survey completed in 2008. The survey solicited the views of 225 business continuity and risk managers through a web-based survey to gauge their perceptions on issues relating to BCM. These professionals responded from around Europe, the Middle East and Africa. The survey was open from the beginning of March until the end of April 2010.
This report analyses the data yielded from the survey, looking at the significance of the response from each individual question. In addition, this report examines correlations between responses in an attempt to draw conclusions about the BCM market in general. Due to a similar question set, it is also possible to compare these responses to those of the 2008 survey. Conclusions have been drawn from the quantitative data available, but where appropriate Marsh experience and expertise has been used to supplement the data to draw conclusions.
Throughout the report, the two main industry groups used for comparison are financial services and manufacturing. Both of these industries are quite distinctive and operate under different parameters. Similar to 2008, they both got the highest number of responses, which improves the correlations drawn.
There were responses to the survey from a wide array of countries, with a large bias (25%) from the UK as well as a substantial number from Abu Dhabi and Saudi Arabia (16% each). The bias is likely due to the substantial presence of Marsh clients and offices in these areas, which were leveraged to get completed responses.
There were also a few (2.2%) responses from outside the EU, although this should not be enough to skew the results. This is a much wider spread of responses than was achieved in 2008.
1 | Methodology
Methodology
6 2010 EMEA business continuity benchmark report
”
“The survey solicited the views of 225 business continuity and risk managers through a web-based survey to gauge their perceptions on issues relating to BCM
Other 14%
Bahrain 2%
Saudi Arabia 16%
Abu Dhabi 16%
Dubai 8%
Germany 8%
Denmark 3%
Portugal 3%
Switzerland 6%
UK 25%
Other 14%
Bahrain 2%
Saudi Arabia 16%
Abu Dhabi 16%
Dubai 8%
Germany 8%
Denmark 3%
Portugal 3%
Switzerland 6%
UK 25%
Over 500027%
1001 - 500031%
501 - 100011%
100 - 50021%
Less than 10010%
Over 500027%
1001 - 500031%
501 - 100011%
100 - 50021%
Less than 10010%
0 5 10 15 20 25
Other
Technology & communications
Retail & consumer
Real estate
Professional services
Power & utilities
Oil & energy
Manufacturing
Government & public services
Financial services
Construction
Strongly agree20%
Agree66%
Disagree3%
Strongly disagree
Undecided11%
Strongly agree20%
Agree66%
Disagree3%
Strongly disagree
Undecided11%
Strongly agree23%
Agree60%
Disagree6%
Strongly disagree
Undecided11%
Strongly agree23%
Agree60%
Disagree6%
Strongly disagree
Undecided11%
Strongly agree29%
Agree54%
Disagree4%
Strongly disagree
Undecided13%
Strongly agree29%
Agree54%
Disagree4%
Strongly disagree
Undecided13%
0 10 20 30 40 50 60 70 80
Very mature
Mature
Non existent
Partial
Basic
Strongly agree17%
Agree50%
Disagree11%
Strongly disagree
Undecided22%
Strongly agree17%
Agree50%
Disagree11%
Strongly disagree
Undecided22%
0 10 20 30 40 50 60
Strongly agree
Agree
Undecided
Disagree
Strongly disagree
0 10 20 30 40 50 60Other
Regulatory non-compliance
Power loss
Criminal/terrorist activity
Leakage/pollution
Industrial action
Supply failure
IT failure
Flooding
Fire/explosion
Equipment failure (non-IT)
No major losses in the last two years
0 10 20 30 40 50 60 70 80
Insurer pressure
Other
Regulatory compliance
Shareholder/non-executive director pressure
Client pressure, i.e. 24/7 operating requirements
Competitive advantage
Past experience
Best practice
0 10 20 30 40 50 60
Regulatory compliance
Insurer pressure
Other
Shareholder/non-executive director pressure
Outside pressure (clients, insurers, etc)
Competitive advantage
Past experience
Best practice
0 10 20 30 40 50Credit crunch e�ect
Bad experiences
Con�icting approaches
Con�icting ownership
Programme complexity
Lack of expertise
Lack of time
Lack of resource
Lack of understanding
Con�icting priorities
Lack of executive sponsorship
Lack of budget
0 10 20 30 40 50
Increased regulatory compliance
Improved risk-intelligent decision-making
Reduced insurance cost
Better preparation for known and unforeseen threats
Better understanding of your business
Faster recovery after real incidents
Reduced impact in real incidents
0 10 20 30 40 50 60
Ful�l legal/regulatory obligations
Other
Protect the supply of products/services
Protect our business strategy
Protect sta�
Protect our shareholder interests
Protect our reputation
Protect our revenue and pro�t
Recover critical business processes
0 20 40 60 80 100
Ful�l legal/regulatory obligations
Protect the supply of products/services
Protect our business strategy
Protect sta�
Protect our shareholder interests
Protect our reputation
Protect our revenue and pro�t
Recover critical business processes
Strongly agree
Agree
Disagree
Strongly disagree
Undecided
Strongly agree
Agree
Disagree
Strongly disagree
Undecided
Strongly disagree2%
Agree20%
Disagree7%
Undecided49%
Strongly agree22%
0 20 40 60 80 100
Strongly agree Agree Undecided Disagree Strongly disagree
Manufacturing
Financial services
0 20 40 60 80 100
Over 5000
Under 100
Strongly agree Agree Undecided Disagree Strongly disagree
Strongly agree
Agree
Disagree
Strongly disagree
Undecided
Strongly agree
Agree
Disagree
Strongly disagree
UndecidedStrongly disagree
1%
Agree44%
Disagree19%
Undecided26%
Strongly agree10%
Lack of budget 20%
Lack of executive sponsorship 9%
Con�icting priorities 33%
Lack of understanding 18%
Lack of resource 28%
Lack of time 30%
Lack of expertise 12%
Programme complexity 13%
Con�icting ownership 11%
Con�icting approaches 4%
Bad experiences 3% Other 1%
Credit crunch e�ect 4%
Manufacturing Financial services
Manufacturing Financial services
Manufacturing Financial services
Manufacturing Financial services
Stronglydisagree
0%
Stronglydisagree
0%
Survey country split

Similar to the survey in 2008, there is a bias towards organisations with over 1,000 people, with 58% of responses from this area (62% in 2008). Again there is only a small percentage of responses from companies smaller than 100 people, with 10% (12% in 2008). These results are as expected and are indicative of prevalent market conditions, where BCM remains a more imminent issue for larger firms. This is due to an increased awareness of BCM and risk in their organisations, as well as increased resources to be able to address these issues.
The survey shows responses from a wide array of industries. The largest responses were from financial services (22%) and manufacturing (13%). The skew is likely to be from the awareness generated from regulation and the impact of real events in these industries. Comparing these results to 2008 shows an increase of 7% in the financial services responses, which could be caused by an increased awareness of risk from worldwide events and the work of the Financial Services Authority (FSA) in highlighting the importance of BCM and having a plan.
7Marsh
Respondent details
Respondent details | 2
”“These results are
as expected and are indicative of prevalent market conditions
Organisation size Industry sector
Other 14%
Bahrain 2%
Saudi Arabia 16%
Abu Dhabi 16%
Dubai 8%
Germany 8%
Denmark 3%
Portugal 3%
Switzerland 6%
UK 25%
Other 14%
Bahrain 2%
Saudi Arabia 16%
Abu Dhabi 16%
Dubai 8%
Germany 8%
Denmark 3%
Portugal 3%
Switzerland 6%
UK 25%
Over 500027%
1001 - 500031%
501 - 100011%
100 - 50021%
Less than 10010%
Over 500027%
1001 - 500031%
501 - 100011%
100 - 50021%
Less than 10010%
0 5 10 15 20 25
Other
Technology & communications
Retail & consumer
Real estate
Professional services
Power & utilities
Oil & energy
Manufacturing
Government & public services
Financial services
Construction
Strongly agree20%
Agree66%
Disagree3%
Strongly disagree
Undecided11%
Strongly agree20%
Agree66%
Disagree3%
Strongly disagree
Undecided11%
Strongly agree23%
Agree60%
Disagree6%
Strongly disagree
Undecided11%
Strongly agree23%
Agree60%
Disagree6%
Strongly disagree
Undecided11%
Strongly agree29%
Agree54%
Disagree4%
Strongly disagree
Undecided13%
Strongly agree29%
Agree54%
Disagree4%
Strongly disagree
Undecided13%
0 10 20 30 40 50 60 70 80
Very mature
Mature
Non existent
Partial
Basic
Strongly agree17%
Agree50%
Disagree11%
Strongly disagree
Undecided22%
Strongly agree17%
Agree50%
Disagree11%
Strongly disagree
Undecided22%
0 10 20 30 40 50 60
Strongly agree
Agree
Undecided
Disagree
Strongly disagree
0 10 20 30 40 50 60Other
Regulatory non-compliance
Power loss
Criminal/terrorist activity
Leakage/pollution
Industrial action
Supply failure
IT failure
Flooding
Fire/explosion
Equipment failure (non-IT)
No major losses in the last two years
0 10 20 30 40 50 60 70 80
Insurer pressure
Other
Regulatory compliance
Shareholder/non-executive director pressure
Client pressure, i.e. 24/7 operating requirements
Competitive advantage
Past experience
Best practice
0 10 20 30 40 50 60
Regulatory compliance
Insurer pressure
Other
Shareholder/non-executive director pressure
Outside pressure (clients, insurers, etc)
Competitive advantage
Past experience
Best practice
0 10 20 30 40 50Credit crunch e�ect
Bad experiences
Con�icting approaches
Con�icting ownership
Programme complexity
Lack of expertise
Lack of time
Lack of resource
Lack of understanding
Con�icting priorities
Lack of executive sponsorship
Lack of budget
0 10 20 30 40 50
Increased regulatory compliance
Improved risk-intelligent decision-making
Reduced insurance cost
Better preparation for known and unforeseen threats
Better understanding of your business
Faster recovery after real incidents
Reduced impact in real incidents
0 10 20 30 40 50 60
Ful�l legal/regulatory obligations
Other
Protect the supply of products/services
Protect our business strategy
Protect sta�
Protect our shareholder interests
Protect our reputation
Protect our revenue and pro�t
Recover critical business processes
0 20 40 60 80 100
Ful�l legal/regulatory obligations
Protect the supply of products/services
Protect our business strategy
Protect sta�
Protect our shareholder interests
Protect our reputation
Protect our revenue and pro�t
Recover critical business processes
Strongly agree
Agree
Disagree
Strongly disagree
Undecided
Strongly agree
Agree
Disagree
Strongly disagree
Undecided
Strongly disagree2%
Agree20%
Disagree7%
Undecided49%
Strongly agree22%
0 20 40 60 80 100
Strongly agree Agree Undecided Disagree Strongly disagree
Manufacturing
Financial services
0 20 40 60 80 100
Over 5000
Under 100
Strongly agree Agree Undecided Disagree Strongly disagree
Strongly agree
Agree
Disagree
Strongly disagree
Undecided
Strongly agree
Agree
Disagree
Strongly disagree
UndecidedStrongly disagree
1%
Agree44%
Disagree19%
Undecided26%
Strongly agree10%
Lack of budget 20%
Lack of executive sponsorship 9%
Con�icting priorities 33%
Lack of understanding 18%
Lack of resource 28%
Lack of time 30%
Lack of expertise 12%
Programme complexity 13%
Con�icting ownership 11%
Con�icting approaches 4%
Bad experiences 3% Other 1%
Credit crunch e�ect 4%
Manufacturing Financial services
Manufacturing Financial services
Manufacturing Financial services
Manufacturing Financial services
Stronglydisagree
0%
Stronglydisagree
0%
Other 14%
Bahrain 2%
Saudi Arabia 16%
Abu Dhabi 16%
Dubai 8%
Germany 8%
Denmark 3%
Portugal 3%
Switzerland 6%
UK 25%
Other 14%
Bahrain 2%
Saudi Arabia 16%
Abu Dhabi 16%
Dubai 8%
Germany 8%
Denmark 3%
Portugal 3%
Switzerland 6%
UK 25%
Over 500027%
1001 - 500031%
501 - 100011%
100 - 50021%
Less than 10010%
Over 500027%
1001 - 500031%
501 - 100011%
100 - 50021%
Less than 10010%
0 5 10 15 20 25
Other
Technology & communications
Retail & consumer
Real estate
Professional services
Power & utilities
Oil & energy
Manufacturing
Government & public services
Financial services
Construction
Strongly agree20%
Agree66%
Disagree3%
Strongly disagree
Undecided11%
Strongly agree20%
Agree66%
Disagree3%
Strongly disagree
Undecided11%
Strongly agree23%
Agree60%
Disagree6%
Strongly disagree
Undecided11%
Strongly agree23%
Agree60%
Disagree6%
Strongly disagree
Undecided11%
Strongly agree29%
Agree54%
Disagree4%
Strongly disagree
Undecided13%
Strongly agree29%
Agree54%
Disagree4%
Strongly disagree
Undecided13%
0 10 20 30 40 50 60 70 80
Very mature
Mature
Non existent
Partial
Basic
Strongly agree17%
Agree50%
Disagree11%
Strongly disagree
Undecided22%
Strongly agree17%
Agree50%
Disagree11%
Strongly disagree
Undecided22%
0 10 20 30 40 50 60
Strongly agree
Agree
Undecided
Disagree
Strongly disagree
0 10 20 30 40 50 60Other
Regulatory non-compliance
Power loss
Criminal/terrorist activity
Leakage/pollution
Industrial action
Supply failure
IT failure
Flooding
Fire/explosion
Equipment failure (non-IT)
No major losses in the last two years
0 10 20 30 40 50 60 70 80
Insurer pressure
Other
Regulatory compliance
Shareholder/non-executive director pressure
Client pressure, i.e. 24/7 operating requirements
Competitive advantage
Past experience
Best practice
0 10 20 30 40 50 60
Regulatory compliance
Insurer pressure
Other
Shareholder/non-executive director pressure
Outside pressure (clients, insurers, etc)
Competitive advantage
Past experience
Best practice
0 10 20 30 40 50Credit crunch e�ect
Bad experiences
Con�icting approaches
Con�icting ownership
Programme complexity
Lack of expertise
Lack of time
Lack of resource
Lack of understanding
Con�icting priorities
Lack of executive sponsorship
Lack of budget
0 10 20 30 40 50
Increased regulatory compliance
Improved risk-intelligent decision-making
Reduced insurance cost
Better preparation for known and unforeseen threats
Better understanding of your business
Faster recovery after real incidents
Reduced impact in real incidents
0 10 20 30 40 50 60
Ful�l legal/regulatory obligations
Other
Protect the supply of products/services
Protect our business strategy
Protect sta�
Protect our shareholder interests
Protect our reputation
Protect our revenue and pro�t
Recover critical business processes
0 20 40 60 80 100
Ful�l legal/regulatory obligations
Protect the supply of products/services
Protect our business strategy
Protect sta�
Protect our shareholder interests
Protect our reputation
Protect our revenue and pro�t
Recover critical business processes
Strongly agree
Agree
Disagree
Strongly disagree
Undecided
Strongly agree
Agree
Disagree
Strongly disagree
Undecided
Strongly disagree2%
Agree20%
Disagree7%
Undecided49%
Strongly agree22%
0 20 40 60 80 100
Strongly agree Agree Undecided Disagree Strongly disagree
Manufacturing
Financial services
0 20 40 60 80 100
Over 5000
Under 100
Strongly agree Agree Undecided Disagree Strongly disagree
Strongly agree
Agree
Disagree
Strongly disagree
Undecided
Strongly agree
Agree
Disagree
Strongly disagree
UndecidedStrongly disagree
1%
Agree44%
Disagree19%
Undecided26%
Strongly agree10%
Lack of budget 20%
Lack of executive sponsorship 9%
Con�icting priorities 33%
Lack of understanding 18%
Lack of resource 28%
Lack of time 30%
Lack of expertise 12%
Programme complexity 13%
Con�icting ownership 11%
Con�icting approaches 4%
Bad experiences 3% Other 1%
Credit crunch e�ect 4%
Manufacturing Financial services
Manufacturing Financial services
Manufacturing Financial services
Manufacturing Financial services
Stronglydisagree
0%
Stronglydisagree
0%

The first three questions in the survey examined firms’ perceptions of their own level of BCM maturity. This explores whether BCM is seen just as a tick in a regulatory and insurance box, or whether it is used by management to improve firms’ business decision making.
86% of respondents said that their BCM is aligned to their strategic business objectives (up 7% on 2008), with only 3% disagreeing (down 4%). This is a very positive response as it shows the trend that BCM is now more intrinsically linked to organisational strategy and the vast majority of businesses now see BCM as intrinsic to their day-to-day operations.
3 | BCM maturity
BCM maturity
8 2010 EMEA business continuity benchmark report
”
“86% of respondents said that their BCM is aligned to their strategic business objectives (up 7% on 2008), with only 3% disagreeing (down 4%)
Other 14%
Bahrain 2%
Saudi Arabia 16%
Abu Dhabi 16%
Dubai 8%
Germany 8%
Denmark 3%
Portugal 3%
Switzerland 6%
UK 25%
Other 14%
Bahrain 2%
Saudi Arabia 16%
Abu Dhabi 16%
Dubai 8%
Germany 8%
Denmark 3%
Portugal 3%
Switzerland 6%
UK 25%
Over 500027%
1001 - 500031%
501 - 100011%
100 - 50021%
Less than 10010%
Over 500027%
1001 - 500031%
501 - 100011%
100 - 50021%
Less than 10010%
0 5 10 15 20 25
Other
Technology & communications
Retail & consumer
Real estate
Professional services
Power & utilities
Oil & energy
Manufacturing
Government & public services
Financial services
Construction
Strongly agree20%
Agree66%
Disagree3%
Strongly disagree
Undecided11%
Strongly agree20%
Agree66%
Disagree3%
Strongly disagree
Undecided11%
Strongly agree23%
Agree60%
Disagree6%
Strongly disagree
Undecided11%
Strongly agree23%
Agree60%
Disagree6%
Strongly disagree
Undecided11%
Strongly agree29%
Agree54%
Disagree4%
Strongly disagree
Undecided13%
Strongly agree29%
Agree54%
Disagree4%
Strongly disagree
Undecided13%
0 10 20 30 40 50 60 70 80
Very mature
Mature
Non existent
Partial
Basic
Strongly agree17%
Agree50%
Disagree11%
Strongly disagree
Undecided22%
Strongly agree17%
Agree50%
Disagree11%
Strongly disagree
Undecided22%
0 10 20 30 40 50 60
Strongly agree
Agree
Undecided
Disagree
Strongly disagree
0 10 20 30 40 50 60Other
Regulatory non-compliance
Power loss
Criminal/terrorist activity
Leakage/pollution
Industrial action
Supply failure
IT failure
Flooding
Fire/explosion
Equipment failure (non-IT)
No major losses in the last two years
0 10 20 30 40 50 60 70 80
Insurer pressure
Other
Regulatory compliance
Shareholder/non-executive director pressure
Client pressure, i.e. 24/7 operating requirements
Competitive advantage
Past experience
Best practice
0 10 20 30 40 50 60
Regulatory compliance
Insurer pressure
Other
Shareholder/non-executive director pressure
Outside pressure (clients, insurers, etc)
Competitive advantage
Past experience
Best practice
0 10 20 30 40 50Credit crunch e�ect
Bad experiences
Con�icting approaches
Con�icting ownership
Programme complexity
Lack of expertise
Lack of time
Lack of resource
Lack of understanding
Con�icting priorities
Lack of executive sponsorship
Lack of budget
0 10 20 30 40 50
Increased regulatory compliance
Improved risk-intelligent decision-making
Reduced insurance cost
Better preparation for known and unforeseen threats
Better understanding of your business
Faster recovery after real incidents
Reduced impact in real incidents
0 10 20 30 40 50 60
Ful�l legal/regulatory obligations
Other
Protect the supply of products/services
Protect our business strategy
Protect sta�
Protect our shareholder interests
Protect our reputation
Protect our revenue and pro�t
Recover critical business processes
0 20 40 60 80 100
Ful�l legal/regulatory obligations
Protect the supply of products/services
Protect our business strategy
Protect sta�
Protect our shareholder interests
Protect our reputation
Protect our revenue and pro�t
Recover critical business processes
Strongly agree
Agree
Disagree
Strongly disagree
Undecided
Strongly agree
Agree
Disagree
Strongly disagree
Undecided
Strongly disagree2%
Agree20%
Disagree7%
Undecided49%
Strongly agree22%
0 20 40 60 80 100
Strongly agree Agree Undecided Disagree Strongly disagree
Manufacturing
Financial services
0 20 40 60 80 100
Over 5000
Under 100
Strongly agree Agree Undecided Disagree Strongly disagree
Strongly agree
Agree
Disagree
Strongly disagree
Undecided
Strongly agree
Agree
Disagree
Strongly disagree
UndecidedStrongly disagree
1%
Agree44%
Disagree19%
Undecided26%
Strongly agree10%
Lack of budget 20%
Lack of executive sponsorship 9%
Con�icting priorities 33%
Lack of understanding 18%
Lack of resource 28%
Lack of time 30%
Lack of expertise 12%
Programme complexity 13%
Con�icting ownership 11%
Con�icting approaches 4%
Bad experiences 3% Other 1%
Credit crunch e�ect 4%
Manufacturing Financial services
Manufacturing Financial services
Manufacturing Financial services
Manufacturing Financial services
Stronglydisagree
0%
Stronglydisagree
0%
BCM is aligned to strategic business objectives
Other 14%
Bahrain 2%
Saudi Arabia 16%
Abu Dhabi 16%
Dubai 8%
Germany 8%
Denmark 3%
Portugal 3%
Switzerland 6%
UK 25%
Other 14%
Bahrain 2%
Saudi Arabia 16%
Abu Dhabi 16%
Dubai 8%
Germany 8%
Denmark 3%
Portugal 3%
Switzerland 6%
UK 25%
Over 500027%
1001 - 500031%
501 - 100011%
100 - 50021%
Less than 10010%
Over 500027%
1001 - 500031%
501 - 100011%
100 - 50021%
Less than 10010%
0 5 10 15 20 25
Other
Technology & communications
Retail & consumer
Real estate
Professional services
Power & utilities
Oil & energy
Manufacturing
Government & public services
Financial services
Construction
Strongly agree20%
Agree66%
Disagree3%
Strongly disagree
Undecided11%
Strongly agree20%
Agree66%
Disagree3%
Strongly disagree
Undecided11%
Strongly agree23%
Agree60%
Disagree6%
Strongly disagree
Undecided11%
Strongly agree23%
Agree60%
Disagree6%
Strongly disagree
Undecided11%
Strongly agree29%
Agree54%
Disagree4%
Strongly disagree
Undecided13%
Strongly agree29%
Agree54%
Disagree4%
Strongly disagree
Undecided13%
0 10 20 30 40 50 60 70 80
Very mature
Mature
Non existent
Partial
Basic
Strongly agree17%
Agree50%
Disagree11%
Strongly disagree
Undecided22%
Strongly agree17%
Agree50%
Disagree11%
Strongly disagree
Undecided22%
0 10 20 30 40 50 60
Strongly agree
Agree
Undecided
Disagree
Strongly disagree
0 10 20 30 40 50 60Other
Regulatory non-compliance
Power loss
Criminal/terrorist activity
Leakage/pollution
Industrial action
Supply failure
IT failure
Flooding
Fire/explosion
Equipment failure (non-IT)
No major losses in the last two years
0 10 20 30 40 50 60 70 80
Insurer pressure
Other
Regulatory compliance
Shareholder/non-executive director pressure
Client pressure, i.e. 24/7 operating requirements
Competitive advantage
Past experience
Best practice
0 10 20 30 40 50 60
Regulatory compliance
Insurer pressure
Other
Shareholder/non-executive director pressure
Outside pressure (clients, insurers, etc)
Competitive advantage
Past experience
Best practice
0 10 20 30 40 50Credit crunch e�ect
Bad experiences
Con�icting approaches
Con�icting ownership
Programme complexity
Lack of expertise
Lack of time
Lack of resource
Lack of understanding
Con�icting priorities
Lack of executive sponsorship
Lack of budget
0 10 20 30 40 50
Increased regulatory compliance
Improved risk-intelligent decision-making
Reduced insurance cost
Better preparation for known and unforeseen threats
Better understanding of your business
Faster recovery after real incidents
Reduced impact in real incidents
0 10 20 30 40 50 60
Ful�l legal/regulatory obligations
Other
Protect the supply of products/services
Protect our business strategy
Protect sta�
Protect our shareholder interests
Protect our reputation
Protect our revenue and pro�t
Recover critical business processes
0 20 40 60 80 100
Ful�l legal/regulatory obligations
Protect the supply of products/services
Protect our business strategy
Protect sta�
Protect our shareholder interests
Protect our reputation
Protect our revenue and pro�t
Recover critical business processes
Strongly agree
Agree
Disagree
Strongly disagree
Undecided
Strongly agree
Agree
Disagree
Strongly disagree
Undecided
Strongly disagree2%
Agree20%
Disagree7%
Undecided49%
Strongly agree22%
0 20 40 60 80 100
Strongly agree Agree Undecided Disagree Strongly disagree
Manufacturing
Financial services
0 20 40 60 80 100
Over 5000
Under 100
Strongly agree Agree Undecided Disagree Strongly disagree
Strongly agree
Agree
Disagree
Strongly disagree
Undecided
Strongly agree
Agree
Disagree
Strongly disagree
UndecidedStrongly disagree
1%
Agree44%
Disagree19%
Undecided26%
Strongly agree10%
Lack of budget 20%
Lack of executive sponsorship 9%
Con�icting priorities 33%
Lack of understanding 18%
Lack of resource 28%
Lack of time 30%
Lack of expertise 12%
Programme complexity 13%
Con�icting ownership 11%
Con�icting approaches 4%
Bad experiences 3% Other 1%
Credit crunch e�ect 4%
Manufacturing Financial services
Manufacturing Financial services
Manufacturing Financial services
Manufacturing Financial services
Stronglydisagree
0%
Stronglydisagree
0%
BCM is integrated into the risk management programme

Similarly, 83% of respondents thought that BCM was integrated into their risk management programme (up 7%), with only 6% disagreeing (down 3%). This reflects the change in attitude to BCM, which Marsh has observed over the last two years. BCM is now a component part of a holistic enterprise risk management (ERM) programme as opposed to a standalone resilience measure. Completing projects in this way leads to synergies from the leveraging of the risk and BCM information upon each other, leading to higher deliverables at reduced resource cost.
83% of respondents also thought that top management understands BCM and provides their full support (up 7%), with only 4% saying they did not (down 5%). Again, this shows the continued trend of improvement from 2008 and highlights the necessity of senior management support and buy-in to a project.
These three questions combined reflect the perceived level of BCM maturity within an organisation and can be mapped using the Marsh BCM maturity model. This rates firms between 1-5, with a level 5 being “Optimised BCM” and a level one being ‘Underdeveloped BCM’. Where an organisation is on that scale represents where BCM is within the organisation; whether it is part of the culture; is it fully integrated into the overall risk management programme and whether its management use it as a strategic tool.
9Marsh
BCM maturity | 3
”“BCM is now a
component part of a holistic ERM programme as opposed to a standalone resilience measure
Other 14%
Bahrain 2%
Saudi Arabia 16%
Abu Dhabi 16%
Dubai 8%
Germany 8%
Denmark 3%
Portugal 3%
Switzerland 6%
UK 25%
Other 14%
Bahrain 2%
Saudi Arabia 16%
Abu Dhabi 16%
Dubai 8%
Germany 8%
Denmark 3%
Portugal 3%
Switzerland 6%
UK 25%
Over 500027%
1001 - 500031%
501 - 100011%
100 - 50021%
Less than 10010%
Over 500027%
1001 - 500031%
501 - 100011%
100 - 50021%
Less than 10010%
0 5 10 15 20 25
Other
Technology & communications
Retail & consumer
Real estate
Professional services
Power & utilities
Oil & energy
Manufacturing
Government & public services
Financial services
Construction
Strongly agree20%
Agree66%
Disagree3%
Strongly disagree
Undecided11%
Strongly agree20%
Agree66%
Disagree3%
Strongly disagree
Undecided11%
Strongly agree23%
Agree60%
Disagree6%
Strongly disagree
Undecided11%
Strongly agree23%
Agree60%
Disagree6%
Strongly disagree
Undecided11%
Strongly agree29%
Agree54%
Disagree4%
Strongly disagree
Undecided13%
Strongly agree29%
Agree54%
Disagree4%
Strongly disagree
Undecided13%
0 10 20 30 40 50 60 70 80
Very mature
Mature
Non existent
Partial
Basic
Strongly agree17%
Agree50%
Disagree11%
Strongly disagree
Undecided22%
Strongly agree17%
Agree50%
Disagree11%
Strongly disagree
Undecided22%
0 10 20 30 40 50 60
Strongly agree
Agree
Undecided
Disagree
Strongly disagree
0 10 20 30 40 50 60Other
Regulatory non-compliance
Power loss
Criminal/terrorist activity
Leakage/pollution
Industrial action
Supply failure
IT failure
Flooding
Fire/explosion
Equipment failure (non-IT)
No major losses in the last two years
0 10 20 30 40 50 60 70 80
Insurer pressure
Other
Regulatory compliance
Shareholder/non-executive director pressure
Client pressure, i.e. 24/7 operating requirements
Competitive advantage
Past experience
Best practice
0 10 20 30 40 50 60
Regulatory compliance
Insurer pressure
Other
Shareholder/non-executive director pressure
Outside pressure (clients, insurers, etc)
Competitive advantage
Past experience
Best practice
0 10 20 30 40 50Credit crunch e�ect
Bad experiences
Con�icting approaches
Con�icting ownership
Programme complexity
Lack of expertise
Lack of time
Lack of resource
Lack of understanding
Con�icting priorities
Lack of executive sponsorship
Lack of budget
0 10 20 30 40 50
Increased regulatory compliance
Improved risk-intelligent decision-making
Reduced insurance cost
Better preparation for known and unforeseen threats
Better understanding of your business
Faster recovery after real incidents
Reduced impact in real incidents
0 10 20 30 40 50 60
Ful�l legal/regulatory obligations
Other
Protect the supply of products/services
Protect our business strategy
Protect sta�
Protect our shareholder interests
Protect our reputation
Protect our revenue and pro�t
Recover critical business processes
0 20 40 60 80 100
Ful�l legal/regulatory obligations
Protect the supply of products/services
Protect our business strategy
Protect sta�
Protect our shareholder interests
Protect our reputation
Protect our revenue and pro�t
Recover critical business processes
Strongly agree
Agree
Disagree
Strongly disagree
Undecided
Strongly agree
Agree
Disagree
Strongly disagree
Undecided
Strongly disagree2%
Agree20%
Disagree7%
Undecided49%
Strongly agree22%
0 20 40 60 80 100
Strongly agree Agree Undecided Disagree Strongly disagree
Manufacturing
Financial services
0 20 40 60 80 100
Over 5000
Under 100
Strongly agree Agree Undecided Disagree Strongly disagree
Strongly agree
Agree
Disagree
Strongly disagree
Undecided
Strongly agree
Agree
Disagree
Strongly disagree
UndecidedStrongly disagree
1%
Agree44%
Disagree19%
Undecided26%
Strongly agree10%
Lack of budget 20%
Lack of executive sponsorship 9%
Con�icting priorities 33%
Lack of understanding 18%
Lack of resource 28%
Lack of time 30%
Lack of expertise 12%
Programme complexity 13%
Con�icting ownership 11%
Con�icting approaches 4%
Bad experiences 3% Other 1%
Credit crunch e�ect 4%
Manufacturing Financial services
Manufacturing Financial services
Manufacturing Financial services
Manufacturing Financial services
Stronglydisagree
0%
Stronglydisagree
0%
Top management understands BCM and provides full support

Overall, this shows that 85% of respondents believe their organisation to be towards the later stages of the maturity model (up 15%). This trend shows a linear progression of maturity over the past few years, with BCM now seen as an intrinsic strategic tool as opposed to part of regulatory and compliance requirements.
This change may be slightly optimistic however, as Marsh’s experience of rating organisations suggest that many overrate their own level of BCM and that their perceptions do not match reality. Further evidence within the survey supports this, such as that only 41% of respondents said that BCM has given them a better understanding of their business and only 29% said it has led to improved risk-intelligent decision-making.
The upside to this is that with organisations aspiring to view BCM as part of their organisation, along with the growth of integrated ERM strategies, it should not be difficult for organisations’ perceptions to become reality.
3 | BCM maturity
10 2010 EMEA business continuity benchmark report
”“41% of respondents
said that BCM has given them a better understanding of their business
BCM maturity
Other 14%
Bahrain 2%
Saudi Arabia 16%
Abu Dhabi 16%
Dubai 8%
Germany 8%
Denmark 3%
Portugal 3%
Switzerland 6%
UK 25%
Other 14%
Bahrain 2%
Saudi Arabia 16%
Abu Dhabi 16%
Dubai 8%
Germany 8%
Denmark 3%
Portugal 3%
Switzerland 6%
UK 25%
Over 500027%
1001 - 500031%
501 - 100011%
100 - 50021%
Less than 10010%
Over 500027%
1001 - 500031%
501 - 100011%
100 - 50021%
Less than 10010%
0 5 10 15 20 25
Other
Technology & communications
Retail & consumer
Real estate
Professional services
Power & utilities
Oil & energy
Manufacturing
Government & public services
Financial services
Construction
Strongly agree20%
Agree66%
Disagree3%
Strongly disagree
Undecided11%
Strongly agree20%
Agree66%
Disagree3%
Strongly disagree
Undecided11%
Strongly agree23%
Agree60%
Disagree6%
Strongly disagree
Undecided11%
Strongly agree23%
Agree60%
Disagree6%
Strongly disagree
Undecided11%
Strongly agree29%
Agree54%
Disagree4%
Strongly disagree
Undecided13%
Strongly agree29%
Agree54%
Disagree4%
Strongly disagree
Undecided13%
0 10 20 30 40 50 60 70 80
Very mature
Mature
Non existent
Partial
Basic
Strongly agree17%
Agree50%
Disagree11%
Strongly disagree
Undecided22%
Strongly agree17%
Agree50%
Disagree11%
Strongly disagree
Undecided22%
0 10 20 30 40 50 60
Strongly agree
Agree
Undecided
Disagree
Strongly disagree
0 10 20 30 40 50 60Other
Regulatory non-compliance
Power loss
Criminal/terrorist activity
Leakage/pollution
Industrial action
Supply failure
IT failure
Flooding
Fire/explosion
Equipment failure (non-IT)
No major losses in the last two years
0 10 20 30 40 50 60 70 80
Insurer pressure
Other
Regulatory compliance
Shareholder/non-executive director pressure
Client pressure, i.e. 24/7 operating requirements
Competitive advantage
Past experience
Best practice
0 10 20 30 40 50 60
Regulatory compliance
Insurer pressure
Other
Shareholder/non-executive director pressure
Outside pressure (clients, insurers, etc)
Competitive advantage
Past experience
Best practice
0 10 20 30 40 50Credit crunch e�ect
Bad experiences
Con�icting approaches
Con�icting ownership
Programme complexity
Lack of expertise
Lack of time
Lack of resource
Lack of understanding
Con�icting priorities
Lack of executive sponsorship
Lack of budget
0 10 20 30 40 50
Increased regulatory compliance
Improved risk-intelligent decision-making
Reduced insurance cost
Better preparation for known and unforeseen threats
Better understanding of your business
Faster recovery after real incidents
Reduced impact in real incidents
0 10 20 30 40 50 60
Ful�l legal/regulatory obligations
Other
Protect the supply of products/services
Protect our business strategy
Protect sta�
Protect our shareholder interests
Protect our reputation
Protect our revenue and pro�t
Recover critical business processes
0 20 40 60 80 100
Ful�l legal/regulatory obligations
Protect the supply of products/services
Protect our business strategy
Protect sta�
Protect our shareholder interests
Protect our reputation
Protect our revenue and pro�t
Recover critical business processes
Strongly agree
Agree
Disagree
Strongly disagree
Undecided
Strongly agree
Agree
Disagree
Strongly disagree
Undecided
Strongly disagree2%
Agree20%
Disagree7%
Undecided49%
Strongly agree22%
0 20 40 60 80 100
Strongly agree Agree Undecided Disagree Strongly disagree
Manufacturing
Financial services
0 20 40 60 80 100
Over 5000
Under 100
Strongly agree Agree Undecided Disagree Strongly disagree
Strongly agree
Agree
Disagree
Strongly disagree
Undecided
Strongly agree
Agree
Disagree
Strongly disagree
UndecidedStrongly disagree
1%
Agree44%
Disagree19%
Undecided26%
Strongly agree10%
Lack of budget 20%
Lack of executive sponsorship 9%
Con�icting priorities 33%
Lack of understanding 18%
Lack of resource 28%
Lack of time 30%
Lack of expertise 12%
Programme complexity 13%
Con�icting ownership 11%
Con�icting approaches 4%
Bad experiences 3% Other 1%
Credit crunch e�ect 4%
Manufacturing Financial services
Manufacturing Financial services
Manufacturing Financial services
Manufacturing Financial services
Stronglydisagree
0%
Stronglydisagree
0%

11Marsh
BCM maturity | 3

This question looks at whether firms are using BCM strategies to manage their supply chain risk. The growth of just-in-time delivery and the drive for leaner supply chains to improve operating efficiency has also exposed organisations to higher levels of risk. Supply chains are also more global, with numerous interdependencies around different countries, making them more prone to negative world events. Embracing BCM to help manage these supply chain risks is a key part of BCM maturity.
68% of respondents agreed that their BCM plan covers their supply chain risks (up 14%), with only 11% saying that it definitely did not (down 11%). These results show a huge swing in awareness to supply chain risk in the past two years. The large number of global events over the past two years affecting firms’ supply chains and ability to operate can explain this change. These range from physical events such as the Icelandic volcanic ash cloud causing planes not being able to fly, to the liquidity crisis causing organisations to go out of business and thus threaten supply lines. Further evidence in the survey supports this, with 13% of respondents experiencing a supply chain disruption in the past two years.
4 | Supply Chain Risks
Supply chain risks
12 2010 EMEA business continuity benchmark report
”
“The growth of just-in-time delivery and the drive for leaner supply chains to improve operating efficiency has also exposed organisations to higher levels of risk
Other 14%
Bahrain 2%
Saudi Arabia 16%
Abu Dhabi 16%
Dubai 8%
Germany 8%
Denmark 3%
Portugal 3%
Switzerland 6%
UK 25%
Other 14%
Bahrain 2%
Saudi Arabia 16%
Abu Dhabi 16%
Dubai 8%
Germany 8%
Denmark 3%
Portugal 3%
Switzerland 6%
UK 25%
Over 500027%
1001 - 500031%
501 - 100011%
100 - 50021%
Less than 10010%
Over 500027%
1001 - 500031%
501 - 100011%
100 - 50021%
Less than 10010%
0 5 10 15 20 25
Other
Technology & communications
Retail & consumer
Real estate
Professional services
Power & utilities
Oil & energy
Manufacturing
Government & public services
Financial services
Construction
Strongly agree20%
Agree66%
Disagree3%
Strongly disagree
Undecided11%
Strongly agree20%
Agree66%
Disagree3%
Strongly disagree
Undecided11%
Strongly agree23%
Agree60%
Disagree6%
Strongly disagree
Undecided11%
Strongly agree23%
Agree60%
Disagree6%
Strongly disagree
Undecided11%
Strongly agree29%
Agree54%
Disagree4%
Strongly disagree
Undecided13%
Strongly agree29%
Agree54%
Disagree4%
Strongly disagree
Undecided13%
0 10 20 30 40 50 60 70 80
Very mature
Mature
Non existent
Partial
Basic
Strongly agree17%
Agree50%
Disagree11%
Strongly disagree
Undecided22%
Strongly agree17%
Agree50%
Disagree11%
Strongly disagree
Undecided22%
0 10 20 30 40 50 60
Strongly agree
Agree
Undecided
Disagree
Strongly disagree
0 10 20 30 40 50 60Other
Regulatory non-compliance
Power loss
Criminal/terrorist activity
Leakage/pollution
Industrial action
Supply failure
IT failure
Flooding
Fire/explosion
Equipment failure (non-IT)
No major losses in the last two years
0 10 20 30 40 50 60 70 80
Insurer pressure
Other
Regulatory compliance
Shareholder/non-executive director pressure
Client pressure, i.e. 24/7 operating requirements
Competitive advantage
Past experience
Best practice
0 10 20 30 40 50 60
Regulatory compliance
Insurer pressure
Other
Shareholder/non-executive director pressure
Outside pressure (clients, insurers, etc)
Competitive advantage
Past experience
Best practice
0 10 20 30 40 50Credit crunch e�ect
Bad experiences
Con�icting approaches
Con�icting ownership
Programme complexity
Lack of expertise
Lack of time
Lack of resource
Lack of understanding
Con�icting priorities
Lack of executive sponsorship
Lack of budget
0 10 20 30 40 50
Increased regulatory compliance
Improved risk-intelligent decision-making
Reduced insurance cost
Better preparation for known and unforeseen threats
Better understanding of your business
Faster recovery after real incidents
Reduced impact in real incidents
0 10 20 30 40 50 60
Ful�l legal/regulatory obligations
Other
Protect the supply of products/services
Protect our business strategy
Protect sta�
Protect our shareholder interests
Protect our reputation
Protect our revenue and pro�t
Recover critical business processes
0 20 40 60 80 100
Ful�l legal/regulatory obligations
Protect the supply of products/services
Protect our business strategy
Protect sta�
Protect our shareholder interests
Protect our reputation
Protect our revenue and pro�t
Recover critical business processes
Strongly agree
Agree
Disagree
Strongly disagree
Undecided
Strongly agree
Agree
Disagree
Strongly disagree
Undecided
Strongly disagree2%
Agree20%
Disagree7%
Undecided49%
Strongly agree22%
0 20 40 60 80 100
Strongly agree Agree Undecided Disagree Strongly disagree
Manufacturing
Financial services
0 20 40 60 80 100
Over 5000
Under 100
Strongly agree Agree Undecided Disagree Strongly disagree
Strongly agree
Agree
Disagree
Strongly disagree
Undecided
Strongly agree
Agree
Disagree
Strongly disagree
UndecidedStrongly disagree
1%
Agree44%
Disagree19%
Undecided26%
Strongly agree10%
Lack of budget 20%
Lack of executive sponsorship 9%
Con�icting priorities 33%
Lack of understanding 18%
Lack of resource 28%
Lack of time 30%
Lack of expertise 12%
Programme complexity 13%
Con�icting ownership 11%
Con�icting approaches 4%
Bad experiences 3% Other 1%
Credit crunch e�ect 4%
Manufacturing Financial services
Manufacturing Financial services
Manufacturing Financial services
Manufacturing Financial services
Stronglydisagree
0%
Stronglydisagree
0%
BCM covers supply chain risk

Further analysis of the data shows differences between manufacturing and financial services responses. In the manufacturing industry, 81% of respondents agreed, whereas in financial services only 43% of respondents agreed and 50% were undecided. These results likely demonstrate the more obvious nature of physical supply chain risks that apply to manufacturing firms. In financial services, it is only the cutting edge of firms that realise how important and vulnerable their supply chain can be.
Whilst these results are encouraging, the service sector needs to avoid the perception that supply chain issues are the remit of manufacturing industries alone. Service firms, especially businesses in financial service, can be equally, if not more at risk. The supply chain network in the finance sector consists of a network of other financial institutions, in contrast to the more linear supply chains of manufacturing firms. The domino effect when these firms cannot supply each other with capital could have far-reaching effects in the financial and business world.
As firms are advancing along the maturity model, they are starting to realise the exposure that they have and the potential upside from managing these risks. The upside can also be that if firms start to analyse their supply chains in more detail they have the potential to find new strategic options, as well improving their operating efficiency.
Supply chain analysis
Other 14%
Bahrain 2%
Saudi Arabia 16%
Abu Dhabi 16%
Dubai 8%
Germany 8%
Denmark 3%
Portugal 3%
Switzerland 6%
UK 25%
Other 14%
Bahrain 2%
Saudi Arabia 16%
Abu Dhabi 16%
Dubai 8%
Germany 8%
Denmark 3%
Portugal 3%
Switzerland 6%
UK 25%
Over 500027%
1001 - 500031%
501 - 100011%
100 - 50021%
Less than 10010%
Over 500027%
1001 - 500031%
501 - 100011%
100 - 50021%
Less than 10010%
0 5 10 15 20 25
Other
Technology & communications
Retail & consumer
Real estate
Professional services
Power & utilities
Oil & energy
Manufacturing
Government & public services
Financial services
Construction
Strongly agree20%
Agree66%
Disagree3%
Strongly disagree
Undecided11%
Strongly agree20%
Agree66%
Disagree3%
Strongly disagree
Undecided11%
Strongly agree23%
Agree60%
Disagree6%
Strongly disagree
Undecided11%
Strongly agree23%
Agree60%
Disagree6%
Strongly disagree
Undecided11%
Strongly agree29%
Agree54%
Disagree4%
Strongly disagree
Undecided13%
Strongly agree29%
Agree54%
Disagree4%
Strongly disagree
Undecided13%
0 10 20 30 40 50 60 70 80
Very mature
Mature
Non existent
Partial
Basic
Strongly agree17%
Agree50%
Disagree11%
Strongly disagree
Undecided22%
Strongly agree17%
Agree50%
Disagree11%
Strongly disagree
Undecided22%
0 10 20 30 40 50 60
Strongly agree
Agree
Undecided
Disagree
Strongly disagree
0 10 20 30 40 50 60Other
Regulatory non-compliance
Power loss
Criminal/terrorist activity
Leakage/pollution
Industrial action
Supply failure
IT failure
Flooding
Fire/explosion
Equipment failure (non-IT)
No major losses in the last two years
0 10 20 30 40 50 60 70 80
Insurer pressure
Other
Regulatory compliance
Shareholder/non-executive director pressure
Client pressure, i.e. 24/7 operating requirements
Competitive advantage
Past experience
Best practice
0 10 20 30 40 50 60
Regulatory compliance
Insurer pressure
Other
Shareholder/non-executive director pressure
Outside pressure (clients, insurers, etc)
Competitive advantage
Past experience
Best practice
0 10 20 30 40 50Credit crunch e�ect
Bad experiences
Con�icting approaches
Con�icting ownership
Programme complexity
Lack of expertise
Lack of time
Lack of resource
Lack of understanding
Con�icting priorities
Lack of executive sponsorship
Lack of budget
0 10 20 30 40 50
Increased regulatory compliance
Improved risk-intelligent decision-making
Reduced insurance cost
Better preparation for known and unforeseen threats
Better understanding of your business
Faster recovery after real incidents
Reduced impact in real incidents
0 10 20 30 40 50 60
Ful�l legal/regulatory obligations
Other
Protect the supply of products/services
Protect our business strategy
Protect sta�
Protect our shareholder interests
Protect our reputation
Protect our revenue and pro�t
Recover critical business processes
0 20 40 60 80 100
Ful�l legal/regulatory obligations
Protect the supply of products/services
Protect our business strategy
Protect sta�
Protect our shareholder interests
Protect our reputation
Protect our revenue and pro�t
Recover critical business processes
Strongly agree
Agree
Disagree
Strongly disagree
Undecided
Strongly agree
Agree
Disagree
Strongly disagree
Undecided
Strongly disagree2%
Agree20%
Disagree7%
Undecided49%
Strongly agree22%
0 20 40 60 80 100
Strongly agree Agree Undecided Disagree Strongly disagree
Manufacturing
Financial services
0 20 40 60 80 100
Over 5000
Under 100
Strongly agree Agree Undecided Disagree Strongly disagree
Strongly agree
Agree
Disagree
Strongly disagree
Undecided
Strongly agree
Agree
Disagree
Strongly disagree
UndecidedStrongly disagree
1%
Agree44%
Disagree19%
Undecided26%
Strongly agree10%
Lack of budget 20%
Lack of executive sponsorship 9%
Con�icting priorities 33%
Lack of understanding 18%
Lack of resource 28%
Lack of time 30%
Lack of expertise 12%
Programme complexity 13%
Con�icting ownership 11%
Con�icting approaches 4%
Bad experiences 3% Other 1%
Credit crunch e�ect 4%
Manufacturing Financial services
Manufacturing Financial services
Manufacturing Financial services
Manufacturing Financial services
Stronglydisagree
0%
Stronglydisagree
0%
Supply Chain Risks | 4
13Marsh
”“These results
likely demonstrate the more obvious nature of physical supply chain risks that apply to manufacturing firms

5 | Incidents and losses
14 2010 EMEA business continuity benchmark report
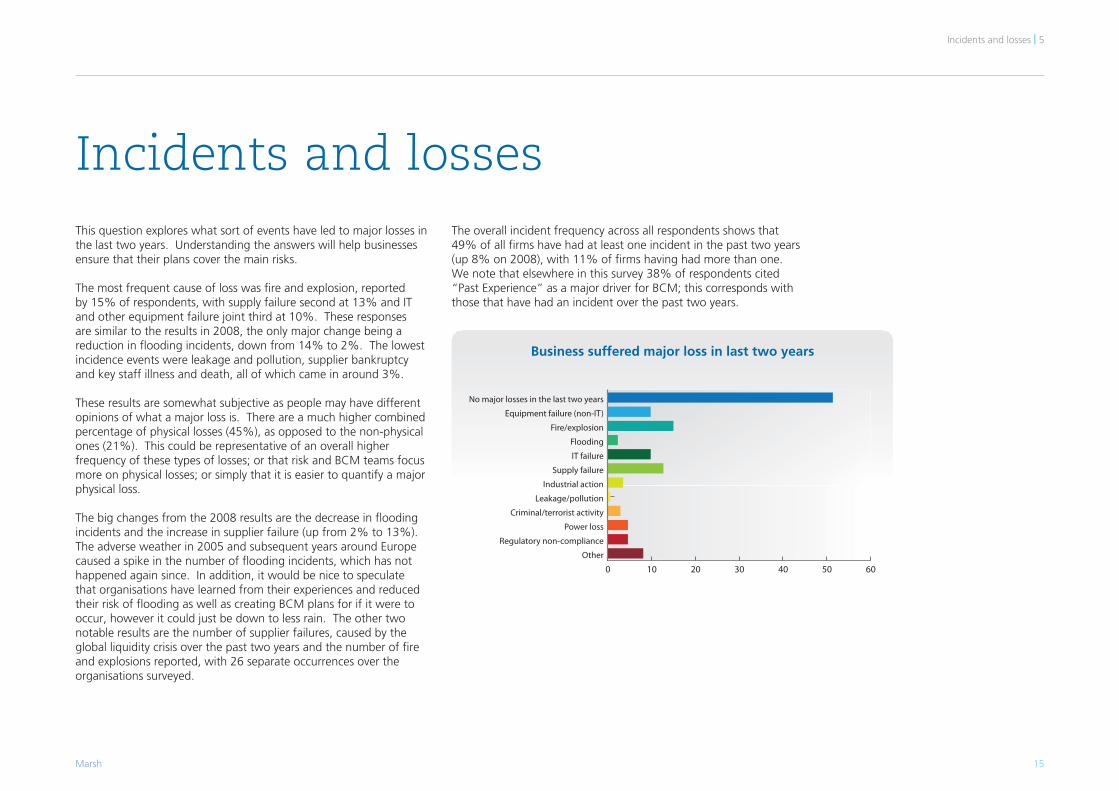
This question explores what sort of events have led to major losses in the last two years. Understanding the answers will help businesses ensure that their plans cover the main risks.
The most frequent cause of loss was fire and explosion, reported by 15% of respondents, with supply failure second at 13% and IT and other equipment failure joint third at 10%. These responses are similar to the results in 2008, the only major change being a reduction in flooding incidents, down from 14% to 2%. The lowest incidence events were leakage and pollution, supplier bankruptcy and key staff illness and death, all of which came in around 3%.
These results are somewhat subjective as people may have different opinions of what a major loss is. There are a much higher combined percentage of physical losses (45%), as opposed to the non-physical ones (21%). This could be representative of an overall higher frequency of these types of losses; or that risk and BCM teams focus more on physical losses; or simply that it is easier to quantify a major physical loss.
The big changes from the 2008 results are the decrease in flooding incidents and the increase in supplier failure (up from 2% to 13%). The adverse weather in 2005 and subsequent years around Europe caused a spike in the number of flooding incidents, which has not happened again since. In addition, it would be nice to speculate that organisations have learned from their experiences and reduced their risk of flooding as well as creating BCM plans for if it were to occur, however it could just be down to less rain. The other two notable results are the number of supplier failures, caused by the global liquidity crisis over the past two years and the number of fire and explosions reported, with 26 separate occurrences over the organisations surveyed.
The overall incident frequency across all respondents shows that 49% of all firms have had at least one incident in the past two years (up 8% on 2008), with 11% of firms having had more than one. We note that elsewhere in this survey 38% of respondents cited “Past Experience” as a major driver for BCM; this corresponds with those that have had an incident over the past two years.
15Marsh
Incidents and losses
Incidents and losses | 5
Business suffered major loss in last two years
Other 14%
Bahrain 2%
Saudi Arabia 16%
Abu Dhabi 16%
Dubai 8%
Germany 8%
Denmark 3%
Portugal 3%
Switzerland 6%
UK 25%
Other 14%
Bahrain 2%
Saudi Arabia 16%
Abu Dhabi 16%
Dubai 8%
Germany 8%
Denmark 3%
Portugal 3%
Switzerland 6%
UK 25%
Over 500027%
1001 - 500031%
501 - 100011%
100 - 50021%
Less than 10010%
Over 500027%
1001 - 500031%
501 - 100011%
100 - 50021%
Less than 10010%
0 5 10 15 20 25
Other
Technology & communications
Retail & consumer
Real estate
Professional services
Power & utilities
Oil & energy
Manufacturing
Government & public services
Financial services
Construction
Strongly agree20%
Agree66%
Disagree3%
Strongly disagree
Undecided11%
Strongly agree20%
Agree66%
Disagree3%
Strongly disagree
Undecided11%
Strongly agree23%
Agree60%
Disagree6%
Strongly disagree
Undecided11%
Strongly agree23%
Agree60%
Disagree6%
Strongly disagree
Undecided11%
Strongly agree29%
Agree54%
Disagree4%
Strongly disagree
Undecided13%
Strongly agree29%
Agree54%
Disagree4%
Strongly disagree
Undecided13%
0 10 20 30 40 50 60 70 80
Very mature
Mature
Non existent
Partial
Basic
Strongly agree17%
Agree50%
Disagree11%
Strongly disagree
Undecided22%
Strongly agree17%
Agree50%
Disagree11%
Strongly disagree
Undecided22%
0 10 20 30 40 50 60
Strongly agree
Agree
Undecided
Disagree
Strongly disagree
0 10 20 30 40 50 60Other
Regulatory non-compliance
Power loss
Criminal/terrorist activity
Leakage/pollution
Industrial action
Supply failure
IT failure
Flooding
Fire/explosion
Equipment failure (non-IT)
No major losses in the last two years
0 10 20 30 40 50 60 70 80
Insurer pressure
Other
Regulatory compliance
Shareholder/non-executive director pressure
Client pressure, i.e. 24/7 operating requirements
Competitive advantage
Past experience
Best practice
0 10 20 30 40 50 60
Regulatory compliance
Insurer pressure
Other
Shareholder/non-executive director pressure
Outside pressure (clients, insurers, etc)
Competitive advantage
Past experience
Best practice
0 10 20 30 40 50Credit crunch e�ect
Bad experiences
Con�icting approaches
Con�icting ownership
Programme complexity
Lack of expertise
Lack of time
Lack of resource
Lack of understanding
Con�icting priorities
Lack of executive sponsorship
Lack of budget
0 10 20 30 40 50
Increased regulatory compliance
Improved risk-intelligent decision-making
Reduced insurance cost
Better preparation for known and unforeseen threats
Better understanding of your business
Faster recovery after real incidents
Reduced impact in real incidents
0 10 20 30 40 50 60
Ful�l legal/regulatory obligations
Other
Protect the supply of products/services
Protect our business strategy
Protect sta�
Protect our shareholder interests
Protect our reputation
Protect our revenue and pro�t
Recover critical business processes
0 20 40 60 80 100
Ful�l legal/regulatory obligations
Protect the supply of products/services
Protect our business strategy
Protect sta�
Protect our shareholder interests
Protect our reputation
Protect our revenue and pro�t
Recover critical business processes
Strongly agree
Agree
Disagree
Strongly disagree
Undecided
Strongly agree
Agree
Disagree
Strongly disagree
Undecided
Strongly disagree2%
Agree20%
Disagree7%
Undecided49%
Strongly agree22%
0 20 40 60 80 100
Strongly agree Agree Undecided Disagree Strongly disagree
Manufacturing
Financial services
0 20 40 60 80 100
Over 5000
Under 100
Strongly agree Agree Undecided Disagree Strongly disagree
Strongly agree
Agree
Disagree
Strongly disagree
Undecided
Strongly agree
Agree
Disagree
Strongly disagree
UndecidedStrongly disagree
1%
Agree44%
Disagree19%
Undecided26%
Strongly agree10%
Lack of budget 20%
Lack of executive sponsorship 9%
Con�icting priorities 33%
Lack of understanding 18%
Lack of resource 28%
Lack of time 30%
Lack of expertise 12%
Programme complexity 13%
Con�icting ownership 11%
Con�icting approaches 4%
Bad experiences 3% Other 1%
Credit crunch e�ect 4%
Manufacturing Financial services
Manufacturing Financial services
Manufacturing Financial services
Manufacturing Financial services
Stronglydisagree
0%
Stronglydisagree
0%

This question aims to understand what the main drivers are for organisations to launch their BCM programmes. This is important in order to ensure that the programme objectives and the benefits obtained align to those drivers.
Analysis of the top BCM drivers shows that best practice is again the highest with 62% (down 15% on last year) of respondents saying that it encouraged them to implement BCM programmes. The other main drivers were past experiences (38%, down 12%) and regulatory compliance (31%, down 10%). The smallest drivers were shareholder pressure (11%, down 11%), client pressure (14%, down 6%) and insurer pressure (17%, down 4%). The only driver that has risen for BCM in the past two years is competitive advantage, which has grown from 20% to 26%.
These results are interesting as across the board they show a decrease in perceived drivers for BCM. Other results in this survey however show that BCM is integral to risk management programmes and is now a core part of organisational structures. This gap between perceived drivers and BCM maturity is due to the intrinsic nature that BCM now has in organisations.
It is no longer an optional extra for improved resilience and now is more a core part of business operations. The positive change in how competitive advantage is seen as a BCM driver supports this view, as organisations are starting to see how they can improve their business through BCM.
6 | BCM drivers
BCM drivers
16 2010 EMEA business continuity benchmark report
”“BCM is integral to
risk management programmes and is now a core part of organisational structures
BCM drivers
Other 14%
Bahrain 2%
Saudi Arabia 16%
Abu Dhabi 16%
Dubai 8%
Germany 8%
Denmark 3%
Portugal 3%
Switzerland 6%
UK 25%
Other 14%
Bahrain 2%
Saudi Arabia 16%
Abu Dhabi 16%
Dubai 8%
Germany 8%
Denmark 3%
Portugal 3%
Switzerland 6%
UK 25%
Over 500027%
1001 - 500031%
501 - 100011%
100 - 50021%
Less than 10010%
Over 500027%
1001 - 500031%
501 - 100011%
100 - 50021%
Less than 10010%
0 5 10 15 20 25
Other
Technology & communications
Retail & consumer
Real estate
Professional services
Power & utilities
Oil & energy
Manufacturing
Government & public services
Financial services
Construction
Strongly agree20%
Agree66%
Disagree3%
Strongly disagree
Undecided11%
Strongly agree20%
Agree66%
Disagree3%
Strongly disagree
Undecided11%
Strongly agree23%
Agree60%
Disagree6%
Strongly disagree
Undecided11%
Strongly agree23%
Agree60%
Disagree6%
Strongly disagree
Undecided11%
Strongly agree29%
Agree54%
Disagree4%
Strongly disagree
Undecided13%
Strongly agree29%
Agree54%
Disagree4%
Strongly disagree
Undecided13%
0 10 20 30 40 50 60 70 80
Very mature
Mature
Non existent
Partial
Basic
Strongly agree17%
Agree50%
Disagree11%
Strongly disagree
Undecided22%
Strongly agree17%
Agree50%
Disagree11%
Strongly disagree
Undecided22%
0 10 20 30 40 50 60
Strongly agree
Agree
Undecided
Disagree
Strongly disagree
0 10 20 30 40 50 60Other
Regulatory non-compliance
Power loss
Criminal/terrorist activity
Leakage/pollution
Industrial action
Supply failure
IT failure
Flooding
Fire/explosion
Equipment failure (non-IT)
No major losses in the last two years
0 10 20 30 40 50 60 70 80
Insurer pressure
Other
Regulatory compliance
Shareholder/non-executive director pressure
Client pressure, i.e. 24/7 operating requirements
Competitive advantage
Past experience
Best practice
0 10 20 30 40 50 60
Regulatory compliance
Insurer pressure
Other
Shareholder/non-executive director pressure
Outside pressure (clients, insurers, etc)
Competitive advantage
Past experience
Best practice
0 10 20 30 40 50Credit crunch e�ect
Bad experiences
Con�icting approaches
Con�icting ownership
Programme complexity
Lack of expertise
Lack of time
Lack of resource
Lack of understanding
Con�icting priorities
Lack of executive sponsorship
Lack of budget
0 10 20 30 40 50
Increased regulatory compliance
Improved risk-intelligent decision-making
Reduced insurance cost
Better preparation for known and unforeseen threats
Better understanding of your business
Faster recovery after real incidents
Reduced impact in real incidents
0 10 20 30 40 50 60
Ful�l legal/regulatory obligations
Other
Protect the supply of products/services
Protect our business strategy
Protect sta�
Protect our shareholder interests
Protect our reputation
Protect our revenue and pro�t
Recover critical business processes
0 20 40 60 80 100
Ful�l legal/regulatory obligations
Protect the supply of products/services
Protect our business strategy
Protect sta�
Protect our shareholder interests
Protect our reputation
Protect our revenue and pro�t
Recover critical business processes
Strongly agree
Agree
Disagree
Strongly disagree
Undecided
Strongly agree
Agree
Disagree
Strongly disagree
Undecided
Strongly disagree2%
Agree20%
Disagree7%
Undecided49%
Strongly agree22%
0 20 40 60 80 100
Strongly agree Agree Undecided Disagree Strongly disagree
Manufacturing
Financial services
0 20 40 60 80 100
Over 5000
Under 100
Strongly agree Agree Undecided Disagree Strongly disagree
Strongly agree
Agree
Disagree
Strongly disagree
Undecided
Strongly agree
Agree
Disagree
Strongly disagree
UndecidedStrongly disagree
1%
Agree44%
Disagree19%
Undecided26%
Strongly agree10%
Lack of budget 20%
Lack of executive sponsorship 9%
Con�icting priorities 33%
Lack of understanding 18%
Lack of resource 28%
Lack of time 30%
Lack of expertise 12%
Programme complexity 13%
Con�icting ownership 11%
Con�icting approaches 4%
Bad experiences 3% Other 1%
Credit crunch e�ect 4%
Manufacturing Financial services
Manufacturing Financial services
Manufacturing Financial services
Manufacturing Financial services
Stronglydisagree
0%
Stronglydisagree
0%

Best practice was again the largest driver for BCM, although it is hard to define exactly what organisations mean by this. Best practice can be hypothesised to be implementing BCM, as it is ‘the right thing to do’. The strength of this driver may be due to the type of respondent to the survey, most of whom are likely to be middle management. Best practice is often viewed as a middle management driver, with a focus on improving current processes. This contrasts to senior management whose focus is more around strategic direction, and whose drivers relate to that or to external pressures.
Further analysis of different industries shows the different priorities that manufacturing and financial services have. Financial services drivers focus more on best practice, past experience, competitive advantage and regulatory compliance. Manufacturing organisations have similar drivers but also focus more on outside and insurance pressures. These results are largely as expected, with financial services organisations facing strict drivers from regulatory bodies such as the FSA, and manufacturing organisations facing more market pressures to implement BCM.
17Marsh
BCM drivers | 6
BCM drivers
Other 14%
Bahrain 2%
Saudi Arabia 16%
Abu Dhabi 16%
Dubai 8%
Germany 8%
Denmark 3%
Portugal 3%
Switzerland 6%
UK 25%
Other 14%
Bahrain 2%
Saudi Arabia 16%
Abu Dhabi 16%
Dubai 8%
Germany 8%
Denmark 3%
Portugal 3%
Switzerland 6%
UK 25%
Over 500027%
1001 - 500031%
501 - 100011%
100 - 50021%
Less than 10010%
Over 500027%
1001 - 500031%
501 - 100011%
100 - 50021%
Less than 10010%
0 5 10 15 20 25
Other
Technology & communications
Retail & consumer
Real estate
Professional services
Power & utilities
Oil & energy
Manufacturing
Government & public services
Financial services
Construction
Strongly agree20%
Agree66%
Disagree3%
Strongly disagree
Undecided11%
Strongly agree20%
Agree66%
Disagree3%
Strongly disagree
Undecided11%
Strongly agree23%
Agree60%
Disagree6%
Strongly disagree
Undecided11%
Strongly agree23%
Agree60%
Disagree6%
Strongly disagree
Undecided11%
Strongly agree29%
Agree54%
Disagree4%
Strongly disagree
Undecided13%
Strongly agree29%
Agree54%
Disagree4%
Strongly disagree
Undecided13%
0 10 20 30 40 50 60 70 80
Very mature
Mature
Non existent
Partial
Basic
Strongly agree17%
Agree50%
Disagree11%
Strongly disagree
Undecided22%
Strongly agree17%
Agree50%
Disagree11%
Strongly disagree
Undecided22%
0 10 20 30 40 50 60
Strongly agree
Agree
Undecided
Disagree
Strongly disagree
0 10 20 30 40 50 60Other
Regulatory non-compliance
Power loss
Criminal/terrorist activity
Leakage/pollution
Industrial action
Supply failure
IT failure
Flooding
Fire/explosion
Equipment failure (non-IT)
No major losses in the last two years
0 10 20 30 40 50 60 70 80
Insurer pressure
Other
Regulatory compliance
Shareholder/non-executive director pressure
Client pressure, i.e. 24/7 operating requirements
Competitive advantage
Past experience
Best practice
0 10 20 30 40 50 60
Regulatory compliance
Insurer pressure
Other
Shareholder/non-executive director pressure
Outside pressure (clients, insurers, etc)
Competitive advantage
Past experience
Best practice
0 10 20 30 40 50Credit crunch e�ect
Bad experiences
Con�icting approaches
Con�icting ownership
Programme complexity
Lack of expertise
Lack of time
Lack of resource
Lack of understanding
Con�icting priorities
Lack of executive sponsorship
Lack of budget
0 10 20 30 40 50
Increased regulatory compliance
Improved risk-intelligent decision-making
Reduced insurance cost
Better preparation for known and unforeseen threats
Better understanding of your business
Faster recovery after real incidents
Reduced impact in real incidents
0 10 20 30 40 50 60
Ful�l legal/regulatory obligations
Other
Protect the supply of products/services
Protect our business strategy
Protect sta�
Protect our shareholder interests
Protect our reputation
Protect our revenue and pro�t
Recover critical business processes
0 20 40 60 80 100
Ful�l legal/regulatory obligations
Protect the supply of products/services
Protect our business strategy
Protect sta�
Protect our shareholder interests
Protect our reputation
Protect our revenue and pro�t
Recover critical business processes
Strongly agree
Agree
Disagree
Strongly disagree
Undecided
Strongly agree
Agree
Disagree
Strongly disagree
Undecided
Strongly disagree2%
Agree20%
Disagree7%
Undecided49%
Strongly agree22%
0 20 40 60 80 100
Strongly agree Agree Undecided Disagree Strongly disagree
Manufacturing
Financial services
0 20 40 60 80 100
Over 5000
Under 100
Strongly agree Agree Undecided Disagree Strongly disagree
Strongly agree
Agree
Disagree
Strongly disagree
Undecided
Strongly agree
Agree
Disagree
Strongly disagree
UndecidedStrongly disagree
1%
Agree44%
Disagree19%
Undecided26%
Strongly agree10%
Lack of budget 20%
Lack of executive sponsorship 9%
Con�icting priorities 33%
Lack of understanding 18%
Lack of resource 28%
Lack of time 30%
Lack of expertise 12%
Programme complexity 13%
Con�icting ownership 11%
Con�icting approaches 4%
Bad experiences 3% Other 1%
Credit crunch e�ect 4%
Manufacturing Financial services
Manufacturing Financial services
Manufacturing Financial services
Manufacturing Financial services
Stronglydisagree
0%
Stronglydisagree
0%

In planning a BCM programme, it helps to be able to anticipate and pre-handle any of the potential barriers to success. This question identifies the barriers that organisations have encountered in real life.
The main barriers to BCM were conflicting priorities (34%, up 15%) a lack of time (30%, up 10%) and a lack of resources (29%, up 15%). Other important barriers were a lack of budget (20%), and a lack of understanding (18%). The smallest barriers are bad experiences (3%), conflicting approaches (4%) and the credit crunch effect (4%).
These results show that despite organisations’ appreciation of the importance of BCM they still view it as one of a number of solutions to risk. Some of these results also contrast quite strongly with earlier responses showing the BCM drivers and programme maturity. On a positive note, only 3% of respondents cited bad experiences as a problem with BCM.
The conclusions drawn are that the barriers to BCM do not lie in a lack of direction or general ‘good intent’. The barriers relate to a lack of understanding of the level of resource and commitment required to do the job properly. This is a matter of BCM maturity, and is further reinforcement of the view that the perceived maturity does not match the reality.
7 | Barriers to BCM
Barriers to BCM
18 2010 EMEA business continuity benchmark report
”“The barriers
relate to a lack of understanding of the level of resource and commitment required to do the job properly
Supply chain analysis
Other 14%
Bahrain 2%
Saudi Arabia 16%
Abu Dhabi 16%
Dubai 8%
Germany 8%
Denmark 3%
Portugal 3%
Switzerland 6%
UK 25%
Other 14%
Bahrain 2%
Saudi Arabia 16%
Abu Dhabi 16%
Dubai 8%
Germany 8%
Denmark 3%
Portugal 3%
Switzerland 6%
UK 25%
Over 500027%
1001 - 500031%
501 - 100011%
100 - 50021%
Less than 10010%
Over 500027%
1001 - 500031%
501 - 100011%
100 - 50021%
Less than 10010%
0 5 10 15 20 25
Other
Technology & communications
Retail & consumer
Real estate
Professional services
Power & utilities
Oil & energy
Manufacturing
Government & public services
Financial services
Construction
Strongly agree20%
Agree66%
Disagree3%
Strongly disagree
Undecided11%
Strongly agree20%
Agree66%
Disagree3%
Strongly disagree
Undecided11%
Strongly agree23%
Agree60%
Disagree6%
Strongly disagree
Undecided11%
Strongly agree23%
Agree60%
Disagree6%
Strongly disagree
Undecided11%
Strongly agree29%
Agree54%
Disagree4%
Strongly disagree
Undecided13%
Strongly agree29%
Agree54%
Disagree4%
Strongly disagree
Undecided13%
0 10 20 30 40 50 60 70 80
Very mature
Mature
Non existent
Partial
Basic
Strongly agree17%
Agree50%
Disagree11%
Strongly disagree
Undecided22%
Strongly agree17%
Agree50%
Disagree11%
Strongly disagree
Undecided22%
0 10 20 30 40 50 60
Strongly agree
Agree
Undecided
Disagree
Strongly disagree
0 10 20 30 40 50 60Other
Regulatory non-compliance
Power loss
Criminal/terrorist activity
Leakage/pollution
Industrial action
Supply failure
IT failure
Flooding
Fire/explosion
Equipment failure (non-IT)
No major losses in the last two years
0 10 20 30 40 50 60 70 80
Insurer pressure
Other
Regulatory compliance
Shareholder/non-executive director pressure
Client pressure, i.e. 24/7 operating requirements
Competitive advantage
Past experience
Best practice
0 10 20 30 40 50 60
Regulatory compliance
Insurer pressure
Other
Shareholder/non-executive director pressure
Outside pressure (clients, insurers, etc)
Competitive advantage
Past experience
Best practice
0 10 20 30 40 50Credit crunch e�ect
Bad experiences
Con�icting approaches
Con�icting ownership
Programme complexity
Lack of expertise
Lack of time
Lack of resource
Lack of understanding
Con�icting priorities
Lack of executive sponsorship
Lack of budget
0 10 20 30 40 50
Increased regulatory compliance
Improved risk-intelligent decision-making
Reduced insurance cost
Better preparation for known and unforeseen threats
Better understanding of your business
Faster recovery after real incidents
Reduced impact in real incidents
0 10 20 30 40 50 60
Ful�l legal/regulatory obligations
Other
Protect the supply of products/services
Protect our business strategy
Protect sta�
Protect our shareholder interests
Protect our reputation
Protect our revenue and pro�t
Recover critical business processes
0 20 40 60 80 100
Ful�l legal/regulatory obligations
Protect the supply of products/services
Protect our business strategy
Protect sta�
Protect our shareholder interests
Protect our reputation
Protect our revenue and pro�t
Recover critical business processes
Strongly agree
Agree
Disagree
Strongly disagree
Undecided
Strongly agree
Agree
Disagree
Strongly disagree
Undecided
Strongly disagree2%
Agree20%
Disagree7%
Undecided49%
Strongly agree22%
0 20 40 60 80 100
Strongly agree Agree Undecided Disagree Strongly disagree
Manufacturing
Financial services
0 20 40 60 80 100
Over 5000
Under 100
Strongly agree Agree Undecided Disagree Strongly disagree
Strongly agree
Agree
Disagree
Strongly disagree
Undecided
Strongly agree
Agree
Disagree
Strongly disagree
UndecidedStrongly disagree
1%
Agree44%
Disagree19%
Undecided26%
Strongly agree10%
Lack of budget 20%
Lack of executive sponsorship 9%
Con�icting priorities 33%
Lack of understanding 18%
Lack of resource 28%
Lack of time 30%
Lack of expertise 12%
Programme complexity 13%
Con�icting ownership 11%
Con�icting approaches 4%
Bad experiences 3% Other 1%
Credit crunch e�ect 4%
Manufacturing Financial services
Manufacturing Financial services
Manufacturing Financial services
Manufacturing Financial services
Stronglydisagree
0%
Stronglydisagree
0%
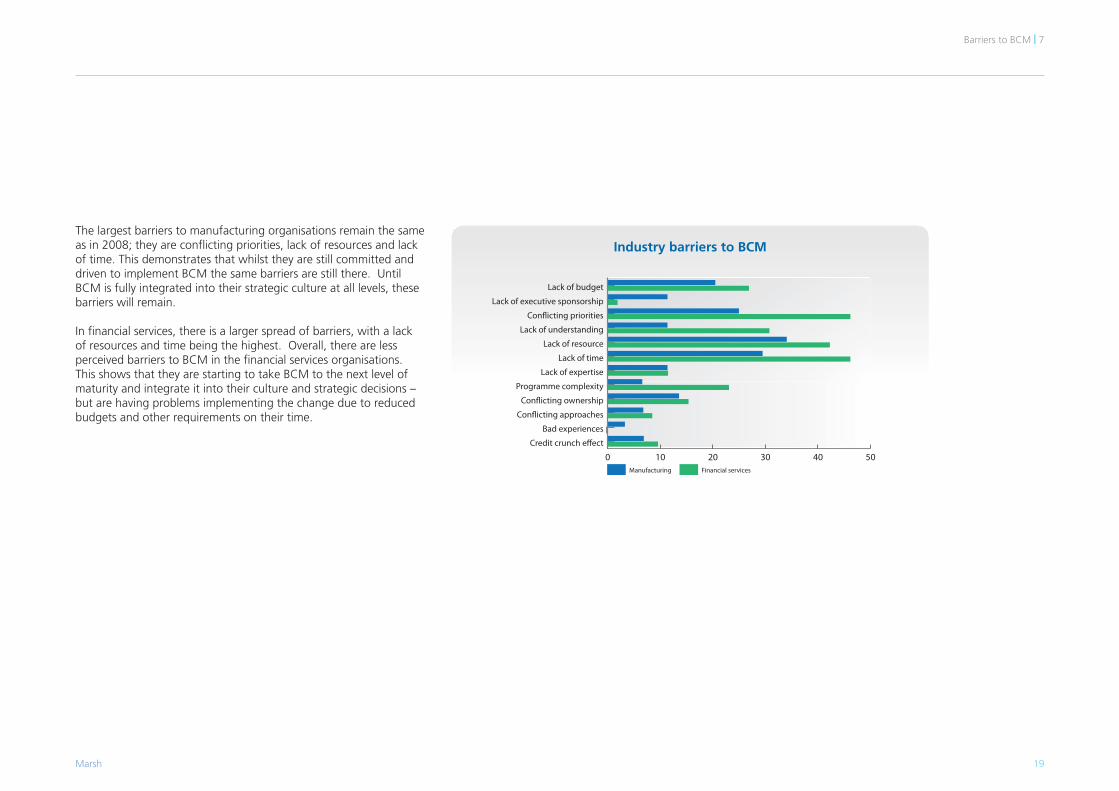
The largest barriers to manufacturing organisations remain the same as in 2008; they are conflicting priorities, lack of resources and lack of time. This demonstrates that whilst they are still committed and driven to implement BCM the same barriers are still there. Until BCM is fully integrated into their strategic culture at all levels, these barriers will remain.
In financial services, there is a larger spread of barriers, with a lack of resources and time being the highest. Overall, there are less perceived barriers to BCM in the financial services organisations. This shows that they are starting to take BCM to the next level of maturity and integrate it into their culture and strategic decisions – but are having problems implementing the change due to reduced budgets and other requirements on their time.
19Marsh
Barriers to BCM | 7
Industry barriers to BCM
Other 14%
Bahrain 2%
Saudi Arabia 16%
Abu Dhabi 16%
Dubai 8%
Germany 8%
Denmark 3%
Portugal 3%
Switzerland 6%
UK 25%
Other 14%
Bahrain 2%
Saudi Arabia 16%
Abu Dhabi 16%
Dubai 8%
Germany 8%
Denmark 3%
Portugal 3%
Switzerland 6%
UK 25%
Over 500027%
1001 - 500031%
501 - 100011%
100 - 50021%
Less than 10010%
Over 500027%
1001 - 500031%
501 - 100011%
100 - 50021%
Less than 10010%
0 5 10 15 20 25
Other
Technology & communications
Retail & consumer
Real estate
Professional services
Power & utilities
Oil & energy
Manufacturing
Government & public services
Financial services
Construction
Strongly agree20%
Agree66%
Disagree3%
Strongly disagree
Undecided11%
Strongly agree20%
Agree66%
Disagree3%
Strongly disagree
Undecided11%
Strongly agree23%
Agree60%
Disagree6%
Strongly disagree
Undecided11%
Strongly agree23%
Agree60%
Disagree6%
Strongly disagree
Undecided11%
Strongly agree29%
Agree54%
Disagree4%
Strongly disagree
Undecided13%
Strongly agree29%
Agree54%
Disagree4%
Strongly disagree
Undecided13%
0 10 20 30 40 50 60 70 80
Very mature
Mature
Non existent
Partial
Basic
Strongly agree17%
Agree50%
Disagree11%
Strongly disagree
Undecided22%
Strongly agree17%
Agree50%
Disagree11%
Strongly disagree
Undecided22%
0 10 20 30 40 50 60
Strongly agree
Agree
Undecided
Disagree
Strongly disagree
0 10 20 30 40 50 60Other
Regulatory non-compliance
Power loss
Criminal/terrorist activity
Leakage/pollution
Industrial action
Supply failure
IT failure
Flooding
Fire/explosion
Equipment failure (non-IT)
No major losses in the last two years
0 10 20 30 40 50 60 70 80
Insurer pressure
Other
Regulatory compliance
Shareholder/non-executive director pressure
Client pressure, i.e. 24/7 operating requirements
Competitive advantage
Past experience
Best practice
0 10 20 30 40 50 60
Regulatory compliance
Insurer pressure
Other
Shareholder/non-executive director pressure
Outside pressure (clients, insurers, etc)
Competitive advantage
Past experience
Best practice
0 10 20 30 40 50Credit crunch e�ect
Bad experiences
Con�icting approaches
Con�icting ownership
Programme complexity
Lack of expertise
Lack of time
Lack of resource
Lack of understanding
Con�icting priorities
Lack of executive sponsorship
Lack of budget
0 10 20 30 40 50
Increased regulatory compliance
Improved risk-intelligent decision-making
Reduced insurance cost
Better preparation for known and unforeseen threats
Better understanding of your business
Faster recovery after real incidents
Reduced impact in real incidents
0 10 20 30 40 50 60
Ful�l legal/regulatory obligations
Other
Protect the supply of products/services
Protect our business strategy
Protect sta�
Protect our shareholder interests
Protect our reputation
Protect our revenue and pro�t
Recover critical business processes
0 20 40 60 80 100
Ful�l legal/regulatory obligations
Protect the supply of products/services
Protect our business strategy
Protect sta�
Protect our shareholder interests
Protect our reputation
Protect our revenue and pro�t
Recover critical business processes
Strongly agree
Agree
Disagree
Strongly disagree
Undecided
Strongly agree
Agree
Disagree
Strongly disagree
Undecided
Strongly disagree2%
Agree20%
Disagree7%
Undecided49%
Strongly agree22%
0 20 40 60 80 100
Strongly agree Agree Undecided Disagree Strongly disagree
Manufacturing
Financial services
0 20 40 60 80 100
Over 5000
Under 100
Strongly agree Agree Undecided Disagree Strongly disagree
Strongly agree
Agree
Disagree
Strongly disagree
Undecided
Strongly agree
Agree
Disagree
Strongly disagree
UndecidedStrongly disagree
1%
Agree44%
Disagree19%
Undecided26%
Strongly agree10%
Lack of budget 20%
Lack of executive sponsorship 9%
Con�icting priorities 33%
Lack of understanding 18%
Lack of resource 28%
Lack of time 30%
Lack of expertise 12%
Programme complexity 13%
Con�icting ownership 11%
Con�icting approaches 4%
Bad experiences 3% Other 1%
Credit crunch e�ect 4%
Manufacturing Financial services
Manufacturing Financial services
Manufacturing Financial services
Manufacturing Financial services
Stronglydisagree
0%
Stronglydisagree
0%

This question identifies the actual benefits of BCM reported by clients. Understanding these will justify expenditure on BCM and will help set expectations accurately. The benefits should also align to the drivers.
Interestingly the perceived benefits of BCM have dropped from those observed in 2008, although the relative spread of the benefits remains similar. The traditional benefit of having a BCM plan, to ensure that a company is prepared should an incident occur, has fallen from 32% to 15% this year. In addition the strategic benefits such as improved risk-intelligent decision-making and better understanding of the business have both dropped, from 38% to 29% and 49% to 41% respectively.
The 2010 results taken independently show that although the primary role of BCM may be to help organisations recover from an incident; it has many other peripheral benefits. These are often harder to quantify, but they do help to justify the cost of a BCM programme, and the realisation of these benefits needs to be managed. The drop in benefits from 2008 is harder to explain, as elsewhere in the survey results show that BCM maturity and implementation is increasing. One reason for this could be the intrinsic role that BCM now plays in organisations operating capacity, thus not being seen as an extra component with discrete benefits.
The two largest benefits to businesses are that they feel better prepared for known and unforeseen events and better understand their business. These two benefits taken independently are enough justification for BCM implementation. The extra benefits can still yield huge benefits to businesses, even if they are hard to use as tangible, up-front, advantages to justify investment.
Given that the overall goal of risk management is to manage risks effectively and efficiently, the BCM programme should work within an overall ERM structure. A better understanding of the business and better risk-intelligent decision-making will improve the effectiveness of the overall risk management and resilience strategies. This can potentially lead to a better return from the investment in these areas.
These results all link back to the maturity model, with more mature firms utilising BCM as a strategic tool to gain these extra benefits. Although seen as intangible and hard to measure, they can only improve the resilience, thus bottom line, of a business.
8 | Benefits of BCM
Benefits of BCM
20 2010 EMEA business continuity benchmark report
Response percent
Other 14%
Bahrain 2%
Saudi Arabia 16%
Abu Dhabi 16%
Dubai 8%
Germany 8%
Denmark 3%
Portugal 3%
Switzerland 6%
UK 25%
Other 14%
Bahrain 2%
Saudi Arabia 16%
Abu Dhabi 16%
Dubai 8%
Germany 8%
Denmark 3%
Portugal 3%
Switzerland 6%
UK 25%
Over 500027%
1001 - 500031%
501 - 100011%
100 - 50021%
Less than 10010%
Over 500027%
1001 - 500031%
501 - 100011%
100 - 50021%
Less than 10010%
0 5 10 15 20 25
Other
Technology & communications
Retail & consumer
Real estate
Professional services
Power & utilities
Oil & energy
Manufacturing
Government & public services
Financial services
Construction
Strongly agree20%
Agree66%
Disagree3%
Strongly disagree
Undecided11%
Strongly agree20%
Agree66%
Disagree3%
Strongly disagree
Undecided11%
Strongly agree23%
Agree60%
Disagree6%
Strongly disagree
Undecided11%
Strongly agree23%
Agree60%
Disagree6%
Strongly disagree
Undecided11%
Strongly agree29%
Agree54%
Disagree4%
Strongly disagree
Undecided13%
Strongly agree29%
Agree54%
Disagree4%
Strongly disagree
Undecided13%
0 10 20 30 40 50 60 70 80
Very mature
Mature
Non existent
Partial
Basic
Strongly agree17%
Agree50%
Disagree11%
Strongly disagree
Undecided22%
Strongly agree17%
Agree50%
Disagree11%
Strongly disagree
Undecided22%
0 10 20 30 40 50 60
Strongly agree
Agree
Undecided
Disagree
Strongly disagree
0 10 20 30 40 50 60Other
Regulatory non-compliance
Power loss
Criminal/terrorist activity
Leakage/pollution
Industrial action
Supply failure
IT failure
Flooding
Fire/explosion
Equipment failure (non-IT)
No major losses in the last two years
0 10 20 30 40 50 60 70 80
Insurer pressure
Other
Regulatory compliance
Shareholder/non-executive director pressure
Client pressure, i.e. 24/7 operating requirements
Competitive advantage
Past experience
Best practice
0 10 20 30 40 50 60
Regulatory compliance
Insurer pressure
Other
Shareholder/non-executive director pressure
Outside pressure (clients, insurers, etc)
Competitive advantage
Past experience
Best practice
0 10 20 30 40 50Credit crunch e�ect
Bad experiences
Con�icting approaches
Con�icting ownership
Programme complexity
Lack of expertise
Lack of time
Lack of resource
Lack of understanding
Con�icting priorities
Lack of executive sponsorship
Lack of budget
0 10 20 30 40 50
Increased regulatory compliance
Improved risk-intelligent decision-making
Reduced insurance cost
Better preparation for known and unforeseen threats
Better understanding of your business
Faster recovery after real incidents
Reduced impact in real incidents
0 10 20 30 40 50 60
Ful�l legal/regulatory obligations
Other
Protect the supply of products/services
Protect our business strategy
Protect sta�
Protect our shareholder interests
Protect our reputation
Protect our revenue and pro�t
Recover critical business processes
0 20 40 60 80 100
Ful�l legal/regulatory obligations
Protect the supply of products/services
Protect our business strategy
Protect sta�
Protect our shareholder interests
Protect our reputation
Protect our revenue and pro�t
Recover critical business processes
Strongly agree
Agree
Disagree
Strongly disagree
Undecided
Strongly agree
Agree
Disagree
Strongly disagree
Undecided
Strongly disagree2%
Agree20%
Disagree7%
Undecided49%
Strongly agree22%
0 20 40 60 80 100
Strongly agree Agree Undecided Disagree Strongly disagree
Manufacturing
Financial services
0 20 40 60 80 100
Over 5000
Under 100
Strongly agree Agree Undecided Disagree Strongly disagree
Strongly agree
Agree
Disagree
Strongly disagree
Undecided
Strongly agree
Agree
Disagree
Strongly disagree
UndecidedStrongly disagree
1%
Agree44%
Disagree19%
Undecided26%
Strongly agree10%
Lack of budget 20%
Lack of executive sponsorship 9%
Con�icting priorities 33%
Lack of understanding 18%
Lack of resource 28%
Lack of time 30%
Lack of expertise 12%
Programme complexity 13%
Con�icting ownership 11%
Con�icting approaches 4%
Bad experiences 3% Other 1%
Credit crunch e�ect 4%
Manufacturing Financial services
Manufacturing Financial services
Manufacturing Financial services
Manufacturing Financial services
Stronglydisagree
0%
Stronglydisagree
0%

This is an important area as it shows what organisations specifically designed their plans to achieve. Unsurprisingly it shows that BCM plans primary purpose is to recover critical business processes (55%, down 24%). The second two largest reasons for BCM are to protect reputation (27%, down 33%) and to protect revenue and profit (29%, down 30%). The reasons for BCM cited least were to protect business strategy (18%) and to protect shareholder interests (17%).
Although the primary reason of recovering critical business processes was expected, the large drop in the main categories show that more mature organisations’ BCM plans have evolved from being designed to counter a specific threat and are now more intrinsically linked to strategy. Although some of these factors work as drivers towards instigating a BCM programme, the plans are no longer tailored to one aspect of organisational resilience.
21Marsh
BCM plan purpose
BCM plan purpose | 9
”
“Although some of these factors work as drivers towards instigating a BCM programme, the plans are no longer tailored to one aspect of organisational resilience
BCM plan purpose
Other 14%
Bahrain 2%
Saudi Arabia 16%
Abu Dhabi 16%
Dubai 8%
Germany 8%
Denmark 3%
Portugal 3%
Switzerland 6%
UK 25%
Other 14%
Bahrain 2%
Saudi Arabia 16%
Abu Dhabi 16%
Dubai 8%
Germany 8%
Denmark 3%
Portugal 3%
Switzerland 6%
UK 25%
Over 500027%
1001 - 500031%
501 - 100011%
100 - 50021%
Less than 10010%
Over 500027%
1001 - 500031%
501 - 100011%
100 - 50021%
Less than 10010%
0 5 10 15 20 25
Other
Technology & communications
Retail & consumer
Real estate
Professional services
Power & utilities
Oil & energy
Manufacturing
Government & public services
Financial services
Construction
Strongly agree20%
Agree66%
Disagree3%
Strongly disagree
Undecided11%
Strongly agree20%
Agree66%
Disagree3%
Strongly disagree
Undecided11%
Strongly agree23%
Agree60%
Disagree6%
Strongly disagree
Undecided11%
Strongly agree23%
Agree60%
Disagree6%
Strongly disagree
Undecided11%
Strongly agree29%
Agree54%
Disagree4%
Strongly disagree
Undecided13%
Strongly agree29%
Agree54%
Disagree4%
Strongly disagree
Undecided13%
0 10 20 30 40 50 60 70 80
Very mature
Mature
Non existent
Partial
Basic
Strongly agree17%
Agree50%
Disagree11%
Strongly disagree
Undecided22%
Strongly agree17%
Agree50%
Disagree11%
Strongly disagree
Undecided22%
0 10 20 30 40 50 60
Strongly agree
Agree
Undecided
Disagree
Strongly disagree
0 10 20 30 40 50 60Other
Regulatory non-compliance
Power loss
Criminal/terrorist activity
Leakage/pollution
Industrial action
Supply failure
IT failure
Flooding
Fire/explosion
Equipment failure (non-IT)
No major losses in the last two years
0 10 20 30 40 50 60 70 80
Insurer pressure
Other
Regulatory compliance
Shareholder/non-executive director pressure
Client pressure, i.e. 24/7 operating requirements
Competitive advantage
Past experience
Best practice
0 10 20 30 40 50 60
Regulatory compliance
Insurer pressure
Other
Shareholder/non-executive director pressure
Outside pressure (clients, insurers, etc)
Competitive advantage
Past experience
Best practice
0 10 20 30 40 50Credit crunch e�ect
Bad experiences
Con�icting approaches
Con�icting ownership
Programme complexity
Lack of expertise
Lack of time
Lack of resource
Lack of understanding
Con�icting priorities
Lack of executive sponsorship
Lack of budget
0 10 20 30 40 50
Increased regulatory compliance
Improved risk-intelligent decision-making
Reduced insurance cost
Better preparation for known and unforeseen threats
Better understanding of your business
Faster recovery after real incidents
Reduced impact in real incidents
0 10 20 30 40 50 60
Ful�l legal/regulatory obligations
Other
Protect the supply of products/services
Protect our business strategy
Protect sta�
Protect our shareholder interests
Protect our reputation
Protect our revenue and pro�t
Recover critical business processes
0 20 40 60 80 100
Ful�l legal/regulatory obligations
Protect the supply of products/services
Protect our business strategy
Protect sta�
Protect our shareholder interests
Protect our reputation
Protect our revenue and pro�t
Recover critical business processes
Strongly agree
Agree
Disagree
Strongly disagree
Undecided
Strongly agree
Agree
Disagree
Strongly disagree
Undecided
Strongly disagree2%
Agree20%
Disagree7%
Undecided49%
Strongly agree22%
0 20 40 60 80 100
Strongly agree Agree Undecided Disagree Strongly disagree
Manufacturing
Financial services
0 20 40 60 80 100
Over 5000
Under 100
Strongly agree Agree Undecided Disagree Strongly disagree
Strongly agree
Agree
Disagree
Strongly disagree
Undecided
Strongly agree
Agree
Disagree
Strongly disagree
UndecidedStrongly disagree
1%
Agree44%
Disagree19%
Undecided26%
Strongly agree10%
Lack of budget 20%
Lack of executive sponsorship 9%
Con�icting priorities 33%
Lack of understanding 18%
Lack of resource 28%
Lack of time 30%
Lack of expertise 12%
Programme complexity 13%
Con�icting ownership 11%
Con�icting approaches 4%
Bad experiences 3% Other 1%
Credit crunch e�ect 4%
Manufacturing Financial services
Manufacturing Financial services
Manufacturing Financial services
Manufacturing Financial services
Stronglydisagree
0%
Stronglydisagree
0%

Further analysis of financial services and manufacturing industries shows that both place a higher emphasis on protecting their reputation than other organisations surveyed. Financial services has a much higher emphasis on fulfilling legal and regulatory obligations and protecting their business strategy and shareholder interests. In contract manufacturing organisations place more emphasis on the protection of the supply of products and services.
These results reinforce earlier analysis, with financial services firms responding to FSA and other regulatory pressure, whilst manufacturing organisations are increasingly concerned about protecting the supply of goods and services. Both sectors have increased their awareness of reputation management dramatically, with 2008 results only showing 8% for manufacturing and 16% for financial services as opposed to the 66% and 82% seen now. This is indicative of the improved general awareness that an organisation’s reputation is core to its continued viability.
The overall conclusion of this data is that firms are beginning to see risk management and BCM as more than just a regulatory fix or a way to avert and manage a crisis. They are beginning to see the potential upside in managing their reputation and ensuring the protection of their staff and other critical processes.
9 | BCM plan purpose
22 2010 EMEA business continuity benchmark report
BCM plan purpose
Other 14%
Bahrain 2%
Saudi Arabia 16%
Abu Dhabi 16%
Dubai 8%
Germany 8%
Denmark 3%
Portugal 3%
Switzerland 6%
UK 25%
Other 14%
Bahrain 2%
Saudi Arabia 16%
Abu Dhabi 16%
Dubai 8%
Germany 8%
Denmark 3%
Portugal 3%
Switzerland 6%
UK 25%
Over 500027%
1001 - 500031%
501 - 100011%
100 - 50021%
Less than 10010%
Over 500027%
1001 - 500031%
501 - 100011%
100 - 50021%
Less than 10010%
0 5 10 15 20 25
Other
Technology & communications
Retail & consumer
Real estate
Professional services
Power & utilities
Oil & energy
Manufacturing
Government & public services
Financial services
Construction
Strongly agree20%
Agree66%
Disagree3%
Strongly disagree
Undecided11%
Strongly agree20%
Agree66%
Disagree3%
Strongly disagree
Undecided11%
Strongly agree23%
Agree60%
Disagree6%
Strongly disagree
Undecided11%
Strongly agree23%
Agree60%
Disagree6%
Strongly disagree
Undecided11%
Strongly agree29%
Agree54%
Disagree4%
Strongly disagree
Undecided13%
Strongly agree29%
Agree54%
Disagree4%
Strongly disagree
Undecided13%
0 10 20 30 40 50 60 70 80
Very mature
Mature
Non existent
Partial
Basic
Strongly agree17%
Agree50%
Disagree11%
Strongly disagree
Undecided22%
Strongly agree17%
Agree50%
Disagree11%
Strongly disagree
Undecided22%
0 10 20 30 40 50 60
Strongly agree
Agree
Undecided
Disagree
Strongly disagree
0 10 20 30 40 50 60Other
Regulatory non-compliance
Power loss
Criminal/terrorist activity
Leakage/pollution
Industrial action
Supply failure
IT failure
Flooding
Fire/explosion
Equipment failure (non-IT)
No major losses in the last two years
0 10 20 30 40 50 60 70 80
Insurer pressure
Other
Regulatory compliance
Shareholder/non-executive director pressure
Client pressure, i.e. 24/7 operating requirements
Competitive advantage
Past experience
Best practice
0 10 20 30 40 50 60
Regulatory compliance
Insurer pressure
Other
Shareholder/non-executive director pressure
Outside pressure (clients, insurers, etc)
Competitive advantage
Past experience
Best practice
0 10 20 30 40 50Credit crunch e�ect
Bad experiences
Con�icting approaches
Con�icting ownership
Programme complexity
Lack of expertise
Lack of time
Lack of resource
Lack of understanding
Con�icting priorities
Lack of executive sponsorship
Lack of budget
0 10 20 30 40 50
Increased regulatory compliance
Improved risk-intelligent decision-making
Reduced insurance cost
Better preparation for known and unforeseen threats
Better understanding of your business
Faster recovery after real incidents
Reduced impact in real incidents
0 10 20 30 40 50 60
Ful�l legal/regulatory obligations
Other
Protect the supply of products/services
Protect our business strategy
Protect sta�
Protect our shareholder interests
Protect our reputation
Protect our revenue and pro�t
Recover critical business processes
0 20 40 60 80 100
Ful�l legal/regulatory obligations
Protect the supply of products/services
Protect our business strategy
Protect sta�
Protect our shareholder interests
Protect our reputation
Protect our revenue and pro�t
Recover critical business processes
Strongly agree
Agree
Disagree
Strongly disagree
Undecided
Strongly agree
Agree
Disagree
Strongly disagree
Undecided
Strongly disagree2%
Agree20%
Disagree7%
Undecided49%
Strongly agree22%
0 20 40 60 80 100
Strongly agree Agree Undecided Disagree Strongly disagree
Manufacturing
Financial services
0 20 40 60 80 100
Over 5000
Under 100
Strongly agree Agree Undecided Disagree Strongly disagree
Strongly agree
Agree
Disagree
Strongly disagree
Undecided
Strongly agree
Agree
Disagree
Strongly disagree
UndecidedStrongly disagree
1%
Agree44%
Disagree19%
Undecided26%
Strongly agree10%
Lack of budget 20%
Lack of executive sponsorship 9%
Con�icting priorities 33%
Lack of understanding 18%
Lack of resource 28%
Lack of time 30%
Lack of expertise 12%
Programme complexity 13%
Con�icting ownership 11%
Con�icting approaches 4%
Bad experiences 3% Other 1%
Credit crunch e�ect 4%
Manufacturing Financial services
Manufacturing Financial services
Manufacturing Financial services
Manufacturing Financial services
Stronglydisagree
0%
Stronglydisagree
0%
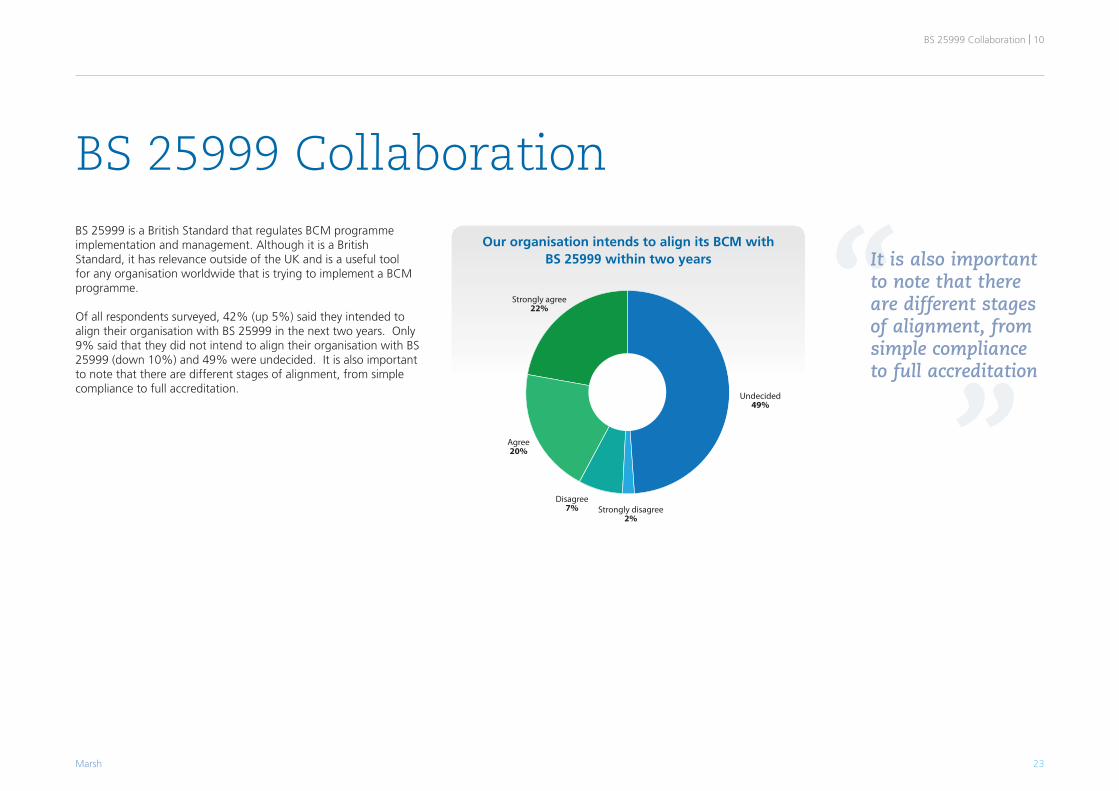
BS 25999 is a British Standard that regulates BCM programme implementation and management. Although it is a British Standard, it has relevance outside of the UK and is a useful tool for any organisation worldwide that is trying to implement a BCM programme.
Of all respondents surveyed, 42% (up 5%) said they intended to align their organisation with BS 25999 in the next two years. Only 9% said that they did not intend to align their organisation with BS 25999 (down 10%) and 49% were undecided. It is also important to note that there are different stages of alignment, from simple compliance to full accreditation.
23Marsh
BS 25999 Collaboration
BS 25999 Collaboration | 10
”“It is also important
to note that there are different stages of alignment, from simple compliance to full accreditation
Our organisation intends to align its BCM withBS 25999 within two years
Other 14%
Bahrain 2%
Saudi Arabia 16%
Abu Dhabi 16%
Dubai 8%
Germany 8%
Denmark 3%
Portugal 3%
Switzerland 6%
UK 25%
Other 14%
Bahrain 2%
Saudi Arabia 16%
Abu Dhabi 16%
Dubai 8%
Germany 8%
Denmark 3%
Portugal 3%
Switzerland 6%
UK 25%
Over 500027%
1001 - 500031%
501 - 100011%
100 - 50021%
Less than 10010%
Over 500027%
1001 - 500031%
501 - 100011%
100 - 50021%
Less than 10010%
0 5 10 15 20 25
Other
Technology & communications
Retail & consumer
Real estate
Professional services
Power & utilities
Oil & energy
Manufacturing
Government & public services
Financial services
Construction
Strongly agree20%
Agree66%
Disagree3%
Strongly disagree
Undecided11%
Strongly agree20%
Agree66%
Disagree3%
Strongly disagree
Undecided11%
Strongly agree23%
Agree60%
Disagree6%
Strongly disagree
Undecided11%
Strongly agree23%
Agree60%
Disagree6%
Strongly disagree
Undecided11%
Strongly agree29%
Agree54%
Disagree4%
Strongly disagree
Undecided13%
Strongly agree29%
Agree54%
Disagree4%
Strongly disagree
Undecided13%
0 10 20 30 40 50 60 70 80
Very mature
Mature
Non existent
Partial
Basic
Strongly agree17%
Agree50%
Disagree11%
Strongly disagree
Undecided22%
Strongly agree17%
Agree50%
Disagree11%
Strongly disagree
Undecided22%
0 10 20 30 40 50 60
Strongly agree
Agree
Undecided
Disagree
Strongly disagree
0 10 20 30 40 50 60Other
Regulatory non-compliance
Power loss
Criminal/terrorist activity
Leakage/pollution
Industrial action
Supply failure
IT failure
Flooding
Fire/explosion
Equipment failure (non-IT)
No major losses in the last two years
0 10 20 30 40 50 60 70 80
Insurer pressure
Other
Regulatory compliance
Shareholder/non-executive director pressure
Client pressure, i.e. 24/7 operating requirements
Competitive advantage
Past experience
Best practice
0 10 20 30 40 50 60
Regulatory compliance
Insurer pressure
Other
Shareholder/non-executive director pressure
Outside pressure (clients, insurers, etc)
Competitive advantage
Past experience
Best practice
0 10 20 30 40 50Credit crunch e�ect
Bad experiences
Con�icting approaches
Con�icting ownership
Programme complexity
Lack of expertise
Lack of time
Lack of resource
Lack of understanding
Con�icting priorities
Lack of executive sponsorship
Lack of budget
0 10 20 30 40 50
Increased regulatory compliance
Improved risk-intelligent decision-making
Reduced insurance cost
Better preparation for known and unforeseen threats
Better understanding of your business
Faster recovery after real incidents
Reduced impact in real incidents
0 10 20 30 40 50 60
Ful�l legal/regulatory obligations
Other
Protect the supply of products/services
Protect our business strategy
Protect sta�
Protect our shareholder interests
Protect our reputation
Protect our revenue and pro�t
Recover critical business processes
0 20 40 60 80 100
Ful�l legal/regulatory obligations
Protect the supply of products/services
Protect our business strategy
Protect sta�
Protect our shareholder interests
Protect our reputation
Protect our revenue and pro�t
Recover critical business processes
Strongly agree
Agree
Disagree
Strongly disagree
Undecided
Strongly agree
Agree
Disagree
Strongly disagree
Undecided
Strongly disagree2%
Agree20%
Disagree7%
Undecided49%
Strongly agree22%
0 20 40 60 80 100
Strongly agree Agree Undecided Disagree Strongly disagree
Manufacturing
Financial services
0 20 40 60 80 100
Over 5000
Under 100
Strongly agree Agree Undecided Disagree Strongly disagree
Strongly agree
Agree
Disagree
Strongly disagree
Undecided
Strongly agree
Agree
Disagree
Strongly disagree
UndecidedStrongly disagree
1%
Agree44%
Disagree19%
Undecided26%
Strongly agree10%
Lack of budget 20%
Lack of executive sponsorship 9%
Con�icting priorities 33%
Lack of understanding 18%
Lack of resource 28%
Lack of time 30%
Lack of expertise 12%
Programme complexity 13%
Con�icting ownership 11%
Con�icting approaches 4%
Bad experiences 3% Other 1%
Credit crunch e�ect 4%
Manufacturing Financial services
Manufacturing Financial services
Manufacturing Financial services
Manufacturing Financial services
Stronglydisagree
0%
Stronglydisagree
0%

Further analysis of the two largest sectors shows that regulatory concerns are likely to be a large driver for BS 25999 alignment. 58% of financial services firms are set to comply, with the majority of the rest currently undecided. In contrast to this is the manufacturing sector, where only 18% are intending to align. These results closely mirror the 2008 survey and show that although BS 25999 is a valuable resource for some organisations it is not applicable to all.
The size of a company also seems to be important when considering BS 25999 alignment. In firms over 5,000 people, there is a 45% alignment, as opposed to 24% in firms under 100. This could be attributed to the fact either that BS 25999 is seen as a standard for larger firms only, or simply that smaller firms have less resources and more pressing concerns and do not view BS 25999 as a priority.
These results show that BS 25999 is most commonly used by large financial services organisations. There are a number of reasons why this could be the case; the time and resource cost could put off smaller industries and compliance could be the main driver in those intending to align. Interestingly these results have not changed greatly from the 2008 survey despite the addition of the Middle East in the survey results and almost half of the responses now from outside the UK. This demonstrates that BS 25999 is not just a UK standard but also has gained worldwide approval. The determining factor for whether a firm adheres to its principles instead relates to their size and industry sector as opposed to their country of origin.
10 | BS 25999 Collaboration
24 2010 EMEA business continuity benchmark report
BS 25999 fi rm sector compliance
Other 14%
Bahrain 2%
Saudi Arabia 16%
Abu Dhabi 16%
Dubai 8%
Germany 8%
Denmark 3%
Portugal 3%
Switzerland 6%
UK 25%
Other 14%
Bahrain 2%
Saudi Arabia 16%
Abu Dhabi 16%
Dubai 8%
Germany 8%
Denmark 3%
Portugal 3%
Switzerland 6%
UK 25%
Over 500027%
1001 - 500031%
501 - 100011%
100 - 50021%
Less than 10010%
Over 500027%
1001 - 500031%
501 - 100011%
100 - 50021%
Less than 10010%
0 5 10 15 20 25
Other
Technology & communications
Retail & consumer
Real estate
Professional services
Power & utilities
Oil & energy
Manufacturing
Government & public services
Financial services
Construction
Strongly agree20%
Agree66%
Disagree3%
Strongly disagree
Undecided11%
Strongly agree20%
Agree66%
Disagree3%
Strongly disagree
Undecided11%
Strongly agree23%
Agree60%
Disagree6%
Strongly disagree
Undecided11%
Strongly agree23%
Agree60%
Disagree6%
Strongly disagree
Undecided11%
Strongly agree29%
Agree54%
Disagree4%
Strongly disagree
Undecided13%
Strongly agree29%
Agree54%
Disagree4%
Strongly disagree
Undecided13%
0 10 20 30 40 50 60 70 80
Very mature
Mature
Non existent
Partial
Basic
Strongly agree17%
Agree50%
Disagree11%
Strongly disagree
Undecided22%
Strongly agree17%
Agree50%
Disagree11%
Strongly disagree
Undecided22%
0 10 20 30 40 50 60
Strongly agree
Agree
Undecided
Disagree
Strongly disagree
0 10 20 30 40 50 60Other
Regulatory non-compliance
Power loss
Criminal/terrorist activity
Leakage/pollution
Industrial action
Supply failure
IT failure
Flooding
Fire/explosion
Equipment failure (non-IT)
No major losses in the last two years
0 10 20 30 40 50 60 70 80
Insurer pressure
Other
Regulatory compliance
Shareholder/non-executive director pressure
Client pressure, i.e. 24/7 operating requirements
Competitive advantage
Past experience
Best practice
0 10 20 30 40 50 60
Regulatory compliance
Insurer pressure
Other
Shareholder/non-executive director pressure
Outside pressure (clients, insurers, etc)
Competitive advantage
Past experience
Best practice
0 10 20 30 40 50Credit crunch e�ect
Bad experiences
Con�icting approaches
Con�icting ownership
Programme complexity
Lack of expertise
Lack of time
Lack of resource
Lack of understanding
Con�icting priorities
Lack of executive sponsorship
Lack of budget
0 10 20 30 40 50
Increased regulatory compliance
Improved risk-intelligent decision-making
Reduced insurance cost
Better preparation for known and unforeseen threats
Better understanding of your business
Faster recovery after real incidents
Reduced impact in real incidents
0 10 20 30 40 50 60
Ful�l legal/regulatory obligations
Other
Protect the supply of products/services
Protect our business strategy
Protect sta�
Protect our shareholder interests
Protect our reputation
Protect our revenue and pro�t
Recover critical business processes
0 20 40 60 80 100
Ful�l legal/regulatory obligations
Protect the supply of products/services
Protect our business strategy
Protect sta�
Protect our shareholder interests
Protect our reputation
Protect our revenue and pro�t
Recover critical business processes
Strongly agree
Agree
Disagree
Strongly disagree
Undecided
Strongly agree
Agree
Disagree
Strongly disagree
Undecided
Strongly disagree2%
Agree20%
Disagree7%
Undecided49%
Strongly agree22%
0 20 40 60 80 100
Strongly agree Agree Undecided Disagree Strongly disagree
Manufacturing
Financial services
0 20 40 60 80 100
Over 5000
Under 100
Strongly agree Agree Undecided Disagree Strongly disagree
Strongly agree
Agree
Disagree
Strongly disagree
Undecided
Strongly agree
Agree
Disagree
Strongly disagree
UndecidedStrongly disagree
1%
Agree44%
Disagree19%
Undecided26%
Strongly agree10%
Lack of budget 20%
Lack of executive sponsorship 9%
Con�icting priorities 33%
Lack of understanding 18%
Lack of resource 28%
Lack of time 30%
Lack of expertise 12%
Programme complexity 13%
Con�icting ownership 11%
Con�icting approaches 4%
Bad experiences 3% Other 1%
Credit crunch e�ect 4%
Manufacturing Financial services
Manufacturing Financial services
Manufacturing Financial services
Manufacturing Financial services
Stronglydisagree
0%
Stronglydisagree
0%
BS 25999 fi rm size compliance
Other 14%
Bahrain 2%
Saudi Arabia 16%
Abu Dhabi 16%
Dubai 8%
Germany 8%
Denmark 3%
Portugal 3%
Switzerland 6%
UK 25%
Other 14%
Bahrain 2%
Saudi Arabia 16%
Abu Dhabi 16%
Dubai 8%
Germany 8%
Denmark 3%
Portugal 3%
Switzerland 6%
UK 25%
Over 500027%
1001 - 500031%
501 - 100011%
100 - 50021%
Less than 10010%
Over 500027%
1001 - 500031%
501 - 100011%
100 - 50021%
Less than 10010%
0 5 10 15 20 25
Other
Technology & communications
Retail & consumer
Real estate
Professional services
Power & utilities
Oil & energy
Manufacturing
Government & public services
Financial services
Construction
Strongly agree20%
Agree66%
Disagree3%
Strongly disagree
Undecided11%
Strongly agree20%
Agree66%
Disagree3%
Strongly disagree
Undecided11%
Strongly agree23%
Agree60%
Disagree6%
Strongly disagree
Undecided11%
Strongly agree23%
Agree60%
Disagree6%
Strongly disagree
Undecided11%
Strongly agree29%
Agree54%
Disagree4%
Strongly disagree
Undecided13%
Strongly agree29%
Agree54%
Disagree4%
Strongly disagree
Undecided13%
0 10 20 30 40 50 60 70 80
Very mature
Mature
Non existent
Partial
Basic
Strongly agree17%
Agree50%
Disagree11%
Strongly disagree
Undecided22%
Strongly agree17%
Agree50%
Disagree11%
Strongly disagree
Undecided22%
0 10 20 30 40 50 60
Strongly agree
Agree
Undecided
Disagree
Strongly disagree
0 10 20 30 40 50 60Other
Regulatory non-compliance
Power loss
Criminal/terrorist activity
Leakage/pollution
Industrial action
Supply failure
IT failure
Flooding
Fire/explosion
Equipment failure (non-IT)
No major losses in the last two years
0 10 20 30 40 50 60 70 80
Insurer pressure
Other
Regulatory compliance
Shareholder/non-executive director pressure
Client pressure, i.e. 24/7 operating requirements
Competitive advantage
Past experience
Best practice
0 10 20 30 40 50 60
Regulatory compliance
Insurer pressure
Other
Shareholder/non-executive director pressure
Outside pressure (clients, insurers, etc)
Competitive advantage
Past experience
Best practice
0 10 20 30 40 50Credit crunch e�ect
Bad experiences
Con�icting approaches
Con�icting ownership
Programme complexity
Lack of expertise
Lack of time
Lack of resource
Lack of understanding
Con�icting priorities
Lack of executive sponsorship
Lack of budget
0 10 20 30 40 50
Increased regulatory compliance
Improved risk-intelligent decision-making
Reduced insurance cost
Better preparation for known and unforeseen threats
Better understanding of your business
Faster recovery after real incidents
Reduced impact in real incidents
0 10 20 30 40 50 60
Ful�l legal/regulatory obligations
Other
Protect the supply of products/services
Protect our business strategy
Protect sta�
Protect our shareholder interests
Protect our reputation
Protect our revenue and pro�t
Recover critical business processes
0 20 40 60 80 100
Ful�l legal/regulatory obligations
Protect the supply of products/services
Protect our business strategy
Protect sta�
Protect our shareholder interests
Protect our reputation
Protect our revenue and pro�t
Recover critical business processes
Strongly agree
Agree
Disagree
Strongly disagree
Undecided
Strongly agree
Agree
Disagree
Strongly disagree
Undecided
Strongly disagree2%
Agree20%
Disagree7%
Undecided49%
Strongly agree22%
0 20 40 60 80 100
Strongly agree Agree Undecided Disagree Strongly disagree
Manufacturing
Financial services
0 20 40 60 80 100
Over 5000
Under 100
Strongly agree Agree Undecided Disagree Strongly disagree
Strongly agree
Agree
Disagree
Strongly disagree
Undecided
Strongly agree
Agree
Disagree
Strongly disagree
UndecidedStrongly disagree
1%
Agree44%
Disagree19%
Undecided26%
Strongly agree10%
Lack of budget 20%
Lack of executive sponsorship 9%
Con�icting priorities 33%
Lack of understanding 18%
Lack of resource 28%
Lack of time 30%
Lack of expertise 12%
Programme complexity 13%
Con�icting ownership 11%
Con�icting approaches 4%
Bad experiences 3% Other 1%
Credit crunch e�ect 4%
Manufacturing Financial services
Manufacturing Financial services
Manufacturing Financial services
Manufacturing Financial services
Stronglydisagree
0%
Stronglydisagree
0%

The final question is a culmination of all the previous responses as it looks into whether firms used BCM as a strategic influence and thus its integration into the organisation’s strategy. Most of this report focuses on how BCM is incident-driven through processes, best practice and physical results. BCM maturity should however have a more of an issue-driven focus; on the non-physical attributes such as reputation, compliance and supply chain management.
Results show a shift towards a strategy driven BCM focus, with 54% (up 3%) saying they use BCM as a strategic influence. Only 20% of respondents said that they do not use BCM for strategy (the same as in 2008) and 26% were undecided.
Those organisations using BCM as a strategic influence are often the ones leading their respective industries, with integrated BCM work as part of holistic ERM programmes. This shows organisations where risk considerations influence the location of new sites and the nature of business carried out on those sites. Some businesses are now starting to take account of resilience as one of the factors in measuring value in making investment decisions.
BCM represents an opportunity for organisations, since, when used correctly, BCM can be a useful factor in making strategic decisions. The understanding of the business, the dependencies on key resources, and the impact of change all help towards a strategic understanding of the organisation, and better decision making. When used as part of an integrated ERM approach BCM can achieve its full potential as a strategic influence.
25Marsh
BCM as a strategic influence
BCM as a strategic influence | 11
BCM as a strategic infl uence
Other 14%
Bahrain 2%
Saudi Arabia 16%
Abu Dhabi 16%
Dubai 8%
Germany 8%
Denmark 3%
Portugal 3%
Switzerland 6%
UK 25%
Other 14%
Bahrain 2%
Saudi Arabia 16%
Abu Dhabi 16%
Dubai 8%
Germany 8%
Denmark 3%
Portugal 3%
Switzerland 6%
UK 25%
Over 500027%
1001 - 500031%
501 - 100011%
100 - 50021%
Less than 10010%
Over 500027%
1001 - 500031%
501 - 100011%
100 - 50021%
Less than 10010%
0 5 10 15 20 25
Other
Technology & communications
Retail & consumer
Real estate
Professional services
Power & utilities
Oil & energy
Manufacturing
Government & public services
Financial services
Construction
Strongly agree20%
Agree66%
Disagree3%
Strongly disagree
Undecided11%
Strongly agree20%
Agree66%
Disagree3%
Strongly disagree
Undecided11%
Strongly agree23%
Agree60%
Disagree6%
Strongly disagree
Undecided11%
Strongly agree23%
Agree60%
Disagree6%
Strongly disagree
Undecided11%
Strongly agree29%
Agree54%
Disagree4%
Strongly disagree
Undecided13%
Strongly agree29%
Agree54%
Disagree4%
Strongly disagree
Undecided13%
0 10 20 30 40 50 60 70 80
Very mature
Mature
Non existent
Partial
Basic
Strongly agree17%
Agree50%
Disagree11%
Strongly disagree
Undecided22%
Strongly agree17%
Agree50%
Disagree11%
Strongly disagree
Undecided22%
0 10 20 30 40 50 60
Strongly agree
Agree
Undecided
Disagree
Strongly disagree
0 10 20 30 40 50 60Other
Regulatory non-compliance
Power loss
Criminal/terrorist activity
Leakage/pollution
Industrial action
Supply failure
IT failure
Flooding
Fire/explosion
Equipment failure (non-IT)
No major losses in the last two years
0 10 20 30 40 50 60 70 80
Insurer pressure
Other
Regulatory compliance
Shareholder/non-executive director pressure
Client pressure, i.e. 24/7 operating requirements
Competitive advantage
Past experience
Best practice
0 10 20 30 40 50 60
Regulatory compliance
Insurer pressure
Other
Shareholder/non-executive director pressure
Outside pressure (clients, insurers, etc)
Competitive advantage
Past experience
Best practice
0 10 20 30 40 50Credit crunch e�ect
Bad experiences
Con�icting approaches
Con�icting ownership
Programme complexity
Lack of expertise
Lack of time
Lack of resource
Lack of understanding
Con�icting priorities
Lack of executive sponsorship
Lack of budget
0 10 20 30 40 50
Increased regulatory compliance
Improved risk-intelligent decision-making
Reduced insurance cost
Better preparation for known and unforeseen threats
Better understanding of your business
Faster recovery after real incidents
Reduced impact in real incidents
0 10 20 30 40 50 60
Ful�l legal/regulatory obligations
Other
Protect the supply of products/services
Protect our business strategy
Protect sta�
Protect our shareholder interests
Protect our reputation
Protect our revenue and pro�t
Recover critical business processes
0 20 40 60 80 100
Ful�l legal/regulatory obligations
Protect the supply of products/services
Protect our business strategy
Protect sta�
Protect our shareholder interests
Protect our reputation
Protect our revenue and pro�t
Recover critical business processes
Strongly agree
Agree
Disagree
Strongly disagree
Undecided
Strongly agree
Agree
Disagree
Strongly disagree
Undecided
Strongly disagree2%
Agree20%
Disagree7%
Undecided49%
Strongly agree22%
0 20 40 60 80 100
Strongly agree Agree Undecided Disagree Strongly disagree
Manufacturing
Financial services
0 20 40 60 80 100
Over 5000
Under 100
Strongly agree Agree Undecided Disagree Strongly disagree
Strongly agree
Agree
Disagree
Strongly disagree
Undecided
Strongly agree
Agree
Disagree
Strongly disagree
UndecidedStrongly disagree
1%
Agree44%
Disagree19%
Undecided26%
Strongly agree10%
Lack of budget 20%
Lack of executive sponsorship 9%
Con�icting priorities 33%
Lack of understanding 18%
Lack of resource 28%
Lack of time 30%
Lack of expertise 12%
Programme complexity 13%
Con�icting ownership 11%
Con�icting approaches 4%
Bad experiences 3% Other 1%
Credit crunch e�ect 4%
Manufacturing Financial services
Manufacturing Financial services
Manufacturing Financial services
Manufacturing Financial services
Stronglydisagree
0%
Stronglydisagree
0%