Embed Size (px)
Citation preview
7/24/2019 2010 economic impact study on nonprofit arts and cultural organizations
http://slidepdf.com/reader/full/2010-economic-impact-study-on-nonprofit-arts-and-cultural-organizations 1/43
in THE GREATER CHATTANOOGA AREA, TN
7/24/2019 2010 economic impact study on nonprofit arts and cultural organizations
http://slidepdf.com/reader/full/2010-economic-impact-study-on-nonprofit-arts-and-cultural-organizations 2/43
Arts and Economic Prosperity IV was conducted by
Americans for the Arts, the nation’s leading nonprofit
organization for advancing the arts in America. Established in
1960, we are dedicated to representing and serving local
communities and creating opportunities for every American to
participate in and appreciate all forms of the arts.
Copyright 2012 Americans for the Arts, 1000 Vermont Avenue NW, 6 th Floor, Washington, DC 20005.
Arts & Economic Prosperity if a registered trademark of Americans for the Arts.
Reprinted by permission.
Printed in the United States.
7/24/2019 2010 economic impact study on nonprofit arts and cultural organizations
http://slidepdf.com/reader/full/2010-economic-impact-study-on-nonprofit-arts-and-cultural-organizations 3/43
a e o on en s
The Arts Mean Business 1By Robert L. Lynch, President and CEO, Americans for the Arts
The Economic Impact of the Nonprofit Arts andCulture Industry in the Greater Chattanooga Area 3
Defining Economic Impact 3
Economic Impact of the ENTIRE Nonprofit Arts and Culture
Industry 4
Direct and Indirect Economic Impact: How a Dollar is Re-
Spent in the Economy 4
Economic Impact of Spending by Nonprofit Arts and Culture
ORGANIZATIONS 6
An Economic Impact Beyond Dollars: Volunteerism 7
The Value of In-Kind Contributions to Arts Organizations
7
Economic Impact of Spending by Nonprofit Arts and Culture
AUDIENCES 8
Cultural Tourists Spend More 9
Cultural Events Attract New Dollars and Retain Local
Dollars 10
Conclusion 11
Arts & Economic Prosperity IV Calculator 13
Economic Impact per $100,000 of Spending by Nonprofit
Arts and Culture ORGANIZATIONS 13
Economic Impact per $100,000 of Spending by Nonprofit
Arts and Culture AUDIENCES 14
Making Comparisons with Similar Study Regions 15
About This Study 17
Frequently Used Terms 21
Frequently Asked Questions 23

7/24/2019 2010 economic impact study on nonprofit arts and cultural organizations
http://slidepdf.com/reader/full/2010-economic-impact-study-on-nonprofit-arts-and-cultural-organizations 4/43
Acknowledgments 25

7/24/2019 2010 economic impact study on nonprofit arts and cultural organizations
http://slidepdf.com/reader/full/2010-economic-impact-study-on-nonprofit-arts-and-cultural-organizations 5/43
"Understanding and acknowledging the incredible economic impact of the nonprofit arts
and culture, we must always remember their fundamental value. They foster beauty,
creativity, originality, and vitality. The arts inspire us, sooth us, provoke us, involve us,and connect us. But they also create jobs and contribute to the economy."
— Robert L. LynchPresident and CEOAmericans for the Arts
7/24/2019 2010 economic impact study on nonprofit arts and cultural organizations
http://slidepdf.com/reader/full/2010-economic-impact-study-on-nonprofit-arts-and-cultural-organizations 6/43
The Arts Mean BusinessBy Robert L. Lynch, President and CEO, Americans for the Arts
America’s artists and arts organizations live and work in every community from coast-to-coast—
fueling creativity, beautifying our cities, and improving our quality of life. In my travels across thecountry, business and government leaders often talk to me about the challenges of funding the arts
amid shrinking resources and alongside other pressing needs. They worry about jobs and the
economy. Is their region a magnet for attracting and retaining a skilled and innovative
workforce? How well are they competing in the high-stakes race to attract new businesses? The
findings from Arts & Economic Prosperity IV send a clear and welcome message: leaders who care
about community and economic vitality can feel good about choosing to invest in the arts.
Arts & Economic Prosperity IV is our fourth study ofthe nonprofit arts and culture industry’s impact on the
economy. The most comprehensive study of its kindever conducted, it features customized findings on 182study regions representing all 50 states and the Districtof Columbia as well as estimates of economic impactnationally. Despite the economic headwinds that ourcountry faced in 2010, the results are impressive. Nationally, the industry generated $135.2 billiondollars of economic activity—$61.1 billion by thenation’s nonprofit arts and culture organizations inaddition to $74.1 billion in event-related expenditures by their audiences. This economic activity supports 4.1million full-time jobs. Our industry also generates$22.3 billion in revenue to local, state, and federalgovernments every year—a yield well beyond their
collective $4 billion in arts allocations.
Arts and culture organizations are resilient andentrepreneurial businesses. They employ peoplelocally, purchase goods and services from within thecommunity, and market and promote their regions. Artsorganizations are rooted locally; these are jobs thatcannot be shipped overseas. Like most industries, theGreat Recession left a measurable financial impact onthe arts—erasing the gains made during the pre-recession years, and leaving 2010 expenditures three percent behind their 2005 levels. The biggest effect ofthe recession was on attendance and audiencespending. Inevitably, as people lost jobs and worried
about losing their houses, arts attendance—likeattendance to sports events and leisure travel—wanedas well. Yet, even in a down economy, somecommunities saw an increase in their arts spending andemployment. As the economy rebounds, the arts arewell poised for growth. They are already producingnew and exciting work—performances and exhibitionsand festivals that entertain, inspire, and attractaudiences.
Arts & Economic Prosperity IV shows that arts andculture organizations leverage additional event-related
spending by their audiences that pumps revenue intothe local economy. When patrons attend an arts eventthey may pay for parking, eat dinner at a restaurant,shop in local retail stores, and have dessert on the wayhome. Based on the 151,802 audience-interceptsurveys conducted for this study, the typical artsattendee spends $24.60 per person, per event, beyondthe cost of admission.
Communities that draw cultural tourists experience anadditional boost of economic activity. Tourism industryresearch has repeatedly demonstrated that arts touristsstay longer and spend more than the averagetraveler. Arts & Economic Prosperity IV reflects those
findings: 32 percent of attendees live outside thecounty in which the arts event took place, and theirevent-related spending is more than twice that of theirlocal counterparts (nonlocal: $39.96 vs. local: $17.42).The message is clear: a vibrant arts community notonly keeps residents and their discretionary spendingclose to home, it also attracts visitors who spendmoney and help local businesses thrive.
Arts & Economic Prosperity IV demonstrates thatAmerica’s arts industry is not only resilient in times ofeconomic uncertainty, but is also a key component toour nation’s economic recovery and future prosperity.Business and elected leaders need not feel that a choice
must be made between arts funding and economic prosperity. This study proves that they can choose both. Nationally, as well as locally, the arts mean business.
Arts & Economic Prosperity IV | Americans for the Arts 1

7/24/2019 2010 economic impact study on nonprofit arts and cultural organizations
http://slidepdf.com/reader/full/2010-economic-impact-study-on-nonprofit-arts-and-cultural-organizations 7/43
7/24/2019 2010 economic impact study on nonprofit arts and cultural organizations
http://slidepdf.com/reader/full/2010-economic-impact-study-on-nonprofit-arts-and-cultural-organizations 8/43
3
"As all budgets—local and national, public and private—continue to
reel from the effects of the economic downturn, some may perceive the
arts as an unaffordable luxury reserved for only the most prosperous
times. Fortunately, this rigorous report offers evidence that the
nonprofit arts industry provides not just cultural benefits to our
communities, but also makes significant positive economic
contributions to the nation’s financial well being regardless of the
overall state of the economy. This certainly is something to applaud."
— Jonathan Spector
President & CEOThe Conference Board
7/24/2019 2010 economic impact study on nonprofit arts and cultural organizations
http://slidepdf.com/reader/full/2010-economic-impact-study-on-nonprofit-arts-and-cultural-organizations 9/43
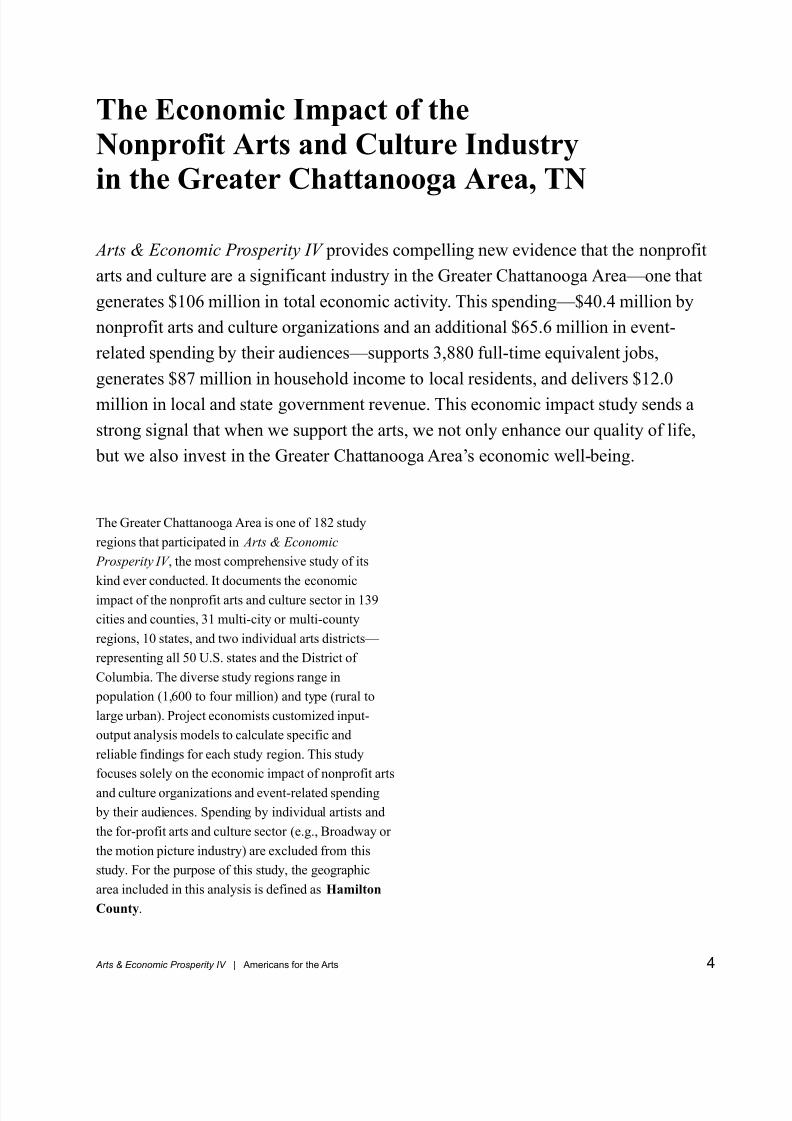
The Economic Impact of the
Nonprofit Arts and Culture Industryin the Greater Chattanooga Area, TN
Arts & Economic Prosperity IV provides compelling new evidence that the nonprofit
arts and culture are a significant industry in the Greater Chattanooga Area—one that
generates $106 million in total economic activity. This spending—$40.4 million by
nonprofit arts and culture organizations and an additional $65.6 million in event-
related spending by their audiences—supports 3,880 full-time equivalent jobs,
generates $87 million in household income to local residents, and delivers $12.0
million in local and state government revenue. This economic impact study sends a
strong signal that when we support the arts, we not only enhance our quality of life,
but we also invest in the Greater Chattanooga Area’s economic well-being.
The Greater Chattanooga Area is one of 182 study
regions that participated in Arts & Economic
Prosperity IV , the most comprehensive study of its
kind ever conducted. It documents the economic
impact of the nonprofit arts and culture sector in 139
cities and counties, 31 multi-city or multi-county
regions, 10 states, and two individual arts districts—
representing all 50 U.S. states and the District of
Columbia. The diverse study regions range in
population (1,600 to four million) and type (rural to
large urban). Project economists customized input-
output analysis models to calculate specific and
reliable findings for each study region. This study
focuses solely on the economic impact of nonprofit arts
and culture organizations and event-related spending
by their audiences. Spending by individual artists and
the for-profit arts and culture sector (e.g., Broadway or
the motion picture industry) are excluded from this
study. For the purpose of this study, the geographic
area included in this analysis is defined as Hamilton
County.
Arts & Economic Prosperity IV | Americans for the Arts 4
7/24/2019 2010 economic impact study on nonprofit arts and cultural organizations
http://slidepdf.com/reader/full/2010-economic-impact-study-on-nonprofit-arts-and-cultural-organizations 10/43
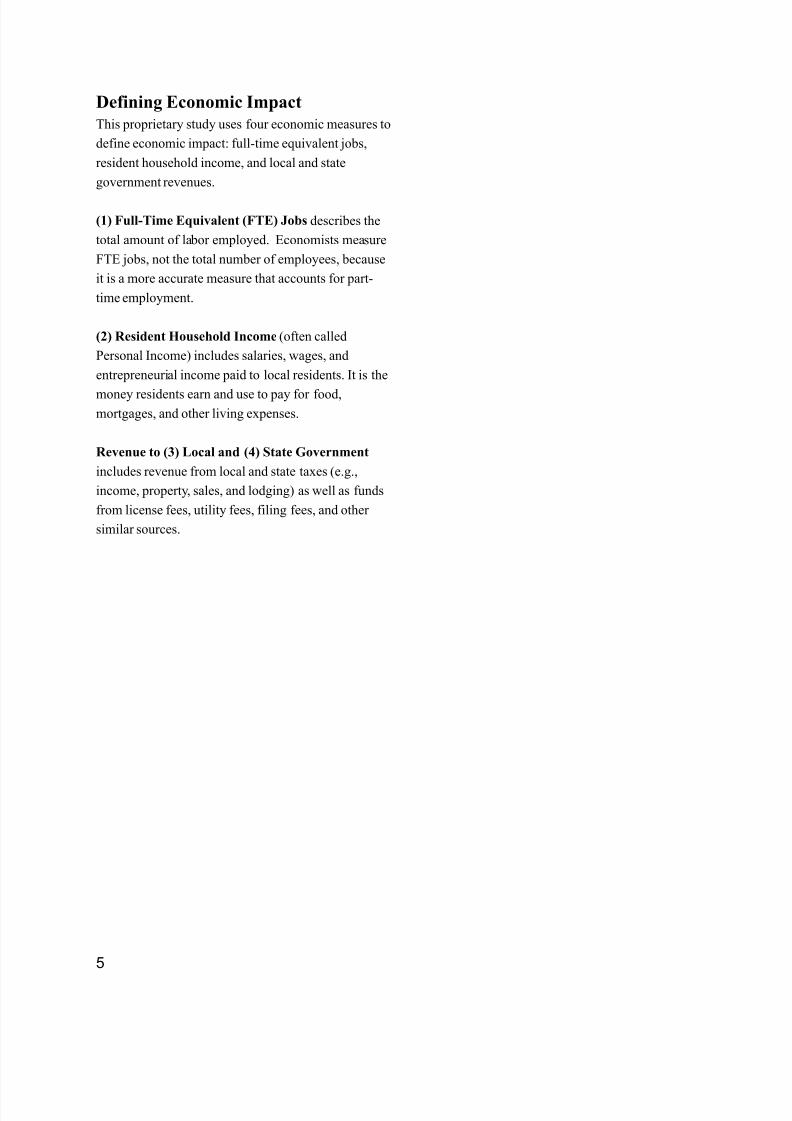
Defining Economic Impact
This proprietary study uses four economic measures to
define economic impact: full-time equivalent jobs,
resident household income, and local and state
government revenues.
(1) Full-Time Equivalent (FTE) Jobs describes the
total amount of labor employed. Economists measure
FTE jobs, not the total number of employees, because
it is a more accurate measure that accounts for part-
time employment.
(2) Resident Household Income (often called
Personal Income) includes salaries, wages, and
entrepreneurial income paid to local residents. It is the
money residents earn and use to pay for food,mortgages, and other living expenses.
Revenue to (3) Local and (4) State Government
includes revenue from local and state taxes (e.g.,
income, property, sales, and lodging) as well as funds
from license fees, utility fees, filing fees, and other
similar sources.
5
7/24/2019 2010 economic impact study on nonprofit arts and cultural organizations
http://slidepdf.com/reader/full/2010-economic-impact-study-on-nonprofit-arts-and-cultural-organizations 11/43
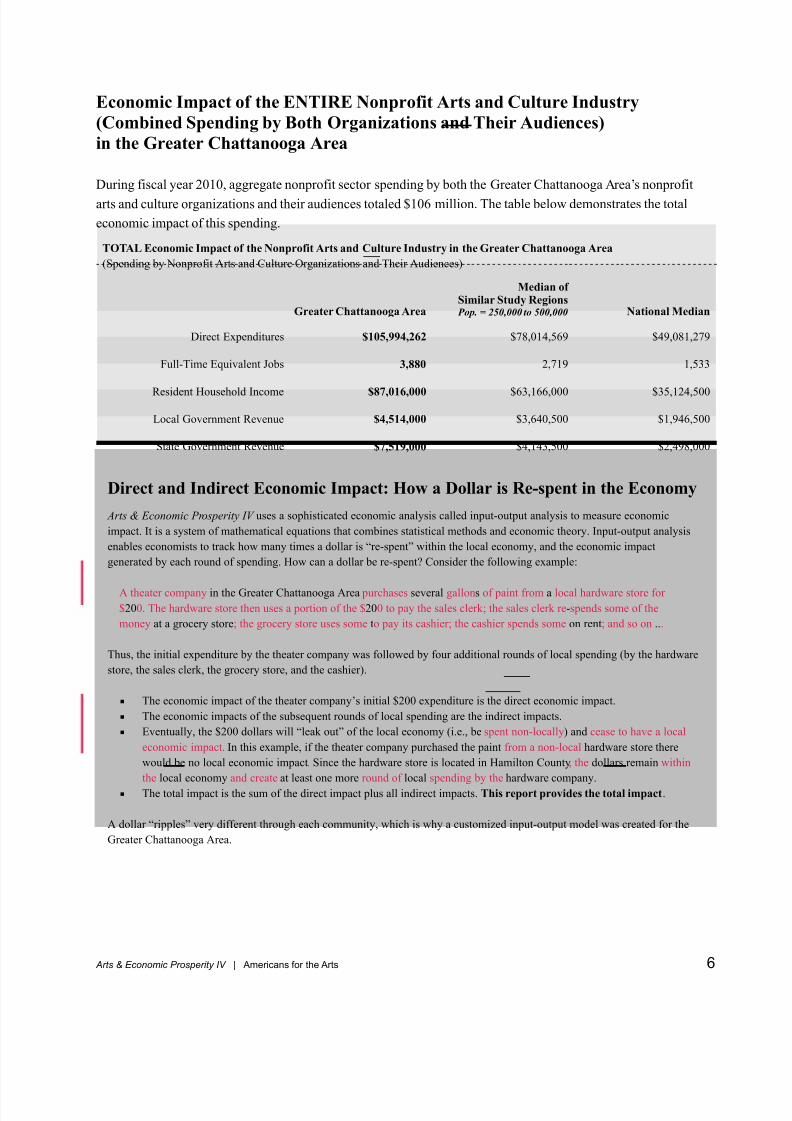
Economic Impact of the ENTIRE Nonprofit Arts and Culture Industry
(Combined Spending by Both Organizations and Their Audiences)
in the Greater Chattanooga Area
During fiscal year 2010, aggregate nonprofit sector spending by both the Greater Chattanooga Area’s nonprofit
arts and culture organizations and their audiences totaled $106 million. The table below demonstrates the total
economic impact of this spending.
Direct and Indirect Economic Impact: How a Dollar is Re-spent in the Economy
Arts & Economic Prosperity IV uses a sophisticated economic analysis called input-output analysis to measure economic
impact. It is a system of mathematical equations that combines statistical methods and economic theory. Input-output analysis
enables economists to track how many times a dollar is “re-spent” within the local economy, and the economic impact
generated by each round of spending. How can a dollar be re-spent? Consider the following example:
A theater company in the Greater Chattanooga Area purchases several gallons of paint from a local hardware store for
$200. The hardware store then uses a portion of the $200 to pay the sales clerk; the sales clerk re-spends some of the
money at a grocery store; the grocery store uses some to pay its cashier; the cashier spends some on rent; and so on ...
Thus, the initial expenditure by the theater company was followed by four additional rounds of local spending (by the hardware
store, the sales clerk, the grocery store, and the cashier).
# The economic impact of the theater company’s initial $200 expenditure is the direct economic impact.
# The economic impacts of the subsequent rounds of local spending are the indirect impacts.
# Eventually, the $200 dollars will “leak out” of the local economy (i.e., be spent non-locally) and cease to have a local
economic impact. In this example, if the theater company purchased the paint from a non-local hardware store there
would be no local economic impact. Since the hardware store is located in Hamilton County, the dollars remain within
the local economy and create at least one more round of local spending by the hardware company.
# The total impact is the sum of the direct impact plus all indirect impacts. This report provides the total impact.
A dollar “ripples” very different through each community, which is why a customized input-output model was created for the
Greater Chattanooga Area.
TOTAL Economic Impact of the Nonprofit Arts and Culture Industry in the Greater Chattanooga Area
(Spending by Nonprofit Arts and Culture Organizations and Their Audiences)
Greater Chattanooga Area
Median of Similar Study Regions Pop. = 250,000 to 500,000 National Median
Direct Expenditures $105,994,262 $78,014,569 $49,081,279
Full-Time Equivalent Jobs 3,880 2,719 1,533
Resident Household Income $87,016,000 $63,166,000 $35,124,500
Local Government Revenue $4,514,000 $3,640,500 $1,946,500
State Government Revenue $7,519,000 $4,143,500 $2,498,000
Arts & Economic Prosperity IV | Americans for the Arts 6
7/24/2019 2010 economic impact study on nonprofit arts and cultural organizations
http://slidepdf.com/reader/full/2010-economic-impact-study-on-nonprofit-arts-and-cultural-organizations 12/43
7
"Mayors understand the connection between the arts industry and city
revenues. Arts activity creates thousands of direct and indirect jobs andgenerates billions in government and business revenues. The arts also
make our cities destinations for tourists, help attract and retain
businesses, and play an important role in the economic revitalization of
cities and the vibrancy of our neighborhoods."
— Philadelphia Mayor Michael A. Nutter
President, The United States Conference of Mayors 2012–2013
"Many businesses support the arts across the country because they
intuitively understand that the arts matter, so it is great to get the
facts and a clearer understanding of the links between the arts and
economic prosperity."
— Stephen Jordan, Executive Director
Business Civic Leadership CenterU.S. Chamber of Commerce
7/24/2019 2010 economic impact study on nonprofit arts and cultural organizations
http://slidepdf.com/reader/full/2010-economic-impact-study-on-nonprofit-arts-and-cultural-organizations 13/43
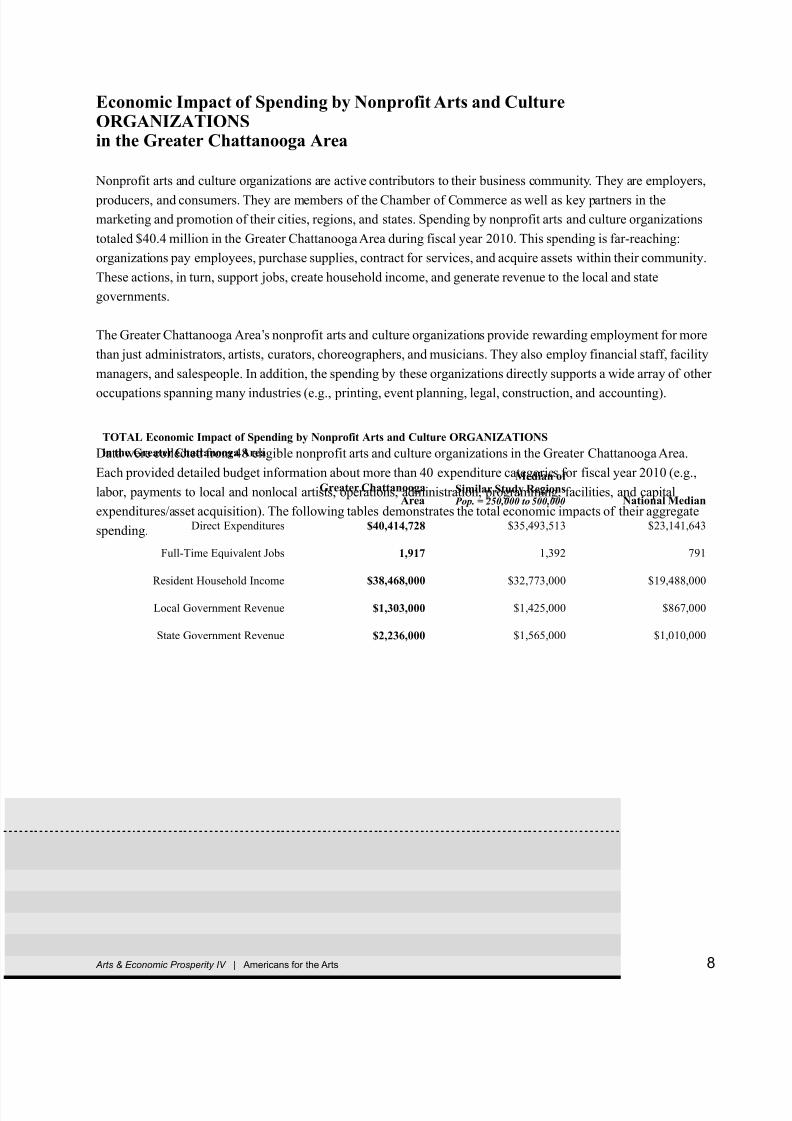
Economic Impact of Spending by Nonprofit Arts and CultureORGANIZATIONSin the Greater Chattanooga Area
Nonprofit arts and culture organizations are active contributors to their business community. They are employers,
producers, and consumers. They are members of the Chamber of Commerce as well as key partners in the
marketing and promotion of their cities, regions, and states. Spending by nonprofit arts and culture organizations
totaled $40.4 million in the Greater Chattanooga Area during fiscal year 2010. This spending is far-reaching:
organizations pay employees, purchase supplies, contract for services, and acquire assets within their community.
These actions, in turn, support jobs, create household income, and generate revenue to the local and state
governments.
The Greater Chattanooga Area’s nonprofit arts and culture organizations provide rewarding employment for more
than just administrators, artists, curators, choreographers, and musicians. They also employ financial staff, facility
managers, and salespeople. In addition, the spending by these organizations directly supports a wide array of other
occupations spanning many industries (e.g., printing, event planning, legal, construction, and accounting).
Data were collected from 48 eligible nonprofit arts and culture organizations in the Greater Chattanooga Area.
Each provided detailed budget information about more than 40 expenditure categories for fiscal year 2010 (e.g.,
labor, payments to local and nonlocal artists, operations, administration, programming, facilities, and capital
expenditures/asset acquisition). The following tables demonstrates the total economic impacts of their aggregate
spending.
TOTAL Economic Impact of Spending by Nonprofit Arts and Culture ORGANIZATIONS
in the Greater Chattanooga Area
Greater ChattanoogaArea
Median of Similar Study Regions Pop. = 250,000 to 500,000 National Median
Direct Expenditures $40,414,728 $35,493,513 $23,141,643
Full-Time Equivalent Jobs 1,917 1,392 791
Resident Household Income $38,468,000 $32,773,000 $19,488,000
Local Government Revenue $1,303,000 $1,425,000 $867,000
State Government Revenue $2,236,000 $1,565,000 $1,010,000
Arts & Economic Prosperity IV | Americans for the Arts 8

7/24/2019 2010 economic impact study on nonprofit arts and cultural organizations
http://slidepdf.com/reader/full/2010-economic-impact-study-on-nonprofit-arts-and-cultural-organizations 14/43
9
7/24/2019 2010 economic impact study on nonprofit arts and cultural organizations
http://slidepdf.com/reader/full/2010-economic-impact-study-on-nonprofit-arts-and-cultural-organizations 15/43
An Economic Impact Beyond Dollars: Volunteerism
Arts & Economic Prosperity IV | Americans for the Arts 10
7/24/2019 2010 economic impact study on nonprofit arts and cultural organizations
http://slidepdf.com/reader/full/2010-economic-impact-study-on-nonprofit-arts-and-cultural-organizations 16/43
While arts volunteers may not have an economic impact as defined in this study, they clearly have an enormous
impact by helping the Greater Chattanooga Area’s nonprofit arts and culture organizations function as a viable
industry. Arts & Economic Prosperity IV reveals a significant contribution to nonprofit arts and culture
organizations as a result of volunteerism. During 2010, a total of 3,323 volunteers donated a total of 67,142 hours
to the Greater Chattanooga Area’s participating nonprofit arts and culture organizations. This represents a donation
of time with an estimated aggregate value of $1,434,153 (Independent Sector estimates the dollar value of the
average 2010 volunteer hour to be $21.36).
The 48 participating organizations reported an average of 20.2 volunteers who volunteered an average of 69.2
hours, for a total of 1,399 hours per organization.
The Value of In-Kind Contributions to Arts Organizations
The participating organizations were asked about the sources and value of their in-kind support. In-kind
contributions are non-cash donations such as materials (e.g., office supplies from a local retailer), facilities (e.g.,rent), and services (e.g., printing costs from a local printer). The 48 participating nonprofit arts and culture
organizations in the Greater Chattanooga Area reported that they received in-kind contributions with an aggregate
value of $493,696 during fiscal year 2010. These contributions were received from a variety of sources including
corporations, individuals, local and state arts agencies, and government.
11
"At Aetna, we encourage our employees to be active volunteers. It’s good
for the employee, good for the community, and a source of corporate pride.
The research also makes clear that employees who are engaged in the
community are more engaged at the workplace—and that is good for
business. Arts organizations are part of the fabric of a healthy community,
so we are delighted to provide incentives to our workers to be regular arts
volunteers."
— Floyd W. Green, IIIHead of Community Relations and Urban MarketingAetna
7/24/2019 2010 economic impact study on nonprofit arts and cultural organizations
http://slidepdf.com/reader/full/2010-economic-impact-study-on-nonprofit-arts-and-cultural-organizations 17/43
Economic Impact of Spending by Nonprofit Arts and Culture AUDIENCES
in the Greater Chattanooga Area
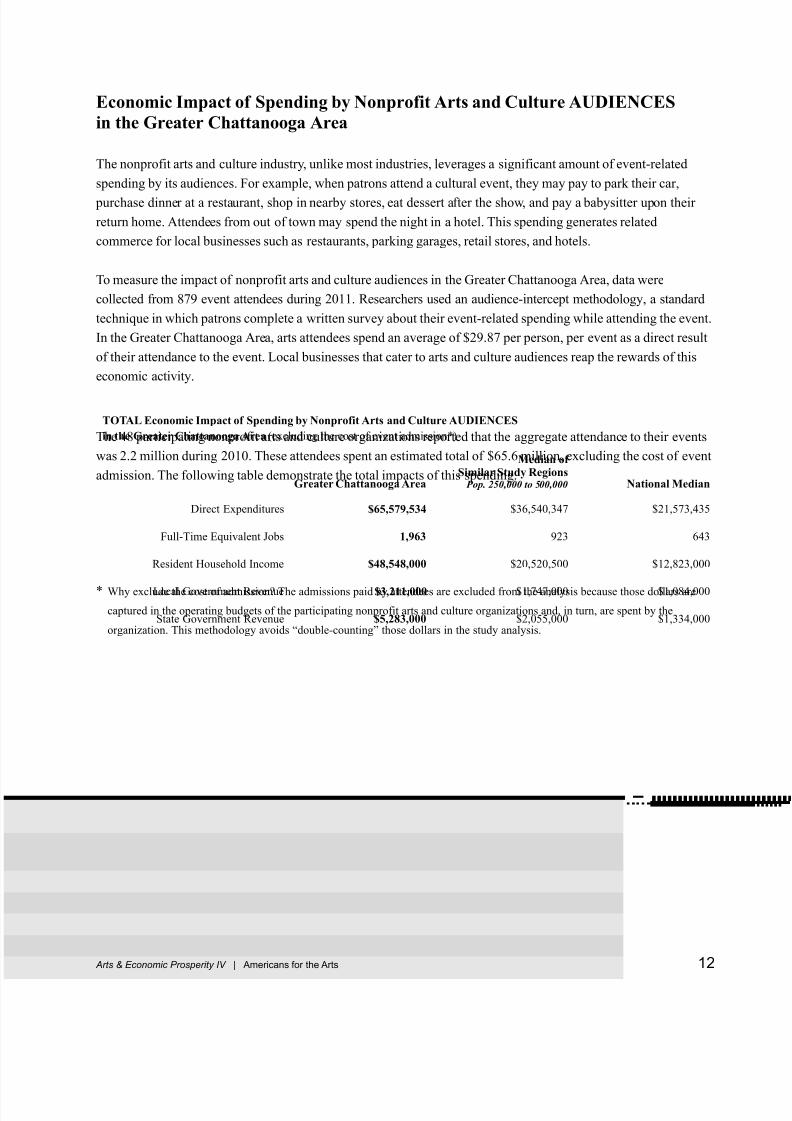
The nonprofit arts and culture industry, unlike most industries, leverages a significant amount of event-related
spending by its audiences. For example, when patrons attend a cultural event, they may pay to park their car,
purchase dinner at a restaurant, shop in nearby stores, eat dessert after the show, and pay a babysitter upon their
return home. Attendees from out of town may spend the night in a hotel. This spending generates related
commerce for local businesses such as restaurants, parking garages, retail stores, and hotels.
To measure the impact of nonprofit arts and culture audiences in the Greater Chattanooga Area, data were
collected from 879 event attendees during 2011. Researchers used an audience-intercept methodology, a standard
technique in which patrons complete a written survey about their event-related spending while attending the event.
In the Greater Chattanooga Area, arts attendees spend an average of $29.87 per person, per event as a direct result
of their attendance to the event. Local businesses that cater to arts and culture audiences reap the rewards of this
economic activity.
The 48 participating nonprofit arts and culture organizations reported that the aggregate attendance to their events
was 2.2 million during 2010. These attendees spent an estimated total of $65.6 million, excluding the cost of event
admission. The following table demonstrate the total impacts of this spending.
* Why exclude the cost of admission? The admissions paid by attendees are excluded from the analysis because those dollars are
captured in the operating budgets of the participating nonprofit arts and culture organizations and, in turn, are spent by the
organization. This methodology avoids “double-counting” those dollars in the study analysis.
TOTAL Economic Impact of Spending by Nonprofit Arts and Culture AUDIENCES
in the Greater Chattanooga Area (excluding the cost of event admission*)
Greater Chattanooga Area
Median of Similar Study Regions
Pop. 250,000 to 500,000 National Median
Direct Expenditures $65,579,534 $36,540,347 $21,573,435
Full-Time Equivalent Jobs 1,963 923 643
Resident Household Income $48,548,000 $20,520,500 $12,823,000
Local Government Revenue $3,211,000 $1,747,000 $1,084,000
State Government Revenue $5,283,000 $2,055,000 $1,334,000
Arts & Economic Prosperity IV | Americans for the Arts 12

7/24/2019 2010 economic impact study on nonprofit arts and cultural organizations
http://slidepdf.com/reader/full/2010-economic-impact-study-on-nonprofit-arts-and-cultural-organizations 18/43
Cultural Tourists Spend More
The 879 audience survey respondents were asked to provide the ZIP code of their primary residence, enabling
researchers to determine which attendees were local residents (live within Hamilton County) and which were non-
residents (live outside Hamilton County). In the Greater Chattanooga Area, researchers estimate that 64.6 percent
of the 2.2 million nonprofit arts attendees were residents; 35.4 percent were non-residents.
Non-resident attendees spend an average of 75 percent more per person than local attendees ($41.39 vs. $23.61) as
a result of their attendance to cultural events. As would be expected from a traveler, higher spending was typically
found in the categories of lodging, meals, and transportation. When a community attracts cultural tourists, it
harnesses significant economic rewards.
13
7/24/2019 2010 economic impact study on nonprofit arts and cultural organizations
http://slidepdf.com/reader/full/2010-economic-impact-study-on-nonprofit-arts-and-cultural-organizations 19/43
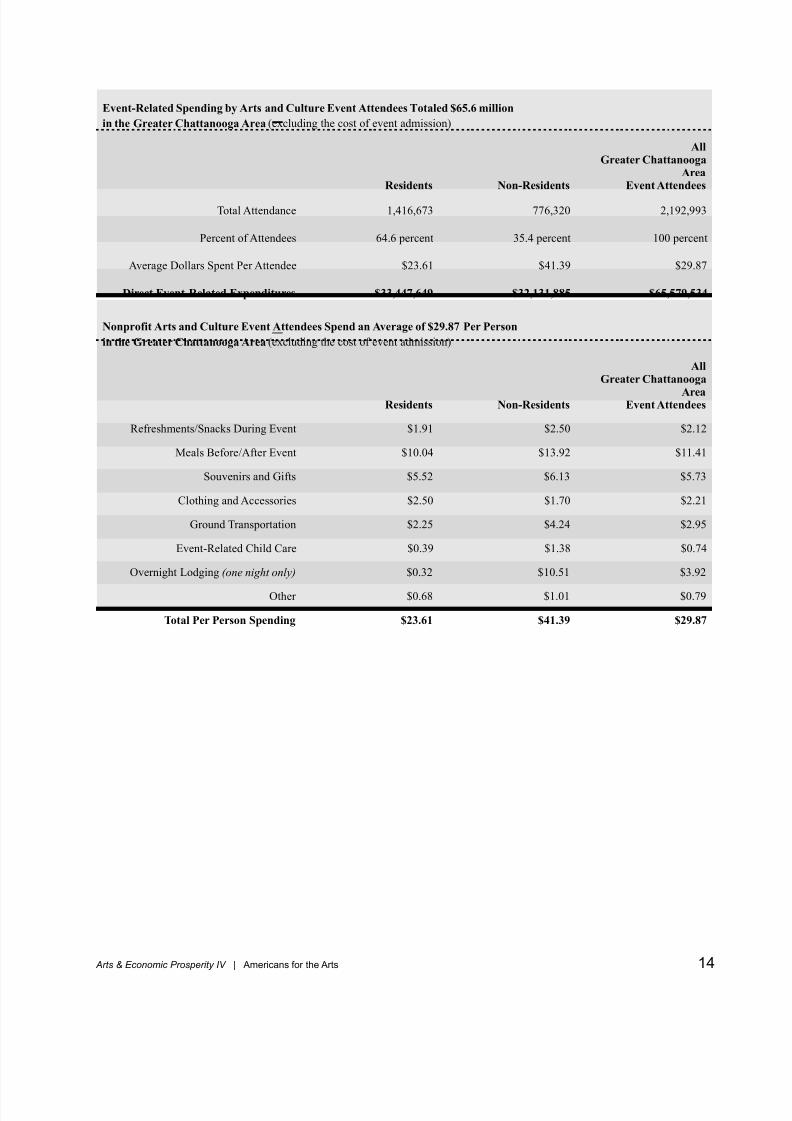
Event-Related Spending by Arts and Culture Event Attendees Totaled $65.6 million
in the Greater Chattanooga Area (excluding the cost of event admission)
Residents Non-Residents
AllGreater Chattanooga
AreaEvent Attendees
Total Attendance 1,416,673 776,320 2,192,993
Percent of Attendees 64.6 percent 35.4 percent 100 percent
Average Dollars Spent Per Attendee $23.61 $41.39 $29.87
Direct Event-Related Expenditures $33,447,649 $32,131,885 $65,579,534
Nonprofit Arts and Culture Event Attendees Spend an Average of $29.87 Per Person
in the Greater Chattanooga Area (excluding the cost of event admission)
Residents Non-Residents
AllGreater Chattanooga
AreaEvent Attendees
Refreshments/Snacks During Event $1.91 $2.50 $2.12
Meals Before/After Event $10.04 $13.92 $11.41
Souvenirs and Gifts $5.52 $6.13 $5.73
Clothing and Accessories $2.50 $1.70 $2.21
Ground Transportation $2.25 $4.24 $2.95
Event-Related Child Care $0.39 $1.38 $0.74
Overnight Lodging (one night only) $0.32 $10.51 $3.92
Other $0.68 $1.01 $0.79
Total Per Person Spending $23.61 $41.39 $29.87
Arts & Economic Prosperity IV | Americans for the Arts 14
7/24/2019 2010 economic impact study on nonprofit arts and cultural organizations
http://slidepdf.com/reader/full/2010-economic-impact-study-on-nonprofit-arts-and-cultural-organizations 20/43
Cultural Events Attract New Dollars and Retain Local Dollars
The Greater Chattanooga Area’s nonprofit arts and culture sector provides attractions that draw visitors to the
community. In fact, 74.6 percent of all non-resident survey respondents reported that the primary reason for their
trip was “specifically to attend this arts/cultural event.”
In addition, 11.6 percent of the Greater Chattanooga Area’s non-resident survey respondents reported that they
will spend at least one night away from home in the Greater Chattanooga Area as a direct result of attending the
cultural event. Non-resident attendees who stay overnight in paid lodging spend an average of $164.00 per person
as a result of their attendance—significantly more than the overall per person average for all non-resident
attendees to events in the Greater Chattanooga Area $41.39.
Finally, the audience survey respondents were asked, “If this event were not happening, would you have traveled
to another community to attend a similar cultural experience?”
# 43.6 percent of the Greater Chattanooga Area’s resident cultural attendees report that they would have
traveled to a different community in order to attend a similar cultural experience.
# 57.4 percent of the Greater Chattanooga Area’s non-resident cultural attendees report the same.
These figures demonstrate the economic impact of the nonprofit arts and culture in the purest sense. If a
community does not provide a variety of artistic and cultural experiences, it will fail to attract the new dollars of
cultural tourists. It will also lose the discretionary spending of its local residents who will travel elsewhere to
experience the arts.
Cultural Attendees are Artists!
# 51.9 percent of the Greater Chattanooga Area’s arts attendees report that they actively participate in thecreation of the arts (e.g., sing in a choir, act in a community play, paint or draw, play an instrument).
15
"As a banker, I have visited businesses in almost every city and town in
Oklahoma. There is a visible difference in places with a vibrant arts
community. I see people looking for places to park, stores staying open late,
and restaurants packed with diners … the business day is extended and the
cash registers are ringing."
— Ken Fergeson
Chairman & CEO, NBanC
Past President, American Bankers Association
7/24/2019 2010 economic impact study on nonprofit arts and cultural organizations
http://slidepdf.com/reader/full/2010-economic-impact-study-on-nonprofit-arts-and-cultural-organizations 21/43
Conclusion
The nonprofit arts and culture are a $106 million industry in the Greater Chattanooga
Area—one that supports 3,880 full-time equivalent jobs and generates $12.0 millionin local and state government revenue. Nonprofit arts and culture organizations,
which spend $40.4 million annually, leverage a remarkable $65.6 million in
additional spending by arts and culture audiences—spending that pumps vital revenue
into local restaurants, hotels, retail stores, parking garages, and other businesses. By
demonstrating that investing in the arts and culture yields economic benefits, Arts &
Economic Prosperity IV lays to rest a common misconception: that communities
support the arts and culture at the expense of local economic development. In fact,
they are investing in an industry that supports jobs, generates government revenue,and is a cornerstone of tourism. This report shows conclusively that the arts mean
business!
Arts & Economic Prosperity IV | Americans for the Arts 16
"Disney has a rich legacy in animation, film and storytelling, so naturally
we consider the arts to be an essential part of our business, as well as an
essential element of our communities. We have seen how the arts not
only enrich American life, but also support millions of jobs across the
country, generate billions of dollars in economic impact, and help drive
the family-vacation industry. By investing in the arts, we plant seeds for
the future and make our communities better places to live."
— Meg Crofton, PresidentWalt Disney World Parks & Resorts Operations, U.S. and France

7/24/2019 2010 economic impact study on nonprofit arts and cultural organizations
http://slidepdf.com/reader/full/2010-economic-impact-study-on-nonprofit-arts-and-cultural-organizations 22/43
17
7/24/2019 2010 economic impact study on nonprofit arts and cultural organizations
http://slidepdf.com/reader/full/2010-economic-impact-study-on-nonprofit-arts-and-cultural-organizations 23/43
Arts & Economic Prosperity IV | Americans for the Arts 18
"A vibrant arts environment stimulates and sustains a richer quality
of life and economic health. In Delaware, where the arts are among
our top 10 employers, we see how the arts contribute to the
renaissance of downtown areas, enhance our educational system, and
attract new businesses and residents to the state."
— Governor Jack A. Markell
Chair, National Governors Association
7/24/2019 2010 economic impact study on nonprofit arts and cultural organizations
http://slidepdf.com/reader/full/2010-economic-impact-study-on-nonprofit-arts-and-cultural-organizations 24/43
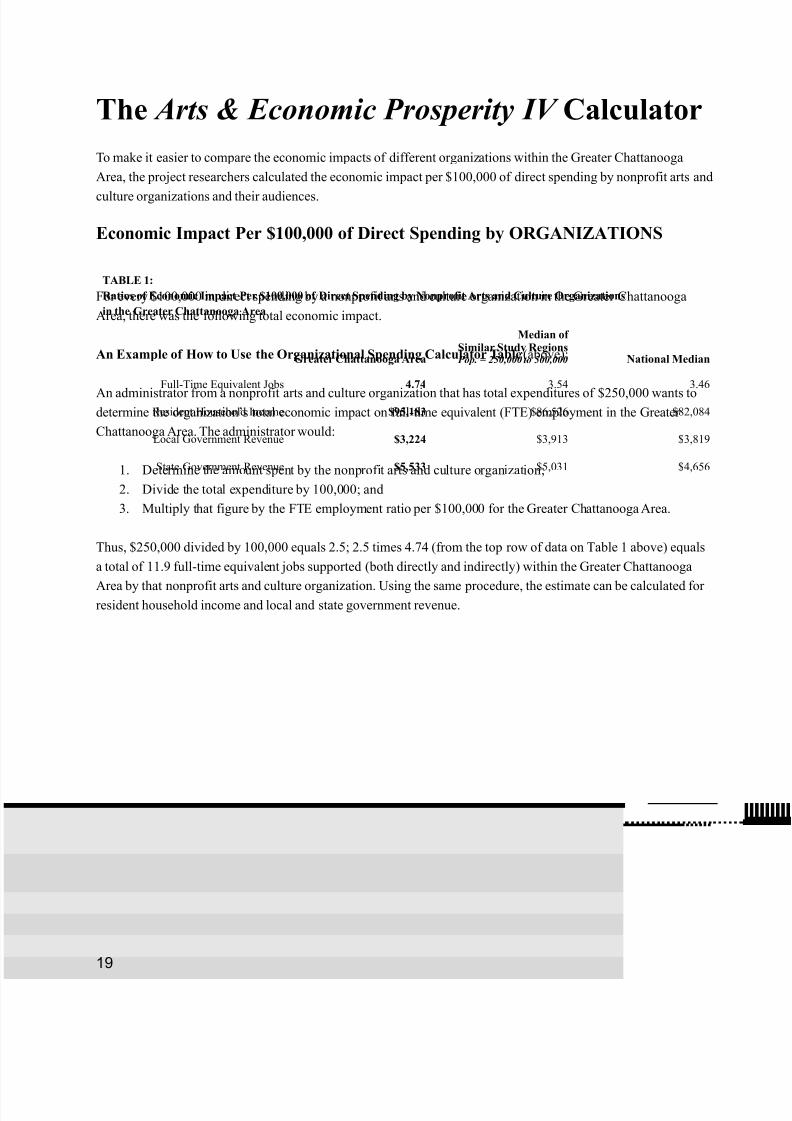
The Arts & Economic Prosperity IV Calculator
To make it easier to compare the economic impacts of different organizations within the Greater Chattanooga
Area, the project researchers calculated the economic impact per $100,000 of direct spending by nonprofit arts and
culture organizations and their audiences.
Economic Impact Per $100,000 of Direct Spending by ORGANIZATIONS
For every $100,000 in direct spending by a nonprofit arts and culture organization in the Greater Chattanooga
Area, there was the following total economic impact.
An Example of How to Use the Organizational Spending Calculator Table (above):
An administrator from a nonprofit arts and culture organization that has total expenditures of $250,000 wants todetermine the organization’s total economic impact on full-time equivalent (FTE) employment in the Greater
Chattanooga Area. The administrator would:
1. Determine the amount spent by the nonprofit arts and culture organization;
2. Divide the total expenditure by 100,000; and
3. Multiply that figure by the FTE employment ratio per $100,000 for the Greater Chattanooga Area.
Thus, $250,000 divided by 100,000 equals 2.5; 2.5 times 4.74 (from the top row of data on Table 1 above) equals
a total of 11.9 full-time equivalent jobs supported (both directly and indirectly) within the Greater Chattanooga
Area by that nonprofit arts and culture organization. Using the same procedure, the estimate can be calculated forresident household income and local and state government revenue.
TABLE 1:
Ratios of Economic Impact Per $100,000 of Direct Spending by Nonprofit Arts and Culture Organizations
in the Greater Chattanooga Area
Greater Chattanooga Area
Median of Similar Study Regions Pop. = 250,000 to 500,000 National Median
Full-Time Equivalent Jobs 4.74 3.54 3.46
Resident Household Income $95,183 $86,526 $82,084
Local Government Revenue $3,224 $3,913 $3,819
State Government Revenue $5,533 $5,031 $4,656
19

7/24/2019 2010 economic impact study on nonprofit arts and cultural organizations
http://slidepdf.com/reader/full/2010-economic-impact-study-on-nonprofit-arts-and-cultural-organizations 25/43
Arts & Economic Prosperity IV | Americans for the Arts 20
7/24/2019 2010 economic impact study on nonprofit arts and cultural organizations
http://slidepdf.com/reader/full/2010-economic-impact-study-on-nonprofit-arts-and-cultural-organizations 26/43
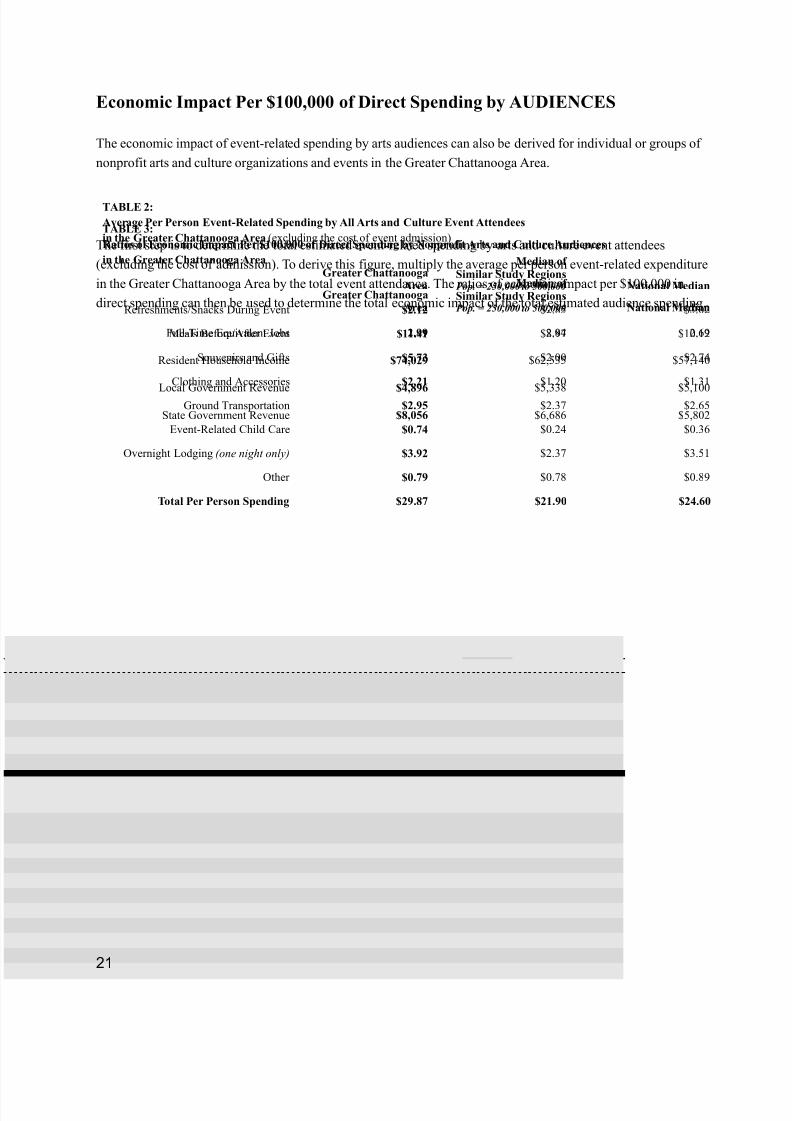
Economic Impact Per $100,000 of Direct Spending by AUDIENCES
The economic impact of event-related spending by arts audiences can also be derived for individual or groups of
nonprofit arts and culture organizations and events in the Greater Chattanooga Area.
The first step is to determine the total estimated event-related spending by arts and culture event attendees
(excluding the cost of admission). To derive this figure, multiply the average per person event-related expenditure
in the Greater Chattanooga Area by the total event attendance. The ratios of economic impact per $100,000 in
direct spending can then be used to determine the total economic impact of the total estimated audience spending.
TABLE 2:
Average Per Person Event-Related Spending by All Arts and Culture Event Attendees
in the Greater Chattanooga Area (excluding the cost of event admission)
Greater ChattanoogaArea
Median of Similar Study Regions Pop. = 250,000 to 500,000 National Median
Refreshments/Snacks During Event $2.12 $2.85 $3.02
Meals Before/After Event $11.41 $8.97 $10.12
Souvenirs and Gifts $5.73 $2.00 $2.74
Clothing and Accessories $2.21 $1.20 $1.31
Ground Transportation $2.95 $2.37 $2.65
Event-Related Child Care $0.74 $0.24 $0.36
Overnight Lodging (one night only) $3.92 $2.37 $3.51
Other $0.79 $0.78 $0.89
Total Per Person Spending $29.87 $21.90 $24.60
TABLE 3:
Ratios of Economic Impact Per $100,000 of Direct Spending by Nonprofit Arts and Culture Audiences
in the Greater Chattanooga Area
Greater ChattanoogaArea
Median of Similar Study Regions Pop. = 250,000 to 500,000 National Median
Full-Time Equivalent Jobs 2.99 2.84 2.69
Resident Household Income $74,029 $62,535 $57,140
Local Government Revenue $4,896 $5,338 $5,100
State Government Revenue $8,056 $6,686 $5,802
21
7/24/2019 2010 economic impact study on nonprofit arts and cultural organizations
http://slidepdf.com/reader/full/2010-economic-impact-study-on-nonprofit-arts-and-cultural-organizations 27/43
An Example of How to Use the Audience Spending Calculator Tables (on the preceding page):
An administrator wants to determine the total economic impact of the 25,000 total attendees to his/her
organization’s nonprofit arts and culture events on full-time equivalent (FTE) employment in the Greater
Chattanooga Area. The administrator would:
1. Determine the total estimated audience spending by multiplying the average per person expenditure for
the Greater Chattanooga Area by the total attendance to nonprofit arts and culture events;
2. Divide the resulting total estimated audience spending by 100,000; and
3. Multiply that figure by the FTE employment ratio per $100,000 for the Greater Chattanooga Area.
Thus, 25,000 times $29.87 (from the bottom row of data on Table 2 on the preceding page) equals $746,750;
$746,750 divided by 100,000 equals 7.47; 7.47 times 2.99 (from the top row of data on Table 3 on the preceding
page) equals a total of 22.3 full-time equivalent jobs supported (both directly and indirectly) within the Greater
Chattanooga Area by that nonprofit arts and culture organization. Using the same procedure, the estimate can be
calculated for resident household income and local and state government revenue.
Making Comparisons with Similar Study Regions
For the purpose of this research project, the geographic region being studied is defined as Hamilton County, TN.
According to the most recent data available from the U.S. Census Bureau, the population of the Greater
Chattanooga Area was estimated to be 337,175 during 2010. For comparison purposes, more than 300 pages of
detailed data tables containing the study results for all 182 participating study regions are located in Appendix B
of the National Statistical Report. The data tables are stratified by population, making it easy to compare the
findings for the Greater Chattanooga Area to the findings for similarly populated study regions (as well as anyother participating study regions that are considered valid comparison cohorts).
All of the national study publications are available both by download (free) and hardcopy (for purchase) at
www.AmericansForTheArts.org/EconomicImpact.
Arts & Economic Prosperity IV | Americans for the Arts 22
7/24/2019 2010 economic impact study on nonprofit arts and cultural organizations
http://slidepdf.com/reader/full/2010-economic-impact-study-on-nonprofit-arts-and-cultural-organizations 28/43
23
"The success of my family’s business depends on finding and cultivating a
creative and innovative workforce. I have witnessed firsthand the power of the
arts in building these business skills. When we participate personally in the arts,
we strengthen our ‘creativity muscles,’ which makes us not just a better ceramicist
or chorus member, but a more creative worker—better able to identify challenges
and innovative business solutions. This is one reason why the arts remain an
important part of my personal and corporate philanthropy."
— Christopher Forbes, Vice Chairman, Forbes, Inc.
7/24/2019 2010 economic impact study on nonprofit arts and cultural organizations
http://slidepdf.com/reader/full/2010-economic-impact-study-on-nonprofit-arts-and-cultural-organizations 29/43
About This Study
The Arts & Economic Prosperity IV study was conducted by Americans for the Arts
to document the economic impact of the nonprofit arts and culture industry in 182communities and regions (139 cities and counties, 31 multi-city or multi-county
regions, and 10 states, and two individual arts districts)—representing all 50 U.S.
states and the District of Columbia.
Arts & Economic Prosperity IV | Americans for the Arts 24
7/24/2019 2010 economic impact study on nonprofit arts and cultural organizations
http://slidepdf.com/reader/full/2010-economic-impact-study-on-nonprofit-arts-and-cultural-organizations 30/43
The diverse communities range in population
(1,600 to four million) and type (rural to urban).
The study focuses solely on nonprofit arts and
culture organizations and their audiences. Public
arts councils and public presenting facilities/
institutions are included as are select programs
embedded within another organization (that have
their own budget and play a substantial role in the
cultural life of the community). The study excludes
spending by individual artists and the for-profit arts
and entertainment sector (e.g., Broadway or the
motion picture industry). Detailed expenditure data
were collected from 9,731 arts and culture
organizations and 151,802 of their attendees. The
project economists, from the Georgia Institute of
Technology, customized input-output analysismodels for each study region to provide specific
and reliable economic impact data about their
nonprofit arts and culture industry, specifically full-
time equivalent jobs, household income, and local
and state government revenue.
The 182 Local, Regional, and
Statewide Study Partners
Americans for the Arts published a Call for
Participants in 2010 seeking communities interestedin participating in the Arts & Economic Prosperity
IV study. Of the more than 200 potential partners
that expressed interest, 182 agreed to participate
and complete four participation criteria: (1) identify
and code the universe of nonprofit arts and culture
organizations in their study region; (2) assist
researchers with the collection of detailed financial
and attendance data from those organizations; (3)
conduct audience-intercept surveys at cultural
events; and (4) pay a modest cost-sharing fee (nocommunity was refused participation for an
inability to pay).
Allied Arts of Greater Chattanooga responded to
the 2010 Call for Participants, and agreed to
complete the required participation criteria.
Surveys of Nonprofit Arts and
Culture ORGANIZATIONS
Each of the 182 study regions attempted to identify
its comprehensive universe of nonprofit arts and
culture organizations using the Urban Institute’s
National Taxonomy of Exempt Entity (NTEE) coding
system as a guideline. The NTEE system—developed
by the National Center for Charitable Statistics at the
Urban Institute—is a definitive classification system
for nonprofit organizations recognized as tax exempt
by the Internal Revenue Code. This system divides
the entire universe of nonprofit organizations into 10
Major categories, including “Arts, Culture, and
Humanities.” The Urban Institute reports that
113,000 nonprofit arts and culture organizations were
registered with the IRS in 2010, up from 94,450 in
2005.
The following NTEE “Arts, Culture, and
Humanities” subcategories were included in this
study:
# A01 – Alliances and Advocacy
# A02 – Management and Technical Assistance
# A03 – Professional Societies and Associations
# A05 – Research Institutes and Public Policy Analysis
# A11 – Single Organization Support
# A12 – Fund Raising and Fund Distribution# A19 – Support (not elsewhere classified)
# A20 – Arts and Culture (general)
# A23 – Cultural and Ethnic Awareness
# A24 – Folk Arts
# A25 – Arts Education
# A26 – Arts and Humanities Councils and Agencies
# A27 – Community Celebrations
# A30 – Media and Communications (general)
# A31 – Film and Video
# A32 – Television
# A33 – Printing and Publishing
# A34 – Radio
# A40 – Visual Arts (general)
# A50 – Museums (general)
# A51 – Art Museums# A52 – Children’s Museums
# A53 – Folk Arts Museums
# A54 – History Museums
# A56 – Natural History and Natural Science Museums
# A57 – Science and Technology Museums
# A60 – Performing Arts (general)
# A61 – Performing Arts Centers
# A62 – Dance
# A63 – Ballet
# A65 – Theatre
Arts & Economic Prosperity IV | Americans for the Arts25
7/24/2019 2010 economic impact study on nonprofit arts and cultural organizations
http://slidepdf.com/reader/full/2010-economic-impact-study-on-nonprofit-arts-and-cultural-organizations 31/43
# A68 – Music
# A69 – Symphony Orchestras
# A6A – Opera
# A6B – Singing and Choral Groups
# A6C – Bands and Ensembles
# A6E – Performing Arts Schools
# A70 – Humanities (general)
# A80 – Historical Organizations (general)
# A82 – Historical Societies and Historic Preservation
# A84 – Commemorative Events
# A90 – Arts Services (general)
# A99 – Arts, Culture, and Humanities (miscellaneous)
In addition to the organization types above, the
study partners were encouraged to include other
types of eligible organizations if they play a
substantial role in the cultural life of the community
or if their primary purpose is to promote
participation in, appreciation for, and understanding
of the visual, performing, folk, and media arts.These include government-owned or government-
operated cultural facilities and institutions,
municipal arts agencies and councils, private
community arts organizations, unincorporated arts
groups, living collections (such as zoos, aquariums,
and botanical gardens), university presenters, and
arts programs that are embedded under the umbrella
of a non-arts organization or facility (such as a
community center or church). In short, if it displays
the characteristics of a nonprofit arts and cultureorganization, it is included. For-profit businesses
and individual artists were excluded from this
study.
Nationally, detailed information was collected from
9,721 eligible organizations about their fiscal year
2010 expenditures in more than 40 expenditure
categories (e.g., labor, local and non-local artists,
operations, materials, facilities, and asset
acquisition) as well as about their event attendance,
in-kind contributions, and volunteerism.
Responding organizations had budgets ranging
from a low of $0 to a high of $239.7 million.
Response rates for the 182 communities averaged
43.2 percent and ranged from 5.3 percent to 100
percent. It is important to note that each study
region’s results are based solely on the actual
survey data collected. No estimates have been made
to account for non-respondents. Therefore, the less-
than-100 percent response rates suggest an
understatement of the economic impact findings in
most of the individual study regions.
In the Greater Chattanooga Area, 48 of the
approximately 218 total eligible nonprofit arts and
culture organizations identified by Allied Arts of
Greater Chattanooga participated in this study—
an overall participation rate of 22 percent.
26
7/24/2019 2010 economic impact study on nonprofit arts and cultural organizations
http://slidepdf.com/reader/full/2010-economic-impact-study-on-nonprofit-arts-and-cultural-organizations 32/43
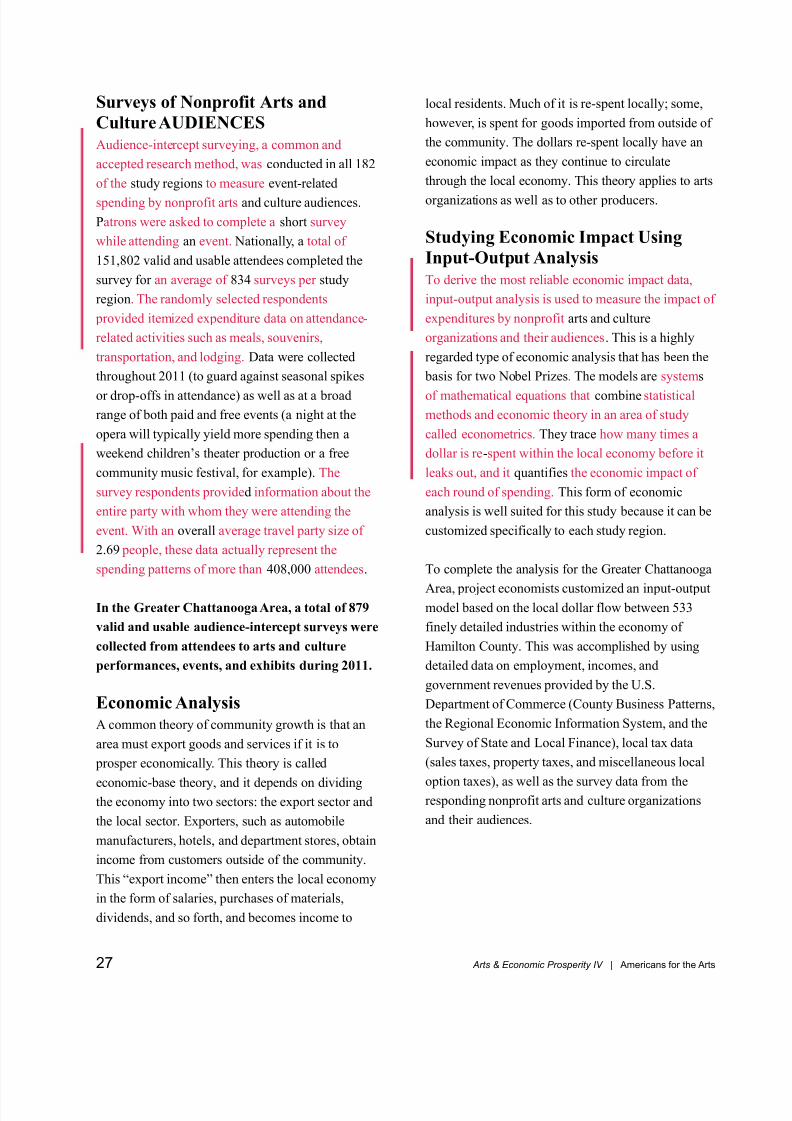
Surveys of Nonprofit Arts and
Culture AUDIENCES
Audience-intercept surveying, a common and
accepted research method, was conducted in all 182
of the study regions to measure event-related
spending by nonprofit arts and culture audiences.
Patrons were asked to complete a short survey
while attending an event. Nationally, a total of
151,802 valid and usable attendees completed the
survey for an average of 834 surveys per study
region. The randomly selected respondents
provided itemized expenditure data on attendance-
related activities such as meals, souvenirs,
transportation, and lodging. Data were collected
throughout 2011 (to guard against seasonal spikes
or drop-offs in attendance) as well as at a broad
range of both paid and free events (a night at the
opera will typically yield more spending then a
weekend children’s theater production or a free
community music festival, for example). The
survey respondents provided information about the
entire party with whom they were attending the
event. With an overall average travel party size of
2.69 people, these data actually represent the
spending patterns of more than 408,000 attendees.
In the Greater Chattanooga Area, a total of 879
valid and usable audience-intercept surveys were
collected from attendees to arts and culture
performances, events, and exhibits during 2011.
Economic Analysis
A common theory of community growth is that an
area must export goods and services if it is to
prosper economically. This theory is called
economic-base theory, and it depends on dividingthe economy into two sectors: the export sector and
the local sector. Exporters, such as automobile
manufacturers, hotels, and department stores, obtain
income from customers outside of the community.
This “export income” then enters the local economy
in the form of salaries, purchases of materials,
dividends, and so forth, and becomes income to
local residents. Much of it is re-spent locally; some,
however, is spent for goods imported from outside of
the community. The dollars re-spent locally have an
economic impact as they continue to circulate
through the local economy. This theory applies to arts
organizations as well as to other producers.
Studying Economic Impact Using
Input-Output Analysis
To derive the most reliable economic impact data,
input-output analysis is used to measure the impact of
expenditures by nonprofit arts and culture
organizations and their audiences. This is a highly
regarded type of economic analysis that has been the
basis for two Nobel Prizes. The models are systems
of mathematical equations that combine statistical
methods and economic theory in an area of study
called econometrics. They trace how many times a
dollar is re-spent within the local economy before it
leaks out, and it quantifies the economic impact of
each round of spending. This form of economic
analysis is well suited for this study because it can be
customized specifically to each study region.
To complete the analysis for the Greater Chattanooga
Area, project economists customized an input-outputmodel based on the local dollar flow between 533
finely detailed industries within the economy of
Hamilton County. This was accomplished by using
detailed data on employment, incomes, and
government revenues provided by the U.S.
Department of Commerce (County Business Patterns,
the Regional Economic Information System, and the
Survey of State and Local Finance), local tax data
(sales taxes, property taxes, and miscellaneous local
option taxes), as well as the survey data from theresponding nonprofit arts and culture organizations
and their audiences.
Arts & Economic Prosperity IV | Americans for the Arts27
7/24/2019 2010 economic impact study on nonprofit arts and cultural organizations
http://slidepdf.com/reader/full/2010-economic-impact-study-on-nonprofit-arts-and-cultural-organizations 33/43
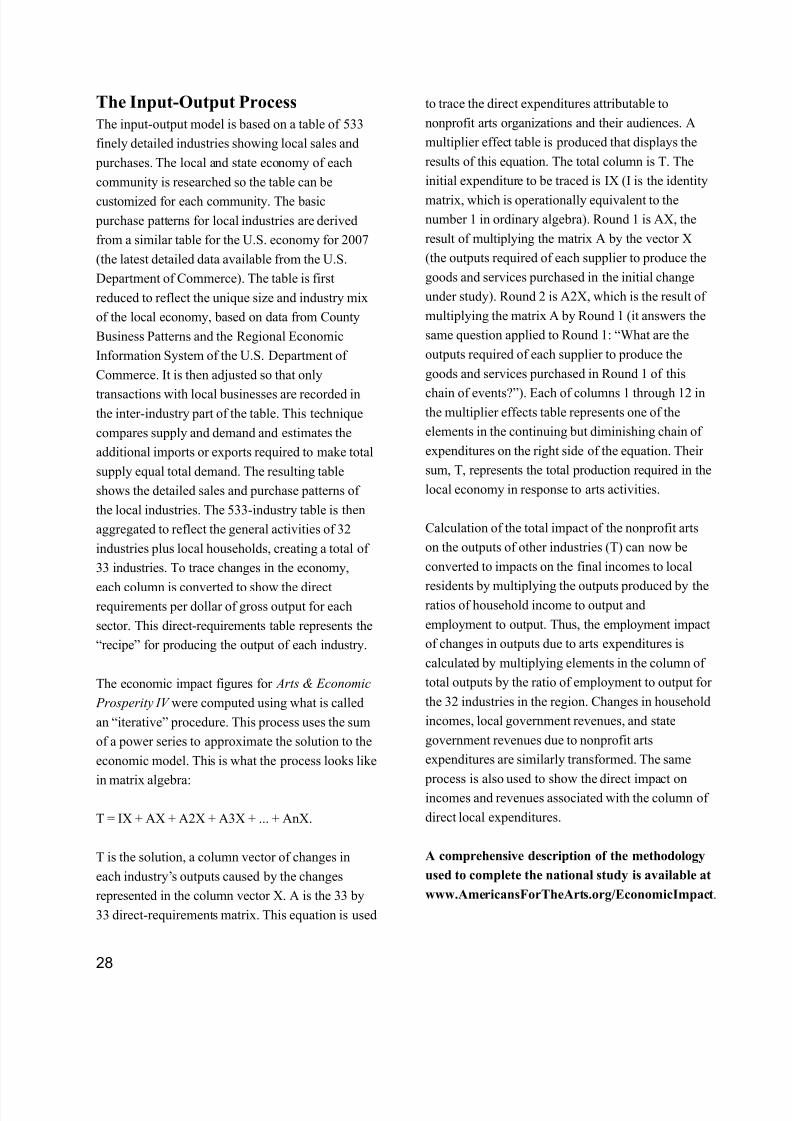
The Input-Output Process
The input-output model is based on a table of 533
finely detailed industries showing local sales and
purchases. The local and state economy of each
community is researched so the table can be
customized for each community. The basic
purchase patterns for local industries are derived
from a similar table for the U.S. economy for 2007
(the latest detailed data available from the U.S.
Department of Commerce). The table is first
reduced to reflect the unique size and industry mix
of the local economy, based on data from County
Business Patterns and the Regional Economic
Information System of the U.S. Department of
Commerce. It is then adjusted so that only
transactions with local businesses are recorded inthe inter-industry part of the table. This technique
compares supply and demand and estimates the
additional imports or exports required to make total
supply equal total demand. The resulting table
shows the detailed sales and purchase patterns of
the local industries. The 533-industry table is then
aggregated to reflect the general activities of 32
industries plus local households, creating a total of
33 industries. To trace changes in the economy,
each column is converted to show the directrequirements per dollar of gross output for each
sector. This direct-requirements table represents the
“recipe” for producing the output of each industry.
The economic impact figures for Arts & Economic
Prosperity IV were computed using what is called
an “iterative” procedure. This process uses the sum
of a power series to approximate the solution to the
economic model. This is what the process looks like
in matrix algebra:
T = IX + AX + A2X + A3X + ... + AnX.
T is the solution, a column vector of changes in
each industry’s outputs caused by the changes
represented in the column vector X. A is the 33 by
33 direct-requirements matrix. This equation is used
to trace the direct expenditures attributable to
nonprofit arts organizations and their audiences. A
multiplier effect table is produced that displays the
results of this equation. The total column is T. The
initial expenditure to be traced is IX (I is the identity
matrix, which is operationally equivalent to the
number 1 in ordinary algebra). Round 1 is AX, the
result of multiplying the matrix A by the vector X
(the outputs required of each supplier to produce the
goods and services purchased in the initial change
under study). Round 2 is A2X, which is the result of
multiplying the matrix A by Round 1 (it answers the
same question applied to Round 1: “What are the
outputs required of each supplier to produce the
goods and services purchased in Round 1 of this
chain of events?”). Each of columns 1 through 12 inthe multiplier effects table represents one of the
elements in the continuing but diminishing chain of
expenditures on the right side of the equation. Their
sum, T, represents the total production required in the
local economy in response to arts activities.
Calculation of the total impact of the nonprofit arts
on the outputs of other industries (T) can now be
converted to impacts on the final incomes to local
residents by multiplying the outputs produced by theratios of household income to output and
employment to output. Thus, the employment impact
of changes in outputs due to arts expenditures is
calculated by multiplying elements in the column of
total outputs by the ratio of employment to output for
the 32 industries in the region. Changes in household
incomes, local government revenues, and state
government revenues due to nonprofit arts
expenditures are similarly transformed. The same
process is also used to show the direct impact onincomes and revenues associated with the column of
direct local expenditures.
A comprehensive description of the methodology
used to complete the national study is available at
www.AmericansForTheArts.org/EconomicImpact.
28
7/24/2019 2010 economic impact study on nonprofit arts and cultural organizations
http://slidepdf.com/reader/full/2010-economic-impact-study-on-nonprofit-arts-and-cultural-organizations 34/43
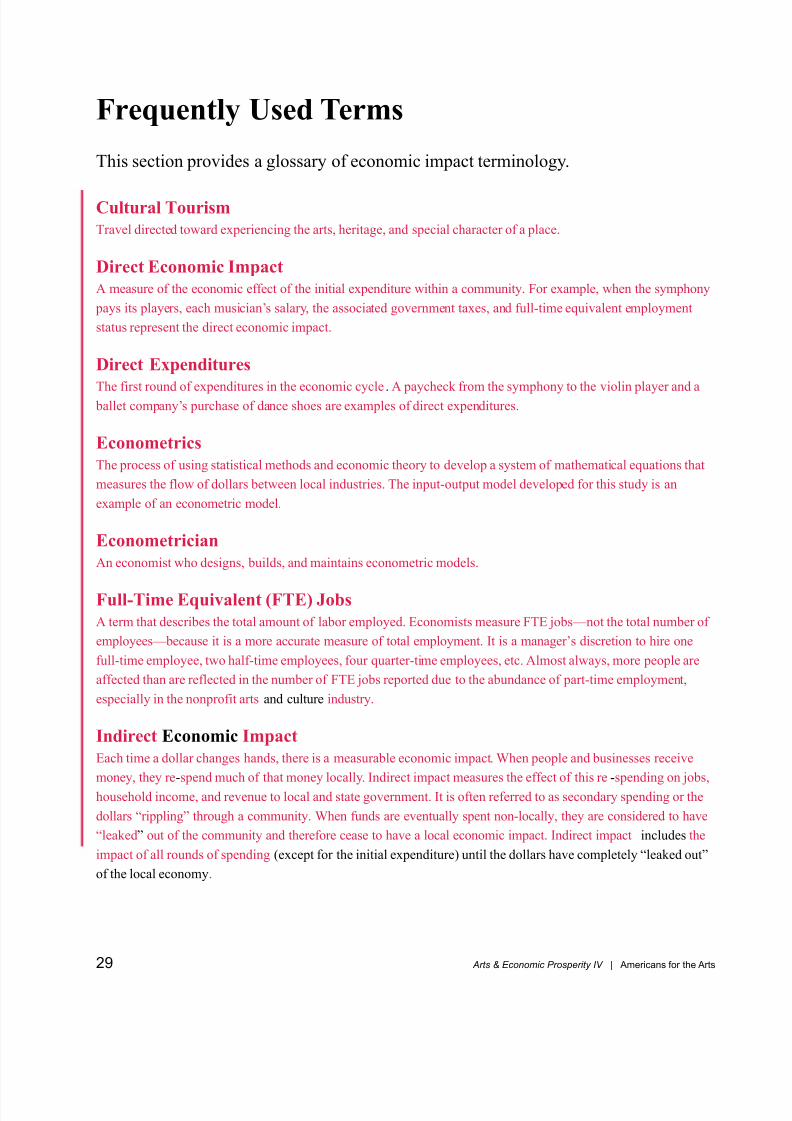
Frequently Used Terms
This section provides a glossary of economic impact terminology.
Cultural Tourism
Travel directed toward experiencing the arts, heritage, and special character of a place.
Direct Economic Impact
A measure of the economic effect of the initial expenditure within a community. For example, when the symphony
pays its players, each musician’s salary, the associated government taxes, and full-time equivalent employment
status represent the direct economic impact.
Direct Expenditures
The first round of expenditures in the economic cycle. A paycheck from the symphony to the violin player and a ballet company’s purchase of dance shoes are examples of direct expenditures.
Econometrics
The process of using statistical methods and economic theory to develop a system of mathematical equations that
measures the flow of dollars between local industries. The input-output model developed for this study is an
example of an econometric model.
Econometrician
An economist who designs, builds, and maintains econometric models.
Full-Time Equivalent (FTE) Jobs
A term that describes the total amount of labor employed. Economists measure FTE jobs—not the total number of
employees—because it is a more accurate measure of total employment. It is a manager’s discretion to hire one
full-time employee, two half-time employees, four quarter-time employees, etc. Almost always, more people are
affected than are reflected in the number of FTE jobs reported due to the abundance of part-time employment,
especially in the nonprofit arts and culture industry.
Indirect Economic Impact
Each time a dollar changes hands, there is a measurable economic impact. When people and businesses receive
money, they re-spend much of that money locally. Indirect impact measures the effect of this re-spending on jobs,
household income, and revenue to local and state government. It is often referred to as secondary spending or the
dollars “rippling” through a community. When funds are eventually spent non-locally, they are considered to have
“leaked” out of the community and therefore cease to have a local economic impact. Indirect impact includes the
impact of all rounds of spending (except for the initial expenditure) until the dollars have completely “leaked out”
of the local economy.
Arts & Economic Prosperity IV | Americans for the Arts29
7/24/2019 2010 economic impact study on nonprofit arts and cultural organizations
http://slidepdf.com/reader/full/2010-economic-impact-study-on-nonprofit-arts-and-cultural-organizations 35/43
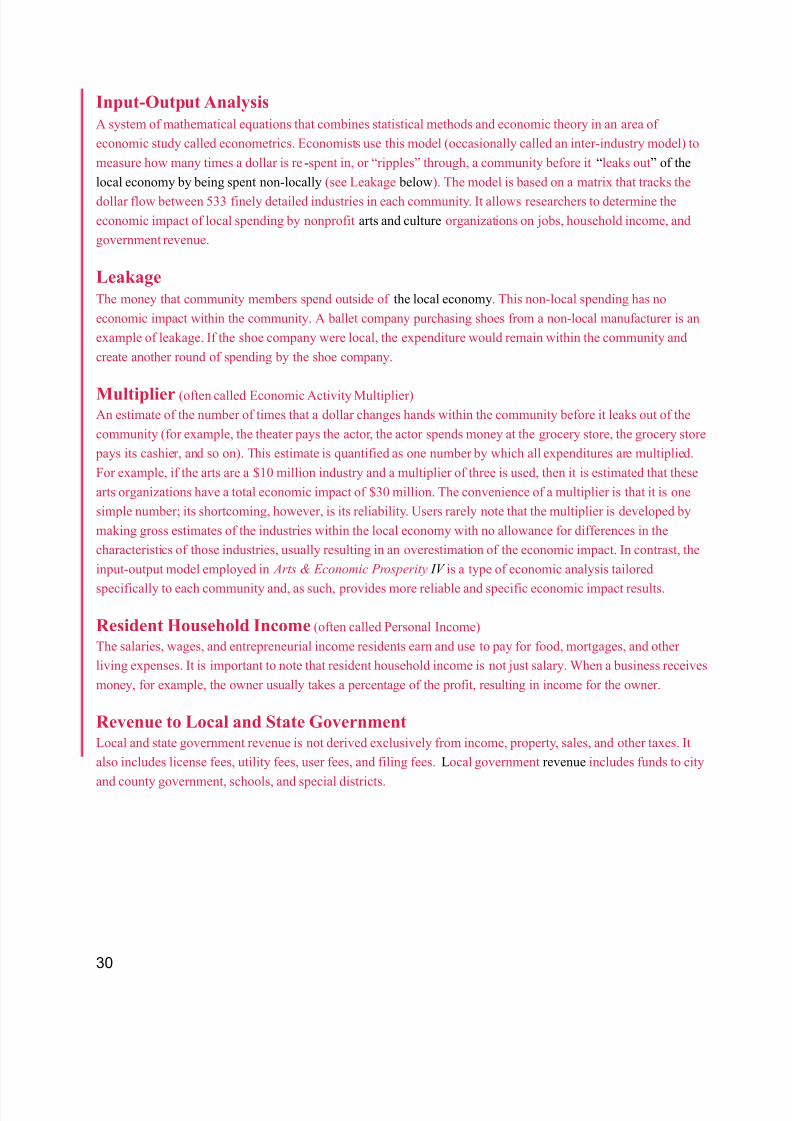
Input-Output Analysis
A system of mathematical equations that combines statistical methods and economic theory in an area of
economic study called econometrics. Economists use this model (occasionally called an inter-industry model) to
measure how many times a dollar is re-spent in, or “ripples” through, a community before it “leaks out” of the
local economy by being spent non-locally (see Leakage below). The model is based on a matrix that tracks the
dollar flow between 533 finely detailed industries in each community. It allows researchers to determine the
economic impact of local spending by nonprofit arts and culture organizations on jobs, household income, and
government revenue.
Leakage
The money that community members spend outside of the local economy. This non-local spending has no
economic impact within the community. A ballet company purchasing shoes from a non-local manufacturer is an
example of leakage. If the shoe company were local, the expenditure would remain within the community and
create another round of spending by the shoe company.
Multiplier (often called Economic Activity Multiplier)
An estimate of the number of times that a dollar changes hands within the community before it leaks out of the
community (for example, the theater pays the actor, the actor spends money at the grocery store, the grocery store
pays its cashier, and so on). This estimate is quantified as one number by which all expenditures are multiplied.
For example, if the arts are a $10 million industry and a multiplier of three is used, then it is estimated that these
arts organizations have a total economic impact of $30 million. The convenience of a multiplier is that it is one
simple number; its shortcoming, however, is its reliability. Users rarely note that the multiplier is developed by
making gross estimates of the industries within the local economy with no allowance for differences in the
characteristics of those industries, usually resulting in an overestimation of the economic impact. In contrast, the
input-output model employed in Arts & Economic Prosperity IV is a type of economic analysis tailored
specifically to each community and, as such, provides more reliable and specific economic impact results.
Resident Household Income (often called Personal Income)
The salaries, wages, and entrepreneurial income residents earn and use to pay for food, mortgages, and other
living expenses. It is important to note that resident household income is not just salary. When a business receives
money, for example, the owner usually takes a percentage of the profit, resulting in income for the owner.
Revenue to Local and State GovernmentLocal and state government revenue is not derived exclusively from income, property, sales, and other taxes. It
also includes license fees, utility fees, user fees, and filing fees. Local government revenue includes funds to city
and county government, schools, and special districts.
30
7/24/2019 2010 economic impact study on nonprofit arts and cultural organizations
http://slidepdf.com/reader/full/2010-economic-impact-study-on-nonprofit-arts-and-cultural-organizations 36/43
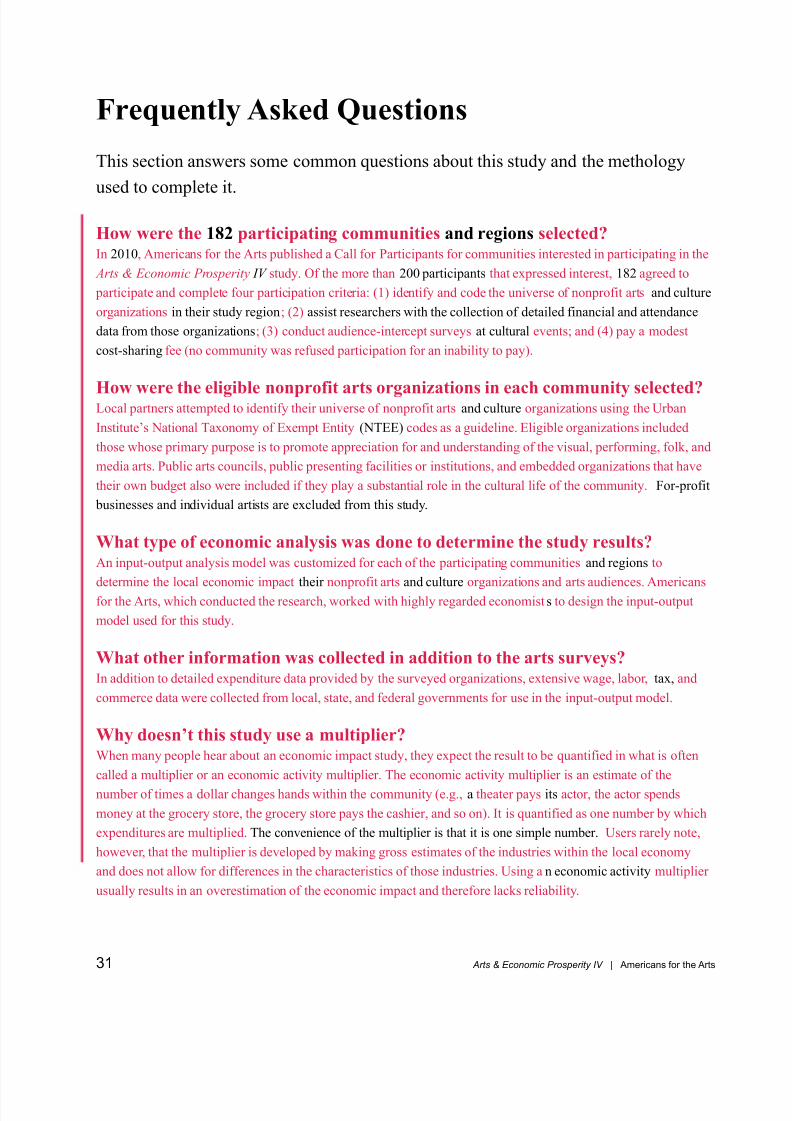
Frequently Asked Questions
This section answers some common questions about this study and the methology
used to complete it.
How were the 182 participating communities and regions selected?In 2010, Americans for the Arts published a Call for Participants for communities interested in participating in the
Arts & Economic Prosperity IV study. Of the more than 200 participants that expressed interest, 182 agreed to
participate and complete four participation criteria: (1) identify and code the universe of nonprofit arts and culture
organizations in their study region; (2) assist researchers with the collection of detailed financial and attendance
data from those organizations; (3) conduct audience-intercept surveys at cultural events; and (4) pay a modest
cost-sharing fee (no community was refused participation for an inability to pay).
How were the eligible nonprofit arts organizations in each community selected?Local partners attempted to identify their universe of nonprofit arts and culture organizations using the Urban
Institute’s National Taxonomy of Exempt Entity (NTEE) codes as a guideline. Eligible organizations included
those whose primary purpose is to promote appreciation for and understanding of the visual, performing, folk, and
media arts. Public arts councils, public presenting facilities or institutions, and embedded organizations that have
their own budget also were included if they play a substantial role in the cultural life of the community. For-profit
businesses and individual artists are excluded from this study.
What type of economic analysis was done to determine the study results?An input-output analysis model was customized for each of the participating communities and regions to
determine the local economic impact their nonprofit arts and culture organizations and arts audiences. Americans
for the Arts, which conducted the research, worked with highly regarded economists to design the input-output
model used for this study.
What other information was collected in addition to the arts surveys?In addition to detailed expenditure data provided by the surveyed organizations, extensive wage, labor, tax, and
commerce data were collected from local, state, and federal governments for use in the input-output model.
Why doesn’t this study use a multiplier?When many people hear about an economic impact study, they expect the result to be quantified in what is often
called a multiplier or an economic activity multiplier. The economic activity multiplier is an estimate of the
number of times a dollar changes hands within the community (e.g., a theater pays its actor, the actor spends
money at the grocery store, the grocery store pays the cashier, and so on). It is quantified as one number by which
expenditures are multiplied. The convenience of the multiplier is that it is one simple number. Users rarely note,
however, that the multiplier is developed by making gross estimates of the industries within the local economy
and does not allow for differences in the characteristics of those industries. Using an economic activity multiplier
usually results in an overestimation of the economic impact and therefore lacks reliability.
Arts & Economic Prosperity IV | Americans for the Arts31
7/24/2019 2010 economic impact study on nonprofit arts and cultural organizations
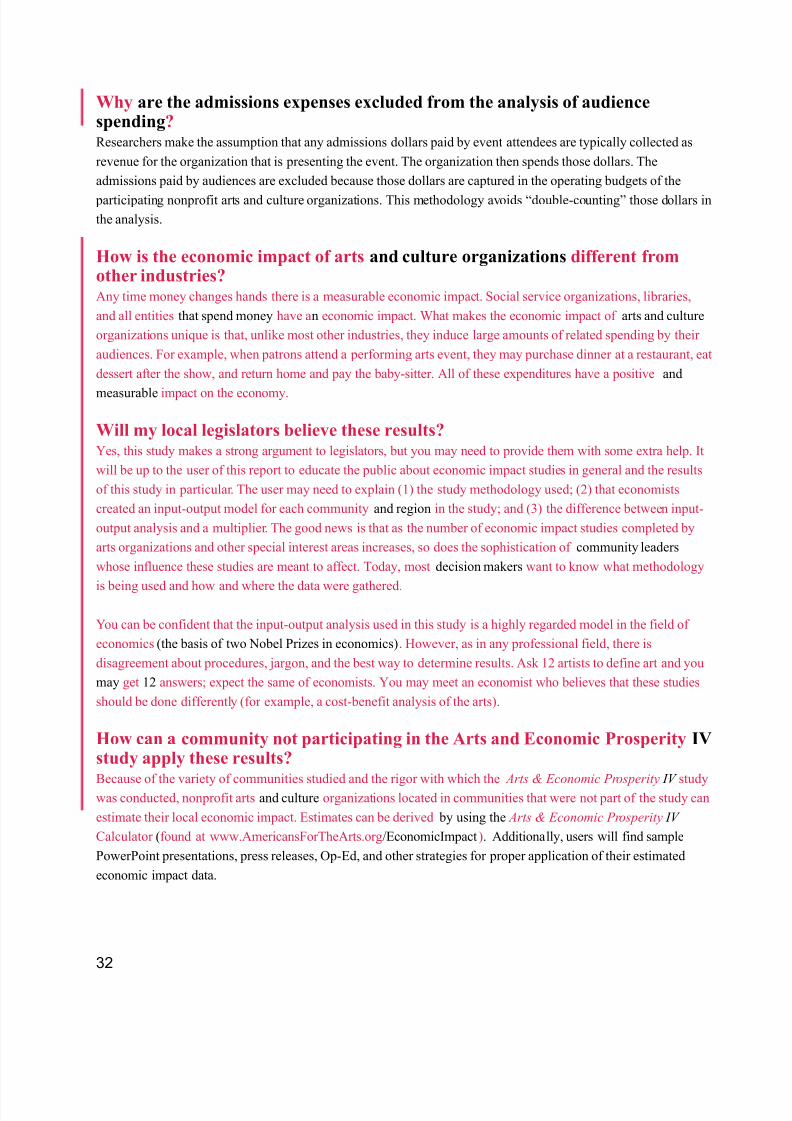
http://slidepdf.com/reader/full/2010-economic-impact-study-on-nonprofit-arts-and-cultural-organizations 37/43
Why are the admissions expenses excluded from the analysis of audiencespending?Researchers make the assumption that any admissions dollars paid by event attendees are typically collected as
revenue for the organization that is presenting the event. The organization then spends those dollars. The
admissions paid by audiences are excluded because those dollars are captured in the operating budgets of the
participating nonprofit arts and culture organizations. This methodology avoids “double-counting” those dollars in
the analysis.
How is the economic impact of arts and culture organizations different fromother industries?Any time money changes hands there is a measurable economic impact. Social service organizations, libraries,
and all entities that spend money have an economic impact. What makes the economic impact of arts and culture
organizations unique is that, unlike most other industries, they induce large amounts of related spending by their
audiences. For example, when patrons attend a performing arts event, they may purchase dinner at a restaurant, eat
dessert after the show, and return home and pay the baby-sitter. All of these expenditures have a positive and
measurable impact on the economy.
Will my local legislators believe these results?Yes, this study makes a strong argument to legislators, but you may need to provide them with some extra help. It
will be up to the user of this report to educate the public about economic impact studies in general and the results
of this study in particular. The user may need to explain (1) the study methodology used; (2) that economists
created an input-output model for each community and region in the study; and (3) the difference between input-
output analysis and a multiplier. The good news is that as the number of economic impact studies completed by
arts organizations and other special interest areas increases, so does the sophistication of community leaders
whose influence these studies are meant to affect. Today, most decision makers want to know what methodology
is being used and how and where the data were gathered.
You can be confident that the input-output analysis used in this study is a highly regarded model in the field of
economics (the basis of two Nobel Prizes in economics). However, as in any professional field, there is
disagreement about procedures, jargon, and the best way to determine results. Ask 12 artists to define art and you
may get 12 answers; expect the same of economists. You may meet an economist who believes that these studies
should be done differently (for example, a cost-benefit analysis of the arts).
How can a community not participating in the Arts and Economic Prosperity IVstudy apply these results?
Because of the variety of communities studied and the rigor with which the Arts & Economic Prosperity IV studywas conducted, nonprofit arts and culture organizations located in communities that were not part of the study can
estimate their local economic impact. Estimates can be derived by using the Arts & Economic Prosperity IV
Calculator (found at www.AmericansForTheArts.org/EconomicImpact). Additionally, users will find sample
PowerPoint presentations, press releases, Op-Ed, and other strategies for proper application of their estimated
economic impact data.
32
7/24/2019 2010 economic impact study on nonprofit arts and cultural organizations
http://slidepdf.com/reader/full/2010-economic-impact-study-on-nonprofit-arts-and-cultural-organizations 38/43
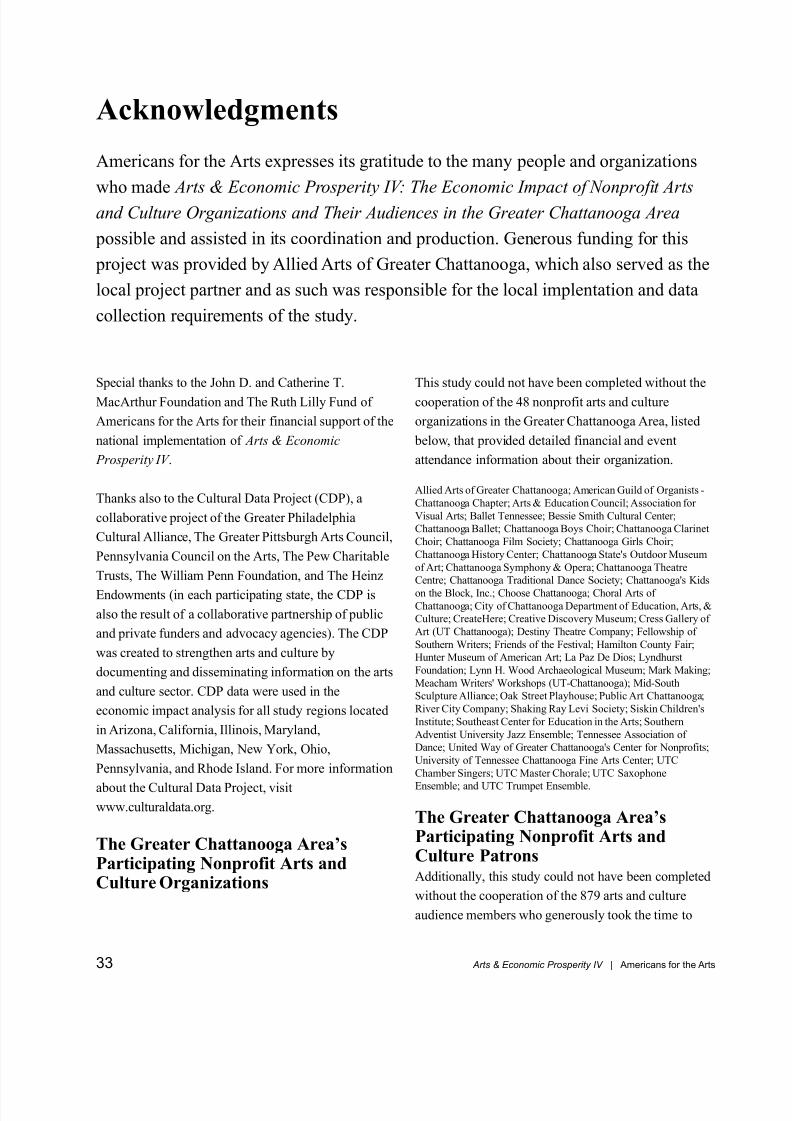
Acknowledgments
Americans for the Arts expresses its gratitude to the many people and organizations
who made Arts & Economic Prosperity IV: The Economic Impact of Nonprofit Artsand Culture Organizations and Their Audiences in the Greater Chattanooga Area
possible and assisted in its coordination and production. Generous funding for this
project was provided by Allied Arts of Greater Chattanooga, which also served as the
local project partner and as such was responsible for the local implentation and data
collection requirements of the study.
Special thanks to the John D. and Catherine T.
MacArthur Foundation and The Ruth Lilly Fund of
Americans for the Arts for their financial support of the
national implementation of Arts & Economic
Prosperity IV .
Thanks also to the Cultural Data Project (CDP), a
collaborative project of the Greater Philadelphia
Cultural Alliance, The Greater Pittsburgh Arts Council,
Pennsylvania Council on the Arts, The Pew Charitable
Trusts, The William Penn Foundation, and The Heinz
Endowments (in each participating state, the CDP is
also the result of a collaborative partnership of public
and private funders and advocacy agencies). The CDP
was created to strengthen arts and culture by
documenting and disseminating information on the arts
and culture sector. CDP data were used in the
economic impact analysis for all study regions located
in Arizona, California, Illinois, Maryland,
Massachusetts, Michigan, New York, Ohio,
Pennsylvania, and Rhode Island. For more information
about the Cultural Data Project, visitwww.culturaldata.org.
The Greater Chattanooga Area’sParticipating Nonprofit Arts andCulture Organizations
This study could not have been completed without the
cooperation of the 48 nonprofit arts and culture
organizations in the Greater Chattanooga Area, listed
below, that provided detailed financial and event
attendance information about their organization.
Allied Arts of Greater Chattanooga; American Guild of Organists -
Chattanooga Chapter; Arts & Education Council; Association for
Visual Arts; Ballet Tennessee; Bessie Smith Cultural Center;Chattanooga Ballet; Chattanooga Boys Choir; Chattanooga Clarinet
Choir; Chattanooga Film Society; Chattanooga Girls Choir;
Chattanooga History Center; Chattanooga State's Outdoor Museum
of Art; Chattanooga Symphony & Opera; Chattanooga TheatreCentre; Chattanooga Traditional Dance Society; Chattanooga's Kids
on the Block, Inc.; Choose Chattanooga; Choral Arts ofChattanooga; City of Chattanooga Department of Education, Arts, &Culture; CreateHere; Creative Discovery Museum; Cress Gallery of
Art (UT Chattanooga); Destiny Theatre Company; Fellowship of
Southern Writers; Friends of the Festival; Hamilton County Fair;Hunter Museum of American Art; La Paz De Dios; Lyndhurst
Foundation; Lynn H. Wood Archaeological Museum; Mark Making;
Meacham Writers' Workshops (UT-Chattanooga); Mid-SouthSculpture Alliance; Oak Street Playhouse; Public Art Chattanooga;
River City Company; Shaking Ray Levi Society; Siskin Children's
Institute; Southeast Center for Education in the Arts; Southern
Adventist University Jazz Ensemble; Tennessee Association ofDance; United Way of Greater Chattanooga's Center for Nonprofits;
University of Tennessee Chattanooga Fine Arts Center; UTC
Chamber Singers; UTC Master Chorale; UTC Saxophone
Ensemble; and UTC Trumpet Ensemble.
The Greater Chattanooga Area’sParticipating Nonprofit Arts andCulture PatronsAdditionally, this study could not have been completed
without the cooperation of the 879 arts and culture
audience members who generously took the time to
Arts & Economic Prosperity IV | Americans for the Arts33

7/24/2019 2010 economic impact study on nonprofit arts and cultural organizations
http://slidepdf.com/reader/full/2010-economic-impact-study-on-nonprofit-arts-and-cultural-organizations 39/43
complete the audience-intercept survey while attending
a performance, event, or exhibit within the Greater
Chattanooga Area.
34

7/24/2019 2010 economic impact study on nonprofit arts and cultural organizations
http://slidepdf.com/reader/full/2010-economic-impact-study-on-nonprofit-arts-and-cultural-organizations 40/43
Arts & Economic Prosperity IV | Americans for the Arts35
7/24/2019 2010 economic impact study on nonprofit arts and cultural organizations
http://slidepdf.com/reader/full/2010-economic-impact-study-on-nonprofit-arts-and-cultural-organizations 41/43
36
"One of the keys to building and sustaining communities and promotinghigh quality economic development is support and funding of the arts. We
have witnessed, in some states, decreased support of the arts which is
counterproductive and a major step backward. We need to emphasize that
potential employers look at enrichment of lives as well as schools, hospitals,
libraries, and other essential services for the communities in which they
want to locate. We need to continue—and increase—our support for the arts.
In today’s competitive marketplace, it has never been truer that supporting
the arts means business."
— Senator Steve Morris
President, National Conference of State Legislatures
"The Committee Encouraging Corporate Philanthropy (CECP), which is active
in measuring trends and best practices in corporate giving to the arts, values the
far-reaching research and leadership of Americans for the Arts, demonstrated in
the Arts & Economic Prosperity™ series.”
— Charles H. Moore
Executive Director, Committee Encouraging Corporate Philanthropy

7/24/2019 2010 economic impact study on nonprofit arts and cultural organizations
http://slidepdf.com/reader/full/2010-economic-impact-study-on-nonprofit-arts-and-cultural-organizations 42/43
Arts & Economic Prosperity IV | Americans for the Arts37
7/24/2019 2010 economic impact study on nonprofit arts and cultural organizations
http://slidepdf.com/reader/full/2010-economic-impact-study-on-nonprofit-arts-and-cultural-organizations 43/43