Embed Size (px)
Citation preview
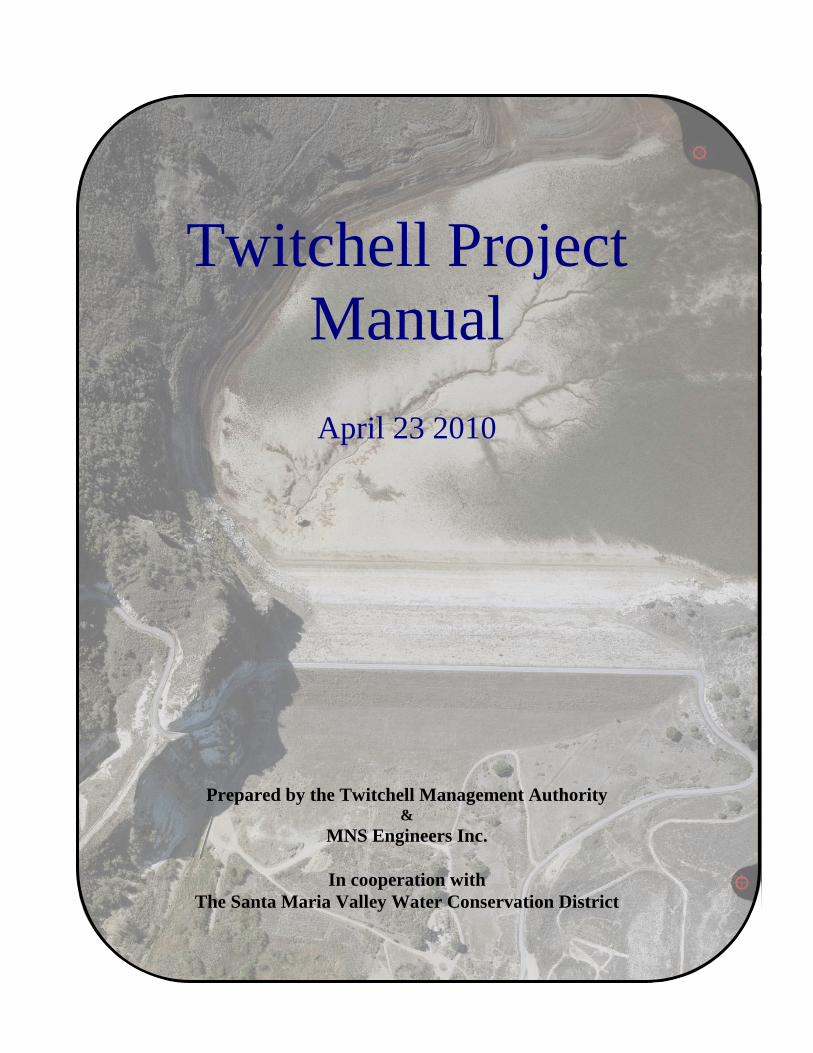
Twitchell Project
Manual
April 23 2010
Prepared by the Twitchell Management Authority &
MNS Engineers Inc.
In cooperation with The Santa Maria Valley Water Conservation District
TWITCHELL PROJECT MANUAL
Twitchell Reservoir Quick Facts
• The Cuyama River, with its principal tributaries Alamo Creek and Huasna River,
is the main source of water for Twitchell Dam. The drainage basin, comprising approximately 1,135 square miles above Twitchell Dam extends into 4 counties (San Luis Obispo, Santa Barbara, Kern, and Ventura.
• Completed in 1959 at a cost of approximately $11 million dollars. $3 million under budget.
• The reservoir supplies about 20,000 AF of recharge to the Santa Maria Groundwater Basin annually.
• Elevations: o Streambed: 476.0 ft o Unofficial referenced boundary of the Water Conservation and Flood
control Pools (Normal Reservoir elevation): 621.8 ft o Outlet Works (Spillway crest): 651.5 ft o Spillway: 686.5 ft o Crest elevation: 692.0 ft
• Twitchell Reservoir is operated and maintained by the Santa Maria Valley Water Conservation District. Funding for maintenance comes from Twitchell Management Authority (TMA), Federal grants. Partners/stakeholders: Bureau of Reclamation, Army Corps of Engineers, County of Santa Barbara, City of Santa Maria.
• In a normal season, it takes about 12 to 14 inches of rain before any water is seen in the reservoir.
• 2009 La Brea Fire, 89,489 acres, 15% within Twitchell’s watershed. • Total sediment now in the reservoir: 42,357 acre-feet • In 1997, the Santa Maria Valley Water Conservation District filed suit to
adjudicate water rights in the Santa Maria Valley Groundwater Basin. Since 2001, the adjudication has proceeded through various court orders, a “partial statement of decision,” and a settlement agreement. Although the court has approved an agreement among those parties who have signed it, not all parties to the adjudication have agreed to it. The Stipulating Agreement formed a coalition of the stipulating parties, called the Twitchell Management Authority, the members of which have voting representation as they contribute funds intended to enhance and monitor water conservation efforts of Twitchell Dam and Reservoir.
TWITCHELL PROJECT MANUAL
Table of Contents Executive Summary .................................................................................................................................... 1 1. Project List and Proposed 5-Year Capital Program of Projects ...................................................... 6
a. Project Funding................................................................................................................................... 6 (1) Funding Sources ........................................................................................................................... 6 (2) Extraordinary Project Operations................................................................................................. 7 (3) Routine Maintenance.................................................................................................................... 8
2. Various Agency Stakeholders at Twitchell Dam ................................................................................ 8 a. TMA Project Implementation Procedures .......................................................................................... 9
3. History of Projects at the Dam ........................................................................................................... 10 a. Routine Maintenance Projects .......................................................................................................... 10 b. Extraordinary and Heavy Maintenance Projects............................................................................... 11
(1) Lower Portal Trash Rack Repair 2002 ....................................................................................... 11 (2) Access Road Pavement Repair 2002-2007................................................................................. 11 (3) Trash Rack Sandblast & Paint 2002........................................................................................... 11 (4) Gate painting 2003 ..................................................................................................................... 12 (5) Gate Seal Replacement 2010...................................................................................................... 12
c. Capital Improvements ....................................................................................................................... 13 (1) Inlet Structure Lower Portal Modifications 1983-84 ................................................................. 13 (2) Gate Cable System Replacement 1993....................................................................................... 13 (3) SCADA Improvements 2006...................................................................................................... 14
d. Sediment Removal Projects .............................................................................................................. 14 (1) 1982 Opening of the Inlet Structure Bottom Portal and Sediment Flush................................... 14 (2) 2000 Emergency Sediment Removal at Upstream Inlet Structure and Downstream Stilling Basin and Cuyama River Channel ..................................................................................................... 15 (3) 2002 Emergency Sediment Removal Project ............................................................................. 16 (4) 2009 Tunnel Sediment Removal Project .................................................................................... 17
4. Brief History of the Dam ..................................................................................................................... 19 5. More Background on Sediment Issues at Twitchell Dam ................................................................ 21
a. Surveys Show Increases in Sedimentation........................................................................................ 21 b. Downstream Sediment History ......................................................................................................... 23 c. Chart of Historical Elevation vs. Capacity ....................................................................................... 23 d. Sediment Affect on Flood Control and Water Conservation Storage............................................... 25 e. Sedimentation: A Pictorial History at the Outlet Structure .............................................................. 26 f. Sedimentation: A Pictorial History in Aerial Photos........................................................................ 28 g. Sedimentation: A Pictorial History Downstream ............................................................................. 29 h. Sediment Related Studies Performed................................................................................................ 31
(1) 1981 USBR Sediment Study ...................................................................................................... 31 (2) 1995 Fugro Sediment Survey ..................................................................................................... 31 (3) 1996 GEI Consultants “Evaluation of Transfer of Title of the Santa Maria Project – Twitchell Dam and Reservoir” ........................................................................................................................... 32 (4) 2000 Santa Maria River Watershed Non-Point Source Pollution Management Plan ................ 32 (5) 2000 URS Alternatives and Costs - Sediment Management Program ....................................... 32 (6) 2001 Emergency Sediment Removal Report, Douglas Pike, P.E............................................... 35 (7) 2001 Sediment Removal Feasibility Study for CALAQQWA Funding .................................... 36 (8) 2002 Twitchell Dam Outlet Works Stilling Basin Sedimentation Issues & Capacity Study..... 36 (9) 2002 Numerical Modeling of Sediment Bypassing Alternatives at Twitchell Reservoir .......... 38
TWITCHELL PROJECT MANUAL
ii
(10) 2007 Twitchell Sediment Survey Report ................................................................................... 38 i. Sediment Management at the Outlet Works ..................................................................................... 39
(1) Sediment Management at the Upstream Inlet Structure............................................................. 39 (2) Sediment Management in the Outlet Works Tunnel .................................................................. 40 (3) Sediment Management in the Stilling Basin .............................................................................. 40 (4) Sediment Management Downstream of Twitchell Dam ............................................................ 41
6. Cuyama Watershed Description......................................................................................................... 42 7. Sediment Management in the Cuyama River Watershed................................................................ 43
a. History of County Projects................................................................................................................ 44 b. Fire Burn Areas................................................................................................................................. 44
(1) Erosion and Sediment Load Impacts .......................................................................................... 44 (2) BAER Reports ............................................................................................................................ 46 (3) U.S. Forest Service and Soil Conservation ................................................................................ 46
c. SR 166 Construction Impacts ........................................................................................................... 46 8. Potential Solutions in the Upstream Watershed ............................................................................... 46
a. Soil Conservation Projects................................................................................................................ 46 (1) Soil Conservation Methods ........................................................................................................ 47 (2) Soil Conservation Project Costs ................................................................................................. 47 (3) Funding & Grant Opportunities.................................................................................................. 48
b. Channel Treatments .......................................................................................................................... 50 c. Sediment Basins................................................................................................................................ 50
(1) Sedimentation Basin Fundamentals ........................................................................................... 50 (2) Easement Issues.......................................................................................................................... 51 (3) River Access and Potential Locations ........................................................................................ 51 (4) Maintenance ............................................................................................................................... 51 (5) Environmental Considerations ................................................................................................... 51
9. Options for Removal of Sediment from Twitchell Reservoir .......................................................... 51 a. Commentary on Fugro Report .......................................................................................................... 51 b. Commercial Value of Twitchell Clay Sediment ............................................................................... 52 c. Sediment Solutions Studied and rejected.......................................................................................... 52
10. Additional Study and Analysis Needed............................................................................................ 52 a. Current Hydraulic and Sediment Transport Analysis....................................................................... 53 b. Upstream Project Analysis................................................................................................................ 53 c. Outlet Works Flushing Procedure Development Analysis ............................................................... 53 d. Downstream HEC RAS Release Inundation Study .......................................................................... 53 e. Reservoir Surcharge and Conservation Pool Adjustment Study ...................................................... 54 f. Further Feasibility Study of Sediment Removal Alternatives .......................................................... 54 g. Access Road Maintenance Strategy.................................................................................................. 54
11. Dam & Reservoir Resources ............................................................................................................. 54 a. History of Topographical Surveys .................................................................................................... 54 b. Property Boundaries.......................................................................................................................... 55 c. Historical Stream gage flow Data ..................................................................................................... 56 d. Web Resources.................................................................................................................................. 57
Appendix 1: 5 Year Program of projects Matrix Appendix 2: Project Descriptions and Estimates Appendix 3: Cuyama Watershed Maps Appendix 4: Post Fire Soil Conservation Articles From USDA/NRCS Appendix 5: Cuyama Watershed USGS Maps Appendix 6: 1998 Flood Map
TWITCHELL PROJECT MANUAL
Page 1 of 59
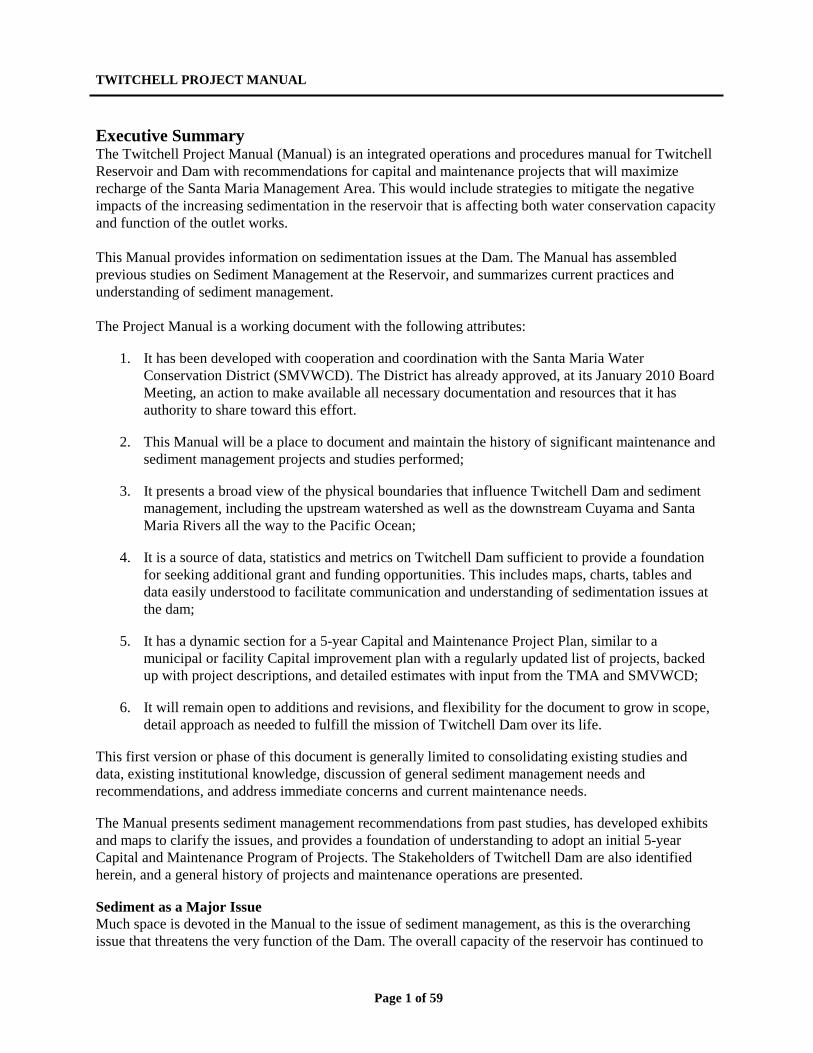
Executive Summary The Twitchell Project Manual (Manual) is an integrated operations and procedures manual for Twitchell Reservoir and Dam with recommendations for capital and maintenance projects that will maximize recharge of the Santa Maria Management Area. This would include strategies to mitigate the negative impacts of the increasing sedimentation in the reservoir that is affecting both water conservation capacity and function of the outlet works. This Manual provides information on sedimentation issues at the Dam. The Manual has assembled previous studies on Sediment Management at the Reservoir, and summarizes current practices and understanding of sediment management. The Project Manual is a working document with the following attributes:
1. It has been developed with cooperation and coordination with the Santa Maria Water Conservation District (SMVWCD). The District has already approved, at its January 2010 Board Meeting, an action to make available all necessary documentation and resources that it has authority to share toward this effort.
2. This Manual will be a place to document and maintain the history of significant maintenance and sediment management projects and studies performed;
3. It presents a broad view of the physical boundaries that influence Twitchell Dam and sediment management, including the upstream watershed as well as the downstream Cuyama and Santa Maria Rivers all the way to the Pacific Ocean;
4. It is a source of data, statistics and metrics on Twitchell Dam sufficient to provide a foundation for seeking additional grant and funding opportunities. This includes maps, charts, tables and data easily understood to facilitate communication and understanding of sedimentation issues at the dam;
5. It has a dynamic section for a 5-year Capital and Maintenance Project Plan, similar to a municipal or facility Capital improvement plan with a regularly updated list of projects, backed up with project descriptions, and detailed estimates with input from the TMA and SMVWCD;
6. It will remain open to additions and revisions, and flexibility for the document to grow in scope, detail approach as needed to fulfill the mission of Twitchell Dam over its life.
This first version or phase of this document is generally limited to consolidating existing studies and data, existing institutional knowledge, discussion of general sediment management needs and recommendations, and address immediate concerns and current maintenance needs.
The Manual presents sediment management recommendations from past studies, has developed exhibits and maps to clarify the issues, and provides a foundation of understanding to adopt an initial 5-year Capital and Maintenance Program of Projects. The Stakeholders of Twitchell Dam are also identified herein, and a general history of projects and maintenance operations are presented.
Sediment as a Major Issue Much space is devoted in the Manual to the issue of sediment management, as this is the overarching issue that threatens the very function of the Dam. The overall capacity of the reservoir has continued to
TWITCHELL PROJECT MANUAL
Page 2 of 59
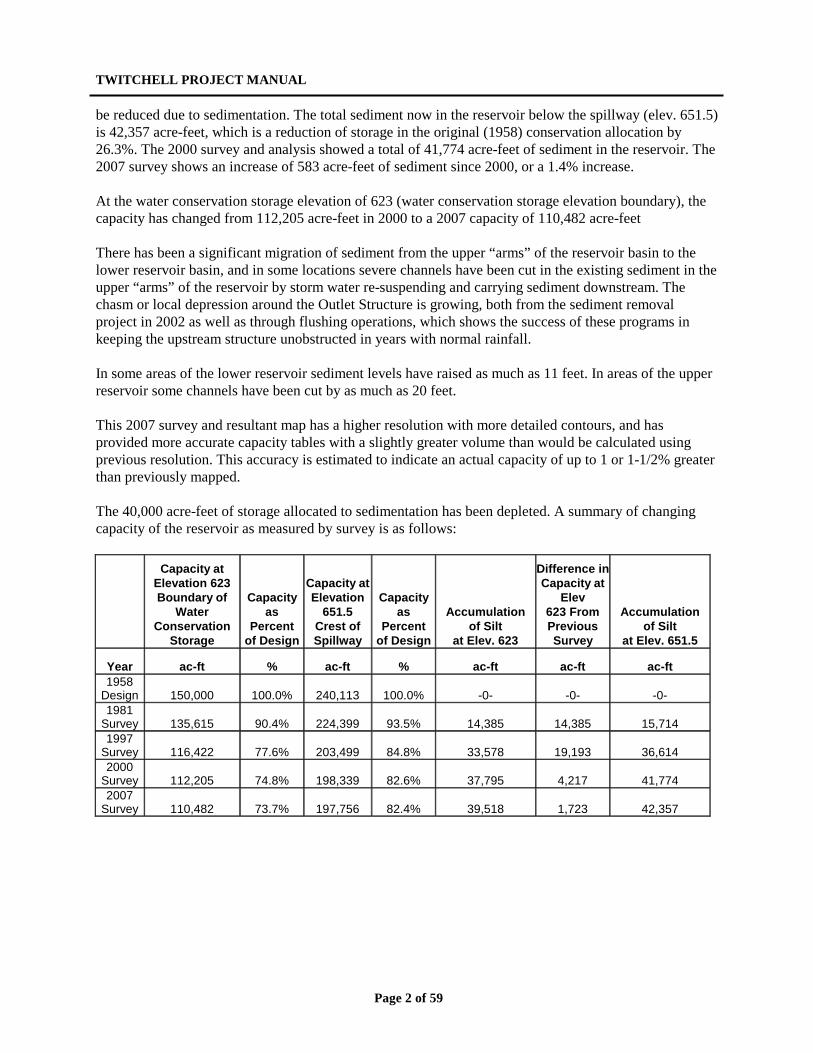
be reduced due to sedimentation. The total sediment now in the reservoir below the spillway (elev. 651.5) is 42,357 acre-feet, which is a reduction of storage in the original (1958) conservation allocation by 26.3%. The 2000 survey and analysis showed a total of 41,774 acre-feet of sediment in the reservoir. The 2007 survey shows an increase of 583 acre-feet of sediment since 2000, or a 1.4% increase. At the water conservation storage elevation of 623 (water conservation storage elevation boundary), the capacity has changed from 112,205 acre-feet in 2000 to a 2007 capacity of 110,482 acre-feet There has been a significant migration of sediment from the upper “arms” of the reservoir basin to the lower reservoir basin, and in some locations severe channels have been cut in the existing sediment in the upper “arms” of the reservoir by storm water re-suspending and carrying sediment downstream. The chasm or local depression around the Outlet Structure is growing, both from the sediment removal project in 2002 as well as through flushing operations, which shows the success of these programs in keeping the upstream structure unobstructed in years with normal rainfall. In some areas of the lower reservoir sediment levels have raised as much as 11 feet. In areas of the upper reservoir some channels have been cut by as much as 20 feet. This 2007 survey and resultant map has a higher resolution with more detailed contours, and has provided more accurate capacity tables with a slightly greater volume than would be calculated using previous resolution. This accuracy is estimated to indicate an actual capacity of up to 1 or 1-1/2% greater than previously mapped. The 40,000 acre-feet of storage allocated to sedimentation has been depleted. A summary of changing capacity of the reservoir as measured by survey is as follows:
Capacity at Elevation 623 Boundary of
Water Conservation
Storage
Capacity
as Percent
of Design
Capacity at Elevation
651.5 Crest of Spillway
Capacity
as Percent
of Design
Accumulation
of Silt at Elev. 623
Difference in Capacity at
Elev 623 From Previous Survey
Accumulation
of Silt at Elev. 651.5
Year ac-ft % ac-ft % ac-ft ac-ft ac-ft 1958
Design 150,000 100.0% 240,113 100.0% -0- -0- -0- 1981
Survey 135,615 90.4% 224,399 93.5% 14,385 14,385 15,714 1997
Survey 116,422 77.6% 203,499 84.8% 33,578 19,193 36,614 2000
Survey 112,205 74.8% 198,339 82.6% 37,795 4,217 41,774 2007
Survey 110,482 73.7% 197,756 82.4% 39,518 1,723 42,357
TWITCHELL PROJECT MANUAL
Page 3 of 59
Solutions to the Sedimentation Issues Although the identification of sedimentation as a potential major operational problem was identified around 1982, only since 1998 has operational impacts been significantly experienced. The unique setting of the Dam and reservoir calls for the development of unique solutions. Long-term, mitigating solutions to reduce sediment flow are needed as well as immediate sediment management measures at the Dam Outlet Works. The Manual suggests potential solution through projects in the upstream watershed such as soil conservation and revegetation projects. Channel treatments and sedimentation basins are also suggested as potential solutions and options for sediment removal from the reservoir are also addressed. These concepts are introduced and briefly explored with a recommendation for further study. The immediate issue of maintaining the Outlet Works open and free of sediment is also addressed. Cleaning and maintenance of the Intake Structure, Tunnel, Stilling Basin, and downstream Cuyama River Channel will continue to be a challenge and priority, however a strategy for upstream sediment reduction measures and development of an operational strategy to reduce the frequency of sediment removal at the Outlet Works is sorely needed. Although a number of studies have been performed that have been of great help in understanding the sediment issues at the Dam, sediment management at Twitchell Dam is still an emerging issue new to operation of this dam and many additional considerations need analysis as we move forward. The additional studies and analysis recommended in this Manual include: a. Hydraulic and Sediment Transport Analysis b. Upstream Sediment Reduction Project Analysis c. Outlet Works Flushing Procedure Development Analysis d. Downstream HEC RAS Release Inundation Study e. Reservoir Surcharge and Conservation Pool Adjustment Study f. Further Feasibility Study of Reservoir Sediment Removal Alternatives g. Access Road Maintenance Strategy This Manual presents an explanation of the sediment issues in a way no previous study has, This manual also presents geographic Information Systems (GIS) map tools of the Reservoir and Cuyama River Basin that have never been produced before. This Manual also references and summarizes in one place the culmination of studies and knowledge to date on sedimentation issues at the Dam. These attributes make this Manual an extremely valuable tool in seeking grants and funding from various public agencies. All Studies and documents referenced in this Manual are available through the SMVWCD or the Engineer. Most are in electronic (.PDF) format and can be easily shared.
TWITCHELL PROJECT MANUAL
Page 4 of 59
This Page Intentionally Blank
TWITCHELL PROJECT MANUAL
Page 5 of 59
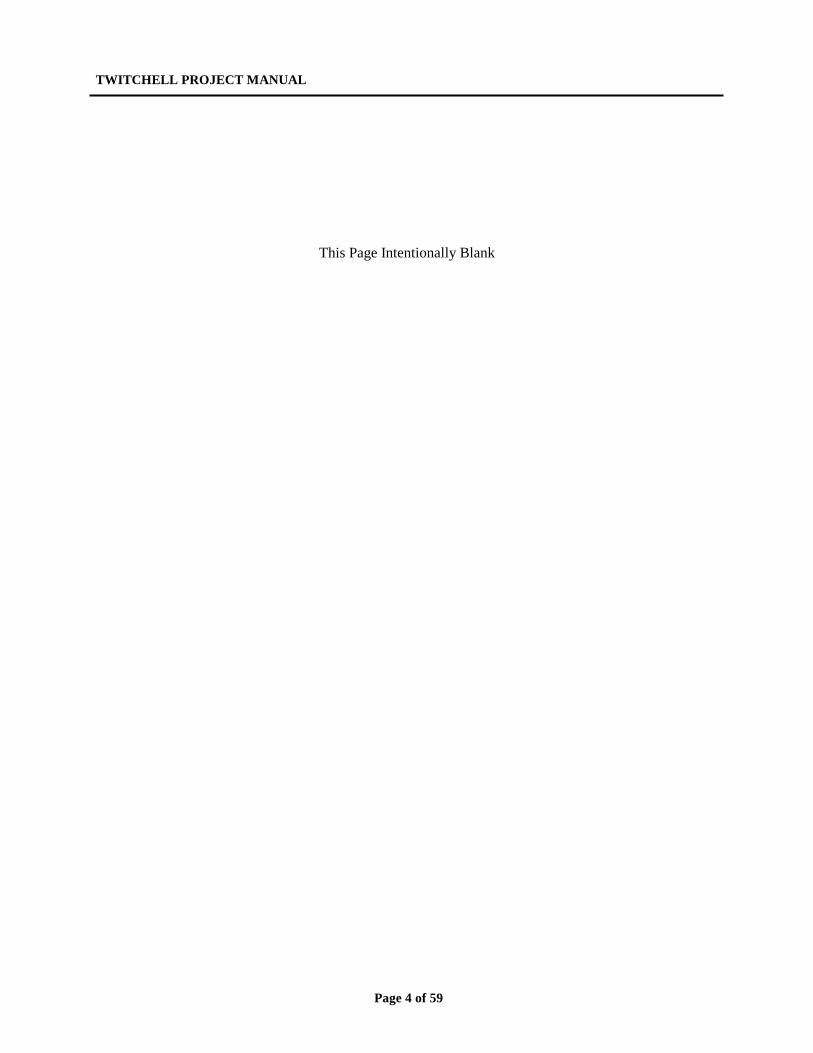
Introduction Originally, Twitchell Dam and Reservoir started as part of “The Santa Maria Project”, one of three "seacoast projects" along the Central Pacific Coast aimed at capturing and storing floodwaters that would otherwise "waste to the sea.” The others are the Cachuma and Ventura River Projects. Constructed by the United States Army Corps of Engineers (USACE) and the Bureau of Reclamation (BOR) in 1958 in behalf of the Santa Barbara County Water Agency (SBCWA), Twitchell dam has been operated by the Santa Maria Valley Water Conservation District (SMVWCD) since completion.
The Santa Maria Project was authorized in 1954 and is a water conservation and flood control project providing full and supplemental irrigation water to approximately 35,000 acres of cropland. The BOR constructed Twitchell Dam and Reservoir, formerly called Vaquero Dam and Reservoir, and the U.S. Army Corps of Engineers constructed a system of river levees.
The Cuyama River, with its principal tributaries Alamo Creek and Huasna River, is the main source of water for Twitchell Dam. The drainage basin, comprising approximately 1,135 square miles above Twitchell Dam, lies along the southern boundary of San Luis Obispo County and the northern edge of Santa Barbara County. All water used within the area is obtained by pumping from the ground-water reservoir.
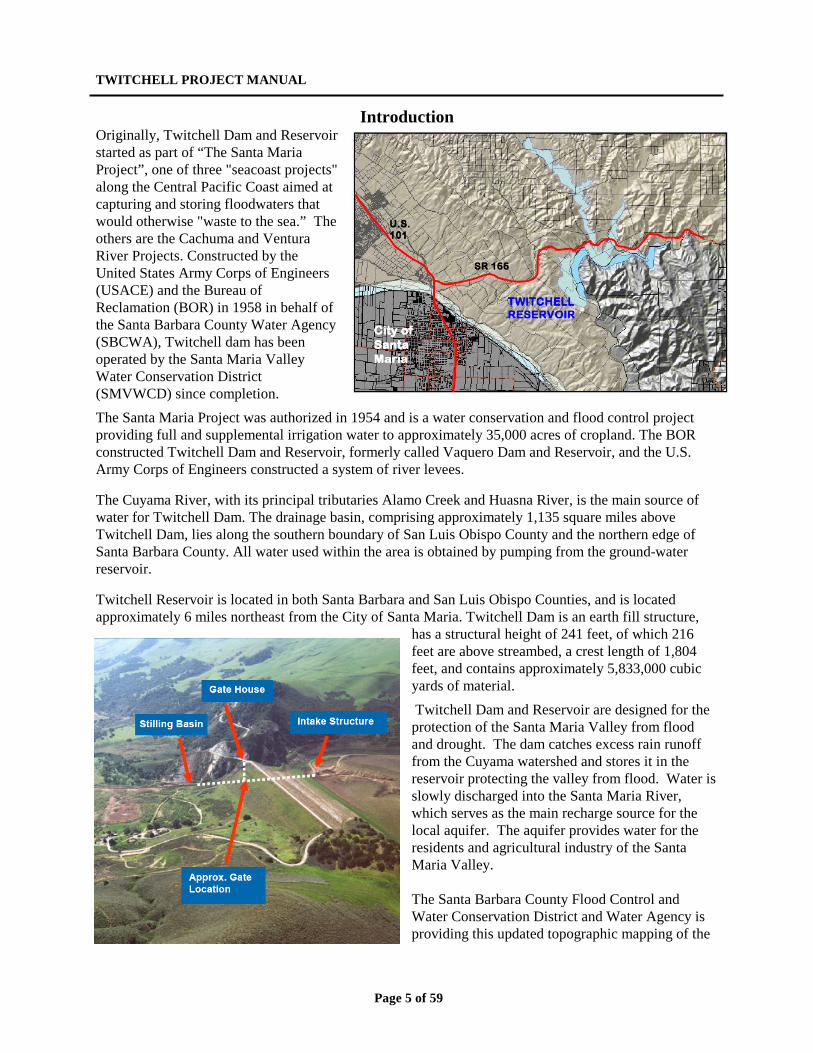
Twitchell Reservoir is located in both Santa Barbara and San Luis Obispo Counties, and is located approximately 6 miles northeast from the City of Santa Maria. Twitchell Dam is an earth fill structure,
has a structural height of 241 feet, of which 216 feet are above streambed, a crest length of 1,804 feet, and contains approximately 5,833,000 cubic yards of material.
Twitchell Dam and Reservoir are designed for the protection of the Santa Maria Valley from flood and drought. The dam catches excess rain runoff from the Cuyama watershed and stores it in the reservoir protecting the valley from flood. Water is slowly discharged into the Santa Maria River, which serves as the main recharge source for the local aquifer. The aquifer provides water for the residents and agricultural industry of the Santa Maria Valley. The Santa Barbara County Flood Control and Water Conservation District and Water Agency is providing this updated topographic mapping of the
TWITCHELL PROJECT MANUAL
Page 6 of 59
Twitchell Reservoir basin and report for the principal purpose of updating data tables showing reservoir capacity at any given level and other tables and/or graphs that show the relationship of capacity, level, area, etc. and comparisons to previous studies. This Survey and study was performed to a higher degree of accuracy than past surveys, a fact that is discussed in detail in this report. The data derived was compared with the last survey to determine current capacities to be used in a revised capacity table. This data is critical to determine water reclamation and flood control capacities as well as to monitor siltation in the reservoir. Previous topographic and/or topographic/bathymetric combined surveys have been performed in 1958, 1981, 1991 and 2000. 1. Project List and Proposed 5-Year Capital Program of Projects
Attached in Appendix 1 is a Project List and proposed 5-Year Capital Program of Projects Matrix. This list and matrix outlines projects identified as needed to maintain normal operations at the Dam and Reservoir. The list provides a project title, description, priority rating, and estimated cost.
a. Project Funding Funding may not be available for all the identified projects so they may need to be implemented based on their order of priority.
(1) Funding Sources There are a variety of sources of funds for the projects at Twitchell Dam and Reservoir. These sources of funding include:
• The SMVWCD receives annual revenues of approximately $350,000-$375,000 from
property taxes, interest, intergovernmental revenues and special assessments. Their expenditures include salaries and benefits for District Employees, utility and maintenance expenses on the Dam Caretaker’s residence, caretaker vehicle expenses, other District equipment and heavy equipment maintenance, special program fees such as cloud-seeding and stream gage monitoring, and on-going maintenance at the dam. Over that past decade, the District has had to expend more and more of its maintenance funds on sediment management until all reserves have been expended. This District is no longer able to fund all needed maintenance and operations at the Dam at the current revenue level.
• In 2007, the courts issued a final judgment in the groundwater litigation between the Santa Maria Valley Water Conservation District and the City of Santa Maria. The courts issued a Stipulated Agreement that mandated the formation of the Twitchell Management Authority (TMA) that is charged with monitoring and enhancing the ground water basin yield and water reclamation mission of Twitchell Dam and Reservoir. The TMA consists of representatives from the cities of Santa Maria, Guadalupe, Golden State Water Company, and the Stipulating Landowners. Each entity is responsible for a proportionate share of the TMA annual budget which is approximately $650,000, assuming all stipulating parties contribute the court-ordered share. Currently (April 2010) the TMA has approximately $350,000 in its budget.
TWITCHELL PROJECT MANUAL
Page 7 of 59
• County of Santa Barbara. The County has several programs that compliment the water reclamation and flood control missions of the Dam. As project partners the County has funded a number of special studies that have benefited Twitchell, including several bathymetric/aerial topography efforts to establish reservoir capacity and sediment impacts. They do not contribute direct monetary support to the District.
• The Bureau of Reclamation has not contributed money directly to support the district but participates in the regular facility inspections and reviews and lends its technical expertise and some limited staff resources to support the mission of the Dam and Reservoir. They are currently considering if the sedimentation issues at Twitchell qualify for special “preventative measure” grant funding. Other grant opportunities include the “Challenge Grant” (http://recovery.doi.gov/press/bureaus/bureau-of-reclamation/arra-challenge-grant-fact-sheet/)
• The SMVWCD received $500,000 for emergence sediment removal from Congress in 2000 which was expended primarily on sediment control projects. Other potential funding sources that are being pursued by the SMVWCD include the US Forest Service and Caltrans. The Forest Service may have an obligation to assist the dam with sedimentation issues caused as a result of fires in the National Forest. Caltrans may have a responsibility to mitigate the negative effects of straightening the Cuyama River along Highway 166. Additional research needs to be accomplished to determine the ava9lability of Soil Conservation or water resource grants from various Federal and State Agencies.
• For the GAP Fire in Santa Barbara County the Natural Resources Conservation Service
(NRCS) identified and approved emergency projects totaling about $4.7 million dollars to help protect life and property at risk from the increased runoff, mud and debris flows from the burned areas. The projects were funded thorough the agencies Emergency Watershed Protection (EWP) Program.
(2) Extraordinary Project Operations The 5-Year Capital Improvement Plan distinguishes between routine operations & maintenance and routine capital improvements and extraordinary operations & maintenance and extraordinary capital improvements. This is because a significant source of funding for work originates from the TMA, whose mission is to fund only appropriate extraordinary projects. “Extraordinary” projects may include projects related sediment management issues that are severely impacting dam operations and reservoir capacity, or may include unusual operations or capital improvements consistent with the TMA Stipulating Agreement and water conservation mission of the Twitchell Project. Examples of extraordinary projects may include removal of sediment threatening or hampering Dam operations, Long-term solutions to reduce sediment flow into the reservoir, monitoring of the groundwater basin, and studies to facilitate extraordinary operations, etc.
TWITCHELL PROJECT MANUAL
Page 8 of 59
(3) Routine Maintenance Routine maintenance would include maintenance operations defined in the ACOE Maintenance and Procedures Manual, as well as a number of established repetitive operations deemed necessary to maintain the facility in good condition. Examples of these operations would include: Maintenance of the shaft house and caretaker structures, staff compensation & daily operation of the office and Dam, equipment maintenance, mowing of the downstream Dam face, etc.
2. Various Agency Stakeholders at Twitchell Dam
The Santa Maria Project (Twitchell Dam and reservoir) was designed and constructed for the United States Bureau of Reclamation (USBR) by the United States Army Corps of Engineers (ACOE). The USBR developed Twitchell Dam under contract to the Santa Barbara County Water Agency (SBCWA) on behalf of the Santa Maria Water Conservation District (SMVWCD). Twitchell Dam was recently paid off and title transferred to the SMVWCD. The relationships between and participation of the various entities involved at the dam include: The United States Congress, on June 17, 1902 and September 3, 1954 Passed reclamation acts 32 Stat. 388 & 68 Stat 1190, respectively, essentially authorizing the USBR to enter into a contract with the Santa Barbara County Water Agency (Agency) for construction of Vaquero (Twitchell) Dam. This agreement acknowledges the relationship between the Agency and the SMVWCD, as well as establish repayment provisions for the local contribution for dam construction. The USBR identifies Twitchell Dam and Reservoir a Section 7 Facility. They generally have no project input at the Dam, but can provide technical assistance. They request funding for any extensive technical assistance. The USBR participates in the 2 and 5-year Periodic Facility Reviews lead by the ACOE. The Santa Barbara County Water Agency (Agency) entered into a contract on April 6, 1956 with the USBR providing for the construction of the Santa Maria Project. The County maintains stream gages upstream, with some funding participation from the SMVWCD. Similarly, the County has an on-going cloud seeding program, which the SMVWCD participates in. The SMVWCD entered into a contract with the Santa Barbara County Water Agency on December 19th, 1955 wherein it became a “member unit” of the Agency regarding the Santa Maria (vis.Twitchell) Project. This agreement also granted the District the right to use of the water generated by Twitchell Dam and outlines the details of their contractual relationship. The SMVWCD receives assessed fees from all property owners within their District to fund operations, and has historically managed the operations at the Dam and been responsible for routine maintenance. They also have historically been responsible for management and releases from the water conservation pool. The SBCWA and County Flood Control Agency and ACOE both monitor and provide input or direction regarding management and releases from the flood control pool. The ACOE participates in the 2 and 5-year Periodic Facility Reviews of the Dam and recommends maintenance and capital improvements in their published report. The Twitchell Management Authority (TMA) is a newly formed, court established Board consisting of representatives from stipulating entities or groups drawing water from the greater Santa Maria Groundwater Basin. They contribute fees to the TMA which are in turn to be used for the benefit of
TWITCHELL PROJECT MANUAL
Page 9 of 59
the Twitchell Dam & Reservoir as well as the groundwater basin within the parameters of the Stipulating Agreement. A weather station exists at the dam, which is owned by the National Oceanic and Atmospheric Agency (NOAA) and monitored by the Dam Caretaker. A SCADA system transmits the gate position in the Dam and Reservoir elevation. The Cachuma Resource Conservation District (CRCD) was formed in 1996. Its mission is to be a soil conservation resource for five major mainland and several island watersheds in the region. The Cuyama River Watershed Basin extends into four counties: Kern, Ventura, San Luis Obispo and Santa Barbara. However, the RCD area only includes that portion which drains northern Santa Barbara County, part of southern San Luis Obispo County, and the southwest corner of Kern County. They have provided limited assistance with sediment issues at Twitchell Dam. In 200 they completed a study on sediment contributions to the reservoir from farming activity. That report is summarized later in this report. When a natural disaster situation is stabilized, USDA's Natural Resources Conservation Service (NRCS) conservation planning professionals visit the area, with partners from state or local governments or other community or resource organizations, and assess damage to the land that may threaten life and property. The Damage Survey Assessments (DSA) also evaluate potential future risks that could occur as a result of changes that have taken place. This is particularly relevant in the wildfire areas of Southern California. After fire has burned all plant life, the potential for severe flooding and landslide damage from rain must be averted where possible. DSA Teams evaluate the area for potential risks and recommend conservation practices to hold the soil in place and reduce the speed or direction of the water as it runs off the soil. However, because the fires in the Cuyama Watershed do not threaten life and property (homes), the NRCS has prepared reports but has not been pro-active in obtaining funding for sediment control efforts.
a. TMA Project Implementation Procedures The Stipulating Agreement provides general parameters for project approval and funding. Under the Twitchell Management Authority (TMA) Structure and Responsibilities section, the following TMA roles and responsibilities for Capital Improvement Projects is outlined: (1) The TMA shall be comprised of one representative of each of the following parties: Santa
Maria, Guadalupe, Golden State Water Company, the District, and Overlying Landowners holding rights to Twitchell Yield.
(2) Only those parties holding an allocation of Twitchell Yield shall be voting members of the TMA. Voting shall be based on each party’s proportionate allocation of Twitchell Yield.
(3) The TMA shall be responsible for all the Extraordinary Project Operations. The definition and examples of extraordinary projects are included in this Manual.
(4) The TMA shall be responsible for developing proposals for Capital Improvement Projects relating to the Twitchell Project. Capital Improvement Projects shall mean projects involving the expenditure of funds for the improvement or enhancement of the Twitchell Project, but shall not include normal operation, maintenance or repair activities. The TMA desires to Establish a TMA approved, prioritized list of projects to be funded. This is initially being implemented through the development of a 5-Year Capital Improvement Plan as part of this Twitchell Project Manual.
(5) Upon the development of a proposal for a Capital Improvement Project, the TMA shall, in cooperation with the District, hold one or more public hearings to solicit input.
TWITCHELL PROJECT MANUAL
Page 10 of 59
(6) Following the public hearing process, the TMA may vote on whether to implement the Capital Improvement Project.
Additionally: (7) The TMA and the SMVWCD will regularly review and append the 5-year capital
improvement Plan as necessary. (8) The TMA will maintain an active Technical Committee to facilitate project development and
implementation. (9) Construction bid documents, for projects funded by the TMA, will be prepared by a
professional engineer and will be reviewed by both TMA and SMVWCD staff prior to advertisement.
(10) Projects funded partially or in full by the TMA will be implemented by the SMVWCD through its normal advertising, award and contract administration processes.
(11) Regular project progress reports will be provided to the TMA, as well as copies of final contract close-out reports and documentation.
As more projects are implemented through the TMA, the process will be refined. 3. History of Projects at the Dam
a. Routine Maintenance Projects The SMVWCD has had the responsibility for routine operations and maintenance at the Dam since its completion. Routine operation and maintenance expenses include, but are not limited to tasks such as: 1. Grass cutting on downstream dam face 2. Weeds abatement on roads 3. Helicopter Aerially applied weed abatement on upstream dam face 4. Daily Weather Service Readings & reports to BOR and ACOE 5. Maintenance of mobile equipment: Backhoe (skip loader), Pickup Truck 6. Maintenance of caretaker residence 7. Paved access road minor maintenance, debris removal & pothole repair 8. Downstream unimproved road maintenance 9. Gate house cleaning, emergency generator maintenance and testing 10. Gate house elevator inspection and maintenance 11. Vermin control as needed 12. Security function & dealing with trespassers 13. Coordination with neighbors regarding downed fences and cattle nuisances 14. Facility review every two years, Major review every five years (ACOE and BoR),
Completion of maintenance & repair issues identified. 15. Functions of district Secretary, contract accountant, contract attorney, contract engineer,
other consultants for environmental permitting, SCADA maintenance, electrical repairs, etc.
16. District Office Rent and Utilities 17. Monthly business of the District Board of Directors
TWITCHELL PROJECT MANUAL
Page 11 of 59
b. Extraordinary and Heavy Maintenance Projects
There have been a few projects that have been extraordinary in that they have only been performed once and they were not foreseen as maintenance needs in the ACOE O&M Manual. Some of these include:
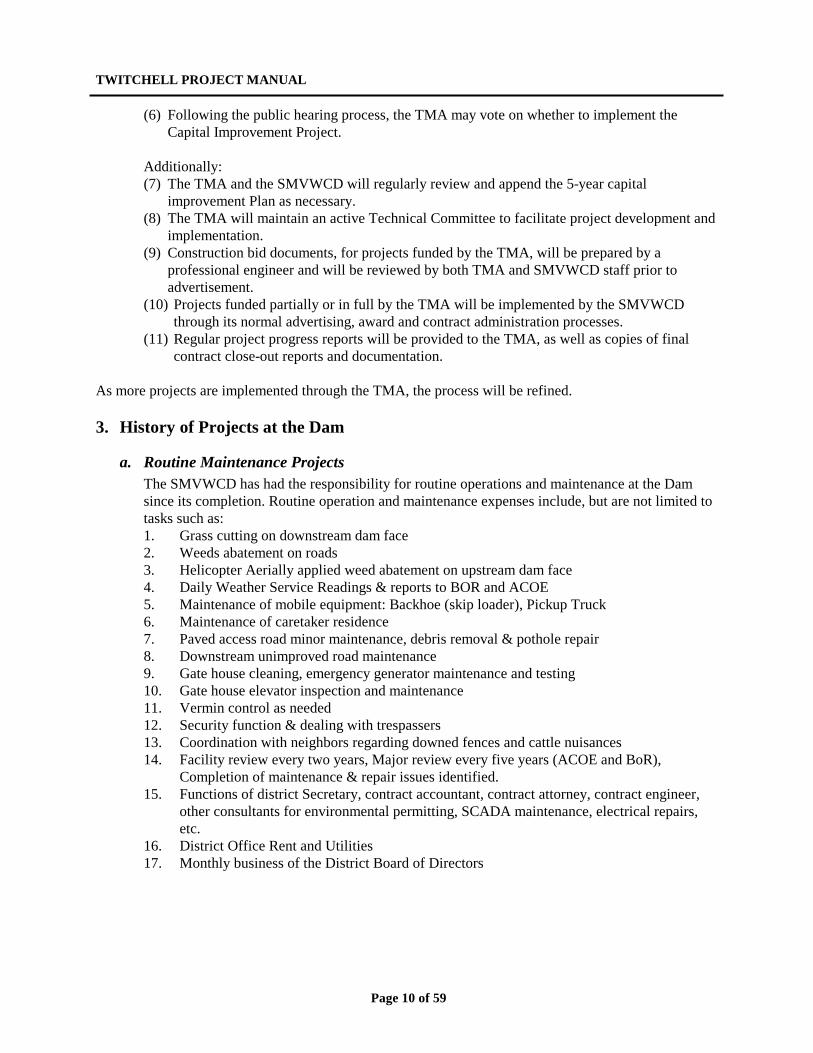
(1) Lower Portal Trash Rack Repair 2002 The lower portal trash rack was dislocated and severely damaged in storms of 2001. A contractor was hired to retrieve the rack, reconstruct, and reinstall it. This work was accomplished at the same time the Inlet structure trash racks were sandblasted and repainted, and the emergency sediment removal in front of the inlet structure was accomplished. The cost of this effort was approximately $7,000.
(2) Access Road Pavement Repair 2002-2007 In both 2002 and 2007 the District contracted for some limited amount of pothole repair on the access road. More frequent and heavier truck traffic associated with the sediment management efforts have resulted in a more frequent maintenance need, and the entire paved road is at risk of failure. These two maintenance projects were both under $50,000 each, and only repaired some of the worst pavement failure areas.
(3) Trash Rack Sandblast & Paint 2002 This project was performed to rehabilitate the steel trash racks and perform corrosion control on the inlet structure. The racks were sandblast in-place and painted with a two-part epoxy paint. This was the first time this maintenance was performed. This work was done concurrently with the lower portal trash rack repair and the 2002 emergency sediment removal from in front of the inlet structure.
TWITCHELL PROJECT MANUAL
Page 12 of 59
Gate Painting 2003
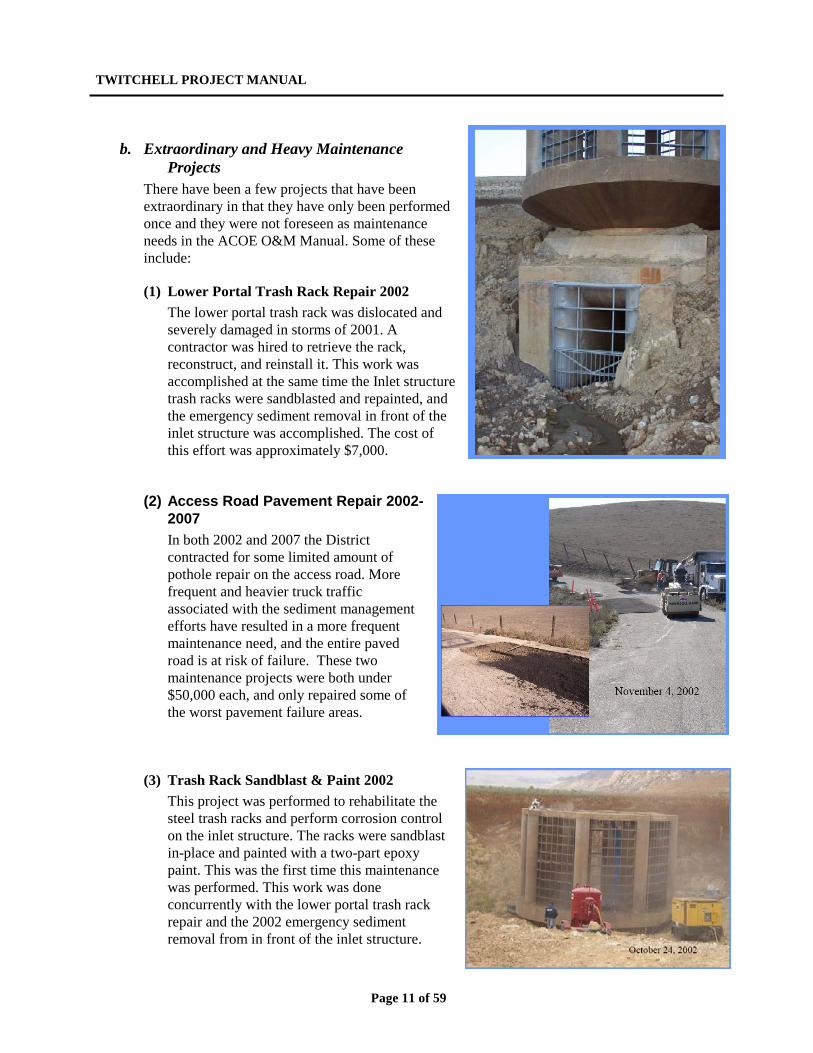
(4) Gate painting 2003 The gates were sandblasted and painted in 2003 by Shock-Hanley Corporation. The paint used was recommended by the Bureau of Reclamation and was a two part epoxy (bitumastic) Carboline Bitumastic 300 M parts A & B. Equipment and materials were lifted by crane to the tunnel entrance and moved by Quad-motorcycle and trailer to the gates. This effort took approximately 3 weeks at a cost of approximately $76,000.
(5) Gate Seal Replacement 2010 The goal of this project was to replace the gate rubber bottom seal and seal bar on all four gates, and to repair cavitation damage to the gates and floor threshold. This was accomplished in two months at a cost of approximately $55,000. This is the first project of
TWITCHELL PROJECT MANUAL
Page 13 of 59
Lower Portal
2002
this type performed on the gates by the District.
c. Capital Improvements Very few Capital Improvements have been completed at the dam since construction was complete in 1959. A few have been:
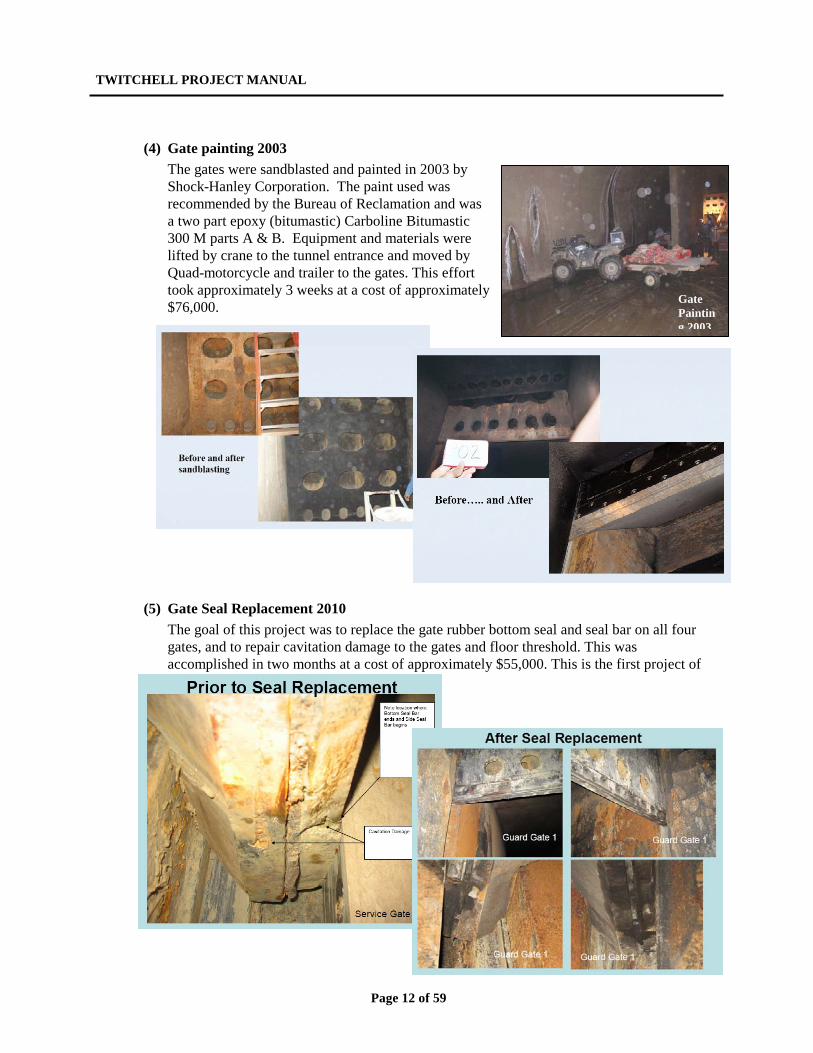
(1) Inlet Structure Lower Portal Modifications 1983-84 This project was the beginning of the “sediment flushing program” at the dam. In 1982 the District excavated sediment that had accumulated in front of the inlet structure to expose the steel cover over the lower inlet portal. This portal originally existed to allow passage of the Cuyama River while the dam was being built. It was then covered, as the primary operational inlet was the large trash racks at elevation 504’. After removing these plates, a trash rack was installed. At this time water was pumped over the dam from the stilling basin to facilitate some flushing of sediment into and through the tunnel. After flushing, approximately 400 CY of sediment was removed from the tunnel. The opening of this portal allowed for flushing of sediment through the base of the inlet structure.
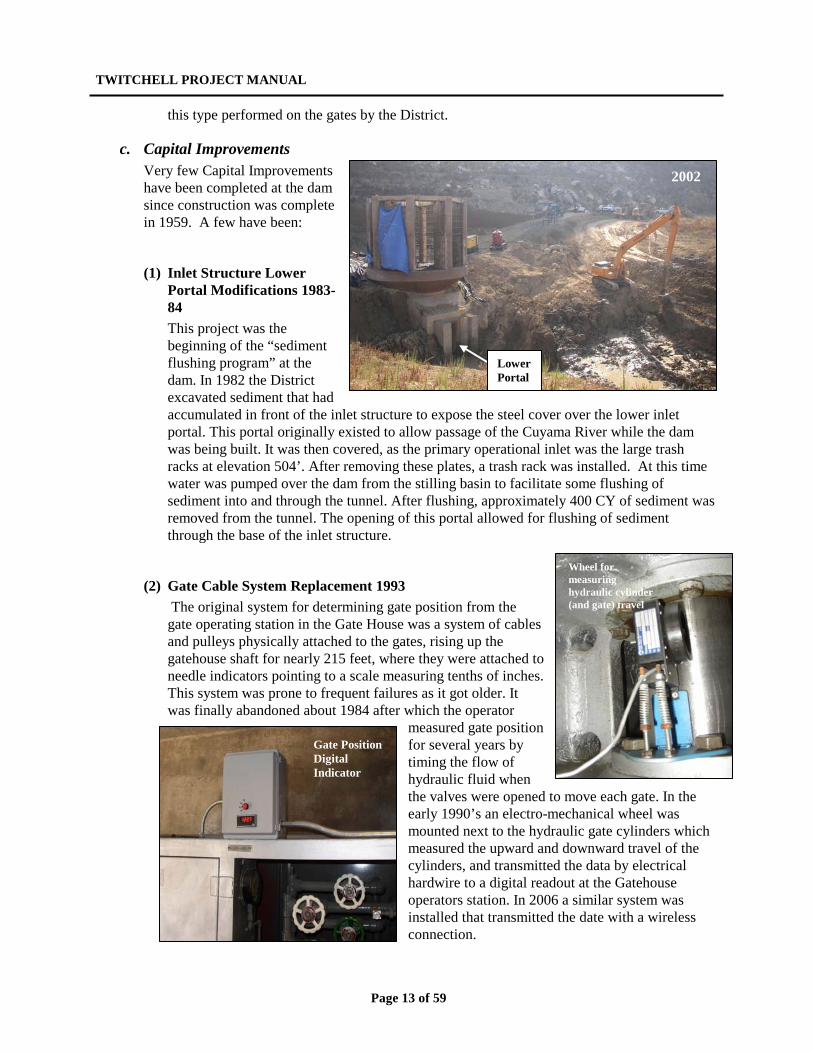
(2) Gate Cable System Replacement 1993 The original system for determining gate position from the gate operating station in the Gate House was a system of cables and pulleys physically attached to the gates, rising up the gatehouse shaft for nearly 215 feet, where they were attached to needle indicators pointing to a scale measuring tenths of inches. This system was prone to frequent failures as it got older. It was finally abandoned about 1984 after which the operator
measured gate position for several years by timing the flow of hydraulic fluid when the valves were opened to move each gate. In the early 1990’s an electro-mechanical wheel was mounted next to the hydraulic gate cylinders which measured the upward and downward travel of the cylinders, and transmitted the data by electrical hardwire to a digital readout at the Gatehouse operators station. In 2006 a similar system was installed that transmitted the date with a wireless connection.
Gate Position Digital Indicator
Wheel for measuring hydraulic cylinder (and gate) travel
TWITCHELL PROJECT MANUAL
Page 14 of 59
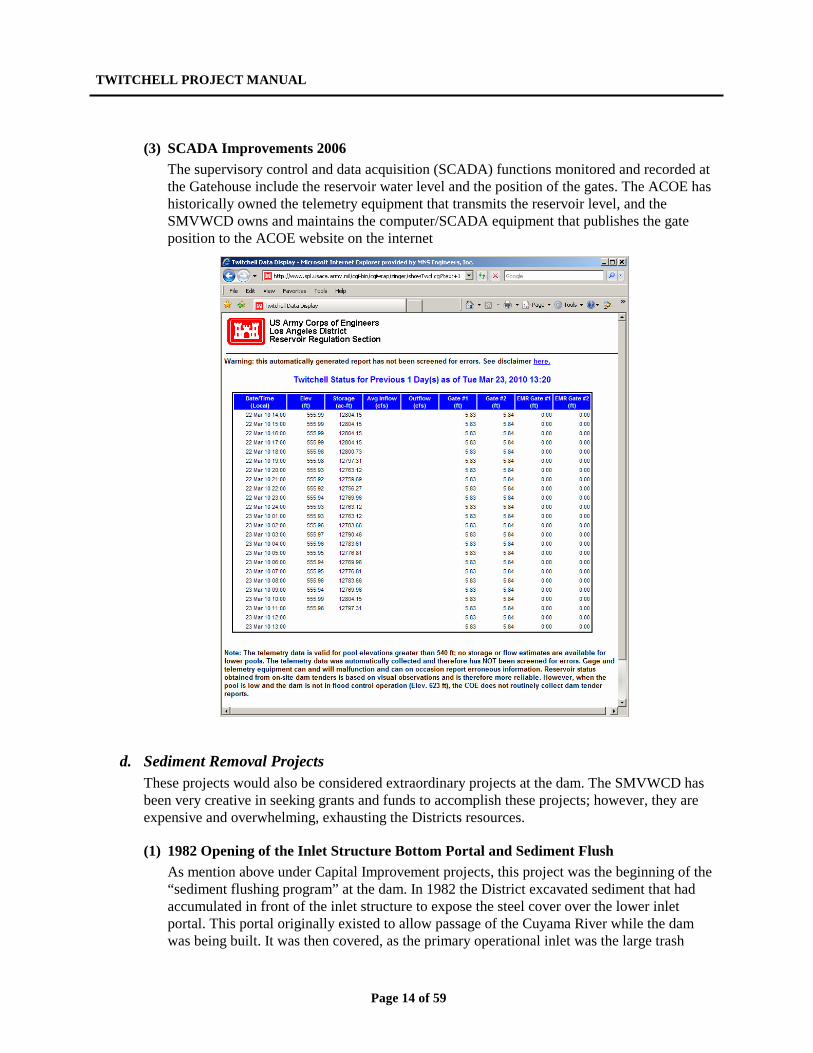
(3) SCADA Improvements 2006 The supervisory control and data acquisition (SCADA) functions monitored and recorded at the Gatehouse include the reservoir water level and the position of the gates. The ACOE has historically owned the telemetry equipment that transmits the reservoir level, and the SMVWCD owns and maintains the computer/SCADA equipment that publishes the gate position to the ACOE website on the internet
d. Sediment Removal Projects These projects would also be considered extraordinary projects at the dam. The SMVWCD has been very creative in seeking grants and funds to accomplish these projects; however, they are expensive and overwhelming, exhausting the Districts resources.
(1) 1982 Opening of the Inlet Structure Bottom Portal and Sediment Flush As mention above under Capital Improvement projects, this project was the beginning of the “sediment flushing program” at the dam. In 1982 the District excavated sediment that had accumulated in front of the inlet structure to expose the steel cover over the lower inlet portal. This portal originally existed to allow passage of the Cuyama River while the dam was being built. It was then covered, as the primary operational inlet was the large trash
TWITCHELL PROJECT MANUAL
Page 15 of 59
racks at elevation 504’. After removing these plates, a trash rack was installed. At this time water was pumped over the dam from the stilling basin to facilitate some flushing of sediment into and through the tunnel. After flushing, approximately 400 CY of sediment was removed from the tunnel. The opening of this portal allowed for flushing of sediment through the base of the inlet structure.
(2) 2000 Emergency Sediment Removal at Upstream Inlet Structure and Downstream Stilling Basin and Cuyama River Channel In 1998 a large storm followed the Logan fire of 1997 bring large amounts of sediment into the reservoir. The flood waters were rising so rapidly that the ACOE directed the Dam Caretaker to open the gates 5’-0”, creating a flow of approximately 5,000 cfs. This release brought large amounts of sediment through the dam, scoured much of the sediment out of the stilling basin, and created a sediment dam in the Cuyama River, much like what exists at the time of this writing (2010). For fear that another storm with large releases could damage downstream facilities, and possibly the dam, Wood Bros., Inc, a construction contractor, was contracted to remove debris and sediment from the Inlet Structure and Outlet Stilling basin in the summer of 2000. They prepared an access road by grading an unimproved access road from the improved access road to the Reservoir (approx. ¾ mi.), grading a new access road along the shoreline of the reservoir (approx. ½ mi.), and prepared a rock supported access drive from the shore across the sediment for inlet structure access (approx 350-400 ft.). They also repaired and re-graded an access road to the stilling basin from the south side of the dam. Their scope was to remove to the shoreline approximately 20-25 feet of debris and soil from the “base of the trash rack”. They also removed for repair the damaged trash rack. They also removed sediment from below the downstream stilling basin.
TWITCHELL PROJECT MANUAL
Page 16 of 59
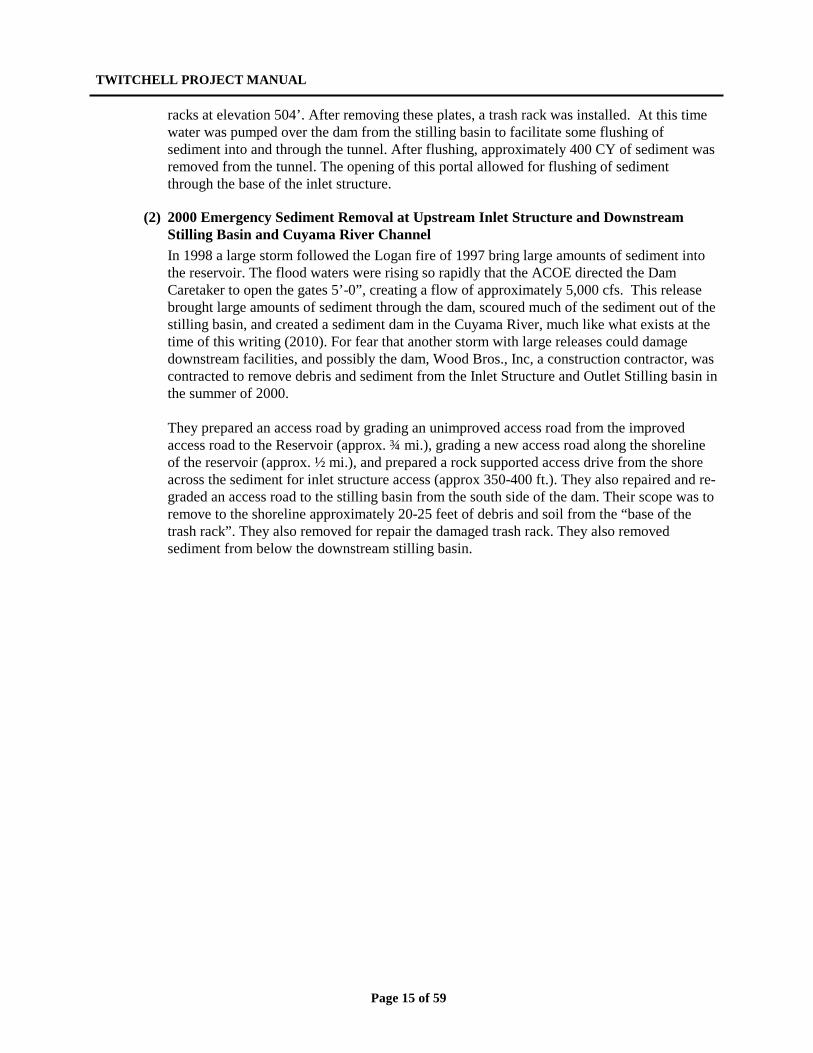
(3) 2002 Emergency Sediment Removal Project This project was accomplished following heavy storms in 2001 that brought large amounts of sediment to the stilling basin. The SMVWCD hired John Madonna Construction to excavate approximately 4500CY of sediment from in front of the upstream inlet structure. This was
accomplished for approximately $90.000.
TWITCHELL PROJECT MANUAL
Page 17 of 59
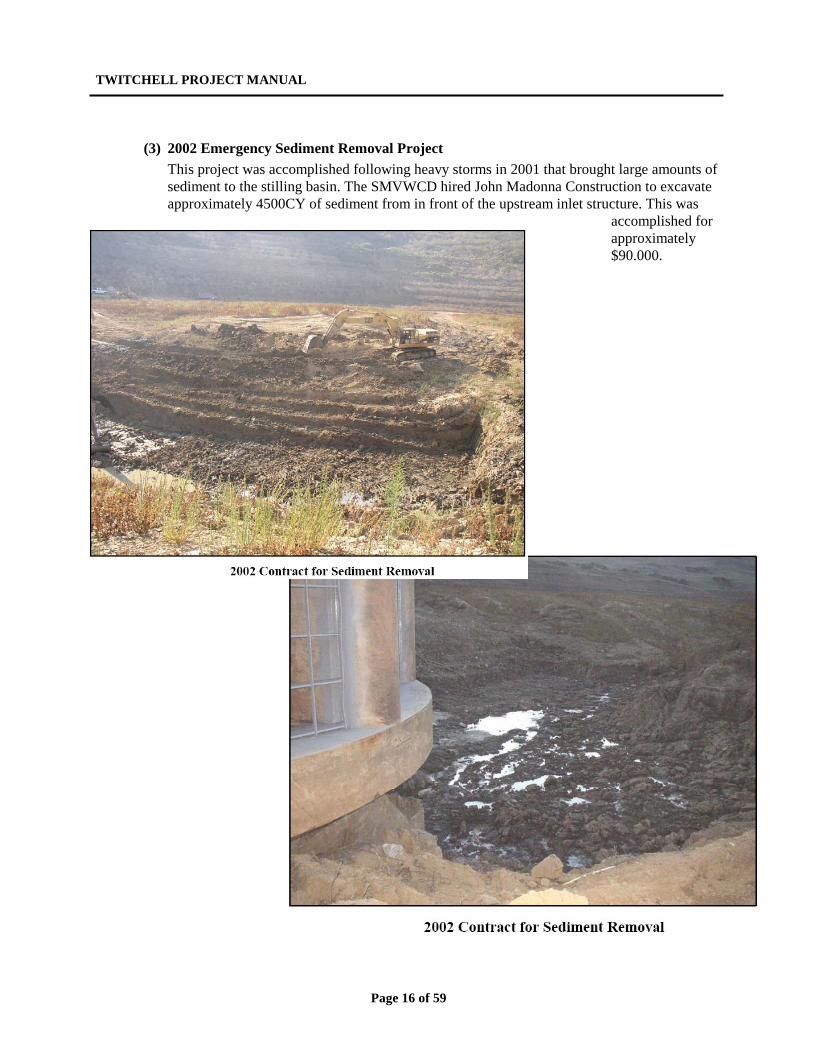
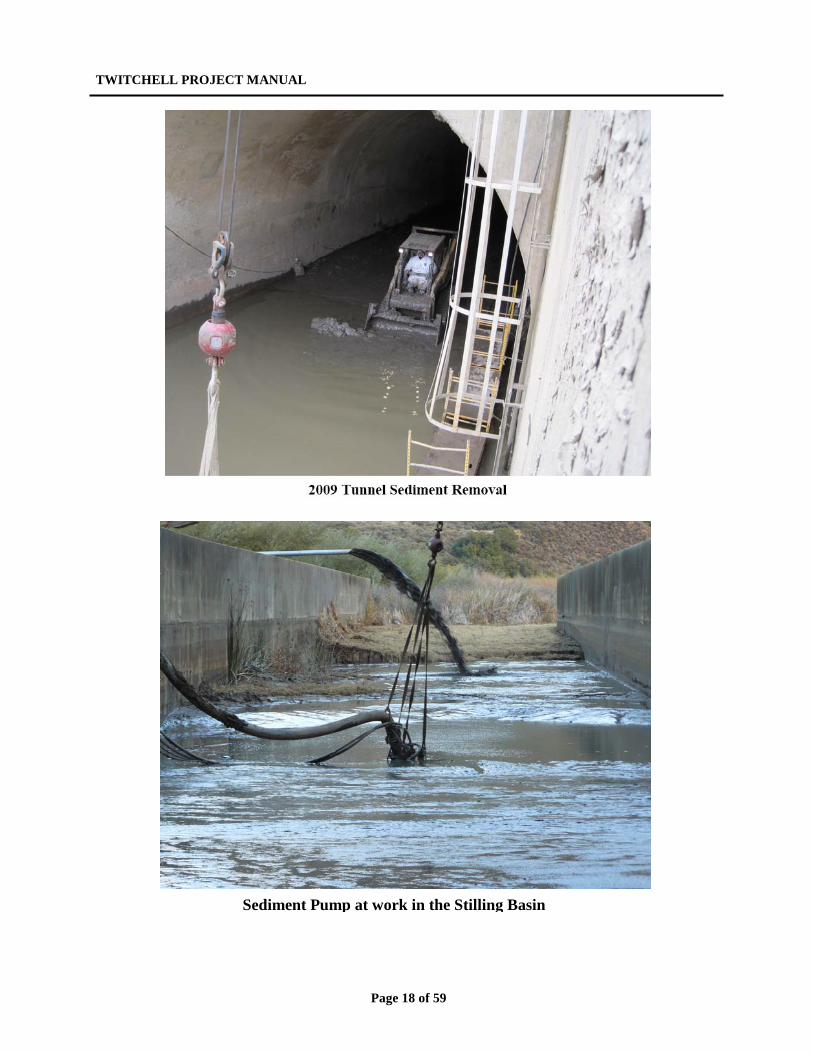
(4) 2009 Tunnel Sediment Removal Project During the annual flushing operation in the spring of 2009, a large wall of clay sediment rushed into the outlet tunnel, literally plugging it. The 625’ upstream of the gates was 80-90% blocked with sediment. Approximately 4-% of the 475’ downstream of the gates was blocked.
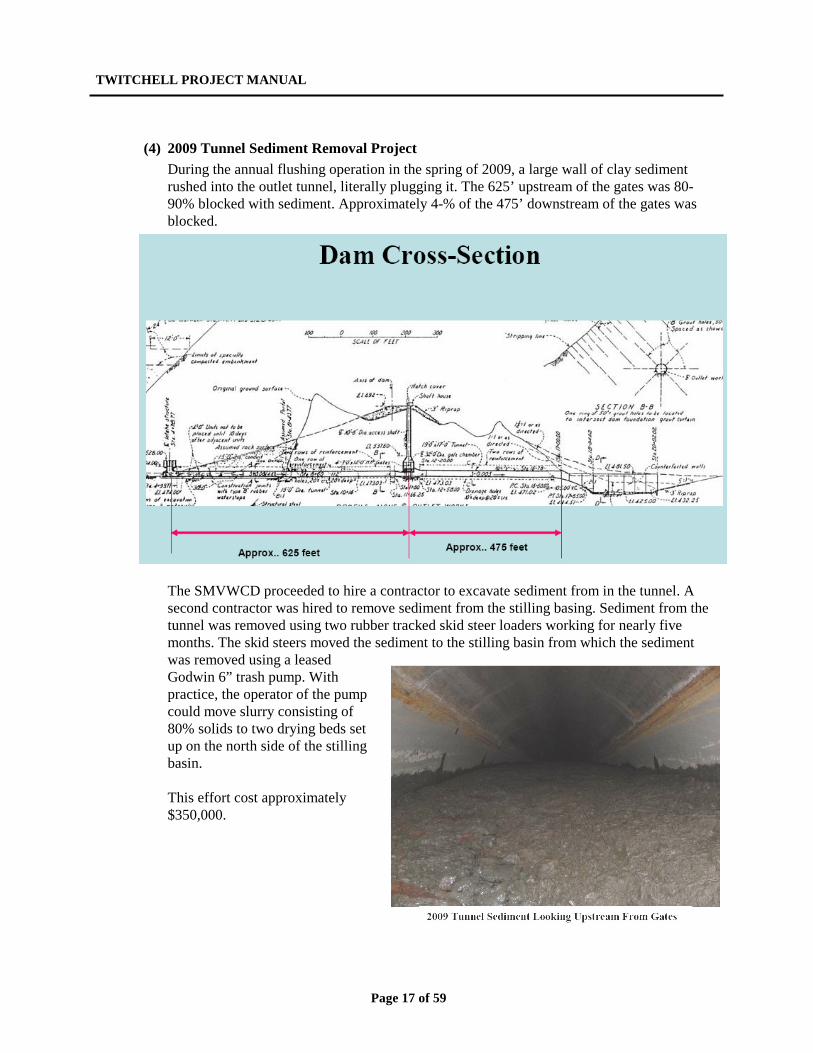
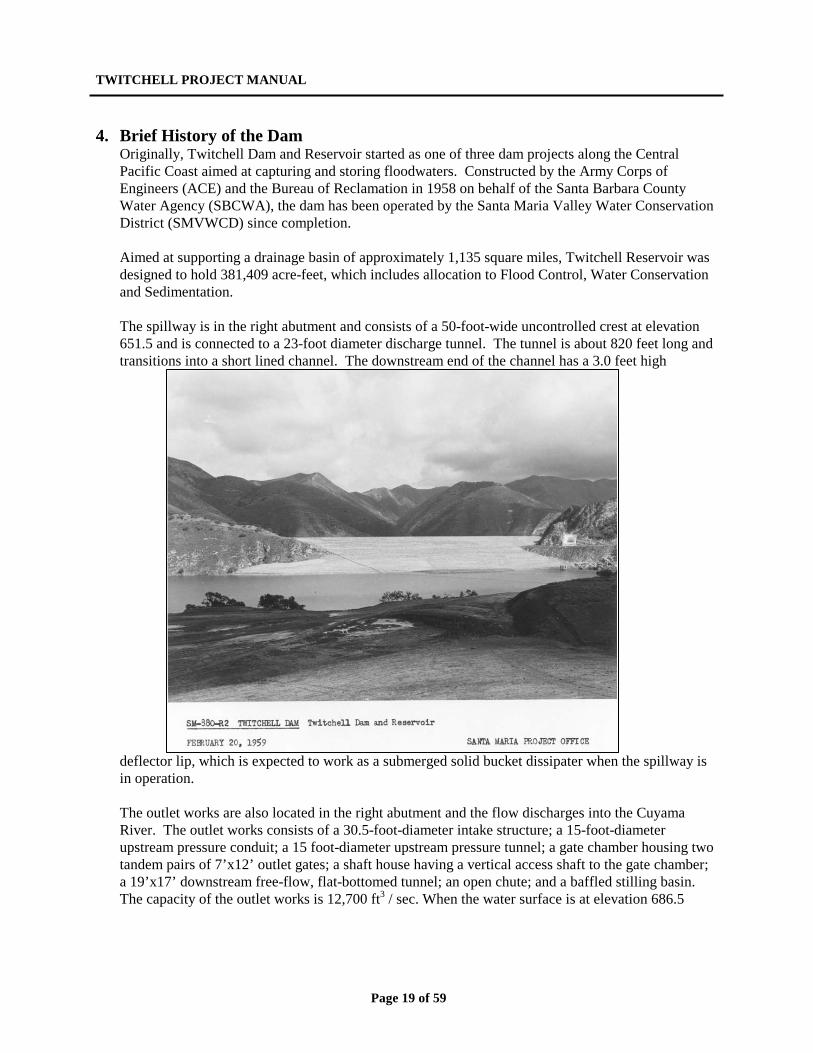
The SMVWCD proceeded to hire a contractor to excavate sediment from in the tunnel. A second contractor was hired to remove sediment from the stilling basing. Sediment from the tunnel was removed using two rubber tracked skid steer loaders working for nearly five months. The skid steers moved the sediment to the stilling basin from which the sediment was removed using a leased Godwin 6” trash pump. With practice, the operator of the pump could move slurry consisting of 80% solids to two drying beds set up on the north side of the stilling basin. This effort cost approximately $350,000.
TWITCHELL PROJECT MANUAL
Page 18 of 59
Sediment Pump at work in the Stilling Basin
TWITCHELL PROJECT MANUAL
Page 19 of 59
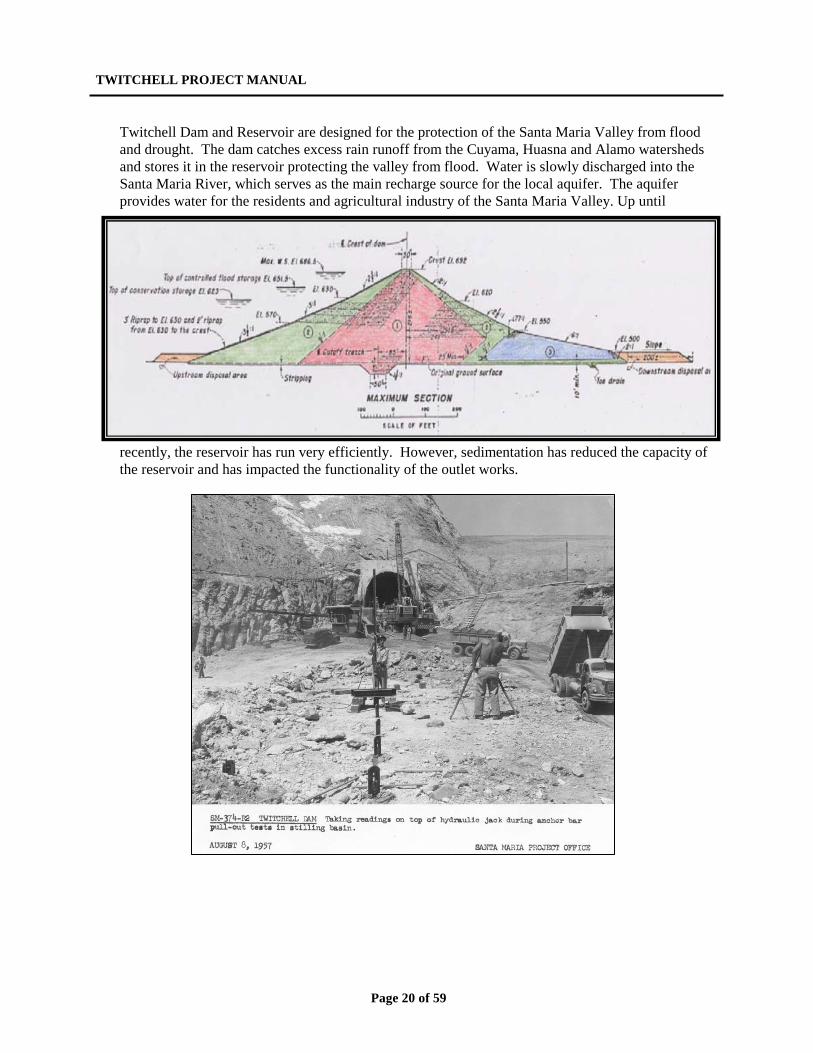
4. Brief History of the Dam
Originally, Twitchell Dam and Reservoir started as one of three dam projects along the Central Pacific Coast aimed at capturing and storing floodwaters. Constructed by the Army Corps of Engineers (ACE) and the Bureau of Reclamation in 1958 on behalf of the Santa Barbara County Water Agency (SBCWA), the dam has been operated by the Santa Maria Valley Water Conservation District (SMVWCD) since completion. Aimed at supporting a drainage basin of approximately 1,135 square miles, Twitchell Reservoir was designed to hold 381,409 acre-feet, which includes allocation to Flood Control, Water Conservation and Sedimentation. The spillway is in the right abutment and consists of a 50-foot-wide uncontrolled crest at elevation 651.5 and is connected to a 23-foot diameter discharge tunnel. The tunnel is about 820 feet long and transitions into a short lined channel. The downstream end of the channel has a 3.0 feet high
deflector lip, which is expected to work as a submerged solid bucket dissipater when the spillway is in operation.
The outlet works are also located in the right abutment and the flow discharges into the Cuyama River. The outlet works consists of a 30.5-foot-diameter intake structure; a 15-foot-diameter upstream pressure conduit; a 15 foot-diameter upstream pressure tunnel; a gate chamber housing two tandem pairs of 7’x12’ outlet gates; a shaft house having a vertical access shaft to the gate chamber; a 19’x17’ downstream free-flow, flat-bottomed tunnel; an open chute; and a baffled stilling basin. The capacity of the outlet works is 12,700 ft3 / sec. When the water surface is at elevation 686.5
TWITCHELL PROJECT MANUAL
Page 20 of 59
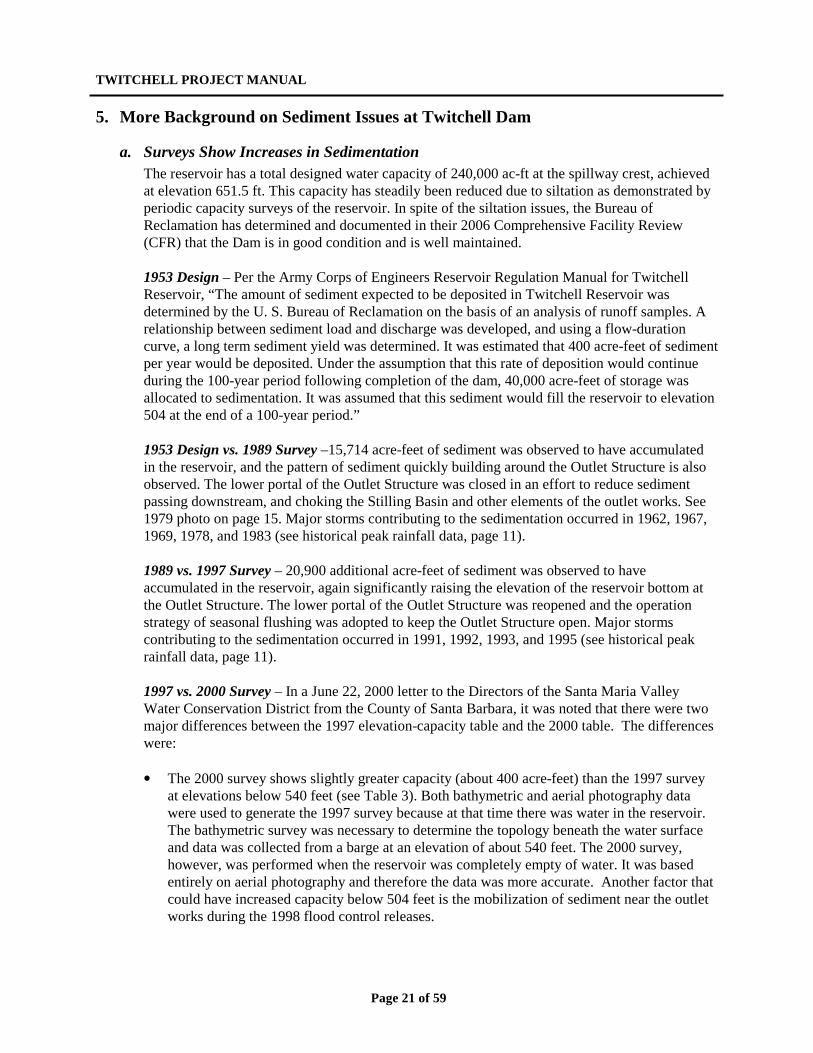
Twitchell Dam and Reservoir are designed for the protection of the Santa Maria Valley from flood and drought. The dam catches excess rain runoff from the Cuyama, Huasna and Alamo watersheds and stores it in the reservoir protecting the valley from flood. Water is slowly discharged into the Santa Maria River, which serves as the main recharge source for the local aquifer. The aquifer provides water for the residents and agricultural industry of the Santa Maria Valley. Up until
recently, the reservoir has run very efficiently. However, sedimentation has reduced the capacity of the reservoir and has impacted the functionality of the outlet works.
TWITCHELL PROJECT MANUAL
Page 21 of 59
5. More Background on Sediment Issues at Twitchell Dam
a. Surveys Show Increases in Sedimentation The reservoir has a total designed water capacity of 240,000 ac-ft at the spillway crest, achieved at elevation 651.5 ft. This capacity has steadily been reduced due to siltation as demonstrated by periodic capacity surveys of the reservoir. In spite of the siltation issues, the Bureau of Reclamation has determined and documented in their 2006 Comprehensive Facility Review (CFR) that the Dam is in good condition and is well maintained.
1953 Design – Per the Army Corps of Engineers Reservoir Regulation Manual for Twitchell Reservoir, “The amount of sediment expected to be deposited in Twitchell Reservoir was determined by the U. S. Bureau of Reclamation on the basis of an analysis of runoff samples. A relationship between sediment load and discharge was developed, and using a flow-duration curve, a long term sediment yield was determined. It was estimated that 400 acre-feet of sediment per year would be deposited. Under the assumption that this rate of deposition would continue during the 100-year period following completion of the dam, 40,000 acre-feet of storage was allocated to sedimentation. It was assumed that this sediment would fill the reservoir to elevation 504 at the end of a 100-year period.” 1953 Design vs. 1989 Survey –15,714 acre-feet of sediment was observed to have accumulated in the reservoir, and the pattern of sediment quickly building around the Outlet Structure is also observed. The lower portal of the Outlet Structure was closed in an effort to reduce sediment passing downstream, and choking the Stilling Basin and other elements of the outlet works. See 1979 photo on page 15. Major storms contributing to the sedimentation occurred in 1962, 1967, 1969, 1978, and 1983 (see historical peak rainfall data, page 11). 1989 vs. 1997 Survey – 20,900 additional acre-feet of sediment was observed to have accumulated in the reservoir, again significantly raising the elevation of the reservoir bottom at the Outlet Structure. The lower portal of the Outlet Structure was reopened and the operation strategy of seasonal flushing was adopted to keep the Outlet Structure open. Major storms contributing to the sedimentation occurred in 1991, 1992, 1993, and 1995 (see historical peak rainfall data, page 11). 1997 vs. 2000 Survey – In a June 22, 2000 letter to the Directors of the Santa Maria Valley Water Conservation District from the County of Santa Barbara, it was noted that there were two major differences between the 1997 elevation-capacity table and the 2000 table. The differences were:
• The 2000 survey shows slightly greater capacity (about 400 acre-feet) than the 1997 survey
at elevations below 540 feet (see Table 3). Both bathymetric and aerial photography data were used to generate the 1997 survey because at that time there was water in the reservoir. The bathymetric survey was necessary to determine the topology beneath the water surface and data was collected from a barge at an elevation of about 540 feet. The 2000 survey, however, was performed when the reservoir was completely empty of water. It was based entirely on aerial photography and therefore the data was more accurate. Another factor that could have increased capacity below 504 feet is the mobilization of sediment near the outlet works during the 1998 flood control releases.
TWITCHELL PROJECT MANUAL
Page 22 of 59
• The 2000 survey shows a loss of over 5,100 acre-feet capacity since 1952 throughout the entire reservoir (below 651.5 feet elevation), 4,217 of which is in the conservation pool (below 623 feet elevation) (see Survey Results summary table). The reason for this significant loss of capacity is the significant storm season of 1998 and the record inflow of sediment and debris that occurred throughout the entire reservoir system.
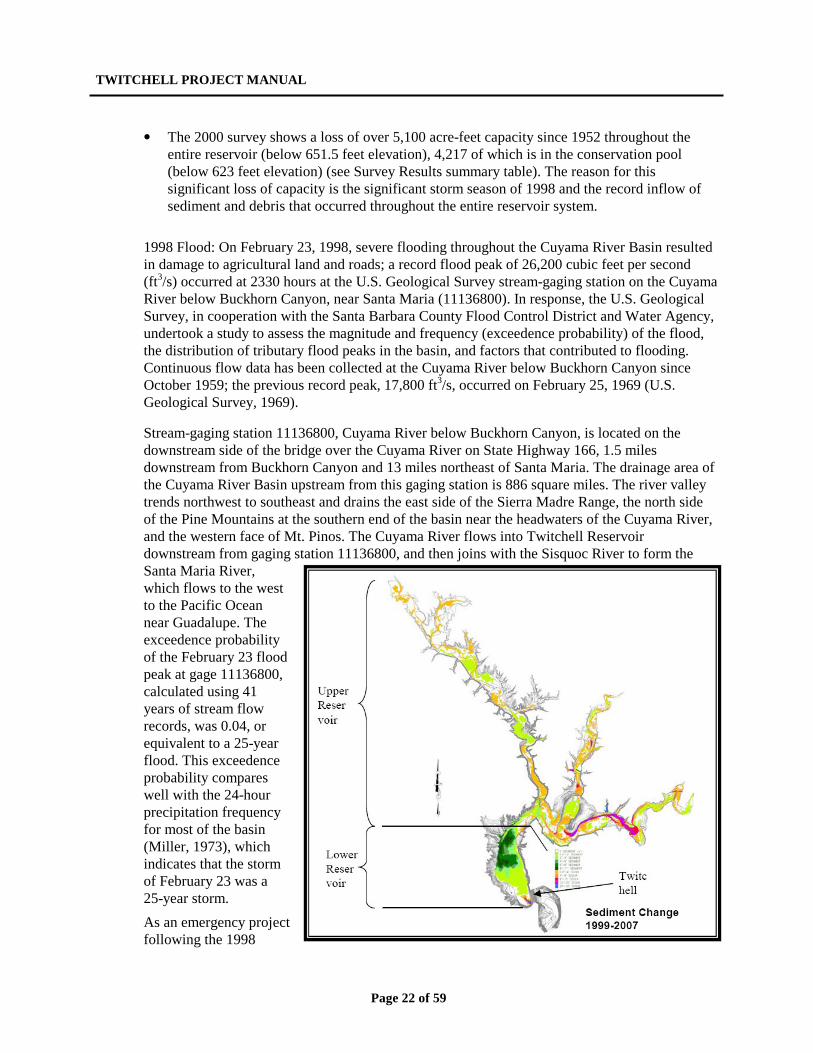
1998 Flood: On February 23, 1998, severe flooding throughout the Cuyama River Basin resulted in damage to agricultural land and roads; a record flood peak of 26,200 cubic feet per second (ft3/s) occurred at 2330 hours at the U.S. Geological Survey stream-gaging station on the Cuyama River below Buckhorn Canyon, near Santa Maria (11136800). In response, the U.S. Geological Survey, in cooperation with the Santa Barbara County Flood Control District and Water Agency, undertook a study to assess the magnitude and frequency (exceedence probability) of the flood, the distribution of tributary flood peaks in the basin, and factors that contributed to flooding. Continuous flow data has been collected at the Cuyama River below Buckhorn Canyon since October 1959; the previous record peak, 17,800 ft3/s, occurred on February 25, 1969 (U.S. Geological Survey, 1969).
Stream-gaging station 11136800, Cuyama River below Buckhorn Canyon, is located on the downstream side of the bridge over the Cuyama River on State Highway 166, 1.5 miles downstream from Buckhorn Canyon and 13 miles northeast of Santa Maria. The drainage area of the Cuyama River Basin upstream from this gaging station is 886 square miles. The river valley trends northwest to southeast and drains the east side of the Sierra Madre Range, the north side of the Pine Mountains at the southern end of the basin near the headwaters of the Cuyama River, and the western face of Mt. Pinos. The Cuyama River flows into Twitchell Reservoir downstream from gaging station 11136800, and then joins with the Sisquoc River to form the Santa Maria River, which flows to the west to the Pacific Ocean near Guadalupe. The exceedence probability of the February 23 flood peak at gage 11136800, calculated using 41 years of stream flow records, was 0.04, or equivalent to a 25-year flood. This exceedence probability compares well with the 24-hour precipitation frequency for most of the basin (Miller, 1973), which indicates that the storm of February 23 was a 25-year storm.
As an emergency project following the 1998
TWITCHELL PROJECT MANUAL
Page 23 of 59
storms, which followed erosion-enhancing fires in the Cuyama River drainage basin, a contractor removed sediment both upstream and downstream of the dam to maintain the outlet works clear. 2000 vs. 2007 Survey –. In 2002 the SMVWCD contracted with Madonna Construction to remove sediment around the Outlet Structure on the upstream side of the dam, and the debris racks were cleaned, repaired and painted. A permitting effort is underway at the time of this writing to remove additional sediment downstream of the dam by cleaning the stilling basin and creating a pilot channel along the creek alignment for up to 3000 feet downstream. Sediment now fills the reservoir eliminating any capacity to the 524 elevation. This is significantly more than the 100-year sediment level of elevation 504 predicted in 1953. Major storms contributing to the sedimentation occurred in 2001 and 2005 (see historical peak rainfall data, below). The total sediment now in the reservoir below the spillway (elev. 651.5) is 42,357 acre-feet, which is a reduction of storage in the conservation allocation of 26.3%. The 2000 survey and analysis showed a total of 41,774 acre-feet of sediment in the reservoir, which is an increase of 583 acre-feet of sediment, a 1.4% increase.
b. Downstream Sediment History The 2007 survey represents the second survey for the downstream area of the dam. The first was performed in 1999. It was not in the scope of the 2007 study to graphically depict or quantify deposits of sediment downstream. However, the survey data base for this type of analysis has been established and this study can be performed when or if it is determined desirable to generate the data. There is currently a project in permitting and preliminary design to clean the stilling basin and excavate a pilot channel in the Cuyama River for approximately 1500-3000 feet downstream to eliminate the building mound of clay sediment backing up the stilling basin into the tunnel, keep water flowing and keeping the water in its original channel. The permits, being prepared and processed for the District, includes environmental studies, Fish & Game, County of Santa Barbara , the Army Corps of Engineers and associated consultations with other Federal agencies. The schedule for performance of this work is TBD.
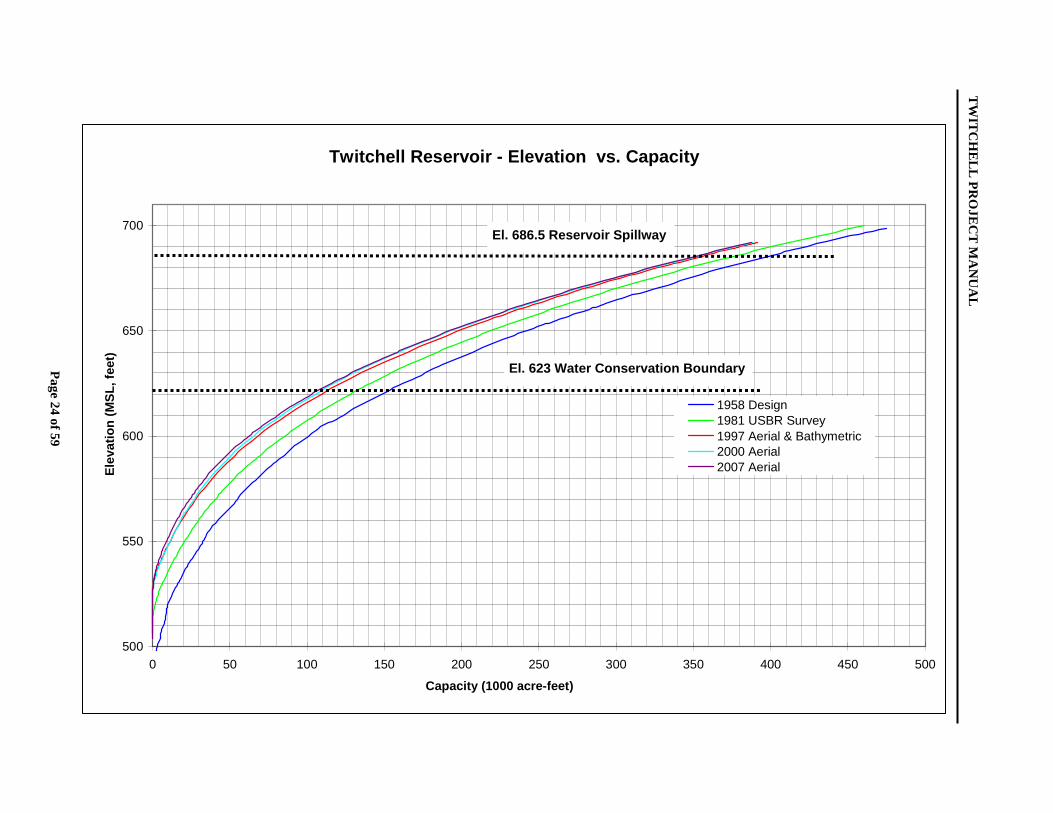
c. Chart of Historical Elevation vs. Capacity The chart on the following page shows a graphical representation of the Change in Capacity over time due to siltation based on the results of the 1981, 1987, 2000, and 2007 topographic maps.
TW
ITC
HE
LL
PRO
JEC
T M
AN
UA
L
Page 24 of 59
Twitchell Reservoir - Elevation vs. Capacity
500
550
600
650
700
0 50 100 150 200 250 300 350 400 450 500
Capacity (1000 acre-feet)
Ele
vatio
n (M
SL,
feet
)
1958 Design1981 USBR Survey1997 Aerial & Bathymetric2000 Aerial2007 Aerial
El. 623 Water Conservation Boundary
El. 686.5 Reservoir Spillway
TWITCHELL PROJECT MANUAL
Page 25 of 59
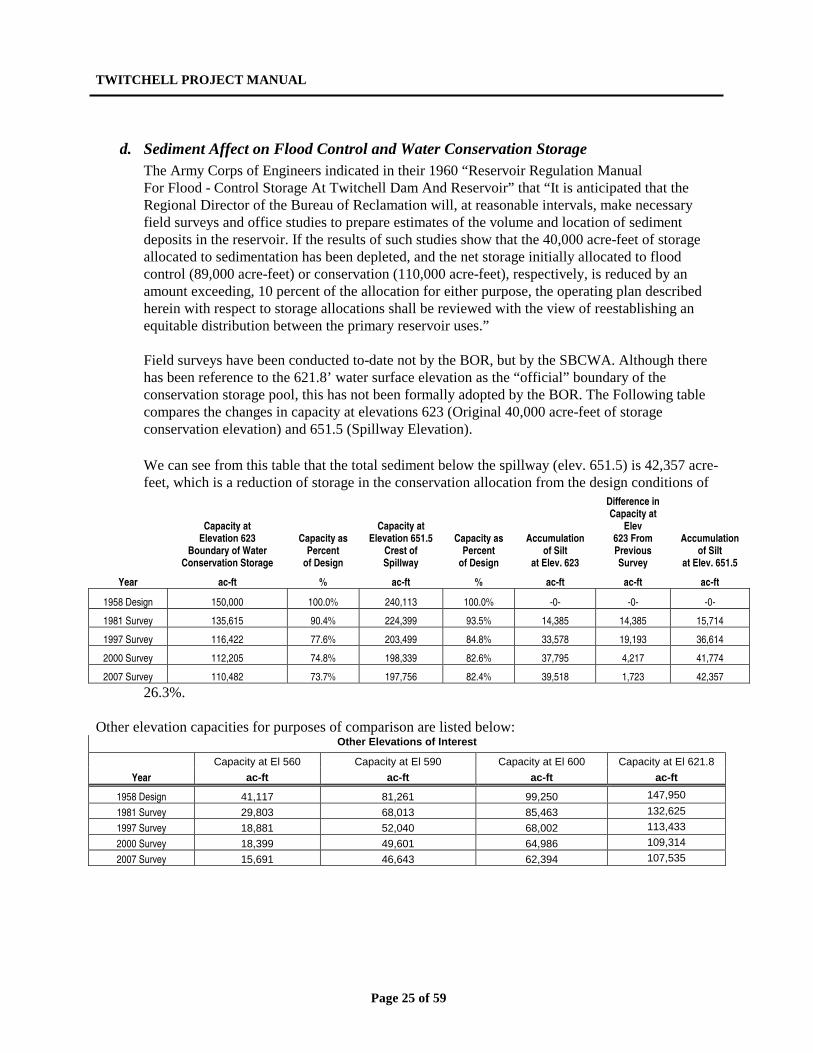
d. Sediment Affect on Flood Control and Water Conservation Storage The Army Corps of Engineers indicated in their 1960 “Reservoir Regulation Manual For Flood - Control Storage At Twitchell Dam And Reservoir” that “It is anticipated that the Regional Director of the Bureau of Reclamation will, at reasonable intervals, make necessary field surveys and office studies to prepare estimates of the volume and location of sediment deposits in the reservoir. If the results of such studies show that the 40,000 acre-feet of storage allocated to sedimentation has been depleted, and the net storage initially allocated to flood control (89,000 acre-feet) or conservation (110,000 acre-feet), respectively, is reduced by an amount exceeding, 10 percent of the allocation for either purpose, the operating plan described herein with respect to storage allocations shall be reviewed with the view of reestablishing an equitable distribution between the primary reservoir uses.” Field surveys have been conducted to-date not by the BOR, but by the SBCWA. Although there has been reference to the 621.8’ water surface elevation as the “official” boundary of the conservation storage pool, this has not been formally adopted by the BOR. The Following table compares the changes in capacity at elevations 623 (Original 40,000 acre-feet of storage conservation elevation) and 651.5 (Spillway Elevation). We can see from this table that the total sediment below the spillway (elev. 651.5) is 42,357 acre-feet, which is a reduction of storage in the conservation allocation from the design conditions of
26.3%. Other elevation capacities for purposes of comparison are listed below:
Other Elevations of Interest
Capacity at El 560 Capacity at El 590 Capacity at El 600 Capacity at El 621.8 Year ac-ft ac-ft ac-ft ac-ft
1958 Design 41,117 81,261 99,250 147,950
1981 Survey 29,803 68,013 85,463 132,625
1997 Survey 18,881 52,040 68,002 113,433
2000 Survey 18,399 49,601 64,986 109,314
2007 Survey 15,691 46,643 62,394 107,535
Capacity at Elevation 623
Boundary of Water Conservation Storage
Capacity as
Percent of Design
Capacity at Elevation 651.5
Crest of Spillway
Capacity as
Percent of Design
Accumulation
of Silt at Elev. 623
Difference in Capacity at
Elev 623 From Previous Survey
Accumulation
of Silt at Elev. 651.5
Year ac-ft % ac-ft % ac-ft ac-ft ac-ft
1958 Design 150,000 100.0% 240,113 100.0% -0- -0- -0-
1981 Survey 135,615 90.4% 224,399 93.5% 14,385 14,385 15,714
1997 Survey 116,422 77.6% 203,499 84.8% 33,578 19,193 36,614
2000 Survey 112,205 74.8% 198,339 82.6% 37,795 4,217 41,774
2007 Survey 110,482 73.7% 197,756 82.4% 39,518 1,723 42,357
TWITCHELL PROJECT MANUAL
Page 26 of 59
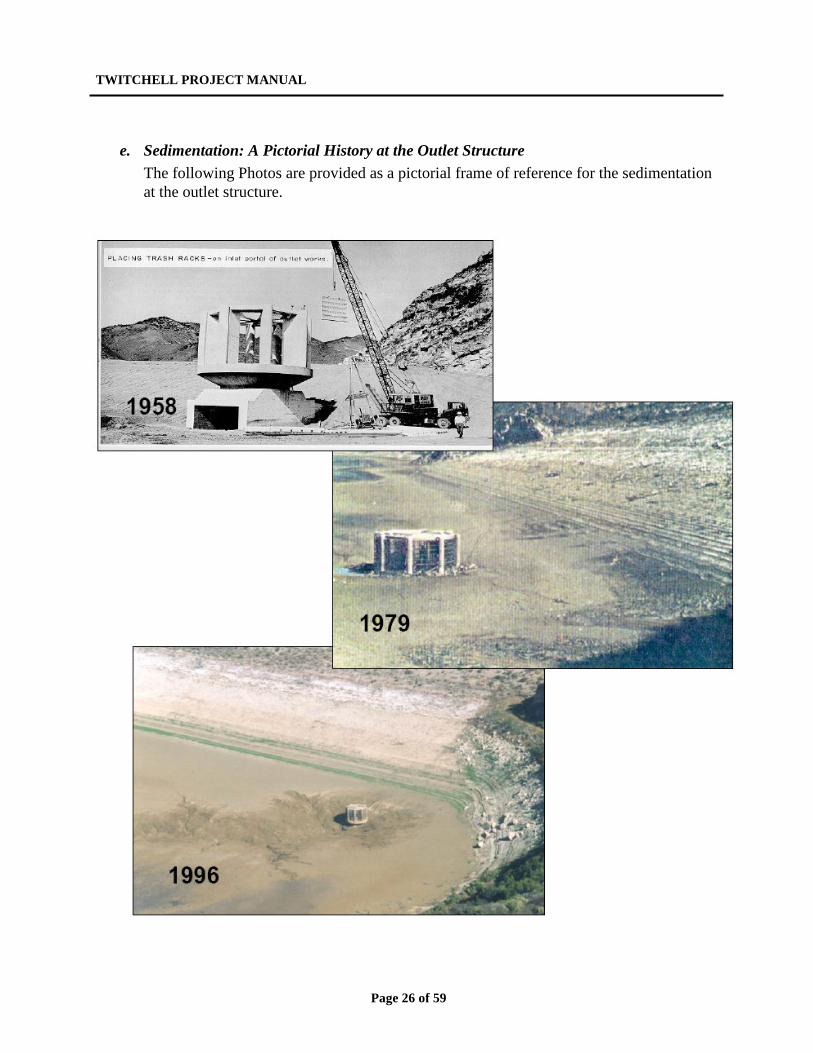
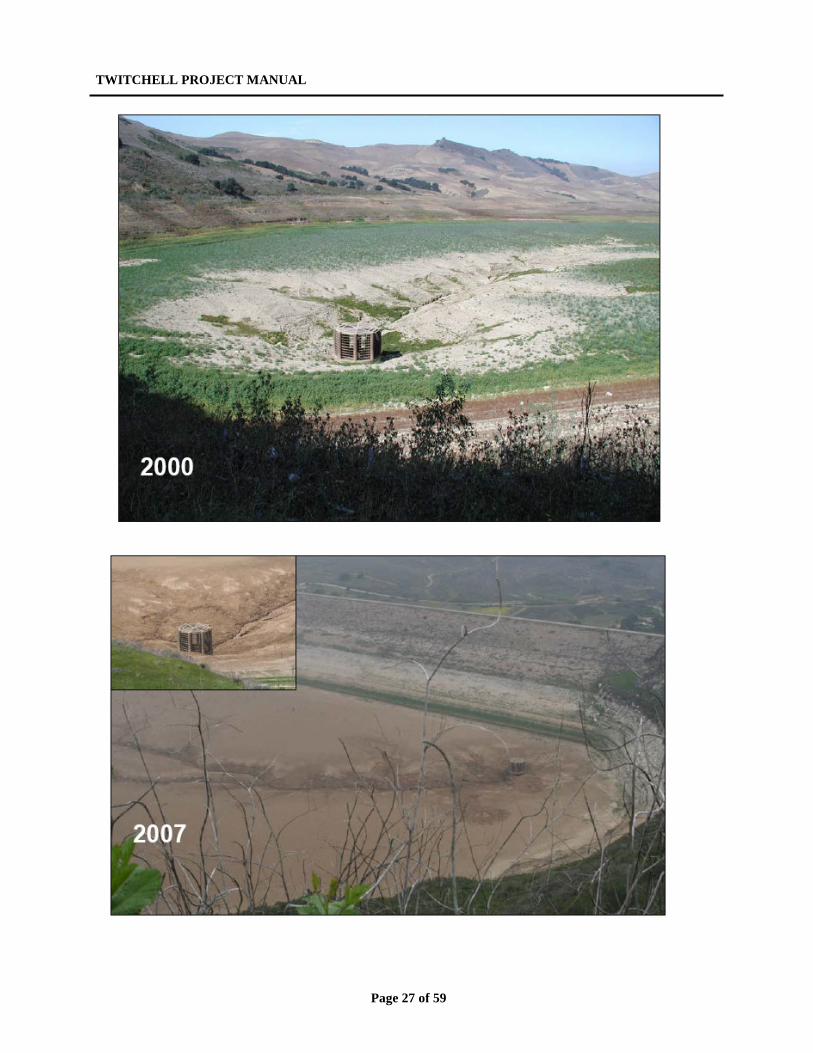
e. Sedimentation: A Pictorial History at the Outlet Structure The following Photos are provided as a pictorial frame of reference for the sedimentation at the outlet structure.
TWITCHELL PROJECT MANUAL
Page 27 of 59
TWITCHELL PROJECT MANUAL
Page 28 of 59
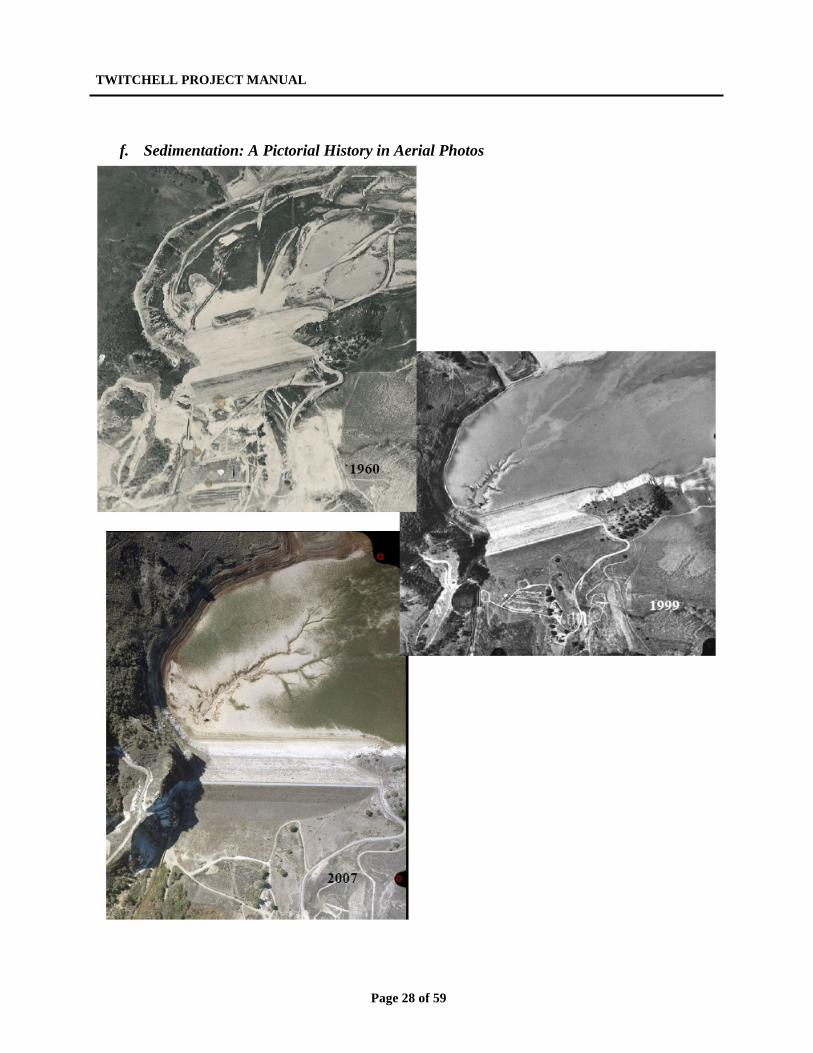
f. Sedimentation: A Pictorial History in Aerial Photos
TWITCHELL PROJECT MANUAL
Page 29 of 59
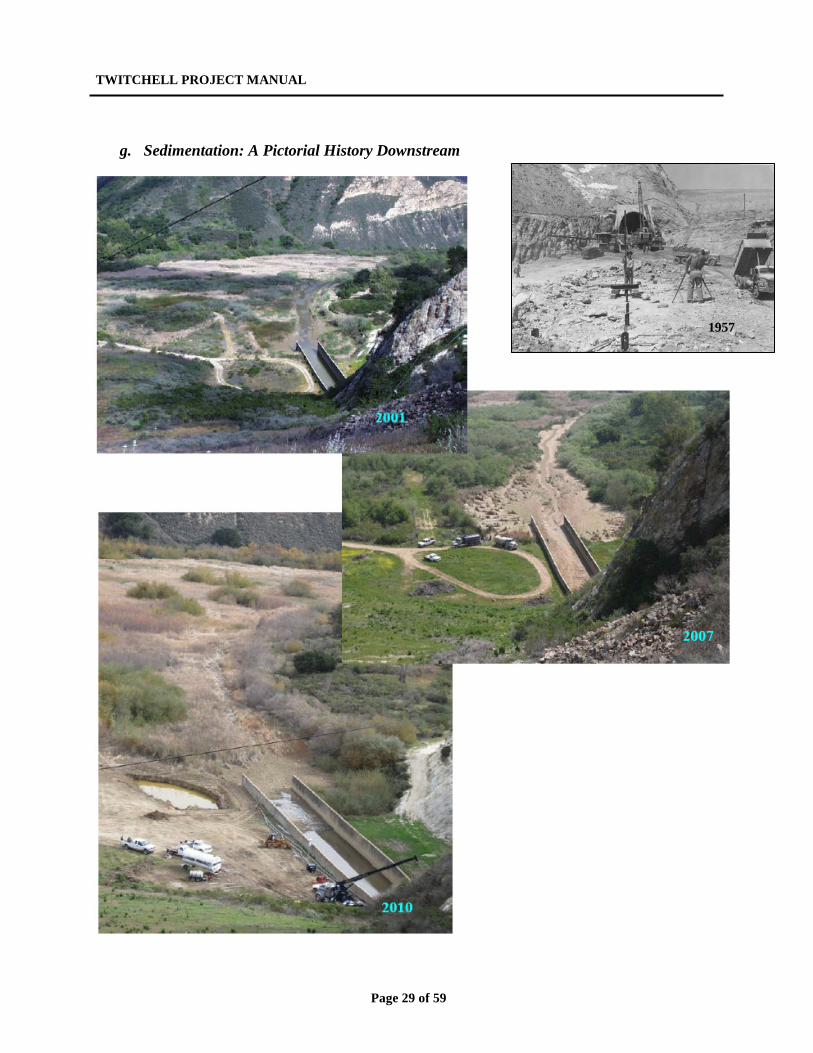
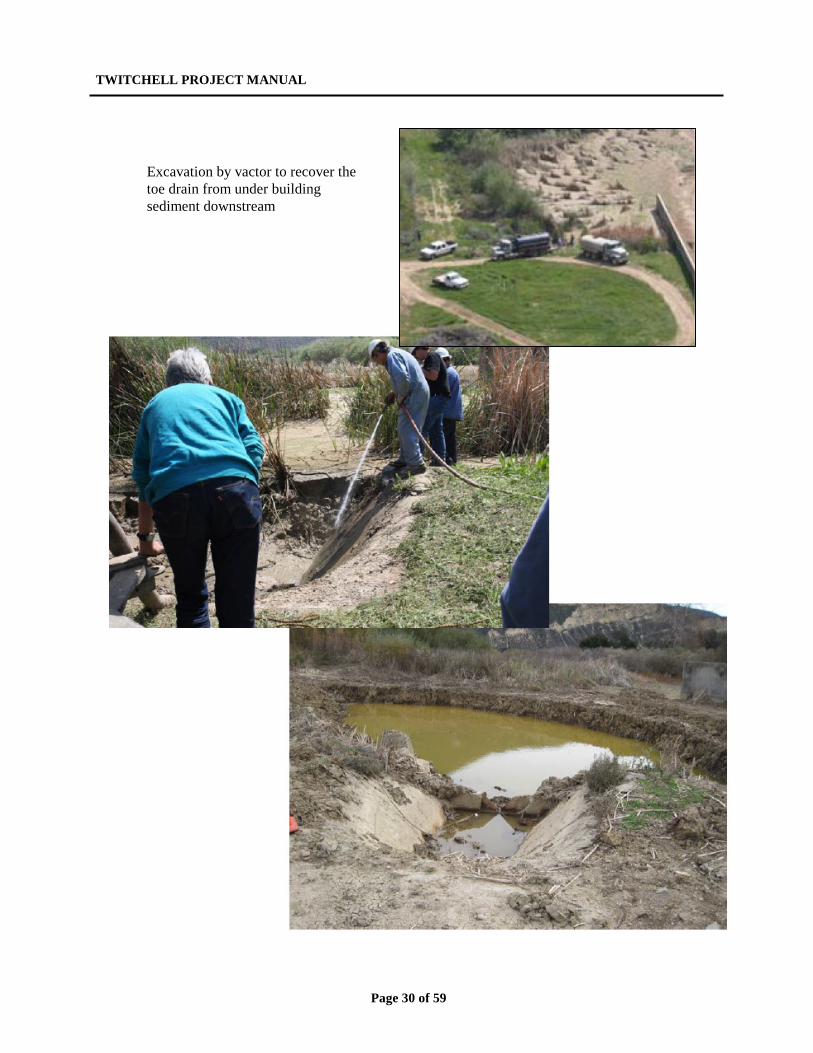
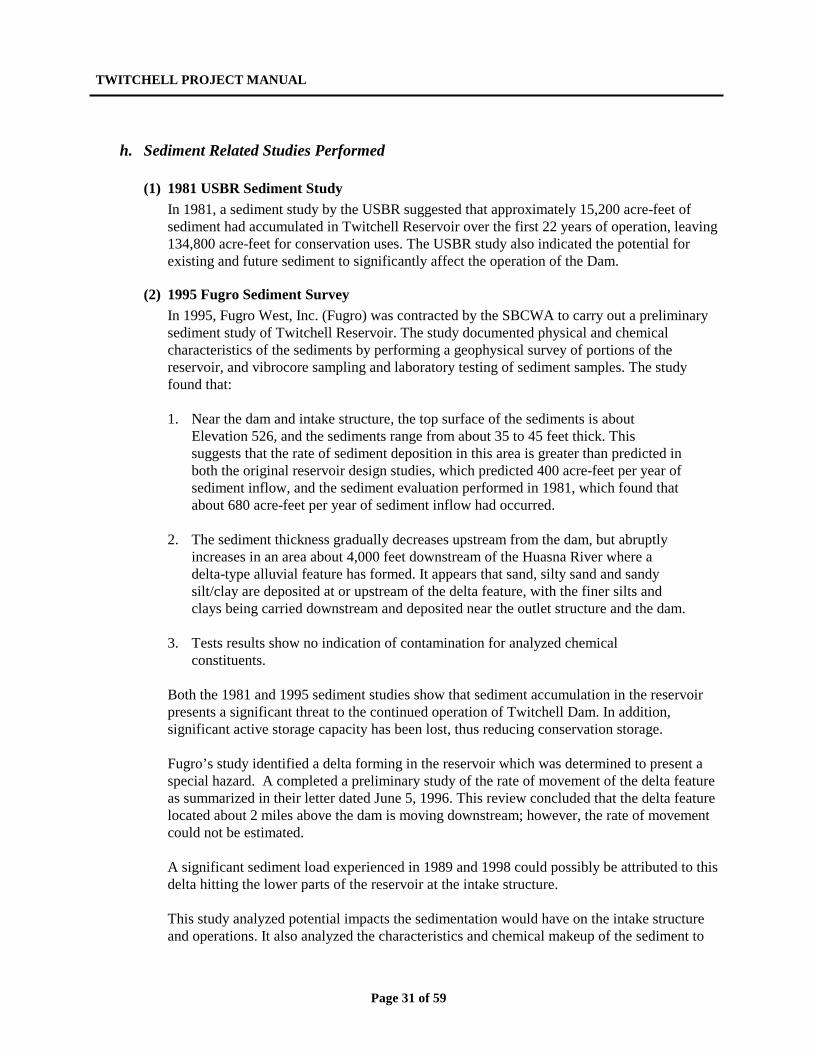
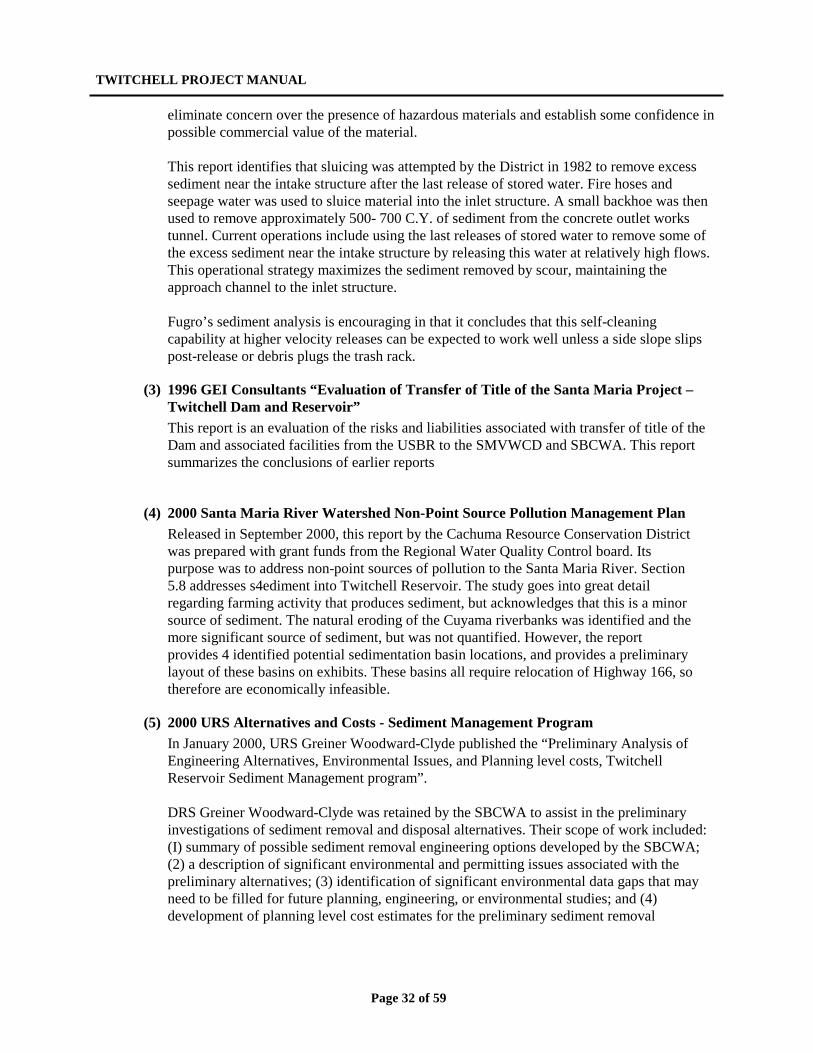
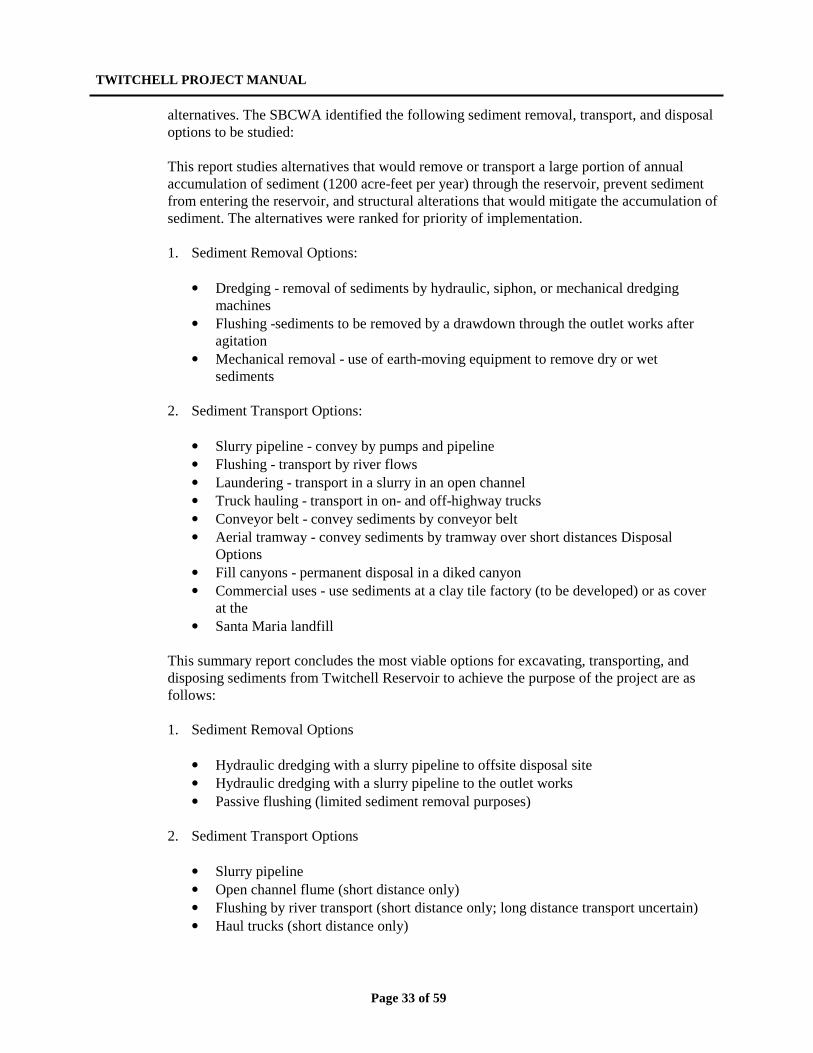
g. Sedimentation: A Pictorial History Downstream
1957
TWITCHELL PROJECT MANUAL
Page 30 of 59
Excavation by vactor to recover the toe drain from under building sediment downstream
TWITCHELL PROJECT MANUAL
Page 31 of 59
h. Sediment Related Studies Performed
(1) 1981 USBR Sediment Study In 1981, a sediment study by the USBR suggested that approximately 15,200 acre-feet of sediment had accumulated in Twitchell Reservoir over the first 22 years of operation, leaving 134,800 acre-feet for conservation uses. The USBR study also indicated the potential for existing and future sediment to significantly affect the operation of the Dam.
(2) 1995 Fugro Sediment Survey In 1995, Fugro West, Inc. (Fugro) was contracted by the SBCWA to carry out a preliminary sediment study of Twitchell Reservoir. The study documented physical and chemical characteristics of the sediments by performing a geophysical survey of portions of the reservoir, and vibrocore sampling and laboratory testing of sediment samples. The study found that: 1. Near the dam and intake structure, the top surface of the sediments is about
Elevation 526, and the sediments range from about 35 to 45 feet thick. This suggests that the rate of sediment deposition in this area is greater than predicted in both the original reservoir design studies, which predicted 400 acre-feet per year of sediment inflow, and the sediment evaluation performed in 1981, which found that about 680 acre-feet per year of sediment inflow had occurred.
2. The sediment thickness gradually decreases upstream from the dam, but abruptly
increases in an area about 4,000 feet downstream of the Huasna River where a delta-type alluvial feature has formed. It appears that sand, silty sand and sandy silt/clay are deposited at or upstream of the delta feature, with the finer silts and clays being carried downstream and deposited near the outlet structure and the dam.
3. Tests results show no indication of contamination for analyzed chemical
constituents. Both the 1981 and 1995 sediment studies show that sediment accumulation in the reservoir presents a significant threat to the continued operation of Twitchell Dam. In addition, significant active storage capacity has been lost, thus reducing conservation storage. Fugro’s study identified a delta forming in the reservoir which was determined to present a special hazard. A completed a preliminary study of the rate of movement of the delta feature as summarized in their letter dated June 5, 1996. This review concluded that the delta feature located about 2 miles above the dam is moving downstream; however, the rate of movement could not be estimated. A significant sediment load experienced in 1989 and 1998 could possibly be attributed to this delta hitting the lower parts of the reservoir at the intake structure. This study analyzed potential impacts the sedimentation would have on the intake structure and operations. It also analyzed the characteristics and chemical makeup of the sediment to
TWITCHELL PROJECT MANUAL
Page 32 of 59
eliminate concern over the presence of hazardous materials and establish some confidence in possible commercial value of the material. This report identifies that sluicing was attempted by the District in 1982 to remove excess sediment near the intake structure after the last release of stored water. Fire hoses and seepage water was used to sluice material into the inlet structure. A small backhoe was then used to remove approximately 500- 700 C.Y. of sediment from the concrete outlet works tunnel. Current operations include using the last releases of stored water to remove some of the excess sediment near the intake structure by releasing this water at relatively high flows. This operational strategy maximizes the sediment removed by scour, maintaining the approach channel to the inlet structure.
Fugro’s sediment analysis is encouraging in that it concludes that this self-cleaning capability at higher velocity releases can be expected to work well unless a side slope slips post-release or debris plugs the trash rack.
(3) 1996 GEI Consultants “Evaluation of Transfer of Title of the Santa Maria Project – Twitchell Dam and Reservoir” This report is an evaluation of the risks and liabilities associated with transfer of title of the Dam and associated facilities from the USBR to the SMVWCD and SBCWA. This report summarizes the conclusions of earlier reports
(4) 2000 Santa Maria River Watershed Non-Point Source Pollution Management Plan Released in September 2000, this report by the Cachuma Resource Conservation District was prepared with grant funds from the Regional Water Quality Control board. Its purpose was to address non-point sources of pollution to the Santa Maria River. Section 5.8 addresses s4ediment into Twitchell Reservoir. The study goes into great detail regarding farming activity that produces sediment, but acknowledges that this is a minor source of sediment. The natural eroding of the Cuyama riverbanks was identified and the more significant source of sediment, but was not quantified. However, the report provides 4 identified potential sedimentation basin locations, and provides a preliminary layout of these basins on exhibits. These basins all require relocation of Highway 166, so therefore are economically infeasible.
(5) 2000 URS Alternatives and Costs - Sediment Management Program In January 2000, URS Greiner Woodward-Clyde published the “Preliminary Analysis of Engineering Alternatives, Environmental Issues, and Planning level costs, Twitchell Reservoir Sediment Management program”. DRS Greiner Woodward-Clyde was retained by the SBCWA to assist in the preliminary investigations of sediment removal and disposal alternatives. Their scope of work included: (I) summary of possible sediment removal engineering options developed by the SBCWA; (2) a description of significant environmental and permitting issues associated with the preliminary alternatives; (3) identification of significant environmental data gaps that may need to be filled for future planning, engineering, or environmental studies; and (4) development of planning level cost estimates for the preliminary sediment removal
TWITCHELL PROJECT MANUAL
Page 33 of 59
alternatives. The SBCWA identified the following sediment removal, transport, and disposal options to be studied: This report studies alternatives that would remove or transport a large portion of annual accumulation of sediment (1200 acre-feet per year) through the reservoir, prevent sediment from entering the reservoir, and structural alterations that would mitigate the accumulation of sediment. The alternatives were ranked for priority of implementation. 1. Sediment Removal Options:
• Dredging - removal of sediments by hydraulic, siphon, or mechanical dredging machines
• Flushing -sediments to be removed by a drawdown through the outlet works after agitation
• Mechanical removal - use of earth-moving equipment to remove dry or wet sediments
2. Sediment Transport Options:
• Slurry pipeline - convey by pumps and pipeline • Flushing - transport by river flows • Laundering - transport in a slurry in an open channel • Truck hauling - transport in on- and off-highway trucks • Conveyor belt - convey sediments by conveyor belt • Aerial tramway - convey sediments by tramway over short distances Disposal
Options • Fill canyons - permanent disposal in a diked canyon • Commercial uses - use sediments at a clay tile factory (to be developed) or as cover
at the • Santa Maria landfill
This summary report concludes the most viable options for excavating, transporting, and disposing sediments from Twitchell Reservoir to achieve the purpose of the project are as follows: 1. Sediment Removal Options
• Hydraulic dredging with a slurry pipeline to offsite disposal site • Hydraulic dredging with a slurry pipeline to the outlet works • Passive flushing (limited sediment removal purposes)
2. Sediment Transport Options
• Slurry pipeline • Open channel flume (short distance only) • Flushing by river transport (short distance only; long distance transport uncertain) • Haul trucks (short distance only)
TWITCHELL PROJECT MANUAL
Page 34 of 59
3. Sediment Disposal Options
• Discharge to Santa Maria River near Fugler Point or Bonita School Road crossing • Downstream sediment basins and/or gravel mine pits
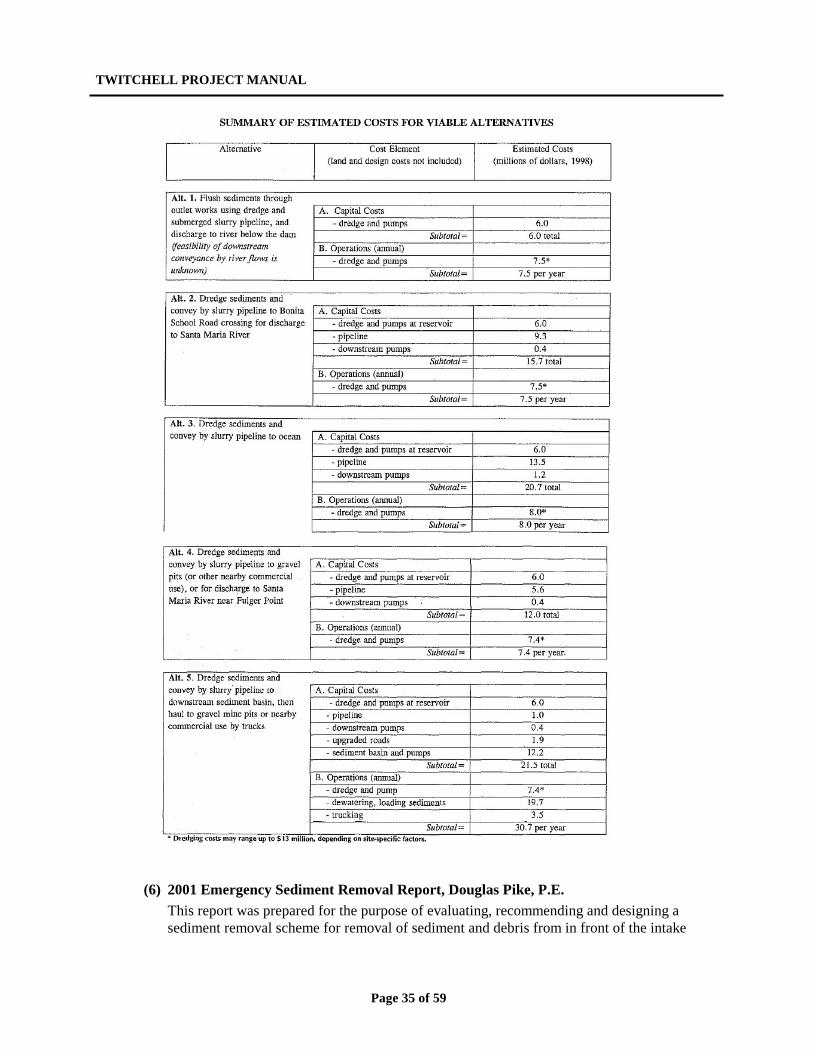
Five primary options were studied along with their environmental considerations. The following page contains a table which summarizes the costs of these five alternatives. The alternatives selected included “sluicing sediment downstream of the reservoir and dredging sediment to the outlet works, immediately downstream of the reservoir or to Fugler Point.” The weak point of any hydraulic dredging plan is the need for large volumes of water, limiting the amount of sediment that could be dredged in a season. The estimated capital and annual operations and maintenance costs for dredging as envisioned by this report is between $13-$29 million. This report indicates that there is commercial value to the sediment. It can be used to manufacture clay roof and floor tiles. It has been tested and determined that it may have a ceramic glaze value for fired ceramic products. It may also be a useful fill and cap material for landfills. This report also discusses environmental impacts and permitting issues, including passing of sediment downstream, which may require environmental mitigation. A chart Summarizing costs for various alternatives is presented on the following page.
TWITCHELL PROJECT MANUAL
Page 35 of 59
(6) 2001 Emergency Sediment Removal Report, Douglas Pike, P.E. This report was prepared for the purpose of evaluating, recommending and designing a sediment removal scheme for removal of sediment and debris from in front of the intake
TWITCHELL PROJECT MANUAL
Page 36 of 59
structure and from the downstream stilling basin to a nearby location. The project also includes cleaning, repairing and re-coating the metal trash racks at the outlet works. For removal of sediment upstream, in front of the outlet structure, it was determined that a method similar to that performed by Wood Brothers in 1999 would be appropriate. Specific steps included: 1. Grading improvements to the access road. 2. Stabilize an access drive on the sediment of the lake bed using large (12”) rock. 3. Excavate with a long reach excavator and haul with 3 axle 10 yard dump trucks. For this particular effort, to avoid environmental impacts the sediment was removed upstream approximately1500 feet to a bench within the reservoir and deposited Recommendations were also made for trash rack repair and mechanical excavation of the stilling basin.
(7) 2001 Sediment Removal Feasibility Study for CALAQQWA Funding This document was prepared by the SMVWCD in 2001 to qualify and apply for California Affordable Quantity and Quality Water Act (CAL-AQQWA) funding sponsored by Senator Barbara Boxer. The project to be funded was a feasibility study of options for removal of sediment from Twitchell Reservoir for 600, 1200, and 2000 acre-ft per year. Four alternatives to be studied were: 1. Passive sluicing and flushing 2. Dredging and flushing 3. Dredging and pipeline to stilling basin 4. Dredging and pipeline to Fugler Point This funding application document is valuable because it contains many letters and SMVWCD Board actions concerning the sediment issue and efforts to obtain funding.
(8) 2002 Twitchell Dam Outlet Works Sedimentation Issues and Capacity Study This study evaluates potential effects of stilling basin sedimentation levels on outlet works operations at Twitchell Dam. This evaluation includes an analysis and discussion of effects of sedimentation on stilling basin capacity, as well as the capacity of the downstream channel. This study also considers the need for, or benefit of, removal of sediment from the stilling basin for capacity or inspection purposes. The County is concerned with safety issues that could arise if flood flows were released into the sediment-filled stilling basin. The hydraulic capacity of the stilling basin, as well as the capacity of the downstream channel of the Cuyama River has been reduced as a result of sedimentation. The hydraulic capacity of the sediment filled stilling basin (as it was in 2002) was calculated using a hydraulic model for various scenarios including a maximum flood release of 12,000 cfs, historical high flow of 5,000 cfs and the more typical operational releases of 500 cfs. Sediment accumulation downstream of the stilling basin is occurring as a natural result of sediment passing through the dam. The effect of this sedimentation on the downstream river
TWITCHELL PROJECT MANUAL
Page 37 of 59
channel is discussed based on the hydraulic analysis, physical analysis based on the 1999 topographic survey and recent field observation. This discussion includes an examination of the need or feasibility of clearing the river channel downstream to restore hydraulic capacity. The need for removing sediment from the stilling basin is discussed from a capacity standpoint, cost vs. benefit standpoint, as well as an inspection and maintenance standpoint. This report also recommends alternate methods for inspecting or monitoring the function and integrity of the stilling basin structure without removing sediment. Inspection of the stilling basin is one of the Category 2 recommendations by the Bureau of Reclamation in their Comprehensive Facility Report. Finally, a physical probe of sediment in the stilling basin for the purposes of predicting excavation and handling characteristics was conducted. The water surface elevations were calculated using the U.S. Army Corps of Engineers computer program HEC-HMS version 3.0. Modeling included the analysis of outlet works (the inlet piping (but not the inlet structure), the gates, and the stilling basin) and the spillway tunnel. A potential design alternate was analyzed which included the excavation of a 50 feet wide
channel from the stilling basin to a point 4,000 feet downstream. The purpose of this alternative analysis is to determine the relative benefit of downstream sediment removal in the river channel.
At the time of this analysis, even small flows were flowing downstream and the Toe Drain was functioning without sediment clogging. Stilling Basing Hydraulic Capacity Conclusions (based on sediment elevations at the time of this study): • The flow conditions (elevation, depth, etc.) within the stilling basin and channel were
shown to be essentially the same when the stilling basin was empty of sediment and when the stilling basin was filled to elevation 467.5. Although velocities increase, this represents no threat to the basin or channel.
• As flows increase toward the higher range of the system’s capacity, steady state flows through the stilling basin tend to be supercritical (no hydraulic jump). If a hydraulic
TWITCHELL PROJECT MANUAL
Page 38 of 59
jump occurred in the stilling basin before reaching this steady state, the water elevation would increase. This possible hydraulic jump, if it occurs at all, is only a “problem” near the highest design limit flows of 12,000 cfs as shown in the table below. The 2-3 foot freeboard requirement (for sub-critical flows in the channel) would be considered marginal for 5,000 cfs and deficient for 12,000 cfs.
Downstream River Channel Hydraulic Capacity Conclusions (based on sediment elevations at the time of this study): 1. With the exception of higher velocities in the immediate vicinity downstream of the
stilling basin, the flow characteristics are not appreciably affected by sediment in the stilling basin.
2. Flow velocities downstream of the outlet works were found to range from 0.6 to 4.5 feet per second, averaging a depth of approximately 3.5 feet.
3. Inundation was widespread. The appendices of the report show the extent of flooding downstream.
4. The frequent deposition of fine sediment over a widespread area is likely and evident. It is expected that this sedimentation will continue, but that the capacity of the downstream channel to receive this sediment is not expected be seriously impacted any time soon. The sediment deposits will continue to spread out over a wide area, and to areas further down the Cuyama River.
5. Clearing sediment from the downstream channel improves the flow characteristics. If sediment were to be removed for a distance of 4,000 feet downstream, as much as 33,000 cubic yards of material may need to be removed. If sediment were removed to a distance of 2,000 feet, as much as 20,000 cubic yards of material may need to be removed. It is also expected that on-going sediment deposits would quickly fill up any shallow, excavated channel.
6. Using this report as a baseline, continue to monitor conditions downstream as they develop. Re-survey the river channel downstream on an as-needed basis to verify functional capacity.
As of 2010, the downstream sediment has become a critical issue, with channel excavation needed as urgently as it was in 1999.
(9) 2002 Numerical Modeling of Sediment Bypassing Alternatives at Twitchell Reservoir The purpose of this report is to describe the numerical modeling of sediment bypassing operations and to recommend one as the preferred alternative. Flushing operations or dredging volumes of 500 cfs and 250 cfs were considered. The basic conclusion is that under ideal conditions any combination of passive sluicing or dredging will move suspended sediment, even under the 250 CFS flows. Modeling shows that deposited clay sediment in the Santa Maria River between Fugler Pt. and Bonita School Bridge will not affect groundwater recharge over the long term but be moved along by other seasonal flows in the SM River watershed.
(10) 2007 Twitchell Sediment Survey Report The 2007 Twitchell Reservoir Survey and Sediment Update Report was prepared to update the topography of the reservoir and update the water volume capacity tables for the reservoir. It was also prepared to document the sediment inflow since the last survey in1999. The survey was performed under the following parameters
TWITCHELL PROJECT MANUAL
Page 39 of 59
1. The specifications were for 2’ contour intervals. 2. Aerial targets were set at 47 locations. 3. C & C Mapping (Central Coast Mapping) was the aerial subconsultant. 4. The flying height was 4,200 feet and photo scale was 1”=700’ 5. Mapping was done from the lowest point in the reservoir of 483 feet to the crest of the
dam at 692 feet. 6. Horizontal & Vertical Benchmarks used were the same as in the 2000 survey. 7. A color, digital ortho-photo in jpeg 2000 format was created. It is a 1 foot pixel
resolution digital photo that is ortho-rectified meaning that it is adjusted to true scale. It is tiled so it can be viewed without a large amount of RAM
Results of the survey: 1. The 2000 survey and analysis showed a total of 41,774 acre-feet of sediment in the
reservoir, so the 2007 survey shows an increase of 583 acre-feet of sediment, or a 1.4% increase.
2. There has been a significant migration of sediment from the upper “arms” of the reservoir to the lower reservoir basin.
3. The chasm or local depression around the Outlet Structure is growing, both from the sediment removal project in 2002 as well as through flushing operations, which shows the success of these programs in keeping the upstream structure unobstructed in years with normal rainfall.
4. Clarification that the 621.8’ water surface elevation is still currently the “official” boundary of the conservation storage pool.
5. This 2007 survey has a higher resolution with more detailed contours, providing more accurate capacity tables. This accuracy is estimated to indicate an actual capacity of up to 1 or 1-1/2% greater than previously mapped.
6. The capacity of the reservoir has continued to be reduced due to sedimentation. The total sediment now below the spillway (elev. 651.5) is 42,357 acre-feet, which is a reduction of storage in the original (1958) conservation allocation of 26.3%.
7. At the water conservation storage elevation of 623 (water conservation storage elevation boundary), the capacity has changed from 112,205 acre-feet in 2000 to a 2007 capacity of 110,482 acre-feet
8. There has been a significant migration of sediment from the upper “arms” of the reservoir basin to the lower reservoir basin
9. In some areas of the lower reservoir sediment levels have raised as much as 11 feet. In areas of the upper reservoir some channels have been cut by as much as 20 feet.
i. Sediment Management at the Outlet Works
(1) Sediment Management at the Upstream Inlet Structure An important sediment management task at the Dam is the Sediment Removal Upstream of the Inlet Structure. The purpose of this project is the removal of sediment blocking the main inlet portal of the Twitchell Dam Inlet Structure. This is emerging as an essential sediment management requirement that must be repeated as needed. A similar project was accomplished in 1999 on an emergency basis by Woods Brothers Contractors and again in 2002 by John Madonna Construction after sediment again blocked the inlet portal. This project may be needed after every significant storm season or event. It is urgently needed again now (Winter 2010). If the
TWITCHELL PROJECT MANUAL
Page 40 of 59
past decade is any indication of frequency that this project is needed, it and appears to become a critical need about every five years on average. Hopefully, as upstream sediment control measures are adopted, the frequency of this project can be reduced. Appendix 2a contains a detailed description of the this effort as it has been performed, including the estimate for execution of this project.
(2) Sediment Management in the Outlet Works Tunnel This project was first performed from the spring to the winter of 2009 after the largest movement of clay sediment to-date passed through the dam. Clearing the tunnel when plugged is essential to allow the Cuyama River to pass. After the annual flushing of the dam system in 2009, there was an excessive volume of sediment brought into the 1,200 foot long, 16 foot diameter tunnel causing 80-90% blockage. This project of clearing the tunnel of sediment should be performed on an annual basis after the annual system flushing if needed or after a significant storm event, if needed. In 2009 clearing the tunnel completely with the blockage of 80-90% took approximately 5 months to complete with 2 skid steers working cooperatively clearing 8-20 linear feet per day of work. Maintenance of the inlet structure sediment is an integral part of maintaining the tunnel functionality and will help facilitate less work needed in the tunnel. When the work is performed, it shall be done with two rubber tracked skid steer loaders. The sediment will be removed to the stilling basin, and then pumped to drying beds using a derrick and the District’s 6” sediment pump as done in the past. This project should be done in conjunction with the annual removal of sediment from the stilling basin. The District pump also serves to dewater the basin and lowest reach of the tunnel at the access ladder to facilitate access into the tunnel.
(3) Sediment Management in the Stilling Basin The stilling basin was originally designed as a long, deep channel with a with a rise at the end and concrete energy dissipaters (concrete blocks protruding from the bottom) forcing flow from super-critical to sub-critical, allowing the water to re-enter the river without scouring the river course. It was assumed by the designer that the water would generally be sediment free, or that velocities would carry the sediment through the stilling basin. The designer did not foresee that clay sediment would overwhelm the basin. For approximately 1,900 feet downstream of the Stilling Basin the river has a slope of less than 1% allowing severe s4edimentation build-up. This build up creates a myriad of challenges downstream, one of which is high clay levels in the Stilling basin reducing its hydraulic capacity so that water and sediment can overtop the basin walls in larger releases and threaten flooding near the base of Twitchell Dam. The sediment also raises the water and sediment level I the tunnel, prohibiting access for inspection. Removal of sediment is performed by use of a derrick lifting the District owned 6” dredging pump discharging the suspended clay to drying beds between the silting basin and the caretaker’s residence. The pump has demonstrated an efficiency in moving 80% solids, and can usually reduce sediment in the stilling basin to acceptable levels within several days. A county backhoe is utilized to stockpile the dried clay for removal offsite.
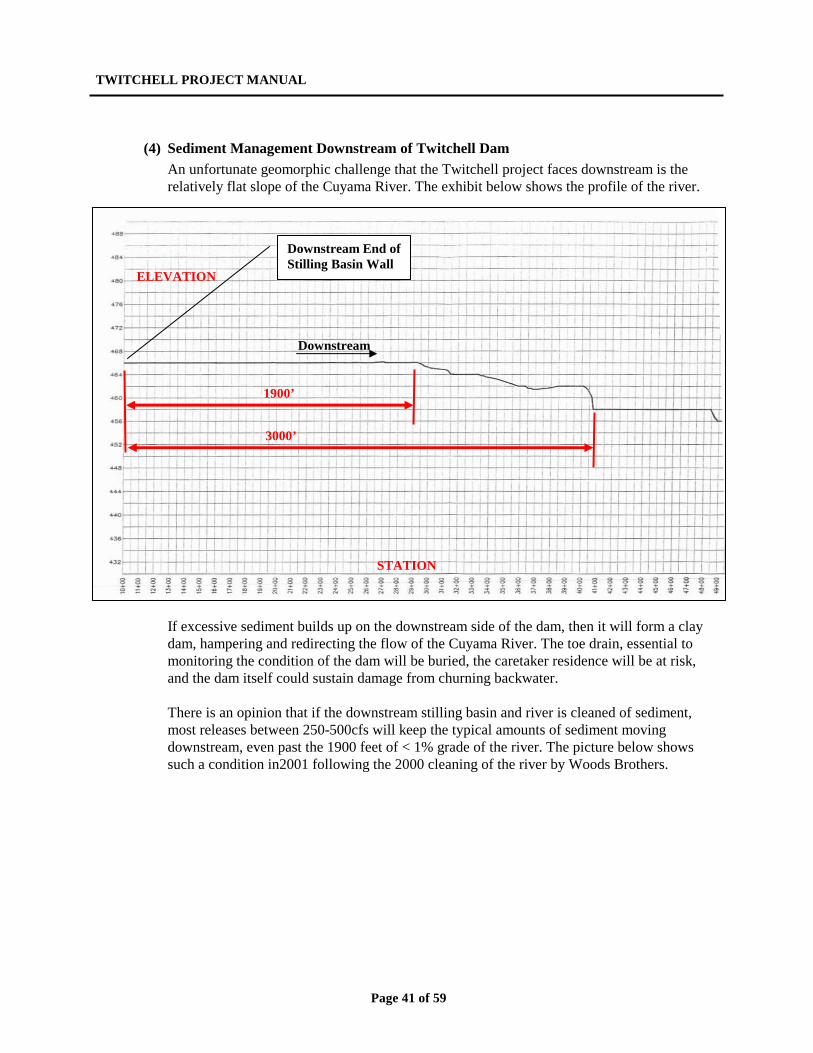
TWITCHELL PROJECT MANUAL
Page 41 of 59
(4) Sediment Management Downstream of Twitchell Dam An unfortunate geomorphic challenge that the Twitchell project faces downstream is the relatively flat slope of the Cuyama River. The exhibit below shows the profile of the river.
If excessive sediment builds up on the downstream side of the dam, then it will form a clay dam, hampering and redirecting the flow of the Cuyama River. The toe drain, essential to monitoring the condition of the dam will be buried, the caretaker residence will be at risk, and the dam itself could sustain damage from churning backwater. There is an opinion that if the downstream stilling basin and river is cleaned of sediment, most releases between 250-500cfs will keep the typical amounts of sediment moving downstream, even past the 1900 feet of < 1% grade of the river. The picture below shows such a condition in2001 following the 2000 cleaning of the river by Woods Brothers.
1900’
STATION
ELEVATION
Downstream
Downstream End of Stilling Basin Wall
3000’
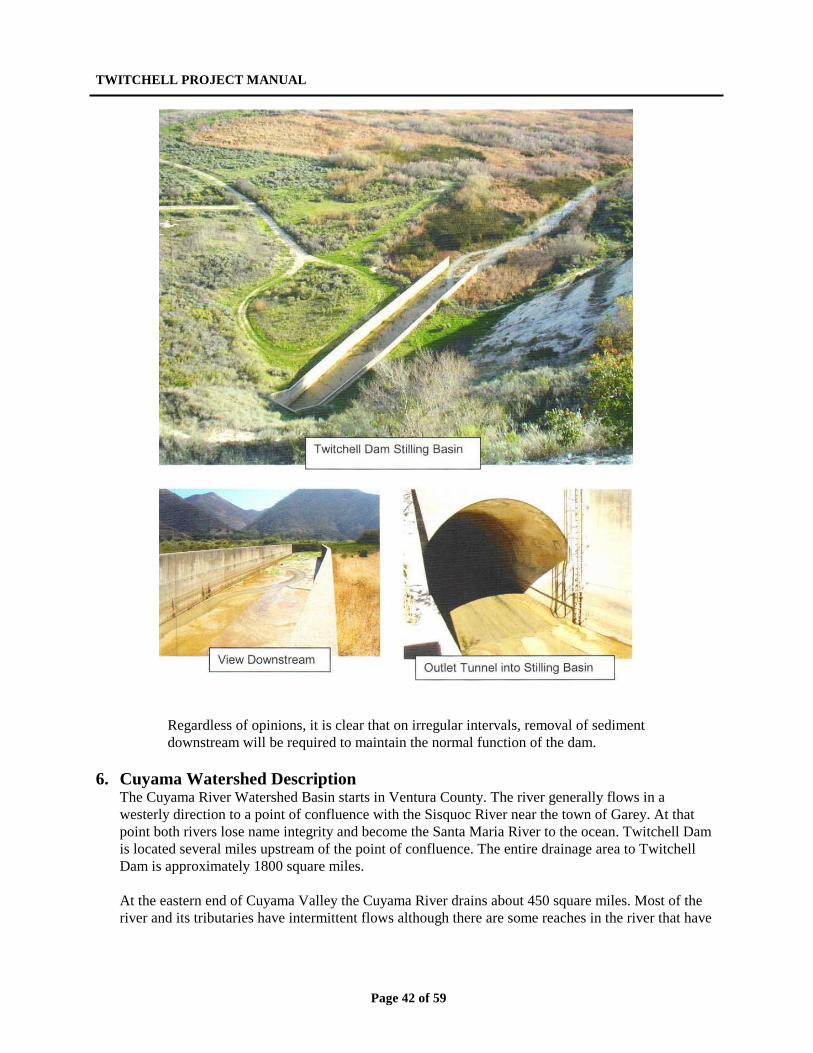
TWITCHELL PROJECT MANUAL
Page 42 of 59
Regardless of opinions, it is clear that on irregular intervals, removal of sediment downstream will be required to maintain the normal function of the dam.
6. Cuyama Watershed Description
The Cuyama River Watershed Basin starts in Ventura County. The river generally flows in a westerly direction to a point of confluence with the Sisquoc River near the town of Garey. At that point both rivers lose name integrity and become the Santa Maria River to the ocean. Twitchell Dam is located several miles upstream of the point of confluence. The entire drainage area to Twitchell Dam is approximately 1800 square miles.
At the eastern end of Cuyama Valley the Cuyama River drains about 450 square miles. Most of the river and its tributaries have intermittent flows although there are some reaches in the river that have
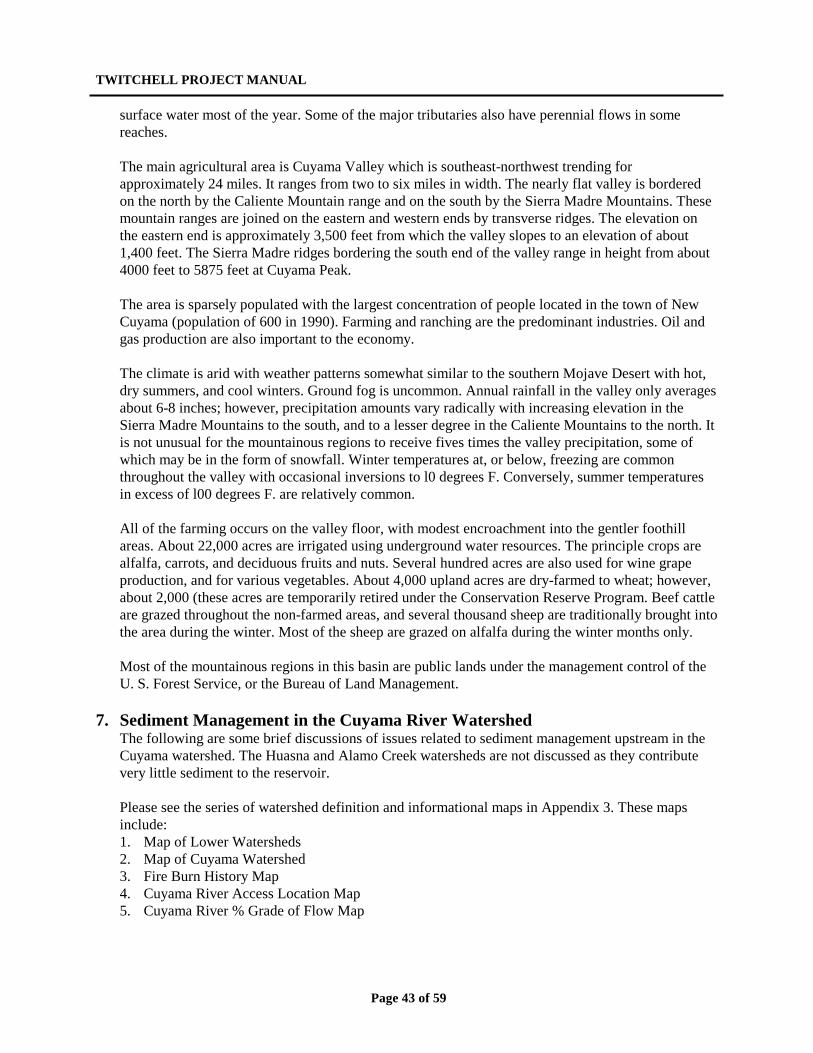
TWITCHELL PROJECT MANUAL
Page 43 of 59
surface water most of the year. Some of the major tributaries also have perennial flows in some reaches. The main agricultural area is Cuyama Valley which is southeast-northwest trending for approximately 24 miles. It ranges from two to six miles in width. The nearly flat valley is bordered on the north by the Caliente Mountain range and on the south by the Sierra Madre Mountains. These mountain ranges are joined on the eastern and western ends by transverse ridges. The elevation on the eastern end is approximately 3,500 feet from which the valley slopes to an elevation of about 1,400 feet. The Sierra Madre ridges bordering the south end of the valley range in height from about 4000 feet to 5875 feet at Cuyama Peak. The area is sparsely populated with the largest concentration of people located in the town of New Cuyama (population of 600 in 1990). Farming and ranching are the predominant industries. Oil and gas production are also important to the economy. The climate is arid with weather patterns somewhat similar to the southern Mojave Desert with hot, dry summers, and cool winters. Ground fog is uncommon. Annual rainfall in the valley only averages about 6-8 inches; however, precipitation amounts vary radically with increasing elevation in the Sierra Madre Mountains to the south, and to a lesser degree in the Caliente Mountains to the north. It is not unusual for the mountainous regions to receive fives times the valley precipitation, some of which may be in the form of snowfall. Winter temperatures at, or below, freezing are common throughout the valley with occasional inversions to l0 degrees F. Conversely, summer temperatures in excess of l00 degrees F. are relatively common. All of the farming occurs on the valley floor, with modest encroachment into the gentler foothill areas. About 22,000 acres are irrigated using underground water resources. The principle crops are alfalfa, carrots, and deciduous fruits and nuts. Several hundred acres are also used for wine grape production, and for various vegetables. About 4,000 upland acres are dry-farmed to wheat; however, about 2,000 (these acres are temporarily retired under the Conservation Reserve Program. Beef cattle are grazed throughout the non-farmed areas, and several thousand sheep are traditionally brought into the area during the winter. Most of the sheep are grazed on alfalfa during the winter months only. Most of the mountainous regions in this basin are public lands under the management control of the U. S. Forest Service, or the Bureau of Land Management.
7. Sediment Management in the Cuyama River Watershed
The following are some brief discussions of issues related to sediment management upstream in the Cuyama watershed. The Huasna and Alamo Creek watersheds are not discussed as they contribute very little sediment to the reservoir. Please see the series of watershed definition and informational maps in Appendix 3. These maps include: 1. Map of Lower Watersheds 2. Map of Cuyama Watershed 3. Fire Burn History Map 4. Cuyama River Access Location Map 5. Cuyama River % Grade of Flow Map
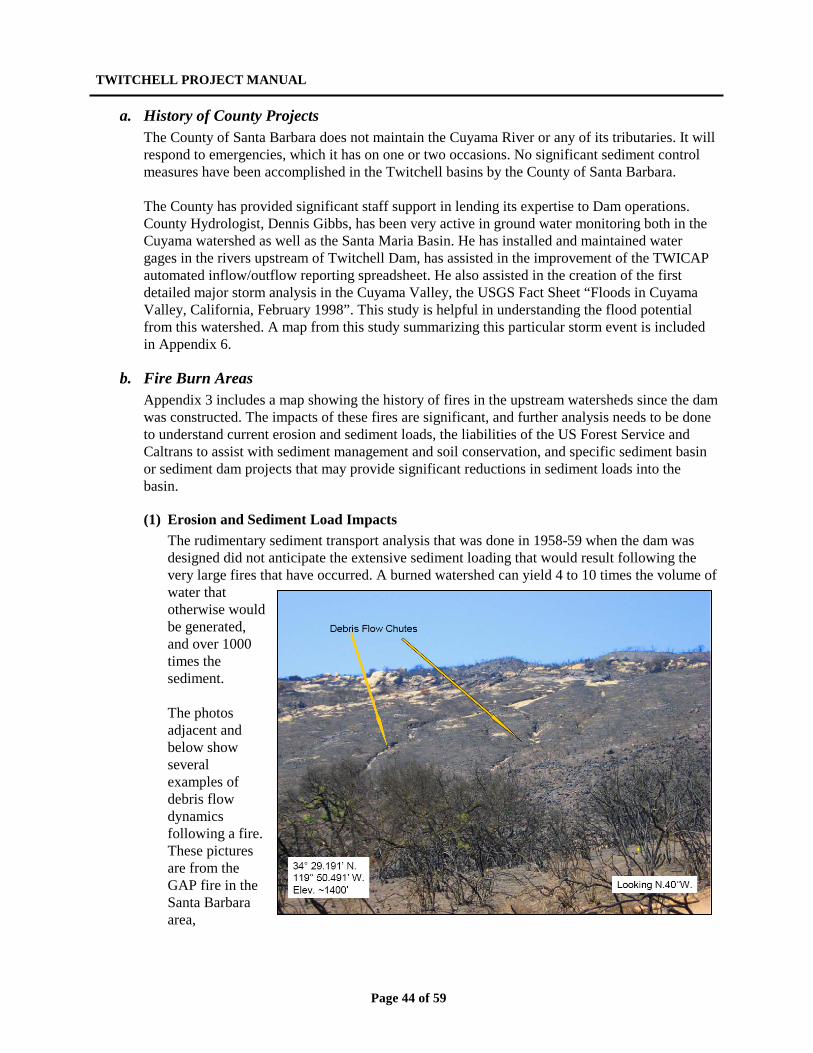
TWITCHELL PROJECT MANUAL
Page 44 of 59
a. History of County Projects The County of Santa Barbara does not maintain the Cuyama River or any of its tributaries. It will respond to emergencies, which it has on one or two occasions. No significant sediment control measures have been accomplished in the Twitchell basins by the County of Santa Barbara. The County has provided significant staff support in lending its expertise to Dam operations. County Hydrologist, Dennis Gibbs, has been very active in ground water monitoring both in the Cuyama watershed as well as the Santa Maria Basin. He has installed and maintained water gages in the rivers upstream of Twitchell Dam, has assisted in the improvement of the TWICAP automated inflow/outflow reporting spreadsheet. He also assisted in the creation of the first detailed major storm analysis in the Cuyama Valley, the USGS Fact Sheet “Floods in Cuyama Valley, California, February 1998”. This study is helpful in understanding the flood potential from this watershed. A map from this study summarizing this particular storm event is included in Appendix 6.
b. Fire Burn Areas Appendix 3 includes a map showing the history of fires in the upstream watersheds since the dam was constructed. The impacts of these fires are significant, and further analysis needs to be done to understand current erosion and sediment loads, the liabilities of the US Forest Service and Caltrans to assist with sediment management and soil conservation, and specific sediment basin or sediment dam projects that may provide significant reductions in sediment loads into the basin.
(1) Erosion and Sediment Load Impacts The rudimentary sediment transport analysis that was done in 1958-59 when the dam was designed did not anticipate the extensive sediment loading that would result following the very large fires that have occurred. A burned watershed can yield 4 to 10 times the volume of water that otherwise would be generated, and over 1000 times the sediment. The photos adjacent and below show several examples of debris flow dynamics following a fire. These pictures are from the GAP fire in the Santa Barbara area,
TWITCHELL PROJECT MANUAL
Page 45 of 59
Just looking at the recent 2009 La Brea fire we can learn the following: 1. The La Brea Fire burned 89,489 acres, 15% was within Twitchell’s watershed 2. In the la Brea fire, the Soil Erosion Hazard Rating was high for 56, 591 acres, Very High
for 31, 946 acres, with no data for 815 acres. 3. The Erosion Potential: 15 tons/acre 4. The Estimated Vegetative Recovery Period, (years): 3.5 5. The Estimated Reduction in Infiltration, (percent): 36 6. The La Brea Fire Soil Burn Severity: 1759 acres in the Cuyama Watershed burned with a
“high to moderate” burn severity with 2107 acres rated “low” burn severity. The RCS models the erosion potential o be 29,193 CY, with a sediment yield to Twitchell of 4833 CY/Sq. Mi. This represents a 1787% Sediment yield increase!
Another example of fire impacts was the 1966 Wellman Fire which burned 93,000 acres, mostly in the Sisquoc River watershed. During winter rains, debris washed down into the Sisquoc River and eventually the Santa Maria River. In 1969, the levee nearly burst from all the water and debris.
TWITCHELL PROJECT MANUAL
Page 46 of 59
It is recommended that a detailed study of the hydrology and sediment transportation characteristics of the Cuyama watershed be studied to focus efforts on the best opportunities for sediment control. This study should include: 1. A look at each sub-basin with its tributaries to determine soil types, creek gradients,
hydrology and sediment generating potential. 2. A look at the historic fire burn areas and sediment generating potential. 3. Prioritization of sub-basins by sediment generating potential. 4. A detailed look at access availability for projects o the high priority tributary systems. 5. Feasibility and cost analysis for easement purchases, project environmental impacts and
costs.
(2) BAER Reports The Burned Area Emergency Response (BAER) team reports contain evaluations designed to assist federal, state and local officials in creating comprehensive remediation plans and to guide restoration efforts as a result of the October Wildfires. These reports are helpful to develop plans to protect citizens from potential floods and debris flows associated with the upcoming winter rains.
(3) U.S. Forest Service and Soil Conservation Unfortunately the US Forest Service makes little to no effort in mitigating the flow of sediment from fire burn areas. Fires and this lack of soil conservation efforts is the single largest contributor of sediment in the basin. The SMVWCD has been pursuing the potential for financial compensation from the US Forest Service for this lack of soil conservation.
c. SR 166 Construction Impacts The construction of State Route 166 straightened the Cuyama River in several locations, increasing the grade and velocity of the river, which in turn has enhanced its sediment carrying capacity. Unfortunately this happens within the upper basin of Twichell Reservoir itself, giving sediment a final “push” into the lower basin. The 1973 CEQA document for construction of the highway did not address the potential increase in sediment loads.
8. Potential Solutions in the Upstream Watershed
a. Soil Conservation Projects As previously stated, the greatest cause of increased sediment load into the reservoir is the recent fires in the Cuyama Watershed. Because of the significant fires in California the past two decades, much of our upstream watershed has burned. Much of it within the Los Padres National Forest. Appendix 3 has an exhibit we prepared showing the fire history over the past 50 years. Unfortunately, the U.S. Forest Service has focused resources elsewhere, and has dedicated no funding for reforestation in our watershed. Similarly, we are not aware that any upstream private property owners have engaged in any replanting efforts. As our community, the Santa Maria Valley, is downstream, we may need to accept responsibility to be the catalyst for restoration of the natural, forested upstream environment. Our main concern is sediment and the disruption of our water conservation mission and support of the farmers in our valley. Re-focusing our efforts from sediment basins to watershed reforestation
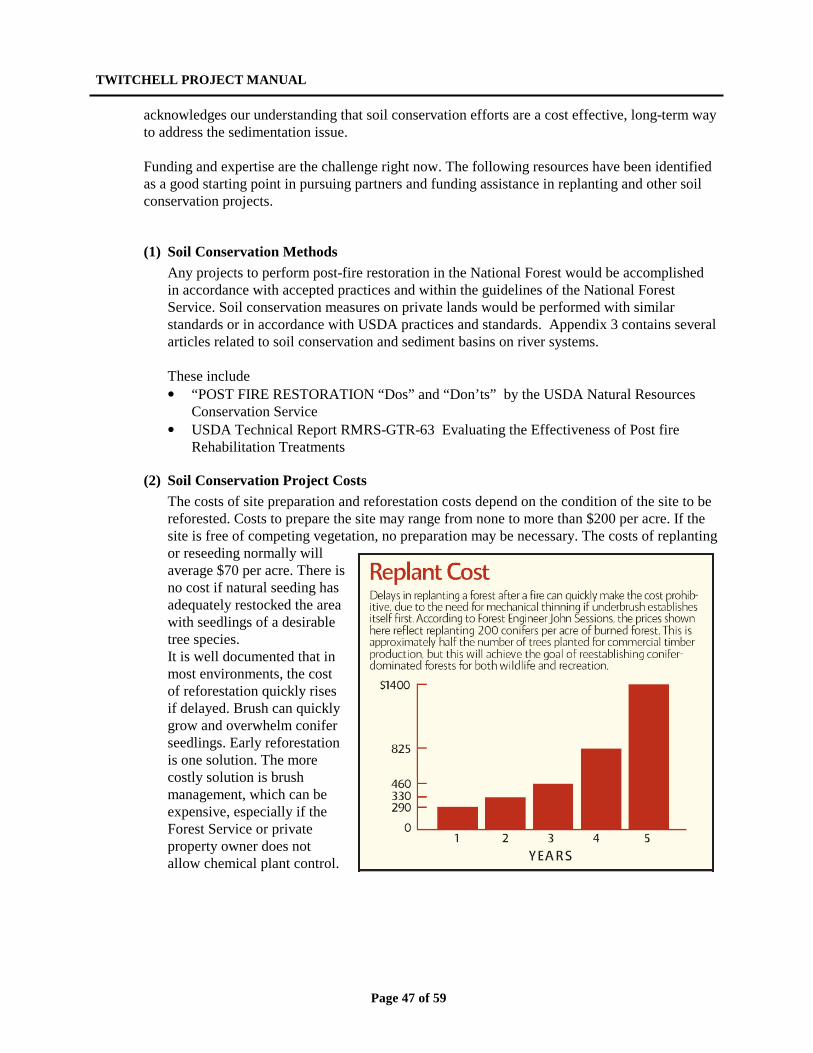
TWITCHELL PROJECT MANUAL
Page 47 of 59
acknowledges our understanding that soil conservation efforts are a cost effective, long-term way to address the sedimentation issue. Funding and expertise are the challenge right now. The following resources have been identified as a good starting point in pursuing partners and funding assistance in replanting and other soil conservation projects.
(1) Soil Conservation Methods Any projects to perform post-fire restoration in the National Forest would be accomplished in accordance with accepted practices and within the guidelines of the National Forest Service. Soil conservation measures on private lands would be performed with similar standards or in accordance with USDA practices and standards. Appendix 3 contains several articles related to soil conservation and sediment basins on river systems. These include • “POST FIRE RESTORATION “Dos” and “Don’ts” by the USDA Natural Resources
Conservation Service • USDA Technical Report RMRS-GTR-63 Evaluating the Effectiveness of Post fire
Rehabilitation Treatments
(2) Soil Conservation Project Costs The costs of site preparation and reforestation costs depend on the condition of the site to be reforested. Costs to prepare the site may range from none to more than $200 per acre. If the site is free of competing vegetation, no preparation may be necessary. The costs of replanting or reseeding normally will average $70 per acre. There is no cost if natural seeding has adequately restocked the area with seedlings of a desirable tree species. It is well documented that in most environments, the cost of reforestation quickly rises if delayed. Brush can quickly grow and overwhelm conifer seedlings. Early reforestation is one solution. The more costly solution is brush management, which can be expensive, especially if the Forest Service or private property owner does not allow chemical plant control.
TWITCHELL PROJECT MANUAL
Page 48 of 59
(3) Funding & Grant Opportunities The following resources have been identified as a good starting point in pursuing partners and funding assistance in replanting and other soil conservation projects.
a. American Forests Global Releaf Forests Ecosystem Restoration Program
The American Forests Global ReLeaf Forests ecosystem restoration program is always looking for quality tree-planting projects to be funded by their Global ReLeaf Forests ecosystem restoration program. They are particularly interested in partnering with private and public sector organizations and agencies to plant trees and improve the environment in projects that would otherwise not be feasible. According to their website, they support projects that plant the right trees in the right places for the right reasons. They have helped plant more than 23 million trees in more than 500 forest ecosystem restoration projects and urban and community forest projects. To be considered for funding, have an application process which receives nominations until January 15 and July 1each year. Their project criteria match the soil conservation Goals that would benefit Twitchell Reservoir. Their project criteria include: • Project is on land owned by a government entity, or project is on public-accessible
private land meeting special criteria. • Plantable area is 20 acres or larger or has the potential to be 20 acres or more. • Forest ecosystem has been damaged by wildfire, hurricanes, tornadoes, insects,
diseases, misguided treatment by humans, or other causes. • Funds for planting the area are not available from regular programs or sources. • Proposals for cost-share Global ReLeaf Forest grants are to cover costs generally
associated with the planting of seedlings (i.e. site preparation, seedling purchase, contracting, transportation, shelters, etc). Note: AMERICAN FORESTS raises $1 per tree from private sources. Due to the keen competition for grants, successful project proposals leverage local support resulting in a lower cost per tree and maximizing the number of trees planted for the funds available.
• Proposal contains an assessment of public benefits (including water quality/quantity and communities served by the watershed) and visibility of the restored area.
• Proposal includes a strong, multiple-use ecosystem repair component and a diversity of native species that will be planted.
• Credit for carbon sequestered by the project will be conferred to AMERICAN FORESTS.
• Proposal includes efforts to build local partnerships. • Adequacy of the planting, care, and long-term maintenance that will be provided by
or supervised by experts. • Proposal contains new or innovative efforts, restorative approaches, or technology
that has the potential for application elsewhere. • Recognition and consideration given for the protection of endangered or threatened
plant and animal species or ecosystems.
The contact for grant proposals is:
American Forests Attn: Margo Dawley P.O. Box 2000 Washington, DC, 20013
TWITCHELL PROJECT MANUAL
Page 49 of 59
Other Contact Information: (202) 737-1944 x224, FAX (202) 737-2457 or e-mail [email protected]. The website is: http://www.americanforests.org/global_releaf/grants/
b. Arbor Day Foundation The Arbor Day Foundation has been helping replant our Nation's Forests for years. Founded in 1972, the centennial of the first Arbor Day observance in the 19th century, the Foundation has grown to become the largest nonprofit membership organization dedicated to planting trees, with over one million members, supporters, and valued partners. They began working with the U.S. Forest Service in the wake of the Yellowstone fires in 1988. Since 1990, they have helped plant nearly 18 million trees in America's National Forests that have been damaged by fire, insects, and other natural causes. They recognize that the record wildfire seasons in recent years, combined with insect infestation and diseases, have contributed to a critical need for replanting in many national forests around the country, yet much of the Forest Service budget for planting trees has been diverted to fighting fires. Their mission is to help fund and implement tree planting projects. They are currently working to help reforest the area in Los Padres National Forest burned by the 2006 Day Fire. The 2006 Day fire burned remote chaparral areas of the Mount Pinos Ranger District. The Arbor Day Foundation is assisting in planting 210,000 native trees including Jeffrey pines, ponderosa pines, sugar pines, white firs, and big cone Douglas firs to reduce erosion and reestablish wildlife habitat and regenerate the area's surrounding chaparral ecosystem. Contact information: The Arbor Day Foundation 100 Arbor Avenue Nebraska City, NE 68410 Toll Free: 1-888-448-7337, Website: http://www.arborday.org/replanting/forests.cfm
c. American Forest Foundation
The American Forest Foundation specializes in working with private forest owners to assist them in initiatives to restore and/or enhance their natural forests. They Work with partners and family forest owners to conserve and create critical wildlife habitat for imperiled species. They partner with educational institutions and programs to raise and plant seedlings.
Contact Information: American Forest Foundation Street Address: 734 15th Street NW, Suite 800 Washington, DC 20005 Telephone: (202) 737-1944
TWITCHELL PROJECT MANUAL
Page 50 of 59
Fax: (202) 737-2457 http://www.affoundation.org/ (My contact at American Forests is Greg Meyer: [email protected])
b. Channel Treatments Channel treatments could be classified as beneficial soil conservation measures, and are typically done with permission of the owners without concern for permanent easements. These measures are often one-time applications, as is seeding and mulching, which leave very little impact on the land. They are often considered environmentally friendly. Channel treatments are implemented to modify sediment and water movement in ephemeral or small-order channels, to prevent flooding and debris torrents that may affect downstream values at risk. Some in-channel structures slow water flow and allow sediment to settle out; sediment will later be released gradually as the structure decays. Channel clearing is done to remove large objects that could become mobilized in a flood. Much less information has been published on channel treatments than on hill slope methods. These treatments would be implemented in the tributaries of the burned watershed areas and typically could include Straw Bale Check Dams, Log Check Dams, Rock Dams and Rock Cage Dams (Gabions), and in-channel debris basins.
c. Sediment Basins A Santa Maria River Watershed Non-Point Source Pollution Management Plan was prepared in 2000 by the Cachuma Resource Conservation District for the State Water Resources Control Board and the Regional Water Quality Control Board Central Coast Region. In this Management Plan several locations were identified that have the potential to trap at least part of the sediment load. In Addition, these sites could also serve as water storage areas until they fill with Sediment. Stored water could be released after supplies are depleted in Twitchell reservoir, and/or they could be used for water-based recreation. Unfortunately, all of the sites would require a relocation of highway 166 in order To get a reasonable storage volume. The current land use at all sites that would B inundated is livestock grazing. See Appendix 6 for applicable maps and excerpts from this Plan
(1) Sedimentation Basin Fundamentals Sedimentation basins generally have the following common elements: a dam to detain water and retain sediment; an outlet spillway, weir, or stand-pipe, top allow water to pass once it reaches a specified elevation; access into the basin for maintenance and removal of sediment; and is located on property with easements or fee ownership by the agency responsible for maintenance of the basin. Sedimentation basins are typically on-line, meaning the primary creek or riverbed flows through the basin. Off-system basins typically take low-flow water to a given designed capacity of flow, off the normal flow pattern of the creek or river via a diversion channel. Larger flows overtop the channel and flow down the natural channel. Where fish exist, these configurations typically provide fish channels to maintain migrations. The Cuyama River is a seasonal river and is dry much of the year, so this may not be a
TWITCHELL PROJECT MANUAL
Page 51 of 59
concern. The environmental process would determine what mitigations for construction of a sedimentation basin would be required.
(2) Easement Issues Any Proposed project in the Cuyama Watershed will require license agreements or easements with the property owners. A map in appendix 3 shows the parcels and owners in parts of the lower watersheds.
(3) River Access and Potential Locations A map provided in Appendix 3 shows the existing improved and unimproved access roads providing access to the Cuyama River. Most of these are private roads on ranches. Similar maps for drainage sub-basins could be prepared for the fire burn areas to map access for potential treatment opportunities
(4) Maintenance Sediment basins, unless designed to be abandoned when full, require regular maintenance. Access for heavy equipment and a local debris disposal site are needed for economical maintenance.
(5) Environmental Considerations The Cuyama River, as a “blue line” river on the USGS maps, requires a full range of County, State and Federal permits and both CEQA and NEPA environmental documentation to complete any projects that affect the river. There are several endangered species known to be in and around the riverbed that may need special studies. The cost in 2010 dollars to fully study and permit sediment removal downstream of the Dam is approximately $200,000.
9. Options for Removal of Sediment from Twitchell Reservoir
a. Commentary on Fugro Report In Section 5.h.4. of this Manual, a summary of the January 2000, URS Greiner Woodward-Clyde report: “Preliminary Analysis of Engineering Alternatives, Environmental Issues, and Planning level costs, Twitchell Reservoir Sediment Management program” is presented. This is the only study performed to investigate sediment removal and disposal alternatives. Please refer to that report for removal alternatives. It should be noted, however, that the option selected as the most cost effective may not be feasible. The concept of dredging and pumping sediment to the Cuyama River may be possible, but the large quantity of clay may “cap” the riverbed with a near impervious layer of clay severely affecting the percolation rates in the riverbed. This study also does not identify alternative repositories for the sediment. This should be studied further to resolve this concern.
TWITCHELL PROJECT MANUAL
Page 52 of 59
b. Commercial Value of Twitchell Clay Sediment The commercial value of the clay has long been recognized. Two race-tracks have used the clay, and it has been identified as a good source of clay for ceramic applications. Unfortunately the identified users need only small amounts compared to the sediment available. Commercial sale of the material will likely make little impact in reduction of sediment, and only small revenues from the sale of sediment may be possible.
c. Sediment Solutions Studied and rejected There have been many concepts advanced, considered and then rejected because of cost & feasibility issues. None of the following disposal options are considered feasible by themselves. However, the combination of two or more of these options with the previous options would render them potentially feasible. Some of these include: 1. The use of sediments to add to agricultural fields along the Santa Maria River in order to
improve the soil fertility does not appear to be feasible. The soils in the Santa Maria Valley are often coarse and readily drained. However, the mixing of fine-grained sediments in the native soils is a very expensive and inefficient method to improve water holding capacity and fertility. Farmers in the valley rely more on fertilizers and special irrigation regimes to achieve high productivity. Hence, the need for fine-grained soils for improvement of farmlands is very low.
2. Sediments could be used to raise agricultural fields to reduce flooding and drainage problems. The need for this type of fill is unknown, but is likely to be very low because of the expense of placing the fine-grained sediments as subsoil, then replacing the original topsoil.
3. Sediments could be used in a commercial fill operation in the region. The demand for fill for commercial, residential, and public works projects varies tremendously from year to year. The sediments from the reservoir are not ideal fill soils, but they may have a commercial use. This use would be sporadic and limited in quantity.
4. Sediments could be used for a commercial ceramic operation in which clay products are made, such as planting pots or tiles. A new commercial operation would need to be established in close proximity to the dam to reduce transportation costs. The amount of sediments used each year in such an operation would be very low compared to the total amount of sediment to be disposed.
5. Sediments could also be used to make planting media in a new commercial operation. Planting mixes for landscaping use fine-grained soils, along with sand and soil amendments. The amount of sediments used each year in such an operation would be very low compared to the total amount of sediment to be disposed.
10. Additional Study and Analysis Needed
All beneficial projects that will make an impact in reducing sedimentation flowing into the Reservoir or in mitigating the impacts of sedimentation in the Reservoir at the outlet works
TWITCHELL PROJECT MANUAL
Page 53 of 59
are expensive. Although excessive expenditures on studies should be avoided, the following studies may be desirable:
a. Current Hydraulic and Sediment Transport Analysis Previous studies show a trend on the inflow of sediment, but recent fires have removed the natural upstream soil protection benefit of vegetation in the burn areas. A detailed study of the hydrology and sediment transport within the upstream watershed sub-basins and the Cuyama River itself should be prepared to estimate the rate and quantity of sediment to the reservoir. This information will help establish the priority of projects and motivate the development of an informed schedule for implementation
b. Upstream Project Analysis Additional study and analysis will be needed to determine the feasibility and cost of:
• Upstream Sedimentation Basins • Revegetation • “Single Treatment Watercourse Improvements” • The Effect Of Mining Operations Upstream
c. Outlet Works Flushing Procedure Development Analysis Currently the District performs a sequence of “fast releases” to clear the outlet works of sediment at the upstream intake structure. This procedure, along with occasional excavation and removal of sediment upstream of the intake structure has been beneficial in keeping the intake structure open. An analysis to consider modifying the flushing operation to reduce potential for impacting the tunnel, and downstream Cuyama River with excessive sedimentation below the dam is suggested. Annual cleaning of the tunnel and Stilling Basin combined with larger flushing releases may reduce the frequency of sediment removal required in the downstream Cuyama River, which is a very expensive process due to permitting issues.
d. Downstream HEC RAS Release Inundation Study For various release rates, perhaps 500 CFS, 1500CFS, 2500 CFS and 5,000 CFS, determine the flood plain elevation for the Cuyama River from Twitchell Dam to the Santa Maria River. This data is needed to make well informed decisions on flushing operations in the future. This study should consider impacts on downstream farming and determine agency obligations for damage, if any. Also, there is currently channel constriction downstream of the dam due to vegetation on private property. This condition of has reduced the estimated capacity of the open channel in the river to around 300 cfs or damage will occur to vineyards. The County of Santa Barbara Flood Control and Water Conservation District has performed environmental work to assist in maintenance of this channel.
TWITCHELL PROJECT MANUAL
Page 54 of 59
e. Reservoir Surcharge and Conservation Pool Adjustment Study Due to sedimentation in the reservoir, approximately 42,000 A.F. of storage in the conservation pool has been lost. Allowing for additional surcharging in the reservoir late in the rainy season may be prudent to make up for lost storage. A study is needed to reopen and review previous analyses to Bureau and COE or possibly provide a new analysis. This study could result in an immediate increase in water yield in years where the water elevation in the reservoir exceeds the conservation pool level. Similarly, upward adjustment of flood control pool/water conservation pool interface should be considered.
f. Further Feasibility Study of Sediment Removal Alternatives Alternatives considered in the 2000 URS Greiner Sediment Management Plan need additional engineering level detail in light of current knowledge and experience. Feasibility needs to be review given our understanding of the potential negative impacts of large movement of sediment to the Santa Maria River. Alternative sediment stockpile sites should be considered. More detailed project descriptions of preferred alternatives from the sediment management plan could be used for future grant submittals The Dunes Center Estuary Improvement and Enhancement Plan should be considered in this study.
g. Access Road Maintenance Strategy The access road to Twitchell Dam was originally a chip seal road intended for maintenance access only and had no significant structural section. With the numerous recent sediment management projects performed involving heavy equipment accessing the dam area, the road has deteriorated extensively. The 4.5 mile road is in need of complete reconstruction, not only localized repair. The cost to reclaim and overlay the road is estimated at $2.6 million. Currently the strategy is to perform this over 5 or ten years with a supplementary annual pothole project to keep the remaining areas intact. A study to refine a strategy would be simple, inexpensive and warranted.
11. Dam & Reservoir Resources
a. History of Topographical Surveys 2007 Prepared with a specification for 2’ contour intervals, this map has a contour accuracy of =+/- 1 foot. This is the most accurate and detailed aerial survey and topo for the reservoir to-date. The downstream portion was mapped to establish a baseline for downstream sedimentation. Mapping was performed for the reservoir between the elevations of 483 feet (lowest point of reservoir in 2007) to 692 feet (crest of the dam). C & C Mapping (Central Coast Mapping) was the aerial subconsultant. The project was flown on 12-04-07 and on 12-10-07. The flying height was 4,200 feet and photo scale was 1”=700’. A color, digital ortho-photo was produced for the entire reservoir area as well. Part of the effort for this mapping was to match the horizontal and vertical datum of the December 2000 survey so that comparisons would be accurate. The horizontal basis was NAD83 and based upon NGS HPGN station SLO 166 PM 15.8 PID FV2078 (located at Post-mile 15.8 on Highway 166 east of Santa Maria). The vertical datum was NGVD 29 and
TWITCHELL PROJECT MANUAL
Page 55 of 59
based upon benchmark PID FV0943 with an elevation of 727.21. This benchmark was chosen because it matched the location and elevation of a control point shown on the year 2000 survey. This 2007 map, as expected with its more detailed contours, has resulted in more accurate capacity tables with a slightly greater volume than would be calculated using previous resolution. This accuracy is estimated to indicate an actual capacity of up to 1 or 1-1/2% greater than previously mapped. 2000 The previous survey, performed in 2000 produced a 2-foot contour map, but was flown at an elevation appropriate for 4-foot resolution accuracy. The 2000 survey is accurate to +/- 2 feet. 1997 Both bathymetric and aerial photography data were used to generate the 1997 survey because at that time there was water in the reservoir. The bathymetric survey was necessary to determine the topology beneath the water surface and data was collected from a barge at an elevation of about 540 feet. 1991, 1981, and 1958 These three topographic maps were made utilizing a combination of both ground survey and aerial stereography. Electronic copies of these topographic maps do not exist, however paper copies are available.
b. Property Boundaries This survey effort did not attempt to compile or retrace District boundaries or other private property boundaries surrounding or including the reservoir. Please see Appendix 3 for an exhibit map showing approximate locations of parcels identified by Assessors Parcel Number that underlie the dam and reservoir. This exhibit is for reference only and was created from Assessors Parcel Maps.
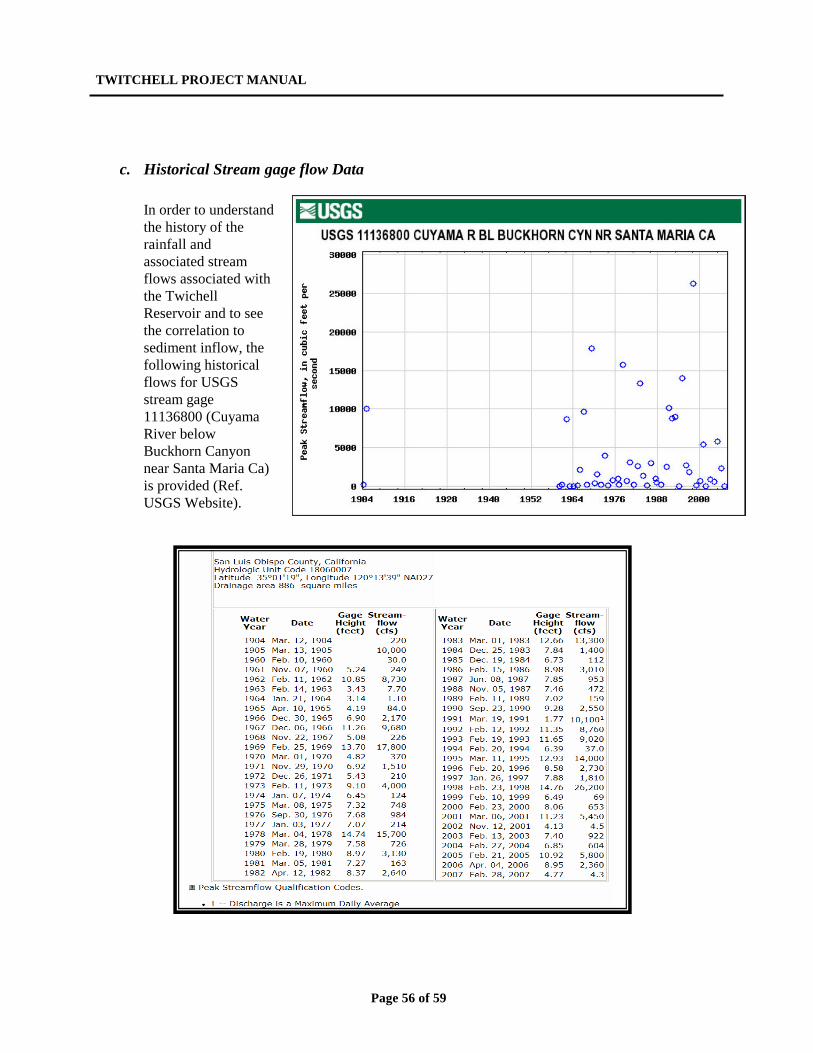
TWITCHELL PROJECT MANUAL
Page 56 of 59
c. Historical Stream gage flow Data
In order to understand the history of the rainfall and associated stream flows associated with the Twichell Reservoir and to see the correlation to sediment inflow, the following historical flows for USGS stream gage 11136800 (Cuyama River below Buckhorn Canyon near Santa Maria Ca) is provided (Ref. USGS Website).
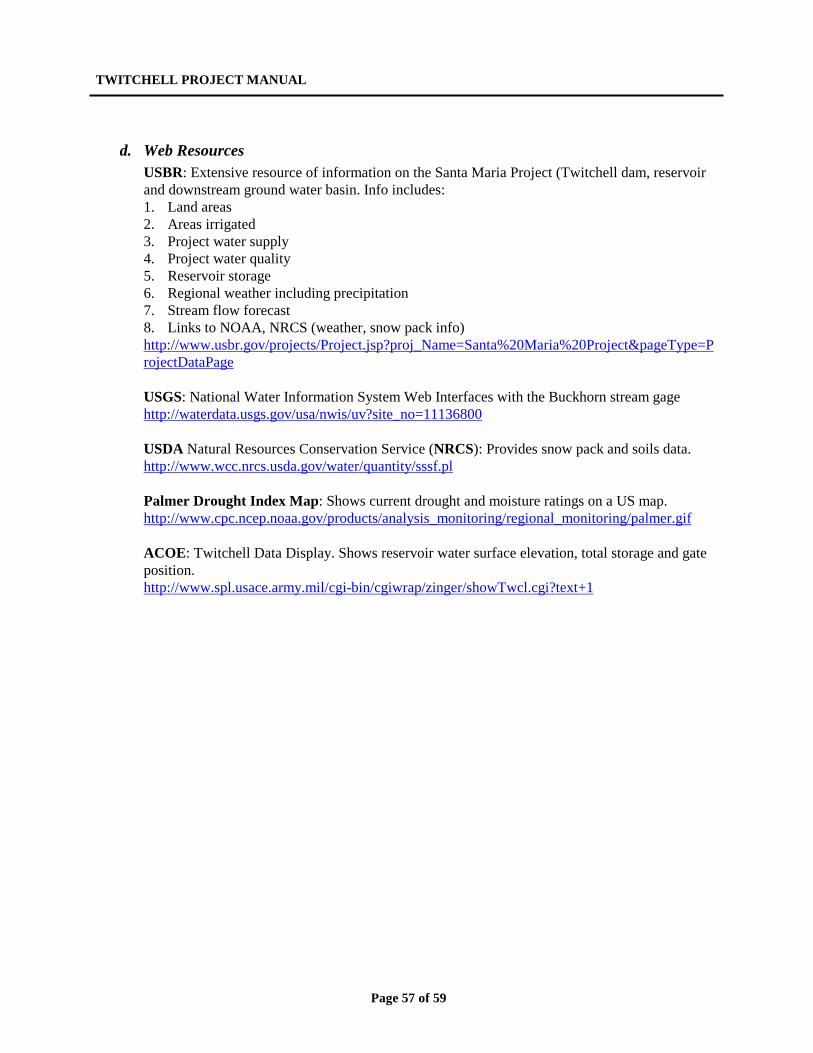
TWITCHELL PROJECT MANUAL
Page 57 of 59
d. Web Resources USBR: Extensive resource of information on the Santa Maria Project (Twitchell dam, reservoir and downstream ground water basin. Info includes: 1. Land areas 2. Areas irrigated 3. Project water supply 4. Project water quality 5. Reservoir storage 6. Regional weather including precipitation 7. Stream flow forecast 8. Links to NOAA, NRCS (weather, snow pack info) http://www.usbr.gov/projects/Project.jsp?proj_Name=Santa%20Maria%20Project&pageType=ProjectDataPage USGS: National Water Information System Web Interfaces with the Buckhorn stream gage http://waterdata.usgs.gov/usa/nwis/uv?site_no=11136800 USDA Natural Resources Conservation Service (NRCS): Provides snow pack and soils data. http://www.wcc.nrcs.usda.gov/water/quantity/sssf.pl Palmer Drought Index Map: Shows current drought and moisture ratings on a US map. http://www.cpc.ncep.noaa.gov/products/analysis_monitoring/regional_monitoring/palmer.gif ACOE: Twitchell Data Display. Shows reservoir water surface elevation, total storage and gate position. http://www.spl.usace.army.mil/cgi-bin/cgiwrap/zinger/showTwcl.cgi?text+1

TWITCHELL PROJECT MANUAL
Page 58 of 59
This Page Intentionally Blank
TWITCHELL PROJECT MANUAL
Page 59 of 59
APPENDICES
Appendix 1: 5 Year Program of projects Matrix
Appendix 2: Project Descriptions and Estimates
Appendix 3: Cuyama Watershed Maps
Appendix 4: Post Fire Soil Conservation Articles From USDA/NRCS
Appendix 5: USGS Maps of Cuyama Watershed
Appendix 6: 1998 Flood Map

TWITCHELL PROJECT MANUAL
Appendix1: 5-Year Program of Projects

TWITCHELL PROJECT MANUAL
Appendix 2: Project Descriptions and Estimates


TWITCHELL PROJECT MANUAL
Appendix 3: Cuyama Watershed Maps

TWITCHELL PROJECT MANUAL
Appendix 4: Post Fire Soil Conservation Articles From USDA/NRCS


TWITCHELL PROJECT MANUAL
Appendix 5: USGS Maps of Cuyama Watershed

TWITCHELL PROJECT MANUAL
Appendix 6: 1998 Flood Map
![[XLS]List of RPS Facilities - California Energy Commission · Web view604-638-5042 Santa Paula 60770A Ventura Regional Sanitation District Cuyama Solar Energy Project -Phase 2 Cuyama](https://img.pdfslide.us/doc/110x75/5b02b0897f8b9a84339001c4/xlslist-of-rps-facilities-california-energy-view604-638-5042-santa-paula-60770a.jpg)