Embed Size (px)
Citation preview
2010 CA AANHPI educ repor 2.qxd:Layout 1 9/11/10 6:21 PM Page 1

The State of Asian American, Native Hawaiian, and Pacific Islander Education in CaliforniaI
2010 CA AANHPI educ repor 2.qxd:Layout 1 9/11/10 6:21 PM Page I
II
The State of Asian American, Native Hawaiian,and Pacific Islander Education in California
Prepared for the Honorable Mike EngAssemblymember, 49th Assembly District
& the CALIFORNIA ASIAN PACIFIC ISLANDER JOINT LEGISLATIVE CAUCUS
By the University of California Asian American and Pacific Islander PolicyMulticampus Research Program (UC AAPI Policy MRP)
Education Working Group
Authors
Mitchell Chang (UCLA), Gordon Fung (UCSF), Don Nakanishi (UCLA),Rodney Ogawa (UC Santa Cruz), Khatharya Um (UC Berkeley),
Lois Takahashi (UCLA and Director, UC AAPI Policy MRP),Melany De La Cruz-Viesca (UCLA), Yen Ling Shek (UCLA), Annie Kuo (UCLA),
and Laura Russ (UCLA)
September 2010
2010 CA AANHPI educ repor 2.qxd:Layout 1 9/11/10 6:21 PM Page II
The State of Asian American, Native Hawaiian, and Pacific Islander Education in CaliforniaIII
Contents
PREFACE – CALIFORNIA ASSEMBLYMEMBER MIKE ENG (49TH DISTRICT) V
INTRODUCTION – LOIS TAKAHASHI, DIRECTOR, UC AAPI POLICY MRP VII
EXECUTIVE SUMMARY IX
SPONSORS AND ACKNOWLEDGEMENTS XII
I. POPULATION CHARACTERISTICS (2006-2008) 1
Estimated State Population By Race/Ethnicity 1
Estimated Population Size by AANHPI Subgroup 2
Limited English Proficiency 3
Poverty 4
Educational Attainment 6
II. K-12 SYSTEM 8
K-12 Enrollment, Graduation, and Dropouts 8
Personnel by Race/Ethnicity 11
Personnel by Race/Ethnicity and Student Race/Ethnicity 12
III. OVERVIEW OF PUBLIC POSTSECONDARY INSTITUTION ENROLLMENT AND DEGREES 13
Eligibility of Public High School Graduates for Admission to Public Postsecondary Institutions 13
Enrollment in Public Postsecondary Institutions 15
Associate and Bachelor’s Degrees Awarded at Public Postsecondary Institutions 16
IV. CALIFORNIA COMMUNITY COLLEGE SYSTEM 17
Enrollment by Race/Ethnicity 17
Retention by Program and by Race/Ethnicity 17
Success Rates by Program and by Race/Ethnicity 18
Financial Aid by Race/Ethnicity 19
Associate Degrees by Race/Ethnicity 21
Personnel by Race/Ethnicity 21
2010 CA AANHPI educ repor 2.qxd:Layout 1 9/11/10 6:21 PM Page III
CONTENTS IV
V. CALIFORNIA STATE UNIVERSITY SYSTEM 23
Enrollment by Race/Ethnicity 23
Graduation Rates by Race/Ethnicity 23
Bachelor’s Degrees by Race/Ethnicity 25
Personnel by Race/Ethnicity 26
VI. UNIVERSITY OF CALIFORNIA SYSTEM 28
Enrollment by Race/Ethnicity 28
Financial Aid by Race/Ethnicity 28
Graduation Rates by Race/Ethnicity 32
Bachelor’s Degrees by Race/Ethnicity 33
Personnel by Race/Ethnicity 35
VII. PIPELINES TO PROFESSIONAL AND GRADUATE TRAINING 36
Teacher Internship and Loan Repayment Programs by Race/Ethnicity 36
Medical Degree Recipients at the University of California by Race/Ethnicity 39
Law Degree Recipients at the University of California by Race/Ethnicity 39
Doctoral Degree Recipients by Race/Ethnicity 40
VIII. POLICY RECOMMENDATIONS 42
APPENDICES 43
2010 CA AANHPI educ repor 2.qxd:Layout 1 9/11/10 6:21 PM Page IV
The State of Asian American, Native Hawaiian, and Pacific Islander Education in CaliforniaV
PREFACE – CALIFORNIA ASSEMBLYMEMBER MIKE ENG (49TH DISTRICT)
It is with great pleasure that we release the State of Asian American, Native Hawaiian, andPacific Islander Education in California report. This project, which was produced in col-laboration with the University of California Asian American and Pacific Islander PolicyMulticampus Research Program, is the second in a series of reports that aim at providing aclearer snapshot of Asian American, Native Hawaiian, and Pacific Islanders (AANHPI) inCalifornia in a broad range of subject areas.
The primary objective of this report is to shed greater light on the educational status ofAANHPIs in California. While the ultimate goal of this collaborative effort is to produce acomprehensive report that provides disaggregated data on the subject by specific race cat-egories, this report simply analyzes the data that is available to us currently from a num-ber of public and non-profit sources.
Unfortunately, much of the available data is provided in a limited number of racial cate-gories, such as “Asians” and “Pacific Islanders.” This, of course, often produces a simplis-tic image of the “model minority,” ignoring many of the barriers that may significantlyimpact the more than a dozen ethnic subgroups that are under the broad “AANHPI” um-brella.
As policymakers, it is imperative that our knowledge and understanding evolve continu-ally with respect to who exactly our populations and subpopulations are and how they arefaring academically in our state so that we can best develop policies that are effective inmeeting their diverse and complex needs. Personally, I believe that in order to help childrensucceed in the classroom, it is critical for elected officials to understand the gaps in achieve-ment that exist within all AANHPI populations in California.
It is my hope that this report will serve as a helpful resource and tool for those educators,parents, policy makers and members of the general public wishing to better understandmany of the factors that contribute to the success of, as well as the challenges that oftenconfront, the AANHPI community in the area of education. Further, I believe this reportwill serve as the first step toward producing a greater body of data in the years to comethat expand on the possible solutions to address some of the disparities. As accurate de-mographic data are critical in developing effective policies that respond to the needs of Cal-ifornia’s residents, this report may demonstrate the urgent need for funding to researchand collect disaggregated data.
I would like to especially thank Farmers Insurance Group, Inc for funding this very im-portant project and especially to their Director of Government Affairs Michael Paiva for co-ordinating the efforts. Without their support this report would not have been possible. Ialso would like to take this opportunity to express my utmost gratitude to Lois M. Taka-hashi, Ph.D., Director of the University of California Asian American and Pacific Islander
AssemblymemberMike Eng
2010 CA AANHPI educ repor 2.qxd:Layout 1 9/11/10 6:21 PM Page V
PREFACE VI
Multicampus Research Program (UC AAPI Policy MRP), and the UC AAPI Policy MRP EducationWorking Group for their tireless efforts in compiling this report. I enjoyed our work together and Ilook forward to more partnerships to come. Finally, I would like to thank Annie Lam for her ab-solute dedication to my vision of AANHPI empowerment and without whom I could not have com-pleted this and previous reports.
MIKE ENG49th Assembly DistrictMember, API Legislative Caucus
2010 CA AANHPI educ repor 2.qxd:Layout 1 9/11/10 6:21 PM Page VI
The State of Asian American, Native Hawaiian, and Pacific Islander Education in CaliforniaVII
INTRODUCTION – LOIS TAKAHASHI, DIRECTOR, UC AAPI POLICY MRP
The University of California Asian American and Pacific Islander Policy Multicampus Re-search Program (UC AAPI Policy MRP) is proud to present this report on the state of AsianAmerican, Native Hawaiian, and Pacific Islander education in California.
The authors of this report are members of the UC AAPI Policy MRP Education WorkingGroup, which is concerned about the educational needs and challenges of California’sAANHPI communities.
In late 2009, several of the Education Working Group members met with California As-semblymember Mike Eng (49th District) and staff from the California Asian Pacific IslanderJoint Legislative Caucus to discuss the needs for information and analysis about education.This report is the first effort by the UC AAPI Policy MRP Education Working Group to pro-vide baseline information to state legislators, advocates, and communities about the stateof AANHPI education in California.
The report is a compilation of publicly available data providing profiles of K-20 students,degrees awarded and graduation rates, retention, success, and dropout rates, profiles of ed-ucators in the state by race/ethnicity and in comparison to the race/ethnicity of students,and pipelines to professional and graduate degrees. The data sources represent a variety ofpublic and nonprofit sources (see data matrix in the Appendix), all publicly available, andunfortunately many without disaggregated data by AANHPI subgroups.
Though data from the US Census’ American Community Survey show information forAANHPI subgroups, many charts in the document only report information for aggregated“Asians” or “Pacific Islanders”, with more disaggregated data available on Filipinos. AAsand NHPIs are diverse in different ways – social class, linguistic abilities, ethnic background,generation – and those differences account for educational disparities. We really regret that wecannot provide data and analysis in terms of ethnic subgroups.
Even with this important limitation, we hope that this report provides useful informationfor policy design and reformulation, for stimulating discussions about education needs andprograms, and for prioritizing public, private, and philanthropic resources to communitiesexperiencing great need. But more than that, we hope that this report serves to engageelected officials, communities, and organizations across the state to work together towardbetter educational institutions, programs, and outcomes for our AANHPI youth and com-munities.
This project could not have been completed without the effort, commitment, and hard workby the UC AAPI Policy MRP Education Working Group (Mitch Chang, Gordon Fung, DonNakanishi, Rod Ogawa, and Khatharya Um), and our team of researchers that acquired thedata and developed the charts for this report (Melany De La Cruz-Viesca, Yen Ling Shek,
Lois M. Takahashi
2010 CA AANHPI educ repor 2.qxd:Layout 1 9/11/10 6:21 PM Page VII
INTRODUCTION VIII
Annie Kuo, and Laura Russ).
I am especially grateful to Annie Lam, former Legislative Director for Assemblymember Mike Eng,who has been such a wonderful partner on this and other UC AAPI Policy MRP projects. I will al-ways be thankful for her wise counsel and boundless enthusiasm.
The UC AAPI Policy MRP is fortunate to have the energy, commitment, and expertise of over 70 fac-ulty across the University of California system to contribute to projects such as this, and we will con-tinue to work with state legislators, advocates, and community members to provide relevant andinformative analyses that can be used to guide policy design and implementation. We hope youfind this report a useful example of this effort.
Lois M. TakahashiDirector, University of California Asian American and Pacific Islander Multicampus Research Pro-gram (UC AAPI Policy MRP)Professor, Departments of Urban Planning and Asian American Studies, UCLA
2010 CA AANHPI educ repor 2.qxd:Layout 1 9/11/10 6:21 PM Page VIII
The State of Asian American, Native Hawaiian, and Pacific Islander Education in CaliforniaIX
EXECUTIVE SUMMARYCalifornia has the largest and most diverse Asian American (AA) and Native Hawaiian and PacificIslander (NHPI) population in the nation. This report on the state of AANHPI education in Cali-fornia highlights the achievements and challenges in public K-12 and public postsecondary educa-tion as they relate to AANHPI populations.1
The topic is important and timely. There has been increasing attention at the federal and state levelon the performance of schools and colleges/universities in preparing youth for participation in aninformation-driven economy and in the nation’s and state’s democratic institutions. The challengesare great, especially for students from non-dominant racial and cultural communities, includingmany immigrant groups, which historically have been underserved by our educational systems.There is an urgent need to take stock of the engagement of AANHPIs in the state’s education sys-tems. This report highlights issues, especially the limitations in available education data on AANHPIsubgroups, and provides recommendations for policy makers and community advocates concernedwith AANHPI education in California.
SUMMARY OF MAJOR FINDINGS
1. Contrary to the "model minority" characterization of Asian American, Native Hawaiian, andPacific Islander educational attainment,2 there are particular ethnic groups with disproportionatelyhigh rates of dropping out of high school and do not have high school diplomas.
• Hmong have the largest proportion (45%) in the state with less than a high schooldiploma among all racial/ethnic groups.
• About 40% of Cambodians and Laotians have less than a high school diploma, which isdouble the state rate.
• Over one fifth of Fijians have less than a high school diploma, which is higher than thestate as a whole.
• Pacific Islander students in grades 9-12 have high dropout rates, with about one-fifthestimated to drop out over a four-year period.
2. Poverty and limited English proficiency alone and together heighten the risk for dropping out ofhigh school and college/university. Most Asian American subgroups are limited English proficient,and specific Asian American, Native Hawaiian, and Pacific Islander subgroups have very highpoverty rates.
• Over 40% of Vietnamese, Koreans, Hmong, Cambodians, Taiwanese, Chinese, and Lao-tians report limited English proficiency, which is double the state rate.
1 Though private education is important for AANHPI populations (about 10% of AA K-12 students are enrolled in pri-vate schools), this report does not include information on private education in California.
2 See National Commission on Asian American and Pacific Islander Research on Education (CARE), “Asian Americansand Pacific Islanders: Facts, Not Fiction: Setting the Record Straight” for background on this characterization,http://professionals.collegeboard.com/profdownload/08-0608-AAPI.pdf
2010 CA AANHPI educ repor 2.qxd:Layout 1 9/11/10 6:21 PM Page IX
EXECUTIVE SUMMARY X
•A quarter of Hmong and Cambodians live in poverty, about double the state rate, andabout one fifth of Tongans live in poverty, more than one and a half times the state rate.
3. Research shows that professional educators who share students’ cultural and linguistic back-grounds bring “culturally responsive instruction and caring-centered pedagogy, together with highexpectations and careful alignment with district and state standards.”3 The proportion of AsianAmerican, Native Hawaiian, and Pacific Islander professional educators is less, and in some cases,far less than the proportion of Asian American, Native Hawaiian, and Pacific Islander enrolled stu-dents in the public K-12 system and postsecondary institutions. Personnel data were not availableby racial/ethnic subgroup.
• Asians, Filipinos, and Pacific Islanders are 5%-7% of all K-12 personnel in the state, butAsians, Filipinos, and Pacific Islanders are 12% of K-12 student enrollment.
• Asians, Filipinos, and Pacific Islanders are 8%-13% of all but one category of CaliforniaCommunity Colleges personnel, but Asians, Filipinos, and Pacific Islanders are 16% ofCalifornia Community College students.4
• Asians are 9% of Managerial and 15% of Faculty personnel at the California State Uni-versities, but Asians, Filipinos, and Pacific Islanders are 18% of California State Univer-sity students.
4. Financial aid is vital but not sufficient for student retention and success for Asian American, Na-tive Hawaiian, and Pacific Islander college students. Data on financial aid were not available byAANHPI subgroup or for the California State Universities, making comparisons difficult if not im-possible.5
• At the California Community Colleges, Pacific Islander students receive the largestscholarships in dollar amount, but Pacific Islander students have lower retention andsuccess rates than most other racial/ethnic groups.
• At the University of California, Asian students are the largest group among allracial/ethnic groups with parent income less than $45,000, but though they receivesimilar dollar amounts in grants as other students, smaller proportions of Asian stu-dents receive scholarships compared to other racial/ethnic groups.
The report makes three recommendations: (1) disaggregated data by AANHPI subgroups are ur-gently needed; (2) more data and analysis are needed to determine the obstacles to retention, suc-cess, and graduation for AANHPI subgroups; and (3) pipeline programs to higher education needto target AANHPIs.
3 Kiang, Peter Nien-chu and Mitchell J. Chang. “Message from the Editors: Special Issue on K–12 Education.” AAPINexus 7(1): v-xii, 2009.
4 Asians, Filipinos, and Pacific Islanders are 17% of Classified Professional personnel at the California CommunityColleges, which is similar to the proportion of Asian, Filipino, and Pacific Islander student enrollment (16%).
5 Retention refers to whether students stay in academic programs until they are complete, and Success measures howwell students are doing in terms of completing programs with a passing grade.
2010 CA AANHPI educ repor 2.qxd:Layout 1 9/11/10 6:21 PM Page X
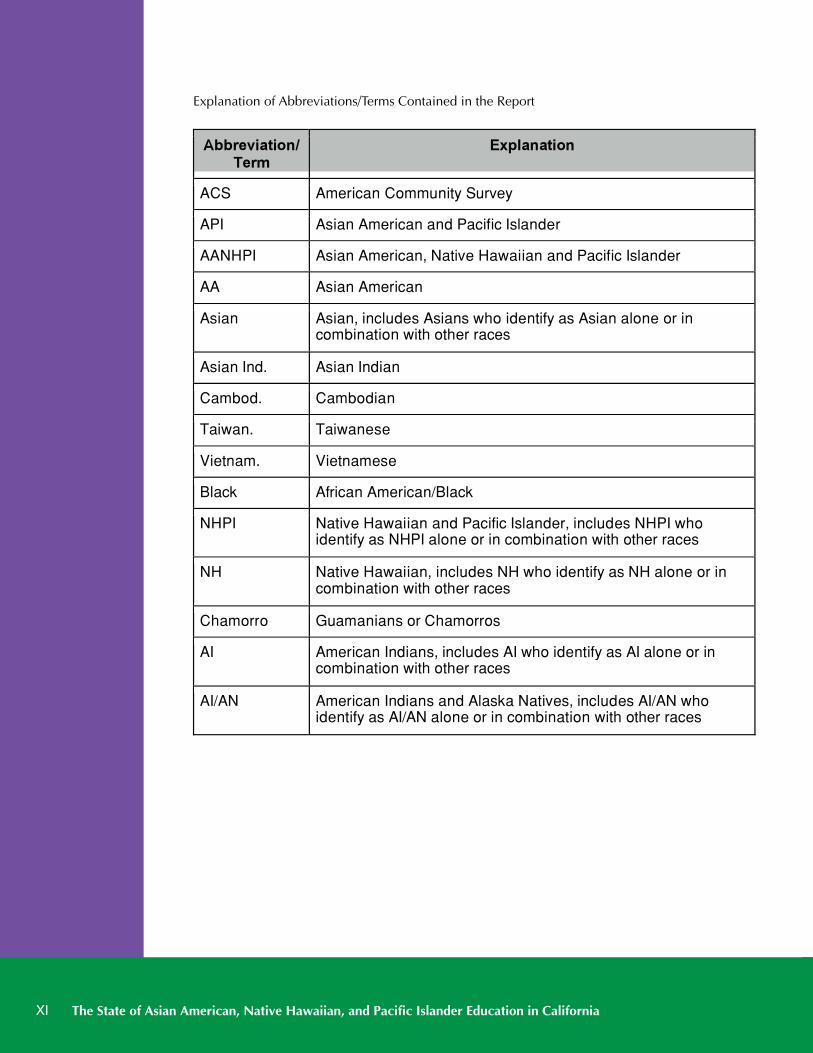
Explanation of Abbreviations/Terms Contained in the Report
The State of Asian American, Native Hawaiian, and Pacific Islander Education in CaliforniaXI
Abbreviation/Term
Explanation
ACS American Community Survey
API Asian American and Pacific Islander
AANHPI Asian American, Native Hawaiian and Pacific Islander
AA Asian American
Asian Asian, includes Asians who identify as Asian alone or in combination with other races
Asian Ind. Asian Indian
Cambod. Cambodian
Taiwan. Taiwanese
Vietnam. Vietnamese
Black African American/Black
NHPI Native Hawaiian and Pacific Islander, includes NHPI who identify as NHPI alone or in combination with other races
NH Native Hawaiian, includes NH who identify as NH alone or in combination with other races
Chamorro Guamanians or Chamorros
AI American Indians, includes AI who identify as AI alone or in combination with other races
AI/AN American Indians and Alaska Natives, includes AI/AN who identify as AI/AN alone or in combination with other races
2010 CA AANHPI educ repor 2.qxd:Layout 1 9/11/10 6:21 PM Page XI
SPONSORS AND ACKNOWLEDGEMENTS XII
Sponsors and Acknowledgements
We are grateful to Farmers Insurance Group, Inc for a generous grant to publish this report. We alsothank the UCLAAsian American Studies Center, the UCLA Graduate Division, and the UCLA LewisCenter for Regional Policy Analysis for funding/administrative support.
The authors also thank Shirley Hune (University of Washington), William Ouchi (UCLA), FrankWu (UC Hastings School of Law), Karl Scheff (California Department of Education), and Assem-blymember Mike Eng and his former Legislative Director Annie Lam for reviewing earlier drafts ofthis document and providing their insights and suggestions, Brian Chiu (UCLA) for providing re-search assistance, Michelle Sun for typesetting and graphic design, and Patricia Osorio-O’Dea andGema Fonseca of the University of California Office of the President (UCOP) for helping us locaterelevant UCOP reports.
We are responsible for all interpretations, errors, and omissions.
2010 CA AANHPI educ repor 2.qxd:Layout 1 9/11/10 6:21 PM Page XII
The State of Asian American, Native Hawaiian, and Pacific Islander Education in California1
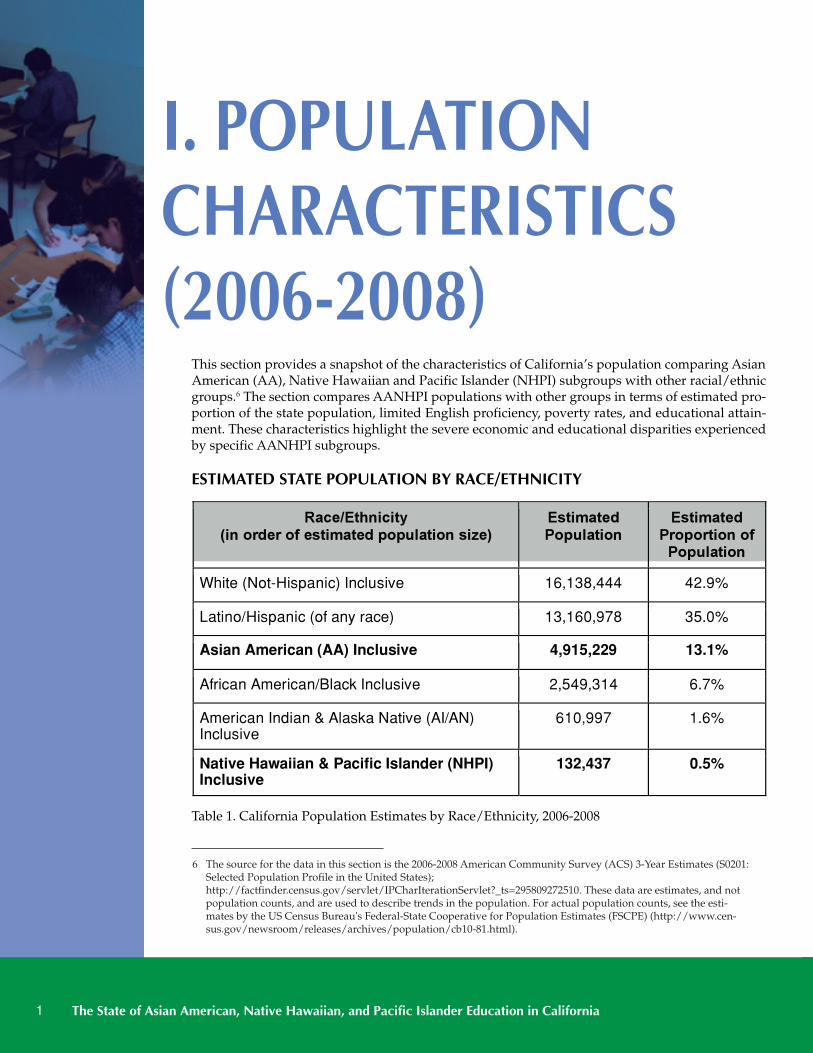
This section provides a snapshot of the characteristics of California’s population comparing AsianAmerican (AA), Native Hawaiian and Pacific Islander (NHPI) subgroups with other racial/ethnicgroups.6 The section compares AANHPI populations with other groups in terms of estimated pro-portion of the state population, limited English proficiency, poverty rates, and educational attain-ment. These characteristics highlight the severe economic and educational disparities experiencedby specific AANHPI subgroups.
ESTIMATED STATE POPULATION BY RACE/ETHNICITY
I. POPULATIONCHARACTERISTICS(2006-2008)
Race/Ethnicity (in order of estimated population size)
Estimated Population
Estimated Proportion of
Population
White (Not-Hispanic) Inclusive 16,138,444 42.9%
Latino/Hispanic (of any race) 13,160,978 35.0%
Asian American (AA) Inclusive 4,915,229 13.1%
African American/Black Inclusive 2,549,314 6.7%
American Indian & Alaska Native (AI/AN) Inclusive
610,997 1.6%
Native Hawaiian & Pacific Islander (NHPI) Inclusive
132,437 0.5%
Table 1. California Population Estimates by Race/Ethnicity, 2006-2008
6 The source for the data in this section is the 2006-2008 American Community Survey (ACS) 3-Year Estimates (S0201:Selected Population Profile in the United States);http://factfinder.census.gov/servlet/IPCharIterationServlet?_ts=295809272510. These data are estimates, and notpopulation counts, and are used to describe trends in the population. For actual population counts, see the esti-mates by the US Census Bureau's Federal-State Cooperative for Population Estimates (FSCPE) (http://www.cen-sus.gov/newsroom/releases/archives/population/cb10-81.html).
2010 CA AANHPI educ repor 2.qxd:Layout 1 9/11/10 6:21 PM Page 1
POPULATION CHARACTERISTICS (2006-2008) 2
• Asian Americans (AAs) comprise 13% of the overall estimated state population(Table 1).
• Native Hawaiian and Pacific Islanders (NHPIs) comprise 0.5% of the estimated statepopulation (Table 1).
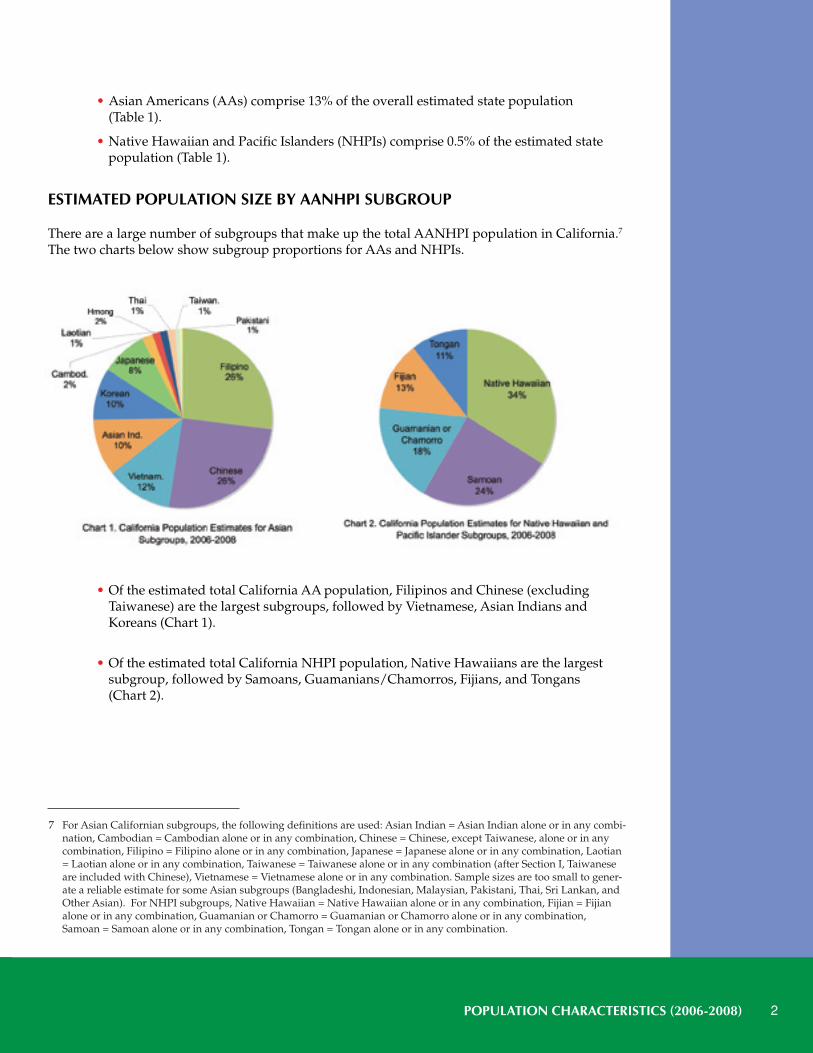
ESTIMATED POPULATION SIZE BY AANHPI SUBGROUP
There are a large number of subgroups that make up the total AANHPI population in California.7
The two charts below show subgroup proportions for AAs and NHPIs.
• Of the estimated total California AA population, Filipinos and Chinese (excludingTaiwanese) are the largest subgroups, followed by Vietnamese, Asian Indians andKoreans (Chart 1).
• Of the estimated total California NHPI population, Native Hawaiians are the largestsubgroup, followed by Samoans, Guamanians/Chamorros, Fijians, and Tongans(Chart 2).
7 For Asian Californian subgroups, the following definitions are used: Asian Indian = Asian Indian alone or in any combi-nation, Cambodian = Cambodian alone or in any combination, Chinese = Chinese, except Taiwanese, alone or in anycombination, Filipino = Filipino alone or in any combination, Japanese = Japanese alone or in any combination, Laotian= Laotian alone or in any combination, Taiwanese = Taiwanese alone or in any combination (after Section I, Taiwaneseare included with Chinese), Vietnamese = Vietnamese alone or in any combination. Sample sizes are too small to gener-ate a reliable estimate for some Asian subgroups (Bangladeshi, Indonesian, Malaysian, Pakistani, Thai, Sri Lankan, andOther Asian). For NHPI subgroups, Native Hawaiian = Native Hawaiian alone or in any combination, Fijian = Fijianalone or in any combination, Guamanian or Chamorro = Guamanian or Chamorro alone or in any combination,Samoan = Samoan alone or in any combination, Tongan = Tongan alone or in any combination.
2010 CA AANHPI educ repor 2.qxd:Layout 1 9/11/10 6:21 PM Page 2
The State of Asian American, Native Hawaiian, and Pacific Islander Education in California3
LIMITED ENGLISH PROFICIENCY
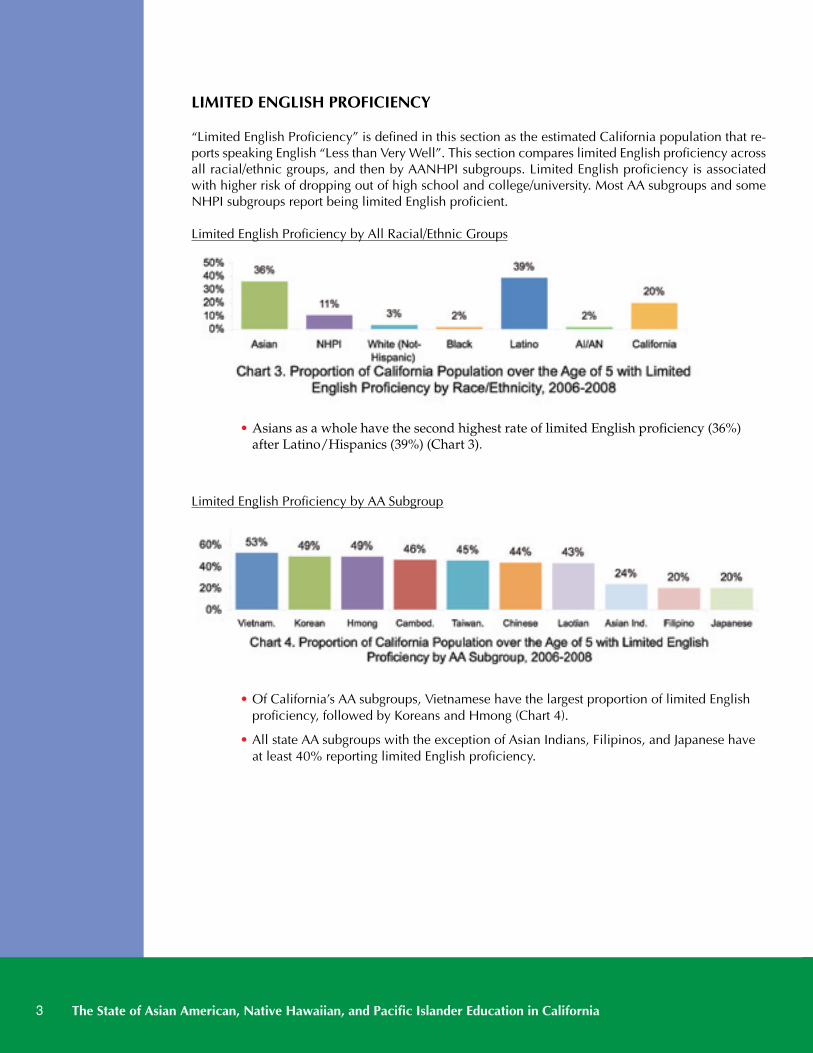
“Limited English Proficiency” is defined in this section as the estimated California population that re-ports speaking English “Less than Very Well”. This section compares limited English proficiency acrossall racial/ethnic groups, and then by AANHPI subgroups. Limited English proficiency is associatedwith higher risk of dropping out of high school and college/university. Most AA subgroups and someNHPI subgroups report being limited English proficient.
Limited English Proficiency by All Racial/Ethnic Groups
• Asians as a whole have the second highest rate of limited English proficiency (36%)after Latino/Hispanics (39%) (Chart 3).
Limited English Proficiency by AA Subgroup
• Of California’s AA subgroups, Vietnamese have the largest proportion of limited Englishproficiency, followed by Koreans and Hmong (Chart 4).
• All state AA subgroups with the exception of Asian Indians, Filipinos, and Japanese haveat least 40% reporting limited English proficiency.
2010 CA AANHPI educ repor 2.qxd:Layout 1 9/11/10 6:21 PM Page 3
POPULATION CHARACTERISTICS (2006-2008) 4
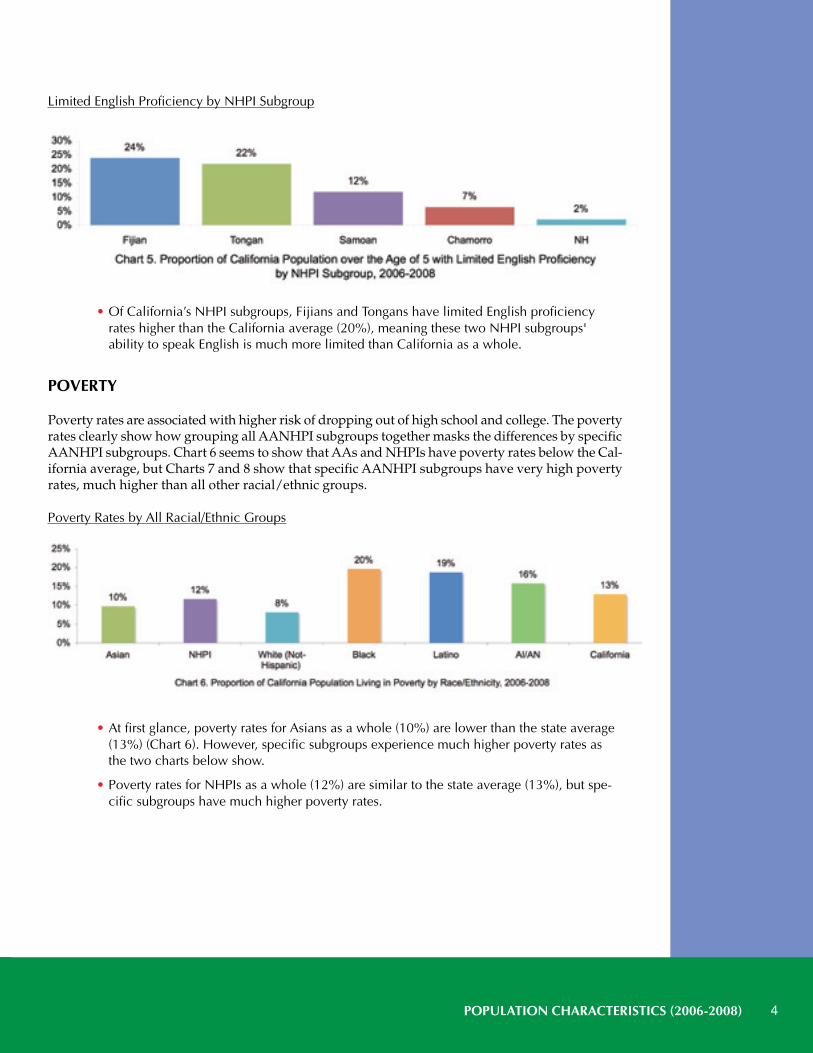
Limited English Proficiency by NHPI Subgroup
• Of California’s NHPI subgroups, Fijians and Tongans have limited English proficiencyrates higher than the California average (20%), meaning these two NHPI subgroups'ability to speak English is much more limited than California as a whole.
POVERTY
Poverty rates are associated with higher risk of dropping out of high school and college. The povertyrates clearly show how grouping all AANHPI subgroups together masks the differences by specificAANHPI subgroups. Chart 6 seems to show that AAs and NHPIs have poverty rates below the Cal-ifornia average, but Charts 7 and 8 show that specific AANHPI subgroups have very high povertyrates, much higher than all other racial/ethnic groups.
Poverty Rates by All Racial/Ethnic Groups
• At first glance, poverty rates for Asians as a whole (10%) are lower than the state average(13%) (Chart 6). However, specific subgroups experience much higher poverty rates asthe two charts below show.
• Poverty rates for NHPIs as a whole (12%) are similar to the state average (13%), but spe-cific subgroups have much higher poverty rates.
2010 CA AANHPI educ repor 2.qxd:Layout 1 9/11/10 6:21 PM Page 4
The State of Asian American, Native Hawaiian, and Pacific Islander Education in California5
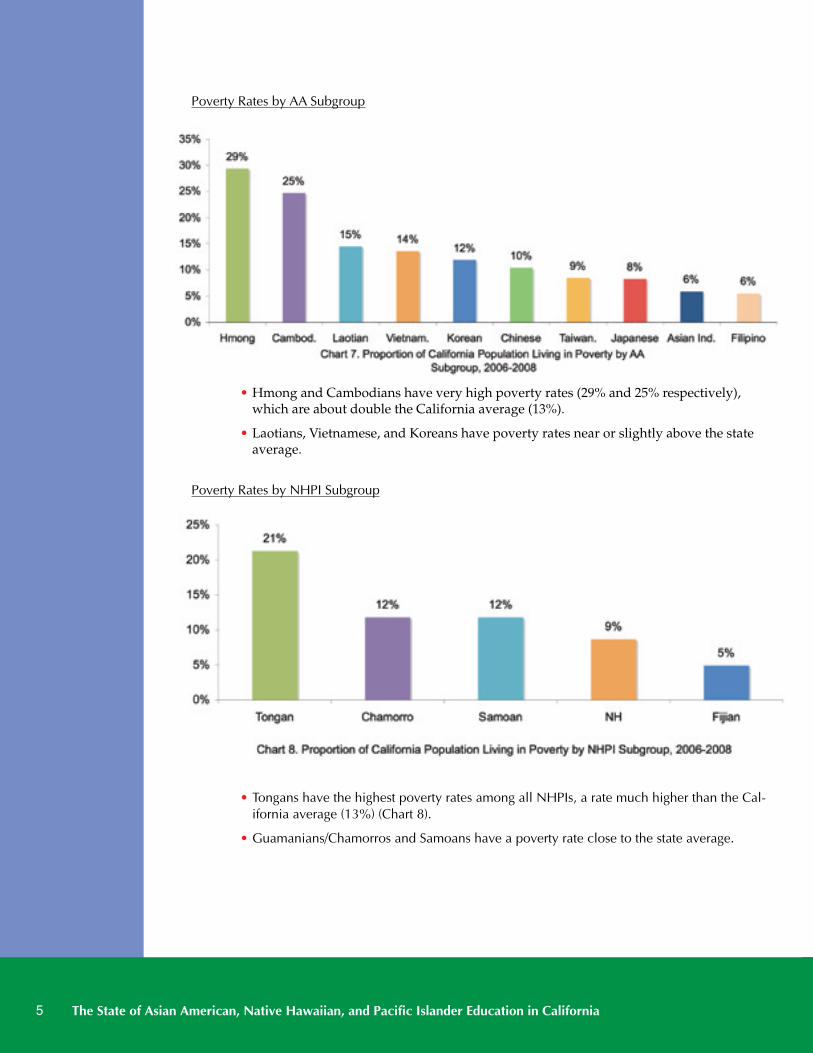
Poverty Rates by AA Subgroup
• Hmong and Cambodians have very high poverty rates (29% and 25% respectively),which are about double the California average (13%).
• Laotians, Vietnamese, and Koreans have poverty rates near or slightly above the stateaverage.
Poverty Rates by NHPI Subgroup
• Tongans have the highest poverty rates among all NHPIs, a rate much higher than the Cal-ifornia average (13%) (Chart 8).
• Guamanians/Chamorros and Samoans have a poverty rate close to the state average.
2010 CA AANHPI educ repor 2.qxd:Layout 1 9/11/10 6:21 PM Page 5
POPULATION CHARACTERISTICS (2006-2008) 6
EDUCATIONAL ATTAINMENT
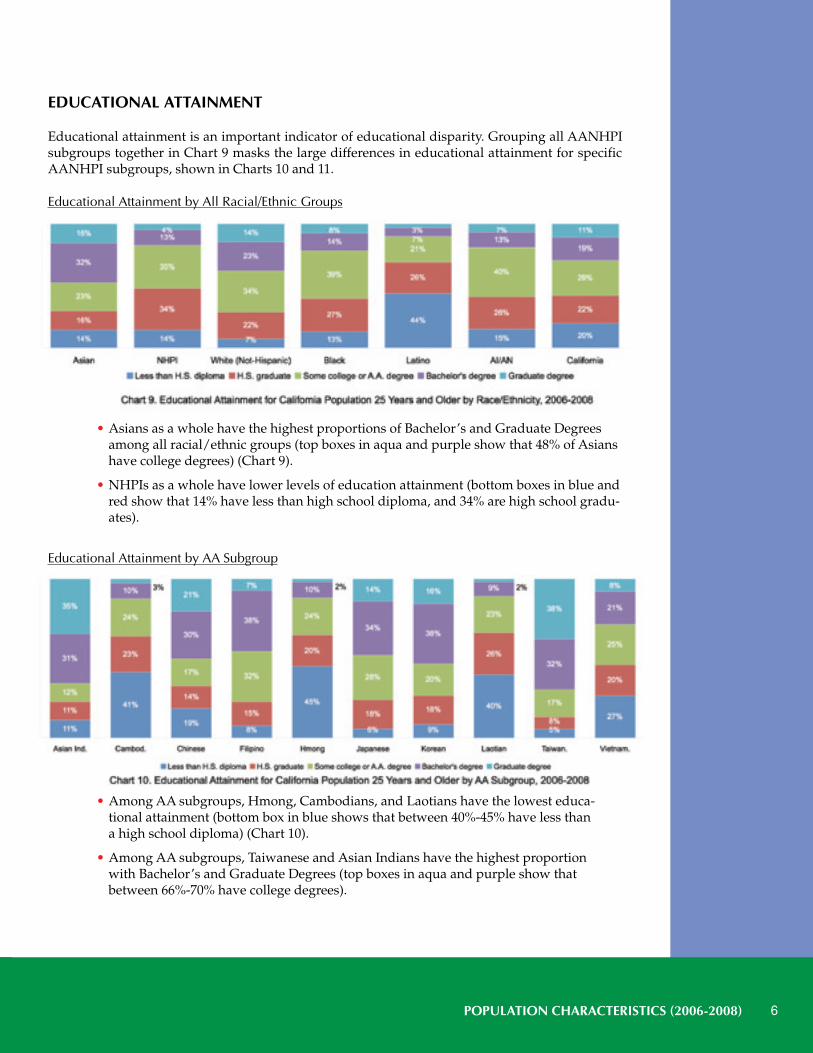
Educational attainment is an important indicator of educational disparity. Grouping all AANHPIsubgroups together in Chart 9 masks the large differences in educational attainment for specificAANHPI subgroups, shown in Charts 10 and 11.
Educational Attainment by All Racial/Ethnic Groups
• Asians as a whole have the highest proportions of Bachelor’s and Graduate Degreesamong all racial/ethnic groups (top boxes in aqua and purple show that 48% of Asianshave college degrees) (Chart 9).
• NHPIs as a whole have lower levels of education attainment (bottom boxes in blue andred show that 14% have less than high school diploma, and 34% are high school gradu-ates).
Educational Attainment by AA Subgroup
• Among AA subgroups, Hmong, Cambodians, and Laotians have the lowest educa-tional attainment (bottom box in blue shows that between 40%-45% have less thana high school diploma) (Chart 10).
• Among AA subgroups, Taiwanese and Asian Indians have the highest proportionwith Bachelor’s and Graduate Degrees (top boxes in aqua and purple show thatbetween 66%-70% have college degrees).
2010 CA AANHPI educ repor 2.qxd:Layout 1 9/11/10 6:21 PM Page 6
The State of Asian American, Native Hawaiian, and Pacific Islander Education in California7
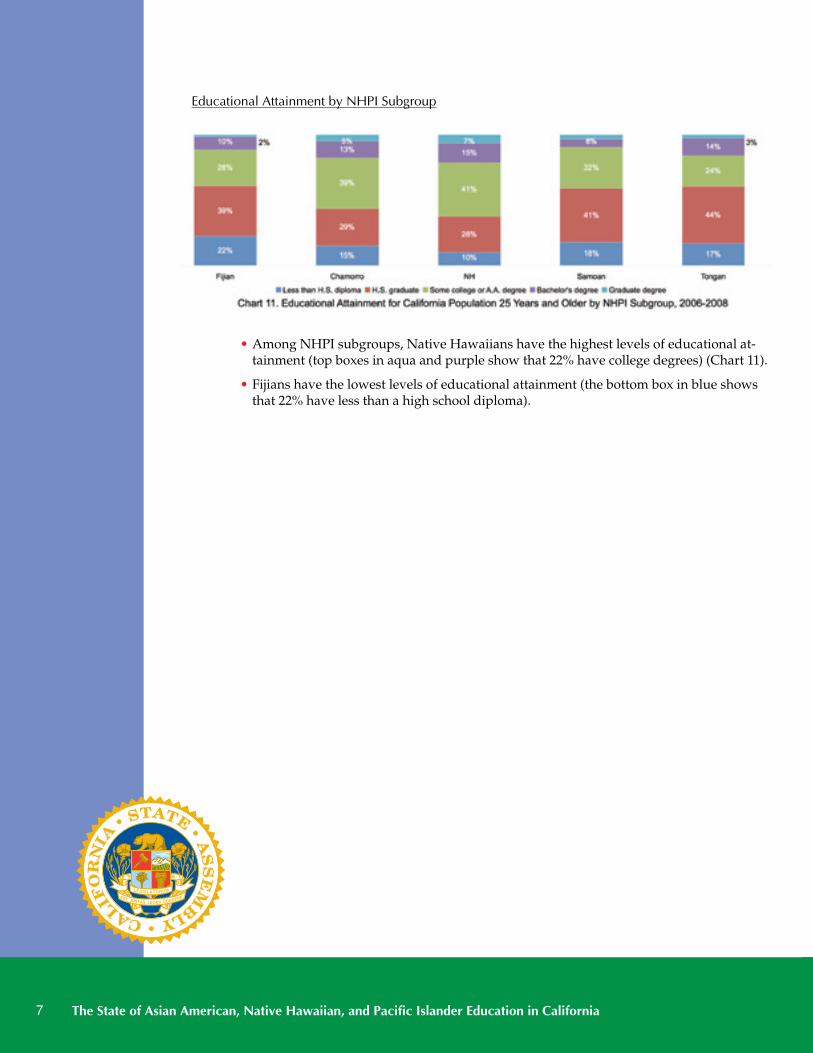
Educational Attainment by NHPI Subgroup
• Among NHPI subgroups, Native Hawaiians have the highest levels of educational at-tainment (top boxes in aqua and purple show that 22% have college degrees) (Chart 11).
• Fijians have the lowest levels of educational attainment (the bottom box in blue showsthat 22% have less than a high school diploma).
2010 CA AANHPI educ repor 2.qxd:Layout 1 9/11/10 6:21 PM Page 7
K-12 SYSTEM 8
The data and charts in this section focus on the approximately 6.3 million students enrolled in theCalifornia statewide K-12 system, and include the following information by race/ethnicity: studentprofiles, high school graduation rates, dropout rates for grades 9-12, and K-12 personnel. These dataonly provide information for Asians as a whole (not including Filipinos), for some measures, Fil-ipinos as a separate subgroup, and Pacific Islanders as a whole. The data unfortunately do not allowseparating out the AANHPI subgroups as in Section I, and therefore, disparities by AANHPI sub-group cannot be reported.
K-12 ENROLLMENT, GRADUATION, AND DROPOUTS
Enrollment, graduation rates, and dropout rates by racial/ethnic group provide a way to comparethe performance of the K-12 system and students in that system by racial/ethnic group. The data8
however do not provide breakdowns for different grade levels, AANHPI subgroups (except for Fil-ipinos), or school districts. For instance, the data do not show whether certain school districts have asignificant number of AA or NHPI students, or whether specific AANHPI subgroups dropout of grades9-12 in specific school districts, or whether specific AANHPI subgroups are graduating with high schooldiplomas.
The data may show a different achievement profile by high school graduates if the data were sep-arated by AANHPI subgroup, social class and linguistic isolation. For example, the grades 9-12dropout rate for Asian and Filipino students is relatively low, compared to other racial/ethnicgroups. However, separating AANHPI subgroups and assessing dropout rates by social class, re-cency of migration, and limited English proficiency would likely highlight vulnerability of differ-ent AANHPI subgroups.
K-12 Student Enrollment by All Racial/Ethnic Groups
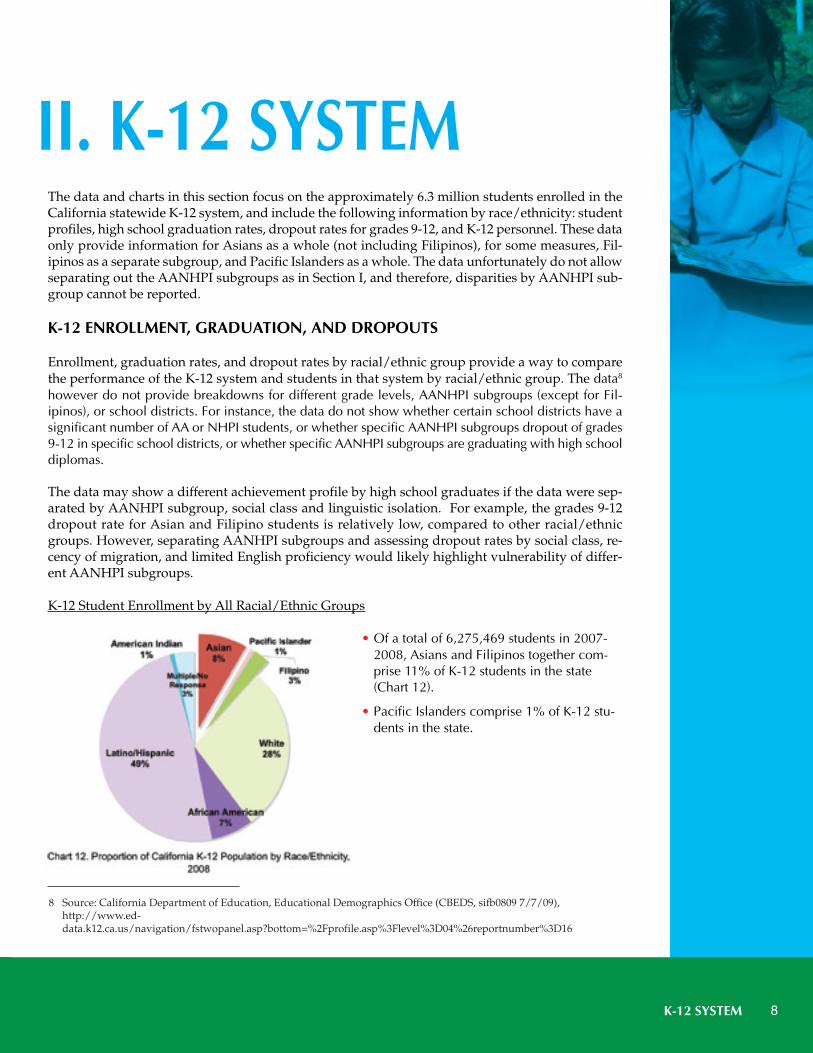
• Of a total of 6,275,469 students in 2007-2008, Asians and Filipinos together com-prise 11% of K-12 students in the state(Chart 12).
• Pacific Islanders comprise 1% of K-12 stu-dents in the state.
II. K-12 SYSTEM
8 Source: California Department of Education, Educational Demographics Office (CBEDS, sifb0809 7/7/09),http://www.ed-data.k12.ca.us/navigation/fstwopanel.asp?bottom=%2Fprofile.asp%3Flevel%3D04%26reportnumber%3D16
2010 CA AANHPI educ repor 2.qxd:Layout 1 9/11/10 6:21 PM Page 8
The State of Asian American, Native Hawaiian, and Pacific Islander Education in California9
K-12 High School Graduates by All Racial/Ethnic Groups9
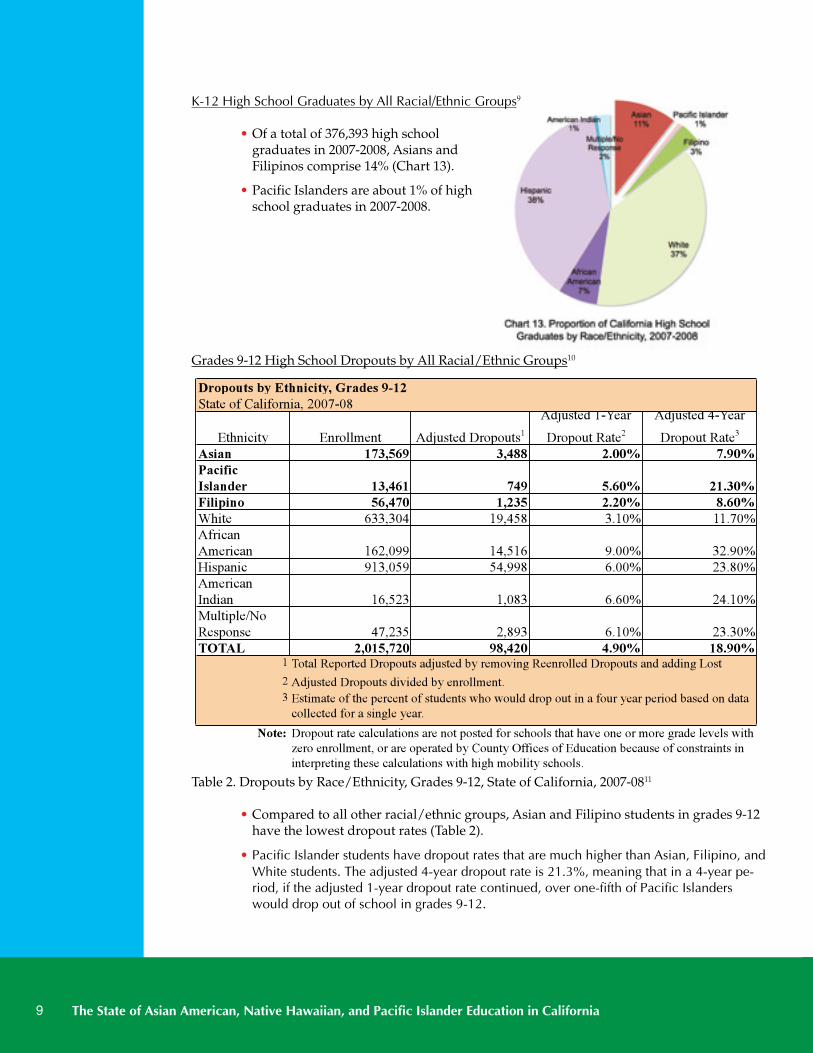
• Of a total of 376,393 high schoolgraduates in 2007-2008, Asians andFilipinos comprise 14% (Chart 13).
• Pacific Islanders are about 1% of highschool graduates in 2007-2008.
Grades 9-12 High School Dropouts by All Racial/Ethnic Groups10
Table 2. Dropouts by Race/Ethnicity, Grades 9-12, State of California, 2007-0811
• Compared to all other racial/ethnic groups, Asian and Filipino students in grades 9-12have the lowest dropout rates (Table 2).
• Pacific Islander students have dropout rates that are much higher than Asian, Filipino, andWhite students. The adjusted 4-year dropout rate is 21.3%, meaning that in a 4-year pe-riod, if the adjusted 1-year dropout rate continued, over one-fifth of Pacific Islanderswould drop out of school in grades 9-12.
Ethnicity Enrollment Adjusted Dropouts1
Adjusted 1-Year
Dropout Rate2
Adjusted 4-Year
Dropout Rate3
Asian 173,569 3,488 2.00% 7.90%
Pacific
Islander 13,461 749 5.60% 21.30%
Filipino 56,470 1,235 2.20% 8.60%
White 633,304 19,458 3.10% 11.70%
African
American 162,099 14,516 9.00% 32.90%
Hispanic 913,059 54,998 6.00% 23.80%
American
Indian 16,523 1,083 6.60% 24.10%
Multiple/No
Response 47,235 2,893 6.10% 23.30%
TOTAL 2,015,720 98,420 4.90% 18.90%1
2
3
Note:
T
Dropouts by Ethnicity, Grades 9-12
State of California, 2007-08
Total Reported Dropouts adjusted by removing Reenrolled Dropouts and adding Lost
Adjusted Dropouts divided by enrollment.
Estimate of the percent of students who would drop out in a four year period based on data
collected for a single year.
Dropout rate calculations are not posted for schools that have one or more grade levels with
zero enrollment, or are operated by County Offices of Education because of constraints in
interpreting these calculations with high mobility schools.
2010 CA AANHPI educ repor 2.qxd:Layout 1 9/11/10 6:21 PM Page 9
K-12 SYSTEM 10
9 Source: California Department of Education, Educational Demographics Office (CBEDS, sifc07 8/7/09)http://www.ed-data.k12.ca.us/Navigation/fsTwoPanel.asp?bottom=%2Fprofile.asp%3Flevel%3D04%26reportNumber%3D16; “Thenumber of twelfth-grade graduates, by ethnicity, who received a diploma in the school year indicated or the summerfollowing that year. It does not include students who took the California High School Proficiency Examination, pro-grams administered by a community college, or adult education programs or who received a General Education Devel-opment certificate (GED).”
10 “To estimate the rate of high school dropouts in California, Total Reported Dropouts were adjusted by removing Reen-rolled Dropouts and adding Lost Transfers. The Adjusted one-year dropout rate was calculated by dividing AdjustedDropouts by enrollment. The estimate of the proportion of students who would drop out in a four-year period wasbased on data collected for a single year. Dropout rate calculations were not posted for schools that had one or moregrade levels with zero enrollment, or were operated by County Offices of Education (because of constraints in interpret-ing these calculations with high mobility schools). As of 2006-07, schools report enrollment to the California Depart-ment of Education using a unique statewide student identifier (SSID) for each student. Before SSIDs, dropout rates wereestimates based on aggregate data of enrollment and dropouts. Therefore, data before and after 2006-07 cannot bemeaningfully compared.”
11 Source: California Department of Education, Educational Demographics Office (CBEDS, dropouts07 8/7/09),http://www.ed-data.k12.ca.us/Navigation/fsTwoPanel.asp?bottom=%2Fprofile.asp%3Flevel%3D04%26reportNumber%3D16
2010 CA AANHPI educ repor 2.qxd:Layout 1 9/11/10 6:22 PM Page 10
The State of Asian American, Native Hawaiian, and Pacific Islander Education in California11
PERSONNEL BY RACE/ETHNICITY
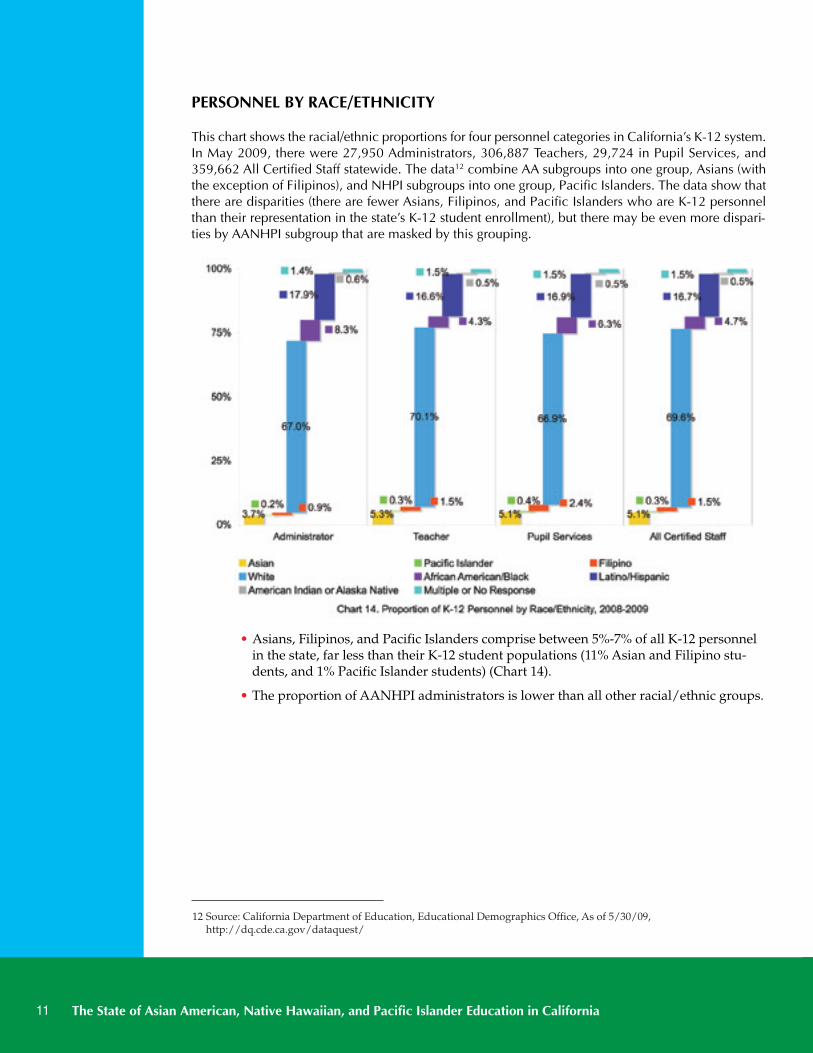
This chart shows the racial/ethnic proportions for four personnel categories in California’s K-12 system.In May 2009, there were 27,950 Administrators, 306,887 Teachers, 29,724 in Pupil Services, and359,662 All Certified Staff statewide. The data12 combine AA subgroups into one group, Asians (withthe exception of Filipinos), and NHPI subgroups into one group, Pacific Islanders. The data show thatthere are disparities (there are fewer Asians, Filipinos, and Pacific Islanders who are K-12 personnelthan their representation in the state’s K-12 student enrollment), but there may be even more dispari-ties by AANHPI subgroup that are masked by this grouping.
• Asians, Filipinos, and Pacific Islanders comprise between 5%-7% of all K-12 personnelin the state, far less than their K-12 student populations (11% Asian and Filipino stu-dents, and 1% Pacific Islander students) (Chart 14).
• The proportion of AANHPI administrators is lower than all other racial/ethnic groups.
12 Source: California Department of Education, Educational Demographics Office, As of 5/30/09,http://dq.cde.ca.gov/dataquest/
2010 CA AANHPI educ repor 2.qxd:Layout 1 9/11/10 6:22 PM Page 11
K-12 SYSTEM 12
PERSONNEL BY RACE/ETHNICITY AND STUDENT RACE/ETHNICITY
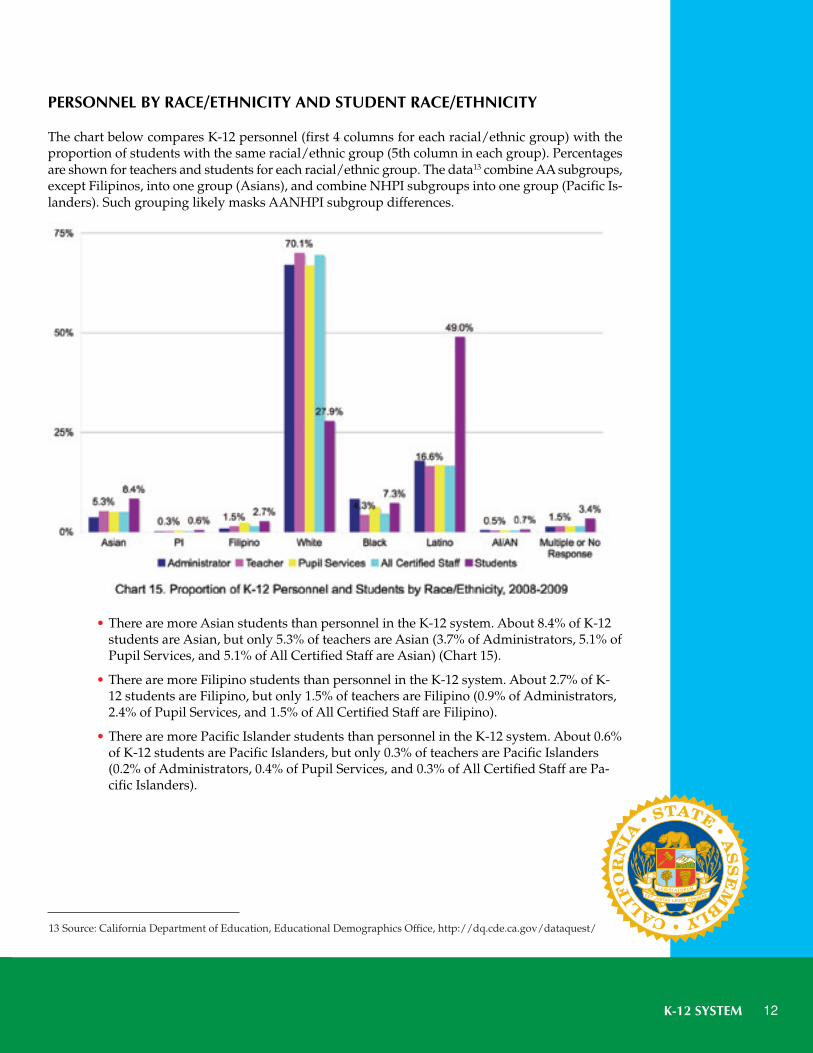
The chart below compares K-12 personnel (first 4 columns for each racial/ethnic group) with theproportion of students with the same racial/ethnic group (5th column in each group). Percentagesare shown for teachers and students for each racial/ethnic group. The data13 combine AA subgroups,except Filipinos, into one group (Asians), and combine NHPI subgroups into one group (Pacific Is-landers). Such grouping likely masks AANHPI subgroup differences.
• There are more Asian students than personnel in the K-12 system. About 8.4% of K-12students are Asian, but only 5.3% of teachers are Asian (3.7% of Administrators, 5.1% ofPupil Services, and 5.1% of All Certified Staff are Asian) (Chart 15).
• There are more Filipino students than personnel in the K-12 system. About 2.7% of K-12 students are Filipino, but only 1.5% of teachers are Filipino (0.9% of Administrators,2.4% of Pupil Services, and 1.5% of All Certified Staff are Filipino).
• There are more Pacific Islander students than personnel in the K-12 system. About 0.6%of K-12 students are Pacific Islanders, but only 0.3% of teachers are Pacific Islanders(0.2% of Administrators, 0.4% of Pupil Services, and 0.3% of All Certified Staff are Pa-cific Islanders).
13 Source: California Department of Education, Educational Demographics Office, http://dq.cde.ca.gov/dataquest/
2010 CA AANHPI educ repor 2.qxd:Layout 1 9/11/10 6:22 PM Page 12
The State of Asian American, Native Hawaiian, and Pacific Islander Education in California13
This section provides an overview of public high school graduates who meet admissions require-ments for California State Universities and the University of California (in other words, they are el-igible for admission),14 and enrollment and degrees awarded by racial/ethnic group for theCalifornia Community Colleges, California State Universities, and University of California system.15
Data specific to each of the systems are presented in later sections. The data do not disaggregate byAA or NHPI subgroup, except for Filipinos. Grouping these data into Asians and Pacific Islanders(APIs) as a whole likely mask any educational disparities such as were shown in Section I of this re-port.
ELIGIBILITY OF PUBLIC HIGH SCHOOL GRADUATES FOR ADMISSION TOPUBLIC POSTSECONDARY INSTITUTIONS
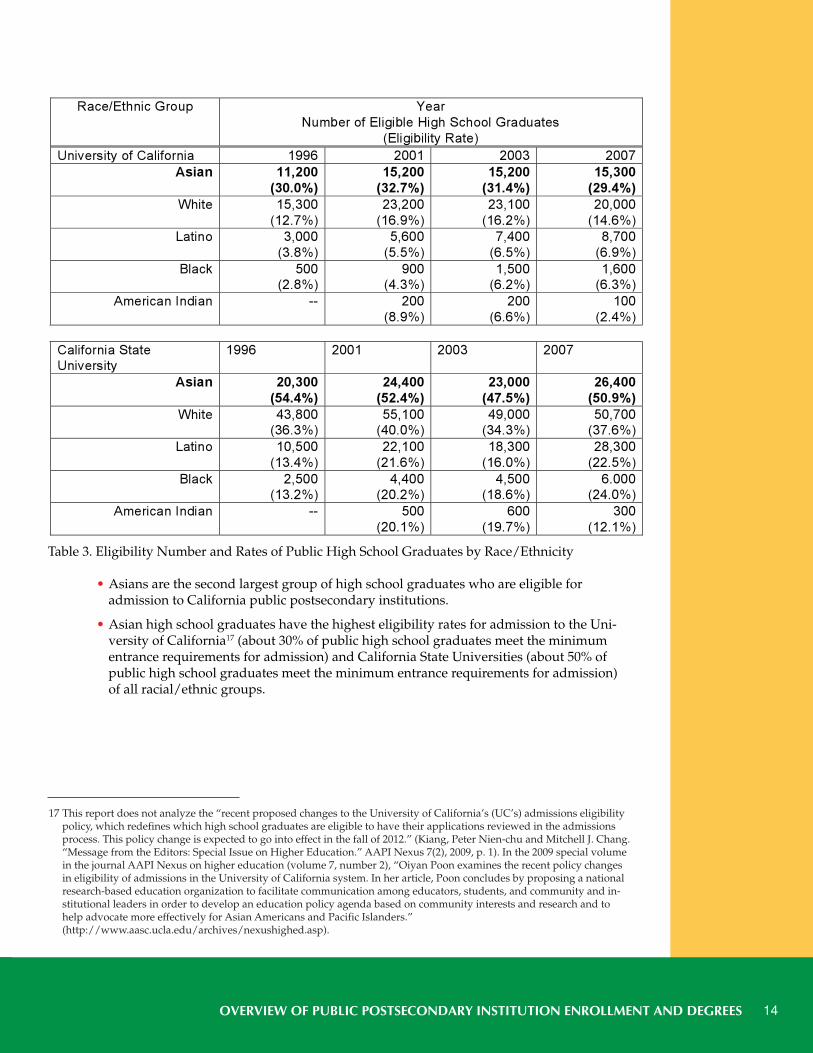
This table shows the total number of public high school graduates who were eligible for admissionto California State Universities and the University of California from 1996-2007 by racial/ethnicgroup.16 The data for Asians groups together Asians (including Filipinos) and Native Hawaiiansand Pacific Islanders. The total number of public high school graduates in 2007 was 350,400, with51,800 Asians (including Filipinos, Native Hawaiians and Pacific Islanders), 136,500 Whites, 125,700Latinos, 24,900 Blacks, 2,800 American Indians, and 8,600 of unknown racial/ethnic background.
III. OVERVIEW OF PUBLICPOSTSECONDARYINSTITUTION ENROLLMENTAND DEGREES
14 Source: http://www.cpec.ca.gov/completereports/2008reports/08-20.pdf, p. 4, 6.15 The University of California, California State Universities, and California Community Colleges submit a record for each
student enrolled and for each degree or certificate completed. The California Postsecondary Education Commission(http://www.cpec.ca.gov/OnLineData/OnLineData.asp) compiles these submitted data.
16 Source: http://www.cpec.ca.gov/completereports/2008reports/08-20.pdf; “The eligibility rates presented in this reportare based on the number of high school graduates who meet the minimum entrance requirements for UC and CSU.These figures differ from the number of students who are admitted to or actually enter each system.” (p. 7).
2010 CA AANHPI educ repor 2.qxd:Layout 1 9/11/10 6:22 PM Page 13
OVERVIEW OF PUBLIC POSTSECONDARY INSTITUTION ENROLLMENT AND DEGREES 14
Table 3. Eligibility Number and Rates of Public High School Graduates by Race/Ethnicity
• Asians are the second largest group of high school graduates who are eligible foradmission to California public postsecondary institutions.
• Asian high school graduates have the highest eligibility rates for admission to the Uni-versity of California17 (about 30% of public high school graduates meet the minimumentrance requirements for admission) and California State Universities (about 50% ofpublic high school graduates meet the minimum entrance requirements for admission)of all racial/ethnic groups.
Race/Ethnic Group
Year Number of Eligible High School Graduates
(Eligibility Rate) University of California 1996 2001 2003 2007
Asian 11,200
(30.0%) 15,200
(32.7%) 15,200
(31.4%) 15,300
(29.4%) White 15,300
(12.7%) 23,200
(16.9%) 23,100
(16.2%) 20,000
(14.6%) Latino 3,000
(3.8%) 5,600
(5.5%) 7,400
(6.5%) 8,700
(6.9%) Black 500
(2.8%) 900
(4.3%) 1,500
(6.2%) 1,600
(6.3%) American Indian -- 200
(8.9%) 200
(6.6%) 100
(2.4%)
California State University
1996 2001 2003 2007
Asian 20,300
(54.4%) 24,400
(52.4%) 23,000
(47.5%) 26,400
(50.9%) White 43,800
(36.3%) 55,100
(40.0%) 49,000
(34.3%) 50,700
(37.6%) Latino 10,500
(13.4%) 22,100
(21.6%) 18,300
(16.0%) 28,300
(22.5%) Black 2,500
(13.2%) 4,400
(20.2%) 4,500
(18.6%) 6.000
(24.0%) American Indian -- 500
(20.1%) 600
(19.7%) 300
(12.1%)
17 This report does not analyze the “recent proposed changes to the University of California’s (UC’s) admissions eligibilitypolicy, which redefines which high school graduates are eligible to have their applications reviewed in the admissionsprocess. This policy change is expected to go into effect in the fall of 2012.” (Kiang, Peter Nien-chu and Mitchell J. Chang.“Message from the Editors: Special Issue on Higher Education.” AAPI Nexus 7(2), 2009, p. 1). In the 2009 special volumein the journal AAPI Nexus on higher education (volume 7, number 2), “Oiyan Poon examines the recent policy changesin eligibility of admissions in the University of California system. In her article, Poon concludes by proposing a nationalresearch-based education organization to facilitate communication among educators, students, and community and in-stitutional leaders in order to develop an education policy agenda based on community interests and research and tohelp advocate more effectively for Asian Americans and Pacific Islanders.”(http://www.aasc.ucla.edu/archives/nexushighed.asp).
2010 CA AANHPI educ repor 2.qxd:Layout 1 9/11/10 6:22 PM Page 14
The State of Asian American, Native Hawaiian, and Pacific Islander Education in California15
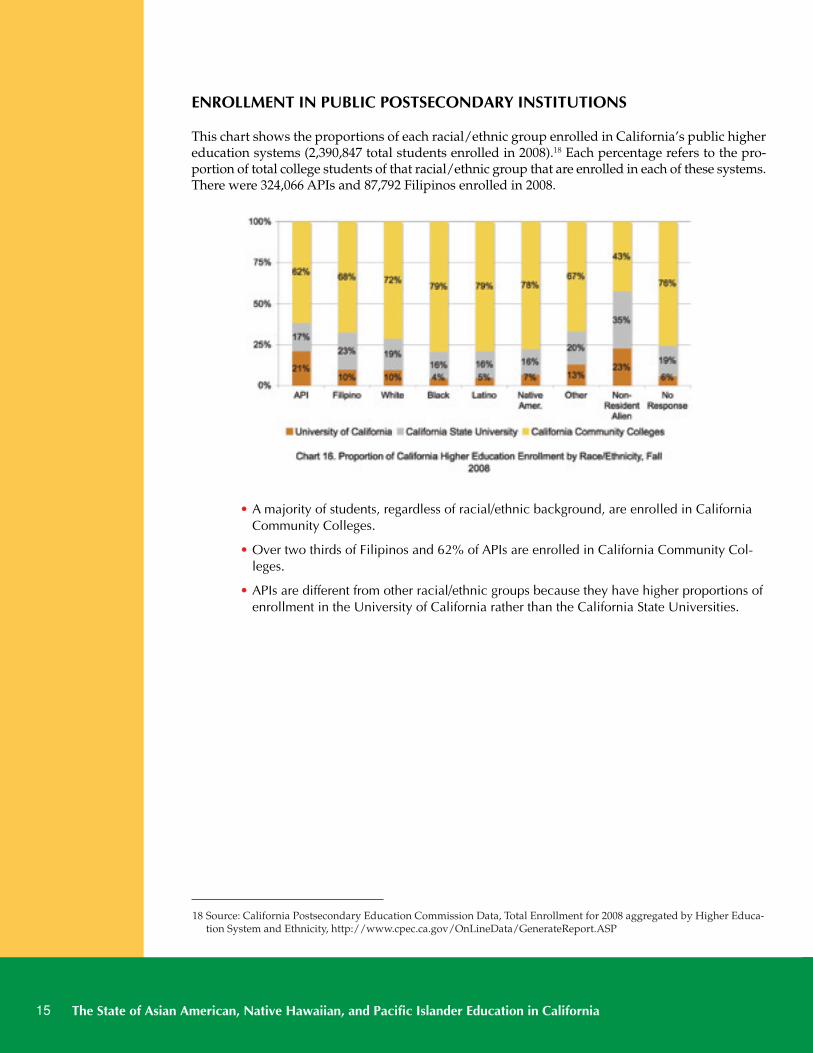
ENROLLMENT IN PUBLIC POSTSECONDARY INSTITUTIONS
This chart shows the proportions of each racial/ethnic group enrolled in California’s public highereducation systems (2,390,847 total students enrolled in 2008).18 Each percentage refers to the pro-portion of total college students of that racial/ethnic group that are enrolled in each of these systems.There were 324,066 APIs and 87,792 Filipinos enrolled in 2008.
• A majority of students, regardless of racial/ethnic background, are enrolled in CaliforniaCommunity Colleges.
• Over two thirds of Filipinos and 62% of APIs are enrolled in California Community Col-leges.
• APIs are different from other racial/ethnic groups because they have higher proportions ofenrollment in the University of California rather than the California State Universities.
18 Source: California Postsecondary Education Commission Data, Total Enrollment for 2008 aggregated by Higher Educa-tion System and Ethnicity, http://www.cpec.ca.gov/OnLineData/GenerateReport.ASP
2010 CA AANHPI educ repor 2.qxd:Layout 1 9/11/10 6:22 PM Page 15
OVERVIEW OF PUBLIC POSTSECONDARY INSTITUTION ENROLLMENT AND DEGREES 16
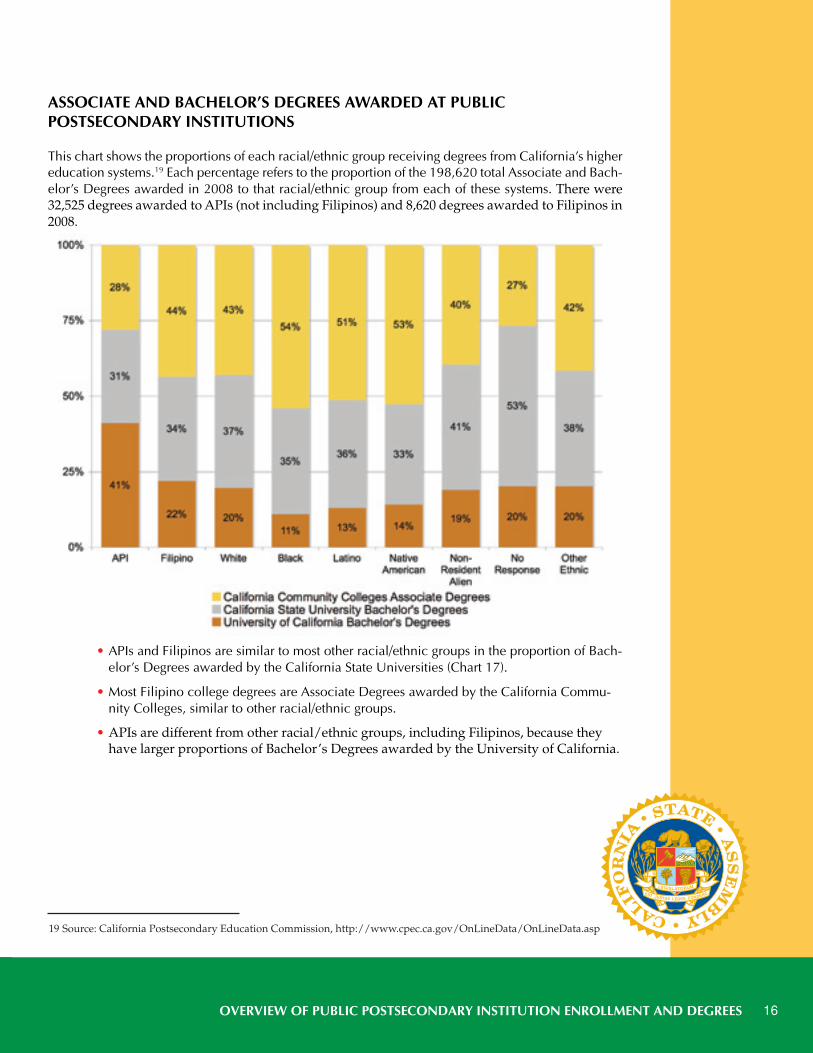
ASSOCIATE AND BACHELOR’S DEGREES AWARDED AT PUBLICPOSTSECONDARY INSTITUTIONS
This chart shows the proportions of each racial/ethnic group receiving degrees from California’s highereducation systems.19 Each percentage refers to the proportion of the 198,620 total Associate and Bach-elor’s Degrees awarded in 2008 to that racial/ethnic group from each of these systems. There were32,525 degrees awarded to APIs (not including Filipinos) and 8,620 degrees awarded to Filipinos in2008.
• APIs and Filipinos are similar to most other racial/ethnic groups in the proportion of Bach-elor’s Degrees awarded by the California State Universities (Chart 17).
• Most Filipino college degrees are Associate Degrees awarded by the California Commu-nity Colleges, similar to other racial/ethnic groups.
• APIs are different from other racial/ethnic groups, including Filipinos, because theyhave larger proportions of Bachelor’s Degrees awarded by the University of California.
19 Source: California Postsecondary Education Commission, http://www.cpec.ca.gov/OnLineData/OnLineData.asp
2010 CA AANHPI educ repor 2.qxd:Layout 1 9/11/10 6:22 PM Page 16
The State of Asian American, Native Hawaiian, and Pacific Islander Education in California17
This section focuses on the California Community Colleges, and includes information about stu-dents (enrollment by race/ethnicity, retention by enrollment status and race/ethnicity, AssociateDegrees by race/ethnicity, financial aid by race/ethnicity), and college staff (personnel by race/eth-nicity). Much of this section’s data combine AA subgroups into one group, Asians, with the excep-tion of Filipinos, and NHPI subgroups into one group, Pacific Islanders (PIs). Grouping AANHPIsubgroups together (either Asians and Pacific Islanders in one group, or Asians as one group andPacific Islanders as another) may mask educational disparities (as shown in educational attainmentin Section I).
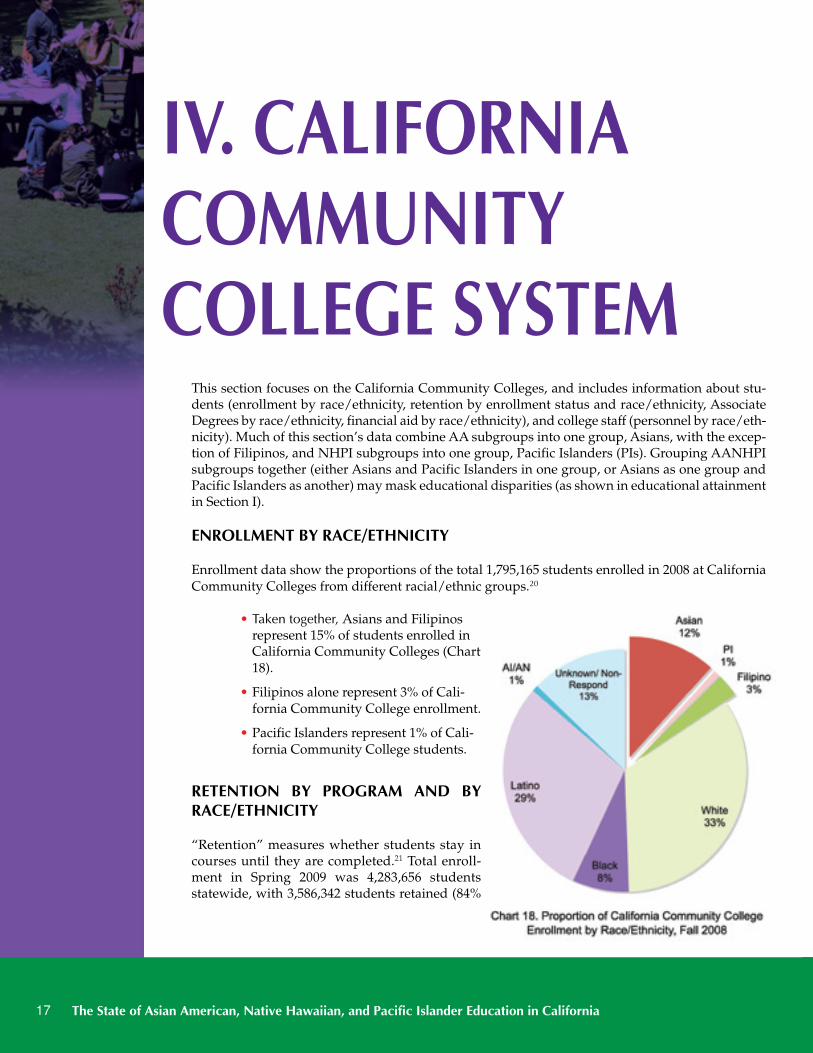
ENROLLMENT BY RACE/ETHNICITY
Enrollment data show the proportions of the total 1,795,165 students enrolled in 2008 at CaliforniaCommunity Colleges from different racial/ethnic groups.20
• Taken together, Asians and Filipinosrepresent 15% of students enrolled inCalifornia Community Colleges (Chart18).
• Filipinos alone represent 3% of Cali-fornia Community College enrollment.
• Pacific Islanders represent 1% of Cali-fornia Community College students.
RETENTION BY PROGRAM AND BYRACE/ETHNICITY
“Retention” measures whether students stay incourses until they are completed.21 Total enroll-ment in Spring 2009 was 4,283,656 studentsstatewide, with 3,586,342 students retained (84%
IV. CALIFORNIACOMMUNITYCOLLEGE SYSTEM
2010 CA AANHPI educ repor 2.qxd:Layout 1 9/11/10 6:22 PM Page 17
CALIFORNIA COMMUNITY COLLEGE SYSTEM 18
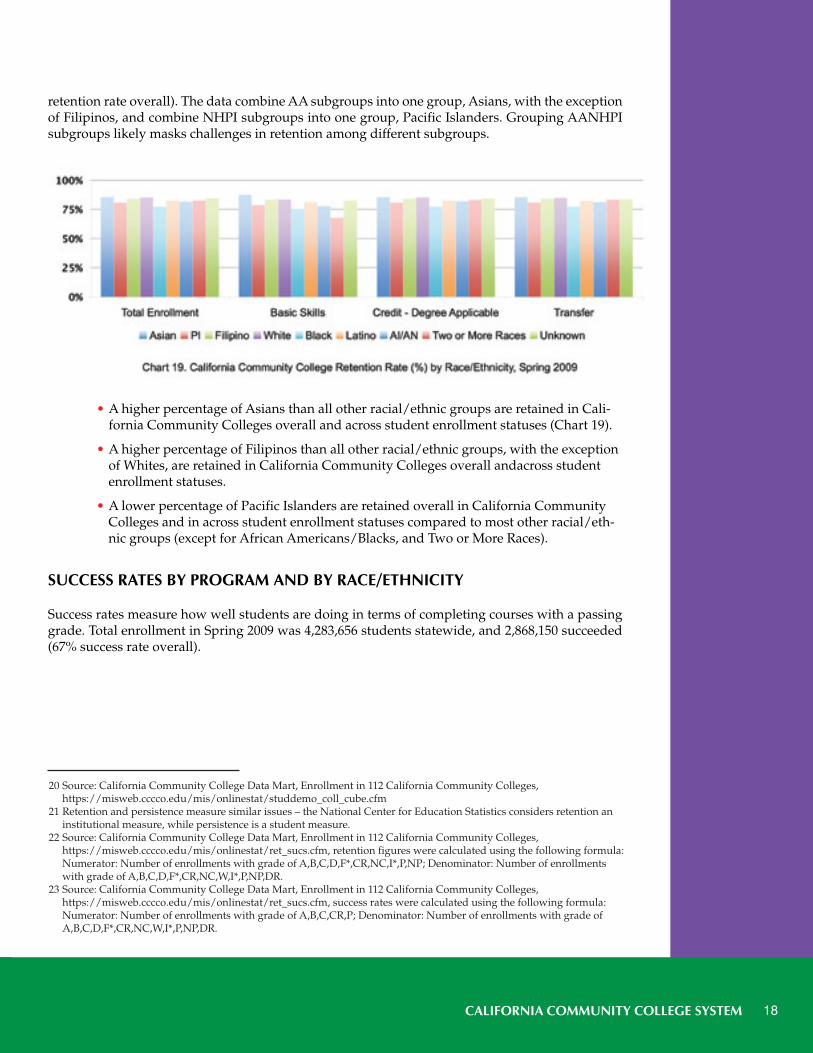
retention rate overall). The data combine AA subgroups into one group, Asians, with the exceptionof Filipinos, and combine NHPI subgroups into one group, Pacific Islanders. Grouping AANHPIsubgroups likely masks challenges in retention among different subgroups.
• A higher percentage of Asians than all other racial/ethnic groups are retained in Cali-fornia Community Colleges overall and across student enrollment statuses (Chart 19).
• A higher percentage of Filipinos than all other racial/ethnic groups, with the exceptionof Whites, are retained in California Community Colleges overall andacross studentenrollment statuses.
• A lower percentage of Pacific Islanders are retained overall in California CommunityColleges and in across student enrollment statuses compared to most other racial/eth-nic groups (except for African Americans/Blacks, and Two or More Races).
SUCCESS RATES BY PROGRAM AND BY RACE/ETHNICITY
Success rates measure how well students are doing in terms of completing courses with a passinggrade. Total enrollment in Spring 2009 was 4,283,656 students statewide, and 2,868,150 succeeded(67% success rate overall).
20 Source: California Community College Data Mart, Enrollment in 112 California Community Colleges,https://misweb.cccco.edu/mis/onlinestat/studdemo_coll_cube.cfm
21 Retention and persistence measure similar issues – the National Center for Education Statistics considers retention aninstitutional measure, while persistence is a student measure.
22 Source: California Community College Data Mart, Enrollment in 112 California Community Colleges,https://misweb.cccco.edu/mis/onlinestat/ret_sucs.cfm, retention figures were calculated using the following formula:Numerator: Number of enrollments with grade of A,B,C,D,F*,CR,NC,I*,P,NP; Denominator: Number of enrollmentswith grade of A,B,C,D,F*,CR,NC,W,I*,P,NP,DR.
23 Source: California Community College Data Mart, Enrollment in 112 California Community Colleges,https://misweb.cccco.edu/mis/onlinestat/ret_sucs.cfm, success rates were calculated using the following formula:Numerator: Number of enrollments with grade of A,B,C,CR,P; Denominator: Number of enrollments with grade ofA,B,C,D,F*,CR,NC,W,I*,P,NP,DR.
2010 CA AANHPI educ repor 2.qxd:Layout 1 9/11/10 6:22 PM Page 18
The State of Asian American, Native Hawaiian, and Pacific Islander Education in California19
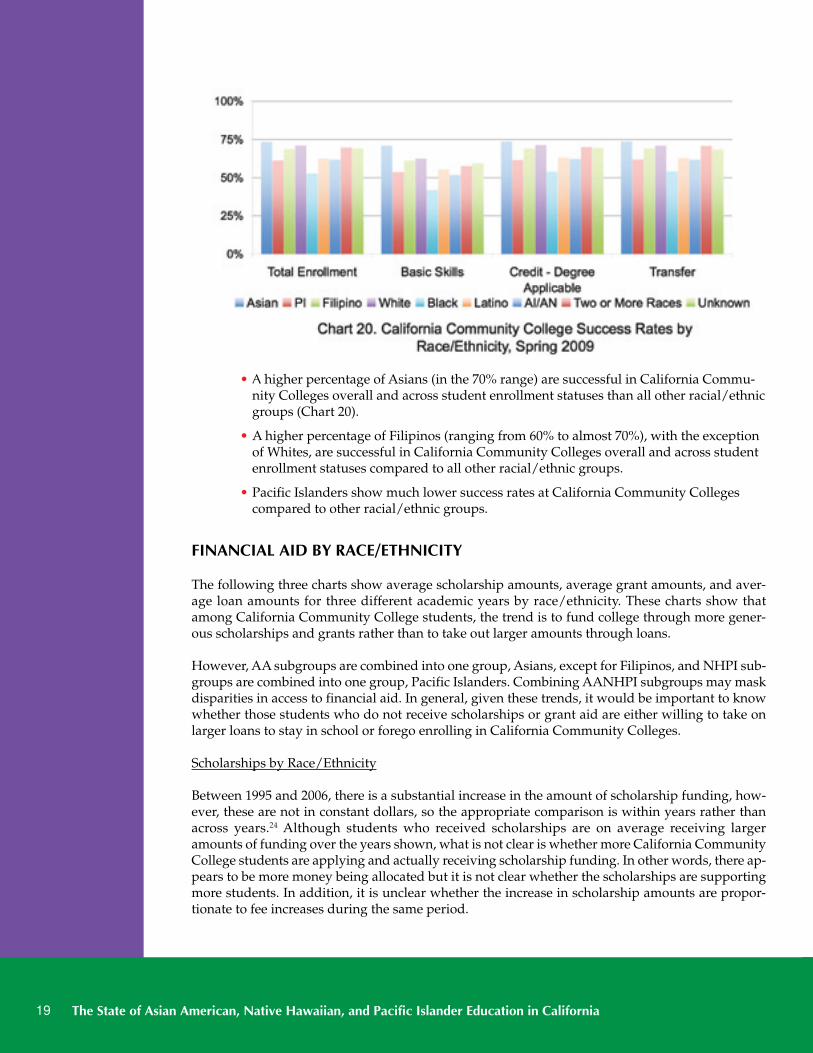
• A higher percentage of Asians (in the 70% range) are successful in California Commu-nity Colleges overall and across student enrollment statuses than all other racial/ethnicgroups (Chart 20).
• A higher percentage of Filipinos (ranging from 60% to almost 70%), with the exceptionof Whites, are successful in California Community Colleges overall and across studentenrollment statuses compared to all other racial/ethnic groups.
• Pacific Islanders show much lower success rates at California Community Collegescompared to other racial/ethnic groups.
FINANCIAL AID BY RACE/ETHNICITY
The following three charts show average scholarship amounts, average grant amounts, and aver-age loan amounts for three different academic years by race/ethnicity. These charts show thatamong California Community College students, the trend is to fund college through more gener-ous scholarships and grants rather than to take out larger amounts through loans.
However, AA subgroups are combined into one group, Asians, except for Filipinos, and NHPI sub-groups are combined into one group, Pacific Islanders. Combining AANHPI subgroups may maskdisparities in access to financial aid. In general, given these trends, it would be important to knowwhether those students who do not receive scholarships or grant aid are either willing to take onlarger loans to stay in school or forego enrolling in California Community Colleges.
Scholarships by Race/Ethnicity
Between 1995 and 2006, there is a substantial increase in the amount of scholarship funding, how-ever, these are not in constant dollars, so the appropriate comparison is within years rather thanacross years.24 Although students who received scholarships are on average receiving largeramounts of funding over the years shown, what is not clear is whether more California CommunityCollege students are applying and actually receiving scholarship funding. In other words, there ap-pears to be more money being allocated but it is not clear whether the scholarships are supportingmore students. In addition, it is unclear whether the increase in scholarship amounts are propor-tionate to fee increases during the same period.
2010 CA AANHPI educ repor 2.qxd:Layout 1 9/11/10 6:22 PM Page 19
CALIFORNIA COMMUNITY COLLEGE SYSTEM 20
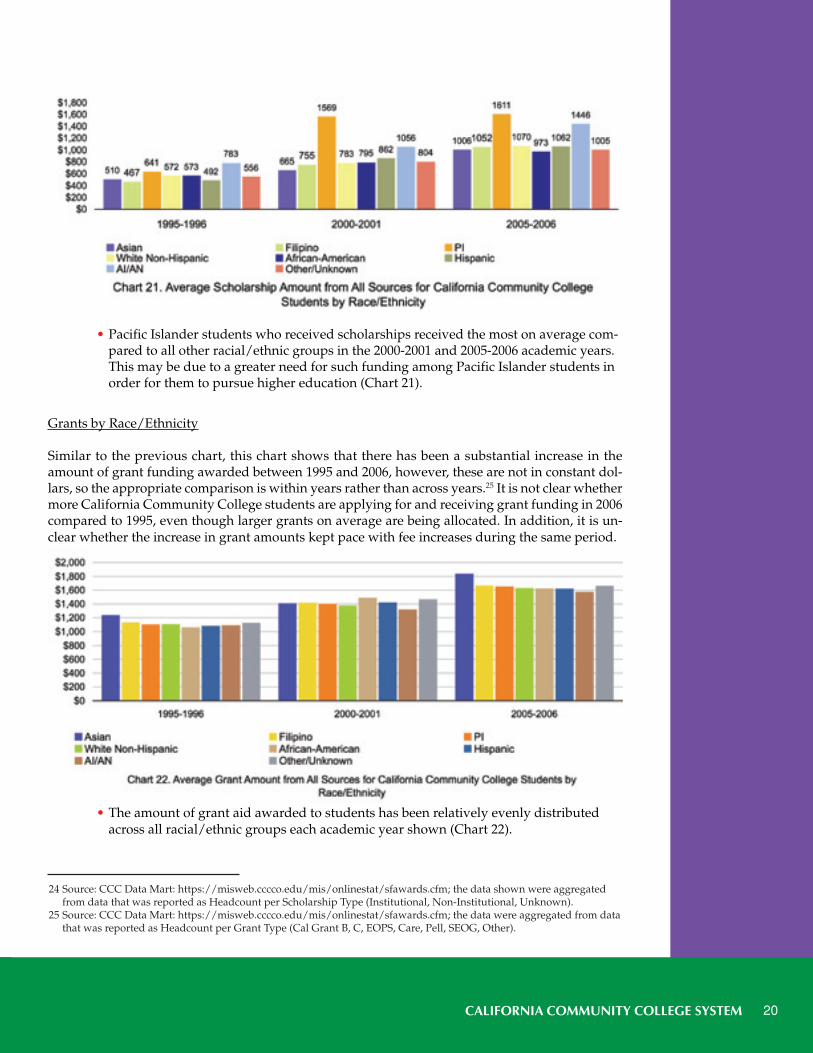
• Pacific Islander students who received scholarships received the most on average com-pared to all other racial/ethnic groups in the 2000-2001 and 2005-2006 academic years.This may be due to a greater need for such funding among Pacific Islander students inorder for them to pursue higher education (Chart 21).
Grants by Race/Ethnicity
Similar to the previous chart, this chart shows that there has been a substantial increase in theamount of grant funding awarded between 1995 and 2006, however, these are not in constant dol-lars, so the appropriate comparison is within years rather than across years.25 It is not clear whethermore California Community College students are applying for and receiving grant funding in 2006compared to 1995, even though larger grants on average are being allocated. In addition, it is un-clear whether the increase in grant amounts kept pace with fee increases during the same period.
• The amount of grant aid awarded to students has been relatively evenly distributedacross all racial/ethnic groups each academic year shown (Chart 22).
24 Source: CCC Data Mart: https://misweb.cccco.edu/mis/onlinestat/sfawards.cfm; the data shown were aggregatedfrom data that was reported as Headcount per Scholarship Type (Institutional, Non-Institutional, Unknown).
25 Source: CCC Data Mart: https://misweb.cccco.edu/mis/onlinestat/sfawards.cfm; the data were aggregated from datathat was reported as Headcount per Grant Type (Cal Grant B, C, EOPS, Care, Pell, SEOG, Other).
2010 CA AANHPI educ repor 2.qxd:Layout 1 9/11/10 6:22 PM Page 20
Loans by Race/Ethnicity
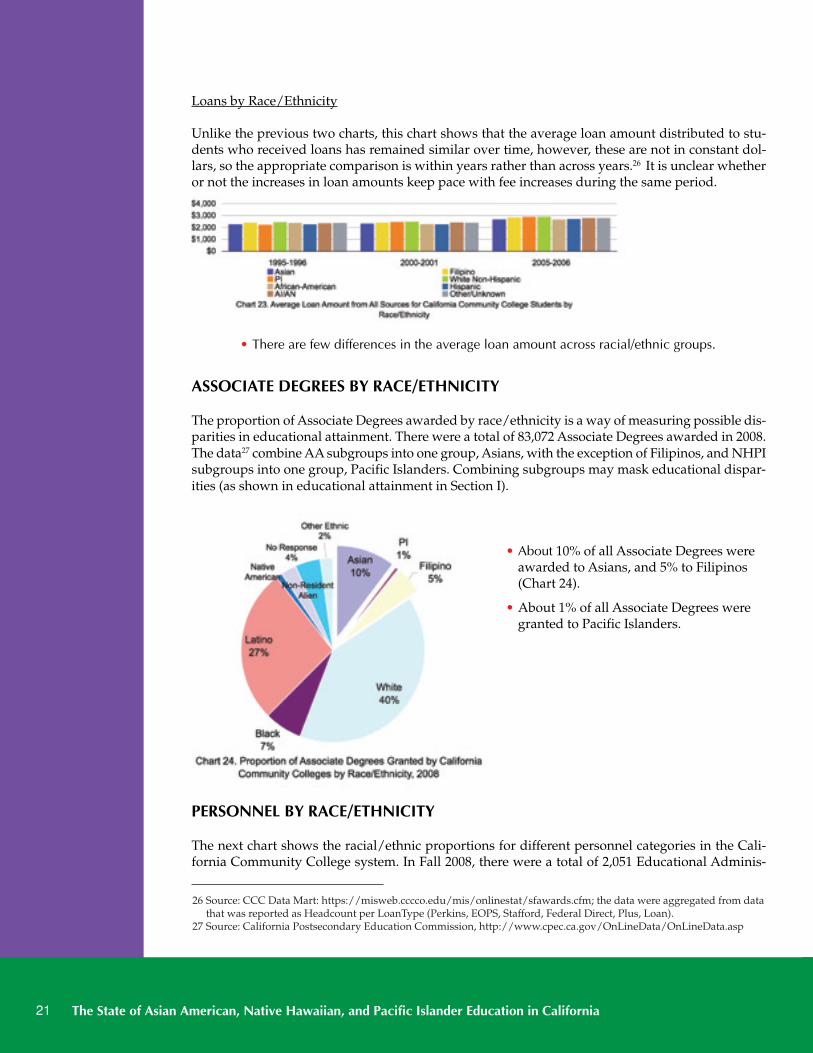
Unlike the previous two charts, this chart shows that the average loan amount distributed to stu-dents who received loans has remained similar over time, however, these are not in constant dol-lars, so the appropriate comparison is within years rather than across years.26 It is unclear whetheror not the increases in loan amounts keep pace with fee increases during the same period.
• There are few differences in the average loan amount across racial/ethnic groups.
ASSOCIATE DEGREES BY RACE/ETHNICITY
The proportion of Associate Degrees awarded by race/ethnicity is a way of measuring possible dis-parities in educational attainment. There were a total of 83,072 Associate Degrees awarded in 2008.The data27 combine AA subgroups into one group, Asians, with the exception of Filipinos, and NHPIsubgroups into one group, Pacific Islanders. Combining subgroups may mask educational dispar-ities (as shown in educational attainment in Section I).
• About 10% of all Associate Degrees wereawarded to Asians, and 5% to Filipinos(Chart 24).
• About 1% of all Associate Degrees weregranted to Pacific Islanders.
PERSONNEL BY RACE/ETHNICITY
The next chart shows the racial/ethnic proportions for different personnel categories in the Cali-fornia Community College system. In Fall 2008, there were a total of 2,051 Educational Adminis-
The State of Asian American, Native Hawaiian, and Pacific Islander Education in California21
26 Source: CCC Data Mart: https://misweb.cccco.edu/mis/onlinestat/sfawards.cfm; the data were aggregated from datathat was reported as Headcount per LoanType (Perkins, EOPS, Stafford, Federal Direct, Plus, Loan).
27 Source: California Postsecondary Education Commission, http://www.cpec.ca.gov/OnLineData/OnLineData.asp
2010 CA AANHPI educ repor 2.qxd:Layout 1 9/11/10 6:22 PM Page 21
CALIFORNIA COMMUNITY COLLEGE SYSTEM 22
trators, 18,200 Tenured/Tenure Track, 45,257 Academic Temporary, 1,544 Classified Administrators,2,136 Classified Professionals, and 25,035 Classified Support staff statewide. The data28 combine AAsubgroups in one group, Asians, with the exception of Filipinos, and combine NHPI subgroups intoone group, Pacific Islanders. Combining AANHPI subgroups may mask disparities in CaliforniaCommunity College personnel by these subgroups.
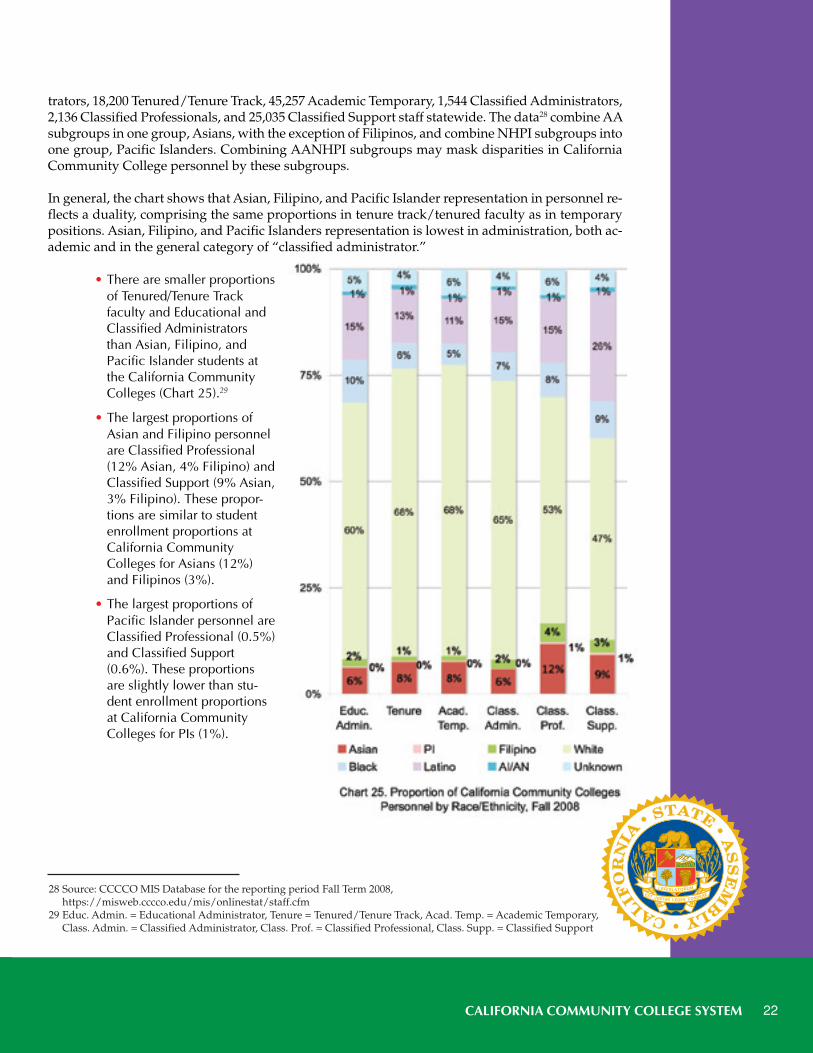
In general, the chart shows that Asian, Filipino, and Pacific Islander representation in personnel re-flects a duality, comprising the same proportions in tenure track/tenured faculty as in temporarypositions. Asian, Filipino, and Pacific Islanders representation is lowest in administration, both ac-ademic and in the general category of “classified administrator.”
• There are smaller proportionsof Tenured/Tenure Trackfaculty and Educational andClassified Administratorsthan Asian, Filipino, andPacific Islander students atthe California CommunityColleges (Chart 25).29
• The largest proportions ofAsian and Filipino personnelare Classified Professional(12% Asian, 4% Filipino) andClassified Support (9% Asian,3% Filipino). These propor-tions are similar to studentenrollment proportions atCalifornia CommunityColleges for Asians (12%)and Filipinos (3%).
• The largest proportions ofPacific Islander personnel areClassified Professional (0.5%)and Classified Support(0.6%). These proportionsare slightly lower than stu-dent enrollment proportionsat California CommunityColleges for PIs (1%).
28 Source: CCCCO MIS Database for the reporting period Fall Term 2008,https://misweb.cccco.edu/mis/onlinestat/staff.cfm
29 Educ. Admin. = Educational Administrator, Tenure = Tenured/Tenure Track, Acad. Temp. = Academic Temporary,Class. Admin. = Classified Administrator, Class. Prof. = Classified Professional, Class. Supp. = Classified Support
2010 CA AANHPI educ repor 2.qxd:Layout 1 9/11/10 6:22 PM Page 22
The State of Asian American, Native Hawaiian, and Pacific Islander Education in California23
This section focuses on the California State Universities, and includes information about enrollmentby race/ethnicity, graduation rates by race/ethnicity, Bachelor’s Degrees by race/ethnicity includ-ing by AANHPI subgroups, and personnel by race/ethnicity. Some of this section’s data combineAA subgroups into one group, Asians, with the exception of Filipinos, and NHPI subgroups into onegroup, Pacific Islanders (PIs). Grouping AANHPI subgroups together (either Asians and Pacific Is-landers in one group, or Asians as one group and Pacific Islanders as another) may mask educationaldisparities (shown in educational attainment in Section I).
ENROLLMENT BY RACE/ETHNICITY
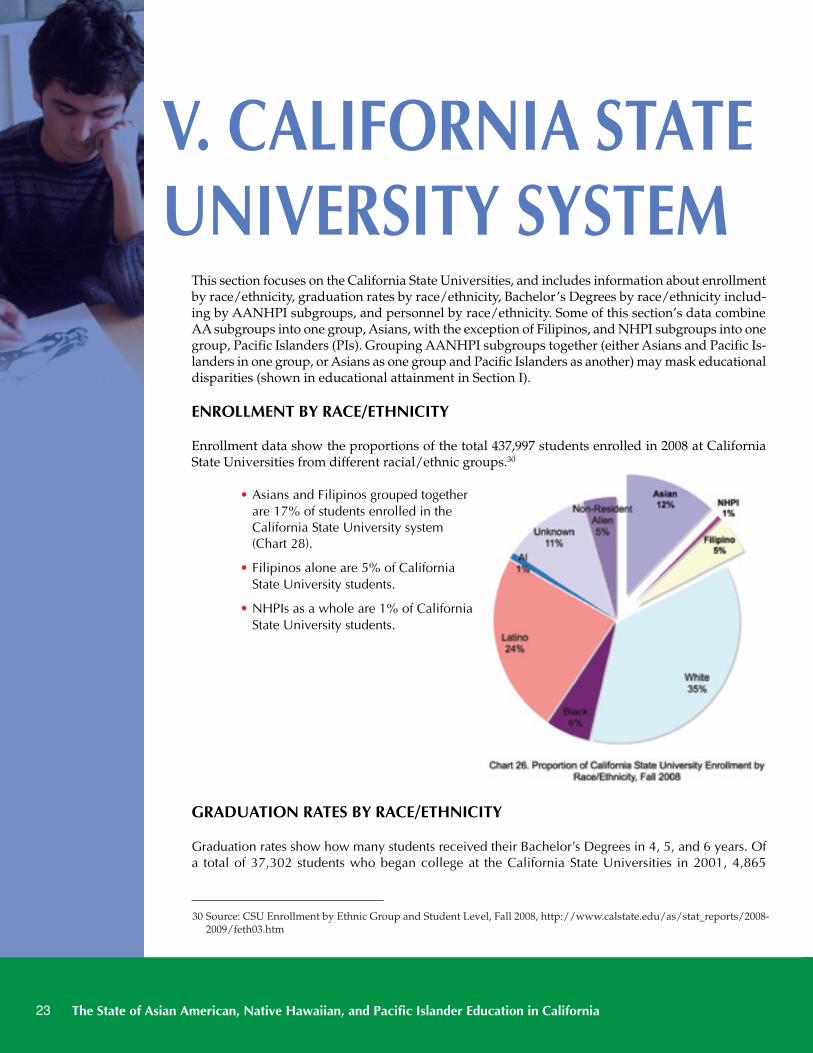
Enrollment data show the proportions of the total 437,997 students enrolled in 2008 at CaliforniaState Universities from different racial/ethnic groups.30
• Asians and Filipinos grouped togetherare 17% of students enrolled in theCalifornia State University system(Chart 28).
• Filipinos alone are 5% of CaliforniaState University students.
• NHPIs as a whole are 1% of CaliforniaState University students.
GRADUATION RATES BY RACE/ETHNICITY
Graduation rates show how many students received their Bachelor’s Degrees in 4, 5, and 6 years. Ofa total of 37,302 students who began college at the California State Universities in 2001, 4,865
V. CALIFORNIA STATEUNIVERSITY SYSTEM
30 Source: CSU Enrollment by Ethnic Group and Student Level, Fall 2008, http://www.calstate.edu/as/stat_reports/2008-2009/feth03.htm
2010 CA AANHPI educ repor 2.qxd:Layout 1 9/11/10 6:22 PM Page 23
CALIFORNIA STATE UNIVERSITY SYSTEM 24
completed a Bachelor’s Degree in 4 years, 8,624 completed a Bachelor’s Degree in 5 years, and 4,197completed a Bachelor’s Degree in 6 years.
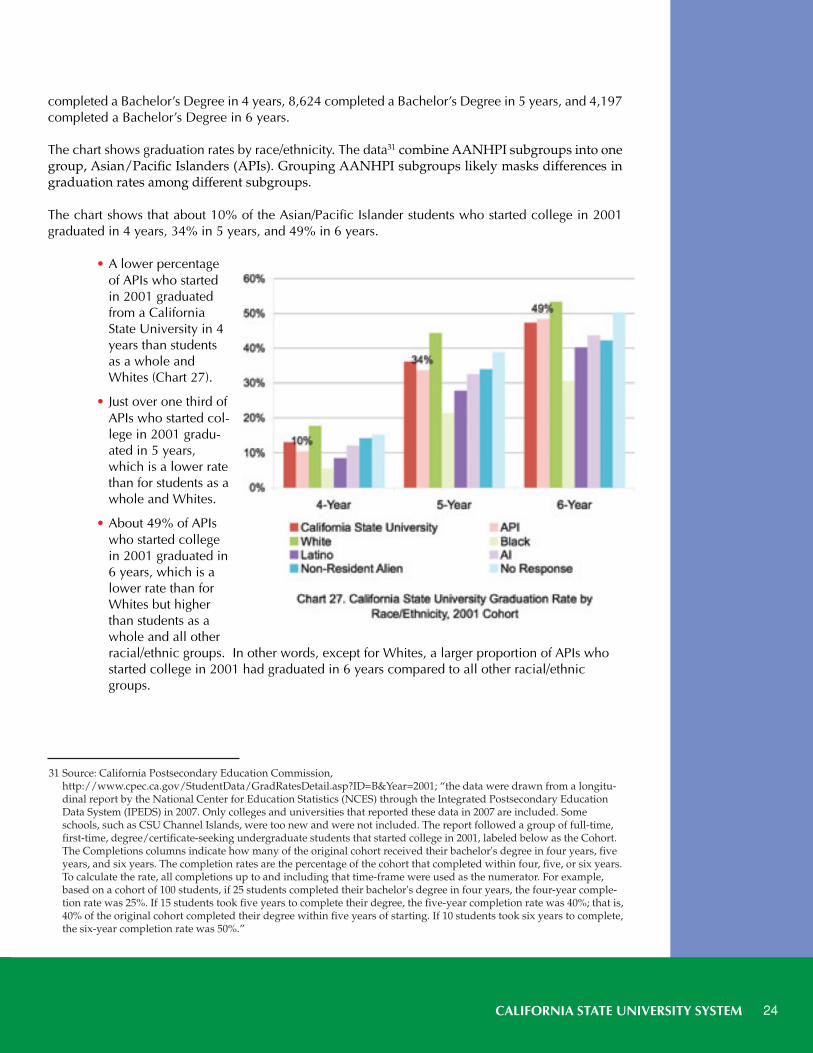
The chart shows graduation rates by race/ethnicity. The data31 combine AANHPI subgroups into onegroup, Asian/Pacific Islanders (APIs). Grouping AANHPI subgroups likely masks differences ingraduation rates among different subgroups.
The chart shows that about 10% of the Asian/Pacific Islander students who started college in 2001graduated in 4 years, 34% in 5 years, and 49% in 6 years.
• A lower percentageof APIs who startedin 2001 graduatedfrom a CaliforniaState University in 4years than studentsas a whole andWhites (Chart 27).
• Just over one third ofAPIs who started col-lege in 2001 gradu-ated in 5 years,which is a lower ratethan for students as awhole and Whites.
• About 49% of APIswho started collegein 2001 graduated in6 years, which is alower rate than forWhites but higherthan students as awhole and all otherracial/ethnic groups. In other words, except for Whites, a larger proportion of APIs whostarted college in 2001 had graduated in 6 years compared to all other racial/ethnicgroups.
31 Source: California Postsecondary Education Commission,http://www.cpec.ca.gov/StudentData/GradRatesDetail.asp?ID=B&Year=2001; “the data were drawn from a longitu-dinal report by the National Center for Education Statistics (NCES) through the Integrated Postsecondary EducationData System (IPEDS) in 2007. Only colleges and universities that reported these data in 2007 are included. Someschools, such as CSU Channel Islands, were too new and were not included. The report followed a group of full-time,first-time, degree/certificate-seeking undergraduate students that started college in 2001, labeled below as the Cohort.The Completions columns indicate how many of the original cohort received their bachelor's degree in four years, fiveyears, and six years. The completion rates are the percentage of the cohort that completed within four, five, or six years.To calculate the rate, all completions up to and including that time-frame were used as the numerator. For example,based on a cohort of 100 students, if 25 students completed their bachelor's degree in four years, the four-year comple-tion rate was 25%. If 15 students took five years to complete their degree, the five-year completion rate was 40%; that is,40% of the original cohort completed their degree within five years of starting. If 10 students took six years to complete,the six-year completion rate was 50%.”
2010 CA AANHPI educ repor 2.qxd:Layout 1 9/11/10 6:22 PM Page 24
The State of Asian American, Native Hawaiian, and Pacific Islander Education in California25
BACHELOR’S DEGREES BY RACE/ETHNICITY
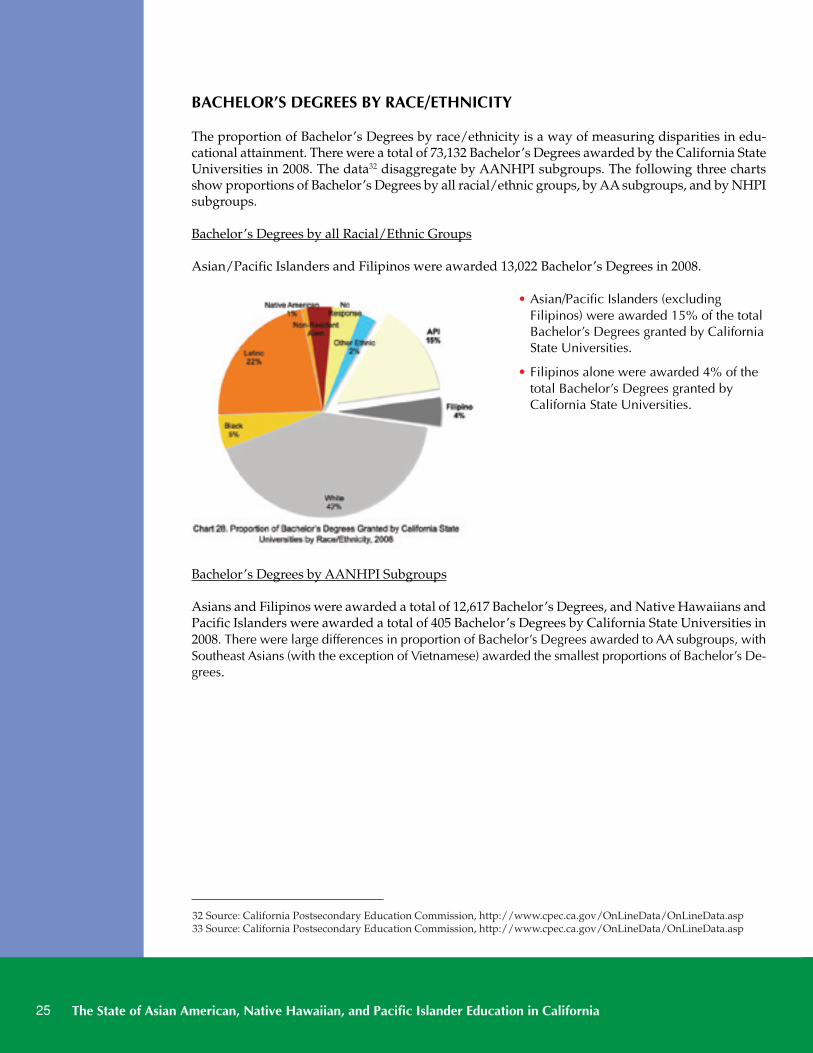
The proportion of Bachelor’s Degrees by race/ethnicity is a way of measuring disparities in edu-cational attainment. There were a total of 73,132 Bachelor’s Degrees awarded by the California StateUniversities in 2008. The data32 disaggregate by AANHPI subgroups. The following three chartsshow proportions of Bachelor’s Degrees by all racial/ethnic groups, by AA subgroups, and by NHPIsubgroups.
Bachelor’s Degrees by all Racial/Ethnic Groups
Asian/Pacific Islanders and Filipinos were awarded 13,022 Bachelor’s Degrees in 2008.
• Asian/Pacific Islanders (excludingFilipinos) were awarded 15% of the totalBachelor’s Degrees granted by CaliforniaState Universities.
• Filipinos alone were awarded 4% of thetotal Bachelor’s Degrees granted byCalifornia State Universities.
Bachelor’s Degrees by AANHPI Subgroups
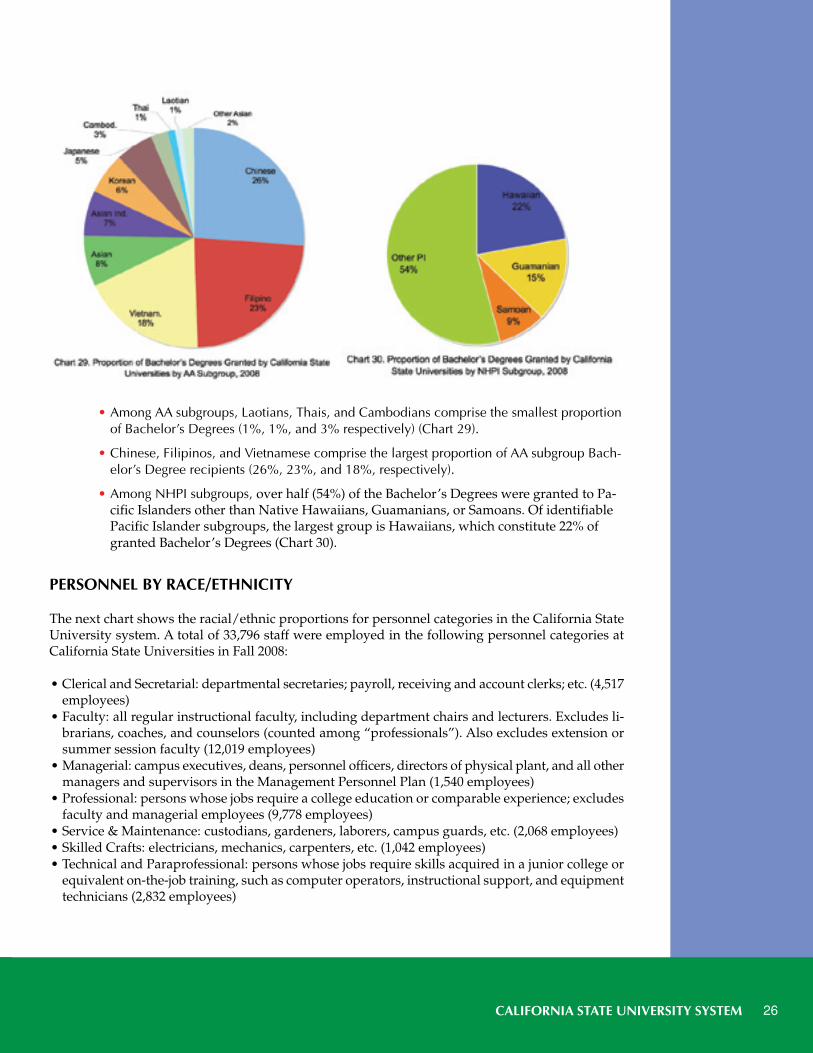
Asians and Filipinos were awarded a total of 12,617 Bachelor’s Degrees, and Native Hawaiians andPacific Islanders were awarded a total of 405 Bachelor’s Degrees by California State Universities in2008. There were large differences in proportion of Bachelor’s Degrees awarded to AA subgroups, withSoutheast Asians (with the exception of Vietnamese) awarded the smallest proportions of Bachelor’s De-grees.
32 Source: California Postsecondary Education Commission, http://www.cpec.ca.gov/OnLineData/OnLineData.asp33 Source: California Postsecondary Education Commission, http://www.cpec.ca.gov/OnLineData/OnLineData.asp
2010 CA AANHPI educ repor 2.qxd:Layout 1 9/11/10 6:22 PM Page 25
CALIFORNIA STATE UNIVERSITY SYSTEM 26
• Among AA subgroups, Laotians, Thais, and Cambodians comprise the smallest proportionof Bachelor’s Degrees (1%, 1%, and 3% respectively) (Chart 29).
• Chinese, Filipinos, and Vietnamese comprise the largest proportion of AA subgroup Bach-elor’s Degree recipients (26%, 23%, and 18%, respectively).
• Among NHPI subgroups, over half (54%) of the Bachelor’s Degrees were granted to Pa-cific Islanders other than Native Hawaiians, Guamanians, or Samoans. Of identifiablePacific Islander subgroups, the largest group is Hawaiians, which constitute 22% ofgranted Bachelor’s Degrees (Chart 30).
PERSONNEL BY RACE/ETHNICITY
The next chart shows the racial/ethnic proportions for personnel categories in the California StateUniversity system. A total of 33,796 staff were employed in the following personnel categories atCalifornia State Universities in Fall 2008:
• Clerical and Secretarial: departmental secretaries; payroll, receiving and account clerks; etc. (4,517employees)
• Faculty: all regular instructional faculty, including department chairs and lecturers. Excludes li-brarians, coaches, and counselors (counted among “professionals”). Also excludes extension orsummer session faculty (12,019 employees)
• Managerial: campus executives, deans, personnel officers, directors of physical plant, and all othermanagers and supervisors in the Management Personnel Plan (1,540 employees)
• Professional: persons whose jobs require a college education or comparable experience; excludesfaculty and managerial employees (9,778 employees)
• Service & Maintenance: custodians, gardeners, laborers, campus guards, etc. (2,068 employees)• Skilled Crafts: electricians, mechanics, carpenters, etc. (1,042 employees)• Technical and Paraprofessional: persons whose jobs require skills acquired in a junior college or
equivalent on-the-job training, such as computer operators, instructional support, and equipmenttechnicians (2,832 employees)
2010 CA AANHPI educ repor 2.qxd:Layout 1 9/11/10 6:22 PM Page 26
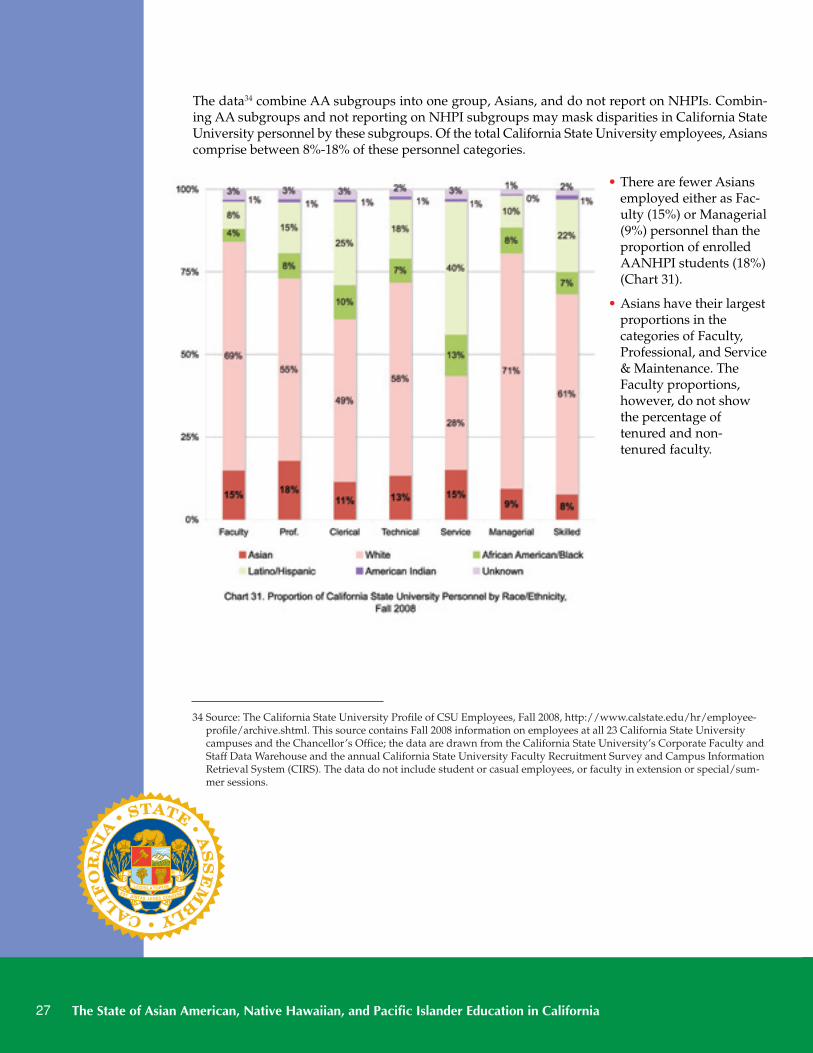
The data34 combine AA subgroups into one group, Asians, and do not report on NHPIs. Combin-ing AA subgroups and not reporting on NHPI subgroups may mask disparities in California StateUniversity personnel by these subgroups. Of the total California State University employees, Asianscomprise between 8%-18% of these personnel categories.
• There are fewer Asiansemployed either as Fac-ulty (15%) or Managerial(9%) personnel than theproportion of enrolledAANHPI students (18%)(Chart 31).
• Asians have their largestproportions in thecategories of Faculty,Professional, and Service& Maintenance. TheFaculty proportions,however, do not showthe percentage oftenured and non-tenured faculty.
The State of Asian American, Native Hawaiian, and Pacific Islander Education in California27
34 Source: The California State University Profile of CSU Employees, Fall 2008, http://www.calstate.edu/hr/employee-profile/archive.shtml. This source contains Fall 2008 information on employees at all 23 California State Universitycampuses and the Chancellor’s Office; the data are drawn from the California State University’s Corporate Faculty andStaff Data Warehouse and the annual California State University Faculty Recruitment Survey and Campus InformationRetrieval System (CIRS). The data do not include student or casual employees, or faculty in extension or special/sum-mer sessions.
2010 CA AANHPI educ repor 2.qxd:Layout 1 9/11/10 6:22 PM Page 27
UNIVERSITY OF CALIFORNIA SYSTEM 28
This section focuses on the University of California system, and includes information about enroll-ment by race/ethnicity, graduation rates by race/ethnicity, Bachelor’s Degrees by race/ethnicityincluding by AA subgroups, and personnel by race/ethnicity. Some of this section’s data combineAANHPI subgroups into one group, Asians/Pacific Islanders, or AA subgroups into one group,Asians, or leaves out NHPIs entirely. Grouping AANHPI subgroups together or leaving NHPIs outlikely masks educational disparities.
ENROLLMENT BY RACE/ETHNICITY
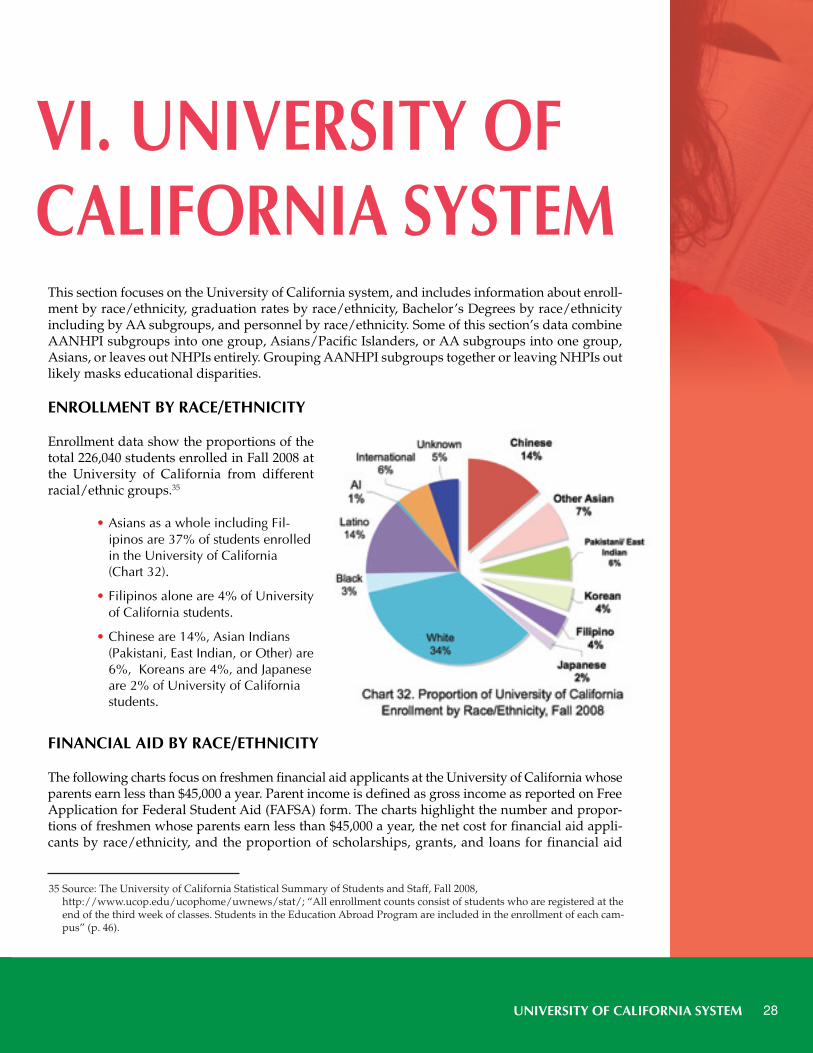
Enrollment data show the proportions of thetotal 226,040 students enrolled in Fall 2008 atthe University of California from differentracial/ethnic groups.35
• Asians as a whole including Fil-ipinos are 37% of students enrolledin the University of California(Chart 32).
• Filipinos alone are 4% of Universityof California students.
• Chinese are 14%, Asian Indians(Pakistani, East Indian, or Other) are6%, Koreans are 4%, and Japaneseare 2% of University of Californiastudents.
FINANCIAL AID BY RACE/ETHNICITY
The following charts focus on freshmen financial aid applicants at the University of California whoseparents earn less than $45,000 a year. Parent income is defined as gross income as reported on FreeApplication for Federal Student Aid (FAFSA) form. The charts highlight the number and propor-tions of freshmen whose parents earn less than $45,000 a year, the net cost for financial aid appli-cants by race/ethnicity, and the proportion of scholarships, grants, and loans for financial aid
VI. UNIVERSITY OFCALIFORNIA SYSTEM
35 Source: The University of California Statistical Summary of Students and Staff, Fall 2008,http://www.ucop.edu/ucophome/uwnews/stat/; “All enrollment counts consist of students who are registered at theend of the third week of classes. Students in the Education Abroad Program are included in the enrollment of each cam-pus” (p. 46).
2010 CA AANHPI educ repor 2.qxd:Layout 1 9/11/10 6:22 PM Page 28
applicants by race/ethnicity. Financial aid data are not currently collected by AA or NHPI sub-group, however, the University of California Office of the President will begin to collect data by AAsubgroup beginning in Fall 2010.36
Freshmen with Parent Income Below $45,000 by Race/Ethnicity
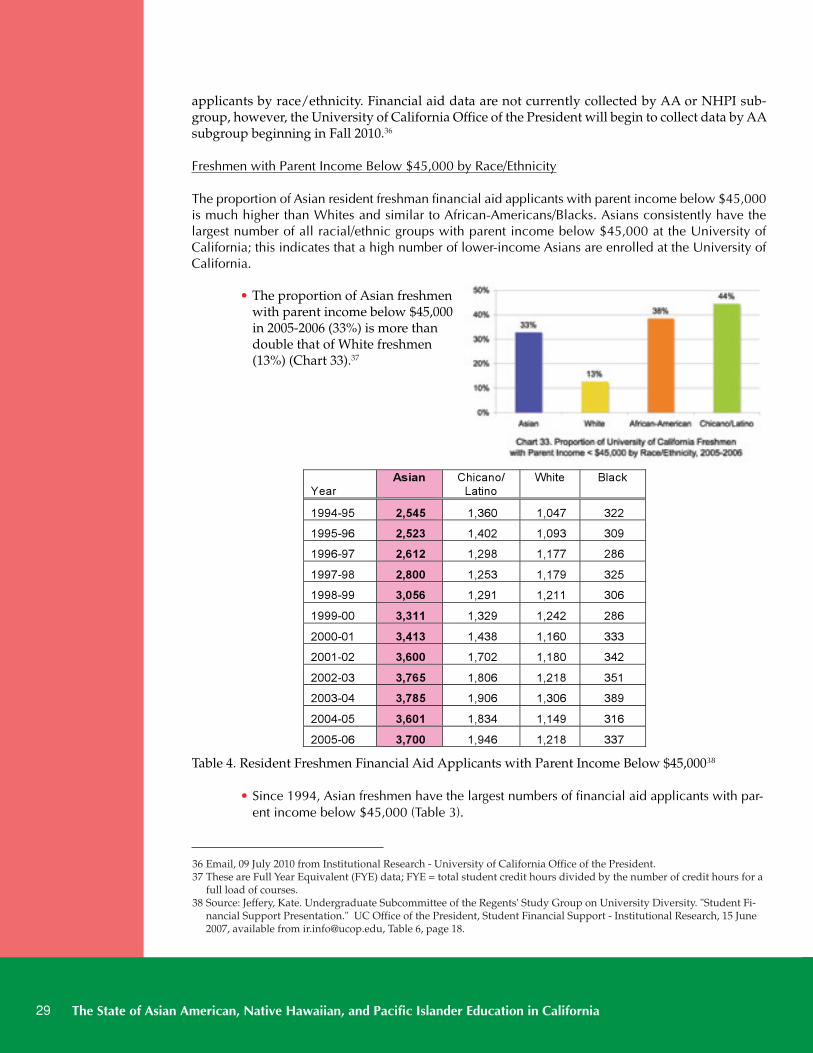
The proportion of Asian resident freshman financial aid applicants with parent income below $45,000is much higher than Whites and similar to African-Americans/Blacks. Asians consistently have thelargest number of all racial/ethnic groups with parent income below $45,000 at the University ofCalifornia; this indicates that a high number of lower-income Asians are enrolled at the University ofCalifornia.
• The proportion of Asian freshmenwith parent income below $45,000in 2005-2006 (33%) is more thandouble that of White freshmen(13%) (Chart 33).37
Table 4. Resident Freshmen Financial Aid Applicants with Parent Income Below $45,00038
• Since 1994, Asian freshmen have the largest numbers of financial aid applicants with par-ent income below $45,000 (Table 3).
The State of Asian American, Native Hawaiian, and Pacific Islander Education in California29
Year Asian Chicano/
Latino White
Black
1994-95 2,545 1,360 1,047 322
1995-96 2,523 1,402 1,093 309
1996-97 2,612 1,298 1,177 286
1997-98 2,800 1,253 1,179 325
1998-99 3,056 1,291 1,211 306
1999-00 3,311 1,329 1,242 286
2000-01 3,413 1,438 1,160 333
2001-02 3,600 1,702 1,180 342
2002-03 3,765 1,806 1,218 351
2003-04 3,785 1,906 1,306 389
2004-05 3,601 1,834 1,149 316
2005-06 3,700 1,946 1,218 337 3
36 Email, 09 July 2010 from Institutional Research - University of California Office of the President.37 These are Full Year Equivalent (FYE) data; FYE = total student credit hours divided by the number of credit hours for a
full load of courses.38 Source: Jeffery, Kate. Undergraduate Subcommittee of the Regents' Study Group on University Diversity. "Student Fi-
nancial Support Presentation." UC Office of the President, Student Financial Support - Institutional Research, 15 June2007, available from [email protected], Table 6, page 18.
2010 CA AANHPI educ repor 2.qxd:Layout 1 9/11/10 6:22 PM Page 29
UNIVERSITY OF CALIFORNIA SYSTEM 30
Net Cost of Freshman Year for Financial Aid Applicants by Race/Ethnicity
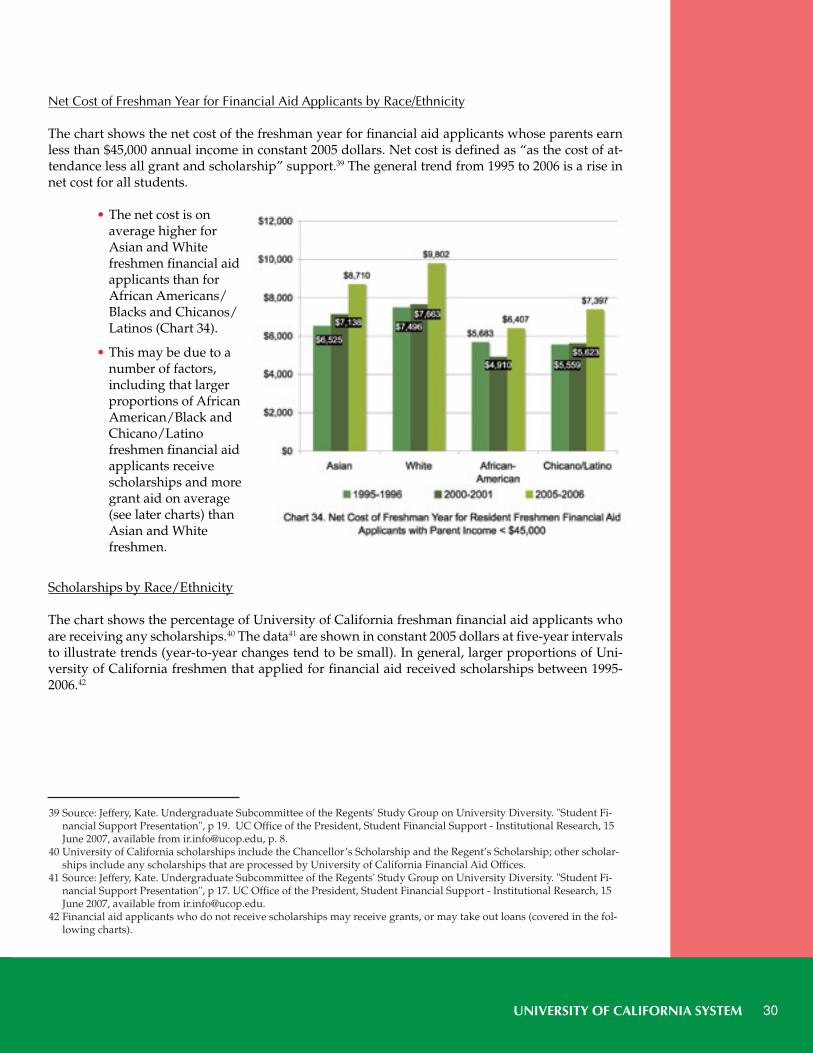
The chart shows the net cost of the freshman year for financial aid applicants whose parents earnless than $45,000 annual income in constant 2005 dollars. Net cost is defined as “as the cost of at-tendance less all grant and scholarship” support.39 The general trend from 1995 to 2006 is a rise innet cost for all students.
• The net cost is onaverage higher forAsian and Whitefreshmen financial aidapplicants than forAfrican Americans/Blacks and Chicanos/Latinos (Chart 34).
• This may be due to anumber of factors,including that largerproportions of AfricanAmerican/Black andChicano/Latinofreshmen financial aidapplicants receivescholarships and moregrant aid on average(see later charts) thanAsian and Whitefreshmen.
Scholarships by Race/Ethnicity
The chart shows the percentage of University of California freshman financial aid applicants whoare receiving any scholarships.40 The data41 are shown in constant 2005 dollars at five-year intervalsto illustrate trends (year-to-year changes tend to be small). In general, larger proportions of Uni-versity of California freshmen that applied for financial aid received scholarships between 1995-2006.42
39 Source: Jeffery, Kate. Undergraduate Subcommittee of the Regents' Study Group on University Diversity. "Student Fi-nancial Support Presentation", p 19. UC Office of the President, Student Financial Support - Institutional Research, 15June 2007, available from [email protected], p. 8.
40 University of California scholarships include the Chancellor’s Scholarship and the Regent’s Scholarship; other scholar-ships include any scholarships that are processed by University of California Financial Aid Offices.
41 Source: Jeffery, Kate. Undergraduate Subcommittee of the Regents' Study Group on University Diversity. "Student Fi-nancial Support Presentation", p 17. UC Office of the President, Student Financial Support - Institutional Research, 15June 2007, available from [email protected].
42 Financial aid applicants who do not receive scholarships may receive grants, or may take out loans (covered in the fol-lowing charts).
2010 CA AANHPI educ repor 2.qxd:Layout 1 9/11/10 6:22 PM Page 30
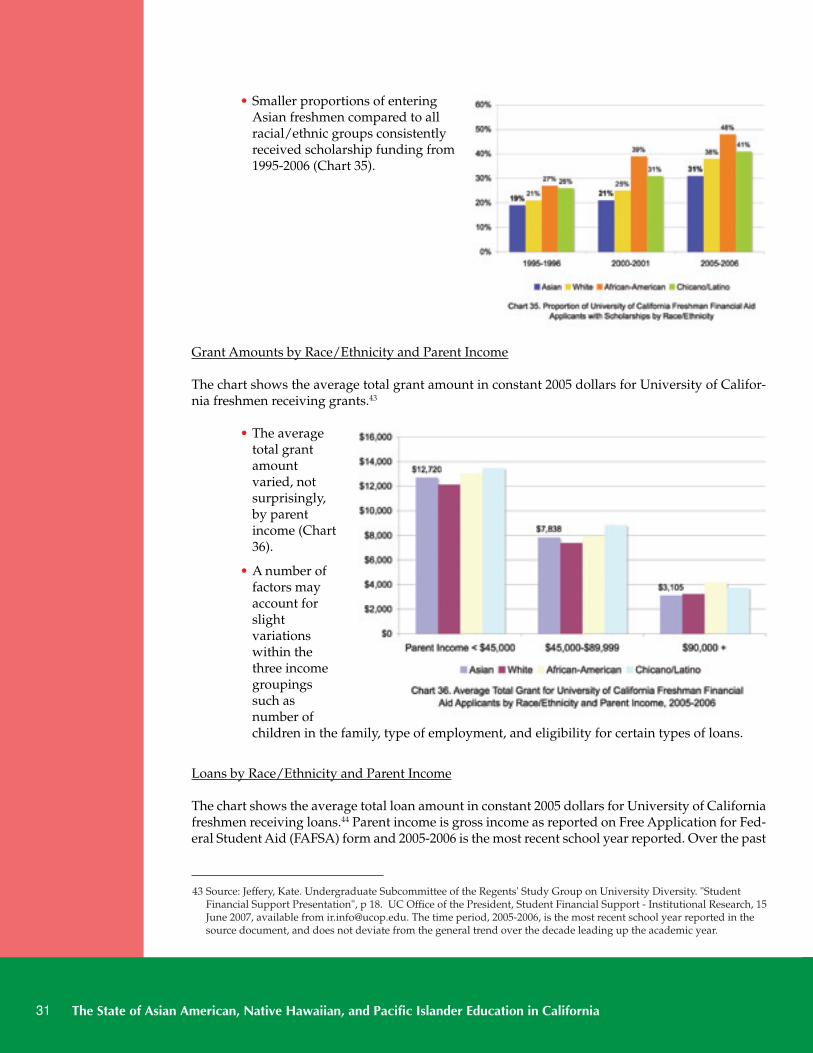
• Smaller proportions of enteringAsian freshmen compared to allracial/ethnic groups consistentlyreceived scholarship funding from1995-2006 (Chart 35).
Grant Amounts by Race/Ethnicity and Parent Income
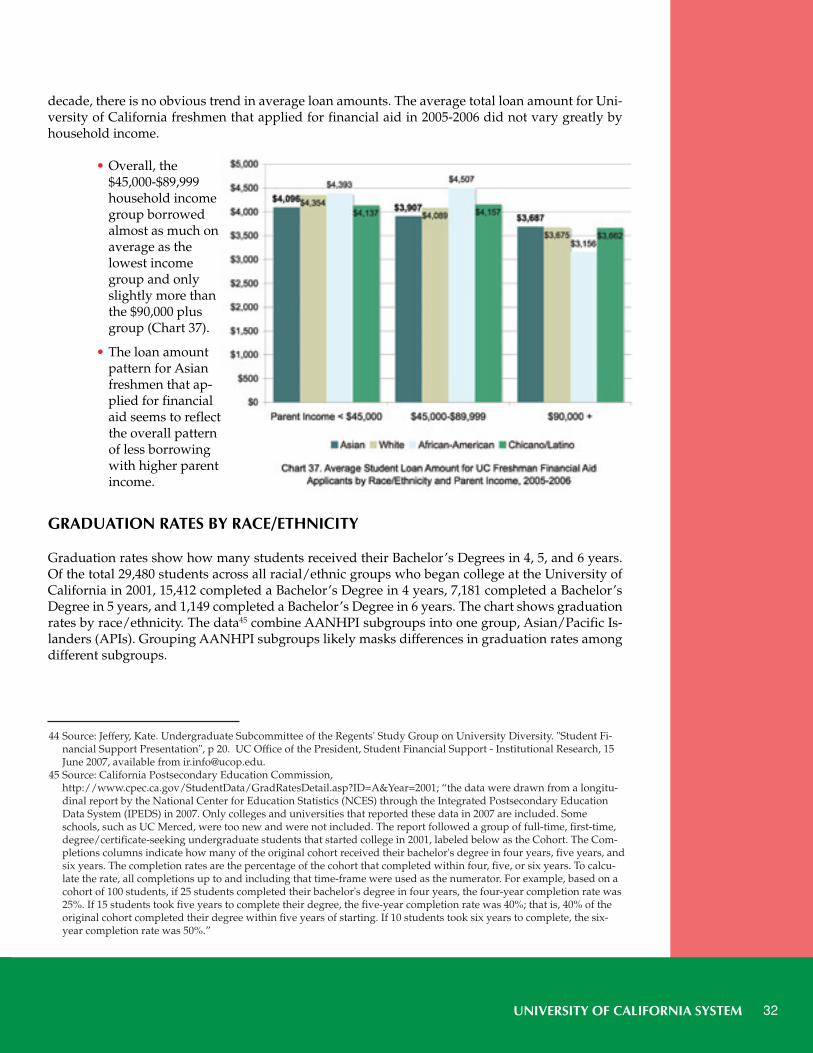
The chart shows the average total grant amount in constant 2005 dollars for University of Califor-nia freshmen receiving grants.43
• The averagetotal grantamountvaried, notsurprisingly,by parentincome (Chart36).
• A number offactors mayaccount forslightvariationswithin thethree incomegroupingssuch asnumber ofchildren in the family, type of employment, and eligibility for certain types of loans.
Loans by Race/Ethnicity and Parent Income
The chart shows the average total loan amount in constant 2005 dollars for University of Californiafreshmen receiving loans.44 Parent income is gross income as reported on Free Application for Fed-eral Student Aid (FAFSA) form and 2005-2006 is the most recent school year reported. Over the past
The State of Asian American, Native Hawaiian, and Pacific Islander Education in California31
43 Source: Jeffery, Kate. Undergraduate Subcommittee of the Regents' Study Group on University Diversity. "StudentFinancial Support Presentation", p 18. UC Office of the President, Student Financial Support - Institutional Research, 15June 2007, available from [email protected]. The time period, 2005-2006, is the most recent school year reported in thesource document, and does not deviate from the general trend over the decade leading up the academic year.
2010 CA AANHPI educ repor 2.qxd:Layout 1 9/11/10 6:22 PM Page 31
UNIVERSITY OF CALIFORNIA SYSTEM 32
decade, there is no obvious trend in average loan amounts. The average total loan amount for Uni-versity of California freshmen that applied for financial aid in 2005-2006 did not vary greatly byhousehold income.
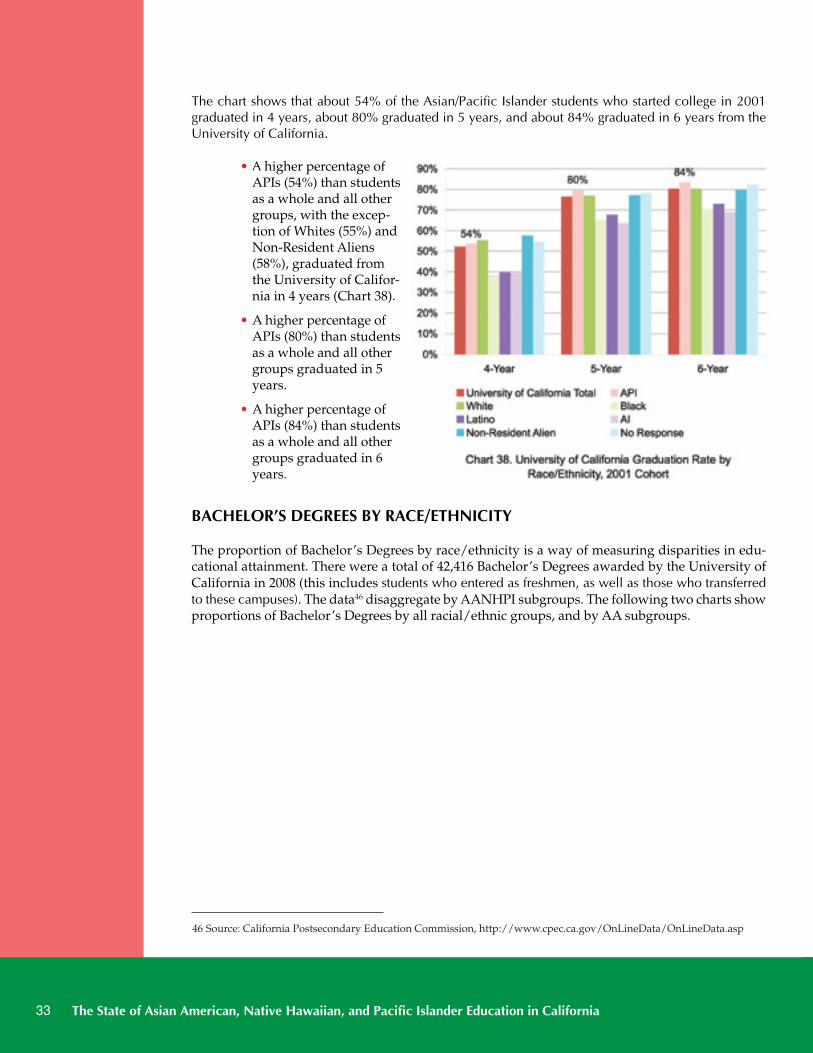
• Overall, the$45,000-$89,999household incomegroup borrowedalmost as much onaverage as thelowest incomegroup and onlyslightly more thanthe $90,000 plusgroup (Chart 37).
• The loan amountpattern for Asianfreshmen that ap-plied for financialaid seems to reflectthe overall patternof less borrowingwith higher parentincome.
GRADUATION RATES BY RACE/ETHNICITY
Graduation rates show how many students received their Bachelor’s Degrees in 4, 5, and 6 years.Of the total 29,480 students across all racial/ethnic groups who began college at the University ofCalifornia in 2001, 15,412 completed a Bachelor’s Degree in 4 years, 7,181 completed a Bachelor’sDegree in 5 years, and 1,149 completed a Bachelor’s Degree in 6 years. The chart shows graduationrates by race/ethnicity. The data45 combine AANHPI subgroups into one group, Asian/Pacific Is-landers (APIs). Grouping AANHPI subgroups likely masks differences in graduation rates amongdifferent subgroups.
44 Source: Jeffery, Kate. Undergraduate Subcommittee of the Regents' Study Group on University Diversity. "Student Fi-nancial Support Presentation", p 20. UC Office of the President, Student Financial Support - Institutional Research, 15June 2007, available from [email protected].
45 Source: California Postsecondary Education Commission,http://www.cpec.ca.gov/StudentData/GradRatesDetail.asp?ID=A&Year=2001; “the data were drawn from a longitu-dinal report by the National Center for Education Statistics (NCES) through the Integrated Postsecondary EducationData System (IPEDS) in 2007. Only colleges and universities that reported these data in 2007 are included. Someschools, such as UC Merced, were too new and were not included. The report followed a group of full-time, first-time,degree/certificate-seeking undergraduate students that started college in 2001, labeled below as the Cohort. The Com-pletions columns indicate how many of the original cohort received their bachelor's degree in four years, five years, andsix years. The completion rates are the percentage of the cohort that completed within four, five, or six years. To calcu-late the rate, all completions up to and including that time-frame were used as the numerator. For example, based on acohort of 100 students, if 25 students completed their bachelor's degree in four years, the four-year completion rate was25%. If 15 students took five years to complete their degree, the five-year completion rate was 40%; that is, 40% of theoriginal cohort completed their degree within five years of starting. If 10 students took six years to complete, the six-year completion rate was 50%.”
2010 CA AANHPI educ repor 2.qxd:Layout 1 9/11/10 6:22 PM Page 32
The chart shows that about 54% of the Asian/Pacific Islander students who started college in 2001graduated in 4 years, about 80% graduated in 5 years, and about 84% graduated in 6 years from theUniversity of California.
• A higher percentage ofAPIs (54%) than studentsas a whole and all othergroups, with the excep-tion of Whites (55%) andNon-Resident Aliens(58%), graduated fromthe University of Califor-nia in 4 years (Chart 38).
• A higher percentage ofAPIs (80%) than studentsas a whole and all othergroups graduated in 5years.
• A higher percentage ofAPIs (84%) than studentsas a whole and all othergroups graduated in 6years.
BACHELOR’S DEGREES BY RACE/ETHNICITY
The proportion of Bachelor’s Degrees by race/ethnicity is a way of measuring disparities in edu-cational attainment. There were a total of 42,416 Bachelor’s Degrees awarded by the University ofCalifornia in 2008 (this includes students who entered as freshmen, as well as those who transferredto these campuses). The data46 disaggregate by AANHPI subgroups. The following two charts showproportions of Bachelor’s Degrees by all racial/ethnic groups, and by AA subgroups.
The State of Asian American, Native Hawaiian, and Pacific Islander Education in California33
46 Source: California Postsecondary Education Commission, http://www.cpec.ca.gov/OnLineData/OnLineData.asp
2010 CA AANHPI educ repor 2.qxd:Layout 1 9/11/10 6:22 PM Page 33
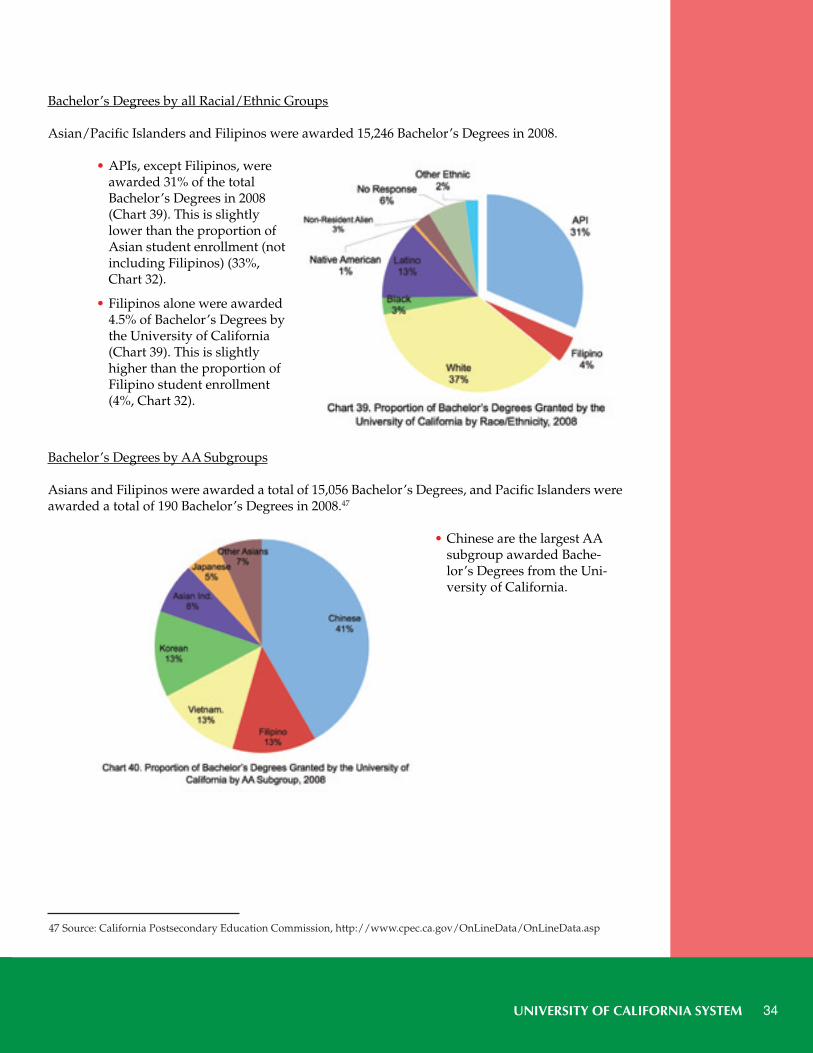
UNIVERSITY OF CALIFORNIA SYSTEM 34
Bachelor’s Degrees by all Racial/Ethnic Groups
Asian/Pacific Islanders and Filipinos were awarded 15,246 Bachelor’s Degrees in 2008.
• APIs, except Filipinos, wereawarded 31% of the totalBachelor’s Degrees in 2008(Chart 39). This is slightlylower than the proportion ofAsian student enrollment (notincluding Filipinos) (33%,Chart 32).
• Filipinos alone were awarded4.5% of Bachelor’s Degrees bythe University of California(Chart 39). This is slightlyhigher than the proportion ofFilipino student enrollment(4%, Chart 32).
Bachelor’s Degrees by AA Subgroups
Asians and Filipinos were awarded a total of 15,056 Bachelor’s Degrees, and Pacific Islanders wereawarded a total of 190 Bachelor’s Degrees in 2008.47
• Chinese are the largest AAsubgroup awarded Bache-lor’s Degrees from the Uni-versity of California.
47 Source: California Postsecondary Education Commission, http://www.cpec.ca.gov/OnLineData/OnLineData.asp
2010 CA AANHPI educ repor 2.qxd:Layout 1 9/11/10 6:22 PM Page 34
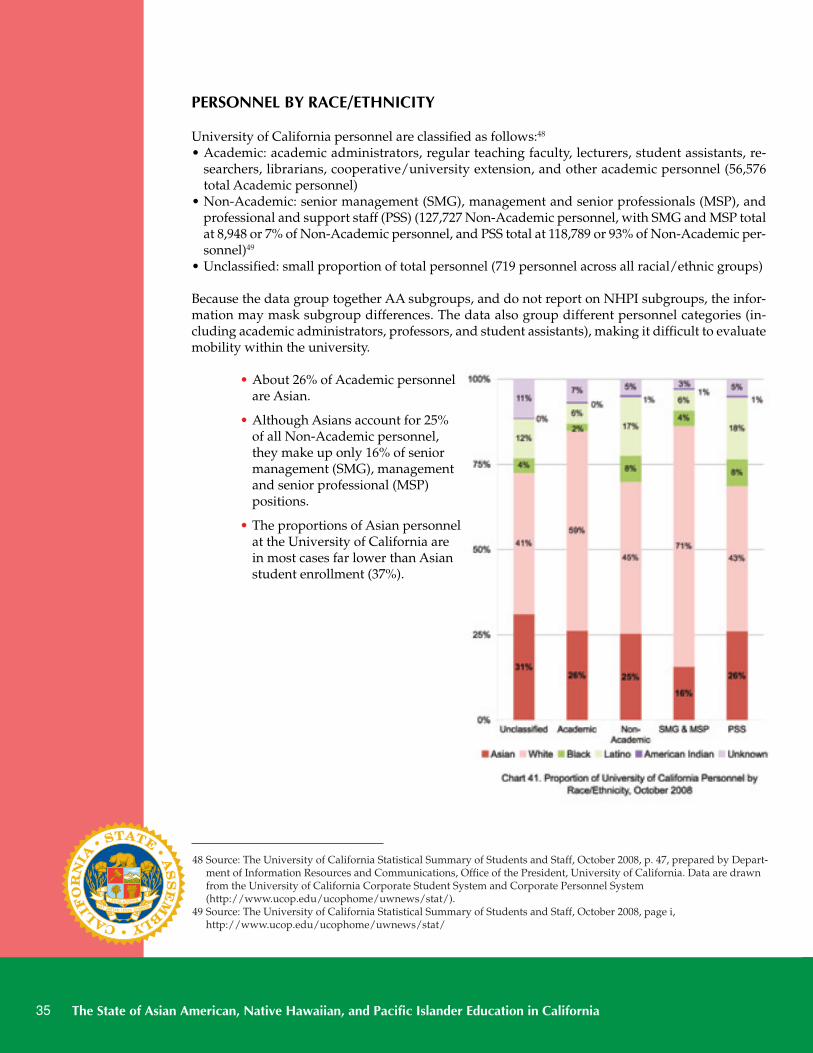
PERSONNEL BY RACE/ETHNICITY
University of California personnel are classified as follows:48
• Academic: academic administrators, regular teaching faculty, lecturers, student assistants, re-searchers, librarians, cooperative/university extension, and other academic personnel (56,576total Academic personnel)
• Non-Academic: senior management (SMG), management and senior professionals (MSP), andprofessional and support staff (PSS) (127,727 Non-Academic personnel, with SMG and MSP totalat 8,948 or 7% of Non-Academic personnel, and PSS total at 118,789 or 93% of Non-Academic per-sonnel)49
• Unclassified: small proportion of total personnel (719 personnel across all racial/ethnic groups)
Because the data group together AA subgroups, and do not report on NHPI subgroups, the infor-mation may mask subgroup differences. The data also group different personnel categories (in-cluding academic administrators, professors, and student assistants), making it difficult to evaluatemobility within the university.
• About 26% of Academic personnelare Asian.
• Although Asians account for 25%of all Non-Academic personnel,they make up only 16% of seniormanagement (SMG), managementand senior professional (MSP)positions.
• The proportions of Asian personnelat the University of California arein most cases far lower than Asianstudent enrollment (37%).
The State of Asian American, Native Hawaiian, and Pacific Islander Education in California35
48 Source: The University of California Statistical Summary of Students and Staff, October 2008, p. 47, prepared by Depart-ment of Information Resources and Communications, Office of the President, University of California. Data are drawnfrom the University of California Corporate Student System and Corporate Personnel System(http://www.ucop.edu/ucophome/uwnews/stat/).
49 Source: The University of California Statistical Summary of Students and Staff, October 2008, page i,http://www.ucop.edu/ucophome/uwnews/stat/
2010 CA AANHPI educ repor 2.qxd:Layout 1 9/11/10 6:22 PM Page 35
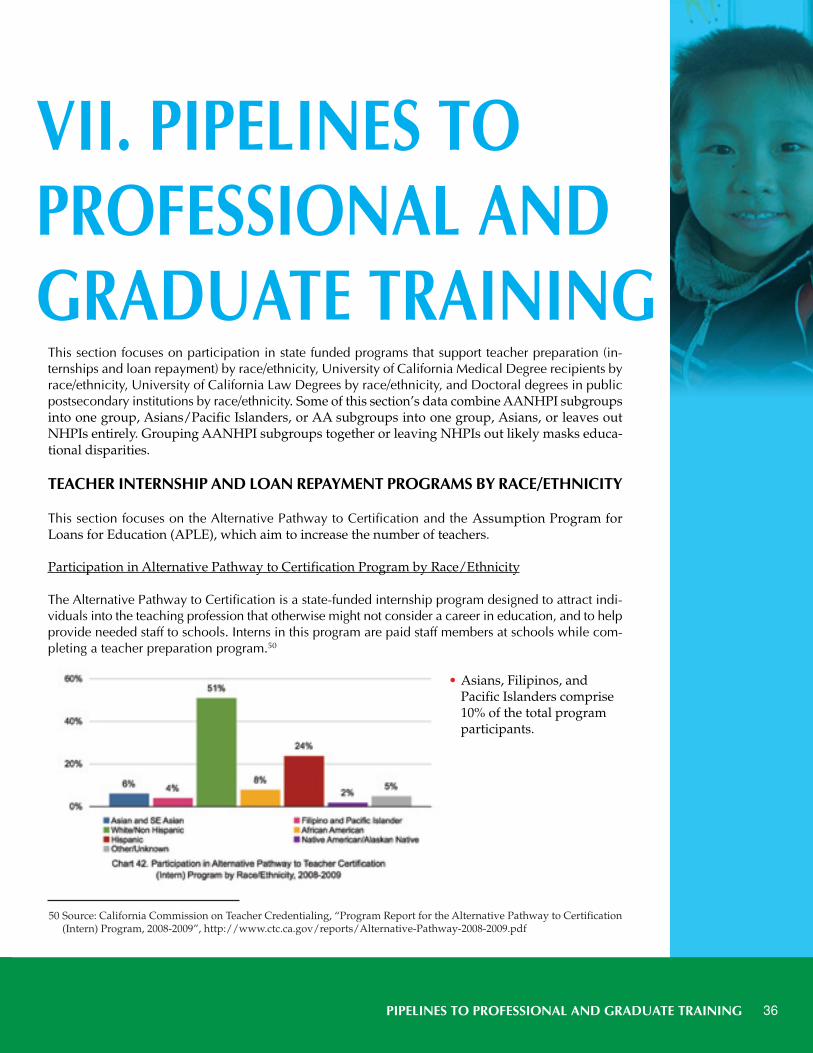
PIPELINES TO PROFESSIONAL AND GRADUATE TRAINING 36
This section focuses on participation in state funded programs that support teacher preparation (in-ternships and loan repayment) by race/ethnicity, University of California Medical Degree recipients byrace/ethnicity, University of California Law Degrees by race/ethnicity, and Doctoral degrees in publicpostsecondary institutions by race/ethnicity. Some of this section’s data combine AANHPI subgroupsinto one group, Asians/Pacific Islanders, or AA subgroups into one group, Asians, or leaves outNHPIs entirely. Grouping AANHPI subgroups together or leaving NHPIs out likely masks educa-tional disparities.
TEACHER INTERNSHIP AND LOAN REPAYMENT PROGRAMS BY RACE/ETHNICITY
This section focuses on the Alternative Pathway to Certification and the Assumption Program forLoans for Education (APLE), which aim to increase the number of teachers.
Participation in Alternative Pathway to Certification Program by Race/Ethnicity
The Alternative Pathway to Certification is a state-funded internship program designed to attract indi-viduals into the teaching profession that otherwise might not consider a career in education, and to helpprovide needed staff to schools. Interns in this program are paid staff members at schools while com-pleting a teacher preparation program.50
• Asians, Filipinos, andPacific Islanders comprise10% of the total programparticipants.
VII. PIPELINES TOPROFESSIONAL ANDGRADUATE TRAINING
50 Source: California Commission on Teacher Credentialing, “Program Report for the Alternative Pathway to Certification(Intern) Program, 2008-2009”, http://www.ctc.ca.gov/reports/Alternative-Pathway-2008-2009.pdf
2010 CA AANHPI educ repor 2.qxd:Layout 1 9/11/10 6:22 PM Page 36
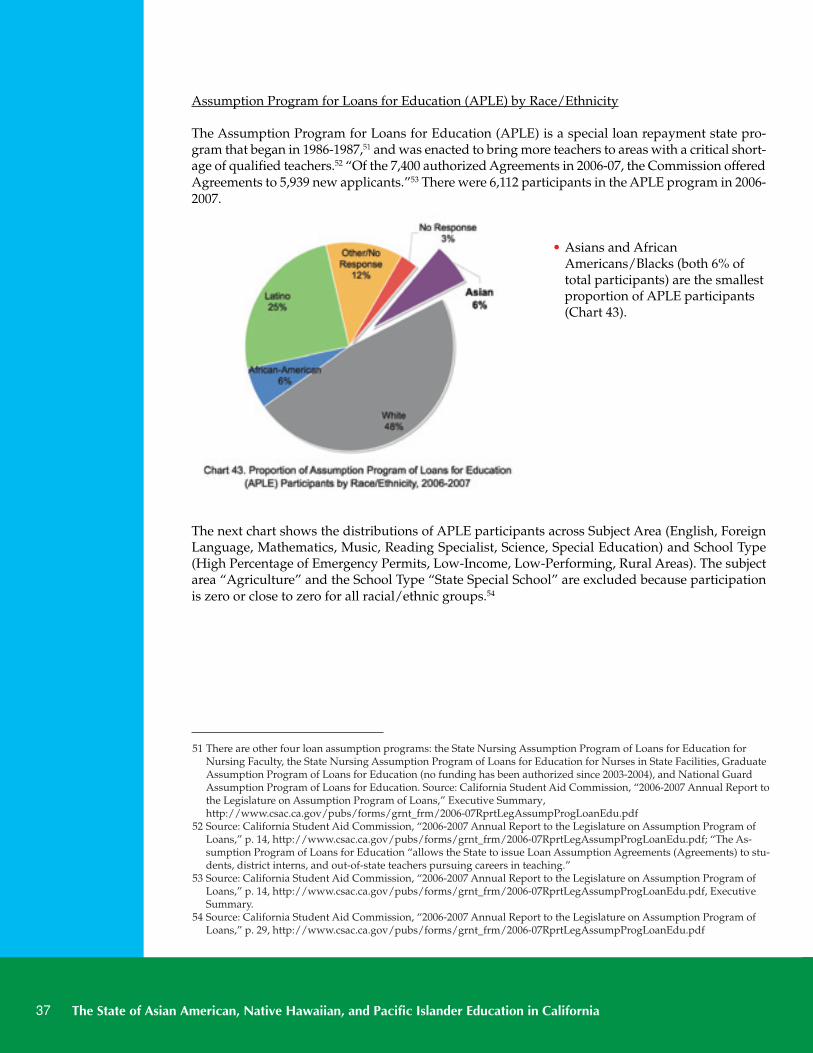
The State of Asian American, Native Hawaiian, and Pacific Islander Education in California37
Assumption Program for Loans for Education (APLE) by Race/Ethnicity
The Assumption Program for Loans for Education (APLE) is a special loan repayment state pro-gram that began in 1986-1987,51 and was enacted to bring more teachers to areas with a critical short-age of qualified teachers.52 “Of the 7,400 authorized Agreements in 2006-07, the Commission offeredAgreements to 5,939 new applicants.”53 There were 6,112 participants in the APLE program in 2006-2007.
• Asians and AfricanAmericans/Blacks (both 6% oftotal participants) are the smallestproportion of APLE participants(Chart 43).
The next chart shows the distributions of APLE participants across Subject Area (English, ForeignLanguage, Mathematics, Music, Reading Specialist, Science, Special Education) and School Type(High Percentage of Emergency Permits, Low-Income, Low-Performing, Rural Areas). The subjectarea “Agriculture” and the School Type “State Special School” are excluded because participationis zero or close to zero for all racial/ethnic groups.54
51 There are other four loan assumption programs: the State Nursing Assumption Program of Loans for Education forNursing Faculty, the State Nursing Assumption Program of Loans for Education for Nurses in State Facilities, GraduateAssumption Program of Loans for Education (no funding has been authorized since 2003-2004), and National GuardAssumption Program of Loans for Education. Source: California Student Aid Commission, “2006-2007 Annual Report tothe Legislature on Assumption Program of Loans,” Executive Summary,http://www.csac.ca.gov/pubs/forms/grnt_frm/2006-07RprtLegAssumpProgLoanEdu.pdf
52 Source: California Student Aid Commission, “2006-2007 Annual Report to the Legislature on Assumption Program ofLoans,” p. 14, http://www.csac.ca.gov/pubs/forms/grnt_frm/2006-07RprtLegAssumpProgLoanEdu.pdf; “The As-sumption Program of Loans for Education “allows the State to issue Loan Assumption Agreements (Agreements) to stu-dents, district interns, and out-of-state teachers pursuing careers in teaching.”
53 Source: California Student Aid Commission, “2006-2007 Annual Report to the Legislature on Assumption Program ofLoans,” p. 14, http://www.csac.ca.gov/pubs/forms/grnt_frm/2006-07RprtLegAssumpProgLoanEdu.pdf, ExecutiveSummary.
54 Source: California Student Aid Commission, “2006-2007 Annual Report to the Legislature on Assumption Program ofLoans,” p. 29, http://www.csac.ca.gov/pubs/forms/grnt_frm/2006-07RprtLegAssumpProgLoanEdu.pdf
2010 CA AANHPI educ repor 2.qxd:Layout 1 9/11/10 6:22 PM Page 37
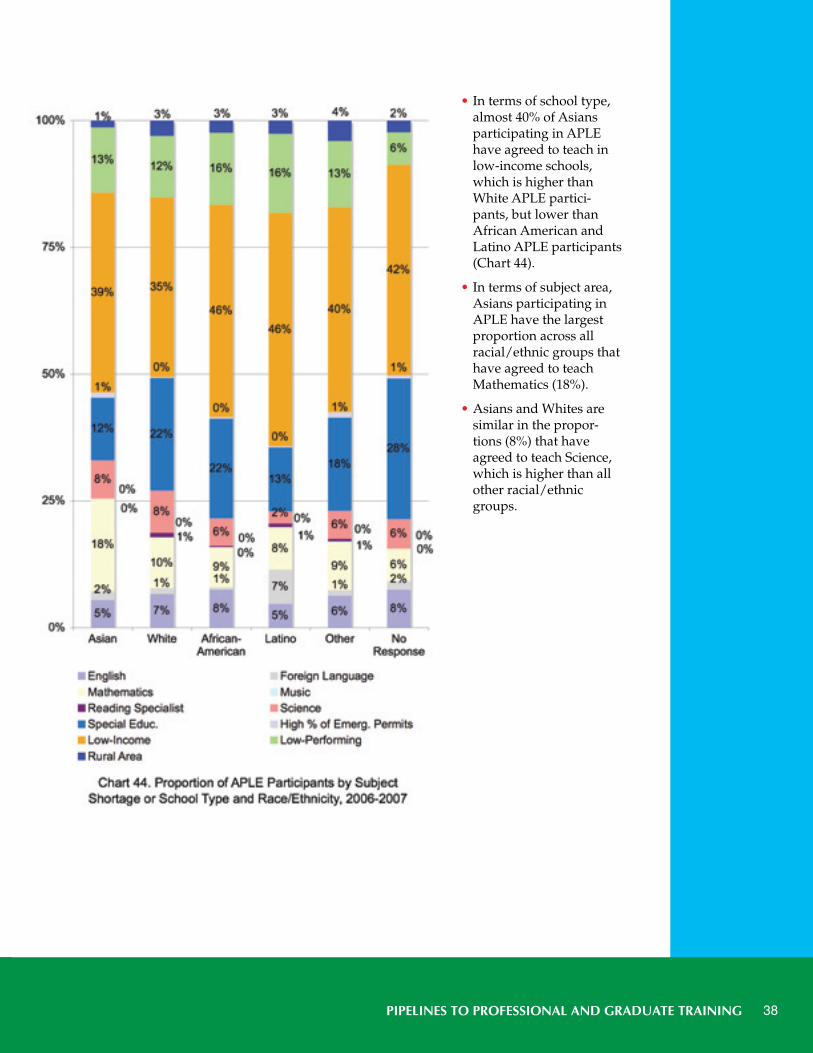
PIPELINES TO PROFESSIONAL AND GRADUATE TRAINING 38
• In terms of school type,almost 40% of Asiansparticipating in APLEhave agreed to teach inlow-income schools,which is higher thanWhite APLE partici-pants, but lower thanAfrican American andLatino APLE participants(Chart 44).
• In terms of subject area,Asians participating inAPLE have the largestproportion across allracial/ethnic groups thathave agreed to teachMathematics (18%).
• Asians and Whites aresimilar in the propor-tions (8%) that haveagreed to teach Science,which is higher than allother racial/ethnicgroups.
2010 CA AANHPI educ repor 2.qxd:Layout 1 9/11/10 6:22 PM Page 38
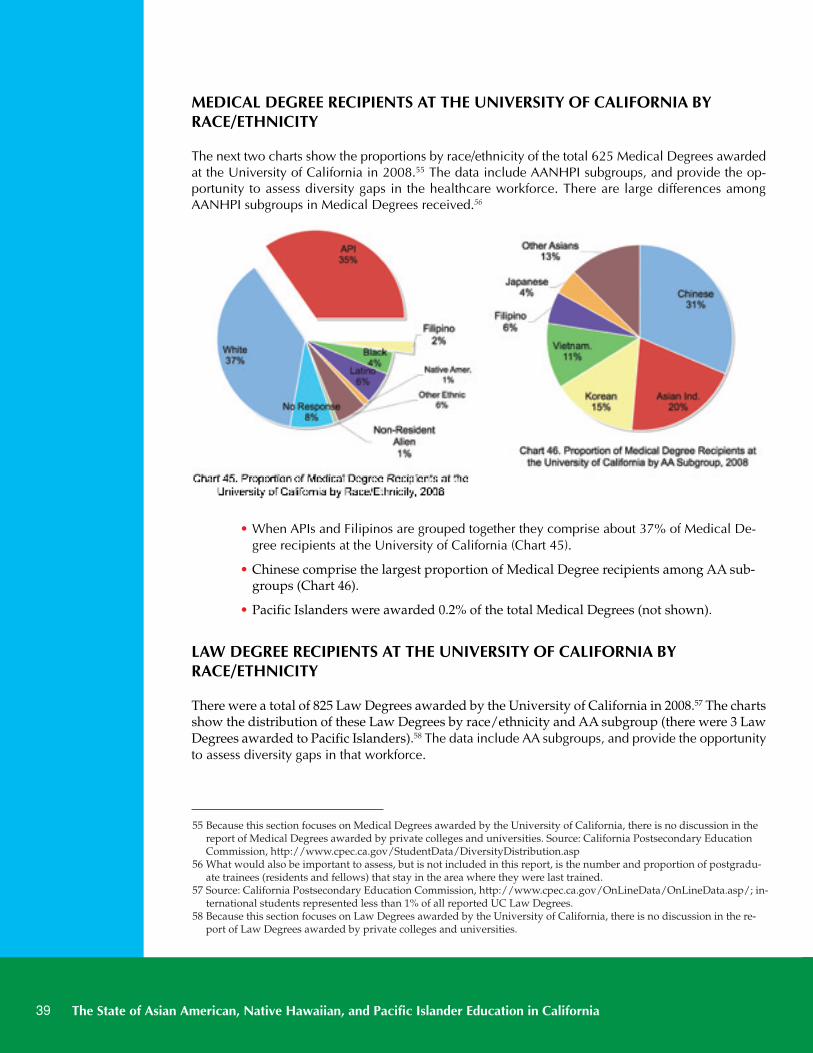
The State of Asian American, Native Hawaiian, and Pacific Islander Education in California39
MEDICAL DEGREE RECIPIENTS AT THE UNIVERSITY OF CALIFORNIA BYRACE/ETHNICITY
The next two charts show the proportions by race/ethnicity of the total 625 Medical Degrees awardedat the University of California in 2008.55 The data include AANHPI subgroups, and provide the op-portunity to assess diversity gaps in the healthcare workforce. There are large differences amongAANHPI subgroups in Medical Degrees received.56
• When APIs and Filipinos are grouped together they comprise about 37% of Medical De-gree recipients at the University of California (Chart 45).
• Chinese comprise the largest proportion of Medical Degree recipients among AA sub-groups (Chart 46).
• Pacific Islanders were awarded 0.2% of the total Medical Degrees (not shown).
LAW DEGREE RECIPIENTS AT THE UNIVERSITY OF CALIFORNIA BYRACE/ETHNICITY
There were a total of 825 Law Degrees awarded by the University of California in 2008.57 The chartsshow the distribution of these Law Degrees by race/ethnicity and AA subgroup (there were 3 LawDegrees awarded to Pacific Islanders).58 The data include AA subgroups, and provide the opportunityto assess diversity gaps in that workforce.
55 Because this section focuses on Medical Degrees awarded by the University of California, there is no discussion in thereport of Medical Degrees awarded by private colleges and universities. Source: California Postsecondary EducationCommission, http://www.cpec.ca.gov/StudentData/DiversityDistribution.asp
56 What would also be important to assess, but is not included in this report, is the number and proportion of postgradu-ate trainees (residents and fellows) that stay in the area where they were last trained.
57 Source: California Postsecondary Education Commission, http://www.cpec.ca.gov/OnLineData/OnLineData.asp/; in-ternational students represented less than 1% of all reported UC Law Degrees.
58 Because this section focuses on Law Degrees awarded by the University of California, there is no discussion in the re-port of Law Degrees awarded by private colleges and universities.
2010 CA AANHPI educ repor 2.qxd:Layout 1 9/11/10 6:22 PM Page 39
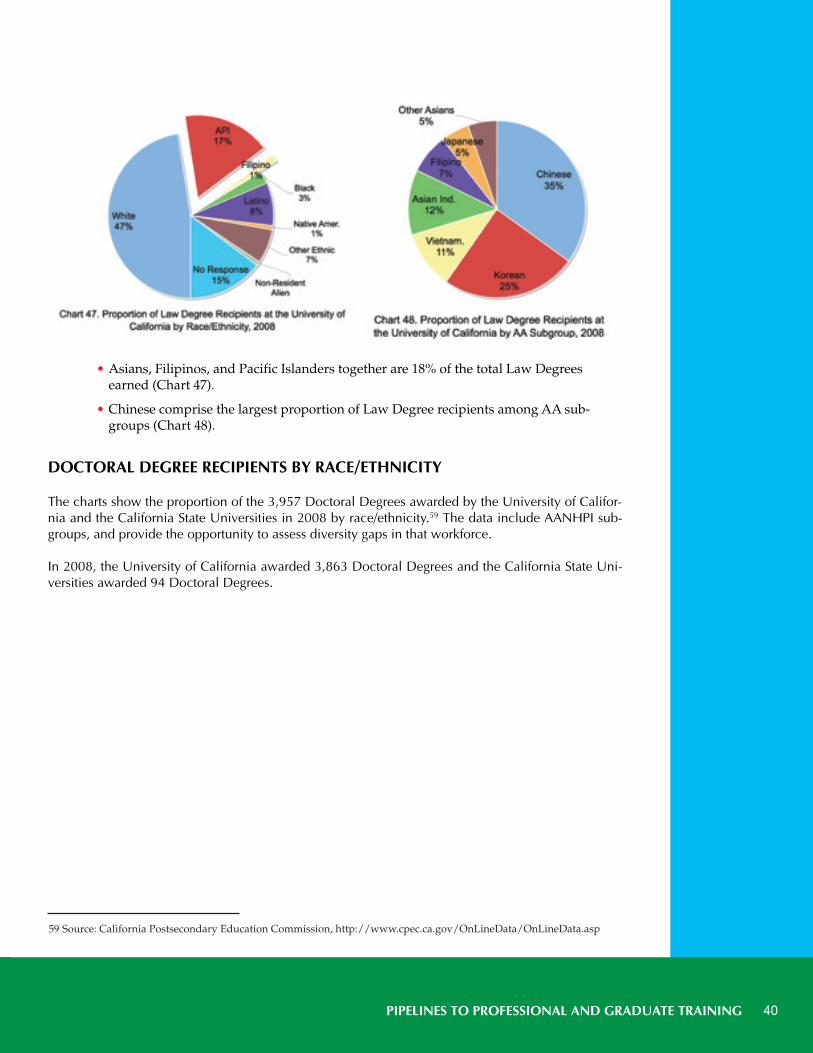
PIPELINES TO PROFESSIONAL AND GRADUATE TRAINING 40
• Asians, Filipinos, and Pacific Islanders together are 18% of the total Law Degreesearned (Chart 47).
• Chinese comprise the largest proportion of Law Degree recipients among AA sub-groups (Chart 48).
DOCTORAL DEGREE RECIPIENTS BY RACE/ETHNICITY
The charts show the proportion of the 3,957 Doctoral Degrees awarded by the University of Califor-nia and the California State Universities in 2008 by race/ethnicity.59 The data include AANHPI sub-groups, and provide the opportunity to assess diversity gaps in that workforce.
In 2008, the University of California awarded 3,863 Doctoral Degrees and the California State Uni-versities awarded 94 Doctoral Degrees.
59 Source: California Postsecondary Education Commission, http://www.cpec.ca.gov/OnLineData/OnLineData.asp
2010 CA AANHPI educ repor 2.qxd:Layout 1 9/11/10 6:22 PM Page 40
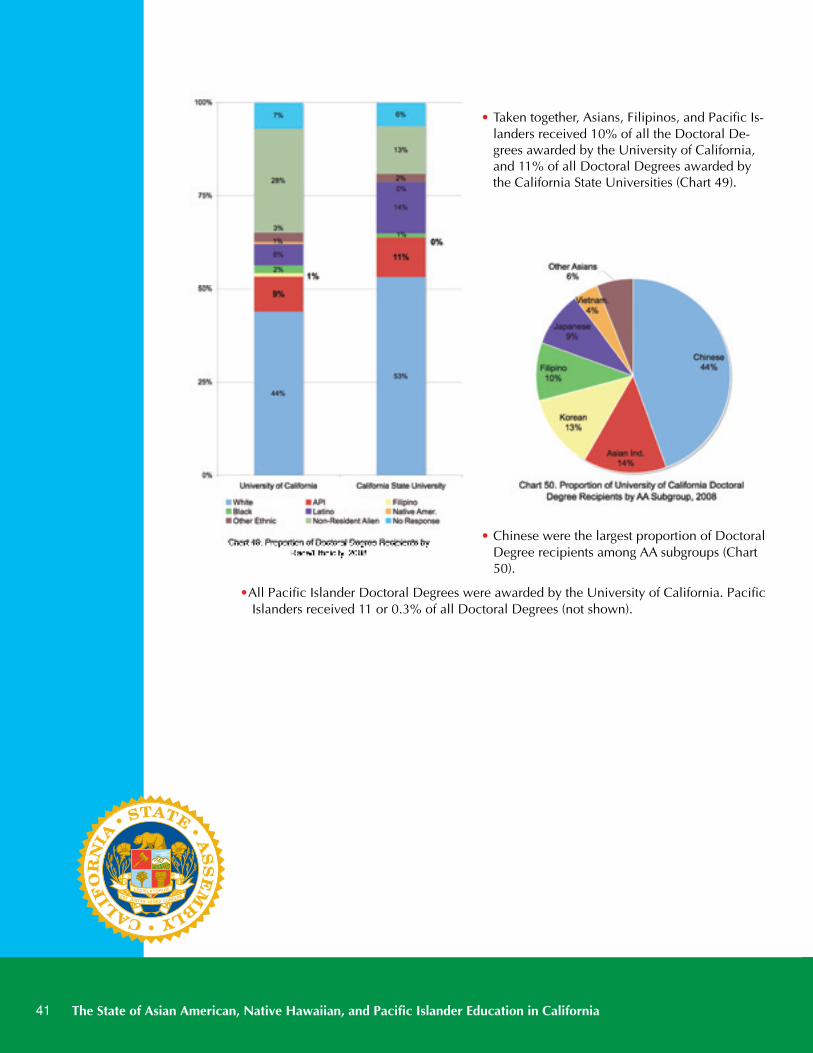
The State of Asian American, Native Hawaiian, and Pacific Islander Education in California41
• Taken together, Asians, Filipinos, and Pacific Is-landers received 10% of all the Doctoral De-grees awarded by the University of California,and 11% of all Doctoral Degrees awarded bythe California State Universities (Chart 49).
• Chinese were the largest proportion of DoctoralDegree recipients among AA subgroups (Chart50).
•All Pacific Islander Doctoral Degrees were awarded by the University of California. PacificIslanders received 11 or 0.3% of all Doctoral Degrees (not shown).
2010 CA AANHPI educ repor 2.qxd:Layout 1 9/11/10 6:22 PM Page 41
POLICY RECOMMENDATIONS 42
1. More and disaggregated data by Asian American, Native Hawaiian, and Pacific Islander subgroupsare urgently needed.
Educational indicators, including retention, success, persistence, degrees awarded, dropout rates,and time it takes to earn a degree should be collected for AANHPI subgroups by K-12 systems, Cal-ifornia Community Colleges, California State Universities, and the University of California. In ad-dition, for public postsecondary institutions, financial aid indicators, such as scholarships, grants,and loans, admission eligibility rates, and personnel data should be collected for AANHPI sub-groups.
2. More data and analysis are needed to determine the obstacles to retention, success, and gradua-tion for Asian American, Native Hawaiian, and Pacific Islander subgroups, including financial aidand appropriate services.
Financial aid amounts, types, and distribution should be analyzed by AANHPI subgroup in termsof their role in admission, retention/success and graduation rates. But financial aid is insufficientto improve admission, retention and success for AANHPI students. In addition, appropriate serv-ices must be designed, implemented, and evaluated for their effectiveness in admission, retention,success, and graduation.
3. Pipeline programs to undergraduate and graduate education need to be inclusive and target AsianAmericans, Native Hawaiians, and Pacific Islanders, particularly subgroups that are underrepre-sented.
Aggregated educational data for AAs and NHPIs mask the disparities in access and attainment forparticular subgroups. Pipeline programs to both undergraduate and graduate education need toconsider racial/ethnic subgroup disparities. For example, there is not a large proportion of AAsparticipating in state funded programs for internships and loan assumption for K-12 teaching prepa-ration and no data are available for NHPI participation in such programs. Although there are no dataavailable for recipients of K-12 teacher certification by AANHPI subgroup, data on alternative statefunded programs to increase K-12 teachers and staff indicated a need to increase outreach and sup-port for AAs and NHPIs. Not only is this needed for the K-12 system, but there is also a need to in-crease AANHPI representation in postsecondary institutions for faculty and administrators.
VIII. POLICYRECOMMENDATIONS
2010 CA AANHPI educ repor 2.qxd:Layout 1 9/11/10 6:22 PM Page 42

The State of Asian American, Native Hawaiian, and Pacific Islander Education in California43
2010 CA AANHPI educ repor 2.qxd:Layout 1 9/11/10 6:22 PM Page 43

APPENDICES 44
APPENDICES
2010 CA AANHPI educ repor 2.qxd:Layout 1 9/11/10 6:22 PM Page 44
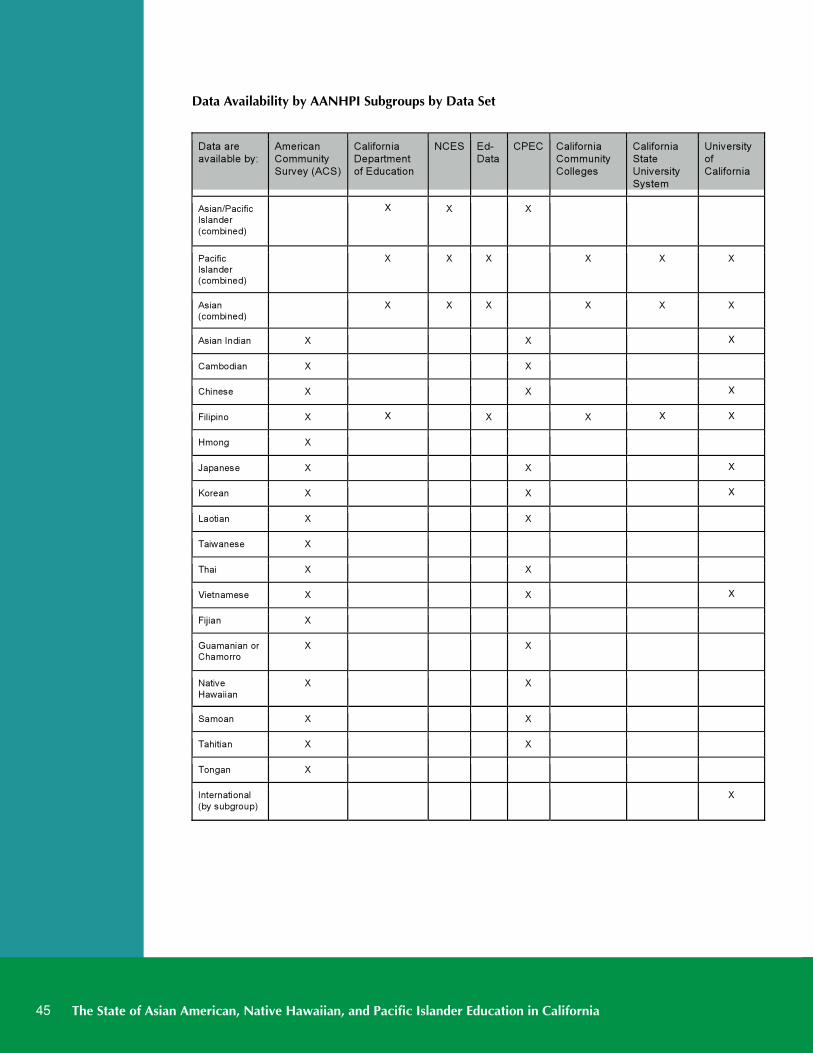
The State of Asian American, Native Hawaiian, and Pacific Islander Education in California45
Data are available by:
American Community Survey (ACS)
California Department of Education
NCES Ed-Data
CPEC California Community Colleges
California State University System
University of California
Asian/Pacific Islander
(combined)
X X X
Pacific Islander (combined)
X X X X X X
Asian (combined)
X X X X X X
Asian Indian X X X
Cambodian X X
Chinese X X X
Filipino X X X X X X
Hmong X
Japanese X X X
Korean X X X
Laotian X X
Taiwanese X
Thai X X
Vietnamese X X X
Fijian X
Guamanian or Chamorro
X X
Native
Hawaiian
X X
Samoan X X
Tahitian X X
Tongan X
International
(by subgroup)
X
Data Availability by AANHPI Subgroups by Data Set
2010 CA AANHPI educ repor 2.qxd:Layout 1 9/11/10 6:22 PM Page 45
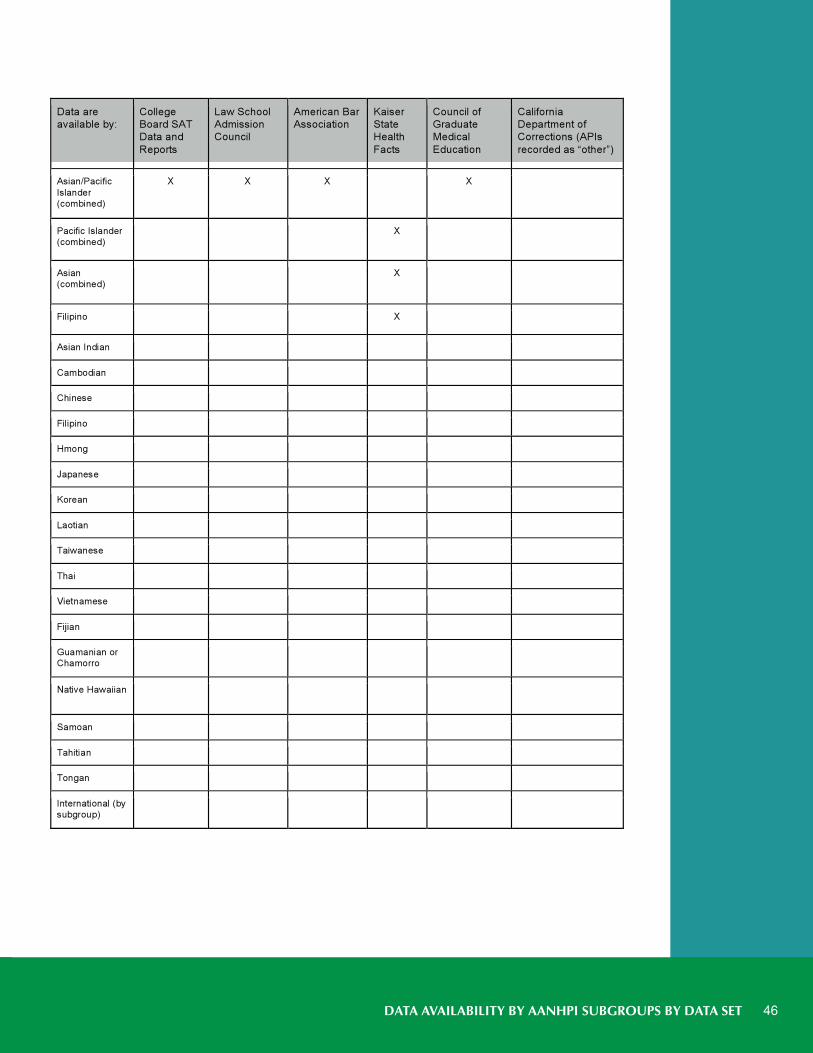
DATA AVAILABILITY BY AANHPI SUBGROUPS BY DATA SET 46
Data are available by:
College Board SAT Data and Reports
Law School Admission Council
American Bar Association
Kaiser State Health Facts
Council of Graduate Medical Education
California Department of Corrections (APIs recorded as “other”)
Asian/Pacific Islander (combined)
X X X X
Pacific Islander (combined)
X
Asian (combined)
X
Filipino X
Asian Indian
Cambodian
Chinese
Filipino
Hmong
Japanese
Korean
Laotian
Taiwanese
Thai
Vietnamese
Fijian
Guamanian or Chamorro
Native Hawaiian
Samoan
Tahitian
Tongan
International (by subgroup)
2010 CA AANHPI educ repor 2.qxd:Layout 1 9/11/10 6:22 PM Page 46
The State of Asian American, Native Hawaiian, and Pacific Islander Education in California47
California Asian Pacific Islander Joint Legislative Caucus
The California Asian Pacific Islander Joint Legislative Caucus represents and advocates for the in-terests of the diverse API communities throughout California. It seeks to increase API participationand representation in all levels of government. Additional information can be found at:http://democrats.assembly.ca.gov/apilegcaucus/.
Asian Pacific Islander Joint Legislative Caucus Members
Assemblymember Warren FurutaniChair of Asian Pacific Islander Joint Legislative CaucusChair of Assembly Budget Subcommittee #4 on State Administration55th Assembly DistrictCapitol OfficeState CapitolP.O. Box 94249-0055Tel: (916) 319-2055District Office4201 Long Beach Blvd., Suite 327Long Beach, CA 90807Tel: (562) 989-2919Website: http://democrats.assembly.ca.gov/members/a55/
Assemblymember Van TranCo-chair of Asian Pacific Islander Joint Legislative CaucusVice Chair of Assembly Committee on Judiciary68th Assembly DistrictCapitol OfficeState CapitolP.O. Box 94249-0068Tel: (916) 319-2068District Office1503 South Coast Dr. #205Costa Mesa, CA 92626Tel: (714) 668-2100Website: http://arc.asm.ca.gov/member/68/
Assemblymember Mary HayashiVice Chair of Asian Pacific Islander Joint Legislative CaucusChair of Assembly Committee on Business, Professions and Consumer Protection18th Assembly DistrictCapitol OfficeState CapitolP.O. Box 94249-0018Tel: (916) 319-2018District OfficeDistrict Director: Mr. Christopher Parman22320 Foothill Boulevard, Suite 540Hayward, CA 94541Tel: (510) 583-8818Website: http://democrats.assembly.ca.gov/members/a18/
2010 CA AANHPI educ repor 2.qxd:Layout 1 9/11/10 6:22 PM Page 47
Asian Pacific Islander Joint Legislative Caucus Members 48
Asian Pacific Islander Joint Legislative Caucus Members
Assemblymember Mike EngChair of Assembly Committee on Banking and Finance49th Assembly DistrictCapitol OfficeState CapitolP.O. Box 94249-0049Tel: (916) 319-2049District Office9420 Telstar Avenue, Suite 103El Monte, CA 91731Tel: (626) 450-6116Website: http://democrats.assembly.ca.gov/members/a49/
Assemblymember Paul FongChair of Assembly Committee on Elections and Redistricting22nd Assembly DistrictCapitol OfficeState CapitolP.O. Box 94249-0022Tel: (916) 319-2022District Office274 Castro Street, Suite 202Mountain View, CA 94041Tel: (408) 277-2003Website: http://democrats.assembly.ca.gov/members/a22/
Assemblymember Ted LieuMember of Assembly Committee on Rules53rd Assembly DistrictCapitol OfficeState CapitolP.O. Box 94249-0053Tel: (916) 319-2053District OfficeEl Segundo Office500 Center StreetEl Segundo, CA 90245Tel: (310) 615-3515Website: http://democrats.assembly.ca.gov/members/a53/
2010 CA AANHPI educ repor 2.qxd:Layout 1 9/11/10 6:22 PM Page 48
The State of Asian American, Native Hawaiian, and Pacific Islander Education in California49
Asian Pacific Islander Joint Legislative Caucus Members
Assemblymember Fiona MaSpeaker pro Tempore12th Assembly DistrictCapitol OfficeState CapitolP.O. Box 94249-0012Tel: (916) 319-2012District Office455 Golden Gate Ave., Suite 14600San Francisco, CA 94102Tel: (415) 557-2312Website: http://democrats.assembly.ca.gov/members/a12/
Assemblymember Alberto TorricoMember of Committee on Governmental Organization20th Assembly DistrictCapitol OfficeState CapitolP.O. Box 94249-0020Tel: (916) 319-2020District Office39510 Paseo Padre Parkway, Suite 280Fremont, CA 94538Tel: (510) 440-9030Website: http://democrats.assembly.ca.gov/members/a20/mainpage.aspx
Assemblymember Mariko YamadaChair of Assembly Committee on Aging and Long-Term Care8th Assembly DistrictCapitol OfficeState CapitolP.O. Box 94249-0008Tel: (916) 319-2008District Office555 Mason Street, Suite 275Vacaville, CA 95688Tel: (707) 455-8025Website: http://democrats.assembly.ca.gov/members/a08/
2010 CA AANHPI educ repor 2.qxd:Layout 1 9/11/10 6:22 PM Page 49
Asian Pacific Islander Joint Legislative Caucus Members 50
Asian Pacific Islander Joint Legislative Caucus Members
Senator Carol LiuChair of Senate Committee on Human Services21st Senate DistrictCapitol OfficeState CapitolSacramento, CA 95814District Office710 S. Central Ave, #310Glendale, CA 91204Tel: (818) 409-0400Website: http://dist21.casen.govoffice.com/
Senator Leland Yee, Ph.D.Assistant President pro Tempore8th Senate DistrictCapitol OfficeState CapitolSacramento, CA 95814San Francisco Office455 Golden Gate Avenue, Suite 14200San Francisco, CA 94102Tel: (415) 557-7857Website: http://dist08.casen.govoffice.com/
Honorary Member, John ChiangCalifornia State ControllerSacramento OfficeP.O. Box 942850Sacramento, CA 94250-5872Tel: (916) 445-2636Website: http://www.sco.ca.gov/eo/directory/directory.shtml
Honorary Member, Michelle SteelBoard of Equalization Member, 3rd DistrictSacramento Office450 N Street, MIC: 77Sacramento, CA 95814Tel: 916-445-5713Website: http://www.boe.ca.gov/members/msteel/index.html
Honorary Member, Betty YeeBoard of Equalization Member, 1st DistrictSacramento Office450 N Street, MIC: 71Sacramento, CA 95814Tel: 916-445-4081Website: http://www.boe.ca.gov/members/yee/
The State of Asian American, Native Hawaiian, and Pacific Islander Education in California51
Biography for Assemblymember Mike Eng, 49th District
Assemblymember Mike Eng represents the 49th Assembly District, which is located within easternLos Angeles County and includes the cities of Alhambra, El Monte, Monterey Park, Rosemead, SanGabriel, San Marino, and South El Monte.
Assemblymember Eng chairs the Assembly Committee on Banking & Finance, which oversees Cal-ifornia’s financial institutions, real property finance, and corporate securities law. Consequently, theCommittee develops and shapes public policy in a broad range of areas such as mortgage foreclo-sures, payday lending, the regulation of state chartered banks and credit unions, consumer lending,and financial privacy.
Assemblymember Eng has a wide range of other important assignments, including membershipon the Assembly Committees on Business and Professions, Education, Health, Housing and Com-munity Development and Transportation.
Assemblymember Eng’s top legislative priorities include addressing California’s transportation in-frastructure needs, “green” job creation, tackling the underground economy by going after taxcheats, advocating for stronger consumer protections, fighting for groundwater cleanup in the SanGabriel Valley and throughout the state, eliminating health disparities amongst underserved com-munities, and confronting the growing problem of hates crimes in California and the rest of the na-tion.
Prior to serving in the State Assembly, Assemblymember Eng was appointed to the California De-partment of Consumer Affairs Acupuncture Board for two terms where he served as Board ViceChair and Chair of the Enforcement Committee. He also served as Mayor and City Councilmem-ber of Monterey Park, where he helped start the region’s first city Environmental Commission todeal with quality of life issues, initiated a summer science program for low-income students, en-hanced after school programs, organized Clean Up the City Day, facilitated the city’s first work-shop for home care workers and founded numerous scholarship opportunities for high schoolstudents.
Assemblymember Eng earned his law degree from the University of California, Los Angeles aftercompleting Bachelor’s and Master’s degrees at the University of Hawaii. He is also a part-timecommunity college instructor.
Assemblymember Eng chairs the Assembly Committee on Banking & Finance, which oversees Cal-ifornia’s financial institutions, real property finance, and corporate securities law. Consequently, theCommittee develops and shapes public policy in a broad range of areas such as mortgage foreclo-sures, payday lending, the regulation of state chartered banks and credit unions, consumer lending,and financial privacy.
Assemblymember Eng has a wide range of other important assignments, including membershipon the Assembly Committees on Business and Professions, Education, Health, Housing and Com-munity Development and Transportation.
Assemblymember Eng’s top legislative priorities include addressing California’s transportation in-frastructure needs, “green” job creation, tackling the underground economy by going after taxcheats, advocating for stronger consumer protections, fighting for groundwater cleanup in the SanGabriel Valley and throughout the state, eliminating health disparities amongst underserved com-munities, and confronting the growing problem of hates crimes in California and the rest of the na-tion.
Prior to serving in the State Assembly, Assemblymember Eng was appointed to the California De-partment of Consumer Affairs Acupuncture Board for two terms where he served as Board Vice
Prior to serving in the State Assembly, Assemblymember Eng was appointed to the California De-partment of Consumer Affairs Acupuncture Board for two terms where he served as Board ViceChair and Chair of the Enforcement Committee. He also served as Mayor and City Councilmem-ber of Monterey Park, where he helped start the region’s first city Environmental Commission todeal with quality of life issues, initiated a summer science program for low-income students, en-hanced after school programs, organized Clean Up the City Day, facilitated the city’s first work-shop for home care workers and founded numerous scholarship opportunities for high schoolstudents.
Assemblymember Eng earned his law degree from the University of California, Los Angeles aftercompleting Bachelor’s and Master’s degrees at the University of Hawaii. He is also a part-timecommunity college instructor.
Biographies of Authors 52
Biographies of Authors
Mitchell J. Chang is Professor of Higher Education and Organizational Change with a joint appoint-ment in Asian American Studies at UCLA. His research focuses on the educational efficacy of diver-sity-related initiatives on college campuses. He has written over 60 articles, book chapters, andreports. He served as the lead editor of Compelling Interest (with D. Witt, J. Jones, & K. Hakuta),which was cited in the U.S. Supreme Court ruling of Grutter v. Bollinger. Professor Chang receiveda National Academy of Education/Spencer Fellowship in 2001, was awarded the Outstanding Out-comes Assessment Research Award, 1999-2000 by the American College Personnel Association, andreceived in 2008 the ACPA Asian Pacific American Network Outstanding Contribution to APIDAResearch Award (shared with J. Park, M. Lin, O. Poon, & D. Nakanishi).
Gordon Fung is Clinical Professor of Medicine at the University of California, San Francisco. At UCSFMedical Center, he is Director of the Cardiology Consultation Service, the Cardiac Noninvasive Lab-oratory, and the nation’s first Asian Heart & Vascular Center. His research focuses on preventive car-diology and ethnic disparities in cardiovascular disease. He has served on the American HeartAssociation’s national board of directors, and is a current member of American College of Cardiol-ogy’s Board of Governors. Dr. Fung has a master’s degree in Public Health from the University of Cal-ifornia, Berkeley School of Public Health, a Medical Degree from the University of California, SanFrancisco, and a Doctorate in Chinese Philosophy from the California Institute of Integral Studies. Hecompleted an internal medicine residency and was chief resident at Highland General Hospital inOakland, and completed a clinical cardiology fellowship at the Veterans Administration MedicalCenter in Martinez, California.
Don Nakanishi is Professor Emeritus of Education and Director Emeritus of the Asian American Stud-ies Center at UCLA. His research focuses on political participation of Asian Pacific Americans andother ethnic/racial groups in American politics, educational policy research, and international po-litical dimensions of minority experiences. He is the author of over 80 books, articles, and reports, andhas received numerous awards for his research and public service. A former national president of theAssociation of Asian American Studies, he also co-founded and served as publisher of AmerasiaJournal, the top scholarly journal in the field of Asian American Studies. A. Magazine identified himas one of the “100 Most Influential Asian Americans in the United States during the Decade of the1990s,” and the Smithsonian Institution appointed him to a 25-member national Blue Ribbon Com-mission to plan for the future of the Smithsonian during the 21st century. He received his B.A. cumlaude with highest honors in Political Science from Yale University, and his Ph.D. in Political Sciencefrom Harvard University.
Rodney Ogawa is Professor of Education at the University of California, Santa Cruz. His research fo-cuses on organizational theory, and the impact of the social environment on school structures, at theclassroom, school, and district level. For more than 20 years, he has examined the impacts of educa-tional reform on performance, conducting research on leadership within school organizations that hasencompassed principals, superintendents, teachers, parents, and students. Professor Ogawa has alsotaught at the University of California, Riverside, where he was Associate Dean in the School of Ed-ucation, and at the University of Utah. Professor Ogawa earned his B.A. in history from UCLA, hisM.A. in education from Occidental College, and his Ph.D. in educational administration from OhioState University, after which he was a postdoctoral trainee in the Organizations Research TrainingProgram at Stanford University.
Khatharya Um is Associate Professor of Asian American Studies at the University of California, Berke-ley. Her research focuses on Southeast Asian and Southeast Asian American Studies, refugee migra-tion, transnational and diaspora studies, post-colonial, conflict and post conflict studies and genocidestudies, and access and education of racialized minorities in American public schools. Her researchand publications focus on the politics of memory and commemoration in post conflict communities,especially among Southeast Asian diasporas, and access, equity and inclusion of language minoritystudents. Professor Um has degrees in Political Science from the University of California, San Diego(B.A. and M.A.) and a Ph.D. in Political Science from the University of California, Berkeley.
2010 CA AANHPI educ repor 2.qxd:Layout 1 9/11/10 6:22 PM Page 52
The State of Asian American, Native Hawaiian, and Pacific Islander Education in California53
Lois M. Takahashi is Professor in the Department of Urban Planning with a joint appointment inAsian American Studies at UCLA, and is Director of the University of California Asian Americanand Pacific Islander Multicampus Research Program (UC AAPI Policy MRP). Her research focuseson HIV prevention among Asians and Pacific Islanders, access to social services, and environmentalgovernance. She has published two books and over fifty articles and book chapters on her varied re-search interests. Professor Takahashi received an A.B. in Architecture from the University of Cali-fornia, Berkeley, an M.S. in Public Policy from Carnegie Mellon University, and her Ph.D. in Urbanand Regional Planning from the University of Southern California.
Melany De La Cruz-Viesca is Assistant Director of the UCLAAsian American Studies Center (AASC),Coordinator and Researcher of the AASC’s highly acclaimed Census information Center (a joint part-nership with the National Coalition of Asian Pacific American Community Development (CAPACD)and the US Census Bureau), and the managing editor of one of the AASC’s two national journals,AAPI Nexus: Asian American and Pacific Islander Policy, Practice, and Community. Ms. De La Cruz-Viesca has published extensively on ethnic populations and community development, and was ap-pointed by Mayor Antonio Villaraigosa in 2009 to the City of Los Angeles Human RelationsCommission. Ms. De La Cruz-Viesca received B.A. degrees in Ethnic Studies and Urban Studies andPlanning from the University of California, San Diego, and an M.A. in Urban Planning from UCLA.
Yen Ling Shek is a doctoral student in Higher Education and Organizational Change at UCLA’s Grad-uate School of Education & Information Studies. She is a Graduate Student Researcher for the Uni-versity of California All Campus Consortium on Research for Diversity’s (ACCORD’s) Pathways toPostsecondary Education Plus project funded by the Gates Foundation. Ms. Shek also serves as aResearch Associate for the University of California Asian American and Pacific Islander Policy Mul-ticampus Research Program (UC AAPI Policy MRP). Her research interests include racial diversityand equity in higher education, institutional commitment to diversity among colleges and universi-ties, Asian American student development, and university cultural resource centers. She receivedher B.A. in Psychology from the University of Virginia and M.A. in Counseling and Personnel Serv-ices from the University of Maryland, College Park.
Annie Kuo is a graduate student in Public Policy at UCLA’s School of Public Affairs. She is also astaff research assistant for the University of California Asian American and Pacific Islander Multi-campus Research Program (UC AAPI Policy MRP), where she is working on designing the UC AAPIPolicy MRP’s new website. Ms. Kuo has worked as a technology manager and consultant for largefirms and faith based organizations, speaks both Taiwanese and Mandarin, and earned her B.S. inComputer Science and Engineering from MIT.
Laura Russ recently received her Ph.D. in Urban Planning from UCLA, where she studied local com-munity-based and civil society organizations in the developing world, using a case study of slumhousing upgrading programs in Ahmedabad, India. Her research focuses on the linkages amonggender, poverty alleviation, and organizational capacity in rapidly growing urban areas in Africaand South Asia. Dr. Russ is the recipient of a National Science Foundation Doctoral Dissertation Re-search Improvement grant, as well as numerous UCLA fellowships and awards. She is currently aLecturer in the Global Studies Program at the University of Illinois, Urbana-Champaign. Along withher Ph.D. from UCLA, Dr. Russ received a B.A. in Urban Studies from Vassar College and an M.A.in Urban Planning from UCLA.
2010 CA AANHPI educ repor 2.qxd:Layout 1 9/11/10 6:22 PM Page 53

54
This report was sponsored by