Embed Size (px)
DESCRIPTION
2010 Based Population Projections and Their Implications for Sandwell
Citation preview
July 2012 Briefing Note 10
2010 Based Population Projections and their Implications
Headline Summary and Pressures
The latest (2010 based) population projections show a much greater increase in the population of Sandwell than previous projections. They show an increase of 68,500 people between 2010 and 2035, an increase of just under a quarter, 23%. The UK population is projected to increase by 15.6% over the same period.
The greatest proportional increases are among the elderly, however, Sandwell’s population growth is more evenly spread across all age groups than nationally, and significant increases are expected in the numbers of children.
Combined with unprecedented budget cuts and welfare reform, the implications for the council are far reaching, some of these are identified below:
• The pressures of an ageing and growing population on adult social care is of particular concern. The LGA has said that councils in England face a £16.5 billion shortfall in funding by 2020 due to escalating costs of adult social care, government cuts and the increasing older population.
• The increase in children has signicant implications for children’s services. (The potential increase in numbers of ‘looked after children’ is also likely to increase the need for the use of agencies in placing children, which increases costs considerably).
As an illustration of the scale of the problem, Barnet Council produced a ‘graph of doom’ which showed that Adult Social Care and Children’s Services would be the only services the council could provide in just under 20 years time (in a similar scenario, Sandwell would not be far behind).

2010 Based Population Projections
2
• Increasing numbers of children also has implications for education, with increased demand for classrooms, teachers and resources. There is also a duty on the local authority to secure sufficient nursery education places for 3 and 4 year olds, as well as sufficient childcare. The rise in the number of under-5s will place added pressures on the provision of nursery and childcare services by the local authority.
• There will be an increased demand for housing and implications for the type, size and tenure of housing required. Increased demand also leads to increasing prices, which in light of the welfare reforms is likely to exacerbate affordability issues.
• There will also be increased demand and competition for jobs, this will place competing pressures on the allocation of land for employment and housing, and further need for job creation and skill matching to increase employment prospects.
• Sandwell is already a densely populated Borough and an increase in population as dramatic as that indicated in the projections has significant implications for land use, infrastructure, congestion and quality of life.
On a positive note, an increased population will mean an increased council tax base. However, local government finance will also be affected by the introduction of the business rate retention scheme. From April 2013 business rate growth will be shared evenly between central and local government. The “local share” of 50% would be retained in full by the collecting councils and the “central share” will be redirected to local government through other grants. Local authorities will therefore be challenged to secure business growth to maximise their rate income. This has further repercussions for land use and economic regeneration.
Background to the Projections
National and Sub-National Population projections are produced every two years by the Office for National Statistics (ONS). Sub-national projections are produced for English regions, local authorities and primary care organisations. They provide estimates of the future population by age and gender, based on local trends in fertility, mortality and migration over the last five years, constrained to the assumptions made for the national projections.
They are not forecasts and do not attempt to predict the impact that future government or local policies, changing economic circumstances or other factors might have on demographic behaviour. Furthermore, due to the inherent uncertainty of demographic behaviour, any set of projections will inevitably be proved wrong, to a greater or lesser extent. Strictly speaking, a population projection is simply the outcome of a given set of assumptions.
2010 Based Population Projections
3
The 2010 based projections are the last set of projections to be released before the publication of the 2011 Census results and they will be revised once the Census results are available. The Census is the most important and authoritative source of information on the UK's population, and as this set of projections is the last to be published over the 10 year period between Censuses it would be advisable to treat them with some caution. Once the Census results are published (late 2012, early 2013) and the projections are revised, it would be advisable to revisit this piece of work.
The 2010 Based Projection Compared with the 2010 Population Estimate and Previous Projections
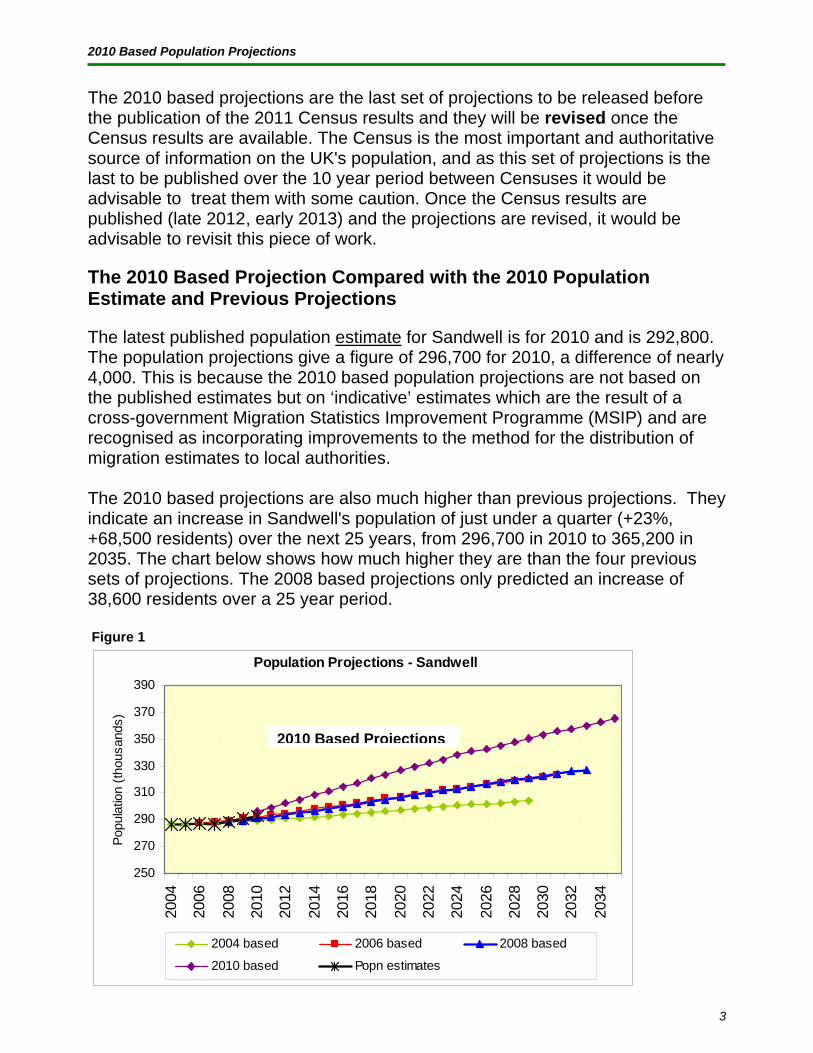
The latest published population estimate for Sandwell is for 2010 and is 292,800. The population projections give a figure of 296,700 for 2010, a difference of nearly 4,000. This is because the 2010 based population projections are not based on the published estimates but on ‘indicative’ estimates which are the result of a cross-government Migration Statistics Improvement Programme (MSIP) and are recognised as incorporating improvements to the method for the distribution of migration estimates to local authorities. The 2010 based projections are also much higher than previous projections. They indicate an increase in Sandwell's population of just under a quarter (+23%, +68,500 residents) over the next 25 years, from 296,700 in 2010 to 365,200 in 2035. The chart below shows how much higher they are than the four previous sets of projections. The 2008 based projections only predicted an increase of 38,600 residents over a 25 year period. Figure 1
Population Projections - Sandwell
250
270
290
310
330
350
370
390
2004
2006
2008
2010
2012
2014
2016
2018
2020
2022
2024
2026
2028
2030
2032
2034
Popu
latio
n (th
ousa
nds)
2004 based 2006 based 2008 based
2010 based Popn estimates
2010 Based Projections
2010 Based Population Projections
4
Source: ONS Sub-National Population Projections and Mid-Year Population Estimates
The reason this set of projections is so much higher is mainly due to differences in the assumptions of future fertility, mortality and migration. In Sandwell, higher numbers of births and greater international in-migration are the main reasons for the differences.
Births
Higher fertility levels have been assumed nationally, in the short-term, and they stay higher for longer reflecting the current relatively high trends in fertility. Births for Sandwell are projected to be between 300 and 600 higher per year in the 2010-based than the 2008-based projections. Part of this is due to Sandwell having a larger population now than before, thereby having more people to generate more births, and part is due to the higher fertility assumptions used in the National Population Projections. Deaths Deaths between the sets of projections appear fairly similar for Sandwell, being slightly higher in the 10-based projections probably due to the slightly higher population. Migration As mentioned above, the 2010-based projections take into account improvements to the method for distributing migration estimates to local authorities. As a result, Sandwell’s net migration estimates for 2010 have been revised upwards by 1,310 (an increase of 88%). This is the 13th largest numerical upward increase of all local authorities in England and Wales.
Numbers of cross-border UK migrants, internal migrants, and international emigrants are broadly similar in the 10-based projections as in the 08-based projections. However, the number of international immigrants has doubled from around 1,200 international immigrants for practically all years of the 08-based projections, to around 2,500 international immigrants for practically all years of the 10-based projections. This has led to the all net migration figures shifting from a loss of approximately 310 people per year previously, to a gain of approximately 470 people per year now. Clearly with net migration moving from negative to positive, the population of Sandwell has been projected to grow much faster in the 2010 based projections than previously.
2010 Based Population Projections
5
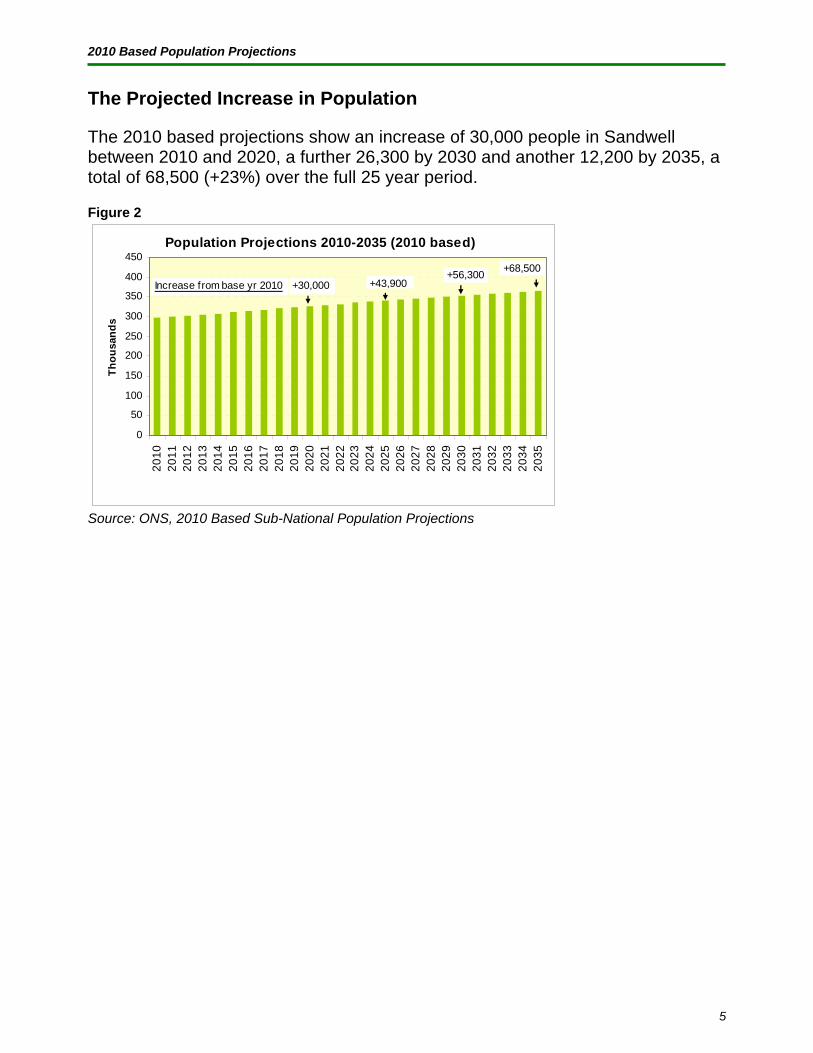
The Projected Increase in Population
The 2010 based projections show an increase of 30,000 people in Sandwell between 2010 and 2020, a further 26,300 by 2030 and another 12,200 by 2035, a total of 68,500 (+23%) over the full 25 year period.
Figure 2
Population Projections 2010-2035 (2010 based)
0
50
100
150
200
250
300
350
400
450
2010
2011
2012
2013
2014
2015
2016
2017
2018
2019
2020
2021
2022
2023
2024
2025
2026
2027
2028
2029
2030
2031
2032
2033
2034
2035
Thou
sand
s
+30,000+56,300 +68,500
+43,900Increase from base yr 2010
Source: ONS, 2010 Based Sub-National Population Projections
2010 Based Population Projections
6
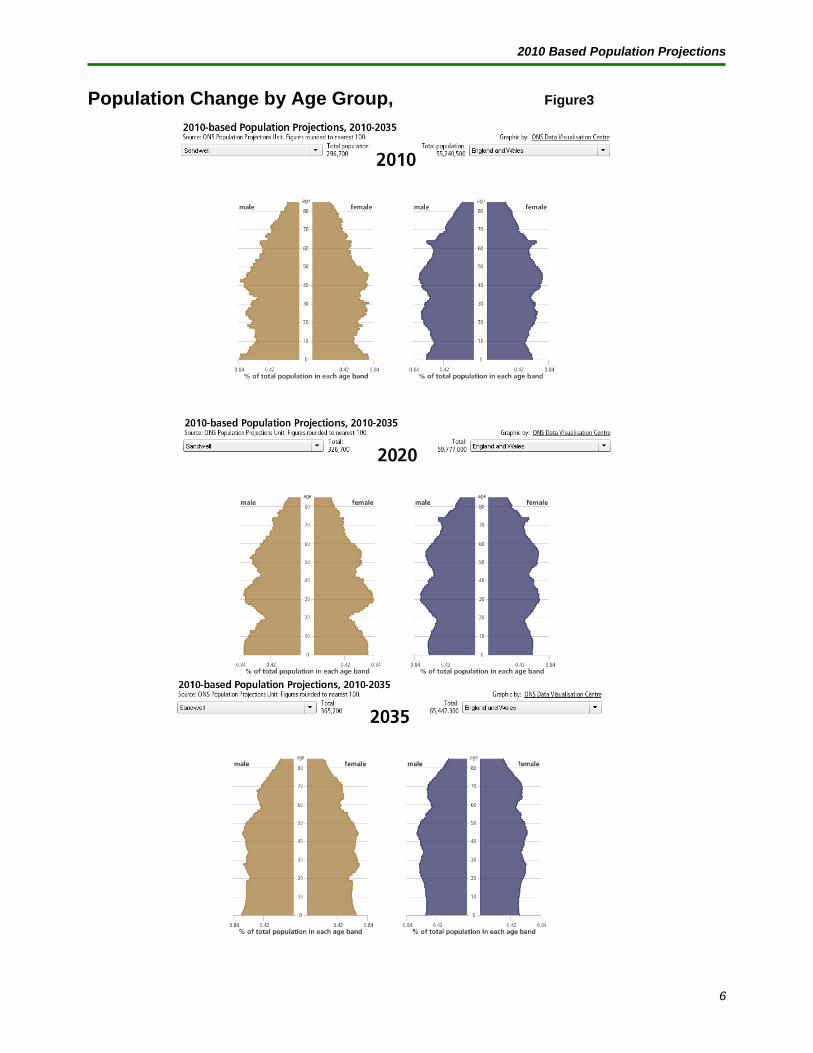
Population Change by Age Group, Figure3
2010 Based Population Projections
7
A snapshot of the population pyramids at 2010, 2020 and 2035 for Sandwell and England and Wales shows how the distribution of population by age and gender changes during the projection period. The increase in the 0-10 age group and 30-35 age groups at 2020 in Sandwell is notable.
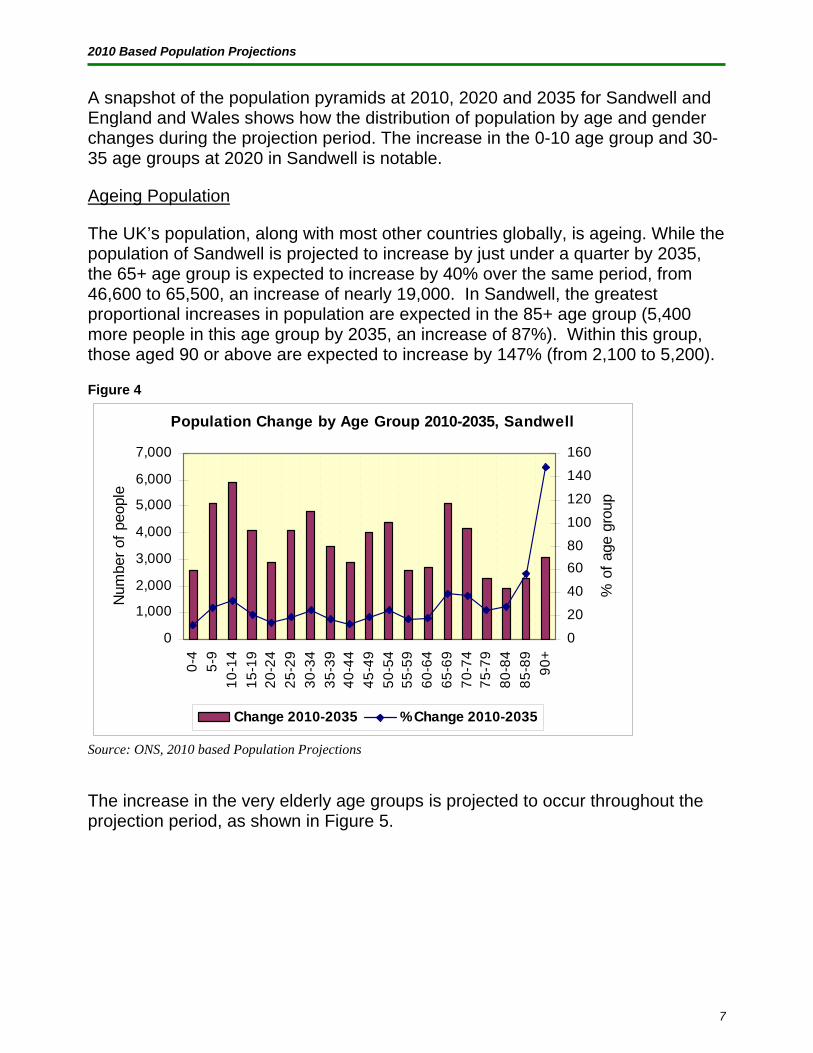
Ageing Population
The UK’s population, along with most other countries globally, is ageing. While the population of Sandwell is projected to increase by just under a quarter by 2035, the 65+ age group is expected to increase by 40% over the same period, from 46,600 to 65,500, an increase of nearly 19,000. In Sandwell, the greatest proportional increases in population are expected in the 85+ age group (5,400 more people in this age group by 2035, an increase of 87%). Within this group, those aged 90 or above are expected to increase by 147% (from 2,100 to 5,200).
Figure 4
Population Change by Age Group 2010-2035, Sandwell
0
1,000
2,000
3,000
4,000
5,000
6,000
7,000
0-4
5-9
10-1
415
-19
20-2
425
-29
30-3
435
-39
40-4
445
-49
50-5
455
-59
60-6
465
-69
70-7
475
-79
80-8
485
-89
90+
Num
ber o
f peo
ple
0
20
40
6080
100
120
140
160
% o
f age
gro
up
Change 2010-2035 % Change 2010-2035
Source: ONS, 2010 based Population Projections
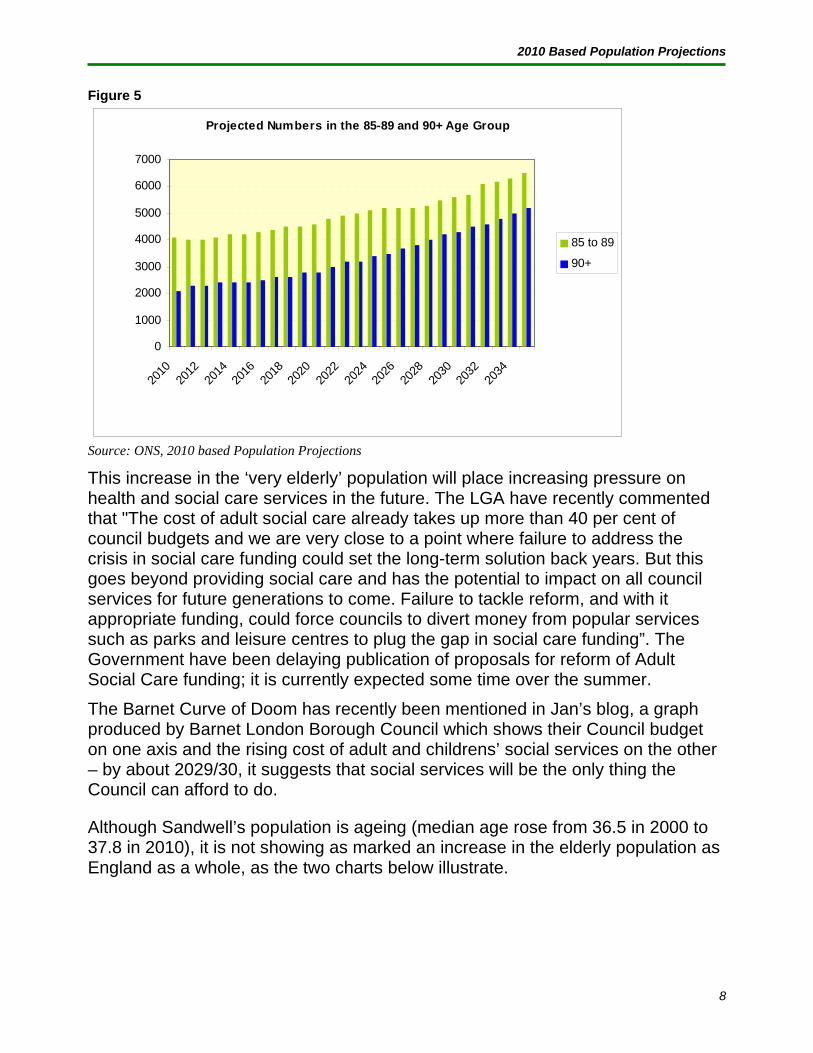
The increase in the very elderly age groups is projected to occur throughout the projection period, as shown in Figure 5.
2010 Based Population Projections
8
Figure 5
Projected Numbers in the 85-89 and 90+ Age Group
0
1000
2000
3000
4000
5000
6000
7000
2010
2012
2014
2016
2018
2020
2022
2024
2026
2028
2030
2032
2034
85 to 89
90+
Source: ONS, 2010 based Population Projections
This increase in the ‘very elderly’ population will place increasing pressure on health and social care services in the future. The LGA have recently commented that "The cost of adult social care already takes up more than 40 per cent of council budgets and we are very close to a point where failure to address the crisis in social care funding could set the long-term solution back years. But this goes beyond providing social care and has the potential to impact on all council services for future generations to come. Failure to tackle reform, and with it appropriate funding, could force councils to divert money from popular services such as parks and leisure centres to plug the gap in social care funding”. The Government have been delaying publication of proposals for reform of Adult Social Care funding; it is currently expected some time over the summer.
The Barnet Curve of Doom has recently been mentioned in Jan’s blog, a graph produced by Barnet London Borough Council which shows their Council budget on one axis and the rising cost of adult and childrens’ social services on the other – by about 2029/30, it suggests that social services will be the only thing the Council can afford to do.
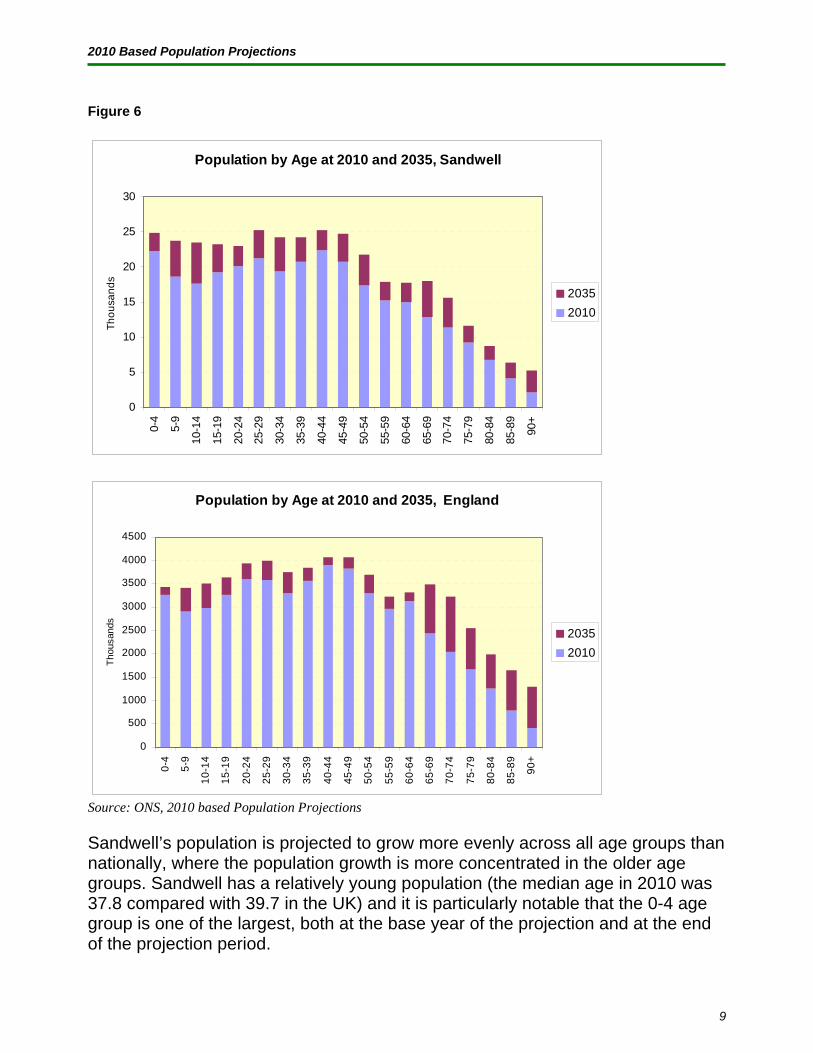
Although Sandwell’s population is ageing (median age rose from 36.5 in 2000 to 37.8 in 2010), it is not showing as marked an increase in the elderly population as England as a whole, as the two charts below illustrate.
2010 Based Population Projections
9
Figure 6
Population by Age at 2010 and 2035, Sandwell
0
5
10
15
20
25
30
0-4
5-9
10-1
4
15-1
9
20-2
4
25-2
9
30-3
4
35-3
9
40-4
4
45-4
9
50-5
4
55-5
9
60-6
4
65-6
9
70-7
4
75-7
9
80-8
4
85-8
9
90+
Thou
sand
s
20352010
Population by Age at 2010 and 2035, England
0
500
1000
1500
2000
2500
3000
3500
4000
4500
0-4
5-9
10-1
4
15-1
9
20-2
4
25-2
9
30-3
4
35-3
9
40-4
4
45-4
9
50-5
4
55-5
9
60-6
4
65-6
9
70-7
4
75-7
9
80-8
4
85-8
9
90+
Thou
sand
s
20352010
Source: ONS, 2010 based Population Projections
Sandwell’s population is projected to grow more evenly across all age groups than nationally, where the population growth is more concentrated in the older age groups. Sandwell has a relatively young population (the median age in 2010 was 37.8 compared with 39.7 in the UK) and it is particularly notable that the 0-4 age group is one of the largest, both at the base year of the projection and at the end of the projection period.
2010 Based Population Projections
10
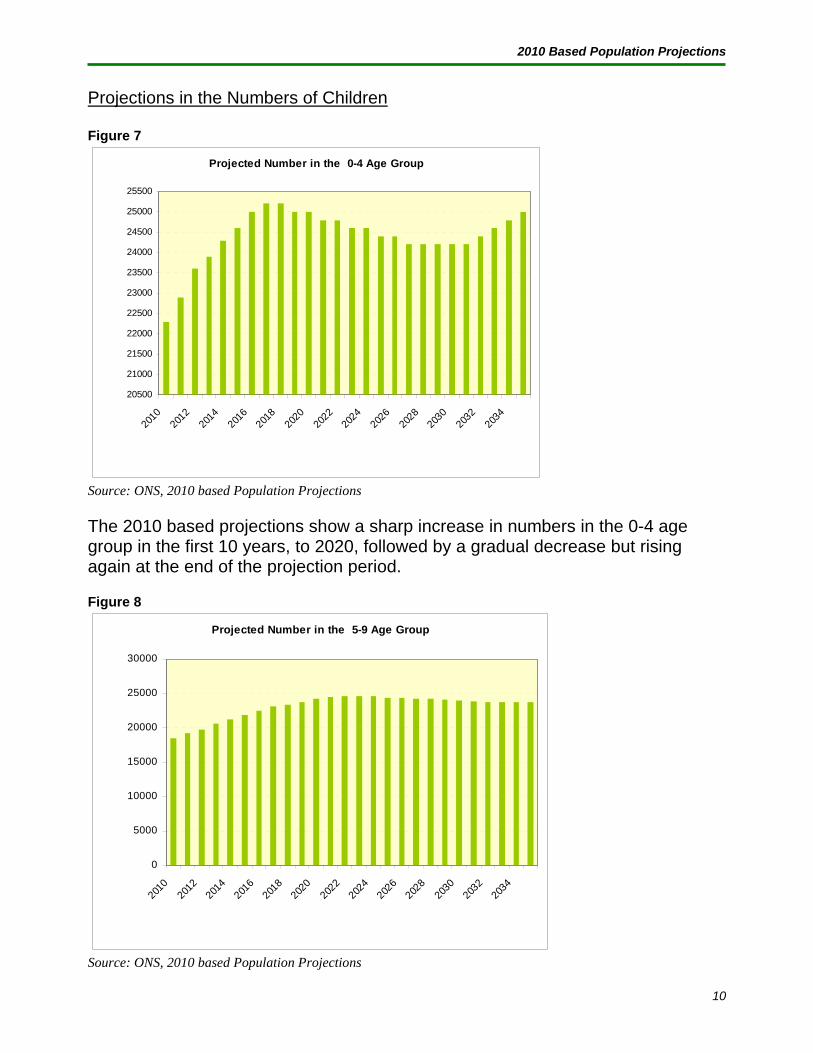
Projections in the Numbers of Children Figure 7
Projected Number in the 0-4 Age Group
20500
21000
21500
22000
22500
23000
23500
24000
24500
25000
25500
2010
2012
2014
2016
2018
2020
2022
2024
2026
2028
2030
2032
2034
Source: ONS, 2010 based Population Projections
The 2010 based projections show a sharp increase in numbers in the 0-4 age group in the first 10 years, to 2020, followed by a gradual decrease but rising again at the end of the projection period.
Figure 8
Projected Number in the 5-9 Age Group
0
5000
10000
15000
20000
25000
30000
2010
2012
2014
2016
2018
2020
2022
2024
2026
2028
2030
2032
2034
Source: ONS, 2010 based Population Projections
2010 Based Population Projections
11
The projections also show a sharp increase in the number of 5-9 year olds during the first 10 years, to 2020, with implications for numbers of school places
Recent Trends in Births
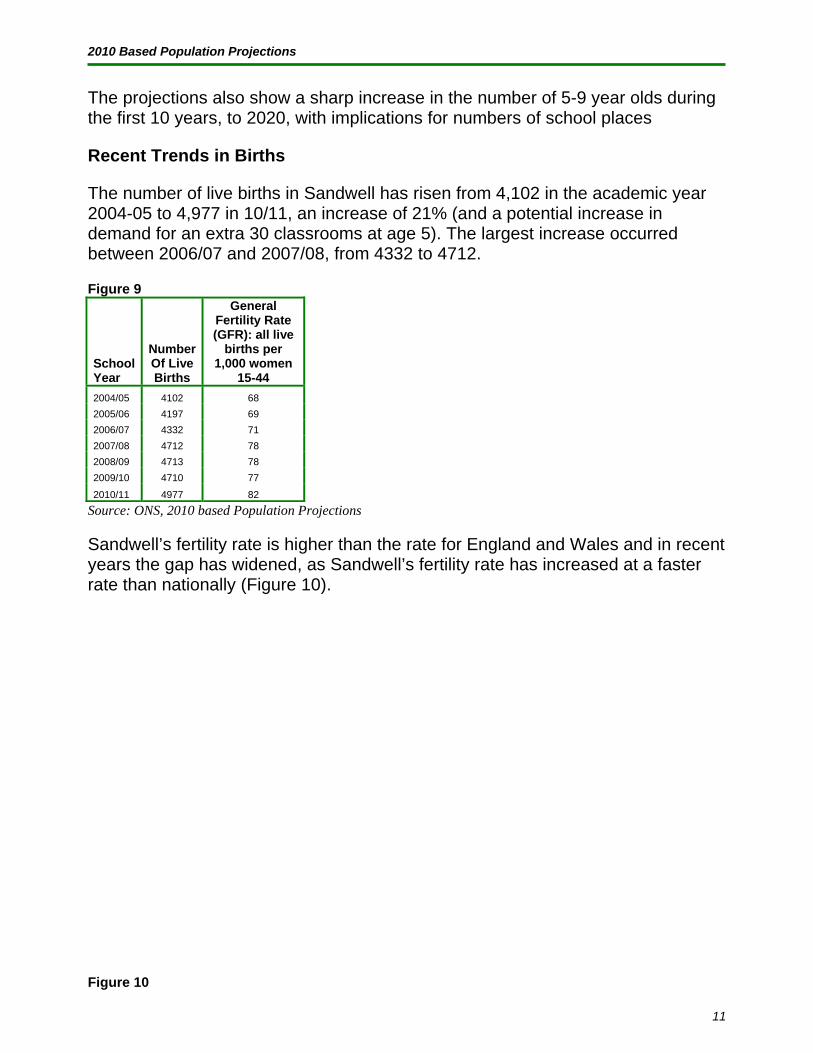
The number of live births in Sandwell has risen from 4,102 in the academic year 2004-05 to 4,977 in 10/11, an increase of 21% (and a potential increase in demand for an extra 30 classrooms at age 5). The largest increase occurred between 2006/07 and 2007/08, from 4332 to 4712.
Figure 9
School Year
Number Of Live Births
General Fertility Rate (GFR): all live
births per 1,000 women
15-44 2004/05 4102 68 2005/06 4197 69 2006/07 4332 71 2007/08 4712 78 2008/09 4713 78 2009/10 4710 77
2010/11 4977 82
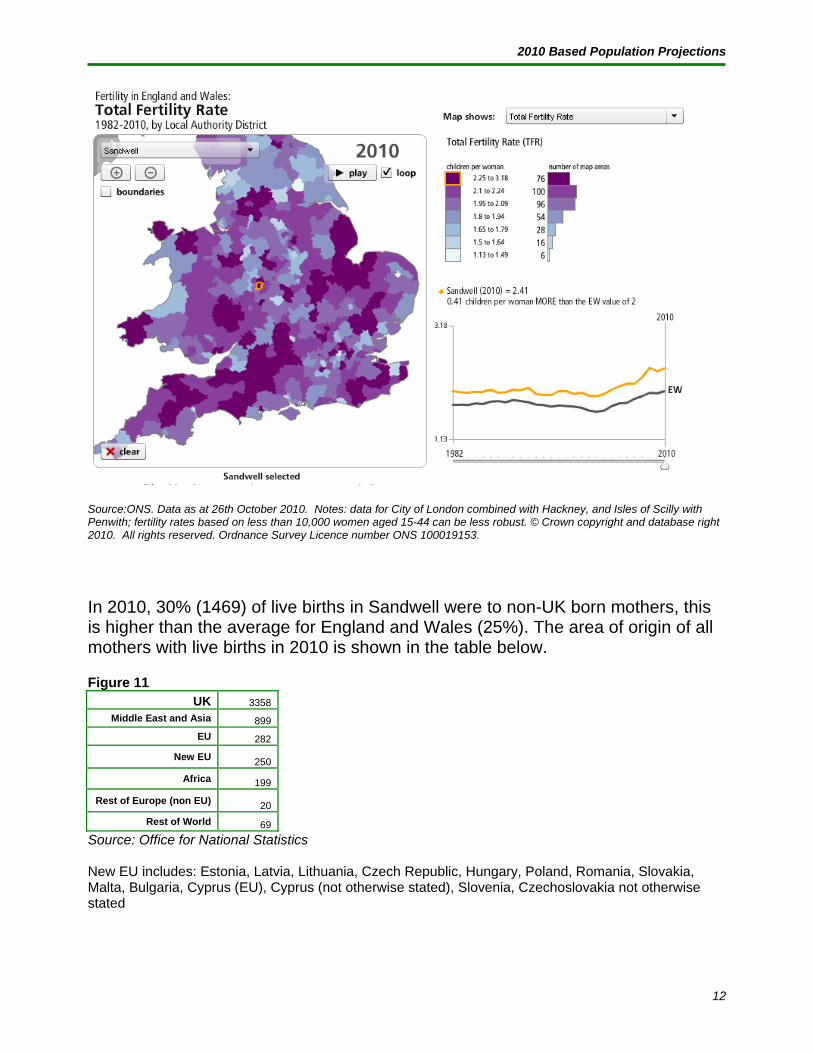
Source: ONS, 2010 based Population Projections Sandwell’s fertility rate is higher than the rate for England and Wales and in recent years the gap has widened, as Sandwell’s fertility rate has increased at a faster rate than nationally (Figure 10). Figure 10
2010 Based Population Projections
12
Source:ONS. Data as at 26th October 2010. Notes: data for City of London combined with Hackney, and Isles of Scilly with Penwith; fertility rates based on less than 10,000 women aged 15-44 can be less robust. © Crown copyright and database right 2010. All rights reserved. Ordnance Survey Licence number ONS 100019153.
In 2010, 30% (1469) of live births in Sandwell were to non-UK born mothers, this is higher than the average for England and Wales (25%). The area of origin of all mothers with live births in 2010 is shown in the table below.
Figure 11 UK 3358
Middle East and Asia 899 EU 282
New EU 250
Africa 199
Rest of Europe (non EU) 20 Rest of World 69
Source: Office for National Statistics New EU includes: Estonia, Latvia, Lithuania, Czech Republic, Hungary, Poland, Romania, Slovakia, Malta, Bulgaria, Cyprus (EU), Cyprus (not otherwise stated), Slovenia, Czechoslovakia not otherwise stated
2010 Based Population Projections
13
The increase in births and numbers of young children places pressure on the local authority in terms of nursery education places for 3 and 4 year olds as well as sufficient childcare and then further pressures on schools for number of education places.
Other pressures arise as a result of increased international in-migration, such as lack of fluency in English, pupil mobility which is high among some migrant communities, mid-term arrivals, and the lack of records and assessments. In terms of Child Protection - it can be highly complex to investigate the family situation of transient families and ensure effective safeguarding of children, and the complexities are exacerbated by language difficulties and cross-cultural issues.
Conclusions and Implications
The 2010 based population projections suggest a much greater increase in Sandwell’s population than previous projections. The implications of such an increase for council services, particularly at a time of unprecedented budget cuts are enormous.
Work is currently being undertaken in the council to examine the likely impacts of the Welfare Reform legislation on the Borough’s residents and ways of mitigating the associated risks. The projected increase in population is likely to exacerbate those risks as competition for housing, jobs, care and other services increases.
The projected increases in the elderly population will put further pressure on health and care services; the Government is already being warned by professionals in this sector of the urgency of the problem.
The projections for Sandwell indicate that while the elderly population is expected to increase dramatically over the next 25 years, the increase in population is spread more broadly across the age groups than nationally. The increase in international in-migration in Sandwell has contributed to the increases in population among the younger age groups. The projected increases in numbers of children will put significant pressures on children’s services, on nursery and childcare places and on the education system.
This report focuses on the 2010 based population projections published by ONS and provides a starting point for a potentially significant piece of work on their implications. This would need to include representatives from service areas to identify and address all the implications for their service area. In addition, we could draw on other information sources and research which broaden the scope, such as household projections/trends in housing tenure, poverty mapping etc.
2010 Based Population Projections
14
As mentioned at the beginning of this paper, these projections will be revised once the 2011 Census results are available. The Census will provide a wealth of information on the population of the Borough and how it has changed over the last ten years. Whether we wait until these are available or start to consider now how population change will impact on the Council and the Borough needs to be considered.
Document produced by: Melanie Chillingworth
www.sandwelltrends.info