Embed Size (px)
Citation preview
JOURNALISM & MASS COMMUNICATION EDUCATOR 300
Undergraduate enrollments injournalism and mass communicationprograms in the United States increas-ed by 2.0% in the autumn of 2010,reversing the slowdown in growth thelast two years.
At the same time, freshman andsophomore enrollments were staticcompared with a year earlier, suggest-ing that the growth may be temporaryunless transfers into the major in thenext few years compensate.
Graduate level enrollments in-creased in the autumn of 2010 com-
pared with a year earlier, with enroll-ment at the master’s level up a dramat-ic 13.4% and doctoral enrollment up6.3%.
Reflecting the general pattern ofenrollment growth, journalism andmass communication programs sent arecord number of bachelor’s, master’s,and doctoral degree recipients into thejob market in academic year 2009-2010.
Enrollment in the journalism spe-cialization—historically the heart ofthe field—declined again in the au-
2010 Annual Survey of Journalism& Mass Communication Enrollments:Enrollments Grow, ReversingStagnation of Recent YearsTUDOR VLAD, LEE B. BECKER, AND WHITNEY KAZRAGIS
Tudor Vlad ([email protected]) is senior research scientist and associate director; Lee B.Becker ([email protected]) is professor of journalism and director; and WhitneyKazragis is graduate research assistant, all in the James M. Cox Jr. Center forInternational Mass Communication Training & Research, Grady College of Journalismand Mass Communication, The University of Georgia.
Undergraduate enrollments in U.S. journalism and mass communication pro-grams increased by 2.0% in the autumn of 2010, a reverse in a two-year slow-down, but perhaps temporary. Graduate level enrollments increased 6.3% indoctoral programs and a dramatic 13.4% in master’s programs. JMC programssent a record number of bachelor’s, master’s, and doctoral degree recipientsinto the job market. Enrollment in the journalism specialization declinedagain, but it remains the largest in the field with about a quarter of students.Undergraduate enrollment of racial/ethnic minorities hit a new high point of36.3%. Nine in ten of program administrators said they are dealing with bigchallenges, most commonly budgets/financing.
tumn of 2010. The percentage of stu-dents enrolled in journalism hasdropped 6.6% since as recently as2007. Despite that, about a quarter ofthe students are still in that specialty,and it remains the largest in the field.
Students classified as members ofa racial or ethnic minority made up alarger percentage of enrolled studentsin journalism and mass communica-tion programs in the autumn of 2010than at any point in the history of thefield. At the undergraduate level,36.3% of the students were classifiedas racial or ethnic minorities.
Journalism and mass communica-tion programs reported engaging in anumber of strategies to update theskills of their faculties to deal with dig-ital media, from sending them to train-ing programs to hiring permanent andadjunct professors with those skills.
Nine in ten of the administratorsof journalism and mass communica-tion programs reported that they aredealing with big challenges, and one inthree of those with challenges saidthey are associated with budgets andfinancing.
These are the key findings of the2010 Annual Survey of Journalism &Mass Communication Enrollments,designed to measure trends in journal-ism and mass communication educa-tion.1
The methods used in the AnnualSurvey of Journalism & Mass Commu-nication Enrollments have remainedunchanged since 1988. Schools includ-ed in this survey are listed in eitherthe Journalism & Mass CommunicationDirectory, published by the Associa-tion for Education in Journalism and
Mass Communication, or The Journ-alist’s Road to Success: A CareerGuide, formerly published and printedby the Dow Jones News Fund, Inc., andnow available online. All degree-grant-ing senior colleges and universitieswith courses organized under thelabels of journalism and mass commu-nication are invited to be listed in theAEJMC Directory. To be included inthe Guide, the college or universitymust offer at least ten courses in news-editorial journalism, and those coursesmust include core courses, such as anintroduction to the mass media andpress law and ethics, as well as basicskills courses, such as reporting andediting. Since 1992, the two journalismprograms listed in the AEJMCDirectory in Puerto Rico have beenincluded in the population.
A combination of these two direc-tories produced 483 listings in 2010. InOctober 2010, a questionnaire wasmailed to the administrator of each ofthese programs. A second mailing ofthis questionnaire was sent to the non-responding schools in December. Athird mailing was sent to the non-responding schools in January of 2011.In February, the administrators weresent a fourth mailing. In each mailing,administrators were given the chanceto return a written form via mail ordownload a form from a website andreturn it electronically. The 258 admin-istrators of the programs who had notresponded by the beginning of Aprilwere contacted by telephone and askedto answer as many questions over thetelephone as possible. Two of the 483schools reported that their programswere no longer active.
Administrators were given theoption of returning a printed form viathe regular mail, returning a down-
WINTER ’11301
Methodology
loadable form by mail or as an attach-ment to an e-mail message, or complet-ing the form online. In the end, only 48,or 10.0%, completed the form online.
The questionnaire asked theadministrators to provide informationon total enrollments in autumn of2010, enrollment by year in school,enrollment by sequence of study,enrollment by gender, and enrollmentby racial or ethnic group. In addition,administrators were asked to indicatethe number and type of degrees grantedin the 2009-2010 academic year,degrees granted by sequence of study,degrees granted by gender, and degreesgranted by racial group. The question-naire also asked about tuition and fees,skills taught in the curricula, facultysize, faculty characteristics, and facultyhiring.
Data were obtained for all of the481 active programs in the population.This is two programs fewer than in2009, when the survey included thelargest number of journalism and masscommunication programs since 1987.That was the first year in which thepopulation for the Annual Survey ofJournalism & Mass CommunicationEnrollments was defined via theNewspaper Fund listing and AEJMCDirectory. Of the 481 returns, 342 werefor programs listed in both directories,92 were only in the AEJMC listing, and47 were only in the Dow Jones Guide.
As in the past, there was great vari-ability in the detail and precision of theinformation administrators provided.Some administrators answered everyquestion, while others answered only afew. Data on degrees offered and onenrollments at the bachelor’s, master’s,and doctoral level were obtained fromall of the 481 programs. Of all theseprograms, 477 offered bachelor’s de-
gree programs, 215 offered master’sdegree programs, and 50 offered doc-toral programs. Data on degrees grant-ed at the undergraduate level wereobtained for 439 of the 477 undergrad-uate programs, or 92.0%. For master’sprograms, the number was 180 of 215,or 83.7%. Forty-six of the 50 doctoralprograms reported number of degreesgranted, or 92.0%.
Data from the program administra-tors that were not obtained online weremanually entered into a data file. Anyinconsistencies in the original docu-ments that were noted were corrected,sometimes by eliminating obviouslyerroneous information. All manualentry of data was then proofed againstthe original form. Reports by programadministrators that were not clearly inerror were taken as accurate. Thesedata were then merged with the onlinedata.
The AEJMC Directory lists mem-bership of the Association of Schools ofJournalism and Mass Communication(ASJMC) and accreditation by theAccrediting Council on Education inJournalism and Mass Communications(ACEJMC). This information wasincluded in the data file. The mostcomplete data were available for the114 accredited programs.2 In general,less complete data were available forthe 80 schools that are members ofASJMC but not accredited by ACEJMC.The 287 schools without accreditationor ASJMC membership had the leastcomplete data. In general, these latterschools are smaller than the accreditedor ASJMC-affiliated schools.
These two characteristics—accred-itation and ASJMC membership—serveas ways of differentiating the 481 jour-nalism and mass communication pro-grams in the population. As was the
JOURNALISM & MASS COMMUNICATION EDUCATOR 302
case in recent years, these two charac-teristics were used in 2010 to makeprojections based on the data reported.Data from the reporting accreditedschools were used to estimate charac-teristics of the accredited schools forwhich there was any missing informa-tion. Similarly, statistical means fromthe nonaccredited ASJMC schoolswere used to estimate missing data forsimilar schools, and data from thenonaccredited schools not affiliatedwith ASJMC were used to estimatemissing data for those programs. Theoverall estimates, then, were based oncomplete information and best approx-imations about data not reported.3
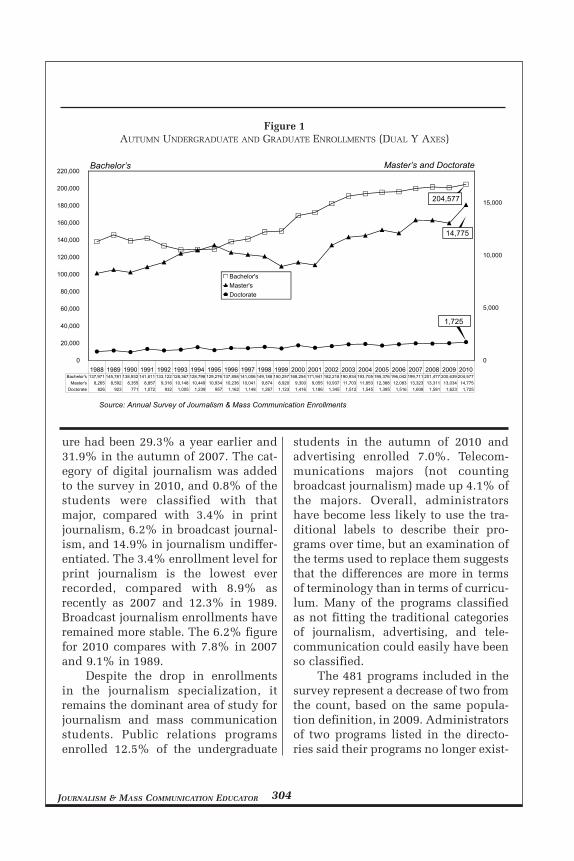
U.S. journalism and mass commu-nication programs enrolled 221,077students in the autumn of 2010, anincrease of 2.7% from a year earlier.The 481 programs had 204,577 stu-dents enrolled at the bachelor’s degreelevel, an increase of 2.0% from theautumn of 2009, and 16,500 studentsseeking a graduate degree. Graduateenrollments were up 12.6% from ayear earlier, with master’s level enroll-ment (14,755) up 13.4% and doctorallevel enrollment (1,725) up 6.3% froma year earlier.
The increase in enrollments inthese journalism and mass communi-cation programs follows two years inwhich enrollments were largely stag-nant. Enrollment had increased 0.8%from the autumn of 2007 to theautumn of 2008 and declined 0.5%from the autumn of 2008 to theautumn of 2009. The rate of growth inenrollments in 2011 was the largestsince enrollments grew by 5.0% from2002 to 2003.
The number of students enrolledas seniors in 2010 was 4.5% more thanin the autumn of 2009, and the numberof juniors was up 1.9% from a year ear-lier. The number of sophomores wasonly 0.1% higher than a year earlier,and the number of students enrolled atthe freshman level was actually flatfrom a year earlier. This suggests thatthe growth in enrollments in 2010might be the exception, with flat en-rollments on the horizon.
It is impossible to know howmany students will transfer into or outof journalism and mass communica-tion programs during the 2011-2012academic year, however, making pre-dictions based on the 2010 enrollmentlevels difficult. Nationally, acrossmajors, enrollments at the undergradu-ate and graduate levels are expected toshow only slight growth for the nextfew years before experiencing moredramatic growth at the middle of thedecade.4 As Figure 1 shows, under-graduate enrollments have grown year-to-year, with the exception of 2009,since 1993. Master’s level enrollmentshave a more uneven pattern of growth.Doctoral enrollments have grownslowly but more consistently acrosstime. The numbers of studentsenrolled in the autumn of 2010 at thebachelor’s, master’s, and doctoral levelwere the largest ever going back to1988, when the current populationdefinition was employed in the enroll-ment survey.
The percentage of enrolled under-graduates who were studying someform of journalism was 25.3 in theautumn of 2010, the lowest level inmore than a decade. In 2009, 28.3% ofthe enrolled undergraduate had aprint, broadcast, or undifferentiatedjournalism specialization, and that fig-
WINTER ’11303
Enrollments
ure had been 29.3% a year earlier and31.9% in the autumn of 2007. The cat-egory of digital journalism was addedto the survey in 2010, and 0.8% of thestudents were classified with thatmajor, compared with 3.4% in printjournalism, 6.2% in broadcast journal-ism, and 14.9% in journalism undiffer-entiated. The 3.4% enrollment level forprint journalism is the lowest everrecorded, compared with 8.9% asrecently as 2007 and 12.3% in 1989.Broadcast journalism enrollments haveremained more stable. The 6.2% figurefor 2010 compares with 7.8% in 2007and 9.1% in 1989.
Despite the drop in enrollmentsin the journalism specialization, itremains the dominant area of study forjournalism and mass communicationstudents. Public relations programsenrolled 12.5% of the undergraduate
students in the autumn of 2010 andadvertising enrolled 7.0%. Telecom-munications majors (not countingbroadcast journalism) made up 4.1% ofthe majors. Overall, administratorshave become less likely to use the tra-ditional labels to describe their pro-grams over time, but an examination ofthe terms used to replace them suggeststhat the differences are more in termsof terminology than in terms of curricu-lum. Many of the programs classifiedas not fitting the traditional categoriesof journalism, advertising, and tele-communication could easily have beenso classified.
The 481 programs included in thesurvey represent a decrease of two fromthe count, based on the same popula-tion definition, in 2009. Administratorsof two programs listed in the directo-ries said their programs no longer exist-
JOURNALISM & MASS COMMUNICATION EDUCATOR 304
Figure 1AUTUMN UNDERGRADUATE AND GRADUATE ENROLLMENTS (DUAL Y AXES)
1988 1989 1990 1991 1992 1993 1994 1995 1996 1997 1998 1999 2000 2001 2002 2003 2004 2005 2006 2007 2008 2009 20100
20,000
40,000
60,000
80,000
100,000
120,000
140,000
160,000
180,000
200,000
220,000
0
5,000
10,000
15,000
Bachelor'sMaster'sDoctorate
Bachelor's 137,971 145,781 138,932 141,811 133,122 128,367 128,798 129,276 137,858 141,006 149,188 150,257 168,254 171,941 182,218 190,934 193,705 195,376 196,042 199,711 201,477 200,639 204,577Master's 8,265 8,592 8,355 8,857 9,316 10,148 10,449 10,934 10,236 10,041 9,874 8,920 9,300 9,055 10,937 11,703 11,853 12,388 12,083 13,323 13,311 13,034 14,775
Doctorate 826 923 771 1,072 932 1,005 1,239 957 1,162 1,148 1,267 1,123 1,416 1,186 1,345 1,512 1,545 1,395 1,516 1,608 1,581 1,623 1,725
F
Source: Annual Survey of Journalism & Mass Communication Enrollments
204,577
14,775
1,725
Bachelor’s Master’s and Doctorate
ed or included journalism and masscommunication programs. Of those481 programs, 477 offer a bachelor’sdegree, down from 478 in 2009, and215 offered a master’s degree, up from210 in 2009. A total of 50 programsindicated they were operating orinvolved in a doctoral program, upfrom 46 a year earlier.
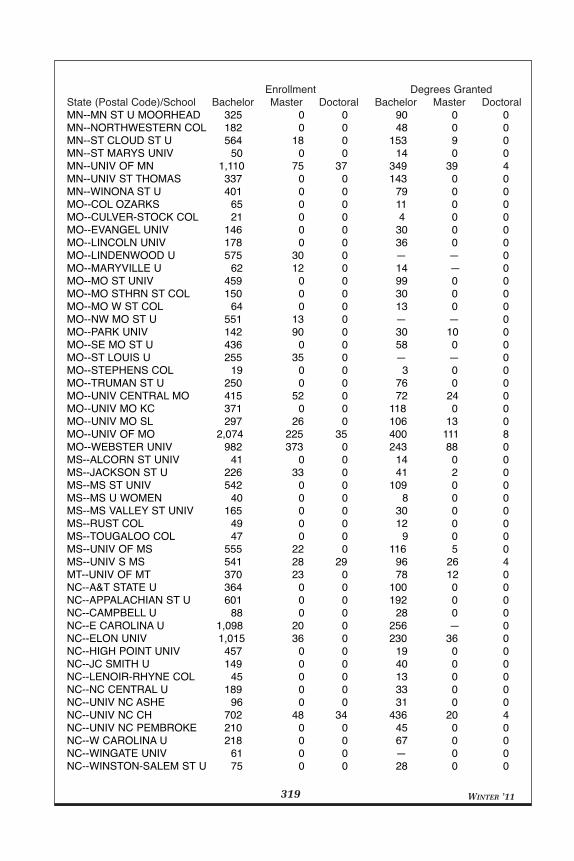
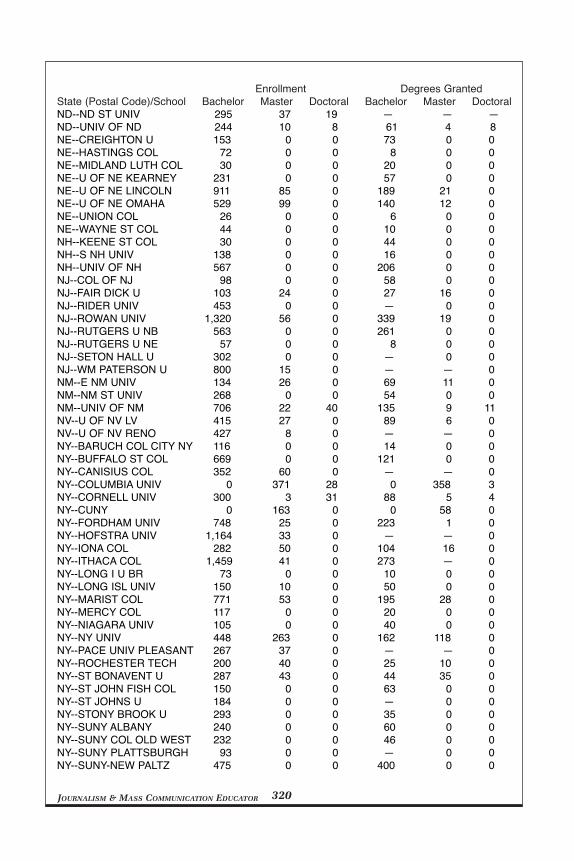
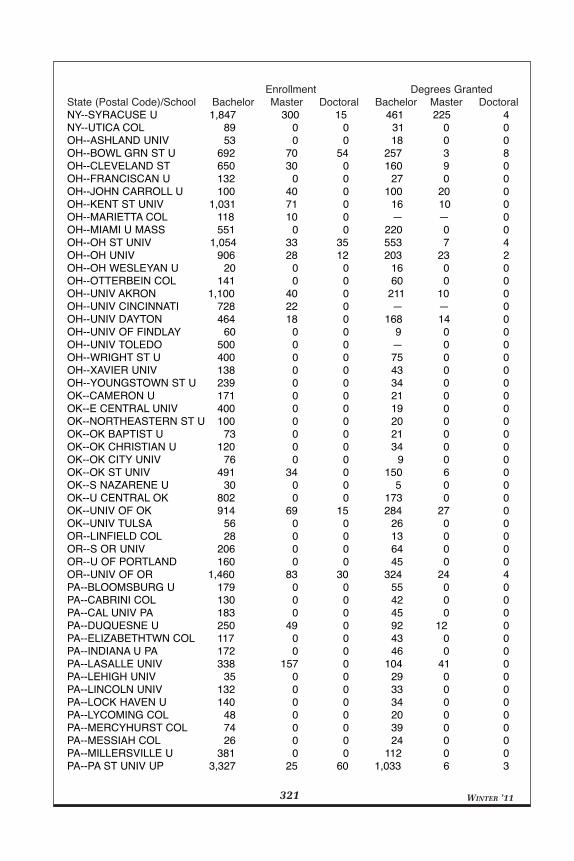
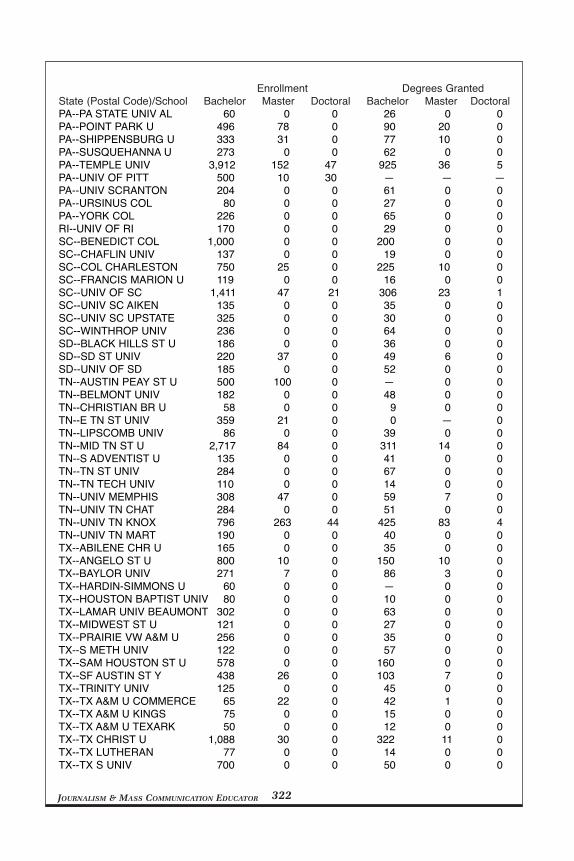
The largest two programs in termsof undergraduate enrollments in theautumn of 2010 were both inPennsylvania. They were TempleUniversity with 3,912 enrolled stu-dents, followed by Pennsylvania StateUniversity with 3,327. The thirdlargest program was Michigan StateUniversity with 2,930 students.Emerson College in Boston had 2,794,putting it in fourth position, followedby Middle Tennessee State Universitywith 2,717 enrolled undergraduates.Filling out the top ten in terms ofundergraduate enrollments were Cali-fornia State University, Fullerton, with2,600 students; University of Alabamawith 2,279; University of Florida with2,193; University of Missouri with2,074; and Ball State University inIndiana with 2,023 students at thebachelor’s level.
Emerson College had the largestnumber of students enrolled in a mas-ter’s level journalism and mass com-munication program with 542, fol-lowed by Northwestern University inIllinois with 450 students, Universityof Sacred Heart in Puerto Rico with400, West Virginia University with400, and American University inWashington with 376. Other top tenmaster’s programs in terms of enroll-ments were at Webster University inMissouri with 373 students, ColumbiaUniversity in New York with 371,Michigan State University with 344,
Syracuse University with 300, andBoston University with 295.
The largest doctoral program wasat Michigan State University, with90 enrolled students, followed byGeorgia State University with 76,Purdue University in Indiana with 75,University of Florida with 72, andPennsylvania State University with 60doctoral students. The University ofTexas at Austin and the University ofWisconsin at Madison share the sixthposition; they both had 55 doctoral stu-dents enrolled in the autumn of 2010.Bowling Green State University had54, Regent University in Virginia had53, and Wayne State University inMichigan and University of Alabamaboth had 52, putting them together intenth position in terms of size of doc-toral programs.
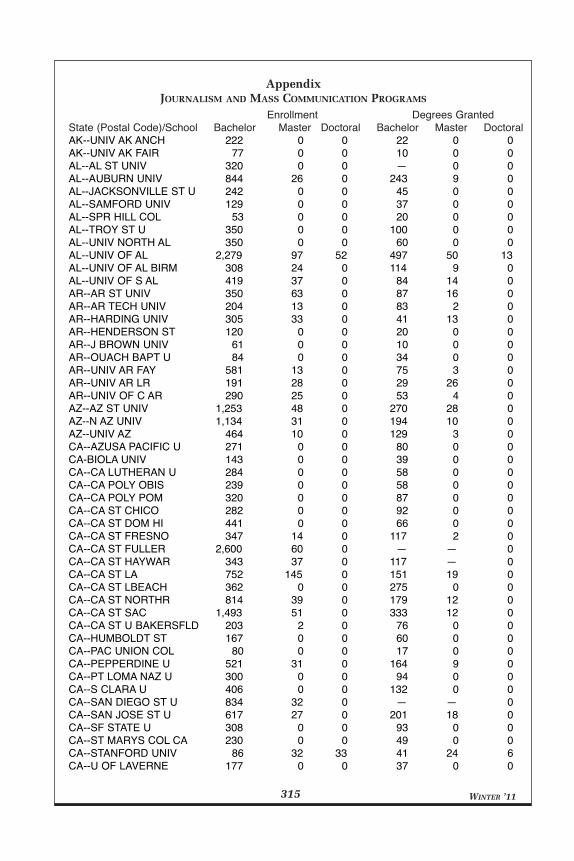
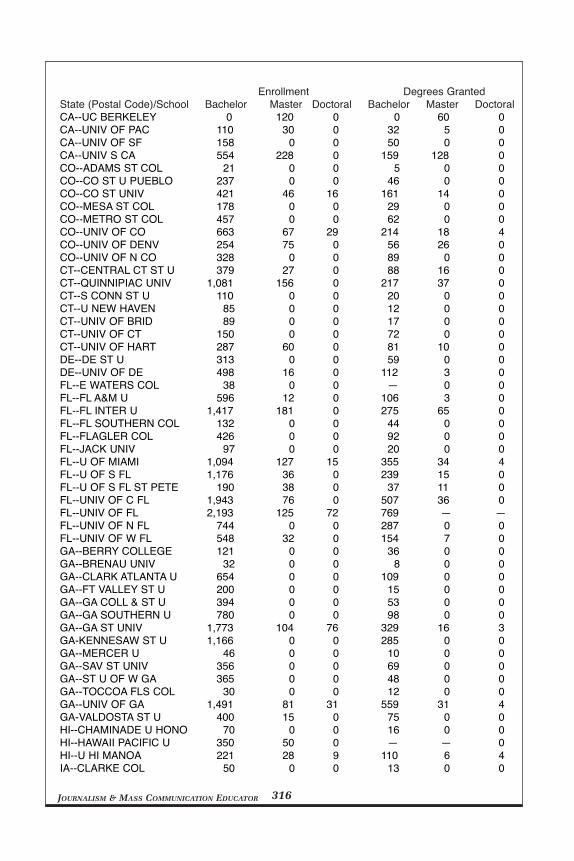
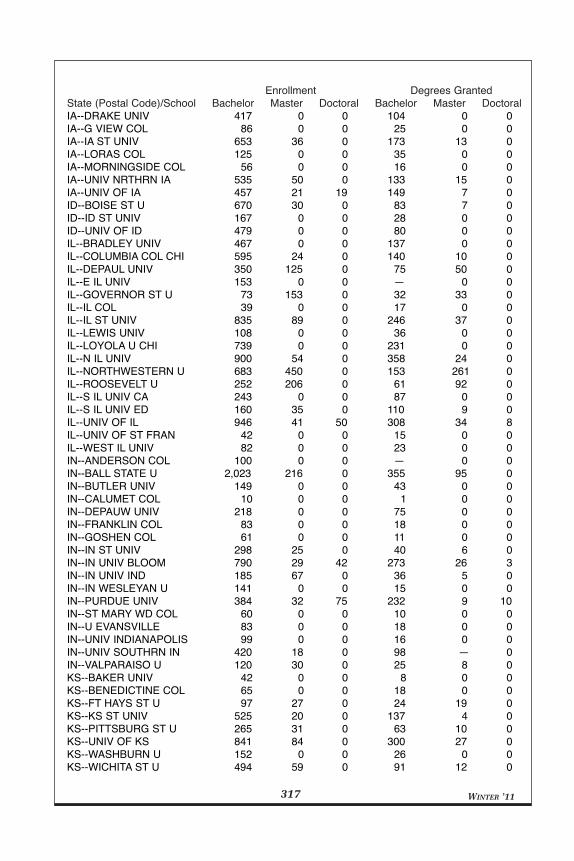
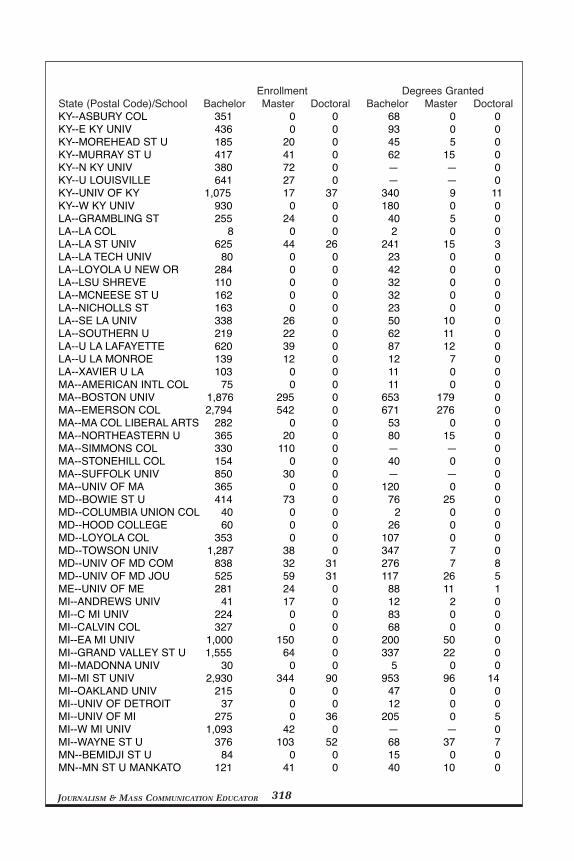
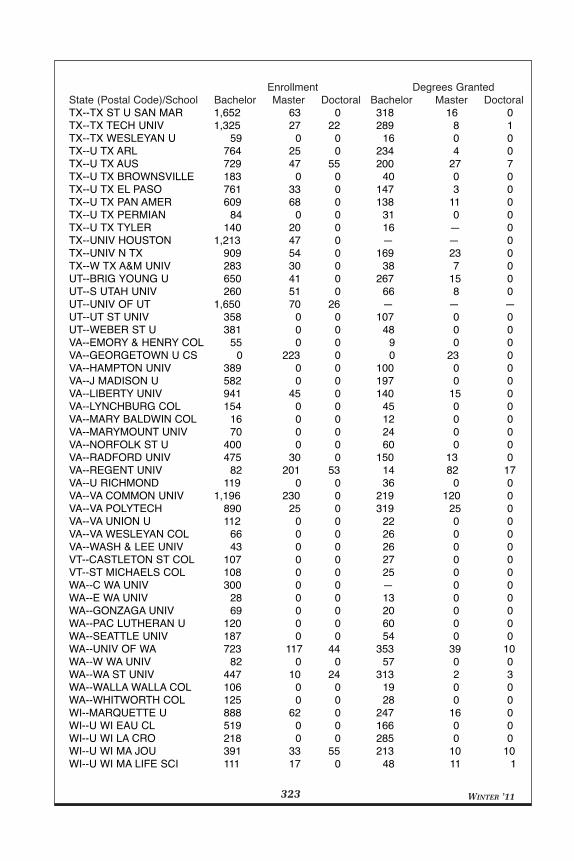
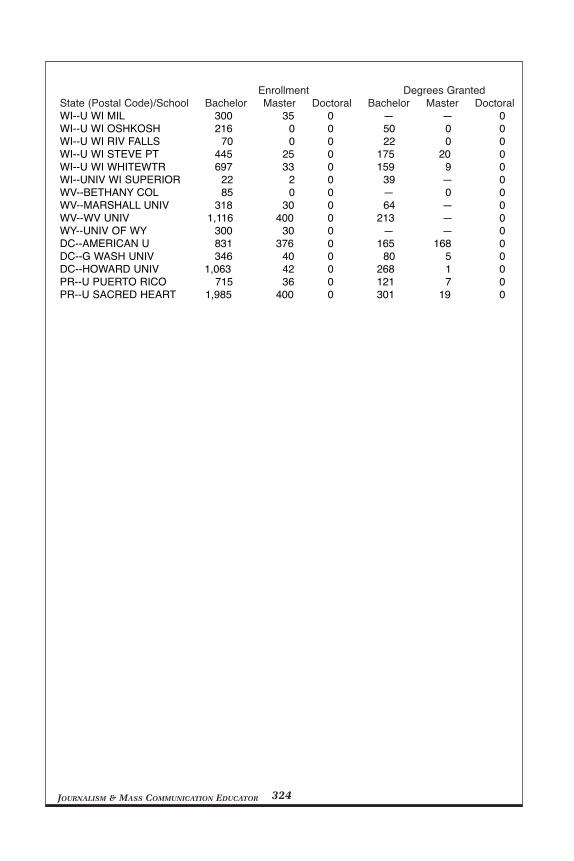
Enrollment figures for all pro-grams included in the survey areshown in the Appendix.
Journalism and mass communica-tion programs in the United Statesgranted 57,242 degrees in academicyear 2009-2010, an increase of 3.0%from the previous year. The number ofbachelor’s degrees granted was 51,553,up 1.4% from a year earlier, while thenumber of master’s degrees stood at5,443, up 20.2% from 2008-2009. Thenumber of doctoral degrees grantedwas down just slightly from the previ-ous year. In 2009-2010, these programsreported granting 246 degrees, down1.6% from the 250 of a year earlier.
The field of journalism and masscommunication continues to be domi-nated by its undergraduate programs,and the degrees granted reflect this. In2009-2010, 90.1% of the degrees grant-
WINTER ’11305
Degrees Granted
ed were at the undergraduate level. Thefigure is down from the year before,when 91.5% of the degrees grantedwere at the undergraduate level. In fact,the ratio in 2009-2010 was the lowest ithas been since 1997-1998, when 89.7%of the degrees granted were at theundergraduate level.
The ranking of programs by num-ber of degrees granted does not alwaysreflect the ranking of enrollmentsbecause many programs do not countstudents as enrolled until they reachthe sophomore or junior level. In 2009-2010, the largest program in terms ofbachelor’s degrees granted wasPennsylvania State University with1,033 bachelor’s degrees granted, fol-lowed by Michigan State Universitywith 953, Temple University with 925,the University of Florida with 769, andEmerson College in Boston with 671.Other schools on the top ten list interms of number of bachelor’s degreesgranted were Boston University with653, the University of Georgia with559, Ohio State University with 553,the University of Central Florida with507, and the University of Alabamawith 497.
The largest master’s degree pro-gram in terms of degrees granted in2009-2010 was Columbia University inNew York with 358 degrees granted.Columbia was followed by EmersonCollege in Boston with 276 master’sdegree recipients, Northwestern Uni-versity in Illinois with 261, SyracuseUniversity with 225, and BostonUniversity with 179. The remainingfive schools on the list were AmericanUniversity in Washington with 168master’s degree granted, the Universityof Southern California with 128,Virginia Commonwealth Universitywith 120, New York University with
118, and the University of Missouri inColumbia with 111.
Regent University in Virginia re-ported the largest number of doctoraldegrees granted among the journalismand mass communication programs,with 17. The next largest programswere at Michigan State University with14 doctoral degrees granted in 2009-2010, the University of Alabama with13, the University of Kentucky with 11,and the University of New Mexico with11. The University of Washington andthe University of Wisconsin Madisonboth granted 10 doctoral degrees in2009-2010. In the number eight slotwas Purdue University with 10. TheUniversity of Missouri at Columbiagranted 8, as did the University ofIllinois, the University of MarylandCommunication Department, the Uni-versity of North Dakota, and BowlingGreen State University.
The number of degrees granted forall programs that reported those dataare shown in the Appendix.
As was explained in the methodol-ogy section of this report, the popula-tion for the Annual Survey of Journ-alism & Mass Communication Enroll-ments is defined by the listing in theDirectory of the Association forEducation in Journalism and MassCommunication and the Dow JonesNews Fund Career Guide. Other uni-versities around the country also grantcommunication degrees. Many of theseare smaller. Many are dominated bycurricula not tied to professional jour-nalism. Many have limited focus on theeducation and training of communica-tion professionals.
One way to monitor these pro-grams is through the IntegratedPostsecondary Education Data System(IPEDS) based on data gathered by the
JOURNALISM & MASS COMMUNICATION EDUCATOR 306
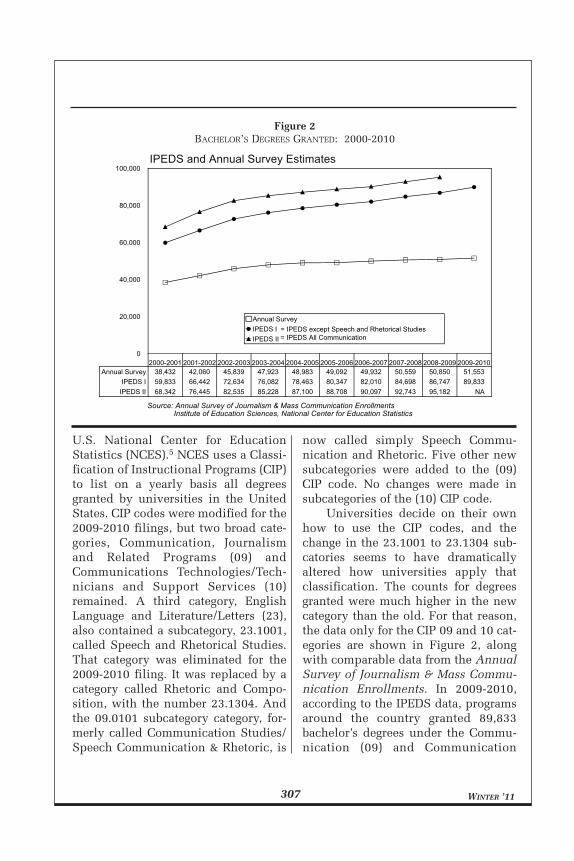
U.S. National Center for EducationStatistics (NCES).5 NCES uses a Classi-fication of Instructional Programs (CIP)to list on a yearly basis all degreesgranted by universities in the UnitedStates. CIP codes were modified for the2009-2010 filings, but two broad cate-gories, Communication, Journalismand Related Programs (09) andCommunications Technologies/Tech-nicians and Support Services (10)remained. A third category, EnglishLanguage and Literature/Letters (23),also contained a subcategory, 23.1001,called Speech and Rhetorical Studies.That category was eliminated for the2009-2010 filing. It was replaced by acategory called Rhetoric and Compo-sition, with the number 23.1304. Andthe 09.0101 subcategory category, for-merly called Communication Studies/Speech Communication & Rhetoric, is
now called simply Speech Commu-nication and Rhetoric. Five other newsubcategories were added to the (09)CIP code. No changes were made insubcategories of the (10) CIP code.
Universities decide on their ownhow to use the CIP codes, and thechange in the 23.1001 to 23.1304 sub-catories seems to have dramaticallyaltered how universities apply thatclassification. The counts for degreesgranted were much higher in the newcategory than the old. For that reason,the data only for the CIP 09 and 10 cat-egories are shown in Figure 2, alongwith comparable data from the AnnualSurvey of Journalism & Mass Commu-nication Enrollments. In 2009-2010,according to the IPEDS data, programsaround the country granted 89,833bachelor’s degrees under the Commu-nication (09) and Communication
WINTER ’11307
Figure 2BACHELOR’S DEGREES GRANTED: 2000-2010
2000-2001 2001-2002 2002-2003 2003-2004 2004-2005 2005-2006 2006-2007 2007-2008 2008-2009 2009-20100
20,000
40,000
60,000
80,000
100,000
Annual SurveyIPEDS IIPEDS II
Annual Survey 38,432 42,060 45,839 47,923 48,983 49,092 49,932 50,559 50,850 51,553IPEDS I 59,833 66,442 72,634 76,082 78,463 80,347 82,010 84,698 86,747 89,833
IPEDS II 68,342 76,445 82,535 85,228 87,100 88,708 90,097 92,743 95,182 NA
Source: Annual Survey of Journalism & Mass Communication Enrollments
= IPEDS except Speech and Rhetorical Studies= IPEDS All Communication
Institute of Education Sciences, National Center for Education Statistics
F
IPEDS and Annual Survey Estimates
Technologies (10) CIP classification.This is an increase of 3.6% from a yearearlier. Some of that growth mightreflect the change in the classificationscheme, but the figure compares with a2.4% growth rate of a year earlier and a3.3% growth rate from 2006-2007 to2007-2008. The growth rate of 3.6%also compares with the 1.4% figure forthe programs included in the AnnualSurvey of Journalism & Mass Commu-nication, indicating, as was true inrecent years, that growth is stronger incommunication studies generally thanin the narrower journalism and masscommunication curricula.
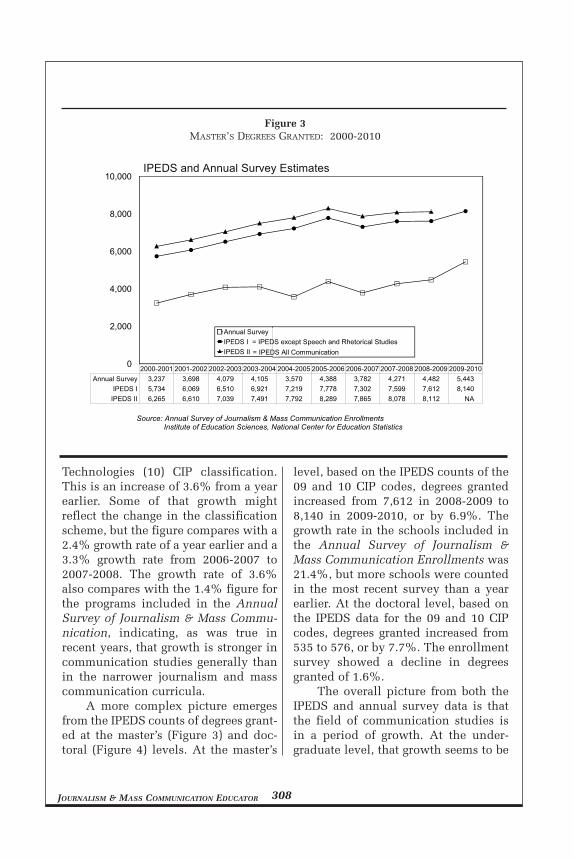
A more complex picture emergesfrom the IPEDS counts of degrees grant-ed at the master’s (Figure 3) and doc-toral (Figure 4) levels. At the master’s
level, based on the IPEDS counts of the09 and 10 CIP codes, degrees grantedincreased from 7,612 in 2008-2009 to8,140 in 2009-2010, or by 6.9%. Thegrowth rate in the schools included inthe Annual Survey of Journalism &Mass Communication Enrollments was21.4%, but more schools were countedin the most recent survey than a yearearlier. At the doctoral level, based onthe IPEDS data for the 09 and 10 CIPcodes, degrees granted increased from535 to 576, or by 7.7%. The enrollmentsurvey showed a decline in degreesgranted of 1.6%.
The overall picture from both theIPEDS and annual survey data is thatthe field of communication studies isin a period of growth. At the under-graduate level, that growth seems to be
JOURNALISM & MASS COMMUNICATION EDUCATOR 308
Figure 3MASTER’S DEGREES GRANTED: 2000-2010
Source: Annual Survey of Journalism & Mass Communication Enrollments
0
2,000
4,000
6,000
8,000
10,000
Annual SurveyIPEDS IIPEDS II
2000-2001 2001-2002 2002-2003 2003-2004 2004-2005 2005-2006 2006-2007 2007-2008 2008-2009 2009-2010Annual Survey 3,237 3,698 4,079 4,105 3,570 4,388 3,782 4,271 4,482 5,443
IPEDS I 5,734 6,069 6,510 6,921 7,219 7,778 7,302 7,599 7,612 8,140IPEDS II 6,265 6,610 7,039 7,491 7,792 8,289 7,865 8,078 8,112 NA
= IPEDS except Speech and Rhetorical Studies= IPEDS All Communication
Institute of Education Sciences, National Center for Education Statistics
F
IPEDS and Annual Survey Estimates
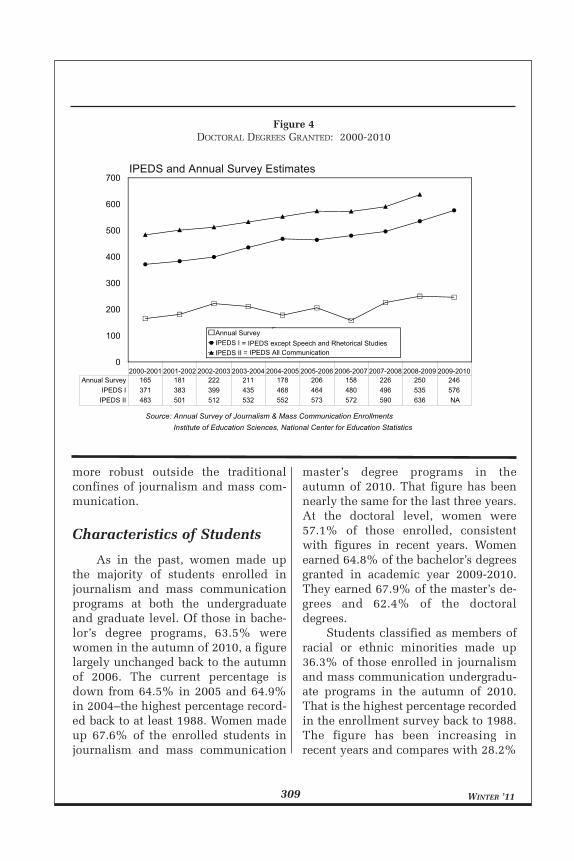
more robust outside the traditionalconfines of journalism and mass com-munication.
As in the past, women made upthe majority of students enrolled injournalism and mass communicationprograms at both the undergraduateand graduate level. Of those in bache-lor’s degree programs, 63.5% werewomen in the autumn of 2010, a figurelargely unchanged back to the autumnof 2006. The current percentage isdown from 64.5% in 2005 and 64.9%in 2004–the highest percentage record-ed back to at least 1988. Women madeup 67.6% of the enrolled students injournalism and mass communication
master’s degree programs in theautumn of 2010. That figure has beennearly the same for the last three years.At the doctoral level, women were57.1% of those enrolled, consistentwith figures in recent years. Womenearned 64.8% of the bachelor’s degreesgranted in academic year 2009-2010.They earned 67.9% of the master’s de-grees and 62.4% of the doctoraldegrees.
Students classified as members ofracial or ethnic minorities made up36.3% of those enrolled in journalismand mass communication undergradu-ate programs in the autumn of 2010.That is the highest percentage recordedin the enrollment survey back to 1988.The figure has been increasing inrecent years and compares with 28.2%
WINTER ’11309
Figure 4DOCTORAL DEGREES GRANTED: 2000-2010
Characteristics of Students
2000-2001 2001-2002 2002-2003 2003-2004 2004-2005 2005-2006 2006-2007 2007-2008 2008-2009 2009-20100
100
200
300
400
500
600
700
Annual SurveyIPEDS IIPEDS II
Annual Survey 165 181 222 211 178 206 158 226 250 246IPEDS I 371 383 399 435 468 464 480 496 535 576
IPEDS II 483 501 512 532 552 573 572 590 636 NA
Source: Annual Survey of Journalism & Mass Communication Enrollments
= IPEDS except Speech and Rhetorical Studies= IPEDS All Communication
Institute of Education Sciences, National Center for Education Statistics
F
IPEDS and Annual Survey Estimates
as recently as 2007. Hispanics made up10.4% of the enrolled students, anincrease from 7.0% a year earlier, andAfrican Americans made up 14.5% ofthe enrolled students, down from the15.4% of a year earlier but up from13.4% in 2008 and 11.9% in 2007.Included in the figure for minority stu-dents are international students, whoonly made up 1.5% of those enrolled injournalism and mass communicationbachelor’s degree programs.
At the master’s level, students clas-sified as members of racial and ethnicminorities made up 42.6% of enrolledstudents, compared with 41.6% record-ed a year earlier. The 2010 figure is thehighest ever recorded in the enrollmentsurvey. Hispanic students were 7.4% ofthose enrolled, and African-Americanstudents were 11.3%. International stu-dents accounted for 11.7% of the en-rolled students, up from 10.0% a yearearlier.
At the doctoral level, 43.2% of theenrolled students were members ofracial or ethnic minorities. That figureis actually down from a year earlier,when 46.8% of the students in doctor-al programs were so classified. Theminority classification also includes24.5% international students. Hispanicstudents were only 3.2% of the en-rolled students, a figure nearly identi-cal with that of a year earlier, andAfrican-American students were 4.9%,down from 7.2% a year earlier.
Of bachelor’s degrees granted injournalism and mass communicationprograms in academic year 2009-2010,27.8% were to members of racial andethnic minorities. That figure was near-ly the same last year, when it was thehighest previously recorded in theenrollment survey. At the master’slevel, 38.3% of the degrees granted
were to racial or ethnic minorities.That figure is lower than a year earlier,when the highest figure had beenrecorded. The change is due largely toa drop in degrees granted to interna-tional students. At the doctoral level,45.1% of the degrees granted were toracial or ethnic minorities, againincluding international students. Thatfigure also is a drop from a year earlier,due in part to a decline in the numberof international students receiving doc-toral degrees.
The number of full-time facultymembers teaching in journalism andmass communication programs in theautumn of 2010 stood at 7,149, up from6,725 a year earlier. The number ofpart-time faculty in the autumn of 2010was 5,162, up from 4,820 a year earlier.The growth in faculty for the 2010-2011 academic year followed declinesboth in full-time and part-time facultyin 2009-2010 from the year before.The number of part-time faculty alsodeclined in 2008-2009, and in 2007-2008, and the 5,162 figure is still belowthe 5,360 figure for 2006-2007.
Journalism and mass communica-tion programs were less likely to reportthey were under a faculty hiring freezein academic year 2010-2011 than a yearearlier. In the autumn of 2010, 24.2% ofthe programs reported they were undera faculty hiring freeze, compared with29.1% a year earlier.
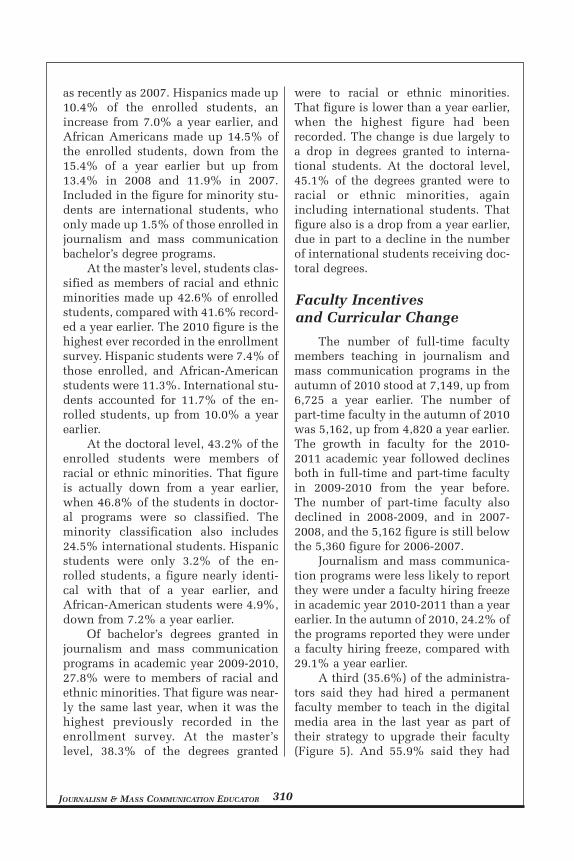
A third (35.6%) of the administra-tors said they had hired a permanentfaculty member to teach in the digitalmedia area in the last year as part oftheir strategy to upgrade their faculty(Figure 5). And 55.9% said they had
JOURNALISM & MASS COMMUNICATION EDUCATOR 310
Faculty Incentivesand Curricular Change
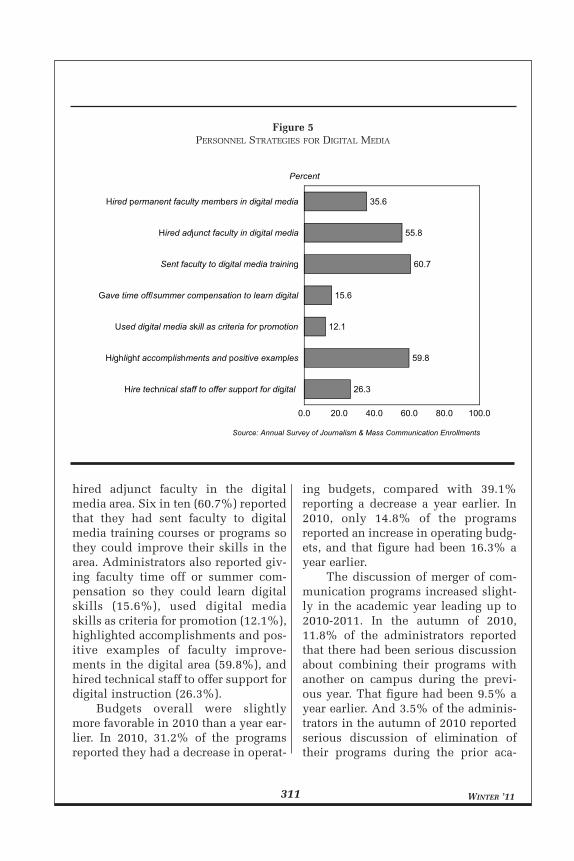
hired adjunct faculty in the digitalmedia area. Six in ten (60.7%) reportedthat they had sent faculty to digitalmedia training courses or programs sothey could improve their skills in thearea. Administrators also reported giv-ing faculty time off or summer com-pensation so they could learn digitalskills (15.6%), used digital mediaskills as criteria for promotion (12.1%),highlighted accomplishments and pos-itive examples of faculty improve-ments in the digital area (59.8%), andhired technical staff to offer support fordigital instruction (26.3%).
Budgets overall were slightlymore favorable in 2010 than a year ear-lier. In 2010, 31.2% of the programsreported they had a decrease in operat-
ing budgets, compared with 39.1%reporting a decrease a year earlier. In2010, only 14.8% of the programsreported an increase in operating budg-ets, and that figure had been 16.3% ayear earlier.
The discussion of merger of com-munication programs increased slight-ly in the academic year leading up to2010-2011. In the autumn of 2010,11.8% of the administrators reportedthat there had been serious discussionabout combining their programs withanother on campus during the previ-ous year. That figure had been 9.5% ayear earlier. And 3.5% of the adminis-trators in the autumn of 2010 reportedserious discussion of elimination oftheir programs during the prior aca-
WINTER ’11311
Figure 5PERSONNEL STRATEGIES FOR DIGITAL MEDIA
Source: Annual Survey of Journalism & Mass Communication Enrollments
35.6
55.8
60.7
15.6
12.1
59.8
26.3
Hired permanent faculty members in digital media
Hired adjunct faculty in digital media
Sent faculty to digital media training
Gave time off/summer compensation to learn digital
Used digital media skill as criteria for promotion
Highlight accomplishments and positive examples
Hire technical staff to offer support for digital
0.0 20.0 40.0 60.0 80.0 100.0
Percent
demic year, compared with 2.1% a yearearlier.
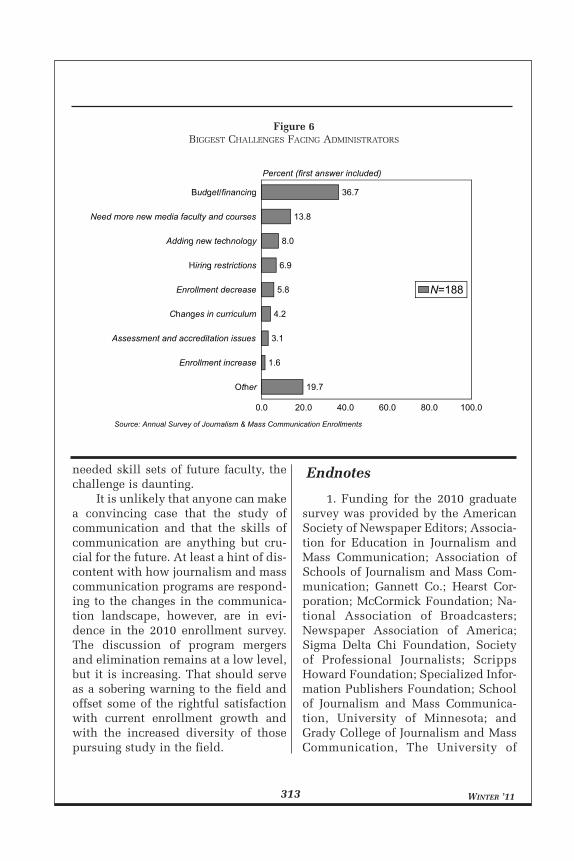
The 2010 enrollment survey askedadministrators to indicate the biggestchallenges facing their unit today orthe issues that they are grapplingwith most intensively. Of those whoresponded, nine in ten said they werefacing big challenges and issues. Andof those, budget issues were the mostoften mentioned (Figure 6)—by 36.7%of those listing a challenge or problem.New faculty and courses were listed asa need by 13.8% of those responding,and the need for new technology waslisted by 8.0%. Hiring, enrollmentdeclines, changes in curricula, assess-ment, and enrollment increases alsowere mentioned.
Enrollments in journalism andmass communication programs seemlikely to continue to grow in futureyears. The overall pattern is of growthgoing back for a decade and a half, anduniversity enrollments across the boardare expected to grow in the nextdecade. A cautionary note is that fresh-man and sophomore enrollments werestatic in 2010 compared with a yearearlier, suggesting that growth in theshort term is likely to depend on trans-fers into the field at the upper divisionlevels. Also of note is the decrease ininterest on the part of enrolled studentsin the journalism specialization. Thisis the historical heart of the field.Growth is likely to be dependent on arevitalization of interest in journalismwithin some different curriculum andcontinued expansion of curricularoffers outside the journalism core.
Graduate enrollment in the field,dominated by enrollment at the mas-
ter’s level, has had an erratic pattern ofgrowth over the last decade. The dra-matic growth in the autumn of 2010compared with a year earlier is unlike-ly to be repeated if past growth patternsare to be the guide. The economydrives graduate enrollments acrossfields, as many who cannot find jobsafter undergraduate studies stay inschool and others who lost jobs orfound them unfulfilling return foradvanced degrees. And it is difficult toguess at this writing what the economyis going to do in the next months.Across fields, graduate enrollments areexpected to continue to grow across thedecade.
One of the most encouragingfindings of the 2010 enrollment surveyis the growth in enrollments of stu-dents classified as members of racialor ethnic minority groups. These stu-dents made up a larger percentage ofenrolled students in journalism andmass communication programs inthe autumn of 2010 than at any point inthe history of the field. At the under-graduate level, 36.3% of the studentswere classified as racial or ethnicminorities.
Administrators of journalism andmass communication programs report-ed that they are engaging in a numberof strategies to update the skills oftheir faculties to deal with digitalmedia, from sending them to trainingprograms to hiring permanent andadjunct professors with those skills.Certainly the biggest long-term chal-lenge facing these administrators isadaptation of their curricula to theevolving labor market and to the needsof society generally. In a time when hir-ing is constrained by static or decliningbudgets, when faculties are aging, andwhen no one is really certain of the
JOURNALISM & MASS COMMUNICATION EDUCATOR 312
Concluding Comments
needed skill sets of future faculty, thechallenge is daunting.
It is unlikely that anyone can makea convincing case that the study ofcommunication and that the skills ofcommunication are anything but cru-cial for the future. At least a hint of dis-content with how journalism and masscommunication programs are respond-ing to the changes in the communica-tion landscape, however, are in evi-dence in the 2010 enrollment survey.The discussion of program mergersand elimination remains at a low level,but it is increasing. That should serveas a sobering warning to the field andoffset some of the rightful satisfactionwith current enrollment growth andwith the increased diversity of thosepursuing study in the field.
1. Funding for the 2010 graduatesurvey was provided by the AmericanSociety of Newspaper Editors; Associa-tion for Education in Journalism andMass Communication; Association ofSchools of Journalism and Mass Com-munication; Gannett Co.; Hearst Cor-poration; McCormick Foundation; Na-tional Association of Broadcasters;Newspaper Association of America;Sigma Delta Chi Foundation, Societyof Professional Journalists; ScrippsHoward Foundation; Specialized Infor-mation Publishers Foundation; Schoolof Journalism and Mass Communica-tion, University of Minnesota; andGrady College of Journalism and MassCommunication, The University of
WINTER ’11313
Figure 6BIGGEST CHALLENGES FACING ADMINISTRATORS
Source: Annual Survey of Journalism & Mass Communication Enrollments
36.7
13.8
8.0
6.9
5.8
4.2
3.1
1.6
19.7
Budget/financing
Need more new media faculty and courses
Adding new technology
Hiring restrictions
Enrollment decrease
Changes in curriculum
Assessment and accreditation issues
Enrollment increase
Other
0.0 20.0 40.0 60.0 80.0 100.0
N=188
Percent (first answer included)
Endnotes
Georgia.2. Indiana University’s School of
Journalism and the journalism programat the Indianapolis Campus of IU aretreated as separate programs in thisanalysis, though they share accredita-tion.
3. Special thanks are given to thefollowing University of Georgia stu-dents who worked on the 2010 gradu-ate survey: Graduate Research Assis-tants Daphne Burden, Paris Desnoes,Genevieve di Leonardo, Konrad Kal-pen, and Chelsea Toledo; and Under-graduate Research Clerks John Cop-ponex, Rachel Donovan, CatherineDeroth, Abby Engelberth, AliciaHarrell, Jordan Herin, Christian Peña,
and Megan Swanson.4. National Center for Education
Statistics, Projections of EducationStatistics to 2019, Tables 27 and 28,2011, available at http://nces.ed.gov/edstats.
5. The completion of all IPEDSsurveys is mandatory for all institu-tions that participate in or are appli-cants for participation in any federalfinancial assistance program author-ized by Title IV of the Higher Educa-tion Act of 1965, as amended. The com-pletion of the surveys is mandatedby 20 U.S.C. 1094, Section 487(a)(17).Title IV covers the administration ofthe federal student financial aid pro-grams.
JOURNALISM & MASS COMMUNICATION EDUCATOR 314
WINTER ’11315
AppendixJOURNALISM AND MASS COMMUNICATION PROGRAMS
Enrollment Degrees GrantedState (Postal Code)/School Bachelor Master Doctoral Bachelor Master DoctoralAK--UNIV AK ANCH 222 0 0 22 0 0AK--UNIV AK FAIR 77 0 0 10 0 0AL--AL ST UNIV 320 0 0 — 0 0AL--AUBURN UNIV 844 26 0 243 9 0AL--JACKSONVILLE ST U 242 0 0 45 0 0AL--SAMFORD UNIV 129 0 0 37 0 0AL--SPR HILL COL 53 0 0 20 0 0AL--TROY ST U 350 0 0 100 0 0AL--UNIV NORTH AL 350 0 0 60 0 0AL--UNIV OF AL 2,279 97 52 497 50 13AL--UNIV OF AL BIRM 308 24 0 114 9 0AL--UNIV OF S AL 419 37 0 84 14 0AR--AR ST UNIV 350 63 0 87 16 0AR--AR TECH UNIV 204 13 0 83 2 0AR--HARDING UNIV 305 33 0 41 13 0AR--HENDERSON ST 120 0 0 20 0 0AR--J BROWN UNIV 61 0 0 10 0 0AR--OUACH BAPT U 84 0 0 34 0 0AR--UNIV AR FAY 581 13 0 75 3 0AR--UNIV AR LR 191 28 0 29 26 0AR--UNIV OF C AR 290 25 0 53 4 0AZ--AZ ST UNIV 1,253 48 0 270 28 0AZ--N AZ UNIV 1,134 31 0 194 10 0AZ--UNIV AZ 464 10 0 129 3 0CA--AZUSA PACIFIC U 271 0 0 80 0 0CA-BIOLA UNIV 143 0 0 39 0 0CA--CA LUTHERAN U 284 0 0 58 0 0CA--CA POLY OBIS 239 0 0 58 0 0CA--CA POLY POM 320 0 0 87 0 0CA--CA ST CHICO 282 0 0 92 0 0CA--CA ST DOM HI 441 0 0 66 0 0CA--CA ST FRESNO 347 14 0 117 2 0CA--CA ST FULLER 2,600 60 0 — — 0CA--CA ST HAYWAR 343 37 0 117 — 0CA--CA ST LA 752 145 0 151 19 0CA--CA ST LBEACH 362 0 0 275 0 0CA--CA ST NORTHR 814 39 0 179 12 0CA--CA ST SAC 1,493 51 0 333 12 0CA--CA ST U BAKERSFLD 203 2 0 76 0 0CA--HUMBOLDT ST 167 0 0 60 0 0CA--PAC UNION COL 80 0 0 17 0 0CA--PEPPERDINE U 521 31 0 164 9 0CA--PT LOMA NAZ U 300 0 0 94 0 0CA--S CLARA U 406 0 0 132 0 0CA--SAN DIEGO ST U 834 32 0 — — 0CA--SAN JOSE ST U 617 27 0 201 18 0CA--SF STATE U 308 0 0 93 0 0CA--ST MARYS COL CA 230 0 0 49 0 0CA--STANFORD UNIV 86 32 33 41 24 6CA--U OF LAVERNE 177 0 0 37 0 0
JOURNALISM & MASS COMMUNICATION EDUCATOR 316
Enrollment Degrees GrantedState (Postal Code)/School Bachelor Master Doctoral Bachelor Master DoctoralCA--UC BERKELEY 0 120 0 0 60 0CA--UNIV OF PAC 110 30 0 32 5 0CA--UNIV OF SF 158 0 0 50 0 0CA--UNIV S CA 554 228 0 159 128 0CO--ADAMS ST COL 21 0 0 5 0 0CO--CO ST U PUEBLO 237 0 0 46 0 0CO--CO ST UNIV 421 46 16 161 14 0CO--MESA ST COL 178 0 0 29 0 0CO--METRO ST COL 457 0 0 62 0 0CO--UNIV OF CO 663 67 29 214 18 4CO--UNIV OF DENV 254 75 0 56 26 0CO--UNIV OF N CO 328 0 0 89 0 0CT--CENTRAL CT ST U 379 27 0 88 16 0CT--QUINNIPIAC UNIV 1,081 156 0 217 37 0CT--S CONN ST U 110 0 0 20 0 0CT--U NEW HAVEN 85 0 0 12 0 0CT--UNIV OF BRID 89 0 0 17 0 0CT--UNIV OF CT 150 0 0 72 0 0CT--UNIV OF HART 287 60 0 81 10 0DE--DE ST U 313 0 0 59 0 0DE--UNIV OF DE 498 16 0 112 3 0FL--E WATERS COL 38 0 0 — 0 0FL--FL A&M U 596 12 0 106 3 0FL--FL INTER U 1,417 181 0 275 65 0FL--FL SOUTHERN COL 132 0 0 44 0 0FL--FLAGLER COL 426 0 0 92 0 0FL--JACK UNIV 97 0 0 20 0 0FL--U OF MIAMI 1,094 127 15 355 34 4FL--U OF S FL 1,176 36 0 239 15 0FL--U OF S FL ST PETE 190 38 0 37 11 0FL--UNIV OF C FL 1,943 76 0 507 36 0FL--UNIV OF FL 2,193 125 72 769 — —FL--UNIV OF N FL 744 0 0 287 0 0FL--UNIV OF W FL 548 32 0 154 7 0GA--BERRY COLLEGE 121 0 0 36 0 0GA--BRENAU UNIV 32 0 0 8 0 0GA--CLARK ATLANTA U 654 0 0 109 0 0GA--FT VALLEY ST U 200 0 0 15 0 0GA--GA COLL & ST U 394 0 0 53 0 0GA--GA SOUTHERN U 780 0 0 98 0 0GA--GA ST UNIV 1,773 104 76 329 16 3GA-KENNESAW ST U 1,166 0 0 285 0 0GA--MERCER U 46 0 0 10 0 0GA--SAV ST UNIV 356 0 0 69 0 0GA--ST U OF W GA 365 0 0 48 0 0GA--TOCCOA FLS COL 30 0 0 12 0 0GA--UNIV OF GA 1,491 81 31 559 31 4GA-VALDOSTA ST U 400 15 0 75 0 0HI--CHAMINADE U HONO 70 0 0 16 0 0HI--HAWAII PACIFIC U 350 50 0 — — 0HI--U HI MANOA 221 28 9 110 6 4IA--CLARKE COL 50 0 0 13 0 0
WINTER ’11317
Enrollment Degrees GrantedState (Postal Code)/School Bachelor Master Doctoral Bachelor Master DoctoralIA--DRAKE UNIV 417 0 0 104 0 0IA--G VIEW COL 86 0 0 25 0 0IA--IA ST UNIV 653 36 0 173 13 0IA--LORAS COL 125 0 0 35 0 0IA--MORNINGSIDE COL 56 0 0 16 0 0IA--UNIV NRTHRN IA 535 50 0 133 15 0IA--UNIV OF IA 457 21 19 149 7 0ID--BOISE ST U 670 30 0 83 7 0ID--ID ST UNIV 167 0 0 28 0 0ID--UNIV OF ID 479 0 0 80 0 0IL--BRADLEY UNIV 467 0 0 137 0 0IL--COLUMBIA COL CHI 595 24 0 140 10 0IL--DEPAUL UNIV 350 125 0 75 50 0IL--E IL UNIV 153 0 0 — 0 0IL--GOVERNOR ST U 73 153 0 32 33 0IL--IL COL 39 0 0 17 0 0IL--IL ST UNIV 835 89 0 246 37 0IL--LEWIS UNIV 108 0 0 36 0 0IL--LOYOLA U CHI 739 0 0 231 0 0IL--N IL UNIV 900 54 0 358 24 0IL--NORTHWESTERN U 683 450 0 153 261 0IL--ROOSEVELT U 252 206 0 61 92 0IL--S IL UNIV CA 243 0 0 87 0 0IL--S IL UNIV ED 160 35 0 110 9 0IL--UNIV OF IL 946 41 50 308 34 8IL--UNIV OF ST FRAN 42 0 0 15 0 0IL--WEST IL UNIV 82 0 0 23 0 0IN--ANDERSON COL 100 0 0 — 0 0IN--BALL STATE U 2,023 216 0 355 95 0IN--BUTLER UNIV 149 0 0 43 0 0IN--CALUMET COL 10 0 0 1 0 0IN--DEPAUW UNIV 218 0 0 75 0 0IN--FRANKLIN COL 83 0 0 18 0 0IN--GOSHEN COL 61 0 0 11 0 0IN--IN ST UNIV 298 25 0 40 6 0IN--IN UNIV BLOOM 790 29 42 273 26 3IN--IN UNIV IND 185 67 0 36 5 0IN--IN WESLEYAN U 141 0 0 15 0 0IN--PURDUE UNIV 384 32 75 232 9 10IN--ST MARY WD COL 60 0 0 10 0 0IN--U EVANSVILLE 83 0 0 18 0 0IN--UNIV INDIANAPOLIS 99 0 0 16 0 0IN--UNIV SOUTHRN IN 420 18 0 98 — 0IN--VALPARAISO U 120 30 0 25 8 0KS--BAKER UNIV 42 0 0 8 0 0KS--BENEDICTINE COL 65 0 0 18 0 0KS--FT HAYS ST U 97 27 0 24 19 0KS--KS ST UNIV 525 20 0 137 4 0KS--PITTSBURG ST U 265 31 0 63 10 0KS--UNIV OF KS 841 84 0 300 27 0KS--WASHBURN U 152 0 0 26 0 0KS--WICHITA ST U 494 59 0 91 12 0
JOURNALISM & MASS COMMUNICATION EDUCATOR 318
Enrollment Degrees GrantedState (Postal Code)/School Bachelor Master Doctoral Bachelor Master DoctoralKY--ASBURY COL 351 0 0 68 0 0KY--E KY UNIV 436 0 0 93 0 0KY--MOREHEAD ST U 185 20 0 45 5 0KY--MURRAY ST U 417 41 0 62 15 0KY--N KY UNIV 380 72 0 — — 0KY--U LOUISVILLE 641 27 0 — — 0KY--UNIV OF KY 1,075 17 37 340 9 11KY--W KY UNIV 930 0 0 180 0 0LA--GRAMBLING ST 255 24 0 40 5 0LA--LA COL 8 0 0 2 0 0LA--LA ST UNIV 625 44 26 241 15 3LA--LA TECH UNIV 80 0 0 23 0 0LA--LOYOLA U NEW OR 284 0 0 42 0 0LA--LSU SHREVE 110 0 0 32 0 0LA--MCNEESE ST U 162 0 0 32 0 0LA--NICHOLLS ST 163 0 0 23 0 0LA--SE LA UNIV 338 26 0 50 10 0LA--SOUTHERN U 219 22 0 62 11 0LA--U LA LAFAYETTE 620 39 0 87 12 0LA--U LA MONROE 139 12 0 12 7 0LA--XAVIER U LA 103 0 0 11 0 0MA--AMERICAN INTL COL 75 0 0 11 0 0MA--BOSTON UNIV 1,876 295 0 653 179 0MA--EMERSON COL 2,794 542 0 671 276 0MA--MA COL LIBERAL ARTS 282 0 0 53 0 0MA--NORTHEASTERN U 365 20 0 80 15 0MA--SIMMONS COL 330 110 0 — — 0MA--STONEHILL COL 154 0 0 40 0 0MA--SUFFOLK UNIV 850 30 0 — — 0MA--UNIV OF MA 365 0 0 120 0 0MD--BOWIE ST U 414 73 0 76 25 0MD--COLUMBIA UNION COL 40 0 0 2 0 0MD--HOOD COLLEGE 60 0 0 26 0 0MD--LOYOLA COL 353 0 0 107 0 0MD--TOWSON UNIV 1,287 38 0 347 7 0MD--UNIV OF MD COM 838 32 31 276 7 8MD--UNIV OF MD JOU 525 59 31 117 26 5ME--UNIV OF ME 281 24 0 88 11 1MI--ANDREWS UNIV 41 17 0 12 2 0MI--C MI UNIV 224 0 0 83 0 0MI--CALVIN COL 327 0 0 68 0 0MI--EA MI UNIV 1,000 150 0 200 50 0MI--GRAND VALLEY ST U 1,555 64 0 337 22 0MI--MADONNA UNIV 30 0 0 5 0 0MI--MI ST UNIV 2,930 344 90 953 96 14MI--OAKLAND UNIV 215 0 0 47 0 0MI--UNIV OF DETROIT 37 0 0 12 0 0MI--UNIV OF MI 275 0 36 205 0 5MI--W MI UNIV 1,093 42 0 — — 0MI--WAYNE ST U 376 103 52 68 37 7MN--BEMIDJI ST U 84 0 0 15 0 0MN--MN ST U MANKATO 121 41 0 40 10 0
WINTER ’11319
Enrollment Degrees GrantedState (Postal Code)/School Bachelor Master Doctoral Bachelor Master DoctoralMN--MN ST U MOORHEAD 325 0 0 90 0 0MN--NORTHWESTERN COL 182 0 0 48 0 0MN--ST CLOUD ST U 564 18 0 153 9 0MN--ST MARYS UNIV 50 0 0 14 0 0MN--UNIV OF MN 1,110 75 37 349 39 4MN--UNIV ST THOMAS 337 0 0 143 0 0MN--WINONA ST U 401 0 0 79 0 0MO--COL OZARKS 65 0 0 11 0 0MO--CULVER-STOCK COL 21 0 0 4 0 0MO--EVANGEL UNIV 146 0 0 30 0 0MO--LINCOLN UNIV 178 0 0 36 0 0MO--LINDENWOOD U 575 30 0 — — 0MO--MARYVILLE U 62 12 0 14 — 0MO--MO ST UNIV 459 0 0 99 0 0MO--MO STHRN ST COL 150 0 0 30 0 0MO--MO W ST COL 64 0 0 13 0 0MO--NW MO ST U 551 13 0 — — 0MO--PARK UNIV 142 90 0 30 10 0MO--SE MO ST U 436 0 0 58 0 0MO--ST LOUIS U 255 35 0 — — 0MO--STEPHENS COL 19 0 0 3 0 0MO--TRUMAN ST U 250 0 0 76 0 0MO--UNIV CENTRAL MO 415 52 0 72 24 0MO--UNIV MO KC 371 0 0 118 0 0MO--UNIV MO SL 297 26 0 106 13 0MO--UNIV OF MO 2,074 225 35 400 111 8MO--WEBSTER UNIV 982 373 0 243 88 0MS--ALCORN ST UNIV 41 0 0 14 0 0MS--JACKSON ST U 226 33 0 41 2 0MS--MS ST UNIV 542 0 0 109 0 0MS--MS U WOMEN 40 0 0 8 0 0MS--MS VALLEY ST UNIV 165 0 0 30 0 0MS--RUST COL 49 0 0 12 0 0MS--TOUGALOO COL 47 0 0 9 0 0MS--UNIV OF MS 555 22 0 116 5 0MS--UNIV S MS 541 28 29 96 26 4MT--UNIV OF MT 370 23 0 78 12 0NC--A&T STATE U 364 0 0 100 0 0NC--APPALACHIAN ST U 601 0 0 192 0 0NC--CAMPBELL U 88 0 0 28 0 0NC--E CAROLINA U 1,098 20 0 256 — 0NC--ELON UNIV 1,015 36 0 230 36 0NC--HIGH POINT UNIV 457 0 0 19 0 0NC--JC SMITH U 149 0 0 40 0 0NC--LENOIR-RHYNE COL 45 0 0 13 0 0NC--NC CENTRAL U 189 0 0 33 0 0NC--UNIV NC ASHE 96 0 0 31 0 0NC--UNIV NC CH 702 48 34 436 20 4NC--UNIV NC PEMBROKE 210 0 0 45 0 0NC--W CAROLINA U 218 0 0 67 0 0NC--WINGATE UNIV 61 0 0 — 0 0NC--WINSTON-SALEM ST U 75 0 0 28 0 0
JOURNALISM & MASS COMMUNICATION EDUCATOR 320
Enrollment Degrees GrantedState (Postal Code)/School Bachelor Master Doctoral Bachelor Master DoctoralND--ND ST UNIV 295 37 19 — — —ND--UNIV OF ND 244 10 8 61 4 8NE--CREIGHTON U 153 0 0 73 0 0NE--HASTINGS COL 72 0 0 8 0 0NE--MIDLAND LUTH COL 30 0 0 20 0 0NE--U OF NE KEARNEY 231 0 0 57 0 0NE--U OF NE LINCOLN 911 85 0 189 21 0NE--U OF NE OMAHA 529 99 0 140 12 0NE--UNION COL 26 0 0 6 0 0NE--WAYNE ST COL 44 0 0 10 0 0NH--KEENE ST COL 30 0 0 44 0 0NH--S NH UNIV 138 0 0 16 0 0NH--UNIV OF NH 567 0 0 206 0 0NJ--COL OF NJ 98 0 0 58 0 0NJ--FAIR DICK U 103 24 0 27 16 0NJ--RIDER UNIV 453 0 0 — 0 0NJ--ROWAN UNIV 1,320 56 0 339 19 0NJ--RUTGERS U NB 563 0 0 261 0 0NJ--RUTGERS U NE 57 0 0 8 0 0NJ--SETON HALL U 302 0 0 — 0 0NJ--WM PATERSON U 800 15 0 — — 0NM--E NM UNIV 134 26 0 69 11 0NM--NM ST UNIV 268 0 0 54 0 0NM--UNIV OF NM 706 22 40 135 9 11NV--U OF NV LV 415 27 0 89 6 0NV--U OF NV RENO 427 8 0 — — 0NY--BARUCH COL CITY NY 116 0 0 14 0 0NY--BUFFALO ST COL 669 0 0 121 0 0NY--CANISIUS COL 352 60 0 — — 0NY--COLUMBIA UNIV 0 371 28 0 358 3NY--CORNELL UNIV 300 3 31 88 5 4NY--CUNY 0 163 0 0 58 0NY--FORDHAM UNIV 748 25 0 223 1 0NY--HOFSTRA UNIV 1,164 33 0 — — 0NY--IONA COL 282 50 0 104 16 0NY--ITHACA COL 1,459 41 0 273 — 0NY--LONG I U BR 73 0 0 10 0 0NY--LONG ISL UNIV 150 10 0 50 0 0NY--MARIST COL 771 53 0 195 28 0NY--MERCY COL 117 0 0 20 0 0NY--NIAGARA UNIV 105 0 0 40 0 0NY--NY UNIV 448 263 0 162 118 0NY--PACE UNIV PLEASANT 267 37 0 — — 0NY--ROCHESTER TECH 200 40 0 25 10 0NY--ST BONAVENT U 287 43 0 44 35 0NY--ST JOHN FISH COL 150 0 0 63 0 0NY--ST JOHNS U 184 0 0 — 0 0NY--STONY BROOK U 293 0 0 35 0 0NY--SUNY ALBANY 240 0 0 60 0 0NY--SUNY COL OLD WEST 232 0 0 46 0 0NY--SUNY PLATTSBURGH 93 0 0 — 0 0NY--SUNY-NEW PALTZ 475 0 0 400 0 0
WINTER ’11321
Enrollment Degrees GrantedState (Postal Code)/School Bachelor Master Doctoral Bachelor Master DoctoralNY--SYRACUSE U 1,847 300 15 461 225 4NY--UTICA COL 89 0 0 31 0 0OH--ASHLAND UNIV 53 0 0 18 0 0OH--BOWL GRN ST U 692 70 54 257 3 8OH--CLEVELAND ST 650 30 0 160 9 0OH--FRANCISCAN U 132 0 0 27 0 0OH--JOHN CARROLL U 100 40 0 100 20 0OH--KENT ST UNIV 1,031 71 0 16 10 0OH--MARIETTA COL 118 10 0 — — 0OH--MIAMI U MASS 551 0 0 220 0 0OH--OH ST UNIV 1,054 33 35 553 7 4OH--OH UNIV 906 28 12 203 23 2OH--OH WESLEYAN U 20 0 0 16 0 0OH--OTTERBEIN COL 141 0 0 60 0 0OH--UNIV AKRON 1,100 40 0 211 10 0OH--UNIV CINCINNATI 728 22 0 — — 0OH--UNIV DAYTON 464 18 0 168 14 0OH--UNIV OF FINDLAY 60 0 0 9 0 0OH--UNIV TOLEDO 500 0 0 — 0 0OH--WRIGHT ST U 400 0 0 75 0 0OH--XAVIER UNIV 138 0 0 43 0 0OH--YOUNGSTOWN ST U 239 0 0 34 0 0OK--CAMERON U 171 0 0 21 0 0OK--E CENTRAL UNIV 400 0 0 19 0 0OK--NORTHEASTERN ST U 100 0 0 20 0 0OK--OK BAPTIST U 73 0 0 21 0 0OK--OK CHRISTIAN U 120 0 0 34 0 0OK--OK CITY UNIV 76 0 0 9 0 0OK--OK ST UNIV 491 34 0 150 6 0OK--S NAZARENE U 30 0 0 5 0 0OK--U CENTRAL OK 802 0 0 173 0 0OK--UNIV OF OK 914 69 15 284 27 0OK--UNIV TULSA 56 0 0 26 0 0OR--LINFIELD COL 28 0 0 13 0 0OR--S OR UNIV 206 0 0 64 0 0OR--U OF PORTLAND 160 0 0 45 0 0OR--UNIV OF OR 1,460 83 30 324 24 4PA--BLOOMSBURG U 179 0 0 55 0 0PA--CABRINI COL 130 0 0 42 0 0PA--CAL UNIV PA 183 0 0 45 0 0PA--DUQUESNE U 250 49 0 92 12 0PA--ELIZABETHTWN COL 117 0 0 43 0 0PA--INDIANA U PA 172 0 0 46 0 0PA--LASALLE UNIV 338 157 0 104 41 0PA--LEHIGH UNIV 35 0 0 29 0 0PA--LINCOLN UNIV 132 0 0 33 0 0PA--LOCK HAVEN U 140 0 0 34 0 0PA--LYCOMING COL 48 0 0 20 0 0PA--MERCYHURST COL 74 0 0 39 0 0PA--MESSIAH COL 26 0 0 24 0 0PA--MILLERSVILLE U 381 0 0 112 0 0PA--PA ST UNIV UP 3,327 25 60 1,033 6 3
JOURNALISM & MASS COMMUNICATION EDUCATOR 322
Enrollment Degrees GrantedState (Postal Code)/School Bachelor Master Doctoral Bachelor Master DoctoralPA--PA STATE UNIV AL 60 0 0 26 0 0PA--POINT PARK U 496 78 0 90 20 0PA--SHIPPENSBURG U 333 31 0 77 10 0PA--SUSQUEHANNA U 273 0 0 62 0 0PA--TEMPLE UNIV 3,912 152 47 925 36 5PA--UNIV OF PITT 500 10 30 — — —PA--UNIV SCRANTON 204 0 0 61 0 0PA--URSINUS COL 80 0 0 27 0 0PA--YORK COL 226 0 0 65 0 0RI--UNIV OF RI 170 0 0 29 0 0SC--BENEDICT COL 1,000 0 0 200 0 0SC--CHAFLIN UNIV 137 0 0 19 0 0SC--COL CHARLESTON 750 25 0 225 10 0SC--FRANCIS MARION U 119 0 0 16 0 0SC--UNIV OF SC 1,411 47 21 306 23 1SC--UNIV SC AIKEN 135 0 0 35 0 0SC--UNIV SC UPSTATE 325 0 0 30 0 0SC--WINTHROP UNIV 236 0 0 64 0 0SD--BLACK HILLS ST U 186 0 0 36 0 0SD--SD ST UNIV 220 37 0 49 6 0SD--UNIV OF SD 185 0 0 52 0 0TN--AUSTIN PEAY ST U 500 100 0 — 0 0TN--BELMONT UNIV 182 0 0 48 0 0TN--CHRISTIAN BR U 58 0 0 9 0 0TN--E TN ST UNIV 359 21 0 0 — 0TN--LIPSCOMB UNIV 86 0 0 39 0 0TN--MID TN ST U 2,717 84 0 311 14 0TN--S ADVENTIST U 135 0 0 41 0 0TN--TN ST UNIV 284 0 0 67 0 0TN--TN TECH UNIV 110 0 0 14 0 0TN--UNIV MEMPHIS 308 47 0 59 7 0TN--UNIV TN CHAT 284 0 0 51 0 0TN--UNIV TN KNOX 796 263 44 425 83 4TN--UNIV TN MART 190 0 0 40 0 0TX--ABILENE CHR U 165 0 0 35 0 0TX--ANGELO ST U 800 10 0 150 10 0TX--BAYLOR UNIV 271 7 0 86 3 0TX--HARDIN-SIMMONS U 60 0 0 — 0 0TX--HOUSTON BAPTIST UNIV 80 0 0 10 0 0TX--LAMAR UNIV BEAUMONT 302 0 0 63 0 0TX--MIDWEST ST U 121 0 0 27 0 0TX--PRAIRIE VW A&M U 256 0 0 35 0 0TX--S METH UNIV 122 0 0 57 0 0TX--SAM HOUSTON ST U 578 0 0 160 0 0TX--SF AUSTIN ST Y 438 26 0 103 7 0TX--TRINITY UNIV 125 0 0 45 0 0TX--TX A&M U COMMERCE 65 22 0 42 1 0TX--TX A&M U KINGS 75 0 0 15 0 0TX--TX A&M U TEXARK 50 0 0 12 0 0TX--TX CHRIST U 1,088 30 0 322 11 0TX--TX LUTHERAN 77 0 0 14 0 0TX--TX S UNIV 700 0 0 50 0 0
WINTER ’11323
Enrollment Degrees GrantedState (Postal Code)/School Bachelor Master Doctoral Bachelor Master DoctoralTX--TX ST U SAN MAR 1,652 63 0 318 16 0TX--TX TECH UNIV 1,325 27 22 289 8 1TX--TX WESLEYAN U 59 0 0 16 0 0TX--U TX ARL 764 25 0 234 4 0TX--U TX AUS 729 47 55 200 27 7TX--U TX BROWNSVILLE 183 0 0 40 0 0TX--U TX EL PASO 761 33 0 147 3 0TX--U TX PAN AMER 609 68 0 138 11 0TX--U TX PERMIAN 84 0 0 31 0 0TX--U TX TYLER 140 20 0 16 — 0TX--UNIV HOUSTON 1,213 47 0 — — 0TX--UNIV N TX 909 54 0 169 23 0TX--W TX A&M UNIV 283 30 0 38 7 0UT--BRIG YOUNG U 650 41 0 267 15 0UT--S UTAH UNIV 260 51 0 66 8 0UT--UNIV OF UT 1,650 70 26 — — —UT--UT ST UNIV 358 0 0 107 0 0UT--WEBER ST U 381 0 0 48 0 0VA--EMORY & HENRY COL 55 0 0 9 0 0VA--GEORGETOWN U CS 0 223 0 0 23 0VA--HAMPTON UNIV 389 0 0 100 0 0VA--J MADISON U 582 0 0 197 0 0VA--LIBERTY UNIV 941 45 0 140 15 0VA--LYNCHBURG COL 154 0 0 45 0 0VA--MARY BALDWIN COL 16 0 0 12 0 0VA--MARYMOUNT UNIV 70 0 0 24 0 0VA--NORFOLK ST U 400 0 0 60 0 0VA--RADFORD UNIV 475 30 0 150 13 0VA--REGENT UNIV 82 201 53 14 82 17VA--U RICHMOND 119 0 0 36 0 0VA--VA COMMON UNIV 1,196 230 0 219 120 0VA--VA POLYTECH 890 25 0 319 25 0VA--VA UNION U 112 0 0 22 0 0VA--VA WESLEYAN COL 66 0 0 26 0 0VA--WASH & LEE UNIV 43 0 0 26 0 0VT--CASTLETON ST COL 107 0 0 27 0 0VT--ST MICHAELS COL 108 0 0 25 0 0WA--C WA UNIV 300 0 0 — 0 0WA--E WA UNIV 28 0 0 13 0 0WA--GONZAGA UNIV 69 0 0 20 0 0WA--PAC LUTHERAN U 120 0 0 60 0 0WA--SEATTLE UNIV 187 0 0 54 0 0WA--UNIV OF WA 723 117 44 353 39 10WA--W WA UNIV 82 0 0 57 0 0WA--WA ST UNIV 447 10 24 313 2 3WA--WALLA WALLA COL 106 0 0 19 0 0WA--WHITWORTH COL 125 0 0 28 0 0WI--MARQUETTE U 888 62 0 247 16 0WI--U WI EAU CL 519 0 0 166 0 0WI--U WI LA CRO 218 0 0 285 0 0WI--U WI MA JOU 391 33 55 213 10 10WI--U WI MA LIFE SCI 111 17 0 48 11 1
JOURNALISM & MASS COMMUNICATION EDUCATOR 324
Enrollment Degrees GrantedState (Postal Code)/School Bachelor Master Doctoral Bachelor Master DoctoralWI--U WI MIL 300 35 0 — — 0WI--U WI OSHKOSH 216 0 0 50 0 0WI--U WI RIV FALLS 70 0 0 22 0 0WI--U WI STEVE PT 445 25 0 175 20 0WI--U WI WHITEWTR 697 33 0 159 9 0WI--UNIV WI SUPERIOR 22 2 0 39 — 0WV--BETHANY COL 85 0 0 — 0 0WV--MARSHALL UNIV 318 30 0 64 — 0WV--WV UNIV 1,116 400 0 213 — 0WY--UNIV OF WY 300 30 0 — — 0DC--AMERICAN U 831 376 0 165 168 0DC--G WASH UNIV 346 40 0 80 5 0DC--HOWARD UNIV 1,063 42 0 268 1 0PR--U PUERTO RICO 715 36 0 121 7 0PR--U SACRED HEART 1,985 400 0 301 19 0