Embed Size (px)
Citation preview
MeadWestvaco 2010 Annual Report
Breakingaway from the pack
Company Profi le
MeadWestvaco Corporation (NYSE: MWV), provides packaging solutions to many of the world’s most admired brands in the healthcare,
beauty and personal care, food, beverage, tobacco, and home and garden industries. The company’s businesses also include Consumer &
Offi ce Products, Specialty Chemicals, and the Community Development and Land Management Group, which sustainably manages the
company’s land holdings to support its operations, and to provide for conservation, recreation and development opportunities. With 17,500
employees worldwide, MWV operates in 30 countries and serves customers in more than 100 nations. MWV manages all of its forestlands in
accordance with internationally recognized forest certifi cation standards, and has been named to the Dow Jones Sustainability World Index
for seven consecutive years.
For more information, please visit www.mwv.com.
inspirationHow do you transform the grocery aisle
into a more appealing place for shoppers
and stockers? Shopper-ready packaging.
That’s what we call our new packaging
solution that allows shoppers to locate
products easier and retailers to keep
shelves stocked more efficiently. It also
gives brand owners just what they want,
too – a solution that captures attention
and delivers a positive brand impression
at the point of purchase. It’s an example
of the innovation that comes from
knowing packaging better than anyone,
and partnering with our customers to
develop cutting-edge solutions that will
please their customers.
At MWV, we have been moving quickly toward our goals – a market-focused organization, an innovative approach to customer partnerships, a higher-performing company for our shareholders. The progress we’ve made has helped increase our edge on the competition.
We were prepared for the challenges of an economic downturn, making the essential moves to succeed through it all. As a result, MWV is more focused, more innovative, and more profitable than ever. Now, the trajectory we’ve set for the future will push us even further ahead of the pack.
impactWhat can our shareholders expect from
MWV’s success? Stronger results. We
had a record year in 2010, surpassing our
previous high-water mark for earnings
from continuing operations. As a result,
we increased our annual dividend rate by
nine percent (having maintained it during
the economic downturn). With a strong
cash flow and confidence in our plans
for additional profitable growth in our
markets, we’re delivering more value to
our shareholders as we work to reach our
ultimate potential.
insightWhere is one of the next great markets
for packaging? Brazil. We’ve been part
of Brazil’s vibrant growth for more than
60 years, and our experience there has
earned us an advantage. It’s helped our
customers supply a growing middle-
class population with products such as
frozen meat, fresh produce, cosmetics
and school supplies. We bring this
kind of expertise to each of our global
markets – which enables us to bring
the best packaging solutions to our
customers, wherever they do business.
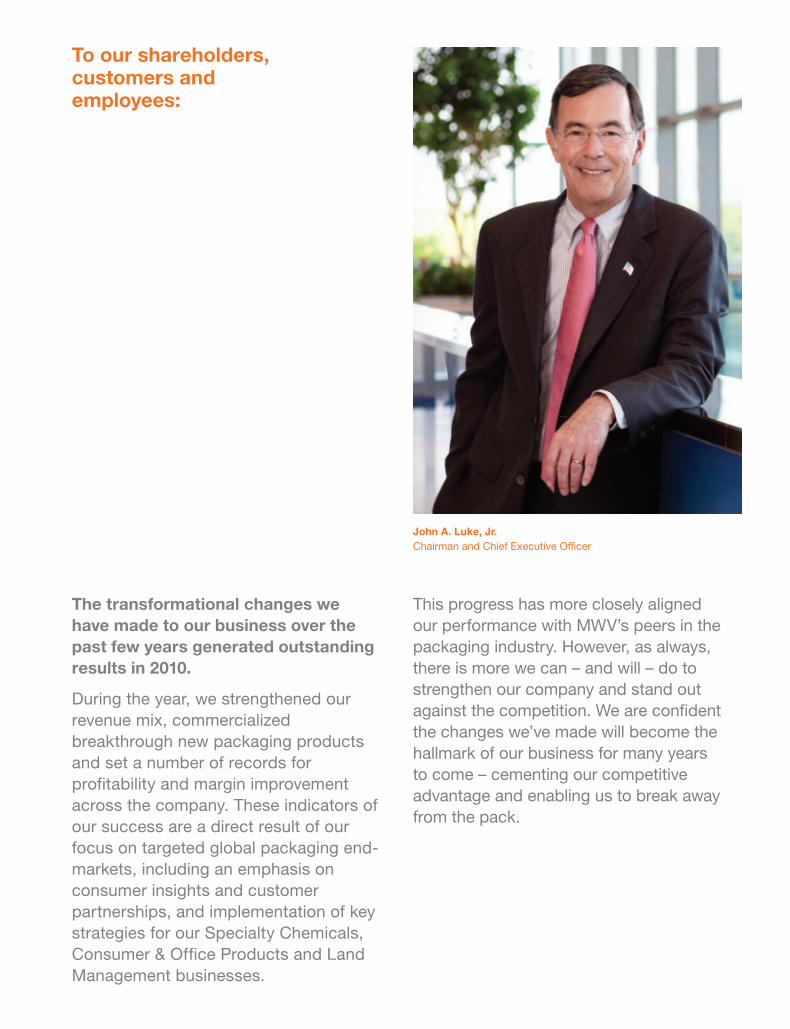
John A. Luke, Jr.Chairman and Chief Executive Officer
To our shareholders, customers and employees:
The transformational changes we have made to our business over the past few years generated outstanding results in 2010.
During the year, we strengthened our
revenue mix, commercialized
breakthrough new packaging products
and set a number of records for
profitability and margin improvement
across the company. These indicators of
our success are a direct result of our
focus on targeted global packaging end-
markets, including an emphasis on
consumer insights and customer
partnerships, and implementation of key
strategies for our Specialty Chemicals,
Consumer & Office Products and Land
Management businesses.
This progress has more closely aligned
our performance with MWV’s peers in the
packaging industry. However, as always,
there is more we can – and will – do to
strengthen our company and stand out
against the competition. We are confident
the changes we’ve made will become the
hallmark of our business for many years
to come – cementing our competitive
advantage and enabling us to break away
from the pack.

MWV 2010 Annual Report2
Breaking away means having adifferentiated business model,a distinct approach to marketparticipation and a definitiveedge with customers. We havebeen focused on establishing ouradvantage in these areas, andwe’re not only reaping the benefitsof our strategic transformation,we’re setting the stage forbreakout growth going forward.
The best barometer of oursuccess is financial performance.By virtually any measure, 2010was a very strong year for MWV’sshareholders. We set a recordfor earnings from continuingoperations; the $1.52 of earningsper share was the highest sincethe company was formed in 2002.
Consistent with this strongperformance, we increased ourdividend by nine percent. We areproud to say that, unlike manyothers, we maintained our ratethrough the financial andeconomic downturn. The increasedemonstrates confidence in ourability to continue to profitablygrow our revenues, increase cashflow from our businesses and deliverhigher returns for shareholderson a sustainable basis.
Many of the reasons for thatconfidence are embedded in thesuccesses we accomplished in2010 – things that contributed toour bottom-line performance thispast year and form the foundationfor our heightened expectationsfor improved performance in 2011and beyond.
Most notably, we continued toemphasize our participation in thekey end-markets we’ve identifiedas having the most potential forprofitability. This market focus iscritical to everything we do, andwe are in the process of organizingdedicated teams for each ofour targeted global packagingmarkets: food, beverage,healthcare, beauty and personalcare, home and garden andtobacco.
All told, these markets forpackaging represent about$325 billion in annual salesaround the world – with growthrates from two to six percentoverall and as high as tento twelve percent in rapidlydeveloping markets. For certain,they have varied and diversecharacteristics and economics,but also many similarities.Each has attractive growth trends.
Each has profitable niches forspecialty solutions. Each presentsopportunities to solve unmetconsumer needs throughinnovation.
In the large and growing globalmarket for food packaging, forinstance, we have worked withbrand owners to specify ourpaperboard for their mostchallenging packaging applications– including frozen food, ready-to-eat meals and hot drink cups.In 2010, we increased sales bynearly 10 percent – representingour growing share of the $200billion global market. We are alsoworking to introduce new productsthat will help us increase thatshare even further.
“ln the large and growing global market for food packaging, we have worked with brand owners to specify our paperboard for their most challenging packaging applications.”

MWV 2010 Annual Report 3
“ MWV’s focus on developing and applying our deep knowledge of end-markets has given us an edge over the competition.”
Our profitable growth strategies inthe food market are indicative ofsimilar efforts underway for eachof the packaging markets we’vetargeted. For instance, in 2010 we:
• acquired Spray Plast toaccelerate global growth intrigger sprayers for home andgarden,
• generated strong growth forour airless and fragrancedispensers in beauty andpersonal care,
• continued to emphasize ourleading solutions for medicationadherence in healthcare,
• grew our beverage multi-packbusiness in Asia and otherdeveloping markets,
• coordinated our globaltobacco business to focuson paperboard, converting,and specialty packaging forthe world’s premier brands,
• and, in an example of a marketwe’ve decided to exit, sold ourmedia and entertainmentpackaging business.
As it has been for many years, partof our focus on these targetedend-markets is to expand ourpositions in the right geographies– where middle-class consumptionis growing rapidly and where ourcustomers are expecting togenerate the vast majority ofgrowth for their brands. Thisincludes a priority emphasis onBrazil, India, China and othercountries across the Asia-Pacificregion.
Brazil is a special example forMWV because we have beenoperating in that country for nearly60 years. Over that time, we haveaccumulated a tremendousamount of knowledge about thecountry, the markets and ourBrazilian customers. Our strengthsin Brazil extend from each of ourbusinesses, including our highlydifferentiated (and highlyprofitable) corrugated packagingbusiness, Rigesa, as well asimportant positions in consumerpackaging for beverage, food andpersonal care markets, the leadingTilibra and Grafons brands forschool and office products, andpositions in end-markets for pinechemicals, asphalt additives andactivated carbon in our SpecialtyChemicals business.
In 2010, our total sales in Brazilwere $670 million – a 17 percentincrease over the prior year.Combined with sales in China,Russia, India and other rapidlydeveloping countries, our businessin these leading growth marketsnow represents more than a quarterof MWV’s annual revenue. This isconsistent with their increasingshare of the overall global economicpie and our focused strategy togrow profitably in these attractivemarkets.
We are very encouraged by thebroad opportunities in Brazil, wherethe economy is expected to growtwice as fast as the United Statesthanks to an expanding middleclass, a stable political environment,vast natural resources, stronginflows of capital and plans to rampup infrastructure spending ahead ofthe 2014 World Cup and the 2016Summer Olympics.
MWV 2010 Annual Report4
Driven by this strong economicengine, the targeted markets forRigesa’s corrugated packagingbusiness – which include frozenfood, fresh produce, consumablehousehold and personal careproducts and durable goods – aregrowing faster than average in thecorrugated industry. That’s one ofthe reasons we are investing toextend our advantage in thisbusiness – enhancing our ability toserve these fast-growing marketsand upgrading our technology toproduce higher-quality packagingwith additional sustainabilitycharacteristics for customers.This is a $500 million investment inour future growth in Brazil, with avery attractive return profile; weexpect to double Rigesa’s currentprofitability in five years.
The focus we’ve placed ondeveloping expertise in ourend-markets is not limited to ourparticipation in the large, growing,global markets for packaging. It’salso been the foundation for oursuccess in other businesses.We’ve long been recognized as aleader in the consumer and officeproducts market, with a deepunderstanding of our customersand retail partners, as well as theneeds and desires of the students,professionals and families whorely on our products.
We have also done considerablework to position our SpecialtyChemicals business for breakoutgrowth and sustained earningsperformance – and those effortscame to a head in 2010. Thebusiness had a record year; wemore than doubled sales andearnings by identifying – and insome cases creating – the rightend-markets for our uniquechemical products.
In each of our businesses, thefocus on developing and applyingour deep knowledge of end-markets has given us an edge overthe competition, and enabled ourcompany to outperform during adifficult economic period. Still, thestrategic progress we’ve made totransform MWV makes ourearnings power more consistent,but not immune from externalmacroeconomic challenges suchas inflation, unemployment, ordisruptive policies and regulations.In other words, the big stuff stillmatters – no matter how muchprogress we make implementingour strategies. We’ll always bescanning the horizon for theimpact of global interdependence– in some cases giving rise to newcompetitive challenges, and inothers presenting the opportunityto capitalize on emergingopportunities for profitable growth.
We are always looking ahead,with a confident approach to thefuture. No one at MWV is satisfiedwith a transformation; no oneviews it as an end-point. We’regoing to remain focused onsharpening our market expertise,creating the most innovativeproducts, earning business fromthe world’s biggest brands andfurther improving our financialperformance for shareholders.
We think this is what sets usapart – and pushes us toward avision of MWV as a premier globalpackaging company. In manyaspects of our business, we’realready there. In others, we’recatching up quickly – poised tomeet and exceed expectations.Our employees are leading thecharge. Our customers are seeingthe results. Our shareholders arereaping the rewards. And I’mhonored to be working with allof them to place MWV into acategory of its own.
Sincerely,
John A. Luke, Jr.Chairman andChief Executive OfficerFebruary 28, 2011
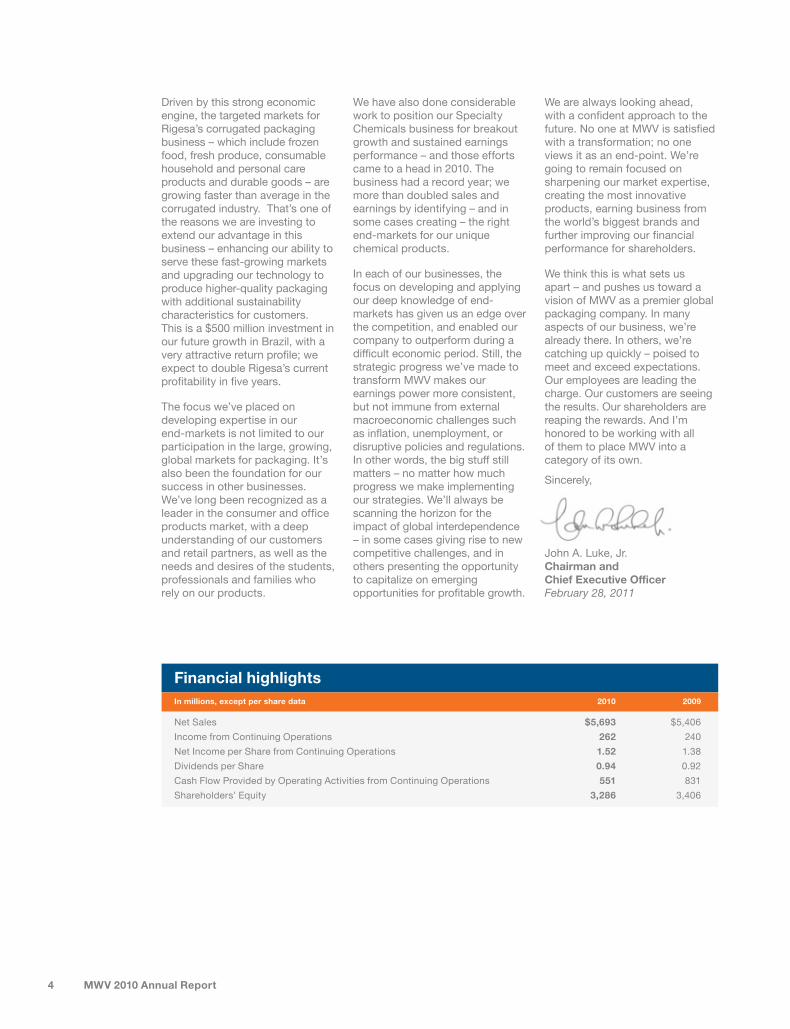
Financial highlightsIn millions, except per share data 2010 2009
Net Sales $5,693 $5,406
Income from Continuing Operations 262 240
Net Income per Share from Continuing Operations 1.52 1.38
Dividends per Share 0.94 0.92
Cash Flow Provided by Operating Activities from Continuing Operations 551 831
Shareholders’ Equity 3,286 3,406
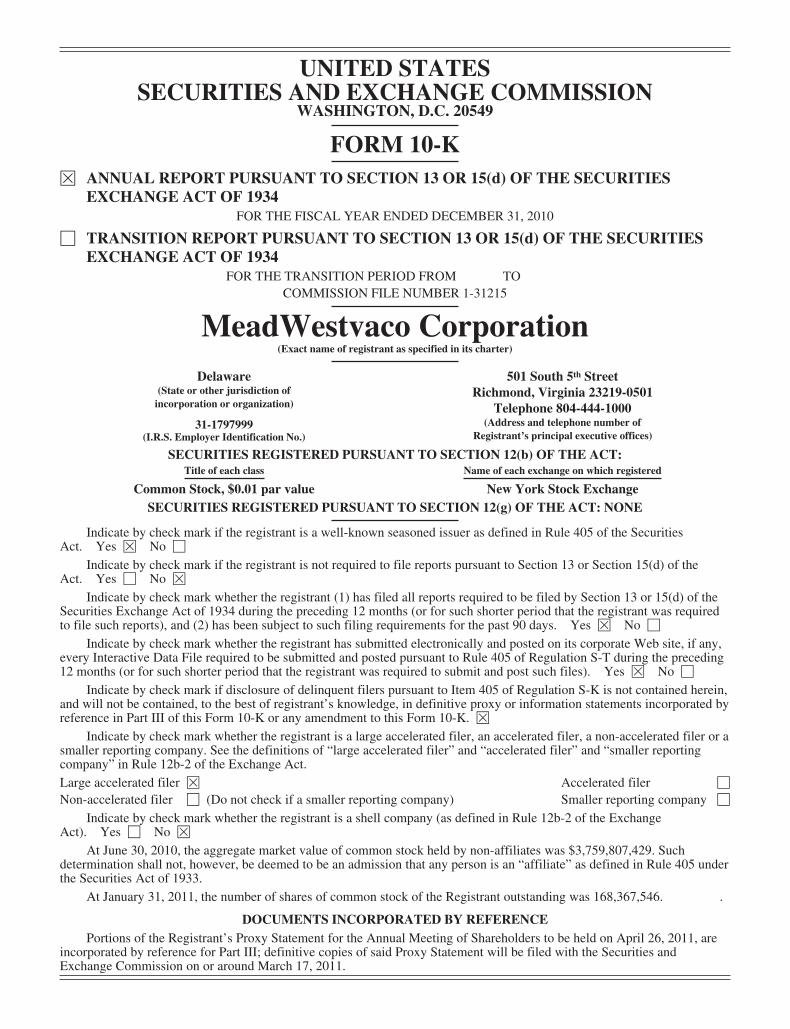
UNITED STATESSECURITIES AND EXCHANGE COMMISSION
WASHINGTON, D.C. 20549
FORM 10-KÈ ANNUAL REPORT PURSUANT TO SECTION 13 OR 15(d) OF THE SECURITIES
EXCHANGE ACT OF 1934FOR THE FISCAL YEAR ENDED DECEMBER 31, 2010
‘ TRANSITION REPORT PURSUANT TO SECTION 13 OR 15(d) OF THE SECURITIESEXCHANGE ACT OF 1934
FOR THE TRANSITION PERIOD FROM TOCOMMISSION FILE NUMBER 1-31215
MeadWestvaco Corporation(Exact name of registrant as specified in its charter)
Delaware 501 South 5th StreetRichmond, Virginia 23219-0501
Telephone 804-444-1000(Address and telephone number of
Registrant’s principal executive offices)
(State or other jurisdiction ofincorporation or organization)
31-1797999(I.R.S. Employer Identification No.)
SECURITIES REGISTERED PURSUANT TO SECTION 12(b) OF THE ACT:Title of each class Name of each exchange on which registered
Common Stock, $0.01 par value New York Stock ExchangeSECURITIES REGISTERED PURSUANT TO SECTION 12(g) OF THE ACT: NONE
Indicate by check mark if the registrant is a well-known seasoned issuer as defined in Rule 405 of the SecuritiesAct. Yes È No ‘
Indicate by check mark if the registrant is not required to file reports pursuant to Section 13 or Section 15(d) of theAct. Yes ‘ No È
Indicate by check mark whether the registrant (1) has filed all reports required to be filed by Section 13 or 15(d) of theSecurities Exchange Act of 1934 during the preceding 12 months (or for such shorter period that the registrant was requiredto file such reports), and (2) has been subject to such filing requirements for the past 90 days. Yes È No ‘
Indicate by check mark whether the registrant has submitted electronically and posted on its corporate Web site, if any,every Interactive Data File required to be submitted and posted pursuant to Rule 405 of Regulation S-T during the preceding12 months (or for such shorter period that the registrant was required to submit and post such files). Yes È No ‘
Indicate by check mark if disclosure of delinquent filers pursuant to Item 405 of Regulation S-K is not contained herein,and will not be contained, to the best of registrant’s knowledge, in definitive proxy or information statements incorporated byreference in Part III of this Form 10-K or any amendment to this Form 10-K. È
Indicate by check mark whether the registrant is a large accelerated filer, an accelerated filer, a non-accelerated filer or asmaller reporting company. See the definitions of “large accelerated filer” and “accelerated filer” and “smaller reportingcompany” in Rule 12b-2 of the Exchange Act.Large accelerated filer È Accelerated filer ‘
Non-accelerated filer ‘ (Do not check if a smaller reporting company) Smaller reporting company ‘
Indicate by check mark whether the registrant is a shell company (as defined in Rule 12b-2 of the ExchangeAct). Yes ‘ No È
At June 30, 2010, the aggregate market value of common stock held by non-affiliates was $3,759,807,429. Suchdetermination shall not, however, be deemed to be an admission that any person is an “affiliate” as defined in Rule 405 underthe Securities Act of 1933.
At January 31, 2011, the number of shares of common stock of the Registrant outstanding was 168,367,546. .
DOCUMENTS INCORPORATED BY REFERENCEPortions of the Registrant’s Proxy Statement for the Annual Meeting of Shareholders to be held on April 26, 2011, are
incorporated by reference for Part III; definitive copies of said Proxy Statement will be filed with the Securities andExchange Commission on or around March 17, 2011.
TABLE OF CONTENTS
Item Page
PART I
1. Business . . . . . . . . . . . . . . . . . . . . . . . . . . . . . . . . . . . . . . . . . . . . . . . . . . . . . . . . . . . . . . . . . . . . . . . . . 11A. Risk factors . . . . . . . . . . . . . . . . . . . . . . . . . . . . . . . . . . . . . . . . . . . . . . . . . . . . . . . . . . . . . . . . . . . . . . . 51B. Unresolved staff comments . . . . . . . . . . . . . . . . . . . . . . . . . . . . . . . . . . . . . . . . . . . . . . . . . . . . . . . . . . 72. Properties . . . . . . . . . . . . . . . . . . . . . . . . . . . . . . . . . . . . . . . . . . . . . . . . . . . . . . . . . . . . . . . . . . . . . . . . 83. Legal proceedings . . . . . . . . . . . . . . . . . . . . . . . . . . . . . . . . . . . . . . . . . . . . . . . . . . . . . . . . . . . . . . . . . 104. Removed and reserved . . . . . . . . . . . . . . . . . . . . . . . . . . . . . . . . . . . . . . . . . . . . . . . . . . . . . . . . . . . . . . 10
PART II
5. Market for registrant’s common equity, related stockholder matters and issuer purchases of equitysecurities . . . . . . . . . . . . . . . . . . . . . . . . . . . . . . . . . . . . . . . . . . . . . . . . . . . . . . . . . . . . . . . . . . . . . . . 13
6. Selected financial data . . . . . . . . . . . . . . . . . . . . . . . . . . . . . . . . . . . . . . . . . . . . . . . . . . . . . . . . . . . . . . 147. Management’s discussion and analysis of financial condition and results of operations . . . . . . . . . . . 167A. Quantitative and qualitative disclosures about market risk . . . . . . . . . . . . . . . . . . . . . . . . . . . . . . . . . . 388. Financial statements and supplementary data . . . . . . . . . . . . . . . . . . . . . . . . . . . . . . . . . . . . . . . . . . . . 399. Changes in and disagreements with accountants on accounting and financial disclosure . . . . . . . . . . . 829A. Controls and procedures . . . . . . . . . . . . . . . . . . . . . . . . . . . . . . . . . . . . . . . . . . . . . . . . . . . . . . . . . . . . . 829B. Other information . . . . . . . . . . . . . . . . . . . . . . . . . . . . . . . . . . . . . . . . . . . . . . . . . . . . . . . . . . . . . . . . . . 82
PART III
10. Directors, executive officers and corporate governance . . . . . . . . . . . . . . . . . . . . . . . . . . . . . . . . . . . . 8311. Executive compensation . . . . . . . . . . . . . . . . . . . . . . . . . . . . . . . . . . . . . . . . . . . . . . . . . . . . . . . . . . . . . 8312. Security ownership of certain beneficial owners and management and related stockholder matters . . 8313. Certain relationships and related transactions, and director independence . . . . . . . . . . . . . . . . . . . . . . 8314. Principle accounting fees and services . . . . . . . . . . . . . . . . . . . . . . . . . . . . . . . . . . . . . . . . . . . . . . . . . . 83
PART IV
15. Exhibits, financial statement schedules . . . . . . . . . . . . . . . . . . . . . . . . . . . . . . . . . . . . . . . . . . . . . . . . . 84Signatures . . . . . . . . . . . . . . . . . . . . . . . . . . . . . . . . . . . . . . . . . . . . . . . . . . . . . . . . . . . . . . . . . . . . . . . . 88
Part I
Item 1. Business
General
MeadWestvaco Corporation (“MeadWestvaco”, “MWV”, or the “company”), a Delaware corporationformed in 2001 following the merger of Westvaco Corporation and The Mead Corporation, is a global packagingcompany that provides packaging solutions to many of the world’s brands in the healthcare, beauty and personalcare, food, beverage, tobacco and home and garden industries. MWV’s other business operations serve theconsumer and office products, specialty chemicals, forestry and real estate markets. MWV’s segments are(i) Packaging Resources, (ii) Consumer Solutions, (iii) Consumer & Office Products, (iv) Specialty Chemicals,and (v) Community Development and Land Management.
Packaging Resources
The Packaging Resources segment produces paperboard used in packaging for food, beverage, tobacco,healthcare, and beauty and personal care markets. This segment’s products include bleached paperboard (“SBS”)and Coated Natural Kraft® paperboard (“CNK®”) that are manufactured at three mills located in the U.S. andcorrugated packaging that is manufactured at two mills located in Brazil. SBS is used for packaging high-valueconsumer products including frozen and dry food, aseptic liquid packaging, disposable cups, tobacco, cosmeticsand pharmaceuticals. CNK® is used for a range of packaging applications, the largest of which for MWV ismulti-pack beverage packaging and food packaging. MWV’s corrugated packaging business is focused on freshproduce, frozen meat and consumer products markets in South America.
Consumer Solutions
The Consumer Solutions segment designs and produces packaging solutions and systems for the food,beverage, tobacco, beauty and personal care, healthcare, and home and garden markets. This segmentmanufactures multi-pack cartons primarily for the global beverage take-home market, high-end packaging for theglobal tobacco market, injection-molded plastic packaging for prescription drugs, and dispensing and sprayersystems for personal care, fragrance, healthcare, home cleaning, and garden and lawn maintenance products.Paperboard and plastic are converted into packaging products at plants located in North America, South America,Europe and Asia. This segment also has pharmaceutical packaging contracts with retailers, including mass-merchants. In addition, this segment manufactures equipment that is leased or sold to its beverage and dairycustomers to package their products.
Consumer & Office Products
The Consumer & Office Products segment manufactures, sources, markets and distributes school and officeproducts and time-management products in North America and Brazil through both retail and commercialchannels. MWV produces many of the leading brand names in school supplies, time-management andcommercial office products, including AMCAL®, AT-A-GLANCE®, Cambridge®, Day Runner®, Five Star®,Mead® and Trapper Keeper®.
Specialty Chemicals
The Specialty Chemicals segment manufactures, markets and distributes specialty chemicals derived fromsawdust and other byproducts of the papermaking process in North America, Europe, South America and Asia.Products include activated carbon used in gas vapor emission control systems for automobiles and trucks andapplications for air, water and food purification. Other products include performance chemicals used in printinginks, asphalt paving and adhesives, as well as in the agricultural, paper and petroleum industries.
1

Community Development and Land Management
The Community Development and Land Management segment is responsible for maximizing the value ofthe company’s landholdings in the Southeastern region of the U.S. Operations of the segment include real estatedevelopment, forestry operations and leasing activities. Real estate development includes (i) selling non-coreforestlands primarily for recreational and residential uses, (ii) entitling and improving high-value tracts, and(iii) master planning select landholdings. Forestry operations include growing and harvesting softwood andhardwood on the company’s forestlands for external consumption and for use by the company’s mill-basedbusiness. Leasing activities include fees from third parties undertaking mineral extraction operations, as well asfees from recreational leases on the company’s forestlands.
For a more detailed description of our segments, including financial information, see Note T of Notes toConsolidated Financial Statements included in Part II, Item 8.
Marketing and distribution
The principal markets for our products are in North America, South America, Europe and Asia. We operatein 30 countries and serve customers in more than 100 nations. Our products are sold through a combination ofour own sales force and paperboard merchants and distributors. The company has sales offices in key citiesthroughout the world.
Intellectual property
MeadWestvaco has a large number of foreign and domestic trademarks, trade names, patents, patent rightsand licenses relating to its business. While, in the aggregate, intellectual property rights are material to ourbusiness, the loss of any one or any related group of such rights would not have a material adverse effect on ourbusiness, with the exception of the “Mead®” trademark and the “AT-A-GLANCE®” trademark for consumer andoffice products.
Competition
MeadWestvaco operates in a very challenging global marketplace and competes with many large, well-established and highly competitive manufacturers and service providers. In addition, our business is affected by arange of macroeconomic conditions, including industry capacity changes, global competition, economicconditions in the U.S. and abroad, and currency exchange rates.
We compete principally through quality, price, value-added products and services such as packagingsolutions, customer service, innovation, technology, and product design. Our proprietary trademarks and patents,in the aggregate, are also important to our competitive position in certain markets.
The Packaging Resources segment competes globally with manufacturers of value-added CNK® and SBSfor packaging and graphic applications, as well as other specialty paperboards. The Consumer Solutions segmentcompetes globally with numerous packaging service providers in the package design, development, andmanufacturing arenas, as well as the manufacture of dispensing and spraying systems. The Consumer & OfficeProducts segment competes with national and regional converters, as well as foreign producers, especially fromAsia. The Specialty Chemicals segment competes on a worldwide basis with producers of activated carbons,refined tall oil products, lignin-based chemicals and specialty resins. The Community Development and LandManagement segment competes in the real estate sales and development market and the forestry productsindustry in the Southeastern region of the U.S.
2
Research
MeadWestvaco conducts research and development in the areas of packaging and chemicals. Innovativeproduct development and manufacturing process improvement are the main objectives of these efforts. Thecompany also evaluates and adapts for use new and emerging technologies that may enable new productdevelopment and manufacturing cost reductions. Expenditures for research and development were $41 million,$43 million and $58 million for the years ended December 31, 2010, 2009 and 2008, respectively.
Environmental laws and regulations
Our operations are subject to extensive regulation by federal, state and local authorities, as well asregulatory authorities with jurisdiction over foreign operations of the company. Due to changes in environmentallaws and regulations, the application of such regulations, and changes in environmental control technology, it isnot possible for us to predict with certainty the amount of capital expenditures to be incurred for environmentalpurposes. Taking these uncertainties into account, we estimate that we will incur $22 million and $56 million inenvironmental capital expenditures in 2011 and 2012, respectively. Approximately $23 million was spent onenvironmental capital projects in 2010.
The company has been notified by the U.S. Environmental Protection Agency or by various state or localgovernments that it may be liable under federal environmental laws or under applicable state or local laws withrespect to the cleanup of hazardous substances at sites previously operated or used by the company. Thecompany is currently named as a potentially responsible party (“PRP”), or has received third-party requests forcontribution under the Comprehensive Environmental Response, Compensation and Liability Act (“CERCLA”)and similar state or local laws with respect to numerous sites. Some of these proceedings are described in moredetail in Part I, Item 3. There are other sites which may contain contamination or which may be potentialSuperfund sites, but for which MeadWestvaco has not received any notice or claim. The potential liability for allthese sites will depend upon several factors, including the extent of contamination, the method of remediation,insurance coverage and contribution by other PRPs. The company regularly evaluates its potential liability atthese various sites. At December 31, 2010, MeadWestvaco had recorded liabilities of approximately $21 millionfor estimated potential cleanup costs based upon its close monitoring of ongoing activities and its past experiencewith these matters. The company believes that it is reasonably possible that costs associated with these sites mayexceed amounts of recorded liabilities by an amount that could range from an insignificant amount to as much as$20 million. This estimate is less certain than the estimate upon which the environmental liabilities were based.After consulting with legal counsel and after considering established liabilities, it is our judgment that theresolution of pending litigation and proceedings is not expected to have a material adverse effect on thecompany’s consolidated financial condition or liquidity. In any given period or periods, however, it is possiblesuch proceedings or matters could have a material effect on the company’s results of operations. Additionalmatters involving environmental proceedings for MeadWestvaco are set forth in Part I, Item 3.
Employees
MeadWestvaco currently employs approximately 17,500 people worldwide, of whom approximately halfare employed in the U.S. and half are employed internationally. Approximately half of the company’s employeesaround the world are represented by labor unions under various collective bargaining agreements. The companyengages in negotiations with labor unions for new collective bargaining agreements from time to time and will benegotiating new collective agreements at various manufacturing locations around the world during the course of2011. The company considers its relationships with its unions and other employee representatives to be generallygood. While it is the company’s objective to reach agreements without work stoppages, it cannot predict theoutcome of any negotiations.
3
International operations
MeadWestvaco’s operations outside the U.S. are conducted through subsidiaries located in Canada, Mexico,South America, Europe and Asia. While there are risks inherent in foreign investments, we do not believe at thistime that such risks are material to our overall business prospects. MeadWestvaco’s sales that were attributable toU.S. operations, including export sales, were 68%, 67% and 66% for the years ended December 31, 2010, 2009and 2008, respectively. Export sales from MeadWestvaco’s U.S. operations were 14% in each of the years endedDecember 31, 2010, 2009, and 2008. Sales that were attributable to foreign operations were 32%, 33% and 34%for the years ended December 31, 2010, 2009 and 2008, respectively. For more information about the company’sU.S. and foreign operations, see Note T of Notes to Consolidated Financial Statements included in Part II, Item 8.
Available information
Our Internet address is www.mwv.com. Please note that MWV’s Internet address is included in this AnnualReport on Form 10-K as an inactive textual reference only. The information contained on our website is notincorporated by reference into this Annual Report on Form 10-K or any future reports we may file with the SECand should not be considered part of this report. MWV makes available on this website free of charge, our annualreports on Form 10-K, quarterly reports on Form 10-Q, current reports on Form 8-K, and amendments to thosereports as soon as reasonably practicable after we electronically file or furnish such materials to the U.S.Securities and Exchange Commission. You may access these filings in the Investors section of our website.MWV’s Corporate Governance Principles, our charters (Nominating and Governance Committee, AuditCommittee, Compensation and Organization Development Committee, Finance Committee, Safety, Health andEnvironment Committee, and Executive Committee) and our Code of Conduct can be found in the Investorssection of our website at the following address: http://www.mwv.com/InvestorRelations/CorporateGovernance/index.htm
4
Item 1A. Risk factors
Risks relating to our business
U.S. and global economic conditions could have an adverse effect on the profitability of some or all of ourbusinesses.
Concerns regarding adverse consumer and business confidence, the availability and cost of credit, reducedconsumer spending and business investment, the volatility and strength of the capital and credit markets, andinflation all affect the business and economic environment and, ultimately, the profitability of our business. In aneconomic downturn characterized by higher unemployment, lower family income, lower business investment andlower consumer spending, the demand for our products is adversely affected. Adverse changes in the U.S. orglobal economy could negatively affect earnings and could have a material adverse effect on our business, resultsof operations, cash flows and financial position. In a challenging and uncertain economic environment, wecannot predict whether or when such circumstances may occur, or what impact, if any, such circumstances couldhave on our business, results of operations, cash flows and financial position.
Conditions in the global capital and credit markets and the economy generally may materially adversely affectour business, results of operations and financial position.
Our results of operations and financial position could be materially affected by adverse changes in theglobal capital and credit markets and the economy generally, including declines in consumer and businessconfidence and spending, both in the U.S. and elsewhere around the world. Conditions in the capital and creditmarkets and the effects of declines in consumer and business confidence and spending may adversely impact theability of our suppliers and customers to conduct their business activities. The consequences of such adverseeffects could include the interruption of production at the facilities of our customers, the reduction, delay orcancellation of customer orders, delays in or the inability of customers to obtain financing to purchase ourproducts, and bankruptcy of customers or other related parties.
While we have procedures to monitor and limit exposure to credit risk, there can be no assurance suchprocedures will effectively limit our credit risk and avoid losses, which could have a material adverse effect onour operating results.
The company’s businesses are subject to significant cost pressures. Pricing volatility and our ability to passhigher costs on to our customers through price increases or other adjustments is uncertain and dependent onmarket conditions and may materially impact our results of operations.
The pricing environment for raw materials used in a number of our businesses continues to be challengingand volatile. Additionally, energy costs remain volatile and unpredictable. Further unpredictable increases in thecost of raw materials, energy or freight may materially impact our results of operations. Depending on marketforces and the terms of customer contracts, our ability to recover these costs through increased pricing may belimited.
The company faces intense competition in each of its businesses, and competitive challenges from lower costmanufacturers in overseas markets. If we cannot successfully compete in an increasingly global market place,our results of operations may be adversely affected.
The company operates in competitive domestic and international markets and competes with many large,well-established and highly competitive manufacturers and service providers, both domestically and on a globalbasis. The company’s businesses are facing competition from lower cost manufacturers in Asia and elsewhere.All of these conditions can contribute to substantial pricing and demand pressures, which could adversely affectthe company’s operating results.
5
A key component of the company’s competitive position is MeadWestvaco’s ability to both innovate andmanage expenses successfully. This requires continuous management focus on producing new and innovativeproducts and solutions and reducing and improving efficiency through cost controls, productivity enhancementsand regular appraisal of our asset portfolio.
The company’s operations are increasingly global in nature. Our business, financial condition and results ofoperations could be adversely affected by the political and economic conditions of the countries in which weconduct business, by fluctuations in currency exchange rates and other factors related to our internationaloperations.
We are currently engaged in a substantial expansion of our corrugated packaging operations in Brazil. Asour international operations and activities expand, we face increasing exposure to the risks of operating in manyforeign countries. These factors include:
• Changes in foreign currency exchange rates which could adversely affect our competitive position,selling prices and manufacturing costs, and therefore the demand for our products in a particularmarket.
• Trade protection measures in favor of local producers of competing products, including governmentsubsidies, tax benefits, trade actions (such as anti-dumping proceedings) and other measures givinglocal producers a competitive advantage over the company.
• Changes generally in political, regulatory or economic conditions in the countries in which we conductbusiness.
These risks could affect the cost of manufacturing and selling our products, our pricing, sales volume, andultimately our financial performance. The likelihood of such occurrences and their potential effect on thecompany vary from country to country and are unpredictable.
The company is subject to extensive regulation under various environmental laws and regulations, and isinvolved in various legal proceedings related to the environment. Environmental regulation and legalproceedings have the potential for involving significant costs and liability for the company.
The company’s operations are subject to a wide range of general and industry-specific environmental lawsand regulations. The company has been focused for some time on improving energy efficiency which alsoreduces its emissions of carbon dioxide. In recent years, acting unilaterally, the company reduced its carbondioxide emissions even as overall production has increased. Since 2000, MWV reduced the annual directemissions at its continuing major U.S. manufacturing facilities by over 390,000 metric tons. In 2009, total directemissions from the company’s major U.S. manufacturing facilities were 2,075,000 metric tons. In 2009, totalindirect emissions from purchased electric power consumed at its major U.S. manufacturing facilities were434,000 metric tons. Indirect emissions in 2009 resulting from transportation are estimated to have been 550,000metric tons (the bulk of these emissions are related to transportation by third parties of raw materials and finishedgoods) from the company’s U.S. manufacturing facilities. Data analysis for 2010 has not been developed at thistime. The company is committed to obtaining additional reductions in these emissions as the efficient use ofvarious forms of energy is enhanced. MWV’s emissions are calculated using the WRI/WBCSD (WorldResources Institute/World Business Council for Sustainable Development) guidance for reporting greenhouse gasemissions.
The U.S. Environmental Protection Agency has announced its intention to adopt new air emissionregulations covering greenhouse gas emissions, new emission standards for industrial boilers and establishmentof more stringent ambient air quality standards. Changes in environmental laws and regulations, or theirapplication, could subject the company to significant additional capital expenditures and operating expenses infuture years. However, any such changes are uncertain and, therefore, it is not possible for the company topredict with certainty the amount of additional capital expenditures or operating expenses that could be necessaryfor compliance with respect to any such changes.
6
The company is also subject to various environmental proceedings and may be subject to additionalproceedings in the future. In the case of known potential liabilities, it is management’s judgment that theresolution of pending litigation and proceedings is not expected to have a material adverse effect on thecompany’s consolidated financial condition or liquidity. In any given period or periods, however, it is possiblesuch proceedings or matters could have a material effect on the results of operations. The company could also besubject to new environmental proceedings which could cause the company to incur substantial additional costswith resulting impact on results of operations.
Additional information regarding environmental proceedings involving MeadWestvaco is set forth in Part I,Item 3.
Material disruptions at one of our major manufacturing facilities could negatively impact our financial results.
We believe we operate our facilities in compliance with applicable rules and regulations and take measuresto minimize the risks of disruption at our facilities. A material operational disruption in one of our majorfacilities could negatively impact production and our financial results. Such a disruption could occur as a resultof any number of events including but not limited to a major equipment failure, labor stoppages, transportationfailures affecting the supply and shipment of materials, severe weather conditions and disruptions in utilityservices.
The real estate industry is highly competitive and economically cyclical.
The company engages in value-added real estate development activities, including obtaining entitlementsand establishing joint ventures and other development-related arrangements. Many of our competitors in thisindustry have greater resources and experience in real estate development than we have currently. In addition,our ability to execute our plans to divest or otherwise realize the greater value associated with our landholdingsmay be affected by the following factors, among others:
• General economic conditions, including credit markets and interest rates.
• Local real estate market conditions, including competition from sellers of land and real estatedevelopers.
• Impact of federal, state and local laws and regulations affecting land use, land use entitlements, landprotection and zoning.
Item 1B. Unresolved staff comments
None.
7
Item 2. Properties
MeadWestvaco is headquartered in Richmond, Virginia. MeadWestvaco believes that its facilities havesufficient capacity to meet current production requirements. The locations of MeadWestvaco’s productionfacilities are currently as follows:
Packaging Resources
Blumenau, Santa Catarina, Brazil Pacajus, Ceara, BrazilCottonton, Alabama Silsbee, TexasCovington, Virginia Tres Barras, Santa Catarina, BrazilEvadale, Texas Valinhos, Sao Paulo, BrazilFeira de Santana, Bahia, Brazil Venlo, The NetherlandsLow Moor, Virginia
Consumer Solutions
Aqua Branca, Sao Paulo, Brazil Mebane, North CarolinaAjax, Ontario, Canada Milan, Italy (Leased)Atlanta, Georgia Moscow, Russian Federation (Leased)Barcelona, Spain Roosendaal, The NetherlandsBassano del Grappa, Italy Sao Paulo, Sao Paulo, Brazil (Leased)Bilbao, Spain San Luis Potosi, MexicoBristol, United Kingdom Santiago de Chile, Chile (Leased)Buenos Aires, Argentina (Leased) Shimada, JapanBydgoszcz, Poland Smyrna, GeorgiaChicago, Illinois Svitavy, Czech RepublicDeols, France Tecate, Mexico (Leased)Dublin, Ireland (Leased) Tijuana, Mexico (Leased)Enschede, The Netherlands Trier, GermanyGrandview, Missouri Troyes, FranceGraz, Austria Valinhos, Sao Paulo, BrazilHemer, Germany Winfield, KansasKrakow, Poland Wuxi, People’s Republic of ChinaLanett, Alabama
Consumer & Office Products
Alexandria, Pennsylvania Sidney, New YorkBauru, Sao Paulo, Brazil Toronto, Ontario, Canada (Leased)Santana de Parnaiba, Sao Paulo, Brazil (Leased)
Specialty Chemicals
Covington, Virginia Waynesboro, GeorgiaDeRidder, Louisiana Wickliffe, KentuckyNorth Charleston, South Carolina
Community Development and Land Management Group and Forestry Centers
Appomattox, Virginia Tres Barras, Santa Catarina, BrazilRupert, West Virginia Waverly Hall, GeorgiaSummerville, South Carolina
8
Research Facilities
North Charleston, South Carolina Shekou Shenzhen, People’s Republic of ChinaRichmond, Virginia (Leased) Tres Barras, Santa Catarina, Brazil
Leases
For financial data on MeadWestvaco’s lease commitments, see Note I of Notes to Consolidated FinancialStatements included in Part II, Item 8.
Other information
MeadWestvaco owns all of the facilities listed above, except as noted.
A limited number of MeadWestvaco facilities are owned, in whole or in part, by municipal or other publicauthorities pursuant to standard industrial revenue bond financing arrangements and are accounted for asproperty owned by MeadWestvaco. MeadWestvaco holds options under which it may purchase each of thesefacilities from such authorities by paying a nominal purchase price and assuming the indebtedness of theindustrial revenue bonds at the time of the purchase.
As of December 31, 2010, MeadWestvaco owned approximately 730,000 acres of forestlands and otherlandholdings in the Southeastern region in the U.S. and approximately 135,000 acres of forestlands in Brazil(more than 1,200 miles from the Amazon rainforest).
9
Item 3. Legal proceedings
On August 28, 2000, an enforcement action in Federal District Court in Maryland was brought by the U.S.Environmental Protection Agency (“EPA”) asserting that Westvaco did not obtain permits under the preventionof significant deterioration regulations under the Clean Air Act or install required pollution controls inconnection with capital projects at the Luke, Maryland mill carried out in the 1980s. MeadWestvaco stronglydisagrees and is vigorously defending this action. On April 23, 2001, the Court dismissed the EPA’s claims forcivil penalties under the major counts of the complaint and the government subsequently abandoned several of itsclaims. Motions for summary judgment have resulted in dismissal of one of the two remaining claims. Additionalmotions addressed to the remaining claim have been scheduled by the Court. Based on information currentlyavailable, MeadWestvaco does not expect that this proceeding will have a material adverse effect on ourconsolidated financial condition or liquidity. In any given period or periods, however, it is possible suchproceeding could have a material effect on the results of operations.
MeadWestvaco is involved in various other litigation and administrative proceedings arising in the normalcourse of business. Although the ultimate outcome of such matters cannot be predicted with certainty,MeadWestvaco does not believe that the currently expected outcome of any proceeding, lawsuit or claim that ispending or threatened, or all of them combined, will have a material adverse effect on its consolidated financialcondition or liquidity. In any given period or periods, however, it is possible such proceedings or matters couldhave a material effect on the results of operations.
Additional information is included in Part I, Item 1, and Note P of Notes to Consolidated FinancialStatements included in Part II, Item 8.
Item 4. Removed and reserved
10
Executive officers of the registrant
Name Age* Present position
Year in whichservice inpresent
position began
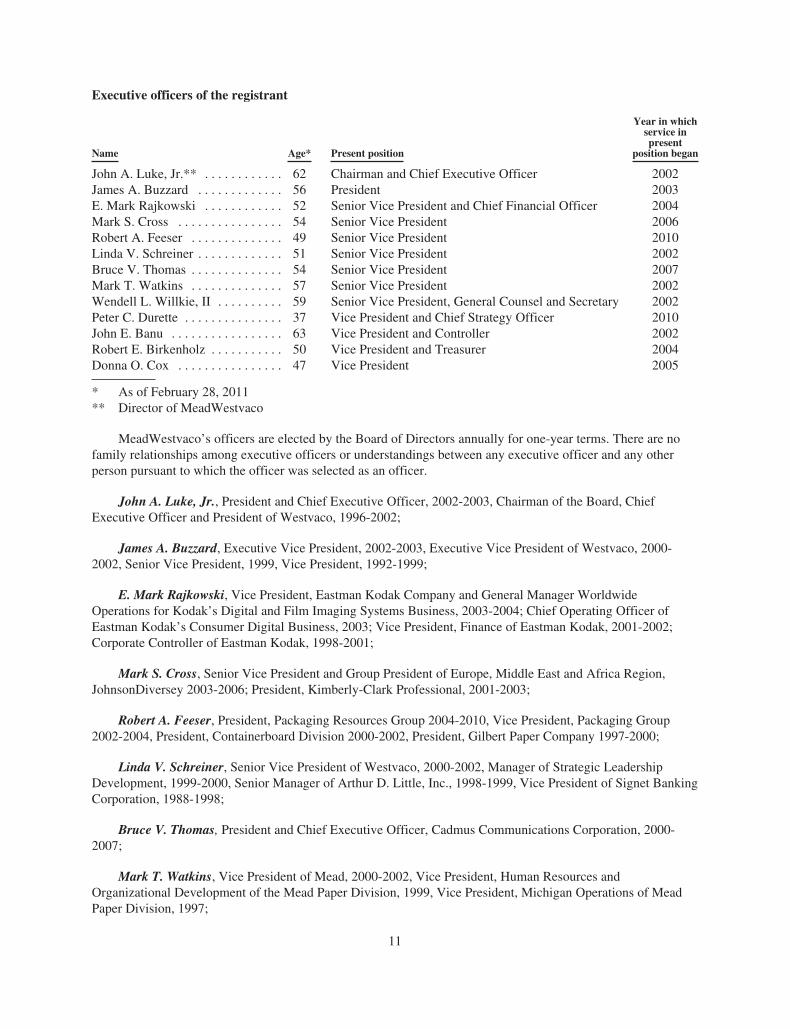
John A. Luke, Jr.** . . . . . . . . . . . . 62 Chairman and Chief Executive Officer 2002James A. Buzzard . . . . . . . . . . . . . 56 President 2003E. Mark Rajkowski . . . . . . . . . . . . 52 Senior Vice President and Chief Financial Officer 2004Mark S. Cross . . . . . . . . . . . . . . . . 54 Senior Vice President 2006Robert A. Feeser . . . . . . . . . . . . . . 49 Senior Vice President 2010Linda V. Schreiner . . . . . . . . . . . . . 51 Senior Vice President 2002Bruce V. Thomas . . . . . . . . . . . . . . 54 Senior Vice President 2007Mark T. Watkins . . . . . . . . . . . . . . 57 Senior Vice President 2002Wendell L. Willkie, II . . . . . . . . . . 59 Senior Vice President, General Counsel and Secretary 2002Peter C. Durette . . . . . . . . . . . . . . . 37 Vice President and Chief Strategy Officer 2010John E. Banu . . . . . . . . . . . . . . . . . 63 Vice President and Controller 2002Robert E. Birkenholz . . . . . . . . . . . 50 Vice President and Treasurer 2004Donna O. Cox . . . . . . . . . . . . . . . . 47 Vice President 2005
* As of February 28, 2011** Director of MeadWestvaco
MeadWestvaco’s officers are elected by the Board of Directors annually for one-year terms. There are nofamily relationships among executive officers or understandings between any executive officer and any otherperson pursuant to which the officer was selected as an officer.
John A. Luke, Jr., President and Chief Executive Officer, 2002-2003, Chairman of the Board, ChiefExecutive Officer and President of Westvaco, 1996-2002;
James A. Buzzard, Executive Vice President, 2002-2003, Executive Vice President of Westvaco, 2000-2002, Senior Vice President, 1999, Vice President, 1992-1999;
E. Mark Rajkowski, Vice President, Eastman Kodak Company and General Manager WorldwideOperations for Kodak’s Digital and Film Imaging Systems Business, 2003-2004; Chief Operating Officer ofEastman Kodak’s Consumer Digital Business, 2003; Vice President, Finance of Eastman Kodak, 2001-2002;Corporate Controller of Eastman Kodak, 1998-2001;
Mark S. Cross, Senior Vice President and Group President of Europe, Middle East and Africa Region,JohnsonDiversey 2003-2006; President, Kimberly-Clark Professional, 2001-2003;
Robert A. Feeser, President, Packaging Resources Group 2004-2010, Vice President, Packaging Group2002-2004, President, Containerboard Division 2000-2002, President, Gilbert Paper Company 1997-2000;
Linda V. Schreiner, Senior Vice President of Westvaco, 2000-2002, Manager of Strategic LeadershipDevelopment, 1999-2000, Senior Manager of Arthur D. Little, Inc., 1998-1999, Vice President of Signet BankingCorporation, 1988-1998;
Bruce V. Thomas, President and Chief Executive Officer, Cadmus Communications Corporation, 2000-2007;
Mark T. Watkins, Vice President of Mead, 2000-2002, Vice President, Human Resources andOrganizational Development of the Mead Paper Division, 1999, Vice President, Michigan Operations of MeadPaper Division, 1997;
11
Wendell L. Willkie, II, Senior Vice President and General Counsel of Westvaco, 1996-2002;
Peter C. Durette, Vice President of Strategy & Business Development at Textron Inc, 2008-2009, Principal/Partner at Marakon Associates, 2004-2008;
John E. Banu, Vice President of Westvaco, 1999-2002; Controller, 1995-1999.
Robert E. Birkenholz, Assistant Treasurer, 2003-2004; Assistant Treasurer, Amerada Hess Corporation,1997-2002;
Donna O. Cox, Director, External Communications, 2003-2005, Manager, Integration/InternalCommunications, 2002-2003, Public Affairs Manager of Westvaco’s Packaging Resources Group, 1999-2002;
12
Part II
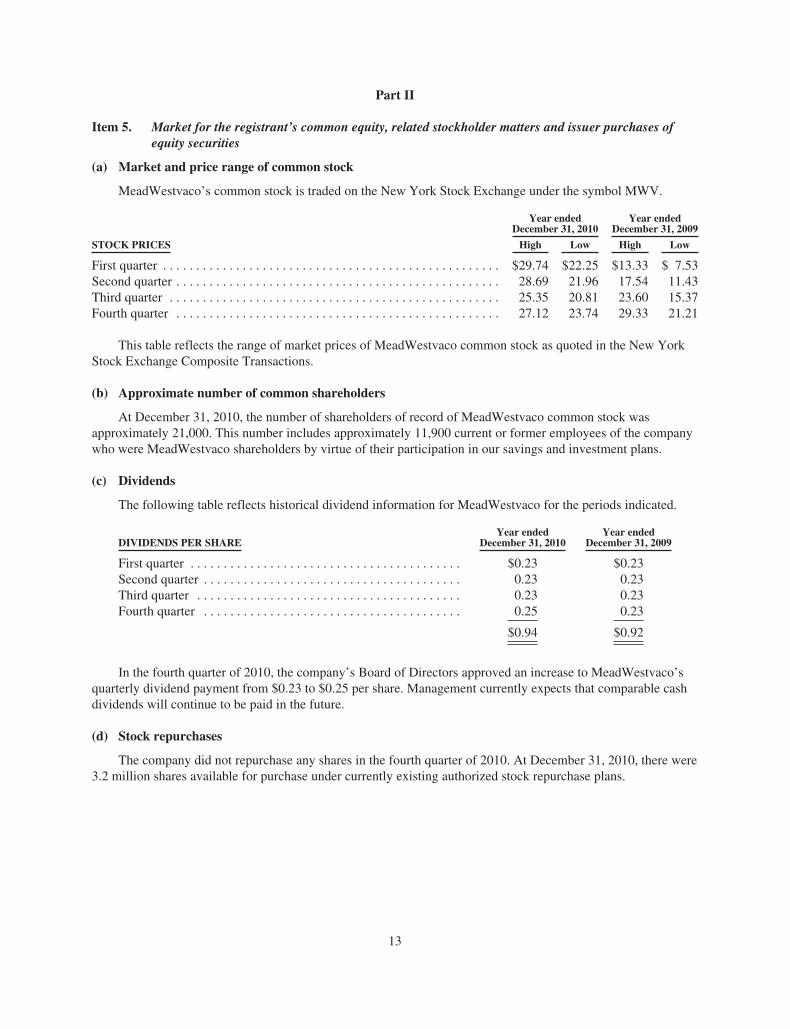
Item 5. Market for the registrant’s common equity, related stockholder matters and issuer purchases ofequity securities
(a) Market and price range of common stock
MeadWestvaco’s common stock is traded on the New York Stock Exchange under the symbol MWV.
Year endedDecember 31, 2010
Year endedDecember 31, 2009
STOCK PRICES High Low High Low
First quarter . . . . . . . . . . . . . . . . . . . . . . . . . . . . . . . . . . . . . . . . . . . . . . . . . . . $29.74 $22.25 $13.33 $ 7.53Second quarter . . . . . . . . . . . . . . . . . . . . . . . . . . . . . . . . . . . . . . . . . . . . . . . . . 28.69 21.96 17.54 11.43Third quarter . . . . . . . . . . . . . . . . . . . . . . . . . . . . . . . . . . . . . . . . . . . . . . . . . . 25.35 20.81 23.60 15.37Fourth quarter . . . . . . . . . . . . . . . . . . . . . . . . . . . . . . . . . . . . . . . . . . . . . . . . . 27.12 23.74 29.33 21.21
This table reflects the range of market prices of MeadWestvaco common stock as quoted in the New YorkStock Exchange Composite Transactions.
(b) Approximate number of common shareholders
At December 31, 2010, the number of shareholders of record of MeadWestvaco common stock wasapproximately 21,000. This number includes approximately 11,900 current or former employees of the companywho were MeadWestvaco shareholders by virtue of their participation in our savings and investment plans.
(c) Dividends
The following table reflects historical dividend information for MeadWestvaco for the periods indicated.
DIVIDENDS PER SHAREYear ended
December 31, 2010Year ended
December 31, 2009
First quarter . . . . . . . . . . . . . . . . . . . . . . . . . . . . . . . . . . . . . . . . . $0.23 $0.23Second quarter . . . . . . . . . . . . . . . . . . . . . . . . . . . . . . . . . . . . . . . 0.23 0.23Third quarter . . . . . . . . . . . . . . . . . . . . . . . . . . . . . . . . . . . . . . . . 0.23 0.23Fourth quarter . . . . . . . . . . . . . . . . . . . . . . . . . . . . . . . . . . . . . . . 0.25 0.23
$0.94 $0.92
In the fourth quarter of 2010, the company’s Board of Directors approved an increase to MeadWestvaco’squarterly dividend payment from $0.23 to $0.25 per share. Management currently expects that comparable cashdividends will continue to be paid in the future.
(d) Stock repurchases
The company did not repurchase any shares in the fourth quarter of 2010. At December 31, 2010, there were3.2 million shares available for purchase under currently existing authorized stock repurchase plans.
13
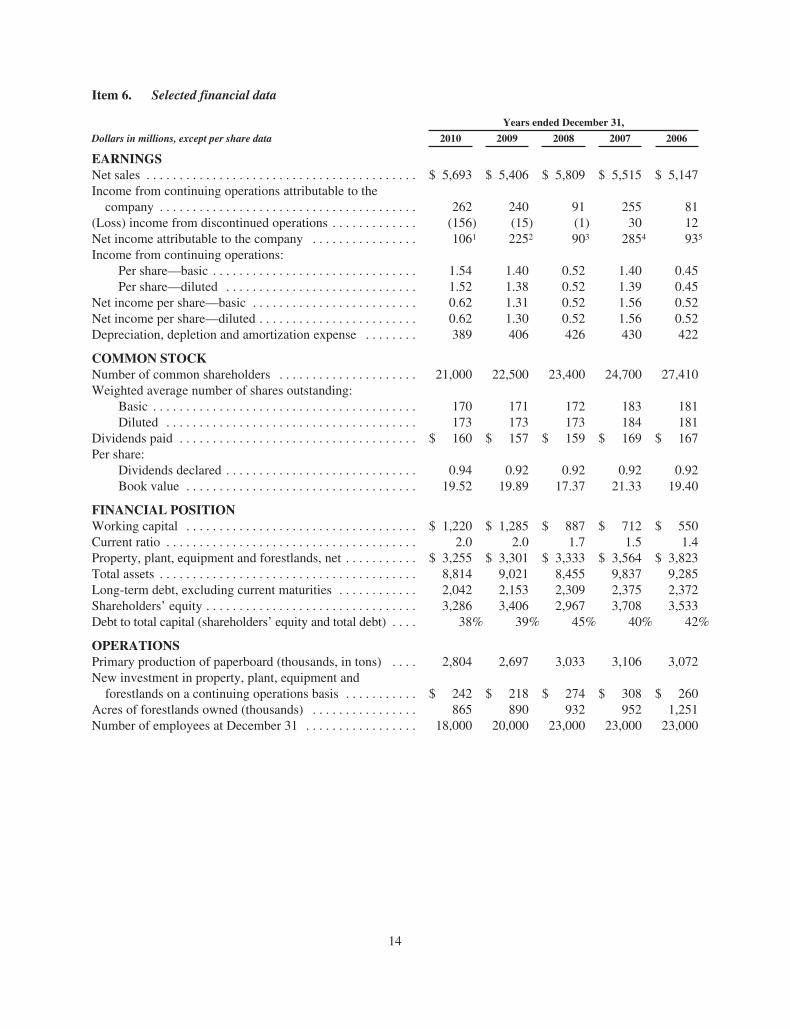
Item 6. Selected financial data
Years ended December 31,
Dollars in millions, except per share data 2010 2009 2008 2007 2006
EARNINGSNet sales . . . . . . . . . . . . . . . . . . . . . . . . . . . . . . . . . . . . . . . . . $ 5,693 $ 5,406 $ 5,809 $ 5,515 $ 5,147Income from continuing operations attributable to thecompany . . . . . . . . . . . . . . . . . . . . . . . . . . . . . . . . . . . . . . . 262 240 91 255 81
(Loss) income from discontinued operations . . . . . . . . . . . . . (156) (15) (1) 30 12Net income attributable to the company . . . . . . . . . . . . . . . . 1061 2252 903 2854 935
Income from continuing operations:Per share—basic . . . . . . . . . . . . . . . . . . . . . . . . . . . . . . . 1.54 1.40 0.52 1.40 0.45Per share—diluted . . . . . . . . . . . . . . . . . . . . . . . . . . . . . 1.52 1.38 0.52 1.39 0.45
Net income per share—basic . . . . . . . . . . . . . . . . . . . . . . . . . 0.62 1.31 0.52 1.56 0.52Net income per share—diluted . . . . . . . . . . . . . . . . . . . . . . . . 0.62 1.30 0.52 1.56 0.52Depreciation, depletion and amortization expense . . . . . . . . 389 406 426 430 422
COMMON STOCKNumber of common shareholders . . . . . . . . . . . . . . . . . . . . . 21,000 22,500 23,400 24,700 27,410Weighted average number of shares outstanding:
Basic . . . . . . . . . . . . . . . . . . . . . . . . . . . . . . . . . . . . . . . . 170 171 172 183 181Diluted . . . . . . . . . . . . . . . . . . . . . . . . . . . . . . . . . . . . . . 173 173 173 184 181
Dividends paid . . . . . . . . . . . . . . . . . . . . . . . . . . . . . . . . . . . . $ 160 $ 157 $ 159 $ 169 $ 167Per share:
Dividends declared . . . . . . . . . . . . . . . . . . . . . . . . . . . . . 0.94 0.92 0.92 0.92 0.92Book value . . . . . . . . . . . . . . . . . . . . . . . . . . . . . . . . . . . 19.52 19.89 17.37 21.33 19.40
FINANCIAL POSITIONWorking capital . . . . . . . . . . . . . . . . . . . . . . . . . . . . . . . . . . . $ 1,220 $ 1,285 $ 887 $ 712 $ 550Current ratio . . . . . . . . . . . . . . . . . . . . . . . . . . . . . . . . . . . . . . 2.0 2.0 1.7 1.5 1.4Property, plant, equipment and forestlands, net . . . . . . . . . . . $ 3,255 $ 3,301 $ 3,333 $ 3,564 $ 3,823Total assets . . . . . . . . . . . . . . . . . . . . . . . . . . . . . . . . . . . . . . . 8,814 9,021 8,455 9,837 9,285Long-term debt, excluding current maturities . . . . . . . . . . . . 2,042 2,153 2,309 2,375 2,372Shareholders’ equity . . . . . . . . . . . . . . . . . . . . . . . . . . . . . . . . 3,286 3,406 2,967 3,708 3,533Debt to total capital (shareholders’ equity and total debt) . . . . 38% 39% 45% 40% 42%
OPERATIONSPrimary production of paperboard (thousands, in tons) . . . . 2,804 2,697 3,033 3,106 3,072New investment in property, plant, equipment andforestlands on a continuing operations basis . . . . . . . . . . . $ 242 $ 218 $ 274 $ 308 $ 260
Acres of forestlands owned (thousands) . . . . . . . . . . . . . . . . 865 890 932 952 1,251Number of employees at December 31 . . . . . . . . . . . . . . . . . 18,000 20,000 23,000 23,000 23,000
14
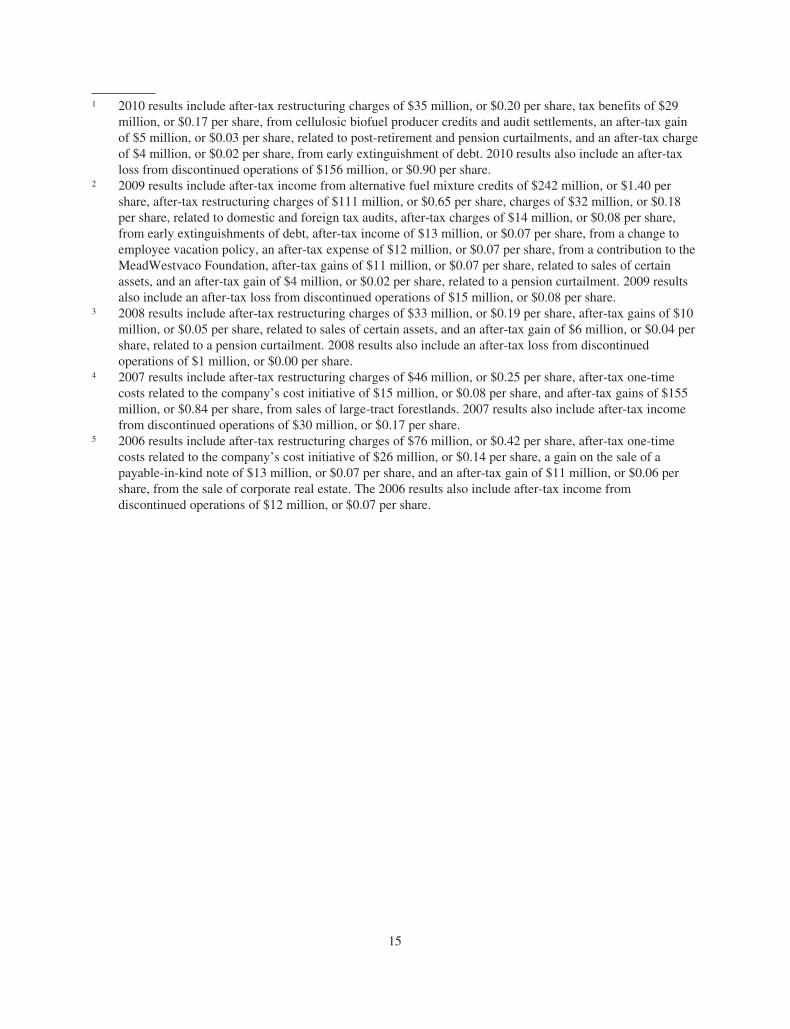
1 2010 results include after-tax restructuring charges of $35 million, or $0.20 per share, tax benefits of $29million, or $0.17 per share, from cellulosic biofuel producer credits and audit settlements, an after-tax gainof $5 million, or $0.03 per share, related to post-retirement and pension curtailments, and an after-tax chargeof $4 million, or $0.02 per share, from early extinguishment of debt. 2010 results also include an after-taxloss from discontinued operations of $156 million, or $0.90 per share.
2 2009 results include after-tax income from alternative fuel mixture credits of $242 million, or $1.40 pershare, after-tax restructuring charges of $111 million, or $0.65 per share, charges of $32 million, or $0.18per share, related to domestic and foreign tax audits, after-tax charges of $14 million, or $0.08 per share,from early extinguishments of debt, after-tax income of $13 million, or $0.07 per share, from a change toemployee vacation policy, an after-tax expense of $12 million, or $0.07 per share, from a contribution to theMeadWestvaco Foundation, after-tax gains of $11 million, or $0.07 per share, related to sales of certainassets, and an after-tax gain of $4 million, or $0.02 per share, related to a pension curtailment. 2009 resultsalso include an after-tax loss from discontinued operations of $15 million, or $0.08 per share.
3 2008 results include after-tax restructuring charges of $33 million, or $0.19 per share, after-tax gains of $10million, or $0.05 per share, related to sales of certain assets, and an after-tax gain of $6 million, or $0.04 pershare, related to a pension curtailment. 2008 results also include an after-tax loss from discontinuedoperations of $1 million, or $0.00 per share.
4 2007 results include after-tax restructuring charges of $46 million, or $0.25 per share, after-tax one-timecosts related to the company’s cost initiative of $15 million, or $0.08 per share, and after-tax gains of $155million, or $0.84 per share, from sales of large-tract forestlands. 2007 results also include after-tax incomefrom discontinued operations of $30 million, or $0.17 per share.
5 2006 results include after-tax restructuring charges of $76 million, or $0.42 per share, after-tax one-timecosts related to the company’s cost initiative of $26 million, or $0.14 per share, a gain on the sale of apayable-in-kind note of $13 million, or $0.07 per share, and an after-tax gain of $11 million, or $0.06 pershare, from the sale of corporate real estate. The 2006 results also include after-tax income fromdiscontinued operations of $12 million, or $0.07 per share.
15
Item 7. Management’s discussion and analysis of financial condition and results of operations
OVERVIEW
For the year ended December 31, 2010, MeadWestvaco Corporation (“MeadWestvaco”, “MWV,” or the“company”) reported net income attributable to the company from continuing operations of $262 million, or$1.52 per share. These results include after-tax restructuring charges of $35 million, or $0.20 per share, taxbenefits from cellulosic biofuel producer credits and audit settlements of $29 million, or $0.17 per share,after-tax gains from pension curtailments of $5 million, or $0.03 per share, and a charge from earlyextinguishment of debt of $4 million, or $0.02 per share. Comparable results for prior years are noted later in thisdiscussion.
Sales from continuing operations increased 5% to $5.69 billion in 2010 compared to $5.41 billion in 2009.Increased sales were driven by higher volumes and improved pricing and product mix resulting from strongcommercial execution in MWV’s targeted global markets, as well as from favorable foreign currency exchangecompared to 2009. These positive effects on sales in 2010 were partially offset by negative volume impactsstemming from continued strategic exits from low-return products. Participation in emerging markets, includingAsia and Brazil, continues to produce favorable results with related sales increasing 15% in 2010. Revenues fromemerging markets currently comprise approximately 27% of the company’s total sales.
Pre-tax earnings on a continuing operations basis from the company’s segments increased 29% to $731million in 2010 compared to $568 million in 2009. Improved results reflect MWV’s continued success ofgrowing profitably in attractive global packaging and other markets, reducing overhead costs and improving theoverall productivity of the company’s manufacturing facilities and supply chain. All of the manufacturingsegments contributed to the significant year-over-year improvement, with strong earnings from the packagingand specialty chemicals businesses.
The company’s liquidity and financial position remain excellent and cash flow from continuing operationstotaled $551 million in 2010. Strong free cash flow in 2010 allowed the company to repay debt prior to scheduledmaturities of $120 million, as well as repurchase and retire 3.9 million shares of MWV’s common stock for $92million. During 2010, the company paid $160 million of dividends to shareholders and increased its quarterlydividend approximately 9% to $0.25 per share in the fourth quarter. The company’s U.S. qualified retirementplans remain well over funded and management does not anticipate any required regulatory funding contributionsto such plans in the foreseeable future.
Looking ahead to the first half of 2011, the company expects to achieve year-over-year margin and earningsimprovement. Positive factors in the company’s outlook include stable to strengthening demand trends intargeted global markets along with continued momentum with commercial strategies focused on business miximprovement and further penetration in growing emerging markets. The company also expects to achieveadditional improvements in productivity across its manufacturing platform. Negative factors in the company’soutlook include higher costs for energy, freight and certain raw materials due to the rising price of oil. Thecompany is continuing to monitor ongoing macro-economic developments and is prepared to respond toadditional challenges.
Certain statements in this document and elsewhere by management of the company that are neither reportedfinancial results nor other historical information are “forward-looking statements” within the meaning of thePrivate Securities Litigation Reform Act of 1995. Refer to the “Forward-looking Statements” section locatedlater in this document.
On November 30, 2010, the company acquired a leading trigger sprayer manufacturer with operationslocated in Europe for $60 million. The all-plastic product portfolio of this business is used throughout householdand industrial cleaning, automotive and agricultural markets. This acquisition better positions MWV for growthin these global markets, and further meets consumer demand for more ergonomic, high-performing and
16
environment-friendly products. Refer to Note Q of Notes to Consolidated Financial Statements included in PartII, Item 8 for further information.
On September 30, 2010, the company completed the sale of its media and entertainment packaging business.On February 1, 2011, the company completed the sale of its envelope products business. For the current- andprior-year periods, the company is reporting these businesses as discontinued operations in the consolidatedfinancial statements. Results from discontinued operations in 2010 were an after-tax loss of $156 millionreflecting a combined after-tax loss of $141 million in accounting for these dispositions and a combined after-taxloss of $15 million from operations. Refer to Note R of Notes to Consolidated Financial Statements included inPart II, Item 8 for further information.
RESULTS OF OPERATIONS
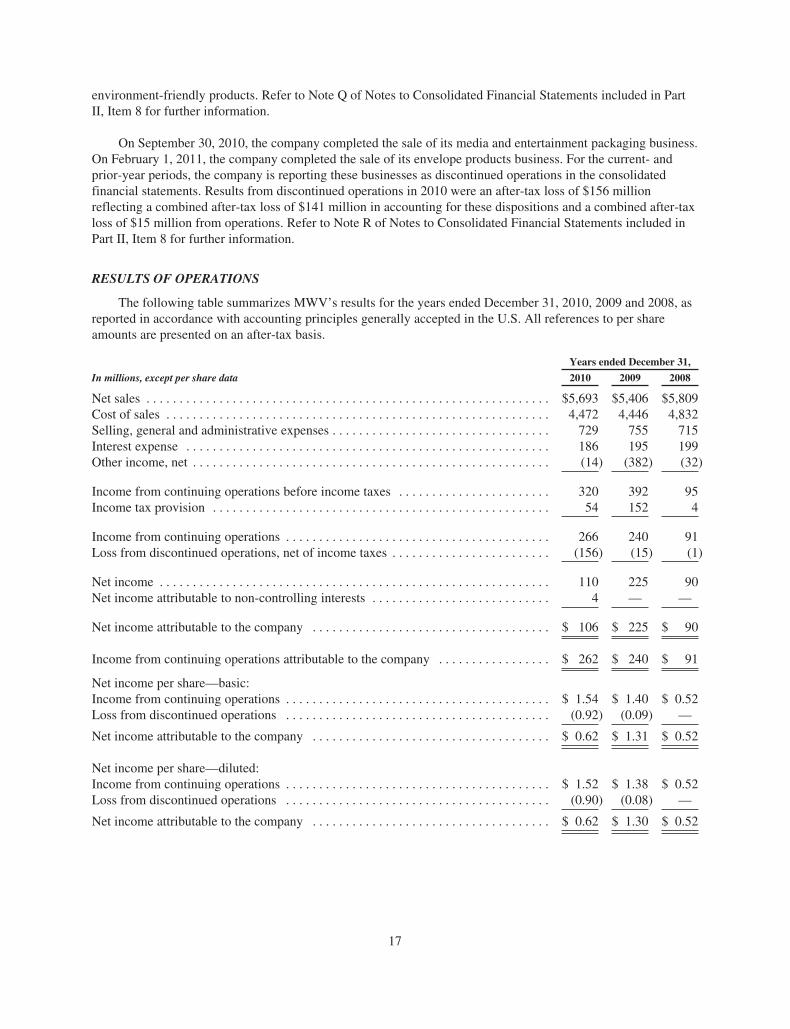
The following table summarizes MWV’s results for the years ended December 31, 2010, 2009 and 2008, asreported in accordance with accounting principles generally accepted in the U.S. All references to per shareamounts are presented on an after-tax basis.
Years ended December 31,
In millions, except per share data 2010 2009 2008
Net sales . . . . . . . . . . . . . . . . . . . . . . . . . . . . . . . . . . . . . . . . . . . . . . . . . . . . . . . . . . . . . $5,693 $5,406 $5,809Cost of sales . . . . . . . . . . . . . . . . . . . . . . . . . . . . . . . . . . . . . . . . . . . . . . . . . . . . . . . . . . 4,472 4,446 4,832Selling, general and administrative expenses . . . . . . . . . . . . . . . . . . . . . . . . . . . . . . . . . 729 755 715Interest expense . . . . . . . . . . . . . . . . . . . . . . . . . . . . . . . . . . . . . . . . . . . . . . . . . . . . . . . 186 195 199Other income, net . . . . . . . . . . . . . . . . . . . . . . . . . . . . . . . . . . . . . . . . . . . . . . . . . . . . . . (14) (382) (32)
Income from continuing operations before income taxes . . . . . . . . . . . . . . . . . . . . . . . 320 392 95Income tax provision . . . . . . . . . . . . . . . . . . . . . . . . . . . . . . . . . . . . . . . . . . . . . . . . . . . 54 152 4
Income from continuing operations . . . . . . . . . . . . . . . . . . . . . . . . . . . . . . . . . . . . . . . . 266 240 91Loss from discontinued operations, net of income taxes . . . . . . . . . . . . . . . . . . . . . . . . (156) (15) (1)
Net income . . . . . . . . . . . . . . . . . . . . . . . . . . . . . . . . . . . . . . . . . . . . . . . . . . . . . . . . . . . 110 225 90Net income attributable to non-controlling interests . . . . . . . . . . . . . . . . . . . . . . . . . . . 4 — —
Net income attributable to the company . . . . . . . . . . . . . . . . . . . . . . . . . . . . . . . . . . . . $ 106 $ 225 $ 90
Income from continuing operations attributable to the company . . . . . . . . . . . . . . . . . $ 262 $ 240 $ 91
Net income per share—basic:Income from continuing operations . . . . . . . . . . . . . . . . . . . . . . . . . . . . . . . . . . . . . . . . $ 1.54 $ 1.40 $ 0.52Loss from discontinued operations . . . . . . . . . . . . . . . . . . . . . . . . . . . . . . . . . . . . . . . . (0.92) (0.09) —
Net income attributable to the company . . . . . . . . . . . . . . . . . . . . . . . . . . . . . . . . . . . . $ 0.62 $ 1.31 $ 0.52
Net income per share—diluted:Income from continuing operations . . . . . . . . . . . . . . . . . . . . . . . . . . . . . . . . . . . . . . . . $ 1.52 $ 1.38 $ 0.52Loss from discontinued operations . . . . . . . . . . . . . . . . . . . . . . . . . . . . . . . . . . . . . . . . (0.90) (0.08) —
Net income attributable to the company . . . . . . . . . . . . . . . . . . . . . . . . . . . . . . . . . . . . $ 0.62 $ 1.30 $ 0.52
17
Comparison of Years ended December 31, 2010 and 2009
Sales from continuing operations were $5.69 billion and $5.41 billion for the years ended December 31,2010 and 2009, respectively. Increased sales were driven by higher volumes and improved pricing and productmix resulting from strong commercial execution in MWV’s targeted global markets, as well as from favorableforeign currency exchange compared to 2009. These positive effects on sales in 2010 were partially offset bynegative volume impacts stemming from continued strategic exits from low-return products. Participation inemerging markets, including Asia and Brazil, continues to produce favorable results with related sales increasing15% in 2010. Revenues from emerging markets currently comprise approximately 27% of the company’s totalsales. Refer to the individual segment discussion that follows for detailed sales information.
Costs of sales were $4.47 billion and $4.45 billion for the years ended December 31, 2010 and 2009,respectively. During 2010, increased costs due to higher volumes and input cost inflation for certain rawmaterials and freight more than offset the benefits from productivity improvements and overhead cost reductionscompared to 2009. In 2010, input costs for energy, raw materials and freight included in cost of sales were $110million higher compared to 2009. Restructuring charges included in cost of sales were $35 million and $137million in 2010 and 2009, respectively.
Selling, general and administrative expenses were $729 million and $755 million for the years endedDecember 31, 2010 and 2009, respectively. Benefits in 2010 from productivity initiatives and overhead reductionactions more than offset increased costs associated with investments for new product development and toaccelerate profitable growth in emerging markets, as well as increased costs of implementing informationtechnology systems and related processes for certain European operations compared to 2009. Restructuringcharges included in selling, general and administrative expenses were $18 million and $36 million in 2010 and2009, respectively.
Pension income from continuing operations was $78 million and $73 million for the years endedDecember 31, 2010 and 2009, respectively. Pension income from continuing operations includes curtailmentgains of $2 million and $6 million in 2010 and 2009, respectively, pursuant to employee reductions associatedwith the company’s 2008 and 2005 strategic cost management programs. Pension income is included inCorporate and Other for segment reporting purposes. Pension income is expected to be about $80 million in2011.
Interest expense was $186 million for the year ended December 31, 2010 and was comprised of $154million related to bond and bank debt, $2 million related to a long-term obligation non-recourse to MWV, $20million related to borrowings under life insurance policies and $10 million related to other borrowings. Interestexpense was $195 million for the year ended December 31, 2009 and was comprised of $157 million related tobond and bank debt, $4 million related to a long-term obligation non-recourse to MWV, $20 million related toborrowings under life insurance policies and $14 million related to other borrowings.
18
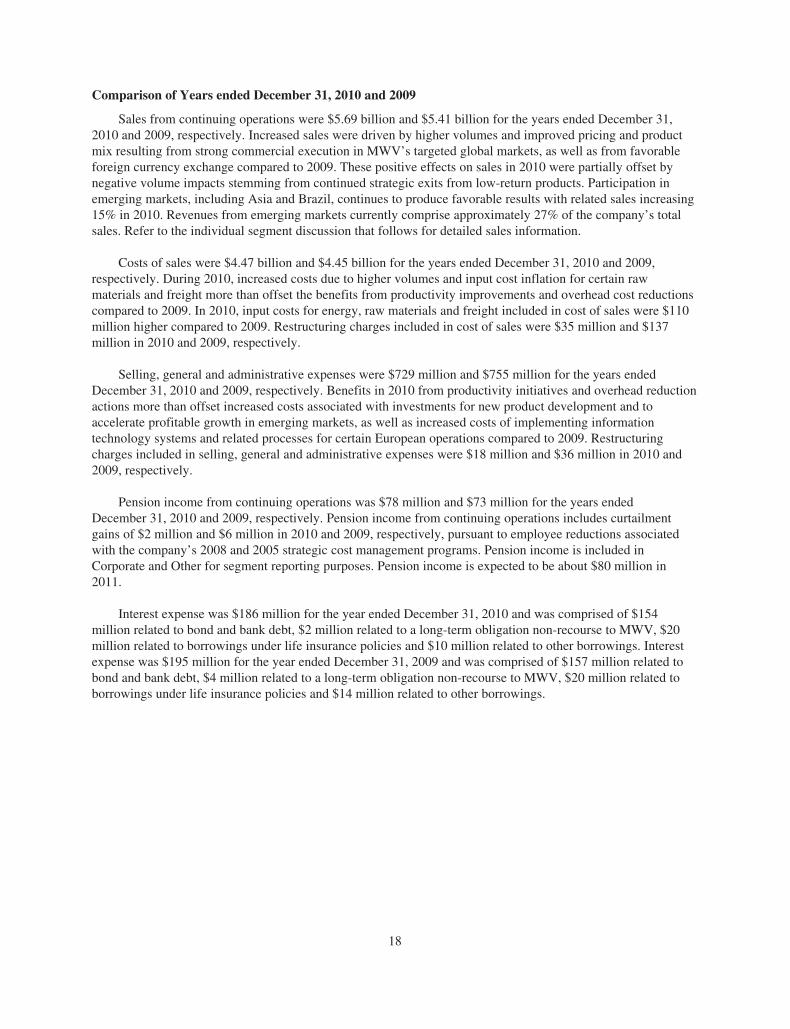
Other income, net was $14 million and $382 million for the years ended December 31, 2010 and 2009,respectively, and was comprised of the following:
Years ended December 31,
In millions 2010 2009
Interest income . . . . . . . . . . . . . . . . . . . . . . . . . . . . . . . . . . . . . . . . . . . . . . . . . $ (22) $ (18)Charges from early extinguishments of debt . . . . . . . . . . . . . . . . . . . . . . . . . . 6 23Foreign currency exchange losses (gains) . . . . . . . . . . . . . . . . . . . . . . . . . . . . 4 (2)Gains on sales of assets . . . . . . . . . . . . . . . . . . . . . . . . . . . . . . . . . . . . . . . . . . . — (16)Alternative fuel mixture credit 1 . . . . . . . . . . . . . . . . . . . . . . . . . . . . . . . . . . . . — (375)Other, net . . . . . . . . . . . . . . . . . . . . . . . . . . . . . . . . . . . . . . . . . . . . . . . . . . . . . (2) 6
$ (14) $(382)
1 Through December 31, 2009, the U.S. Internal Revenue Code allowed an excise tax credit for alternativefuel mixtures produced by a taxpayer for use as a fuel in a taxpayer’s trade or business.
The company’s effective tax rate attributable to continuing operations was 17% and 39% for the years endedDecember 31, 2010 and 2009, respectively. The lower effective tax rate in 2010 compared to 2009 was primarilydue to the mix and levels of pre-tax earnings between the company’s domestic and foreign operations, includingpre-tax domestic income of $375 million from alternative fuel mixture credits in 2009, as well as the effects fromcertain items in 2010 including tax benefits from an internal reorganization of a domestic entity, tax benefitsfrom the Cellulosic Biofuel Producer Credit and tax charges from domestic and foreign tax audits.
In addition to the information discussed above, the following sections discuss the results of operations foreach of the company’s segments and certain items included in Corporate and Other. MWV’s segments are(i) Packaging Resources, (ii) Consumer Solutions, (iii) Consumer & Office Products, (iv) Specialty Chemicals,and (v) Community Development and Land Management. Refer to Note T of Notes to Consolidated FinancialStatements included in Part II, Item 8 for a reconciliation of the sum of the results of the segments and Corporateand Other to consolidated income from continuing operations attributable to the company before income taxes.Restructuring charges are included in Corporate and Other for segment reporting purposes. Refer to thediscussion included in “Significant Transactions” herein below for restructuring charges attributable to thecompany’s segments.
19
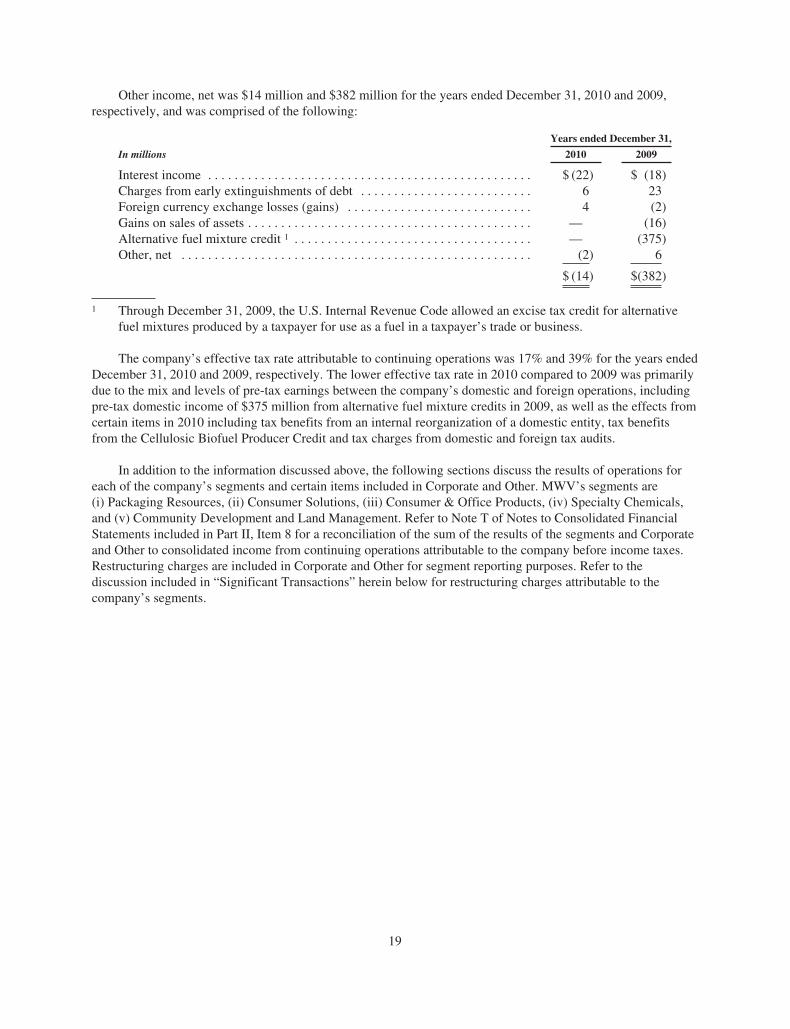
Packaging Resources
Years ended December 31,
In millions 2010 2009
Sales . . . . . . . . . . . . . . . . . . . . . . . . . . . . . . . . . . . . . . . . . . . . . . . . . . . . . . . . . $2,670 $2,446Segment profit 1 . . . . . . . . . . . . . . . . . . . . . . . . . . . . . . . . . . . . . . . . . . . . . . . . 257 182
1 Segment profit is measured as results before restructuring charges, pension income, interest expense andincome, income taxes, and non-controlling interest income and losses.
The Packaging Resources segment produces paperboard used in packaging for food, beverage, tobacco,healthcare, and beauty and personal care markets. This segment’s products include bleached paperboard (“SBS”)and Coated Natural Kraft® paperboard (“CNK®”) that are manufactured at three mills located in the U.S. andcorrugated packaging that is manufactured at two mills located in Brazil. SBS is used for packaging high-valueconsumer products including frozen and dry food, aseptic liquid packaging, disposable cups, tobacco, cosmeticsand pharmaceuticals. CNK® is used for a range of packaging applications, the largest of which for MWV ismulti-pack beverage packaging and food packaging. MWV’s corrugated packaging business is focused on freshproduce, frozen meat and consumer products markets in South America.
Sales for the Packaging Resources segment were $2.67 billion in 2010 compared to $2.45 billion in 2009.Sales increased in 2010 due to higher volume and improved pricing and product mix, as well as from favorableforeign currency exchange compared to 2009. Shipments of SBS were approximately 1,363,000 tons in 2010,relatively unchanged from 2009. Shipments of CNK® were 1,013,000 tons in 2010, up 6% from 2009, as demandcontinued to recover for beverage and retail food packaging. In 2010, SBS prices were up 6% while CNK® priceswere relatively unchanged compared to 2009. Backlogs for SBS and CNK® are currently at four to five weeks.Sales by the segment’s Brazilian operation, Rigesa, were 24% higher in 2010 due to favorable foreign currencyexchange and improved pricing and product mix, as well as from increased volume compared to 2009.
Profit for the Packaging Resources segment was $257 million in 2010 compared to $182 million in 2009.Profit in 2010 benefited by $122 million from improved pricing and product mix, $64 million from productivityinitiatives and overhead reduction actions and $18 million from increased volume compared to 2009. Profit in2010 was negatively impacted by $97 million from input cost inflation for certain raw materials and freight, $25million from increased costs due to reduced fiber availability from severe weather in the U.S. during the firstquarter of 2010 and $7 million from foreign currency exchange and other items compared to 2009.
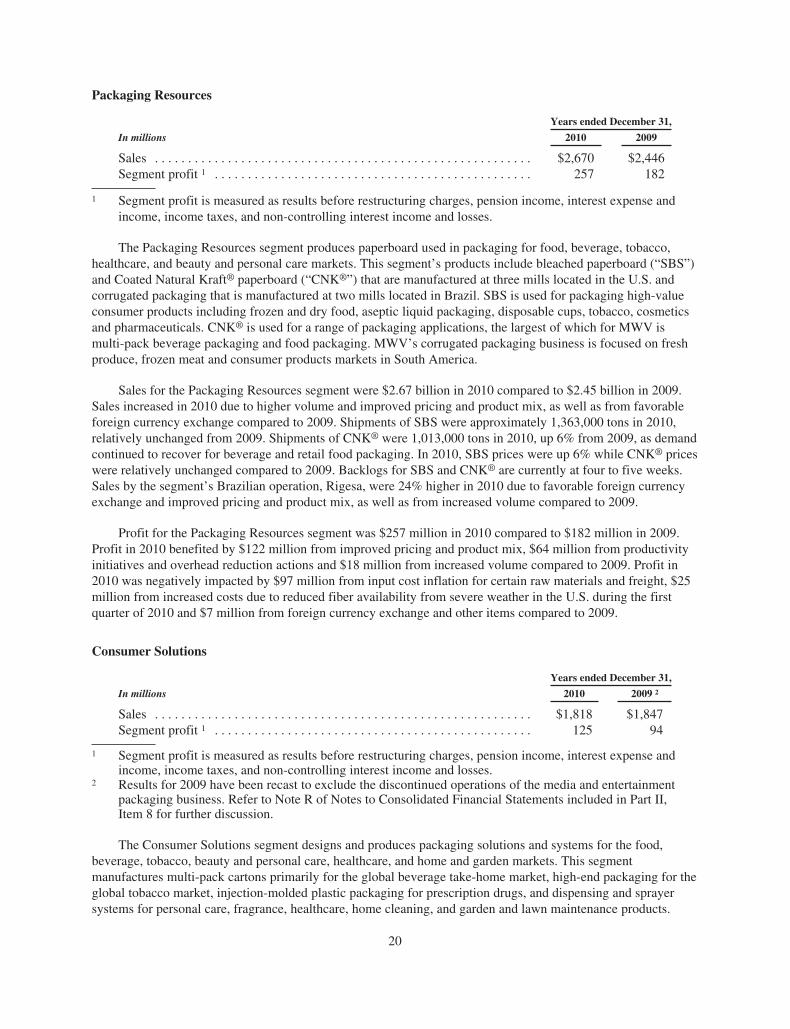
Consumer Solutions
Years ended December 31,
In millions 2010 2009 2
Sales . . . . . . . . . . . . . . . . . . . . . . . . . . . . . . . . . . . . . . . . . . . . . . . . . . . . . . . . . $1,818 $1,847Segment profit 1 . . . . . . . . . . . . . . . . . . . . . . . . . . . . . . . . . . . . . . . . . . . . . . . . 125 94
1 Segment profit is measured as results before restructuring charges, pension income, interest expense andincome, income taxes, and non-controlling interest income and losses.
2 Results for 2009 have been recast to exclude the discontinued operations of the media and entertainmentpackaging business. Refer to Note R of Notes to Consolidated Financial Statements included in Part II,Item 8 for further discussion.
The Consumer Solutions segment designs and produces packaging solutions and systems for the food,beverage, tobacco, beauty and personal care, healthcare, and home and garden markets. This segmentmanufactures multi-pack cartons primarily for the global beverage take-home market, high-end packaging for theglobal tobacco market, injection-molded plastic packaging for prescription drugs, and dispensing and sprayersystems for personal care, fragrance, healthcare, home cleaning, and garden and lawn maintenance products.
20
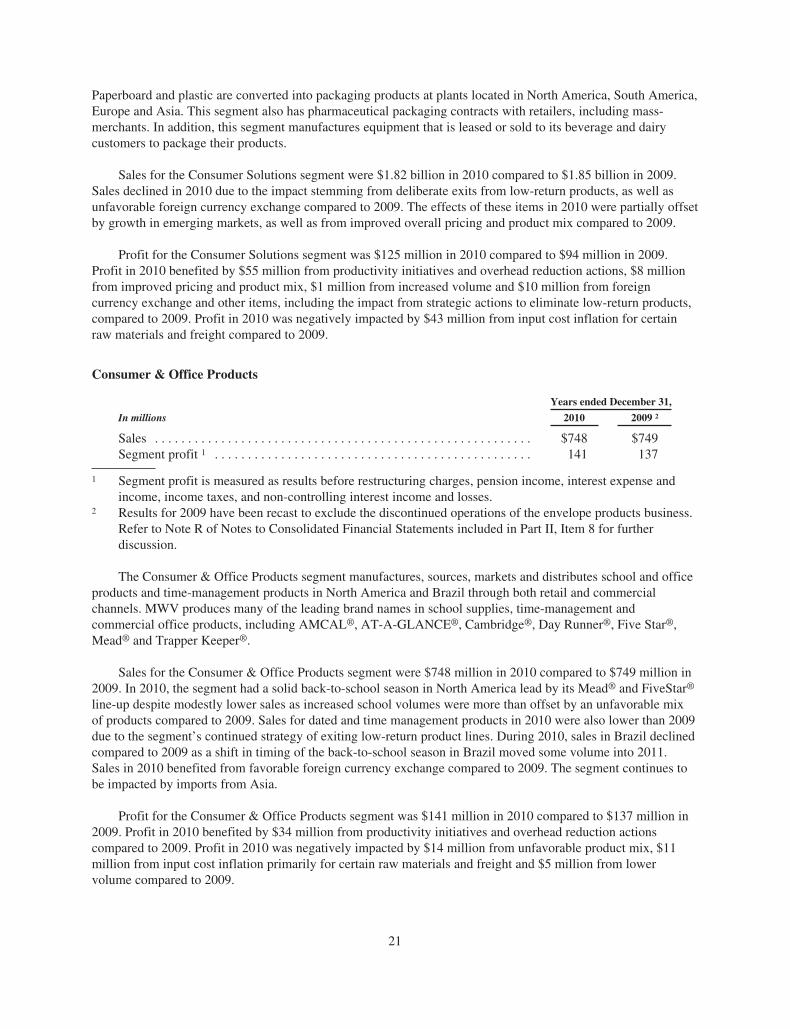
Paperboard and plastic are converted into packaging products at plants located in North America, South America,Europe and Asia. This segment also has pharmaceutical packaging contracts with retailers, including mass-merchants. In addition, this segment manufactures equipment that is leased or sold to its beverage and dairycustomers to package their products.
Sales for the Consumer Solutions segment were $1.82 billion in 2010 compared to $1.85 billion in 2009.Sales declined in 2010 due to the impact stemming from deliberate exits from low-return products, as well asunfavorable foreign currency exchange compared to 2009. The effects of these items in 2010 were partially offsetby growth in emerging markets, as well as from improved overall pricing and product mix compared to 2009.
Profit for the Consumer Solutions segment was $125 million in 2010 compared to $94 million in 2009.Profit in 2010 benefited by $55 million from productivity initiatives and overhead reduction actions, $8 millionfrom improved pricing and product mix, $1 million from increased volume and $10 million from foreigncurrency exchange and other items, including the impact from strategic actions to eliminate low-return products,compared to 2009. Profit in 2010 was negatively impacted by $43 million from input cost inflation for certainraw materials and freight compared to 2009.
Consumer & Office Products
Years ended December 31,
In millions 2010 2009 2
Sales . . . . . . . . . . . . . . . . . . . . . . . . . . . . . . . . . . . . . . . . . . . . . . . . . . . . . . . . . $748 $749Segment profit 1 . . . . . . . . . . . . . . . . . . . . . . . . . . . . . . . . . . . . . . . . . . . . . . . . 141 137
1 Segment profit is measured as results before restructuring charges, pension income, interest expense andincome, income taxes, and non-controlling interest income and losses.
2 Results for 2009 have been recast to exclude the discontinued operations of the envelope products business.Refer to Note R of Notes to Consolidated Financial Statements included in Part II, Item 8 for furtherdiscussion.
The Consumer & Office Products segment manufactures, sources, markets and distributes school and officeproducts and time-management products in North America and Brazil through both retail and commercialchannels. MWV produces many of the leading brand names in school supplies, time-management andcommercial office products, including AMCAL®, AT-A-GLANCE®, Cambridge®, Day Runner®, Five Star®,Mead® and Trapper Keeper®.
Sales for the Consumer & Office Products segment were $748 million in 2010 compared to $749 million in2009. In 2010, the segment had a solid back-to-school season in North America lead by its Mead® and FiveStar®
line-up despite modestly lower sales as increased school volumes were more than offset by an unfavorable mixof products compared to 2009. Sales for dated and time management products in 2010 were also lower than 2009due to the segment’s continued strategy of exiting low-return product lines. During 2010, sales in Brazil declinedcompared to 2009 as a shift in timing of the back-to-school season in Brazil moved some volume into 2011.Sales in 2010 benefited from favorable foreign currency exchange compared to 2009. The segment continues tobe impacted by imports from Asia.
Profit for the Consumer & Office Products segment was $141 million in 2010 compared to $137 million in2009. Profit in 2010 benefited by $34 million from productivity initiatives and overhead reduction actionscompared to 2009. Profit in 2010 was negatively impacted by $14 million from unfavorable product mix, $11million from input cost inflation primarily for certain raw materials and freight and $5 million from lowervolume compared to 2009.
21
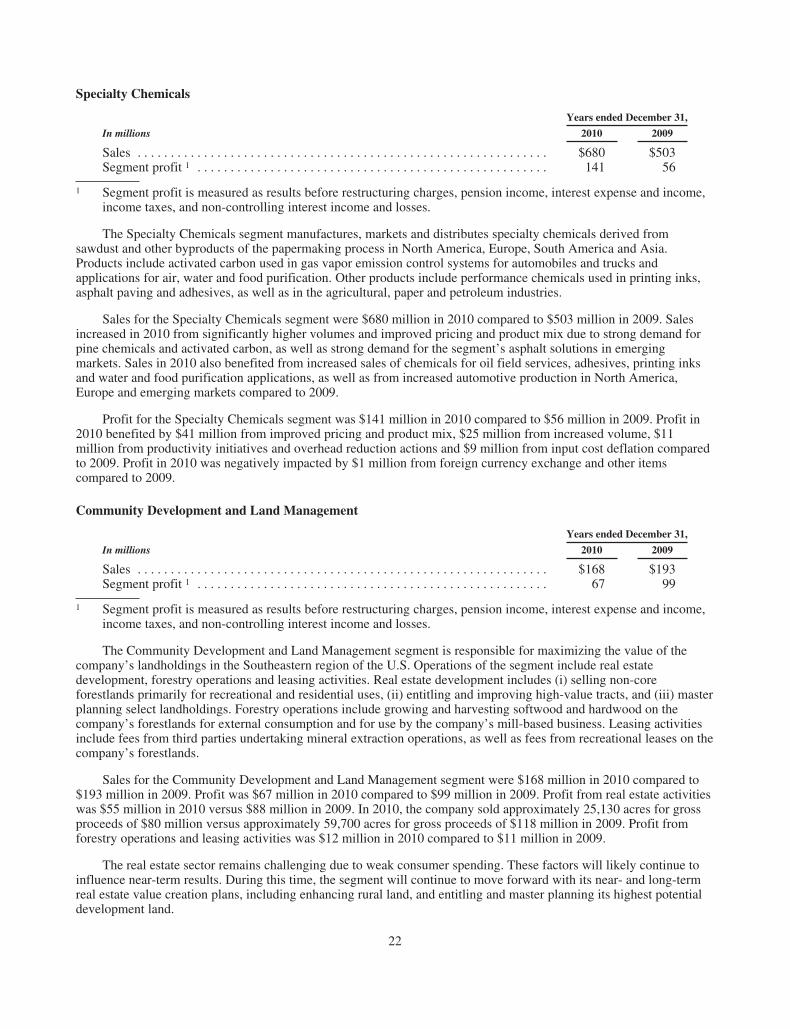
Specialty Chemicals
Years ended December 31,
In millions 2010 2009
Sales . . . . . . . . . . . . . . . . . . . . . . . . . . . . . . . . . . . . . . . . . . . . . . . . . . . . . . . . . . . . . . $680 $503Segment profit 1 . . . . . . . . . . . . . . . . . . . . . . . . . . . . . . . . . . . . . . . . . . . . . . . . . . . . . 141 56
1 Segment profit is measured as results before restructuring charges, pension income, interest expense and income,income taxes, and non-controlling interest income and losses.
The Specialty Chemicals segment manufactures, markets and distributes specialty chemicals derived fromsawdust and other byproducts of the papermaking process in North America, Europe, South America and Asia.Products include activated carbon used in gas vapor emission control systems for automobiles and trucks andapplications for air, water and food purification. Other products include performance chemicals used in printing inks,asphalt paving and adhesives, as well as in the agricultural, paper and petroleum industries.
Sales for the Specialty Chemicals segment were $680 million in 2010 compared to $503 million in 2009. Salesincreased in 2010 from significantly higher volumes and improved pricing and product mix due to strong demand forpine chemicals and activated carbon, as well as strong demand for the segment’s asphalt solutions in emergingmarkets. Sales in 2010 also benefited from increased sales of chemicals for oil field services, adhesives, printing inksand water and food purification applications, as well as from increased automotive production in North America,Europe and emerging markets compared to 2009.
Profit for the Specialty Chemicals segment was $141 million in 2010 compared to $56 million in 2009. Profit in2010 benefited by $41 million from improved pricing and product mix, $25 million from increased volume, $11million from productivity initiatives and overhead reduction actions and $9 million from input cost deflation comparedto 2009. Profit in 2010 was negatively impacted by $1 million from foreign currency exchange and other itemscompared to 2009.
Community Development and Land Management
Years ended December 31,
In millions 2010 2009
Sales . . . . . . . . . . . . . . . . . . . . . . . . . . . . . . . . . . . . . . . . . . . . . . . . . . . . . . . . . . . . . . $168 $193Segment profit 1 . . . . . . . . . . . . . . . . . . . . . . . . . . . . . . . . . . . . . . . . . . . . . . . . . . . . . 67 99
1 Segment profit is measured as results before restructuring charges, pension income, interest expense and income,income taxes, and non-controlling interest income and losses.
The Community Development and Land Management segment is responsible for maximizing the value of thecompany’s landholdings in the Southeastern region of the U.S. Operations of the segment include real estatedevelopment, forestry operations and leasing activities. Real estate development includes (i) selling non-coreforestlands primarily for recreational and residential uses, (ii) entitling and improving high-value tracts, and (iii) masterplanning select landholdings. Forestry operations include growing and harvesting softwood and hardwood on thecompany’s forestlands for external consumption and for use by the company’s mill-based business. Leasing activitiesinclude fees from third parties undertaking mineral extraction operations, as well as fees from recreational leases on thecompany’s forestlands.
Sales for the Community Development and Land Management segment were $168 million in 2010 compared to$193 million in 2009. Profit was $67 million in 2010 compared to $99 million in 2009. Profit from real estate activitieswas $55 million in 2010 versus $88 million in 2009. In 2010, the company sold approximately 25,130 acres for grossproceeds of $80 million versus approximately 59,700 acres for gross proceeds of $118 million in 2009. Profit fromforestry operations and leasing activities was $12 million in 2010 compared to $11 million in 2009.
The real estate sector remains challenging due to weak consumer spending. These factors will likely continue toinfluence near-term results. During this time, the segment will continue to move forward with its near- and long-termreal estate value creation plans, including enhancing rural land, and entitling and master planning its highest potentialdevelopment land.
22
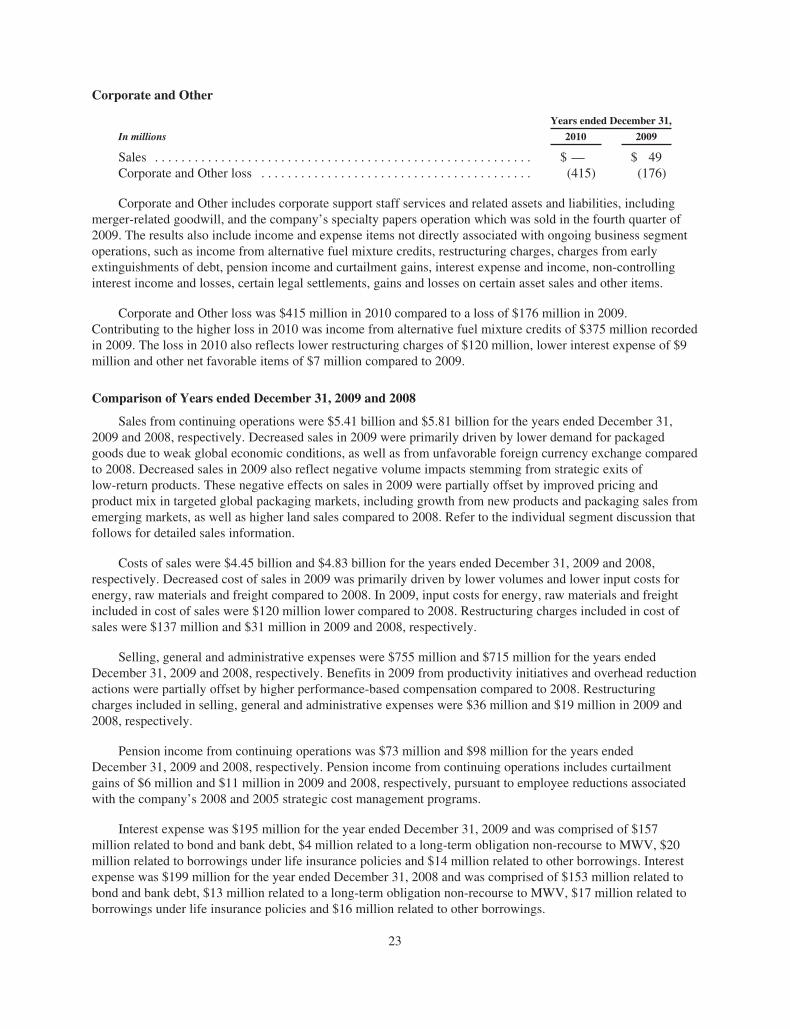
Corporate and Other
Years ended December 31,
In millions 2010 2009
Sales . . . . . . . . . . . . . . . . . . . . . . . . . . . . . . . . . . . . . . . . . . . . . . . . . . . . . . . . . $ — $ 49Corporate and Other loss . . . . . . . . . . . . . . . . . . . . . . . . . . . . . . . . . . . . . . . . . (415) (176)
Corporate and Other includes corporate support staff services and related assets and liabilities, includingmerger-related goodwill, and the company’s specialty papers operation which was sold in the fourth quarter of2009. The results also include income and expense items not directly associated with ongoing business segmentoperations, such as income from alternative fuel mixture credits, restructuring charges, charges from earlyextinguishments of debt, pension income and curtailment gains, interest expense and income, non-controllinginterest income and losses, certain legal settlements, gains and losses on certain asset sales and other items.
Corporate and Other loss was $415 million in 2010 compared to a loss of $176 million in 2009.Contributing to the higher loss in 2010 was income from alternative fuel mixture credits of $375 million recordedin 2009. The loss in 2010 also reflects lower restructuring charges of $120 million, lower interest expense of $9million and other net favorable items of $7 million compared to 2009.
Comparison of Years ended December 31, 2009 and 2008
Sales from continuing operations were $5.41 billion and $5.81 billion for the years ended December 31,2009 and 2008, respectively. Decreased sales in 2009 were primarily driven by lower demand for packagedgoods due to weak global economic conditions, as well as from unfavorable foreign currency exchange comparedto 2008. Decreased sales in 2009 also reflect negative volume impacts stemming from strategic exits oflow-return products. These negative effects on sales in 2009 were partially offset by improved pricing andproduct mix in targeted global packaging markets, including growth from new products and packaging sales fromemerging markets, as well as higher land sales compared to 2008. Refer to the individual segment discussion thatfollows for detailed sales information.
Costs of sales were $4.45 billion and $4.83 billion for the years ended December 31, 2009 and 2008,respectively. Decreased cost of sales in 2009 was primarily driven by lower volumes and lower input costs forenergy, raw materials and freight compared to 2008. In 2009, input costs for energy, raw materials and freightincluded in cost of sales were $120 million lower compared to 2008. Restructuring charges included in cost ofsales were $137 million and $31 million in 2009 and 2008, respectively.
Selling, general and administrative expenses were $755 million and $715 million for the years endedDecember 31, 2009 and 2008, respectively. Benefits in 2009 from productivity initiatives and overhead reductionactions were partially offset by higher performance-based compensation compared to 2008. Restructuringcharges included in selling, general and administrative expenses were $36 million and $19 million in 2009 and2008, respectively.
Pension income from continuing operations was $73 million and $98 million for the years endedDecember 31, 2009 and 2008, respectively. Pension income from continuing operations includes curtailmentgains of $6 million and $11 million in 2009 and 2008, respectively, pursuant to employee reductions associatedwith the company’s 2008 and 2005 strategic cost management programs.
Interest expense was $195 million for the year ended December 31, 2009 and was comprised of $157million related to bond and bank debt, $4 million related to a long-term obligation non-recourse to MWV, $20million related to borrowings under life insurance policies and $14 million related to other borrowings. Interestexpense was $199 million for the year ended December 31, 2008 and was comprised of $153 million related tobond and bank debt, $13 million related to a long-term obligation non-recourse to MWV, $17 million related toborrowings under life insurance policies and $16 million related to other borrowings.
23
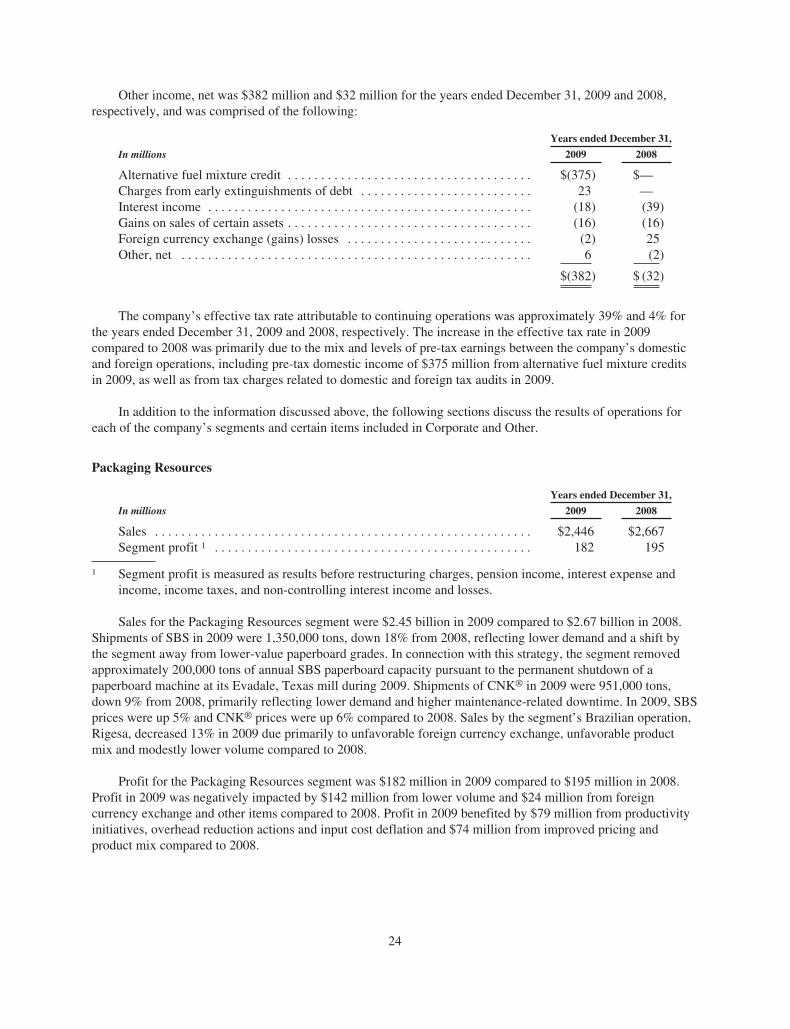
Other income, net was $382 million and $32 million for the years ended December 31, 2009 and 2008,respectively, and was comprised of the following:
Years ended December 31,
In millions 2009 2008
Alternative fuel mixture credit . . . . . . . . . . . . . . . . . . . . . . . . . . . . . . . . . . . . . $(375) $—Charges from early extinguishments of debt . . . . . . . . . . . . . . . . . . . . . . . . . . 23 —Interest income . . . . . . . . . . . . . . . . . . . . . . . . . . . . . . . . . . . . . . . . . . . . . . . . . (18) (39)Gains on sales of certain assets . . . . . . . . . . . . . . . . . . . . . . . . . . . . . . . . . . . . . (16) (16)Foreign currency exchange (gains) losses . . . . . . . . . . . . . . . . . . . . . . . . . . . . (2) 25Other, net . . . . . . . . . . . . . . . . . . . . . . . . . . . . . . . . . . . . . . . . . . . . . . . . . . . . . 6 (2)
$(382) $ (32)
The company’s effective tax rate attributable to continuing operations was approximately 39% and 4% forthe years ended December 31, 2009 and 2008, respectively. The increase in the effective tax rate in 2009compared to 2008 was primarily due to the mix and levels of pre-tax earnings between the company’s domesticand foreign operations, including pre-tax domestic income of $375 million from alternative fuel mixture creditsin 2009, as well as from tax charges related to domestic and foreign tax audits in 2009.
In addition to the information discussed above, the following sections discuss the results of operations foreach of the company’s segments and certain items included in Corporate and Other.
Packaging Resources
Years ended December 31,
In millions 2009 2008
Sales . . . . . . . . . . . . . . . . . . . . . . . . . . . . . . . . . . . . . . . . . . . . . . . . . . . . . . . . . $2,446 $2,667Segment profit 1 . . . . . . . . . . . . . . . . . . . . . . . . . . . . . . . . . . . . . . . . . . . . . . . . 182 195
1 Segment profit is measured as results before restructuring charges, pension income, interest expense andincome, income taxes, and non-controlling interest income and losses.
Sales for the Packaging Resources segment were $2.45 billion in 2009 compared to $2.67 billion in 2008.Shipments of SBS in 2009 were 1,350,000 tons, down 18% from 2008, reflecting lower demand and a shift bythe segment away from lower-value paperboard grades. In connection with this strategy, the segment removedapproximately 200,000 tons of annual SBS paperboard capacity pursuant to the permanent shutdown of apaperboard machine at its Evadale, Texas mill during 2009. Shipments of CNK® in 2009 were 951,000 tons,down 9% from 2008, primarily reflecting lower demand and higher maintenance-related downtime. In 2009, SBSprices were up 5% and CNK® prices were up 6% compared to 2008. Sales by the segment’s Brazilian operation,Rigesa, decreased 13% in 2009 due primarily to unfavorable foreign currency exchange, unfavorable productmix and modestly lower volume compared to 2008.
Profit for the Packaging Resources segment was $182 million in 2009 compared to $195 million in 2008.Profit in 2009 was negatively impacted by $142 million from lower volume and $24 million from foreigncurrency exchange and other items compared to 2008. Profit in 2009 benefited by $79 million from productivityinitiatives, overhead reduction actions and input cost deflation and $74 million from improved pricing andproduct mix compared to 2008.
24
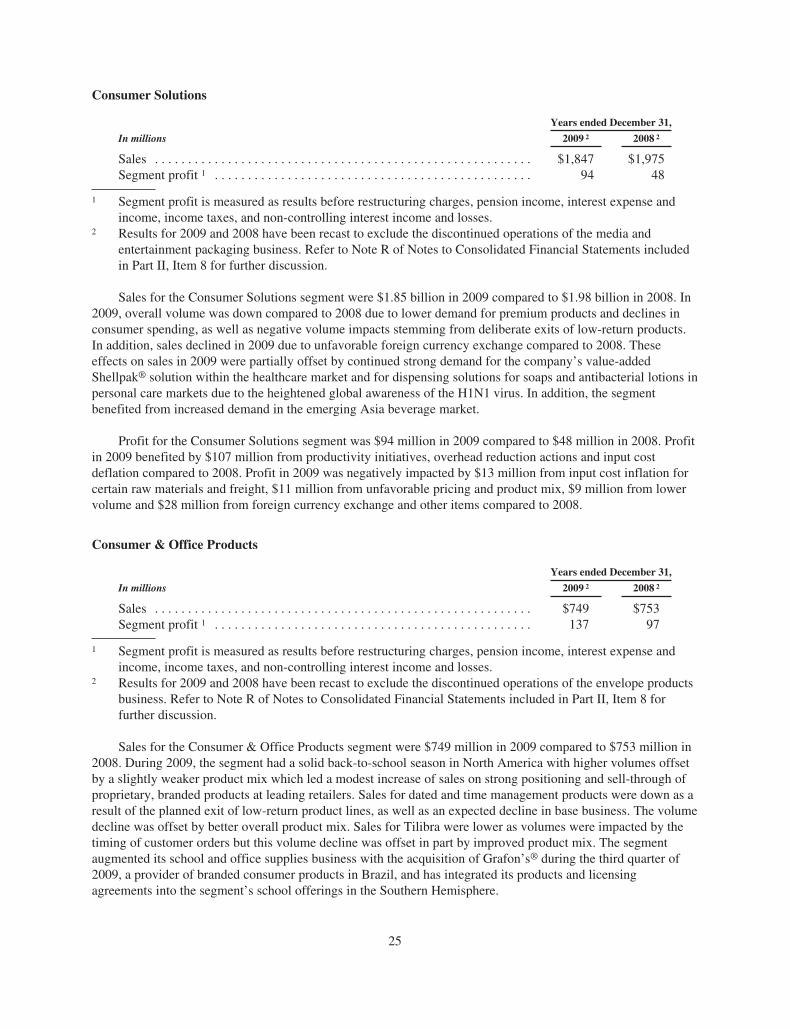
Consumer Solutions
Years ended December 31,
In millions 2009 2 2008 2
Sales . . . . . . . . . . . . . . . . . . . . . . . . . . . . . . . . . . . . . . . . . . . . . . . . . . . . . . . . . $1,847 $1,975Segment profit 1 . . . . . . . . . . . . . . . . . . . . . . . . . . . . . . . . . . . . . . . . . . . . . . . . 94 48
1 Segment profit is measured as results before restructuring charges, pension income, interest expense andincome, income taxes, and non-controlling interest income and losses.
2 Results for 2009 and 2008 have been recast to exclude the discontinued operations of the media andentertainment packaging business. Refer to Note R of Notes to Consolidated Financial Statements includedin Part II, Item 8 for further discussion.
Sales for the Consumer Solutions segment were $1.85 billion in 2009 compared to $1.98 billion in 2008. In2009, overall volume was down compared to 2008 due to lower demand for premium products and declines inconsumer spending, as well as negative volume impacts stemming from deliberate exits of low-return products.In addition, sales declined in 2009 due to unfavorable foreign currency exchange compared to 2008. Theseeffects on sales in 2009 were partially offset by continued strong demand for the company’s value-addedShellpak® solution within the healthcare market and for dispensing solutions for soaps and antibacterial lotions inpersonal care markets due to the heightened global awareness of the H1N1 virus. In addition, the segmentbenefited from increased demand in the emerging Asia beverage market.
Profit for the Consumer Solutions segment was $94 million in 2009 compared to $48 million in 2008. Profitin 2009 benefited by $107 million from productivity initiatives, overhead reduction actions and input costdeflation compared to 2008. Profit in 2009 was negatively impacted by $13 million from input cost inflation forcertain raw materials and freight, $11 million from unfavorable pricing and product mix, $9 million from lowervolume and $28 million from foreign currency exchange and other items compared to 2008.
Consumer & Office Products
Years ended December 31,
In millions 2009 2 2008 2
Sales . . . . . . . . . . . . . . . . . . . . . . . . . . . . . . . . . . . . . . . . . . . . . . . . . . . . . . . . . $749 $753Segment profit 1 . . . . . . . . . . . . . . . . . . . . . . . . . . . . . . . . . . . . . . . . . . . . . . . . 137 97
1 Segment profit is measured as results before restructuring charges, pension income, interest expense andincome, income taxes, and non-controlling interest income and losses.
2 Results for 2009 and 2008 have been recast to exclude the discontinued operations of the envelope productsbusiness. Refer to Note R of Notes to Consolidated Financial Statements included in Part II, Item 8 forfurther discussion.
Sales for the Consumer & Office Products segment were $749 million in 2009 compared to $753 million in2008. During 2009, the segment had a solid back-to-school season in North America with higher volumes offsetby a slightly weaker product mix which led a modest increase of sales on strong positioning and sell-through ofproprietary, branded products at leading retailers. Sales for dated and time management products were down as aresult of the planned exit of low-return product lines, as well as an expected decline in base business. The volumedecline was offset by better overall product mix. Sales for Tilibra were lower as volumes were impacted by thetiming of customer orders but this volume decline was offset in part by improved product mix. The segmentaugmented its school and office supplies business with the acquisition of Grafon’s® during the third quarter of2009, a provider of branded consumer products in Brazil, and has integrated its products and licensingagreements into the segment’s school offerings in the Southern Hemisphere.
25
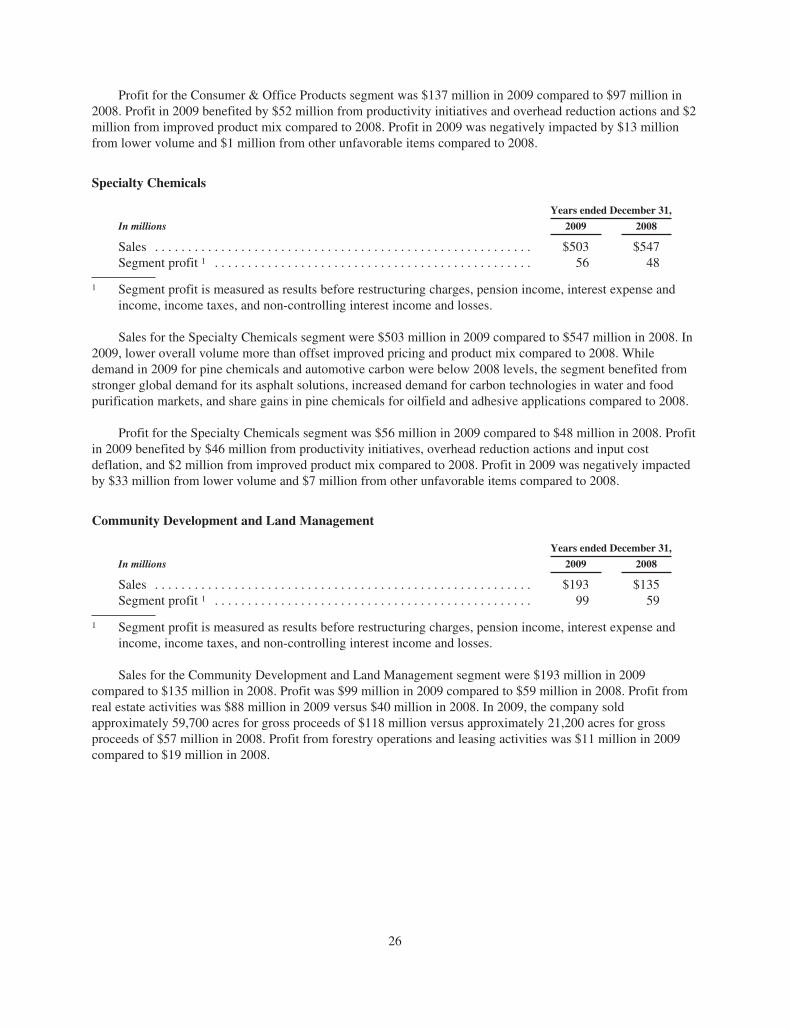
Profit for the Consumer & Office Products segment was $137 million in 2009 compared to $97 million in2008. Profit in 2009 benefited by $52 million from productivity initiatives and overhead reduction actions and $2million from improved product mix compared to 2008. Profit in 2009 was negatively impacted by $13 millionfrom lower volume and $1 million from other unfavorable items compared to 2008.
Specialty Chemicals
Years ended December 31,
In millions 2009 2008
Sales . . . . . . . . . . . . . . . . . . . . . . . . . . . . . . . . . . . . . . . . . . . . . . . . . . . . . . . . . $503 $547Segment profit 1 . . . . . . . . . . . . . . . . . . . . . . . . . . . . . . . . . . . . . . . . . . . . . . . . 56 48
1 Segment profit is measured as results before restructuring charges, pension income, interest expense andincome, income taxes, and non-controlling interest income and losses.
Sales for the Specialty Chemicals segment were $503 million in 2009 compared to $547 million in 2008. In2009, lower overall volume more than offset improved pricing and product mix compared to 2008. Whiledemand in 2009 for pine chemicals and automotive carbon were below 2008 levels, the segment benefited fromstronger global demand for its asphalt solutions, increased demand for carbon technologies in water and foodpurification markets, and share gains in pine chemicals for oilfield and adhesive applications compared to 2008.
Profit for the Specialty Chemicals segment was $56 million in 2009 compared to $48 million in 2008. Profitin 2009 benefited by $46 million from productivity initiatives, overhead reduction actions and input costdeflation, and $2 million from improved product mix compared to 2008. Profit in 2009 was negatively impactedby $33 million from lower volume and $7 million from other unfavorable items compared to 2008.
Community Development and Land Management
Years ended December 31,
In millions 2009 2008
Sales . . . . . . . . . . . . . . . . . . . . . . . . . . . . . . . . . . . . . . . . . . . . . . . . . . . . . . . . . $193 $135Segment profit 1 . . . . . . . . . . . . . . . . . . . . . . . . . . . . . . . . . . . . . . . . . . . . . . . . 99 59
1 Segment profit is measured as results before restructuring charges, pension income, interest expense andincome, income taxes, and non-controlling interest income and losses.
Sales for the Community Development and Land Management segment were $193 million in 2009compared to $135 million in 2008. Profit was $99 million in 2009 compared to $59 million in 2008. Profit fromreal estate activities was $88 million in 2009 versus $40 million in 2008. In 2009, the company soldapproximately 59,700 acres for gross proceeds of $118 million versus approximately 21,200 acres for grossproceeds of $57 million in 2008. Profit from forestry operations and leasing activities was $11 million in 2009compared to $19 million in 2008.
26

Corporate and Other
Years ended December 31,
In millions 2009 2008
Sales . . . . . . . . . . . . . . . . . . . . . . . . . . . . . . . . . . . . . . . . . . . . . . . . . . . . . . . . . $ 49 $ 106Corporate and Other loss . . . . . . . . . . . . . . . . . . . . . . . . . . . . . . . . . . . . . . . . . (176) (352)
Corporate and Other loss was $176 million in 2009 compared to a loss of $352 million in 2008.Contributing to the lower loss in 2009 was income from alternative fuel mixture credits of $375 million recordedin 2009. The loss in 2009 also reflects higher restructuring charges of $121 million, lower pension income of $25million, charges from the early extinguishments of debt of $23 million in 2009, an expense of $20 million from acontribution to the MeadWestvaco Foundation in 2009 and other net unfavorable items of $10 million comparedto 2008.
LIQUIDITY AND CAPITAL RESOURCES
Cash flow from continuing operations and the company’s current cash levels are expected to be adequate tofund scheduled debt payments, dividends to shareholders and the majority of MWV’s capital expenditures in2011. In addition, the company’s U.S. qualified retirement plans remain well over funded and management doesnot anticipate any required regulatory funding contributions to such plans in the foreseeable future.
Cash and cash equivalents totaled $790 million at December 31, 2010. The credit quality of the portfolio ofshort-term investments remains strong with the majority of cash and cash equivalents invested in U.S.government securities. The company currently has $600 million of undrawn bank-committed credit capacity.Management continuously monitors the credit quality of the company’s credit facility banks, insurance providersand derivative contract counter-parties, in addition to customers and key suppliers.
Operating activities
Cash provided by operating activities from continuing operations was $551 million in 2010, compared to$831 million in 2009 and $317 million in 2008. The decline in cash flow in 2010 compared to 2009 reflectshigher receipts of alternative fuel mixture credits of $292 million in 2009 compared to 2010, partially offset byimproved year-over-year segment earnings in 2010. Cash used by operating activities from discontinuedoperations was $5 million in 2010, compared to cash provided by discontinued operations of $45 million and $59million in 2009 and 2008, respectively.
Investing activities
Cash used in investing activities from continuing operations was $279 million in 2010, compared to $211million in 2009 and $245 million in 2008. Cash used in investing activities from continuing operations in 2010was driven by capital expenditures of $242 million, payments for acquired businesses (net of cash acquired) of$49 million, contributions to joint ventures of $9 million and other uses of funds of $10 million, offset in part byproceeds from dispositions of assets of $31 million. Cash used in investing activities from continuing operationsin 2009 was driven by capital expenditures of $218 million, payments for acquired businesses (net of cashacquired) of $15 million, contributions to joint ventures of $5 million and other uses of funds of $25 million,offset in part by proceeds from dispositions of assets of $52 million. Cash used in investing activities fromcontinuing operations in 2008 was driven by capital expenditures of $274 million, payments for acquiredbusinesses (net of cash acquired) of $18 million, contributions to joint ventures of $15 million and other uses offunds of $5 million, offset in part by proceeds from dispositions of assets of $67 million. Cash provided byinvesting activities from discontinued operations was $59 million in 2010, compared to $2 million in 2009 and$437 million in 2008. Cash flows provided by discontinued operations primarily relate to proceeds received fromdispositions of certain businesses. Refer to Note R of Notes to Consolidated Financial Statements included inPart II, Item 8 for further information on discontinued operations.
27
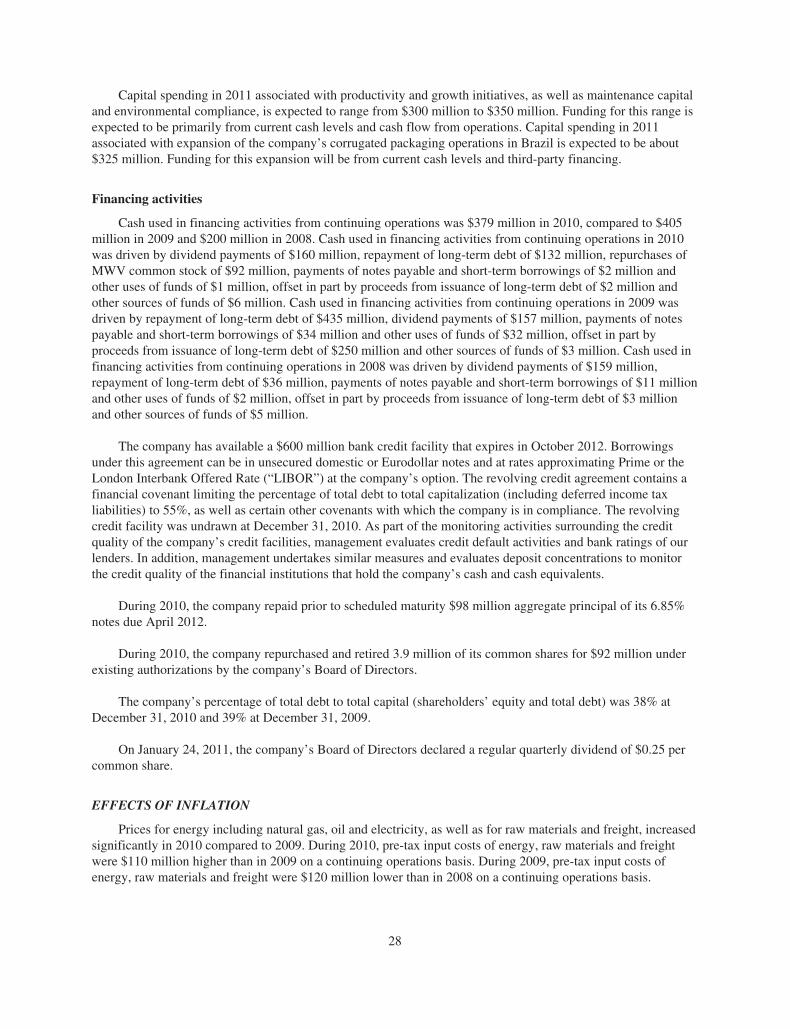
Capital spending in 2011 associated with productivity and growth initiatives, as well as maintenance capitaland environmental compliance, is expected to range from $300 million to $350 million. Funding for this range isexpected to be primarily from current cash levels and cash flow from operations. Capital spending in 2011associated with expansion of the company’s corrugated packaging operations in Brazil is expected to be about$325 million. Funding for this expansion will be from current cash levels and third-party financing.
Financing activities
Cash used in financing activities from continuing operations was $379 million in 2010, compared to $405million in 2009 and $200 million in 2008. Cash used in financing activities from continuing operations in 2010was driven by dividend payments of $160 million, repayment of long-term debt of $132 million, repurchases ofMWV common stock of $92 million, payments of notes payable and short-term borrowings of $2 million andother uses of funds of $1 million, offset in part by proceeds from issuance of long-term debt of $2 million andother sources of funds of $6 million. Cash used in financing activities from continuing operations in 2009 wasdriven by repayment of long-term debt of $435 million, dividend payments of $157 million, payments of notespayable and short-term borrowings of $34 million and other uses of funds of $32 million, offset in part byproceeds from issuance of long-term debt of $250 million and other sources of funds of $3 million. Cash used infinancing activities from continuing operations in 2008 was driven by dividend payments of $159 million,repayment of long-term debt of $36 million, payments of notes payable and short-term borrowings of $11 millionand other uses of funds of $2 million, offset in part by proceeds from issuance of long-term debt of $3 millionand other sources of funds of $5 million.
The company has available a $600 million bank credit facility that expires in October 2012. Borrowingsunder this agreement can be in unsecured domestic or Eurodollar notes and at rates approximating Prime or theLondon Interbank Offered Rate (“LIBOR”) at the company’s option. The revolving credit agreement contains afinancial covenant limiting the percentage of total debt to total capitalization (including deferred income taxliabilities) to 55%, as well as certain other covenants with which the company is in compliance. The revolvingcredit facility was undrawn at December 31, 2010. As part of the monitoring activities surrounding the creditquality of the company’s credit facilities, management evaluates credit default activities and bank ratings of ourlenders. In addition, management undertakes similar measures and evaluates deposit concentrations to monitorthe credit quality of the financial institutions that hold the company’s cash and cash equivalents.
During 2010, the company repaid prior to scheduled maturity $98 million aggregate principal of its 6.85%notes due April 2012.
During 2010, the company repurchased and retired 3.9 million of its common shares for $92 million underexisting authorizations by the company’s Board of Directors.
The company’s percentage of total debt to total capital (shareholders’ equity and total debt) was 38% atDecember 31, 2010 and 39% at December 31, 2009.
On January 24, 2011, the company’s Board of Directors declared a regular quarterly dividend of $0.25 percommon share.
EFFECTS OF INFLATION
Prices for energy including natural gas, oil and electricity, as well as for raw materials and freight, increasedsignificantly in 2010 compared to 2009. During 2010, pre-tax input costs of energy, raw materials and freightwere $110 million higher than in 2009 on a continuing operations basis. During 2009, pre-tax input costs ofenergy, raw materials and freight were $120 million lower than in 2008 on a continuing operations basis.
28
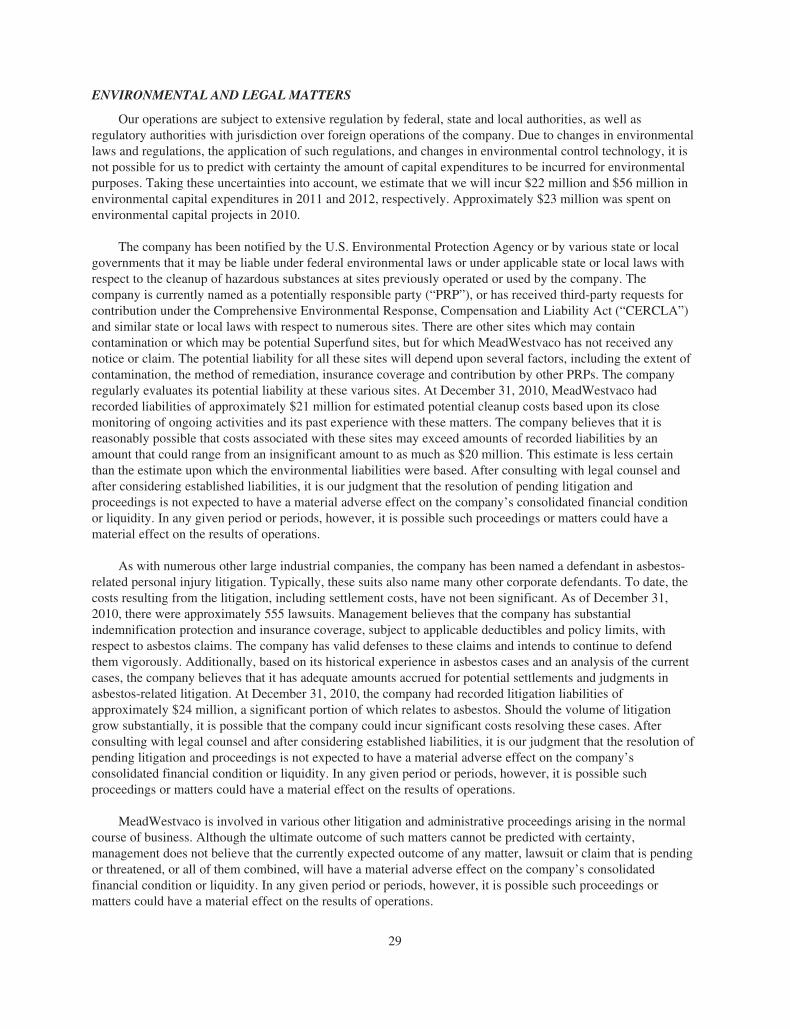
ENVIRONMENTAL AND LEGAL MATTERS
Our operations are subject to extensive regulation by federal, state and local authorities, as well asregulatory authorities with jurisdiction over foreign operations of the company. Due to changes in environmentallaws and regulations, the application of such regulations, and changes in environmental control technology, it isnot possible for us to predict with certainty the amount of capital expenditures to be incurred for environmentalpurposes. Taking these uncertainties into account, we estimate that we will incur $22 million and $56 million inenvironmental capital expenditures in 2011 and 2012, respectively. Approximately $23 million was spent onenvironmental capital projects in 2010.
The company has been notified by the U.S. Environmental Protection Agency or by various state or localgovernments that it may be liable under federal environmental laws or under applicable state or local laws withrespect to the cleanup of hazardous substances at sites previously operated or used by the company. Thecompany is currently named as a potentially responsible party (“PRP”), or has received third-party requests forcontribution under the Comprehensive Environmental Response, Compensation and Liability Act (“CERCLA”)and similar state or local laws with respect to numerous sites. There are other sites which may containcontamination or which may be potential Superfund sites, but for which MeadWestvaco has not received anynotice or claim. The potential liability for all these sites will depend upon several factors, including the extent ofcontamination, the method of remediation, insurance coverage and contribution by other PRPs. The companyregularly evaluates its potential liability at these various sites. At December 31, 2010, MeadWestvaco hadrecorded liabilities of approximately $21 million for estimated potential cleanup costs based upon its closemonitoring of ongoing activities and its past experience with these matters. The company believes that it isreasonably possible that costs associated with these sites may exceed amounts of recorded liabilities by anamount that could range from an insignificant amount to as much as $20 million. This estimate is less certainthan the estimate upon which the environmental liabilities were based. After consulting with legal counsel andafter considering established liabilities, it is our judgment that the resolution of pending litigation andproceedings is not expected to have a material adverse effect on the company’s consolidated financial conditionor liquidity. In any given period or periods, however, it is possible such proceedings or matters could have amaterial effect on the results of operations.
As with numerous other large industrial companies, the company has been named a defendant in asbestos-related personal injury litigation. Typically, these suits also name many other corporate defendants. To date, thecosts resulting from the litigation, including settlement costs, have not been significant. As of December 31,2010, there were approximately 555 lawsuits. Management believes that the company has substantialindemnification protection and insurance coverage, subject to applicable deductibles and policy limits, withrespect to asbestos claims. The company has valid defenses to these claims and intends to continue to defendthem vigorously. Additionally, based on its historical experience in asbestos cases and an analysis of the currentcases, the company believes that it has adequate amounts accrued for potential settlements and judgments inasbestos-related litigation. At December 31, 2010, the company had recorded litigation liabilities ofapproximately $24 million, a significant portion of which relates to asbestos. Should the volume of litigationgrow substantially, it is possible that the company could incur significant costs resolving these cases. Afterconsulting with legal counsel and after considering established liabilities, it is our judgment that the resolution ofpending litigation and proceedings is not expected to have a material adverse effect on the company’sconsolidated financial condition or liquidity. In any given period or periods, however, it is possible suchproceedings or matters could have a material effect on the results of operations.
MeadWestvaco is involved in various other litigation and administrative proceedings arising in the normalcourse of business. Although the ultimate outcome of such matters cannot be predicted with certainty,management does not believe that the currently expected outcome of any matter, lawsuit or claim that is pendingor threatened, or all of them combined, will have a material adverse effect on the company’s consolidatedfinancial condition or liquidity. In any given period or periods, however, it is possible such proceedings ormatters could have a material effect on the results of operations.
29
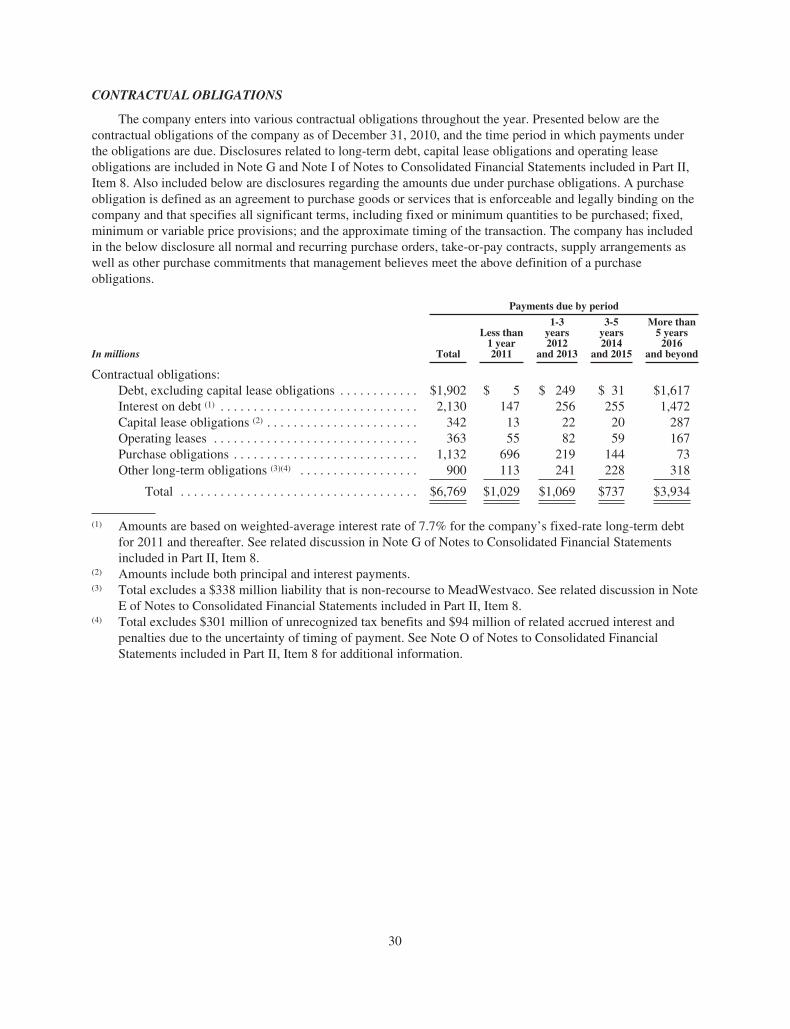
CONTRACTUAL OBLIGATIONS
The company enters into various contractual obligations throughout the year. Presented below are thecontractual obligations of the company as of December 31, 2010, and the time period in which payments underthe obligations are due. Disclosures related to long-term debt, capital lease obligations and operating leaseobligations are included in Note G and Note I of Notes to Consolidated Financial Statements included in Part II,Item 8. Also included below are disclosures regarding the amounts due under purchase obligations. A purchaseobligation is defined as an agreement to purchase goods or services that is enforceable and legally binding on thecompany and that specifies all significant terms, including fixed or minimum quantities to be purchased; fixed,minimum or variable price provisions; and the approximate timing of the transaction. The company has includedin the below disclosure all normal and recurring purchase orders, take-or-pay contracts, supply arrangements aswell as other purchase commitments that management believes meet the above definition of a purchaseobligations.
Payments due by period
In millions Total
Less than1 year2011
1-3years2012
and 2013
3-5years2014
and 2015
More than5 years2016
and beyond
Contractual obligations:Debt, excluding capital lease obligations . . . . . . . . . . . . $1,902 $ 5 $ 249 $ 31 $1,617Interest on debt (1) . . . . . . . . . . . . . . . . . . . . . . . . . . . . . . 2,130 147 256 255 1,472Capital lease obligations (2) . . . . . . . . . . . . . . . . . . . . . . . 342 13 22 20 287Operating leases . . . . . . . . . . . . . . . . . . . . . . . . . . . . . . . 363 55 82 59 167Purchase obligations . . . . . . . . . . . . . . . . . . . . . . . . . . . . 1,132 696 219 144 73Other long-term obligations (3)(4) . . . . . . . . . . . . . . . . . . 900 113 241 228 318
Total . . . . . . . . . . . . . . . . . . . . . . . . . . . . . . . . . . . . $6,769 $1,029 $1,069 $737 $3,934
(1) Amounts are based on weighted-average interest rate of 7.7% for the company’s fixed-rate long-term debtfor 2011 and thereafter. See related discussion in Note G of Notes to Consolidated Financial Statementsincluded in Part II, Item 8.
(2) Amounts include both principal and interest payments.(3) Total excludes a $338 million liability that is non-recourse to MeadWestvaco. See related discussion in Note
E of Notes to Consolidated Financial Statements included in Part II, Item 8.(4) Total excludes $301 million of unrecognized tax benefits and $94 million of related accrued interest and
penalties due to the uncertainty of timing of payment. See Note O of Notes to Consolidated FinancialStatements included in Part II, Item 8 for additional information.
30
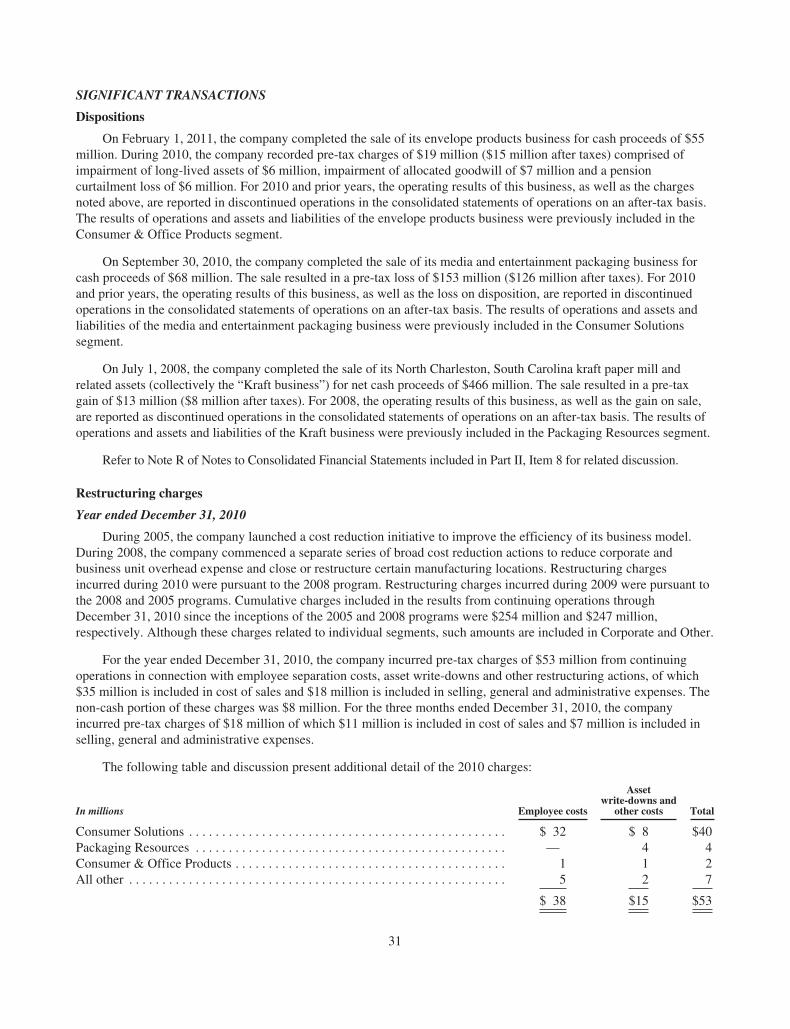
SIGNIFICANT TRANSACTIONS
Dispositions
On February 1, 2011, the company completed the sale of its envelope products business for cash proceeds of $55million. During 2010, the company recorded pre-tax charges of $19 million ($15 million after taxes) comprised ofimpairment of long-lived assets of $6 million, impairment of allocated goodwill of $7 million and a pensioncurtailment loss of $6 million. For 2010 and prior years, the operating results of this business, as well as the chargesnoted above, are reported in discontinued operations in the consolidated statements of operations on an after-tax basis.The results of operations and assets and liabilities of the envelope products business were previously included in theConsumer & Office Products segment.
On September 30, 2010, the company completed the sale of its media and entertainment packaging business forcash proceeds of $68 million. The sale resulted in a pre-tax loss of $153 million ($126 million after taxes). For 2010and prior years, the operating results of this business, as well as the loss on disposition, are reported in discontinuedoperations in the consolidated statements of operations on an after-tax basis. The results of operations and assets andliabilities of the media and entertainment packaging business were previously included in the Consumer Solutionssegment.
On July 1, 2008, the company completed the sale of its North Charleston, South Carolina kraft paper mill andrelated assets (collectively the “Kraft business”) for net cash proceeds of $466 million. The sale resulted in a pre-taxgain of $13 million ($8 million after taxes). For 2008, the operating results of this business, as well as the gain on sale,are reported as discontinued operations in the consolidated statements of operations on an after-tax basis. The results ofoperations and assets and liabilities of the Kraft business were previously included in the Packaging Resources segment.
Refer to Note R of Notes to Consolidated Financial Statements included in Part II, Item 8 for related discussion.
Restructuring charges
Year ended December 31, 2010
During 2005, the company launched a cost reduction initiative to improve the efficiency of its business model.During 2008, the company commenced a separate series of broad cost reduction actions to reduce corporate andbusiness unit overhead expense and close or restructure certain manufacturing locations. Restructuring chargesincurred during 2010 were pursuant to the 2008 program. Restructuring charges incurred during 2009 were pursuant tothe 2008 and 2005 programs. Cumulative charges included in the results from continuing operations throughDecember 31, 2010 since the inceptions of the 2005 and 2008 programs were $254 million and $247 million,respectively. Although these charges related to individual segments, such amounts are included in Corporate and Other.
For the year ended December 31, 2010, the company incurred pre-tax charges of $53 million from continuingoperations in connection with employee separation costs, asset write-downs and other restructuring actions, of which$35 million is included in cost of sales and $18 million is included in selling, general and administrative expenses. Thenon-cash portion of these charges was $8 million. For the three months ended December 31, 2010, the companyincurred pre-tax charges of $18 million of which $11 million is included in cost of sales and $7 million is included inselling, general and administrative expenses.
The following table and discussion present additional detail of the 2010 charges:
In millions Employee costs
Assetwrite-downs and
other costs Total
Consumer Solutions . . . . . . . . . . . . . . . . . . . . . . . . . . . . . . . . . . . . . . . . . . . . . . . . $ 32 $ 8 $40Packaging Resources . . . . . . . . . . . . . . . . . . . . . . . . . . . . . . . . . . . . . . . . . . . . . . . — 4 4Consumer & Office Products . . . . . . . . . . . . . . . . . . . . . . . . . . . . . . . . . . . . . . . . . 1 1 2All other . . . . . . . . . . . . . . . . . . . . . . . . . . . . . . . . . . . . . . . . . . . . . . . . . . . . . . . . . 5 2 7
$ 38 $15 $53
31

Consumer Solutions
During the year ended December 31, 2010, the Consumer Solutions segment had various restructuringactions in its manufacturing operations in Europe and the U.S. These actions resulted in pre-tax charges of $40million, of which $32 million related to employee separation costs and $8 million related to asset write-downsand other restructuring actions.
Packaging Resources
During the year ended December 31, 2010, the Packaging Resources segment had various restructuringactions in its manufacturing operations in Brazil and the U.S. These actions resulted in pre-tax charges of $4million related to asset write-downs and other restructuring actions.
Consumer & Office Products
During the year ended December 31, 2010, the Consumer & Office Products segment had variousrestructuring actions in its manufacturing operations in the U.S and Brazil. These actions resulted in pre-taxcharges of $2 million, of which $1 million related to employee separation costs and $1 million related to assetwrite-downs and other restructuring actions.
All other
During the year ended December 31, 2010, the company recorded restructuring charges of $7 million, ofwhich $5 million related to employee relocation costs and $2 million related to other restructuring actions.
Year ended December 31, 2009
For the year ended December 31, 2009, the company incurred pre-tax charges of $173 million fromcontinuing operations in connection with employee separation costs, asset write-downs and other restructuringactions, of which $137 million is included in cost of sales and $36 million is included in selling, general andadministrative expenses. Of these charges, $71 million related to the Consumer Solutions segment, $42 millionrelated to the Packaging Resources segment, $6 million related to the Consumer & Office Products segment and$54 million was attributed to Corporate and Other. The non-cash portion of these charges was $126 million.
Year ended December 31, 2008
For the year ended December 31, 2008, the company incurred pre-tax charges of $52 from continuingoperations in connection with employee separation costs, asset write-downs and other restructuring actions, ofwhich $31 million is included in cost of sales, $19 million is included in selling, general and administrativeexpenses and $2 million is included in other income. Of these charges, $32 million related to the ConsumerSolutions segment, $4 million related to the Packaging Resources segment, $4 million related to the SpecialtyChemicals segment, $3 million related to the Consumer & Office Products segment and $9 million was attributedto Corporate and Other. The non-cash portion of these charges was $34 million.
Alternative fuel mixture credit
Through December 31, 2009, the U.S. Internal Revenue Code allowed an excise tax credit for alternativefuel mixtures produced by a taxpayer for sale, or for use as a fuel in a taxpayer’s trade or business. MWVqualified for the alternative fuel mixture credit because it uses an alternative fuel known as black liquor, which isa byproduct of its wood pulping process, to power its paperboard mills. The company recorded income of $375million, after associated expenses, based on fuel usage at its three U.S. paperboard mills from mid-January 2009through December 31, 2009. The credit expired on December 31, 2009.
32
CRITICAL ACCOUNTING POLICIES
Our principal accounting policies are described in the Summary of Significant Accounting Policies in theNotes to Consolidated Financial Statements included in Part II, Item 8. The preparation of financial statements inaccordance with GAAP requires management to make estimates and assumptions that affect the reportedamounts of some assets and liabilities and, in some instances, the reported amounts of revenues and expensesduring the reporting period. Actual results could differ from these estimates. Management believes theaccounting policies discussed below represent those accounting policies requiring the exercise of judgmentwhere a different set of judgments could result in the greatest changes to reported results. Management hasdiscussed the development and selection of the critical accounting estimates with the Audit Committee of theBoard of Directors, and the Audit Committee has reviewed the company’s disclosure.
Environmental and legal liabilities: We record accruals for estimated environmental liabilities whenremedial efforts are probable and the costs can be reasonably estimated. These estimates reflect assumptions andjudgments as to the probable nature, magnitude and timing of required investigation, remediation and monitoringactivities, as well as availability of insurance coverage and contribution by other potentially responsible parties.Due to the numerous uncertainties and variables associated with these assumptions and judgments, and changesin governmental regulations and environmental technologies, accruals are subject to substantial uncertainties, andactual costs could be materially greater or less than the estimated amounts. We record accruals for other legalcontingencies, which are also subject to numerous uncertainties and variables associated with assumptions andjudgments, when the loss is probable and reasonably estimable. Liabilities recorded for claims are limited topending cases based on the company’s historical experience, consultation with outside counsel and consultationwith an actuarial specialist concerning the feasibility of reasonably estimating liabilities associated with claimsthat may arise in the future. We recognize insurance recoveries when collection is reasonably assured.
Restructuring and other charges: We periodically record charges for the reduction of our workforce, theclosure of manufacturing facilities and other actions related to business improvement and productivity initiatives.These events require estimates of liabilities for employee separation payments and related benefits, demolition,facility closures and other costs, which could differ from actual costs incurred.
Pension and postretirement benefits: Assumptions used in the determination of net pension cost andpostretirement benefit expense, including the discount rate, the expected return on plan assets, and increases infuture compensation and medical costs, are evaluated by the company, reviewed with the plan actuaries annuallyand updated as appropriate. Actual asset returns and compensation and medical costs, which are more favorablethan assumptions, can have the effect of lowering expense and cash contributions, and, conversely, actual results,which are less favorable than assumptions, could increase expense and cash contributions. In accordance withgenerally accepted accounting principles, actual results that differ from assumptions are accumulated andamortized over future periods and, therefore, affect expense in such future periods.
In 2010, the company recorded pre-tax pension income from continuing operations of $78 million,compared to $73 million in 2009 and $98 million in 2008. The company currently estimates pre-tax pensionincome in 2011 to be about $80 million. This estimate assumes a long-term rate of return on plan assets of8.00%, and a discount rate of 5.25%. The company determined the discount rate by referencing the CitigroupPension Discount Curve. The company believes that using a yield curve approach most accurately reflectschanges in the present value of liabilities over time since each cash flow is discounted at the rate at which itcould effectively be settled.
If the expected rate of return on plan assets were to change by 0.5%, annual pension income in 2011 wouldchange by approximately $18 million. Similarly, if the discount rate were to change by 0.5%, annual pensionincome in 2011 would change by approximately $16 million.
33
At December 31, 2010, the aggregate value of pension fund assets had increased to $3.8 billion from $3.5billion at December 31, 2009, reflecting overall favorable equity and fixed income market performance during2010. For further details regarding pension fund assets, see Note L of Notes to Consolidated Financial Statementsincluded in Part II, Item 8.
Prior service cost and actuarial gains and losses in the retirement and postretirement benefit plans subject toamortization are amortized over the average remaining service periods, which are about 10 and 7 years for thebargained and salaried retirement plans respectively, and 5 years for the postretirement benefit plan, and are acomponent of accumulated other comprehensive loss.
Long-lived assets useful lives: Useful lives of tangible and intangible assets are based on management’sestimates of the periods over which the assets will be productively utilized in the revenue-generation process orfor other useful purposes. Factors that affect the determination of lives include prior experience with similarassets, product life expectations and industry practices. The determination of useful lives dictates the period overwhich tangible and intangible long-lived assets are depreciated or amortized, typically using the straight-linemethod.
Impairment of long-lived assets: We review long-lived assets for impairment whenever events or changes incircumstances indicate that the carrying amount of an asset may not be recoverable. If such circumstances aredetermined to exist, an estimate of undiscounted future cash flows produced by the long-lived asset, or theappropriate grouping of assets, is compared to carrying value to determine whether impairment exists. For anasset that is determined to be impaired, the loss is measured based on quoted market prices in active markets, ifavailable. If quoted market prices are not available, the estimate of fair value is based on various valuationtechniques, including a discounted value of estimated future cash flows. Considerable judgment must beexercised as to determining future cash flows and their timing and, possibly, choosing business valuecomparables or selecting discount rates to use in any value computations.
Intangible assets: Business acquisitions often result in recording intangible assets. Intangible assets arerecognized at the time of an acquisition, based upon their fair value. Similar to long-lived tangible assets,intangible assets with finite lives are subject to periodic impairment reviews whenever events or changes incircumstances indicate that the carrying amount of an asset may not be recoverable. As with tangible assets,considerable judgment must be exercised. Periodic impairment reviews of intangible assets assigned an indefinitelife are required, at least annually, as well as when events or circumstances change. As with our review ofimpairment of tangible assets and goodwill, we employ significant assumptions in assessing our indefinite-livedintangible assets for impairment (primarily Calmar trademarks and trade names). An income approach (the relieffrom royalty method) is used to determine the fair values of our indefinite-lived intangible assets. Although ourestimate of fair values of the company’s indefinite-lived intangible assets under the income approach exceed therespective carrying values, different assumptions regarding projected performance and other factors could resultin significant non-cash impairment charges in the future. Based on our annual review of our indefinite-livedintangible assets as of October 1, 2010, there was no indication of impairment.
Goodwill: Goodwill represents the excess of cost of an acquired business over the fair value of theidentifiable tangible and intangible assets acquired and liabilities assumed in a business combination. As withtangible and other intangible assets, periodic impairment reviews are required, at least annually, as well as whenevents or circumstances change. We review the recorded value of our goodwill annually on October 1 or sooner,if events or changes in circumstances indicate that the carrying amount may exceed fair value. As with ourreview of impairment of tangible and intangible assets, we employ significant assumptions in assessing goodwillfor impairment. These assumptions include relevant considerations of market-participant data. An incomeapproach is generally used to determine the fair values of our reporting units.
34
In applying the income approach in assessing goodwill for impairment, changes in assumptions couldmaterially affect the determination of fair value for a reporting unit. Although our fair value estimates of thecompany’s reporting units under the income approach exceed the respective carrying values, differentassumptions regarding projected performance and other factors could result in significant non-cash impairmentcharges in the future. The following assumptions are key to our income approach:
• Business projections—Projections are based on three-year forecasts that are developed internally bymanagement and reviewed by the company’s Board of Directors. These projections include significantassumptions such as estimates of future revenues, profits, working capital requirements, operatingplans, costs of planned restructuring actions and capital expenditures. Assumptions surrounding macro-economic data and estimates include industry projections, inflation, foreign currency exchange ratesand costs of energy, raw materials and freight.
• Growth rates—A growth rate based on market participant data considerations is used to calculate theterminal value of a reporting unit. The growth rate is the expected rate at which a reporting unit’searnings stream is projected to grow beyond the three-year forecast period.
• Discount rates—Future cash flows are discounted at a rate that is consistent with a weighted averagecost of capital for a potential market participant. The weighted average cost of capital is an estimate ofthe overall after-tax rate of return required by equity and debt holders of a business enterprise. Thediscount rates selected for the reporting units are based on existing conditions within the respectivemarkets and reflect appropriate adjustments for potential risk premiums in those markets as well asappropriate weighting of the market cost of equity versus debt, which is developed with the assistanceof external financial advisors.
• Tax rates—Tax rates are based on estimates of the tax rates that a market participant would realize inthe respective primary markets and geographic areas in which the reporting units operate.
Based on our annual review of the recorded value of goodwill at October 1, 2010, there was no indication ofimpairment. Holding other valuation assumptions constant, it would take a downward shift in operating profits,which management does not believe is likely, of more than approximately 30% from projected levels before thefair values of any reporting units would be below the respective carrying values, thereby triggering therequirement to perform further analysis which may indicate potential goodwill impairment. See Note D of Notesto Consolidated Financial Statements included in Part II, Item 8 for further information.
Revenue recognition: We recognize revenue at the point when title and the risk of ownership passes to thecustomer. Substantially all of our revenues are generated through product sales, and shipping terms generallyindicate when title and the risk of ownership have passed. Revenue is recognized at shipment for sales whenshipping terms are FOB (free on board) shipping point unless risk of loss is maintained under freight terms. Forsales where shipping terms are FOB destination, revenue is recognized when the goods are received by thecustomer. We provide for all allowances for estimated returns and other customer credits such as discounts andvolume rebates, when the revenue is recognized, based on historical experience, current trends and anynotification of pending returns. The customer allowances are, in many instances, subjective and are determinedwith significant management judgment and are reviewed regularly to determine the adequacy of the amounts.Changes in economic conditions, markets and customer relationships may require adjustments to theseallowances from period to period. Also included in net sales is service revenue which is recognized as the serviceis performed. Revenue is recognized for leased equipment to customers on a straight-line basis over the estimatedterm of the lease and is included in net sales of the company. Sales of landholdings are included in net sales inthe consolidated statements of operations to reflect the strategic view and structure of the operations of theCommunity Development and Land Management segment established in 2008.
Income taxes: Income taxes are accounted for in accordance with the guidelines provided by the FinancialAccounting Standards Board, which recognizes deferred tax assets and liabilities based on the estimated futuretax effects of differences between the financial statement and tax basis of assets and liabilities given the enactedtax laws.
35
We evaluate the need for a deferred tax asset valuation allowance by assessing whether it is more likely thannot that the company will realize its deferred tax assets in the future. The assessment of whether or not avaluation allowance is required often requires significant judgment, including the forecast of future taxableincome and the valuation of tax planning initiatives. Adjustments to the deferred tax valuation allowance aremade to earnings in the period when such assessment is made.
The company has tax jurisdictions located in many areas of the world and is subject to audit in thesejurisdictions. Tax audits by their nature are often complex and can require several years to resolve. In thepreparation of the company’s financial statements, management exercises judgments in estimating the potentialexposure to unresolved tax matters. The company recognizes the tax benefit from an uncertain tax position if it ismore likely than not that the position is sustainable. For those tax positions that meet the more likely than notcriteria, the company records only the portion of the tax benefit that is greater than 50% likely to be realizedupon settlement with the respective taxing authority. Interest and penalties related to unrecognized tax benefitsare recorded within income tax expense in the consolidated statements of operations. While actual results couldvary, in management’s judgment, the company has adequate tax accruals with respect to the ultimate outcome ofsuch unresolved tax matters.
Each quarter, management must estimate our effective tax rate for the full year. This estimate includesassumptions about the level of income that will be achieved for the full year in both our domestic andinternational operations. The forecast of full-year earnings includes assumptions about markets in each of ourbusinesses as well as the timing of certain transactions, including forestland sales gains and restructuring charges.Should business performance or the timing of certain transactions change during the year, the level of incomeachieved may not meet the level of income estimated earlier in the year at interim periods. This change in theincome levels and mix of earnings can result in significant adjustments to the tax provision in the quarter inwhich the estimate is refined.
NEW ACCOUNTING GUIDANCE
During 2010, the company adopted the below accounting guidance as promulgated by the FinancialAccounting Standards Board.
Accounting for variable interest entities
On January 1, 2010, the company adopted new accounting guidance related to the accounting and disclosurefor variable interest entities. The new guidance provides an improved framework for identifying whether anenterprise has a controlling financial interest in a variable interest entity and requires additional disclosures of anenterprise’s involvement with variable interest entities. The adoption did not have an effect on the company’sconsolidated financial statements for the year ended December 31, 2010.
Fair value disclosures
On January 1, 2010, the company adopted new accounting guidance that requires additional disclosuresregarding different classes of assets and liabilities measured at fair value, valuation techniques employed andtransfers between the levels of fair value measurements. Refer to Note A of Notes to Consolidated FinancialStatements included in Part II, Item 8 for disclosures of fair value measurements.
There were no other accounting standards issued in 2010 that had or are expected to have a material impacton the company’s financial position or results of operations.
36
Forward-looking Statements
Certain statements in this document and elsewhere by management of the company that are neither reportedfinancial results nor other historical information are “forward-looking statements” within the meaning of thePrivate Securities Litigation Reform Act of 1995. Such information includes, without limitation, the businessoutlook, assessment of market conditions, anticipated financial and operating results, strategies, future plans,contingencies and contemplated transactions of the company. Such forward-looking statements are notguarantees of future performance and are subject to known and unknown risks, uncertainties and other factorswhich may cause or contribute to actual results of company operations, or the performance or achievements ofeach company, or industry results, to differ materially from those expressed or implied by the forward-lookingstatements. In addition to any such risks, uncertainties and other factors discussed elsewhere herein, risks,uncertainties, and other factors that could cause or contribute to actual results differing materially from thoseexpressed or implied for the forward-looking statements include, but are not limited to, events or circumstanceswhich affect the ability of MeadWestvaco to realize improvements in operating earnings from the company’songoing cost reduction initiatives; the ability of MeadWestvaco to close announced and pending transactions,including divestitures; the reorganization of the company’s packaging business units; competitive pricing for thecompany’s products; impact from inflation on raw materials, energy and other costs; fluctuations in demand andchanges in production capacities; relative growth or decline in the United States and international economies;government policies and regulations, including, but not limited to those affecting the environment, climatechange, tax policies and the tobacco industry; the company’s continued ability to reach agreement with itsunionized employees on collective bargaining agreements; the company’s ability to execute its plans to divest orotherwise realize the greater value associated with its land holdings; adverse results in current or future litigation;currency movements; volatility and further deterioration of the capital markets; and other risk factors discussedin this Annual Report on Form 10-K and in other filings made from time to time with the SEC. MeadWestvacoundertakes no obligation to publicly update any forward-looking statement, whether as a result of newinformation, future events or otherwise. Investors are advised, however, to consult any further disclosures madeon related subjects in the company’s reports filed with the SEC.
37

Item 7A. Quantitative and qualitative disclosures about market risk
Interest rates
The company has developed a targeted mix of fixed- and variable-rate debt as part of an overall strategy tomaintain an appropriate level of exposure to interest-rate fluctuations. To efficiently manage this mix, thecompany utilizes interest-rate swap agreements. There were no outstanding interest-rate swaps at December 31,2010. The total notional amount of interest-rate swap instruments was $250 million at December 31, 2009. SeeNote H of Notes to Consolidated Financial Statements included in Part II, Item 8 for related discussion.
Foreign currency
The company has foreign-based operations, primarily in South America, Canada, Mexico, Europe and Asia,which accounted for approximately 32% of its 2010 net sales. In addition, certain of the company’s domesticoperations have sales to foreign customers. In the conduct of its foreign operations, the company also makesinter-company sales and receives royalties and dividends denominated in many different currencies. All of thisexposes the company to the effect of changes in foreign currency exchange rates.
Flows of foreign currencies into and out of the company’s domestic operations are generally stable andregularly occurring and are recorded at fair market value in the company’s financial statements. The company’sforeign currency management policy permits it to enter into foreign currency hedges when these flows exceed athreshold, which is a function of these cash flows and forecasted annual operations. During 2010 and 2009, thecompany entered into foreign currency hedges to partially offset the foreign currency impact of these flows onoperating income. See Note H of Notes to Consolidated Financial Statements included in Part II, Item 8 forrelated discussion.
The company also issues inter-company loans to and receives foreign cash deposits from its foreignsubsidiaries in their local currencies, exposing it to the effect of changes in spot exchange rates between loanissue and loan repayment dates for the inter-company loans and changes in spot exchange rates from deposit datefor foreign cash deposits. Generally, management uses foreign-exchange hedge contracts with terms of less thanone year to hedge these exposures. When applied to the company’s derivative and other foreign currencysensitive instruments at December 31, 2010, a 10% adverse change in currency rates would have about a $61million effect on the company’s results. Although the company’s derivative and other foreign currency sensitiveinstruments expose it to market risk, fluctuations in the value of these instruments are mitigated by expectedoffsetting fluctuations in the matched exposures.
Natural gas
In order to better predict and control the future cost of natural gas consumed at the company’s mills andplants, the company engages in financial hedging of future gas purchase prices. Gas usage is relativelypredictable month-by-month. The company hedges primarily with financial instruments that are priced based onNew York Mercantile Exchange (NYMEX) natural gas futures contracts. See Note H of Notes to ConsolidatedFinancial Statements included in Part II, Item 8 for related discussion.
38

Item 8. Financial statements and supplementary data
Index
Page
Report of Independent Registered Public Accounting Firm . . . . . . . . . . . . . . . . . . . . . . . . . . . . . . . . . . . . . . . 40
Consolidated Statements of Operations for the Years Ended December 31, 2010, 2009 and 2008 . . . . . . . . 41
Consolidated Balance Sheets at December 31, 2010 and 2009 . . . . . . . . . . . . . . . . . . . . . . . . . . . . . . . . . . . . 42
Consolidated Statements of Equity for the Years Ended December 31, 2010, 2009 and 2008 . . . . . . . . . . . . 43
Consolidated Statements of Cash Flows for the Years Ended December 31, 2010, 2009 and 2008 . . . . . . . . 44
Notes to Consolidated Financial Statements . . . . . . . . . . . . . . . . . . . . . . . . . . . . . . . . . . . . . . . . . . . . . . . . . . 45
39
Report of Independent Registered Public Accounting Firm
To the Board of Directors and Shareholders of MeadWestvaco Corporation
In our opinion, the accompanying consolidated balance sheets and the related consolidated statements ofoperations, equity, and cash flows present fairly, in all material respects, the financial position of MeadWestvacoCorporation and its subsidiaries at December 31, 2010 and 2009, and the results of their operations and their cashflows for each of the three years in the period ended December 31, 2010 in conformity with accounting principlesgenerally accepted in the United States of America. Also in our opinion, the Company maintained, in all materialrespects, effective internal control over financial reporting as of December 31, 2010, based on criteria establishedin Internal Control—Integrated Framework issued by the Committee of Sponsoring Organizations of theTreadway Commission (COSO). The Company’s management is responsible for these financial statements, formaintaining effective internal control over financial reporting and for its assessment of the effectiveness ofinternal control over financial reporting, included in Management’s Report on Internal Control over FinancialReporting under Item 9A. Our responsibility is to express opinions on these financial statements and on theCompany’s internal control over financial reporting based on our integrated audits. We conducted our audits inaccordance with the standards of the Public Company Accounting Oversight Board (United States). Thosestandards require that we plan and perform the audits to obtain reasonable assurance about whether the financialstatements are free of material misstatement and whether effective internal control over financial reporting wasmaintained in all material respects. Our audits of the financial statements included examining, on a test basis,evidence supporting the amounts and disclosures in the financial statements, assessing the accounting principlesused and significant estimates made by management, and evaluating the overall financial statement presentation.Our audit of internal control over financial reporting included obtaining an understanding of internal control overfinancial reporting, assessing the risk that a material weakness exists, and testing and evaluating the design andoperating effectiveness of internal control based on the assessed risk. Our audits also included performing suchother procedures as we considered necessary in the circumstances. We believe that our audits provide areasonable basis for our opinions.
A company’s internal control over financial reporting is a process designed to provide reasonable assuranceregarding the reliability of financial reporting and the preparation of financial statements for external purposes inaccordance with generally accepted accounting principles. A company’s internal control over financial reportingincludes those policies and procedures that (i) pertain to the maintenance of records that, in reasonable detail,accurately and fairly reflect the transactions and dispositions of the assets of the company; (ii) provide reasonableassurance that transactions are recorded as necessary to permit preparation of financial statements in accordancewith generally accepted accounting principles, and that receipts and expenditures of the company are being madeonly in accordance with authorizations of management and directors of the company; and (iii) provide reasonableassurance regarding prevention or timely detection of unauthorized acquisition, use, or disposition of thecompany’s assets that could have a material effect on the financial statements.
Because of its inherent limitations, internal control over financial reporting may not prevent or detectmisstatements. Also, projections of any evaluation of effectiveness to future periods are subject to the risk thatcontrols may become inadequate because of changes in conditions, or that the degree of compliance with thepolicies or procedures may deteriorate.
/s/ PricewaterhouseCoopers LLP
Richmond, VirginiaFebruary 28, 2011
40
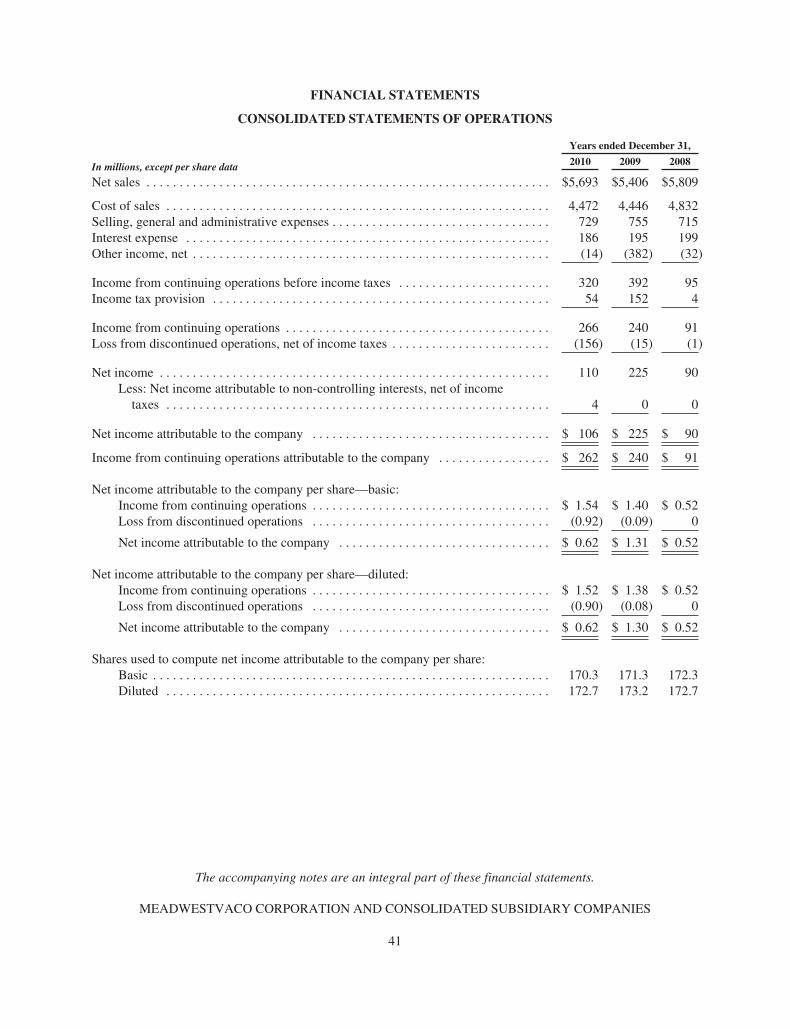
FINANCIAL STATEMENTS
CONSOLIDATED STATEMENTS OF OPERATIONS
In millions, except per share data
Years ended December 31,
2010 2009 2008
Net sales . . . . . . . . . . . . . . . . . . . . . . . . . . . . . . . . . . . . . . . . . . . . . . . . . . . . . . . . . . . . . $5,693 $5,406 $5,809
Cost of sales . . . . . . . . . . . . . . . . . . . . . . . . . . . . . . . . . . . . . . . . . . . . . . . . . . . . . . . . . . 4,472 4,446 4,832Selling, general and administrative expenses . . . . . . . . . . . . . . . . . . . . . . . . . . . . . . . . . 729 755 715Interest expense . . . . . . . . . . . . . . . . . . . . . . . . . . . . . . . . . . . . . . . . . . . . . . . . . . . . . . . 186 195 199Other income, net . . . . . . . . . . . . . . . . . . . . . . . . . . . . . . . . . . . . . . . . . . . . . . . . . . . . . . (14) (382) (32)
Income from continuing operations before income taxes . . . . . . . . . . . . . . . . . . . . . . . 320 392 95Income tax provision . . . . . . . . . . . . . . . . . . . . . . . . . . . . . . . . . . . . . . . . . . . . . . . . . . . 54 152 4
Income from continuing operations . . . . . . . . . . . . . . . . . . . . . . . . . . . . . . . . . . . . . . . . 266 240 91Loss from discontinued operations, net of income taxes . . . . . . . . . . . . . . . . . . . . . . . . (156) (15) (1)
Net income . . . . . . . . . . . . . . . . . . . . . . . . . . . . . . . . . . . . . . . . . . . . . . . . . . . . . . . . . . . 110 225 90Less: Net income attributable to non-controlling interests, net of incometaxes . . . . . . . . . . . . . . . . . . . . . . . . . . . . . . . . . . . . . . . . . . . . . . . . . . . . . . . . . . 4 0 0
Net income attributable to the company . . . . . . . . . . . . . . . . . . . . . . . . . . . . . . . . . . . . $ 106 $ 225 $ 90
Income from continuing operations attributable to the company . . . . . . . . . . . . . . . . . $ 262 $ 240 $ 91
Net income attributable to the company per share—basic:Income from continuing operations . . . . . . . . . . . . . . . . . . . . . . . . . . . . . . . . . . . . $ 1.54 $ 1.40 $ 0.52Loss from discontinued operations . . . . . . . . . . . . . . . . . . . . . . . . . . . . . . . . . . . . (0.92) (0.09) 0
Net income attributable to the company . . . . . . . . . . . . . . . . . . . . . . . . . . . . . . . . $ 0.62 $ 1.31 $ 0.52
Net income attributable to the company per share—diluted:Income from continuing operations . . . . . . . . . . . . . . . . . . . . . . . . . . . . . . . . . . . . $ 1.52 $ 1.38 $ 0.52Loss from discontinued operations . . . . . . . . . . . . . . . . . . . . . . . . . . . . . . . . . . . . (0.90) (0.08) 0
Net income attributable to the company . . . . . . . . . . . . . . . . . . . . . . . . . . . . . . . . $ 0.62 $ 1.30 $ 0.52
Shares used to compute net income attributable to the company per share:Basic . . . . . . . . . . . . . . . . . . . . . . . . . . . . . . . . . . . . . . . . . . . . . . . . . . . . . . . . . . . . 170.3 171.3 172.3Diluted . . . . . . . . . . . . . . . . . . . . . . . . . . . . . . . . . . . . . . . . . . . . . . . . . . . . . . . . . . 172.7 173.2 172.7
The accompanying notes are an integral part of these financial statements.
MEADWESTVACO CORPORATION AND CONSOLIDATED SUBSIDIARY COMPANIES
41
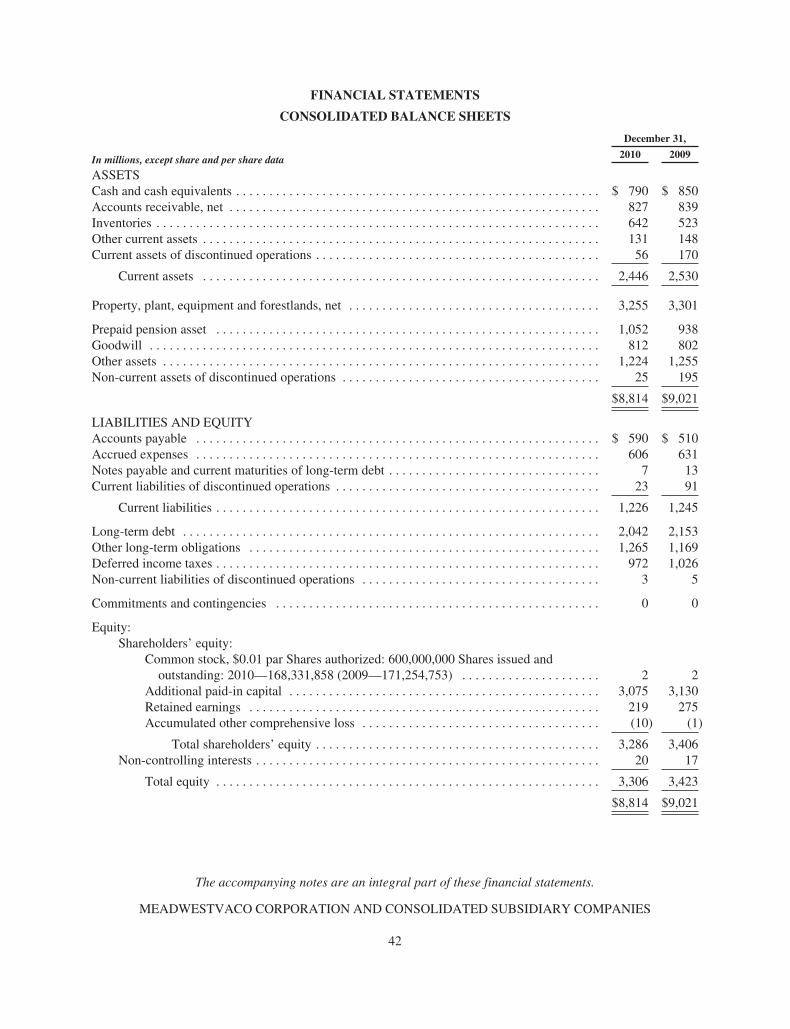
FINANCIAL STATEMENTS
CONSOLIDATED BALANCE SHEETS
In millions, except share and per share data
December 31,
2010 2009
ASSETSCash and cash equivalents . . . . . . . . . . . . . . . . . . . . . . . . . . . . . . . . . . . . . . . . . . . . . . . . . . . . . . . $ 790 $ 850Accounts receivable, net . . . . . . . . . . . . . . . . . . . . . . . . . . . . . . . . . . . . . . . . . . . . . . . . . . . . . . . . 827 839Inventories . . . . . . . . . . . . . . . . . . . . . . . . . . . . . . . . . . . . . . . . . . . . . . . . . . . . . . . . . . . . . . . . . . . 642 523Other current assets . . . . . . . . . . . . . . . . . . . . . . . . . . . . . . . . . . . . . . . . . . . . . . . . . . . . . . . . . . . . 131 148Current assets of discontinued operations . . . . . . . . . . . . . . . . . . . . . . . . . . . . . . . . . . . . . . . . . . . 56 170
Current assets . . . . . . . . . . . . . . . . . . . . . . . . . . . . . . . . . . . . . . . . . . . . . . . . . . . . . . . . . . . . 2,446 2,530
Property, plant, equipment and forestlands, net . . . . . . . . . . . . . . . . . . . . . . . . . . . . . . . . . . . . . . 3,255 3,301
Prepaid pension asset . . . . . . . . . . . . . . . . . . . . . . . . . . . . . . . . . . . . . . . . . . . . . . . . . . . . . . . . . . 1,052 938Goodwill . . . . . . . . . . . . . . . . . . . . . . . . . . . . . . . . . . . . . . . . . . . . . . . . . . . . . . . . . . . . . . . . . . . . 812 802Other assets . . . . . . . . . . . . . . . . . . . . . . . . . . . . . . . . . . . . . . . . . . . . . . . . . . . . . . . . . . . . . . . . . . 1,224 1,255Non-current assets of discontinued operations . . . . . . . . . . . . . . . . . . . . . . . . . . . . . . . . . . . . . . . 25 195
$8,814 $9,021
LIABILITIES AND EQUITYAccounts payable . . . . . . . . . . . . . . . . . . . . . . . . . . . . . . . . . . . . . . . . . . . . . . . . . . . . . . . . . . . . . $ 590 $ 510Accrued expenses . . . . . . . . . . . . . . . . . . . . . . . . . . . . . . . . . . . . . . . . . . . . . . . . . . . . . . . . . . . . . 606 631Notes payable and current maturities of long-term debt . . . . . . . . . . . . . . . . . . . . . . . . . . . . . . . . 7 13Current liabilities of discontinued operations . . . . . . . . . . . . . . . . . . . . . . . . . . . . . . . . . . . . . . . . 23 91
Current liabilities . . . . . . . . . . . . . . . . . . . . . . . . . . . . . . . . . . . . . . . . . . . . . . . . . . . . . . . . . . 1,226 1,245
Long-term debt . . . . . . . . . . . . . . . . . . . . . . . . . . . . . . . . . . . . . . . . . . . . . . . . . . . . . . . . . . . . . . . 2,042 2,153Other long-term obligations . . . . . . . . . . . . . . . . . . . . . . . . . . . . . . . . . . . . . . . . . . . . . . . . . . . . . 1,265 1,169Deferred income taxes . . . . . . . . . . . . . . . . . . . . . . . . . . . . . . . . . . . . . . . . . . . . . . . . . . . . . . . . . . 972 1,026Non-current liabilities of discontinued operations . . . . . . . . . . . . . . . . . . . . . . . . . . . . . . . . . . . . 3 5
Commitments and contingencies . . . . . . . . . . . . . . . . . . . . . . . . . . . . . . . . . . . . . . . . . . . . . . . . . 0 0
Equity:Shareholders’ equity:
Common stock, $0.01 par Shares authorized: 600,000,000 Shares issued andoutstanding: 2010—168,331,858 (2009—171,254,753) . . . . . . . . . . . . . . . . . . . . . 2 2
Additional paid-in capital . . . . . . . . . . . . . . . . . . . . . . . . . . . . . . . . . . . . . . . . . . . . . . . 3,075 3,130Retained earnings . . . . . . . . . . . . . . . . . . . . . . . . . . . . . . . . . . . . . . . . . . . . . . . . . . . . . 219 275Accumulated other comprehensive loss . . . . . . . . . . . . . . . . . . . . . . . . . . . . . . . . . . . . (10) (1)
Total shareholders’ equity . . . . . . . . . . . . . . . . . . . . . . . . . . . . . . . . . . . . . . . . . . . 3,286 3,406Non-controlling interests . . . . . . . . . . . . . . . . . . . . . . . . . . . . . . . . . . . . . . . . . . . . . . . . . . . . 20 17
Total equity . . . . . . . . . . . . . . . . . . . . . . . . . . . . . . . . . . . . . . . . . . . . . . . . . . . . . . . . . . 3,306 3,423
$8,814 $9,021
The accompanying notes are an integral part of these financial statements.
MEADWESTVACO CORPORATION AND CONSOLIDATED SUBSIDIARY COMPANIES
42
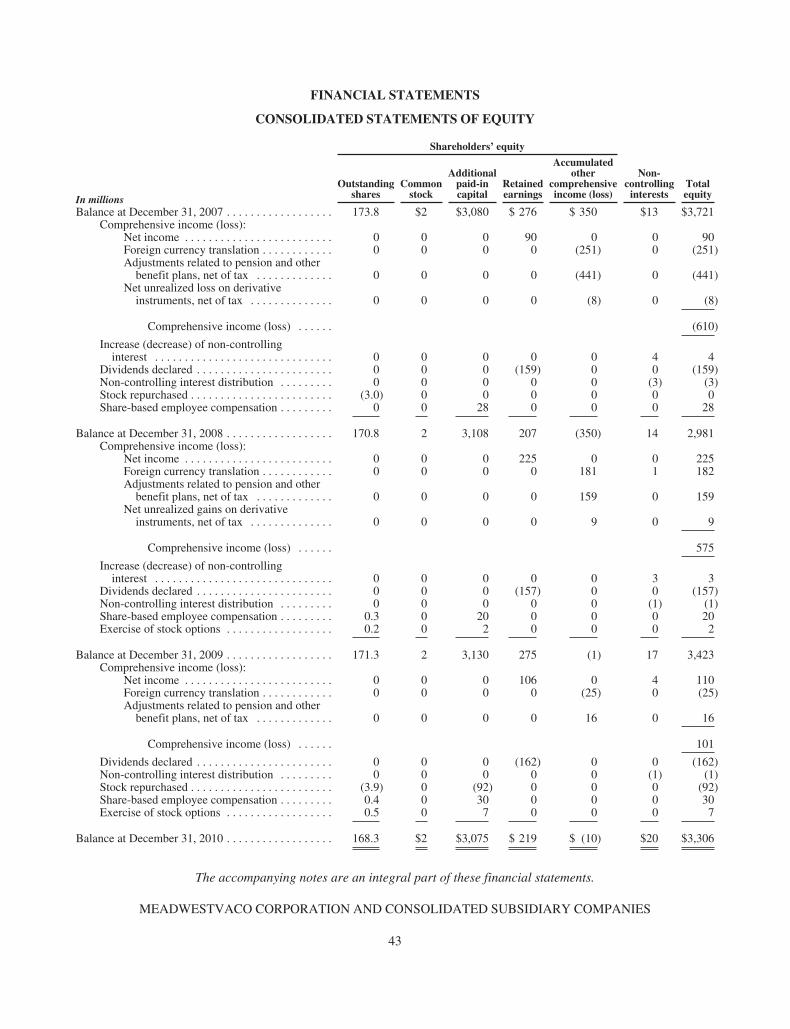
FINANCIAL STATEMENTS
CONSOLIDATED STATEMENTS OF EQUITY
In millions
Shareholders’ equity
Non-controllinginterests
Totalequity
Outstandingshares
Commonstock
Additionalpaid-incapital
Retainedearnings
Accumulatedother
comprehensiveincome (loss)
Balance at December 31, 2007 . . . . . . . . . . . . . . . . . . 173.8 $2 $3,080 $ 276 $ 350 $13 $3,721Comprehensive income (loss):
Net income . . . . . . . . . . . . . . . . . . . . . . . . . 0 0 0 90 0 0 90Foreign currency translation . . . . . . . . . . . . 0 0 0 0 (251) 0 (251)Adjustments related to pension and otherbenefit plans, net of tax . . . . . . . . . . . . . 0 0 0 0 (441) 0 (441)
Net unrealized loss on derivativeinstruments, net of tax . . . . . . . . . . . . . . 0 0 0 0 (8) 0 (8)
Comprehensive income (loss) . . . . . . (610)
Increase (decrease) of non-controllinginterest . . . . . . . . . . . . . . . . . . . . . . . . . . . . . . 0 0 0 0 0 4 4
Dividends declared . . . . . . . . . . . . . . . . . . . . . . . 0 0 0 (159) 0 0 (159)Non-controlling interest distribution . . . . . . . . . 0 0 0 0 0 (3) (3)Stock repurchased . . . . . . . . . . . . . . . . . . . . . . . . (3.0) 0 0 0 0 0 0Share-based employee compensation . . . . . . . . . 0 0 28 0 0 0 28
Balance at December 31, 2008 . . . . . . . . . . . . . . . . . . 170.8 2 3,108 207 (350) 14 2,981Comprehensive income (loss):
Net income . . . . . . . . . . . . . . . . . . . . . . . . . 0 0 0 225 0 0 225Foreign currency translation . . . . . . . . . . . . 0 0 0 0 181 1 182Adjustments related to pension and otherbenefit plans, net of tax . . . . . . . . . . . . . 0 0 0 0 159 0 159
Net unrealized gains on derivativeinstruments, net of tax . . . . . . . . . . . . . . 0 0 0 0 9 0 9
Comprehensive income (loss) . . . . . . 575
Increase (decrease) of non-controllinginterest . . . . . . . . . . . . . . . . . . . . . . . . . . . . . . 0 0 0 0 0 3 3
Dividends declared . . . . . . . . . . . . . . . . . . . . . . . 0 0 0 (157) 0 0 (157)Non-controlling interest distribution . . . . . . . . . 0 0 0 0 0 (1) (1)Share-based employee compensation . . . . . . . . . 0.3 0 20 0 0 0 20Exercise of stock options . . . . . . . . . . . . . . . . . . 0.2 0 2 0 0 0 2
Balance at December 31, 2009 . . . . . . . . . . . . . . . . . . 171.3 2 3,130 275 (1) 17 3,423Comprehensive income (loss):
Net income . . . . . . . . . . . . . . . . . . . . . . . . . 0 0 0 106 0 4 110Foreign currency translation . . . . . . . . . . . . 0 0 0 0 (25) 0 (25)Adjustments related to pension and otherbenefit plans, net of tax . . . . . . . . . . . . . 0 0 0 0 16 0 16
Comprehensive income (loss) . . . . . . 101
Dividends declared . . . . . . . . . . . . . . . . . . . . . . . 0 0 0 (162) 0 0 (162)Non-controlling interest distribution . . . . . . . . . 0 0 0 0 0 (1) (1)Stock repurchased . . . . . . . . . . . . . . . . . . . . . . . . (3.9) 0 (92) 0 0 0 (92)Share-based employee compensation . . . . . . . . . 0.4 0 30 0 0 0 30Exercise of stock options . . . . . . . . . . . . . . . . . . 0.5 0 7 0 0 0 7
Balance at December 31, 2010 . . . . . . . . . . . . . . . . . . 168.3 $2 $3,075 $ 219 $ (10) $20 $3,306
The accompanying notes are an integral part of these financial statements.
MEADWESTVACO CORPORATION AND CONSOLIDATED SUBSIDIARY COMPANIES
43
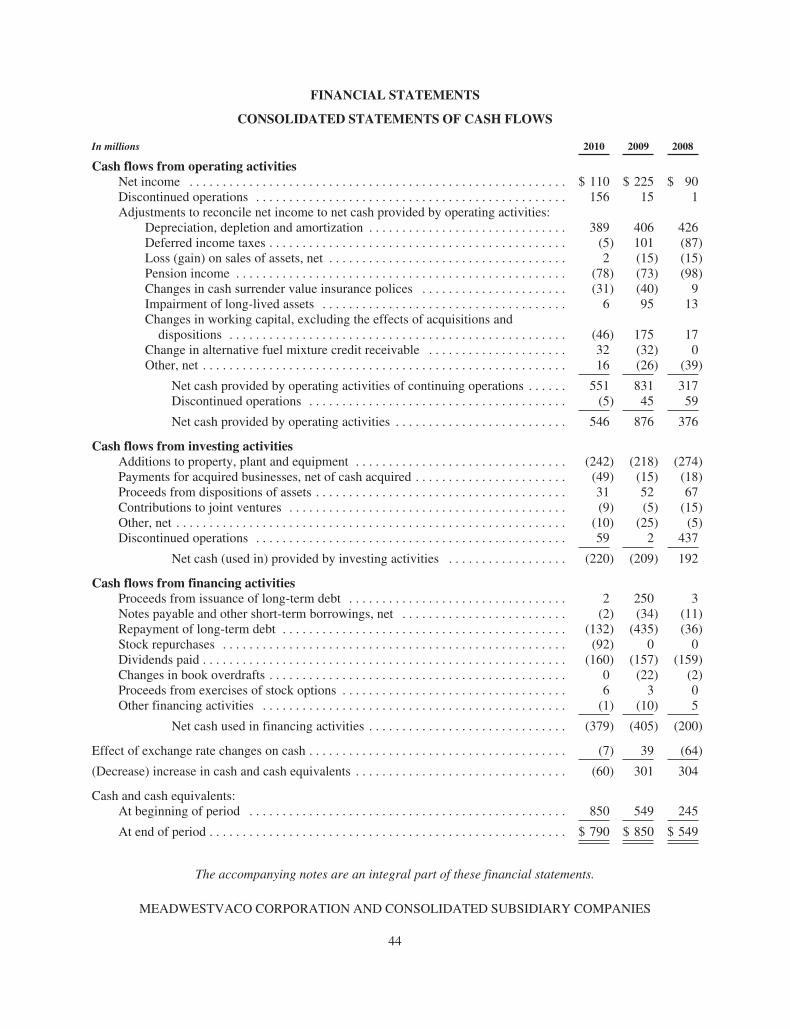
FINANCIAL STATEMENTS
CONSOLIDATED STATEMENTS OF CASH FLOWS
In millions 2010 2009 2008
Cash flows from operating activitiesNet income . . . . . . . . . . . . . . . . . . . . . . . . . . . . . . . . . . . . . . . . . . . . . . . . . . . . . . . . . $ 110 $ 225 $ 90Discontinued operations . . . . . . . . . . . . . . . . . . . . . . . . . . . . . . . . . . . . . . . . . . . . . . . 156 15 1Adjustments to reconcile net income to net cash provided by operating activities:
Depreciation, depletion and amortization . . . . . . . . . . . . . . . . . . . . . . . . . . . . . . 389 406 426Deferred income taxes . . . . . . . . . . . . . . . . . . . . . . . . . . . . . . . . . . . . . . . . . . . . . (5) 101 (87)Loss (gain) on sales of assets, net . . . . . . . . . . . . . . . . . . . . . . . . . . . . . . . . . . . . 2 (15) (15)Pension income . . . . . . . . . . . . . . . . . . . . . . . . . . . . . . . . . . . . . . . . . . . . . . . . . . (78) (73) (98)Changes in cash surrender value insurance polices . . . . . . . . . . . . . . . . . . . . . . (31) (40) 9Impairment of long-lived assets . . . . . . . . . . . . . . . . . . . . . . . . . . . . . . . . . . . . . 6 95 13Changes in working capital, excluding the effects of acquisitions anddispositions . . . . . . . . . . . . . . . . . . . . . . . . . . . . . . . . . . . . . . . . . . . . . . . . . . . (46) 175 17
Change in alternative fuel mixture credit receivable . . . . . . . . . . . . . . . . . . . . . 32 (32) 0Other, net . . . . . . . . . . . . . . . . . . . . . . . . . . . . . . . . . . . . . . . . . . . . . . . . . . . . . . . 16 (26) (39)
Net cash provided by operating activities of continuing operations . . . . . . 551 831 317Discontinued operations . . . . . . . . . . . . . . . . . . . . . . . . . . . . . . . . . . . . . . . (5) 45 59
Net cash provided by operating activities . . . . . . . . . . . . . . . . . . . . . . . . . . 546 876 376
Cash flows from investing activitiesAdditions to property, plant and equipment . . . . . . . . . . . . . . . . . . . . . . . . . . . . . . . . (242) (218) (274)Payments for acquired businesses, net of cash acquired . . . . . . . . . . . . . . . . . . . . . . . (49) (15) (18)Proceeds from dispositions of assets . . . . . . . . . . . . . . . . . . . . . . . . . . . . . . . . . . . . . . 31 52 67Contributions to joint ventures . . . . . . . . . . . . . . . . . . . . . . . . . . . . . . . . . . . . . . . . . . (9) (5) (15)Other, net . . . . . . . . . . . . . . . . . . . . . . . . . . . . . . . . . . . . . . . . . . . . . . . . . . . . . . . . . . . (10) (25) (5)Discontinued operations . . . . . . . . . . . . . . . . . . . . . . . . . . . . . . . . . . . . . . . . . . . . . . . 59 2 437
Net cash (used in) provided by investing activities . . . . . . . . . . . . . . . . . . (220) (209) 192
Cash flows from financing activitiesProceeds from issuance of long-term debt . . . . . . . . . . . . . . . . . . . . . . . . . . . . . . . . . 2 250 3Notes payable and other short-term borrowings, net . . . . . . . . . . . . . . . . . . . . . . . . . (2) (34) (11)Repayment of long-term debt . . . . . . . . . . . . . . . . . . . . . . . . . . . . . . . . . . . . . . . . . . . (132) (435) (36)Stock repurchases . . . . . . . . . . . . . . . . . . . . . . . . . . . . . . . . . . . . . . . . . . . . . . . . . . . . (92) 0 0Dividends paid . . . . . . . . . . . . . . . . . . . . . . . . . . . . . . . . . . . . . . . . . . . . . . . . . . . . . . . (160) (157) (159)Changes in book overdrafts . . . . . . . . . . . . . . . . . . . . . . . . . . . . . . . . . . . . . . . . . . . . . 0 (22) (2)Proceeds from exercises of stock options . . . . . . . . . . . . . . . . . . . . . . . . . . . . . . . . . . 6 3 0Other financing activities . . . . . . . . . . . . . . . . . . . . . . . . . . . . . . . . . . . . . . . . . . . . . . (1) (10) 5
Net cash used in financing activities . . . . . . . . . . . . . . . . . . . . . . . . . . . . . . (379) (405) (200)
Effect of exchange rate changes on cash . . . . . . . . . . . . . . . . . . . . . . . . . . . . . . . . . . . . . . . (7) 39 (64)
(Decrease) increase in cash and cash equivalents . . . . . . . . . . . . . . . . . . . . . . . . . . . . . . . . (60) 301 304
Cash and cash equivalents:At beginning of period . . . . . . . . . . . . . . . . . . . . . . . . . . . . . . . . . . . . . . . . . . . . . . . . 850 549 245
At end of period . . . . . . . . . . . . . . . . . . . . . . . . . . . . . . . . . . . . . . . . . . . . . . . . . . . . . . $ 790 $ 850 $ 549
The accompanying notes are an integral part of these financial statements.
MEADWESTVACO CORPORATION AND CONSOLIDATED SUBSIDIARY COMPANIES
44
NOTES TO CONSOLIDATED FINANCIAL STATEMENTS
Summary of significant accounting policies
Basis of consolidation and preparation of financial statements: The consolidated financial statementsinclude all majority-owned or controlled entities of MeadWestvaco Corporation (“MeadWestvaco”, “MWV”, orthe “company”), and all significant inter-company transactions are eliminated. MWV’s segments are(i) Packaging Resources, (ii) Consumer Solutions, (iii) Consumer & Office Products, (iv) Specialty Chemicals,and (v) Community Development and Land Management.
Estimates and assumptions: The preparation of financial statements in accordance with generally acceptedaccounting principles requires management to make estimates and assumptions that affect the reported amountsof some assets and liabilities and, in some instances, the reported amounts of revenues and expenses during thereporting period. Actual results could differ from these estimates.
Translation of foreign currencies: The local currency is the functional currency for substantially all of thecompany’s significant operations outside the U.S. The assets and liabilities of the company’s foreign subsidiariesare translated into U.S. dollars using period-end exchange rates, and adjustments resulting from these financialstatement translations are included in accumulated other comprehensive loss in the consolidated balance sheets.Revenues and expenses are translated at average rates prevailing during the period.
Cash equivalents: Highly liquid securities with an original maturity of three months or less are considered tobe cash equivalents.
Accounts receivable and allowance for doubtful accounts: Trade accounts receivable are recorded at theinvoice amount and generally do not bear interest. The allowance for doubtful accounts is the company’s bestestimate of the amount of probable loss in the existing accounts receivable. The company determines theallowance based on historical write-off experience by business. Past due balances over a specified amount arereviewed individually for collectibility. Account balances are charged off against the allowance when it isprobable that the receivable will not be recovered.
Inventories: Inventories are valued at the lower of cost or market. Cost is determined using the last-in,first-out method for substantially all raw materials, finished goods and production materials of U.S.manufacturing operations. Cost of all other inventories, including stores and supplies inventories and inventoriesof non-U.S. manufacturing operations, is determined by the first-in, first-out or average cost methods.
Property, plant, equipment and forestlands: Owned assets are recorded at cost. Also included in the cost ofthese assets is interest on funds borrowed during the construction period. When assets are sold, retired ordisposed of, their cost and related accumulated depreciation are removed from the accounts and any resultinggain or loss is reflected in cost of sales. Gains and losses on sales of corporate real estate are recorded in otherincome, net. Costs of renewals and betterments of properties are capitalized; costs of maintenance and repairs arecharged to expense. Costs of reforestation of forestlands are capitalized. Reforestation costs include the costs ofseedlings, site preparation, planting of seedlings and early-stage fertilization.
Depreciation and depletion: The cost of plant and equipment is depreciated, utilizing the straight-linemethod, over the estimated useful lives of the assets, which range from 20 to 40 years for buildings and 5 to 30years for machinery and equipment. Timber is depleted as timber is cut at rates determined annually based on therelationship of undepleted timber costs to the estimated volume of recoverable timber. Timber volumes used incalculating depletion rates are based upon merchantable timber volumes at a specific point in time. The depletionrates for company-owned land do not include an estimate of either future reforestation costs associated with astand’s final harvest or future volume in connection with replanting of a stand subsequent to the final harvest.
45
NOTES TO CONSOLIDATED FINANCIAL STATEMENTS—(Continued)
Impairment of long-lived assets: The company periodically evaluates whether current events orcircumstances indicate that the carrying value of its long-lived assets, including intangible assets with finite lives,to be held and used may not be recoverable. If such circumstances are determined to exist, an estimate ofundiscounted future cash flows produced by the long-lived asset, or the appropriate grouping of assets, iscompared to carrying value to determine whether impairment exists.
If an asset is determined to be impaired, the loss is measured based on quoted market prices in activemarkets, if available. If quoted market prices are not available, the estimate of fair value is based on variousvaluation techniques, including a discounted value of estimated future cash flows. The company reports an assetto be disposed of at the lower of its carrying value or its estimated net realizable value.
Intangible assets assigned indefinite lives are to be tested at least annually or more often if events or changesin circumstances indicate that the fair value of an intangible asset is below its carrying value. The fair values ofthe company’s indefinite-lived intangible assets (primarily Calmar trademarks and trade names) are estimatedusing an income approach (the relief from royalty method). Although the estimate of the fair values of thecompany’s indefinite-lived intangible assets under the income approach exceed the respective carrying values,different assumptions regarding projected performance and other factors could result in significant non-cashimpairment charges in the future. Based on the company’s annual review of the indefinite-lived intangible assetsas of October 1, 2010, there was no indication of impairment.
Goodwill: Goodwill represents the excess of cost of an acquired business over the fair value of theidentifiable tangible and intangible assets acquired and liabilities assumed in a business combination. Thecompany reviews the recorded value of goodwill at least annually on October 1, or sooner if events or changes incircumstances indicate that the fair value of a reporting unit is below its carrying value. Goodwill is required tobe tested for impairment using a two-step process. The first step is to identify a potential impairment and thesecond step is to measure the amount of the impairment loss, if any. Goodwill is deemed to be impaired if thecarrying amount of a reporting unit’s goodwill exceeds its estimated fair value. Goodwill has been allocated tothe company’s respective reporting units based on its nature and synergies expected to be achieved. The fairvalue of each reporting unit is estimated primarily using an income approach, specifically the discounted cashflow method. The company employs significant assumptions in evaluating its goodwill for impairment. Theseassumptions include relevant considerations of market-participant data.
In applying the income approach in assessing goodwill for impairment, changes in assumptions couldmaterially affect the determination of fair value for a reporting unit. Although the fair value estimates of thecompany’s reporting units under the income approach exceed the respective carrying values, differentassumptions regarding projected performance and other factors could result in significant non-cash impairmentcharges in the future. The following assumptions are key to the company’s income approach:
• Business projections—Projections are based on three-year forecasts that are developed internally bymanagement and reviewed by the company’s Board of Directors. These projections include significantassumptions such as estimates of future revenues, profits, working capital requirements, operatingplans, costs of planned restructuring actions and capital expenditures. Assumptions surrounding macro-economic data and estimates include industry projections, inflation, foreign currency exchange ratesand costs of energy, raw materials and freight.
• Growth rates—A growth rate based on market participant data considerations is used to calculate theterminal value of a reporting unit. The growth rate is the expected rate at which a reporting unit’searnings stream is projected to grow beyond the three-year forecast period.
• Discount rates—Future cash flows are discounted at a rate that is consistent with a weighted averagecost of capital for a potential market participant. The weighted average cost of capital is an estimate ofthe overall after-tax rate of return required by equity and debt holders of a business enterprise. The
46
NOTES TO CONSOLIDATED FINANCIAL STATEMENTS—(Continued)
discount rates selected for the reporting units are based on existing conditions within the respectivemarkets and reflect appropriate adjustments for potential risk premiums in those markets as well asappropriate weighting of the market cost of equity versus debt, which is developed with the assistanceof external financial advisors.
• Tax rates—Tax rates are based on estimates of the tax rates that a market participant would realize inthe respective primary markets and geographic areas in which the reporting units operate.
Based on management’s annual evaluation of the recorded value of goodwill as of October 1, 2010, therewas no indication of impairment. However, changes to any of the above assumptions could lead to impairment ofgoodwill in the future. See Note D for further information.
Other assets: Capitalized software for internal use, equipment leased to customers and other amortizableand indefinite-lived intangible assets are included in other assets. Capitalized software and other amortizableintangibles are amortized using the straight-line and cash flows methods over their estimated useful lives of 3 to21 years. Equipment leased to customers is amortized using the sum-of-the-years-digits method over theestimated useful life of the machine, generally 10 years. Revenue is recognized for the leased equipment on astraight-line basis over the life of the lease and is included in net sales. The company records softwaredevelopment costs in accordance with the accounting guidance provided by the Financial Accounting StandardsBoard. See Note D and Note E for further information.
Financial instruments: The company utilizes well-defined financial derivatives in the normal course of itsoperations as a means to manage some of its interest rate, foreign currency and commodity risks. All derivativeinstruments are required to be recorded in the consolidated balance sheets as assets or liabilities, measured at fairvalue. The fair value estimates are based on relevant market information, including market rates and prices. If thederivative is designated as a fair-value hedge, the changes in the fair value of the derivative and of the hedgeditem attributable to the hedged risk are recognized in earnings. If the derivative is designated as a cash-flowhedge, the effective portion of the change in the fair value of the derivative is recorded in accumulated othercomprehensive income or loss and is recognized in the consolidated statements of operations when the hedgeditem affects earnings. Ineffective portions of changes in the fair value of cash-flow hedges are recognized inearnings. If a derivative is not designated as a qualifying hedge, changes in fair value are recognized in earnings.See Note H for further information.
Environmental and legal liabilities: Environmental expenditures that increase useful lives of assets arecapitalized, while other environmental expenditures are expensed. Liabilities are recorded when remedial effortsare probable and the costs can be reasonably estimated. The company recognizes a liability for other legalcontingencies when a loss is probable and reasonably estimable. Liabilities recorded for claims are limited topending cases based on the company’s historical experience, consultation with outside counsel and consultationwith an actuarial specialist concerning the feasibility of reasonably estimating liabilities associated with claimsthat may arise in the future. The company recognizes insurance recoveries when collection is reasonably assured.See Note P for further information.
Asset retirement obligations: The company has certain conditional and unconditional asset retirementobligations associated with owned or leased property, plant and equipment, including surface impoundments,asbestos, and water supply wells. The company records a liability for the fair value of an asset retirementobligation when incurred if the fair value of the liability can be reasonably estimated. Management does not havesufficient information to estimate the fair value of certain obligations, primarily associated with surfaceimpoundments and asbestos, because the settlement date or range of potential settlement dates has not beenspecified and information is not available to apply expected present value techniques. Subsequent to initialmeasurement, the company recognizes changes in the amounts of the obligations, as necessary, resulting from thepassage of time and revisions to either the timing or amount of estimated cash flows.
47
NOTES TO CONSOLIDATED FINANCIAL STATEMENTS—(Continued)
Revenue recognition: The company recognizes revenues at the point when title and the risk of ownershippasses to the customer. Substantially all of the company’s revenues are generated through product sales andshipping terms generally indicate when title and the risk of ownership have passed. Revenue is recognized atshipment for sales where shipping terms are FOB (free on board) shipping point unless risk of loss is maintainedunder freight terms. For sales where shipping terms are FOB destination, revenue is recognized when the goodsare received by the customer. The company provides allowances for estimated returns and other customer creditssuch as discounts and volume rebates, when the revenue is recognized, based on historical experience, currenttrends and any notification of pending returns. Also included in net sales is service revenue which is recognizedas the service is performed. Revenue is recognized for leased equipment to customers on a straight-line basisover the estimated term of the lease and is included in net sales of the company. Sales of landholdings areincluded in net sales in the consolidated statements of operations to reflect the strategic view and structure of theoperations of the Community Development and Land Management segment established in 2008.
Shipping and handling costs: Shipping and handling costs are classified as a component of cost of sales.Amounts billed to a customer in a sales transaction related to shipping and handling are classified as revenue.
Research and development: Included in cost of sales and selling, general and administrative expenses areexpenditures for research and development of $41 million, $43 million and $58 million for the years endedDecember 31, 2010, 2009 and 2008, respectively, which were expensed as incurred.
Income taxes: Deferred income taxes are recorded for temporary differences between financial statementcarrying amounts and the tax basis of assets and liabilities. Deferred tax assets and liabilities reflect the enactedtax rates in effect for the years the differences are expected to reverse. The company evaluates the need for adeferred tax asset valuation allowance by assessing whether it is more likely than not that it will realize itsdeferred tax assets in the future.
The company has tax jurisdictions located in many areas of the world and is subject to audit in thesejurisdictions. Tax audits by their nature are often complex and can require several years to resolve. In thepreparation of the company’s financial statements, management exercises judgments in estimating the potentialexposure to unresolved tax matters. The company recognizes the tax benefit from an uncertain tax position if it ismore likely than not that the position is sustainable. For those tax positions that meet the more likely than notcriteria, the company records only the portion of the tax benefit that is greater than 50% likely to be realizedupon settlement with the respective taxing authority. Interest and penalties related to unrecognized tax benefitsare recorded within income tax expense in the consolidated statements of operations. While actual results couldvary, in management’s judgment, the company has adequate tax accruals with respect to the ultimate outcome ofsuch unresolved tax matters.
Share-based compensation: The company records compensation expense for graded and cliff vestingawards on a straight-line basis over the vesting period, which is generally three years. The company uses the“long-haul” method to determine the pool of tax benefits or deficiencies resulting from tax deductions related toawards of equity instruments that exceed or are less than the cumulative compensation cost for those instrumentsrecognized for financial reporting. Substantially all compensation expense related to share-based awards isrecorded as a component of selling, general and administrative expenses in the consolidated statements ofoperations. For stock-settled awards, the company issues previously authorized new shares. See Note K forfurther detail on share-based compensation.
Net income per share: Basic net income per share for all the periods presented has been calculated using thecompany’s weighted average shares outstanding. In computing diluted net income per share, incremental sharesissuable upon the assumed exercise of stock options and other share-based compensation awards have beenadded to weighted average shares outstanding, if dilutive. For the years ended December 31, 2010, 2009, and
48
NOTES TO CONSOLIDATED FINANCIAL STATEMENTS—(Continued)
2008, 7.9 million, 8.0 million and 9.0 million equity awards, respectively, were excluded from the calculation ofweighted average shares outstanding, as the exercise price per share was greater than the average market value,resulting in an anti-dilutive effect on diluted earnings per share.
Related party transactions: The company has certain related party transactions in the ordinary course ofbusiness that are insignificant.
Discontinued operations: Certain prior period amounts have been reclassified in these consolidated financialstatements to conform to the 2010 presentation of discontinued operations for the media and entertainmentpackaging business and the envelope products business, as well as the 2008 presentation of discontinuedoperations of the Kraft business. See Note R for additional information.
New accounting guidance
During 2010, the company adopted the below accounting guidance as promulgated by the FinancialAccounting Standards Board.
Accounting for variable interest entities
On January 1, 2010, the company adopted new accounting guidance related to the accounting and disclosurefor variable interest entities. The new guidance provides an improved framework for identifying whether anenterprise has a controlling financial interest in a variable interest entity and requires additional disclosures of anenterprise’s involvement with variable interest entities. The adoption did not have an effect on the company’sconsolidated financial statements for the year ended December 31, 2010.
Fair value disclosures
On January 1, 2010, the company adopted new accounting guidance that requires additional disclosuresregarding different classes of assets and liabilities measured at fair value, valuation techniques employed andtransfers between the levels of fair value measurements. See Note A for disclosures of fair value measurements.
There were no other accounting standards issued in 2010 that had or are expected to have a material impacton the company’s financial position or results of operations.
49
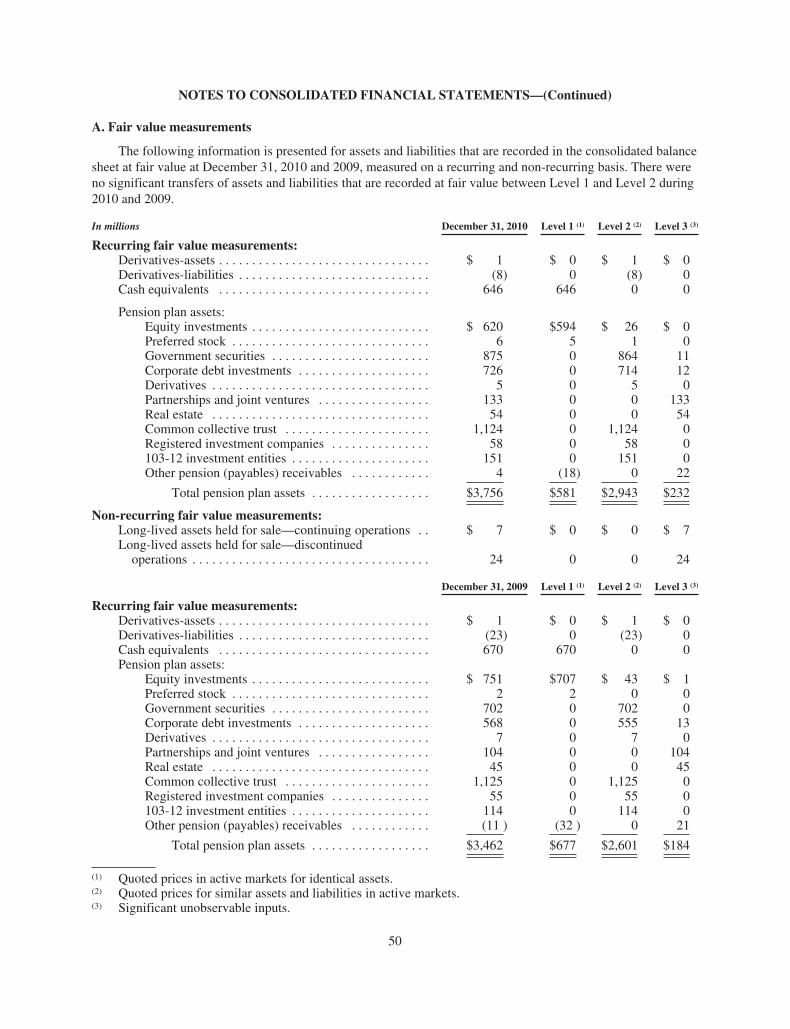
NOTES TO CONSOLIDATED FINANCIAL STATEMENTS—(Continued)
A. Fair value measurements
The following information is presented for assets and liabilities that are recorded in the consolidated balancesheet at fair value at December 31, 2010 and 2009, measured on a recurring and non-recurring basis. There wereno significant transfers of assets and liabilities that are recorded at fair value between Level 1 and Level 2 during2010 and 2009.
In millions December 31, 2010 Level 1 (1) Level 2 (2) Level 3 (3)
Recurring fair value measurements:Derivatives-assets . . . . . . . . . . . . . . . . . . . . . . . . . . . . . . . . $ 1 $ 0 $ 1 $ 0Derivatives-liabilities . . . . . . . . . . . . . . . . . . . . . . . . . . . . . (8) 0 (8) 0Cash equivalents . . . . . . . . . . . . . . . . . . . . . . . . . . . . . . . . 646 646 0 0
Pension plan assets:Equity investments . . . . . . . . . . . . . . . . . . . . . . . . . . . $ 620 $594 $ 26 $ 0Preferred stock . . . . . . . . . . . . . . . . . . . . . . . . . . . . . . 6 5 1 0Government securities . . . . . . . . . . . . . . . . . . . . . . . . 875 0 864 11Corporate debt investments . . . . . . . . . . . . . . . . . . . . 726 0 714 12Derivatives . . . . . . . . . . . . . . . . . . . . . . . . . . . . . . . . . 5 0 5 0Partnerships and joint ventures . . . . . . . . . . . . . . . . . 133 0 0 133Real estate . . . . . . . . . . . . . . . . . . . . . . . . . . . . . . . . . 54 0 0 54Common collective trust . . . . . . . . . . . . . . . . . . . . . . 1,124 0 1,124 0Registered investment companies . . . . . . . . . . . . . . . 58 0 58 0103-12 investment entities . . . . . . . . . . . . . . . . . . . . . 151 0 151 0Other pension (payables) receivables . . . . . . . . . . . . 4 (18) 0 22
Total pension plan assets . . . . . . . . . . . . . . . . . . $3,756 $581 $2,943 $232
Non-recurring fair value measurements:Long-lived assets held for sale—continuing operations . . $ 7 $ 0 $ 0 $ 7Long-lived assets held for sale—discontinuedoperations . . . . . . . . . . . . . . . . . . . . . . . . . . . . . . . . . . . . 24 0 0 24
December 31, 2009 Level 1 (1) Level 2 (2) Level 3 (3)
Recurring fair value measurements:Derivatives-assets . . . . . . . . . . . . . . . . . . . . . . . . . . . . . . . . $ 1 $ 0 $ 1 $ 0Derivatives-liabilities . . . . . . . . . . . . . . . . . . . . . . . . . . . . . (23) 0 (23) 0Cash equivalents . . . . . . . . . . . . . . . . . . . . . . . . . . . . . . . . 670 670 0 0Pension plan assets:
Equity investments . . . . . . . . . . . . . . . . . . . . . . . . . . . $ 751 $707 $ 43 $ 1Preferred stock . . . . . . . . . . . . . . . . . . . . . . . . . . . . . . 2 2 0 0Government securities . . . . . . . . . . . . . . . . . . . . . . . . 702 0 702 0Corporate debt investments . . . . . . . . . . . . . . . . . . . . 568 0 555 13Derivatives . . . . . . . . . . . . . . . . . . . . . . . . . . . . . . . . . 7 0 7 0Partnerships and joint ventures . . . . . . . . . . . . . . . . . 104 0 0 104Real estate . . . . . . . . . . . . . . . . . . . . . . . . . . . . . . . . . 45 0 0 45Common collective trust . . . . . . . . . . . . . . . . . . . . . . 1,125 0 1,125 0Registered investment companies . . . . . . . . . . . . . . . 55 0 55 0103-12 investment entities . . . . . . . . . . . . . . . . . . . . . 114 0 114 0Other pension (payables) receivables . . . . . . . . . . . . (11 ) (32 ) 0 21
Total pension plan assets . . . . . . . . . . . . . . . . . . $3,462 $677 $2,601 $184
(1) Quoted prices in active markets for identical assets.(2) Quoted prices for similar assets and liabilities in active markets.(3) Significant unobservable inputs.
50
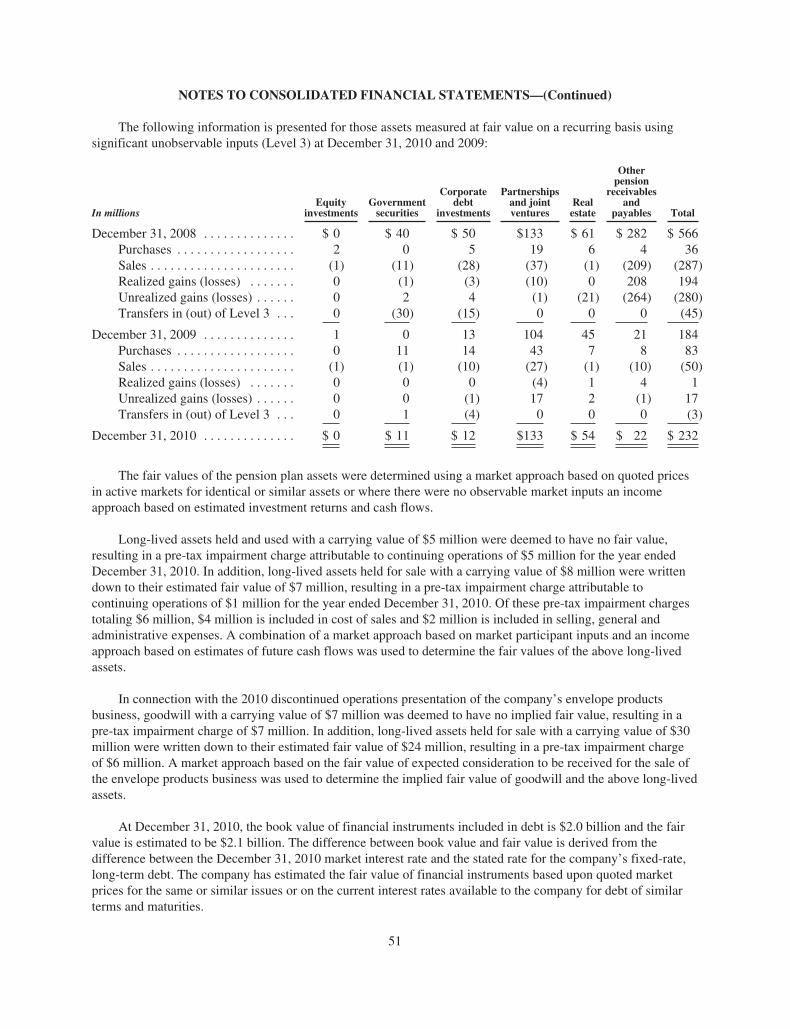
NOTES TO CONSOLIDATED FINANCIAL STATEMENTS—(Continued)
The following information is presented for those assets measured at fair value on a recurring basis usingsignificant unobservable inputs (Level 3) at December 31, 2010 and 2009:
In millionsEquity
investmentsGovernmentsecurities
Corporatedebt
investments
Partnershipsand jointventures
Realestate
Otherpension
receivablesand
payables Total
December 31, 2008 . . . . . . . . . . . . . . $ 0 $ 40 $ 50 $133 $ 61 $ 282 $ 566Purchases . . . . . . . . . . . . . . . . . . 2 0 5 19 6 4 36Sales . . . . . . . . . . . . . . . . . . . . . . (1) (11) (28) (37) (1) (209) (287)Realized gains (losses) . . . . . . . 0 (1) (3) (10) 0 208 194Unrealized gains (losses) . . . . . . 0 2 4 (1) (21) (264) (280)Transfers in (out) of Level 3 . . . 0 (30) (15) 0 0 0 (45)
December 31, 2009 . . . . . . . . . . . . . . 1 0 13 104 45 21 184Purchases . . . . . . . . . . . . . . . . . . 0 11 14 43 7 8 83Sales . . . . . . . . . . . . . . . . . . . . . . (1) (1) (10) (27) (1) (10) (50)Realized gains (losses) . . . . . . . 0 0 0 (4) 1 4 1Unrealized gains (losses) . . . . . . 0 0 (1) 17 2 (1) 17Transfers in (out) of Level 3 . . . 0 1 (4) 0 0 0 (3)
December 31, 2010 . . . . . . . . . . . . . . $ 0 $ 11 $ 12 $133 $ 54 $ 22 $ 232
The fair values of the pension plan assets were determined using a market approach based on quoted pricesin active markets for identical or similar assets or where there were no observable market inputs an incomeapproach based on estimated investment returns and cash flows.
Long-lived assets held and used with a carrying value of $5 million were deemed to have no fair value,resulting in a pre-tax impairment charge attributable to continuing operations of $5 million for the year endedDecember 31, 2010. In addition, long-lived assets held for sale with a carrying value of $8 million were writtendown to their estimated fair value of $7 million, resulting in a pre-tax impairment charge attributable tocontinuing operations of $1 million for the year ended December 31, 2010. Of these pre-tax impairment chargestotaling $6 million, $4 million is included in cost of sales and $2 million is included in selling, general andadministrative expenses. A combination of a market approach based on market participant inputs and an incomeapproach based on estimates of future cash flows was used to determine the fair values of the above long-livedassets.
In connection with the 2010 discontinued operations presentation of the company’s envelope productsbusiness, goodwill with a carrying value of $7 million was deemed to have no implied fair value, resulting in apre-tax impairment charge of $7 million. In addition, long-lived assets held for sale with a carrying value of $30million were written down to their estimated fair value of $24 million, resulting in a pre-tax impairment chargeof $6 million. A market approach based on the fair value of expected consideration to be received for the sale ofthe envelope products business was used to determine the implied fair value of goodwill and the above long-livedassets.
At December 31, 2010, the book value of financial instruments included in debt is $2.0 billion and the fairvalue is estimated to be $2.1 billion. The difference between book value and fair value is derived from thedifference between the December 31, 2010 market interest rate and the stated rate for the company’s fixed-rate,long-term debt. The company has estimated the fair value of financial instruments based upon quoted marketprices for the same or similar issues or on the current interest rates available to the company for debt of similarterms and maturities.
51
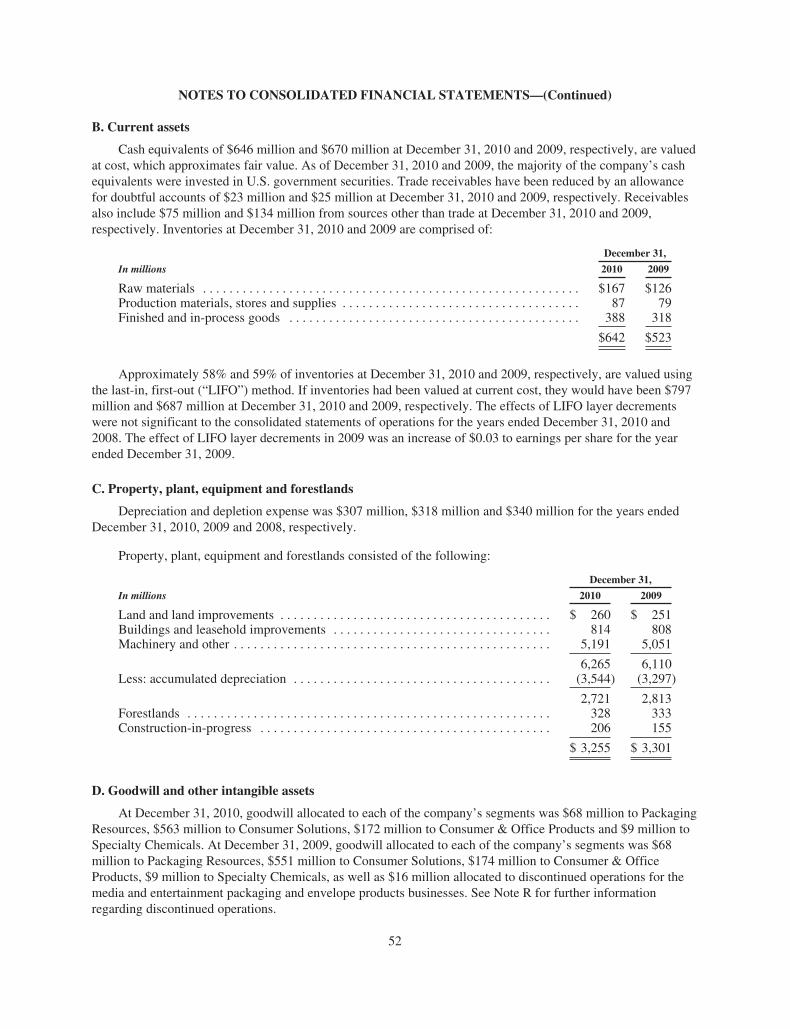
NOTES TO CONSOLIDATED FINANCIAL STATEMENTS—(Continued)
B. Current assets
Cash equivalents of $646 million and $670 million at December 31, 2010 and 2009, respectively, are valuedat cost, which approximates fair value. As of December 31, 2010 and 2009, the majority of the company’s cashequivalents were invested in U.S. government securities. Trade receivables have been reduced by an allowancefor doubtful accounts of $23 million and $25 million at December 31, 2010 and 2009, respectively. Receivablesalso include $75 million and $134 million from sources other than trade at December 31, 2010 and 2009,respectively. Inventories at December 31, 2010 and 2009 are comprised of:
December 31,
In millions 2010 2009
Raw materials . . . . . . . . . . . . . . . . . . . . . . . . . . . . . . . . . . . . . . . . . . . . . . . . . . . . . . . . . $167 $126Production materials, stores and supplies . . . . . . . . . . . . . . . . . . . . . . . . . . . . . . . . . . . . 87 79Finished and in-process goods . . . . . . . . . . . . . . . . . . . . . . . . . . . . . . . . . . . . . . . . . . . . 388 318
$642 $523
Approximately 58% and 59% of inventories at December 31, 2010 and 2009, respectively, are valued usingthe last-in, first-out (“LIFO”) method. If inventories had been valued at current cost, they would have been $797million and $687 million at December 31, 2010 and 2009, respectively. The effects of LIFO layer decrementswere not significant to the consolidated statements of operations for the years ended December 31, 2010 and2008. The effect of LIFO layer decrements in 2009 was an increase of $0.03 to earnings per share for the yearended December 31, 2009.
C. Property, plant, equipment and forestlands
Depreciation and depletion expense was $307 million, $318 million and $340 million for the years endedDecember 31, 2010, 2009 and 2008, respectively.
Property, plant, equipment and forestlands consisted of the following:
December 31,
In millions 2010 2009
Land and land improvements . . . . . . . . . . . . . . . . . . . . . . . . . . . . . . . . . . . . . . . . . $ 260 $ 251Buildings and leasehold improvements . . . . . . . . . . . . . . . . . . . . . . . . . . . . . . . . . 814 808Machinery and other . . . . . . . . . . . . . . . . . . . . . . . . . . . . . . . . . . . . . . . . . . . . . . . . 5,191 5,051
6,265 6,110Less: accumulated depreciation . . . . . . . . . . . . . . . . . . . . . . . . . . . . . . . . . . . . . . . (3,544) (3,297)
2,721 2,813Forestlands . . . . . . . . . . . . . . . . . . . . . . . . . . . . . . . . . . . . . . . . . . . . . . . . . . . . . . . 328 333Construction-in-progress . . . . . . . . . . . . . . . . . . . . . . . . . . . . . . . . . . . . . . . . . . . . 206 155
$ 3,255 $ 3,301
D. Goodwill and other intangible assets
At December 31, 2010, goodwill allocated to each of the company’s segments was $68 million to PackagingResources, $563 million to Consumer Solutions, $172 million to Consumer & Office Products and $9 million toSpecialty Chemicals. At December 31, 2009, goodwill allocated to each of the company’s segments was $68million to Packaging Resources, $551 million to Consumer Solutions, $174 million to Consumer & OfficeProducts, $9 million to Specialty Chemicals, as well as $16 million allocated to discontinued operations for themedia and entertainment packaging and envelope products businesses. See Note R for further informationregarding discontinued operations.
52
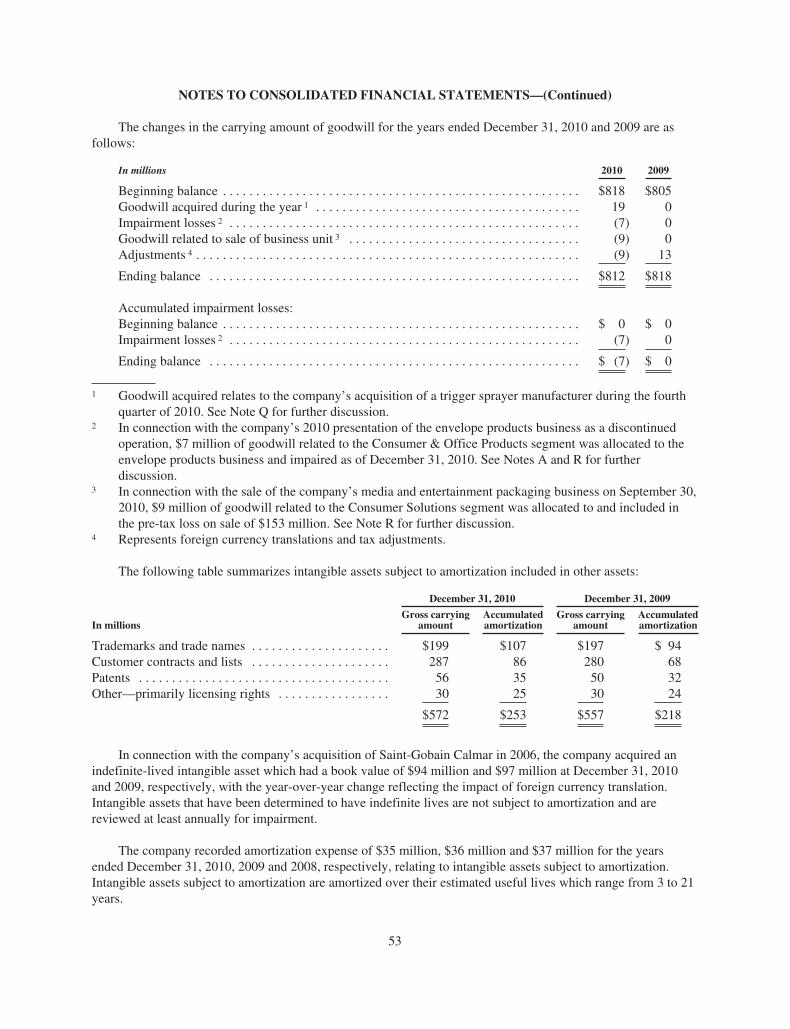
NOTES TO CONSOLIDATED FINANCIAL STATEMENTS—(Continued)
The changes in the carrying amount of goodwill for the years ended December 31, 2010 and 2009 are asfollows:
In millions 2010 2009
Beginning balance . . . . . . . . . . . . . . . . . . . . . . . . . . . . . . . . . . . . . . . . . . . . . . . . . . . . . . $818 $805Goodwill acquired during the year 1 . . . . . . . . . . . . . . . . . . . . . . . . . . . . . . . . . . . . . . . . 19 0Impairment losses 2 . . . . . . . . . . . . . . . . . . . . . . . . . . . . . . . . . . . . . . . . . . . . . . . . . . . . . (7) 0Goodwill related to sale of business unit 3 . . . . . . . . . . . . . . . . . . . . . . . . . . . . . . . . . . . (9) 0Adjustments 4 . . . . . . . . . . . . . . . . . . . . . . . . . . . . . . . . . . . . . . . . . . . . . . . . . . . . . . . . . . (9) 13
Ending balance . . . . . . . . . . . . . . . . . . . . . . . . . . . . . . . . . . . . . . . . . . . . . . . . . . . . . . . . $812 $818
Accumulated impairment losses:Beginning balance . . . . . . . . . . . . . . . . . . . . . . . . . . . . . . . . . . . . . . . . . . . . . . . . . . . . . . $ 0 $ 0Impairment losses 2 . . . . . . . . . . . . . . . . . . . . . . . . . . . . . . . . . . . . . . . . . . . . . . . . . . . . . (7) 0
Ending balance . . . . . . . . . . . . . . . . . . . . . . . . . . . . . . . . . . . . . . . . . . . . . . . . . . . . . . . . $ (7) $ 0
1 Goodwill acquired relates to the company’s acquisition of a trigger sprayer manufacturer during the fourthquarter of 2010. See Note Q for further discussion.
2 In connection with the company’s 2010 presentation of the envelope products business as a discontinuedoperation, $7 million of goodwill related to the Consumer & Office Products segment was allocated to theenvelope products business and impaired as of December 31, 2010. See Notes A and R for furtherdiscussion.
3 In connection with the sale of the company’s media and entertainment packaging business on September 30,2010, $9 million of goodwill related to the Consumer Solutions segment was allocated to and included inthe pre-tax loss on sale of $153 million. See Note R for further discussion.
4 Represents foreign currency translations and tax adjustments.
The following table summarizes intangible assets subject to amortization included in other assets:
December 31, 2010 December 31, 2009
In millionsGross carrying
amountAccumulatedamortization
Gross carryingamount
Accumulatedamortization
Trademarks and trade names . . . . . . . . . . . . . . . . . . . . . $199 $107 $197 $ 94Customer contracts and lists . . . . . . . . . . . . . . . . . . . . . 287 86 280 68Patents . . . . . . . . . . . . . . . . . . . . . . . . . . . . . . . . . . . . . . 56 35 50 32Other—primarily licensing rights . . . . . . . . . . . . . . . . . 30 25 30 24
$572 $253 $557 $218
In connection with the company’s acquisition of Saint-Gobain Calmar in 2006, the company acquired anindefinite-lived intangible asset which had a book value of $94 million and $97 million at December 31, 2010and 2009, respectively, with the year-over-year change reflecting the impact of foreign currency translation.Intangible assets that have been determined to have indefinite lives are not subject to amortization and arereviewed at least annually for impairment.
The company recorded amortization expense of $35 million, $36 million and $37 million for the yearsended December 31, 2010, 2009 and 2008, respectively, relating to intangible assets subject to amortization.Intangible assets subject to amortization are amortized over their estimated useful lives which range from 3 to 21years.
53
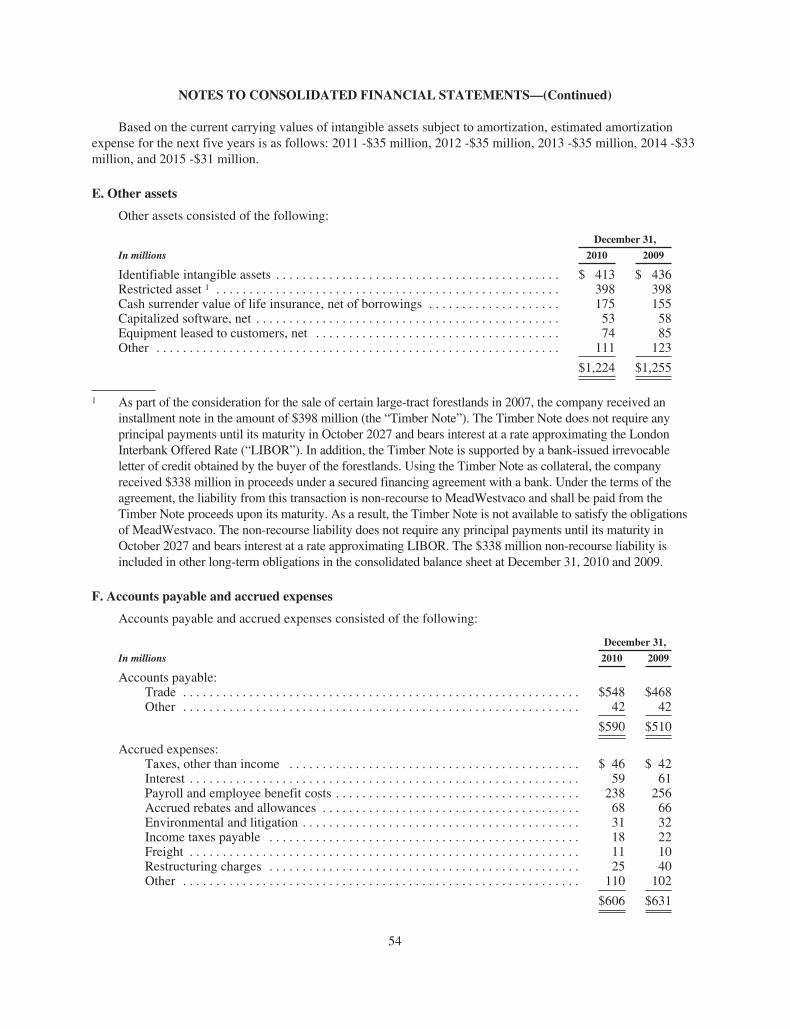
NOTES TO CONSOLIDATED FINANCIAL STATEMENTS—(Continued)
Based on the current carrying values of intangible assets subject to amortization, estimated amortizationexpense for the next five years is as follows: 2011 -$35 million, 2012 -$35 million, 2013 -$35 million, 2014 -$33million, and 2015 -$31 million.
E. Other assets
Other assets consisted of the following:
December 31,
In millions 2010 2009
Identifiable intangible assets . . . . . . . . . . . . . . . . . . . . . . . . . . . . . . . . . . . . . . . . . . . $ 413 $ 436Restricted asset 1 . . . . . . . . . . . . . . . . . . . . . . . . . . . . . . . . . . . . . . . . . . . . . . . . . . . . 398 398Cash surrender value of life insurance, net of borrowings . . . . . . . . . . . . . . . . . . . . 175 155Capitalized software, net . . . . . . . . . . . . . . . . . . . . . . . . . . . . . . . . . . . . . . . . . . . . . . 53 58Equipment leased to customers, net . . . . . . . . . . . . . . . . . . . . . . . . . . . . . . . . . . . . . 74 85Other . . . . . . . . . . . . . . . . . . . . . . . . . . . . . . . . . . . . . . . . . . . . . . . . . . . . . . . . . . . . . 111 123
$1,224 $1,255
1 As part of the consideration for the sale of certain large-tract forestlands in 2007, the company received aninstallment note in the amount of $398 million (the “Timber Note”). The Timber Note does not require anyprincipal payments until its maturity in October 2027 and bears interest at a rate approximating the LondonInterbank Offered Rate (“LIBOR”). In addition, the Timber Note is supported by a bank-issued irrevocableletter of credit obtained by the buyer of the forestlands. Using the Timber Note as collateral, the companyreceived $338 million in proceeds under a secured financing agreement with a bank. Under the terms of theagreement, the liability from this transaction is non-recourse to MeadWestvaco and shall be paid from theTimber Note proceeds upon its maturity. As a result, the Timber Note is not available to satisfy the obligationsof MeadWestvaco. The non-recourse liability does not require any principal payments until its maturity inOctober 2027 and bears interest at a rate approximating LIBOR. The $338 million non-recourse liability isincluded in other long-term obligations in the consolidated balance sheet at December 31, 2010 and 2009.
F. Accounts payable and accrued expenses
Accounts payable and accrued expenses consisted of the following:
December 31,
In millions 2010 2009
Accounts payable:Trade . . . . . . . . . . . . . . . . . . . . . . . . . . . . . . . . . . . . . . . . . . . . . . . . . . . . . . . . . . . . $548 $468Other . . . . . . . . . . . . . . . . . . . . . . . . . . . . . . . . . . . . . . . . . . . . . . . . . . . . . . . . . . . . 42 42
$590 $510
Accrued expenses:Taxes, other than income . . . . . . . . . . . . . . . . . . . . . . . . . . . . . . . . . . . . . . . . . . . . $ 46 $ 42Interest . . . . . . . . . . . . . . . . . . . . . . . . . . . . . . . . . . . . . . . . . . . . . . . . . . . . . . . . . . . 59 61Payroll and employee benefit costs . . . . . . . . . . . . . . . . . . . . . . . . . . . . . . . . . . . . . 238 256Accrued rebates and allowances . . . . . . . . . . . . . . . . . . . . . . . . . . . . . . . . . . . . . . . 68 66Environmental and litigation . . . . . . . . . . . . . . . . . . . . . . . . . . . . . . . . . . . . . . . . . . 31 32Income taxes payable . . . . . . . . . . . . . . . . . . . . . . . . . . . . . . . . . . . . . . . . . . . . . . . 18 22Freight . . . . . . . . . . . . . . . . . . . . . . . . . . . . . . . . . . . . . . . . . . . . . . . . . . . . . . . . . . . 11 10Restructuring charges . . . . . . . . . . . . . . . . . . . . . . . . . . . . . . . . . . . . . . . . . . . . . . . 25 40Other . . . . . . . . . . . . . . . . . . . . . . . . . . . . . . . . . . . . . . . . . . . . . . . . . . . . . . . . . . . . 110 102
$606 $631
54
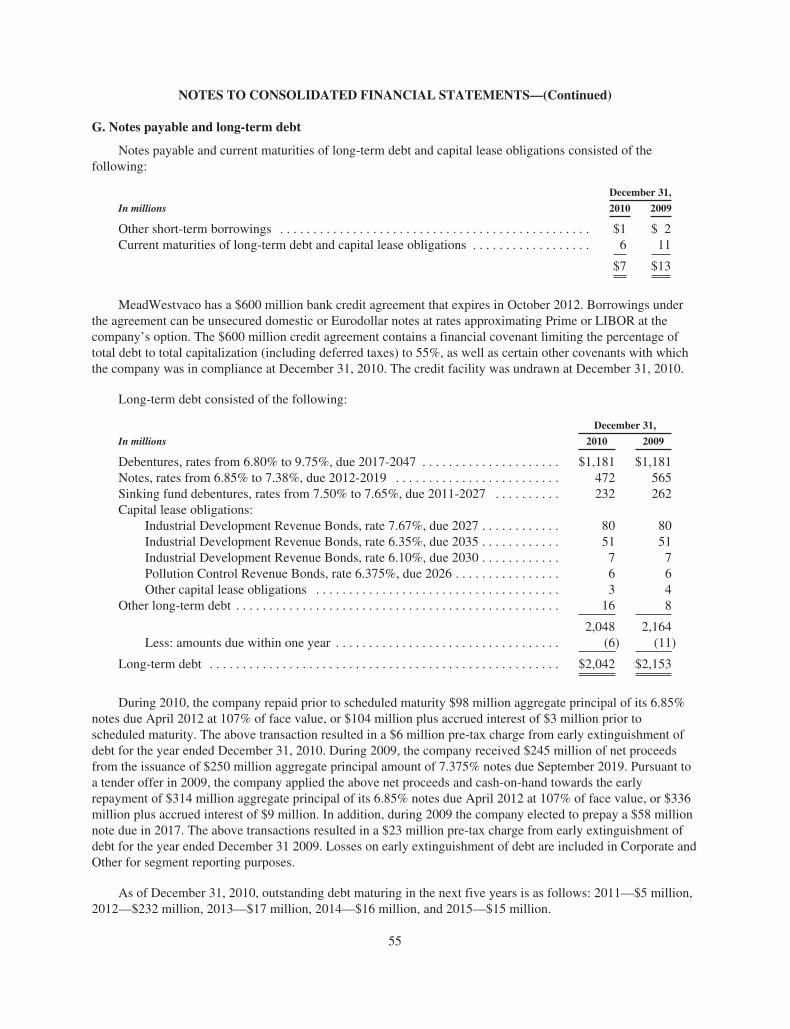
NOTES TO CONSOLIDATED FINANCIAL STATEMENTS—(Continued)
G. Notes payable and long-term debt
Notes payable and current maturities of long-term debt and capital lease obligations consisted of thefollowing:
December 31,
In millions 2010 2009
Other short-term borrowings . . . . . . . . . . . . . . . . . . . . . . . . . . . . . . . . . . . . . . . . . . . . . . . $1 $ 2Current maturities of long-term debt and capital lease obligations . . . . . . . . . . . . . . . . . . 6 11
$7 $13
MeadWestvaco has a $600 million bank credit agreement that expires in October 2012. Borrowings underthe agreement can be unsecured domestic or Eurodollar notes at rates approximating Prime or LIBOR at thecompany’s option. The $600 million credit agreement contains a financial covenant limiting the percentage oftotal debt to total capitalization (including deferred taxes) to 55%, as well as certain other covenants with whichthe company was in compliance at December 31, 2010. The credit facility was undrawn at December 31, 2010.
Long-term debt consisted of the following:
December 31,
In millions 2010 2009
Debentures, rates from 6.80% to 9.75%, due 2017-2047 . . . . . . . . . . . . . . . . . . . . . $1,181 $1,181Notes, rates from 6.85% to 7.38%, due 2012-2019 . . . . . . . . . . . . . . . . . . . . . . . . . 472 565Sinking fund debentures, rates from 7.50% to 7.65%, due 2011-2027 . . . . . . . . . . 232 262Capital lease obligations:
Industrial Development Revenue Bonds, rate 7.67%, due 2027 . . . . . . . . . . . . 80 80Industrial Development Revenue Bonds, rate 6.35%, due 2035 . . . . . . . . . . . . 51 51Industrial Development Revenue Bonds, rate 6.10%, due 2030 . . . . . . . . . . . . 7 7Pollution Control Revenue Bonds, rate 6.375%, due 2026 . . . . . . . . . . . . . . . . 6 6Other capital lease obligations . . . . . . . . . . . . . . . . . . . . . . . . . . . . . . . . . . . . . 3 4
Other long-term debt . . . . . . . . . . . . . . . . . . . . . . . . . . . . . . . . . . . . . . . . . . . . . . . . . 16 8
2,048 2,164Less: amounts due within one year . . . . . . . . . . . . . . . . . . . . . . . . . . . . . . . . . . (6) (11)
Long-term debt . . . . . . . . . . . . . . . . . . . . . . . . . . . . . . . . . . . . . . . . . . . . . . . . . . . . . $2,042 $2,153
During 2010, the company repaid prior to scheduled maturity $98 million aggregate principal of its 6.85%notes due April 2012 at 107% of face value, or $104 million plus accrued interest of $3 million prior toscheduled maturity. The above transaction resulted in a $6 million pre-tax charge from early extinguishment ofdebt for the year ended December 31, 2010. During 2009, the company received $245 million of net proceedsfrom the issuance of $250 million aggregate principal amount of 7.375% notes due September 2019. Pursuant toa tender offer in 2009, the company applied the above net proceeds and cash-on-hand towards the earlyrepayment of $314 million aggregate principal of its 6.85% notes due April 2012 at 107% of face value, or $336million plus accrued interest of $9 million. In addition, during 2009 the company elected to prepay a $58 millionnote due in 2017. The above transactions resulted in a $23 million pre-tax charge from early extinguishment ofdebt for the year ended December 31 2009. Losses on early extinguishment of debt are included in Corporate andOther for segment reporting purposes.
As of December 31, 2010, outstanding debt maturing in the next five years is as follows: 2011—$5 million,2012—$232 million, 2013—$17 million, 2014—$16 million, and 2015—$15 million.
55
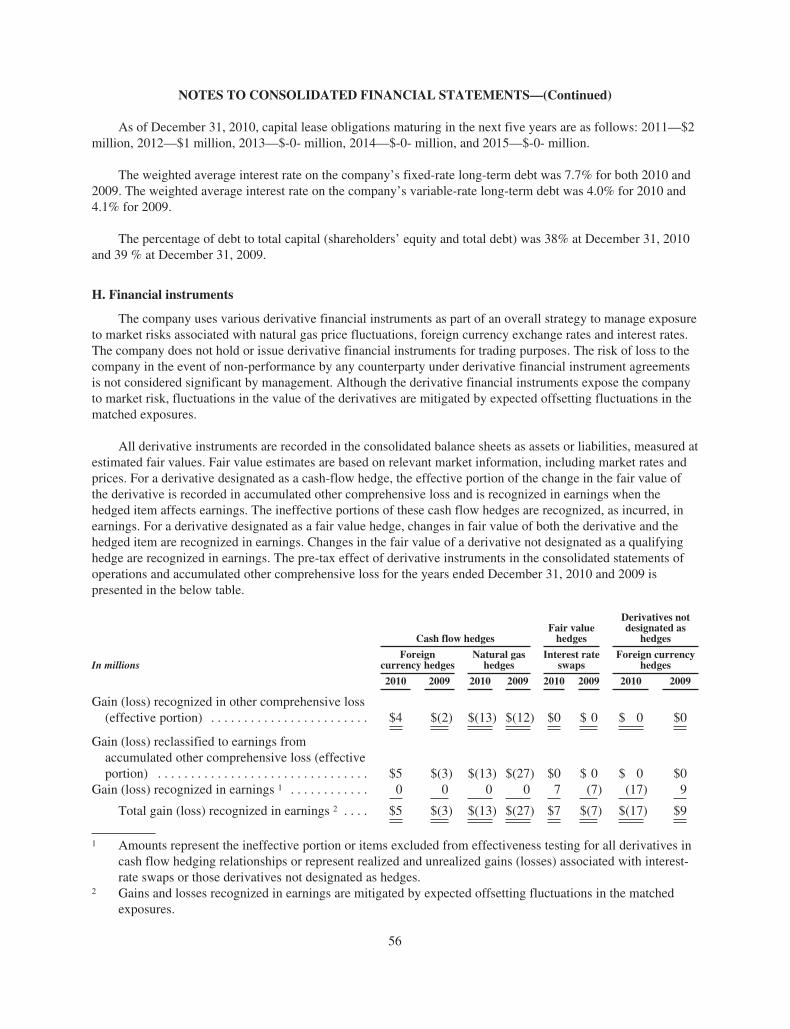
NOTES TO CONSOLIDATED FINANCIAL STATEMENTS—(Continued)
As of December 31, 2010, capital lease obligations maturing in the next five years are as follows: 2011—$2million, 2012—$1 million, 2013—$-0- million, 2014—$-0- million, and 2015—$-0- million.
The weighted average interest rate on the company’s fixed-rate long-term debt was 7.7% for both 2010 and2009. The weighted average interest rate on the company’s variable-rate long-term debt was 4.0% for 2010 and4.1% for 2009.
The percentage of debt to total capital (shareholders’ equity and total debt) was 38% at December 31, 2010and 39 % at December 31, 2009.
H. Financial instruments
The company uses various derivative financial instruments as part of an overall strategy to manage exposureto market risks associated with natural gas price fluctuations, foreign currency exchange rates and interest rates.The company does not hold or issue derivative financial instruments for trading purposes. The risk of loss to thecompany in the event of non-performance by any counterparty under derivative financial instrument agreementsis not considered significant by management. Although the derivative financial instruments expose the companyto market risk, fluctuations in the value of the derivatives are mitigated by expected offsetting fluctuations in thematched exposures.
All derivative instruments are recorded in the consolidated balance sheets as assets or liabilities, measured atestimated fair values. Fair value estimates are based on relevant market information, including market rates andprices. For a derivative designated as a cash-flow hedge, the effective portion of the change in the fair value ofthe derivative is recorded in accumulated other comprehensive loss and is recognized in earnings when thehedged item affects earnings. The ineffective portions of these cash flow hedges are recognized, as incurred, inearnings. For a derivative designated as a fair value hedge, changes in fair value of both the derivative and thehedged item are recognized in earnings. Changes in the fair value of a derivative not designated as a qualifyinghedge are recognized in earnings. The pre-tax effect of derivative instruments in the consolidated statements ofoperations and accumulated other comprehensive loss for the years ended December 31, 2010 and 2009 ispresented in the below table.
Cash flow hedgesFair valuehedges
Derivatives notdesignated as
hedges
In millionsForeign
currency hedgesNatural gas
hedgesInterest rate
swapsForeign currency
hedges
2010 2009 2010 2009 2010 2009 2010 2009
Gain (loss) recognized in other comprehensive loss(effective portion) . . . . . . . . . . . . . . . . . . . . . . . . $4 $(2) $(13) $(12) $0 $ 0 $ 0 $0
Gain (loss) reclassified to earnings fromaccumulated other comprehensive loss (effectiveportion) . . . . . . . . . . . . . . . . . . . . . . . . . . . . . . . . $5 $(3) $(13) $(27) $0 $ 0 $ 0 $0
Gain (loss) recognized in earnings 1 . . . . . . . . . . . . 0 0 0 0 7 (7) (17) 9
Total gain (loss) recognized in earnings 2 . . . . $5 $(3) $(13) $(27) $7 $(7) $(17) $9
1 Amounts represent the ineffective portion or items excluded from effectiveness testing for all derivatives incash flow hedging relationships or represent realized and unrealized gains (losses) associated with interest-rate swaps or those derivatives not designated as hedges.
2 Gains and losses recognized in earnings are mitigated by expected offsetting fluctuations in the matchedexposures.
56
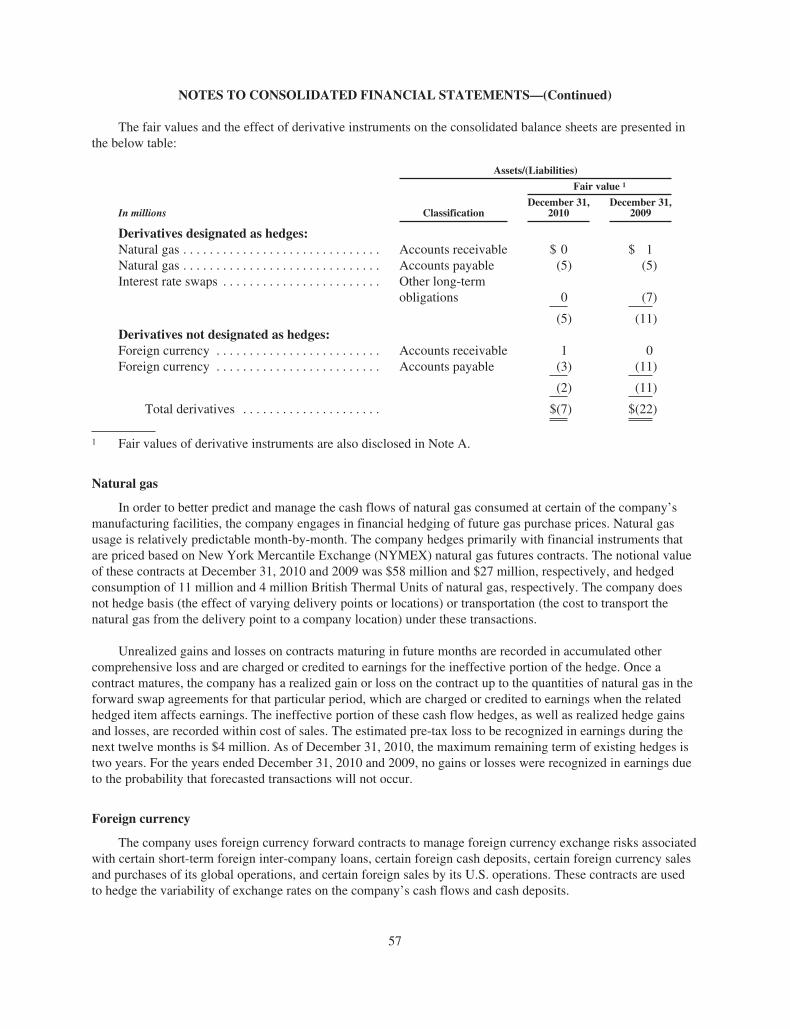
NOTES TO CONSOLIDATED FINANCIAL STATEMENTS—(Continued)
The fair values and the effect of derivative instruments on the consolidated balance sheets are presented inthe below table:
Assets/(Liabilities)
Fair value 1
In millions ClassificationDecember 31,
2010December 31,
2009
Derivatives designated as hedges:Natural gas . . . . . . . . . . . . . . . . . . . . . . . . . . . . . . Accounts receivable $ 0 $ 1Natural gas . . . . . . . . . . . . . . . . . . . . . . . . . . . . . . Accounts payable (5) (5)Interest rate swaps . . . . . . . . . . . . . . . . . . . . . . . . Other long-term
obligations 0 (7)
(5) (11)Derivatives not designated as hedges:Foreign currency . . . . . . . . . . . . . . . . . . . . . . . . . Accounts receivable 1 0Foreign currency . . . . . . . . . . . . . . . . . . . . . . . . . Accounts payable (3) (11)
(2) (11)
Total derivatives . . . . . . . . . . . . . . . . . . . . . $(7) $(22)
1 Fair values of derivative instruments are also disclosed in Note A.
Natural gas
In order to better predict and manage the cash flows of natural gas consumed at certain of the company’smanufacturing facilities, the company engages in financial hedging of future gas purchase prices. Natural gasusage is relatively predictable month-by-month. The company hedges primarily with financial instruments thatare priced based on New York Mercantile Exchange (NYMEX) natural gas futures contracts. The notional valueof these contracts at December 31, 2010 and 2009 was $58 million and $27 million, respectively, and hedgedconsumption of 11 million and 4 million British Thermal Units of natural gas, respectively. The company doesnot hedge basis (the effect of varying delivery points or locations) or transportation (the cost to transport thenatural gas from the delivery point to a company location) under these transactions.
Unrealized gains and losses on contracts maturing in future months are recorded in accumulated othercomprehensive loss and are charged or credited to earnings for the ineffective portion of the hedge. Once acontract matures, the company has a realized gain or loss on the contract up to the quantities of natural gas in theforward swap agreements for that particular period, which are charged or credited to earnings when the relatedhedged item affects earnings. The ineffective portion of these cash flow hedges, as well as realized hedge gainsand losses, are recorded within cost of sales. The estimated pre-tax loss to be recognized in earnings during thenext twelve months is $4 million. As of December 31, 2010, the maximum remaining term of existing hedges istwo years. For the years ended December 31, 2010 and 2009, no gains or losses were recognized in earnings dueto the probability that forecasted transactions will not occur.
Foreign currency
The company uses foreign currency forward contracts to manage foreign currency exchange risks associatedwith certain short-term foreign inter-company loans, certain foreign cash deposits, certain foreign currency salesand purchases of its global operations, and certain foreign sales by its U.S. operations. These contracts are usedto hedge the variability of exchange rates on the company’s cash flows and cash deposits.
57
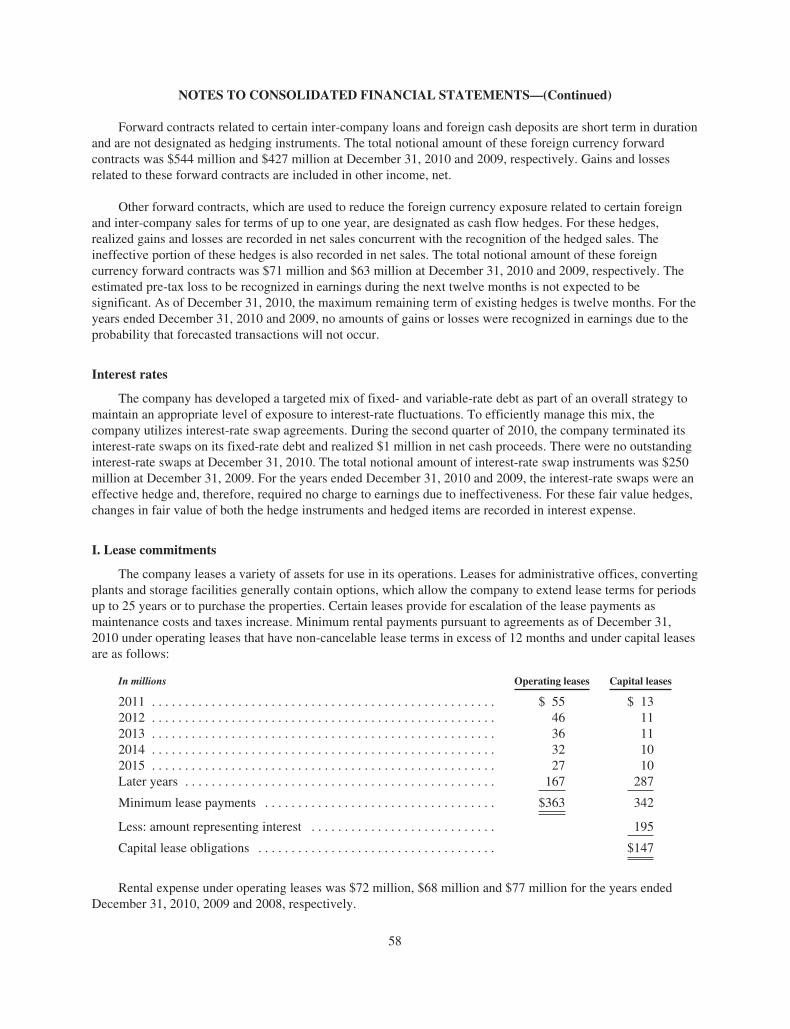
NOTES TO CONSOLIDATED FINANCIAL STATEMENTS—(Continued)
Forward contracts related to certain inter-company loans and foreign cash deposits are short term in durationand are not designated as hedging instruments. The total notional amount of these foreign currency forwardcontracts was $544 million and $427 million at December 31, 2010 and 2009, respectively. Gains and lossesrelated to these forward contracts are included in other income, net.
Other forward contracts, which are used to reduce the foreign currency exposure related to certain foreignand inter-company sales for terms of up to one year, are designated as cash flow hedges. For these hedges,realized gains and losses are recorded in net sales concurrent with the recognition of the hedged sales. Theineffective portion of these hedges is also recorded in net sales. The total notional amount of these foreigncurrency forward contracts was $71 million and $63 million at December 31, 2010 and 2009, respectively. Theestimated pre-tax loss to be recognized in earnings during the next twelve months is not expected to besignificant. As of December 31, 2010, the maximum remaining term of existing hedges is twelve months. For theyears ended December 31, 2010 and 2009, no amounts of gains or losses were recognized in earnings due to theprobability that forecasted transactions will not occur.
Interest rates
The company has developed a targeted mix of fixed- and variable-rate debt as part of an overall strategy tomaintain an appropriate level of exposure to interest-rate fluctuations. To efficiently manage this mix, thecompany utilizes interest-rate swap agreements. During the second quarter of 2010, the company terminated itsinterest-rate swaps on its fixed-rate debt and realized $1 million in net cash proceeds. There were no outstandinginterest-rate swaps at December 31, 2010. The total notional amount of interest-rate swap instruments was $250million at December 31, 2009. For the years ended December 31, 2010 and 2009, the interest-rate swaps were aneffective hedge and, therefore, required no charge to earnings due to ineffectiveness. For these fair value hedges,changes in fair value of both the hedge instruments and hedged items are recorded in interest expense.
I. Lease commitments
The company leases a variety of assets for use in its operations. Leases for administrative offices, convertingplants and storage facilities generally contain options, which allow the company to extend lease terms for periodsup to 25 years or to purchase the properties. Certain leases provide for escalation of the lease payments asmaintenance costs and taxes increase. Minimum rental payments pursuant to agreements as of December 31,2010 under operating leases that have non-cancelable lease terms in excess of 12 months and under capital leasesare as follows:
In millions Operating leases Capital leases
2011 . . . . . . . . . . . . . . . . . . . . . . . . . . . . . . . . . . . . . . . . . . . . . . . . . . . . $ 55 $ 132012 . . . . . . . . . . . . . . . . . . . . . . . . . . . . . . . . . . . . . . . . . . . . . . . . . . . . 46 112013 . . . . . . . . . . . . . . . . . . . . . . . . . . . . . . . . . . . . . . . . . . . . . . . . . . . . 36 112014 . . . . . . . . . . . . . . . . . . . . . . . . . . . . . . . . . . . . . . . . . . . . . . . . . . . . 32 102015 . . . . . . . . . . . . . . . . . . . . . . . . . . . . . . . . . . . . . . . . . . . . . . . . . . . . 27 10Later years . . . . . . . . . . . . . . . . . . . . . . . . . . . . . . . . . . . . . . . . . . . . . . . 167 287
Minimum lease payments . . . . . . . . . . . . . . . . . . . . . . . . . . . . . . . . . . . $363 342
Less: amount representing interest . . . . . . . . . . . . . . . . . . . . . . . . . . . . 195
Capital lease obligations . . . . . . . . . . . . . . . . . . . . . . . . . . . . . . . . . . . . $147
Rental expense under operating leases was $72 million, $68 million and $77 million for the years endedDecember 31, 2010, 2009 and 2008, respectively.
58
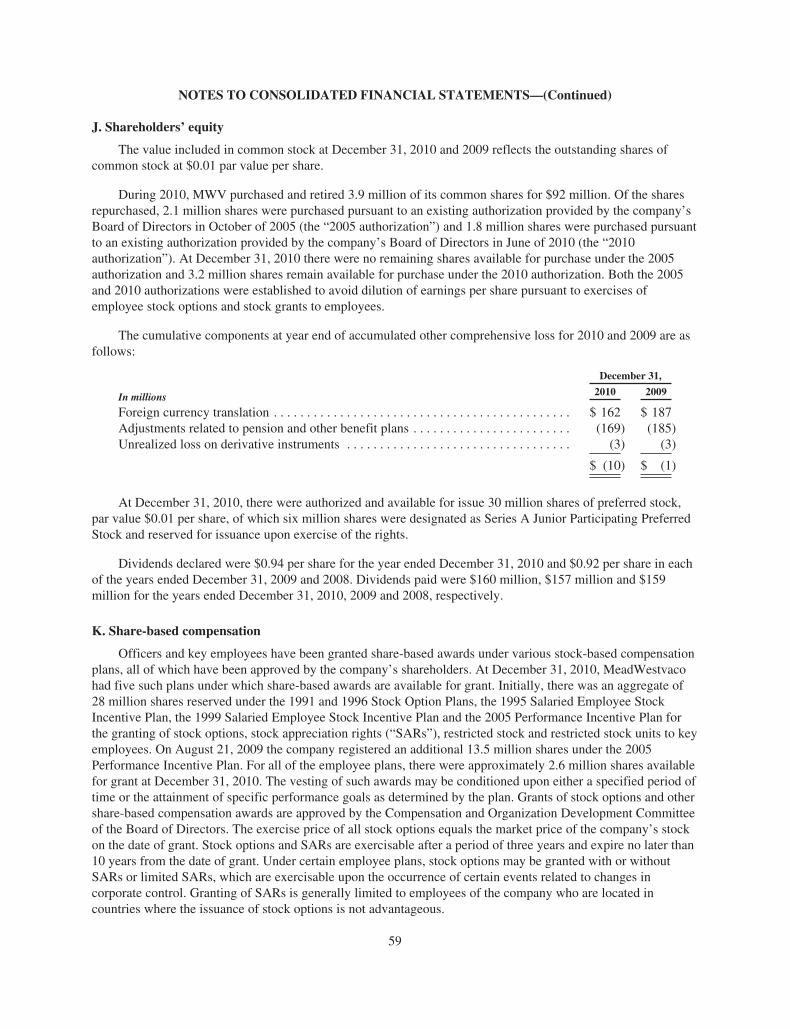
NOTES TO CONSOLIDATED FINANCIAL STATEMENTS—(Continued)
J. Shareholders’ equity
The value included in common stock at December 31, 2010 and 2009 reflects the outstanding shares ofcommon stock at $0.01 par value per share.
During 2010, MWV purchased and retired 3.9 million of its common shares for $92 million. Of the sharesrepurchased, 2.1 million shares were purchased pursuant to an existing authorization provided by the company’sBoard of Directors in October of 2005 (the “2005 authorization”) and 1.8 million shares were purchased pursuantto an existing authorization provided by the company’s Board of Directors in June of 2010 (the “2010authorization”). At December 31, 2010 there were no remaining shares available for purchase under the 2005authorization and 3.2 million shares remain available for purchase under the 2010 authorization. Both the 2005and 2010 authorizations were established to avoid dilution of earnings per share pursuant to exercises ofemployee stock options and stock grants to employees.
The cumulative components at year end of accumulated other comprehensive loss for 2010 and 2009 are asfollows:
In millions
December 31,
2010 2009
Foreign currency translation . . . . . . . . . . . . . . . . . . . . . . . . . . . . . . . . . . . . . . . . . . . . . $ 162 $ 187Adjustments related to pension and other benefit plans . . . . . . . . . . . . . . . . . . . . . . . . (169) (185)Unrealized loss on derivative instruments . . . . . . . . . . . . . . . . . . . . . . . . . . . . . . . . . . (3) (3)
$ (10) $ (1)
At December 31, 2010, there were authorized and available for issue 30 million shares of preferred stock,par value $0.01 per share, of which six million shares were designated as Series A Junior Participating PreferredStock and reserved for issuance upon exercise of the rights.
Dividends declared were $0.94 per share for the year ended December 31, 2010 and $0.92 per share in eachof the years ended December 31, 2009 and 2008. Dividends paid were $160 million, $157 million and $159million for the years ended December 31, 2010, 2009 and 2008, respectively.
K. Share-based compensation
Officers and key employees have been granted share-based awards under various stock-based compensationplans, all of which have been approved by the company’s shareholders. At December 31, 2010, MeadWestvacohad five such plans under which share-based awards are available for grant. Initially, there was an aggregate of28 million shares reserved under the 1991 and 1996 Stock Option Plans, the 1995 Salaried Employee StockIncentive Plan, the 1999 Salaried Employee Stock Incentive Plan and the 2005 Performance Incentive Plan forthe granting of stock options, stock appreciation rights (“SARs”), restricted stock and restricted stock units to keyemployees. On August 21, 2009 the company registered an additional 13.5 million shares under the 2005Performance Incentive Plan. For all of the employee plans, there were approximately 2.6 million shares availablefor grant at December 31, 2010. The vesting of such awards may be conditioned upon either a specified period oftime or the attainment of specific performance goals as determined by the plan. Grants of stock options and othershare-based compensation awards are approved by the Compensation and Organization Development Committeeof the Board of Directors. The exercise price of all stock options equals the market price of the company’s stockon the date of grant. Stock options and SARs are exercisable after a period of three years and expire no later than10 years from the date of grant. Under certain employee plans, stock options may be granted with or withoutSARs or limited SARs, which are exercisable upon the occurrence of certain events related to changes incorporate control. Granting of SARs is generally limited to employees of the company who are located incountries where the issuance of stock options is not advantageous.
59
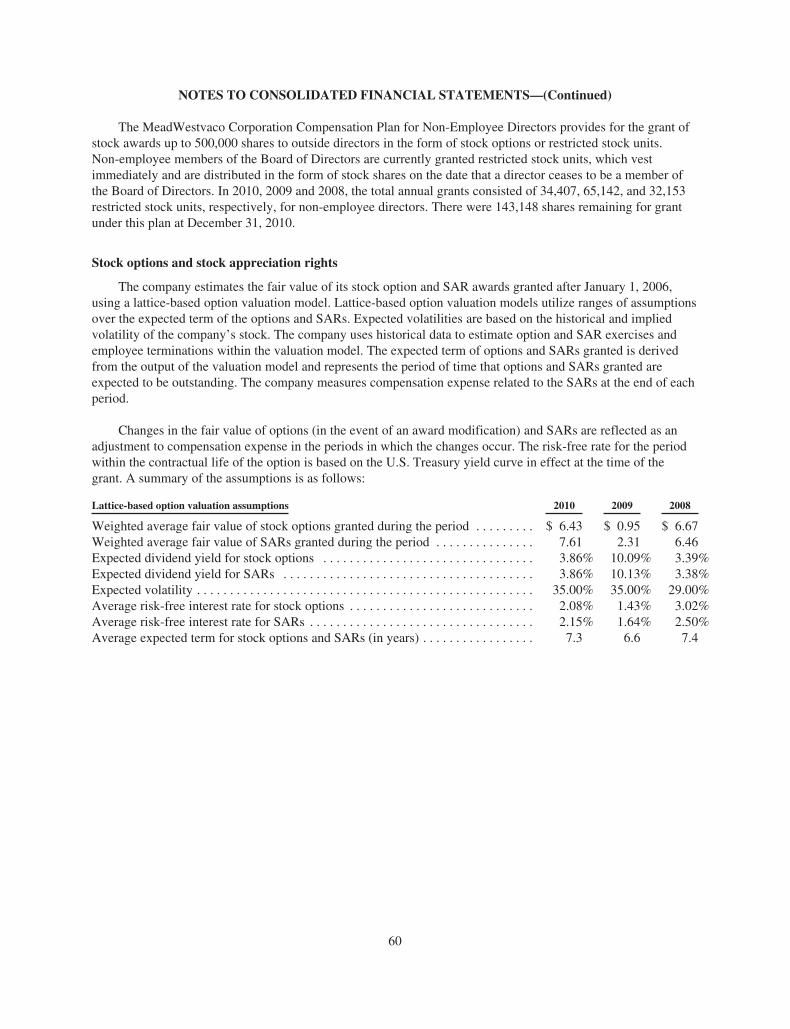
NOTES TO CONSOLIDATED FINANCIAL STATEMENTS—(Continued)
The MeadWestvaco Corporation Compensation Plan for Non-Employee Directors provides for the grant ofstock awards up to 500,000 shares to outside directors in the form of stock options or restricted stock units.Non-employee members of the Board of Directors are currently granted restricted stock units, which vestimmediately and are distributed in the form of stock shares on the date that a director ceases to be a member ofthe Board of Directors. In 2010, 2009 and 2008, the total annual grants consisted of 34,407, 65,142, and 32,153restricted stock units, respectively, for non-employee directors. There were 143,148 shares remaining for grantunder this plan at December 31, 2010.
Stock options and stock appreciation rights
The company estimates the fair value of its stock option and SAR awards granted after January 1, 2006,using a lattice-based option valuation model. Lattice-based option valuation models utilize ranges of assumptionsover the expected term of the options and SARs. Expected volatilities are based on the historical and impliedvolatility of the company’s stock. The company uses historical data to estimate option and SAR exercises andemployee terminations within the valuation model. The expected term of options and SARs granted is derivedfrom the output of the valuation model and represents the period of time that options and SARs granted areexpected to be outstanding. The company measures compensation expense related to the SARs at the end of eachperiod.
Changes in the fair value of options (in the event of an award modification) and SARs are reflected as anadjustment to compensation expense in the periods in which the changes occur. The risk-free rate for the periodwithin the contractual life of the option is based on the U.S. Treasury yield curve in effect at the time of thegrant. A summary of the assumptions is as follows:
Lattice-based option valuation assumptions 2010 2009 2008
Weighted average fair value of stock options granted during the period . . . . . . . . . $ 6.43 $ 0.95 $ 6.67Weighted average fair value of SARs granted during the period . . . . . . . . . . . . . . . 7.61 2.31 6.46Expected dividend yield for stock options . . . . . . . . . . . . . . . . . . . . . . . . . . . . . . . . 3.86% 10.09% 3.39%Expected dividend yield for SARs . . . . . . . . . . . . . . . . . . . . . . . . . . . . . . . . . . . . . . 3.86% 10.13% 3.38%Expected volatility . . . . . . . . . . . . . . . . . . . . . . . . . . . . . . . . . . . . . . . . . . . . . . . . . . . 35.00% 35.00% 29.00%Average risk-free interest rate for stock options . . . . . . . . . . . . . . . . . . . . . . . . . . . . 2.08% 1.43% 3.02%Average risk-free interest rate for SARs . . . . . . . . . . . . . . . . . . . . . . . . . . . . . . . . . . 2.15% 1.64% 2.50%Average expected term for stock options and SARs (in years) . . . . . . . . . . . . . . . . . 7.3 6.6 7.4
60
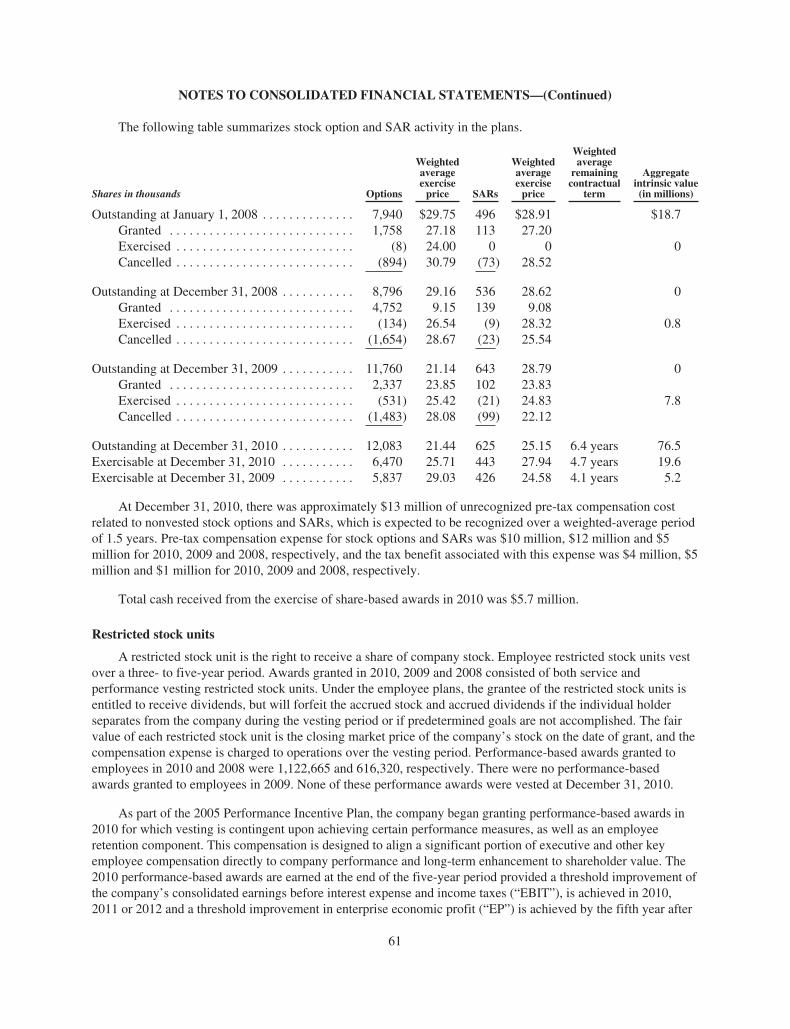
NOTES TO CONSOLIDATED FINANCIAL STATEMENTS—(Continued)
The following table summarizes stock option and SAR activity in the plans.
Shares in thousands Options
Weightedaverageexerciseprice SARs
Weightedaverageexerciseprice
Weightedaverage
remainingcontractual
term
Aggregateintrinsic value(in millions)
Outstanding at January 1, 2008 . . . . . . . . . . . . . . 7,940 $29.75 496 $28.91 $18.7Granted . . . . . . . . . . . . . . . . . . . . . . . . . . . . 1,758 27.18 113 27.20Exercised . . . . . . . . . . . . . . . . . . . . . . . . . . . (8) 24.00 0 0 0Cancelled . . . . . . . . . . . . . . . . . . . . . . . . . . . (894) 30.79 (73) 28.52
Outstanding at December 31, 2008 . . . . . . . . . . . 8,796 29.16 536 28.62 0Granted . . . . . . . . . . . . . . . . . . . . . . . . . . . . 4,752 9.15 139 9.08Exercised . . . . . . . . . . . . . . . . . . . . . . . . . . . (134) 26.54 (9) 28.32 0.8Cancelled . . . . . . . . . . . . . . . . . . . . . . . . . . . (1,654) 28.67 (23) 25.54
Outstanding at December 31, 2009 . . . . . . . . . . . 11,760 21.14 643 28.79 0Granted . . . . . . . . . . . . . . . . . . . . . . . . . . . . 2,337 23.85 102 23.83Exercised . . . . . . . . . . . . . . . . . . . . . . . . . . . (531) 25.42 (21) 24.83 7.8Cancelled . . . . . . . . . . . . . . . . . . . . . . . . . . . (1,483) 28.08 (99) 22.12
Outstanding at December 31, 2010 . . . . . . . . . . . 12,083 21.44 625 25.15 6.4 years 76.5Exercisable at December 31, 2010 . . . . . . . . . . . 6,470 25.71 443 27.94 4.7 years 19.6Exercisable at December 31, 2009 . . . . . . . . . . . 5,837 29.03 426 24.58 4.1 years 5.2
At December 31, 2010, there was approximately $13 million of unrecognized pre-tax compensation costrelated to nonvested stock options and SARs, which is expected to be recognized over a weighted-average periodof 1.5 years. Pre-tax compensation expense for stock options and SARs was $10 million, $12 million and $5million for 2010, 2009 and 2008, respectively, and the tax benefit associated with this expense was $4 million, $5million and $1 million for 2010, 2009 and 2008, respectively.
Total cash received from the exercise of share-based awards in 2010 was $5.7 million.
Restricted stock units
A restricted stock unit is the right to receive a share of company stock. Employee restricted stock units vestover a three- to five-year period. Awards granted in 2010, 2009 and 2008 consisted of both service andperformance vesting restricted stock units. Under the employee plans, the grantee of the restricted stock units isentitled to receive dividends, but will forfeit the accrued stock and accrued dividends if the individual holderseparates from the company during the vesting period or if predetermined goals are not accomplished. The fairvalue of each restricted stock unit is the closing market price of the company’s stock on the date of grant, and thecompensation expense is charged to operations over the vesting period. Performance-based awards granted toemployees in 2010 and 2008 were 1,122,665 and 616,320, respectively. There were no performance-basedawards granted to employees in 2009. None of these performance awards were vested at December 31, 2010.
As part of the 2005 Performance Incentive Plan, the company began granting performance-based awards in2010 for which vesting is contingent upon achieving certain performance measures, as well as an employeeretention component. This compensation is designed to align a significant portion of executive and other keyemployee compensation directly to company performance and long-term enhancement to shareholder value. The2010 performance-based awards are earned at the end of the five-year period provided a threshold improvement ofthe company’s consolidated earnings before interest expense and income taxes (“EBIT”), is achieved in 2010,2011 or 2012 and a threshold improvement in enterprise economic profit (“EP”) is achieved by the fifth year after
61
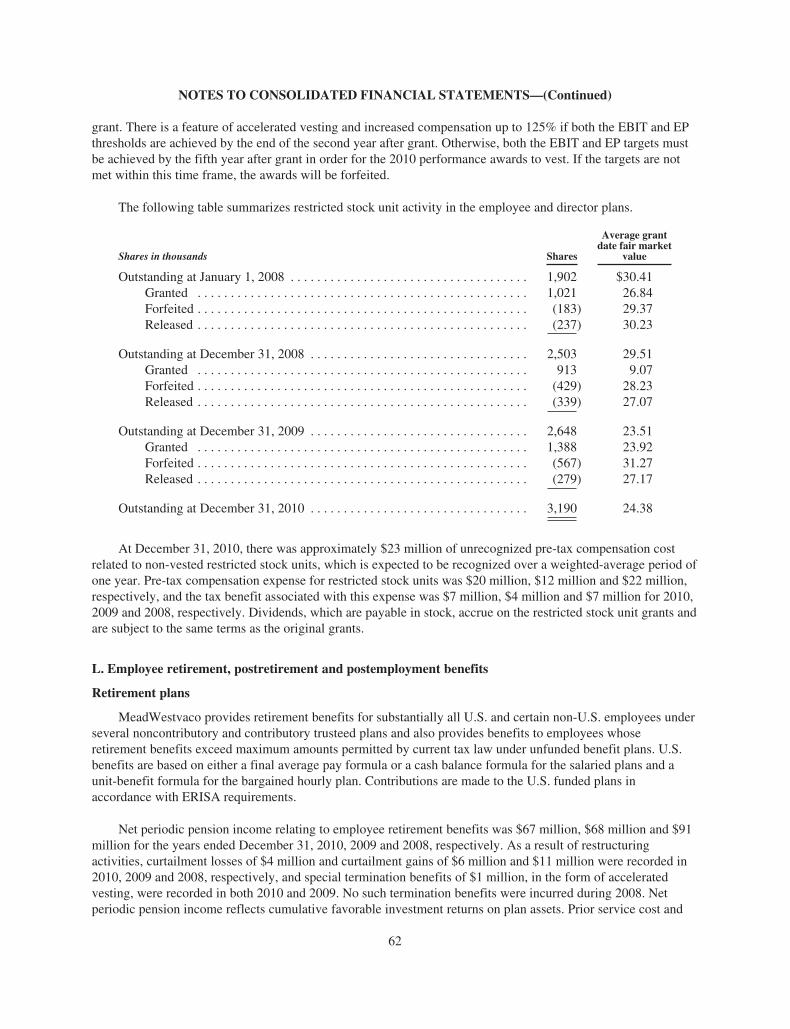
NOTES TO CONSOLIDATED FINANCIAL STATEMENTS—(Continued)
grant. There is a feature of accelerated vesting and increased compensation up to 125% if both the EBIT and EPthresholds are achieved by the end of the second year after grant. Otherwise, both the EBIT and EP targets mustbe achieved by the fifth year after grant in order for the 2010 performance awards to vest. If the targets are notmet within this time frame, the awards will be forfeited.
The following table summarizes restricted stock unit activity in the employee and director plans.
Shares in thousands Shares
Average grantdate fair market
value
Outstanding at January 1, 2008 . . . . . . . . . . . . . . . . . . . . . . . . . . . . . . . . . . . . 1,902 $30.41Granted . . . . . . . . . . . . . . . . . . . . . . . . . . . . . . . . . . . . . . . . . . . . . . . . . . 1,021 26.84Forfeited . . . . . . . . . . . . . . . . . . . . . . . . . . . . . . . . . . . . . . . . . . . . . . . . . . (183) 29.37Released . . . . . . . . . . . . . . . . . . . . . . . . . . . . . . . . . . . . . . . . . . . . . . . . . . (237) 30.23
Outstanding at December 31, 2008 . . . . . . . . . . . . . . . . . . . . . . . . . . . . . . . . . 2,503 29.51Granted . . . . . . . . . . . . . . . . . . . . . . . . . . . . . . . . . . . . . . . . . . . . . . . . . . 913 9.07Forfeited . . . . . . . . . . . . . . . . . . . . . . . . . . . . . . . . . . . . . . . . . . . . . . . . . . (429) 28.23Released . . . . . . . . . . . . . . . . . . . . . . . . . . . . . . . . . . . . . . . . . . . . . . . . . . (339) 27.07
Outstanding at December 31, 2009 . . . . . . . . . . . . . . . . . . . . . . . . . . . . . . . . . 2,648 23.51Granted . . . . . . . . . . . . . . . . . . . . . . . . . . . . . . . . . . . . . . . . . . . . . . . . . . 1,388 23.92Forfeited . . . . . . . . . . . . . . . . . . . . . . . . . . . . . . . . . . . . . . . . . . . . . . . . . . (567) 31.27Released . . . . . . . . . . . . . . . . . . . . . . . . . . . . . . . . . . . . . . . . . . . . . . . . . . (279) 27.17
Outstanding at December 31, 2010 . . . . . . . . . . . . . . . . . . . . . . . . . . . . . . . . . 3,190 24.38
At December 31, 2010, there was approximately $23 million of unrecognized pre-tax compensation costrelated to non-vested restricted stock units, which is expected to be recognized over a weighted-average period ofone year. Pre-tax compensation expense for restricted stock units was $20 million, $12 million and $22 million,respectively, and the tax benefit associated with this expense was $7 million, $4 million and $7 million for 2010,2009 and 2008, respectively. Dividends, which are payable in stock, accrue on the restricted stock unit grants andare subject to the same terms as the original grants.
L. Employee retirement, postretirement and postemployment benefits
Retirement plans
MeadWestvaco provides retirement benefits for substantially all U.S. and certain non-U.S. employees underseveral noncontributory and contributory trusteed plans and also provides benefits to employees whoseretirement benefits exceed maximum amounts permitted by current tax law under unfunded benefit plans. U.S.benefits are based on either a final average pay formula or a cash balance formula for the salaried plans and aunit-benefit formula for the bargained hourly plan. Contributions are made to the U.S. funded plans inaccordance with ERISA requirements.
Net periodic pension income relating to employee retirement benefits was $67 million, $68 million and $91million for the years ended December 31, 2010, 2009 and 2008, respectively. As a result of restructuringactivities, curtailment losses of $4 million and curtailment gains of $6 million and $11 million were recorded in2010, 2009 and 2008, respectively, and special termination benefits of $1 million, in the form of acceleratedvesting, were recorded in both 2010 and 2009. No such termination benefits were incurred during 2008. Netperiodic pension income reflects cumulative favorable investment returns on plan assets. Prior service cost and
62
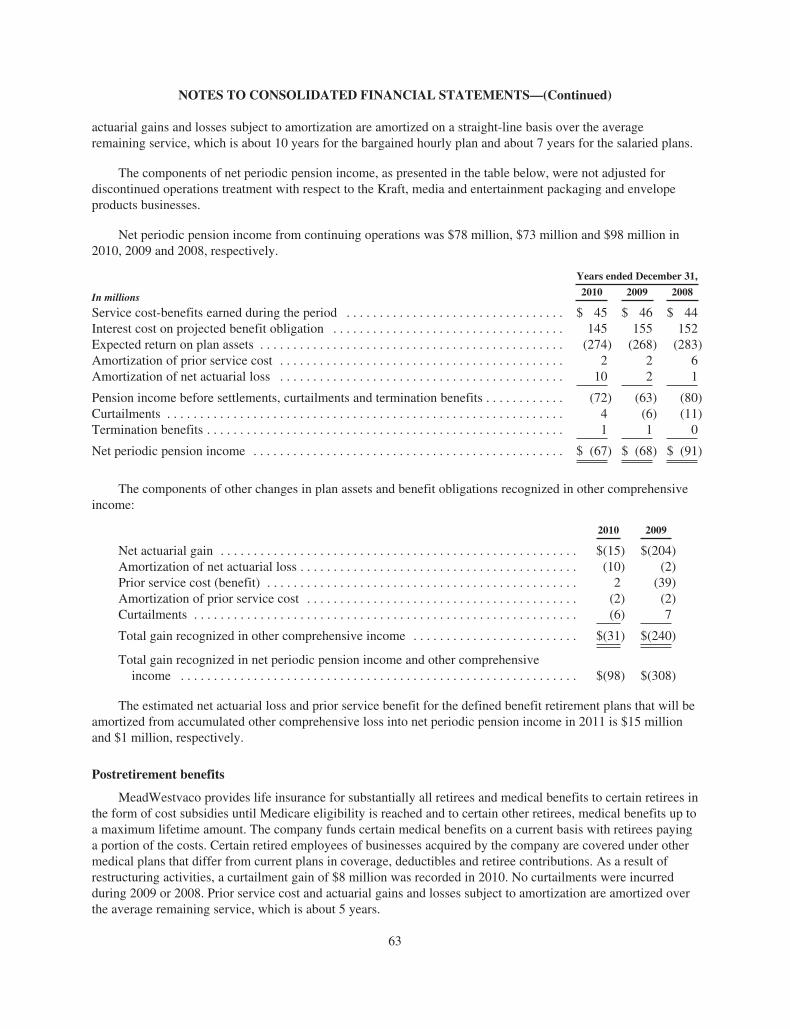
NOTES TO CONSOLIDATED FINANCIAL STATEMENTS—(Continued)
actuarial gains and losses subject to amortization are amortized on a straight-line basis over the averageremaining service, which is about 10 years for the bargained hourly plan and about 7 years for the salaried plans.
The components of net periodic pension income, as presented in the table below, were not adjusted fordiscontinued operations treatment with respect to the Kraft, media and entertainment packaging and envelopeproducts businesses.
Net periodic pension income from continuing operations was $78 million, $73 million and $98 million in2010, 2009 and 2008, respectively.
In millions
Years ended December 31,
2010 2009 2008
Service cost-benefits earned during the period . . . . . . . . . . . . . . . . . . . . . . . . . . . . . . . . . $ 45 $ 46 $ 44Interest cost on projected benefit obligation . . . . . . . . . . . . . . . . . . . . . . . . . . . . . . . . . . . 145 155 152Expected return on plan assets . . . . . . . . . . . . . . . . . . . . . . . . . . . . . . . . . . . . . . . . . . . . . . (274) (268) (283)Amortization of prior service cost . . . . . . . . . . . . . . . . . . . . . . . . . . . . . . . . . . . . . . . . . . . 2 2 6Amortization of net actuarial loss . . . . . . . . . . . . . . . . . . . . . . . . . . . . . . . . . . . . . . . . . . . 10 2 1
Pension income before settlements, curtailments and termination benefits . . . . . . . . . . . . (72) (63) (80)Curtailments . . . . . . . . . . . . . . . . . . . . . . . . . . . . . . . . . . . . . . . . . . . . . . . . . . . . . . . . . . . . 4 (6) (11)Termination benefits . . . . . . . . . . . . . . . . . . . . . . . . . . . . . . . . . . . . . . . . . . . . . . . . . . . . . . 1 1 0
Net periodic pension income . . . . . . . . . . . . . . . . . . . . . . . . . . . . . . . . . . . . . . . . . . . . . . . $ (67) $ (68) $ (91)
The components of other changes in plan assets and benefit obligations recognized in other comprehensiveincome:
2010 2009
Net actuarial gain . . . . . . . . . . . . . . . . . . . . . . . . . . . . . . . . . . . . . . . . . . . . . . . . . . . . . . $(15) $(204)Amortization of net actuarial loss . . . . . . . . . . . . . . . . . . . . . . . . . . . . . . . . . . . . . . . . . . (10) (2)Prior service cost (benefit) . . . . . . . . . . . . . . . . . . . . . . . . . . . . . . . . . . . . . . . . . . . . . . . 2 (39)Amortization of prior service cost . . . . . . . . . . . . . . . . . . . . . . . . . . . . . . . . . . . . . . . . . (2) (2)Curtailments . . . . . . . . . . . . . . . . . . . . . . . . . . . . . . . . . . . . . . . . . . . . . . . . . . . . . . . . . . (6) 7
Total gain recognized in other comprehensive income . . . . . . . . . . . . . . . . . . . . . . . . . $(31) $(240)
Total gain recognized in net periodic pension income and other comprehensiveincome . . . . . . . . . . . . . . . . . . . . . . . . . . . . . . . . . . . . . . . . . . . . . . . . . . . . . . . . . . . . $(98) $(308)
The estimated net actuarial loss and prior service benefit for the defined benefit retirement plans that will beamortized from accumulated other comprehensive loss into net periodic pension income in 2011 is $15 millionand $1 million, respectively.
Postretirement benefits
MeadWestvaco provides life insurance for substantially all retirees and medical benefits to certain retirees inthe form of cost subsidies until Medicare eligibility is reached and to certain other retirees, medical benefits up toa maximum lifetime amount. The company funds certain medical benefits on a current basis with retirees payinga portion of the costs. Certain retired employees of businesses acquired by the company are covered under othermedical plans that differ from current plans in coverage, deductibles and retiree contributions. As a result ofrestructuring activities, a curtailment gain of $8 million was recorded in 2010. No curtailments were incurredduring 2009 or 2008. Prior service cost and actuarial gains and losses subject to amortization are amortized overthe average remaining service, which is about 5 years.
63
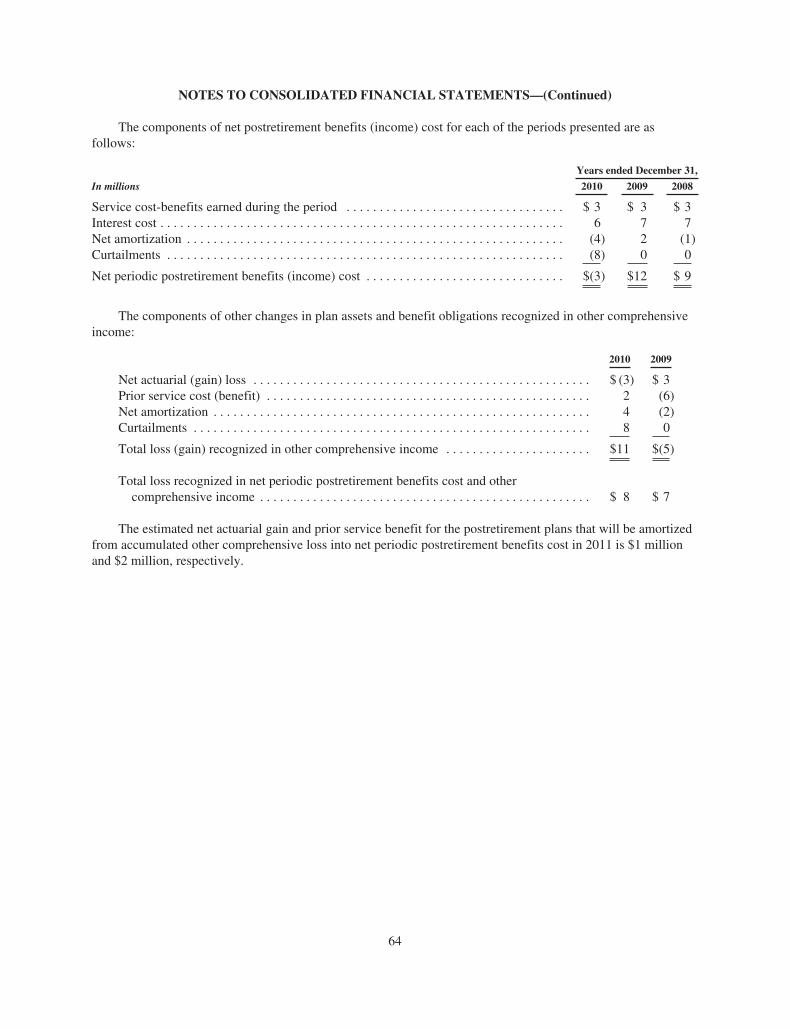
NOTES TO CONSOLIDATED FINANCIAL STATEMENTS—(Continued)
The components of net postretirement benefits (income) cost for each of the periods presented are asfollows:
Years ended December 31,
In millions 2010 2009 2008
Service cost-benefits earned during the period . . . . . . . . . . . . . . . . . . . . . . . . . . . . . . . . . $ 3 $ 3 $ 3Interest cost . . . . . . . . . . . . . . . . . . . . . . . . . . . . . . . . . . . . . . . . . . . . . . . . . . . . . . . . . . . . . 6 7 7Net amortization . . . . . . . . . . . . . . . . . . . . . . . . . . . . . . . . . . . . . . . . . . . . . . . . . . . . . . . . . (4) 2 (1)Curtailments . . . . . . . . . . . . . . . . . . . . . . . . . . . . . . . . . . . . . . . . . . . . . . . . . . . . . . . . . . . . (8) 0 0
Net periodic postretirement benefits (income) cost . . . . . . . . . . . . . . . . . . . . . . . . . . . . . . $(3) $12 $ 9
The components of other changes in plan assets and benefit obligations recognized in other comprehensiveincome:
2010 2009
Net actuarial (gain) loss . . . . . . . . . . . . . . . . . . . . . . . . . . . . . . . . . . . . . . . . . . . . . . . . . . . $ (3) $ 3Prior service cost (benefit) . . . . . . . . . . . . . . . . . . . . . . . . . . . . . . . . . . . . . . . . . . . . . . . . . 2 (6)Net amortization . . . . . . . . . . . . . . . . . . . . . . . . . . . . . . . . . . . . . . . . . . . . . . . . . . . . . . . . . 4 (2)Curtailments . . . . . . . . . . . . . . . . . . . . . . . . . . . . . . . . . . . . . . . . . . . . . . . . . . . . . . . . . . . . 8 0
Total loss (gain) recognized in other comprehensive income . . . . . . . . . . . . . . . . . . . . . . $11 $(5)
Total loss recognized in net periodic postretirement benefits cost and othercomprehensive income . . . . . . . . . . . . . . . . . . . . . . . . . . . . . . . . . . . . . . . . . . . . . . . . . . $ 8 $ 7
The estimated net actuarial gain and prior service benefit for the postretirement plans that will be amortizedfrom accumulated other comprehensive loss into net periodic postretirement benefits cost in 2011 is $1 millionand $2 million, respectively.
64
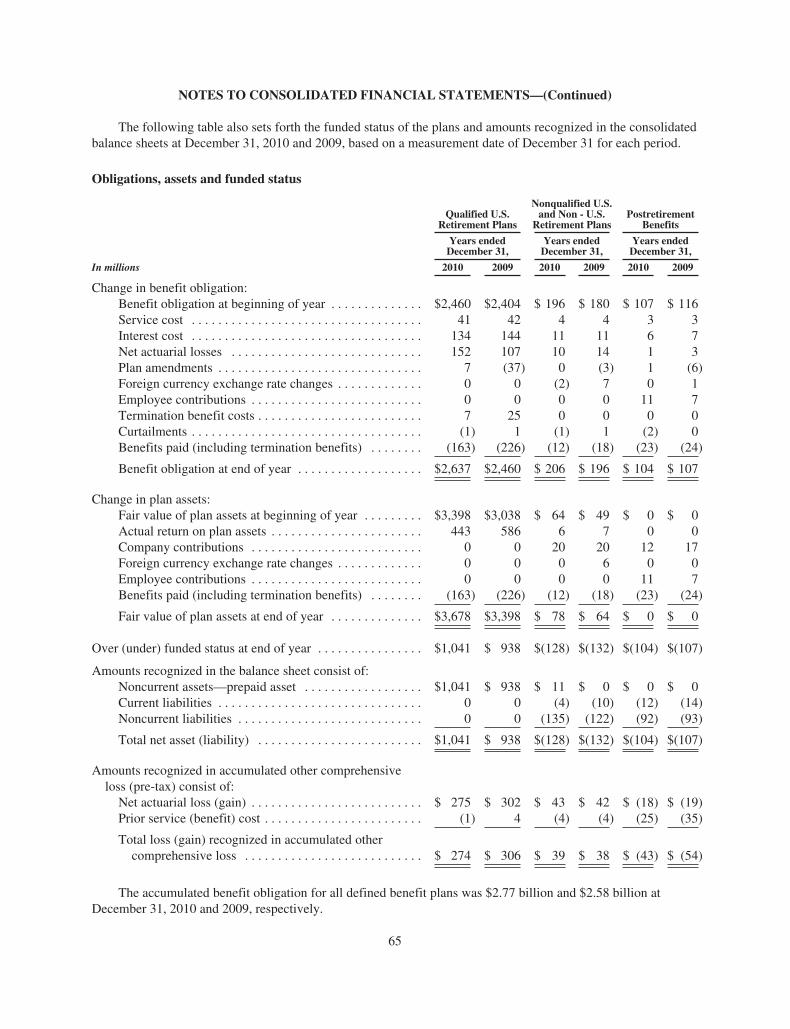
NOTES TO CONSOLIDATED FINANCIAL STATEMENTS—(Continued)
The following table also sets forth the funded status of the plans and amounts recognized in the consolidatedbalance sheets at December 31, 2010 and 2009, based on a measurement date of December 31 for each period.
Obligations, assets and funded status
Qualified U.S.Retirement Plans
Nonqualified U.S.and Non - U.S.
Retirement PlansPostretirement
Benefits
Years endedDecember 31,
Years endedDecember 31,
Years endedDecember 31,
In millions 2010 2009 2010 2009 2010 2009
Change in benefit obligation:Benefit obligation at beginning of year . . . . . . . . . . . . . . $2,460 $2,404 $ 196 $ 180 $ 107 $ 116Service cost . . . . . . . . . . . . . . . . . . . . . . . . . . . . . . . . . . . 41 42 4 4 3 3Interest cost . . . . . . . . . . . . . . . . . . . . . . . . . . . . . . . . . . . 134 144 11 11 6 7Net actuarial losses . . . . . . . . . . . . . . . . . . . . . . . . . . . . . 152 107 10 14 1 3Plan amendments . . . . . . . . . . . . . . . . . . . . . . . . . . . . . . . 7 (37) 0 (3) 1 (6)Foreign currency exchange rate changes . . . . . . . . . . . . . 0 0 (2) 7 0 1Employee contributions . . . . . . . . . . . . . . . . . . . . . . . . . . 0 0 0 0 11 7Termination benefit costs . . . . . . . . . . . . . . . . . . . . . . . . . 7 25 0 0 0 0Curtailments . . . . . . . . . . . . . . . . . . . . . . . . . . . . . . . . . . . (1) 1 (1) 1 (2) 0Benefits paid (including termination benefits) . . . . . . . . (163) (226) (12) (18) (23) (24)
Benefit obligation at end of year . . . . . . . . . . . . . . . . . . . $2,637 $2,460 $ 206 $ 196 $ 104 $ 107
Change in plan assets:Fair value of plan assets at beginning of year . . . . . . . . . $3,398 $3,038 $ 64 $ 49 $ 0 $ 0Actual return on plan assets . . . . . . . . . . . . . . . . . . . . . . . 443 586 6 7 0 0Company contributions . . . . . . . . . . . . . . . . . . . . . . . . . . 0 0 20 20 12 17Foreign currency exchange rate changes . . . . . . . . . . . . . 0 0 0 6 0 0Employee contributions . . . . . . . . . . . . . . . . . . . . . . . . . . 0 0 0 0 11 7Benefits paid (including termination benefits) . . . . . . . . (163) (226) (12) (18) (23) (24)
Fair value of plan assets at end of year . . . . . . . . . . . . . . $3,678 $3,398 $ 78 $ 64 $ 0 $ 0
Over (under) funded status at end of year . . . . . . . . . . . . . . . . $1,041 $ 938 $(128) $(132) $(104) $(107)
Amounts recognized in the balance sheet consist of:Noncurrent assets—prepaid asset . . . . . . . . . . . . . . . . . . $1,041 $ 938 $ 11 $ 0 $ 0 $ 0Current liabilities . . . . . . . . . . . . . . . . . . . . . . . . . . . . . . . 0 0 (4) (10) (12) (14)Noncurrent liabilities . . . . . . . . . . . . . . . . . . . . . . . . . . . . 0 0 (135) (122) (92) (93)
Total net asset (liability) . . . . . . . . . . . . . . . . . . . . . . . . . $1,041 $ 938 $(128) $(132) $(104) $(107)
Amounts recognized in accumulated other comprehensiveloss (pre-tax) consist of:Net actuarial loss (gain) . . . . . . . . . . . . . . . . . . . . . . . . . . $ 275 $ 302 $ 43 $ 42 $ (18) $ (19)Prior service (benefit) cost . . . . . . . . . . . . . . . . . . . . . . . . (1) 4 (4) (4) (25) (35)
Total loss (gain) recognized in accumulated othercomprehensive loss . . . . . . . . . . . . . . . . . . . . . . . . . . . $ 274 $ 306 $ 39 $ 38 $ (43) $ (54)
The accumulated benefit obligation for all defined benefit plans was $2.77 billion and $2.58 billion atDecember 31, 2010 and 2009, respectively.
65
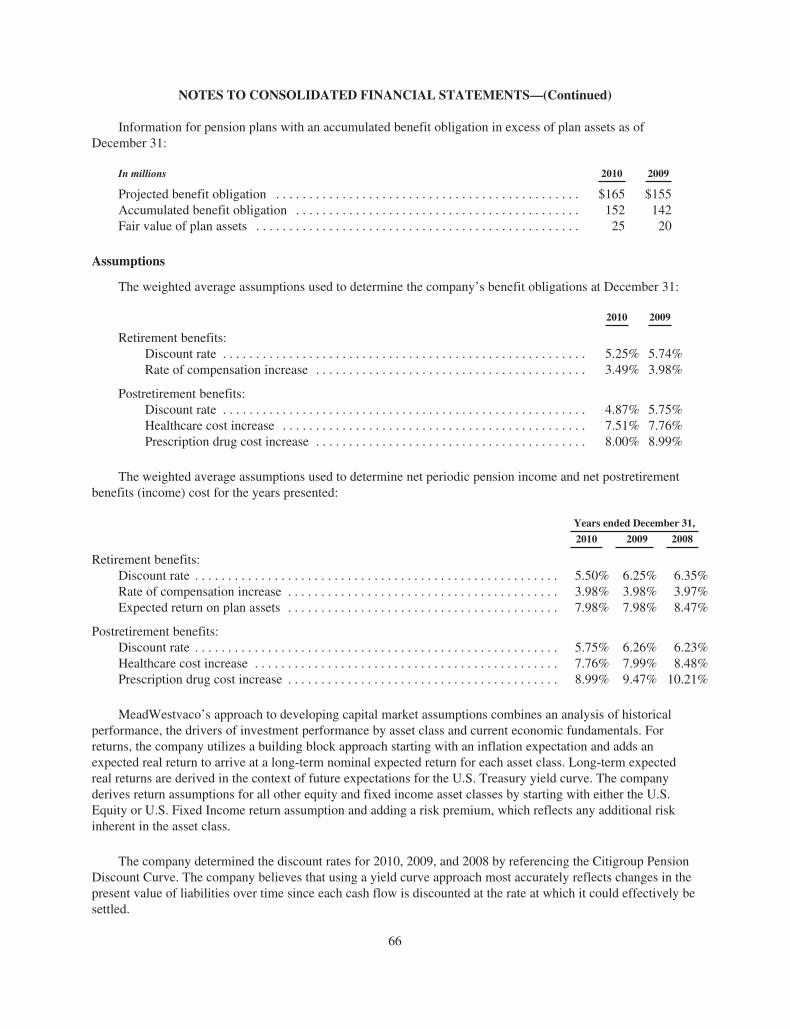
NOTES TO CONSOLIDATED FINANCIAL STATEMENTS—(Continued)
Information for pension plans with an accumulated benefit obligation in excess of plan assets as ofDecember 31:
In millions 2010 2009
Projected benefit obligation . . . . . . . . . . . . . . . . . . . . . . . . . . . . . . . . . . . . . . . . . . . . . . $165 $155Accumulated benefit obligation . . . . . . . . . . . . . . . . . . . . . . . . . . . . . . . . . . . . . . . . . . . 152 142Fair value of plan assets . . . . . . . . . . . . . . . . . . . . . . . . . . . . . . . . . . . . . . . . . . . . . . . . . 25 20
Assumptions
The weighted average assumptions used to determine the company’s benefit obligations at December 31:
2010 2009
Retirement benefits:Discount rate . . . . . . . . . . . . . . . . . . . . . . . . . . . . . . . . . . . . . . . . . . . . . . . . . . . . . . . 5.25% 5.74%Rate of compensation increase . . . . . . . . . . . . . . . . . . . . . . . . . . . . . . . . . . . . . . . . . 3.49% 3.98%
Postretirement benefits:Discount rate . . . . . . . . . . . . . . . . . . . . . . . . . . . . . . . . . . . . . . . . . . . . . . . . . . . . . . . 4.87% 5.75%Healthcare cost increase . . . . . . . . . . . . . . . . . . . . . . . . . . . . . . . . . . . . . . . . . . . . . . 7.51% 7.76%Prescription drug cost increase . . . . . . . . . . . . . . . . . . . . . . . . . . . . . . . . . . . . . . . . . 8.00% 8.99%
The weighted average assumptions used to determine net periodic pension income and net postretirementbenefits (income) cost for the years presented:
Years ended December 31,
2010 2009 2008
Retirement benefits:Discount rate . . . . . . . . . . . . . . . . . . . . . . . . . . . . . . . . . . . . . . . . . . . . . . . . . . . . . . . 5.50% 6.25% 6.35%Rate of compensation increase . . . . . . . . . . . . . . . . . . . . . . . . . . . . . . . . . . . . . . . . . 3.98% 3.98% 3.97%Expected return on plan assets . . . . . . . . . . . . . . . . . . . . . . . . . . . . . . . . . . . . . . . . . 7.98% 7.98% 8.47%
Postretirement benefits:Discount rate . . . . . . . . . . . . . . . . . . . . . . . . . . . . . . . . . . . . . . . . . . . . . . . . . . . . . . . 5.75% 6.26% 6.23%Healthcare cost increase . . . . . . . . . . . . . . . . . . . . . . . . . . . . . . . . . . . . . . . . . . . . . . 7.76% 7.99% 8.48%Prescription drug cost increase . . . . . . . . . . . . . . . . . . . . . . . . . . . . . . . . . . . . . . . . . 8.99% 9.47% 10.21%
MeadWestvaco’s approach to developing capital market assumptions combines an analysis of historicalperformance, the drivers of investment performance by asset class and current economic fundamentals. Forreturns, the company utilizes a building block approach starting with an inflation expectation and adds anexpected real return to arrive at a long-term nominal expected return for each asset class. Long-term expectedreal returns are derived in the context of future expectations for the U.S. Treasury yield curve. The companyderives return assumptions for all other equity and fixed income asset classes by starting with either the U.S.Equity or U.S. Fixed Income return assumption and adding a risk premium, which reflects any additional riskinherent in the asset class.
The company determined the discount rates for 2010, 2009, and 2008 by referencing the Citigroup PensionDiscount Curve. The company believes that using a yield curve approach most accurately reflects changes in thepresent value of liabilities over time since each cash flow is discounted at the rate at which it could effectively besettled.
66
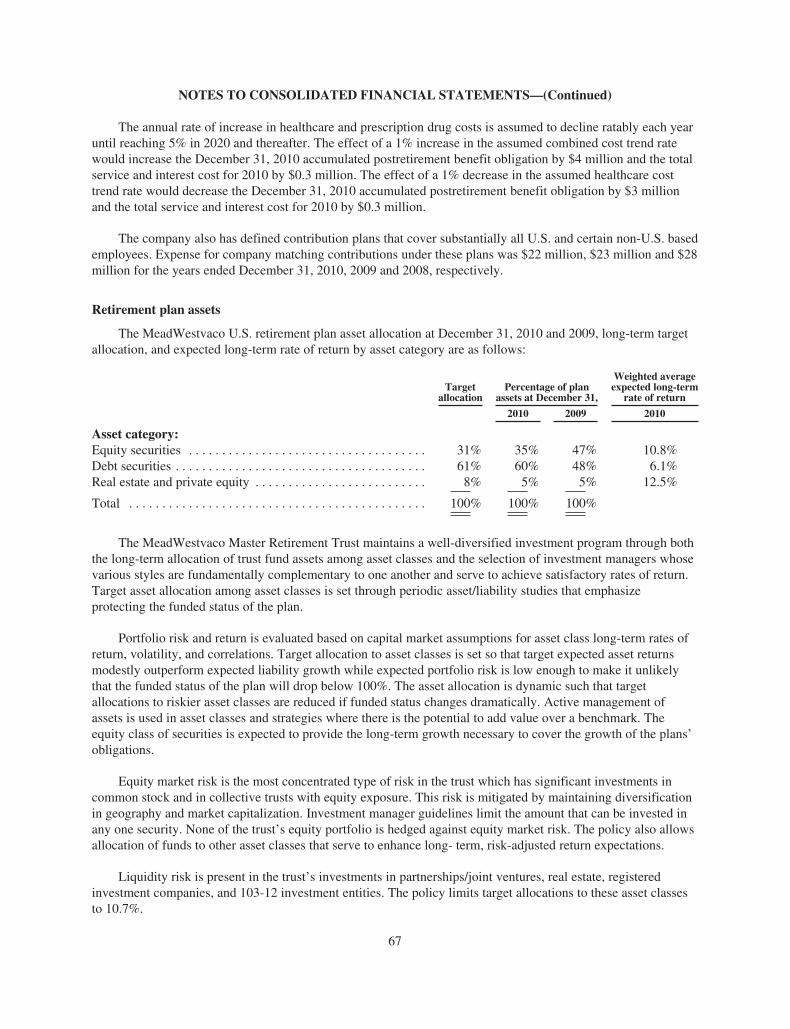
NOTES TO CONSOLIDATED FINANCIAL STATEMENTS—(Continued)
The annual rate of increase in healthcare and prescription drug costs is assumed to decline ratably each yearuntil reaching 5% in 2020 and thereafter. The effect of a 1% increase in the assumed combined cost trend ratewould increase the December 31, 2010 accumulated postretirement benefit obligation by $4 million and the totalservice and interest cost for 2010 by $0.3 million. The effect of a 1% decrease in the assumed healthcare costtrend rate would decrease the December 31, 2010 accumulated postretirement benefit obligation by $3 millionand the total service and interest cost for 2010 by $0.3 million.
The company also has defined contribution plans that cover substantially all U.S. and certain non-U.S. basedemployees. Expense for company matching contributions under these plans was $22 million, $23 million and $28million for the years ended December 31, 2010, 2009 and 2008, respectively.
Retirement plan assets
The MeadWestvaco U.S. retirement plan asset allocation at December 31, 2010 and 2009, long-term targetallocation, and expected long-term rate of return by asset category are as follows:
Targetallocation
Percentage of planassets at December 31,
Weighted averageexpected long-term
rate of return
2010 2009 2010
Asset category:Equity securities . . . . . . . . . . . . . . . . . . . . . . . . . . . . . . . . . . . . 31% 35% 47% 10.8%Debt securities . . . . . . . . . . . . . . . . . . . . . . . . . . . . . . . . . . . . . . 61% 60% 48% 6.1%Real estate and private equity . . . . . . . . . . . . . . . . . . . . . . . . . . 8% 5% 5% 12.5%
Total . . . . . . . . . . . . . . . . . . . . . . . . . . . . . . . . . . . . . . . . . . . . . 100% 100% 100%
The MeadWestvaco Master Retirement Trust maintains a well-diversified investment program through boththe long-term allocation of trust fund assets among asset classes and the selection of investment managers whosevarious styles are fundamentally complementary to one another and serve to achieve satisfactory rates of return.Target asset allocation among asset classes is set through periodic asset/liability studies that emphasizeprotecting the funded status of the plan.
Portfolio risk and return is evaluated based on capital market assumptions for asset class long-term rates ofreturn, volatility, and correlations. Target allocation to asset classes is set so that target expected asset returnsmodestly outperform expected liability growth while expected portfolio risk is low enough to make it unlikelythat the funded status of the plan will drop below 100%. The asset allocation is dynamic such that targetallocations to riskier asset classes are reduced if funded status changes dramatically. Active management ofassets is used in asset classes and strategies where there is the potential to add value over a benchmark. Theequity class of securities is expected to provide the long-term growth necessary to cover the growth of the plans’obligations.
Equity market risk is the most concentrated type of risk in the trust which has significant investments incommon stock and in collective trusts with equity exposure. This risk is mitigated by maintaining diversificationin geography and market capitalization. Investment manager guidelines limit the amount that can be invested inany one security. None of the trust’s equity portfolio is hedged against equity market risk. The policy also allowsallocation of funds to other asset classes that serve to enhance long- term, risk-adjusted return expectations.
Liquidity risk is present in the trust’s investments in partnerships/joint ventures, real estate, registeredinvestment companies, and 103-12 investment entities. The policy limits target allocations to these asset classesto 10.7%.
67
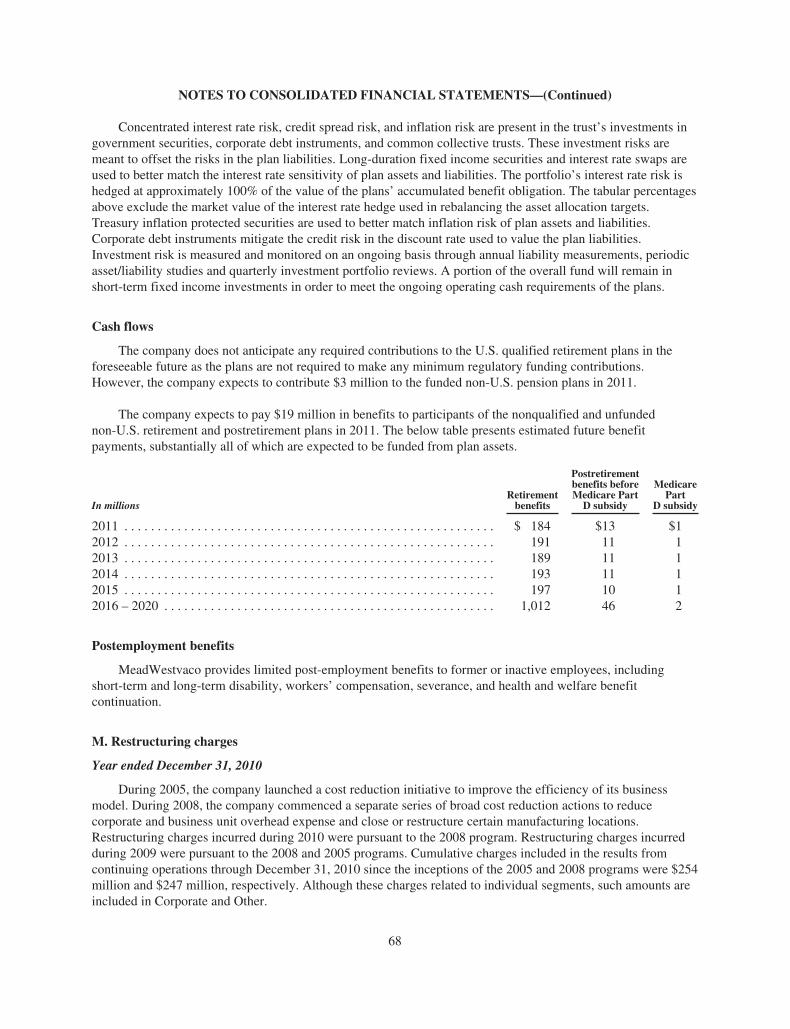
NOTES TO CONSOLIDATED FINANCIAL STATEMENTS—(Continued)
Concentrated interest rate risk, credit spread risk, and inflation risk are present in the trust’s investments ingovernment securities, corporate debt instruments, and common collective trusts. These investment risks aremeant to offset the risks in the plan liabilities. Long-duration fixed income securities and interest rate swaps areused to better match the interest rate sensitivity of plan assets and liabilities. The portfolio’s interest rate risk ishedged at approximately 100% of the value of the plans’ accumulated benefit obligation. The tabular percentagesabove exclude the market value of the interest rate hedge used in rebalancing the asset allocation targets.Treasury inflation protected securities are used to better match inflation risk of plan assets and liabilities.Corporate debt instruments mitigate the credit risk in the discount rate used to value the plan liabilities.Investment risk is measured and monitored on an ongoing basis through annual liability measurements, periodicasset/liability studies and quarterly investment portfolio reviews. A portion of the overall fund will remain inshort-term fixed income investments in order to meet the ongoing operating cash requirements of the plans.
Cash flows
The company does not anticipate any required contributions to the U.S. qualified retirement plans in theforeseeable future as the plans are not required to make any minimum regulatory funding contributions.However, the company expects to contribute $3 million to the funded non-U.S. pension plans in 2011.
The company expects to pay $19 million in benefits to participants of the nonqualified and unfundednon-U.S. retirement and postretirement plans in 2011. The below table presents estimated future benefitpayments, substantially all of which are expected to be funded from plan assets.
In millionsRetirementbenefits
Postretirementbenefits beforeMedicare PartD subsidy
MedicarePart
D subsidy
2011 . . . . . . . . . . . . . . . . . . . . . . . . . . . . . . . . . . . . . . . . . . . . . . . . . . . . . . . . $ 184 $13 $12012 . . . . . . . . . . . . . . . . . . . . . . . . . . . . . . . . . . . . . . . . . . . . . . . . . . . . . . . . 191 11 12013 . . . . . . . . . . . . . . . . . . . . . . . . . . . . . . . . . . . . . . . . . . . . . . . . . . . . . . . . 189 11 12014 . . . . . . . . . . . . . . . . . . . . . . . . . . . . . . . . . . . . . . . . . . . . . . . . . . . . . . . . 193 11 12015 . . . . . . . . . . . . . . . . . . . . . . . . . . . . . . . . . . . . . . . . . . . . . . . . . . . . . . . . 197 10 12016 – 2020 . . . . . . . . . . . . . . . . . . . . . . . . . . . . . . . . . . . . . . . . . . . . . . . . . . 1,012 46 2
Postemployment benefits
MeadWestvaco provides limited post-employment benefits to former or inactive employees, includingshort-term and long-term disability, workers’ compensation, severance, and health and welfare benefitcontinuation.
M. Restructuring charges
Year ended December 31, 2010
During 2005, the company launched a cost reduction initiative to improve the efficiency of its businessmodel. During 2008, the company commenced a separate series of broad cost reduction actions to reducecorporate and business unit overhead expense and close or restructure certain manufacturing locations.Restructuring charges incurred during 2010 were pursuant to the 2008 program. Restructuring charges incurredduring 2009 were pursuant to the 2008 and 2005 programs. Cumulative charges included in the results fromcontinuing operations through December 31, 2010 since the inceptions of the 2005 and 2008 programs were $254million and $247 million, respectively. Although these charges related to individual segments, such amounts areincluded in Corporate and Other.
68
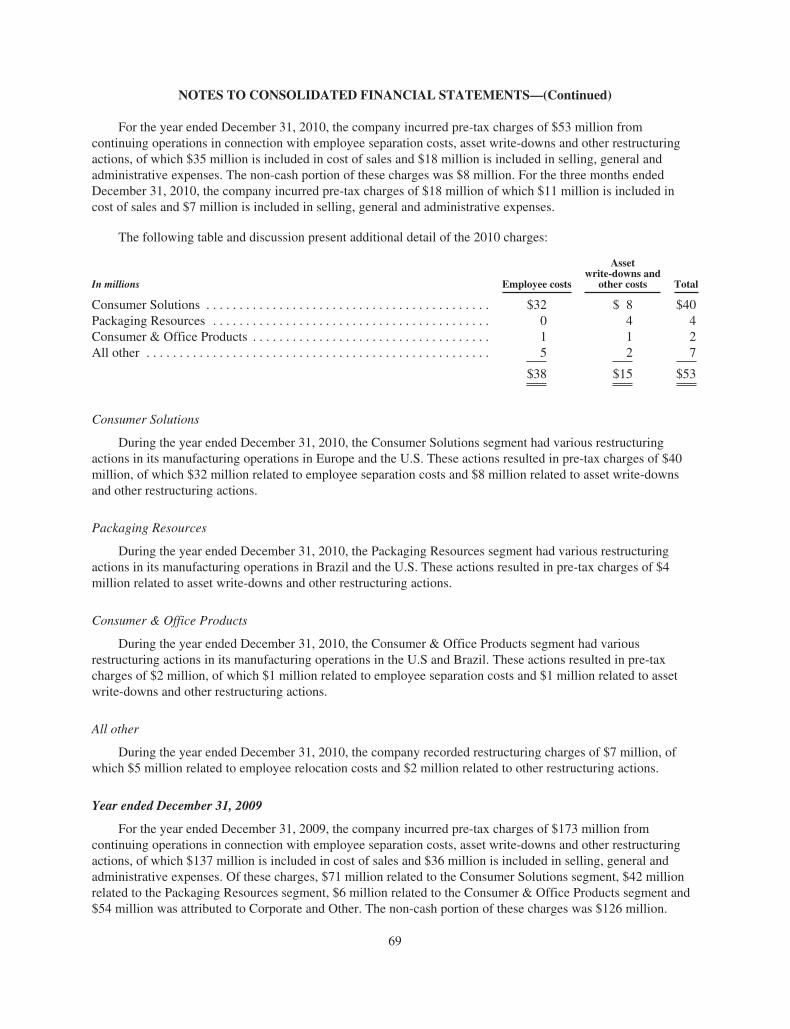
NOTES TO CONSOLIDATED FINANCIAL STATEMENTS—(Continued)
For the year ended December 31, 2010, the company incurred pre-tax charges of $53 million fromcontinuing operations in connection with employee separation costs, asset write-downs and other restructuringactions, of which $35 million is included in cost of sales and $18 million is included in selling, general andadministrative expenses. The non-cash portion of these charges was $8 million. For the three months endedDecember 31, 2010, the company incurred pre-tax charges of $18 million of which $11 million is included incost of sales and $7 million is included in selling, general and administrative expenses.
The following table and discussion present additional detail of the 2010 charges:
In millions Employee costs
Assetwrite-downs and
other costs Total
Consumer Solutions . . . . . . . . . . . . . . . . . . . . . . . . . . . . . . . . . . . . . . . . . . . $32 $ 8 $40Packaging Resources . . . . . . . . . . . . . . . . . . . . . . . . . . . . . . . . . . . . . . . . . . 0 4 4Consumer & Office Products . . . . . . . . . . . . . . . . . . . . . . . . . . . . . . . . . . . . 1 1 2All other . . . . . . . . . . . . . . . . . . . . . . . . . . . . . . . . . . . . . . . . . . . . . . . . . . . . 5 2 7
$38 $15 $53
Consumer Solutions
During the year ended December 31, 2010, the Consumer Solutions segment had various restructuringactions in its manufacturing operations in Europe and the U.S. These actions resulted in pre-tax charges of $40million, of which $32 million related to employee separation costs and $8 million related to asset write-downsand other restructuring actions.
Packaging Resources
During the year ended December 31, 2010, the Packaging Resources segment had various restructuringactions in its manufacturing operations in Brazil and the U.S. These actions resulted in pre-tax charges of $4million related to asset write-downs and other restructuring actions.
Consumer & Office Products
During the year ended December 31, 2010, the Consumer & Office Products segment had variousrestructuring actions in its manufacturing operations in the U.S and Brazil. These actions resulted in pre-taxcharges of $2 million, of which $1 million related to employee separation costs and $1 million related to assetwrite-downs and other restructuring actions.
All other
During the year ended December 31, 2010, the company recorded restructuring charges of $7 million, ofwhich $5 million related to employee relocation costs and $2 million related to other restructuring actions.
Year ended December 31, 2009
For the year ended December 31, 2009, the company incurred pre-tax charges of $173 million fromcontinuing operations in connection with employee separation costs, asset write-downs and other restructuringactions, of which $137 million is included in cost of sales and $36 million is included in selling, general andadministrative expenses. Of these charges, $71 million related to the Consumer Solutions segment, $42 millionrelated to the Packaging Resources segment, $6 million related to the Consumer & Office Products segment and$54 million was attributed to Corporate and Other. The non-cash portion of these charges was $126 million.
69
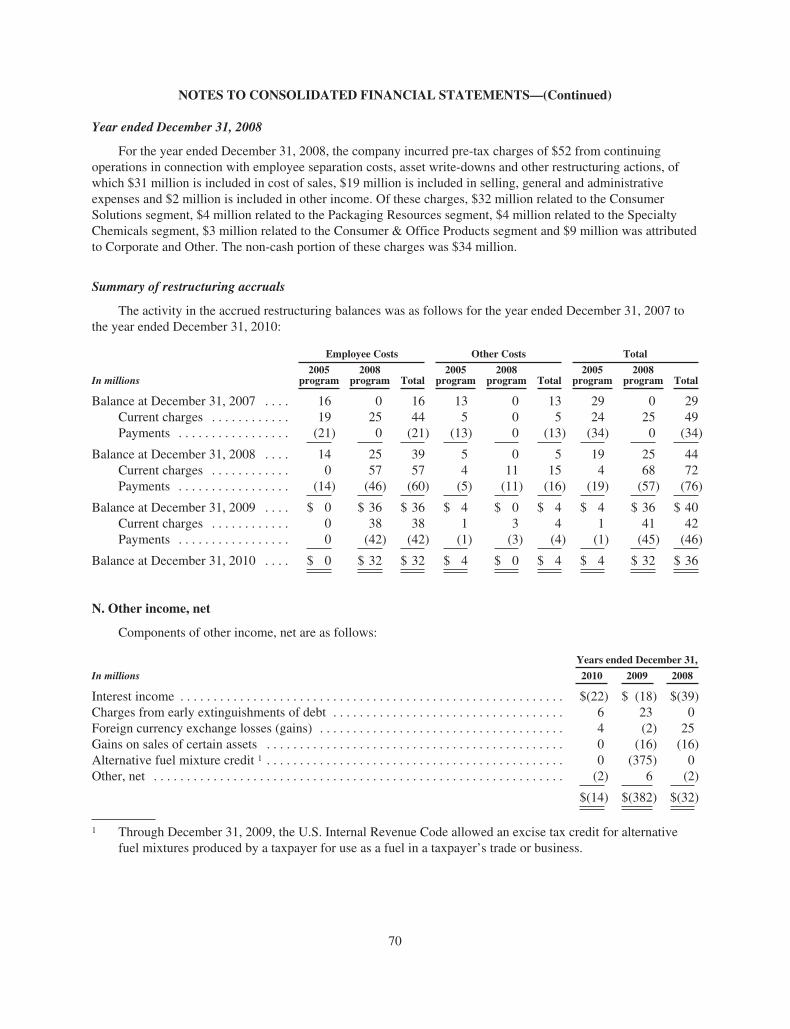
NOTES TO CONSOLIDATED FINANCIAL STATEMENTS—(Continued)
Year ended December 31, 2008
For the year ended December 31, 2008, the company incurred pre-tax charges of $52 from continuingoperations in connection with employee separation costs, asset write-downs and other restructuring actions, ofwhich $31 million is included in cost of sales, $19 million is included in selling, general and administrativeexpenses and $2 million is included in other income. Of these charges, $32 million related to the ConsumerSolutions segment, $4 million related to the Packaging Resources segment, $4 million related to the SpecialtyChemicals segment, $3 million related to the Consumer & Office Products segment and $9 million was attributedto Corporate and Other. The non-cash portion of these charges was $34 million.
Summary of restructuring accruals
The activity in the accrued restructuring balances was as follows for the year ended December 31, 2007 tothe year ended December 31, 2010:
Employee Costs Other Costs Total
In millions2005
program2008
program Total2005
program2008
program Total2005
program2008
program Total
Balance at December 31, 2007 . . . . 16 0 16 13 0 13 29 0 29Current charges . . . . . . . . . . . . 19 25 44 5 0 5 24 25 49Payments . . . . . . . . . . . . . . . . . (21) 0 (21) (13) 0 (13) (34) 0 (34)
Balance at December 31, 2008 . . . . 14 25 39 5 0 5 19 25 44Current charges . . . . . . . . . . . . 0 57 57 4 11 15 4 68 72Payments . . . . . . . . . . . . . . . . . (14) (46) (60) (5) (11) (16) (19) (57) (76)
Balance at December 31, 2009 . . . . $ 0 $ 36 $ 36 $ 4 $ 0 $ 4 $ 4 $ 36 $ 40Current charges . . . . . . . . . . . . 0 38 38 1 3 4 1 41 42Payments . . . . . . . . . . . . . . . . . 0 (42) (42) (1) (3) (4) (1) (45) (46)
Balance at December 31, 2010 . . . . $ 0 $ 32 $ 32 $ 4 $ 0 $ 4 $ 4 $ 32 $ 36
N. Other income, net
Components of other income, net are as follows:
Years ended December 31,
In millions 2010 2009 2008
Interest income . . . . . . . . . . . . . . . . . . . . . . . . . . . . . . . . . . . . . . . . . . . . . . . . . . . . . . . . . . $(22) $ (18) $(39)Charges from early extinguishments of debt . . . . . . . . . . . . . . . . . . . . . . . . . . . . . . . . . . . 6 23 0Foreign currency exchange losses (gains) . . . . . . . . . . . . . . . . . . . . . . . . . . . . . . . . . . . . . 4 (2) 25Gains on sales of certain assets . . . . . . . . . . . . . . . . . . . . . . . . . . . . . . . . . . . . . . . . . . . . . 0 (16) (16)Alternative fuel mixture credit 1 . . . . . . . . . . . . . . . . . . . . . . . . . . . . . . . . . . . . . . . . . . . . . 0 (375) 0Other, net . . . . . . . . . . . . . . . . . . . . . . . . . . . . . . . . . . . . . . . . . . . . . . . . . . . . . . . . . . . . . . (2) 6 (2)
$(14) $(382) $(32)
1 Through December 31, 2009, the U.S. Internal Revenue Code allowed an excise tax credit for alternativefuel mixtures produced by a taxpayer for use as a fuel in a taxpayer’s trade or business.
70
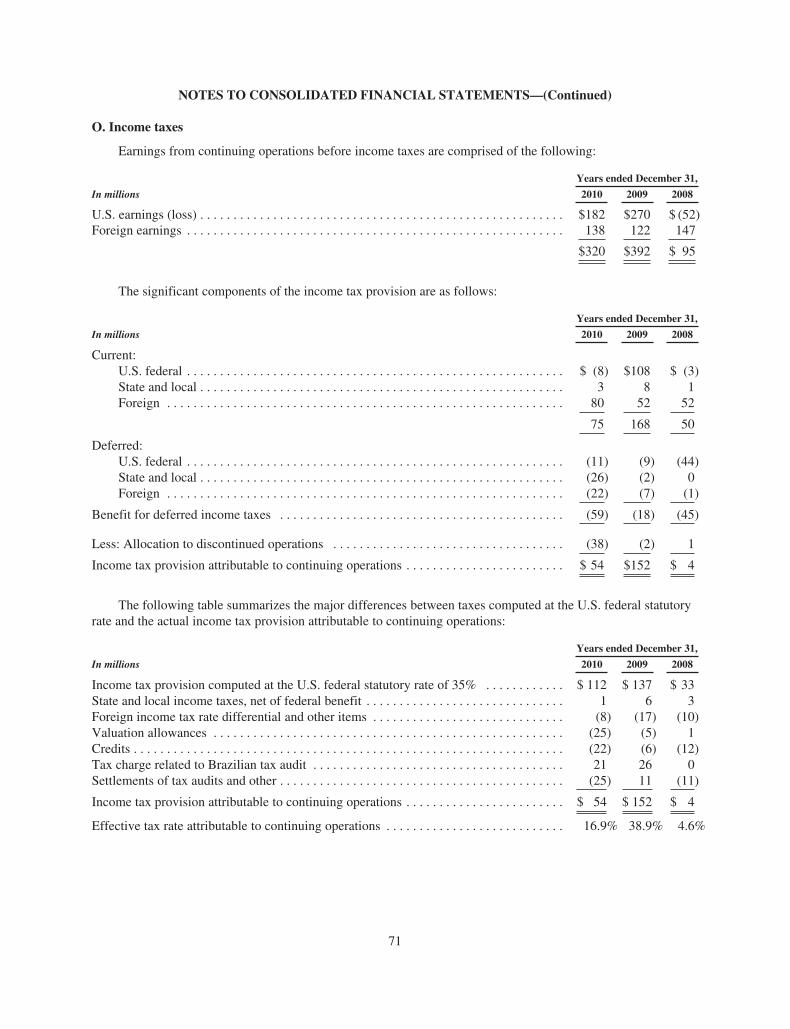
NOTES TO CONSOLIDATED FINANCIAL STATEMENTS—(Continued)
O. Income taxes
Earnings from continuing operations before income taxes are comprised of the following:
Years ended December 31,
In millions 2010 2009 2008
U.S. earnings (loss) . . . . . . . . . . . . . . . . . . . . . . . . . . . . . . . . . . . . . . . . . . . . . . . . . . . . . . . $182 $270 $ (52)Foreign earnings . . . . . . . . . . . . . . . . . . . . . . . . . . . . . . . . . . . . . . . . . . . . . . . . . . . . . . . . . 138 122 147
$320 $392 $ 95
The significant components of the income tax provision are as follows:
Years ended December 31,
In millions 2010 2009 2008
Current:U.S. federal . . . . . . . . . . . . . . . . . . . . . . . . . . . . . . . . . . . . . . . . . . . . . . . . . . . . . . . . . $ (8) $108 $ (3)State and local . . . . . . . . . . . . . . . . . . . . . . . . . . . . . . . . . . . . . . . . . . . . . . . . . . . . . . . 3 8 1Foreign . . . . . . . . . . . . . . . . . . . . . . . . . . . . . . . . . . . . . . . . . . . . . . . . . . . . . . . . . . . . 80 52 52
75 168 50
Deferred:U.S. federal . . . . . . . . . . . . . . . . . . . . . . . . . . . . . . . . . . . . . . . . . . . . . . . . . . . . . . . . . (11) (9) (44)State and local . . . . . . . . . . . . . . . . . . . . . . . . . . . . . . . . . . . . . . . . . . . . . . . . . . . . . . . (26) (2) 0Foreign . . . . . . . . . . . . . . . . . . . . . . . . . . . . . . . . . . . . . . . . . . . . . . . . . . . . . . . . . . . . (22) (7) (1)
Benefit for deferred income taxes . . . . . . . . . . . . . . . . . . . . . . . . . . . . . . . . . . . . . . . . . . . (59) (18) (45)
Less: Allocation to discontinued operations . . . . . . . . . . . . . . . . . . . . . . . . . . . . . . . . . . . (38) (2) 1
Income tax provision attributable to continuing operations . . . . . . . . . . . . . . . . . . . . . . . . $ 54 $152 $ 4
The following table summarizes the major differences between taxes computed at the U.S. federal statutoryrate and the actual income tax provision attributable to continuing operations:
Years ended December 31,
In millions 2010 2009 2008
Income tax provision computed at the U.S. federal statutory rate of 35% . . . . . . . . . . . . $ 112 $ 137 $ 33State and local income taxes, net of federal benefit . . . . . . . . . . . . . . . . . . . . . . . . . . . . . . 1 6 3Foreign income tax rate differential and other items . . . . . . . . . . . . . . . . . . . . . . . . . . . . . (8) (17) (10)Valuation allowances . . . . . . . . . . . . . . . . . . . . . . . . . . . . . . . . . . . . . . . . . . . . . . . . . . . . . (25) (5) 1Credits . . . . . . . . . . . . . . . . . . . . . . . . . . . . . . . . . . . . . . . . . . . . . . . . . . . . . . . . . . . . . . . . . (22) (6) (12)Tax charge related to Brazilian tax audit . . . . . . . . . . . . . . . . . . . . . . . . . . . . . . . . . . . . . . 21 26 0Settlements of tax audits and other . . . . . . . . . . . . . . . . . . . . . . . . . . . . . . . . . . . . . . . . . . . (25) 11 (11)
Income tax provision attributable to continuing operations . . . . . . . . . . . . . . . . . . . . . . . . $ 54 $ 152 $ 4
Effective tax rate attributable to continuing operations . . . . . . . . . . . . . . . . . . . . . . . . . . . 16.9% 38.9% 4.6%
71
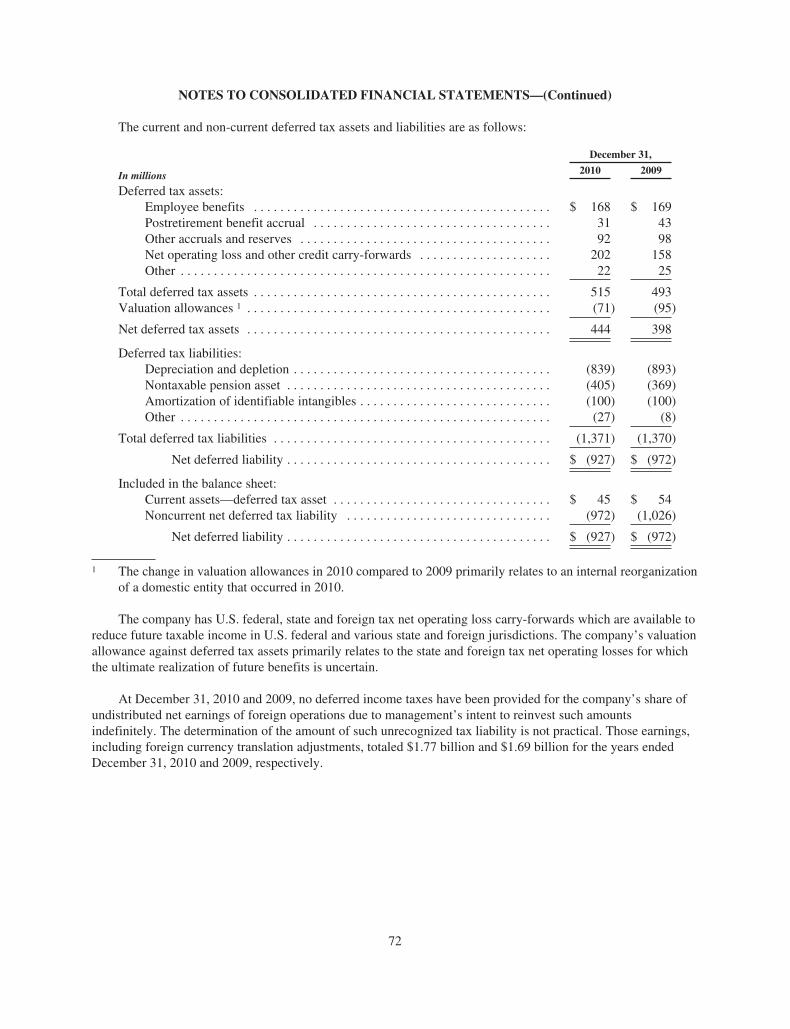
NOTES TO CONSOLIDATED FINANCIAL STATEMENTS—(Continued)
The current and non-current deferred tax assets and liabilities are as follows:
In millions
December 31,
2010 2009
Deferred tax assets:Employee benefits . . . . . . . . . . . . . . . . . . . . . . . . . . . . . . . . . . . . . . . . . . . . . $ 168 $ 169Postretirement benefit accrual . . . . . . . . . . . . . . . . . . . . . . . . . . . . . . . . . . . . 31 43Other accruals and reserves . . . . . . . . . . . . . . . . . . . . . . . . . . . . . . . . . . . . . . 92 98Net operating loss and other credit carry-forwards . . . . . . . . . . . . . . . . . . . . 202 158Other . . . . . . . . . . . . . . . . . . . . . . . . . . . . . . . . . . . . . . . . . . . . . . . . . . . . . . . . 22 25
Total deferred tax assets . . . . . . . . . . . . . . . . . . . . . . . . . . . . . . . . . . . . . . . . . . . . . 515 493Valuation allowances 1 . . . . . . . . . . . . . . . . . . . . . . . . . . . . . . . . . . . . . . . . . . . . . . (71) (95)
Net deferred tax assets . . . . . . . . . . . . . . . . . . . . . . . . . . . . . . . . . . . . . . . . . . . . . . 444 398
Deferred tax liabilities:Depreciation and depletion . . . . . . . . . . . . . . . . . . . . . . . . . . . . . . . . . . . . . . . (839) (893)Nontaxable pension asset . . . . . . . . . . . . . . . . . . . . . . . . . . . . . . . . . . . . . . . . (405) (369)Amortization of identifiable intangibles . . . . . . . . . . . . . . . . . . . . . . . . . . . . . (100) (100)Other . . . . . . . . . . . . . . . . . . . . . . . . . . . . . . . . . . . . . . . . . . . . . . . . . . . . . . . . (27) (8)
Total deferred tax liabilities . . . . . . . . . . . . . . . . . . . . . . . . . . . . . . . . . . . . . . . . . . (1,371) (1,370)
Net deferred liability . . . . . . . . . . . . . . . . . . . . . . . . . . . . . . . . . . . . . . . . $ (927) $ (972)
Included in the balance sheet:Current assets—deferred tax asset . . . . . . . . . . . . . . . . . . . . . . . . . . . . . . . . . $ 45 $ 54Noncurrent net deferred tax liability . . . . . . . . . . . . . . . . . . . . . . . . . . . . . . . (972) (1,026)
Net deferred liability . . . . . . . . . . . . . . . . . . . . . . . . . . . . . . . . . . . . . . . . $ (927) $ (972)
1 The change in valuation allowances in 2010 compared to 2009 primarily relates to an internal reorganizationof a domestic entity that occurred in 2010.
The company has U.S. federal, state and foreign tax net operating loss carry-forwards which are available toreduce future taxable income in U.S. federal and various state and foreign jurisdictions. The company’s valuationallowance against deferred tax assets primarily relates to the state and foreign tax net operating losses for whichthe ultimate realization of future benefits is uncertain.
At December 31, 2010 and 2009, no deferred income taxes have been provided for the company’s share ofundistributed net earnings of foreign operations due to management’s intent to reinvest such amountsindefinitely. The determination of the amount of such unrecognized tax liability is not practical. Those earnings,including foreign currency translation adjustments, totaled $1.77 billion and $1.69 billion for the years endedDecember 31, 2010 and 2009, respectively.
72
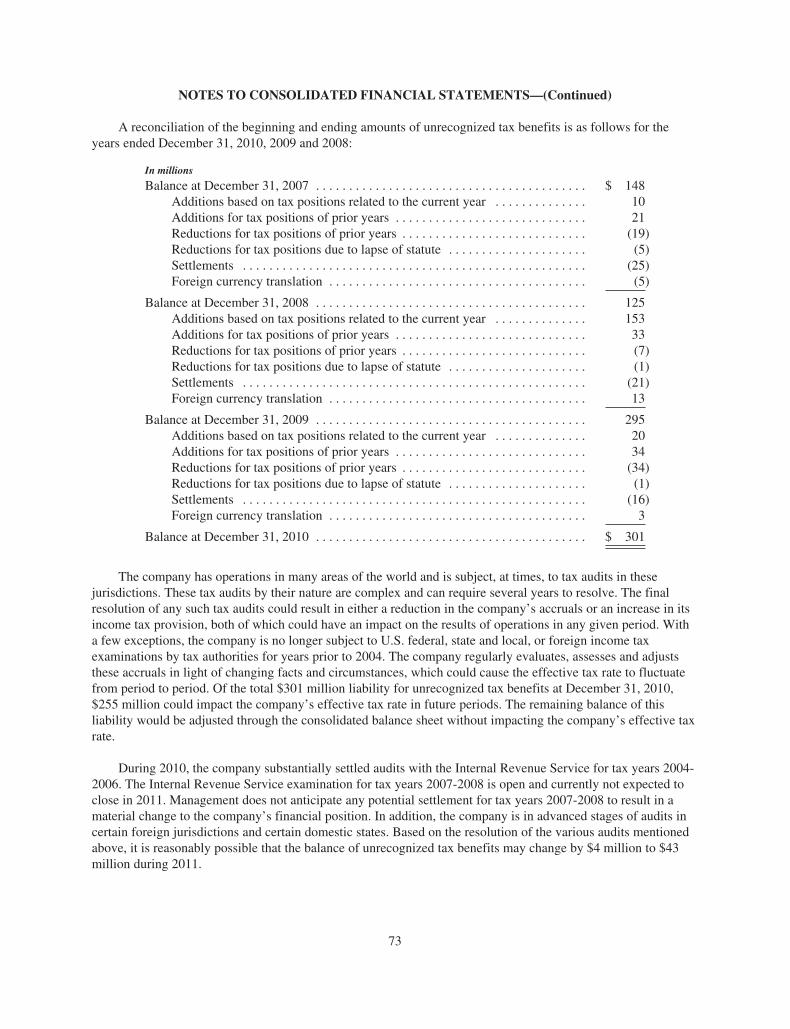
NOTES TO CONSOLIDATED FINANCIAL STATEMENTS—(Continued)
A reconciliation of the beginning and ending amounts of unrecognized tax benefits is as follows for theyears ended December 31, 2010, 2009 and 2008:
In millions
Balance at December 31, 2007 . . . . . . . . . . . . . . . . . . . . . . . . . . . . . . . . . . . . . . . . . $ 148Additions based on tax positions related to the current year . . . . . . . . . . . . . . 10Additions for tax positions of prior years . . . . . . . . . . . . . . . . . . . . . . . . . . . . . 21Reductions for tax positions of prior years . . . . . . . . . . . . . . . . . . . . . . . . . . . . (19)Reductions for tax positions due to lapse of statute . . . . . . . . . . . . . . . . . . . . . (5)Settlements . . . . . . . . . . . . . . . . . . . . . . . . . . . . . . . . . . . . . . . . . . . . . . . . . . . . (25)Foreign currency translation . . . . . . . . . . . . . . . . . . . . . . . . . . . . . . . . . . . . . . . (5)
Balance at December 31, 2008 . . . . . . . . . . . . . . . . . . . . . . . . . . . . . . . . . . . . . . . . . 125Additions based on tax positions related to the current year . . . . . . . . . . . . . . 153Additions for tax positions of prior years . . . . . . . . . . . . . . . . . . . . . . . . . . . . . 33Reductions for tax positions of prior years . . . . . . . . . . . . . . . . . . . . . . . . . . . . (7)Reductions for tax positions due to lapse of statute . . . . . . . . . . . . . . . . . . . . . (1)Settlements . . . . . . . . . . . . . . . . . . . . . . . . . . . . . . . . . . . . . . . . . . . . . . . . . . . . (21)Foreign currency translation . . . . . . . . . . . . . . . . . . . . . . . . . . . . . . . . . . . . . . . 13
Balance at December 31, 2009 . . . . . . . . . . . . . . . . . . . . . . . . . . . . . . . . . . . . . . . . . 295Additions based on tax positions related to the current year . . . . . . . . . . . . . . 20Additions for tax positions of prior years . . . . . . . . . . . . . . . . . . . . . . . . . . . . . 34Reductions for tax positions of prior years . . . . . . . . . . . . . . . . . . . . . . . . . . . . (34)Reductions for tax positions due to lapse of statute . . . . . . . . . . . . . . . . . . . . . (1)Settlements . . . . . . . . . . . . . . . . . . . . . . . . . . . . . . . . . . . . . . . . . . . . . . . . . . . . (16)Foreign currency translation . . . . . . . . . . . . . . . . . . . . . . . . . . . . . . . . . . . . . . . 3
Balance at December 31, 2010 . . . . . . . . . . . . . . . . . . . . . . . . . . . . . . . . . . . . . . . . . $ 301
The company has operations in many areas of the world and is subject, at times, to tax audits in thesejurisdictions. These tax audits by their nature are complex and can require several years to resolve. The finalresolution of any such tax audits could result in either a reduction in the company’s accruals or an increase in itsincome tax provision, both of which could have an impact on the results of operations in any given period. Witha few exceptions, the company is no longer subject to U.S. federal, state and local, or foreign income taxexaminations by tax authorities for years prior to 2004. The company regularly evaluates, assesses and adjuststhese accruals in light of changing facts and circumstances, which could cause the effective tax rate to fluctuatefrom period to period. Of the total $301 million liability for unrecognized tax benefits at December 31, 2010,$255 million could impact the company’s effective tax rate in future periods. The remaining balance of thisliability would be adjusted through the consolidated balance sheet without impacting the company’s effective taxrate.
During 2010, the company substantially settled audits with the Internal Revenue Service for tax years 2004-2006. The Internal Revenue Service examination for tax years 2007-2008 is open and currently not expected toclose in 2011. Management does not anticipate any potential settlement for tax years 2007-2008 to result in amaterial change to the company’s financial position. In addition, the company is in advanced stages of audits incertain foreign jurisdictions and certain domestic states. Based on the resolution of the various audits mentionedabove, it is reasonably possible that the balance of unrecognized tax benefits may change by $4 million to $43million during 2011.
73
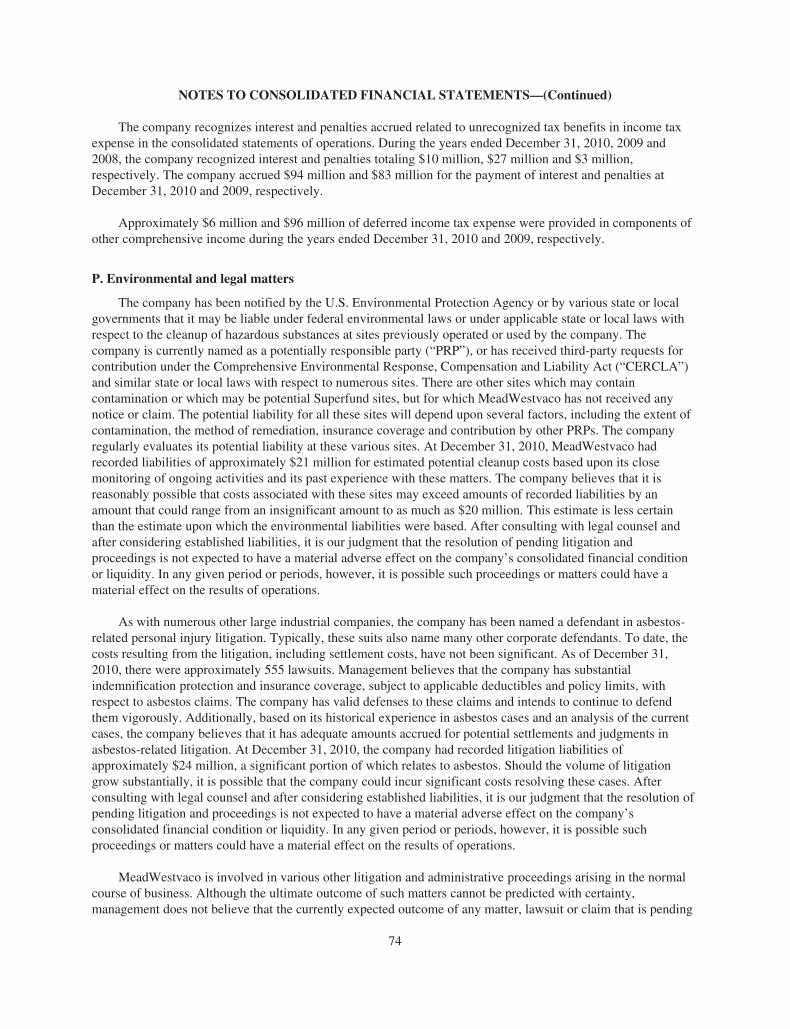
NOTES TO CONSOLIDATED FINANCIAL STATEMENTS—(Continued)
The company recognizes interest and penalties accrued related to unrecognized tax benefits in income taxexpense in the consolidated statements of operations. During the years ended December 31, 2010, 2009 and2008, the company recognized interest and penalties totaling $10 million, $27 million and $3 million,respectively. The company accrued $94 million and $83 million for the payment of interest and penalties atDecember 31, 2010 and 2009, respectively.
Approximately $6 million and $96 million of deferred income tax expense were provided in components ofother comprehensive income during the years ended December 31, 2010 and 2009, respectively.
P. Environmental and legal matters
The company has been notified by the U.S. Environmental Protection Agency or by various state or localgovernments that it may be liable under federal environmental laws or under applicable state or local laws withrespect to the cleanup of hazardous substances at sites previously operated or used by the company. Thecompany is currently named as a potentially responsible party (“PRP”), or has received third-party requests forcontribution under the Comprehensive Environmental Response, Compensation and Liability Act (“CERCLA”)and similar state or local laws with respect to numerous sites. There are other sites which may containcontamination or which may be potential Superfund sites, but for which MeadWestvaco has not received anynotice or claim. The potential liability for all these sites will depend upon several factors, including the extent ofcontamination, the method of remediation, insurance coverage and contribution by other PRPs. The companyregularly evaluates its potential liability at these various sites. At December 31, 2010, MeadWestvaco hadrecorded liabilities of approximately $21 million for estimated potential cleanup costs based upon its closemonitoring of ongoing activities and its past experience with these matters. The company believes that it isreasonably possible that costs associated with these sites may exceed amounts of recorded liabilities by anamount that could range from an insignificant amount to as much as $20 million. This estimate is less certainthan the estimate upon which the environmental liabilities were based. After consulting with legal counsel andafter considering established liabilities, it is our judgment that the resolution of pending litigation andproceedings is not expected to have a material adverse effect on the company’s consolidated financial conditionor liquidity. In any given period or periods, however, it is possible such proceedings or matters could have amaterial effect on the results of operations.
As with numerous other large industrial companies, the company has been named a defendant in asbestos-related personal injury litigation. Typically, these suits also name many other corporate defendants. To date, thecosts resulting from the litigation, including settlement costs, have not been significant. As of December 31,2010, there were approximately 555 lawsuits. Management believes that the company has substantialindemnification protection and insurance coverage, subject to applicable deductibles and policy limits, withrespect to asbestos claims. The company has valid defenses to these claims and intends to continue to defendthem vigorously. Additionally, based on its historical experience in asbestos cases and an analysis of the currentcases, the company believes that it has adequate amounts accrued for potential settlements and judgments inasbestos-related litigation. At December 31, 2010, the company had recorded litigation liabilities ofapproximately $24 million, a significant portion of which relates to asbestos. Should the volume of litigationgrow substantially, it is possible that the company could incur significant costs resolving these cases. Afterconsulting with legal counsel and after considering established liabilities, it is our judgment that the resolution ofpending litigation and proceedings is not expected to have a material adverse effect on the company’sconsolidated financial condition or liquidity. In any given period or periods, however, it is possible suchproceedings or matters could have a material effect on the results of operations.
MeadWestvaco is involved in various other litigation and administrative proceedings arising in the normalcourse of business. Although the ultimate outcome of such matters cannot be predicted with certainty,management does not believe that the currently expected outcome of any matter, lawsuit or claim that is pending
74
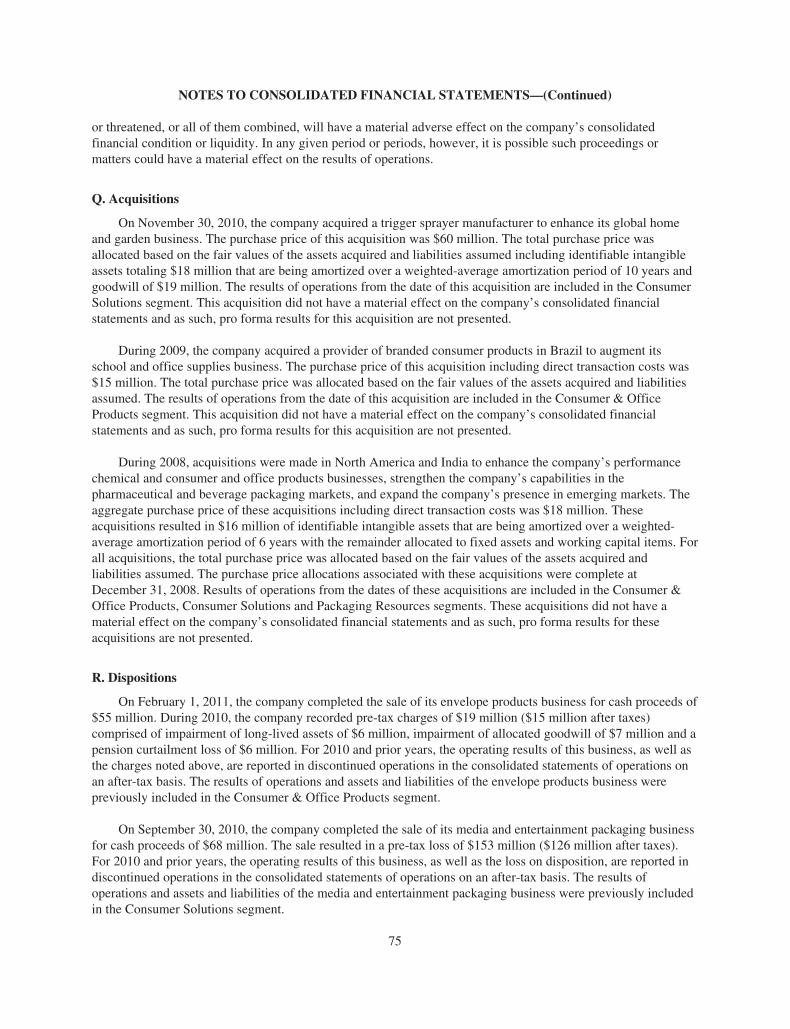
NOTES TO CONSOLIDATED FINANCIAL STATEMENTS—(Continued)
or threatened, or all of them combined, will have a material adverse effect on the company’s consolidatedfinancial condition or liquidity. In any given period or periods, however, it is possible such proceedings ormatters could have a material effect on the results of operations.
Q. Acquisitions
On November 30, 2010, the company acquired a trigger sprayer manufacturer to enhance its global homeand garden business. The purchase price of this acquisition was $60 million. The total purchase price wasallocated based on the fair values of the assets acquired and liabilities assumed including identifiable intangibleassets totaling $18 million that are being amortized over a weighted-average amortization period of 10 years andgoodwill of $19 million. The results of operations from the date of this acquisition are included in the ConsumerSolutions segment. This acquisition did not have a material effect on the company’s consolidated financialstatements and as such, pro forma results for this acquisition are not presented.
During 2009, the company acquired a provider of branded consumer products in Brazil to augment itsschool and office supplies business. The purchase price of this acquisition including direct transaction costs was$15 million. The total purchase price was allocated based on the fair values of the assets acquired and liabilitiesassumed. The results of operations from the date of this acquisition are included in the Consumer & OfficeProducts segment. This acquisition did not have a material effect on the company’s consolidated financialstatements and as such, pro forma results for this acquisition are not presented.
During 2008, acquisitions were made in North America and India to enhance the company’s performancechemical and consumer and office products businesses, strengthen the company’s capabilities in thepharmaceutical and beverage packaging markets, and expand the company’s presence in emerging markets. Theaggregate purchase price of these acquisitions including direct transaction costs was $18 million. Theseacquisitions resulted in $16 million of identifiable intangible assets that are being amortized over a weighted-average amortization period of 6 years with the remainder allocated to fixed assets and working capital items. Forall acquisitions, the total purchase price was allocated based on the fair values of the assets acquired andliabilities assumed. The purchase price allocations associated with these acquisitions were complete atDecember 31, 2008. Results of operations from the dates of these acquisitions are included in the Consumer &Office Products, Consumer Solutions and Packaging Resources segments. These acquisitions did not have amaterial effect on the company’s consolidated financial statements and as such, pro forma results for theseacquisitions are not presented.
R. Dispositions
On February 1, 2011, the company completed the sale of its envelope products business for cash proceeds of$55 million. During 2010, the company recorded pre-tax charges of $19 million ($15 million after taxes)comprised of impairment of long-lived assets of $6 million, impairment of allocated goodwill of $7 million and apension curtailment loss of $6 million. For 2010 and prior years, the operating results of this business, as well asthe charges noted above, are reported in discontinued operations in the consolidated statements of operations onan after-tax basis. The results of operations and assets and liabilities of the envelope products business werepreviously included in the Consumer & Office Products segment.
On September 30, 2010, the company completed the sale of its media and entertainment packaging businessfor cash proceeds of $68 million. The sale resulted in a pre-tax loss of $153 million ($126 million after taxes).For 2010 and prior years, the operating results of this business, as well as the loss on disposition, are reported indiscontinued operations in the consolidated statements of operations on an after-tax basis. The results ofoperations and assets and liabilities of the media and entertainment packaging business were previously includedin the Consumer Solutions segment.
75
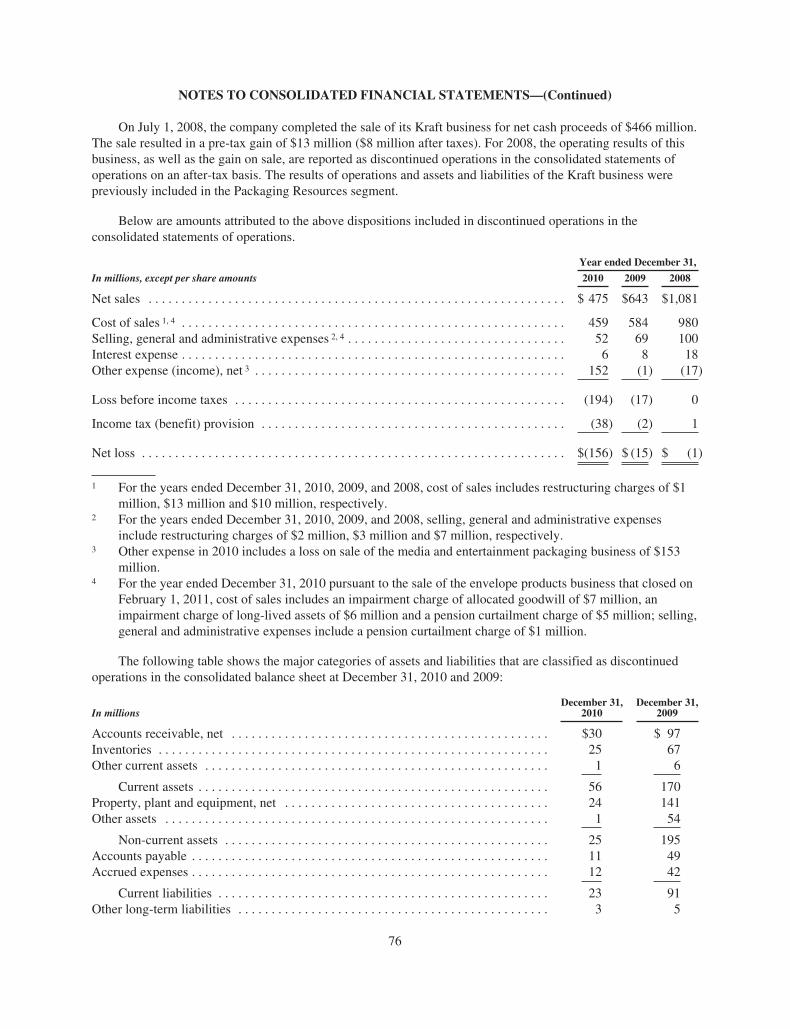
NOTES TO CONSOLIDATED FINANCIAL STATEMENTS—(Continued)
On July 1, 2008, the company completed the sale of its Kraft business for net cash proceeds of $466 million.The sale resulted in a pre-tax gain of $13 million ($8 million after taxes). For 2008, the operating results of thisbusiness, as well as the gain on sale, are reported as discontinued operations in the consolidated statements ofoperations on an after-tax basis. The results of operations and assets and liabilities of the Kraft business werepreviously included in the Packaging Resources segment.
Below are amounts attributed to the above dispositions included in discontinued operations in theconsolidated statements of operations.
Year ended December 31,
In millions, except per share amounts 2010 2009 2008
Net sales . . . . . . . . . . . . . . . . . . . . . . . . . . . . . . . . . . . . . . . . . . . . . . . . . . . . . . . . . . . . . . . $ 475 $643 $1,081
Cost of sales 1, 4 . . . . . . . . . . . . . . . . . . . . . . . . . . . . . . . . . . . . . . . . . . . . . . . . . . . . . . . . . . 459 584 980Selling, general and administrative expenses 2, 4 . . . . . . . . . . . . . . . . . . . . . . . . . . . . . . . . . 52 69 100Interest expense . . . . . . . . . . . . . . . . . . . . . . . . . . . . . . . . . . . . . . . . . . . . . . . . . . . . . . . . . . 6 8 18Other expense (income), net 3 . . . . . . . . . . . . . . . . . . . . . . . . . . . . . . . . . . . . . . . . . . . . . . . 152 (1) (17)
Loss before income taxes . . . . . . . . . . . . . . . . . . . . . . . . . . . . . . . . . . . . . . . . . . . . . . . . . . (194) (17) 0
Income tax (benefit) provision . . . . . . . . . . . . . . . . . . . . . . . . . . . . . . . . . . . . . . . . . . . . . . (38) (2) 1
Net loss . . . . . . . . . . . . . . . . . . . . . . . . . . . . . . . . . . . . . . . . . . . . . . . . . . . . . . . . . . . . . . . . $(156) $ (15) $ (1)
1 For the years ended December 31, 2010, 2009, and 2008, cost of sales includes restructuring charges of $1million, $13 million and $10 million, respectively.
2 For the years ended December 31, 2010, 2009, and 2008, selling, general and administrative expensesinclude restructuring charges of $2 million, $3 million and $7 million, respectively.
3 Other expense in 2010 includes a loss on sale of the media and entertainment packaging business of $153million.
4 For the year ended December 31, 2010 pursuant to the sale of the envelope products business that closed onFebruary 1, 2011, cost of sales includes an impairment charge of allocated goodwill of $7 million, animpairment charge of long-lived assets of $6 million and a pension curtailment charge of $5 million; selling,general and administrative expenses include a pension curtailment charge of $1 million.
The following table shows the major categories of assets and liabilities that are classified as discontinuedoperations in the consolidated balance sheet at December 31, 2010 and 2009:
In millionsDecember 31,
2010December 31,
2009
Accounts receivable, net . . . . . . . . . . . . . . . . . . . . . . . . . . . . . . . . . . . . . . . . . . . . . . . . $30 $ 97Inventories . . . . . . . . . . . . . . . . . . . . . . . . . . . . . . . . . . . . . . . . . . . . . . . . . . . . . . . . . . . 25 67Other current assets . . . . . . . . . . . . . . . . . . . . . . . . . . . . . . . . . . . . . . . . . . . . . . . . . . . . 1 6
Current assets . . . . . . . . . . . . . . . . . . . . . . . . . . . . . . . . . . . . . . . . . . . . . . . . . . . . . 56 170Property, plant and equipment, net . . . . . . . . . . . . . . . . . . . . . . . . . . . . . . . . . . . . . . . . 24 141Other assets . . . . . . . . . . . . . . . . . . . . . . . . . . . . . . . . . . . . . . . . . . . . . . . . . . . . . . . . . . 1 54
Non-current assets . . . . . . . . . . . . . . . . . . . . . . . . . . . . . . . . . . . . . . . . . . . . . . . . . 25 195Accounts payable . . . . . . . . . . . . . . . . . . . . . . . . . . . . . . . . . . . . . . . . . . . . . . . . . . . . . . 11 49Accrued expenses . . . . . . . . . . . . . . . . . . . . . . . . . . . . . . . . . . . . . . . . . . . . . . . . . . . . . . 12 42
Current liabilities . . . . . . . . . . . . . . . . . . . . . . . . . . . . . . . . . . . . . . . . . . . . . . . . . . 23 91Other long-term liabilities . . . . . . . . . . . . . . . . . . . . . . . . . . . . . . . . . . . . . . . . . . . . . . . 3 5
76

NOTES TO CONSOLIDATED FINANCIAL STATEMENTS—(Continued)
In connection with the sale of the media and entertainment packaging business in 2010, the sale of the Kraftbusiness in 2008, the sale of certain large-tract landholdings in 2007 and the sale of the printing and writingpapers business in 2005, the company provided certain guarantees and indemnities to the respective buyers andother parties. These obligations include both potential environmental matters as well as certain contracts withthird parties. The company has evaluated these guarantees and indemnifications, which did not result in amaterial impact on the company’s consolidated financial statements. The total aggregate exposure to thecompany for these matters could be up to about $53 million; however, the company currently considers there tobe a remote possibility of being required to make any payments related to these guarantees.
S. Cash flows
Changes in current assets and liabilities, net of acquisitions and dispositions, were as follows:
In millions
Years ended December 31,
2010 2009 2008
(Increase) decrease in:Receivables . . . . . . . . . . . . . . . . . . . . . . . . . . . . . . . . . . . . . . . . . . . . . . . . . . . . . . . . . . $ (39) $ (33) $ 87Inventories . . . . . . . . . . . . . . . . . . . . . . . . . . . . . . . . . . . . . . . . . . . . . . . . . . . . . . . . . . . (110) 124 (3)Prepaid expenses . . . . . . . . . . . . . . . . . . . . . . . . . . . . . . . . . . . . . . . . . . . . . . . . . . . . . . 18 7 1
Increase (decrease) in:Accounts payable and accrued expenses . . . . . . . . . . . . . . . . . . . . . . . . . . . . . . . . . . . . 46 130 (73)Income taxes payable . . . . . . . . . . . . . . . . . . . . . . . . . . . . . . . . . . . . . . . . . . . . . . . . . . . 39 (53) 5
$ (46) $175 $ 17
Cash paid for:Interest . . . . . . . . . . . . . . . . . . . . . . . . . . . . . . . . . . . . . . . . . . . . . . . . . . . . . . . . . . . . . . $ 172 $197 $195
Less capitalized interest . . . . . . . . . . . . . . . . . . . . . . . . . . . . . . . . . . . . . . . . . . . . . (2) (3) (3)
Interest paid, net . . . . . . . . . . . . . . . . . . . . . . . . . . . . . . . . . . . . . . . . . . . . . . . . . . . . . . . $ 170 $194 $192
Income tax (refund) paid, net . . . . . . . . . . . . . . . . . . . . . . . . . . . . . . . . . . . . . . . . . . . . . $ (29) $ 69 $ 78
T. Segment information
MWV’s segments are (i) Packaging Resources, (ii) Consumer Solutions, (iii) Consumer & Office Products,(iv) Specialty Chemicals, and (v) Community Development and Land Management.
The Packaging Resources segment produces paperboard used in packaging for food, beverage, tobacco,healthcare, and beauty and personal care markets. This segment’s products include bleached paperboard (“SBS”)and Coated Natural Kraft® paperboard (“CNK®”) that are manufactured at three mills located in the U.S. andcorrugated packaging that is manufactured at two mills located in Brazil. SBS is used for packaging high-valueconsumer products including frozen and dry food, aseptic liquid packaging, disposable cups, tobacco, cosmeticsand pharmaceuticals. CNK® is used for a range of packaging applications, the largest of which for MWV ismulti-pack beverage packaging and food packaging. MWV’s corrugated packaging business is focused on freshproduce, frozen meat and consumer products markets in South America.
The Consumer Solutions segment designs and produces packaging solutions and systems for the food,beverage, tobacco, beauty and personal care, healthcare, and home and garden markets. This segment manufacturesmulti-pack cartons primarily for the global beverage take-home market, high-end packaging for the global tobaccomarket, injection-molded plastic packaging for prescription drugs, and dispensing and sprayer systems for personalcare, fragrance, healthcare, home cleaning, and garden and lawn maintenance products. Paperboard and plastic areconverted into packaging products at plants located in North America, South America, Europe and Asia. Thissegment also has pharmaceutical packaging contracts with retailers, including mass-merchants. In addition, thissegment manufactures equipment that is leased or sold to its beverage and dairy customers to package their
77
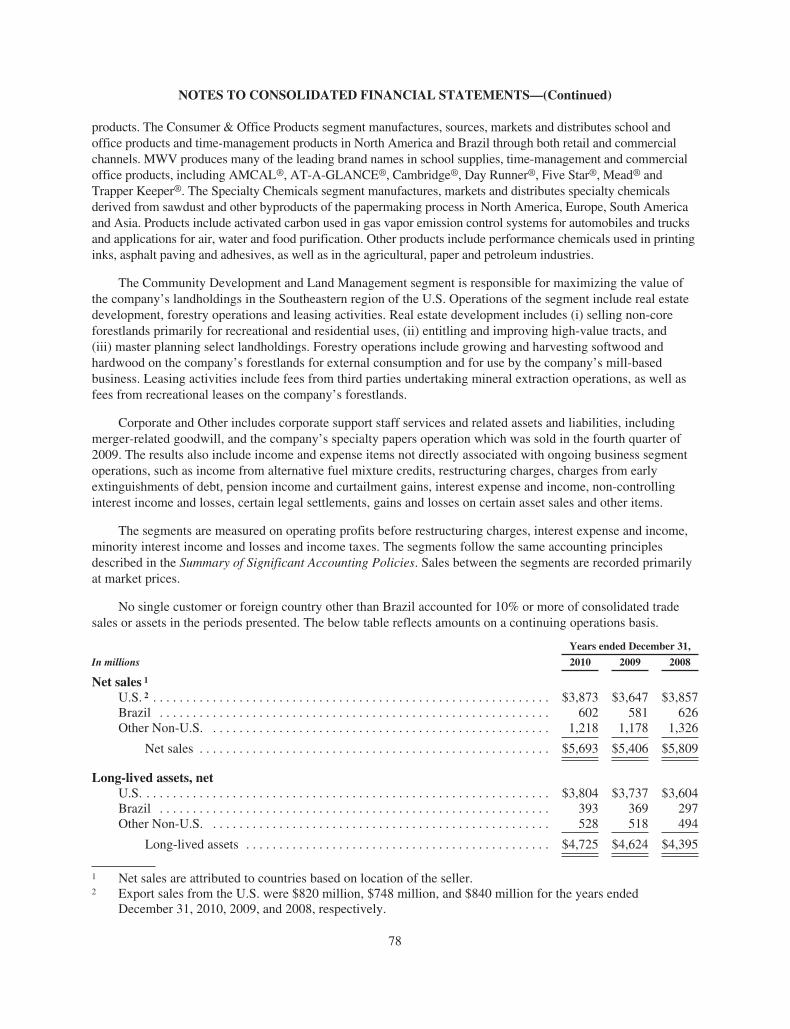
NOTES TO CONSOLIDATED FINANCIAL STATEMENTS—(Continued)
products. The Consumer & Office Products segment manufactures, sources, markets and distributes school andoffice products and time-management products in North America and Brazil through both retail and commercialchannels. MWV produces many of the leading brand names in school supplies, time-management and commercialoffice products, including AMCAL®, AT-A-GLANCE®, Cambridge®, Day Runner®, Five Star®, Mead® andTrapper Keeper®. The Specialty Chemicals segment manufactures, markets and distributes specialty chemicalsderived from sawdust and other byproducts of the papermaking process in North America, Europe, South Americaand Asia. Products include activated carbon used in gas vapor emission control systems for automobiles and trucksand applications for air, water and food purification. Other products include performance chemicals used in printinginks, asphalt paving and adhesives, as well as in the agricultural, paper and petroleum industries.
The Community Development and Land Management segment is responsible for maximizing the value ofthe company’s landholdings in the Southeastern region of the U.S. Operations of the segment include real estatedevelopment, forestry operations and leasing activities. Real estate development includes (i) selling non-coreforestlands primarily for recreational and residential uses, (ii) entitling and improving high-value tracts, and(iii) master planning select landholdings. Forestry operations include growing and harvesting softwood andhardwood on the company’s forestlands for external consumption and for use by the company’s mill-basedbusiness. Leasing activities include fees from third parties undertaking mineral extraction operations, as well asfees from recreational leases on the company’s forestlands.
Corporate and Other includes corporate support staff services and related assets and liabilities, includingmerger-related goodwill, and the company’s specialty papers operation which was sold in the fourth quarter of2009. The results also include income and expense items not directly associated with ongoing business segmentoperations, such as income from alternative fuel mixture credits, restructuring charges, charges from earlyextinguishments of debt, pension income and curtailment gains, interest expense and income, non-controllinginterest income and losses, certain legal settlements, gains and losses on certain asset sales and other items.
The segments are measured on operating profits before restructuring charges, interest expense and income,minority interest income and losses and income taxes. The segments follow the same accounting principlesdescribed in the Summary of Significant Accounting Policies. Sales between the segments are recorded primarilyat market prices.
No single customer or foreign country other than Brazil accounted for 10% or more of consolidated tradesales or assets in the periods presented. The below table reflects amounts on a continuing operations basis.
Years ended December 31,
In millions 2010 2009 2008
Net sales 1
U.S. 2 . . . . . . . . . . . . . . . . . . . . . . . . . . . . . . . . . . . . . . . . . . . . . . . . . . . . . . . . . . . . $3,873 $3,647 $3,857Brazil . . . . . . . . . . . . . . . . . . . . . . . . . . . . . . . . . . . . . . . . . . . . . . . . . . . . . . . . . . . 602 581 626Other Non-U.S. . . . . . . . . . . . . . . . . . . . . . . . . . . . . . . . . . . . . . . . . . . . . . . . . . . . 1,218 1,178 1,326
Net sales . . . . . . . . . . . . . . . . . . . . . . . . . . . . . . . . . . . . . . . . . . . . . . . . . . . . . $5,693 $5,406 $5,809
Long-lived assets, netU.S. . . . . . . . . . . . . . . . . . . . . . . . . . . . . . . . . . . . . . . . . . . . . . . . . . . . . . . . . . . . . . $3,804 $3,737 $3,604Brazil . . . . . . . . . . . . . . . . . . . . . . . . . . . . . . . . . . . . . . . . . . . . . . . . . . . . . . . . . . . 393 369 297Other Non-U.S. . . . . . . . . . . . . . . . . . . . . . . . . . . . . . . . . . . . . . . . . . . . . . . . . . . . 528 518 494
Long-lived assets . . . . . . . . . . . . . . . . . . . . . . . . . . . . . . . . . . . . . . . . . . . . . . $4,725 $4,624 $4,395
1 Net sales are attributed to countries based on location of the seller.2 Export sales from the U.S. were $820 million, $748 million, and $840 million for the years ended
December 31, 2010, 2009, and 2008, respectively.
78
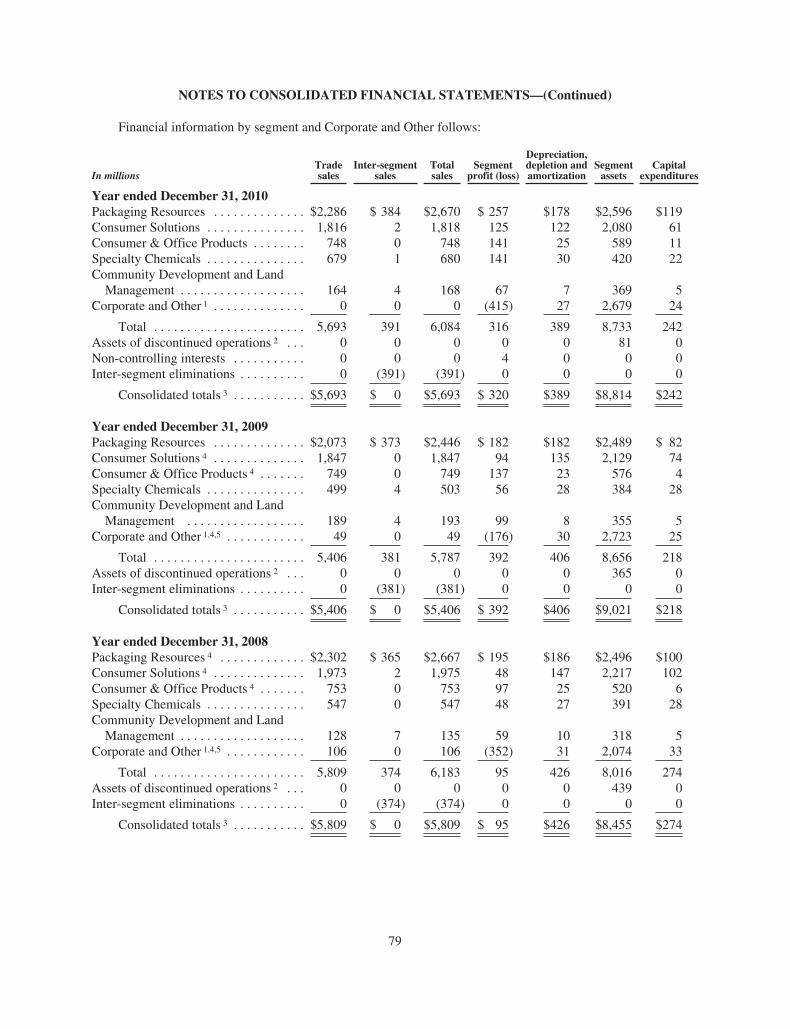
NOTES TO CONSOLIDATED FINANCIAL STATEMENTS—(Continued)
Financial information by segment and Corporate and Other follows:
In millionsTradesales
Inter-segmentsales
Totalsales
Segmentprofit (loss)
Depreciation,depletion andamortization
Segmentassets
Capitalexpenditures
Year ended December 31, 2010Packaging Resources . . . . . . . . . . . . . . $2,286 $ 384 $2,670 $ 257 $178 $2,596 $119Consumer Solutions . . . . . . . . . . . . . . . 1,816 2 1,818 125 122 2,080 61Consumer & Office Products . . . . . . . . 748 0 748 141 25 589 11Specialty Chemicals . . . . . . . . . . . . . . . 679 1 680 141 30 420 22Community Development and LandManagement . . . . . . . . . . . . . . . . . . . 164 4 168 67 7 369 5
Corporate and Other 1 . . . . . . . . . . . . . . 0 0 0 (415) 27 2,679 24
Total . . . . . . . . . . . . . . . . . . . . . . . 5,693 391 6,084 316 389 8,733 242Assets of discontinued operations 2 . . . 0 0 0 0 0 81 0Non-controlling interests . . . . . . . . . . . 0 0 0 4 0 0 0Inter-segment eliminations . . . . . . . . . . 0 (391) (391) 0 0 0 0
Consolidated totals 3 . . . . . . . . . . . $5,693 $ 0 $5,693 $ 320 $389 $8,814 $242
Year ended December 31, 2009Packaging Resources . . . . . . . . . . . . . . $2,073 $ 373 $2,446 $ 182 $182 $2,489 $ 82Consumer Solutions 4 . . . . . . . . . . . . . . 1,847 0 1,847 94 135 2,129 74Consumer & Office Products 4 . . . . . . . 749 0 749 137 23 576 4Specialty Chemicals . . . . . . . . . . . . . . . 499 4 503 56 28 384 28Community Development and LandManagement . . . . . . . . . . . . . . . . . . 189 4 193 99 8 355 5
Corporate and Other 1,4,5 . . . . . . . . . . . . 49 0 49 (176) 30 2,723 25
Total . . . . . . . . . . . . . . . . . . . . . . . 5,406 381 5,787 392 406 8,656 218Assets of discontinued operations 2 . . . 0 0 0 0 0 365 0Inter-segment eliminations . . . . . . . . . . 0 (381) (381) 0 0 0 0
Consolidated totals 3 . . . . . . . . . . . $5,406 $ 0 $5,406 $ 392 $406 $9,021 $218
Year ended December 31, 2008Packaging Resources 4 . . . . . . . . . . . . . $2,302 $ 365 $2,667 $ 195 $186 $2,496 $100Consumer Solutions 4 . . . . . . . . . . . . . . 1,973 2 1,975 48 147 2,217 102Consumer & Office Products 4 . . . . . . . 753 0 753 97 25 520 6Specialty Chemicals . . . . . . . . . . . . . . . 547 0 547 48 27 391 28Community Development and LandManagement . . . . . . . . . . . . . . . . . . . 128 7 135 59 10 318 5
Corporate and Other 1,4,5 . . . . . . . . . . . . 106 0 106 (352) 31 2,074 33
Total . . . . . . . . . . . . . . . . . . . . . . . 5,809 374 6,183 95 426 8,016 274Assets of discontinued operations 2 . . . 0 0 0 0 0 439 0Inter-segment eliminations . . . . . . . . . . 0 (374) (374) 0 0 0 0
Consolidated totals 3 . . . . . . . . . . . $5,809 $ 0 $5,809 $ 95 $426 $8,455 $274
79
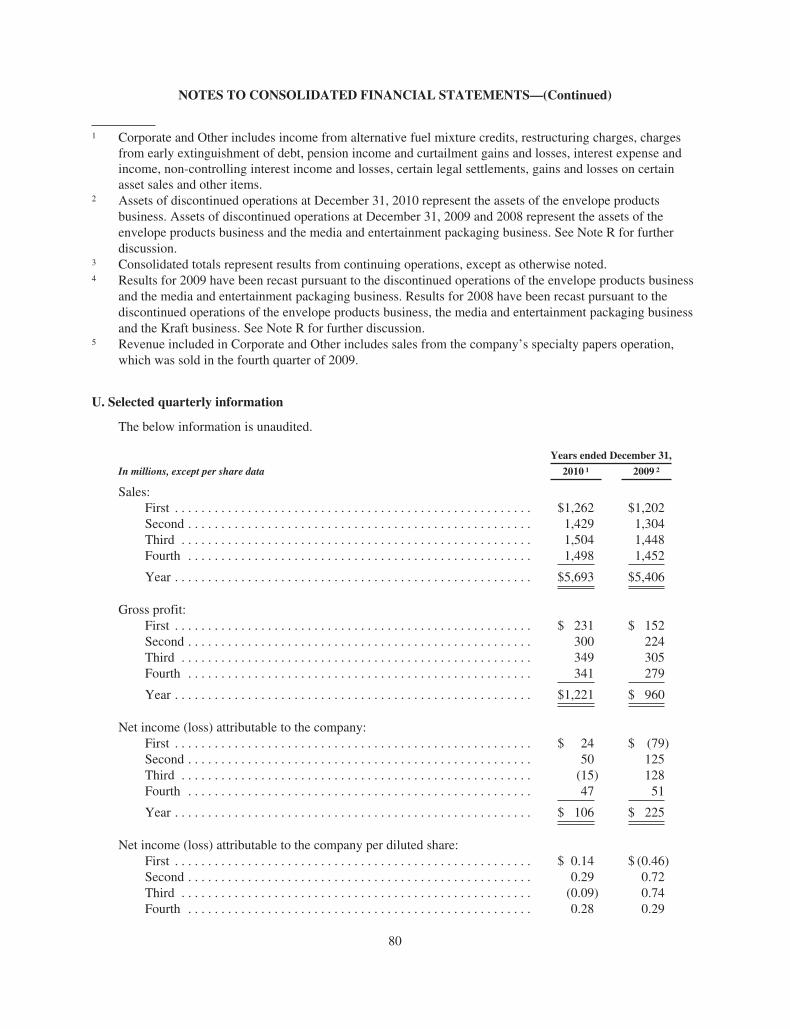
NOTES TO CONSOLIDATED FINANCIAL STATEMENTS—(Continued)
1 Corporate and Other includes income from alternative fuel mixture credits, restructuring charges, chargesfrom early extinguishment of debt, pension income and curtailment gains and losses, interest expense andincome, non-controlling interest income and losses, certain legal settlements, gains and losses on certainasset sales and other items.
2 Assets of discontinued operations at December 31, 2010 represent the assets of the envelope productsbusiness. Assets of discontinued operations at December 31, 2009 and 2008 represent the assets of theenvelope products business and the media and entertainment packaging business. See Note R for furtherdiscussion.
3 Consolidated totals represent results from continuing operations, except as otherwise noted.4 Results for 2009 have been recast pursuant to the discontinued operations of the envelope products business
and the media and entertainment packaging business. Results for 2008 have been recast pursuant to thediscontinued operations of the envelope products business, the media and entertainment packaging businessand the Kraft business. See Note R for further discussion.
5 Revenue included in Corporate and Other includes sales from the company’s specialty papers operation,which was sold in the fourth quarter of 2009.
U. Selected quarterly information
The below information is unaudited.
Years ended December 31,
In millions, except per share data 2010 1 2009 2
Sales:First . . . . . . . . . . . . . . . . . . . . . . . . . . . . . . . . . . . . . . . . . . . . . . . . . . . . . . $1,262 $1,202Second . . . . . . . . . . . . . . . . . . . . . . . . . . . . . . . . . . . . . . . . . . . . . . . . . . . . 1,429 1,304Third . . . . . . . . . . . . . . . . . . . . . . . . . . . . . . . . . . . . . . . . . . . . . . . . . . . . . 1,504 1,448Fourth . . . . . . . . . . . . . . . . . . . . . . . . . . . . . . . . . . . . . . . . . . . . . . . . . . . . 1,498 1,452
Year . . . . . . . . . . . . . . . . . . . . . . . . . . . . . . . . . . . . . . . . . . . . . . . . . . . . . . $5,693 $5,406
Gross profit:First . . . . . . . . . . . . . . . . . . . . . . . . . . . . . . . . . . . . . . . . . . . . . . . . . . . . . . $ 231 $ 152Second . . . . . . . . . . . . . . . . . . . . . . . . . . . . . . . . . . . . . . . . . . . . . . . . . . . . 300 224Third . . . . . . . . . . . . . . . . . . . . . . . . . . . . . . . . . . . . . . . . . . . . . . . . . . . . . 349 305Fourth . . . . . . . . . . . . . . . . . . . . . . . . . . . . . . . . . . . . . . . . . . . . . . . . . . . . 341 279
Year . . . . . . . . . . . . . . . . . . . . . . . . . . . . . . . . . . . . . . . . . . . . . . . . . . . . . . $1,221 $ 960
Net income (loss) attributable to the company:First . . . . . . . . . . . . . . . . . . . . . . . . . . . . . . . . . . . . . . . . . . . . . . . . . . . . . . $ 24 $ (79)Second . . . . . . . . . . . . . . . . . . . . . . . . . . . . . . . . . . . . . . . . . . . . . . . . . . . . 50 125Third . . . . . . . . . . . . . . . . . . . . . . . . . . . . . . . . . . . . . . . . . . . . . . . . . . . . . (15) 128Fourth . . . . . . . . . . . . . . . . . . . . . . . . . . . . . . . . . . . . . . . . . . . . . . . . . . . . 47 51
Year . . . . . . . . . . . . . . . . . . . . . . . . . . . . . . . . . . . . . . . . . . . . . . . . . . . . . . $ 106 $ 225
Net income (loss) attributable to the company per diluted share:First . . . . . . . . . . . . . . . . . . . . . . . . . . . . . . . . . . . . . . . . . . . . . . . . . . . . . . $ 0.14 $ (0.46)Second . . . . . . . . . . . . . . . . . . . . . . . . . . . . . . . . . . . . . . . . . . . . . . . . . . . . 0.29 0.72Third . . . . . . . . . . . . . . . . . . . . . . . . . . . . . . . . . . . . . . . . . . . . . . . . . . . . . (0.09) 0.74Fourth . . . . . . . . . . . . . . . . . . . . . . . . . . . . . . . . . . . . . . . . . . . . . . . . . . . . 0.28 0.29
80
NOTES TO CONSOLIDATED FINANCIAL STATEMENTS—(Continued)
1 First quarter 2010 results include an income tax benefit of $10 million, or $0.06 per share, related tofavorable domestic tax audit settlements, after-tax restructuring charges of $3 million, or $0.02 per share,and an after-tax loss from discontinued operations of $5 million, or $0.03 per share. Second quarter 2010results include after-tax restructuring charges of $10 million, or $0.06 per share, and an after-tax loss fromdiscontinued operations of $6 million, or $0.03 per share. Third quarter 2010 results include an income taxbenefit from cellulosic biofuel producer credits of $15 million, or $0.09 per share, after-tax restructuringcharges of $10 million, or $0.06 per share, an after-tax charge of $4 million, or $0.02 per share, from earlyextinguishment of debt, and an after-tax loss from discontinued operations of $124 million, or $0.72 pershare. Fourth quarter 2010 results include after-tax restructuring charges of $12 million, or $0.07 per share,an after-tax gain of $5 million, or $0.03 per share, related to a pension curtailment, an income tax benefitfrom cellulosic biofuel producer credits of $5 million, or $0.03 per share, and an after-tax loss fromdiscontinued operations of $21 million, or $0.12 per share.
2 First quarter 2009 results include after-tax restructuring charges of $48 million, or $0.28 per share, and anafter-tax loss from discontinued operations of $14 million, or $0.08 per share. Second quarter 2009 resultsinclude after-tax income from alternative fuel mixture credits of $112 million, or $0.65 per share, after-taxrestructuring charges of $24 million, or $0.14 per share, and an after-tax loss from discontinued operationsof $6 million, or $0.03 per share. Third quarter 2009 results include after-tax income from alternative fuelmixture credits of $64 million, or $0.37 per share, after-tax restructuring charges of $27 million, or $0.15per share, after-tax income of $13 million, or $0.07 per share, from a change to employee vacation policy,an after-tax charge of $11 million, or $0.06 per share, from early extinguishment of debt, an after-tax gain of$4 million, or $0.02 per share, related to a pension curtailment and after-tax income from discontinuedoperations of $7 million, or $0.04 per share. Fourth quarter 2009 results include after-tax income fromalternative fuel mixture credits of $66 million, or $0.38 per share, tax charges of $32 million, or $0.18 pershare, related to domestic and foreign tax audits, after-tax restructuring charges of $13 million, or $0.08 pershare, an after-tax expense of $12 million, or $0.07 per share, from a contribution to the MeadWestvacoFoundation, after-tax gains of $12 million, or $0.07 per share, related to sales of certain assets, an after-taxcharge of $3 million, or $0.02 per share, from early extinguishment of debt, and an after-tax loss fromdiscontinued operations of $2 million, or $0.01 per share.
81
Item 9. Changes in and disagreements with accountants on accounting and financial disclosure
None.
Item 9A. Controls and procedures
Management’s report on internal control over financial reporting.
Management is responsible for establishing and maintaining adequate internal control over financialreporting for the company. In order to evaluate the effectiveness of internal control over financial reporting,management has conducted an assessment, including testing, using the criteria established in Internal Control—Integrated Framework issued by the Committee of Sponsoring Organizations of the Treadway Commission(“COSO”). The company’s internal control over financial reporting, as defined in Rule 13a-15(f) under theSecurities Exchange Act of 1934 (“Exchange Act”), is a process designed to provide reasonable assuranceregarding the reliability of our financial reporting and the preparation of financial statements for externalpurposes in accordance with generally accepted accounting principles. Because of its inherent limitations,internal control over financial reporting may not prevent or detect misstatements. Also, projections of anyevaluation of effectiveness to future periods are subject to the risk that controls may become inadequate becauseof changes in conditions, or that the degree of compliance with the policies or procedures may deteriorate.
Based on our assessment, under the criteria established in Internal Control—Integrated Framework, issuedby the COSO, management has concluded that the company maintained effective internal control over financialreporting as of December 31, 2010. In addition, the effectiveness of the company’s internal control over financialreporting as of December 31, 2010 has been audited by PricewaterhouseCoopers LLP, an independent registeredpublic accounting firm, as stated in their report which appears in Part II, Item 8.
Evaluation of the company’s disclosure controls and procedures.
As of the end of the period covered by this Annual Report on Form 10-K, we evaluated the effectiveness ofour “disclosure controls and procedures” (as defined in Rule 13a-15(e) of the Exchange Act). This evaluationwas conducted under the supervision and with the participation of management, including our Chief ExecutiveOfficer (“CEO”) and Chief Financial Officer (“CFO”). Based on the evaluation of disclosure controls andprocedures, our CEO and CFO have concluded that the disclosure controls and procedures were effective andoperating to the reasonable assurance level, as of December 31, 2010, to ensure that information required to bedisclosed in the reports that we file or submit under the Securities Exchange Act of 1934 have been accumulatedand communicated to management, including our CEO and CFO, and other persons responsible for preparingsuch reports to allow timely decisions regarding required disclosure and that it is recorded, processed,summarized and reported within the time periods specified in the SEC’s rules and forms.
Changes in internal control over financial reporting.
During the fiscal year ended December 31, 2010, there was no change in our internal control over financialreporting that has materially affected, or is reasonably likely to materially effect, our internal control overfinancial reporting.
Item 9B. Other information
None.
82
Part III
Item 10. Directors, executive officers and corporate governance
Information required by this item for MeadWestvaco’s directors will be contained in MeadWestvaco’s 2010Proxy Statement, pursuant to Regulation 14A under the sections captioned “Nominees for Election as Directors,”and “Board Committees,” to be filed with the SEC on or around March 17, 2011, and is incorporated herein byreference. A portion of the information required by this item for MeadWestvaco’s executive officers is alsocontained in Part I of this report under the caption “Executive officers of the registrant.”
Item 11. Executive compensation
Information required by this item will be contained in MeadWestvaco’s 2011 Proxy Statement, pursuant toRegulation 14A under the sections captioned “Executive Compensation,” “Compensation Discussion andAnalysis,” and “Director Compensation,” to be filed with the SEC on or around March 17, 2011, and isincorporated herein by reference.
Item 12. Security ownership of certain beneficial owners and management and related stockholder matters
Information required by this item will be contained in MeadWestvaco’s 2011 Proxy Statement, pursuant toRegulation 14A under the sections captioned “Equity Compensation Plan Information,” “Ownership of Directorsand Executive Officers,” and “Ownership of Certain Beneficial Owners,” to be filed with the SEC on or aroundMarch 17, 2011, and is incorporated herein by reference.
Item 13. Certain relationships and related transactions, and director independence
Information required by this item will be contained in MeadWestvaco’s 2011 Proxy Statement, pursuant toRegulation 14A under the section captioned “Board Committees,” to be filed with the SEC on or aroundMarch 17, 2011, and is incorporated herein by reference.
Item 14. Principal accounting fees and services
Information required by this item will be contained in MeadWestvaco’s 2011 Proxy Statement, pursuant toRegulation 14A under the section captioned “Report of the Audit Committee of the Board of Directors,” to befiled with the SEC on or around March 17, 2011, and is incorporated herein by reference.
83
Part IV
Item 15. Exhibits, financial statement schedules
(a) Documents filed as part of this report:
1. Consolidated financial statements
The consolidated financial statements of MeadWestvaco Corporation and consolidated subsidiaries arelisted in the index which is included in Part II, Item 8.
2. Consolidated financial statement schedules
All financial statement schedules have been omitted because they are inapplicable, not required, or shown inthe consolidated financial statements and notes thereto contained herein.
3. Exhibits
3.1 Amended and Restated Certificate of Incorporation of the Registrant, previously filed as Exhibit 99.1to the company’s Form 8-K on May 1, 2008, and incorporated herein by reference.
3.2 Amended and Restated By-laws of the Registrant dated October, 2008, previously filed as Exhibit 99.1to the company’s Form 8-K on December 15, 2009, and incorporated herein by reference.
4.1 Indenture dated as of April 2, 2002 by and among the Registrant, Westvaco Corporation, The MeadCorporation and The Bank of New York, as Trustee, previously filed as Exhibit 4(a) to thecompany’s Form 8-K on April 2, 2002 (SEC file number 001-31215), and incorporated herein byreference.
4.2 Form of Indenture, dated as of March 1, 1983, between Westvaco Corporation and The Bank of NewYork (formerly Irving Trust Company), as trustee, previously filed as Exhibit 2 to Westvaco’sRegistration Statement on Form 8-A on January 24, 1984 (SEC file number 001-03013), andincorporated herein by reference.
4.3 First Supplemental Indenture by and among Westvaco Corporation, the Registrant, The MeadCorporation and The Bank of New York dated January 31, 2002, previously filed as Exhibit 4.1 tothe company’s Form 8-K on February 1, 2002 (SEC file number 001-31215), and incorporatedherein by reference.
4.4 Second Supplemental Indenture between the Registrant and The Bank of New York datedDecember 31, 2002, previously filed as Exhibit 4.1 to the company’s Form 8-K on January 7, 2003(SEC file number 001-31215), and incorporated herein by reference.
4.5 Indenture dated as of February 1, 1993 between The Mead Corporation and The First National Bank ofChicago, as Trustee, previously filed as Exhibit 4.vv to the company’s Annual Report on Form 10-Kfor the Transition Period ended December 31, 2001, and incorporated herein by reference.
4.6 First Supplemental Indenture between The Mead Corporation, the Registrant, Westvaco Corporationand Bank One Trust Company, NA dated January 31, 2002, previously filed as Exhibit 4.3 to thecompany’s Form 8-K on February 1, 2002 (SEC file number 001-31215), and incorporated herein byreference.
4.7 Second Supplemental Indenture between MW Custom Papers, Inc. and Bank One Trust Company,NA dated December 31, 2002, previously filed as Exhibit 4.4 to the company’s Form 8-K onJanuary 7, 2003 (SEC file number 001-31215), and incorporated herein by reference.
84
4.8 Third Supplemental Indenture between the Registrant and Bank One Trust Company, NA datedDecember 31, 2002, previously filed as Exhibit 4.5 to the company’s Form 8-K on January 7, 2003(SEC file number 001-31215), and incorporated herein by reference.
4.11 $600 Million Three-Year Credit Agreement, dated as of October 19, 2009, among the Registrant with asyndicate of commercial banks, including Citibank, N.A., as administrative agent previously filed asExhibit 4.115 to the company’s Annual Report on Form 10-K for the year ended December 31, 2009,and incorporated herein by reference.
4.12 Form of 7.375% Note due in 2019, previously filed as Exhibit 4.1 to the company’s Form 8-K onAugust 25, 2009, and incorporated herein by reference.
10.2+ The Mead Corporation 1996 Stock Option Plan, as amended through June 24, 1999 and amendedFebruary 22, 2001, previously filed as Exhibit 10.3 to Mead’s Quarterly Report on Form 10-Q for theperiod ended July 4, 1999 (SEC file number 001-02267) and Appendix 2 to Mead’s definitive proxystatement for the 2001 Annual Meeting of Shareholders, and incorporated herein by reference.
10.3+ Amendment to The Mead Corporation 1996 Stock Option Plan, effective April 23, 2002, previouslyfiled as Exhibit 10.3 to the company’s Quarterly Report on Form 10-Q for the period ended June 30,2002, and incorporated herein by reference.
10.4+ Amendment to The Mead Corporation 1996 Stock Option Plan effective January 23, 2007, aspreviously filed as Exhibit 10.4 to the company’s Annual Report on Form 10-K for the year endedDecember 31, 2007, and incorporated herein by reference.
10.5+ 1985 Supplement to The Mead Corporation Incentive Compensation Election Plan, as amendedNovember 17, 1987, and as further amended October 29, 1988; as amended effective June 24, 1998;as amended effective October 26, 2001, previously filed as Exhibit 10.xxix to the company’s AnnualReport on Form 10-K for the Transition Period ended December 31, 2001, and incorporated hereinby reference.
10.6+ The Mead Corporation Supplemental Executive Retirement Plan effective January 1, 1997; as amendedeffective June 24, 1998; as amended effective August 28, 2001, previously filed as Exhibit 10.xxxii tothe company’s Annual Report on Form 10-K for the Transition Period ended December 31, 2001, andincorporated herein by reference.
10.7+ Third Amendment to The Mead Corporation Supplemental Executive Retirement Plan in whichexecutive officers participate, previously filed as Exhibit 10.1 to the company’s Quarterly Report onForm 10-Q for the period ended March 30, 2002 (SEC file number 001-31215), and incorporatedherein by reference.
10.8+ Benefit Trust Agreement dated August 27, 1996 between The Mead Corporation and Key TrustCompany of Ohio, N.A.; as amended effective June 24, 1998; as amended effective October 28, 2000;as amended effective June 28, 2001; as amended August 28, 2001, previously filed as Exhibit 10.xxxivto the company’s Annual Report on Form 10-K for the Transition Period ended December 31, 2001,and incorporated herein by reference.
10.12+ The Mead Corporation Deferred Compensation Plan for Directors, as amended through October 29,1988; as amended effective June 24, 1998; as amended effective October 26, 2001, previously filedas Exhibit 10.xxxvi to the company’s Annual Report on Form 10-K for the Transition Period endedDecember 31, 2001, and incorporated herein by reference.
10.13+ 1985 Supplement to The Mead Corporation Deferred Compensation Plan for Directors, as amendedthrough October 29, 1988; as amended effective June 24, 1998; as amended effective October 26,2001, previously filed as Exhibit 10.xxxvii to the company’s Annual Report on Form 10-K for theTransition Period ended December 31, 2001, and incorporated herein by reference.
85

10.14+ The Mead Corporation Directors Capital Accumulation Plan as Amended and Restated effectiveJanuary 1, 2000; as amended effective October 26, 2001, previously filed as Exhibit 10.xxxviii to thecompany’s Annual Report on Form 10-K for the Transition Period ended December 31, 2001, andincorporated herein by reference.
10.15+ Westvaco Corporation 1995 Salaried Employee Stock Incentive Plan, effective February 28, 1995,previously filed at Exhibit 99 to Westvaco’s Registration Statement on Form S-8 on February 28,1995, and incorporated herein by reference.
10.16+ Amendment to Westvaco Corporation 1995 Salaried Employee Stock Incentive Plan, effectiveApril 23, 2002, previously filed as Exhibit 10-2 to the company’s Quarterly Report on Form 10-Q forthe period ended June 30, 2002 (SEC file number 001-31215), and incorporated herein by reference.
10.17+ Westvaco Corporation 1999 Salaried Employee Stock Incentive Plan, effective September 17, 1999,previously filed as Appendix A to Westvaco’s definitive proxy statement for the 1999 AnnualMeeting of Shareholders (SEC file number 001-03013), and incorporated herein by reference.
10.18+ Amendment to Westvaco Corporation 1999 Salaried Employee Stock Incentive Plan effective as ofApril 23, 2002, previously filed as Exhibit 10.1 to the company’s Quarterly Report on Form 10-Q forthe period ended June 30, 2002 (SEC file number 001-31215), and incorporated herein by reference.
10.19+ Amendment to Westvaco Corporation 1999 Salaried Employee Stock Incentive Plan effectiveJanuary 23, 2007, as previously filed as Exhibit 10.19 to the company’s Annual Report on Form 10-Kfor the year ended December 31, 2007, and incorporated herein by reference.
10.20+ MeadWestvaco Corporation Compensation Plan for Non-Employee Directors as Amended andRestated effective January 1, 2009 except as otherwise provided, previously filed as Exhibit 10.20 tothe company’s Annual Report on Form 10-K for the year ended December 31, 2008, andincorporated herein by reference.
10.21 Equity and Asset Purchase Agreement dated as of January 14, 2005 between the Registrant andMaple Acquisition LLC, previously filed as Exhibit 99.1 on the company’s Form 8-K on January 21,2005, for the sale of its papers business and associated assets, and incorporated herein by reference.
10.22+ MeadWestvaco Corporation 2005 Performance Incentive Plan effective April 22, 2005 and asamended February 26, 2007 and January 1, 2009 previously filed as Exhibit 10.1 to the company’sForm 8-K on April 30, 2009, and incorporated herein by reference.
10.23+ MeadWestvaco Corporation Executive Retirement Plan, as amended and restated effective January 1,2009 except as otherwise provided, previously filed as Exhibit 10.24 to the company’s AnnualReport on Form 10-K for the year ended December 31, 2008, and incorporated herein by reference.
10.24+ MeadWestvaco Corporation Deferred Income Plan Restatement effective January 1, 2007 except asotherwise provided, previously filed as Exhibit 10.25 to the company’s Annual Report on Form 10-Kfor the year ended December 31, 2008, and incorporated herein by reference.
10.25+ MeadWestvaco Corporation Retirement Restoration Plan effective January 1, 2009, except asotherwise provided, previously filed as Exhibit 10.26 to the company’s Annual Report on Form 10-Kfor the year ended December 31, 2008, and incorporated herein by reference.
10.26+ MeadWestvaco Corporation Compensation Program for Non-Employee Directors effective April 26,2010, previously filed as Exhibit 10.27 to the company’s Annual Report on Form 10-K for the yearended December 31, 2009, and incorporated herein by reference.
10.27+ Form of Employment Agreement dated January 1, 2008, for Mark T. Watkins, as previously filed asExhibit 10.33 to the company’s Annual Report on Form 10-K for the year ended December 31, 2007,and incorporated herein by reference.
86
10.28 Form of Employment Agreement dated January 1, 2008, for John A. Luke, Jr., James A. Buzzard, E.Mark Rajkowski and Wendell L. Willkie, II, as previously filed as Exhibit 10.32 to the company’sAnnual Report on Form 10-K for the year ended December 31, 2007, and incorporated herein byreference.
10.29+ Amendments to The Mead Corporation Incentive Compensation Election Plan, The MeadCorporation Deferred Compensation Plan for Directors, The Mead Corporation Directors CapitalAccumulation Plan, Westvaco Corporation Deferred Compensation Plan, Westvaco CorporationSavings and Investment Restoration Plan, Westvaco Corporation Deferred Compensation Plan forNon-Employee Outside Directors, and Westvaco Corporation Retirement Plan for Outside Directors,previously filed as Exhibit 10.30 to the company’s Annual Report on Form 10-K for the year endedDecember 31, 2008, and incorporated herein by reference.
10.30+ Westvaco Corporation Retirement Plan for Outside Directors, as previously filed as Exhibit 10.i tothe company’s Annual Report on Form 10-K for the year ended October 31, 1996, and incorporatedherein by reference.
10.31+ Summary of MeadWestvaco Corporation Long-Term Incentive Plan under 2005 PerformanceIncentive Plan, as amended, previously filed as Exhibit 10.31 to the company’s Annual Report onForm 10-K for the year ended December 31, 2008, and incorporated herein by reference.
10.32+ Summary of MeadWestvaco Corporation Annual Incentive Plan under 2005 Performance IncentivePlan, as amended, previously filed as Exhibit 10.32 to the company’s Annual Report on Form 10-Kfor the year ended December 31, 2008, and incorporated herein by reference.
10.33+ Summary of MeadWestvaco Corporation 2010 Long-Term Incentive Plan under the 2005Performance Plan, as amended, previously filed as Exhibit 10.35 to the company’s Quarterly Reporton Form 10-Q for the period ended March 21, 2010, and incorporated herein by reference.
10.34+ Summary of MeadWestvaco Corporation 2010 Annual Incentive Plan under the 2005 PerformanceIncentive Plan, as amended previously filed as Exhibit 10.35 to the company’s Annual Report onForm 10-K for the year ended December 31, 2009, and incorporated herein by reference.
10.35+ Stock Option Awards in 2009—Terms and Conditions, previously filed as Exhibit 10.3 to thecompany’s Quarterly Report on Form 10-Q for the period ended March 31, 2009, and incorporatedherein by reference.
10.36+ Service Based Restricted Stock Unit Awards in 2009—Terms and Conditions, previously filed asExhibit 10.4 to the company’s Quarterly Report on Form 10-Q for the period ended March 31, 2009,and incorporated herein by reference.
10.37+* MeadWestvaco Corporation Compensation Program for Non-Employee Directors effective April 18,2011.
21.* Subsidiaries of the Registrant.
23.1* Consent of PricewaterhouseCoopers LLP.
31.1* Rule 13a-14(a) Certification by Chief Executive Officer.
31.2* Rule 13a-14(a) Certification by Chief Financial Officer.
32.1* Section 1350 Certification by Chief Executive Officer.
32.2* Section 1350 Certification by Chief Financial Officer.
* Filed herewith.+ Management contract or compensatory plan or arrangement.
We agree to furnish copies of other instruments defining the rights of holders of long-term debt to theCommission upon its request.
87
SIGNATURES
Pursuant to the requirements of Section 13 or 15(d) of the Securities Exchange Act of 1934, the registranthas duly caused this report to be signed on its behalf by the undersigned, thereunto duly authorized.
MEADWESTVACO CORPORATION(Registrant)
February 28, 2011/s/ E. MARK RAJKOWSKI
Name: E. Mark Rajkowski
Title: Chief Financial Officer
88
Pursuant to the requirements of the Securities Exchange Act of 1934, this report has been signed below bythe following persons on behalf of the registrant and in the capacities and on the dates indicated.
Signatures Title Date
/s/ JOHN A. LUKE, JR.John A. Luke, Jr.
Chairman of the Board of Directorsand Chief Executive Officer(Principal Executive Officer andDirector)
February 28, 2011
/s/ E. MARK RAJKOWSKI
E. Mark Rajkowski
Senior Vice President(Chief Financial Officer)
February 28, 2011
/s/ JOHN E. BANU
John E. Banu
Vice President and Controller(Principal Accounting Officer)
February 28, 2011
/s/ MICHAEL E. CAMPBELL
Michael E. Campbell
Director February 28, 2011
/s/ DR. THOMAS W. COLE, JR.Dr. Thomas W. Cole, Jr.
Director February 28, 2011
/s/ JAMES G. KAISER
James G. Kaiser
Director February 28, 2011
/s/ RICHARD B. KELSON
Richard B. Kelson
Director February 28, 2011
/s/ JAMES M. KILTS
James M. Kilts
Director February 28, 2011
/s/ SUSAN J. KROPF
Susan J. Kropf
Director February 28, 2011
/s/ DOUGLAS S. LUKEDouglas S. Luke
Director February 28, 2011
/s/ ROBERT C. MCCORMACK
Robert C. McCormack
Director February 28, 2011
/s/ TIMOTHY H. POWERS
Timothy H. Powers
Director February 28, 2011
/s/ EDWARD M. STRAWEdward M. Straw
Director February 28, 2011
/s/ JANE L. WARNER
Jane L. Warner
Director February 28, 2011
89
[THIS PAGE INTENTIONALLY LEFT BLANK]
90
EXHIBIT 31.1
CERTIFICATION
I, John A. Luke, Jr. certify that:
1. I have reviewed this annual report on Form 10-K of MeadWestvaco Corporation;
2. Based on my knowledge, this report does not contain any untrue statement of a material fact or omit to statea material fact necessary to make the statements made, in light of the circumstances under which suchstatements were made, not misleading with respect to the period covered by this report;
3. Based on my knowledge, the financial statements, and other financial information included in this report,fairly present in all material respects the financial condition, results of operations and cash flows of theregistrant as of, and for, the periods presented in this report;
4. The registrant’s other certifying officer(s) and I are responsible for establishing and maintaining disclosurecontrols and procedures (as defined in Exchange Act Rules 13a-15(e) and 15d-15(e)) and internal controlover financial reporting (as defined in Exchange Act Rules 13a-15(f) and 15d-15(f)) for the registrant andhave:
(a) Designed such disclosure controls and procedures, or caused such disclosure controls and procedures tobe designed under our supervision, to ensure that material information relating to the registrant,including its consolidated subsidiaries, is made known to us by others within those entities, particularlyduring the period in which this report is being prepared;
(b) Designed such internal control over financial reporting, or caused such internal control over financialreporting to be designed under our supervision, to provide reasonable assurance regarding thereliability of financial reporting and the preparation of financial statements for external purposes inaccordance with generally accepted accounting principles;
(c) Evaluated the effectiveness of the registrant’s disclosure controls and procedures and presented in thisreport our conclusions about the effectiveness of the disclosure controls and procedures, as of the endof the period covered by this report based on such evaluation; and
(d) Disclosed in this report any change in the registrant’s internal control over financial reporting thatoccurred during the registrant’s most recent fiscal quarter (the registrant’s fourth fiscal quarter in thecase of an annual report) that has materially affected, or is reasonably likely to materially affect, theregistrant’s internal control over financial reporting; and
5. The registrant’s other certifying officer(s) and I have disclosed, based on our most recent evaluation ofinternal control over financial reporting, to the registrant’s auditors and the audit committee of theregistrant’s board of directors (or persons performing the equivalent functions):
(a) All significant deficiencies and material weaknesses in the design or operation of internal control overfinancial reporting which are reasonably likely to adversely affect the registrant’s ability to record,process, summarize and report financial information; and
(b) Any fraud, whether or not material, that involves management or other employees who have asignificant role in the registrant’s internal control over financial reporting.
Date: February 28, 2011
/s/ JOHN A. LUKE, JR.
Name: John A. Luke, Jr.
Title: Chief Executive Officer
91
EXHIBIT 31.2
CERTIFICATION
I, E. Mark Rajkowski certify that:
1. I have reviewed this annual report on Form 10-K of MeadWestvaco Corporation;
2. Based on my knowledge, this report does not contain any untrue statement of a material fact or omit to statea material fact necessary to make the statements made, in light of the circumstances under which suchstatements were made, not misleading with respect to the period covered by this report;
3. Based on my knowledge, the financial statements, and other financial information included in this report,fairly present in all material respects the financial condition, results of operations and cash flows of theregistrant as of, and for, the periods presented in this report;
4. The registrant’s other certifying officer(s) and I are responsible for establishing and maintaining disclosurecontrols and procedures (as defined in Exchange Act Rules 13a-15(e) and 15d-15(e)) and internal controlover financial reporting (as defined in Exchange Act Rules 13a-15(f) and 15d-15(f)) for the registrant andhave:
(a) Designed such disclosure controls and procedures, or caused such disclosure controls and procedures tobe designed under our supervision, to ensure that material information relating to the registrant,including its consolidated subsidiaries, is made known to us by others within those entities, particularlyduring the period in which this report is being prepared;
(b) Designed such internal control over financial reporting, or caused such internal control over financialreporting to be designed under our supervision, to provide reasonable assurance regarding thereliability of financial reporting and the preparation of financial statements for external purposes inaccordance with generally accepted accounting principles;
(c) Evaluated the effectiveness of the registrant’s disclosure controls and procedures and presented in thisreport our conclusions about the effectiveness of the disclosure controls and procedures, as of the endof the period covered by this report based on such evaluation; and
(d) Disclosed in this report any change in the registrant’s internal control over financial reporting thatoccurred during the registrant’s most recent fiscal quarter (the registrant’s fourth fiscal quarter in thecase of an annual report) that has materially affected, or is reasonably likely to materially affect, theregistrant’s internal control over financial reporting; and
5. The registrant’s other certifying officer(s) and I have disclosed, based on our most recent evaluation ofinternal control over financial reporting, to the registrant’s auditors and the audit committee of theregistrant’s board of directors (or persons performing the equivalent functions):
(a) All significant deficiencies and material weaknesses in the design or operation of internal control overfinancial reporting which are reasonably likely to adversely affect the registrant’s ability to record,process, summarize and report financial information; and
(b) Any fraud, whether or not material, that involves management or other employees who have asignificant role in the registrant’s internal control over financial reporting.
Date: February 28, 2011
/s/ E. MARK RAJKOWSKI
Name: E. Mark Rajkowski
Title: Chief Financial Officer
92
EXHIBIT 32.1
CERTIFICATION PURSUANT TO18 U.S.C. SECTION 1350,
AS ADOPTED PURSUANT TOSECTION 906 OF THE SARBANES-OXLEY ACT OF 2002
The undersigned hereby certifies, in his capacity as an officer of MeadWestvaco Corporation (the“Company”), for purposes of 18 U.S.C. Section 1350, as adopted pursuant to Section 906 of the Sarbanes-OxleyAct of 2002, that:
• the Annual Report of the Company on Form 10-K for the period ended December 31, 2010 fullycomplies with the requirements of Section 13(a) or 15 (d) of the Securities Exchange Act of 1934; and
• the information contained in such report fairly presents, in all material respects, the financial conditionand results of operations of the Company.
Date: February 28, 2011
/s/ JOHN A. LUKE, JR.
Name: John A. Luke, Jr.
Title: Chief Executive Officer
93
EXHIBIT 32.2
CERTIFICATION PURSUANT TO18 U.S.C. SECTION 1350,
AS ADOPTED PURSUANT TOSECTION 906 OF THE SARBANES-OXLEY ACT OF 2002
The undersigned hereby certifies, in his capacity as an officer of MeadWestvaco Corporation (the“Company”), for purposes of 18 U.S.C. Section 1350, as adopted pursuant to Section 906 of the Sarbanes-OxleyAct of 2002, that:
• the Annual Report of the Company on Form 10-K for the period ended December 31, 2010 fullycomplies with the requirements of Section 13(a) or 15(d) of the Securities Exchange Act of 1934; and
• the information contained in such report fairly presents, in all material respects, the financial conditionand results of operations of the Company.
Date: February 28, 2011
/s/ E. MARK RAJKOWSKI
Name: E. Mark Rajkowski
Title: Chief Financial Officer
94
[THIS PAGE INTENTIONALLY LEFT BLANK]
95
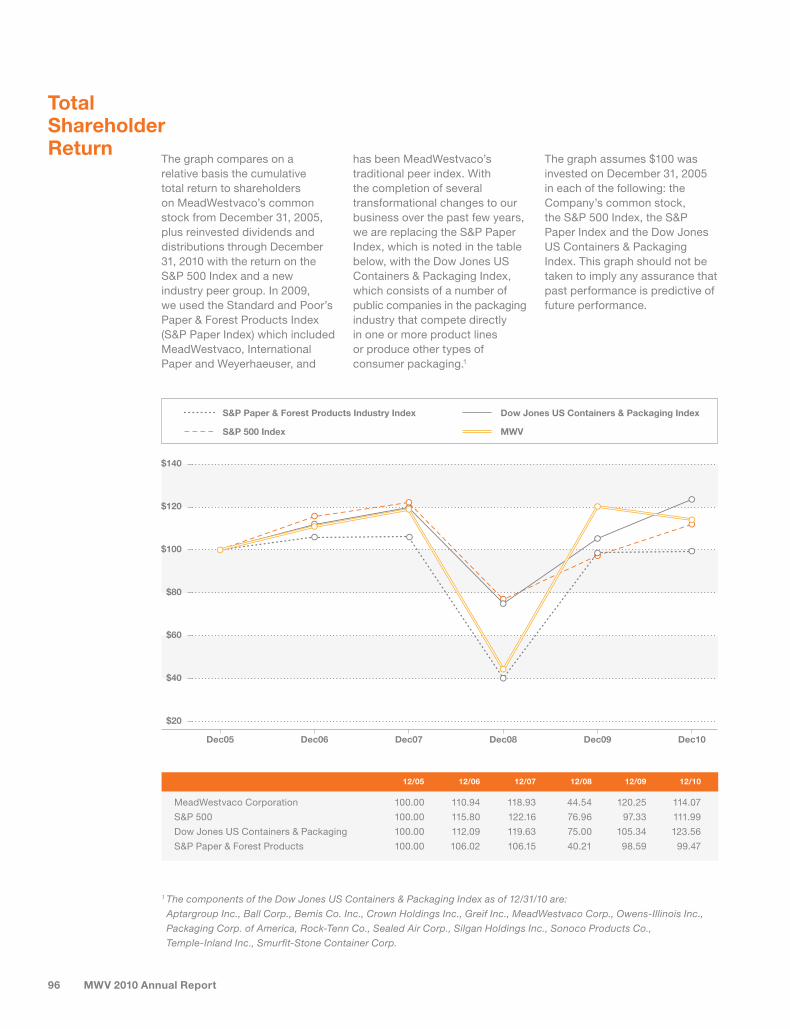
MWV 2010 Annual Report96
TotalShareholderReturn
1 The components of the Dow Jones US Containers & Packaging Index as of 12/31/10 are:
Aptargroup Inc., Ball Corp., Bemis Co. Inc., Crown Holdings Inc., Greif Inc., MeadWestvaco Corp., Owens-Illinois Inc.,
Packaging Corp. of America, Rock-Tenn Co., Sealed Air Corp., Silgan Holdings Inc., Sonoco Products Co.,
Temple-Inland Inc., Smurfi t-Stone Container Corp.
The graph compares on a
relative basis the cumulative
total return to shareholders
on MeadWestvaco’s common
stock from December 31, 2005,
plus reinvested dividends and
distributions through December
31, 2010 with the return on the
S&P 500 Index and a new
industry peer group. In 2009,
we used the Standard and Poor’s
Paper & Forest Products Index
(S&P Paper Index) which included
MeadWestvaco, International
Paper and Weyerhaeuser, and
has been MeadWestvaco’s
traditional peer index. With
the completion of several
transformational changes to our
business over the past few years,
we are replacing the S&P Paper
Index, which is noted in the table
below, with the Dow Jones US
Containers & Packaging Index,
which consists of a number of
public companies in the packaging
industry that compete directly
in one or more product lines
or produce other types of
consumer packaging.1
The graph assumes $100 was
invested on December 31, 2005
in each of the following: the
Company’s common stock,
the S&P 500 Index, the S&P
Paper Index and the Dow Jones
US Containers & Packaging
Index. This graph should not be
taken to imply any assurance that
past performance is predictive of
future performance.
12/05 12/06 12/07 12/08 12/09 12/10
MeadWestvaco Corporation 100.00 110.94 118.93 44.54 120.25 114.07
S&P 500 100.00 115.80 122.16 76.96 97.33 111.99
Dow Jones US Containers & Packaging 100.00 112.09 119.63 75.00 105.34 123.56
S&P Paper & Forest Products 100.00 106.02 106.15 40.21 98.59 99.47
MWV 2010 Annual Report 97
Board ofDirectors
John A. Luke, Jr.Chairman and
Chief Executive Offi cer
MeadWestvaco Corporation
Michael E. CampbellChairman, President and
Chief Executive Offi cer
Arch Chemicals, Inc.
Dr. Thomas W. Cole, Jr.President Emeritus
Clark Atlanta University
James G. KaiserChairman, Director and
Chief Executive Offi cer
Avenir Partners, Inc.
Richard B. KelsonPresident and CEO
ServCo, LLC.
Retired Executive Vice President
and Chief Financial Offi cer
Alcoa, Inc.
James M. KiltsFounding Partner
Centerview Management
Partners, LLC.
Former Vice Chairman
The Procter & Gamble Company
Former Chairman and
Chief Executive Offi cer
The Gillette Company
Susan J. KropfRetired President and
Chief Operating Offi cer
Avon Products, Inc.
Douglas S. LukePresident and Chief
Executive Offi cer
HL Capital, Inc.
Robert C. McCormackFounding Partner
Trident Capital, Inc.
Timothy H. PowersChairman, President and
Chief Executive Offi cer
Hubbell, Inc.
Edward M. Straw*Retired President of Global
Operations
The Estée Lauder Companies, Inc.
Vice Admiral
United States Navy (Retired)
Jane L. WarnerExecutive Vice President
Illinois Tool Works, Inc.
* Mr. Straw will retire from the MWV
Board of Directors effective as of the
Annual Meeting, Monday, April 18, 2011.
MWV 2010 Annual Report
Leadership Team
John A. Luke, Jr.*Chairman and
Chief Executive Offi cer
James A. Buzzard*President
Mark S. Cross*Senior Vice President
Peter C. Durette*Vice President
Robert A. Feeser*Senior Vice President
E. Mark Rajkowski*Senior Vice President and
Chief Financial Offi cer
Linda V. Schreiner*Senior Vice President
Bruce V. Thomas*Senior Vice President
Wendell L. Willkie II*Senior Vice President,
General Counsel and
Secretary
Group Leaders
Dr. Robert K. BecklerPresident
Rigesa
Alejandro CedeñoVice President
Innovation
Jason M. ChapmanVice President
Financial Planning & Analysis
Kevin G. ClarkPresident
Tobacco
Donna O. Cox*Vice President
Communications
Mark V. GullingPresident
Global Business Services
Nikhilanand J. HiremathVice President
Supply Chain
Marvin E. HundleyPresident
Forestry
Charles E. Johnson, Jr.Vice President
Packaging Resources System
Thomas Y. JonasPresident
Beauty & Personal Care and
Home & Garden
Dirk J. Krouskop*Vice President
Safety, Health and Environment
T.D. Lithgow, Ph.D.Chief Science Offi cer
Healthcare
98
Neil A. McLachlanPresident
Consumer & Offi ce Products
Dr. Edward A. RosePresident
Specialty Chemicals
John K. SanfaconPresident
Food Service
Stephen R. SchergerPresident
Beverage and Consumer
Electronics
Kenneth T. SeegerSenior Vice President,
and President,
Community Development
and Land Management
John C. TaylorPresident
Primary Plastics Operations
Mark T. Watkins*Senior Vice President
Technology
Corporate Offi cers
John E. BanuVice President and
Controller
Robert E. BirkenholzVice President and
Treasurer
John J. CarraraAssistant Secretary and
Associate General Counsel
Ned W. MasseeVice President
Corporate Affairs
MWV Management
* Also an MWV Corporate Offi cer
Annual Meeting of Shareholders
The next meeting of shareholders
will be held on Monday, April 18,
2011, at 11:00 a.m.
Waldorf Astoria Hotel
301 Park Avenue
New York, NY 10022
Stock Exchange Listing
Symbol: MWV
New York Stock Exchange
MeadWestvaco Corporation
common stock can be issued in
direct registration (book entry or
uncertifi cated) form. The stock is
DRS (Direct Registration System)
eligible.
Information Requests
Corporate Secretary
MeadWestvaco Corporation
299 Park Avenue
New York, NY 10171
A copy of the Company’s annual
report fi led with the Securities
and Exchange Commission
(Form 10-K) will be furnished
without charge to any shareholder
upon written request to the
address written above.
Telephone +1 212 318 5714
Toll-free in the United States and
Canada +1 800 432 9874
Investor Relations
Please visit the MeadWestvaco
Corporation Investor Relations site
at www.mwv.com/investorrelations.
On this site you can order fi nancial
documents online, send email
inquiries and review additional
information about the company.
Direct Purchase and Sales Plan
The BuyDIRECTSM Plan,
administered by BNY Mellon,
provides existing shareholders and
interested fi rst-time investors a
direct, convenient and affordable
alternative for buying and selling
MeadWestvaco shares. Contact
BNY Mellon for an enrollment form
and brochure that describes the
Plan fully.
Transfer Agent and Registrar
For BuyDIRECTSM Plan enrollment and other shareholder inquiries: MeadWestvaco Corporation
c/o BNY Mellon
PO Box 358015
Pittsburgh, PA 15252-8015
For BuyDIRECTSM Plan sales, liquidations, transfers, withdrawals or optional cash investments (please use bottom portion of advice or statement):MeadWestvaco Corporation
c/o BNY Mellon
PO Box 358015
Pittsburgh, PA 15252-8015
To send certifi cates for transfer or change of address: MeadWestvaco Corporation
c/o BNY Mellon
PO Box 358015
Pittsburgh, PA 15252-8015
Design: Interbrand
Printing: RR Donnelley
Cover: MWV Tango® Advantage C2S
10 pt / 234 gsm. Printed on recycled paper
containing 20% postconsumer fi ber.
© 2011 MeadWestvaco Corporation
ShareholderInformation
All telephone inquiries:+1 866 455 3115 toll-free in the
United States and Canada
+1 201 680 6685 outside the
United States and Canada
All email inquiries:[email protected]
On the Internet at:www.bnymellon.com/
shareowner/equityaccess
Corporate Headquarters
MWV501 South 5th StreetRichmond, VA 23219-0501T +1 804 444 1000
mwv.com


![FUnt‰mdnb¬ · 2011-06-18 · FSpØp apdn]q´nbndßn. ss]ent®´s‚ ho´n¬ sN∂mWv B \SØw \n∂Xv. hnfns®gpt∂¬∏n®v ss]entN´t\mSv cayXs∏´n´mWv A®≥ XncnsI t]m∂Xv;](https://img.pdfslide.us/doc/110x75/5e98c4f3b38ef418117cf13e/funtamdnb-2011-06-18-fspp-apdnqnbndn-ssentsa-hon-snamwv.jpg)