Embed Size (px)
Citation preview

2010-55
Does the Intended Use of Proceeds and Bank's Characteristics Affect the
Bank Underwriters’ Certification Role? Evidence from Seasoned Equity Offerings
Katsushi Suzuki Kazuo Yamada

1
Does the Intended Use of Proceeds and Bank's Characteristics Affect the Bank
Underwriters’ Certification Role? Evidence from Seasoned Equity Offerings
by
Katsushi Suzuki1 and Kazuo Yamada2
This version: 19 October 2010
1 Graduate School of Business Administration, Kobe University, 2-1,Rokkodai,Nada,Kobe 657-8501 , phone: +81 78 803 6914, mail: [email protected] 2 Graduate School of Business Administration, Kobe University, 2-1,Rokkodai,Nada,Kobe 657-8501, and Japan Society for the Promotion of Science, mail: mailto:[email protected]

2
Does the Intended Use of Proceeds and Bank's Characteristics Affect the Bank
Underwriters’ Certification Role? Evidence from Seasoned Equity Offerings
Abstract
This paper examines the effects of the intended use of proceeds on bank underwriters’ certification roles in Japan following deregulation in 1999. We find that bank underwriters have a positive effect on announcement returns. However, when the issuer discloses that the intended use of proceeds is repayment, the bank underwriter has no effect on the announcement returns. Although banks’ holding loans have a positive effect on announcement returns, banks’ equity holdings are negatively associated with the announcement return. Furthermore, issuers underwritten by banks whose use of proceeds is loan repayment are more likely to be weak in their ex-post performance than those without repayment. We conclude that banks have different effects on issuers according to the intended use of proceeds and the banks’ characteristics.
JEL classification: G21; G24
Keywords: Commercial bank; Intended use of proceeds; Announcement return; Certification;
Conflicts of interest.

3
1. Introduction
On average, firms’ stock prices react negatively to their announcements of seasoned
equity offerings (SEOs).3 Several hypotheses have been advanced to explain the
abnormal negative average common stock return following an SEO announcement.
Prominent among these is the adverse selection model of Myers and Majluf (1984).
Myers and Majluf (1984) attribute the average negative return to information
asymmetry between corporate insiders and outside investors. If managers are better
informed than outside investors, firms are more likely to issue equity when the equity is
overvalued. Thus, the announcement of an equity offering conveys negative information
about firm value. Under this condition, Booth and Smith (1986) and Cooney, Kato, and
Schallheim (2003) argue that the informative underwriter can guarantee that the market
price is not overvalued for investors, and their certification of the market price has a
more favorable effect on the SEO market reaction.
In general, banks can obtain private information about a firm through loans or
clearing functions. This private information may affect the announcement return in two
ways: through a certification effect and through a conflict of interest effect.4,5 A bank
with private information can assess the issuers’ market valuation and set the security
price more suitably than an investment house can (i.e., the certification effect).6
3 In Japan, Cooney, Kato, and Schallheim (2003) and Kang and Stulz (1996) found that the average abnormal return
following SEO announcements was positive before 1991. However, after 1995, the abnormal return of SEO
announcement is negative, similar to United States SEO market (Suzuki 2009). 4 There are also several papers that examine the effect of bank entry into the market. Gande, Puri, and Saunders
(1999) and Takaoka and McKenzie (2006) show that competition intensifies within the underwriting market, because
issue costs, following the entrance of banks, decrease on the U.S. and Japanese bond markets. 5 Kanatas and Qi (1998) and Puri (1999) show the effect of certification in the presence of a conflict of interest rather
than treating certification and conflict as two mutually exclusive effects. 6 Suzuki (2010) argues that because the bank underwriter can set the security price suitably, the bank issuers lower
the issue discounts more than those employed by investment houses.

4
Conversely, if a bank has the issuer’s bad information about a future prospectus that is
not spread to investors, the bank may have an incentive to misrepresent the value of a
firm’s securities and use the proceeds to repay its own loans (i.e., the conflict of interest
effect). If the conflict of interest effect is supported, the SEO announcement return and
long-term performance of issuers underwritten and borrowed by the bank’s underwriters
will be negative. Extensive research using bond market data demonstrates that the
certification effect has a stronger influence on credit availability than the conflict of
interest effect does.7,8
This paper examines the market reaction to SEO announcements and post-issue
performance with a particular emphasis on commercial bank-affiliated underwriters.
This paper differs from previous empirical research in several respects. First, we
examine the relationship between the bank underwriter and the issue costs of the stock
market instead of the bond market. Compared to a bond market, the problem of inside
information is more serious in SEO markets (Brennan and Kraus 1987; Myer and
Majluf 1984; Burch, Nanda, and Warther 2005).9 Thus, it is suitable to use the equity
market to examine the effect, because the announcement effect is more relevant to firms
that face serious information problems. Suzuki (2010) examines the relationship
between the bank underwriter and the flotation costs (i.e. discount rate and the
7 For example, Puri (1996), Gande, Puri, Saunders, and Walter (1997), and Takaoka and McKenzie (2006) examine
the question of whether investors paid higher prices for bonds underwritten by banks than those underwritten by
investment houses. See Kroszner and Rajan (1994), Puri (1994), and Konishi (2002) for studies of bond performance
using pre-war data for the United States or Japan. 8 In contrast, Ito and Konishi (2000) and Kang and Liu (2007) show that Japanese banks create conflicts of interest in
bond markets. 9 Brennan and Kraus (1987) and Myer and Majluf (1984) wrote theoretical papers on capital structure, based on the
problem of insider information at the time of new equity issuance. Burch, Nanda, and Warther (2005) argue that the
problem of inside information is more serious in SEO markets than bond markets, because bond markets usually
observe calibrated debt ratings provided by third parties, such as Standard and Poor’s and Moody’s.
5
underwriting fee) of SEOs. In addition, we examine the effect of between bank
underwriters on the market impact of SEO announcements and the post-issue long-term
performance.
Second, this paper examines the effect of the relationship between the bank
underwriter and the intended use of the proceeds on the SEO announcement return and
long-term performance. In Japan, when issuers offer new shares, they must disclose the
intended use of the proceeds to the investors in their prospectus. If the conflict of
interest effect is supported, the SEO announcement’s return will be more negative when
issued by a bank that uses the proceeds to repay bank loans. Walker and Yost (2008)
find that the pre-issue disclosure of the intended use of SEO proceeds reduces
informational asymmetry and have an effect of the announcement price reactions.
Duarte-Silva (2010) examines the relationship between the underwriter lending and the
SEO announcement return. Regarding the relationship between long-term performance
and the use of proceeds, Autore, Bray, and Peterson (2009) find that management can
recapitalize debt by issuing stock when investors are overly optimistic about a firm’s
future prospects, potentially resulting in relative devaluation over the long term. In
addition, we examined the relationship between the intended use of proceeds to repay
the bank underwriter and the market impact on SEO announcement returns and
long-term performance.
Third, Japanese banks differ from U.S. banks in several respects. Japanese banks
have close and long-term relationships with their borrowers. Such ties enable a bank to
produce more information than an investment house.10 Moreover, unlike the United
10 In this paper, the term “investment house” refers to securities companies that do not have a bank as their parent
company.

6
States where banks are banned from having equity holdings, Japanese banks are allowed
to own equity in their client firms. While previous theoretical research has strenuously
examined the difference between allowing and denying bank equity holdings (e.g.,
Kanatas and Qi 2003; Puri 1999), empirical examinations have not been fully performed
in the United States. Puri (1999) argues that the impact of equity holdings is
internationally testable in countries in which banks are allowed to hold equity. Thus, we
examine the effect of the equity holdings of bank underwriters on SEO announcement
returns and post-issue performance.
This research contributes to the existing literature in several ways. We find that the
bank underwriter, and especially the bank lending relationship, has a positive effect on
SEO announcement returns and post-issue long-term performance. This result is
consistent with the certification effect in which investors evaluate if a bank with private
information can assess the issuer’s intrinsic value and set the security price more
suitably than an investment house. This result is also consistent with the bond market
(Puri 1996; Gande, Puri, Saunders, and Walter 1997; Konishi 2002; Takaoka and
McKenzie 2006; Yasuda 2007) and equity market (Duarte-Silva 2010; Kutsuna, Smith,
and Smith 2007; Suzuki 2010) literature. However, when the issuers intend to use
proceeds to repay bank loans, the bank underwriter is not significantly associated with
the announcement return and the post-issue performance. This result is novel and
implies that the intended use of proceeds to repay bank loans offsets a bank’s
certification effect, which is consistent with the conflict of interest effect.
Bank equity holdings have significantly negative effects on SEO announcement
returns and post-issue performance. These results imply that the bank equity holding
offsets the bank’s certification effect, which is consistent with the conflict of interest

7
effect. Yasuda (2007) and Suzuki (2010) find that the underwriting fee of issuers in
which the underwriters’ parent banks concurrently have shareholdings is higher than
that of the issuers underwritten by investment houses or banks with no lending in the
bond and SEO market.11 We find additional effects of the concurrent bank equity
holdings on SEO announcement returns.
The verification method of an abnormal return also differs from that used in
previous studies. This paper examines abnormal SEO returns using a
characteristic-based benchmark model. Event studies typically use data that are
characteristically non-representative of the overall market and are often grouped by
underlying traits, such as size, momentum, and valuation. For instance, firms that
initiate dividends, split their stock, or issue new shares are likely to be large with high
prior returns.12 Ahern (2009) indicates that a characteristic-based benchmark model
produces the least biased returns with the fewest rejection errors. To control for any
possible selection bias in the estimation, we used a benchmark portfolio sample that
employs a propensity score-matching estimation approach.
We assumed that the bank is exogenously determined. Additionally, to investigate
the robustness of our results, we used sample selectivity methods. The results discussed
above do not differ when controlling for the endogeneity of the bank’s underwriting
decisions using selectivity methods.
The remainder of this paper consists of six sections. Section 2 discusses the related
literature and develops our hypotheses. Section 3 describes the sample selection and 11 Drucker and Puri (2005) find that issuers with underwriters who concurrently lend to issuers pay lower
underwriting fees and loan yield spreads than those with underwriters who do not lend to issuers. 12 Under these conditions, Ahern (2009) evaluates eight methods, including a characteristic-based benchmark model,
a market model, the Fama French Three-Factor and Carhart Four-Factor models, and four test statistics, to determine
which method has the least mean bias, the best power, and the best specification of the tests.
8
data. Sections 4 and 5 present the empirical methodology and results, respectively.
Finally, section 6 presents concluding remarks.
2. Related Literature and Hypotheses
Myers and Majluf (1984) argue that if managers typically have a more accurate
information set than the market and the market is aware of this information asymmetry,
investors interpret the decision to sell equity by issues as an incidence of managerial
opportunism. Therefore, the asymmetric information between the issuer and outside
investors produces negative stock return following an SEO announcement.
The role of the underwriter is to alleviate the asymmetric information. The
underwriter has incentive to underwrite the issuers with a suitable stock price. Booth
and Smith (1986), Chemmanur and Fulghieri (1994), and Cooney, Kato, and Schallheim
(2003) argue that because the underwriter has an incentive to price appropriately to
maintain its reputation for future business, the informative underwriter certifies its
issuers to the market.13
Unlike investment houses, which do not offer loans to issuers in Japan, banks can
obtain private information about issuers through loans or clearing functions. Diamond
(1984) argues that through debt contracts, banks can access information that is not
publicly available and enjoy a comparative cost advantage in information production.
This advantage allows bank underwriters to gather more information about issuers and
use their information to signal to investors the quality of issued securities, as formally
modeled in Puri (1999). The certification hypothesis implies that if banks obtain
superior information via lending activities, issuers underwritten by banks that are
13 Dunbar (2000) and Fernando, Gatchev, and Spindt (2005) indicate that mispricing in offer prices significantly
affects changes in the underwriter market share and leads to changes in the lead underwriter.

9
concurrently lending should have higher announcement returns and post-issue
performance than those that are underwritten by banks without lending and investment
houses.
Japanese banks can hold both loans and stocks of firms.14 There is no definitive
evidence from previous research that a bank’s equity holdings will enhance or lower its
certification ability. Berlin, John, and Saunders (1996) argue that equity holdings by
financial intermediaries enhance their certification capacity. Moreover, Li and Masulis
(2004) suggest that equity investments in issuers improve the alignment of underwriter
and issuer interests, thus causing underwriters to set relatively higher offer prices. If a
bank’s equity holdings heighten the bank’s certification ability and improve the
alignment of underwriter and issuer interests, then issues underwritten by banks holding
the equity of issuers will have lower announcement returns and post-issue performance
than those underwritten by banks that do not hold the equity of issuers.
In contrast, Puri (1999) argues that when the equity held by the bank underwriter
is retired by the proceeds of the issue, equity damages the credibility of the bank. The
reason is that equity increases the incentives of the bank to underwrite a bad quality
firm more than debt does. If the certification ability of a bank that is concurrently
underwriting and holding the shares of an issuer is weaker than that of a bank
underwriter engaged only in lending, then issues underwritten by banks holding the
equity of issuers will have lower announcement returns and post-issue performance than
those underwritten by banks that do not hold the equity of issuers.
A bank with superior information about issuing firms can misrepresent the value of
a firm’s securities and use the proceeds to repay its own debts (Benston 1990). This is
14 By law in Japan, bank shareholdings among firms are limited to a maximum of 5%.

10
known as the conflict of interest effect. Because Japanese investment houses do not
extend loans to firms, the issuer with an investment house underwriter is not altered by
the conflict of interest effect, though the issuer with a bank underwriter may face this
effect. This is especially true when issuers have lending relationships with banks
disclose that the intended use of proceeds is repayment; this increases outsiders’
concerns about the bank’s conflict of interest. Thus, the conflict of interest hypothesis
implies that when the intended use of proceeds disclosed by issuers is loan repayment,
these issues underwritten by banks will have lower announcement returns and post-issue
performance than issuers with banks that do not use proceeds for loan repayment.
3. Sample Selection
We analyze an initial sample of 693 SEOs from January 2000 to December 2007. The
sample includes all registered stock offerings made by Japanese firms during that period.
We exclude utilities, financial companies, and REITs, as well as firms that release
important information (e.g., such as earnings, dividends, and switch the exchange) with
the announcement of the issue. The final sample consists of 346 offerings.
We obtain the data on equity issues (including the offer price, proceeds, and original
underwriter names) from the IN Information Systems and the eol ESPer database. Bank
shareholding information is accessed via a subscription to the Japanese Group Company
database and the NIKKEI NEEDS Financial Quest database. Data on the age of the
SEO firms and the timing of the listed changes are obtained from Quarterly Firms
Statistics and the NIKKEI NEEDS Financial Quest database. The remainder of the data
is gathered from the NIKKEI NEEDS Financial Quest database.
4. Empirical Model

11
4.1. Announcement return
Following Ahern (2009), we use a characteristic-based benchmark model to examine
abnormal returns around the SEO pricing date. We defined abnormal returns for an
individual firm , as:
, (1)
where is the daily stock return on day for firm , and is the
daily stock return on day for the matching portfolio . A simple comparison of the
daily return of firms that issued equity and those that did not is inappropriate due to a
possible selection bias. If firms issuing securities are riskier than those that do not issue
securities, then a simple comparison of the returns between these groups confounds
ex-ante riskiness and ex-post riskiness (i.e., changes in the riskiness of the borrowers
after issuing the security). To circumvent this problem, we need to control for any
possible selection bias in the estimation. Thus, we employ a propensity score matching
estimation approach. The matching procedure is presented in Appendix A. The CAR is
the three-day cumulative abnormal return around the SEO announcement date (day -1, 0,
+1). We estimate the following equation using an ordinary least squares regression
(OLS): 1 2 3 4
5 6 7
8 9 10
CAR Bank Payment Investment Working capital
ln(Capitalization ) RelSize TobinQ
STDR MajorUW Days
EXCHANGE YEAR .
j j j j j
j j j
j j j
k jk l jl jk l
u
, (2)
The dependent variable CAR represents the cumulative abnormal returns around the
announcement date (day -1, 0, +1). The first independent variable is Bank, which is the
i ,i tAR
, , ,Return Returni t i t p tAR
,Returni t t i ,Returni t
t p
12
variable of primary interest. Bank is a dummy variable is equal to one if the lead
underwriter is a bank-affiliated securities company and zero otherwise. When the
certification effect is considered, the CAR should be positively correlated with the Bank.
Conversely, considering the conflict of interest effect, the CAR should be negatively
correlated with the Bank.
Payment, Investment, and Working capital are the variables concerning the firm’s
intended purpose for the proceeds. Payment is a dummy variable, which is equal to one
if the intended use of proceeds, which issuers disclose in the SEO prospectus, is a loan
payment. Otherwise, the variable equals zero. Autore, Bray, and Peterson (2009)
indicate that management may recapitalize debt by issuing stock when investors are
overly optimistic about a firm’s future prospects, which potentially results in relative
devaluation in the long term. Thus, we expected CAR to be negatively associated with
Payment. Investment is a dummy variable, which is equal to one if the intended use of
proceeds is investment for facilities and zero otherwise. Walker and Yost (2008) find
that firms that have valuable growth opportunities are specific in their S-filings, and the
market views their anticipated investments favorably. Furthermore, Autore, Bray, and
Peterson (2009) indicate that firms issuing equity specifically for investment purposes
are more likely to use the proceeds for value adding investments and less likely to be
opportunistic market timers. Thus, we expected CAR to be positively associated with
Investment. Working capital is a dummy variable, and it is equal to one if the intended
use of proceeds is working capital and zero otherwise. The use of working capital does
not necessarily reflect future investment opportunities. Thus, we did not expect CAR to
be associated with Working capital.
The remaining independent variables are used to control for other factors that may

13
affect the announcement return. The adverse selection problem results in a negative
relationship between announcement returns and ex-ante uncertainty concerning the
value of the issue. We define two proxies, ln(Capitalization) and STDR, for asymmetric
information and uncertainty, respectively. The first proxy, ln(Capitalization) is the
natural logarithm of total market capitalization on the day prior to the offer. STDR is the
standard deviation of daily stock returns over 120 trading days and ending 20 days prior
to the offer. We expect CAR to be positively associated with ln(Capitalization) and
STDR. Cooney and Kalay (1993) argue that the investment opportunities to invest in a
positive net present value (NPV) project are positively associated with SEO
announcement returns. TobinQ is the ratio of the market value of a firm to its total assets.
We expected CAR to be positively associated with TobinQ. Prestigious underwriters
certify the quality of the issue and alleviate informational asymmetry problems. As a
proxy variable for prestigious underwriters, Major UW was used in the present study as
the dummy variable for a prestigious underwriter. This variable assumes a value of one
if the lead underwriter is a major underwriter (e.g., such as Nomura, Nikko, or Daiwa)
and zero otherwise. Based on the certification role of prestigious underwriters, Major
UW was expected to be positively associated with the CAR. Days is the number of days
between the pricing date (PD) and the issue day (ID). If the number of days between PD
and ID is high, price uncertainty will increase (Corwin 2003). We define the relative
offer size, RelSize, as the number of offered shares divided by the size of the existing
market for the firm’s shares. EXCHANGE and YEAR are sets of exchange and year
dummy variables, respectively.
4.2. Long-term performance

14
Following Li and Zhao (2006), we use a propensity score matching method to examine
the post-issue abnormal buy and hold returns. We define the post-issue abnormal buy
and hold returns for an individual firm , ABHR i as:
ABHR BHR BHRi i p (3)
where BHR i is the buy and hold return for the 24-month return after issue for firm
, and BHR p is the buy and hold return for the 24-month return after issue for the
matching portfolio . The propensity score matching method finds matches by the
propensity score. The matching procedure is presented in Appendix A. In the long-term
performance examination, we exclude the issuers that issued equity 2 years before the
issue examined. Therefore, the long-term performance sample includes 300 issuers.
5. Empirical Results
5.1. Descriptive statistics
In this paper, a bank-affiliated underwriter is defined as a securities company in which
the bank holds at least a 20% equity stake. Table 1 shows the number of bank-affiliated
underwriting and investment houses that underwrote SEOs from 2000 to 2007. The
underwriting market share of bank-affiliated underwriters is nearly unchanged over this
period: from 40.90% in 2000 to 53.85% in 2006. This market share accounts for 47.69%
of the overall issues during 2000–2007. These results are consistent with Suzuki (2010).
The high market share of bank underwriter in 2000 is because the bank acquired the
stocks of certain major investment houses just before 2000, including Daiwa Securities
SMBC and Kokusai Securities. Daiwa Securities, second in the underwriting market,
merged with Sumitomo Securities, which handled securities for the Sumitomo
i
i
p
15
Bank-Group. Daiwa Securities SMBC then joined the Sumitomo Bank-Group. In 2000,
Daiwa Securities SMBC underwrote 19 SEO firms and held a 25% market share.
Kokusai Securities, the fifth largest in the underwriting market, became a group
company of the Bank of Tokyo Mitsubishi when Nomura Securities (an investment
house and the largest stockholder) sold off equity to the Bank of Tokyo Mitsubishi.15
There were five underwriting firms of Kokusai Securities in 2000, accounting for a
6.5% market share. Unlike the underwriting market for Japanese bonds, there were no
rapid changes in market share in the SEO underwriting market. This implies that driving
an investment bank out of the SEO market is relatively difficult. We indicate the detail
of bank underwriters in Appendix B.
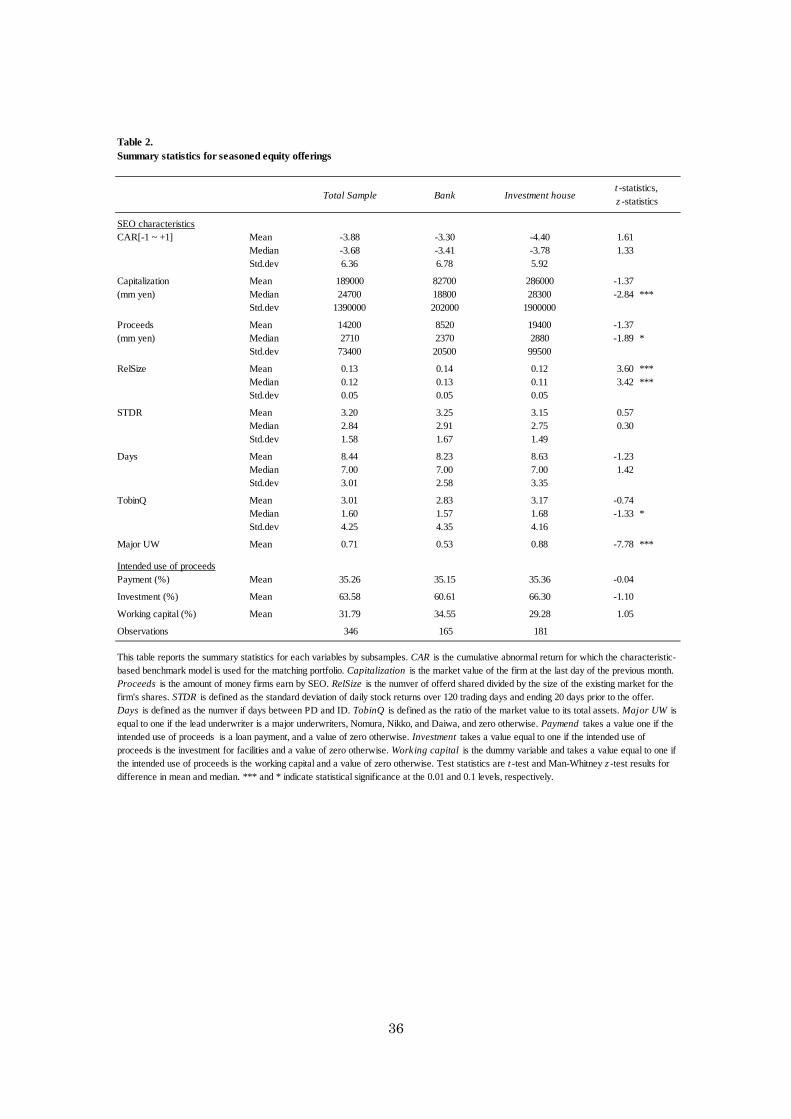
Table 2 presents descriptive statistics for the sample. The total number of offers is
divided into two mutually exclusive categories: bank and investment house SEO
samples. The mean (median) cumulative abnormal return, i.e., CAR, is -3.88% (-3.68%).
This level is low at ~1.5% compared with Eckobo, Masulis, and Norli (2007) in the
United States (-2.22%). The mean market capitalization, i.e., Capitalization, is 189,000
million yen, and the average offering raised 14,200 million yen in proceeds. The mean
relative offer size, i.e., RelSize, is 13%, and the mean (median) STDR is 3.20 (2.84). The
period from the pricing date to the offer date is, on average, 8.44 days. The share of
major underwriters in the Japanese SEO underwriter market is 71%. The percentage of
issuers who intend to repay loans in Japan is 35%. The share of issuers who intended to
invest their SEO proceeds for facilities is 64%. The share of firms who intended to use
proceeds for working capital is 32%. The mean level of offering characteristics in the
15 In September 2002, Kokusai Securities, Tokyo Mitsubishi Securities, and Tokyo Mitsubishi Personal Securities
formed Mitsubishi Securities.

16
bank underwriter group is not statistically different from that in the investment house
group, excluding Major UW and RelSize.
5.2. Announcement returns
In Table 3, we report the cumulative abnormal return, which divides the entire sample
by the issuer’s intended use of proceeds. In Panel A, we divide the sample into the
payment issuer and the non-payment issuer groups and compare the announcement
returns between these groups. The payment group is defined as the firms whose
intended use of the SEO proceeds is loan payment, and the non-payment group is
defined as the firms that do not intend to use the SEO proceeds in loan payment. The
level of announcement returns in the payment group (mean: -4.82%; median: -4.88%) is
lower than that in the non-payment group (mean: -3.37%; median: -3.41%), and the
difference is both economically and statistically significant. Furthermore, we divide the
sample into issuers underwritten by banks and those underwritten by investment houses.
We then compare the announcement returns with the payment and non-payment groups,
respectively. Although the cumulative abnormal returns of the payment group are not
statistically different from that in the non-payment group in the investment house
subsample, the announcement returns of the payment group are 2.5% lower than that in
the non-payment group in the bank underwriter subsample. In Panel B, we divide the
sample into the investment and non-investment groups and compare the cumulative
abnormal returns with these groups. The investment group is defined as the firms whose
intended use of SEO proceeds disclosed in the prospectus is investing in facilities, and
the non-investment issuer’s intended use of SEO proceeds is not investing in facilities.
The level of announcement returns in the investment group (mean: -3.59%; median:
17
-3.62%) was not statistically and economically different from that in the non-investment
group (mean: -4.39%; median: -3.81%). We divided the issuers into bank and
investment house subsamples and then compared the announcement returns with the
investment and non-investment groups, respectively. Neither comparison resulted in a
statistical or economic difference in CAR between the investment and non-investment
groups. In Panel C, we divided the sample into the working capital and non-working
capital groups and compared the cumulative abnormal returns for each. The working
capital group is defined as the firms whose intended use of SEO proceeds in the
prospectus is working capital, and the non-working capital issuer’s intended use of SEO
proceeds is not working capital. The level of announcement returns in the working
capital group (mean: -4.52%; median: -5.04%) is not statistically or economically
different from that in the non-working capital group (mean: -3.58%; median: -3.40%).
Moreover, we divided the sample into issuers affiliated with banks and investment
houses and compared the cumulative abnormal returns with the working capital and
non-working capital groups, respectively. There is neither a statistical nor economic
difference in CAR between the working capital and non-working capital groups.
Table 4 shows the effect of bank underwriting and the intended loan payment on the
announcement cumulative abnormal returns. In Model 2, the estimated Bank coefficient
is positively associated with the cumulative abnormal returns, consistent with the
certification effect. However, in Models 3 and 5, the coefficient of the interaction of
Bank and Payment, Bank*Payment, is negatively and significantly associated with
cumulative abnormal returns. This result is consistent with the bank’s conflict of interest
effect, which implies that the announcement abnormal returns of banks with the intent
to repay are lower than that of banks without loan repayment intentions and no different

18
from that of issuers affiliated with investment firms. The average Japanese firm usually
has a bank that is its largest lender and sometimes supplies one or two board members.
In such a case, the bank is referred to as the “main bank” of the firm. To investigate the
impact of the main bank’s underwriter on announcement returns, we include the Main
Bank in the base model. The Main Bank is a dummy variable that assumes a value of
one if the bank underwriter’s parent bank is the greatest lender to the issuer and zero
otherwise. In Models 4 and 5, the estimated coefficients of the Main Bank are not
significantly associated with the discount rate, which is consistent with Suzuki (2010)
and Takaoka and McKenzie (2006). We assume that the bank is exogenously
determined. To investigate the robustness of the results, we use sample selectivity
methods, as in Suzuki (2010) and Takaoka and McKenzie (2006). However, the results
discusses above do not differ when we control for the endogeneity of the bank’s
underwriting decisions using selectivity methods. The sample selectivity methods are
presented in Appendix C.
The results in Table 4 do not allow us to examine whether bank lending and
shareholding affect SEO announcement returns. To examine the impact of lending and
shareholding relationships between bank underwriters and issuers, issuers are classified
into various groups, as shown in Table 5. They are divided into two groups based on the
parent underwriter of the loans to the issuing firm: issuing firms with a loan relationship
and issuing firms with no loan relationship. The number of issuers with a loan
relationship is 112 (67.88%), and the number of firms with no loan relationship is 53
(32.12%). The loan share is the total loan from the parent bank of the underwriter just
before the issue, divided by the issuer’s total assets. The average loan share of issuers
with a loan relationship is 6.58%. Based on the parent’s equity share in the issuing firm,
19
issuers are divided into two groups: issuing firms with an equity relationship and those
with no equity relationship. The number of issuing firms with an equity relationship is
52 (31.51%), and the number with no equity relationship is 113 (68.49%). The Equity
share is the equity held by the parent bank of the underwriter just before issuing
securities, divided by the number of shares outstanding. The average equity share of
issuers with an equity relationship is 2.17%.
A base model is explained in Section 4, which included two variables, Loan share
and Equity share, to investigate the impact of loan and equity relationships on
announcement returns. Models 1-4 in Table 6 show the effect of concurrent loan and
equity holdings by a bank underwriter on the announcement returns. The Loan share
coefficient is positively associated with the cumulative abnormal returns. This result is
consistent with Duarte-Silva (2010), who indicates (with respect to the certification
prediction) that the level of the SEO announcement return is positively associated with
the underwriter who lends concurrently. In contrast, the Equity share coefficient is
negatively associated with the announcement return. This result is consistent with the
certification effect, which predicts that the level of the SEO announcement return is
positively associated with the bank underwriter who holds equity concurrently. If the
conflict of interest effect is supported, an announcement return may be lower from an
issuers who discloses the intention for loan repayment and is underwritten by bank
underwriters who concurrently lend. LoanD is a dummy variable that is equal to one if
the bank underwriter is concurrently lending and a value of zero otherwise. In Model 6,
the coefficient of the interaction variable of LoanD and Payment, LoanD*Payment, is
negatively associated with the announcement abnormal returns. These results imply that
the intended use of proceeds to repay bank loans offsets a bank’s certification effect,

20
which is consistent with the conflict of interest effect.
5.3. Long-term performance
To examine issuers’ long-term performance, we exclude firms that offered new stocks
within 2 years before and after the SEO offering. Therefore, the long-term performance
sample consists of 222 offerings. If the certification effect is supported, issuers
underwritten by banks that are concurrently lending should have higher post-issue
performance than those underwritten by banks without lending and investment houses.
Conversely, if banks misuse their superior information to repay their own claims more
actively than investment houses, the issuers with banks that use proceeds to repay bank
loans may have lower post-issue performance than those underwritten by banks without
lending or by investment houses. In this section, post-issue performance is compared
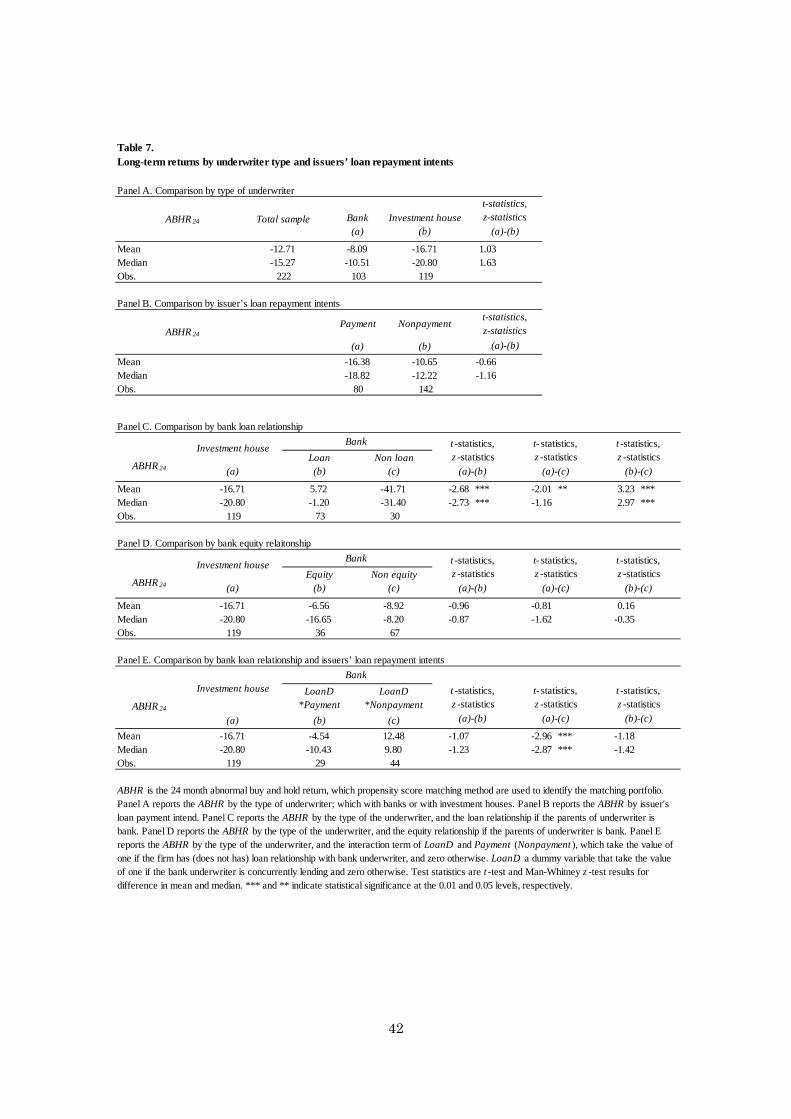
with the bank relationship and the issuers’ intended uses of proceeds.
To examine the impact of bank relationships and the issuers’ payment intentions,
issuers are classified into various groups as shown in Table 7. In Panel A, they are
divided into two groups based on the underwriter: issuing firms with bank underwriters
and investment houses. The mean (median) ABHR for bank underwriters is -8.09%
(-10.51%), which is greater than the mean (median) ABHR for investment houses,
-16.71% (-20.80%). Panel B of Table 7 shows the ABHR of issuers who intended to
repay bank loans and those who did not. The average (median) ABHR for issuers who
intended to repay loans is -16.38% (-18.82%), which is lower than the average (median)
ABHR for issuers who did not intend to repay loans, -10.65% (-12.22%). This result is
consistent with Autore, Bray, and Peterson (2009), who state that management may
recapitalize debt by issuing stocks when investors are overly optimistic about a firm’s
21
future prospects, potentially resulting in long-term relative devaluation.
Panels C and D of Table 7 indicate the ABHR of issuers with bank loans and their
equity relationships. The average (median) ABHR of the firms that have a loan
relationship with a bank is 5.72% (-1.20%). The average and median ABHR of issuers
with bank underwriters’ loan relationships is significantly higher than those without a
loan relationship. This result is consistent with the certification effect by the bank loan
relationship. The average (median) ABHRs of the equity relationship and non-equity
relationship are -6.56% (-16.65%) and -8.92% (-8.20%), respectively. Although the
ABHR of banks without an equity relationship (Non equity) is marginally greater than
that of investment houses (z-statistics = 1.62), the ABHR of banks with an equity
relationship (Equity) is not different from that of investment houses. These results imply
that the level of ABHR is marginally affected by the difference in bank equity
relationships, which is consistent with the conflict of interest effect by the bank equity
relationship.
Panel E of Table 7 indicates the ABHR of issuers with the interaction of the payment
intention and bank loan relationship. The average (mean) ABHR of banks with
LoanD*Payment is not significantly different from that of investment houses (t-statistics
= -1.07, and z-statistics = -1.23). In contrast, the average (median) ABHR of banks with
LoanD*Nonpayment is significantly higher than that of investment houses (t-statistics =
2.96, and z-statistics = 2.87). These results imply that firms’ intentions to use proceeds
to repay bank loans offset a bank’s certification effect, which is consistent with the
conflict of interest effect.
6. Concluding Remarks

22
We examine the effects of bank underwriters on the market reaction to SEO
announcements and post-issue long-term performance in Japan following deregulation
in 1999. We find that according to the issuers’ payment intentions and bank
relationships, bank underwriters have different effects on SEO announcement returns
and post-issue performance.
First, we demonstrate that the bank underwriter, and especially the bank lending
relationship, have a positive effect on SEO announcement returns and post-issue
long-term performance. This result is consistent with the certification effect, which
states that investors who evaluate a bank with private information can assess the issuer’s
intrinsic value and set the security price more suitably than an investment house can.
Second, when the issuers intended to use proceeds to repay bank loans, the bank
underwriter is not significantly associated with the announcement returns and post-issue
performance. This result is novel, and it implies that the intended use of proceeds to
repay bank loans offsets a bank’s certification effect, which is consistent with the
conflict of interest effect. Finally, bank equity holdings have significantly negative
effects on SEO announcement returns and post-issue performance. These results imply
that the bank equity holding offsets a bank’s certification effect, which is consistent
with the conflict of interest effect. We conclude that banks have different effects on the
issuers according to the banks’ characteristics and intended uses of the proceeds.
These results support both the certification and conflict of interest effects with
regard to SEO announcement returns according to the bank’s relationships and the
issuers’ repayment intentions. However, because the conflict of interest effect on the
SEO announcement returns does not exceed the certification effect, the announcement
returns of issuers affiliated with banks is not lower than that of issuers affiliated with

23
investment houses. Thus, the evidence supports the deregulation of the internal flow of
information obtained through lending relationships.
Appendix A: Matching Procedure
The matching procedure was performed as follows. First, we implemented a probit
estimation that models the probability of an equity offering in year t, conditional on the
covariates observed in year t-1. Firms that issue equity ( ) are labeled as
treatment observations. Next, we attached a propensity score to each observation. The
propensity score is defined as
(A1)
where is a vector of covariates in the probit estimation.
Next, we implemented another set of probit estimations, including cross-terms, which
are multiplied by the variables that measure the extent of the external control of a firm.
For each treatment observation, we identified matched observations from the sample of
firms not issuing securities. The matched observations are those that demonstrate the
“closest” propensity scores to a particular treatment observation; they are labeled as
control observations. These matched observations were selected from the same calendar
year as the treatment observation. It should also be noted that we used a non-treated
observation more than once as a control, i.e., a non-treatment observation may have
been used as a control for more than one treatment observation at the same time. Several
matching algorithms can be used to find the “closest” control observations. As a
1tSEO
( )e
1 1( ) Pr( 1 ),t t te X SEO X
1tX
24
baseline for this analysis, we employed the ten nearest matches in which the arbitrarily
determined ten observations with propensity scores closest to each treatment
observation were selected.16
One of the benefits of employing a propensity-score-matching estimation is that we
could match treatment and control observations using the scalar propensity score. The
propensity score, which is the conditional probability of a treatment given the value of
the observed characteristics, is a useful variable when dealing with highly dimensional
vectors of covariates. Rosenbaum and Rubin (1983) show that treatment observations
and control observations with the same propensity score value have the same
distribution as the full vector of covariates. Thus, it is sufficient to match firms in terms
of the propensity score to obtain the same probability distribution of covariates for
treatment and control observations. We began with the baseline probit estimation. In the
probit estimation, we obtained the conditional probabilities of a firm issuing equity in
year t given the values of the observed firm’s characteristics in year t-1. The dependent
binary variable represents a security offering in year t ( ). The following
explanatory variables were used. Regarding firm performance, the return on total assets
( ) and the capitalization ( ), which is defined as the natural logarithm of
the total market capitalization, were employed. We also used the debt ratio ( ) as
a variable for a higher risk of bankruptcy and the market to book ratio ( ) as a
variable for the firm’s value gap.
16 We found that the results obtained using different matching algorithms (i.e., nearest five matches) are similar to
those obtained using the ten nearest matches.
tSEO
1tROA 1tCAP
1tDEBT
1tMTB
25
Appendix B: Wave of securities company mergers between 2000 and 2007
Table A1 shows the list of bank underwriters, their parent commercial banks, and shares.
In our sample period, most bank underwriters merged due to the regulation change and
the merger of their parent commercial banks. Before 1993, the Securities and Exchange
Law, which was modeled after the Glass-Steagall Act in the U.S., separated the banking
and securities business. The Financial Institution Reform Act of 1993 allowed banks
and securities companies to enter each other’s business areas. For example, the
Industrial Bank of Japan formed the subsidiary securities company, Industrial Bank of
Japan Securities, in July 1993. This act affected the structure of securities companies in
two ways. First, in the deregulation process, securities companies were allowed to form
equity brokerage businesses. In contrast, subsidiaries of commercial banks were not
allowed to engage in equity brokerage businesses, including equity underwriting.
However, the Financial System Law of October 1999 enabled securities companies to
engage in equity brokerage businesses.
Second, after The Financial Institution Reform Act of 1993 took effect, the structure
of the securities industry was concentrated. Thus, banks established subsidies for
securities companies. For example, the Industrial Bank of Japan established the
Industrial Bank of Japan Securities in September 1997. Furthermore, the Financial
System Reform Law of 1998 allowed the creation of financial holding companies.
Large banks established or merged other banks or financial service companies. As a
result of the concentration of financial companies, four securities companies remained:
Shinko Securities, Mizuho Securities, Mitsubishi UFJ Securities, and SMBC Friends
Securities, at the end of December 2007.
In April 2000, two subsidiaries of the Industrial Bank of Japan, Shin-Nihon

26
Securities and Wako Securities, formed Shinko Securities (a). This was an equal merger,
and the surviving entity was the former Shin-Nihon Securities. Mizuho Investor
Securities (b), formerly Kankaku Securities (which is an affiliated company of
Daiichi-Kangyo Bank), became a member of the Mizuho Financial Group in April
2002; it acquired Daito Securities in April 2002. In September 2000, the Mizuho group
was created through the establishment of Mizuho Holdings as a holding company of
Dai-Ichi Kangyo Bank, Fuji Bank, and the Industrial Bank of Japan, and in October
2000, their respective securities companies (Fuji Securities, Dai-Ichi Kangyo Bank
Securities, and Industrial Bank of Japan Securities) merged with Mizuho Securities (c).
The surviving entity was the Industrial Bank of Japan Securities.
In July 2001, Sanwa Securities and Tokai International Securities merged into
UFJ Capital Markets Securities via the merger of their parent banks. Furthermore, UFJ
Capital Markets Securities merged with Tsubasa Securities, which was comprised of the
former Taiyo Securities, Towa Securities and Dai-Ichi Securities in June 2002 and
named UFJ Tsubasa Securities (d). UFJ Tsubasa Securities is a subsidiary of UFJ Bank
and a member of the former UFJ Group. In September 2002, Kokusai Securities, Tokyo
Mitsubishi Securities (e), and Tokyo Mitsubishi Personal Securities merged to form
Mitsubishi Securities (f), which simultaneously became a subsidiary of The Bank of
Tokyo-Mitsubishi and a member of the former Tokyo-Mitsubishi Group. Kokusai
Securities (g) was an affiliate of Nomura Securities but became the subsidiary of Tokyo
Mitsubishi Bank. Tokyo Mitsubishi Securities was a former subsidiary of the Mitsubishi
Trust Bank and was named Mitsubishi-Shin Securities. It became the subsidiary of the
Tokyo Mitsubishi Bank in September 1999 and changed its name to Tokyo Mitsubishi
Securities. In October 2005, the two largest financial group banks, Mitsubishi Tokyo

27
Financial Group and UFJ Financial Group, merged to form the Mitsubishi UFJ
Financial Group. As a result of this merger, their securities subsidiaries (UFJ Tsubasa
Securities and Mitsubishi Securities) merged into Mitsubishi UFJ Securities (h). In April
2003, Meiko National Securities, which was a member of the Sumitomo Group, and
Sakura Friend Securities, which was a subsidiary of the Sakura Bank and a member of
the former Mitsui Group, formed SMBC Friend Securities (i). In April 1999, the
wholesale division of Daiwa Securities and the operations of Sumitomo Capital
Securities Operations formed under the name of Daiwa Securities SB Capital Market.
At first, Daiwa Securities held 60% of the shares and Sumitomo Bank held 40%. In
April 2001, Daiwa Securities SB Capital Market absorbed part of the wholesale
securities operations of Sakura Bank and changed its name to Daiwa Securities SMBC
Securities (j).
Appendix C. Selection Bias
To examine the difference in the cumulative abnormal returns between firms with a
bank or an investment house underwriting, we used OLS regression and estimated the
coefficient of a dummy variable for the type of underwriter (Table 4). Specifically, we
estimated the following model:
(A2)
where is the cumulative abnormal return of the th issue, represents the set of
publicly-observable characteristics of the th issuer that affect the cumulative abnormal
return, is a dummy variable that is equal to one if the th issue is underwritten by a
bank and zero otherwise, and is the disturbance term that can contain information on
the th issuer’s unobservable characteristics. It is well-known that the estimated
coefficient of the dummy variable in the OLS regression is inconsistent if the dummy
,i i iy X C
iy i iX
i
iC i
i

28
variable is endogenously determined. Because a bank’s decision to underwrite an issue
depends on both the issuer’s observable and unobservable characteristics, the dummy
variable is potentially correlated with the disturbance term . To illustrate the nature
of this problem, suppose that the bank’s decision to underwrite an issue depends on:
(A3)
where represents a set of the issuer’s publicly-observable characteristics, and is
the disturbance term that includes a set of the issuer’s publicly-unobservable
characteristics. A bank underwrites the issue only when . Otherwise, a house
underwrites the issue. The selection bias of the OLS arises because can be
correlated with , in which case the underwriter can partially reveal hidden
characteristics and thereby affect stock pricing. To assess the effect of the issuer’s
unobservable characteristics on cost, we followed Puri (1996) and replaced the dummy
variable in Equation (1) with:
(A4)
where and are the density and cumulative probability functions of the
standard normal distribution, respectively. Thus, Equation (A2) becomes:
(A5)
The test for the difference in the issue cost between bank-underwritten firms and
investment house-underwritten firms consists of the sign and significance of . A
positive (negative) and significant value of suggests a higher (lower) issue cost when
a bank underwrites the issue. We estimated Equation (A5) using Heckman’s two-step
approach (Heckman, 1979). In the first step, we calculated in Equation (A3) via probit
regression and substituted this estimate of into Equation (A4) in order to obtain an
approximation for . We calculated in Equation (A5) by performing an
iC
,i id I u
iI u
0id
u
( ) ( )* (1 )* ,( ) 1 ( )
i ii i
i i
I IBANKINFO C C
I I
( ) ( )
.i i iy X wBANKINFO v
w
w
iBANKINFO w

29
OLS regression and testing the null hypothesis that .
The explanatory variables used in a probit model explaining Bank were variables
contained in the base models for the discount rate and underwriter spread,
Ln(Capitalization), STDR, Major UW, RelSize, Ln(Proceeds), and two additional
variables: the main bank’s loan share and the number of issues the issuer has made.
Table A2 presents the results of the cumulative abnormal returns on the OLS regression
in the second step of the test. In this step, the signs and significance of all independent
variables are similar to those in Table 4. In particular, the BANKINFO coefficient is
positive and significant at the 5% level. This result also supports the certification
hypotheses.
[2010.10.19 1005]
0w
30
References
Ahern, K. 2009. Sample Selection and Event Study Estimation. Journal of Empirical
Finance 16:466–82.
Autore, D., D. Bray, and D. Peterson. 2009. Intended Use of Proceeds and the Long-run
Performance of Seasoned Equity Issuers. Journal of Corporate Finance 15:358–67.
Barnes, E., and M. Walker. 2006. The Seasoned-Equity Issues of UK Firms: Market
Reaction and Issuance Method Choice. Journal of Business Finance & Accounting
33:45–78.
Benston, G.J. 1990. The Separation of Commercial and Investment Banking (New York:
Oxford University Press).
Berlin, M., K. John, and A. Saunders. 1996. Bank Equity Stakes in Borrowing Firms
and Financial Distress. Review of Financial Studies 9:889–919.
Booth, J., and R. Smith. 1986. Capital Raising, Underwriting and the Certification
Hypothesis. Journal of Financial Economics 15:261–81.
Brennan, M., and A. Kraus. 1987. Efficient Financing under Asymmetric Information.
Journal of Finance 42:1225–43.
Burch, T., V. Nanda, and V. Warther. 2005. Does It Pay to be Loyal? An Empirical
Analysis of Underwriting Relationships and Fees. Journal of Financial Economics
77:673–99.
Chemmanur, T., and P. Fulghieri. 1994. Reputation, Renegotiation, and the Choice
between Bank Loans and Publicly Traded Debt. Review of Financial Studies
7:475–506.
Cooney, J., and A. Kalay. 1993. Positive Information from Equity Issue Announcements.
Journal of Financial Economics 33:149–72.

31
Cooney, J., H. Kato, and J. Schallheim. 2003. Underwriter Certification and Japanese
Seasoned Equity Issues. Review of Financial Studies 16:949–82.
Corwin, S. 2003. The Determinants of Underpricing for Seasoned Equity Offers.
Journal of Finance 58:2249–80.
Diamond, D. 1984. Financial Intermediation and Delegated Monitoring. Review of
Economic Studies 51:393–414.
Drucker, S., and M. Puri, 2005. On the benefits of concurrent lending and underwriting.
Journal of Finance 60, 2763-2799.
Duarte-Silva, T. 2010. The market for Certification by External Parties: Evidence from
Underwriting and Banking Relationships. Journal of Financial Economics
98:568–582.
Dunbar, C. 2000. Factors Affecting Investment Bank Initial Public Offering Market
Share. Journal of Financial Economics 55:3–41.
Eckbo, B., R. Masulis, and O. Norli. 2007. Security Offerings. In Handbook of
Corporate Finance: Empirical Corporate Finance, Vol. I, ed. B. E. Eckbo.
Elsevier/North-Holland, pp. 233–373.
Fernando, C., V. Gatchev, and P. Spindt. 2005. Wanna Dance? How Firms and
Underwriters Choose Each Other. Journal of Finance 60:2437–69.
Gande, A., M. Puri, and A. Saunders. 1999. Bank Entry, Competition, and the Market
for Corporate Securities Underwriting. Journal of Financial Economics 54:165–95.
Gande, A., M. Puri, A. Saunders, and I. Walter. 1997. Bank Underwriting of Debt
Securities: Modern Evidence. Review of Financial Studies 10:1175–1202.
Heckman, J. 1979. Sample Selection Bias as a Specification Error. Econometrica

32
47:153 –161.
Ito, A., and M. Konishi. 2000. Underwritten by Bank Subsidiary and Conflicts of
Interest. Henkakuki no Kinyu Shihon Sijyou 73–100 (in Japanese).
Kanatas, G., and J. Qi. 1998. Underwriting by Commercial Banks: Incentive Conflicts,
Scope Economies, and Project Quality. Journal of Money, Credit & Banking
30:119–33.
Kanatas, G., and J. Qi. 2003. Integration of Lending and Underwriting: Implications of
Scope Economies. Journal of Finance 58:1167–91.
Kang, J., and W. Liu. 2007. Is Universal Banking Justified? Evidence from Bank
Underwriting of Corporate Bonds in Japan. Journal of Financial Economics
84:142–86.
Kang, J., and R. Stulz. 1996. How Different is Japanese Corporate Finance? An
Investigation of the Information Content of New Security Issues. Review of
Financial Studies 9:109–39.
Konishi, M. 2002. Bond Underwriting by Banks and Conflicts of Interest: Evidence
from Japan during the Pre-War Period. Journal of Banking & Finance 26:767–93.
Kroszner, R., and R. Rajan. 1994. Is the Glass-Steagall Act Justified? A Study of the
U.S. Experience with Universal Banking Before 1933. The American Economic
Review 84:810–832.
Kutsuna, K., J. Smith, and R. Smith. 2006. Banking Relationships and Access to Equity
Capital Markets: Evidence from Japan’s Main Bank System. Journal of Banking &
Finance 31:335–60.
Li, X., and R. Masulis. 2004. Venture Capital Investments by IPO Underwriters:
Certification, Alignment of Interest, or Moral Hazard? Working Paper (Vanderbilt

33
University).
Li, X., and X. Zhao. 2006. Propensity Score Matching and Abnormal Performance after
Seasoned Equity Offerings. Journal of Empirical Finance 13:351–70.
Lin, Y., S. You, and F. Lin. 2008. The Effects of Pre-issue Information Releases on
Seasoned Equity Offerings. Journal of Business Finance & Accounting
35:1138-1163.
Miller, M., and K. Rock. 1985. Dividend Policy under Asymmetric Information.
Journal of Finance 40:1031–51.
Myers, S., and N. Majluf. 1984. Corporate Financing and Investment Decisions when
Firms Have Information that Investors do not. Journal of Financial Economics
13:187–221.
Puri, M. 1994. The Long-Term Default Performance of Bank Underwritten Security
Issues. Journal of Banking & Finance 18:397–418.
Puri, M. 1996. Commercial Banks in Investment Banking Conflict of Interest or
Certification Role? Journal of Financial Economics 40:373–401.
Puri, M. 1999. Commercial Banks as Underwriters: Implications for the Going Public
Process. Journal of Financial Economics 54:133–63.
Rosenbaum, P., and D. Rubin. 1983. The Central Role of the Propensity Score in
Observational Studies for Causal Effects. Biometrika 70:41–55.
Suzuki, K. 2009. Equity Finance. In Contemporary Corporate Finance, Vol. 3, ed. H.
Hanaeda, and S. Sakakibara. Tyuoukeizai, pp. 83-110 (in Japanese).
Suzuki, K. 2010. Do the Equity Holding and Soundness of Bank Underwriters Affect
Issue Costs of SEOs? Journal of Banking & Finance 34:984–95.
Takaoka, S. and C. McKenzie. 2006. The Impact of Bank Entry in the Japanese

34
Corporate Bond Underwriting Market. Journal of Banking & Finance 30:59–83.
Walker, M., and K. Yost. 2008. Seasoned Equity Offerings: What Firms Say, Do, and
How the Market Reacts. Journal of Corporate Finance 14:376–86.
Yasuda, A. 2007. Bank Relationships and Underwriter Competition: Evidence from
Japan. Journal of Financial Economics 86:369–404.

35
Num % Num %
(a) (b) (b)/(a) (c) (c)/(a)
2000 44 18 40.91 26 59.09
2001 24 10 41.67 14 58.33
2002 27 12 44.44 15 55.56
2003 31 13 41.94 18 58.06
2004 87 49 56.32 38 43.68
2005 58 28 48.28 30 51.72
2006 49 21 42.86 28 57.14
2007 26 14 53.85 12 46.15
Total 346 165 47.69 181 52.31
This table reports the number of bank underwriter and investment houses underwriting for eachyear. The sample consists of 346 seasoned equity issues from January 2000 to December 2006. Abank underwriter is defined as a securities company in which the bank holds at least 20% equity.
Table 1. The number of seasoned equity offerings from 2000 to 2007
Bank Investment houseTotal sample
year
36
Total Sample Bank Investment house
SEO characteristicsCAR[-1 ~ +1] Mean -3.88 -3.30 -4.40 1.61
Median -3.68 -3.41 -3.78 1.33Std.dev 6.36 6.78 5.92
Capitalization Mean 189000 82700 286000 -1.37(mm yen) Median 24700 18800 28300 -2.84 ***
Std.dev 1390000 202000 1900000
Proceeds Mean 14200 8520 19400 -1.37(mm yen) Median 2710 2370 2880 -1.89 *
Std.dev 73400 20500 99500
RelSize Mean 0.13 0.14 0.12 3.60 ***Median 0.12 0.13 0.11 3.42 ***Std.dev 0.05 0.05 0.05
STDR Mean 3.20 3.25 3.15 0.57Median 2.84 2.91 2.75 0.30Std.dev 1.58 1.67 1.49
Days Mean 8.44 8.23 8.63 -1.23Median 7.00 7.00 7.00 1.42Std.dev 3.01 2.58 3.35
TobinQ Mean 3.01 2.83 3.17 -0.74Median 1.60 1.57 1.68 -1.33 *Std.dev 4.25 4.35 4.16
Major UW Mean 0.71 0.53 0.88 -7.78 ***
Intended use of proceedsPayment (%) Mean 35.26 35.15 35.36 -0.04
Investment (%) Mean 63.58 60.61 66.30 -1.10
Working capital (%) Mean 31.79 34.55 29.28 1.05
Observations 346 165 181
t -statistics,z -statistics
Table 2. Summary statistics for seasoned equity offerings
This table reports the summary statistics for each variables by subsamples. CAR is the cumulative abnormal return for which the characteristic-based benchmark model is used for the matching portfolio. Capitalization is the market value of the firm at the last day of the previous month.Proceeds is the amount of money firms earn by SEO. RelSize is the numver of offerd shared divided by the size of the existing market for thefirm's shares. STDR is defined as the standard deviation of daily stock returns over 120 trading days and ending 20 days prior to the offer.Days is defined as the numver if days between PD and ID. TobinQ is defined as the ratio of the market value to its total assets. Major UW isequal to one if the lead underwriter is a major underwriters, Nomura, Nikko, and Daiwa, and zero otherwise. Paymend takes a value one if theintended use of proceeds is a loan payment, and a value of zero otherwise. Investment takes a value equal to one if the intended use ofproceeds is the investment for facilities and a value of zero otherwise. Working capital is the dummy variable and takes a value equal to one ifthe intended use of proceeds is the working capital and a value of zero otherwise. Test statistics are t -test and Man-Whitney z -test results fordifference in mean and median. *** and * indicate statistical significance at the 0.01 and 0.1 levels, respectively.

37
Panel A. Intended use of the proceeds: repayment
Repayment Non-repayment(a) (b)
Total sample Mean -4.82 -3.37 2.04 **Median -4.88 -3.41 1.98 **Std.dev 6.32 6.34Obs. 122 224
Bank Mean (A) -4.96 -2.41 -2.34 **Median (B) -5.21 -2.44 -2.32 **Std.dev 6.62 6.73Obs. 58 107
Investment house Mean (C) -4.69 -4.25 -0.49Median (D) -3.74 -3.78 0.36Std.dev 6.09 5.85Obs. 64 117
t -statistics (A) - (C) -0.23 2.19**z -statistics (B) - (D) -0.40 2.05**
Panel B. Intended use of the proceeds: investment facilities
Investment Non-investment(a) (b)
Total sample Mean -3.59 -4.39 1.13Median -3.62 -3.81 1.28Std.dev 5.83 7.20Obs. 220 126
Bank Mean (A) -3.00 -3.77 0.71Median (B) -3.39 -3.84 0.91Std.dev 6.27 7.53Obs. 100 65
Investment house Mean (C) -4.08 -5.05 1.05Median (D) -3.78 -3.78 0.99Std.dev 5.40 6.84Obs.
t-statistics (A) - (C) 1.37 1.00z-statistics (B) - (D) 1.15 0.88
Table 3.Announcement returns by the intended use of the proceeds and the type of underwriter
t -statistics,z -statistics
CAR[-1~+1]
CAR[-1~+1]t -statistics,z -statistics

38
Panel C. Intended use of the proceeds: working capital
Working capital Non-working capital(a) (b)
Total sample Mean -4.52 -3.58 -1.28Median -5.04 -3.40 -1.62Std.dev 7.42 5.80Obs. 110 236
Bank Mean (A) -3.86 -3.01 -0.77Median (B) -3.94 -3.39 -0.81Std.dev 7.44 6.43Obs. 57 108
Investment house Mean (C) -5.23 -4.06 -1.20Median (D) -5.78 -3.40 -1.69 *Std.dev 7.41 5.18Obs. 53 128
t-statistics (A) - (C) 0.96 1.40z-statistics (B) - (D) 1.07 1.03
CAR[-1~+1]t -statistics,z -statistics
This table reports the cumulative abnormal returns in the three trading days around the announcement date (i.e., days -1, 0, and 1). Panel A divides the entire sample into the payment group and the non-payment group and compares theCAR with the payment group and the non-payment group. Panel B divides the entire sample into the investment groupand the non-investment group and compares the CAR with the investment group and the non-investment group. PanelC divides the entire sample into the working capital group and the non-working capital group and compares the CARwith the working capital group and the non-working capital group. Test statistics are t -test and Man-Whitney z -testresults for difference in mean and median. ** and * indicate statistical significance at the 0.05 and 0.1 levels,respectively.

39
(Obs = 346)
Bank 1.43 ** 2.30 *** 1.74 ** 2.60 ***(2.02) (2.68) (2.19) (2.72)
Main Bank -0.94 -0.90(-0.91) (-0.87)
Bank*Payment -2.64 * -2.61 *(-1.80) (-1.78)
Payment -1.18 -1.17 0.08 -1.14 0.09(-1.63) (-1.62) (0.08) (-1.58) (0.10)
Investment 0.15 0.24 0.18 0.16 0.10(0.19) (0.32) (0.24) (0.20) (0.13)
Working capital -0.16 -0.12 -0.28 -0.10 -0.25(-0.18) (-0.14) (-0.32) (-0.11) (-0.29)
ln(Capitalization) -0.02 -0.01 -0.01 0.04 0.04(-0.05) (-0.03) (-0.03) (0.15) (0.15)
RelSize -9.62 -11.63 -12.02 -10.98 -11.39(-1.25) (-1.51) (-1.54) (-1.42) (-1.46)
TobinQ -0.07 -0.06 -0.07 -0.06 -0.07(-0.37) (-0.32) (-0.42) (-0.30) (-0.39)
STDR -0.98 *** -0.98 *** -0.97 *** -1.01 *** -0.99 ***(-3.45) (-3.46) (-3.44) (-3.55) (-3.53)
Major UW -0.80 -0.23 -0.40 -0.31 -0.48(-1.00) (-0.27) (-0.47) (-0.36) (-0.55)
Days 0.09 0.13 0.15 0.12 0.15(0.22) (0.33) (0.40) (0.32) (0.39)
Exchange dummyYear dummy
Intercept -0.08 -1.38 -2.20 -2.41 -3.31(-0.01) (-0.19) (-0.30) (-0.33) (-0.44)
Adj-R2 0.08 0.09 0.10 0.09 0.10
This table reports the effect of bank underwriter and the intended use of proceeds on the announcement cumulative abnormalreturn. The dependent variable, CAR , represents the cumulative abnormal returns around the announcement date (day -1, 0, +1).Bank is the dummy variable which take the value of one if the underwriter is bank. Main Bank is the dummy variable thattakes the value of one if the bank underwriter's parent bank is the greatest lender to the issuer and zero otherwise. Paymendtakes the value of one if the intended use of proceeds which issuers disclose in the SEO prospectus is a loan payment, and zerootherwise. Bank *Payment is the interaction term of Bank and Payment . Ln(Capitalization ) is the natural logarithem ofmarket value at the last day of previous month. RelSize is the numver of offerd shared divided by the size of the existing marketfor the firm's shares. TobinQ is defined as the ratio of the market value to its total assets. STDR is deefined as the standarddeviation of daily stock returns over 120 trading days and ending 20 days prior to the offer. Major UW takes a value one if thelead underwriter is a major underwriters, Nomura, Nikko, and Daiwa, and zero otherwise. Days is defined as the numver ifdays between PD and ID. We also include Stock Exchange dummy and year dummy. Heteroskedasticity-adjusted t-statisticsare presented in parentheses below the regression coefficients. ***, **, and * indicate statistical significance at the 0.01, 0.05,and 0.1 levels, respectively.
yes yesyes yes yes
yesyesyes
yesyes
Model 1 Model 2 Model 5Model 3
Table 4.The effect of bank underwriter and the intended use of proceeds on the announcement return
Model 4

40
Mean Median Mean Median Mean Median
Loan relationshipyes 112 6.58 4.48 0.84 0.00 41.07 -3.48 -3.51no 53 0.36 0.00 22.64 -2.93 -3.04
Equity relationshipyes 52 4.68 3.50 2.17 2.09 40.38 -3.66 -3.22no 113 4.37 0.59 32.74 -3.14 -3.61
Note:
Table 5.Relationship between issuers and bank underwriters, loan repayment, and announcement returns
This table presents the relationship between issuers and bank underwriters, loan repayment, and announcement returns.The sample is restricted to issuers with bank underwriters. Upper (lower) rows divide the sample into groups dependingon whether a loan (equity) relationship existed between the firm and parent bank of the underwriter.
Bank loan ratio(%)
Bank equity ratio(%) Repayment
(%)
CAR[-1~+1] (%)

41
(Obs = 346)
Bank 1.03 1.91 ** 1.50 ** 2.35 ** 2.40 *(1.44) (2.56) (2.01) (2.56) (1.87)
Loan Share 0.10 * 0.11 ** 0.11 **(1.82) (2.21) (2.24)
Equity Share -0.81 ** -0.88 ** -0.86 **(-2.29) (-2.46) (-2.43)
Bank*Payment -2.61 *(-1.82)
LoanD -0.17(-0.12)
LoanD*Payment -2.96 *(-1.93)
NonLoanD*Payment -1.11(-0.49)
Payment -1.23 * -1.10 -1.16 * 0.07 0.06(-1.72) (-1.55) (-1.65) (0.07) (0.07)
Investment 0.41 0.18 0.37 0.32 0.26(0.54) (0.24) (0.48) (0.41) (0.33)
Working capital -0.20 -0.10 -0.20 -0.36 -0.22(-0.23) (-0.12) (-0.23) (-0.41) (-0.24)
ln(Capitalization) -0.09 0.08 0.00 -0.01 0.03(-0.31) (0.26) (-0.01) (-0.02) (0.10)
RelSize -10.65 -10.23 -9.02 -9.42 -12.45(-1.39) (-1.34) (-1.19) (-1.23) (-1.60)
TobinQ -0.04 -0.07 -0.05 -0.07 -0.08(-0.24) (0.37) (-0.29) (-0.37) (-0.42)
STDR -0.94 *** -1.04 *** -0.99 *** -0.97 *** -0.99 ***(-3.30) (-3.67) (-3.52) (-3.49) (-3.52)
Major UW -0.10 -0.49 -0.36 -0.51 -0.43(-0.11) (-0.57) (-0.42) (-0.60) (-0.49)
Days 0.12 0.13 0.13 0.15 0.15(0.31) (0.35) (0.32) (0.39) (0.38)
Exchange dummy yes yes yes yesYear dummy yes yes yes yes
Intercept -1.27 -2.96 -1.27 -2.00 -2.92(-0.16) (-0.40) (-0.18) (-0.29) (-0.40)
Adj-R2 0.09 0.10 0.11 0.11 0.09
yesyes
Table 6.The effect of concurrent loan and equity holdings by bank underwriters on announcement returns
This table reports the effect of bank underwriter and the intended use of proceeds on the announcement cumulative abnormal return. Thedependent variable, CAR , represents the cumulative abnormal returns around the announcement date (day -1, 0, +1). Bank is the dummy variablewhich take the value of one if the underwriter is bank. Loan Share is the share of outstanding loans made by bank. Equity Share is the equityshare held by the bank underwriter. Paymend takes the value of one if the intended use of proceeds which issuers disclose in the SEO prospectusis a loan payment, and zero otherwise. Bank *Payment is the interaction term of Bank and Payment . LoanD a dummy variable that take thevalue of one if the bank underwriter is concurrently lending and zero otherwise. LoanD *Payment is the interaction term of LoanD and Payment .NonLoanD *Payment is the interaction term of NonLoanD , which take the value of one if the underwriter is not concurrently lending and zerootherwise, and Payment . Ln(Capitalization ) is the natural logarithem of market value at the last day of previous month. RelSize is the numver ofofferd shared divided by the size of the existing market for the firm's shares. TobinQ is defined as the ratio of the market value to its total assets.STDR is deefined as the standard deviation of daily stock returns over 120 trading days and ending 20 days prior to the offer. Major UW takes avalue one if the lead underwriter is a major underwriters, Nomura, Nikko, and Daiwa, and zero otherwise. Days is defined as the numver if daysbetween PD and ID. We also include Stock Exchange dummy and year dummy. Heteroskedasticity-adjusted t-statistics are presented inparentheses below the regression coefficients. ***, **, and * indicate statistical significance at the 0.01, 0.05, and 0.1 levels, respectively.
Model 4Model 1 Model 2 Model 3 Model 5
42
Panel A. Comparison by type of underwriter
Bank Investment house(a) (b)
Mean -12.71 -8.09 -16.71 1.03Median -15.27 -10.51 -20.80 1.63Obs. 222 103 119
Panel B. Comparison by issuer’s loan repayment intents
Payment Nonpayment
(a) (b)
Mean -16.38 -10.65 -0.66Median -18.82 -12.22 -1.16Obs. 80 142
Table 7. Long-term returns by underwriter type and issuers’ loan repayment intents
ABHR 24
ABHR 24
(a)-(b)
(a)-(b)
t-statistics,z-statistics
t-statistics,z-statistics
Total sample
Panel C. Comparison by bank loan relationship
Loan Non loan(a) (b) (c)
Mean -16.71 5.72 -41.71 -2.68 *** -2.01 ** 3.23 ***Median -20.80 -1.20 -31.40 -2.73 *** -1.16 2.97 ***Obs. 119 73 30
Panel D. Comparison by bank equity relaitonship
Equity Non equity(a) (b) (c)
Mean -16.71 -6.56 -8.92 -0.96 -0.81 0.16Median -20.80 -16.65 -8.20 -0.87 -1.62 -0.35Obs. 119 36 67
Panel E. Comparison by bank loan relationship and issuers’ loan repayment intents
LoanD*Payment
LoanD*Nonpayment
(a) (b) (c)
Mean -16.71 -4.54 12.48 -1.07 -2.96 *** -1.18Median -20.80 -10.43 9.80 -1.23 -2.87 *** -1.42Obs. 119 29 44
(b)-(c)
t -statistics,z -statistics
Bank
t- statistics,z -statistics
t -statistics,z -statistics
t- statistics,z -statistics
(b)-(c)
ABHR is the 24 month abnormal buy and hold return, which propensity score matching method are used to identify the matching portfolio.Panel A reports the ABHR by the type of underwriter; which with banks or with investment houses. Panel B reports the ABHR by issuer'sloan payment intend. Panel C reports the ABHR by the type of the underwriter, and the loan relationship if the parents of underwriter isbank. Panel D reports the ABHR by the type of the underwriter, and the equity relationship if the parents of underwriter is bank. Panel Ereports the ABHR by the type of the underwriter, and the interaction term of LoanD and Payment (Nonpayment ), which take the value ofone if the firm has (does not has) loan relationship with bank underwriter, and zero otherwise. LoanD a dummy variable that take the valueof one if the bank underwriter is concurrently lending and zero otherwise. Test statistics are t -test and Man-Whitney z -test results fordifference in mean and median. *** and ** indicate statistical significance at the 0.01 and 0.05 levels, respectively.
ABHR 24 (a)-(b) (a)-(c) (b)-(c)
Investment houseBank
ABHR 24 (a)-(b) (a)-(c)
Investment houseBank t -statistics,
z -statisticst -statistics,z -statistics
t -statistics,z -statistics
t- statistics,z -statistics
Investment house t -statistics,z -statisticsABHR 24
(a)-(b) (a)-(c)

43
Bank underwriter Parent commercial bank Number of Firms Share (%)
Daiwa SMBC Securities i Mitsui Sumitomo Bank 87 25.14
Kokusai Securities f Tokyo Mitsubishi Bank 7 2.02
Mitsubishi Securities e Tokyo Mitsubishi Bank 8 2.31
Mitsubishi UFJ Securities x Mitsubishi Tokyo UFJ Bank 7 2.02
Mizuho Securities c Mizuho Corporate Bank 13 3.76
Mizuho investors Securities b Mizuho Bank 5 1.45
Shinko Securities a Mizuho Bank 22 6.36
SMBC Friend Securities h Sumitomo Bank 1 0.29
Tokyo Mitsubishi Securities g Tokyo Mitsubishi Bank 1 0.29
UFJ Tsubasa Securities d UFJ Bank 14 4.05
Note:Security company mergersApril 2000, Shinnihon Securities and Wako Securities formed Shinko SecuritiesOctorber 2000, Daiichi Kangyo Securities, Fuji Securities, and IBJ Securities formed Mizuho SecuritiesJuly 2001, Sanwa Securities and Tokai International Securities formed UFJ Capital Markets SecuritiesJune 2002, Tsubasa Securities and UFJ Capital Markets Securities formed UFJ Tsubasa SecuritiesSeptember 2002, Kokusai Securities, Tokyo Mitsubishi Securities, and Tokyo Mitsubishi Personal Securities formed Mitsubishi SecuritiesApril 2003, Meiko National Securities and Sakura Frend Securities formed SMBC Friend SecuritiesOctorber 2005, Mitsubishi Securities and UFJ Tsubasa Securities formed Mitsubishi UFJ Securities
Table A1.Bank Underwriter and Market Share

44
Coeff.
BANKINFO 0.85 1.98 **Payment -1.15 -1.60Investment 0.24 0.32Working capital -0.12 -0.14ln(Capitalization) -0.03 -0.10RelSize -9.94 -1.29TobinQ -0.06 -0.34STDR -0.98 -3.46 ***Major UW -0.78 -0.97Days 0.10 0.26
Exchange dummyYear dummy
Intercept 3.22 0.98
Adj-R2
Note:
0.09
This table reports the effect of bank underwriter and the intended use of proceeds on the announcementcumulative abnormal return. The dependent variable, CAR, represents the cumulative abnormal returnsaround the announcement date (day -1, 0, +1). BANKINFO is the selectivity bias adjustments bankvariable. Paymend takes the value of one if the intended use of proceeds which issuers disclose in theSEO prospectus is a loan payment, and zero otherwise. Bank*Payment is the interaction term of Bankand Payment. Ln(Capitalization) is the natural logarithm of market value at the last day of previousmonth. RelSize is the numver of offerd shared divided by the size of the existing market for the firm'sshares. TobinQ is defined as the ratio of the market value to its total assets. STDR is deefined as thestandard deviation of daily stock returns over 120 trading days and ending 20 days prior to the offer.Major UW takes a value one if the lead underwriter is a major underwriters, Nomura, Nikko, and Daiwa,and zero otherwise. Days is defined as the numver if days between PD and ID. We also include StockExchange dummy and year dummy. Heteroskedasticity-adjusted t-statistics are presented in parenthesesbelow the regression coefficients. *** and ** indicate statistical significance at the 0.01 and 0.05 levels,respectively.
The effect of the bank underwriter on the announcement returns: selectivity bias adjustmentsTable A2.
(Obs = 346)t-statistics
Two-step
yesyes