Embed Size (px)
Citation preview

budgetplan
Budget
March 30, 2010
2010-2011 BudgetBudget Plan
Legal deposit - Bibliothèque et Archives nationales du QuébecMarch 2010ISBN 978-2-551-23931-3 (Print)ISBN 978-2-550-58438-4 (PDF)
© Gouvernement du Québec, 2010
This document is printed on completely recycled paper, made in Québec, contaning 100% post-consumer fibre and produced without elemental chlorine.
100%
2010-2011 Budget
Budget Plan
SECTION A The Government’s Economic and Fiscal Policy Directions
SECTION B The Québec Economy: Recent Developments and Outlook for 2010 and 2011
SECTION C The Government’s Financial Framework
SECTION D Debt, Financing and Debt Management
SECTION E Update on Federal Transfers
SECTION F Report on the Application of the Balanced Budget Act
SECTION G Report on the Application of the Act to reduce the debt and establish the Generations Fund
SECTION H Report on the Funding of Public Services
SECTION I Additional Information – Historical Data

A.1
Section A
A The Government’s Economic and Fiscal Policy Directions
INTRODUCTION ........................................................................................................ A.3
1. THE ECONOMIC AND BUDGETARY SITUATION........................................................ A.5
1.1 The recovery is well underway ................................................................... A.5 1.2 Deficits of $4.3 billion in 2009-2010 and $4.5 billion
in 2010-2011 ............................................................................................. A.7 2. RETURN TO BUDGET BALANCE AND REDUCE THE DEBT........................................A.11
2.1 Budget balance must restored ................................................................A.11 2.2 A plan that restores budget balance in 2013-2014 ..............................A.13 2.3 Sustained efforts to reduce the debt ......................................................A.15
2.3.1 Revenue from the rise in the price of heritage pool electricity deposited in the Generations Fund..............................................................................................A.16
2.3.2 Revision of debt reduction objectives ........................................A.17 3. CONTINUE WITH THE GOVERNMENT’S STRATEGY: SECURE THE
RECOVERY AND STAY THE COURSE ON RESTORING BUDGET BALANCE .......................................................................................................A.19
3.1 Relying on measures already in place to secure the recovery.....................................................................................................A.19 3.1.1 Continuation of the action plan ..................................................A.20 3.1.2 New initiatives to develop the full potential of
our economy ................................................................................A.23 3.2 Stay the course on returning to budget balance: a
challenge within our reach.......................................................................A.25
A.2
4. IMPLEMENTATION OF THE PLAN TO RETURN TO BUDGET BALANCE........................A.31
4.1 Review of the measures announced in March 2009............................ A.32 4.2 Additional steps to restore budget balance........................................... A.33
4.2.1 More than 90% of the effort already identified ........................ A.37 4.2.2 Breakdown of the efforts to return to budget
balance: 62% for the government, 38% for taxpayers ..................................................................................... A.38
4.3 The benefits of the Plan to return to budget balance ........................... A.40 CONCLUSION.........................................................................................................A.45
APPENDIX ............................................................................................................A.47
The Government’s Economic and Fiscal Policy Directions A.3
ASection
INTRODUCTION Following an historic financial crisis and a deep recession, the global economy has resumed growing. However, Québec’s economy suffered less than its main partners.
In the 2010-2011 Budget, the government is continuing to implement its vigorous economic action plan that has played a crucial role to sustain the economy and employment and thus underpin the recovery.
⎯ For 2009 and 2010, $15 billion is being injected into the economy, the equivalent of 4.9% of GDP.
The government is also taking additional substantial steps as part of the implementation of the Plan to return to budget balance now that the recovery is fully underway. Following three quarters of contraction, Québec's economy resumed growing in the third quarter of 2009.
⎯ Between July 2009 and February 2010, 50 100 were created. For 2010 and 2011, real GDP is expected to gain 2.3% and 2.6% respectively.
As far as public finances are concerned, Québec faces the same challenges as its neighbours. The recession has left an annual shortfall in excess of $4 billion that must gradually be eliminated. However, Québec must deal with a heavier debt load than anywhere else in Canada. Its demographic situation is also unique in North America with a potential labour pool, i.e. its population age 15 to 64, set to decline starting in 2014. This situation allows no other choice than to return to budget balance by 2013-2014, as the Balanced Budget Act stipulates.
In this spirit, the government intends to:
⎯ maintain the recovery efforts already in place to support the economy in 2010 and consolidate the recovery;
⎯ take the necessary steps to return to budget balance by 2013-2014, i.e. at the time it will have to deal with the decline in the working-age population;
⎯ implement new initiatives to, in the longer term, develop the economy’s full potential and reduce the debt.
Given that the impact of the recession was less severe in Québec, the government is seizing this opportunity to position itself favourably compared to its economic partners as we enter this period of economic growth.

The Government’s Economic and Fiscal Policy Directions A.5
ASection
1. THE ECONOMIC AND BUDGETARY SITUATION Following the most severe recession since the Great Depression, the global economy began recovering in the second half of 2009. The return to growth was buoyed by exceptional monetary easing, support for the financial system and fiscal stimulus.
⎯ The recovery is also well underway in Québec. After dropping 1.4% in 2009, real GDP is expected to rise 2.3% in 2010 and 2.6% in 2011.
1.1 The recovery is well underway
As was the case with its main trading partners, economic activity bounced back in Québec in the third quarter of 2009. Québec withstood the global economic recession better than its main trading partners. In particular, the decline in output and employment was less severe in Québec than in Ontario, Canada and the United States.
After dropping 1.4% in 2009, real GDP is expected to gain 2.3% in 2010, fuelled by American demand for Québec products, the recovery in consumer spending and investments by governments. In 2011, the anticipated upturn in business non-residential investment will boost economic growth in Québec to a projected 2.6%.
⎯ The recession will have been a little more severe than expected at the time of the 2009-2010 Budget, when a decline of 1.2% in real GDP was anticipated for 2009.
⎯ Nonetheless, the recovery will exceed last year’s economic growth forecast for 2010 of 1.9%.
Economic recovery should be accompanied by the creation of 38 700 jobs in 2010 and 41 600 jobs in 2011. TABLE A.1 Economic growth in Québec (real GDP, annual percentage change)
2009 2010 2011
2010-2011 Budget − 1.4 2.3 2.6
Update – Fall 2009 − 1.5 1.7 2.6
2009-2010 Budget − 1.2 1.9 2.6
Sources: Institut de la statistique du Québec and Ministère des Finances du Québec.
2010-2011 Budget A.6 Budget Plan
All told, the decline in output in Québec in late 2008 and in 2009 will leave traces, despite the substantial rebound in growth that will ensue. While growth in output over the next four years will exceed the historical trend that will not be enough to recover, over the forecast period, the production lost as a result of the recession.
⎯ Relative to the values forecast in the 2008-2009 Budget, projected nominal GDP will be $17 billion lower in 2010 and $13 billion lower in 2014.
The Government’s Economic and Fiscal Policy Directions A.7
ASection
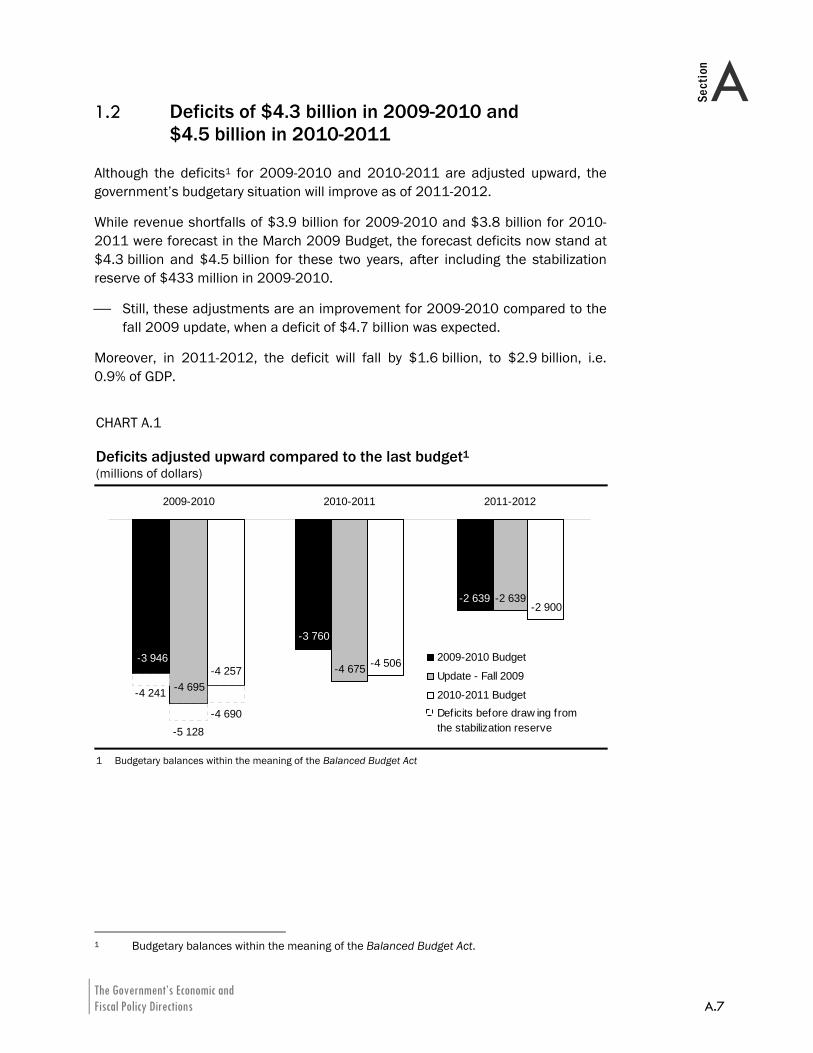
1.2 Deficits of $4.3 billion in 2009-2010 and $4.5 billion in 2010-2011
Although the deficits1 for 2009-2010 and 2010-2011 are adjusted upward, the government’s budgetary situation will improve as of 2011-2012.
While revenue shortfalls of $3.9 billion for 2009-2010 and $3.8 billion for 2010-2011 were forecast in the March 2009 Budget, the forecast deficits now stand at $4.3 billion and $4.5 billion for these two years, after including the stabilization reserve of $433 million in 2009-2010.
⎯ Still, these adjustments are an improvement for 2009-2010 compared to the fall 2009 update, when a deficit of $4.7 billion was expected.
Moreover, in 2011-2012, the deficit will fall by $1.6 billion, to $2.9 billion, i.e. 0.9% of GDP.
CHART A.1 Deficits adjusted upward compared to the last budget1 (millions of dollars)
-3 946
-4 695-4 257
-2 639
-3 760
-2 639
-4 675
-2 900
-4 506
2009-2010 2010-2011 2011-2012
2009-2010 Budget
Update - Fall 2009
2010-2011 Budget
-4 257-4 695
-3 946
-4 241
-5 128-4 690 Deficits before draw ing from
the stabilization reserve
1 Budgetary balances within the meaning of the Balanced Budget Act
1 Budgetary balances within the meaning of the Balanced Budget Act.
2010-2011 Budget A.8 Budget Plan
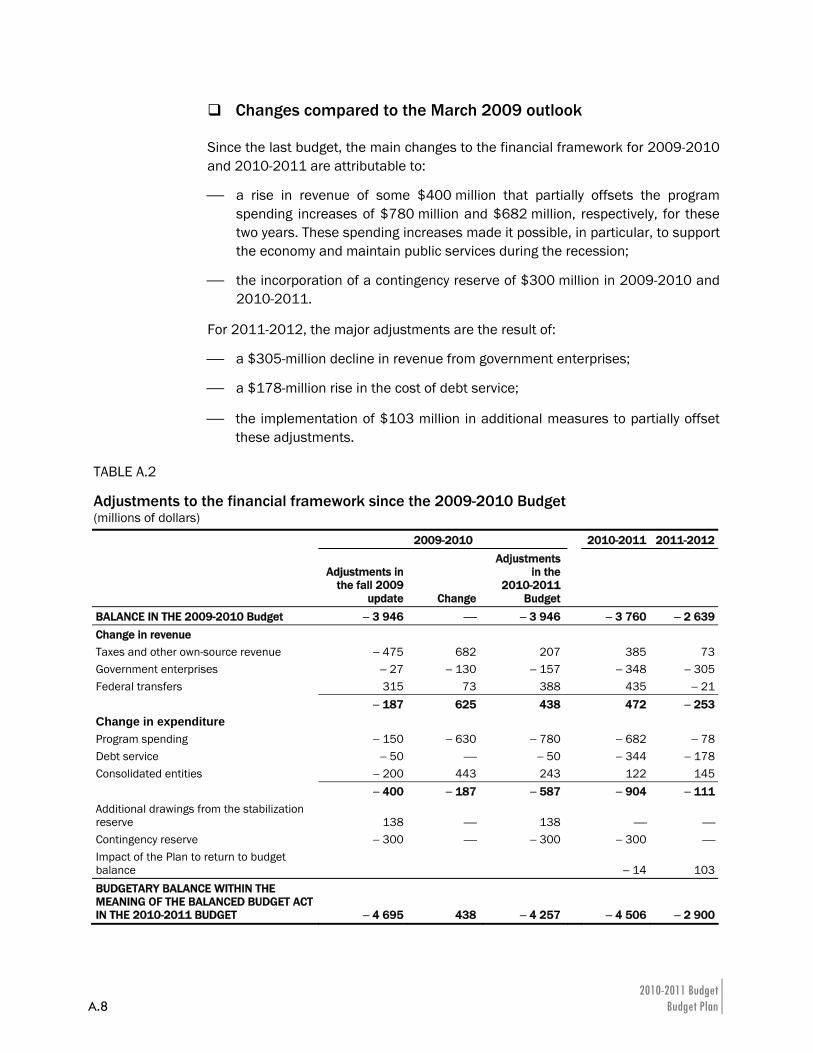
Changes compared to the March 2009 outlook
Since the last budget, the main changes to the financial framework for 2009-2010 and 2010-2011 are attributable to:
⎯ a rise in revenue of some $400 million that partially offsets the program spending increases of $780 million and $682 million, respectively, for these two years. These spending increases made it possible, in particular, to support the economy and maintain public services during the recession;
⎯ the incorporation of a contingency reserve of $300 million in 2009-2010 and 2010-2011.
For 2011-2012, the major adjustments are the result of:
⎯ a $305-million decline in revenue from government enterprises;
⎯ a $178-million rise in the cost of debt service;
⎯ the implementation of $103 million in additional measures to partially offset these adjustments.
TABLE A.2 Adjustments to the financial framework since the 2009-2010 Budget (millions of dollars)
2009-2010 2010-2011 2011-2012
Adjustments in the fall 2009
update Change
Adjustments in the
2010-2011 Budget
BALANCE IN THE 2009-2010 Budget − 3 946 ⎯ − 3 946 − 3 760 − 2 639Change in revenue Taxes and other own-source revenue − 475 682 207 385 73Government enterprises − 27 − 130 − 157 − 348 − 305Federal transfers 315 73 388 435 − 21 − 187 625 438 472 − 253Change in expenditure Program spending − 150 − 630 − 780 − 682 − 78Debt service − 50 ⎯ − 50 − 344 − 178Consolidated entities − 200 443 243 122 145 − 400 − 187 − 587 − 904 − 111Additional drawings from the stabilization reserve 138 ⎯ 138 ⎯ ⎯Contingency reserve − 300 ⎯ − 300 − 300 ⎯Impact of the Plan to return to budget balance − 14 103BUDGETARY BALANCE WITHIN THE MEANING OF THE BALANCED BUDGET ACT IN THE 2010-2011 BUDGET − 4 695 438 − 4 257 − 4 506 − 2 900
The Government’s Economic and Fiscal Policy Directions A.9
ASection
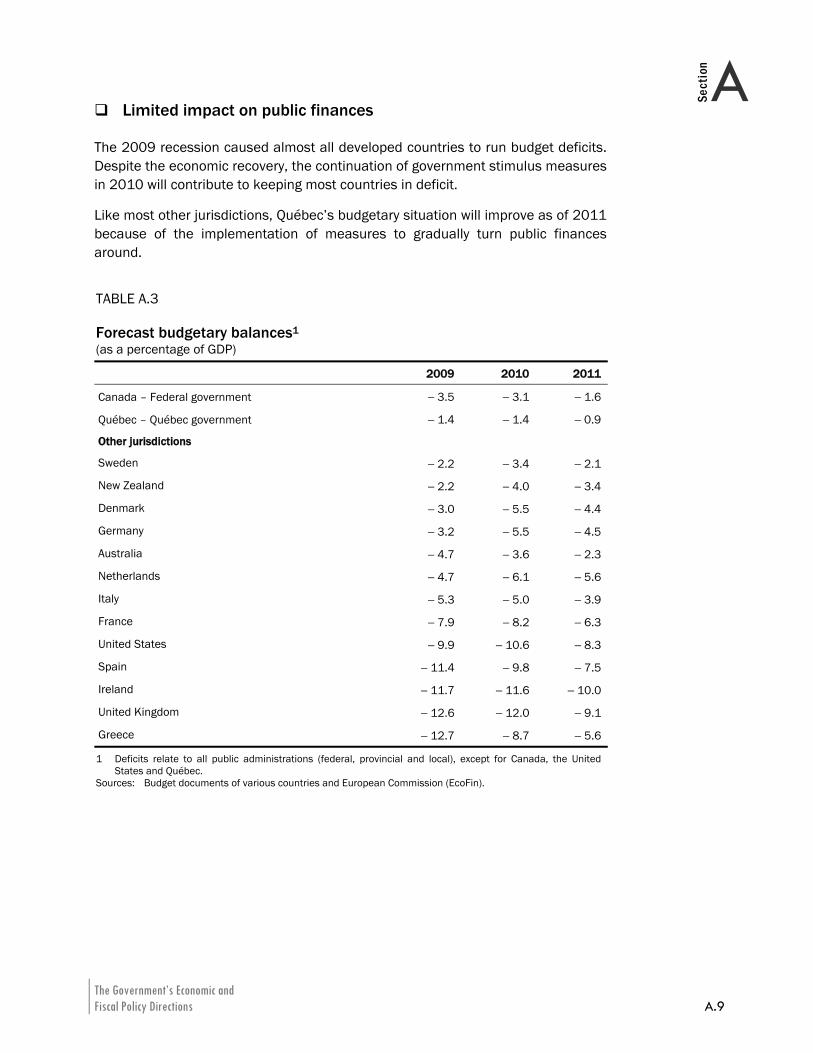
Limited impact on public finances
The 2009 recession caused almost all developed countries to run budget deficits. Despite the economic recovery, the continuation of government stimulus measures in 2010 will contribute to keeping most countries in deficit.
Like most other jurisdictions, Québec’s budgetary situation will improve as of 2011 because of the implementation of measures to gradually turn public finances around.
TABLE A.3 Forecast budgetary balances1 (as a percentage of GDP)
2009 2010 2011
Canada – Federal government − 3.5 − 3.1 − 1.6
Québec – Québec government − 1.4 − 1.4 − 0.9
Other jurisdictions
Sweden − 2.2 − 3.4 − 2.1
New Zealand − 2.2 − 4.0 − 3.4
Denmark − 3.0 − 5.5 − 4.4
Germany − 3.2 − 5.5 − 4.5
Australia − 4.7 − 3.6 − 2.3
Netherlands − 4.7 − 6.1 − 5.6
Italy − 5.3 − 5.0 − 3.9
France − 7.9 − 8.2 − 6.3
United States − 9.9 − 10.6 − 8.3
Spain − 11.4 − 9.8 − 7.5
Ireland − 11.7 − 11.6 − 10.0
United Kingdom − 12.6 − 12.0 − 9.1
Greece − 12.7 − 8.7 − 5.6
1 Deficits relate to all public administrations (federal, provincial and local), except for Canada, the United States and Québec.
Sources: Budget documents of various countries and European Commission (EcoFin).

The Government’s Economic and Fiscal Policy Directions A.11
ASection
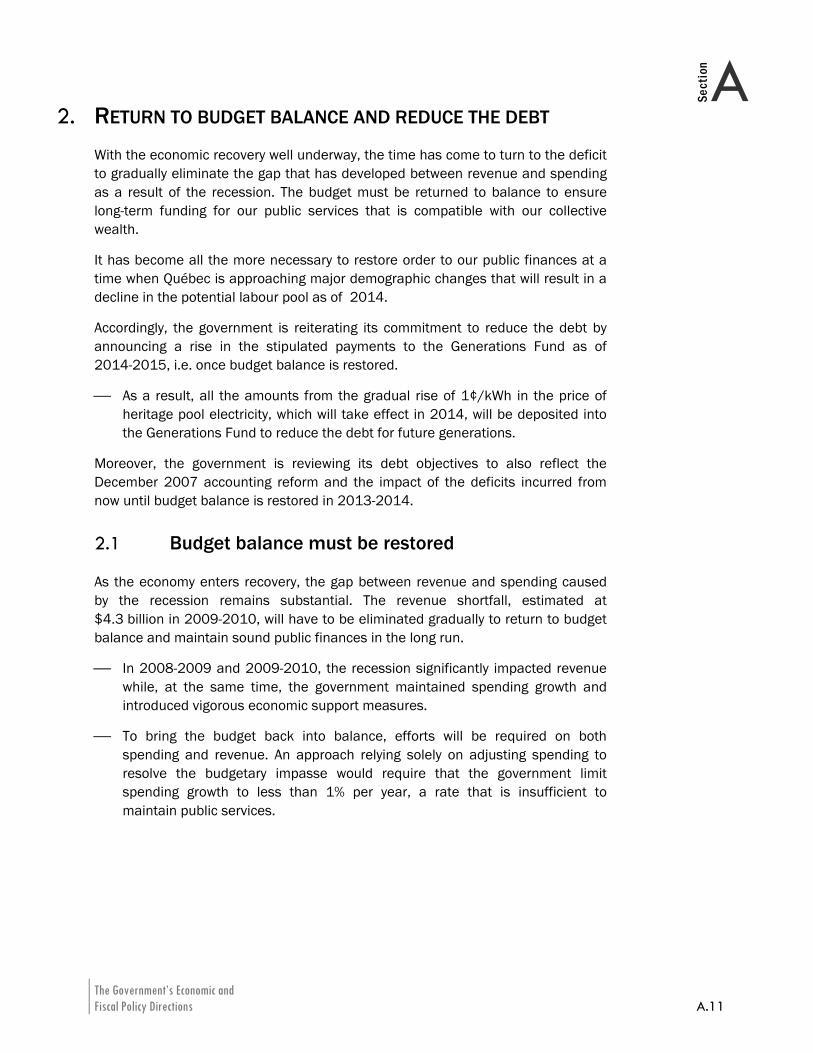
2. RETURN TO BUDGET BALANCE AND REDUCE THE DEBT With the economic recovery well underway, the time has come to turn to the deficit to gradually eliminate the gap that has developed between revenue and spending as a result of the recession. The budget must be returned to balance to ensure long-term funding for our public services that is compatible with our collective wealth.
It has become all the more necessary to restore order to our public finances at a time when Québec is approaching major demographic changes that will result in a decline in the potential labour pool as of 2014.
Accordingly, the government is reiterating its commitment to reduce the debt by announcing a rise in the stipulated payments to the Generations Fund as of 2014-2015, i.e. once budget balance is restored.
⎯ As a result, all the amounts from the gradual rise of 1¢/kWh in the price of heritage pool electricity, which will take effect in 2014, will be deposited into the Generations Fund to reduce the debt for future generations.
Moreover, the government is reviewing its debt objectives to also reflect the December 2007 accounting reform and the impact of the deficits incurred from now until budget balance is restored in 2013-2014.
2.1 Budget balance must be restored
As the economy enters recovery, the gap between revenue and spending caused by the recession remains substantial. The revenue shortfall, estimated at $4.3 billion in 2009-2010, will have to be eliminated gradually to return to budget balance and maintain sound public finances in the long run.
⎯ In 2008-2009 and 2009-2010, the recession significantly impacted revenue while, at the same time, the government maintained spending growth and introduced vigorous economic support measures.
⎯ To bring the budget back into balance, efforts will be required on both spending and revenue. An approach relying solely on adjusting spending to resolve the budgetary impasse would require that the government limit spending growth to less than 1% per year, a rate that is insufficient to maintain public services.
2010-2011 Budget A.12 Budget Plan
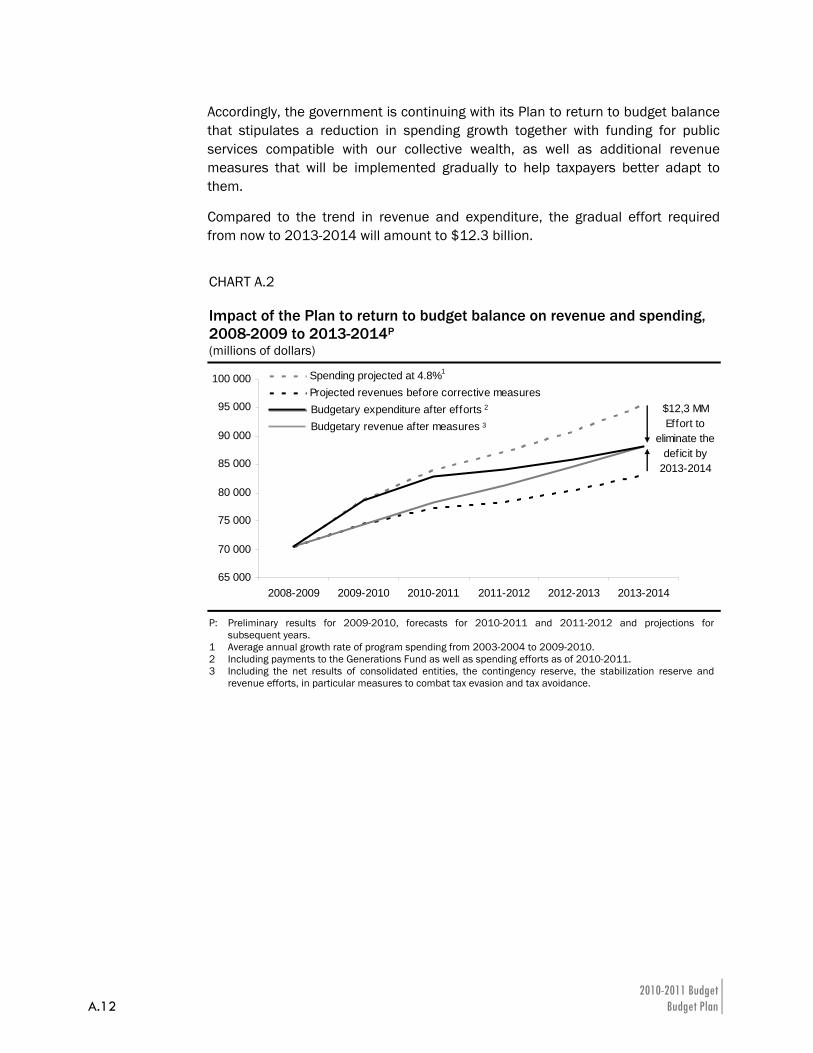
Accordingly, the government is continuing with its Plan to return to budget balance that stipulates a reduction in spending growth together with funding for public services compatible with our collective wealth, as well as additional revenue measures that will be implemented gradually to help taxpayers better adapt to them.
Compared to the trend in revenue and expenditure, the gradual effort required from now to 2013-2014 will amount to $12.3 billion.
CHART A.2 Impact of the Plan to return to budget balance on revenue and spending, 2008-2009 to 2013-2014P (millions of dollars)
65 000
70 000
75 000
80 000
85 000
90 000
95 000
100 000
2008-2009 2009-2010 2010-2011 2011-2012 2012-2013 2013-2014
Spending projected at 4.8%Projected revenues before corrective measuresBudgetary expenditure after effortsBudgetary revenue after measures
$12,3 MMEffort to
eliminate the deficit by
2013-2014
Budgetary expenditure after effortsBudgetary revenue after measures
2
3
1
P: Preliminary results for 2009-2010, forecasts for 2010-2011 and 2011-2012 and projections for subsequent years.
1 Average annual growth rate of program spending from 2003-2004 to 2009-2010. 2 Including payments to the Generations Fund as well as spending efforts as of 2010-2011. 3 Including the net results of consolidated entities, the contingency reserve, the stabilization reserve and
revenue efforts, in particular measures to combat tax evasion and tax avoidance.
The Government’s Economic and Fiscal Policy Directions A.13
ASection
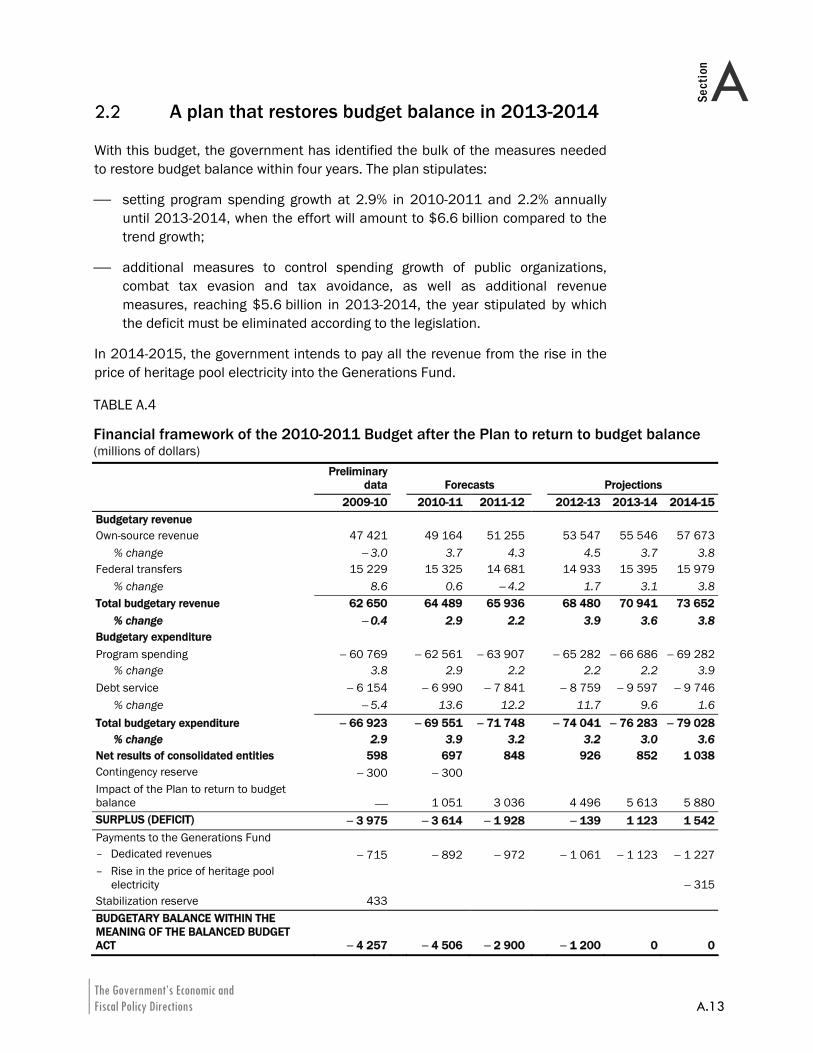
2.2 A plan that restores budget balance in 2013-2014
With this budget, the government has identified the bulk of the measures needed to restore budget balance within four years. The plan stipulates:
⎯ setting program spending growth at 2.9% in 2010-2011 and 2.2% annually until 2013-2014, when the effort will amount to $6.6 billion compared to the trend growth;
⎯ additional measures to control spending growth of public organizations, combat tax evasion and tax avoidance, as well as additional revenue measures, reaching $5.6 billion in 2013-2014, the year stipulated by which the deficit must be eliminated according to the legislation.
In 2014-2015, the government intends to pay all the revenue from the rise in the price of heritage pool electricity into the Generations Fund. TABLE A.4 Financial framework of the 2010-2011 Budget after the Plan to return to budget balance (millions of dollars)
Preliminary
data Forecasts Projections 2009-10 2010-11 2011-12 2012-13 2013-14 2014-15Budgetary revenue Own-source revenue 47 421 49 164 51 255 53 547 55 546 57 673 % change − 3.0 3.7 4.3 4.5 3.7 3.8Federal transfers 15 229 15 325 14 681 14 933 15 395 15 979 % change 8.6 0.6 − 4.2 1.7 3.1 3.8Total budgetary revenue 62 650 64 489 65 936 68 480 70 941 73 652 % change − 0.4 2.9 2.2 3.9 3.6 3.8Budgetary expenditure Program spending − 60 769 − 62 561 − 63 907 − 65 282 − 66 686 − 69 282 % change 3.8 2.9 2.2 2.2 2.2 3.9Debt service − 6 154 − 6 990 − 7 841 − 8 759 − 9 597 − 9 746 % change − 5.4 13.6 12.2 11.7 9.6 1.6Total budgetary expenditure − 66 923 − 69 551 − 71 748 − 74 041 − 76 283 − 79 028 % change 2.9 3.9 3.2 3.2 3.0 3.6Net results of consolidated entities 598 697 848 926 852 1 038Contingency reserve − 300 − 300 Impact of the Plan to return to budget balance ⎯ 1 051 3 036 4 496 5 613 5 880SURPLUS (DEFICIT) − 3 975 − 3 614 − 1 928 − 139 1 123 1 542Payments to the Generations Fund – Dedicated revenues − 715 − 892 − 972 − 1 061 − 1 123 − 1 227– Rise in the price of heritage pool
electricity − 315Stabilization reserve 433 BUDGETARY BALANCE WITHIN THE MEANING OF THE BALANCED BUDGET ACT − 4 257 − 4 506 − 2 900 − 1 200 0 0
2010-2011 Budget A.14 Budget Plan
The Balanced Budget Act
In the fall of 2009, the National Assembly passed a bill amending the Balanced Budget Act to stipulate, in particular, a gradual elimination of the deficit. The Act specifies that the deficit must be eliminated by 2013-2014.
The Act also stipulates that, no later than the 2011-2012 Budget, the government will have to set definitive declining deficit objectives for 2011-2012 and 2012-2013. Once set, these objectives must be met and any overrun will have to be offset.
Revision of the deficit objective for 2011-2012
To limit the additional impact on taxpayers of the efforts to return to budget balance and ensure that public services are maintained, the government is revising the 2011-2012 deficit target upward. This revision is consistent with the approach described in the March 2009 Budget calling for the gradual introduction of measures to control spending and enhance revenue, without undermining economic recovery.
Accordingly, the shortfall for the year now stands at $2.9 billion compared with the target of $2.6 billion stipulated in the March 2009 Budget. The objective of $1.2 billion for 2012-2013 is maintained and the deficit is still expected to be eliminated by 2013-2014, as stipulated in the Act.
Sizeable deficits to be offset because of the recession
With the latest revisions to the financial framework, the total deficits to be offset, until 2013-2014, stand at $12.9 billion, slightly less than the $13.2 billion expected in the October 2009 economic and financial update.
⎯ It should be mentioned that in the March 2009 Budget, the government had forecast a cumulative revenue shortfall of $11.5 billion from 2009-2010 to 2013-2014.
The Government’s Economic and Fiscal Policy Directions A.15
ASection
2.3 Sustained efforts to reduce the debt
Despite the deficit situation, the government is reiterating its commitment to continue with its efforts to reduce the debt load. Accordingly, it intends to:
⎯ maintain, as stipulated, its payments to the Generations Fund from now until 2013-2014, i.e. when the budget is balanced once again;
⎯ step up, as of 2014-2015, debt repayment efforts by paying the revenue from the rise in the price of heritage pool electricity into the Generations Fund;
⎯ review its debt reduction objectives.
2010-2011 Budget A.16 Budget Plan
2.3.1 Revenue from the rise in the price of heritage pool electricity deposited in the Generations Fund
In the March 23, 2006 Budget Speech, the Minister of Finance announced the creation of the Generations Fund. This is a fund in which the government deposits dedicated revenue that will eventually be used to make debt repayments.
In spite of the deficits expected over the next few years, the government is continuing with its debt reduction efforts and, consequently:
⎯ will maintain the stipulated annual payments of dedicated revenue;
⎯ deposit, as of 2014-2015, all the revenue from the gradual rise, over five years, in the price of heritage pool electricity into the Generations Fund;
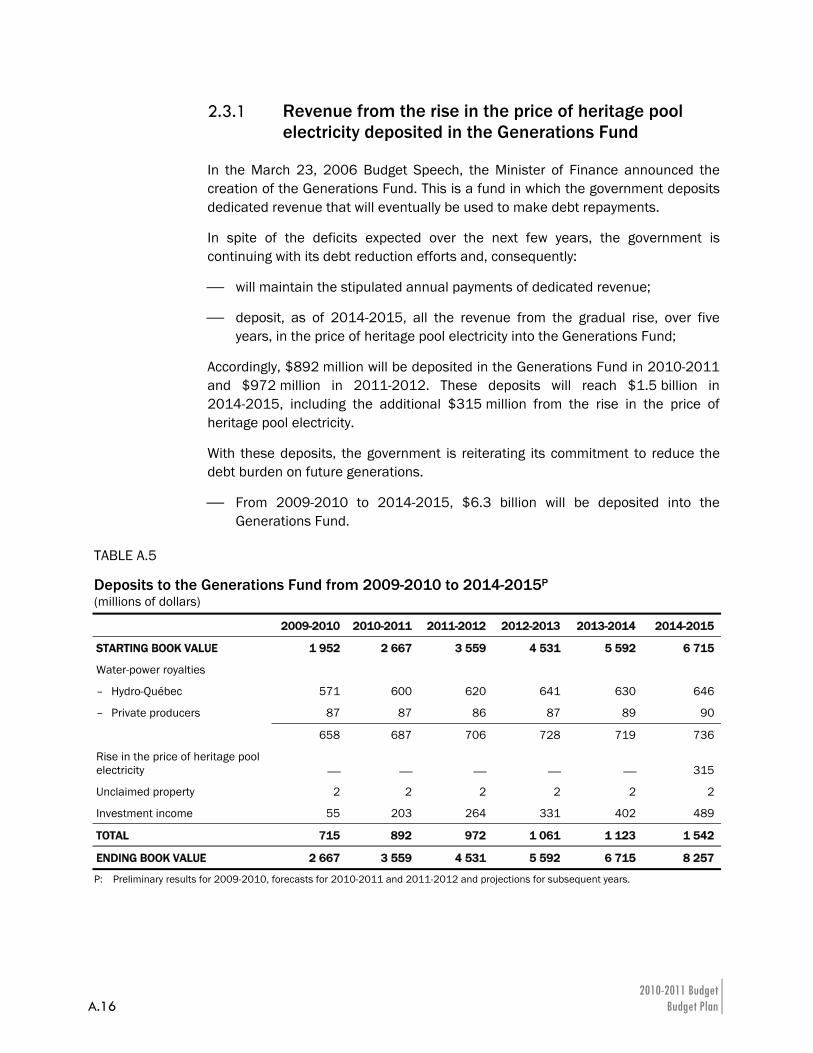
Accordingly, $892 million will be deposited in the Generations Fund in 2010-2011 and $972 million in 2011-2012. These deposits will reach $1.5 billion in 2014-2015, including the additional $315 million from the rise in the price of heritage pool electricity.
With these deposits, the government is reiterating its commitment to reduce the debt burden on future generations.
⎯ From 2009-2010 to 2014-2015, $6.3 billion will be deposited into the Generations Fund.
TABLE A.5 Deposits to the Generations Fund from 2009-2010 to 2014-2015P (millions of dollars)
2009-2010 2010-2011 2011-2012 2012-2013 2013-2014 2014-2015
STARTING BOOK VALUE 1 952 2 667 3 559 4 531 5 592 6 715
Water-power royalties
– Hydro-Québec 571 600 620 641 630 646
– Private producers 87 87 86 87 89 90
658 687 706 728 719 736
Rise in the price of heritage pool electricity ⎯ ⎯ ⎯ ⎯ ⎯ 315
Unclaimed property 2 2 2 2 2 2
Investment income 55 203 264 331 402 489
TOTAL 715 892 972 1 061 1 123 1 542
ENDING BOOK VALUE 2 667 3 559 4 531 5 592 6 715 8 257
P: Preliminary results for 2009-2010, forecasts for 2010-2011 and 2011-2012 and projections for subsequent years.
The Government’s Economic and Fiscal Policy Directions A.17
ASection
2.3.2 Revision of debt reduction objectives
When the Generations Fund was created, the objective was for total government debt to represent 25% of GDP by March 31, 2026. This objective was written into the Act to reduce the debt and establish the Generations Fund, passed June 15, 2006.
⎯ The objectives set in the Act apply to the government’s “total debt”. This debt concept corresponded to the government reporting entity at the time the Act was passed.
In December 2007, the government carried out a major accounting reform. In particular, this reform expanded the reporting entity to include institutions of the health and social services network and most institutions of the education network. A new concept of debt, the gross debt, was then created, corresponding to the new reporting entity.
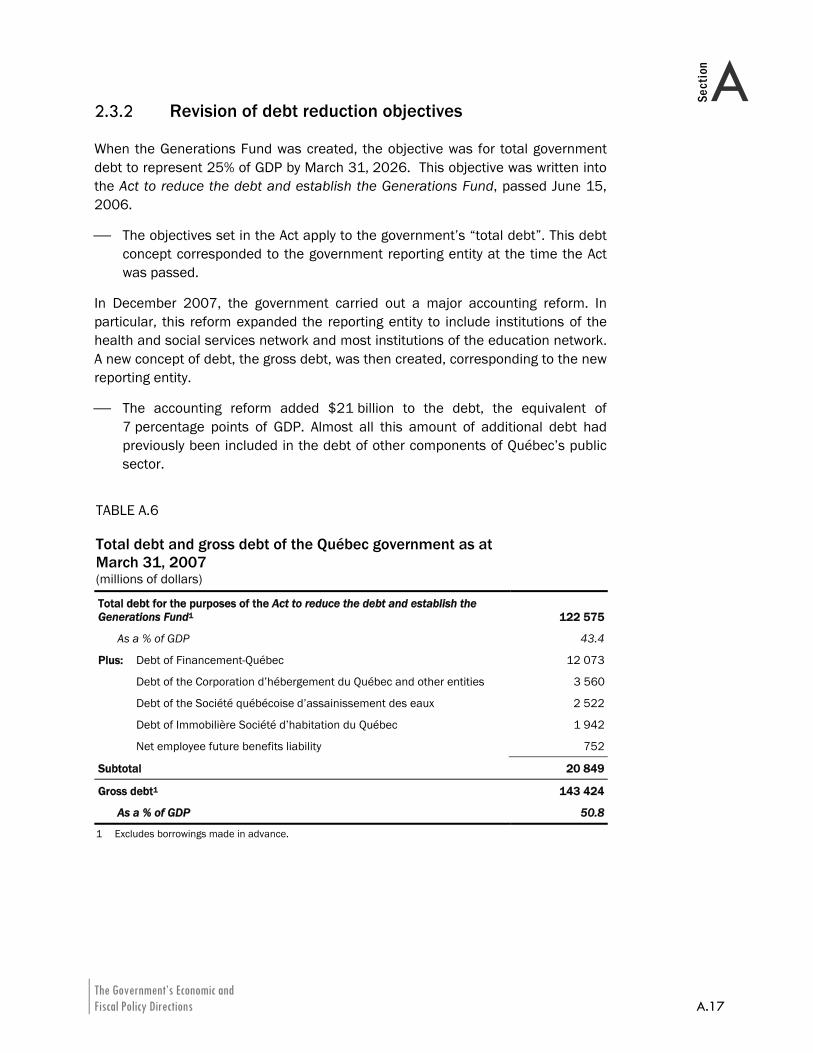
⎯ The accounting reform added $21 billion to the debt, the equivalent of 7 percentage points of GDP. Almost all this amount of additional debt had previously been included in the debt of other components of Québec’s public sector.
TABLE A.6 Total debt and gross debt of the Québec government as at March 31, 2007 (millions of dollars)
Total debt for the purposes of the Act to reduce the debt and establish the Generations Fund1 122 575
As a % of GDP 43.4
Plus: Debt of Financement-Québec 12 073
Debt of the Corporation d’hébergement du Québec and other entities 3 560
Debt of the Société québécoise d’assainissement des eaux 2 522
Debt of Immobilière Société d’habitation du Québec 1 942
Net employee future benefits liability 752
Subtotal 20 849
Gross debt1 143 424
As a % of GDP 50.8
1 Excludes borrowings made in advance.
2010-2011 Budget A.18 Budget Plan
Moreover, the recession will leave budget deficits totalling almost $13 billion from 2009-2010 to 2012-2013 that will add to the debt.
Accordingly, as stipulated in last year’s budget, the Act to reduce the debt and establish the Generations Fund will be amended to revise the debt reduction objectives.
Discussions on the debt in recent years have distinguished between “good” and “bad” debt.
Good debt is the debt contracted to acquire an asset, for instance to build a road, school or hospital. Bad debt is debt that does not correspond to an asset. Priority must be given to dealing with that debt.
⎯ As at March 31, 2010, the debt representing accumulated deficits, i.e. the bad debt, is expected to reach $106.6 billion, equivalent to 35.4% of GDP.
The government’s first objective is to cut that percentage in half, to 17% by 2025-2026. That is a maximum level.
A second objective will focus on the gross debt. As at March 31, 2010, the gross debt is expected to reach $160.1 billion, equivalent to 53.2% of GDP. This percentage is forecast to reach a maximum of 55.1% of GDP in 2011-2012 before beginning to decline.
The government’s objective is to reduce gross debt as a percentage of GDP to 45% by 2025-2026. Once again, that is a maximum level.
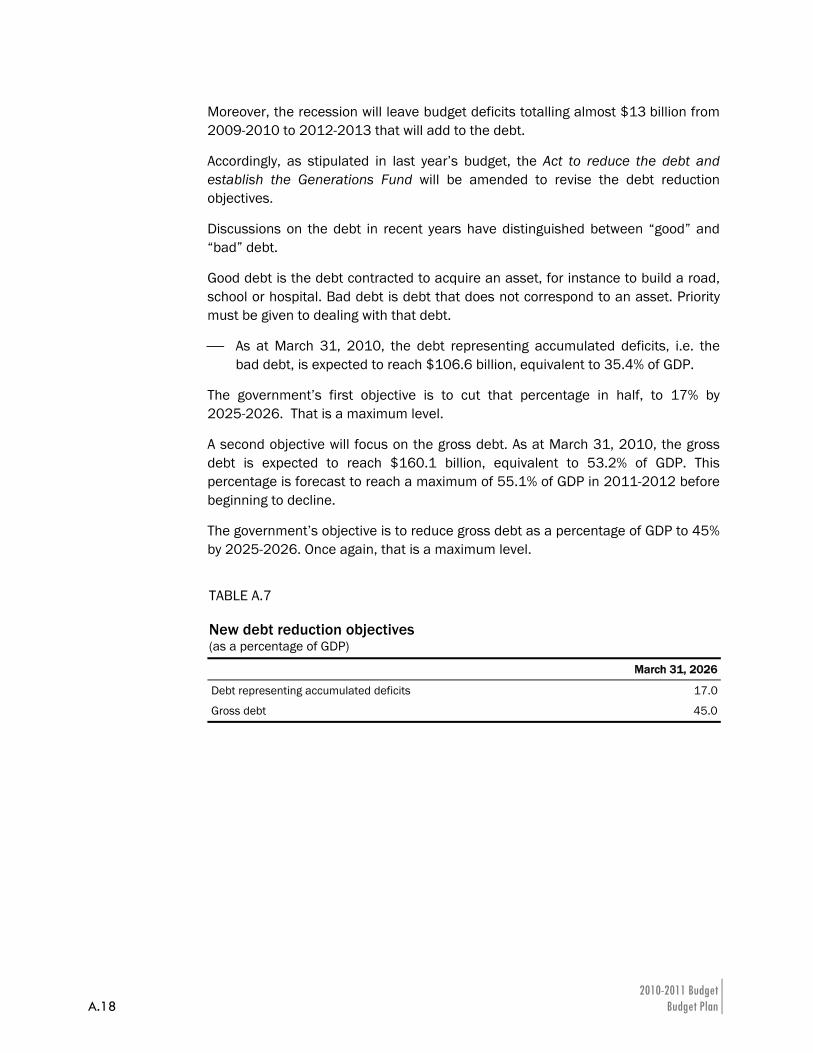
TABLE A.7 New debt reduction objectives (as a percentage of GDP)
March 31, 2026
Debt representing accumulated deficits 17.0
Gross debt 45.0

The Government’s Economic and Fiscal Policy Directions A.19
ASection
3. CONTINUE WITH THE GOVERNMENT’S STRATEGY: SECURE THE RECOVERY AND STAY THE COURSE ON RESTORING BUDGET BALANCE The government set clear priorities in the 2009-2010 Budget:
⎯ first, support the economy and secure the recovery;
⎯ then, restore order to public finances.
The government has taken the steps needed to get through the recession and return to economic growth, though the price has been significant deficits. Now that the recovery is well underway, the government is continuing with its strategy in this budget:
⎯ by continuing with its economic action plan, in 2010, maintaining the efforts already in place;
⎯ by taking the additional steps needed to:
— restore order to public finances and return to budget balance by 2013-2014;
— ensure the development of Québec’s economic potential in the longer term.
3.1 Relying on measures already in place to secure the recovery
In late 2008, when the effects of the financial crisis and the global recession hit Québec's economy, the government acted quickly and vigorously.
⎯ The implementation of a $15-billion economic action plan for 2009 and 2010 enabled Québec's economy to get through the recession in better shape than neighbouring economies.
Like other jurisdictions, Québec intends to continue the efforts already taken to secure the recovery. As stipulated in its action plan, new cash resources will be injected into the economy in 2010.
Moreover, in this budget, the government is announcing initiatives targeting segments of the economy hit harder than others by the recession, the Montréal labour market in particular. Structuring measures are also being announced to ensure the development of Québec’s economic potential in the longer term.
2010-2011 Budget A.20 Budget Plan
3.1.1 Continuation of the action plan
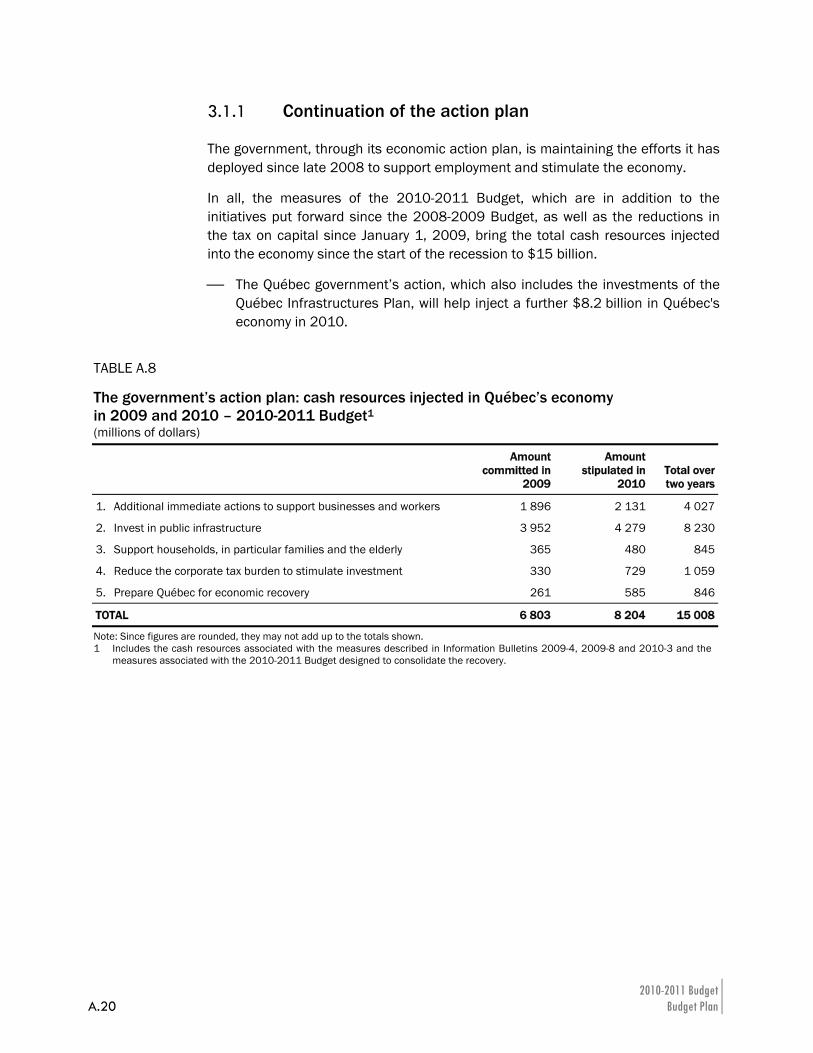
The government, through its economic action plan, is maintaining the efforts it has deployed since late 2008 to support employment and stimulate the economy.
In all, the measures of the 2010-2011 Budget, which are in addition to the initiatives put forward since the 2008-2009 Budget, as well as the reductions in the tax on capital since January 1, 2009, bring the total cash resources injected into the economy since the start of the recession to $15 billion.
⎯ The Québec government’s action, which also includes the investments of the Québec Infrastructures Plan, will help inject a further $8.2 billion in Québec's economy in 2010.
TABLE A.8 The government’s action plan: cash resources injected in Québec’s economy in 2009 and 2010 – 2010-2011 Budget1 (millions of dollars)
Amount committed in
2009
Amount stipulated in
2010 Total over two years
1. Additional immediate actions to support businesses and workers 1 896 2 131 4 027
2. Invest in public infrastructure 3 952 4 279 8 230
3. Support households, in particular families and the elderly 365 480 845
4. Reduce the corporate tax burden to stimulate investment 330 729 1 059
5. Prepare Québec for economic recovery 261 585 846
TOTAL 6 803 8 204 15 008
Note: Since figures are rounded, they may not add up to the totals shown. 1 Includes the cash resources associated with the measures described in Information Bulletins 2009-4, 2009-8 and 2010-3 and the
measures associated with the 2010-2011 Budget designed to consolidate the recovery.
The Government’s Economic and Fiscal Policy Directions A.21
ASection
A key role to support the recovery
Since the fall of 2008, the Québec government has acted a number of times to support the economy and counter the effects of the recession. The action plan is injecting $15.0 billion in the economy in 2009 and 2010, i.e. 4.9% of GDP.
In particular, for 2010, the government plans to inject $8.2 billion, including:
⎯ $3.1 billion for businesses;
⎯ $0.7 billion for individuals;
⎯ $4.4 billion to improve infrastructure.2
The Québec government’s initiatives, together with those announced by the federal government, have enabled Québec’s economy to get through the recession and be better positioned to capitalize on the recovery. In 2009 and 2010, Québec will have gained an extra 1.5 percentage points in real GDP compared to what it would have been without the government support measures.
2 Including infrastructure investments of $117 million in 2010, recorded in the measures
designed to prepare Québec for economic recovery announced in the 2009-2010 Budget.
2010-2011 Budget A.22 Budget Plan
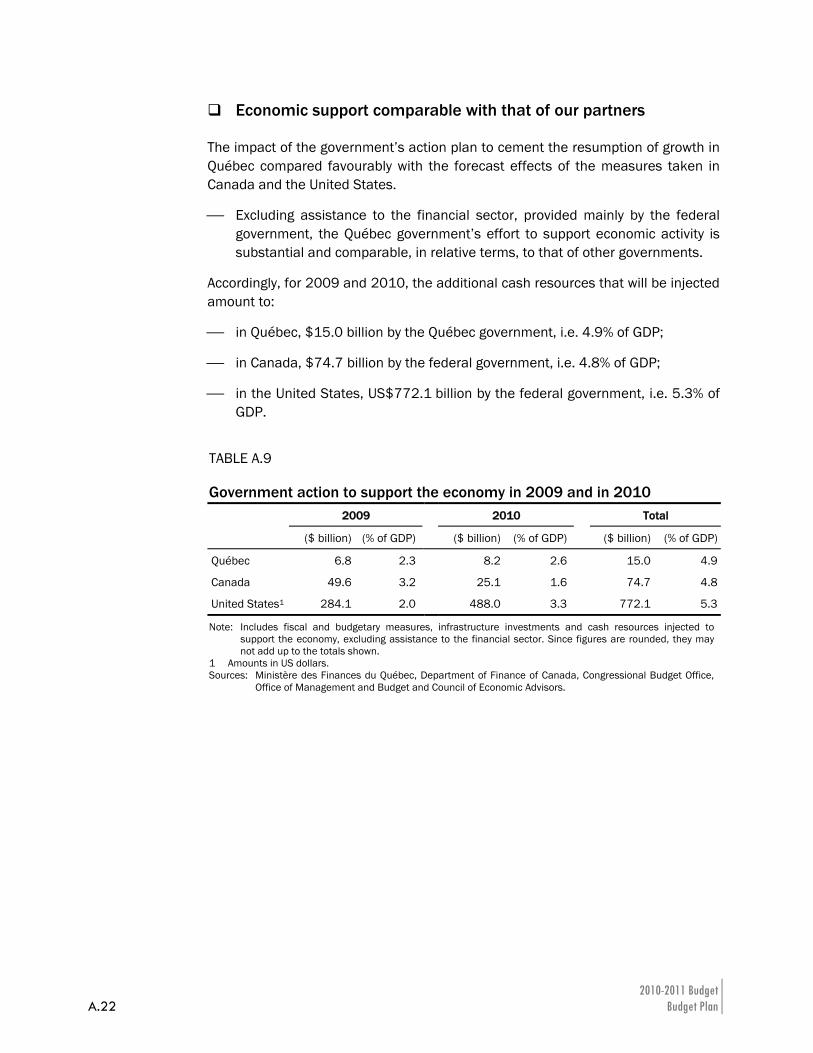
Economic support comparable with that of our partners
The impact of the government’s action plan to cement the resumption of growth in Québec compared favourably with the forecast effects of the measures taken in Canada and the United States.
⎯ Excluding assistance to the financial sector, provided mainly by the federal government, the Québec government’s effort to support economic activity is substantial and comparable, in relative terms, to that of other governments.
Accordingly, for 2009 and 2010, the additional cash resources that will be injected amount to:
⎯ in Québec, $15.0 billion by the Québec government, i.e. 4.9% of GDP;
⎯ in Canada, $74.7 billion by the federal government, i.e. 4.8% of GDP;
⎯ in the United States, US$772.1 billion by the federal government, i.e. 5.3% of GDP.
TABLE A.9 Government action to support the economy in 2009 and in 2010 2009 2010 Total
($ billion) (% of GDP) ($ billion) (% of GDP) ($ billion) (% of GDP)
Québec 6.8 2.3 8.2 2.6 15.0 4.9
Canada 49.6 3.2 25.1 1.6 74.7 4.8
United States1 284.1 2.0 488.0 3.3 772.1 5.3
Note: Includes fiscal and budgetary measures, infrastructure investments and cash resources injected to support the economy, excluding assistance to the financial sector. Since figures are rounded, they may not add up to the totals shown.
1 Amounts in US dollars. Sources: Ministère des Finances du Québec, Department of Finance of Canada, Congressional Budget Office,
Office of Management and Budget and Council of Economic Advisors.
The Government’s Economic and Fiscal Policy Directions A.23
ASection
3.1.2 New initiatives to develop the full potential of our economy
In addition to continuing its strategy to support economic recovery during 2010, the government is announcing new initiatives to fully develop Québec's full economic potential in the longer term. Accordingly, the government intends to:
⎯ meet the demographic challenge by setting up a national commission on labour market participation to identify the action that needs to be taken;
⎯ use the levers available to it to boost our performance, in particular by updating and extending the Stratégie québécoise de la recherche et de l’innovation for three years;
⎯ provide Montréal with further support in its role as an essential component of Québec’s development, in particular by positioning Québec’s largest city as a solid financial centre;
⎯ build a green economy through specific actions to develop the electric vehicle sector in Québec and encourage the marketing of products that have obtained carbon footprint certification;
⎯ ensure responsible and sustainable management of our resources with the deployment of the Northern Plan and assistance for wind-power projects;
⎯ stimulate our cultural vitality by, among other things, promoting Québec artists on the international stage and by consolidating support for the Montréal Symphony Orchestra.
These additional initiatives are part of the government strategy to take immediate structuring steps to better position Québec's economy over the coming years.
2010-2011 Budget A.24 Budget Plan
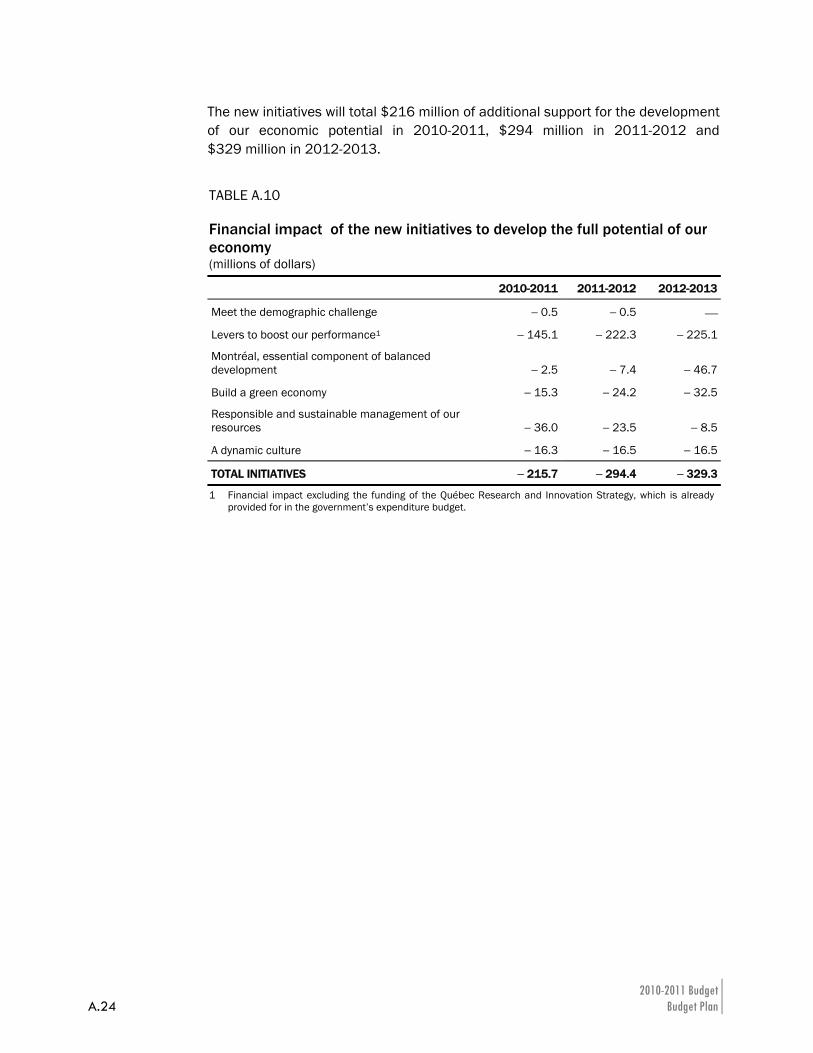
The new initiatives will total $216 million of additional support for the development of our economic potential in 2010-2011, $294 million in 2011-2012 and $329 million in 2012-2013.
TABLE A.10 Financial impact of the new initiatives to develop the full potential of our economy (millions of dollars)
2010-2011 2011-2012 2012-2013
Meet the demographic challenge − 0.5 − 0.5 ⎯
Levers to boost our performance1 − 145.1 − 222.3 − 225.1
Montréal, essential component of balanced development − 2.5 − 7.4 − 46.7
Build a green economy − 15.3 − 24.2 − 32.5
Responsible and sustainable management of our resources − 36.0 − 23.5 − 8.5
A dynamic culture − 16.3 − 16.5 − 16.5
TOTAL INITIATIVES − 215.7 − 294.4 − 329.3
1 Financial impact excluding the funding of the Québec Research and Innovation Strategy, which is already provided for in the government’s expenditure budget.

The Government’s Economic and Fiscal Policy Directions A.25
ASection
3.2 Stay the course on returning to budget balance: a challenge within our reach
The government has followed the right strategy by deciding to support the economy to get through the recession, even if at the cost of running significant deficits.
Now that the recovery is well underway, the government intends to take advantage of the fact that Québec is in better economic shape than its main economic partners by moving immediately with additional steps to return to budget balance by 2013-2014, as stipulated in the Balanced Budget Act.
In this budget, the government is taking additional substantial steps to turn public finances around by 2013-2014.
Having come out of the recession in better shape than its main economic partners, Québec is well-positioned to act now, as the recovery takes hold.
The need to act
Québec faces two challenges that are distinct in the North American economic space and confirm the need to eliminate the deficit by 2013-2014, as stipulated in the Balanced Budget Act:
⎯ a deficit situation that adds to a heavier debt load than our neighbours, resulting in less leeway;
⎯ a demographic situation featuring a decline in the potential labour pool and a slowdown in economic growth.
These two challenges require actions in the near future to return to budget balance by 2013-2014 to achieve the leeway needed to maintain funding of public services in a more restrictive context than that of our neighbours.
2010-2011 Budget A.26 Budget Plan
A heavier debt load that limits our leeway
The deficits posted until the mid-1990s contributed to making Québec the most indebted province in Canada. The shortfalls forecast from now to 2013-2014 will add to Québec’s already considerable debt load and thus further reduce the government’s leeway to fund public services.
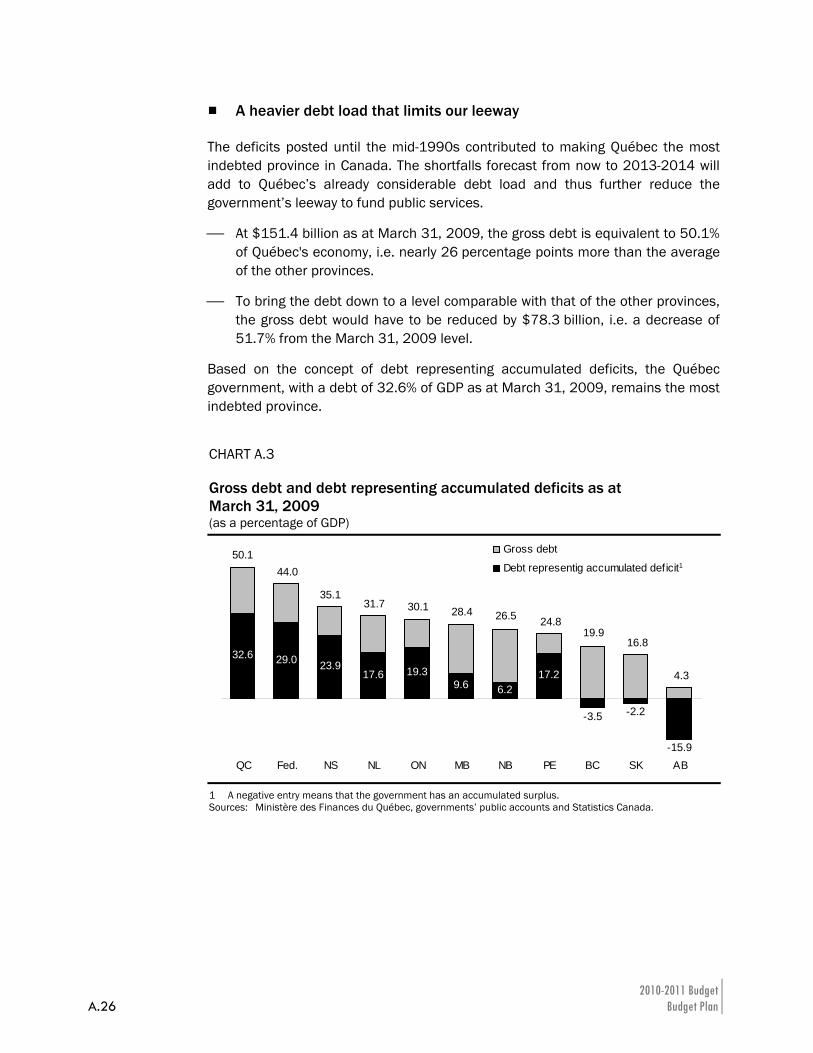
⎯ At $151.4 billion as at March 31, 2009, the gross debt is equivalent to 50.1% of Québec's economy, i.e. nearly 26 percentage points more than the average of the other provinces.
⎯ To bring the debt down to a level comparable with that of the other provinces, the gross debt would have to be reduced by $78.3 billion, i.e. a decrease of 51.7% from the March 31, 2009 level.
Based on the concept of debt representing accumulated deficits, the Québec government, with a debt of 32.6% of GDP as at March 31, 2009, remains the most indebted province.
CHART A.3 Gross debt and debt representing accumulated deficits as at March 31, 2009 (as a percentage of GDP)
32.6 29.0 23.917.6 19.3
9.6 6.217.2
-15.9
-2.2-3.5
QC Fed. NS NL ON MB NB PE BC SK AB
Gross debt
Debt representig accumulated deficit50.1
44.0
35.131.7 30.1 28.4 26.5 24.8
19.916.8
4.3
1
1 A negative entry means that the government has an accumulated surplus. Sources: Ministère des Finances du Québec, governments’ public accounts and Statistics Canada.
The Government’s Economic and Fiscal Policy Directions A.27
ASection
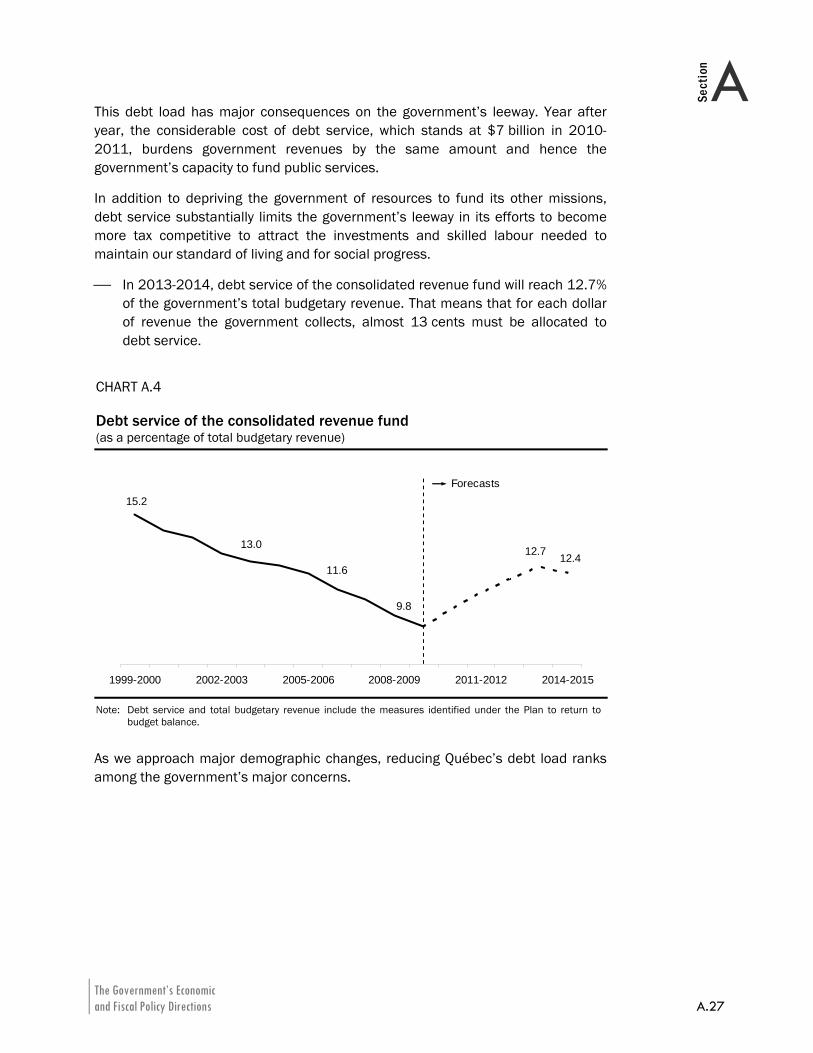
This debt load has major consequences on the government’s leeway. Year after year, the considerable cost of debt service, which stands at $7 billion in 2010-2011, burdens government revenues by the same amount and hence the government’s capacity to fund public services.
In addition to depriving the government of resources to fund its other missions, debt service substantially limits the government’s leeway in its efforts to become more tax competitive to attract the investments and skilled labour needed to maintain our standard of living and for social progress.
⎯ In 2013-2014, debt service of the consolidated revenue fund will reach 12.7% of the government’s total budgetary revenue. That means that for each dollar of revenue the government collects, almost 13 cents must be allocated to debt service.
CHART A.4 Debt service of the consolidated revenue fund (as a percentage of total budgetary revenue)
12.4
15.2
12.7
9.8
11.6
13.0
1999-2000 2002-2003 2005-2006 2008-2009 2011-2012 2014-2015
Forecasts
Note: Debt service and total budgetary revenue include the measures identified under the Plan to return to
budget balance.
As we approach major demographic changes, reducing Québec’s debt load ranks among the government’s major concerns.
2010-2011 Budget A.28 Budget Plan
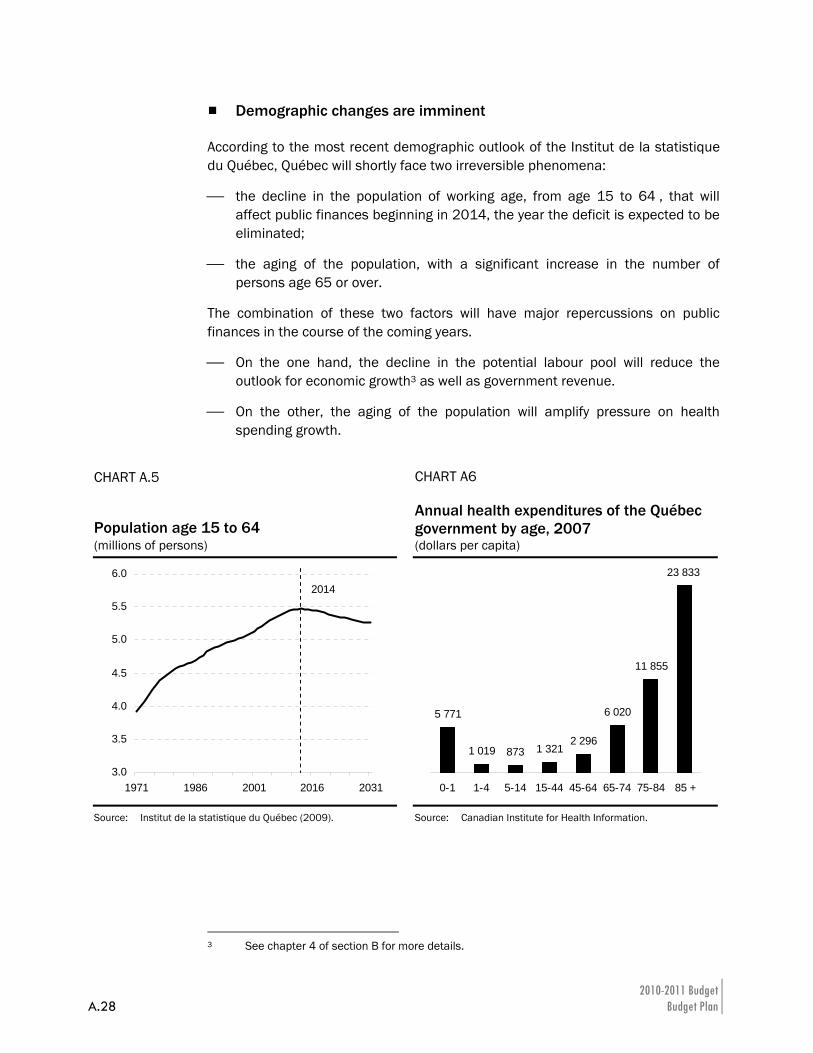
Demographic changes are imminent
According to the most recent demographic outlook of the Institut de la statistique du Québec, Québec will shortly face two irreversible phenomena:
⎯ the decline in the population of working age, from age 15 to 64 , that will affect public finances beginning in 2014, the year the deficit is expected to be eliminated;
⎯ the aging of the population, with a significant increase in the number of persons age 65 or over.
The combination of these two factors will have major repercussions on public finances in the course of the coming years.
⎯ On the one hand, the decline in the potential labour pool will reduce the outlook for economic growth3 as well as government revenue.
⎯ On the other, the aging of the population will amplify pressure on health spending growth.
3 See chapter 4 of section B for more details.
CHART A.5 Population age 15 to 64
CHART A6 Annual health expenditures of the Québec government by age, 2007
(millions of persons) (dollars per capita)
3.0
3.5
4.0
4.5
5.0
5.5
6.0
1971 1986 2001 2016 2031
2014
5 771
1 019 873 1 3212 296
6 020
11 855
23 833
0-1 1-4 5-14 15-44 45-64 65-74 75-84 85 +
Source: Institut de la statistique du Québec (2009).
Source: Canadian Institute for Health Information.
The Government’s Economic and Fiscal Policy Directions A.29
ASection
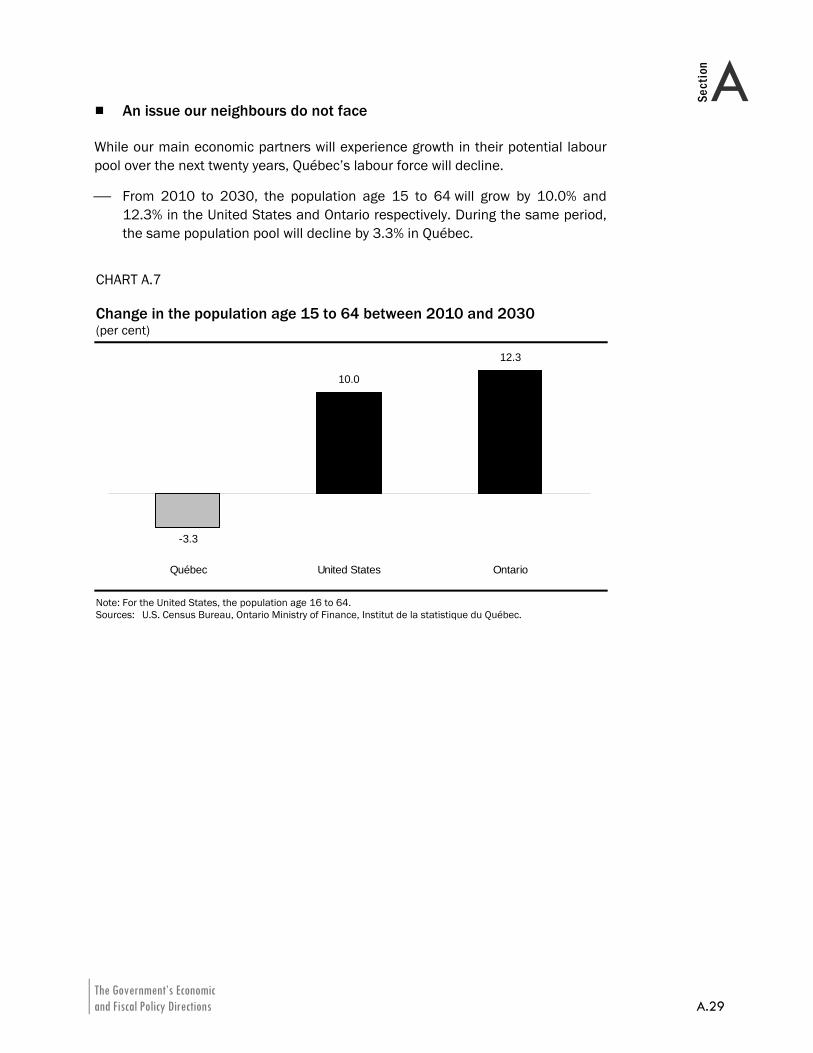
An issue our neighbours do not face
While our main economic partners will experience growth in their potential labour pool over the next twenty years, Québec’s labour force will decline.
⎯ From 2010 to 2030, the population age 15 to 64 will grow by 10.0% and 12.3% in the United States and Ontario respectively. During the same period, the same population pool will decline by 3.3% in Québec.
CHART A.7 Change in the population age 15 to 64 between 2010 and 2030 (per cent)
-3.3
10.0
12.3
Québec United States Ontario
Note: For the United States, the population age 16 to 64. Sources: U.S. Census Bureau, Ontario Ministry of Finance, Institut de la statistique du Québec.
2010-2011 Budget A.30 Budget Plan
Capitalize on the recovery to take firm steps to turn our public finances around
The return to economic growth, together with the milder impact of the recession in Québec, enables the government to seize the opportunity to position itself favourably compared to its economic partners.
In that spirit, the government intends to capitalize on the economic recovery to take firm steps to turn our public finances around. Accordingly, the government:
⎯ is taking steps now. Having suffered less from the recession, Québec can act more quickly than its partners without threatening the recovery;
⎯ is taking the right steps. As it indicated in its Plan to return to budget balance, the government must, first and foremost, reduce spending growth to a level compatible with its ability to pay. Moreover, the choice of the additional tax levies needed to fund public services must take their impact on economic growth into account.
Taking the right steps now will more quickly generate the leeway stemming from a gradual return to balanced budgets. In this regard, the government’s approach must seek a balance between a reduction in spending growth compatible with maintaining public services and implementation of additional revenue measures, whose phased introduction from now until 2013-2014, will allow taxpayers to gradually adapt to them.
The Government’s Economic and Fiscal Policy Directions A.31
ASection
4. IMPLEMENTATION OF THE PLAN TO RETURN TO BUDGET BALANCE The Plan to return to budget balance, announced in March 2009, did not specify any measures for 2009-2010, in order not to hinder efforts to revive the economy.
Now that the recovery is well underway, the government is implementing, starting in 2010-2011, the initial revenue measures and is deploying the initial efforts to reduce spending growth.
2010-2011 Budget A.32 Budget Plan
4.1 Review of the measures announced in March 2009
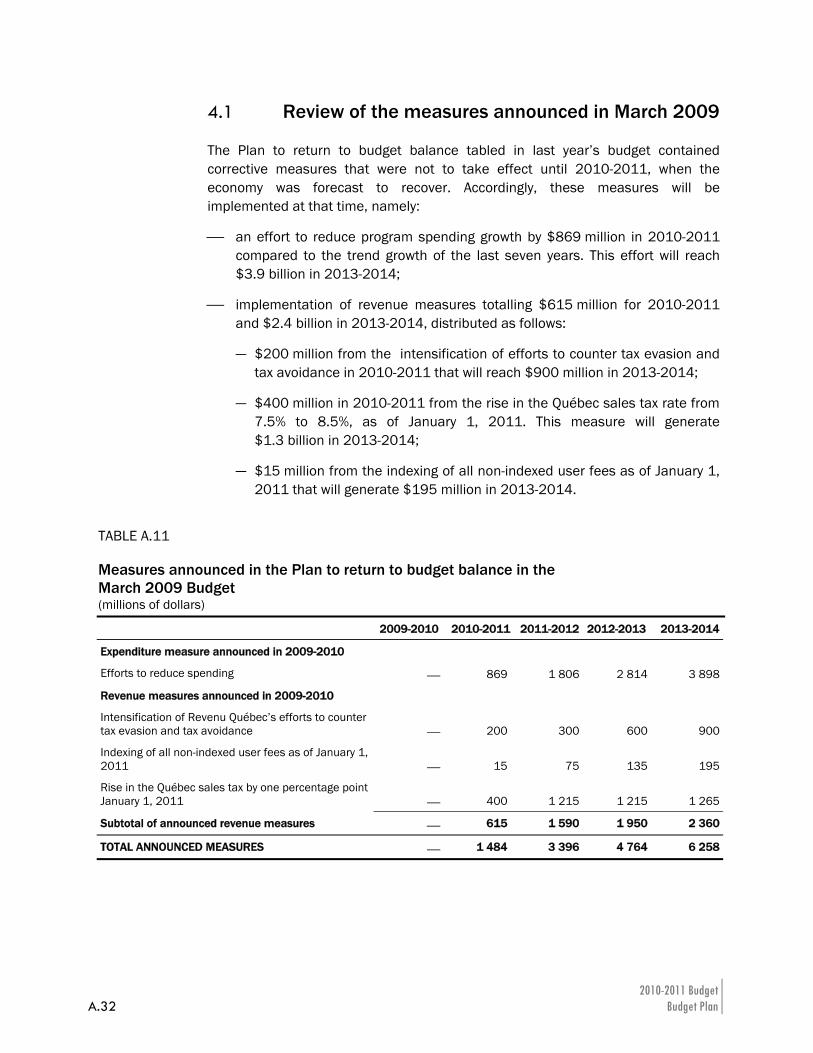
The Plan to return to budget balance tabled in last year’s budget contained corrective measures that were not to take effect until 2010-2011, when the economy was forecast to recover. Accordingly, these measures will be implemented at that time, namely:
⎯ an effort to reduce program spending growth by $869 million in 2010-2011 compared to the trend growth of the last seven years. This effort will reach $3.9 billion in 2013-2014;
⎯ implementation of revenue measures totalling $615 million for 2010-2011 and $2.4 billion in 2013-2014, distributed as follows:
— $200 million from the intensification of efforts to counter tax evasion and tax avoidance in 2010-2011 that will reach $900 million in 2013-2014;
— $400 million in 2010-2011 from the rise in the Québec sales tax rate from 7.5% to 8.5%, as of January 1, 2011. This measure will generate $1.3 billion in 2013-2014;
— $15 million from the indexing of all non-indexed user fees as of January 1, 2011 that will generate $195 million in 2013-2014.
TABLE A.11 Measures announced in the Plan to return to budget balance in the March 2009 Budget (millions of dollars)
2009-2010 2010-2011 2011-2012 2012-2013 2013-2014
Expenditure measure announced in 2009-2010
Efforts to reduce spending ⎯ 869 1 806 2 814 3 898
Revenue measures announced in 2009-2010
Intensification of Revenu Québec’s efforts to counter tax evasion and tax avoidance ⎯ 200 300 600 900
Indexing of all non-indexed user fees as of January 1, 2011 ⎯ 15 75 135 195
Rise in the Québec sales tax by one percentage point January 1, 2011 ⎯ 400 1 215 1 215 1 265
Subtotal of announced revenue measures ⎯ 615 1 590 1 950 2 360
TOTAL ANNOUNCED MEASURES ⎯ 1 484 3 396 4 764 6 258
The Government’s Economic and Fiscal Policy Directions A.33
ASection
4.2 Additional steps to restore budget balance
This budget stipulates the implementation of new measures as part of the Plan to return to budget balance. These measures, excluding those affecting program spending, will reach $436 million in 2010-2011 and $2.2 billion in 2013-2014.
In keeping with its fiscal policy directions, the government has opted for measures that are among the least damaging for economic growth.
Keep within within our ability to pay:
⎯ program spending growth limited to 2.9% in 2010-2011 and 2.2% annually until 2013-2014;
⎯ efforts to control spending within public bodies.
Ensure that everyone pays their fair share:
⎯ additional efforts to combat tax evasion and tax avoidance.
Provide adequate funding for public services:
⎯ additional rise in the rate of the Québec sales tax, from 8,5% to 9.5% as of January 1, 2012;
⎯ introduction of an annual health contribution, for each adult, of $25 in 2010,4 $100 in 2011 and $200 as of 2012;
⎯ temporary rise in the compensatory tax on financial institutions;
⎯ implementation of the revision of the mining duties regime.
Modernize our road and public transit infrastructures:
⎯ a rise in the fuel tax rate of 1 ¢ per litre on April 1 of each year from 2010 to 2013.
Reduce the debt for future generations once the budget is back in balance:
⎯ a gradual rise of 1 ¢/kWh of heritage pool electricity, over five years, as of 2014.
Compensatory measures will reduce, even eliminate, the impact of these measures for low-income individuals and households, in particular regarding the rise in the Québec sales tax.
4 The health contribution will be $50 in 2010. However, since it will apply only as of July 2010,
this is equivalent to $25 for 2010.
2010-2011 Budget A.34 Budget Plan
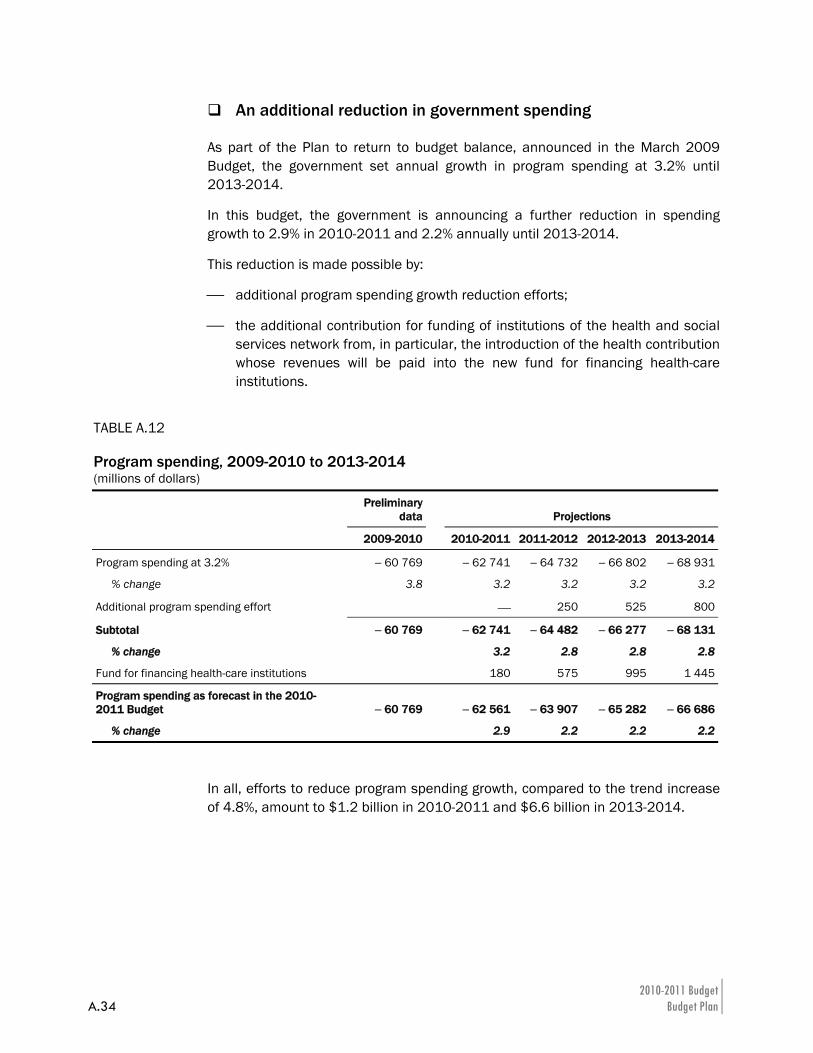
An additional reduction in government spending
As part of the Plan to return to budget balance, announced in the March 2009 Budget, the government set annual growth in program spending at 3.2% until 2013-2014.
In this budget, the government is announcing a further reduction in spending growth to 2.9% in 2010-2011 and 2.2% annually until 2013-2014.
This reduction is made possible by:
⎯ additional program spending growth reduction efforts;
⎯ the additional contribution for funding of institutions of the health and social services network from, in particular, the introduction of the health contribution whose revenues will be paid into the new fund for financing health-care institutions.
In all, efforts to reduce program spending growth, compared to the trend increase of 4.8%, amount to $1.2 billion in 2010-2011 and $6.6 billion in 2013-2014.
TABLE A.12 Program spending, 2009-2010 to 2013-2014 (millions of dollars)
Preliminary
data Projections
2009-2010 2010-2011 2011-2012 2012-2013 2013-2014
Program spending at 3.2% − 60 769 − 62 741 − 64 732 − 66 802 − 68 931
% change 3.8 3.2 3.2 3.2 3.2
Additional program spending effort ⎯ 250 525 800
Subtotal − 60 769 − 62 741 − 64 482 − 66 277 − 68 131
% change 3.2 2.8 2.8 2.8
Fund for financing health-care institutions 180 575 995 1 445
Program spending as forecast in the 2010-2011 Budget − 60 769 − 62 561 − 63 907 − 65 282 − 66 686
% change 2.9 2.2 2.2 2.2
The Government’s Economic and Fiscal Policy Directions A.35
ASection
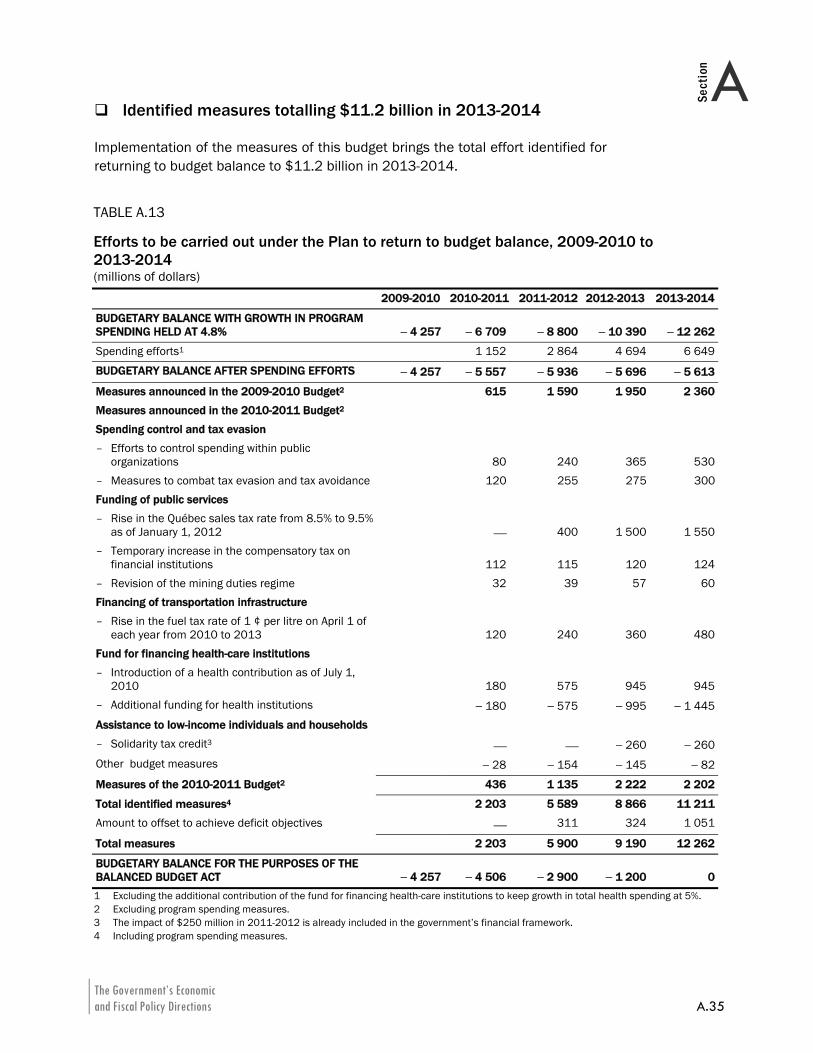
Identified measures totalling $11.2 billion in 2013-2014
Implementation of the measures of this budget brings the total effort identified for returning to budget balance to $11.2 billion in 2013-2014.
TABLE A.13 Efforts to be carried out under the Plan to return to budget balance, 2009-2010 to 2013-2014 (millions of dollars) 2009-2010 2010-2011 2011-2012 2012-2013 2013-2014
BUDGETARY BALANCE WITH GROWTH IN PROGRAM SPENDING HELD AT 4.8% − 4 257 − 6 709 − 8 800 − 10 390 − 12 262
Spending efforts1 1 152 2 864 4 694 6 649
BUDGETARY BALANCE AFTER SPENDING EFFORTS − 4 257 − 5 557 − 5 936 − 5 696 − 5 613
Measures announced in the 2009-2010 Budget2 615 1 590 1 950 2 360
Measures announced in the 2010-2011 Budget2 Spending control and tax evasion – Efforts to control spending within public
organizations 80 240 365 530– Measures to combat tax evasion and tax avoidance 120 255 275 300Funding of public services – Rise in the Québec sales tax rate from 8.5% to 9.5%
as of January 1, 2012 ⎯ 400 1 500 1 550– Temporary increase in the compensatory tax on
financial institutions 112 115 120 124– Revision of the mining duties regime 32 39 57 60Financing of transportation infrastructure – Rise in the fuel tax rate of 1 ¢ per litre on April 1 of
each year from 2010 to 2013 120 240 360 480Fund for financing health-care institutions – Introduction of a health contribution as of July 1,
2010 180 575 945 945– Additional funding for health institutions − 180 − 575 − 995 − 1 445Assistance to low-income individuals and households – Solidarity tax credit3 ⎯ ⎯ − 260 − 260Other budget measures − 28 − 154 − 145 − 82
Measures of the 2010-2011 Budget2 436 1 135 2 222 2 202
Total identified measures4 2 203 5 589 8 866 11 211
Amount to offset to achieve deficit objectives ⎯ 311 324 1 051
Total measures 2 203 5 900 9 190 12 262
BUDGETARY BALANCE FOR THE PURPOSES OF THE BALANCED BUDGET ACT − 4 257 − 4 506 − 2 900 − 1 200 01 Excluding the additional contribution of the fund for financing health-care institutions to keep growth in total health spending at 5%. 2 Excluding program spending measures. 3 The impact of $250 million in 2011-2012 is already included in the government’s financial framework. 4 Including program spending measures.
2010-2011 Budget A.36 Budget Plan
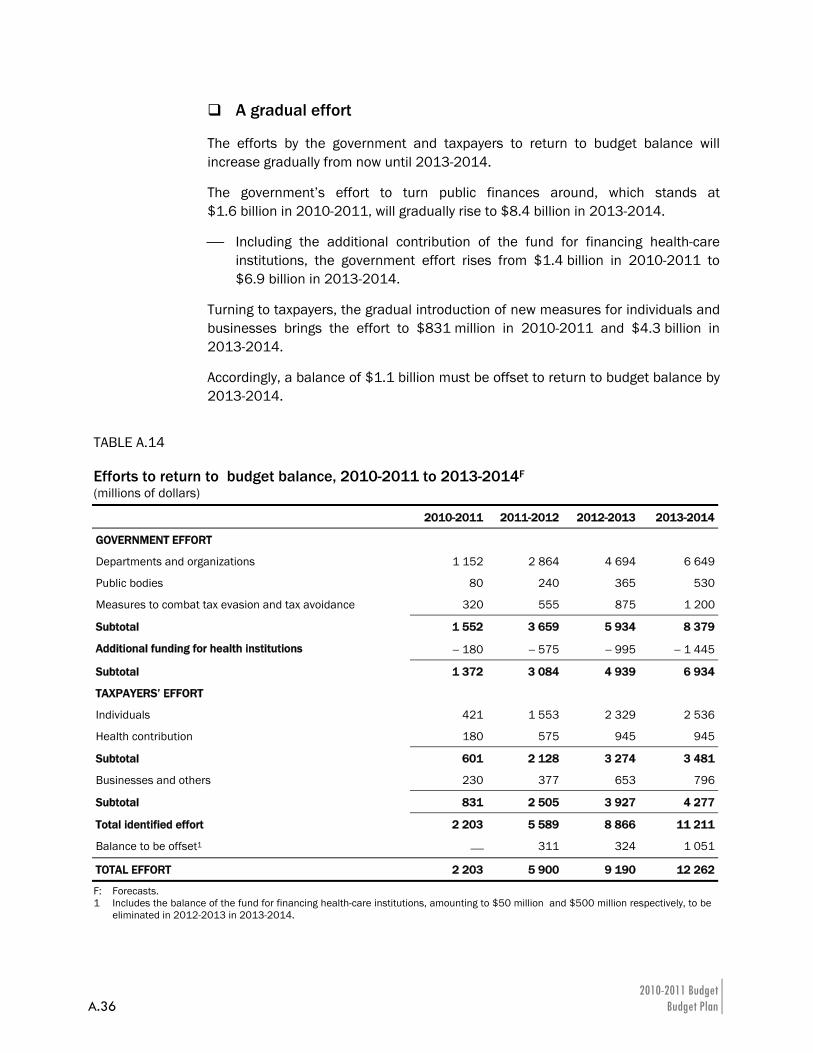
A gradual effort
The efforts by the government and taxpayers to return to budget balance will increase gradually from now until 2013-2014.
The government’s effort to turn public finances around, which stands at $1.6 billion in 2010-2011, will gradually rise to $8.4 billion in 2013-2014.
⎯ Including the additional contribution of the fund for financing health-care institutions, the government effort rises from $1.4 billion in 2010-2011 to $6.9 billion in 2013-2014.
Turning to taxpayers, the gradual introduction of new measures for individuals and businesses brings the effort to $831 million in 2010-2011 and $4.3 billion in 2013-2014.
Accordingly, a balance of $1.1 billion must be offset to return to budget balance by 2013-2014.
TABLE A.14 Efforts to return to budget balance, 2010-2011 to 2013-2014F (millions of dollars)
2010-2011 2011-2012 2012-2013 2013-2014
GOVERNMENT EFFORT
Departments and organizations 1 152 2 864 4 694 6 649
Public bodies 80 240 365 530
Measures to combat tax evasion and tax avoidance 320 555 875 1 200
Subtotal 1 552 3 659 5 934 8 379
Additional funding for health institutions − 180 − 575 − 995 − 1 445
Subtotal 1 372 3 084 4 939 6 934
TAXPAYERS’ EFFORT
Individuals 421 1 553 2 329 2 536
Health contribution 180 575 945 945
Subtotal 601 2 128 3 274 3 481
Businesses and others 230 377 653 796
Subtotal 831 2 505 3 927 4 277
Total identified effort 2 203 5 589 8 866 11 211
Balance to be offset1 ⎯ 311 324 1 051
TOTAL EFFORT 2 203 5 900 9 190 12 262
F: Forecasts. 1 Includes the balance of the fund for financing health-care institutions, amounting to $50 million and $500 million respectively, to be
eliminated in 2012-2013 in 2013-2014.
The Government’s Economic and Fiscal Policy Directions A.37
ASection
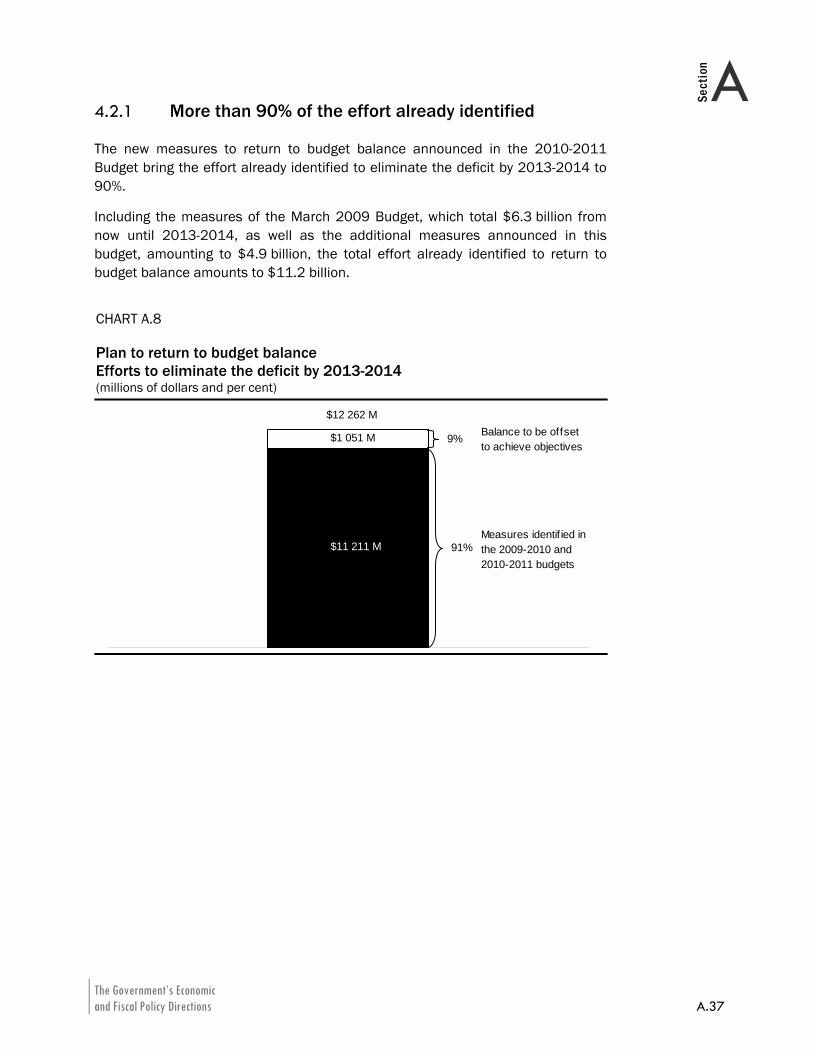
4.2.1 More than 90% of the effort already identified
The new measures to return to budget balance announced in the 2010-2011 Budget bring the effort already identified to eliminate the deficit by 2013-2014 to 90%.
Including the measures of the March 2009 Budget, which total $6.3 billion from now until 2013-2014, as well as the additional measures announced in this budget, amounting to $4.9 billion, the total effort already identified to return to budget balance amounts to $11.2 billion.
CHART A.8 Plan to return to budget balance Efforts to eliminate the deficit by 2013-2014 (millions of dollars and per cent)
$12 262 M
$1 051 M
$11 211 M
9%
91%
Balance to be offsetto achieve objectives
Measures identif ied in the 2009-2010 and 2010-2011 budgets
2010-2011 Budget A.38 Budget Plan
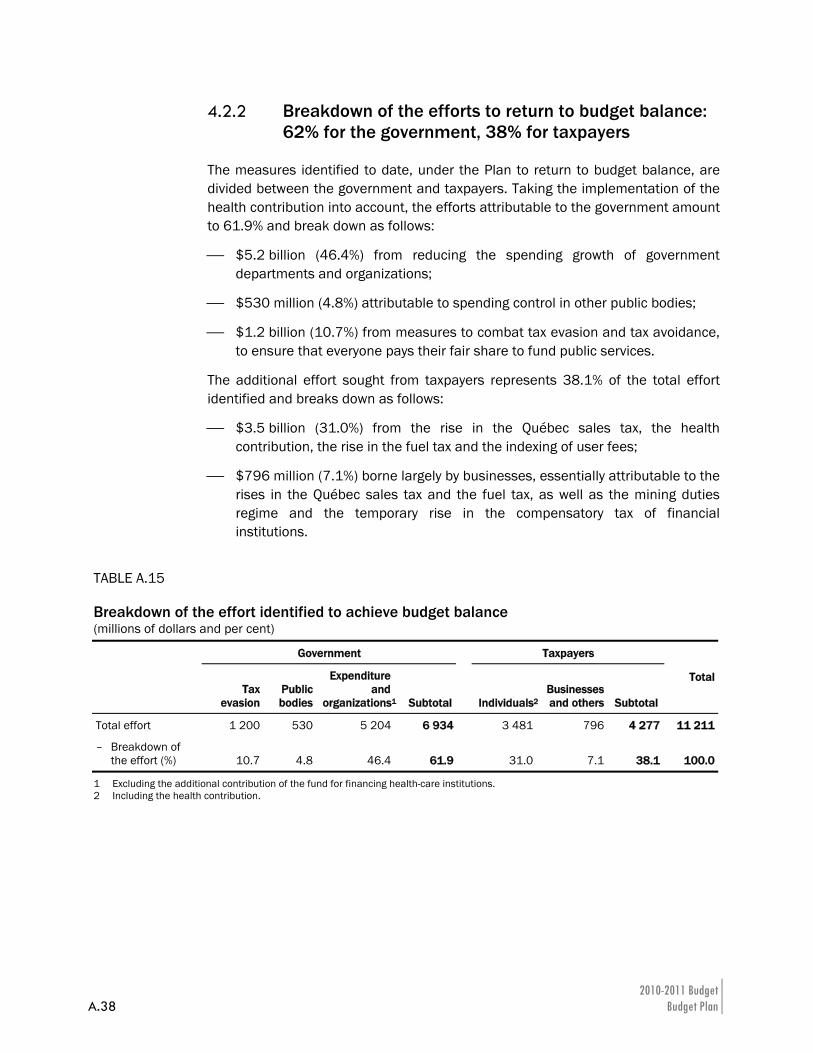
4.2.2 Breakdown of the efforts to return to budget balance: 62% for the government, 38% for taxpayers
The measures identified to date, under the Plan to return to budget balance, are divided between the government and taxpayers. Taking the implementation of the health contribution into account, the efforts attributable to the government amount to 61.9% and break down as follows:
⎯ $5.2 billion (46.4%) from reducing the spending growth of government departments and organizations;
⎯ $530 million (4.8%) attributable to spending control in other public bodies;
⎯ $1.2 billion (10.7%) from measures to combat tax evasion and tax avoidance, to ensure that everyone pays their fair share to fund public services.
The additional effort sought from taxpayers represents 38.1% of the total effort identified and breaks down as follows:
⎯ $3.5 billion (31.0%) from the rise in the Québec sales tax, the health contribution, the rise in the fuel tax and the indexing of user fees;
⎯ $796 million (7.1%) borne largely by businesses, essentially attributable to the rises in the Québec sales tax and the fuel tax, as well as the mining duties regime and the temporary rise in the compensatory tax of financial institutions.
TABLE A.15 Breakdown of the effort identified to achieve budget balance (millions of dollars and per cent)
Government Taxpayers
Tax
evasion Public bodies
Expenditure and
organizations1 Subtotal Individuals2Businesses and others Subtotal
Total
Total effort 1 200 530 5 204 6 934 3 481 796 4 277 11 211
– Breakdown of the effort (%) 10.7 4.8 46.4 61.9 31.0 7.1 38.1 100.0
1 Excluding the additional contribution of the fund for financing health-care institutions. 2 Including the health contribution.
The Government’s Economic and Fiscal Policy Directions A.39
ASection
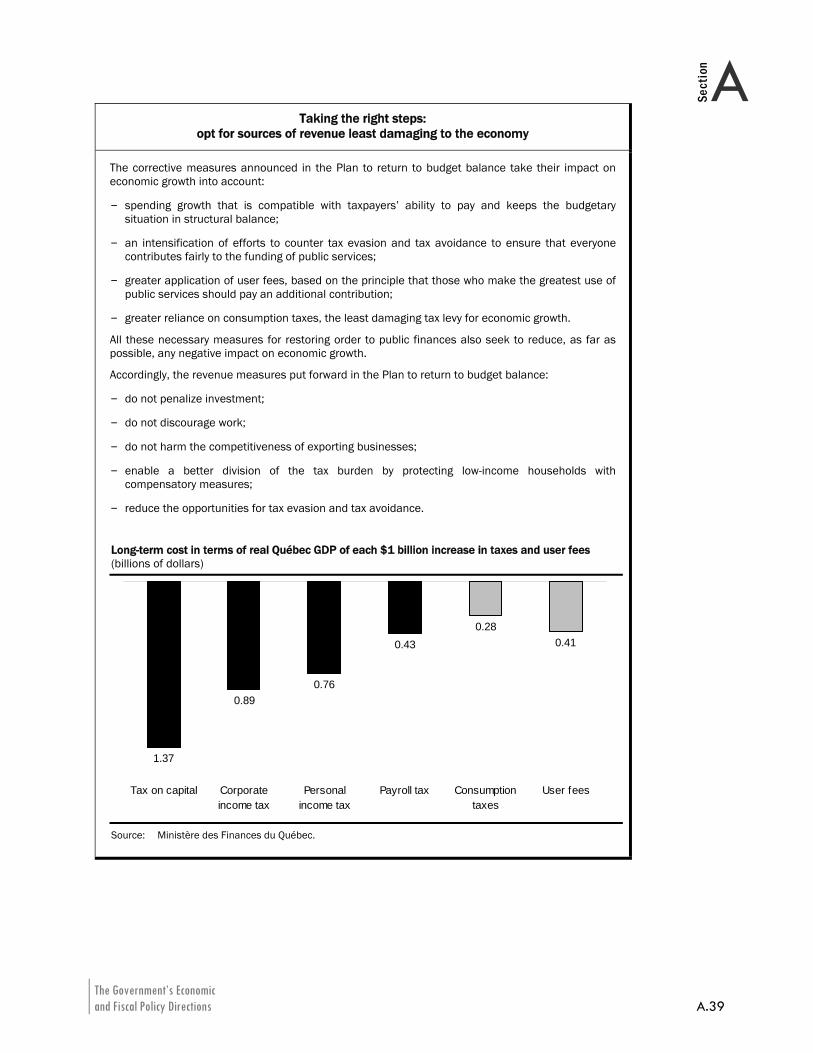
Taking the right steps: opt for sources of revenue least damaging to the economy
The corrective measures announced in the Plan to return to budget balance take their impact on economic growth into account:
– spending growth that is compatible with taxpayers’ ability to pay and keeps the budgetary situation in structural balance;
– an intensification of efforts to counter tax evasion and tax avoidance to ensure that everyone contributes fairly to the funding of public services;
– greater application of user fees, based on the principle that those who make the greatest use of public services should pay an additional contribution;
– greater reliance on consumption taxes, the least damaging tax levy for economic growth.
All these necessary measures for restoring order to public finances also seek to reduce, as far as possible, any negative impact on economic growth.
Accordingly, the revenue measures put forward in the Plan to return to budget balance:
– do not penalize investment;
– do not discourage work;
– do not harm the competitiveness of exporting businesses;
– enable a better division of the tax burden by protecting low-income households with compensatory measures;
– reduce the opportunities for tax evasion and tax avoidance.
Long-term cost in terms of real Québec GDP of each $1 billion increase in taxes and user fees (billions of dollars)
0.410.28
0.43
0.760.89
1.37
Tax on capital Corporateincome tax
Personalincome tax
Payroll tax Consumptiontaxes
User fees
Source: Ministère des Finances du Québec.
2010-2011 Budget A.40 Budget Plan
4.3 The benefits of the Plan to return to budget balance
The Plan to return to budget balance is being implemented as part of the broad fiscal policy directions that have characterized the government’s action in recent years.
The fiscal policy directions guiding the government’s action
For a number of years now, the government’s fiscal policy has been built around six broad policy directions:
⎯ maintaining a balanced budget;
⎯ spending growth consistent with growth in GDP;
⎯ a commitment towards future generations to reduce the debt;
⎯ a competitive tax system that is essential to wealth creation;
⎯ adequate funding of our public services;
⎯ reinvestment in the modernization of our infrastructures.
The new measures announced under the Plan to return to budget balance are consistent with these broad policy directions and objectives.
The Government’s Economic and Fiscal Policy Directions A.41
ASection
Growth in spending compatible with our ability to pay
The measures put forward in the Plan to return to budget balance will help bring spending as a proportion of our economy to a level compatible with our broad fiscal policy directions:
⎯ growth in spending compatible with our ability to pay;
⎯ spending as a proportion of the economy compatible with a competitive, wealth-creating tax system.
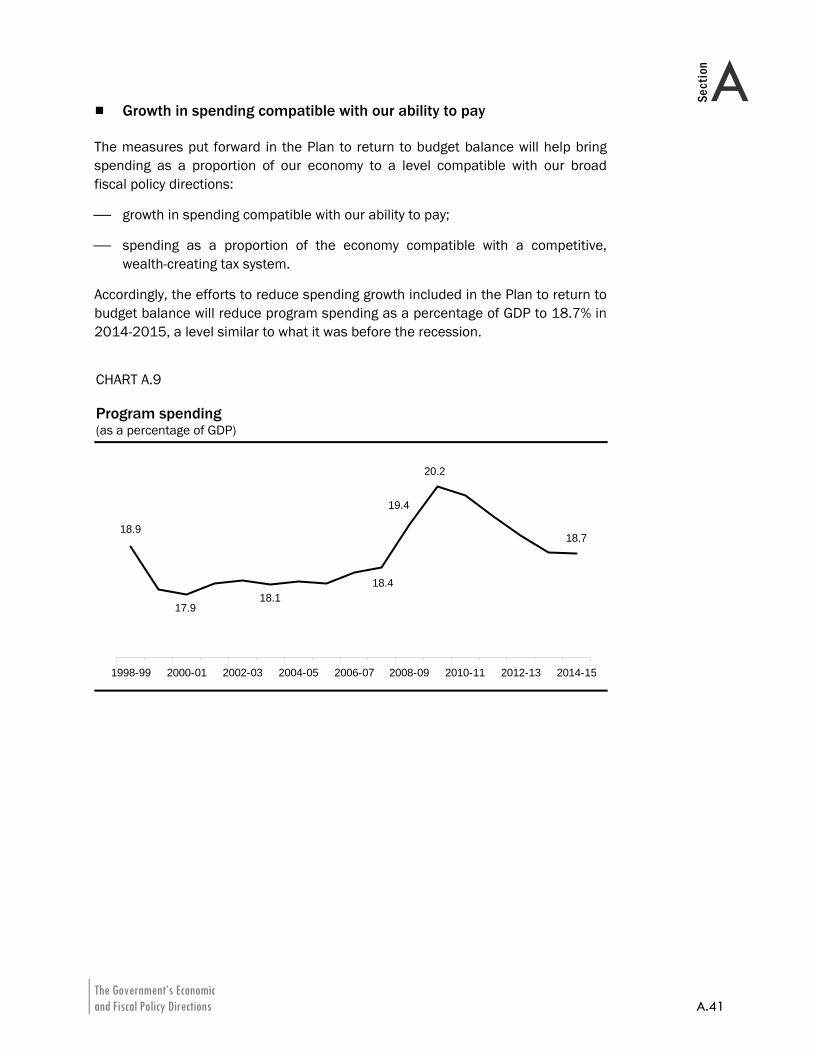
Accordingly, the efforts to reduce spending growth included in the Plan to return to budget balance will reduce program spending as a percentage of GDP to 18.7% in 2014-2015, a level similar to what it was before the recession.
CHART A.9 Program spending (as a percentage of GDP)
19.4
18.9
17.918.1
18.4
18.7
20.2
1998-99 2000-01 2002-03 2004-05 2006-07 2008-09 2010-11 2012-13 2014-15
2010-2011 Budget A.42 Budget Plan
Sufficient revenue to fund public services
The additional revenue provided by the measures of the Plan to return to budget balance will enable the government to meet its commitments regarding its fiscal policy directions:
⎯ adequate funding of public services;
⎯ significant reinvestment in the modernization of infrastructures.
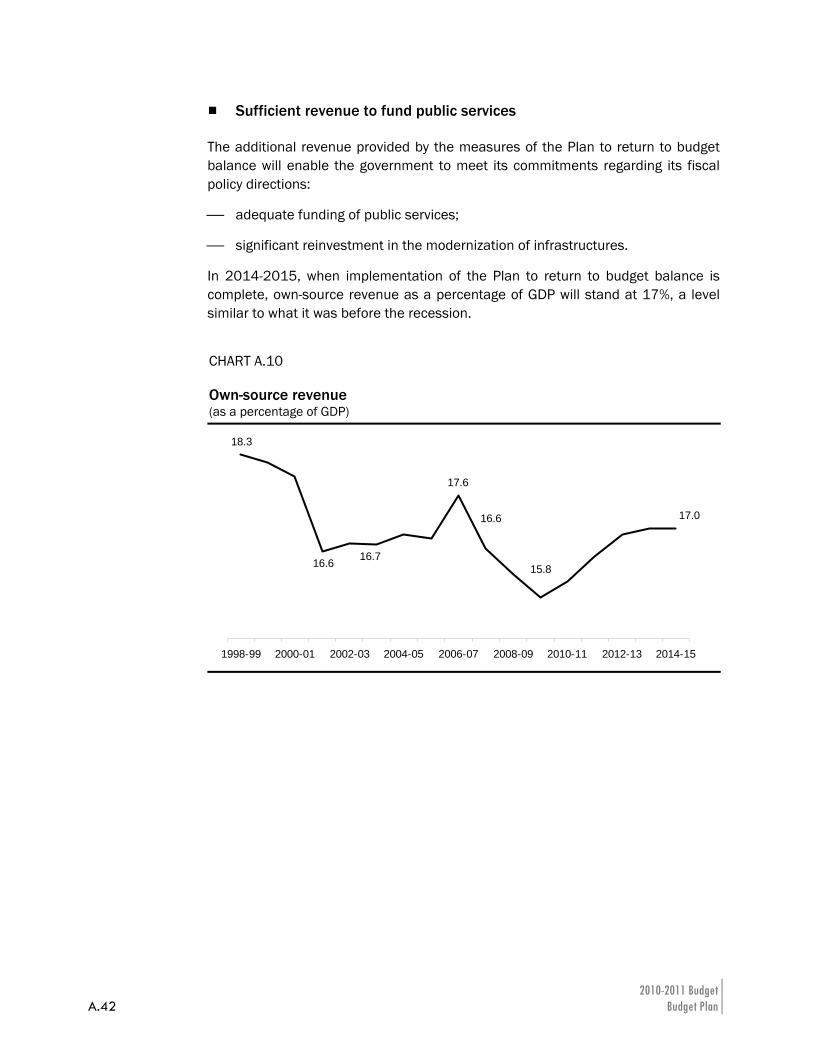
In 2014-2015, when implementation of the Plan to return to budget balance is complete, own-source revenue as a percentage of GDP will stand at 17%, a level similar to what it was before the recession.
CHART A.10 Own-source revenue (as a percentage of GDP)
18.3
16.6 16.7
17.6
16.6 17.0
15.8
1998-99 2000-01 2002-03 2004-05 2006-07 2008-09 2010-11 2012-13 2014-15
The Government’s Economic and Fiscal Policy Directions A.43
ASection
Continuation of efforts to reduce the debt load
In accordance with the government’s commitment to continue working to reduce the debt load, the implementation of the Plan to return to budget balance, combined with the rise in payments to the Generations Fund, will reduce the impact of deficits on the size of the public debt.
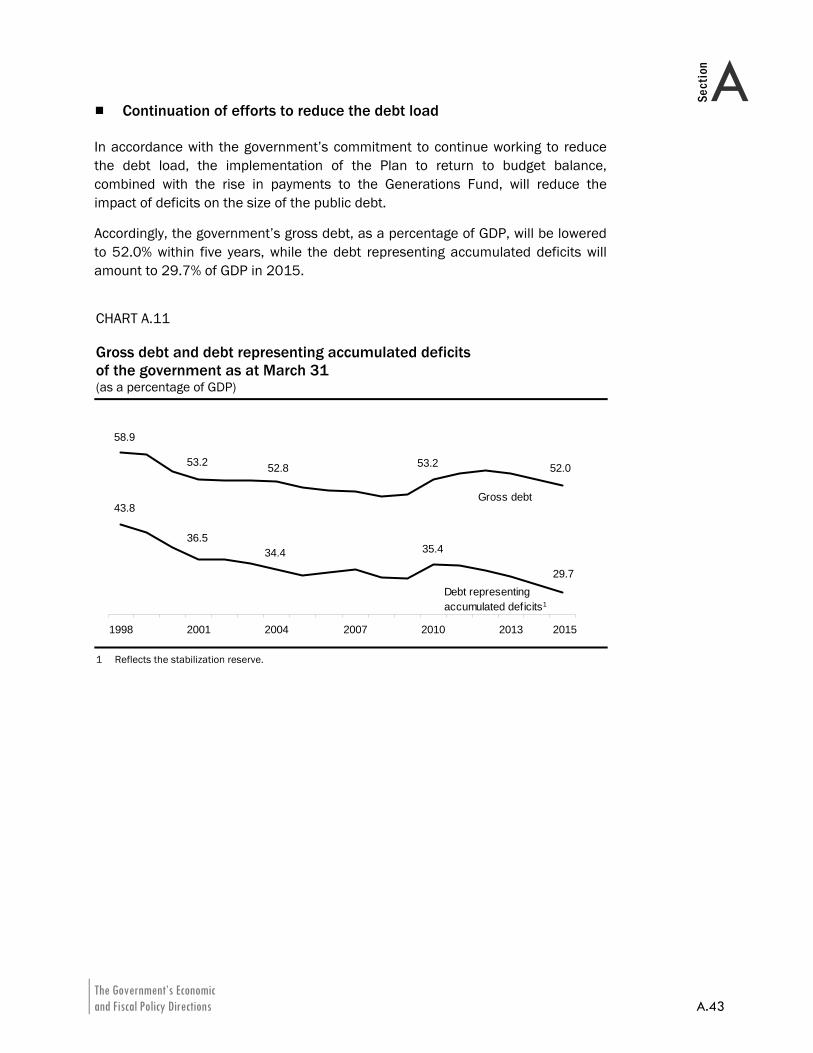
Accordingly, the government’s gross debt, as a percentage of GDP, will be lowered to 52.0% within five years, while the debt representing accumulated deficits will amount to 29.7% of GDP in 2015.
CHART A.11 Gross debt and debt representing accumulated deficits of the government as at March 31 (as a percentage of GDP)
52.853.2
58.9
52.053.2
34.436.5
43.8
29.7
35.4
1998 2001 2004 2007 2010 2013
Gross debt
Debt representing accumulated deficits1
2015
1 Reflects the stabilization reserve.

The Government’s Economic and Fiscal Policy Directions A.45
ASection
CONCLUSION The global economy is on the road to recovery and most governments will take advantage of the favourable economic situation to move forward on two fronts: consolidate the recovery of their respective economies and gradually restore order to public finances.
The milder impact of the recession in Québec presents an opportunity to act by taking the right steps that will help provide the leeway necessary to meet the challenges facing us, in particular regarding demography.
With this budget, the government is continuing with its strategy that aims to:
⎯ support the recovery by maintaining its support of the economy and employment, as stipulated in its action plan announced as part of the 2009-2010 Budget;
⎯ capitalize on a recovery that is well underway to implement the initial measures to restore order to public finances with a view to eliminating the budget deficit by 2013-2014, as stipulated in the Balanced Budget Act;
⎯ ensure the development of our economic potential in the longer term through additional strategic support for the economy;
⎯ boost efforts to reduce the debt for future generations.
As the economy recovers, the government is thus reaffirming its determination to do everything necessary to position itself favourably compared to its economic partners by moving now to take the right steps that will contribute to creating a prosperous economic environment for all Quebecers.

The Government’s Economic and Fiscal Policy Directions A.47
ASection
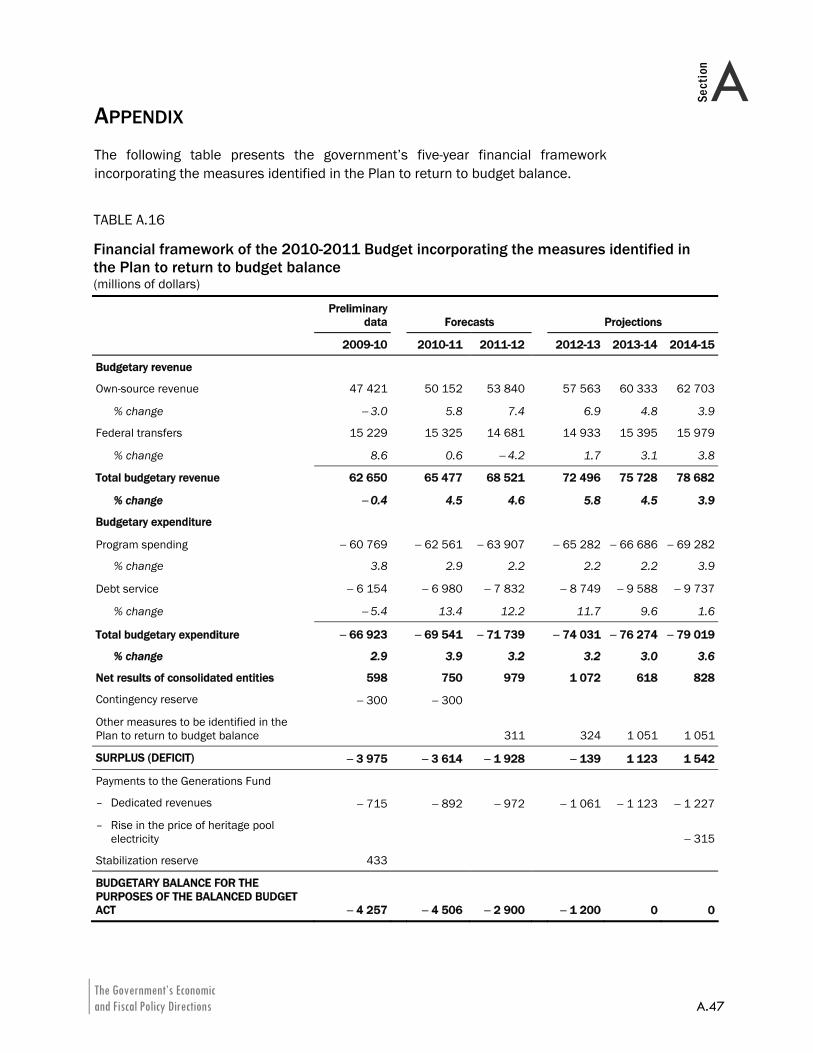
APPENDIX The following table presents the government’s five-year financial framework incorporating the measures identified in the Plan to return to budget balance.
TABLE A.16 Financial framework of the 2010-2011 Budget incorporating the measures identified in the Plan to return to budget balance (millions of dollars)
Preliminary
data Forecasts Projections
2009-10 2010-11 2011-12 2012-13 2013-14 2014-15
Budgetary revenue
Own-source revenue 47 421 50 152 53 840 57 563 60 333 62 703
% change − 3.0 5.8 7.4 6.9 4.8 3.9
Federal transfers 15 229 15 325 14 681 14 933 15 395 15 979
% change 8.6 0.6 − 4.2 1.7 3.1 3.8
Total budgetary revenue 62 650 65 477 68 521 72 496 75 728 78 682
% change − 0.4 4.5 4.6 5.8 4.5 3.9
Budgetary expenditure
Program spending − 60 769 − 62 561 − 63 907 − 65 282 − 66 686 − 69 282
% change 3.8 2.9 2.2 2.2 2.2 3.9
Debt service − 6 154 − 6 980 − 7 832 − 8 749 − 9 588 − 9 737
% change − 5.4 13.4 12.2 11.7 9.6 1.6
Total budgetary expenditure − 66 923 − 69 541 − 71 739 − 74 031 − 76 274 − 79 019
% change 2.9 3.9 3.2 3.2 3.0 3.6
Net results of consolidated entities 598 750 979 1 072 618 828
Contingency reserve − 300 − 300
Other measures to be identified in the Plan to return to budget balance 311 324 1 051 1 051
SURPLUS (DEFICIT) − 3 975 − 3 614 − 1 928 − 139 1 123 1 542
Payments to the Generations Fund
– Dedicated revenues − 715 − 892 − 972 − 1 061 − 1 123 − 1 227
– Rise in the price of heritage pool electricity − 315
Stabilization reserve 433
BUDGETARY BALANCE FOR THE PURPOSES OF THE BALANCED BUDGET ACT − 4 257 − 4 506 − 2 900 − 1 200 0 0

B.1
Section B
B The Québec Economy: Recent Developments and Outlook for 2010 and 2011 HIGHLIGHTS............................................................................................................ B.3
INTRODUCTION ........................................................................................................ B.5
1. GLOBAL ECONOMIC SITUATION........................................................................... B.7
1.1 Recovery is under way................................................................................B.7 1.2 Emerging Asian economies underpinning economic growth...................B.9 1.3 Conditions for sustainable global economic recovery .......................... B.13
2. THE ECONOMIC SITUATION IN QUÉBEC ..............................................................B.15
2.1 The economic recovery is well underway............................................... B.15 2.2 Contribution of households to economic growth................................... B.17 2.3 Non-residential investment..................................................................... B.20 2.4 Rebound in exports starting in 2010 ..................................................... B.22 2.5 Labour market ......................................................................................... B.25 2.6 Change in nominal GDP .......................................................................... B.26 2.7 Comparison with the private sector ....................................................... B.27 2.8 Five-year economic outlook .................................................................... B.29
3. THE SITUATION OF QUÉBEC’S ECONOMIC PARTNERS...........................................B.33
3.1 The situation in Canada .......................................................................... B.34 3.2 The economic situation in the United States......................................... B.38 3.3 The situation overseas ............................................................................ B.44
4. ECONOMIC PROJECTIONS FOR QUÉBEC FOR 2010-2025..................................B.47
4.1 Shrinking potential labour pool .............................................................. B.51 4.2 Increases in labour market participation............................................... B.58 4.3 Acceleration in productivity..................................................................... B.64 4.4 Gradual slowdown in economic growth ................................................. B.68 4.5 Government actions to support the economy ....................................... B.69

The Québec Economy: Recent Developments and Outlook for 2010 and 2011 B.3
BSection
HIGHLIGHTS
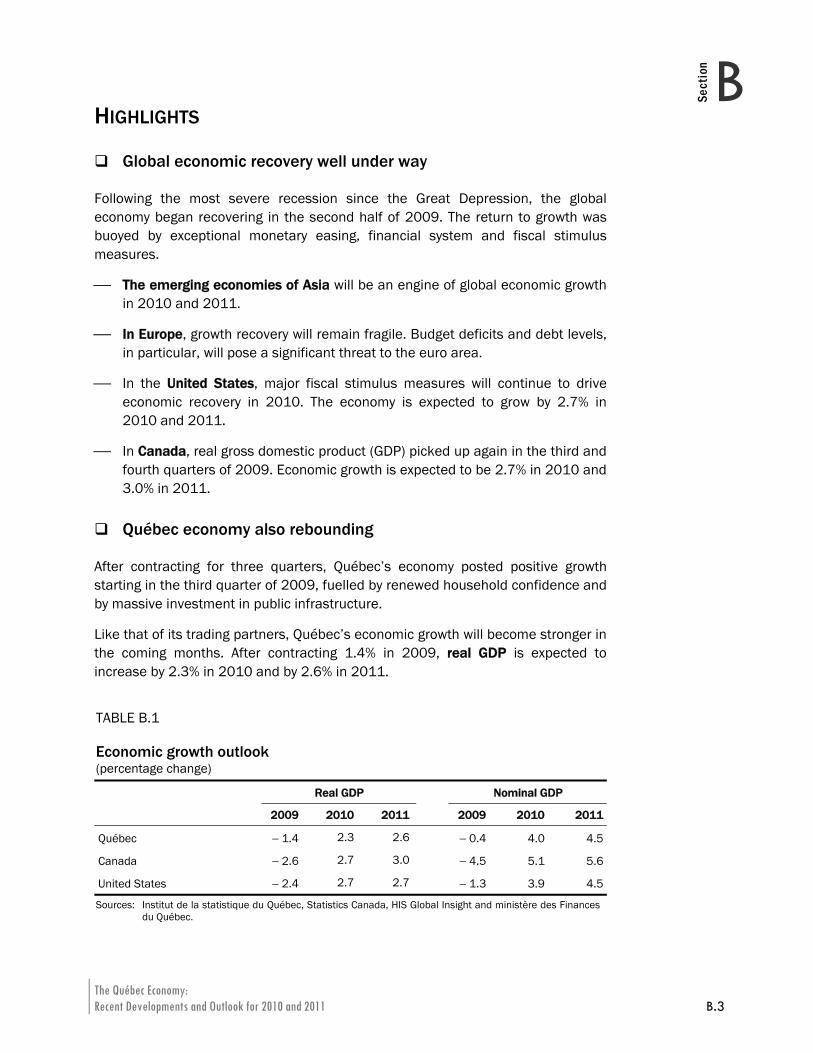
Global economic recovery well under way
Following the most severe recession since the Great Depression, the global economy began recovering in the second half of 2009. The return to growth was buoyed by exceptional monetary easing, financial system and fiscal stimulus measures.
⎯ The emerging economies of Asia will be an engine of global economic growth in 2010 and 2011.
⎯ In Europe, growth recovery will remain fragile. Budget deficits and debt levels, in particular, will pose a significant threat to the euro area.
⎯ In the United States, major fiscal stimulus measures will continue to drive economic recovery in 2010. The economy is expected to grow by 2.7% in 2010 and 2011.
⎯ In Canada, real gross domestic product (GDP) picked up again in the third and fourth quarters of 2009. Economic growth is expected to be 2.7% in 2010 and 3.0% in 2011.
Québec economy also rebounding
After contracting for three quarters, Québec’s economy posted positive growth starting in the third quarter of 2009, fuelled by renewed household confidence and by massive investment in public infrastructure.
Like that of its trading partners, Québec’s economic growth will become stronger in the coming months. After contracting 1.4% in 2009, real GDP is expected to increase by 2.3% in 2010 and by 2.6% in 2011.
TABLE B.1 Economic growth outlook (percentage change)
Real GDP Nominal GDP
2009 2010 2011 2009 2010 2011
Québec − 1.4 2.3 2.6 − 0.4 4.0 4.5
Canada − 2.6 2.7 3.0 − 4.5 5.1 5.6
United States − 2.4 2.7 2.7 − 1.3 3.9 4.5
Sources: Institut de la statistique du Québec, Statistics Canada, HIS Global Insight and ministère des Finances du Québec.
2010-2011 Budget B.4 Budget Plan
Québec weathered the recession better than its trading partners, notably thanks to massive public investment started as early as 2008, the good performance of the housing market and the size of the aerospace industry, which was not hit as hard as the automotive industry. As a result, the decline in output and job losses was less severe in Québec in 2009 than in Canada and the United States.
After shrinking 0.4% in 2009, nominal GDP, which takes price changes into account and on which government revenues are based, is expected to grow by 4.0% this year and 4.5% next year.
The recession will leave scars
Québec’s economic activity should continue to expand in the coming years, especially between 2010 and 2014, when real GDP is expected to grow at an average rate of 2.3%.
The decline in Québec’s output in 2009 will leave scars, despite the significant rebound that will follow. Even though the growth in output over the next four years will exceed the historical trend, it will not be sufficient over the forecast period to recover the output losses during the recession:
⎯ Relative to the values forecasted in the 2008-2009 Budget, the projected nominal GDP will be $17 billion lower in 2010 and $13 billion lower in 2014.
Over the next five years, economic growth will be slowed down by a number of factors. In particular, the high Canadian dollar and stiff competition from emerging economies will slow growth in Québec’s international exports. The latter will also be limited by the moderate growth in US domestic demand.
In addition, changes in Québec’s potential labour pool will no longer sustain economic growth starting in 2014. More specifically, the number of working-age people will fall over the next 15 years due to the decline in population growth and to population aging.
As a result, a slowdown in real GDP growth is projected. Following a three-decade trend of 2.1%, annual economic growth is expected to gradually dip to 1.4% by 2021-2025.
The Québec Economy: Recent Developments and Outlook for 2010 and 2011 B.5
BSection
INTRODUCTION This section of the Budget Plan presents the economic forecasts underpinning the 2010-2011 Budget. It is divided into four sections.
Section 1 explains the global economic situation. After experiencing a deep recession, the global economy began recovering in the second half of 2009. In 2010, economic growth will continue to be supported by government stimulus measures. Households and businesses are expected to take over from governments in driving global economic growth in 2011.
Section 2 presents the economic situation in Québec. Like its trading partners, Québec is in full economic recovery mode. Real GDP growth on average is even expected to outpace the historical trend until 2014.
Section 3 describes the economic situation of Québec’s trading partners. Québec is an open economy. Its output is largely dependent on foreign demand for Québec products, with exports accounting for more than half of its GDP. The Québec economy will benefit primarily from the upturn in the US and Canadian economies.
Section 4 presents the 15-year economic projections for Québec. During the period in question, Québec will face major demographic changes that will have a significant impact on its labour market and economy.

The Québec Economy: Recent Developments and Outlook for 2010 and 2011 B.7
BSection
1. GLOBAL ECONOMIC SITUATION
1.1 Recovery is under way
In 2008 and 2009, the global economy went through the worst recession since the Great Depression. Public authorities from around the world worked together intensively to revive economic activity.
⎯ Central banks eased their monetary policy stance considerably.
⎯ Government authorities adopted economic stimulus plans of unprecedented scale and introduced measures to reduce credit risk and invigorate the banking sector.
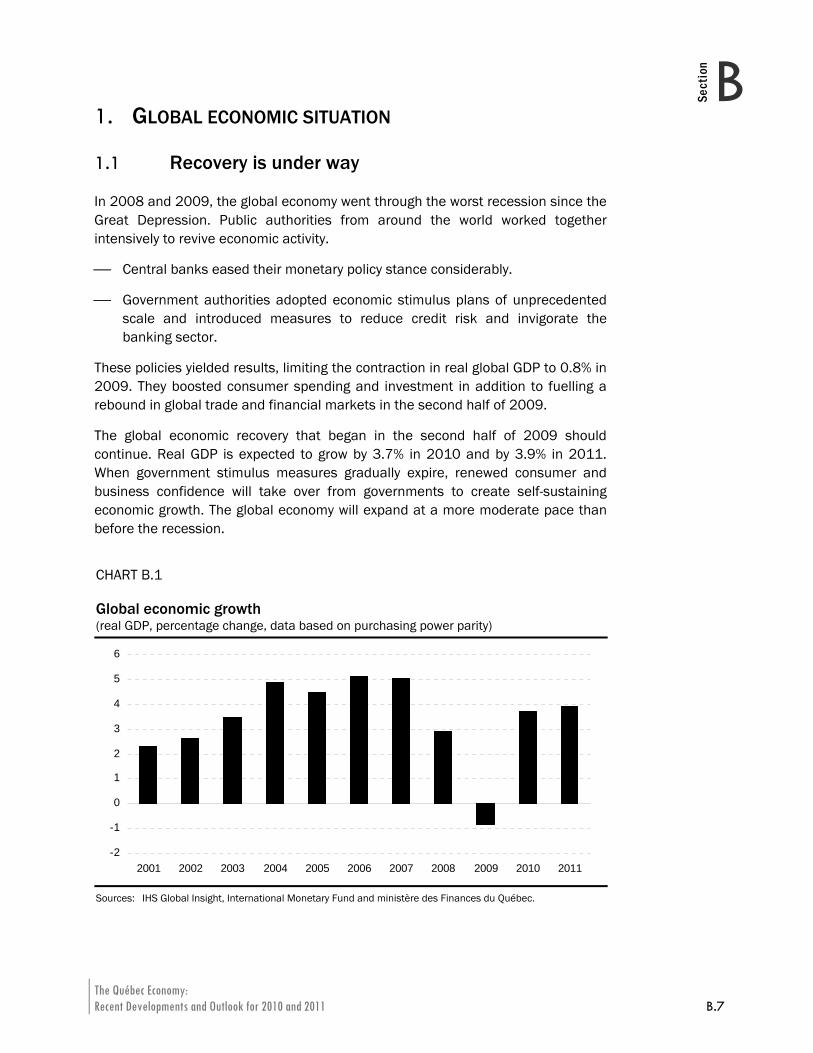
These policies yielded results, limiting the contraction in real global GDP to 0.8% in 2009. They boosted consumer spending and investment in addition to fuelling a rebound in global trade and financial markets in the second half of 2009.
The global economic recovery that began in the second half of 2009 should continue. Real GDP is expected to grow by 3.7% in 2010 and by 3.9% in 2011. When government stimulus measures gradually expire, renewed consumer and business confidence will take over from governments to create self-sustaining economic growth. The global economy will expand at a more moderate pace than before the recession.
CHART B.1 Global economic growth (real GDP, percentage change, data based on purchasing power parity)
-2
-1
0
1
2
3
4
5
6
2001 2002 2003 2004 2005 2006 2007 2008 2009 2010 2011
Sources: IHS Global Insight, International Monetary Fund and ministère des Finances du Québec.
2010-2011 Budget B.8 Budget Plan
Revival of world trade
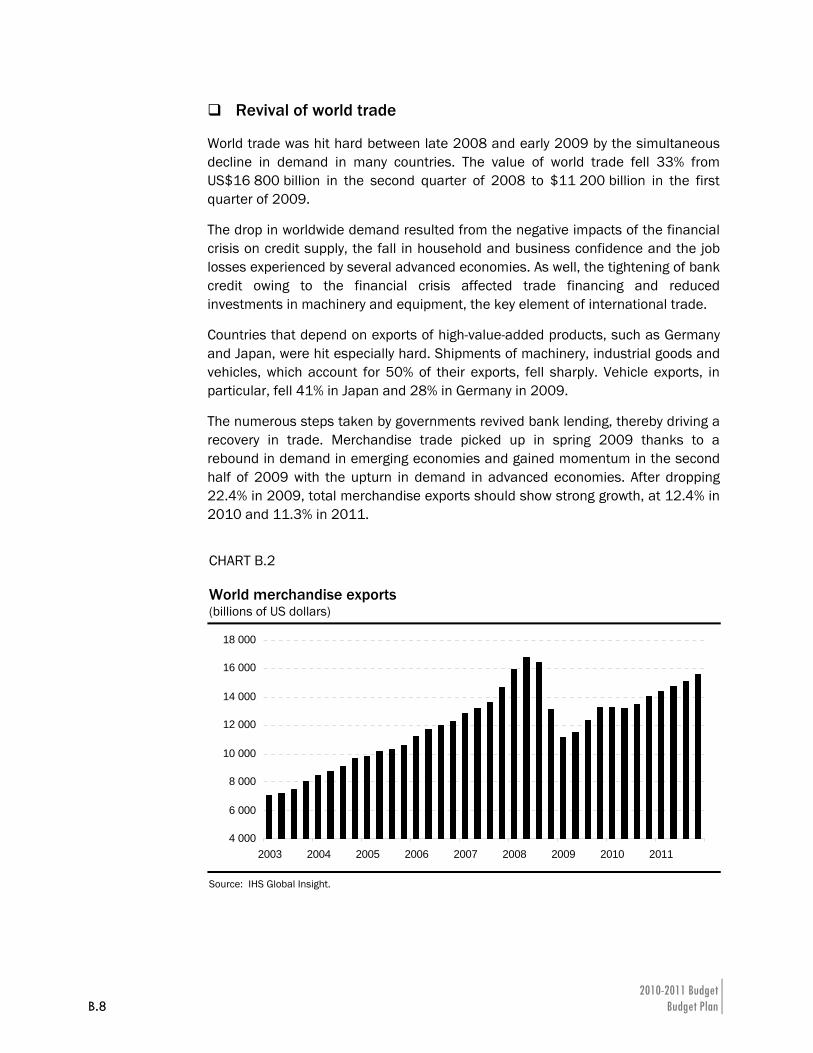
World trade was hit hard between late 2008 and early 2009 by the simultaneous decline in demand in many countries. The value of world trade fell 33% from US$16 800 billion in the second quarter of 2008 to $11 200 billion in the first quarter of 2009.
The drop in worldwide demand resulted from the negative impacts of the financial crisis on credit supply, the fall in household and business confidence and the job losses experienced by several advanced economies. As well, the tightening of bank credit owing to the financial crisis affected trade financing and reduced investments in machinery and equipment, the key element of international trade.
Countries that depend on exports of high-value-added products, such as Germany and Japan, were hit especially hard. Shipments of machinery, industrial goods and vehicles, which account for 50% of their exports, fell sharply. Vehicle exports, in particular, fell 41% in Japan and 28% in Germany in 2009.
The numerous steps taken by governments revived bank lending, thereby driving a recovery in trade. Merchandise trade picked up in spring 2009 thanks to a rebound in demand in emerging economies and gained momentum in the second half of 2009 with the upturn in demand in advanced economies. After dropping 22.4% in 2009, total merchandise exports should show strong growth, at 12.4% in 2010 and 11.3% in 2011.
CHART B.2 World merchandise exports (billions of US dollars)
4 000
6 000
8 000
10 000
12 000
14 000
16 000
18 000
2003 2004 2005 2006 2007 2008 2009 2010 2011
Source: IHS Global Insight.
The Québec Economy: Recent Developments and Outlook for 2010 and 2011 B.9
BSection
1.2 Emerging Asian economies underpinning economic growth
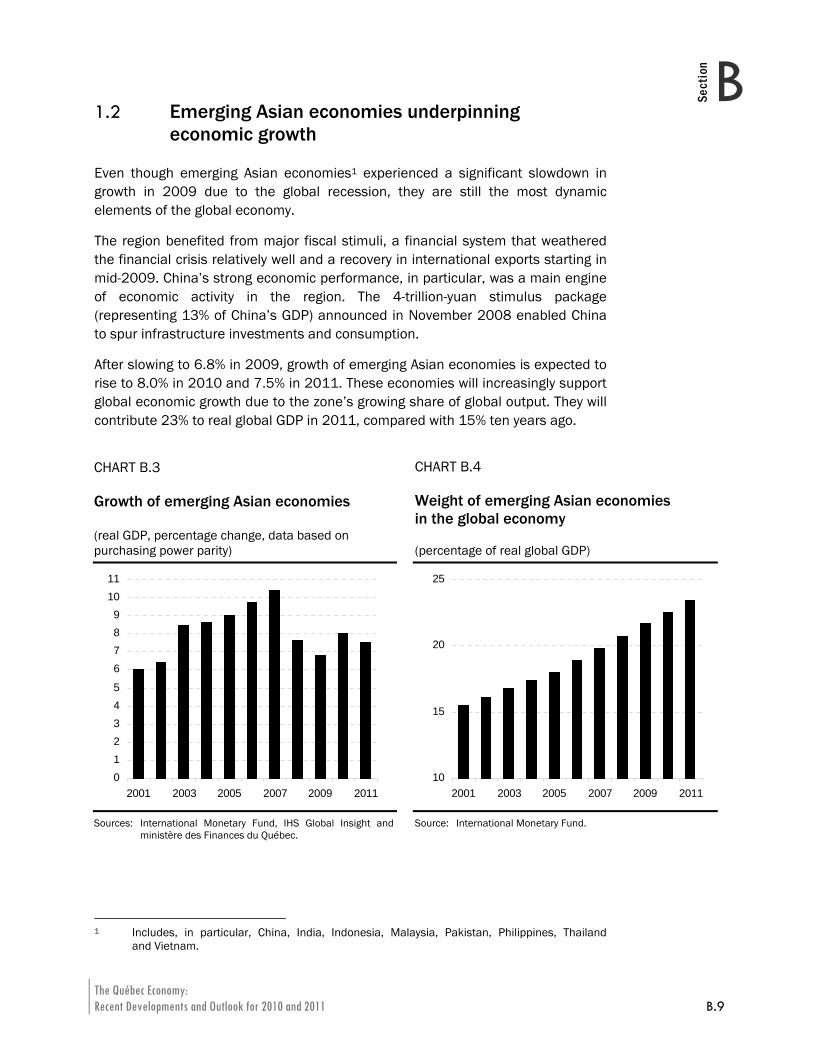
Even though emerging Asian economies1 experienced a significant slowdown in growth in 2009 due to the global recession, they are still the most dynamic elements of the global economy.
The region benefited from major fiscal stimuli, a financial system that weathered the financial crisis relatively well and a recovery in international exports starting in mid-2009. China’s strong economic performance, in particular, was a main engine of economic activity in the region. The 4-trillion-yuan stimulus package (representing 13% of China’s GDP) announced in November 2008 enabled China to spur infrastructure investments and consumption.
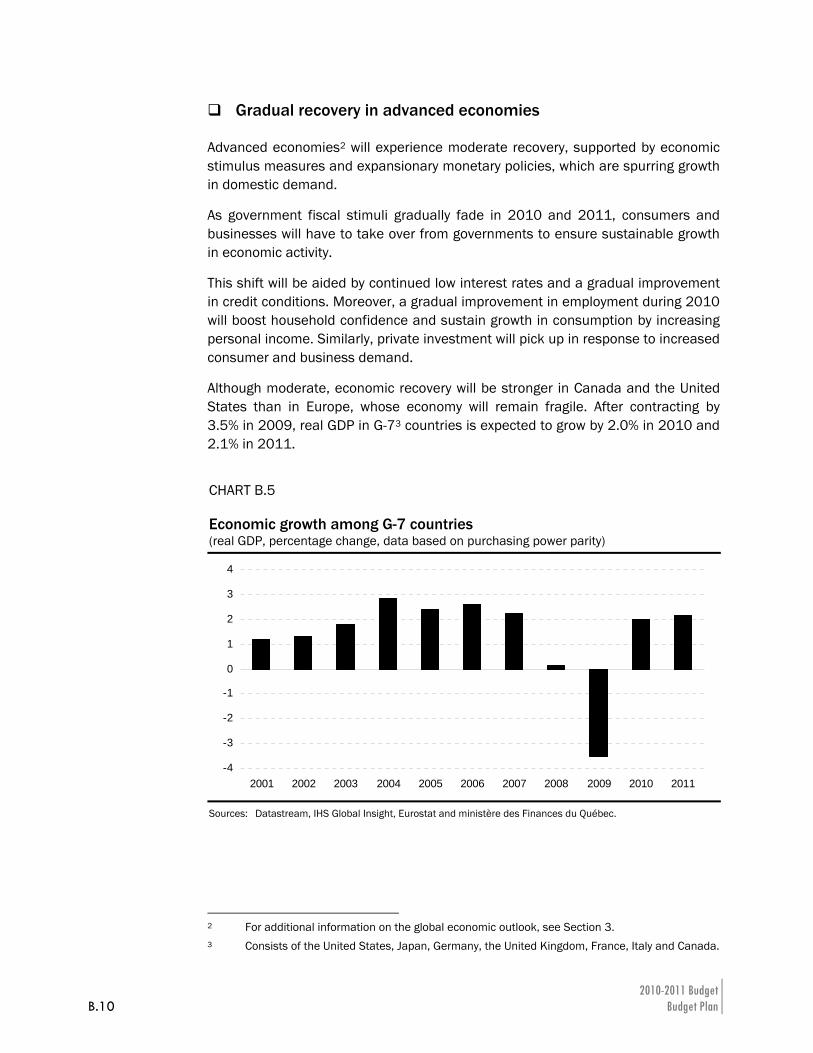
After slowing to 6.8% in 2009, growth of emerging Asian economies is expected to rise to 8.0% in 2010 and 7.5% in 2011. These economies will increasingly support global economic growth due to the zone’s growing share of global output. They will contribute 23% to real global GDP in 2011, compared with 15% ten years ago.
1 Includes, in particular, China, India, Indonesia, Malaysia, Pakistan, Philippines, Thailand
and Vietnam.
CHART B.3 Growth of emerging Asian economies
CHART B.4 Weight of emerging Asian economies in the global economy
(real GDP, percentage change, data based on purchasing power parity)
(percentage of real global GDP)
012345
6789
1011
2001 2003 2005 2007 2009 2011
10
15
20
25
2001 2003 2005 2007 2009 2011
Sources: International Monetary Fund, IHS Global Insight and ministère des Finances du Québec.
Source: International Monetary Fund.
2010-2011 Budget B.10 Budget Plan
Gradual recovery in advanced economies
Advanced economies2 will experience moderate recovery, supported by economic stimulus measures and expansionary monetary policies, which are spurring growth in domestic demand.
As government fiscal stimuli gradually fade in 2010 and 2011, consumers and businesses will have to take over from governments to ensure sustainable growth in economic activity.
This shift will be aided by continued low interest rates and a gradual improvement in credit conditions. Moreover, a gradual improvement in employment during 2010 will boost household confidence and sustain growth in consumption by increasing personal income. Similarly, private investment will pick up in response to increased consumer and business demand.
Although moderate, economic recovery will be stronger in Canada and the United States than in Europe, whose economy will remain fragile. After contracting by 3.5% in 2009, real GDP in G-73 countries is expected to grow by 2.0% in 2010 and 2.1% in 2011.
CHART B.5 Economic growth among G-7 countries (real GDP, percentage change, data based on purchasing power parity)
-4
-3
-2
-1
0
1
2
3
4
2001 2002 2003 2004 2005 2006 2007 2008 2009 2010 2011
Sources: Datastream, IHS Global Insight, Eurostat and ministère des Finances du Québec.
2 For additional information on the global economic outlook, see Section 3. 3 Consists of the United States, Japan, Germany, the United Kingdom, France, Italy and Canada.
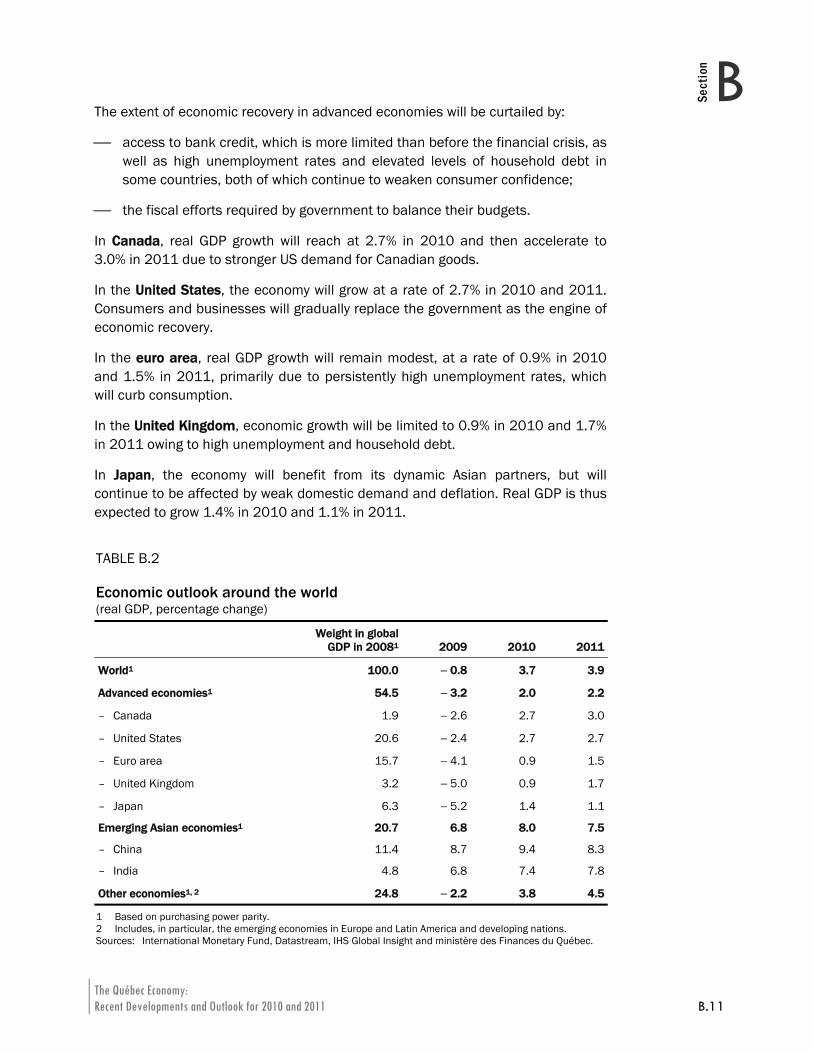
The Québec Economy: Recent Developments and Outlook for 2010 and 2011 B.11
BSection
The extent of economic recovery in advanced economies will be curtailed by:
⎯ access to bank credit, which is more limited than before the financial crisis, as well as high unemployment rates and elevated levels of household debt in some countries, both of which continue to weaken consumer confidence;
⎯ the fiscal efforts required by government to balance their budgets.
In Canada, real GDP growth will reach at 2.7% in 2010 and then accelerate to 3.0% in 2011 due to stronger US demand for Canadian goods.
In the United States, the economy will grow at a rate of 2.7% in 2010 and 2011. Consumers and businesses will gradually replace the government as the engine of economic recovery.
In the euro area, real GDP growth will remain modest, at a rate of 0.9% in 2010 and 1.5% in 2011, primarily due to persistently high unemployment rates, which will curb consumption.
In the United Kingdom, economic growth will be limited to 0.9% in 2010 and 1.7% in 2011 owing to high unemployment and household debt.
In Japan, the economy will benefit from its dynamic Asian partners, but will continue to be affected by weak domestic demand and deflation. Real GDP is thus expected to grow 1.4% in 2010 and 1.1% in 2011.
TABLE B.2 Economic outlook around the world (real GDP, percentage change)
Weight in global
GDP in 20081 2009 2010 2011
World1 100.0 − 0.8 3.7 3.9
Advanced economies1 54.5 − 3.2 2.0 2.2
– Canada 1.9 − 2.6 2.7 3.0
– United States 20.6 − 2.4 2.7 2.7
– Euro area 15.7 − 4.1 0.9 1.5
– United Kingdom 3.2 − 5.0 0.9 1.7
– Japan 6.3 − 5.2 1.4 1.1
Emerging Asian economies1 20.7 6.8 8.0 7.5
– China 11.4 8.7 9.4 8.3
– India 4.8 6.8 7.4 7.8
Other economies1, 2 24.8 − 2.2 3.8 4.5
1 Based on purchasing power parity. 2 Includes, in particular, the emerging economies in Europe and Latin America and developing nations. Sources: International Monetary Fund, Datastream, IHS Global Insight and ministère des Finances du Québec.
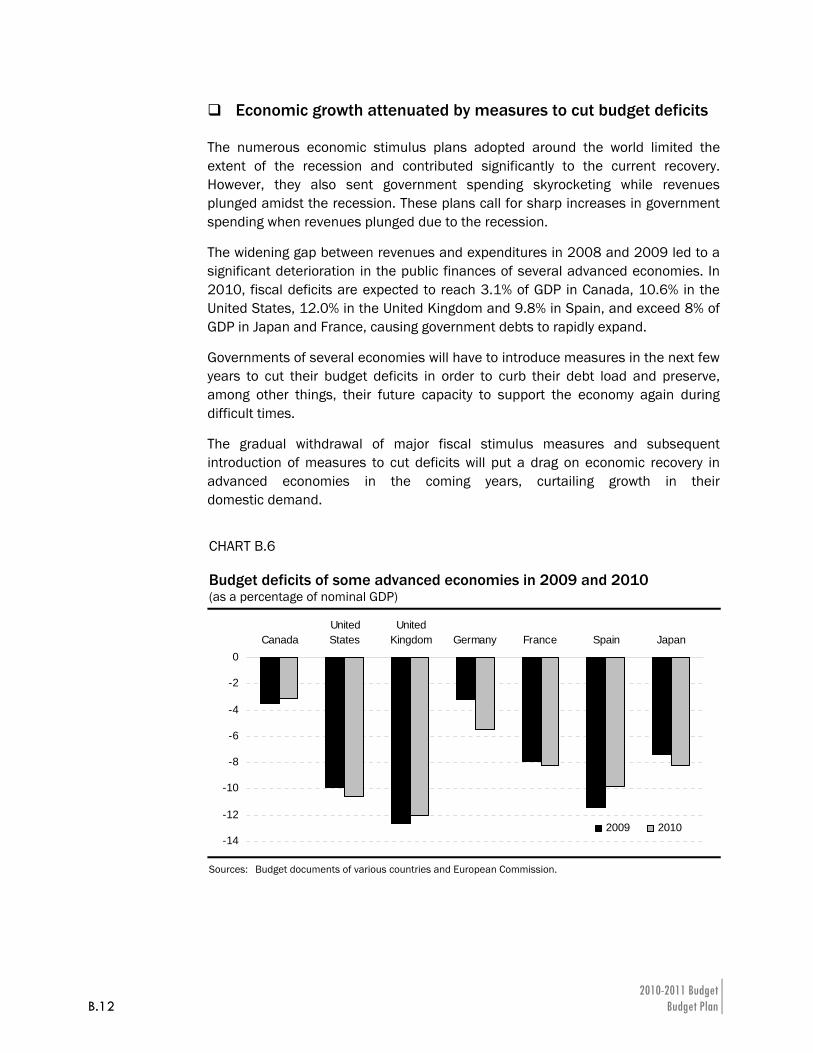
2010-2011 Budget B.12 Budget Plan
Economic growth attenuated by measures to cut budget deficits
The numerous economic stimulus plans adopted around the world limited the extent of the recession and contributed significantly to the current recovery. However, they also sent government spending skyrocketing while revenues plunged amidst the recession. These plans call for sharp increases in government spending when revenues plunged due to the recession.
The widening gap between revenues and expenditures in 2008 and 2009 led to a significant deterioration in the public finances of several advanced economies. In 2010, fiscal deficits are expected to reach 3.1% of GDP in Canada, 10.6% in the United States, 12.0% in the United Kingdom and 9.8% in Spain, and exceed 8% of GDP in Japan and France, causing government debts to rapidly expand.
Governments of several economies will have to introduce measures in the next few years to cut their budget deficits in order to curb their debt load and preserve, among other things, their future capacity to support the economy again during difficult times.
The gradual withdrawal of major fiscal stimulus measures and subsequent introduction of measures to cut deficits will put a drag on economic recovery in advanced economies in the coming years, curtailing growth in their domestic demand.
CHART B.6 Budget deficits of some advanced economies in 2009 and 2010 (as a percentage of nominal GDP)
-14
-12
-10
-8
-6
-4
-2
0Canada
UnitedStates
UnitedKingdom Germany France Spain Japan
2009 2010
Sources: Budget documents of various countries and European Commission.
The Québec Economy: Recent Developments and Outlook for 2010 and 2011 B.13
BSection
1.3 Conditions for sustainable global economic recovery
Thus far, the global economic recovery has been supported by the numerous monetary and budget stimulus programs adopted by G-204 governments to sustain economic activity in 2009 and 2010.
These programs should be sufficient to enable households and businesses to take over from governments in driving economic growth in 2011. However, sustainable recovery in the global economy depends on a number of conditions, including:
⎯ the negative effects of the financial crisis on banking activity and credit access conditions will be mitigated in 2010;
⎯ national governments and central banks as a whole proceed with a gradual and gauged withdrawal of their economic support policies;
⎯ the negative impact of economic and budget problems in European countries such as Greece and Spain will remain limited mostly to Europe and will not hinder global economic recovery;
⎯ the Chinese economy continues to perform well, while the measures introduced by public authorities to prevent the economy from overheating temper but not stop growth.
However, some of these conditions may not be fully met, in which case global economic growth would be attenuated.
Continuing effects of the financial crisis
Despite the net improvement in financial markets in 2009, credit conditions remain more restrictive than prior to the recession. Credit supply and demand in advanced economies are still weakened by the financial crisis, curtailing growth in consumption and investment.
⎯ US banks continue to tighten their credit standards for most types of loans both to households and to the business sector. However, the standards are not as tight as during the recession.
⎯ In Europe, financing conditions for households and businesses, while remaining restrictive, are also improving.
The negative effects of the financial crisis may last longer, thereby curbing growth in consumption and investment in advanced economies and adversely affecting foreign trade.
4 Economic forum consisting of 19 countries and the European Union.
2010-2011 Budget B.14 Budget Plan
End of economic stimulus measures
The stimulus measures introduced by governments around the world will expire within two years. It is not often in recent history that budgetary and fiscal policies have been tightened at the same time, which is what makes this current growth cycle different from previous ones and creates additional uncertainty.
With the current global economic recovery still fragile, ending economic stimulus measures too fast and too much at the same time, notably in the United States, could make it harder for consumers and businesses to take over from governments in 2011 as the principal engine of economic growth, thereby jeopardizing the recovery.
Budget crisis in European economies
A number of European countries are currently caught under very large budget deficits, This is particularly the case in Greece, Spain, Portugal and the United Kingdom.
The situation has resulted to high financing costs for some of these countries and a decline in the value of the euro, the pound sterling and European stock markets.
The resulting negative impact on the international economic and financial system could dampen the global economic recovery.
Performance of the Chinese economy
Owing to its key contribution to the demand for commodities, its driving role in Asia’s economic expansion and its growing weight in the world economy, China has a major influence over global economic growth.
In an effort to rein in the real estate market and tighten bank credit, the Chinese authorities recently introduced measures to prevent the economy from overheating and plan to take more action in this regard. The impact of these steps on China’s economic growth could be more negative than anticipated.
A greater-than-anticipated slowdown in the Chinese economy would attenuate the growth of China’s Asian trading partners and would have an adverse effect on commodity prices by dampening demand for commodities.
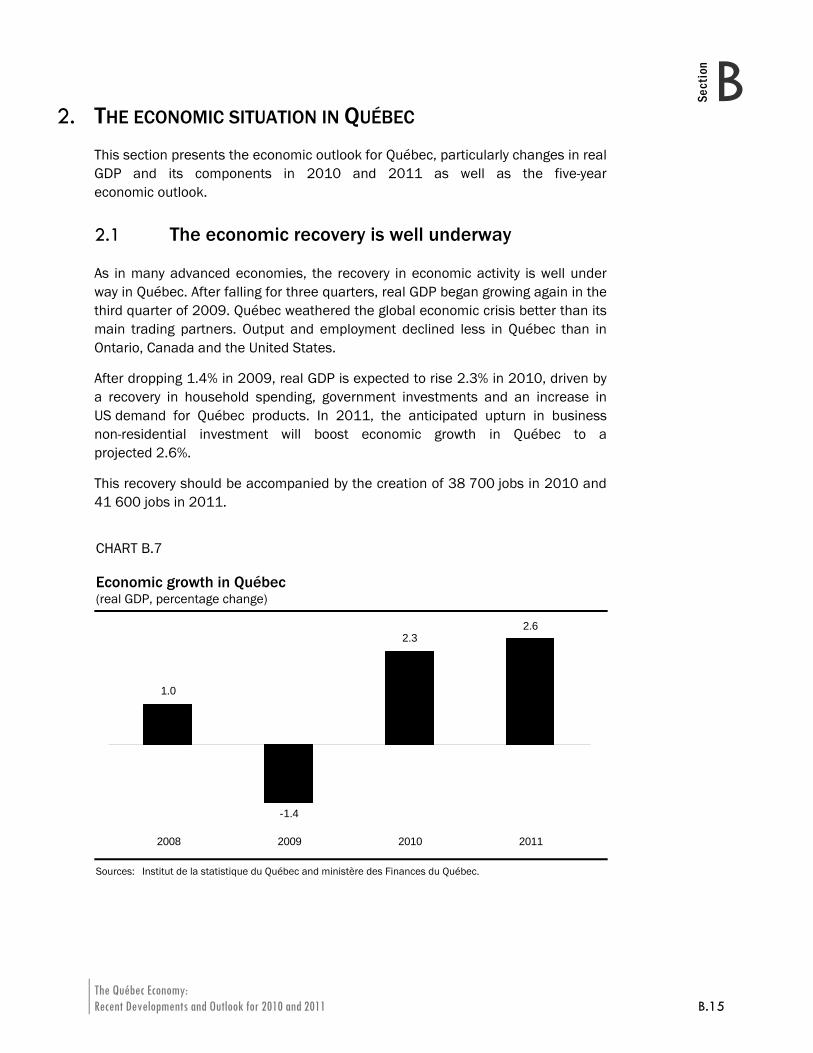
The Québec Economy: Recent Developments and Outlook for 2010 and 2011 B.15
BSection
2. THE ECONOMIC SITUATION IN QUÉBEC This section presents the economic outlook for Québec, particularly changes in real GDP and its components in 2010 and 2011 as well as the five-year economic outlook.
2.1 The economic recovery is well underway
As in many advanced economies, the recovery in economic activity is well under way in Québec. After falling for three quarters, real GDP began growing again in the third quarter of 2009. Québec weathered the global economic crisis better than its main trading partners. Output and employment declined less in Québec than in Ontario, Canada and the United States.
After dropping 1.4% in 2009, real GDP is expected to rise 2.3% in 2010, driven by a recovery in household spending, government investments and an increase in US demand for Québec products. In 2011, the anticipated upturn in business non-residential investment will boost economic growth in Québec to a projected 2.6%.
This recovery should be accompanied by the creation of 38 700 jobs in 2010 and 41 600 jobs in 2011.
CHART B.7 Economic growth in Québec (real GDP, percentage change)
1.0
-1.4
2.32.6
2008 2009 2010 2011
Sources: Institut de la statistique du Québec and ministère des Finances du Québec.
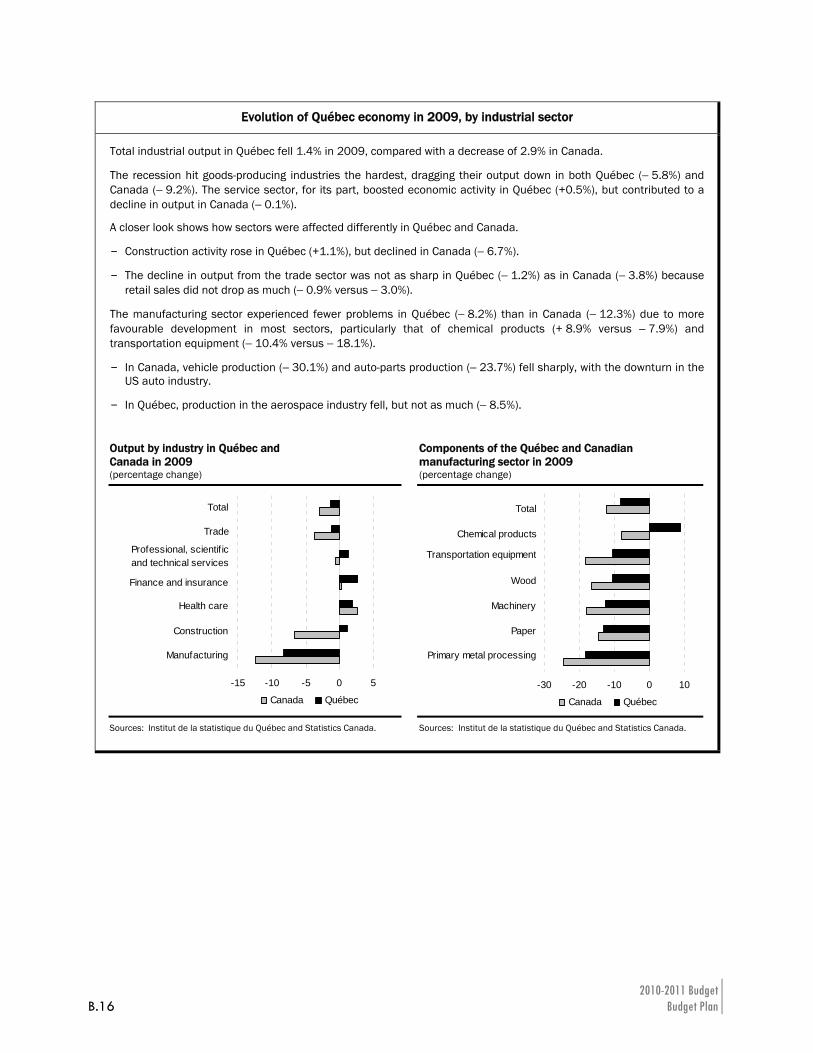
2010-2011 Budget B.16 Budget Plan
Evolution of Québec economy in 2009, by industrial sector
Total industrial output in Québec fell 1.4% in 2009, compared with a decrease of 2.9% in Canada.
The recession hit goods-producing industries the hardest, dragging their output down in both Québec (− 5.8%) and Canada (− 9.2%). The service sector, for its part, boosted economic activity in Québec (+0.5%), but contributed to a decline in output in Canada (− 0.1%).
A closer look shows how sectors were affected differently in Québec and Canada.
– Construction activity rose in Québec (+1.1%), but declined in Canada (− 6.7%).
– The decline in output from the trade sector was not as sharp in Québec (− 1.2%) as in Canada (− 3.8%) because retail sales did not drop as much (− 0.9% versus − 3.0%).
The manufacturing sector experienced fewer problems in Québec (− 8.2%) than in Canada (− 12.3%) due to more favourable development in most sectors, particularly that of chemical products (+ 8.9% versus − 7.9%) and transportation equipment (− 10.4% versus − 18.1%).
– In Canada, vehicle production (− 30.1%) and auto-parts production (− 23.7%) fell sharply, with the downturn in the US auto industry.
– In Québec, production in the aerospace industry fell, but not as much (− 8.5%).
Output by industry in Québec and Canada in 2009
Components of the Québec and Canadian manufacturing sector in 2009
(percentage change) (percentage change)
-15 -10 -5 0 5
Canada Québec
Trade
Professional, scientif ic and technical services
Finance and insurance
Health care
Construction
Manufacturing
Total
-30 -20 -10 0 10
Primary metal processing
Paper
Machinery
Wood
Transportation equipment
Chemical products
Total
Canada Québec
Chemical products
Transportation equipment
Machinery
Paper
Wood
Primary metal processing
Total
Sources: Institut de la statistique du Québec and Statistics Canada.
Sources: Institut de la statistique du Québec and Statistics Canada.
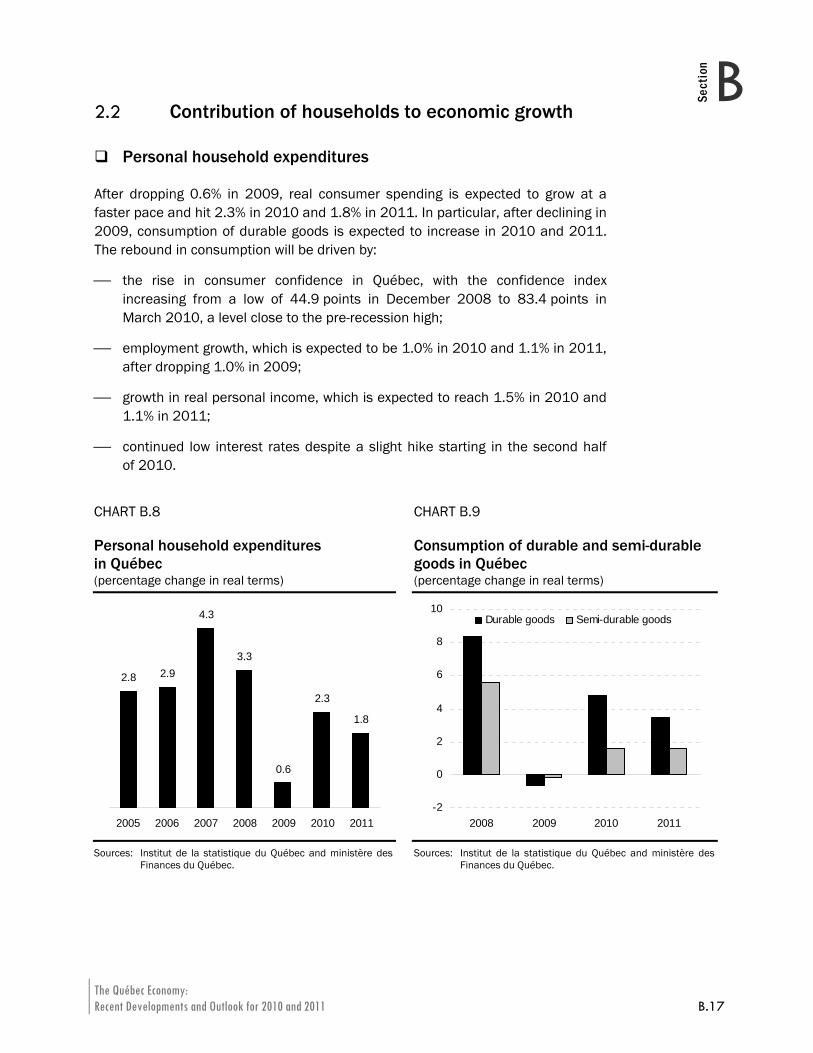
The Québec Economy: Recent Developments and Outlook for 2010 and 2011 B.17
BSection
2.2 Contribution of households to economic growth
Personal household expenditures
After dropping 0.6% in 2009, real consumer spending is expected to grow at a faster pace and hit 2.3% in 2010 and 1.8% in 2011. In particular, after declining in 2009, consumption of durable goods is expected to increase in 2010 and 2011. The rebound in consumption will be driven by:
⎯ the rise in consumer confidence in Québec, with the confidence index increasing from a low of 44.9 points in December 2008 to 83.4 points in March 2010, a level close to the pre-recession high;
⎯ employment growth, which is expected to be 1.0% in 2010 and 1.1% in 2011, after dropping 1.0% in 2009;
⎯ growth in real personal income, which is expected to reach 1.5% in 2010 and 1.1% in 2011;
⎯ continued low interest rates despite a slight hike starting in the second half of 2010.
CHART B.8 Personal household expenditures in Québec
CHART B.9 Consumption of durable and semi-durable goods in Québec
(percentage change in real terms) (percentage change in real terms)
2.8 2.9
4.3
3.3
0.6
2.3
1.8
2005 2006 2007 2008 2009 2010 2011
-2
0
2
4
6
8
10
2008 2009 2010 2011
Durable goods Semi-durable goods
Sources: Institut de la statistique du Québec and ministère des
Finances du Québec.
Sources: Institut de la statistique du Québec and ministère des Finances du Québec.
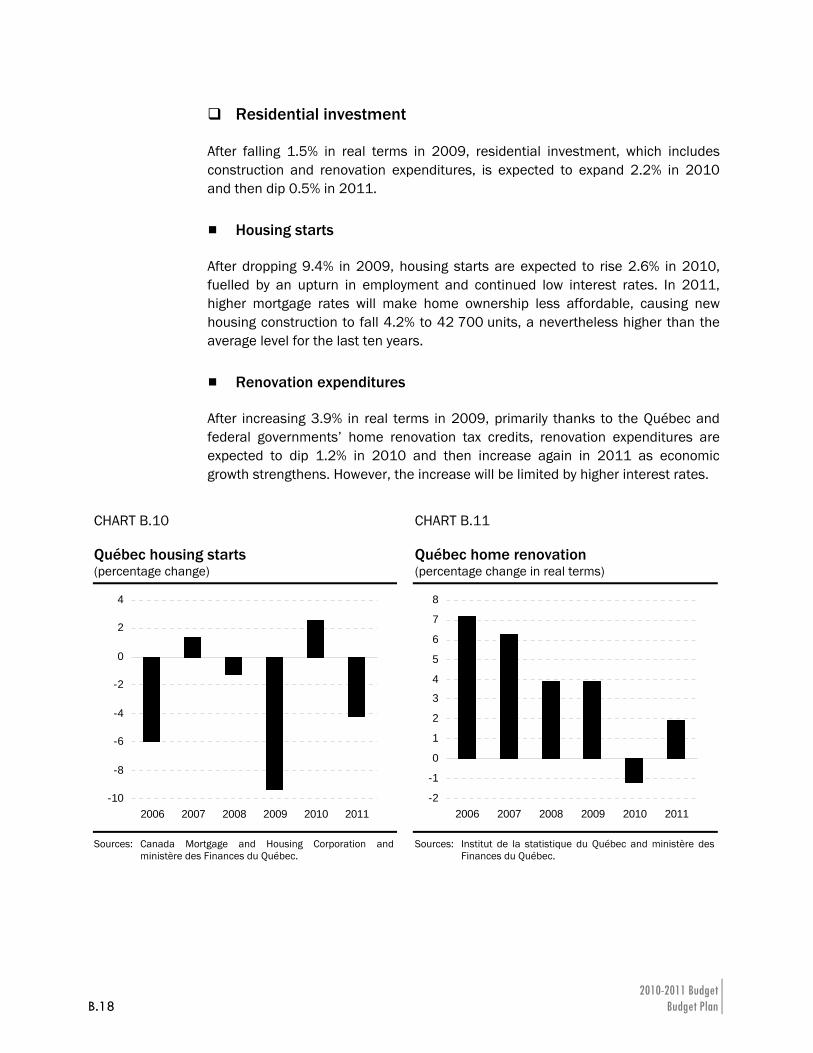
2010-2011 Budget B.18 Budget Plan
Residential investment
After falling 1.5% in real terms in 2009, residential investment, which includes construction and renovation expenditures, is expected to expand 2.2% in 2010 and then dip 0.5% in 2011.
Housing starts
After dropping 9.4% in 2009, housing starts are expected to rise 2.6% in 2010, fuelled by an upturn in employment and continued low interest rates. In 2011, higher mortgage rates will make home ownership less affordable, causing new housing construction to fall 4.2% to 42 700 units, a nevertheless higher than the average level for the last ten years.
Renovation expenditures
After increasing 3.9% in real terms in 2009, primarily thanks to the Québec and federal governments’ home renovation tax credits, renovation expenditures are expected to dip 1.2% in 2010 and then increase again in 2011 as economic growth strengthens. However, the increase will be limited by higher interest rates.
CHART B.10 Québec housing starts
CHART B.11 Québec home renovation
(percentage change) (percentage change in real terms)
-10
-8
-6
-4
-2
0
2
4
2006 2007 2008 2009 2010 2011
-2
-1
0
1
2
3
4
5
6
7
8
2006 2007 2008 2009 2010 2011
Sources: Canada Mortgage and Housing Corporation and ministère des Finances du Québec.
Sources: Institut de la statistique du Québec and ministère des Finances du Québec.
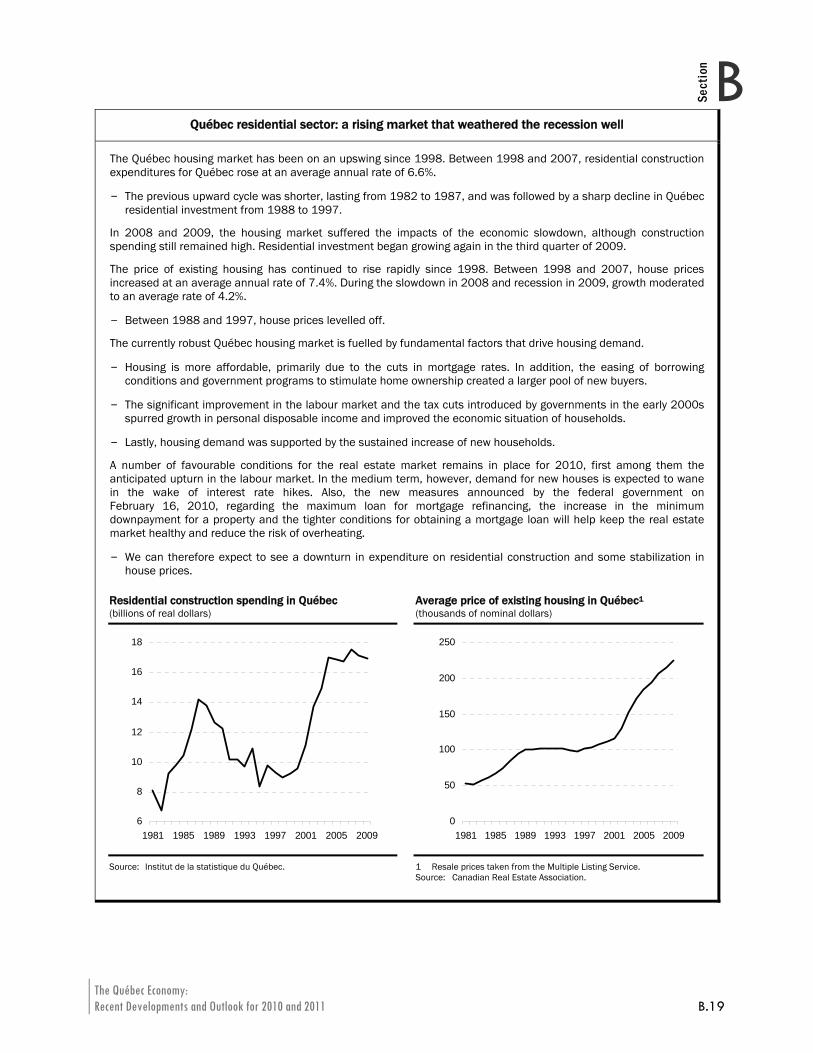
The Québec Economy: Recent Developments and Outlook for 2010 and 2011 B.19
BSection
Québec residential sector: a rising market that weathered the recession well
The Québec housing market has been on an upswing since 1998. Between 1998 and 2007, residential construction expenditures for Québec rose at an average annual rate of 6.6%.
– The previous upward cycle was shorter, lasting from 1982 to 1987, and was followed by a sharp decline in Québec residential investment from 1988 to 1997.
In 2008 and 2009, the housing market suffered the impacts of the economic slowdown, although construction spending still remained high. Residential investment began growing again in the third quarter of 2009.
The price of existing housing has continued to rise rapidly since 1998. Between 1998 and 2007, house prices increased at an average annual rate of 7.4%. During the slowdown in 2008 and recession in 2009, growth moderated to an average rate of 4.2%.
– Between 1988 and 1997, house prices levelled off.
The currently robust Québec housing market is fuelled by fundamental factors that drive housing demand.
– Housing is more affordable, primarily due to the cuts in mortgage rates. In addition, the easing of borrowing conditions and government programs to stimulate home ownership created a larger pool of new buyers.
– The significant improvement in the labour market and the tax cuts introduced by governments in the early 2000s spurred growth in personal disposable income and improved the economic situation of households.
– Lastly, housing demand was supported by the sustained increase of new households.
A number of favourable conditions for the real estate market remains in place for 2010, first among them the anticipated upturn in the labour market. In the medium term, however, demand for new houses is expected to wane in the wake of interest rate hikes. Also, the new measures announced by the federal government on February 16, 2010, regarding the maximum loan for mortgage refinancing, the increase in the minimum downpayment for a property and the tighter conditions for obtaining a mortgage loan will help keep the real estate market healthy and reduce the risk of overheating.
– We can therefore expect to see a downturn in expenditure on residential construction and some stabilization in house prices.
Residential construction spending in Québec Average price of existing housing in Québec1 (billions of real dollars) (thousands of nominal dollars)
6
8
10
12
14
16
18
1981 1985 1989 1993 1997 2001 2005 2009
0
50
100
150
200
250
1981 1985 1989 1993 1997 2001 2005 2009
Source: Institut de la statistique du Québec.
1 Resale prices taken from the Multiple Listing Service. Source: Canadian Real Estate Association.
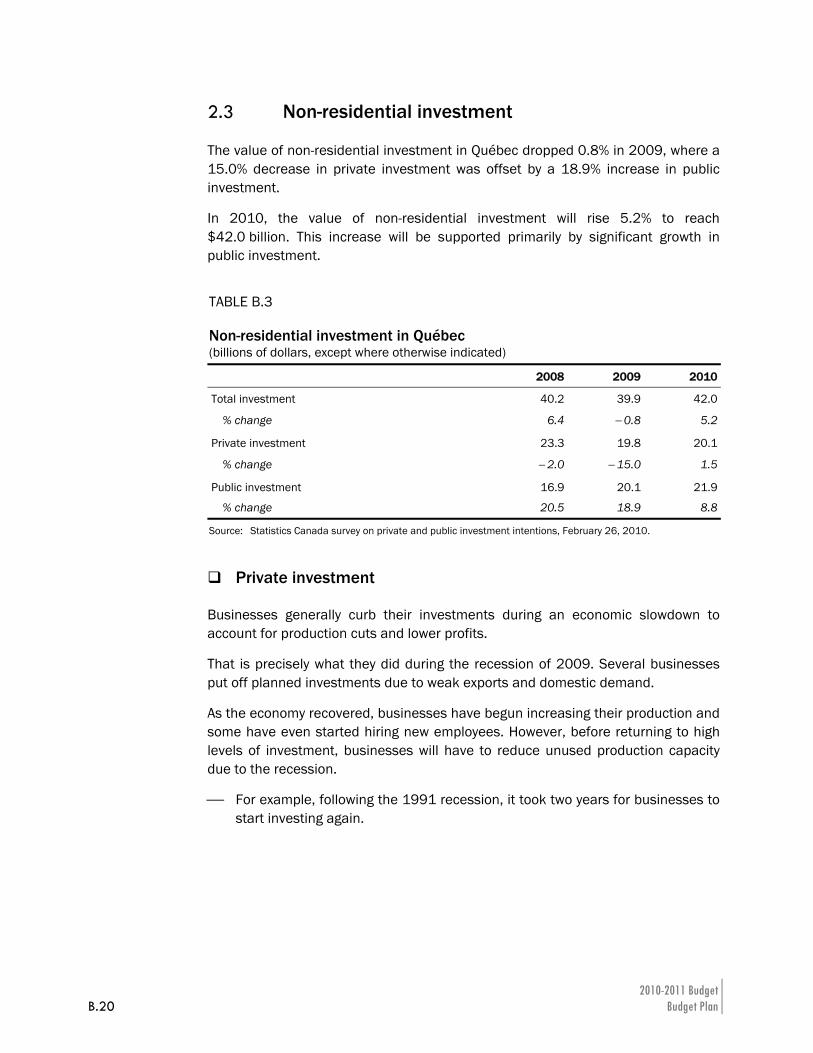
2010-2011 Budget B.20 Budget Plan
2.3 Non-residential investment
The value of non-residential investment in Québec dropped 0.8% in 2009, where a 15.0% decrease in private investment was offset by a 18.9% increase in public investment.
In 2010, the value of non-residential investment will rise 5.2% to reach $42.0 billion. This increase will be supported primarily by significant growth in public investment.
TABLE B.3 Non-residential investment in Québec (billions of dollars, except where otherwise indicated)
2008 2009 2010
Total investment 40.2 39.9 42.0
% change 6.4 − 0.8 5.2
Private investment 23.3 19.8 20.1
% change − 2.0 − 15.0 1.5
Public investment 16.9 20.1 21.9
% change 20.5 18.9 8.8
Source: Statistics Canada survey on private and public investment intentions, February 26, 2010.
Private investment
Businesses generally curb their investments during an economic slowdown to account for production cuts and lower profits.
That is precisely what they did during the recession of 2009. Several businesses put off planned investments due to weak exports and domestic demand.
As the economy recovered, businesses have begun increasing their production and some have even started hiring new employees. However, before returning to high levels of investment, businesses will have to reduce unused production capacity due to the recession.
⎯ For example, following the 1991 recession, it took two years for businesses to start investing again.
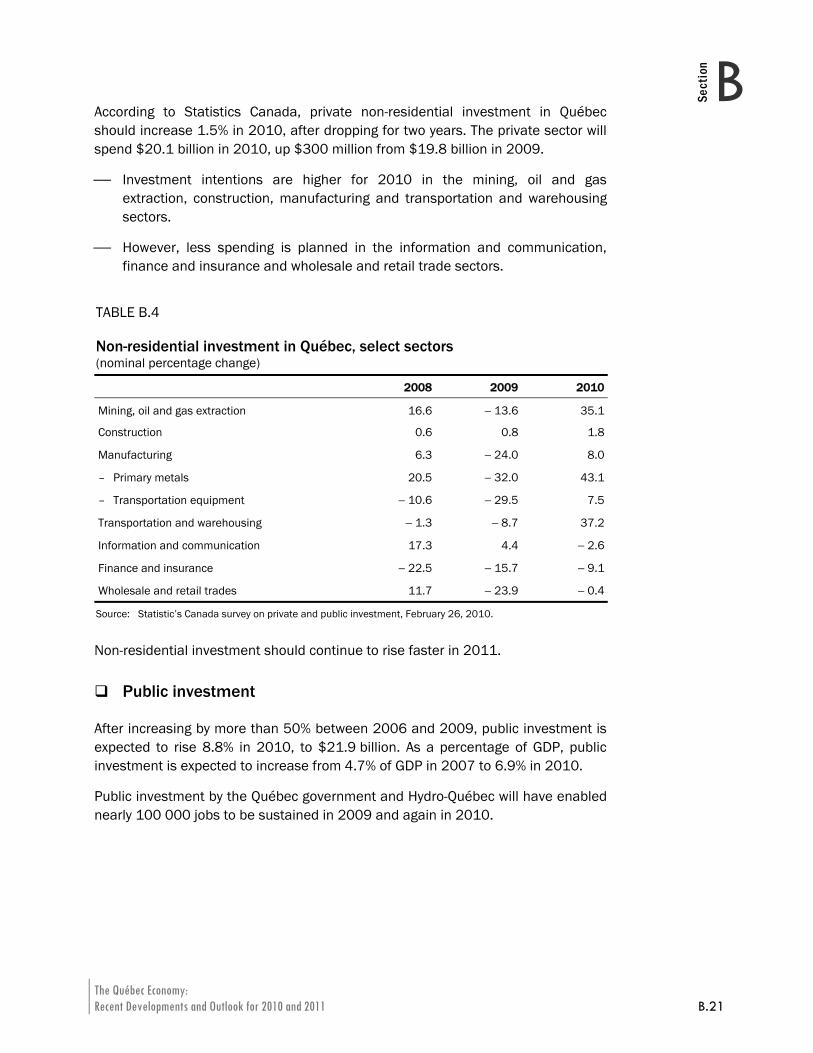
The Québec Economy: Recent Developments and Outlook for 2010 and 2011 B.21
BSection
According to Statistics Canada, private non-residential investment in Québec should increase 1.5% in 2010, after dropping for two years. The private sector will spend $20.1 billion in 2010, up $300 million from $19.8 billion in 2009.
⎯ Investment intentions are higher for 2010 in the mining, oil and gas extraction, construction, manufacturing and transportation and warehousing sectors.
⎯ However, less spending is planned in the information and communication, finance and insurance and wholesale and retail trade sectors.
TABLE B.4 Non-residential investment in Québec, select sectors (nominal percentage change)
2008 2009 2010
Mining, oil and gas extraction 16.6 − 13.6 35.1
Construction 0.6 0.8 1.8
Manufacturing 6.3 − 24.0 8.0
– Primary metals 20.5 − 32.0 43.1
– Transportation equipment − 10.6 − 29.5 7.5
Transportation and warehousing − 1.3 − 8.7 37.2
Information and communication 17.3 4.4 − 2.6
Finance and insurance − 22.5 − 15.7 − 9.1
Wholesale and retail trades 11.7 − 23.9 − 0.4
Source: Statistic’s Canada survey on private and public investment, February 26, 2010.
Non-residential investment should continue to rise faster in 2011.
Public investment
After increasing by more than 50% between 2006 and 2009, public investment is expected to rise 8.8% in 2010, to $21.9 billion. As a percentage of GDP, public investment is expected to increase from 4.7% of GDP in 2007 to 6.9% in 2010.
Public investment by the Québec government and Hydro-Québec will have enabled nearly 100 000 jobs to be sustained in 2009 and again in 2010.
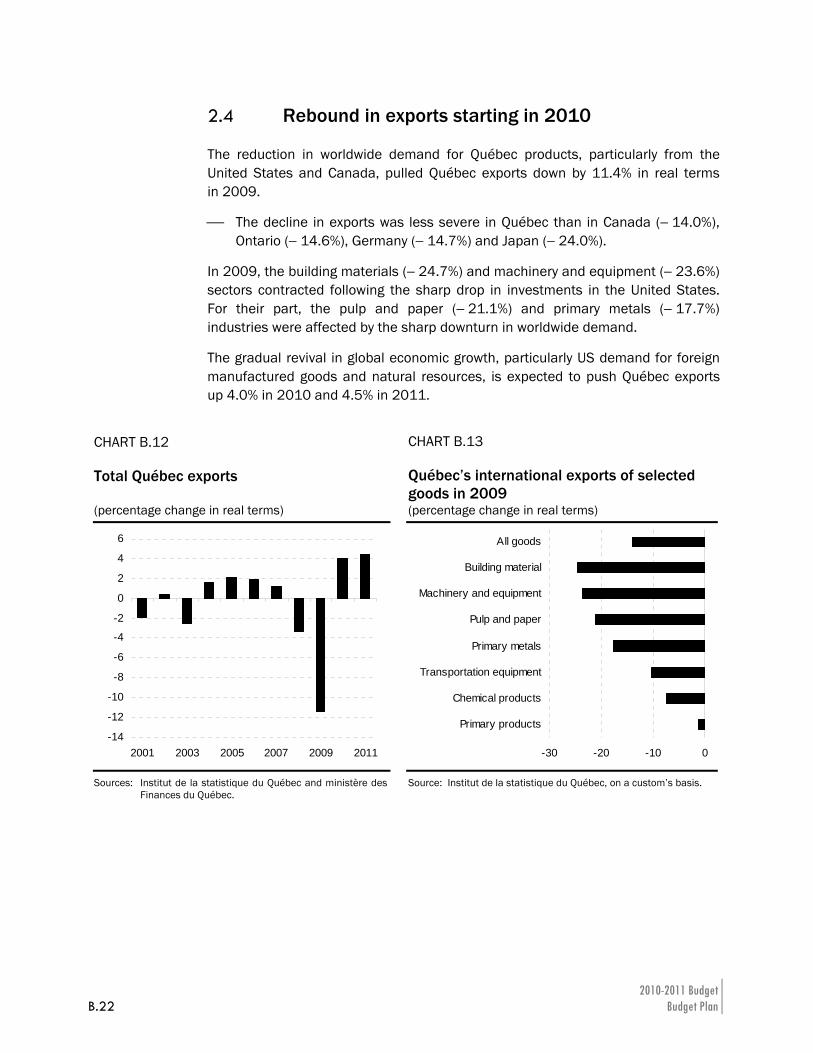
2010-2011 Budget B.22 Budget Plan
2.4 Rebound in exports starting in 2010
The reduction in worldwide demand for Québec products, particularly from the United States and Canada, pulled Québec exports down by 11.4% in real terms in 2009.
⎯ The decline in exports was less severe in Québec than in Canada (− 14.0%), Ontario (− 14.6%), Germany (− 14.7%) and Japan (− 24.0%).
In 2009, the building materials (− 24.7%) and machinery and equipment (− 23.6%) sectors contracted following the sharp drop in investments in the United States. For their part, the pulp and paper (− 21.1%) and primary metals (− 17.7%) industries were affected by the sharp downturn in worldwide demand.
The gradual revival in global economic growth, particularly US demand for foreign manufactured goods and natural resources, is expected to push Québec exports up 4.0% in 2010 and 4.5% in 2011.
CHART B.12 Total Québec exports
CHART B.13 Québec’s international exports of selected goods in 2009
(percentage change in real terms) (percentage change in real terms)
-14
-12
-10
-8
-6
-4
-2
0
2
4
6
2001 2003 2005 2007 2009 2011
-30 -20 -10 0
Primary products
Chemical products
Transportation equipment
Primary metals
Pulp and paper
Machinery and equipment
Building material
All goods
Sources: Institut de la statistique du Québec and ministère des Finances du Québec.
Source: Institut de la statistique du Québec, on a custom’s basis.
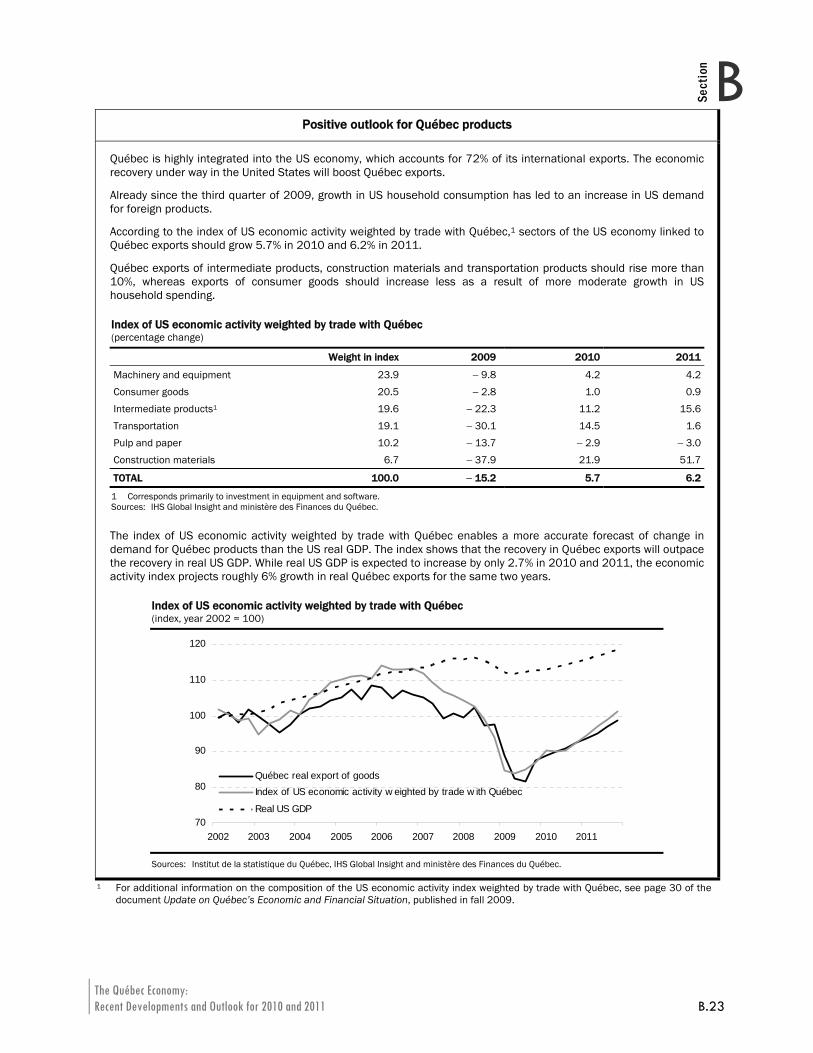
The Québec Economy: Recent Developments and Outlook for 2010 and 2011 B.23
BSection
Positive outlook for Québec products
Québec is highly integrated into the US economy, which accounts for 72% of its international exports. The economic recovery under way in the United States will boost Québec exports.
Already since the third quarter of 2009, growth in US household consumption has led to an increase in US demand for foreign products.
According to the index of US economic activity weighted by trade with Québec,1 sectors of the US economy linked to Québec exports should grow 5.7% in 2010 and 6.2% in 2011.
Québec exports of intermediate products, construction materials and transportation products should rise more than 10%, whereas exports of consumer goods should increase less as a result of more moderate growth in US household spending.
Index of US economic activity weighted by trade with Québec (percentage change)
Weight in index 2009 2010 2011
Machinery and equipment 23.9 − 9.8 4.2 4.2Consumer goods 20.5 − 2.8 1.0 0.9Intermediate products1 19.6 − 22.3 11.2 15.6
Transportation 19.1 − 30.1 14.5 1.6Pulp and paper 10.2 − 13.7 − 2.9 − 3.0Construction materials 6.7 − 37.9 21.9 51.7
TOTAL 100.0 − 15.2 5.7 6.2
1 Corresponds primarily to investment in equipment and software. Sources: IHS Global Insight and ministère des Finances du Québec.
The index of US economic activity weighted by trade with Québec enables a more accurate forecast of change in demand for Québec products than the US real GDP. The index shows that the recovery in Québec exports will outpace the recovery in real US GDP. While real US GDP is expected to increase by only 2.7% in 2010 and 2011, the economic activity index projects roughly 6% growth in real Québec exports for the same two years.
Index of US economic activity weighted by trade with Québec (index, year 2002 = 100)
70
80
90
100
110
120
2002 2003 2004 2005 2006 2007 2008 2009 2010 2011
Québec real export of goodsIndex of US economic activity w eighted by trade w ith Québec
Real US GDP
Sources: Institut de la statistique du Québec, IHS Global Insight and ministère des Finances du Québec. 1 For additional information on the composition of the US economic activity index weighted by trade with Québec, see page 30 of the
document Update on Québec’s Economic and Financial Situation, published in fall 2009.
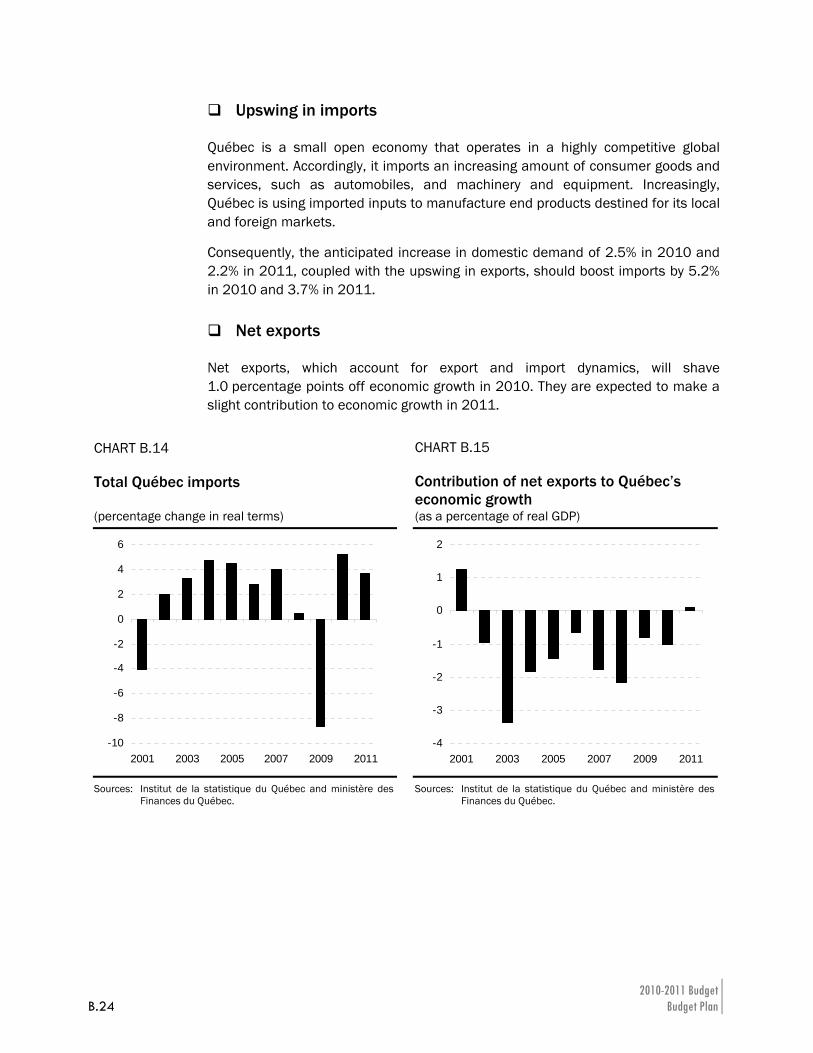
2010-2011 Budget B.24 Budget Plan
Upswing in imports
Québec is a small open economy that operates in a highly competitive global environment. Accordingly, it imports an increasing amount of consumer goods and services, such as automobiles, and machinery and equipment. Increasingly, Québec is using imported inputs to manufacture end products destined for its local and foreign markets.
Consequently, the anticipated increase in domestic demand of 2.5% in 2010 and 2.2% in 2011, coupled with the upswing in exports, should boost imports by 5.2% in 2010 and 3.7% in 2011.
Net exports
Net exports, which account for export and import dynamics, will shave 1.0 percentage points off economic growth in 2010. They are expected to make a slight contribution to economic growth in 2011.
CHART B.14 Total Québec imports
CHART B.15 Contribution of net exports to Québec’s economic growth
(percentage change in real terms) (as a percentage of real GDP)
-10
-8
-6
-4
-2
0
2
4
6
2001 2003 2005 2007 2009 2011
-4
-3
-2
-1
0
1
2
2001 2003 2005 2007 2009 2011
Sources: Institut de la statistique du Québec and ministère des Finances du Québec.
Sources: Institut de la statistique du Québec and ministère des Finances du Québec.
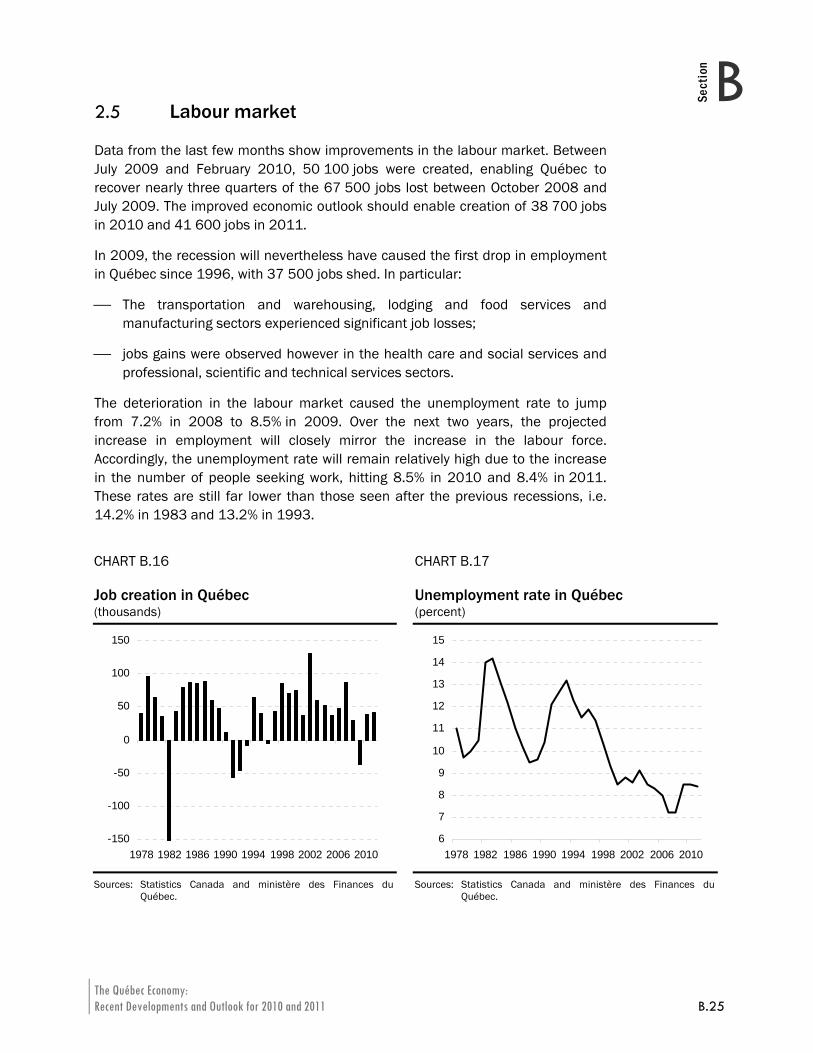
The Québec Economy: Recent Developments and Outlook for 2010 and 2011 B.25
BSection
2.5 Labour market
Data from the last few months show improvements in the labour market. Between July 2009 and February 2010, 50 100 jobs were created, enabling Québec to recover nearly three quarters of the 67 500 jobs lost between October 2008 and July 2009. The improved economic outlook should enable creation of 38 700 jobs in 2010 and 41 600 jobs in 2011.
In 2009, the recession will nevertheless have caused the first drop in employment in Québec since 1996, with 37 500 jobs shed. In particular:
⎯ The transportation and warehousing, lodging and food services and manufacturing sectors experienced significant job losses;
⎯ jobs gains were observed however in the health care and social services and professional, scientific and technical services sectors.
The deterioration in the labour market caused the unemployment rate to jump from 7.2% in 2008 to 8.5% in 2009. Over the next two years, the projected increase in employment will closely mirror the increase in the labour force. Accordingly, the unemployment rate will remain relatively high due to the increase in the number of people seeking work, hitting 8.5% in 2010 and 8.4% in 2011. These rates are still far lower than those seen after the previous recessions, i.e. 14.2% in 1983 and 13.2% in 1993.
CHART B.16 Job creation in Québec
CHART B.17 Unemployment rate in Québec
(thousands) (percent)
-150
-100
-50
0
50
100
150
1978 1982 1986 1990 1994 1998 2002 2006 2010
6
7
8
9
10
11
12
13
14
15
1978 1982 1986 1990 1994 1998 2002 2006 2010
Sources: Statistics Canada and ministère des Finances du Québec.
Sources: Statistics Canada and ministère des Finances du Québec.
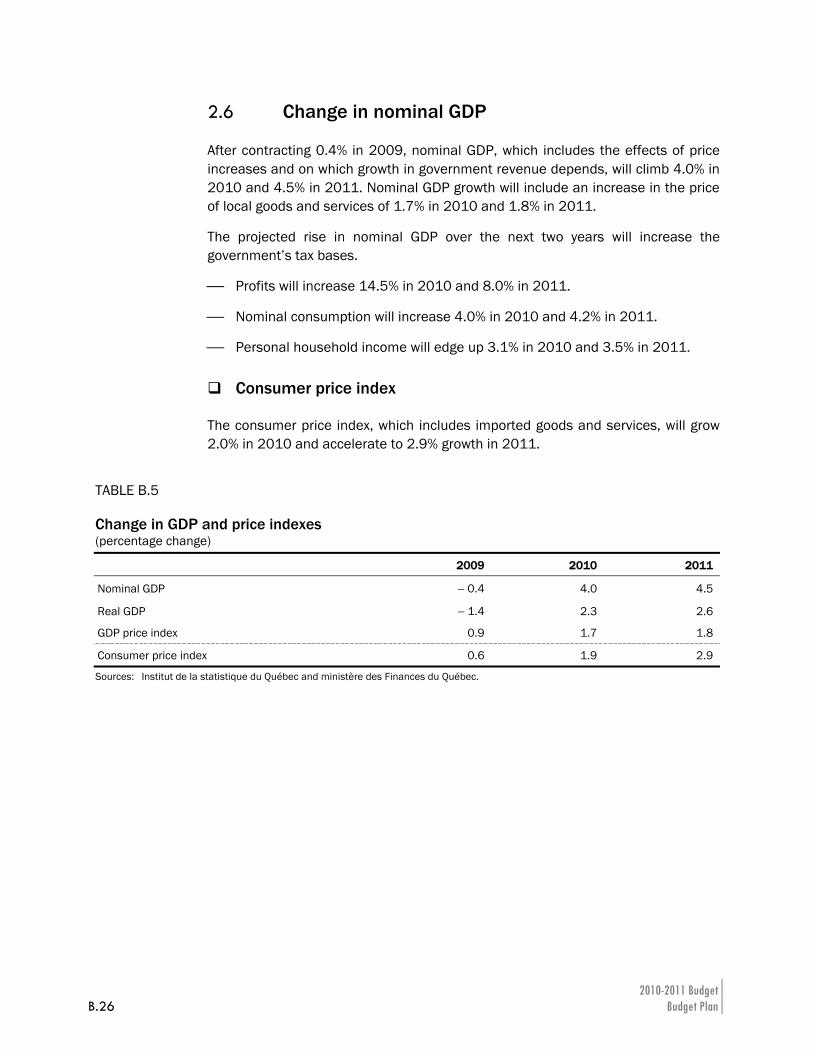
2010-2011 Budget B.26 Budget Plan
2.6 Change in nominal GDP
After contracting 0.4% in 2009, nominal GDP, which includes the effects of price increases and on which growth in government revenue depends, will climb 4.0% in 2010 and 4.5% in 2011. Nominal GDP growth will include an increase in the price of local goods and services of 1.7% in 2010 and 1.8% in 2011.
The projected rise in nominal GDP over the next two years will increase the government’s tax bases.
⎯ Profits will increase 14.5% in 2010 and 8.0% in 2011.
⎯ Nominal consumption will increase 4.0% in 2010 and 4.2% in 2011.
⎯ Personal household income will edge up 3.1% in 2010 and 3.5% in 2011.
Consumer price index
The consumer price index, which includes imported goods and services, will grow 2.0% in 2010 and accelerate to 2.9% growth in 2011.
TABLE B.5 Change in GDP and price indexes (percentage change)
2009 2010 2011
Nominal GDP − 0.4 4.0 4.5
Real GDP − 1.4 2.3 2.6
GDP price index 0.9 1.7 1.8
Consumer price index 0.6 1.9 2.9
Sources: Institut de la statistique du Québec and ministère des Finances du Québec.
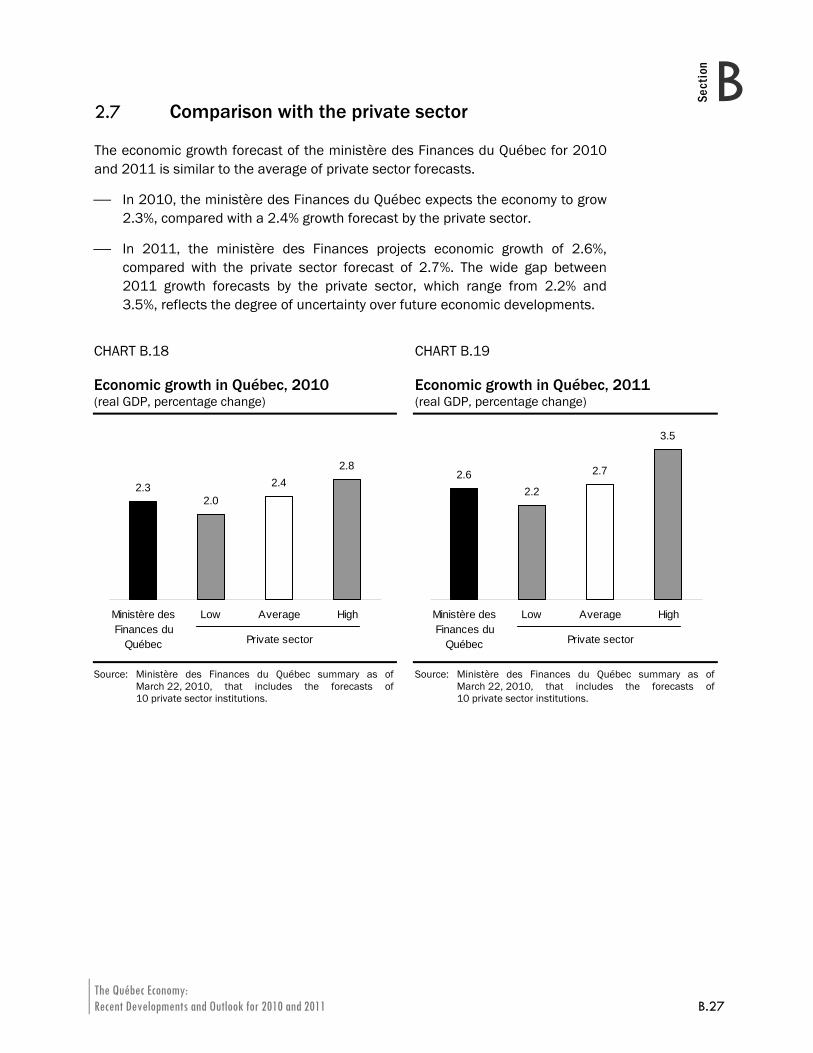
The Québec Economy: Recent Developments and Outlook for 2010 and 2011 B.27
BSection
2.7 Comparison with the private sector
The economic growth forecast of the ministère des Finances du Québec for 2010 and 2011 is similar to the average of private sector forecasts.
⎯ In 2010, the ministère des Finances du Québec expects the economy to grow 2.3%, compared with a 2.4% growth forecast by the private sector.
⎯ In 2011, the ministère des Finances projects economic growth of 2.6%, compared with the private sector forecast of 2.7%. The wide gap between 2011 growth forecasts by the private sector, which range from 2.2% and 3.5%, reflects the degree of uncertainty over future economic developments.
CHART B.18 Economic growth in Québec, 2010
CHART B.19 Economic growth in Québec, 2011
(real GDP, percentage change) (real GDP, percentage change)
2.32.0
2.42.8
Ministère desFinances du
Québec
Low Average High
Private sector
2.62.2
2.7
3.5
Ministère desFinances du
Québec
Low Average High
Private sector
Source: Ministère des Finances du Québec summary as of March 22, 2010, that includes the forecasts of 10 private sector institutions.
Source: Ministère des Finances du Québec summary as of March 22, 2010, that includes the forecasts of 10 private sector institutions.
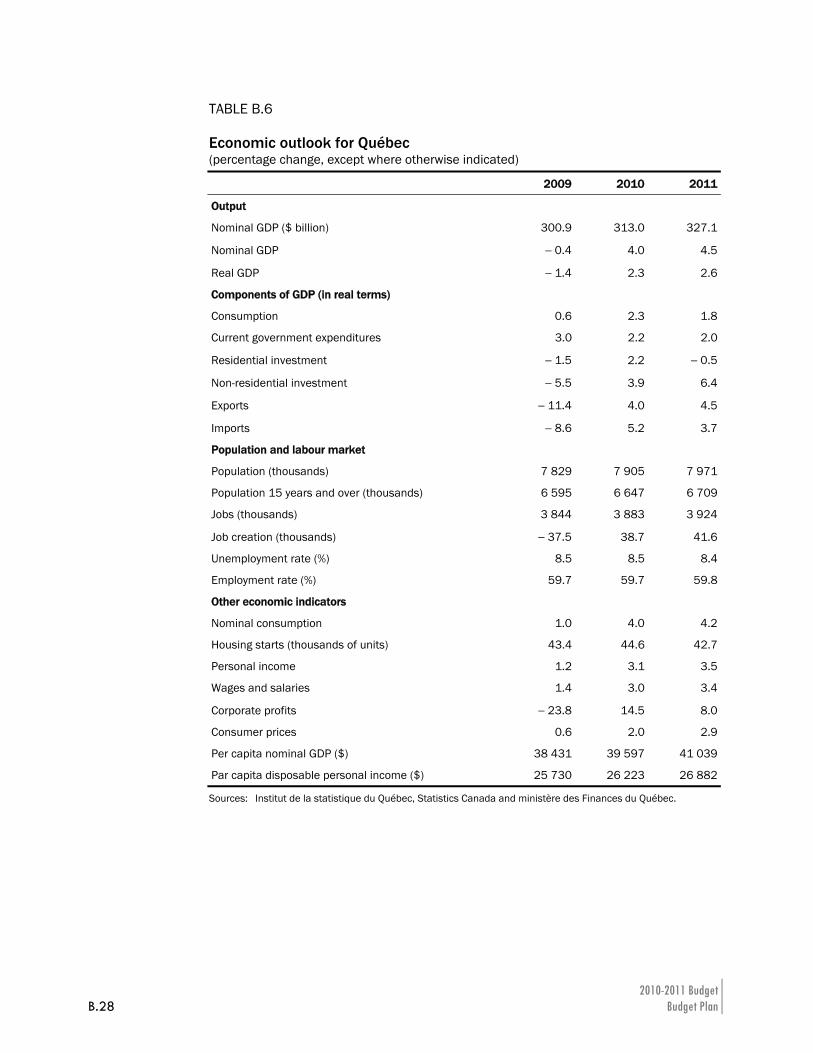
2010-2011 Budget B.28 Budget Plan
TABLE B.6 Economic outlook for Québec (percentage change, except where otherwise indicated)
2009 2010 2011
Output
Nominal GDP ($ billion) 300.9 313.0 327.1
Nominal GDP − 0.4 4.0 4.5
Real GDP − 1.4 2.3 2.6
Components of GDP (in real terms)
Consumption 0.6 2.3 1.8
Current government expenditures 3.0 2.2 2.0
Residential investment − 1.5 2.2 − 0.5
Non-residential investment − 5.5 3.9 6.4
Exports − 11.4 4.0 4.5
Imports − 8.6 5.2 3.7
Population and labour market
Population (thousands) 7 829 7 905 7 971
Population 15 years and over (thousands) 6 595 6 647 6 709
Jobs (thousands) 3 844 3 883 3 924
Job creation (thousands) − 37.5 38.7 41.6
Unemployment rate (%) 8.5 8.5 8.4
Employment rate (%) 59.7 59.7 59.8
Other economic indicators
Nominal consumption 1.0 4.0 4.2
Housing starts (thousands of units) 43.4 44.6 42.7
Personal income 1.2 3.1 3.5
Wages and salaries 1.4 3.0 3.4
Corporate profits − 23.8 14.5 8.0
Consumer prices 0.6 2.0 2.9
Per capita nominal GDP ($) 38 431 39 597 41 039
Par capita disposable personal income ($) 25 730 26 223 26 882
Sources: Institut de la statistique du Québec, Statistics Canada and ministère des Finances du Québec.
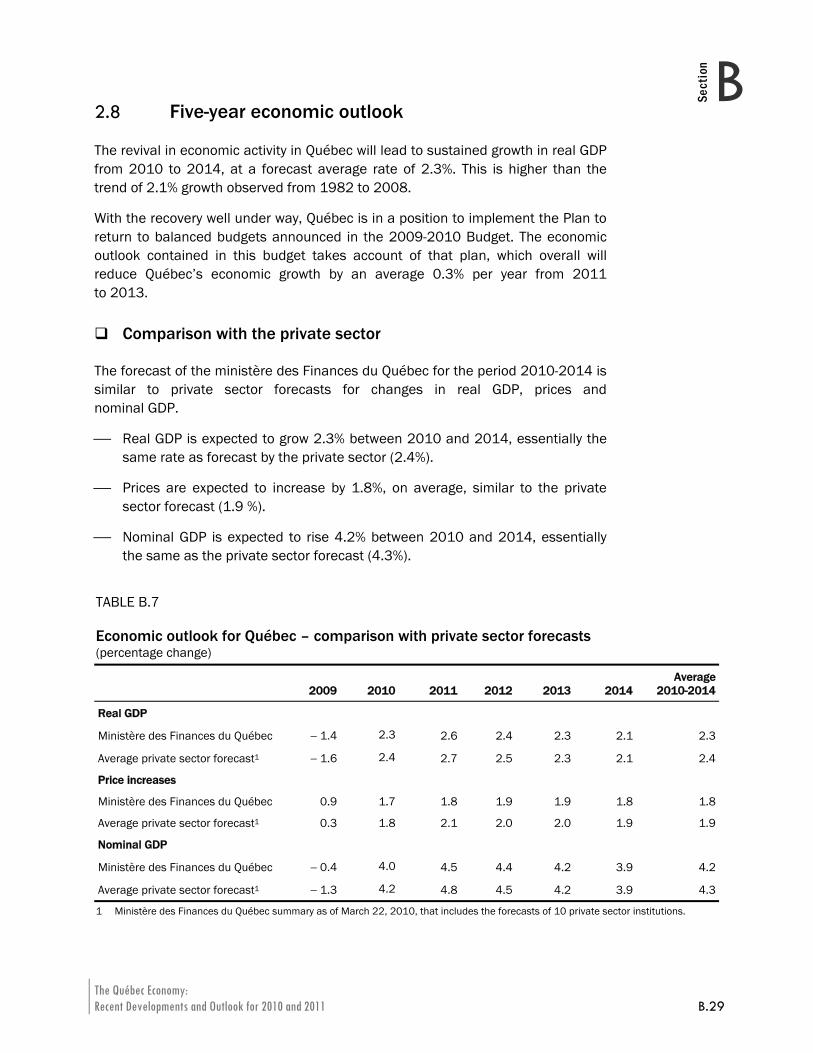
The Québec Economy: Recent Developments and Outlook for 2010 and 2011 B.29
BSection
2.8 Five-year economic outlook
The revival in economic activity in Québec will lead to sustained growth in real GDP from 2010 to 2014, at a forecast average rate of 2.3%. This is higher than the trend of 2.1% growth observed from 1982 to 2008.
With the recovery well under way, Québec is in a position to implement the Plan to return to balanced budgets announced in the 2009-2010 Budget. The economic outlook contained in this budget takes account of that plan, which overall will reduce Québec’s economic growth by an average 0.3% per year from 2011 to 2013.
Comparison with the private sector
The forecast of the ministère des Finances du Québec for the period 2010-2014 is similar to private sector forecasts for changes in real GDP, prices and nominal GDP.
⎯ Real GDP is expected to grow 2.3% between 2010 and 2014, essentially the same rate as forecast by the private sector (2.4%).
⎯ Prices are expected to increase by 1.8%, on average, similar to the private sector forecast (1.9 %).
⎯ Nominal GDP is expected to rise 4.2% between 2010 and 2014, essentially the same as the private sector forecast (4.3%).
TABLE B.7 Economic outlook for Québec – comparison with private sector forecasts (percentage change)
2009 2010 2011 2012 2013 2014 Average
2010-2014
Real GDP
Ministère des Finances du Québec − 1.4 2.3 2.6 2.4 2.3 2.1 2.3
Average private sector forecast1 − 1.6 2.4 2.7 2.5 2.3 2.1 2.4
Price increases
Ministère des Finances du Québec 0.9 1.7 1.8 1.9 1.9 1.8 1.8
Average private sector forecast1 0.3 1.8 2.1 2.0 2.0 1.9 1.9
Nominal GDP
Ministère des Finances du Québec − 0.4 4.0 4.5 4.4 4.2 3.9 4.2
Average private sector forecast1 − 1.3 4.2 4.8 4.5 4.2 3.9 4.3
1 Ministère des Finances du Québec summary as of March 22, 2010, that includes the forecasts of 10 private sector institutions.
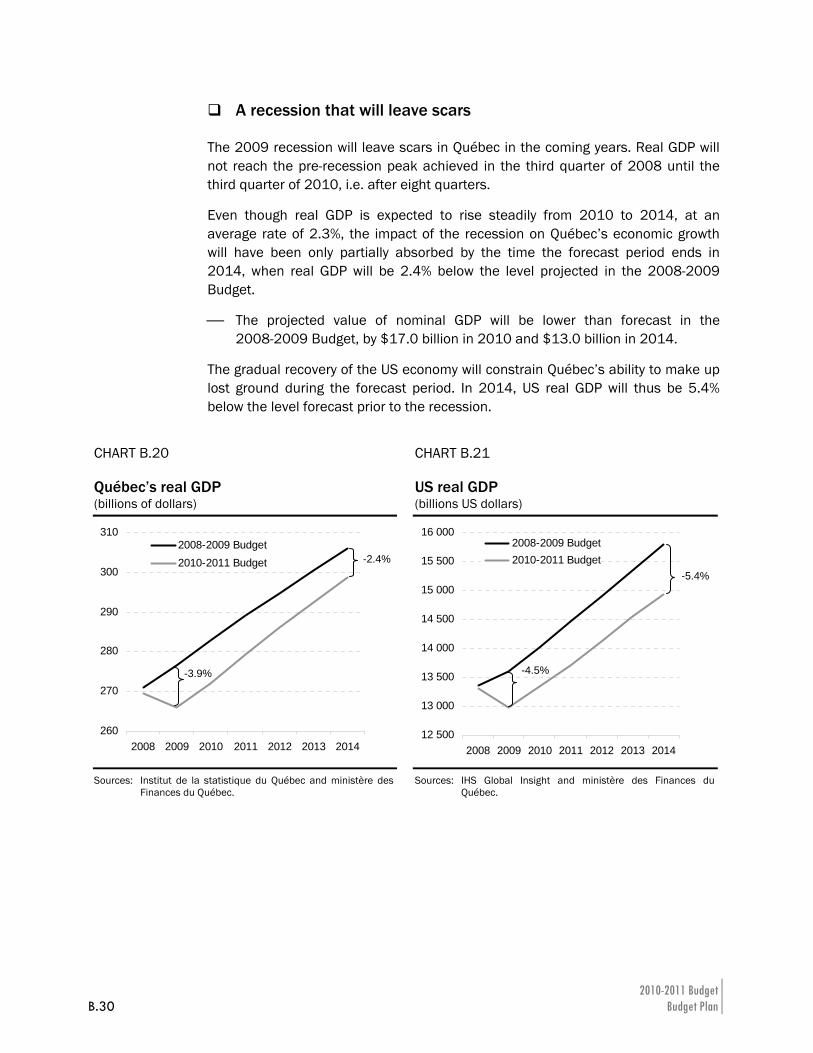
2010-2011 Budget B.30 Budget Plan
A recession that will leave scars
The 2009 recession will leave scars in Québec in the coming years. Real GDP will not reach the pre-recession peak achieved in the third quarter of 2008 until the third quarter of 2010, i.e. after eight quarters.
Even though real GDP is expected to rise steadily from 2010 to 2014, at an average rate of 2.3%, the impact of the recession on Québec’s economic growth will have been only partially absorbed by the time the forecast period ends in 2014, when real GDP will be 2.4% below the level projected in the 2008-2009 Budget.
⎯ The projected value of nominal GDP will be lower than forecast in the 2008-2009 Budget, by $17.0 billion in 2010 and $13.0 billion in 2014.
The gradual recovery of the US economy will constrain Québec’s ability to make up lost ground during the forecast period. In 2014, US real GDP will thus be 5.4% below the level forecast prior to the recession.
CHART B.20 Québec’s real GDP
CHART B.21 US real GDP
(billions of dollars) (billions US dollars)
260
270
280
290
300
310
2008 2009 2010 2011 2012 2013 2014
2008-2009 Budget2010-2011 Budget
12 500
13 000
13 500
14 000
14 500
15 000
15 500
16 000
2008 2009 2010 2011 2012 2013 2014
2008-2009 Budget2010-2011 Budget
Sources: Institut de la statistique du Québec and ministère des Finances du Québec.
Sources: IHS Global Insight and ministère des Finances du Québec.
-2.4%-5.4%
-4.5%-3.9%
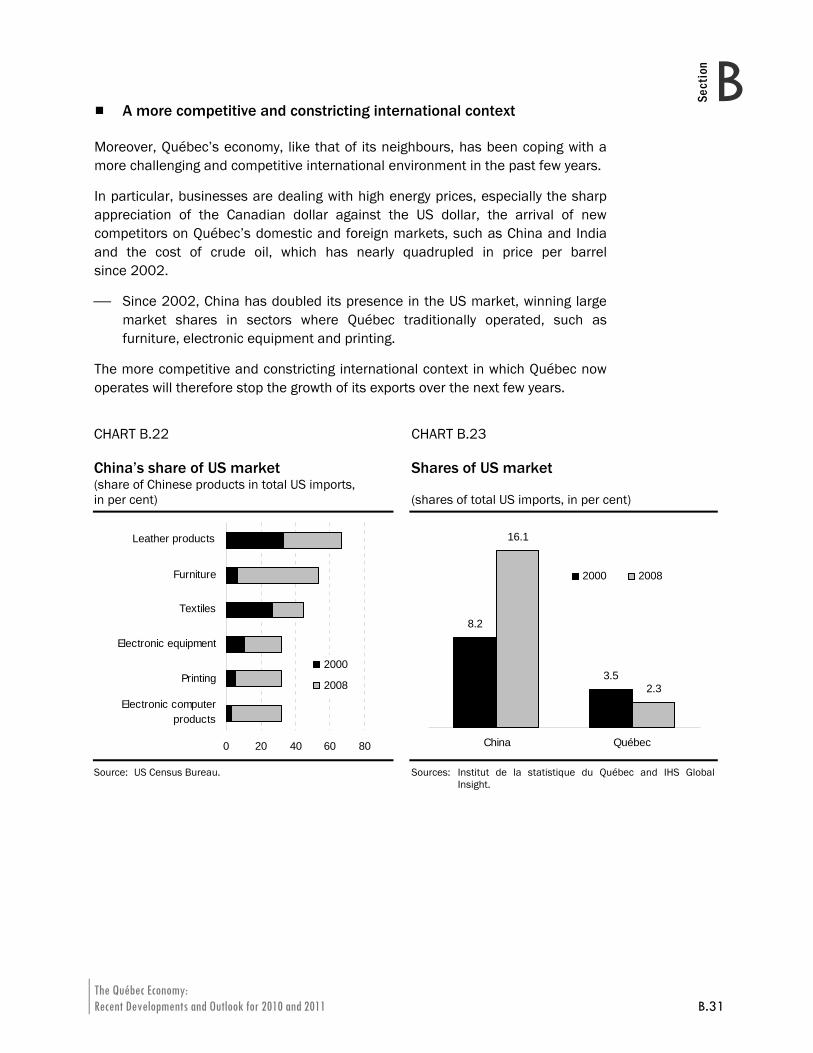
The Québec Economy: Recent Developments and Outlook for 2010 and 2011 B.31
BSection
A more competitive and constricting international context
Moreover, Québec’s economy, like that of its neighbours, has been coping with a more challenging and competitive international environment in the past few years.
In particular, businesses are dealing with high energy prices, especially the sharp appreciation of the Canadian dollar against the US dollar, the arrival of new competitors on Québec’s domestic and foreign markets, such as China and India and the cost of crude oil, which has nearly quadrupled in price per barrel since 2002.
⎯ Since 2002, China has doubled its presence in the US market, winning large market shares in sectors where Québec traditionally operated, such as furniture, electronic equipment and printing.
The more competitive and constricting international context in which Québec now operates will therefore stop the growth of its exports over the next few years.
CHART B.22 China’s share of US market
CHART B.23 Shares of US market
(share of Chinese products in total US imports, in per cent) (shares of total US imports, in per cent)
0 20 40 60 80
2000
2008
Leather products
Furniture
Textiles
Electronic equipment
Printing
Electronic computerproducts
8.2
3.5
16.1
2.3
China Québec
2000 2008
Source: US Census Bureau.
Sources: Institut de la statistique du Québec and IHS Global Insight.

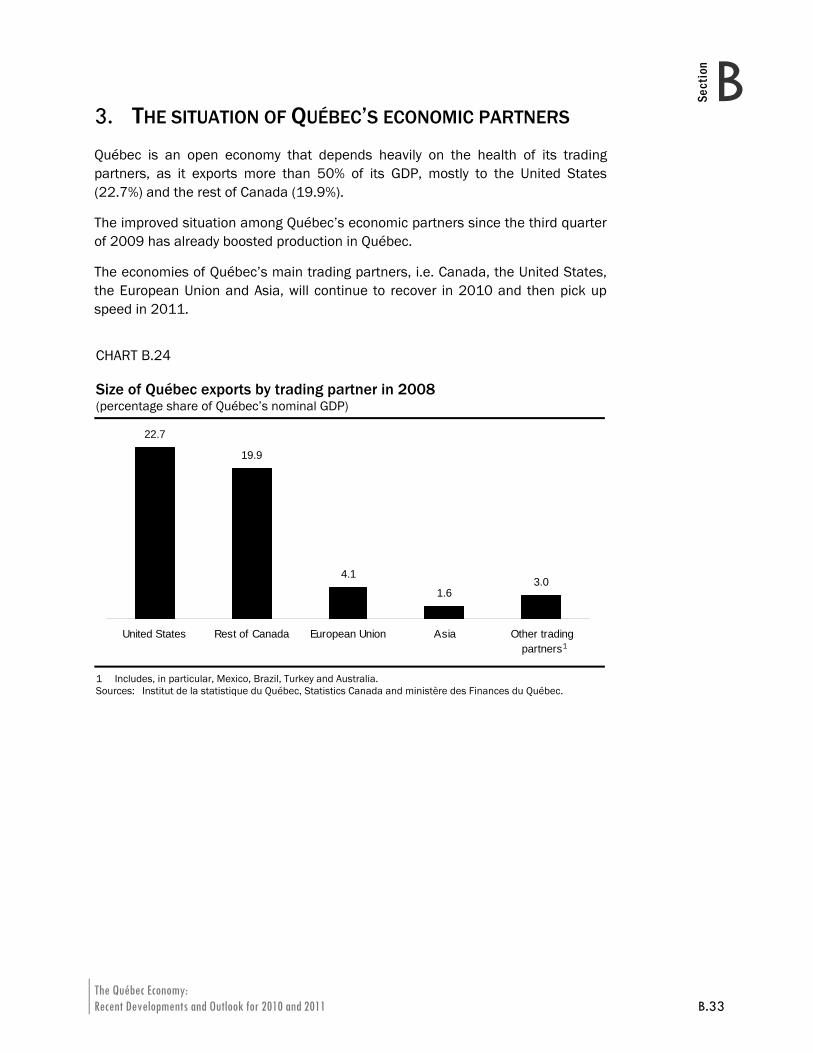
The Québec Economy: Recent Developments and Outlook for 2010 and 2011 B.33
BSection
3. THE SITUATION OF QUÉBEC’S ECONOMIC PARTNERS Québec is an open economy that depends heavily on the health of its trading partners, as it exports more than 50% of its GDP, mostly to the United States (22.7%) and the rest of Canada (19.9%).
The improved situation among Québec’s economic partners since the third quarter of 2009 has already boosted production in Québec.
The economies of Québec’s main trading partners, i.e. Canada, the United States, the European Union and Asia, will continue to recover in 2010 and then pick up speed in 2011.
CHART B.24 Size of Québec exports by trading partner in 2008 (percentage share of Québec’s nominal GDP)
22.7
19.9
4.1
1.63.0
United States Rest of Canada European Union Asia Other tradingpartners
1 Includes, in particular, Mexico, Brazil, Turkey and Australia. Sources: Institut de la statistique du Québec, Statistics Canada and ministère des Finances du Québec.
1
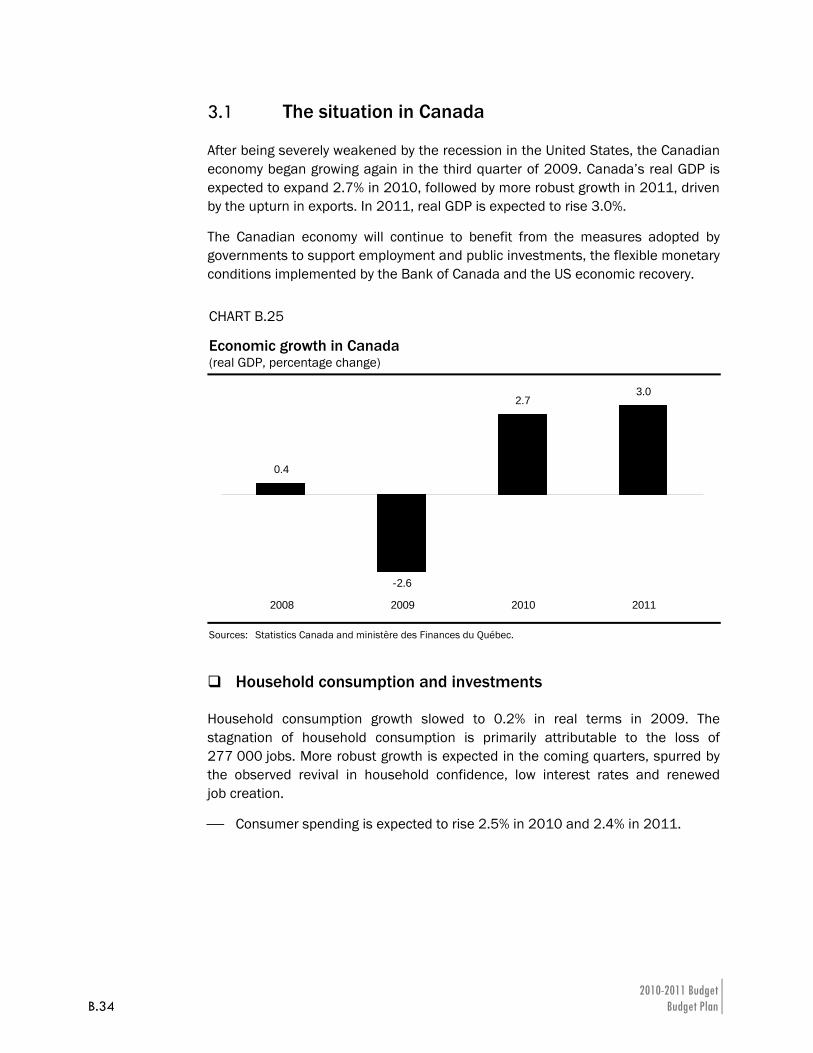
2010-2011 Budget B.34 Budget Plan
3.1 The situation in Canada
After being severely weakened by the recession in the United States, the Canadian economy began growing again in the third quarter of 2009. Canada’s real GDP is expected to expand 2.7% in 2010, followed by more robust growth in 2011, driven by the upturn in exports. In 2011, real GDP is expected to rise 3.0%.
The Canadian economy will continue to benefit from the measures adopted by governments to support employment and public investments, the flexible monetary conditions implemented by the Bank of Canada and the US economic recovery.
CHART B.25 Economic growth in Canada (real GDP, percentage change)
0.4
-2.6
2.73.0
2008 2009 2010 2011
Sources: Statistics Canada and ministère des Finances du Québec.
Household consumption and investments
Household consumption growth slowed to 0.2% in real terms in 2009. The stagnation of household consumption is primarily attributable to the loss of 277 000 jobs. More robust growth is expected in the coming quarters, spurred by the observed revival in household confidence, low interest rates and renewed job creation.
⎯ Consumer spending is expected to rise 2.5% in 2010 and 2.4% in 2011.

The Québec Economy: Recent Developments and Outlook for 2010 and 2011 B.35
BSection
Furthermore, reduced output and weak global demand led businesses to delay some of their investment projects, heading to a 17.4% decline in the volume of non-residential investment in 2009. Investments are expected to increase 4.5% in 2010 and by 5.8% in 2011, driven by a gradual recovery in production, particularly in the automotive and petroleum products sectors.
The recovery in consumption and investment will be accompanied by the creation of nearly 188 000 jobs in 2010 and 252 000 jobs in 2011.
Exports
The US recession severely affected Canadian exports, which declined 14.0% in real terms in 2009. However, they are expected to rise 5.3% in 2010 and 6.3% in 2011.
Stronger demand for commodities, especially oil, should drive an increase in production and exports in the mining and petroleum sectors. The gradual revival of North American demand for light vehicles and the need for car dealers to replenish their inventory should also spur production and exports in the automotive sector. However, the recovery will be slowed by an appreciation of the Canadian dollar.
CHART B.26 Jobs creation and real consumer spending in Canada
CHART B.27 Business non-residential investment in Canada
(percentage change) (percentage change in real terms)
-2
-1
0
1
2
3
4
5
2005 2006 2007 2008 2009 2010 2011
Consumption
Jobs
-20
-15
-10
-5
0
5
10
15
2005 2006 2007 2008 2009 2010 2011
Sources: Statistics Canada and ministère des Finances du Québec.
Sources: Statistics Canada and ministère des Finances du Québec.
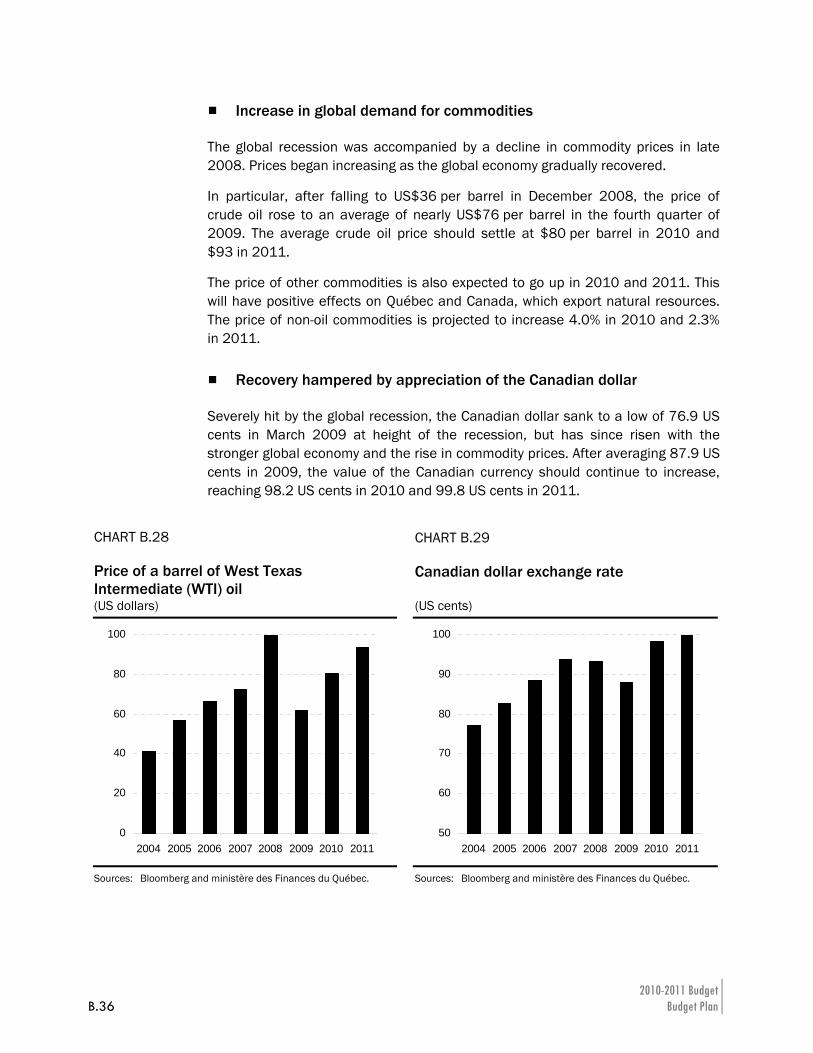
2010-2011 Budget B.36 Budget Plan
Increase in global demand for commodities
The global recession was accompanied by a decline in commodity prices in late 2008. Prices began increasing as the global economy gradually recovered.
In particular, after falling to US$36 per barrel in December 2008, the price of crude oil rose to an average of nearly US$76 per barrel in the fourth quarter of 2009. The average crude oil price should settle at $80 per barrel in 2010 and $93 in 2011.
The price of other commodities is also expected to go up in 2010 and 2011. This will have positive effects on Québec and Canada, which export natural resources. The price of non-oil commodities is projected to increase 4.0% in 2010 and 2.3% in 2011.
Recovery hampered by appreciation of the Canadian dollar
Severely hit by the global recession, the Canadian dollar sank to a low of 76.9 US cents in March 2009 at height of the recession, but has since risen with the stronger global economy and the rise in commodity prices. After averaging 87.9 US cents in 2009, the value of the Canadian currency should continue to increase, reaching 98.2 US cents in 2010 and 99.8 US cents in 2011.
CHART B.28 Price of a barrel of West Texas Intermediate (WTI) oil
CHART B.29 Canadian dollar exchange rate
(US dollars) (US cents)
0
20
40
60
80
100
2004 2005 2006 2007 2008 2009 2010 2011
50
60
70
80
90
100
2004 2005 2006 2007 2008 2009 2010 2011
Sources: Bloomberg and ministère des Finances du Québec.
Sources: Bloomberg and ministère des Finances du Québec.
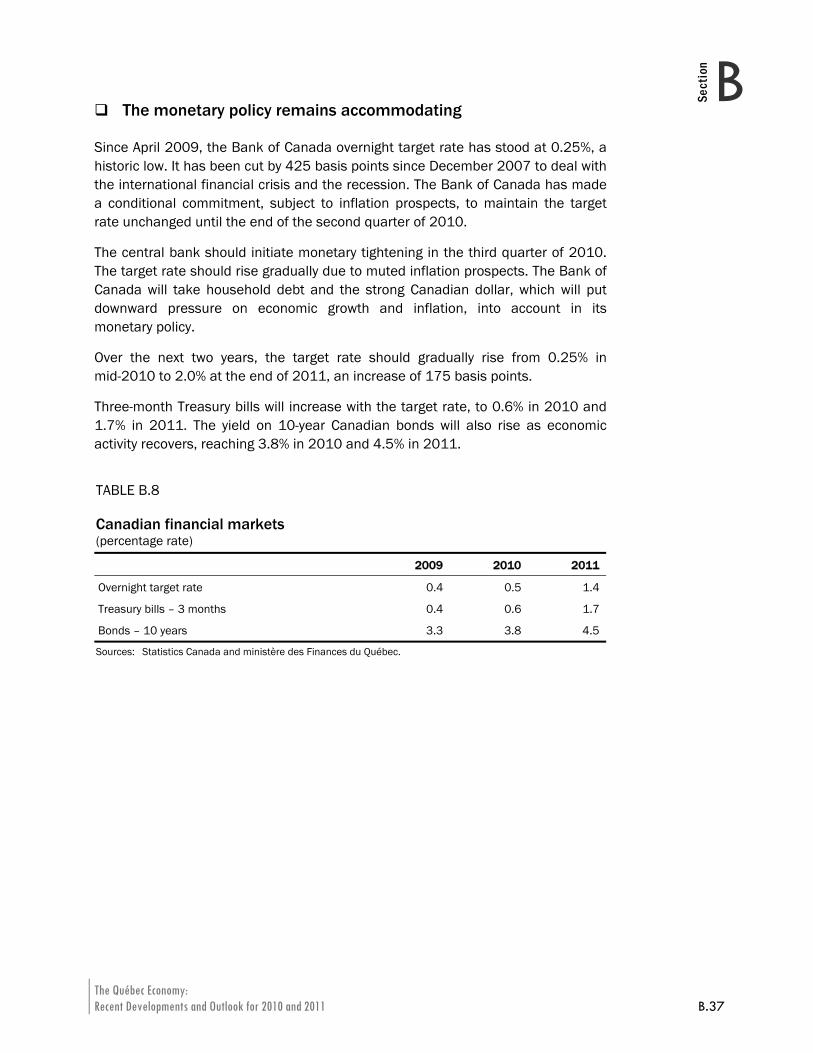
The Québec Economy: Recent Developments and Outlook for 2010 and 2011 B.37
BSection
The monetary policy remains accommodating
Since April 2009, the Bank of Canada overnight target rate has stood at 0.25%, a historic low. It has been cut by 425 basis points since December 2007 to deal with the international financial crisis and the recession. The Bank of Canada has made a conditional commitment, subject to inflation prospects, to maintain the target rate unchanged until the end of the second quarter of 2010.
The central bank should initiate monetary tightening in the third quarter of 2010. The target rate should rise gradually due to muted inflation prospects. The Bank of Canada will take household debt and the strong Canadian dollar, which will put downward pressure on economic growth and inflation, into account in its monetary policy.
Over the next two years, the target rate should gradually rise from 0.25% in mid-2010 to 2.0% at the end of 2011, an increase of 175 basis points.
Three-month Treasury bills will increase with the target rate, to 0.6% in 2010 and 1.7% in 2011. The yield on 10-year Canadian bonds will also rise as economic activity recovers, reaching 3.8% in 2010 and 4.5% in 2011.
TABLE B.8 Canadian financial markets (percentage rate)
2009 2010 2011
Overnight target rate 0.4 0.5 1.4
Treasury bills – 3 months 0.4 0.6 1.7
Bonds – 10 years 3.3 3.8 4.5
Sources: Statistics Canada and ministère des Finances du Québec.
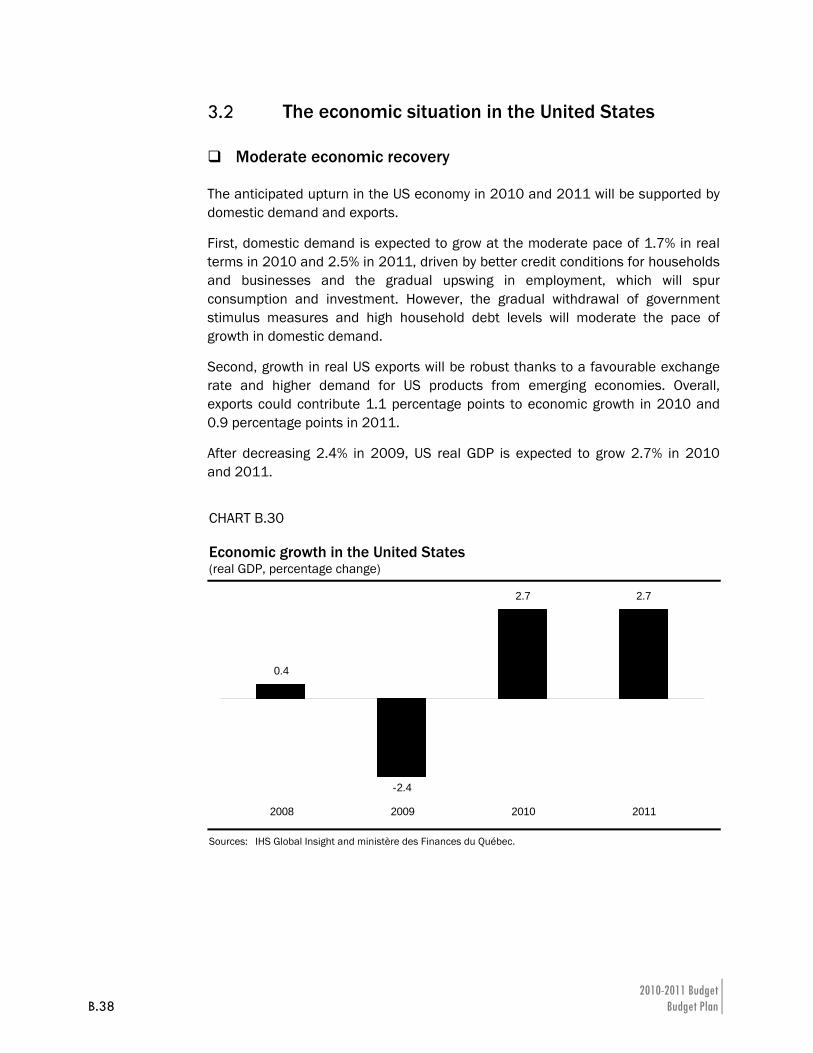
2010-2011 Budget B.38 Budget Plan
3.2 The economic situation in the United States
Moderate economic recovery
The anticipated upturn in the US economy in 2010 and 2011 will be supported by domestic demand and exports.
First, domestic demand is expected to grow at the moderate pace of 1.7% in real terms in 2010 and 2.5% in 2011, driven by better credit conditions for households and businesses and the gradual upswing in employment, which will spur consumption and investment. However, the gradual withdrawal of government stimulus measures and high household debt levels will moderate the pace of growth in domestic demand.
Second, growth in real US exports will be robust thanks to a favourable exchange rate and higher demand for US products from emerging economies. Overall, exports could contribute 1.1 percentage points to economic growth in 2010 and 0.9 percentage points in 2011.
After decreasing 2.4% in 2009, US real GDP is expected to grow 2.7% in 2010 and 2011.
CHART B.30 Economic growth in the United States (real GDP, percentage change)
0.4
-2.4
2.7 2.7
2008 2009 2010 2011
Sources: IHS Global Insight and ministère des Finances du Québec.
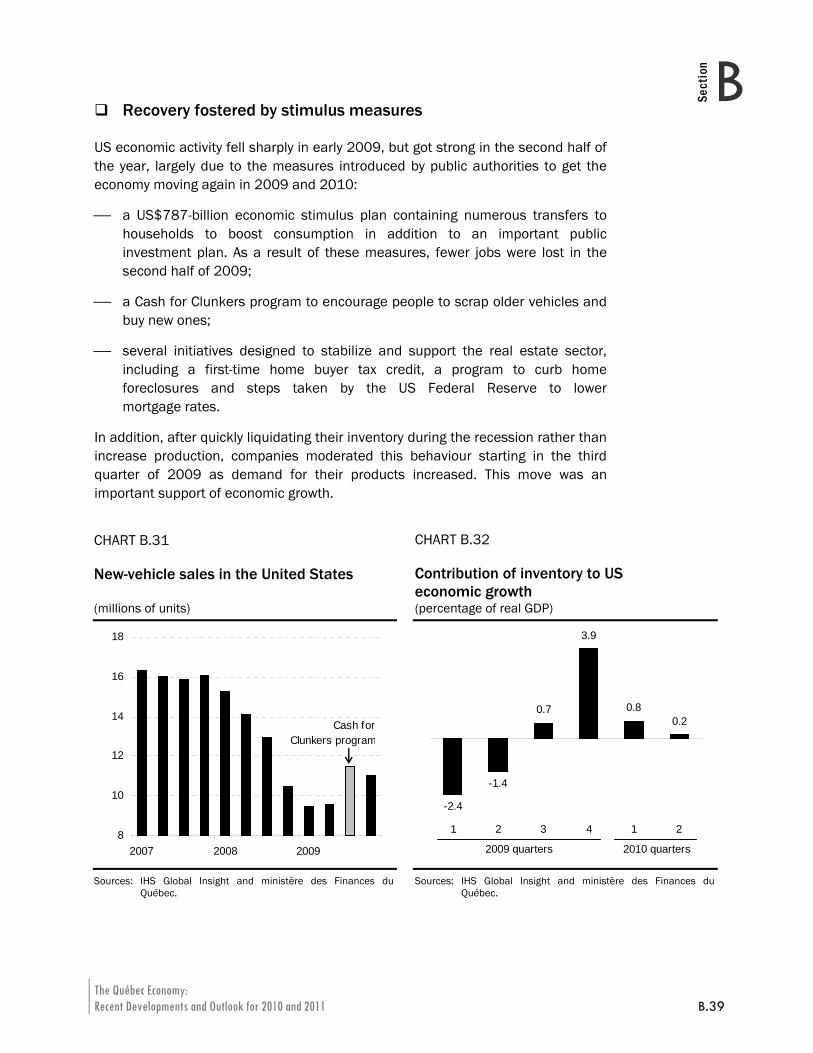
The Québec Economy: Recent Developments and Outlook for 2010 and 2011 B.39
BSection
Recovery fostered by stimulus measures
US economic activity fell sharply in early 2009, but got strong in the second half of the year, largely due to the measures introduced by public authorities to get the economy moving again in 2009 and 2010:
⎯ a US$787-billion economic stimulus plan containing numerous transfers to households to boost consumption in addition to an important public investment plan. As a result of these measures, fewer jobs were lost in the second half of 2009;
⎯ a Cash for Clunkers program to encourage people to scrap older vehicles and buy new ones;
⎯ several initiatives designed to stabilize and support the real estate sector, including a first-time home buyer tax credit, a program to curb home foreclosures and steps taken by the US Federal Reserve to lower mortgage rates.
In addition, after quickly liquidating their inventory during the recession rather than increase production, companies moderated this behaviour starting in the third quarter of 2009 as demand for their products increased. This move was an important support of economic growth.
CHART B.31 New-vehicle sales in the United States
CHART B.32 Contribution of inventory to US economic growth
(millions of units) (percentage of real GDP)
8
10
12
14
16
18
2007 2008 2009
Cash for Clunkers program
-2.4
-1.4
0.7
3.9
0.80.2
1 2 3 4 1 2
2009 quarters 2010 quarters
Sources: IHS Global Insight and ministère des Finances du Québec.
Sources: IHS Global Insight and ministère des Finances du Québec.
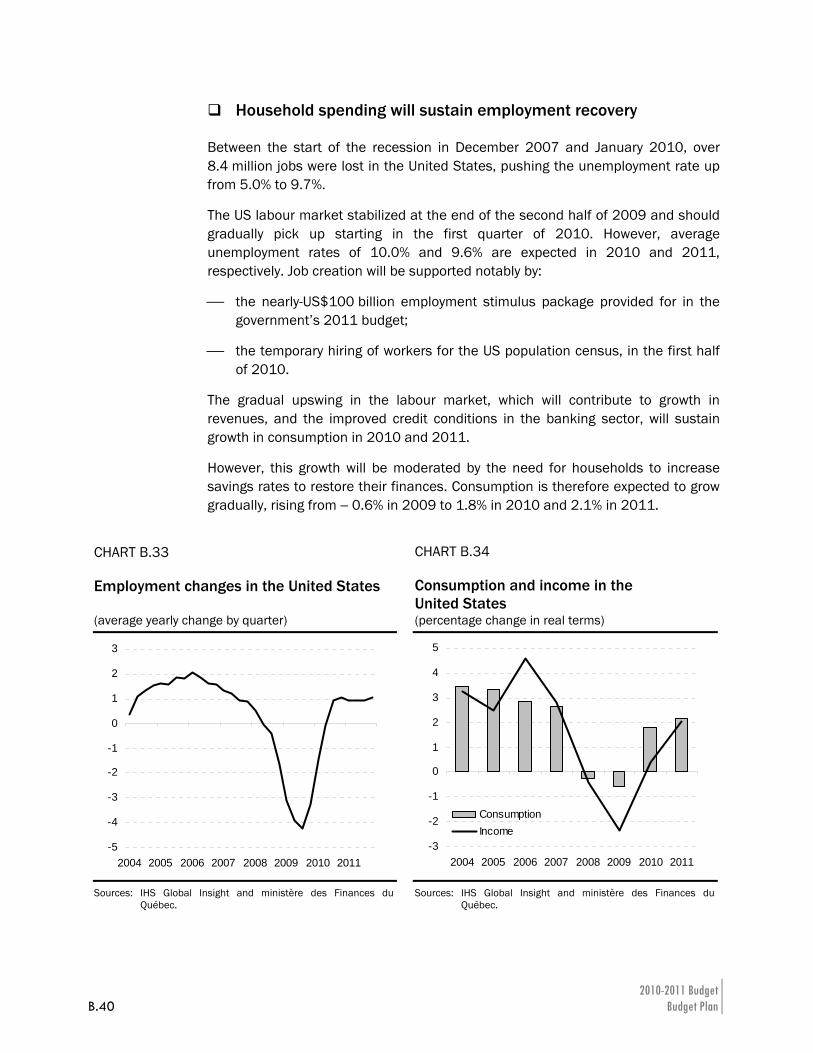
2010-2011 Budget B.40 Budget Plan
Household spending will sustain employment recovery
Between the start of the recession in December 2007 and January 2010, over 8.4 million jobs were lost in the United States, pushing the unemployment rate up from 5.0% to 9.7%.
The US labour market stabilized at the end of the second half of 2009 and should gradually pick up starting in the first quarter of 2010. However, average unemployment rates of 10.0% and 9.6% are expected in 2010 and 2011, respectively. Job creation will be supported notably by:
⎯ the nearly-US$100 billion employment stimulus package provided for in the government’s 2011 budget;
⎯ the temporary hiring of workers for the US population census, in the first half of 2010.
The gradual upswing in the labour market, which will contribute to growth in revenues, and the improved credit conditions in the banking sector, will sustain growth in consumption in 2010 and 2011.
However, this growth will be moderated by the need for households to increase savings rates to restore their finances. Consumption is therefore expected to grow gradually, rising from − 0.6% in 2009 to 1.8% in 2010 and 2.1% in 2011.
CHART B.33 Employment changes in the United States
CHART B.34 Consumption and income in the United States
(average yearly change by quarter) (percentage change in real terms)
-5
-4
-3
-2
-1
0
1
2
3
2004 2005 2006 2007 2008 2009 2010 2011
-3
-2
-1
0
1
2
3
4
5
2004 2005 2006 2007 2008 2009 2010 2011
ConsumptionIncome
Sources: IHS Global Insight and ministère des Finances du Québec.
Sources: IHS Global Insight and ministère des Finances du Québec.
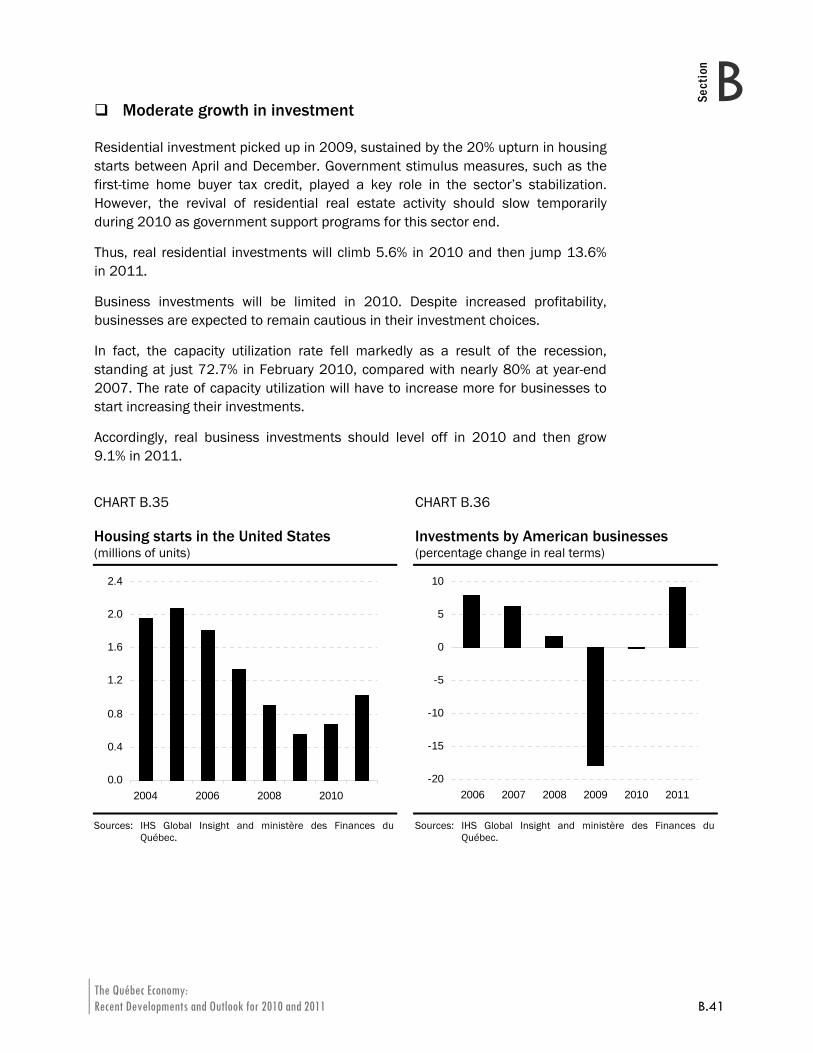
The Québec Economy: Recent Developments and Outlook for 2010 and 2011 B.41
BSection
Moderate growth in investment
Residential investment picked up in 2009, sustained by the 20% upturn in housing starts between April and December. Government stimulus measures, such as the first-time home buyer tax credit, played a key role in the sector’s stabilization. However, the revival of residential real estate activity should slow temporarily during 2010 as government support programs for this sector end.
Thus, real residential investments will climb 5.6% in 2010 and then jump 13.6% in 2011.
Business investments will be limited in 2010. Despite increased profitability, businesses are expected to remain cautious in their investment choices.
In fact, the capacity utilization rate fell markedly as a result of the recession, standing at just 72.7% in February 2010, compared with nearly 80% at year-end 2007. The rate of capacity utilization will have to increase more for businesses to start increasing their investments.
Accordingly, real business investments should level off in 2010 and then grow 9.1% in 2011.
CHART B.35 Housing starts in the United States
CHART B.36 Investments by American businesses
(millions of units) (percentage change in real terms)
0.0
0.4
0.8
1.2
1.6
2.0
2.4
2004 2006 2008 2010
-20
-15
-10
-5
0
5
10
2006 2007 2008 2009 2010 2011
Sources: IHS Global Insight and ministère des Finances du Québec.
Sources: IHS Global Insight and ministère des Finances du Québec.
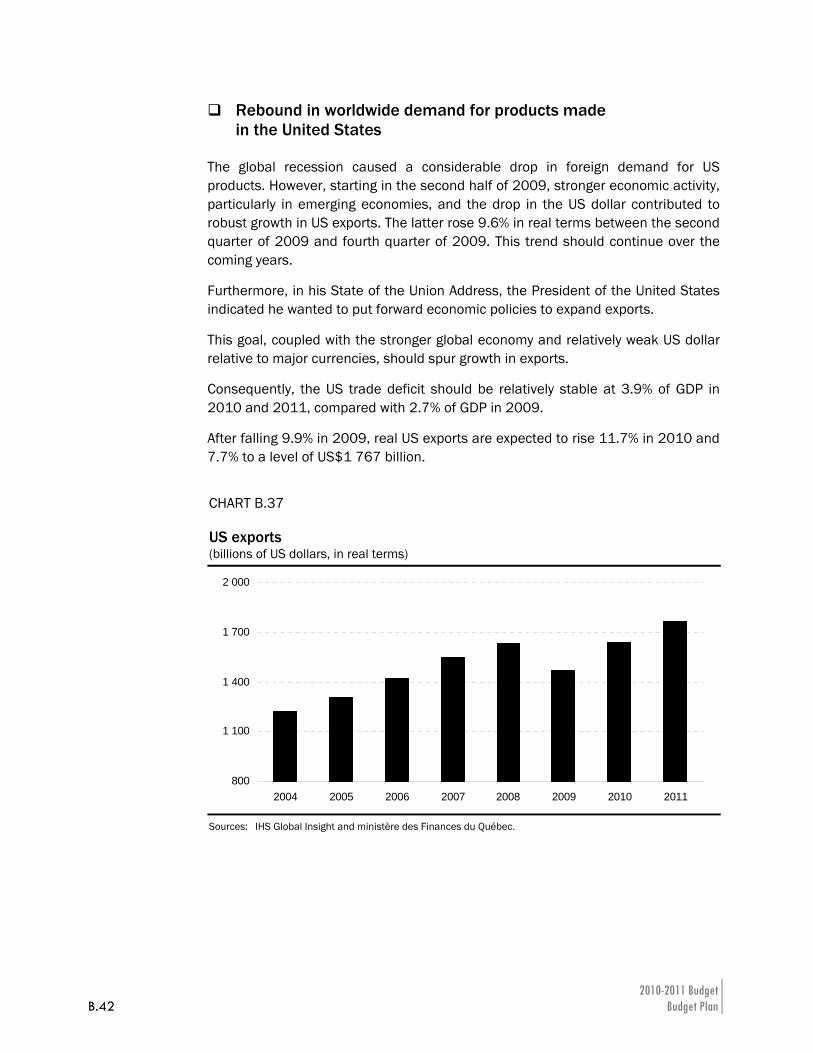
2010-2011 Budget B.42 Budget Plan
Rebound in worldwide demand for products made in the United States
The global recession caused a considerable drop in foreign demand for US products. However, starting in the second half of 2009, stronger economic activity, particularly in emerging economies, and the drop in the US dollar contributed to robust growth in US exports. The latter rose 9.6% in real terms between the second quarter of 2009 and fourth quarter of 2009. This trend should continue over the coming years.
Furthermore, in his State of the Union Address, the President of the United States indicated he wanted to put forward economic policies to expand exports.
This goal, coupled with the stronger global economy and relatively weak US dollar relative to major currencies, should spur growth in exports.
Consequently, the US trade deficit should be relatively stable at 3.9% of GDP in 2010 and 2011, compared with 2.7% of GDP in 2009.
After falling 9.9% in 2009, real US exports are expected to rise 11.7% in 2010 and 7.7% to a level of US$1 767 billion.
CHART B.37 US exports (billions of US dollars, in real terms)
800
1 100
1 400
1 700
2 000
2004 2005 2006 2007 2008 2009 2010 2011
Sources: IHS Global Insight and ministère des Finances du Québec.
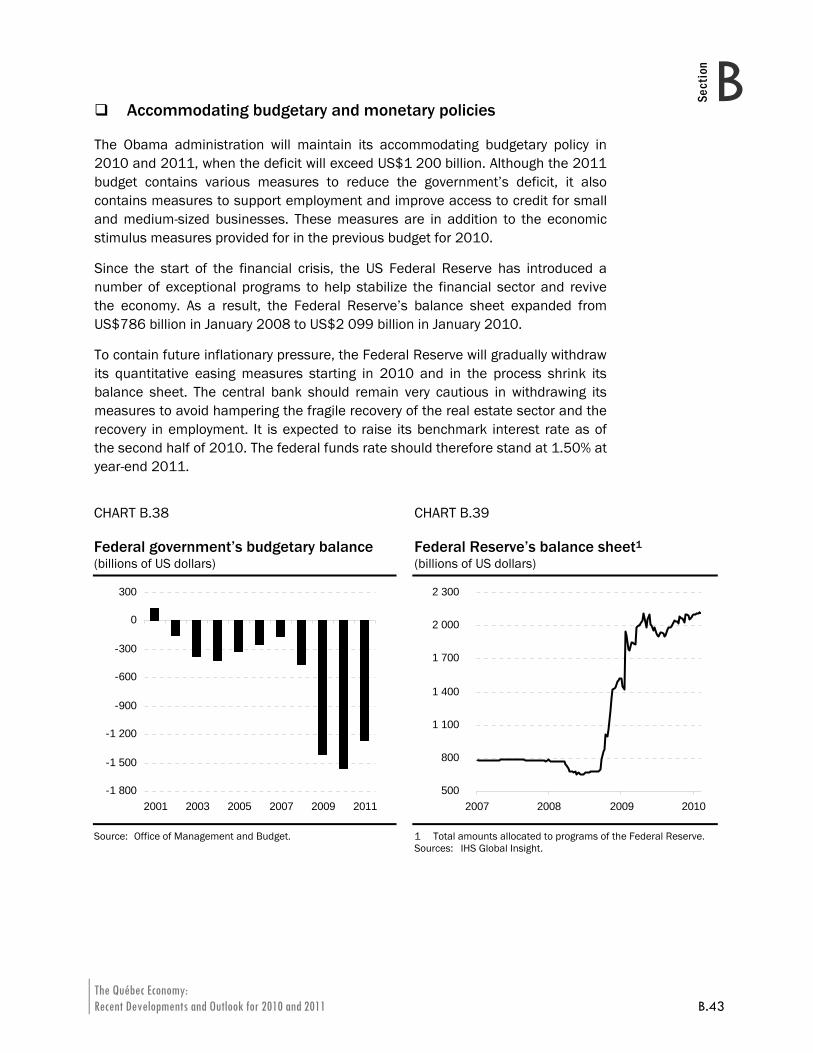
The Québec Economy: Recent Developments and Outlook for 2010 and 2011 B.43
BSection
Accommodating budgetary and monetary policies
The Obama administration will maintain its accommodating budgetary policy in 2010 and 2011, when the deficit will exceed US$1 200 billion. Although the 2011 budget contains various measures to reduce the government’s deficit, it also contains measures to support employment and improve access to credit for small and medium-sized businesses. These measures are in addition to the economic stimulus measures provided for in the previous budget for 2010.
Since the start of the financial crisis, the US Federal Reserve has introduced a number of exceptional programs to help stabilize the financial sector and revive the economy. As a result, the Federal Reserve’s balance sheet expanded from US$786 billion in January 2008 to US$2 099 billion in January 2010.
To contain future inflationary pressure, the Federal Reserve will gradually withdraw its quantitative easing measures starting in 2010 and in the process shrink its balance sheet. The central bank should remain very cautious in withdrawing its measures to avoid hampering the fragile recovery of the real estate sector and the recovery in employment. It is expected to raise its benchmark interest rate as of the second half of 2010. The federal funds rate should therefore stand at 1.50% at year-end 2011.
CHART B.38 Federal government’s budgetary balance
CHART B.39 Federal Reserve’s balance sheet1
(billions of US dollars) (billions of US dollars)
-1 800
-1 500
-1 200
-900
-600
-300
0
300
2001 2003 2005 2007 2009 2011
500
800
1 100
1 400
1 700
2 000
2 300
2007 2008 2009 2010
Source: Office of Management and Budget.
1 Total amounts allocated to programs of the Federal Reserve. Sources: IHS Global Insight.
2010-2011 Budget B.44 Budget Plan
3.3 The situation overseas
Like North American economies, advanced economies in Europe and Asia were severely hit by the global recession in late 2008 and the first half of 2009. However, economic activity in advanced economies overseas has been recovering, albeit modestly, since the second half of 2009.
As for emerging economies and developing economies, they also experienced a significant slowdown in growth in 2009. However, they appear to be recovering strongly, particularly China.
Euro area
After five quarters of contraction, real GDP in the euro area started growing again in the third quarter of 2009, marking the end of the recession. Among factors contributing to the renewed growth are fiscal stimulus plans, stock adjustments and an acceleration in exports in mid-2009 fuelled by the pick-up in global demand.
However, the anticipated growth in 2010 should be weak due to the temporary impact of stimulus measures and the negative impact of the high debt levels of some euro area countries. The external sector will make a positive contribution to growth in 2010. On the other hand, household consumption will remain weak, being affected by an unemployment rate that will reach nearly 11% in early 2011.
Real GDP in the euro area is expected to rise 0.9% in 2010 and 1.5% the following year.
United Kingdom
After falling 5.0% in 2009, the UK economy is on the road to gradual recovery after posting 0.3% growth in real GDP in the fourth quarter of 2009. The recovery is supported by an improvement in the financial sector and the real estate market, an expansionary monetary policy and stronger international growth.
Supported by the contribution of the external sector, which should benefit from a favourable exchange rate, and public spending, but constrained by a high unemployment rate and a significant household debt level, the UK economy should grow 0.9% in 2010 and 1.7% in 2011.
The Québec Economy: Recent Developments and Outlook for 2010 and 2011 B.45
BSection
Japan
After experiencing a major slowdown in 2008 and early 2009, the Japanese economy emerged from the recession in the second quarter of 2009 and started growing at a faster pace at year-end. The renewed growth is primarily attributable to the positive impact of economic stimulus plans and the rebound in exports.
However, Japan’s economic recovery should be curtailed by modest growth in domestic demand. As well, sustained and lasting growth will be hampered by persistent deflation. Thus, real GDP is expected to grow 1.4% in 2010 and 1.1% in 2011, after contracting 5.2% in 2009.
China
China’s economic growth accelerated in 2009, after being slowed by a decline in exports during the global recession. The country’s strong economic recovery is mainly attributable to robust domestic demand. Chinese investments got a boost from the major economic recovery plan implemented in late 2008 as well as from the swelling of domestic credit.
In order to slow growth in domestic demand, the Chinese authorities have taken steps to tighten monetary policy since the beginning of 2010 and may take additional steps as well. The measures are designed first and foremost to rein in liquidity so as to curtail credit, but also to prevent the economy from overheating. As the global economic recovery gathers steam, foreign trade should gradually become again the main driver of economic activity in China.
After growing 8.7% in 2009, the Chinese economy is expected to expand 9.4% in 2010 and then slow to 8.3% growth in 2011, when the economic stimulus measures end.

The Québec Economy: Recent Developments and Outlook for 2010 and 2011 B.47
BSection
4. ECONOMIC PROJECTIONS FOR QUÉBEC FOR 2010-2025 Québec will face major demographic changes over the next 15 years. An aging and slower-growing population will go hand in hand with a shrinking potential labour pool, i.e. essentially the number of people between the ages of 15 and 64. These changes will have a significant impact on both the labour market and the economy.
⎯ First, the shrinking potential labour pool will put downward pressure on employment.
⎯ Second, population aging will reduce the overall percentage of the population with a job.
However, the impact of these demographic changes will be attenuated, even offset, by economic adjustments brought on by tightening of the labour market and an improvement in current trends.
⎯ A higher level of schooling, greater participation of women in the labour market and more favourable conditions for older workers to continue working or go back to work will continue to spur employment.
⎯ The pressure exerted by the labour market, along with more effective use of workers and technologies, will provide more support for labour productivity.
⎯ The introduction or enhancement of public policies could also boost employment and productivity.
In addition, the more encouraging population trends of late, including the increase in the birth rate and international immigration, could improve population projections.
The impact of anticipated demographic changes according to three scenarios
This section presents three scenarios to illustrate the challenges involved.
The scope of the demographic challenge expected in Québec can be measured by separately estimating the negative impact of future demographic changes on economic growth. The first scenario illustrates the change in real GDP in the context of a shrinking potential labour pool without accounting for other economic factors, such as labour market participation and productivity, which should adjust and at least partially offset the demographic situation.
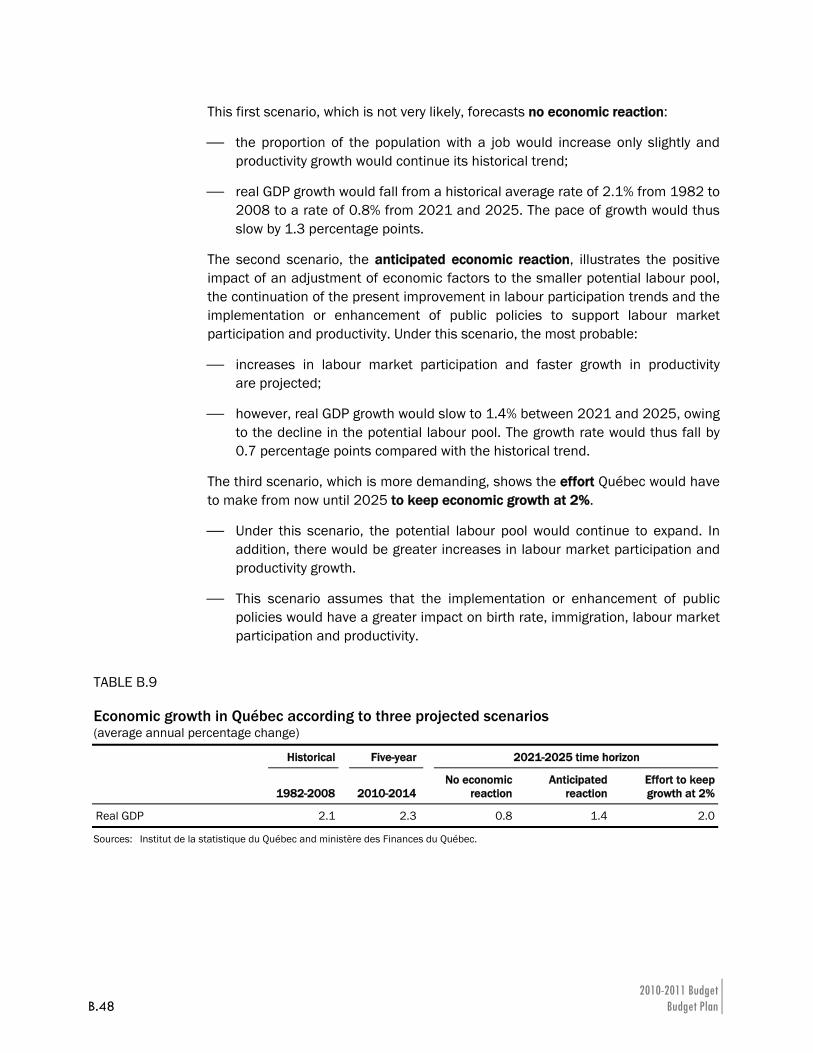
2010-2011 Budget B.48 Budget Plan
This first scenario, which is not very likely, forecasts no economic reaction:
⎯ the proportion of the population with a job would increase only slightly and productivity growth would continue its historical trend;
⎯ real GDP growth would fall from a historical average rate of 2.1% from 1982 to 2008 to a rate of 0.8% from 2021 and 2025. The pace of growth would thus slow by 1.3 percentage points.
The second scenario, the anticipated economic reaction, illustrates the positive impact of an adjustment of economic factors to the smaller potential labour pool, the continuation of the present improvement in labour participation trends and the implementation or enhancement of public policies to support labour market participation and productivity. Under this scenario, the most probable:
⎯ increases in labour market participation and faster growth in productivity are projected;
⎯ however, real GDP growth would slow to 1.4% between 2021 and 2025, owing to the decline in the potential labour pool. The growth rate would thus fall by 0.7 percentage points compared with the historical trend.
The third scenario, which is more demanding, shows the effort Québec would have to make from now until 2025 to keep economic growth at 2%.
⎯ Under this scenario, the potential labour pool would continue to expand. In addition, there would be greater increases in labour market participation and productivity growth.
⎯ This scenario assumes that the implementation or enhancement of public policies would have a greater impact on birth rate, immigration, labour market participation and productivity.
TABLE B.9 Economic growth in Québec according to three projected scenarios (average annual percentage change)
Historical Five-year 2021-2025 time horizon
1982-2008 2010-2014No economic
reactionAnticipated
reaction Effort to keep growth at 2%
Real GDP 2.1 2.3 0.8 1.4 2.0
Sources: Institut de la statistique du Québec and ministère des Finances du Québec.
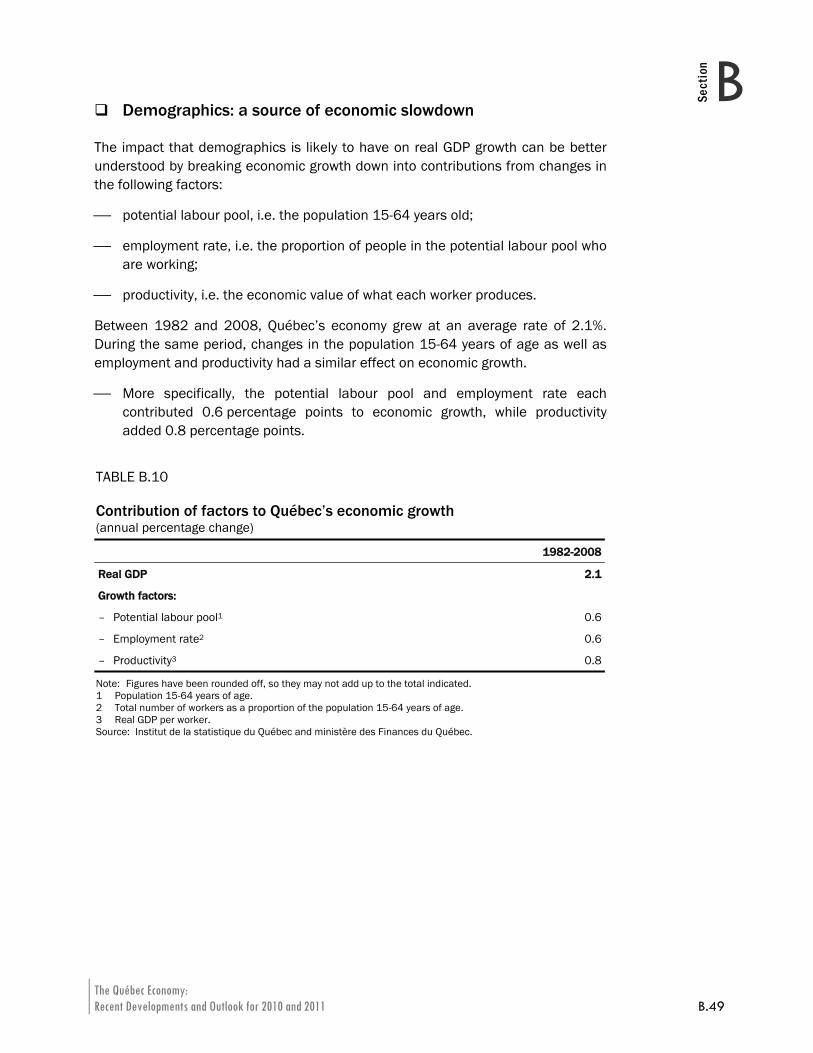
The Québec Economy: Recent Developments and Outlook for 2010 and 2011 B.49
BSection
Demographics: a source of economic slowdown
The impact that demographics is likely to have on real GDP growth can be better understood by breaking economic growth down into contributions from changes in the following factors:
⎯ potential labour pool, i.e. the population 15-64 years old;
⎯ employment rate, i.e. the proportion of people in the potential labour pool who are working;
⎯ productivity, i.e. the economic value of what each worker produces.
Between 1982 and 2008, Québec’s economy grew at an average rate of 2.1%. During the same period, changes in the population 15-64 years of age as well as employment and productivity had a similar effect on economic growth.
⎯ More specifically, the potential labour pool and employment rate each contributed 0.6 percentage points to economic growth, while productivity added 0.8 percentage points.
TABLE B.10 Contribution of factors to Québec’s economic growth (annual percentage change)
1982-2008
Real GDP 2.1
Growth factors:
– Potential labour pool1 0.6
– Employment rate2 0.6
– Productivity3 0.8
Note: Figures have been rounded off, so they may not add up to the total indicated. 1 Population 15-64 years of age. 2 Total number of workers as a proportion of the population 15-64 years of age. 3 Real GDP per worker. Source: Institut de la statistique du Québec and ministère des Finances du Québec.
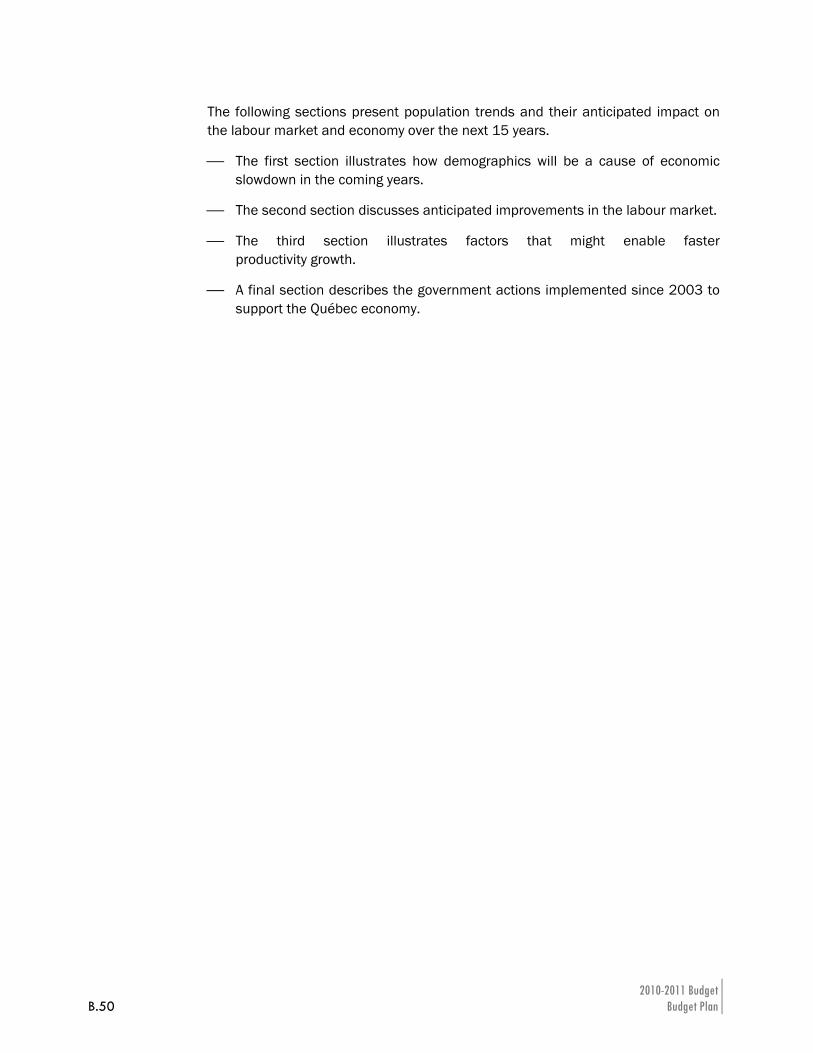
2010-2011 Budget B.50 Budget Plan
The following sections present population trends and their anticipated impact on the labour market and economy over the next 15 years.
⎯ The first section illustrates how demographics will be a cause of economic slowdown in the coming years.
⎯ The second section discusses anticipated improvements in the labour market.
⎯ The third section illustrates factors that might enable faster productivity growth.
⎯ A final section describes the government actions implemented since 2003 to support the Québec economy.
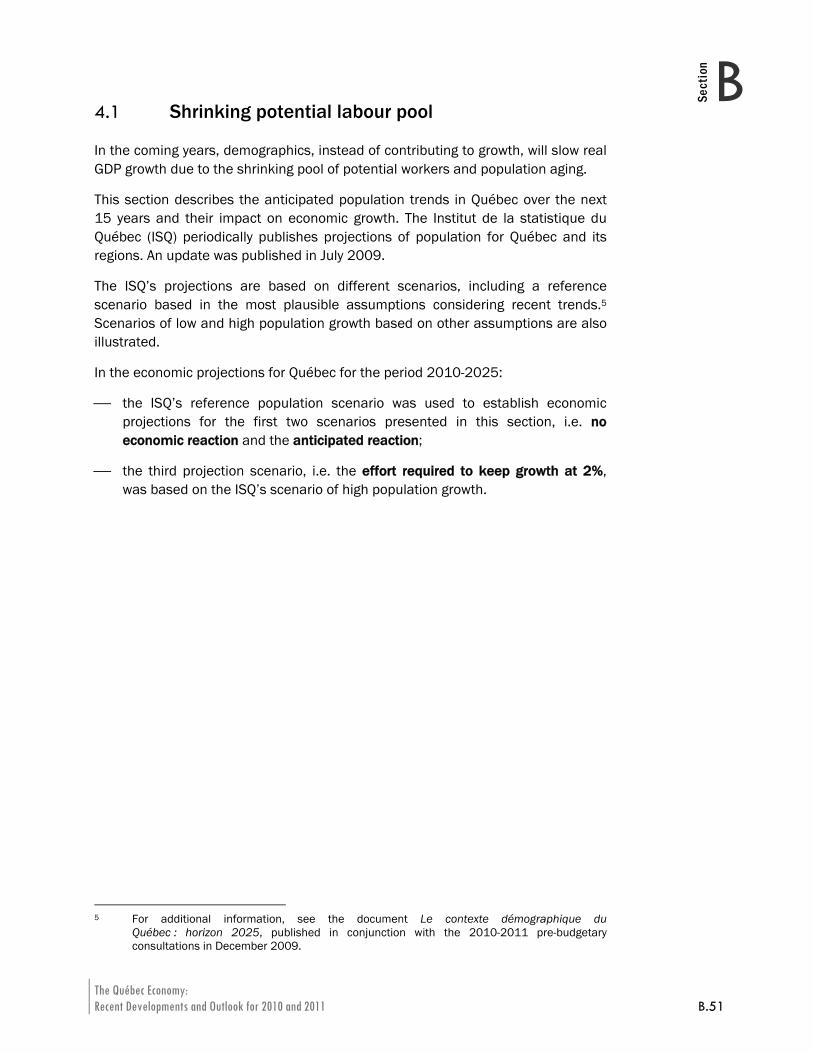
The Québec Economy: Recent Developments and Outlook for 2010 and 2011 B.51
BSection
4.1 Shrinking potential labour pool
In the coming years, demographics, instead of contributing to growth, will slow real GDP growth due to the shrinking pool of potential workers and population aging.
This section describes the anticipated population trends in Québec over the next 15 years and their impact on economic growth. The Institut de la statistique du Québec (ISQ) periodically publishes projections of population for Québec and its regions. An update was published in July 2009.
The ISQ’s projections are based on different scenarios, including a reference scenario based in the most plausible assumptions considering recent trends.5 Scenarios of low and high population growth based on other assumptions are also illustrated.
In the economic projections for Québec for the period 2010-2025:
⎯ the ISQ’s reference population scenario was used to establish economic projections for the first two scenarios presented in this section, i.e. no economic reaction and the anticipated reaction;
⎯ the third projection scenario, i.e. the effort required to keep growth at 2%, was based on the ISQ’s scenario of high population growth.
5 For additional information, see the document Le contexte démographique du
Québec : horizon 2025, published in conjunction with the 2010-2011 pre-budgetary consultations in December 2009.
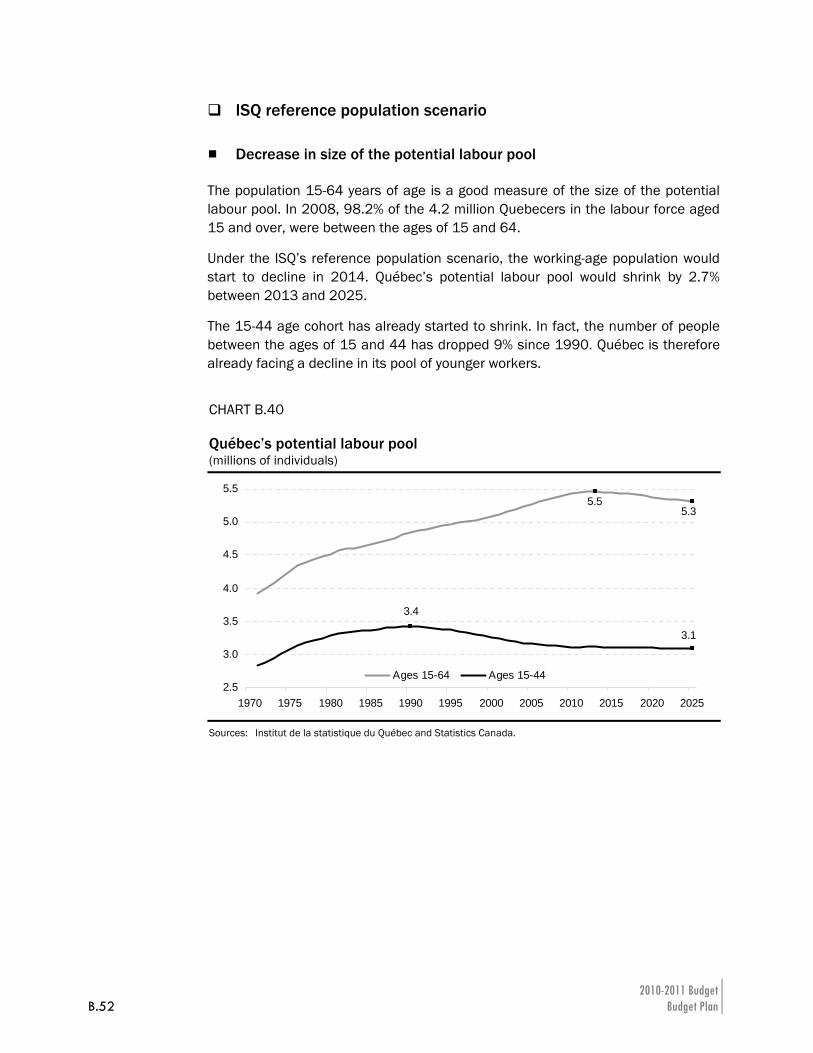
2010-2011 Budget B.52 Budget Plan
ISQ reference population scenario
Decrease in size of the potential labour pool
The population 15-64 years of age is a good measure of the size of the potential labour pool. In 2008, 98.2% of the 4.2 million Quebecers in the labour force aged 15 and over, were between the ages of 15 and 64.
Under the ISQ’s reference population scenario, the working-age population would start to decline in 2014. Québec’s potential labour pool would shrink by 2.7% between 2013 and 2025.
The 15-44 age cohort has already started to shrink. In fact, the number of people between the ages of 15 and 44 has dropped 9% since 1990. Québec is therefore already facing a decline in its pool of younger workers.
CHART B.40 Québec’s potential labour pool (millions of individuals)
2.5
3.0
3.5
4.0
4.5
5.0
5.5
1970 1975 1980 1985 1990 1995 2000 2005 2010 2015 2020 2025
Ages 15-64 Ages 15-44
3.4
3.1
5.55.3
Sources: Institut de la statistique du Québec and Statistics Canada.
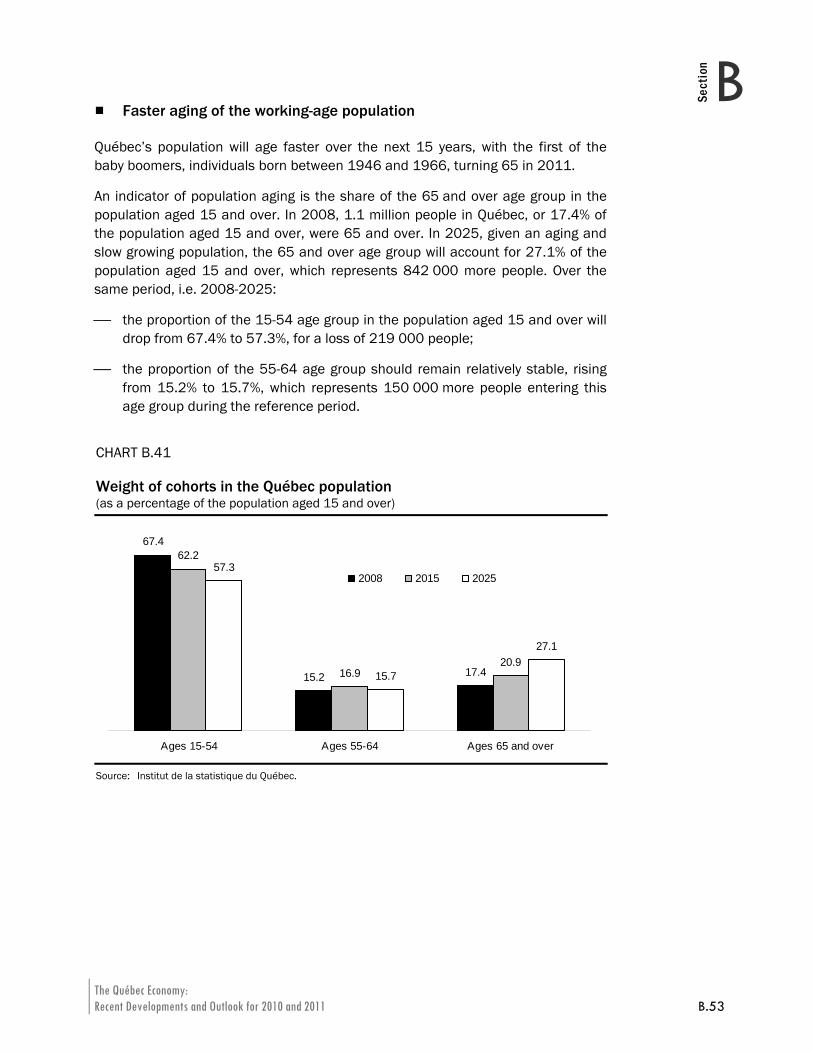
The Québec Economy: Recent Developments and Outlook for 2010 and 2011 B.53
BSection
Faster aging of the working-age population
Québec’s population will age faster over the next 15 years, with the first of the baby boomers, individuals born between 1946 and 1966, turning 65 in 2011.
An indicator of population aging is the share of the 65 and over age group in the population aged 15 and over. In 2008, 1.1 million people in Québec, or 17.4% of the population aged 15 and over, were 65 and over. In 2025, given an aging and slow growing population, the 65 and over age group will account for 27.1% of the population aged 15 and over, which represents 842 000 more people. Over the same period, i.e. 2008-2025:
⎯ the proportion of the 15-54 age group in the population aged 15 and over will drop from 67.4% to 57.3%, for a loss of 219 000 people;
⎯ the proportion of the 55-64 age group should remain relatively stable, rising from 15.2% to 15.7%, which represents 150 000 more people entering this age group during the reference period.
CHART B.41 Weight of cohorts in the Québec population (as a percentage of the population aged 15 and over)
67.4
15.2 17.4
62.2
16.920.9
57.3
15.7
27.1
Ages 15-54 Ages 55-64 Ages 65 and over
2008 2015 2025
Source: Institut de la statistique du Québec.
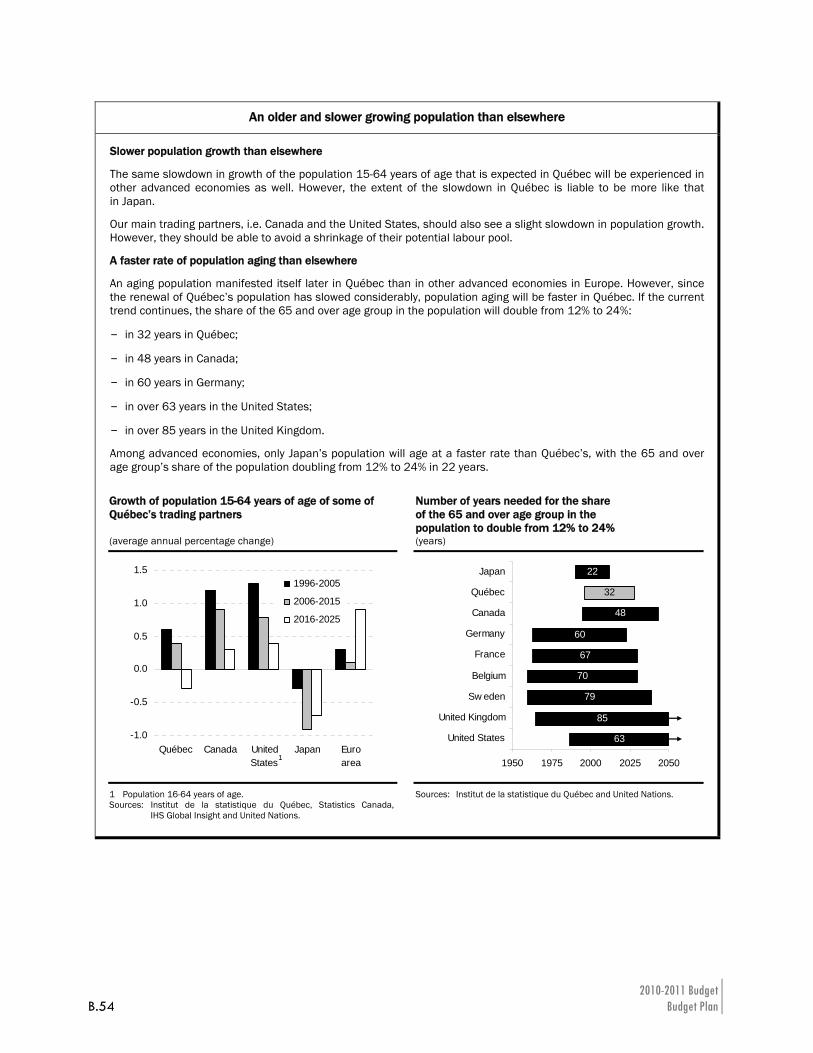
2010-2011 Budget B.54 Budget Plan
An older and slower growing population than elsewhere
Slower population growth than elsewhere
The same slowdown in growth of the population 15-64 years of age that is expected in Québec will be experienced in other advanced economies as well. However, the extent of the slowdown in Québec is liable to be more like that in Japan.
Our main trading partners, i.e. Canada and the United States, should also see a slight slowdown in population growth. However, they should be able to avoid a shrinkage of their potential labour pool.
A faster rate of population aging than elsewhere
An aging population manifested itself later in Québec than in other advanced economies in Europe. However, since the renewal of Québec’s population has slowed considerably, population aging will be faster in Québec. If the current trend continues, the share of the 65 and over age group in the population will double from 12% to 24%:
– in 32 years in Québec;
– in 48 years in Canada;
– in 60 years in Germany;
– in over 63 years in the United States;
– in over 85 years in the United Kingdom.
Among advanced economies, only Japan’s population will age at a faster rate than Québec’s, with the 65 and over age group’s share of the population doubling from 12% to 24% in 22 years. Growth of population 15-64 years of age of some of Québec’s trading partners
Number of years needed for the share of the 65 and over age group in the population to double from 12% to 24%
(average annual percentage change) (years)
-1.0
-0.5
0.0
0.5
1.0
1.5
Québec Canada UnitedStates
Japan Euroarea
1996-2005
2006-2015
2016-2025
1
63
85
79
70
67
60
48
22
32
1950 1975 2000 2025 2050
United States
United Kingdom
Sw eden
Belgium
France
Germany
Canada
Québec
Japan
1 Population 16-64 years of age. Sources: Institut de la statistique du Québec, Statistics Canada,
IHS Global Insight and United Nations.
Sources: Institut de la statistique du Québec and United Nations.
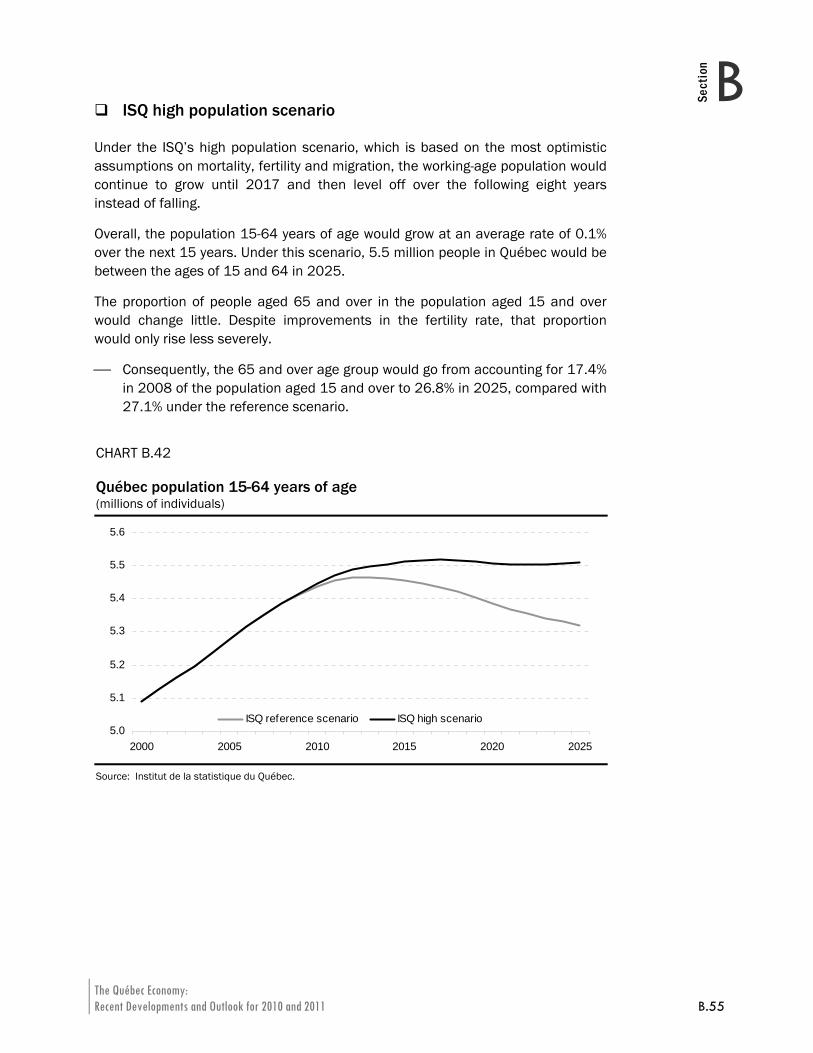
The Québec Economy: Recent Developments and Outlook for 2010 and 2011 B.55
BSection
ISQ high population scenario
Under the ISQ’s high population scenario, which is based on the most optimistic assumptions on mortality, fertility and migration, the working-age population would continue to grow until 2017 and then level off over the following eight years instead of falling.
Overall, the population 15-64 years of age would grow at an average rate of 0.1% over the next 15 years. Under this scenario, 5.5 million people in Québec would be between the ages of 15 and 64 in 2025.
The proportion of people aged 65 and over in the population aged 15 and over would change little. Despite improvements in the fertility rate, that proportion would only rise less severely.
⎯ Consequently, the 65 and over age group would go from accounting for 17.4% in 2008 of the population aged 15 and over to 26.8% in 2025, compared with 27.1% under the reference scenario.
CHART B.42 Québec population 15-64 years of age (millions of individuals)
5.0
5.1
5.2
5.3
5.4
5.5
5.6
2000 2005 2010 2015 2020 2025
ISQ reference scenario ISQ high scenario
Source: Institut de la statistique du Québec.
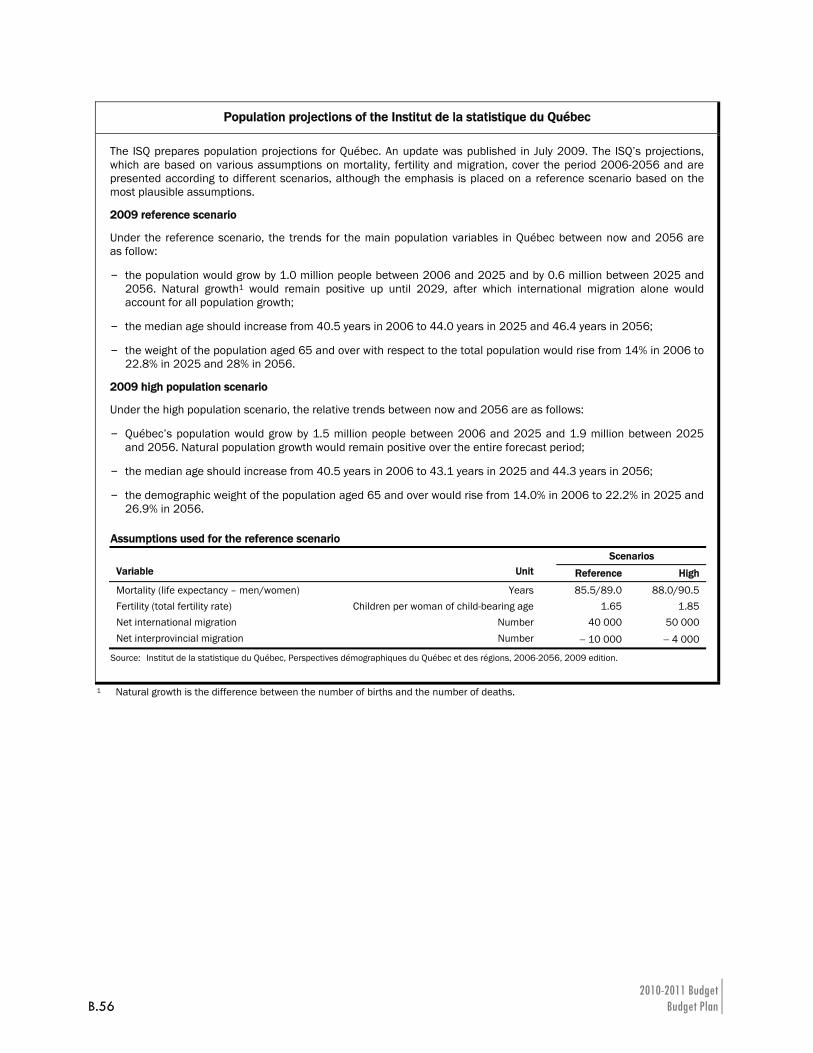
2010-2011 Budget B.56 Budget Plan
Population projections of the Institut de la statistique du Québec
The ISQ prepares population projections for Québec. An update was published in July 2009. The ISQ’s projections, which are based on various assumptions on mortality, fertility and migration, cover the period 2006-2056 and are presented according to different scenarios, although the emphasis is placed on a reference scenario based on the most plausible assumptions.
2009 reference scenario
Under the reference scenario, the trends for the main population variables in Québec between now and 2056 are as follow:
– the population would grow by 1.0 million people between 2006 and 2025 and by 0.6 million between 2025 and 2056. Natural growth1 would remain positive up until 2029, after which international migration alone would account for all population growth;
– the median age should increase from 40.5 years in 2006 to 44.0 years in 2025 and 46.4 years in 2056;
– the weight of the population aged 65 and over with respect to the total population would rise from 14% in 2006 to 22.8% in 2025 and 28% in 2056.
2009 high population scenario
Under the high population scenario, the relative trends between now and 2056 are as follows:
– Québec’s population would grow by 1.5 million people between 2006 and 2025 and 1.9 million between 2025 and 2056. Natural population growth would remain positive over the entire forecast period;
– the median age should increase from 40.5 years in 2006 to 43.1 years in 2025 and 44.3 years in 2056;
– the demographic weight of the population aged 65 and over would rise from 14.0% in 2006 to 22.2% in 2025 and 26.9% in 2056.
Assumptions used for the reference scenario
Scenarios Variable Unit Reference High
Mortality (life expectancy – men/women) Years 85.5/89.0 88.0/90.5 Fertility (total fertility rate) Children per woman of child-bearing age 1.65 1.85 Net international migration Number 40 000 50 000 Net interprovincial migration Number − 10 000 − 4 000
Source: Institut de la statistique du Québec, Perspectives démographiques du Québec et des régions, 2006-2056, 2009 edition.
1 Natural growth is the difference between the number of births and the number of deaths.
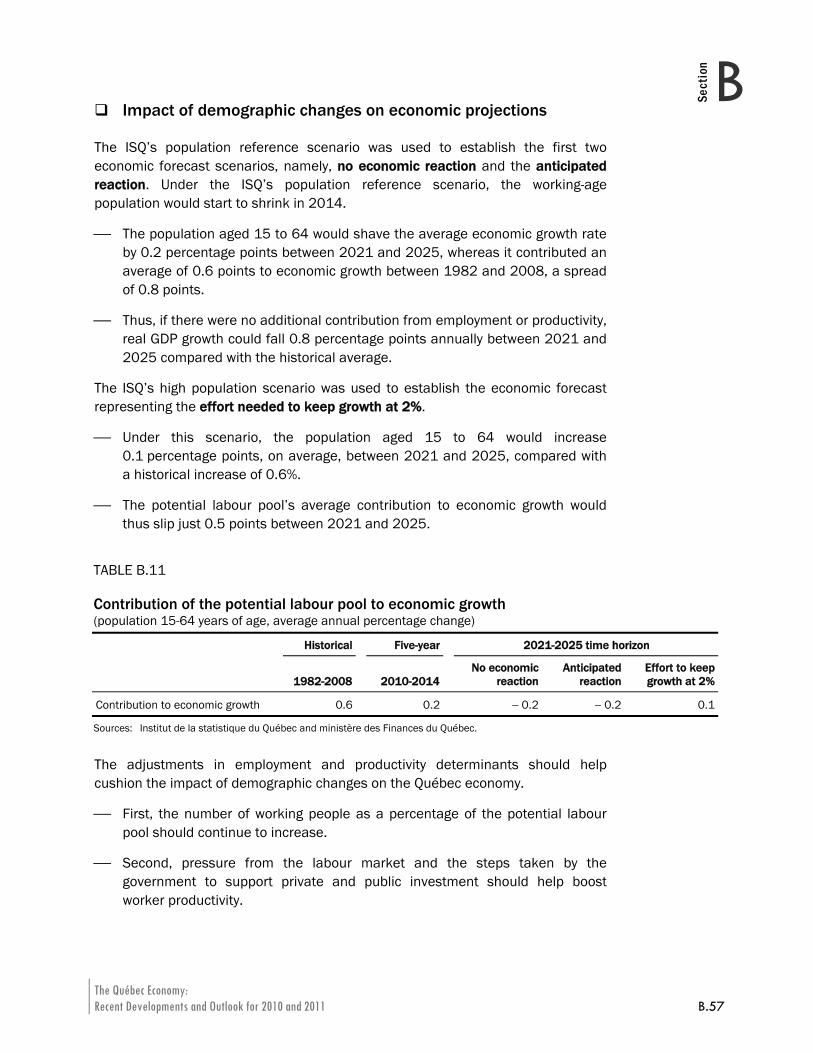
The Québec Economy: Recent Developments and Outlook for 2010 and 2011 B.57
BSection
Impact of demographic changes on economic projections
The ISQ’s population reference scenario was used to establish the first two economic forecast scenarios, namely, no economic reaction and the anticipated reaction. Under the ISQ’s population reference scenario, the working-age population would start to shrink in 2014.
⎯ The population aged 15 to 64 would shave the average economic growth rate by 0.2 percentage points between 2021 and 2025, whereas it contributed an average of 0.6 points to economic growth between 1982 and 2008, a spread of 0.8 points.
⎯ Thus, if there were no additional contribution from employment or productivity, real GDP growth could fall 0.8 percentage points annually between 2021 and 2025 compared with the historical average.
The ISQ’s high population scenario was used to establish the economic forecast representing the effort needed to keep growth at 2%.
⎯ Under this scenario, the population aged 15 to 64 would increase 0.1 percentage points, on average, between 2021 and 2025, compared with a historical increase of 0.6%.
⎯ The potential labour pool’s average contribution to economic growth would thus slip just 0.5 points between 2021 and 2025.
The adjustments in employment and productivity determinants should help cushion the impact of demographic changes on the Québec economy.
⎯ First, the number of working people as a percentage of the potential labour pool should continue to increase.
⎯ Second, pressure from the labour market and the steps taken by the government to support private and public investment should help boost worker productivity.
TABLE B.11 Contribution of the potential labour pool to economic growth (population 15-64 years of age, average annual percentage change)
Historical Five-year 2021-2025 time horizon
1982-2008 2010-2014No economic
reactionAnticipated
reaction Effort to keep growth at 2%
Contribution to economic growth 0.6 0.2 − 0.2 − 0.2 0.1
Sources: Institut de la statistique du Québec and ministère des Finances du Québec.
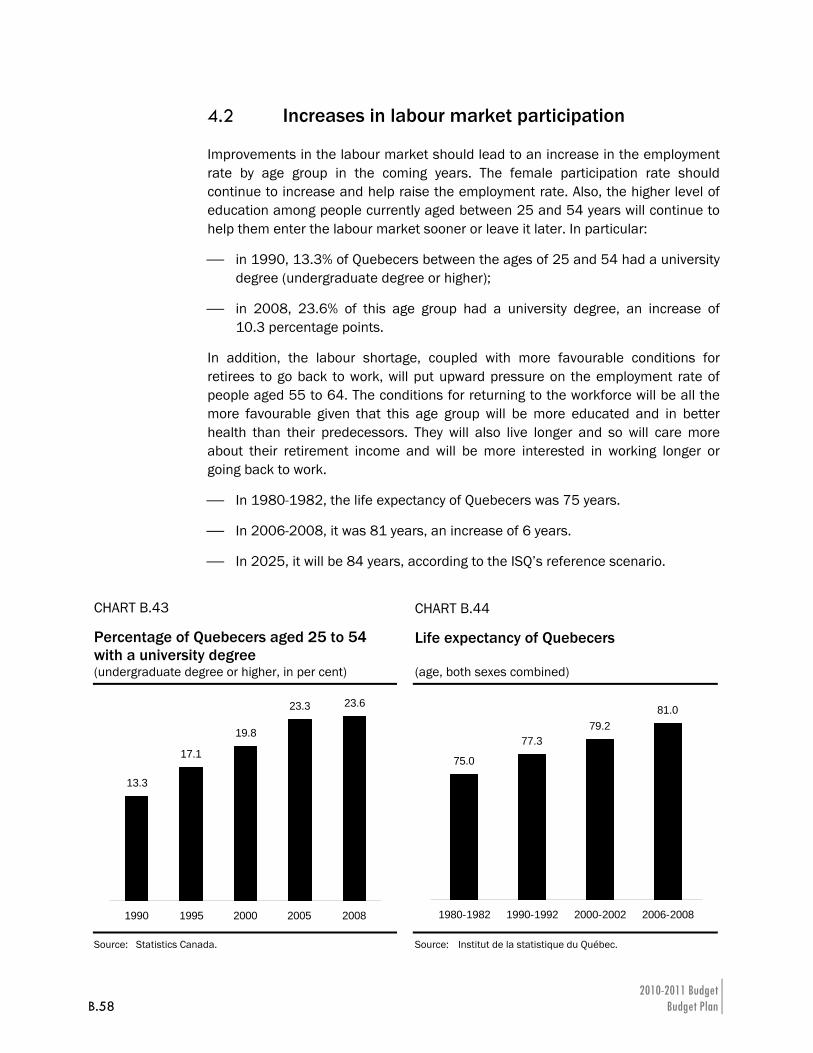
2010-2011 Budget B.58 Budget Plan
4.2 Increases in labour market participation
Improvements in the labour market should lead to an increase in the employment rate by age group in the coming years. The female participation rate should continue to increase and help raise the employment rate. Also, the higher level of education among people currently aged between 25 and 54 years will continue to help them enter the labour market sooner or leave it later. In particular:
⎯ in 1990, 13.3% of Quebecers between the ages of 25 and 54 had a university degree (undergraduate degree or higher);
⎯ in 2008, 23.6% of this age group had a university degree, an increase of 10.3 percentage points.
In addition, the labour shortage, coupled with more favourable conditions for retirees to go back to work, will put upward pressure on the employment rate of people aged 55 to 64. The conditions for returning to the workforce will be all the more favourable given that this age group will be more educated and in better health than their predecessors. They will also live longer and so will care more about their retirement income and will be more interested in working longer or going back to work.
⎯ In 1980-1982, the life expectancy of Quebecers was 75 years.
⎯ In 2006-2008, it was 81 years, an increase of 6 years.
⎯ In 2025, it will be 84 years, according to the ISQ’s reference scenario.
CHART B.43 Percentage of Quebecers aged 25 to 54 with a university degree
CHART B.44 Life expectancy of Quebecers
(undergraduate degree or higher, in per cent) (age, both sexes combined)
13.3
17.1
19.8
23.3 23.6
1990 1995 2000 2005 2008
75.0
77.379.2
81.0
1980-1982 1990-1992 2000-2002 2006-2008
Source: Statistics Canada.
Source: Institut de la statistique du Québec.
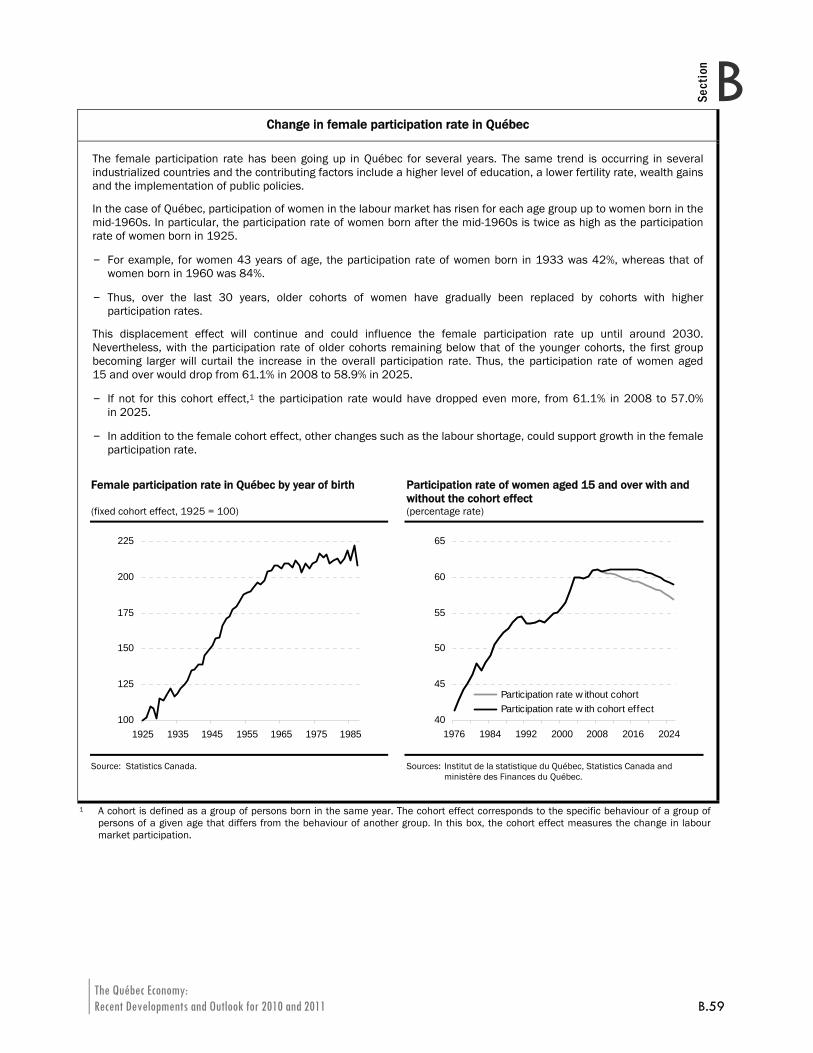
The Québec Economy: Recent Developments and Outlook for 2010 and 2011 B.59
BSection
Change in female participation rate in Québec
The female participation rate has been going up in Québec for several years. The same trend is occurring in several industrialized countries and the contributing factors include a higher level of education, a lower fertility rate, wealth gains and the implementation of public policies.
In the case of Québec, participation of women in the labour market has risen for each age group up to women born in the mid-1960s. In particular, the participation rate of women born after the mid-1960s is twice as high as the participation rate of women born in 1925.
– For example, for women 43 years of age, the participation rate of women born in 1933 was 42%, whereas that of women born in 1960 was 84%.
– Thus, over the last 30 years, older cohorts of women have gradually been replaced by cohorts with higher participation rates.
This displacement effect will continue and could influence the female participation rate up until around 2030. Nevertheless, with the participation rate of older cohorts remaining below that of the younger cohorts, the first group becoming larger will curtail the increase in the overall participation rate. Thus, the participation rate of women aged 15 and over would drop from 61.1% in 2008 to 58.9% in 2025.
– If not for this cohort effect,1 the participation rate would have dropped even more, from 61.1% in 2008 to 57.0% in 2025.
– In addition to the female cohort effect, other changes such as the labour shortage, could support growth in the female participation rate.
Female participation rate in Québec by year of birth
Participation rate of women aged 15 and over with and without the cohort effect
(fixed cohort effect, 1925 = 100) (percentage rate)
100
125
150
175
200
225
1925 1935 1945 1955 1965 1975 1985
40
45
50
55
60
65
1976 1984 1992 2000 2008 2016 2024
Participation rate w ithout cohort effectParticipation rate w ith cohort effectParticipation rate w ithout cohort Participation rate w ith cohort effect
Source: Statistics Canada.
Sources: Institut de la statistique du Québec, Statistics Canada and ministère des Finances du Québec.
1 A cohort is defined as a group of persons born in the same year. The cohort effect corresponds to the specific behaviour of a group of persons of a given age that differs from the behaviour of another group. In this box, the cohort effect measures the change in labour market participation.
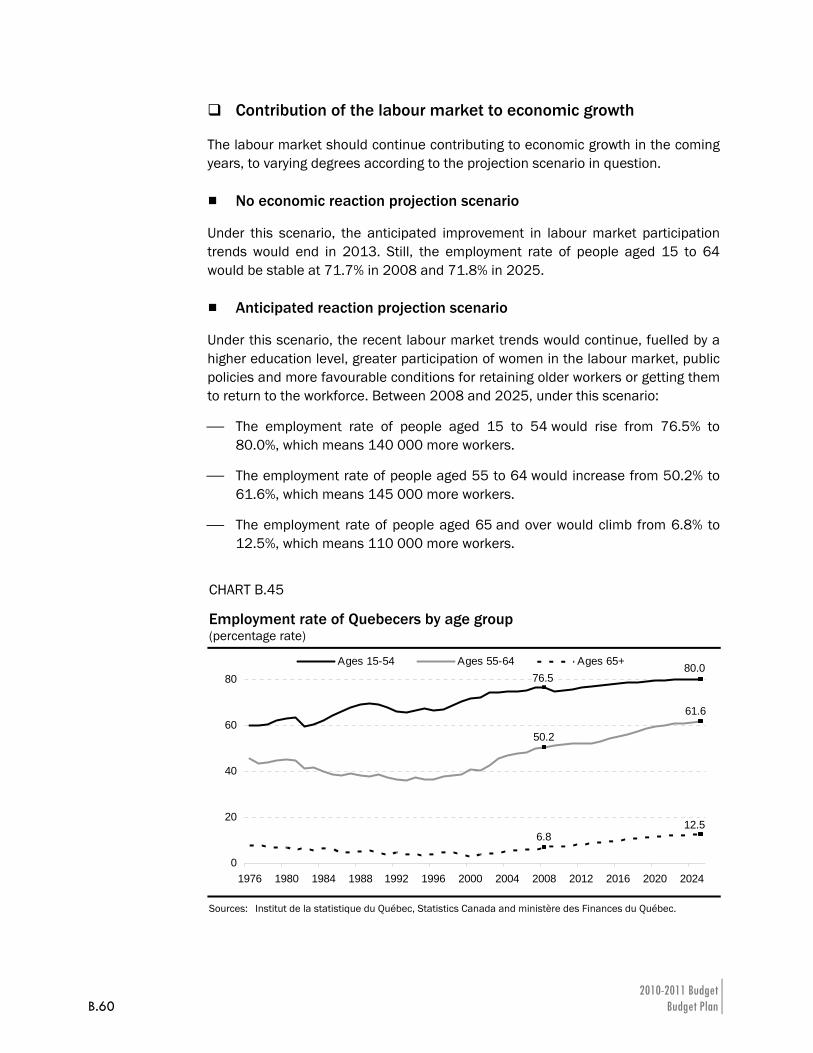
2010-2011 Budget B.60 Budget Plan
Contribution of the labour market to economic growth
The labour market should continue contributing to economic growth in the coming years, to varying degrees according to the projection scenario in question.
No economic reaction projection scenario
Under this scenario, the anticipated improvement in labour market participation trends would end in 2013. Still, the employment rate of people aged 15 to 64 would be stable at 71.7% in 2008 and 71.8% in 2025.
Anticipated reaction projection scenario
Under this scenario, the recent labour market trends would continue, fuelled by a higher education level, greater participation of women in the labour market, public policies and more favourable conditions for retaining older workers or getting them to return to the workforce. Between 2008 and 2025, under this scenario:
⎯ The employment rate of people aged 15 to 54 would rise from 76.5% to 80.0%, which means 140 000 more workers.
⎯ The employment rate of people aged 55 to 64 would increase from 50.2% to 61.6%, which means 145 000 more workers.
⎯ The employment rate of people aged 65 and over would climb from 6.8% to 12.5%, which means 110 000 more workers.
CHART B.45 Employment rate of Quebecers by age group (percentage rate)
0
20
40
60
80
1976 1980 1984 1988 1992 1996 2000 2004 2008 2012 2016 2020 2024
Ages 15-54 Ages 55-64 Ages 65+76.5
80.0
50.2
6.8
61.6
12.5
Sources: Institut de la statistique du Québec, Statistics Canada and ministère des Finances du Québec.
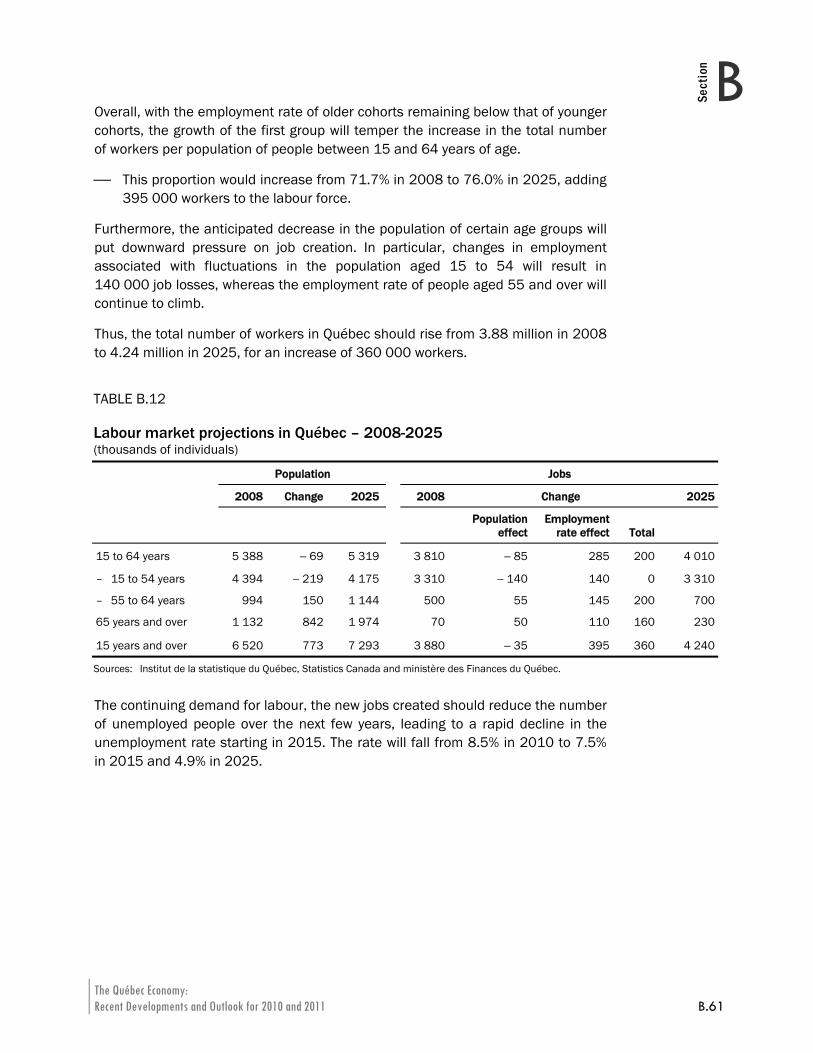
The Québec Economy: Recent Developments and Outlook for 2010 and 2011 B.61
BSection
Overall, with the employment rate of older cohorts remaining below that of younger cohorts, the growth of the first group will temper the increase in the total number of workers per population of people between 15 and 64 years of age.
⎯ This proportion would increase from 71.7% in 2008 to 76.0% in 2025, adding 395 000 workers to the labour force.
Furthermore, the anticipated decrease in the population of certain age groups will put downward pressure on job creation. In particular, changes in employment associated with fluctuations in the population aged 15 to 54 will result in 140 000 job losses, whereas the employment rate of people aged 55 and over will continue to climb.
Thus, the total number of workers in Québec should rise from 3.88 million in 2008 to 4.24 million in 2025, for an increase of 360 000 workers.
The continuing demand for labour, the new jobs created should reduce the number of unemployed people over the next few years, leading to a rapid decline in the unemployment rate starting in 2015. The rate will fall from 8.5% in 2010 to 7.5% in 2015 and 4.9% in 2025.
TABLE B.12 Labour market projections in Québec – 2008-2025 (thousands of individuals)
Population Jobs
2008 Change 2025 2008 Change 2025
Population
effectEmployment
rate effect Total
15 to 64 years 5 388 − 69 5 319 3 810 − 85 285 200 4 010
– 15 to 54 years 4 394 − 219 4 175 3 310 − 140 140 0 3 310
– 55 to 64 years 994 150 1 144 500 55 145 200 700
65 years and over 1 132 842 1 974 70 50 110 160 230
15 years and over 6 520 773 7 293 3 880 − 35 395 360 4 240
Sources: Institut de la statistique du Québec, Statistics Canada and ministère des Finances du Québec.
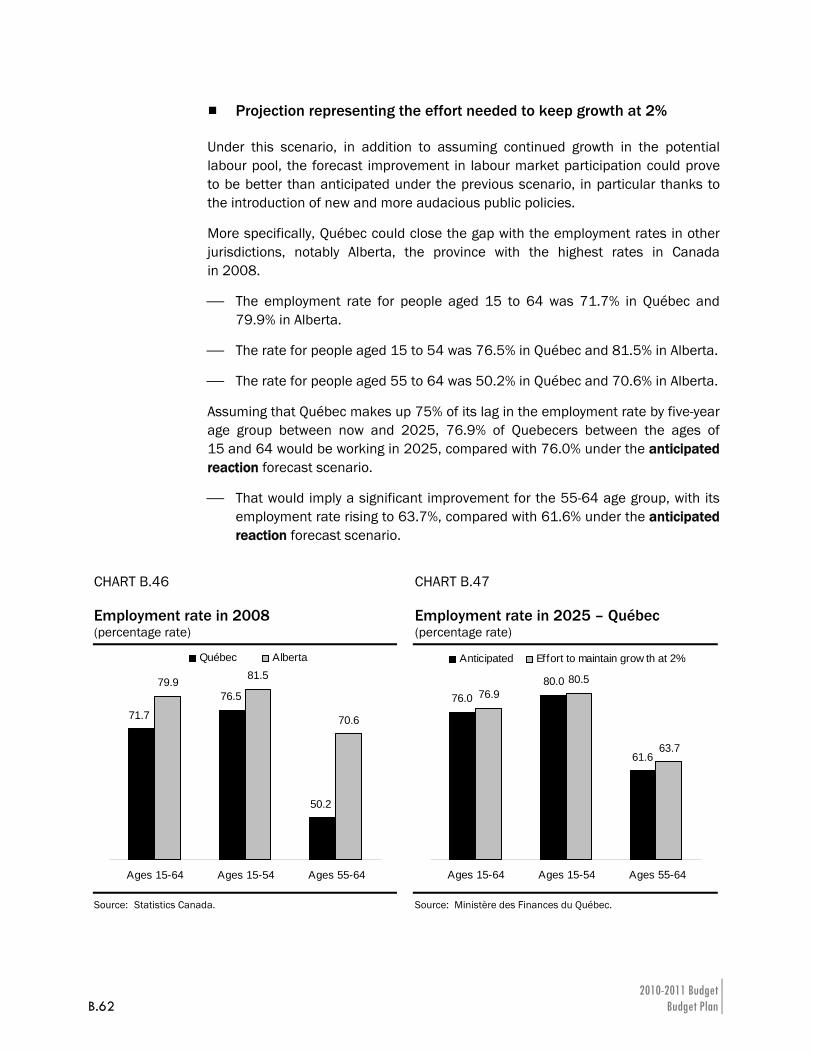
2010-2011 Budget B.62 Budget Plan
Projection representing the effort needed to keep growth at 2%
Under this scenario, in addition to assuming continued growth in the potential labour pool, the forecast improvement in labour market participation could prove to be better than anticipated under the previous scenario, in particular thanks to the introduction of new and more audacious public policies.
More specifically, Québec could close the gap with the employment rates in other jurisdictions, notably Alberta, the province with the highest rates in Canada in 2008.
⎯ The employment rate for people aged 15 to 64 was 71.7% in Québec and 79.9% in Alberta.
⎯ The rate for people aged 15 to 54 was 76.5% in Québec and 81.5% in Alberta.
⎯ The rate for people aged 55 to 64 was 50.2% in Québec and 70.6% in Alberta.
Assuming that Québec makes up 75% of its lag in the employment rate by five-year age group between now and 2025, 76.9% of Quebecers between the ages of 15 and 64 would be working in 2025, compared with 76.0% under the anticipated reaction forecast scenario.
⎯ That would imply a significant improvement for the 55-64 age group, with its employment rate rising to 63.7%, compared with 61.6% under the anticipated reaction forecast scenario.
CHART B.46 Employment rate in 2008
CHART B.47 Employment rate in 2025 – Québec
(percentage rate) (percentage rate)
79.9 81.5
70.6
50.2
76.5
71.7
Ages 15-64 Ages 15-54 Ages 55-64
Québec Alberta
80.076.9
80.5
63.7
76.0
61.6
Ages 15-64 Ages 15-54 Ages 55-64
Anticipated Effort to maintain grow th at 2%
Source: Statistics Canada.
Source: Ministère des Finances du Québec.
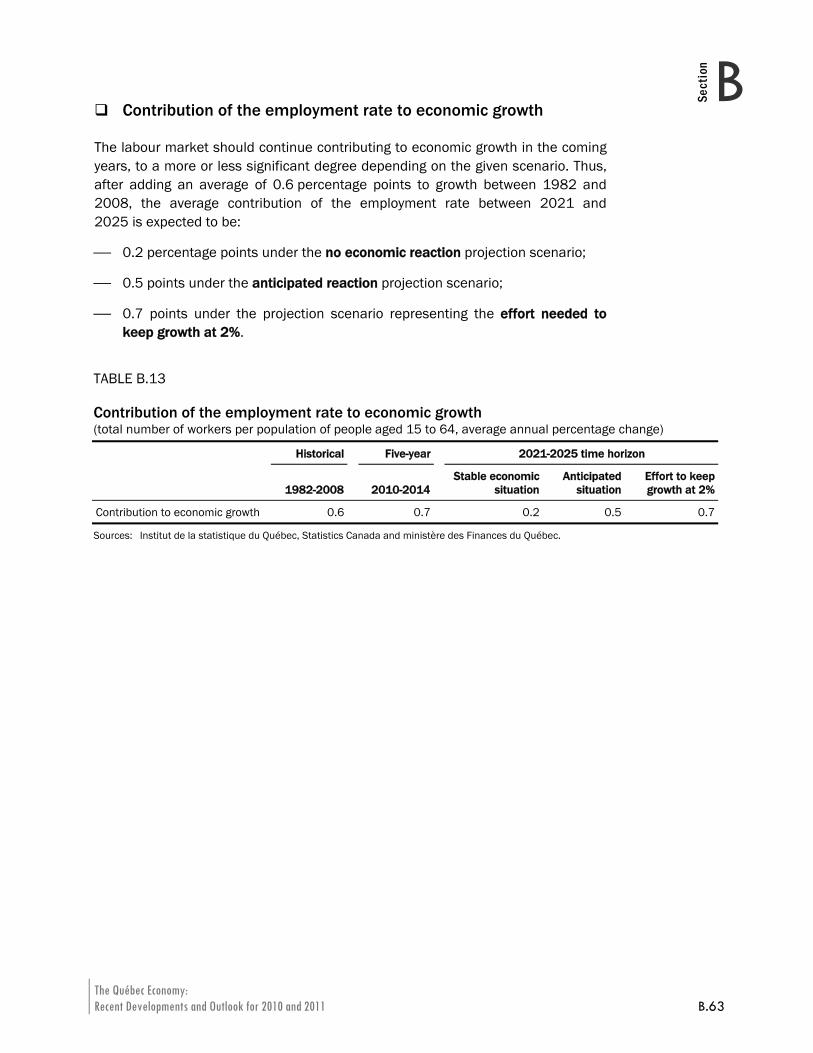
The Québec Economy: Recent Developments and Outlook for 2010 and 2011 B.63
BSection
Contribution of the employment rate to economic growth
The labour market should continue contributing to economic growth in the coming years, to a more or less significant degree depending on the given scenario. Thus, after adding an average of 0.6 percentage points to growth between 1982 and 2008, the average contribution of the employment rate between 2021 and 2025 is expected to be:
⎯ 0.2 percentage points under the no economic reaction projection scenario;
⎯ 0.5 points under the anticipated reaction projection scenario;
⎯ 0.7 points under the projection scenario representing the effort needed to keep growth at 2%.
TABLE B.13 Contribution of the employment rate to economic growth (total number of workers per population of people aged 15 to 64, average annual percentage change)
Historical Five-year 2021-2025 time horizon
1982-2008 2010-2014Stable economic
situationAnticipated
situation Effort to keep growth at 2%
Contribution to economic growth 0.6 0.7 0.2 0.5 0.7
Sources: Institut de la statistique du Québec, Statistics Canada and ministère des Finances du Québec.
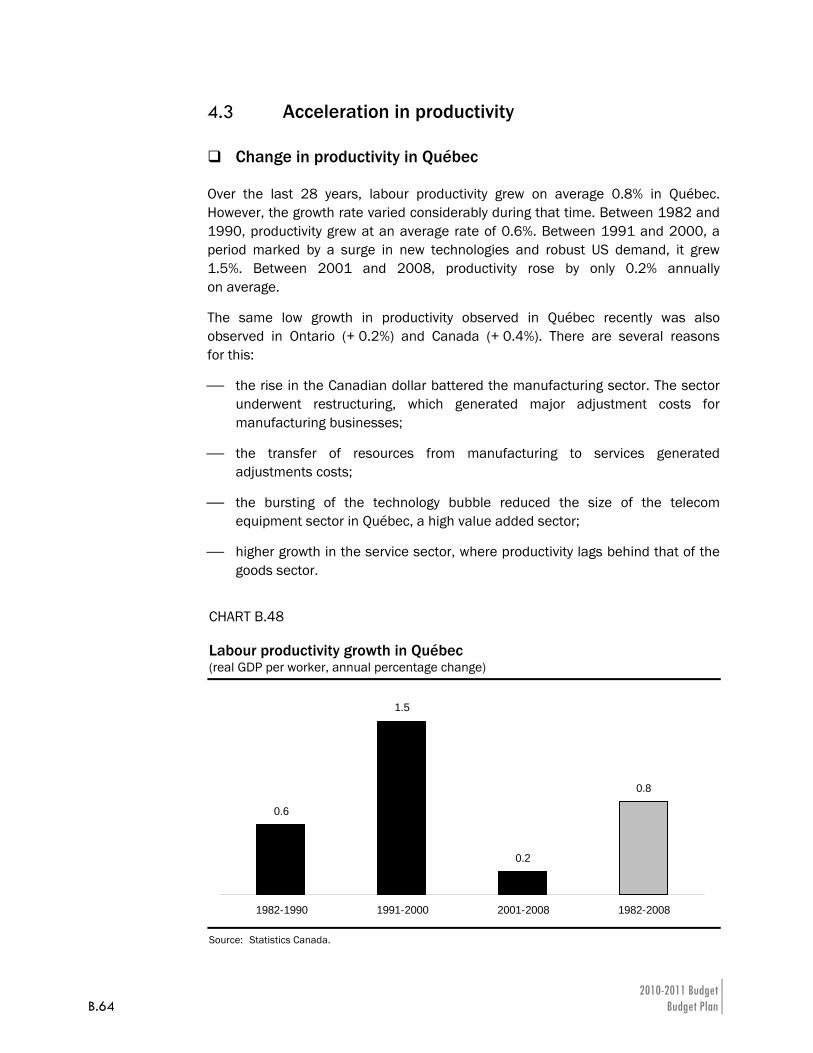
2010-2011 Budget B.64 Budget Plan
4.3 Acceleration in productivity
Change in productivity in Québec
Over the last 28 years, labour productivity grew on average 0.8% in Québec. However, the growth rate varied considerably during that time. Between 1982 and 1990, productivity grew at an average rate of 0.6%. Between 1991 and 2000, a period marked by a surge in new technologies and robust US demand, it grew 1.5%. Between 2001 and 2008, productivity rose by only 0.2% annually on average.
The same low growth in productivity observed in Québec recently was also observed in Ontario (+ 0.2%) and Canada (+ 0.4%). There are several reasons for this:
⎯ the rise in the Canadian dollar battered the manufacturing sector. The sector underwent restructuring, which generated major adjustment costs for manufacturing businesses;
⎯ the transfer of resources from manufacturing to services generated adjustments costs;
⎯ the bursting of the technology bubble reduced the size of the telecom equipment sector in Québec, a high value added sector;
⎯ higher growth in the service sector, where productivity lags behind that of the goods sector.
CHART B.48 Labour productivity growth in Québec (real GDP per worker, annual percentage change)
0.6
1.5
0.2
0.8
1982-1990 1991-2000 2001-2008 1982-2008
Source: Statistics Canada.
The Québec Economy: Recent Developments and Outlook for 2010 and 2011 B.65
BSection
The pace of growth in labour productivity (output per worker) is expected to pick up in the coming years, reaching an average rate of 1.4% from 2010 to 2014. This strong growth will be largely linked to the revival in economic activity following the 2009 recession. It should reach 1.1% from 2015 to 2025.
This anticipated acceleration in productivity within the next 15 years will be supported by several factors, in particular:
⎯ in recent years, the government has taken a number of steps to support private investment. In particular, it undertook to eliminate the tax on capital for all companies by January 1, 2011, and introduced an investment tax credit;
⎯ through the Québec Infrastructure Plan, the government is improving transportation infrastructure, which facilitates trade, municipal infrastructure, which is a factor in site location for companies, and education infrastructure, which contributes to worker training, research and innovation;
⎯ in addition, faced with a shrinking potential labour pool and the attendant possibility of pressure on wages, Québec businesses will use workers and technology more effectively as well as make more use of machinery and equipment;
⎯ moreover, in a context of a tightening labour market, the downward trend in the number of hours worked in Québec could slow, and even reverse itself, another factor that could lead to an increase in output per worker. This could be the case, for example, if part-time work or involuntary unemployment were to fall.
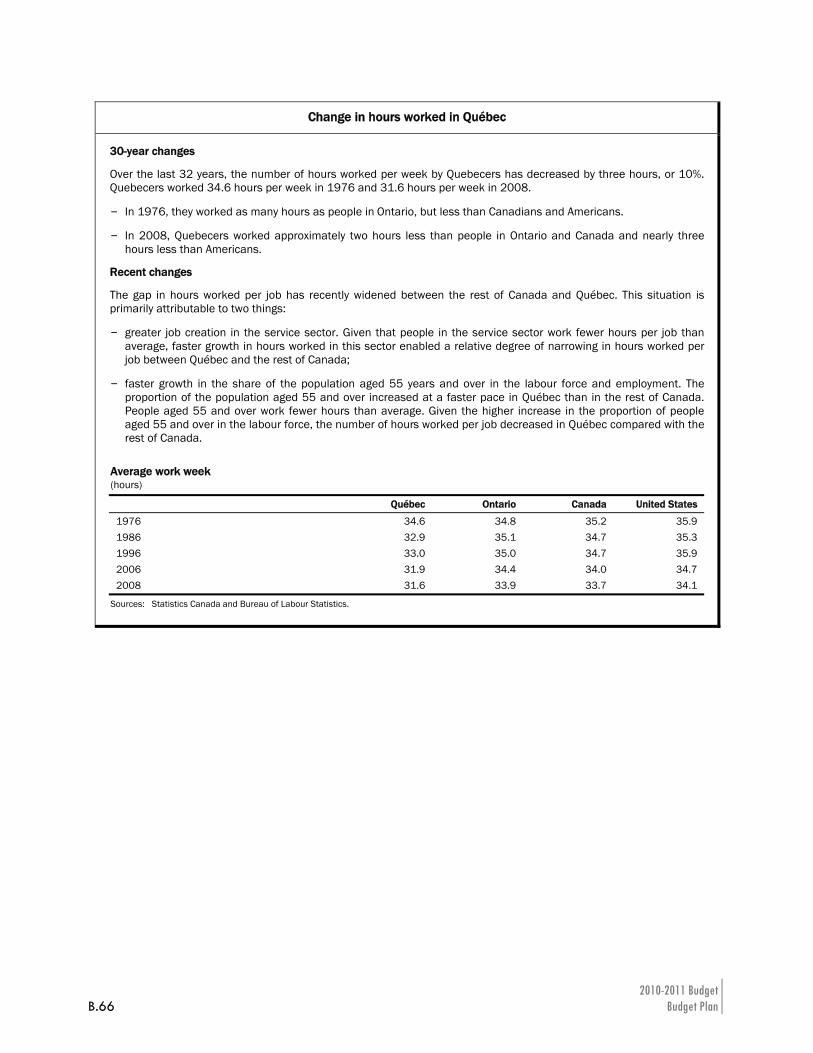
2010-2011 Budget B.66 Budget Plan
Change in hours worked in Québec
30-year changes
Over the last 32 years, the number of hours worked per week by Quebecers has decreased by three hours, or 10%. Quebecers worked 34.6 hours per week in 1976 and 31.6 hours per week in 2008.
– In 1976, they worked as many hours as people in Ontario, but less than Canadians and Americans.
– In 2008, Quebecers worked approximately two hours less than people in Ontario and Canada and nearly three hours less than Americans.
Recent changes
The gap in hours worked per job has recently widened between the rest of Canada and Québec. This situation is primarily attributable to two things:
– greater job creation in the service sector. Given that people in the service sector work fewer hours per job than average, faster growth in hours worked in this sector enabled a relative degree of narrowing in hours worked per job between Québec and the rest of Canada;
– faster growth in the share of the population aged 55 years and over in the labour force and employment. The proportion of the population aged 55 and over increased at a faster pace in Québec than in the rest of Canada. People aged 55 and over work fewer hours than average. Given the higher increase in the proportion of people aged 55 and over in the labour force, the number of hours worked per job decreased in Québec compared with the rest of Canada.
Average work week (hours)
Québec Ontario Canada United States
1976 34.6 34.8 35.2 35.9 1986 32.9 35.1 34.7 35.3 1996 33.0 35.0 34.7 35.9 2006 31.9 34.4 34.0 34.7 2008 31.6 33.9 33.7 34.1
Sources: Statistics Canada and Bureau of Labour Statistics.
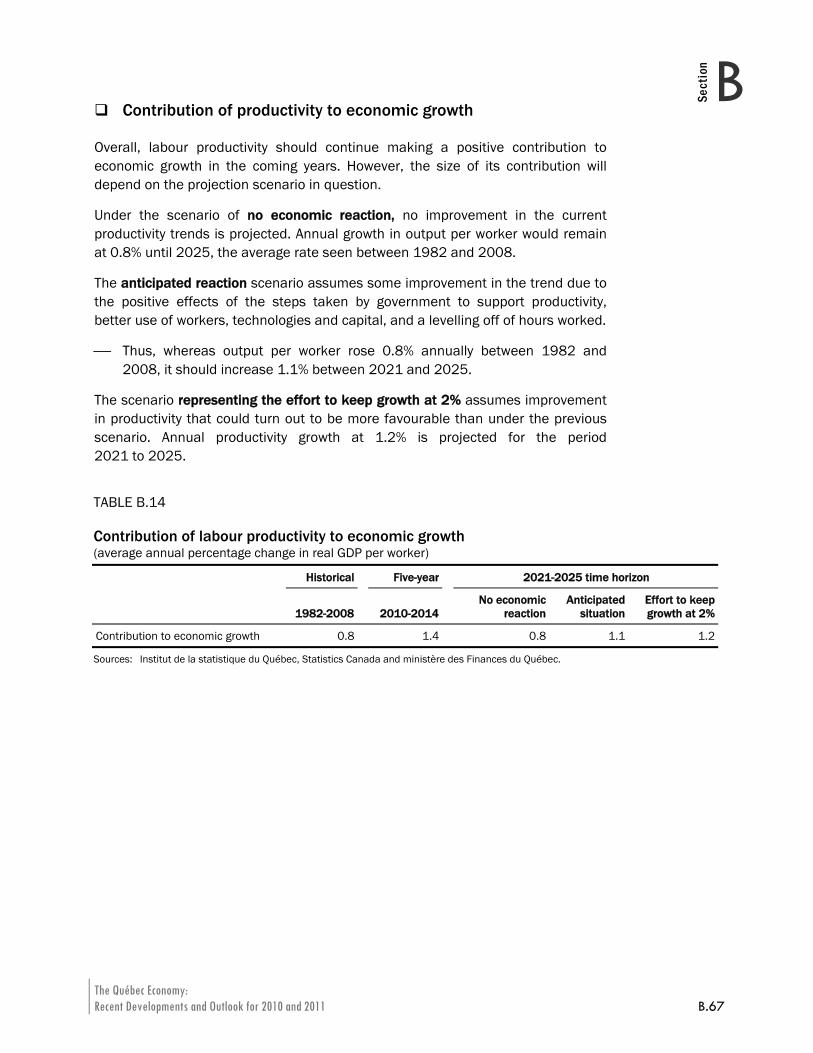
The Québec Economy: Recent Developments and Outlook for 2010 and 2011 B.67
BSection
Contribution of productivity to economic growth
Overall, labour productivity should continue making a positive contribution to economic growth in the coming years. However, the size of its contribution will depend on the projection scenario in question.
Under the scenario of no economic reaction, no improvement in the current productivity trends is projected. Annual growth in output per worker would remain at 0.8% until 2025, the average rate seen between 1982 and 2008.
The anticipated reaction scenario assumes some improvement in the trend due to the positive effects of the steps taken by government to support productivity, better use of workers, technologies and capital, and a levelling off of hours worked.
⎯ Thus, whereas output per worker rose 0.8% annually between 1982 and 2008, it should increase 1.1% between 2021 and 2025.
The scenario representing the effort to keep growth at 2% assumes improvement in productivity that could turn out to be more favourable than under the previous scenario. Annual productivity growth at 1.2% is projected for the period 2021 to 2025.
TABLE B.14 Contribution of labour productivity to economic growth (average annual percentage change in real GDP per worker)
Historical Five-year 2021-2025 time horizon
1982-2008 2010-2014No economic
reactionAnticipated
situation Effort to keep growth at 2%
Contribution to economic growth 0.8 1.4 0.8 1.1 1.2
Sources: Institut de la statistique du Québec, Statistics Canada and ministère des Finances du Québec.
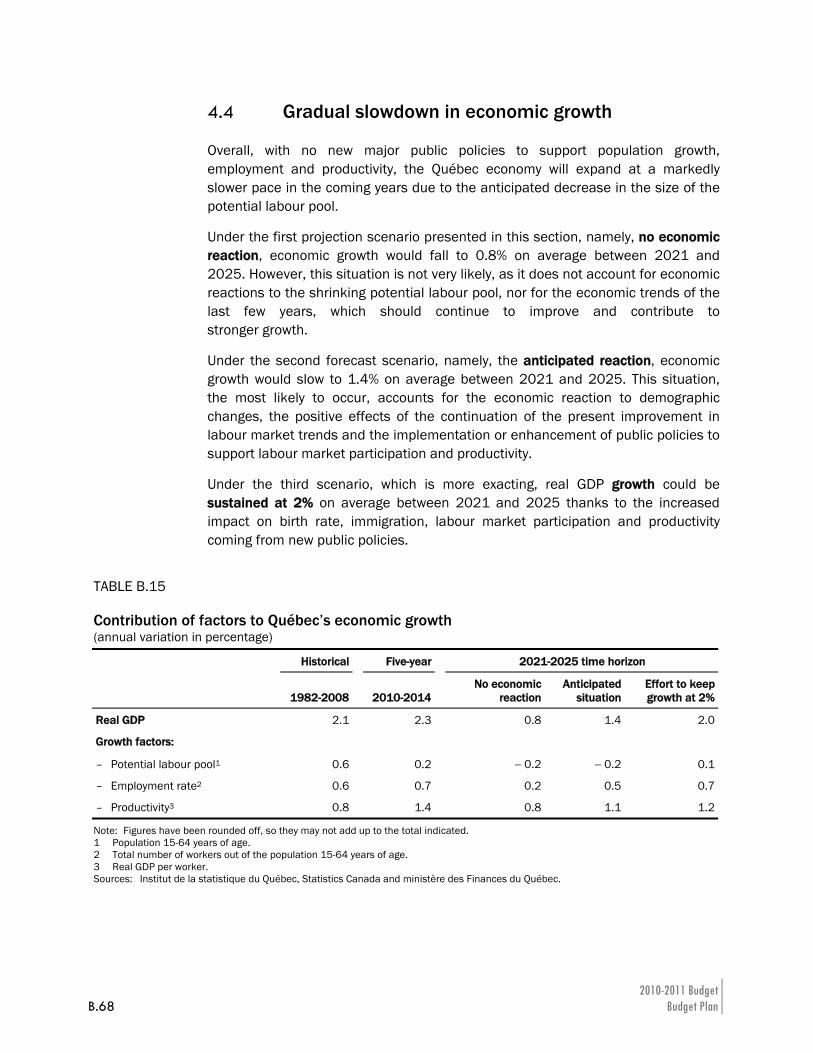
2010-2011 Budget B.68 Budget Plan
4.4 Gradual slowdown in economic growth
Overall, with no new major public policies to support population growth, employment and productivity, the Québec economy will expand at a markedly slower pace in the coming years due to the anticipated decrease in the size of the potential labour pool.
Under the first projection scenario presented in this section, namely, no economic reaction, economic growth would fall to 0.8% on average between 2021 and 2025. However, this situation is not very likely, as it does not account for economic reactions to the shrinking potential labour pool, nor for the economic trends of the last few years, which should continue to improve and contribute to stronger growth.
Under the second forecast scenario, namely, the anticipated reaction, economic growth would slow to 1.4% on average between 2021 and 2025. This situation, the most likely to occur, accounts for the economic reaction to demographic changes, the positive effects of the continuation of the present improvement in labour market trends and the implementation or enhancement of public policies to support labour market participation and productivity.
Under the third scenario, which is more exacting, real GDP growth could be sustained at 2% on average between 2021 and 2025 thanks to the increased impact on birth rate, immigration, labour market participation and productivity coming from new public policies.
TABLE B.15 Contribution of factors to Québec’s economic growth (annual variation in percentage)
Historical Five-year 2021-2025 time horizon
1982-2008 2010-2014No economic
reactionAnticipated
situation Effort to keepgrowth at 2%
Real GDP 2.1 2.3 0.8 1.4 2.0
Growth factors:
– Potential labour pool1 0.6 0.2 − 0.2 − 0.2 0.1
– Employment rate2 0.6 0.7 0.2 0.5 0.7
– Productivity3 0.8 1.4 0.8 1.1 1.2
Note: Figures have been rounded off, so they may not add up to the total indicated. 1 Population 15-64 years of age. 2 Total number of workers out of the population 15-64 years of age. 3 Real GDP per worker. Sources: Institut de la statistique du Québec, Statistics Canada and ministère des Finances du Québec.
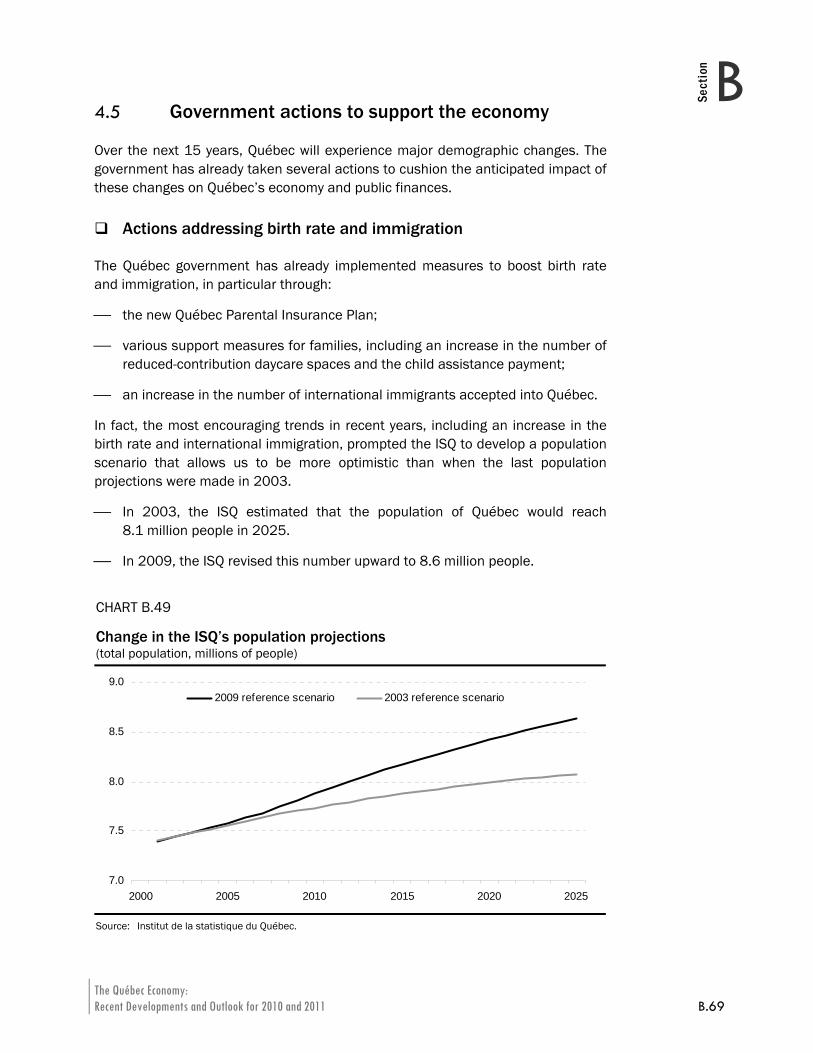
The Québec Economy: Recent Developments and Outlook for 2010 and 2011 B.69
BSection
4.5 Government actions to support the economy
Over the next 15 years, Québec will experience major demographic changes. The government has already taken several actions to cushion the anticipated impact of these changes on Québec’s economy and public finances.
Actions addressing birth rate and immigration
The Québec government has already implemented measures to boost birth rate and immigration, in particular through:
⎯ the new Québec Parental Insurance Plan;
⎯ various support measures for families, including an increase in the number of reduced-contribution daycare spaces and the child assistance payment;
⎯ an increase in the number of international immigrants accepted into Québec.
In fact, the most encouraging trends in recent years, including an increase in the birth rate and international immigration, prompted the ISQ to develop a population scenario that allows us to be more optimistic than when the last population projections were made in 2003.
⎯ In 2003, the ISQ estimated that the population of Québec would reach 8.1 million people in 2025.
⎯ In 2009, the ISQ revised this number upward to 8.6 million people.
CHART B.49 Change in the ISQ’s population projections (total population, millions of people)
7.0
7.5
8.0
8.5
9.0
2000 2005 2010 2015 2020 2025
2009 reference scenario 2003 reference scenario
Source: Institut de la statistique du Québec.
2010-2011 Budget B.70 Budget Plan
Actions addressing the labour market
The Québec government also took steps to encourage labour market participation.
It acted to meet the labour needs of businesses and to support workers affected by the difficult economic situation.
⎯ In the 2008-2009 Budget, the government introduced the Employment Pact, the goals of which are to develop human potential in every region, value work and improve workforce training.
⎯ In its 2009-2010 Budget, the government announced the Employment Pact Plus, which contains 16 measures to mitigate the effects of the economic slowdown on workers and businesses.
To keep immigrants and help them enter the Québec job market, the government announced measures to:
⎯ increase efforts to recognize the training and diplomas of foreign-trained workers;
⎯ improve new immigrants’ knowledge of and proficiency in French.
Also, to attenuate the impact of population aging on labour market participation, the government changed the rules to enable more gradual phased retirement.
Actions addressing productivity
To support the economy and investment and increase the productivity of Québec businesses, the government has targeted its actions since 2003 with a view to reducing the tax burden of businesses.
⎯ The tax on capital was eliminated for manufacturing firms in 2008 and will be eliminated for all sectors at the end of 2010.
⎯ Tax incentives to develop e-business and investment have been introduced.
In conclusion
The actions taken by the government to deal with the major demographic changes on the horizon have borne fruit. The results are encouraging, but they must not become a stumbling block on the road ahead. In particular, Québec must continue its efforts to foster birth rate, immigration, labour market participation and productivity.
C.1
Section C
C The Government’s Financial Framework
INTRODUCTION ........................................................................................................ C.3
1. TAKING ADVANTAGE OF THE RECOVERY TO BEGIN RESTORING FISCAL BALANCE .............................................................................................. C.5
2. UPDATING OF THE FINANCIAL FRAMEWORK....................................................... C.11
2.1 Budgetary revenue ...................................................................................C.11 2.1.1 Own-source revenue excluding government
enterprises ...................................................................................C.12 2.1.2 Revenue from government enterprises .....................................C.16 2.1.3 Revenues from federal transfers................................................C.18
2.2 Budgetary expenditure.............................................................................C.21 2.2.1 Adjustments to program spending .............................................C.22 2.2.2 Action plan to reduce spending growth so as
to achieve fiscal balance.............................................................C.24 2.2.3 Efforts on the part of all government
departments ................................................................................C.25 2.2.4 Weight of government spending in the
economy.......................................................................................C.28 2.2.5 Debt service .................................................................................C.29
2.3 Government investments.........................................................................C.31 2.3.1 The Québec Infrastructures Plan................................................C.31 2.3.2 Investments by Québec government
departments and organizations..................................................C.33 2.3.3 Investments by government enterprises....................................C.33 2.3.4 Public investments in the economy............................................C.34
C.2
3. BUDGETARY FORECASTS FOR REVENUE AND CONSOLIDATED EXPENDITURE................................................................................................. C.35
3.1 Line-by-line consolidation........................................................................ C.37 3.2 Consolidated entities............................................................................... C.42
3.2.1 Non-budget-funded bodies and special funds.......................... C.43 3.2.2 Health and social services and education
networks...................................................................................... C.47 3.2.3 Generations Fund ....................................................................... C.49
4. CONSOLIDATED NET FINANCIAL REQUIREMENTS................................................. C.51
5. CONSOLIDATED NON-BUDGETARY TRANSACTIONS.............................................. C.55
APPENDIX 1: INVESTMENTS.................................................................................... C.61
APPENDIX 2: INVESTMENT PROJECTS BY GOVERNMENT ENTERPRISES ......................... C.65
APPENDIX 3: PRESENTATION OF CONSOLIDATED FINANCIAL REQUIREMENTS BEFORE LINE-BY-LINE CONSOLIDATION OF THE HEALTH AND SOCIAL SERVICES AND EDUCATION NETWORKS....................................................................................... C.67
The Government’s Financial Framework C.3
CSection
INTRODUCTION This section of the Budget Plan presents the preliminary results for fiscal 2009-2010 and the government’s budgetary and financial stance for 2010-2011 and 2011-2012.
The information provided concerns:
⎯ consolidated financial and budgetary transactions for the period from 2009-2010 to 2011-2012, including the impact of the measures announced in the present budget;
⎯ the change in revenue and expenditure, as well as adjustments made since last year’s budget;
⎯ the government’s main expenditure items, capital expenditures, net financial requirements and non-budgetary transactions.
Section A also contains five-year financial forecasts, up to 2014-2015.

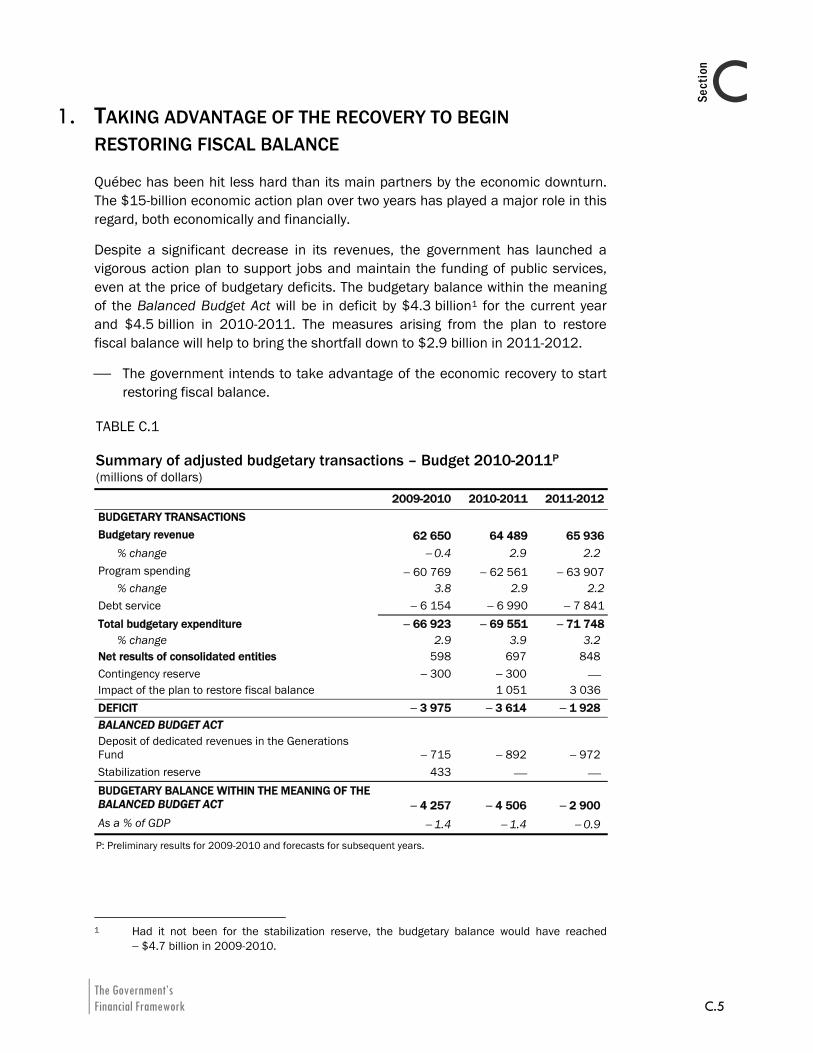
The Government’s Financial Framework C.5
CSection
1. TAKING ADVANTAGE OF THE RECOVERY TO BEGIN RESTORING FISCAL BALANCE Québec has been hit less hard than its main partners by the economic downturn. The $15-billion economic action plan over two years has played a major role in this regard, both economically and financially.
Despite a significant decrease in its revenues, the government has launched a vigorous action plan to support jobs and maintain the funding of public services, even at the price of budgetary deficits. The budgetary balance within the meaning of the Balanced Budget Act will be in deficit by $4.3 billion1 for the current year and $4.5 billion in 2010-2011. The measures arising from the plan to restore fiscal balance will help to bring the shortfall down to $2.9 billion in 2011-2012.
⎯ The government intends to take advantage of the economic recovery to start restoring fiscal balance.
TABLE C.1 Summary of adjusted budgetary transactions – Budget 2010-2011P (millions of dollars)
2009-2010 2010-2011 2011-2012 BUDGETARY TRANSACTIONS Budgetary revenue 62 650 64 489 65 936
% change − 0.4 2.9 2.2 Program spending − 60 769 − 62 561 − 63 907
% change 3.8 2.9 2.2 Debt service − 6 154 − 6 990 − 7 841 Total budgetary expenditure − 66 923 − 69 551 − 71 748
% change 2.9 3.9 3.2 Net results of consolidated entities 598 697 848 Contingency reserve − 300 − 300 ⎯ Impact of the plan to restore fiscal balance 1 051 3 036 DEFICIT − 3 975 − 3 614 − 1 928 BALANCED BUDGET ACT Deposit of dedicated revenues in the Generations Fund − 715 − 892 − 972 Stabilization reserve 433 ⎯ ⎯ BUDGETARY BALANCE WITHIN THE MEANING OF THE BALANCED BUDGET ACT − 4 257 − 4 506 − 2 900 As a % of GDP − 1.4 − 1.4 − 0.9
P: Preliminary results for 2009-2010 and forecasts for subsequent years.
1 Had it not been for the stabilization reserve, the budgetary balance would have reached
− $4.7 billion in 2009-2010.
2010-2011 Budget C.6 Budget Plan
As of 2010-2011, the government plans, on the one hand, to continue its rigorous management of program spending by limiting growth in such spending to 2.9% and, on the other hand, to implement other measures totalling $1.1 billion. In 2011-2012, growth in program spending will stand at 2.2% and the total for other measures will be $3.0 billion.
In addition, the government is incorporating a contingency reserve of $300 million into its financial framework for 2009-20102 and 2010-2011 respectively to provide for any shortfalls.
2 A reserve of the same amount had been provided for 2009-2010 in the October 2009 Update
on Québec’s Economic and Financial Situation.
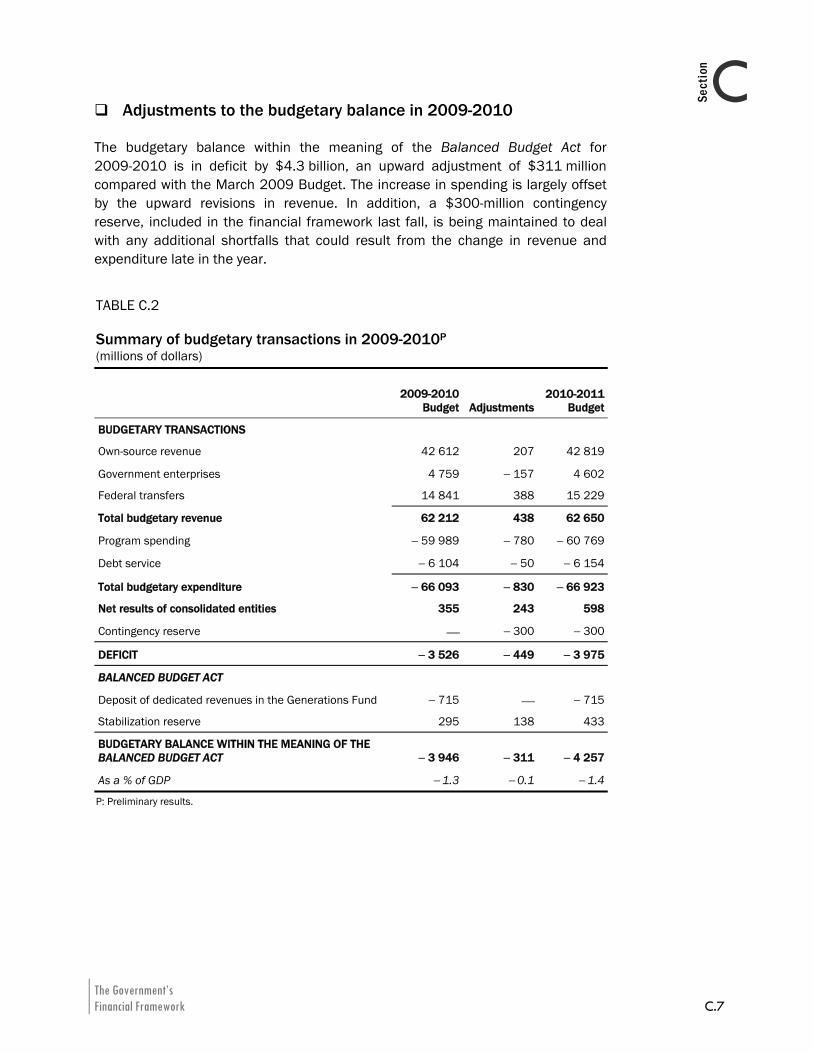
The Government’s Financial Framework C.7
CSection
Adjustments to the budgetary balance in 2009-2010
The budgetary balance within the meaning of the Balanced Budget Act for 2009-2010 is in deficit by $4.3 billion, an upward adjustment of $311 million compared with the March 2009 Budget. The increase in spending is largely offset by the upward revisions in revenue. In addition, a $300-million contingency reserve, included in the financial framework last fall, is being maintained to deal with any additional shortfalls that could result from the change in revenue and expenditure late in the year.
TABLE C.2 Summary of budgetary transactions in 2009-2010P (millions of dollars)
2009-2010Budget Adjustments
2010-2011
Budget
BUDGETARY TRANSACTIONS
Own-source revenue 42 612 207 42 819
Government enterprises 4 759 − 157 4 602
Federal transfers 14 841 388 15 229
Total budgetary revenue 62 212 438 62 650
Program spending − 59 989 − 780 − 60 769
Debt service − 6 104 − 50 − 6 154
Total budgetary expenditure − 66 093 − 830 − 66 923
Net results of consolidated entities 355 243 598
Contingency reserve ⎯ − 300 − 300
DEFICIT − 3 526 − 449 − 3 975
BALANCED BUDGET ACT
Deposit of dedicated revenues in the Generations Fund − 715 ⎯ − 715
Stabilization reserve 295 138 433
BUDGETARY BALANCE WITHIN THE MEANING OF THE BALANCED BUDGET ACT − 3 946 − 311 − 4 257
As a % of GDP − 1.3 − 0.1 − 1.4
P: Preliminary results.
2010-2011 Budget C.8 Budget Plan
Since the March 2009 Budget, a number of factors have enabled the government to offset the shortfall stemming from growth in spending. These factors are:
⎯ a $388-million increase in federal transfers;
⎯ a $207-million rise in own-source revenue excluding government enterprise.
These positive contributions have made it possible to reduce the impact of:
⎯ the $780-million upward adjustment of the program spending objective, including:
— $380 million for the increase in the government’s contribution to La Financière agricole du Québec. This expenditure offset the anticipated deficit of La Financière agricole du Québec accounted for in consolidated entities. This also explains in part the upward revision of $243 million in respect of consolidated entities;
— $150 million for enhancing the Renfort program to assist Québec companies facing liquidity problems;
— $126 million attributable to spending in respect of the A (H1N1) flu pandemic;
⎯ a decline of $157 million in revenue from government enterprises, including losses of $226 million at the Société générale de financement du Québec;
⎯ a $50-million rise in debt service.
Once the $300-million contingency reserve and the $433-million balance of the stabilization reserve are taken into account, the budgetary balance is in deficit by $4.3 billion.
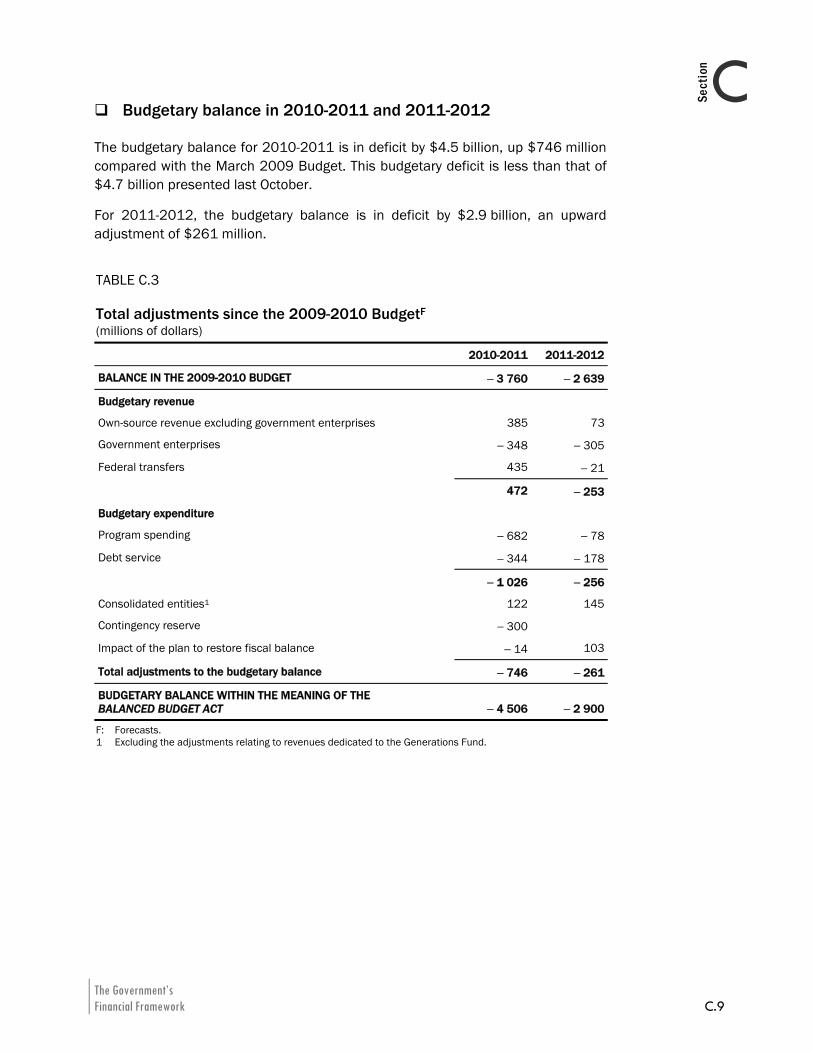
The Government’s Financial Framework C.9
CSection
Budgetary balance in 2010-2011 and 2011-2012
The budgetary balance for 2010-2011 is in deficit by $4.5 billion, up $746 million compared with the March 2009 Budget. This budgetary deficit is less than that of $4.7 billion presented last October.
For 2011-2012, the budgetary balance is in deficit by $2.9 billion, an upward adjustment of $261 million.
TABLE C.3 Total adjustments since the 2009-2010 BudgetF (millions of dollars)
2010-2011 2011-2012
BALANCE IN THE 2009-2010 BUDGET − 3 760 − 2 639
Budgetary revenue
Own-source revenue excluding government enterprises 385 73
Government enterprises − 348 − 305
Federal transfers 435 − 21
472 − 253
Budgetary expenditure
Program spending − 682 − 78
Debt service − 344 − 178
− 1 026 − 256
Consolidated entities1 122 145
Contingency reserve − 300
Impact of the plan to restore fiscal balance − 14 103
Total adjustments to the budgetary balance − 746 − 261
BUDGETARY BALANCE WITHIN THE MEANING OF THE BALANCED BUDGET ACT − 4 506 − 2 900
F: Forecasts. 1 Excluding the adjustments relating to revenues dedicated to the Generations Fund.
2010-2011 Budget C.10 Budget Plan
2010-2011: a budgetary balance of − $4.5 billion
The $746-million upward adjustment to the budgetary deficit compared with the March 2009 Budget is explained primarily by:
⎯ the $682-million upward revision of the program spending objective, including $325 million stemming from an increase in the government contribution to La Financière agricole du Québec and $195 million for the cost of the new measures announced in this budget;
⎯ the $348-million reduction in revenue from government enterprises, attributable for the most part to a decline of $300 million in Hydro-Québec’s net profits;
⎯ the $344-million rise in debt service;
⎯ the inclusion of a $300-million contingency reserve in the government’s financial framework.
The $385-million upward adjustment in own-source revenue excluding government enterprises and the positive adjustments of $435 million in federal transfers improve the budgetary balance accordingly.
2011-2012: a budgetary balance of − $2.9 billion
The $261-million upward revision of the budgetary deficit compared with the March 2009 Budget can be attributed mainly to:
⎯ the $300-million decline in Hydro-Québec’s profits and the $178-million increase in debt service;
⎯ the fact that these adjustments are partially offset by a $103-million increase in respect of the measures taken under the plan to restore fiscal balance.
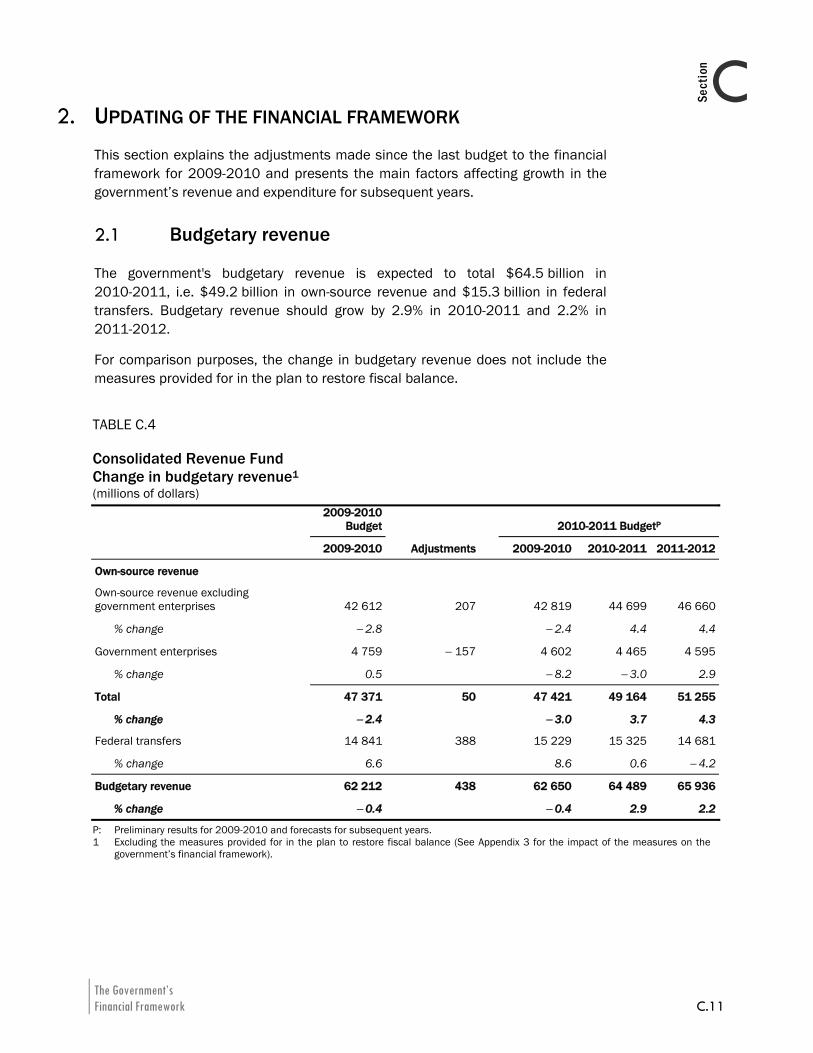
The Government’s Financial Framework C.11
CSection
2. UPDATING OF THE FINANCIAL FRAMEWORK This section explains the adjustments made since the last budget to the financial framework for 2009-2010 and presents the main factors affecting growth in the government’s revenue and expenditure for subsequent years.
2.1 Budgetary revenue
The government's budgetary revenue is expected to total $64.5 billion in 2010-2011, i.e. $49.2 billion in own-source revenue and $15.3 billion in federal transfers. Budgetary revenue should grow by 2.9% in 2010-2011 and 2.2% in 2011-2012.
For comparison purposes, the change in budgetary revenue does not include the measures provided for in the plan to restore fiscal balance.
TABLE C.4 Consolidated Revenue Fund Change in budgetary revenue1 (millions of dollars)
2009-2010
Budget 2010-2011 BudgetP
2009-2010 Adjustments 2009-2010 2010-2011 2011-2012
Own-source revenue
Own-source revenue excluding government enterprises 42 612 207 42 819 44 699 46 660
% change − 2.8 − 2.4 4.4 4.4
Government enterprises 4 759 − 157 4 602 4 465 4 595
% change 0.5 − 8.2 − 3.0 2.9
Total 47 371 50 47 421 49 164 51 255
% change − 2.4 − 3.0 3.7 4.3
Federal transfers 14 841 388 15 229 15 325 14 681
% change 6.6 8.6 0.6 − 4.2
Budgetary revenue 62 212 438 62 650 64 489 65 936
% change − 0.4 − 0.4 2.9 2.2
P: Preliminary results for 2009-2010 and forecasts for subsequent years. 1 Excluding the measures provided for in the plan to restore fiscal balance (See Appendix 3 for the impact of the measures on the
government’s financial framework).
2010-2011 Budget C.12 Budget Plan
2.1.1 Own-source revenue excluding government enterprises
Upward adjustments in 2009-2010
Preliminary results for fiscal 2009-2010 show that own-source revenue, excluding the profits of government enterprises, is adjusted upward by $207 million compared with the March 2009 Budget and posts a decline of 2.4% compared with the previous year.
Adjustments to own-source revenue by source
Revenue from personal income tax is revised downward by $705 million, despite the progression of salaries and wages in 2009. This revision reflects essentially the change in income tax payable, which was much lower than expected. In particular, the financial crisis and the recession led to a significant decline in capital gains realized in respect of 2008. This result had recurrent effects in 2009-2010. In addition, tax instalments in respect of 2009, which are based on income tax paid in 2008, have been revised downward.
Contributions to the Health Services Fund are adjusted upward slightly by $50 million, in accordance with the positive adjustment of salaries and wages in 2009.
Revenue from corporate taxes is revised upward by $496 million in 2009-2010. Nevertheless, it showed a decrease of close to 10% compared with the previous year.
⎯ Since the beginning of the year, tax receipts have declined less than was expected.
⎯ The refunds requested by enterprises have continued to put a strain on corporate tax revenue. The accumulation of losses by corporations during the financial crisis and the economic recession enabled them to continue claiming larger refunds in 2009-2010. It should be noted that businesses can claim refunds, particularly by applying losses for the current year against their tax payable for the three previous years. This mechanism contributes to the volatility of this revenue source during a recession.
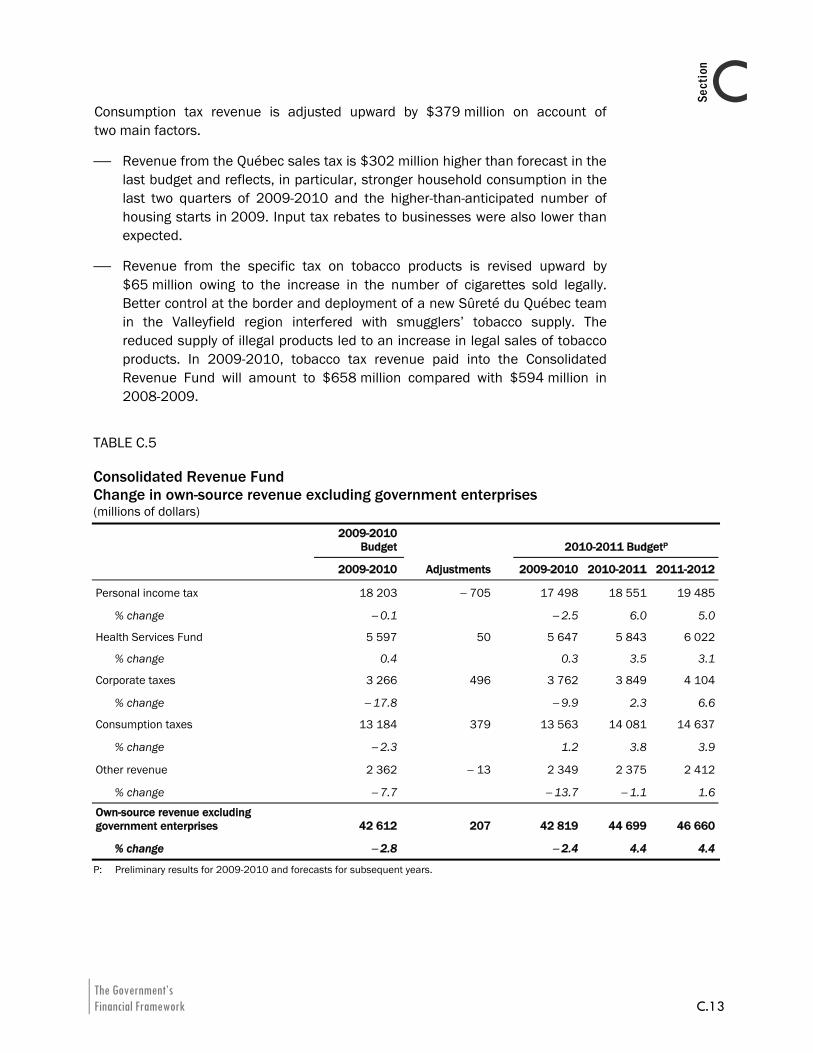
The Government’s Financial Framework C.13
CSection
Consumption tax revenue is adjusted upward by $379 million on account of two main factors.
⎯ Revenue from the Québec sales tax is $302 million higher than forecast in the last budget and reflects, in particular, stronger household consumption in the last two quarters of 2009-2010 and the higher-than-anticipated number of housing starts in 2009. Input tax rebates to businesses were also lower than expected.
⎯ Revenue from the specific tax on tobacco products is revised upward by $65 million owing to the increase in the number of cigarettes sold legally. Better control at the border and deployment of a new Sûreté du Québec team in the Valleyfield region interfered with smugglers’ tobacco supply. The reduced supply of illegal products led to an increase in legal sales of tobacco products. In 2009-2010, tobacco tax revenue paid into the Consolidated Revenue Fund will amount to $658 million compared with $594 million in 2008-2009.
TABLE C.5 Consolidated Revenue Fund Change in own-source revenue excluding government enterprises (millions of dollars)
2009-2010
Budget 2010-2011 BudgetP
2009-2010 Adjustments 2009-2010 2010-2011 2011-2012
Personal income tax 18 203 − 705 17 498 18 551 19 485
% change − 0.1 − 2.5 6.0 5.0
Health Services Fund 5 597 50 5 647 5 843 6 022
% change 0.4 0.3 3.5 3.1
Corporate taxes 3 266 496 3 762 3 849 4 104
% change − 17.8 − 9.9 2.3 6.6
Consumption taxes 13 184 379 13 563 14 081 14 637
% change − 2.3 1.2 3.8 3.9
Other revenue 2 362 − 13 2 349 2 375 2 412
% change − 7.7 − 13.7 − 1.1 1.6
Own-source revenue excluding government enterprises 42 612 207 42 819 44 699 46 660
% change − 2.8 − 2.4 4.4 4.4
P: Preliminary results for 2009-2010 and forecasts for subsequent years.
2010-2011 Budget C.14 Budget Plan
Resumption of growth in own-source revenue in 2010-2011
After posting a decrease of 2.4% in 2009-2010, own-source revenue, excluding that from government enterprises, will increase by 4.4% in 2010-2011, a rate equivalent to economic growth.
⎯ The change in the government’s main tax bases is expected to reflect the growth of 4% in nominal GDP.
In 2011-2012, own-source revenue, excluding that from government enterprises, will grow by 4.4%, a rate equivalent to the increase in nominal GDP, i.e. 4.5%.
Change in revenue by source
Personal income tax, the main source of government revenue, will increase by 6.0% in 2010-2011 to $18.6 billion.
⎯ Excluding the impact of the refundable tax credit for home improvement and renovation, which ended on December 31, 2009, revenue from personal income tax would instead climb by 4.5%, an increase compatible with the growth in personal income, taking into account the progressive nature of the tax system.
In 2011-2012, revenue from personal income tax should increase by 5.0%, while personal income is expected to grow by 3.5%.
⎯ This slightly stronger growth may be attributed, in particular, to the contribution from retirement income. From now on, income subject to tax will increase more rapidly than personal income given the growing share of income from private retirement plans.
Contributions to the Health Services Fund should rise by 3.5% in 2010-2011 and 3.1% in 2011-2012, in accordance with the aniticipated growth in salaries and wages.
After the decline observed in 2008-2009 and 2009-2010, revenue from corporate taxes will show an increase of 2.3% in 2010-2011 and 6.6% in 2011-2012. Essentially, this anticipated growth is due to two factors.
⎯ First, the fact that profits are expected to rise by 14.5% and 8.0% in 2010 and 2011 respectively will lead to a gradual increase in taxable income and corporate tax revenue.
The Government’s Financial Framework C.15
CSection
⎯ In addition, use of the losses accumulated by businesses during the economic slowdown of the past two years and the gradual elimination of the tax on capital, a component of corporate taxes, by January 1, 2011 will continue to offset the growth in revenue from this source.
In 2010-2011 and 2011-2012, revenue from consumption taxes should show an increase of 3.8% and 3.9% respectively, a growth rate comparable with that of household consumption.
Change in revenue compatible with that of the economy
Overall, growth in own-source revenue, excluding government enterprises, is expected to be compatible with nominal economic growth for the next two years, leaving aside the financial impact of fiscal measures. As indicated earlier, the measures provided for in the plan to restore fiscal balance have not been incorporated into own-source revenue in this section.
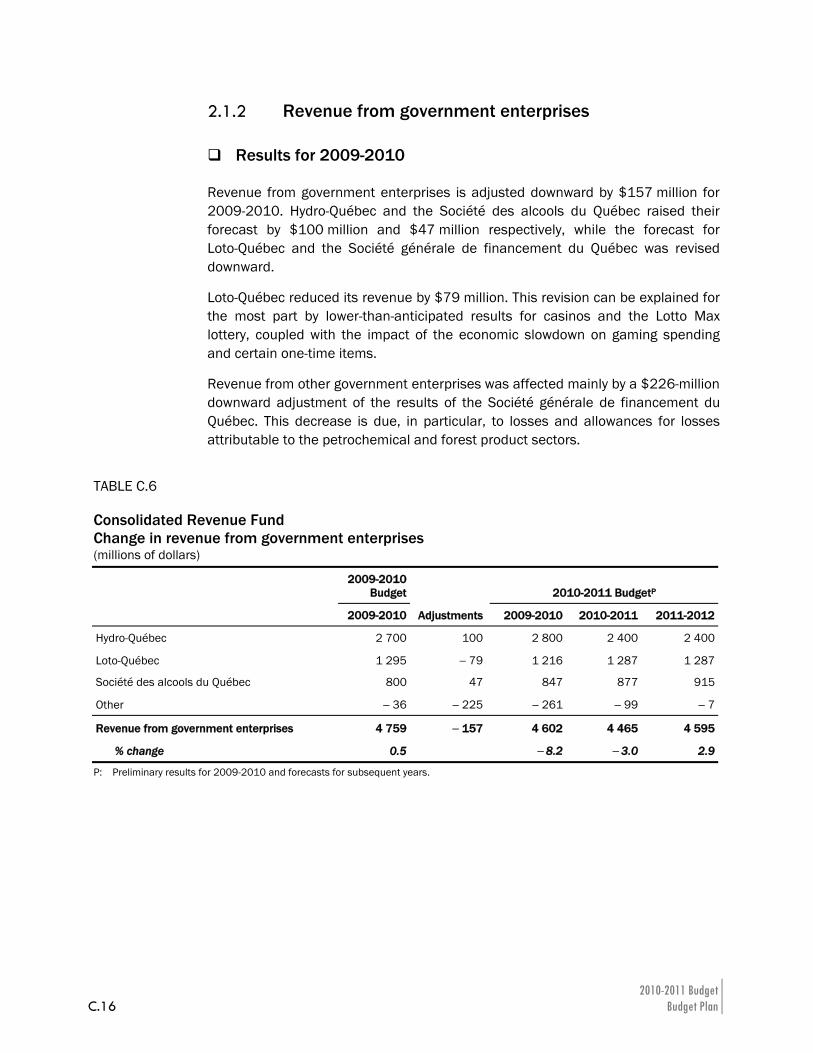
2010-2011 Budget C.16 Budget Plan
2.1.2 Revenue from government enterprises
Results for 2009-2010
Revenue from government enterprises is adjusted downward by $157 million for 2009-2010. Hydro-Québec and the Société des alcools du Québec raised their forecast by $100 million and $47 million respectively, while the forecast for Loto-Québec and the Société générale de financement du Québec was revised downward.
Loto-Québec reduced its revenue by $79 million. This revision can be explained for the most part by lower-than-anticipated results for casinos and the Lotto Max lottery, coupled with the impact of the economic slowdown on gaming spending and certain one-time items.
Revenue from other government enterprises was affected mainly by a $226-million downward adjustment of the results of the Société générale de financement du Québec. This decrease is due, in particular, to losses and allowances for losses attributable to the petrochemical and forest product sectors.
TABLE C.6 Consolidated Revenue Fund Change in revenue from government enterprises (millions of dollars)
2009-2010
Budget 2010-2011 BudgetP
2009-2010 Adjustments 2009-2010 2010-2011 2011-2012
Hydro-Québec 2 700 100 2 800 2 400 2 400
Loto-Québec 1 295 − 79 1 216 1 287 1 287
Société des alcools du Québec 800 47 847 877 915
Other − 36 − 225 − 261 − 99 − 7
Revenue from government enterprises 4 759 − 157 4 602 4 465 4 595
% change 0.5 − 8.2 − 3.0 2.9
P: Preliminary results for 2009-2010 and forecasts for subsequent years.
The Government’s Financial Framework C.17
CSection
Outlook for 2010-2011 and 2011-2012
Revenue from government enterprises for 2010-2011 and 2011-2012 will amount to $4.5 billion and $4.6 billion respectively.
The anticipated $2.4-billion reduction in Hydro-Québec revenues over the next two years, in accordance with its strategic plan tabled in summer 2009, will be partly offset by growth in the revenue of the Société des alcools du Québec and Loto-Québec.
Application of new capital expenditure accounting standards by Hydro-Québec
As of January 1, 2011, entities subject to public accountability and government enterprises will have to apply the new International Financial Reporting Standards (IFRS).
To prepare for the compulsory replacement of generally accepted accounting principles with IFRS in 2011, Hydro-Québec has employed the straight-line method of depreciation since January 1, 2010, because the compound interest method of depreciation at a rate of 3% is not a recognized method under IFRS. Hydro-Québec has applied this new depreciation method retrospectively with restatement of prior fiscal years for assets related to unregulated activities, including those of Hydro-Québec Production.
This accounting change has had an impact on Hydro-Québec’s financial position as at January 1, 2010, in the form of a roughly $3.8-billion decrease in tangible fixed assets and retained earnings. It has also substantially increased the annual amortization expense. In 2010, this expense will climb by close to $150 million for Hydro-Québec Production.
2010-2011 Budget C.18 Budget Plan
2.1.3 Revenues from federal transfers
In 2009-2010, federal transfer revenues should reach $15.2 billion, or $388 million more than forecast in the March 2009 Budget. This revision stems essentially from the signing of new agreements between the federal government and the Québec government, particularly:
⎯ the Canada-Québec Labour Market Agreement, announced on April 30, 2009, which results in a roughly $700-million increase in transfer revenues over six years, i.e. $116 million per year as of 2008-2009;
⎯ the Canada-Québec Base Fund Agreement on infrastructure (Building Canada) announced on May 22, 2009, which generates additional revenues of $175 million over two years, i.e. $100 million in 2009-2010 and $75 million in 2010-2011.
For 2010-2011 and 2011-2012, federal transfer revenues are expected to amount to $15.3 billion and $14.7 billion.
TABLE C.7 Consolidated Revenue Fund Change in federal transfers (millions of dollars)
2009-2010
Budget 2010-2011 BudgetP
2009-2010 Adjustments 2009-2010 2010-2011 2011-2012
Equalization 8 355 ⎯ 8 355 8 552 7 888
% change 4.1 4.1 2.4 − 7.8
Health transfers 4 137 11 4 148 4 264 4 504
% change 10.6 10.9 2.8 5.6
Transfers for post-secondary education and other social programs 1 413 48 1 461 1 432 1 452
% change 11.5 15.3 − 2.0 1.4
Other programs 936 329 1 265 1 077 837
% change 5.4 28.0 − 14.9 − 22.3
Federal transfers 14 841 388 15 229 15 325 14 681
% change 6.6 8.6 0.6 − 4.2
P: Preliminary results for 2009-2010 and forecasts for subsequent years.
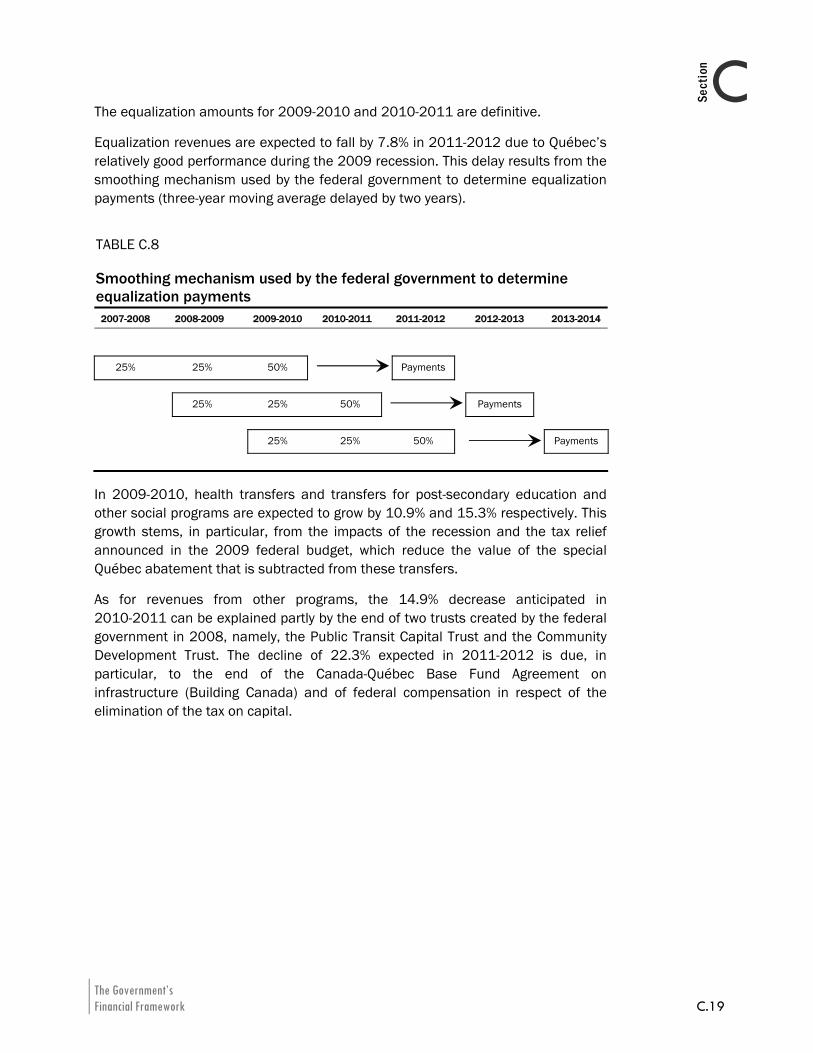
The Government’s Financial Framework C.19
CSection
The equalization amounts for 2009-2010 and 2010-2011 are definitive.
Equalization revenues are expected to fall by 7.8% in 2011-2012 due to Québec’s relatively good performance during the 2009 recession. This delay results from the smoothing mechanism used by the federal government to determine equalization payments (three-year moving average delayed by two years).
TABLE C.8 Smoothing mechanism used by the federal government to determine equalization payments
2007-2008 2008-2009 2009-2010 2010-2011 2011-2012 2012-2013 2013-2014
25% 25% 50% Payments
25% 25% 50% Payments
25% 25% 50% Payments
In 2009-2010, health transfers and transfers for post-secondary education and other social programs are expected to grow by 10.9% and 15.3% respectively. This growth stems, in particular, from the impacts of the recession and the tax relief announced in the 2009 federal budget, which reduce the value of the special Québec abatement that is subtracted from these transfers.
As for revenues from other programs, the 14.9% decrease anticipated in 2010-2011 can be explained partly by the end of two trusts created by the federal government in 2008, namely, the Public Transit Capital Trust and the Community Development Trust. The decline of 22.3% expected in 2011-2012 is due, in particular, to the end of the Canada-Québec Base Fund Agreement on infrastructure (Building Canada) and of federal compensation in respect of the elimination of the tax on capital.
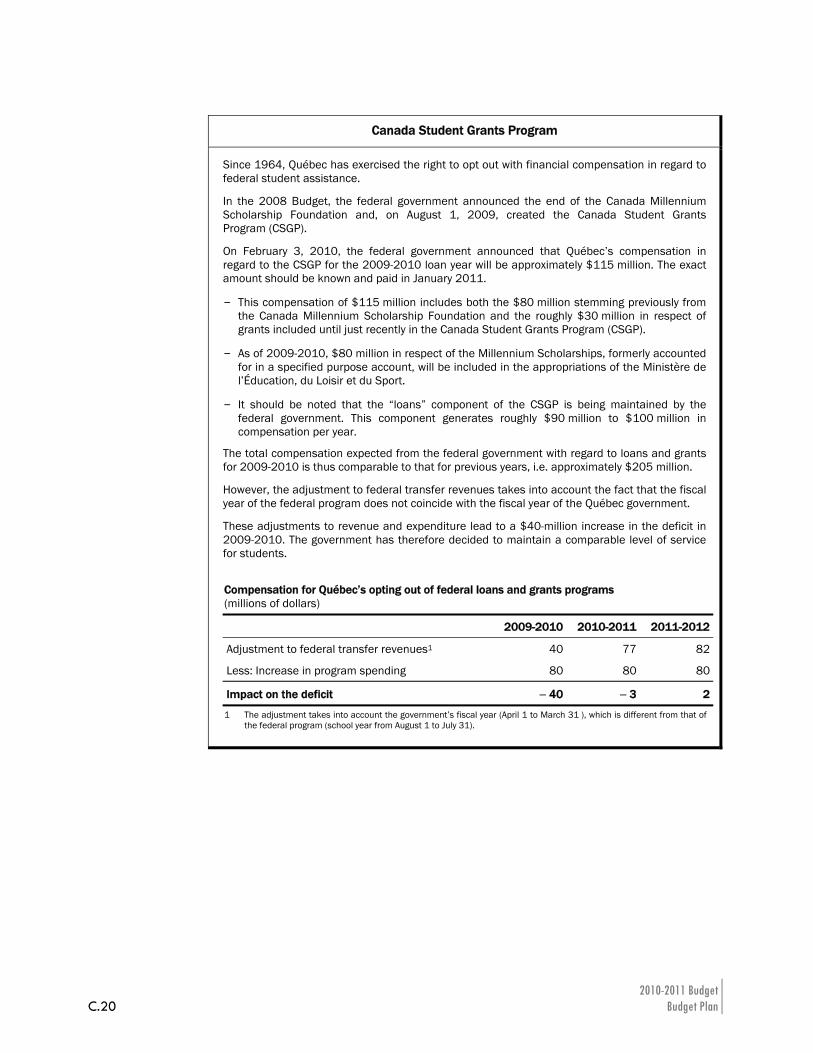
2010-2011 Budget C.20 Budget Plan
Canada Student Grants Program
Since 1964, Québec has exercised the right to opt out with financial compensation in regard to federal student assistance.
In the 2008 Budget, the federal government announced the end of the Canada Millennium Scholarship Foundation and, on August 1, 2009, created the Canada Student Grants Program (CSGP).
On February 3, 2010, the federal government announced that Québec’s compensation in regard to the CSGP for the 2009-2010 loan year will be approximately $115 million. The exact amount should be known and paid in January 2011.
– This compensation of $115 million includes both the $80 million stemming previously from the Canada Millennium Scholarship Foundation and the roughly $30 million in respect of grants included until just recently in the Canada Student Grants Program (CSGP).
– As of 2009-2010, $80 million in respect of the Millennium Scholarships, formerly accounted for in a specified purpose account, will be included in the appropriations of the Ministère de l’Éducation, du Loisir et du Sport.
– It should be noted that the “loans” component of the CSGP is being maintained by the federal government. This component generates roughly $90 million to $100 million in compensation per year.
The total compensation expected from the federal government with regard to loans and grants for 2009-2010 is thus comparable to that for previous years, i.e. approximately $205 million.
However, the adjustment to federal transfer revenues takes into account the fact that the fiscal year of the federal program does not coincide with the fiscal year of the Québec government.
These adjustments to revenue and expenditure lead to a $40-million increase in the deficit in 2009-2010. The government has therefore decided to maintain a comparable level of service for students.
Compensation for Québec’s opting out of federal loans and grants programs (millions of dollars)
2009-2010 2010-2011 2011-2012
Adjustment to federal transfer revenues1 40 77 82
Less: Increase in program spending 80 80 80
Impact on the deficit − 40 − 3 2
1 The adjustment takes into account the government’s fiscal year (April 1 to March 31 ), which is different from that of the federal program (school year from August 1 to July 31).
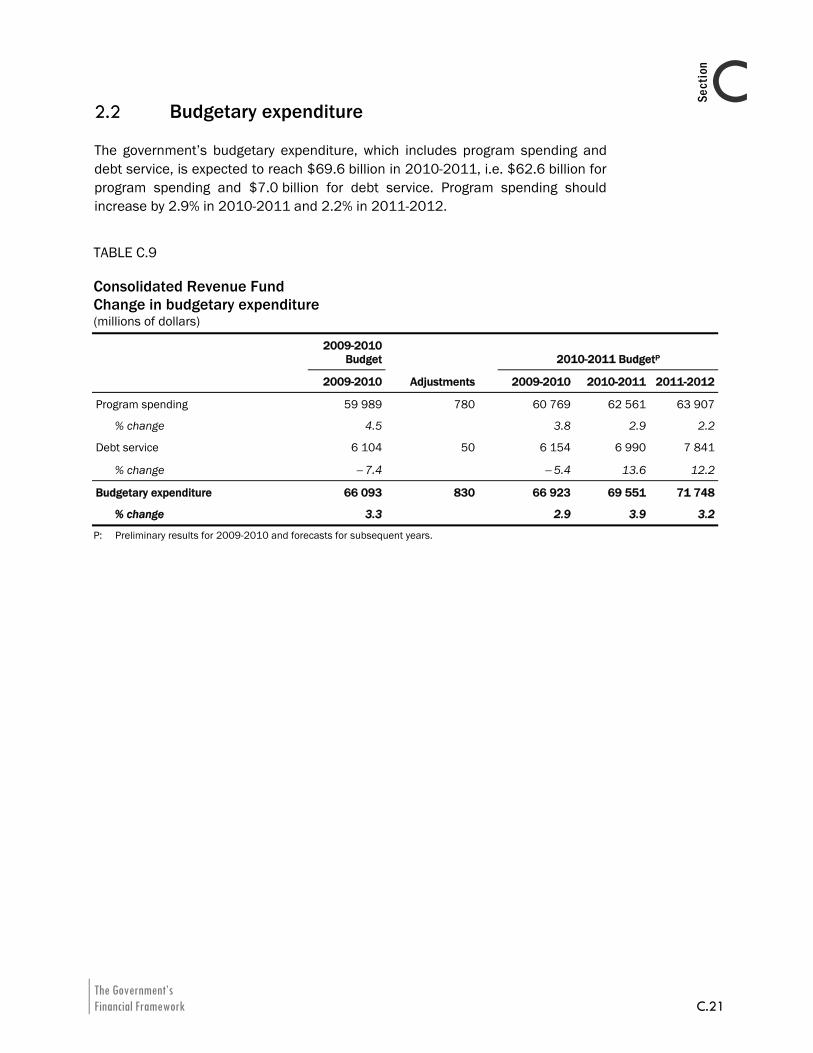
The Government’s Financial Framework C.21
CSection
2.2 Budgetary expenditure
The government’s budgetary expenditure, which includes program spending and debt service, is expected to reach $69.6 billion in 2010-2011, i.e. $62.6 billion for program spending and $7.0 billion for debt service. Program spending should increase by 2.9% in 2010-2011 and 2.2% in 2011-2012.
TABLE C.9 Consolidated Revenue Fund Change in budgetary expenditure (millions of dollars)
2009-2010
Budget 2010-2011 BudgetP
2009-2010 Adjustments 2009-2010 2010-2011 2011-2012
Program spending 59 989 780 60 769 62 561 63 907
% change 4.5 3.8 2.9 2.2
Debt service 6 104 50 6 154 6 990 7 841
% change − 7.4 − 5.4 13.6 12.2
Budgetary expenditure 66 093 830 66 923 69 551 71 748
% change 3.3 2.9 3.9 3.2
P: Preliminary results for 2009-2010 and forecasts for subsequent years.
2010-2011 Budget C.22 Budget Plan
2.2.1 Adjustments to program spending
2009-2010
Program spending in 2009-2010 stands at $60.8 billion, an increase of 3.8% compared with 2008-2009. This represents an upward revision of $780 million relative to the target of $60.0 billion.
This adjustment can be explained mainly by:
⎯ the $380-million increase in the government’s contribution for La Financière agricole du Québec;
⎯ the cost of $126 million attributable to spending in respect of the A (H1N1) flu pandemic;
⎯ the $150-million impact of the enhancement of the Renfort program from $1.2 billion to $2.0 billion in order to assist Québec companies facing liquidity problems;
⎯ the $80 million in compensation from the federal government under its student loans and grants programs, in place of the Millennium Scholarship Program.
2010-2011 and subsequent years
Growth in program spending for 2010-2011 will be 2.9%, or less than the rate of 3.2% initially defined in the plan to restore fiscal balance.
The program spending objective for 2010-2011 is raised by $682 million and incorporates, in particular:
⎯ $317 million associated mainly with the recurrence of the 2009-2010 adjustments, including $325 million for the increase in the government’s contribution to La Financière agricole du Québec;
⎯ $195 million for all the spending measures announced in this budget;
⎯ $170 million for the recurrence of the Renfort program and the additional resources to fight tax evasion and avoidance announced in the Update on Québec's Economic and Financial Situation.
As of 2011-2012, program spending growth will be rolled back to 2.2% so as to restore fiscal balance.
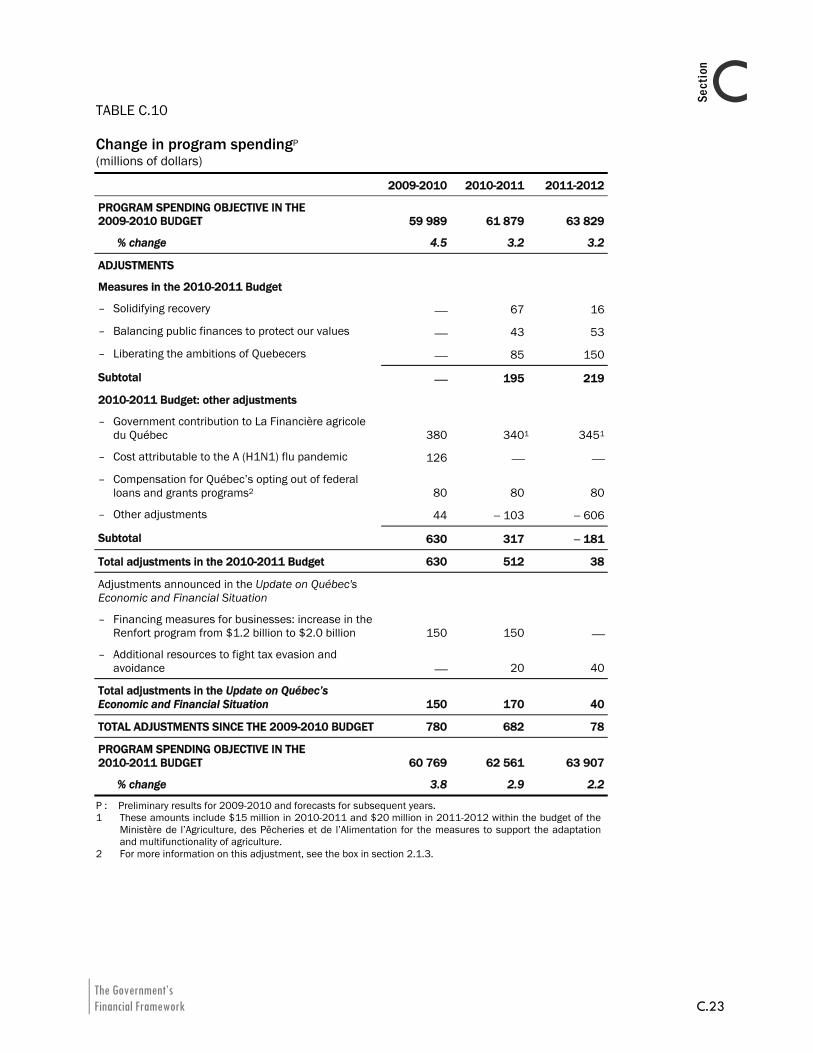
The Government’s Financial Framework C.23
CSection
TABLE C.10 Change in program spendingP (millions of dollars)
2009-2010 2010-2011 2011-2012
PROGRAM SPENDING OBJECTIVE IN THE 2009-2010 BUDGET 59 989 61 879 63 829
% change 4.5 3.2 3.2
ADJUSTMENTS
Measures in the 2010-2011 Budget
– Solidifying recovery ⎯ 67 16
– Balancing public finances to protect our values ⎯ 43 53
– Liberating the ambitions of Quebecers ⎯ 85 150
Subtotal ⎯ 195 219
2010-2011 Budget: other adjustments
– Government contribution to La Financière agricole du Québec 380 3401 3451
– Cost attributable to the A (H1N1) flu pandemic 126 ⎯ ⎯
– Compensation for Québec’s opting out of federal loans and grants programs2 80 80 80
– Other adjustments 44 − 103 − 606
Subtotal 630 317 − 181
Total adjustments in the 2010-2011 Budget 630 512 38
Adjustments announced in the Update on Québec's Economic and Financial Situation
– Financing measures for businesses: increase in the Renfort program from $1.2 billion to $2.0 billion 150 150 ⎯
– Additional resources to fight tax evasion and avoidance ⎯ 20 40
Total adjustments in the Update on Québec’s Economic and Financial Situation 150 170 40
TOTAL ADJUSTMENTS SINCE THE 2009-2010 BUDGET 780 682 78
PROGRAM SPENDING OBJECTIVE IN THE 2010-2011 BUDGET 60 769 62 561 63 907
% change 3.8 2.9 2.2
P : Preliminary results for 2009-2010 and forecasts for subsequent years. 1 These amounts include $15 million in 2010-2011 and $20 million in 2011-2012 within the budget of the
Ministère de l’Agriculture, des Pêcheries et de l’Alimentation for the measures to support the adaptation and multifunctionality of agriculture.
2 For more information on this adjustment, see the box in section 2.1.3.
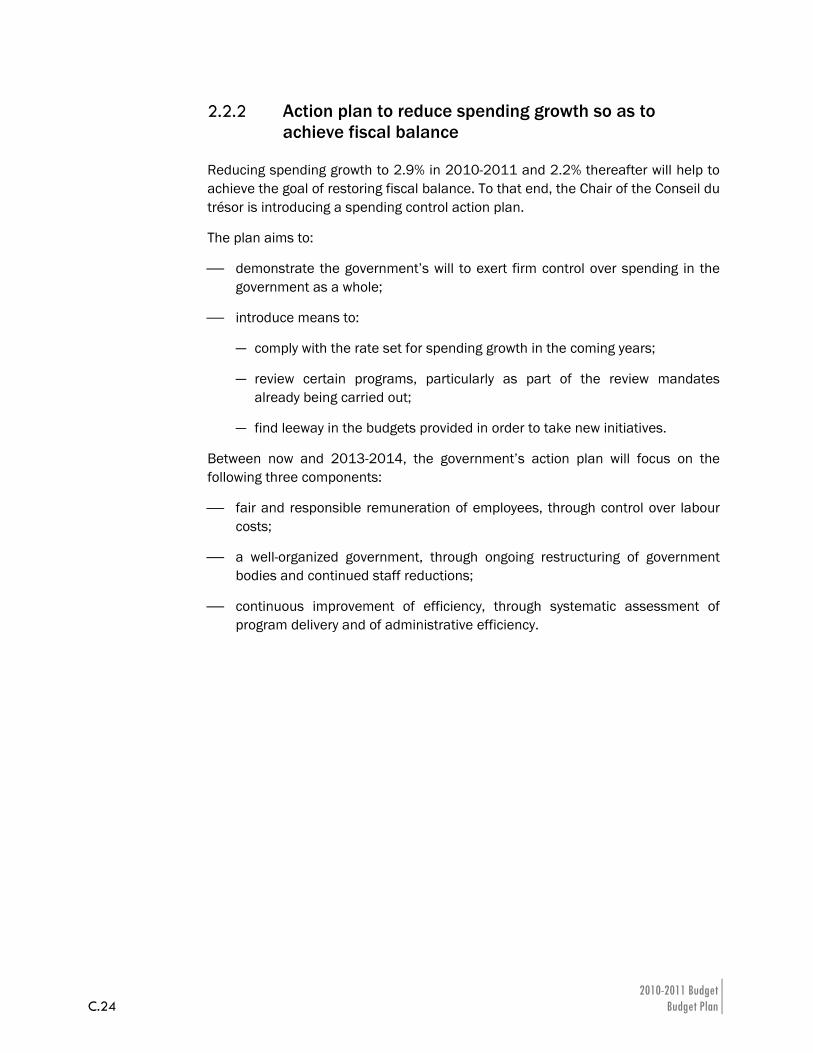
2010-2011 Budget C.24 Budget Plan
2.2.2 Action plan to reduce spending growth so as to achieve fiscal balance
Reducing spending growth to 2.9% in 2010-2011 and 2.2% thereafter will help to achieve the goal of restoring fiscal balance. To that end, the Chair of the Conseil du trésor is introducing a spending control action plan.
The plan aims to:
⎯ demonstrate the government’s will to exert firm control over spending in the government as a whole;
⎯ introduce means to:
— comply with the rate set for spending growth in the coming years;
— review certain programs, particularly as part of the review mandates already being carried out;
— find leeway in the budgets provided in order to take new initiatives.
Between now and 2013-2014, the government’s action plan will focus on the following three components:
⎯ fair and responsible remuneration of employees, through control over labour costs;
⎯ a well-organized government, through ongoing restructuring of government bodies and continued staff reductions;
⎯ continuous improvement of efficiency, through systematic assessment of program delivery and of administrative efficiency.
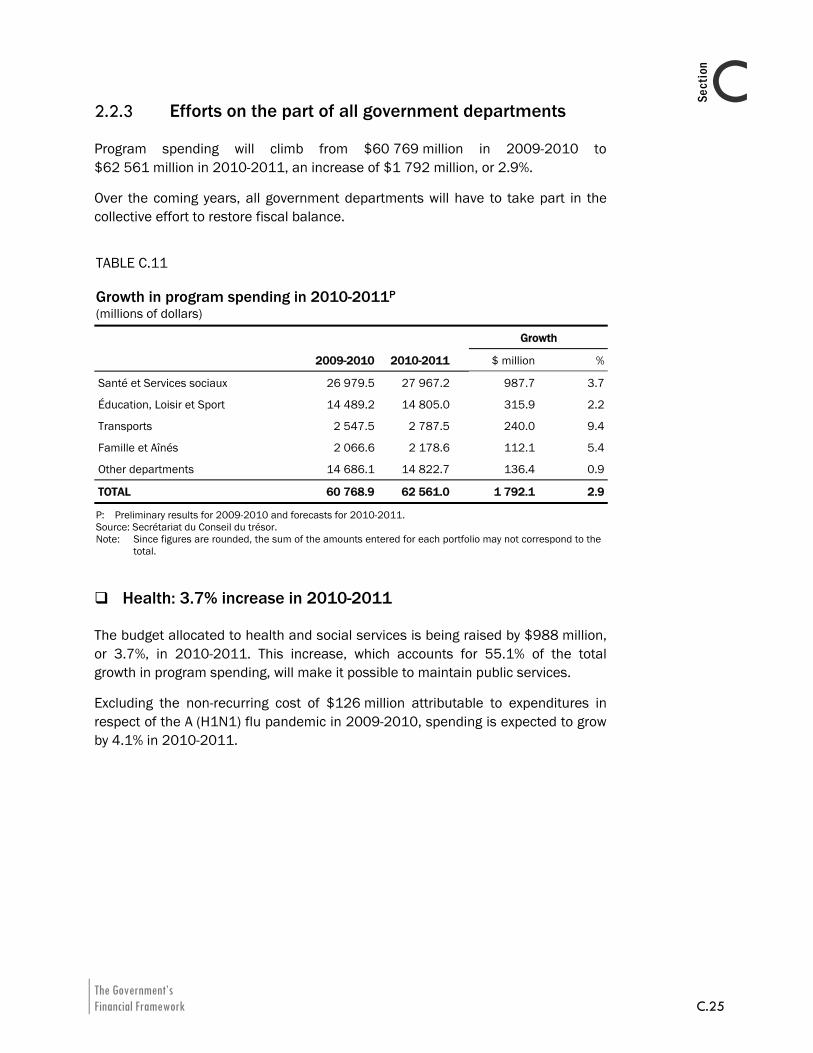
The Government’s Financial Framework C.25
CSection
2.2.3 Efforts on the part of all government departments
Program spending will climb from $60 769 million in 2009-2010 to $62 561 million in 2010-2011, an increase of $1 792 million, or 2.9%.
Over the coming years, all government departments will have to take part in the collective effort to restore fiscal balance.
TABLE C.11 Growth in program spending in 2010-2011P (millions of dollars)
Growth
2009-2010 2010-2011 $ million %
Santé et Services sociaux 26 979.5 27 967.2 987.7 3.7
Éducation, Loisir et Sport 14 489.2 14 805.0 315.9 2.2
Transports 2 547.5 2 787.5 240.0 9.4
Famille et Aînés 2 066.6 2 178.6 112.1 5.4
Other departments 14 686.1 14 822.7 136.4 0.9
TOTAL 60 768.9 62 561.0 1 792.1 2.9
P: Preliminary results for 2009-2010 and forecasts for 2010-2011. Source: Secrétariat du Conseil du trésor. Note: Since figures are rounded, the sum of the amounts entered for each portfolio may not correspond to the
total.
Health: 3.7% increase in 2010-2011
The budget allocated to health and social services is being raised by $988 million, or 3.7%, in 2010-2011. This increase, which accounts for 55.1% of the total growth in program spending, will make it possible to maintain public services.
Excluding the non-recurring cost of $126 million attributable to expenditures in respect of the A (H1N1) flu pandemic in 2009-2010, spending is expected to grow by 4.1% in 2010-2011.
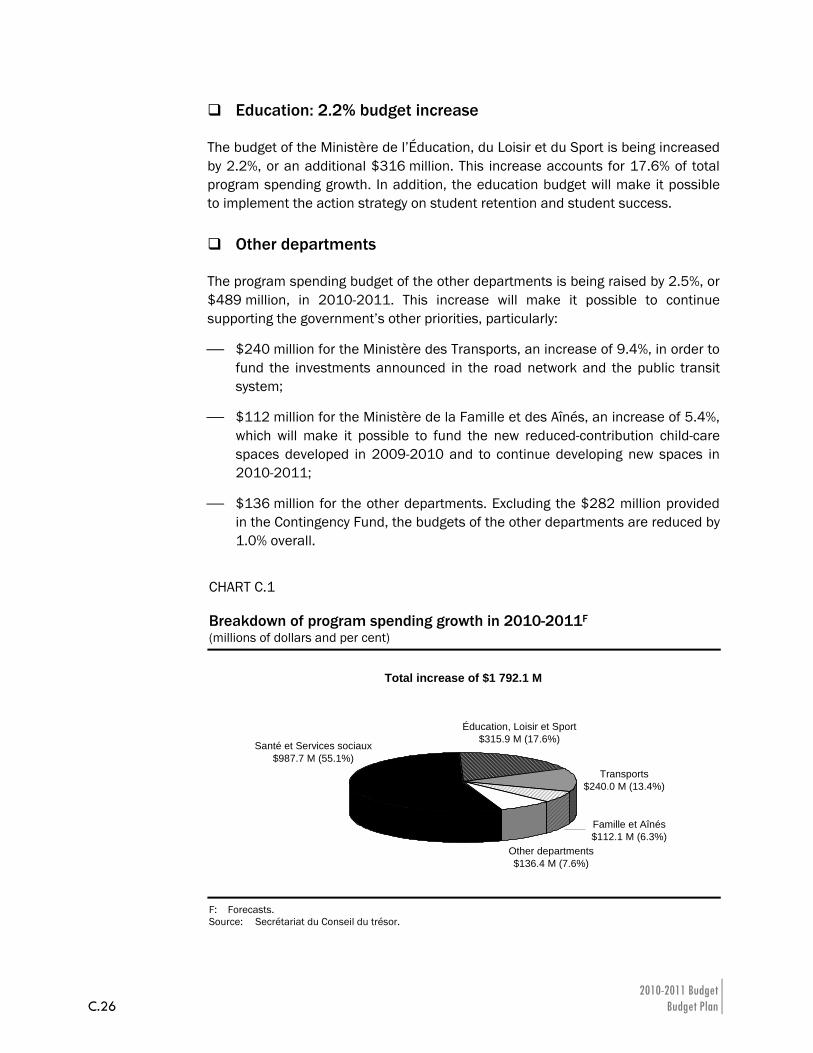
2010-2011 Budget C.26 Budget Plan
Education: 2.2% budget increase
The budget of the Ministère de l’Éducation, du Loisir et du Sport is being increased by 2.2%, or an additional $316 million. This increase accounts for 17.6% of total program spending growth. In addition, the education budget will make it possible to implement the action strategy on student retention and student success.
Other departments
The program spending budget of the other departments is being raised by 2.5%, or $489 million, in 2010-2011. This increase will make it possible to continue supporting the government’s other priorities, particularly:
⎯ $240 million for the Ministère des Transports, an increase of 9.4%, in order to fund the investments announced in the road network and the public transit system;
⎯ $112 million for the Ministère de la Famille et des Aînés, an increase of 5.4%, which will make it possible to fund the new reduced-contribution child-care spaces developed in 2009-2010 and to continue developing new spaces in 2010-2011;
⎯ $136 million for the other departments. Excluding the $282 million provided in the Contingency Fund, the budgets of the other departments are reduced by 1.0% overall.
CHART C.1 Breakdown of program spending growth in 2010-2011F (millions of dollars and per cent)
Total increase of $1 792.1 M
Other departments$136.4 M (7.6%)
Santé et Services sociaux$987.7 M (55.1%)
Éducation, Loisir et Sport$315.9 M (17.6%)
Famille et Aînés$112.1 M (6.3%)
Transports$240.0 M (13.4%)
F: Forecasts. Source: Secrétariat du Conseil du trésor.
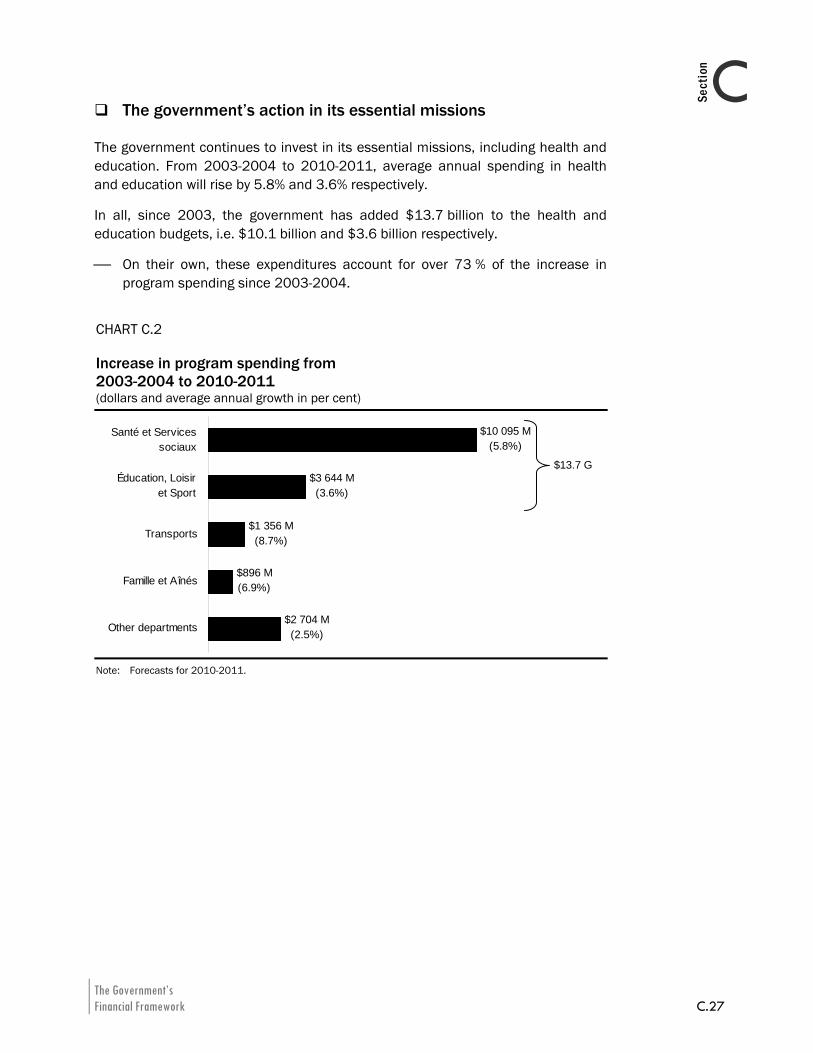
The Government’s Financial Framework C.27
CSection
The government’s action in its essential missions
The government continues to invest in its essential missions, including health and education. From 2003-2004 to 2010-2011, average annual spending in health and education will rise by 5.8% and 3.6% respectively.
In all, since 2003, the government has added $13.7 billion to the health and education budgets, i.e. $10.1 billion and $3.6 billion respectively.
⎯ On their own, these expenditures account for over 73 % of the increase in program spending since 2003-2004.
CHART C.2 Increase in program spending from 2003-2004 to 2010-2011 (dollars and average annual growth in per cent)
$10 095 M(5.8%)
$3 644 M(3.6%)
$1 356 M(8.7%)
$896 M(6.9%)
$2 704 M(2.5%)Other departments
Famille et Aînés
Transports
Éducation, Loisir etSport
Santé et Servicessociaux
$13.7 G
Santé et Servicessociaux
Éducation, Loisiret Sport
Note: Forecasts for 2010-2011.
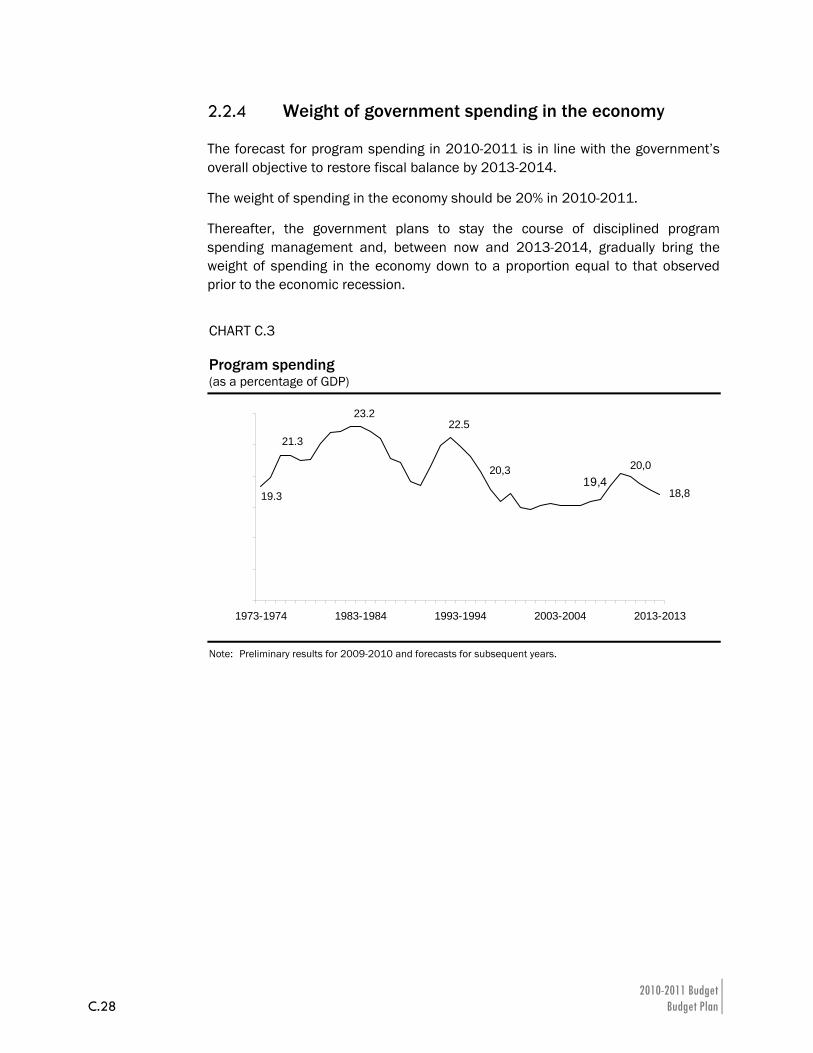
2010-2011 Budget C.28 Budget Plan
2.2.4 Weight of government spending in the economy
The forecast for program spending in 2010-2011 is in line with the government’s overall objective to restore fiscal balance by 2013-2014.
The weight of spending in the economy should be 20% in 2010-2011.
Thereafter, the government plans to stay the course of disciplined program spending management and, between now and 2013-2014, gradually bring the weight of spending in the economy down to a proportion equal to that observed prior to the economic recession.
CHART C.3 Program spending (as a percentage of GDP)
18,8
22.523.2
19,420,3
19.3
21.3
20,0
1973-1974 1983-1984 1993-1994 2003-2004 2013-2013
Note: Preliminary results for 2009-2010 and forecasts for subsequent years.
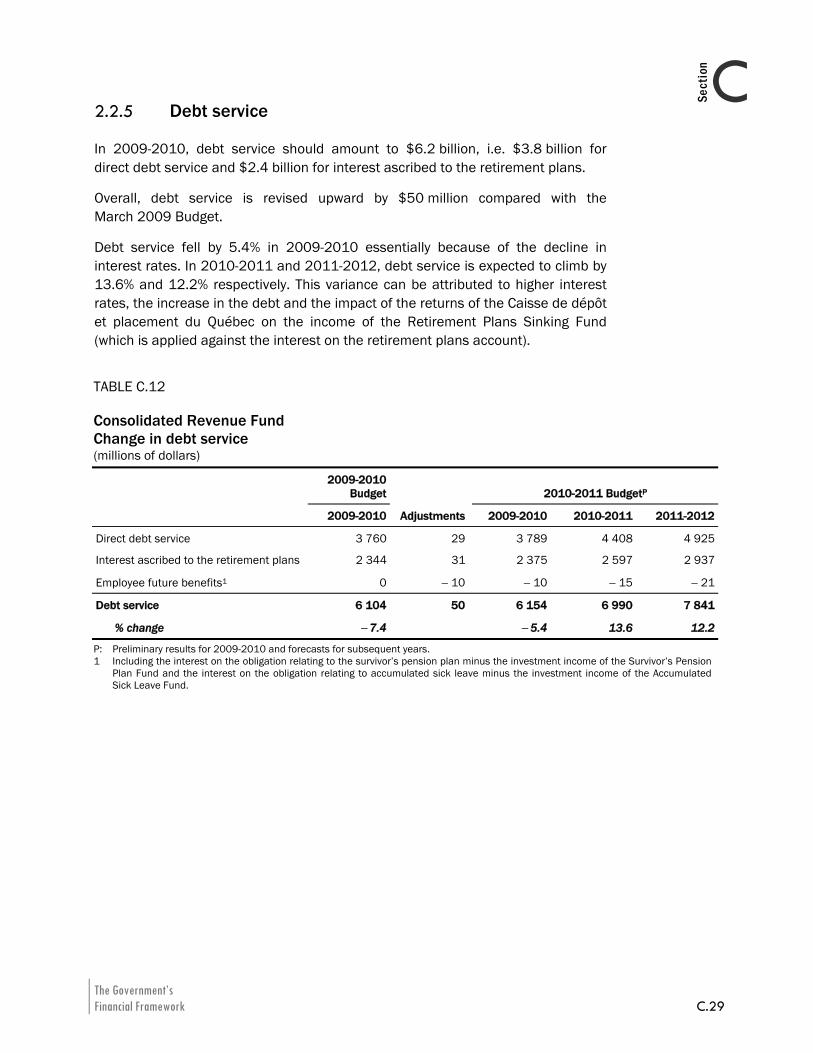
The Government’s Financial Framework C.29
CSection
2.2.5 Debt service
In 2009-2010, debt service should amount to $6.2 billion, i.e. $3.8 billion for direct debt service and $2.4 billion for interest ascribed to the retirement plans.
Overall, debt service is revised upward by $50 million compared with the March 2009 Budget.
Debt service fell by 5.4% in 2009-2010 essentially because of the decline in interest rates. In 2010-2011 and 2011-2012, debt service is expected to climb by 13.6% and 12.2% respectively. This variance can be attributed to higher interest rates, the increase in the debt and the impact of the returns of the Caisse de dépôt et placement du Québec on the income of the Retirement Plans Sinking Fund (which is applied against the interest on the retirement plans account).
TABLE C.12 Consolidated Revenue Fund Change in debt service (millions of dollars)
2009-2010
Budget 2010-2011 BudgetP
2009-2010 Adjustments 2009-2010 2010-2011 2011-2012
Direct debt service 3 760 29 3 789 4 408 4 925
Interest ascribed to the retirement plans 2 344 31 2 375 2 597 2 937
Employee future benefits1 0 − 10 − 10 − 15 − 21
Debt service 6 104 50 6 154 6 990 7 841
% change − 7.4 − 5.4 13.6 12.2
P: Preliminary results for 2009-2010 and forecasts for subsequent years. 1 Including the interest on the obligation relating to the survivor’s pension plan minus the investment income of the Survivor’s Pension
Plan Fund and the interest on the obligation relating to accumulated sick leave minus the investment income of the Accumulated Sick Leave Fund.
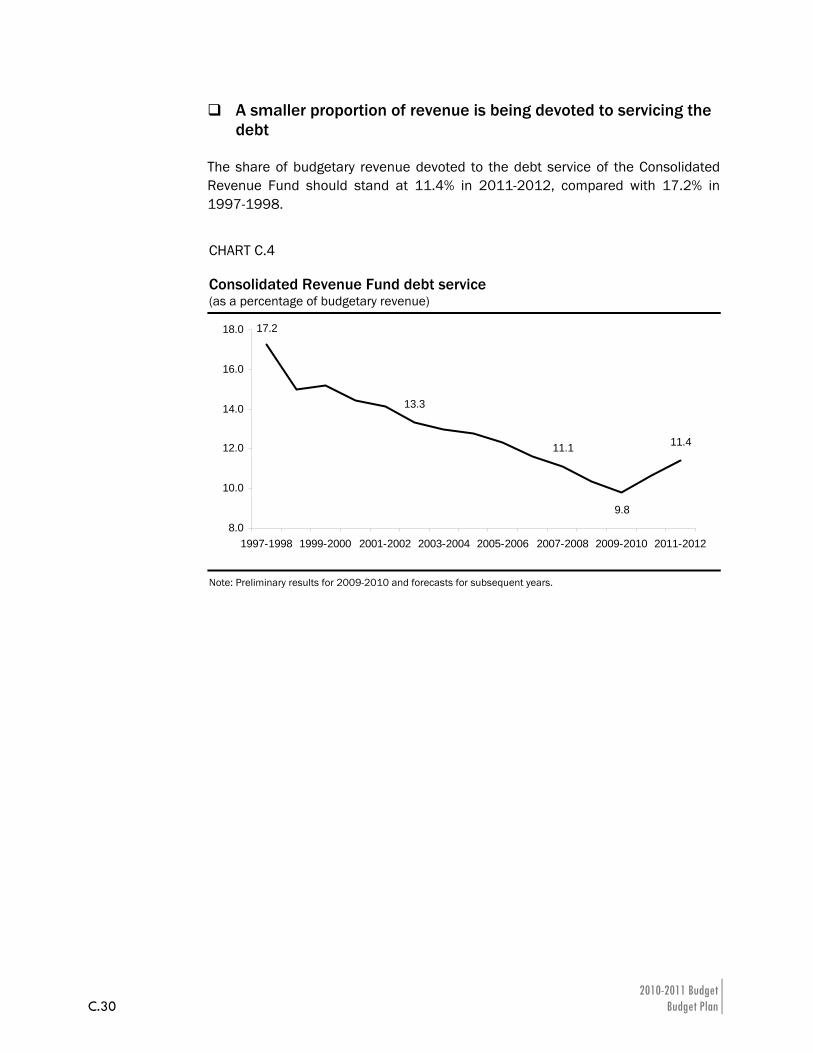
2010-2011 Budget C.30 Budget Plan
A smaller proportion of revenue is being devoted to servicing the debt
The share of budgetary revenue devoted to the debt service of the Consolidated Revenue Fund should stand at 11.4% in 2011-2012, compared with 17.2% in 1997-1998.
CHART C.4 Consolidated Revenue Fund debt service (as a percentage of budgetary revenue)
Note: Preliminary results for 2009-2010 and forecasts for subsequent years.
17.2
13.3
11.1 11.4
9.88.0
10.0
12.0
14.0
16.0
18.0
1997-1998 1999-2000 2001-2002 2003-2004 2005-2006 2007-2008 2009-2010 2011-2012
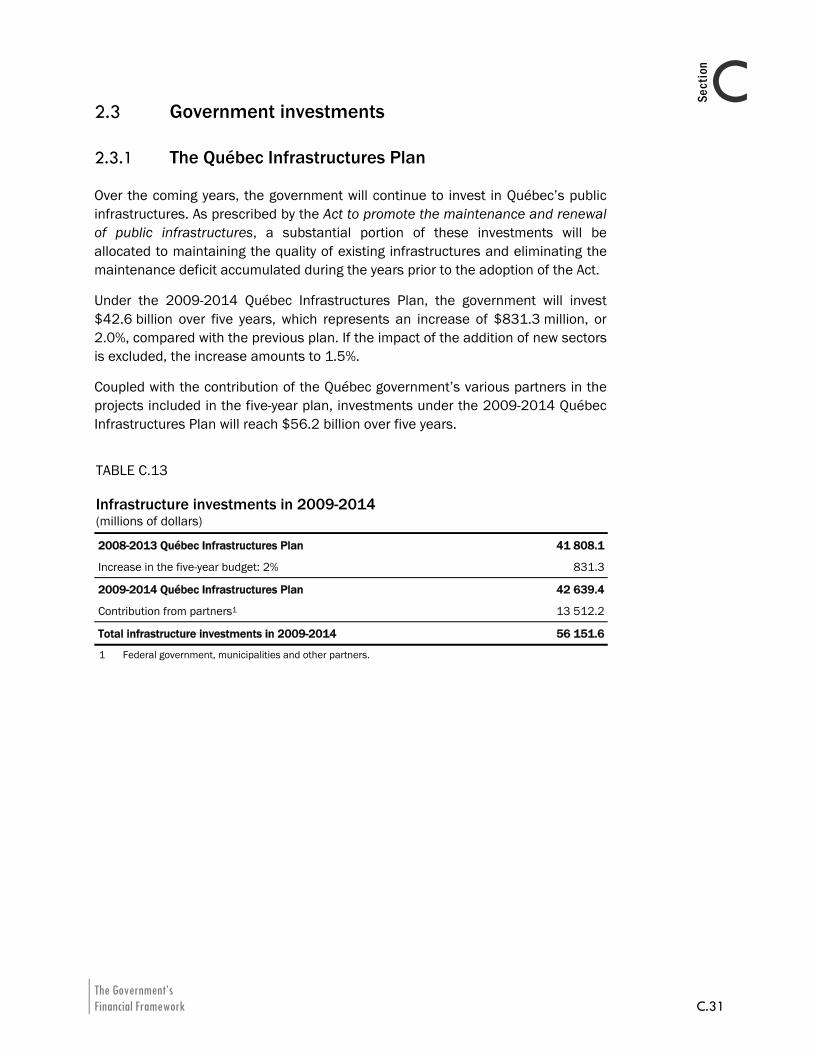
The Government’s Financial Framework C.31
CSection
2.3 Government investments
2.3.1 The Québec Infrastructures Plan
Over the coming years, the government will continue to invest in Québec’s public infrastructures. As prescribed by the Act to promote the maintenance and renewal of public infrastructures, a substantial portion of these investments will be allocated to maintaining the quality of existing infrastructures and eliminating the maintenance deficit accumulated during the years prior to the adoption of the Act.
Under the 2009-2014 Québec Infrastructures Plan, the government will invest $42.6 billion over five years, which represents an increase of $831.3 million, or 2.0%, compared with the previous plan. If the impact of the addition of new sectors is excluded, the increase amounts to 1.5%.
Coupled with the contribution of the Québec government’s various partners in the projects included in the five-year plan, investments under the 2009-2014 Québec Infrastructures Plan will reach $56.2 billion over five years.
TABLE C.13 Infrastructure investments in 2009-2014 (millions of dollars)
2008-2013 Québec Infrastructures Plan 41 808.1
Increase in the five-year budget: 2% 831.3
2009-2014 Québec Infrastructures Plan 42 639.4
Contribution from partners1 13 512.2
Total infrastructure investments in 2009-2014 56 151.6
1 Federal government, municipalities and other partners.
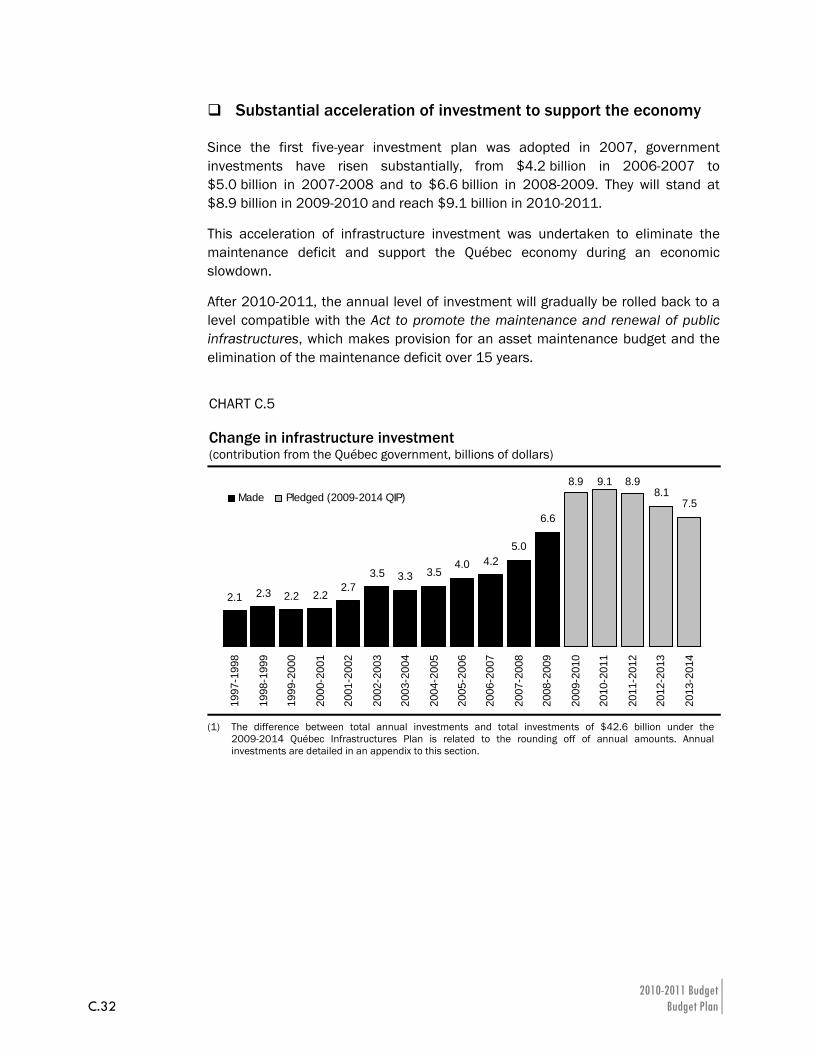
2010-2011 Budget C.32 Budget Plan
Substantial acceleration of investment to support the economy
Since the first five-year investment plan was adopted in 2007, government investments have risen substantially, from $4.2 billion in 2006-2007 to $5.0 billion in 2007-2008 and to $6.6 billion in 2008-2009. They will stand at $8.9 billion in 2009-2010 and reach $9.1 billion in 2010-2011.
This acceleration of infrastructure investment was undertaken to eliminate the maintenance deficit and support the Québec economy during an economic slowdown.
After 2010-2011, the annual level of investment will gradually be rolled back to a level compatible with the Act to promote the maintenance and renewal of public infrastructures, which makes provision for an asset maintenance budget and the elimination of the maintenance deficit over 15 years.
CHART C.5 Change in infrastructure investment (contribution from the Québec government, billions of dollars)
2.1 2.3 2.2 2.22.7
3.5 3.3 3.54.0 4.2
5.0
6.6
8.9 9.1 8.98.1
7.5
1997
-199
8
1998
-199
9
1999
-200
0
2000
-200
1
2001
-200
2
2002
-200
3
2003
-200
4
2004
-200
5
2005
-200
6
2006
-200
7
2007
-200
8
2008
-200
9
2009
-201
0
2010
-201
1
2011
-201
2
2012
-201
3
2013
-201
4
Made Pledged (2009-2014 QIP)
(1) The difference between total annual investments and total investments of $42.6 billion under the 2009-2014 Québec Infrastructures Plan is related to the rounding off of annual amounts. Annual investments are detailed in an appendix to this section.
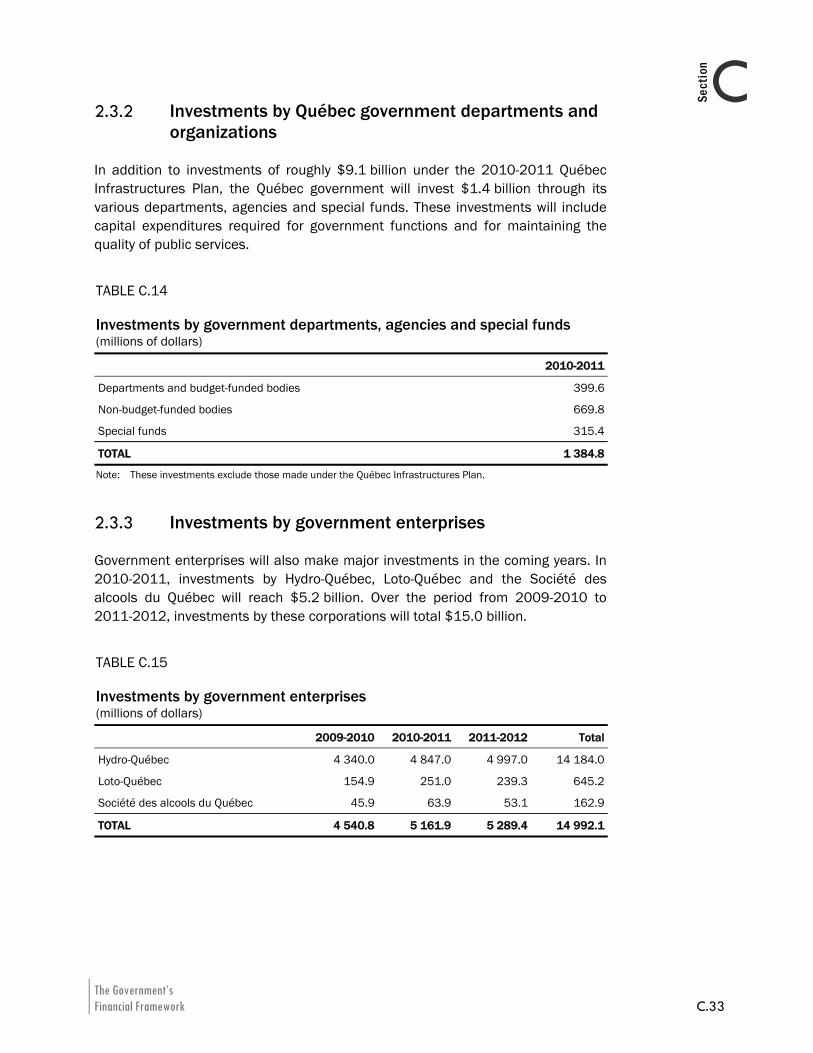
The Government’s Financial Framework C.33
CSection
2.3.2 Investments by Québec government departments and organizations
In addition to investments of roughly $9.1 billion under the 2010-2011 Québec Infrastructures Plan, the Québec government will invest $1.4 billion through its various departments, agencies and special funds. These investments will include capital expenditures required for government functions and for maintaining the quality of public services.
TABLE C.14 Investments by government departments, agencies and special funds (millions of dollars)
2010-2011
Departments and budget-funded bodies 399.6
Non-budget-funded bodies 669.8
Special funds 315.4
TOTAL 1 384.8
Note: These investments exclude those made under the Québec Infrastructures Plan.
2.3.3 Investments by government enterprises
Government enterprises will also make major investments in the coming years. In 2010-2011, investments by Hydro-Québec, Loto-Québec and the Société des alcools du Québec will reach $5.2 billion. Over the period from 2009-2010 to 2011-2012, investments by these corporations will total $15.0 billion.
TABLE C.15 Investments by government enterprises (millions of dollars)
2009-2010 2010-2011 2011-2012 Total
Hydro-Québec 4 340.0 4 847.0 4 997.0 14 184.0
Loto-Québec 154.9 251.0 239.3 645.2
Société des alcools du Québec 45.9 63.9 53.1 162.9
TOTAL 4 540.8 5 161.9 5 289.4 14 992.1
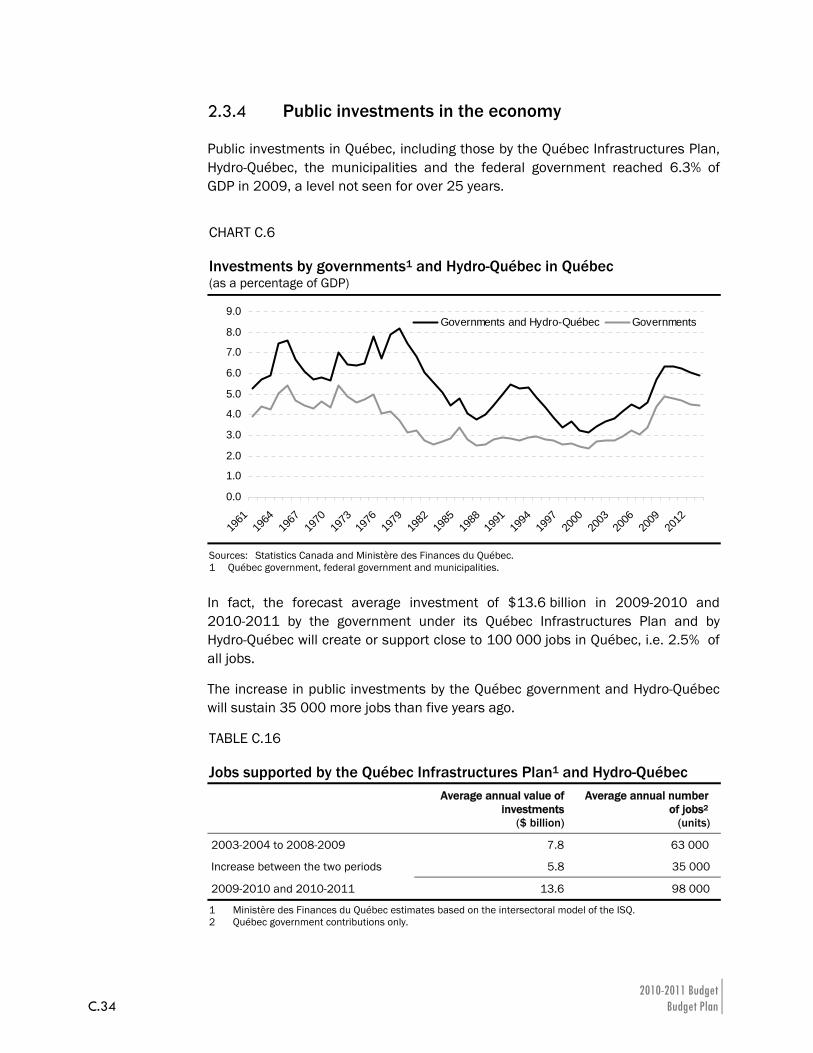
2010-2011 Budget C.34 Budget Plan
2.3.4 Public investments in the economy
Public investments in Québec, including those by the Québec Infrastructures Plan, Hydro-Québec, the municipalities and the federal government reached 6.3% of GDP in 2009, a level not seen for over 25 years.
CHART C.6 Investments by governments1 and Hydro-Québec in Québec (as a percentage of GDP)
0.0
1.0
2.0
3.0
4.0
5.0
6.0
7.0
8.0
9.0
1961
1964
1967
1970
1973
1976
1979
1982
1985
1988
1991
1994
1997
2000
2003
2006
2009
2012
Governments and Hydro-Québec Governments
Sources: Statistics Canada and Ministère des Finances du Québec. 1 Québec government, federal government and municipalities.
In fact, the forecast average investment of $13.6 billion in 2009-2010 and 2010-2011 by the government under its Québec Infrastructures Plan and by Hydro-Québec will create or support close to 100 000 jobs in Québec, i.e. 2.5% of all jobs.
The increase in public investments by the Québec government and Hydro-Québec will sustain 35 000 more jobs than five years ago.
TABLE C.16 Jobs supported by the Québec Infrastructures Plan1 and Hydro-Québec
Average annual value of investments
($ billion)
Average annual number of jobs2
(units)
2003-2004 to 2008-2009 7.8 63 000
Increase between the two periods 5.8 35 000
2009-2010 and 2010-2011 13.6 98 000
1 Ministère des Finances du Québec estimates based on the intersectoral model of the ISQ. 2 Québec government contributions only.
The Government’s Financial Framework C.35
CSection
3. BUDGETARY FORECASTS FOR REVENUE AND CONSOLIDATED EXPENDITURE Starting with the 2010-2011 Budget, the government will present consolidated financial forecasts for revenue and expenditure. Accordingly, the budgetary revenue and expenditure of all the entities in the government’s reporting entity, including the entities in the health and social services and education networks and other government organizations, are being added to the budgetary revenue and expenditure of the Consolidated Revenue Fund. The results for the budgetary balance differ in no way from those shown in the preceding tables. This presentation makes it possible, among other things, to isolate the own-source revenues of consolidated entities and their attendant expenditures.
Consolidated budgetary transactions provide more complete information on the government’s financial projections.
The following table presents the government’s consolidated financial framework for fiscal 2009-2010 to 2011-2012.
Within the meaning of the Balanced Budget Act, the budgetary balance is in deficit by $4.3 billion for 2009-2010. Thereafter, it will be in deficit by $4.5 billion in 2010-2011 and $2.9 billion in 2011-2012.
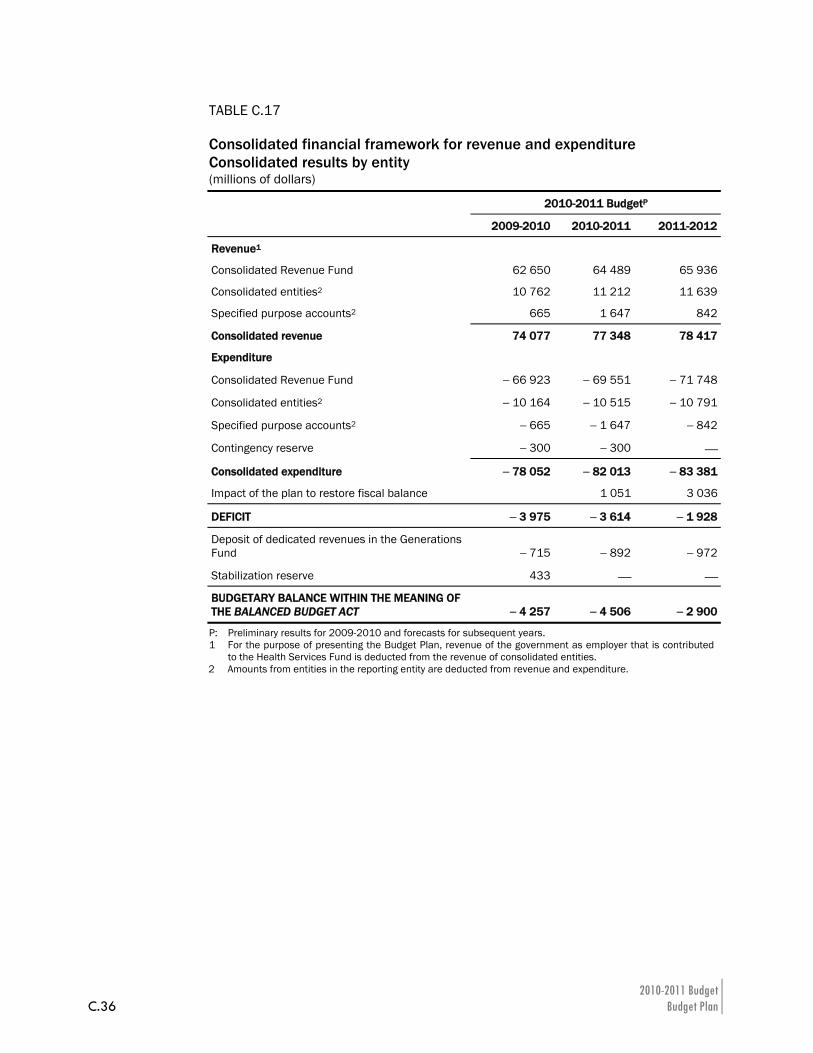
2010-2011 Budget C.36 Budget Plan
TABLE C.17 Consolidated financial framework for revenue and expenditure Consolidated results by entity (millions of dollars)
2010-2011 BudgetP
2009-2010 2010-2011 2011-2012
Revenue1
Consolidated Revenue Fund 62 650 64 489 65 936
Consolidated entities2 10 762 11 212 11 639
Specified purpose accounts2 665 1 647 842
Consolidated revenue 74 077 77 348 78 417
Expenditure
Consolidated Revenue Fund − 66 923 − 69 551 − 71 748
Consolidated entities2 − 10 164 − 10 515 − 10 791
Specified purpose accounts2 − 665 − 1 647 − 842
Contingency reserve − 300 − 300 ⎯
Consolidated expenditure − 78 052 − 82 013 − 83 381
Impact of the plan to restore fiscal balance 1 051 3 036
DEFICIT − 3 975 − 3 614 − 1 928
Deposit of dedicated revenues in the Generations Fund − 715 − 892 − 972
Stabilization reserve 433 ⎯ ⎯
BUDGETARY BALANCE WITHIN THE MEANING OF THE BALANCED BUDGET ACT − 4 257 − 4 506 − 2 900
P: Preliminary results for 2009-2010 and forecasts for subsequent years. 1 For the purpose of presenting the Budget Plan, revenue of the government as employer that is contributed
to the Health Services Fund is deducted from the revenue of consolidated entities. 2 Amounts from entities in the reporting entity are deducted from revenue and expenditure.
The Government’s Financial Framework C.37
CSection
3.1 Line-by-line consolidation
To ensure the information in the budget documents is better aligned with the presentation in the public accounts, the budget plan will henceforth present all of the consolidated revenues and expenditures of the entities included in the government’s reporting entity.
⎯ Until 2007-2008, the budget plan presented the net results of consolidated organizations, as well as certain summary information on the revenue and expenditure of non-budget-funded bodies and special funds. Those of the Generations Fund and the health and social services and education networks were added in 2008-2009.
⎯ From now on, the revenue and expenditure of all these entities and the specified purpose accounts will be presented separately and added to those of the Consolidated Revenue Fund. This approach, which is called line-by-line consolidation, also requires eliminating transactions between related entities, particularly transfer expenditures from the government that are paid to consolidated entities and the corresponding revenues received by these entities. These transactions are carried out within the government and have no impact on its deficit or annual surplus.
The presentation of the budget documents will thus correspond to that of the public accounts. Starting in fiscal 2009-2010, governments have been asked by the Public Sector Accounting Board (PSAB) of the Canadian Institute of Chartered Accountants (CICA) to consolidate line by line, in their financial statements, all the entities included in their reporting entity, including the transactions of their networks.
This will improve the quality and transparency of the information produced as part of the governent’s budget planning.
Table C.18 presents the main revenue and expenditure categories of the government’s consolidated financial framework for 2009-2010 and 2010-2011.
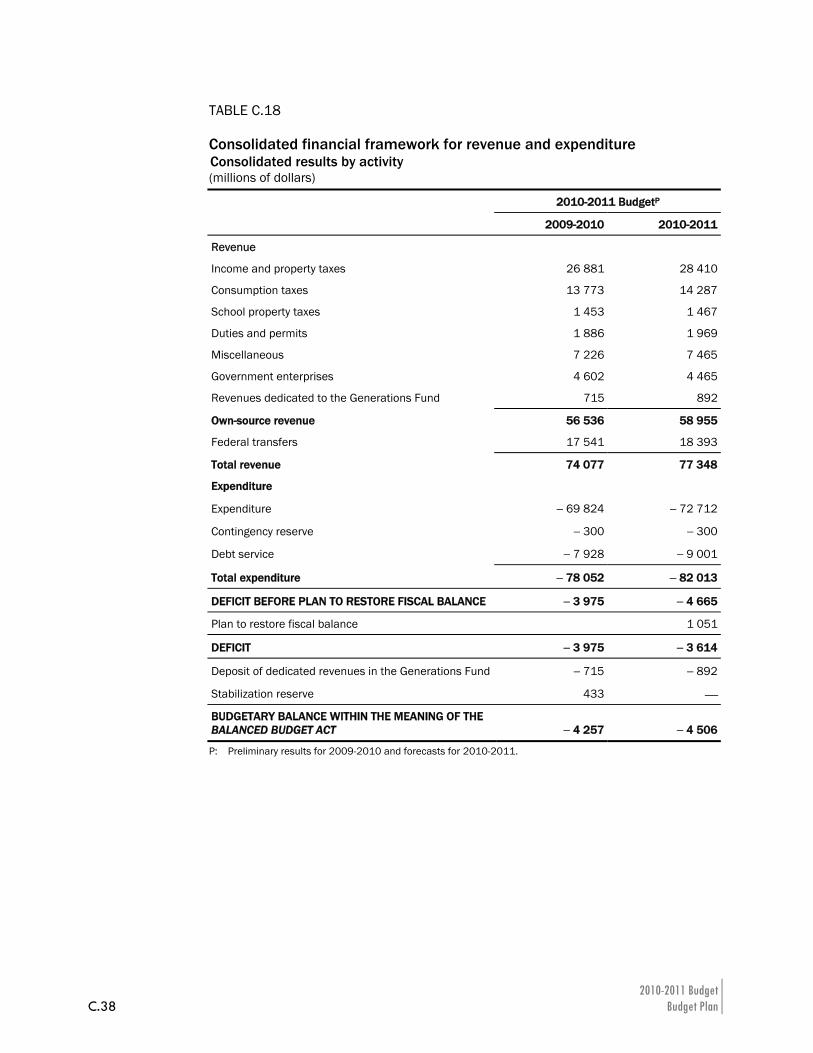
2010-2011 Budget C.38 Budget Plan
TABLE C.18 Consolidated financial framework for revenue and expenditure Consolidated results by activity (millions of dollars)
2010-2011 BudgetP
2009-2010 2010-2011
Revenue
Income and property taxes 26 881 28 410
Consumption taxes 13 773 14 287
School property taxes 1 453 1 467
Duties and permits 1 886 1 969
Miscellaneous 7 226 7 465
Government enterprises 4 602 4 465
Revenues dedicated to the Generations Fund 715 892
Own-source revenue 56 536 58 955
Federal transfers 17 541 18 393
Total revenue 74 077 77 348
Expenditure
Expenditure − 69 824 − 72 712
Contingency reserve − 300 − 300
Debt service − 7 928 − 9 001
Total expenditure − 78 052 − 82 013
DEFICIT BEFORE PLAN TO RESTORE FISCAL BALANCE − 3 975 − 4 665
Plan to restore fiscal balance 1 051
DEFICIT − 3 975 − 3 614
Deposit of dedicated revenues in the Generations Fund − 715 − 892
Stabilization reserve 433 ⎯
BUDGETARY BALANCE WITHIN THE MEANING OF THE BALANCED BUDGET ACT − 4 257 − 4 506
P: Preliminary results for 2009-2010 and forecasts for 2010-2011.
The Government’s Financial Framework C.39
CSection
Tables C.19 and C.20 detail the consolidated budgetary forecasts for 2009-2010 and 2010-2011. The consolidation takes into account transactions carried out in consolidated entities and in specified purpose accounts and eliminates financial transactions between entities in the government’s reporting entity. The latter transactions are carried out within the government and have no impact on the budgetary balance.
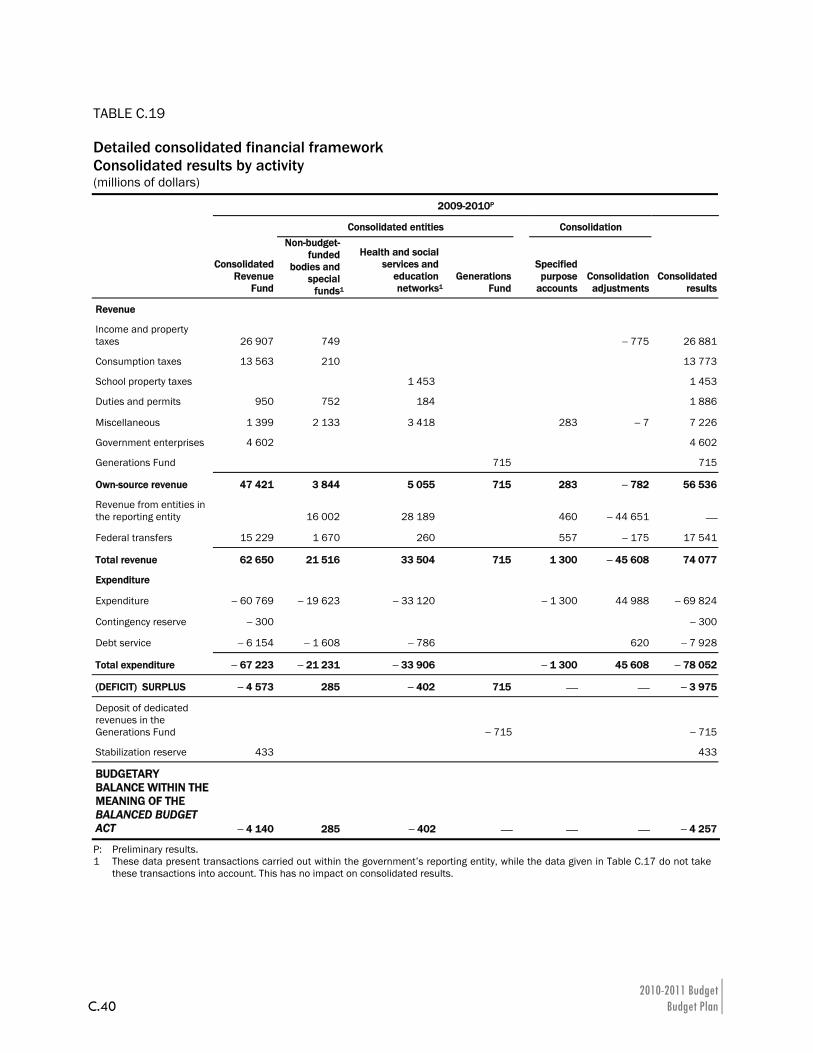
2010-2011 Budget C.40 Budget Plan
TABLE C.19 Detailed consolidated financial framework Consolidated results by activity (millions of dollars)
2009-2010P
Consolidated entities Consolidation
Consolidated Revenue
Fund
Non-budget-funded
bodies and special
funds1
Health and social services and
education networks1
Generations Fund
Specified purpose
accounts Consolidation adjustments
Consolidated results
Revenue
Income and property taxes 26 907 749 − 775 26 881
Consumption taxes 13 563 210 13 773
School property taxes 1 453 1 453
Duties and permits 950 752 184 1 886
Miscellaneous 1 399 2 133 3 418 283 − 7 7 226
Government enterprises 4 602 4 602
Generations Fund 715 715
Own-source revenue 47 421 3 844 5 055 715 283 − 782 56 536
Revenue from entities in the reporting entity 16 002 28 189 460 − 44 651 ⎯
Federal transfers 15 229 1 670 260 557 − 175 17 541
Total revenue 62 650 21 516 33 504 715 1 300 − 45 608 74 077
Expenditure
Expenditure − 60 769 − 19 623 − 33 120 − 1 300 44 988 − 69 824
Contingency reserve − 300 − 300
Debt service − 6 154 − 1 608 − 786 620 − 7 928
Total expenditure − 67 223 − 21 231 − 33 906 − 1 300 45 608 − 78 052
(DEFICIT) SURPLUS − 4 573 285 − 402 715 ⎯ ⎯ − 3 975
Deposit of dedicated revenues in the Generations Fund − 715 − 715
Stabilization reserve 433 433
BUDGETARY BALANCE WITHIN THE MEANING OF THE BALANCED BUDGET ACT − 4 140 285 − 402 ⎯
⎯ ⎯ − 4 257
P: Preliminary results. 1 These data present transactions carried out within the government’s reporting entity, while the data given in Table C.17 do not take
these transactions into account. This has no impact on consolidated results.
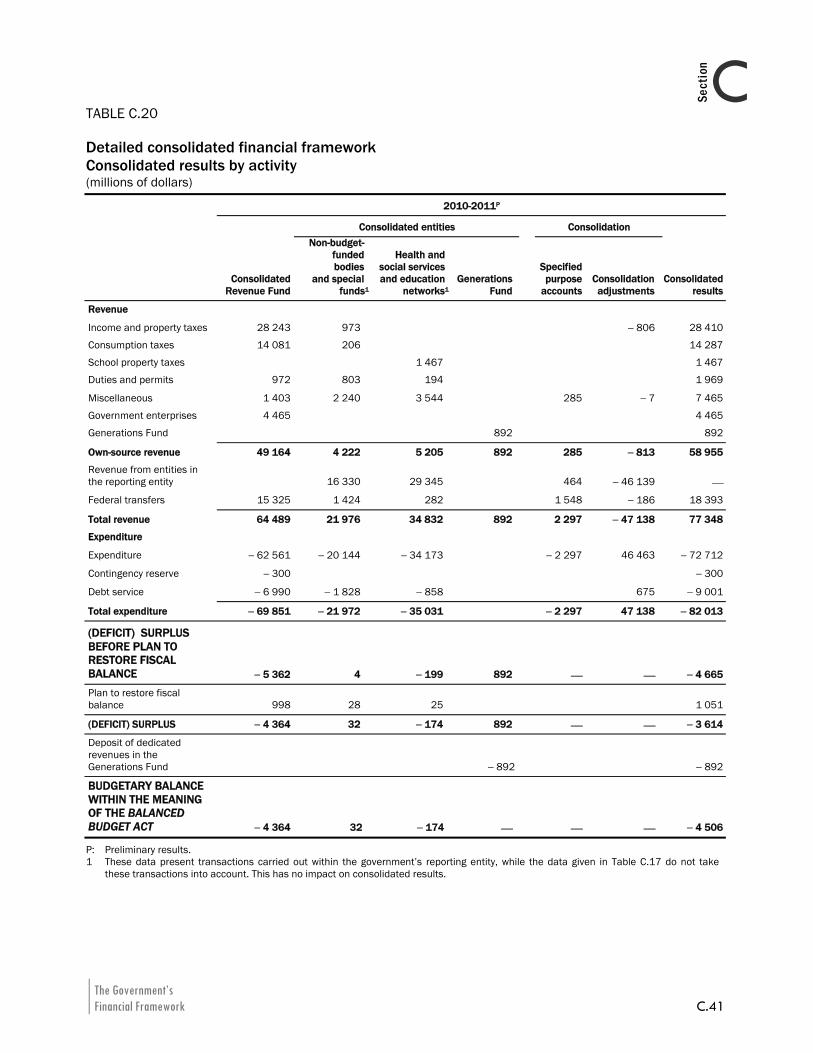
The Government’s Financial Framework C.41
CSection
TABLE C.20 Detailed consolidated financial framework Consolidated results by activity (millions of dollars)
2010-2011P
Consolidated entities Consolidation
Consolidated
Revenue Fund
Non-budget-funded bodies
and special funds1
Health and social services and education
networks1Generations
Fund
Specified purpose
accounts Consolidation adjustments
Consolidated results
Revenue
Income and property taxes 28 243 973 − 806 28 410
Consumption taxes 14 081 206 14 287
School property taxes 1 467 1 467
Duties and permits 972 803 194 1 969
Miscellaneous 1 403 2 240 3 544 285 − 7 7 465
Government enterprises 4 465 4 465
Generations Fund 892 892
Own-source revenue 49 164 4 222 5 205 892 285 − 813 58 955
Revenue from entities in the reporting entity 16 330 29 345 464 − 46 139 ⎯
Federal transfers 15 325 1 424 282 1 548 − 186 18 393
Total revenue 64 489 21 976 34 832 892 2 297 − 47 138 77 348
Expenditure
Expenditure − 62 561 − 20 144 − 34 173 − 2 297 46 463 − 72 712
Contingency reserve − 300 − 300
Debt service − 6 990 − 1 828 − 858 675 − 9 001
Total expenditure − 69 851 − 21 972 − 35 031 − 2 297 47 138 − 82 013
(DEFICIT) SURPLUS BEFORE PLAN TO RESTORE FISCAL BALANCE − 5 362 4 − 199 892 ⎯ ⎯ − 4 665
Plan to restore fiscal balance 998 28 25 1 051
(DEFICIT) SURPLUS − 4 364 32 − 174 892 ⎯ ⎯ − 3 614
Deposit of dedicated revenues in the Generations Fund − 892 − 892
BUDGETARY BALANCE WITHIN THE MEANING OF THE BALANCED BUDGET ACT − 4 364 32 − 174 ⎯ ⎯ ⎯ − 4 506
P: Preliminary results. 1 These data present transactions carried out within the government’s reporting entity, while the data given in Table C.17 do not take
these transactions into account. This has no impact on consolidated results.
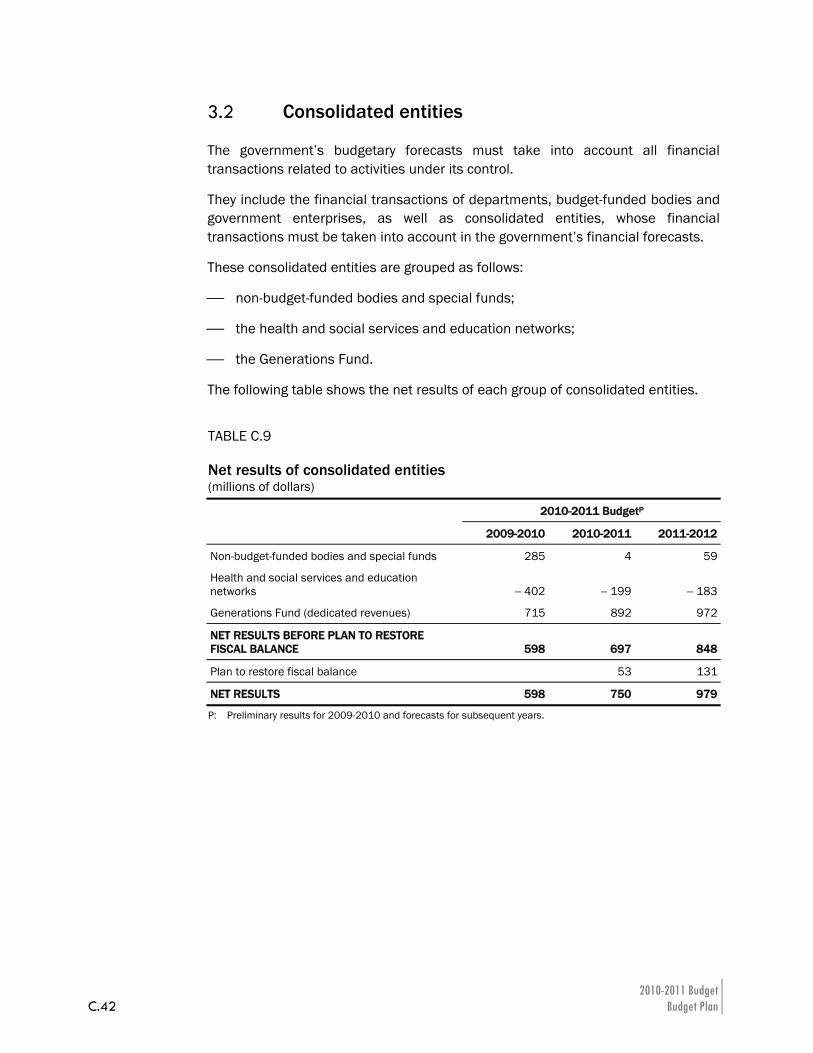
2010-2011 Budget C.42 Budget Plan
3.2 Consolidated entities
The government’s budgetary forecasts must take into account all financial transactions related to activities under its control.
They include the financial transactions of departments, budget-funded bodies and government enterprises, as well as consolidated entities, whose financial transactions must be taken into account in the government’s financial forecasts.
These consolidated entities are grouped as follows:
⎯ non-budget-funded bodies and special funds;
⎯ the health and social services and education networks;
⎯ the Generations Fund.
The following table shows the net results of each group of consolidated entities.
TABLE C.9 Net results of consolidated entities (millions of dollars)
2010-2011 BudgetP
2009-2010 2010-2011 2011-2012
Non-budget-funded bodies and special funds 285 4 59
Health and social services and education networks − 402 − 199 − 183
Generations Fund (dedicated revenues) 715 892 972
NET RESULTS BEFORE PLAN TO RESTORE FISCAL BALANCE 598 697 848
Plan to restore fiscal balance 53 131
NET RESULTS 598 750 979
P: Preliminary results for 2009-2010 and forecasts for subsequent years.
The Government’s Financial Framework C.43
CSection
In December 2007, further to the recommendations of the Task Force on Government Accounting, the government adopted a reform of its accounting policies to bring them into full conformity with generally accepted accounting principles (GAAP). Accordingly, since 2006-2007, its reporting entity has included agencies and institutions in the health and social services network, school boards, CEGEPs, and the Université du Québec and its branches.
This year, in addition to presenting the net results of the health and social services and education networks, the budget presents a projection of the networks’ revenue and expenditure and their non–budgetary transactions.
3.2.1 Non-budget-funded bodies and special funds
Non-budget-funded bodies and special funds include 104 government entities whose mission is to sell goods and services or fund government programs. For instance:
⎯ the Fonds de conservation et d'amélioration du réseau routier du Québec funds investments for maintaining and developing roads and structures;
⎯ the Fonds de l’assurance médicaments pays the cost of medications and pharmaceutical services for people insured by the Régie de l’assurance maladie du Québec.
For fiscal 2009-2010, the net results of non-budget-funded bodies and special funds show a surplus of $285 million. For 2010-2011 and 2011-2012, the net results of non-budget-funded bodies and special funds are expected to show surpluses of $32 million and $140 million respectively.
These surpluses are attributable mainly to an increase in the government’s contribution to La Financière agricole du Québec, up $380 million in 2009-2010 and $325 million as of 2010-2011.
These net results take into account the measures in the plan to restore fiscal balance, which amount to $28 million in 2010-2011 and $81 million in 2011-2012. These measures should total $165 million in 2013-2014.
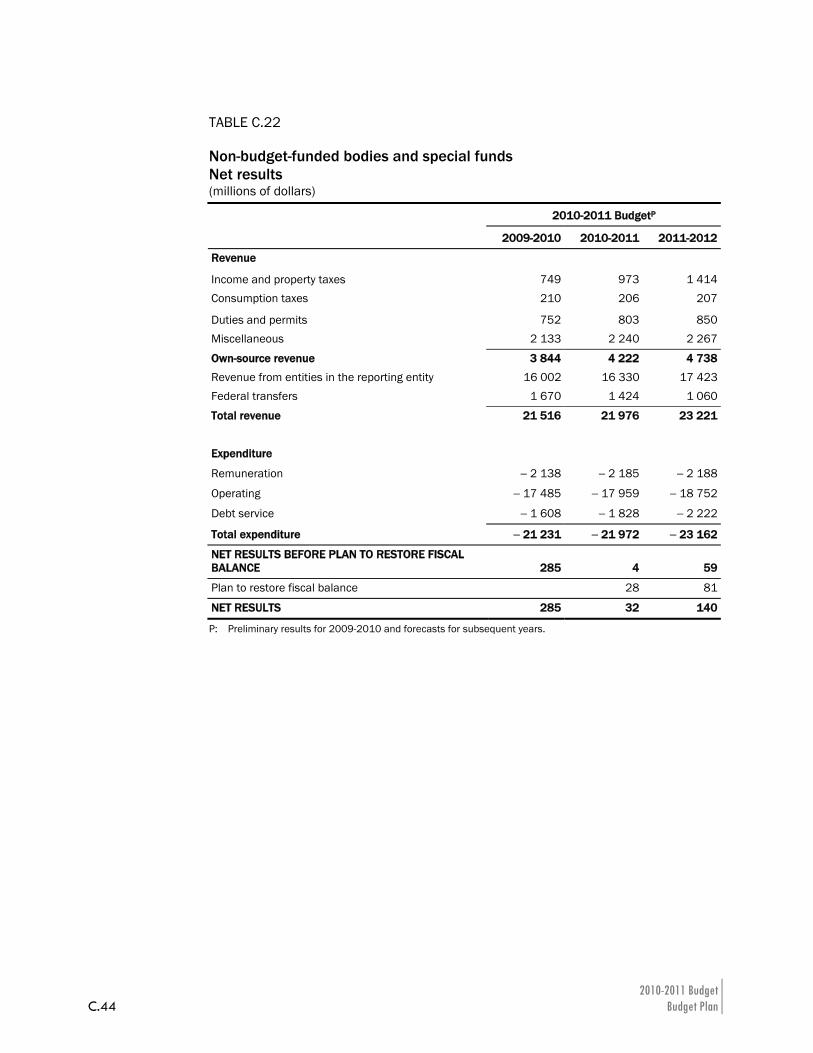
2010-2011 Budget C.44 Budget Plan
TABLE C.22 Non-budget-funded bodies and special funds Net results (millions of dollars)
2010-2011 BudgetP
2009-2010 2010-2011 2011-2012
Revenue
Income and property taxes 749 973 1 414Consumption taxes 210 206 207
Duties and permits 752 803 850Miscellaneous 2 133 2 240 2 267
Own-source revenue 3 844 4 222 4 738
Revenue from entities in the reporting entity 16 002 16 330 17 423Federal transfers 1 670 1 424 1 060
Total revenue 21 516 21 976 23 221
Expenditure
Remuneration − 2 138 − 2 185 − 2 188
Operating − 17 485 − 17 959 − 18 752
Debt service − 1 608 − 1 828 − 2 222
Total expenditure − 21 231 − 21 972 − 23 162
NET RESULTS BEFORE PLAN TO RESTORE FISCAL BALANCE 285 4 59
Plan to restore fiscal balance 28 81
NET RESULTS 285 32 140
P: Preliminary results for 2009-2010 and forecasts for subsequent years.
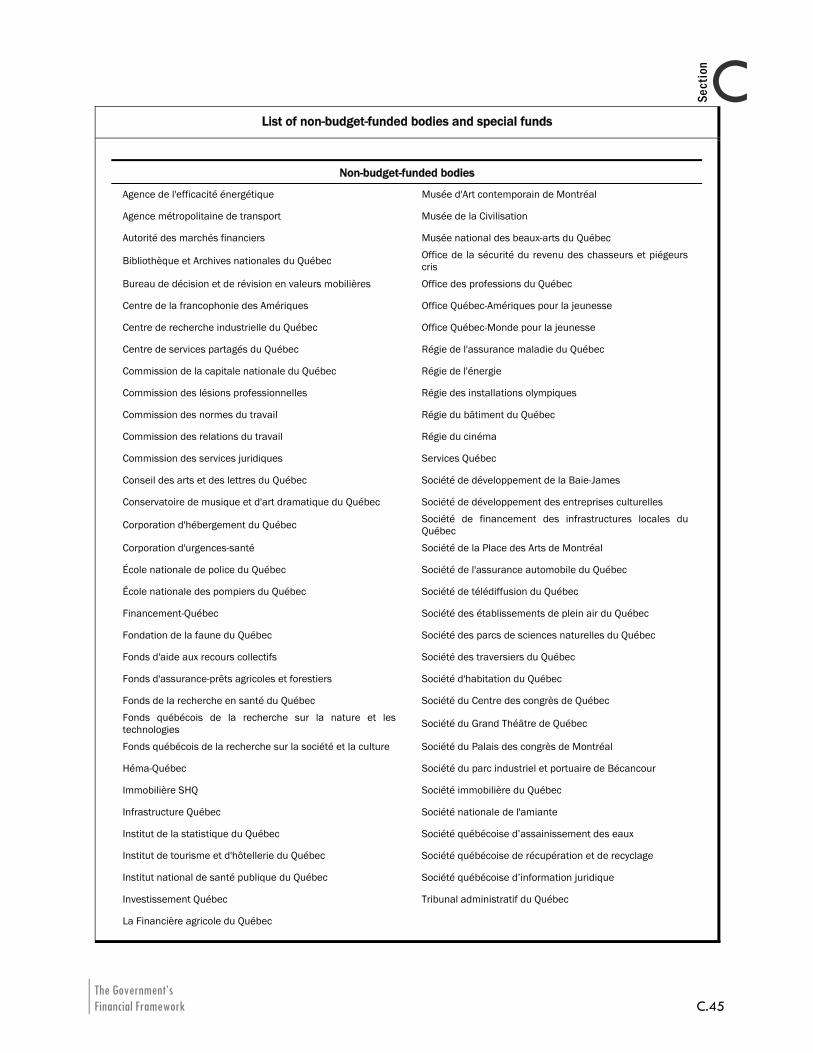
The Government’s Financial Framework C.45
CSection
List of non-budget-funded bodies and special funds
Non-budget-funded bodies
Agence de l'efficacité énergétique Musée d'Art contemporain de Montréal
Agence métropolitaine de transport Musée de la Civilisation
Autorité des marchés financiers Musée national des beaux-arts du Québec
Bibliothèque et Archives nationales du Québec Office de la sécurité du revenu des chasseurs et piégeurs cris
Bureau de décision et de révision en valeurs mobilières Office des professions du Québec
Centre de la francophonie des Amériques Office Québec-Amériques pour la jeunesse
Centre de recherche industrielle du Québec Office Québec-Monde pour la jeunesse
Centre de services partagés du Québec Régie de l'assurance maladie du Québec
Commission de la capitale nationale du Québec Régie de l'énergie
Commission des lésions professionnelles Régie des installations olympiques
Commission des normes du travail Régie du bâtiment du Québec
Commission des relations du travail Régie du cinéma
Commission des services juridiques Services Québec
Conseil des arts et des lettres du Québec Société de développement de la Baie-James
Conservatoire de musique et d'art dramatique du Québec Société de développement des entreprises culturelles
Corporation d'hébergement du Québec Société de financement des infrastructures locales du Québec
Corporation d'urgences-santé Société de la Place des Arts de Montréal
École nationale de police du Québec Société de l'assurance automobile du Québec
École nationale des pompiers du Québec Société de télédiffusion du Québec
Financement-Québec Société des établissements de plein air du Québec
Fondation de la faune du Québec Société des parcs de sciences naturelles du Québec
Fonds d'aide aux recours collectifs Société des traversiers du Québec
Fonds d'assurance-prêts agricoles et forestiers Société d'habitation du Québec
Fonds de la recherche en santé du Québec Société du Centre des congrès de Québec Fonds québécois de la recherche sur la nature et les technologies Société du Grand Théâtre de Québec
Fonds québécois de la recherche sur la société et la culture Société du Palais des congrès de Montréal
Héma-Québec Société du parc industriel et portuaire de Bécancour
Immobilière SHQ Société immobilière du Québec
Infrastructure Québec Société nationale de l'amiante
Institut de la statistique du Québec Société québécoise d’assainissement des eaux
Institut de tourisme et d'hôtellerie du Québec Société québécoise de récupération et de recyclage
Institut national de santé publique du Québec Société québécoise d’information juridique
Investissement Québec Tribunal administratif du Québec
La Financière agricole du Québec
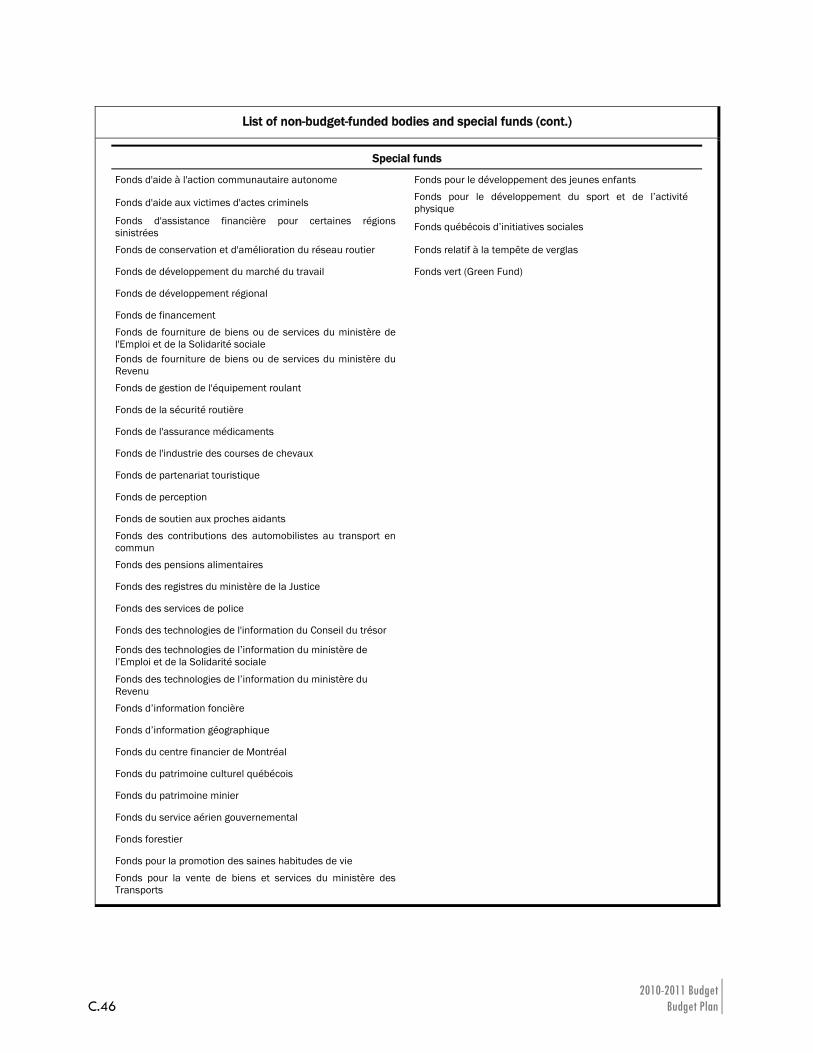
2010-2011 Budget C.46 Budget Plan
List of non-budget-funded bodies and special funds (cont.)
Special funds
Fonds d'aide à l'action communautaire autonome Fonds pour le développement des jeunes enfants
Fonds d'aide aux victimes d'actes criminels Fonds pour le développement du sport et de l’activité physique
Fonds d'assistance financière pour certaines régions sinistrées Fonds québécois d’initiatives sociales
Fonds de conservation et d'amélioration du réseau routier Fonds relatif à la tempête de verglas
Fonds de développement du marché du travail Fonds vert (Green Fund)
Fonds de développement régional
Fonds de financement Fonds de fourniture de biens ou de services du ministère de l'Emploi et de la Solidarité sociale
Fonds de fourniture de biens ou de services du ministère du Revenu
Fonds de gestion de l'équipement roulant
Fonds de la sécurité routière
Fonds de l'assurance médicaments
Fonds de l'industrie des courses de chevaux
Fonds de partenariat touristique
Fonds de perception
Fonds de soutien aux proches aidants Fonds des contributions des automobilistes au transport en commun
Fonds des pensions alimentaires
Fonds des registres du ministère de la Justice
Fonds des services de police
Fonds des technologies de l'information du Conseil du trésor
Fonds des technologies de l’information du ministère de l’Emploi et de la Solidarité sociale
Fonds des technologies de l’information du ministère du Revenu
Fonds d’information foncière
Fonds d’information géographique
Fonds du centre financier de Montréal
Fonds du patrimoine culturel québécois
Fonds du patrimoine minier
Fonds du service aérien gouvernemental
Fonds forestier
Fonds pour la promotion des saines habitudes de vie Fonds pour la vente de biens et services du ministère des Transports
The Government’s Financial Framework C.47
CSection
3.2.2 Health and social services and education networks
The health and social services network is made up of 209 entities. These entities comprise 15 agencies and three regional authorities in the health and social services, as well as 191 public health and social services institutions.
The education network is made of up 131 entities, including 73 school boards, 48 CEGEPs and the Université du Québec and its nine branches.
As of fiscal 2009-2010, the public accounts have presented the revenue and expenditure of the networks and the assets and liabilities of their balance sheet line by line, whereas the previous budget essentially took into account the projected net financial results of the networks for the purpose of preparing the government’s financial framework.
In the interests of improving consistency between the financial data published in the budget and those disseminated in the public accounts, this budget presents, for the first time, detailed prospective financial information on the networks.
In the March 2009 Budget, the government provided $120 million for 2009-2010 to cover any overruns that might be incurred. The present budget is adjusting this amount upward by $282 million to $402 million. This adjustment is due to, in particular, the effects of harmonizing the network’s accounting policies with those of the government.
The deficits of the health and social services and education networks for 2010-2011 and 2011-2012 amount to $174 million and $133 million respectively after the measures under the plan to restore fiscal balance.
In cooperation with the Ministère de la Santé et des Services sociaux and the Ministère de l’Éducation, du Loisir et du Sport, the monitoring and budgetary control process for the networks has been improved. Other efforts will be deployed over the coming year to enhance the monitoring and budgetary control process for the entities that make up the networks.
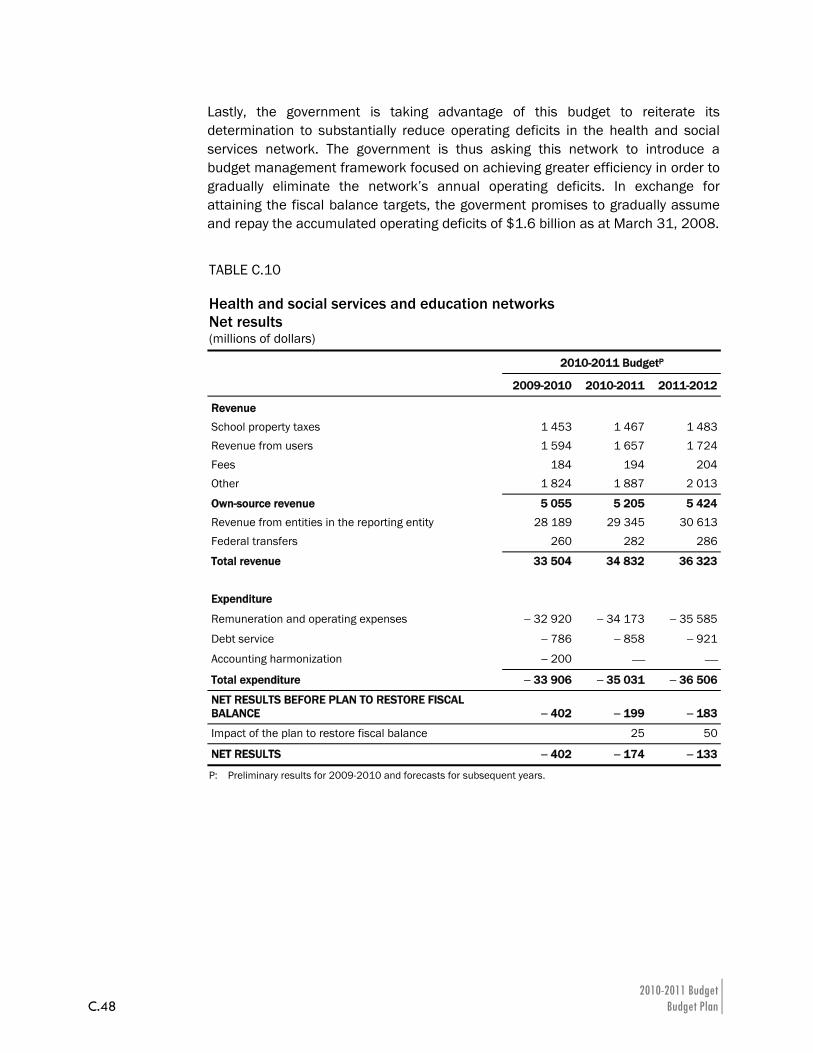
2010-2011 Budget C.48 Budget Plan
Lastly, the government is taking advantage of this budget to reiterate its determination to substantially reduce operating deficits in the health and social services network. The government is thus asking this network to introduce a budget management framework focused on achieving greater efficiency in order to gradually eliminate the network’s annual operating deficits. In exchange for attaining the fiscal balance targets, the goverment promises to gradually assume and repay the accumulated operating deficits of $1.6 billion as at March 31, 2008.
TABLE C.10 Health and social services and education networks Net results (millions of dollars)
2010-2011 BudgetP
2009-2010 2010-2011 2011-2012
Revenue School property taxes 1 453 1 467 1 483Revenue from users 1 594 1 657 1 724Fees 184 194 204Other 1 824 1 887 2 013
Own-source revenue 5 055 5 205 5 424Revenue from entities in the reporting entity 28 189 29 345 30 613Federal transfers 260 282 286
Total revenue 33 504 34 832 36 323
Expenditure
Remuneration and operating expenses − 32 920 − 34 173 − 35 585
Debt service − 786 − 858 − 921
Accounting harmonization − 200 ⎯ ⎯
Total expenditure − 33 906 − 35 031 − 36 506
NET RESULTS BEFORE PLAN TO RESTORE FISCAL BALANCE − 402 − 199 − 183
Impact of the plan to restore fiscal balance 25 50
NET RESULTS − 402 − 174 − 133
P: Preliminary results for 2009-2010 and forecasts for subsequent years.
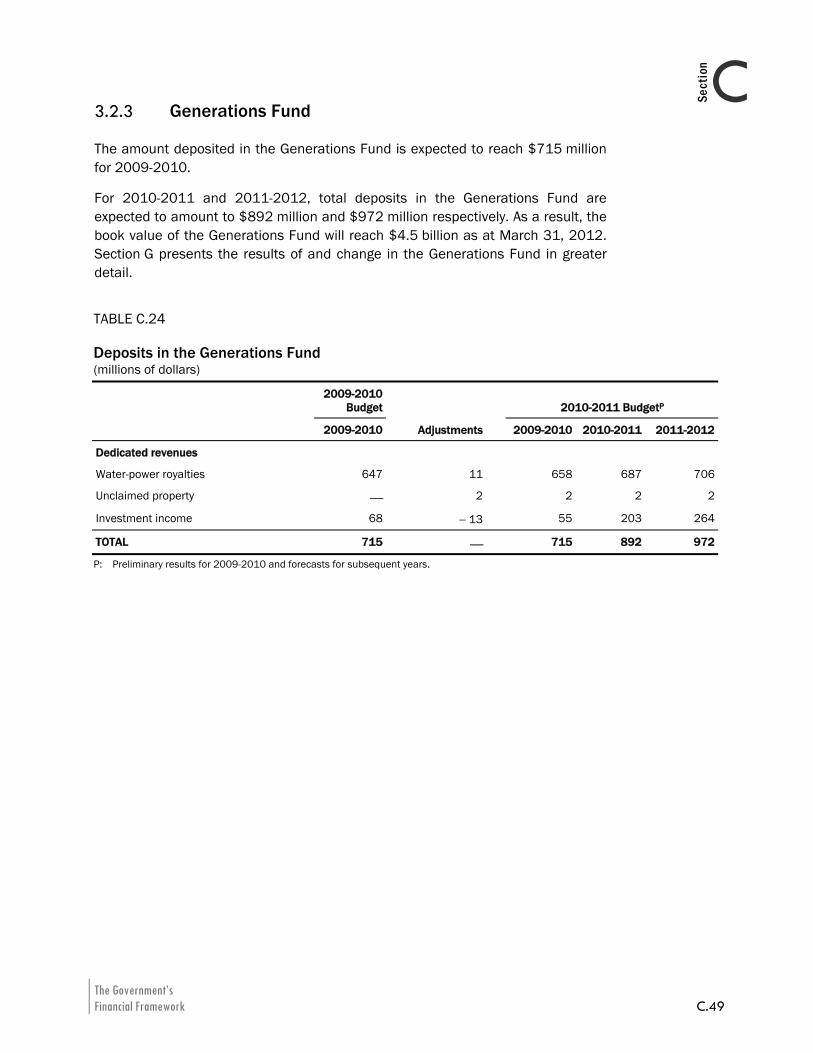
The Government’s Financial Framework C.49
CSection
3.2.3 Generations Fund
The amount deposited in the Generations Fund is expected to reach $715 million for 2009-2010.
For 2010-2011 and 2011-2012, total deposits in the Generations Fund are expected to amount to $892 million and $972 million respectively. As a result, the book value of the Generations Fund will reach $4.5 billion as at March 31, 2012. Section G presents the results of and change in the Generations Fund in greater detail.
TABLE C.24 Deposits in the Generations Fund (millions of dollars)
2009-2010
Budget 2010-2011 BudgetP
2009-2010 Adjustments 2009-2010 2010-2011 2011-2012
Dedicated revenues
Water-power royalties 647 11 658 687 706
Unclaimed property ⎯ 2 2 2 2
Investment income 68 − 13 55 203 264
TOTAL 715 ⎯ 715 892 972
P: Preliminary results for 2009-2010 and forecasts for subsequent years.

The Government’s Financial Framework C.51
CSection
4. CONSOLIDATED NET FINANCIAL REQUIREMENTS The budgetary balance is presented on an accrual basis, with assets and liabilities being recognized, respectively, when they are acquired or incurred, regardless of when the corresponding funds are disbursed or received. Conversely, net surpluses or financial requirements represent the difference between the government’s cash inflow and disbursements. This measure thus takes into account not only changes in the budgetary balance but also resources or requirements arising from the government’s investments through the acquisition of fixed assets, through loans investments and advances, and through other activities such as paying accounts payable and collecting accounts receivable. The difference between the budgetary balance and net financial resources or requirements is recognized in non-budgetary transactions.
Moreover, for the first time, the government is presenting the non-budgetary transactions of the health and social services and education networks in detail. Previously, the government’s investments in the networks were presented on a net basis3 whereas, from now on, the networks’ non-budgetary transactions will be detailed like those of the Consolidated Revenue Fund.
As a whole, consolidated net financial requirements stand at $7.0 billion in 2009-2010 and 2010-2011, and at $6.9 billion in 2011-2012.
3 The presentation of net financial requirements excluding the non-budgetary transactions of
the health and social services and education networks is shown in Appendix 3.
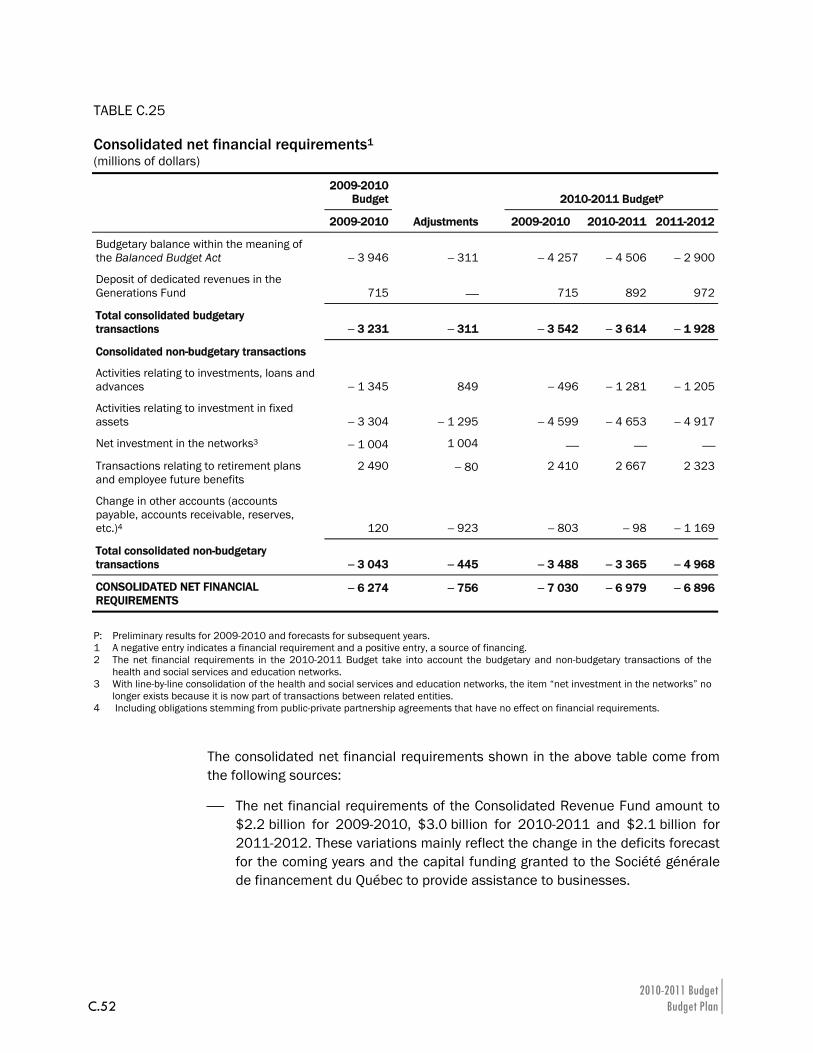
2010-2011 Budget C.52 Budget Plan
The consolidated net financial requirements shown in the above table come from the following sources:
⎯ The net financial requirements of the Consolidated Revenue Fund amount to $2.2 billion for 2009-2010, $3.0 billion for 2010-2011 and $2.1 billion for 2011-2012. These variations mainly reflect the change in the deficits forecast for the coming years and the capital funding granted to the Société générale de financement du Québec to provide assistance to businesses.
TABLE C.25 Consolidated net financial requirements1 (millions of dollars)
2009-2010
Budget 2010-2011 BudgetP
2009-2010 Adjustments 2009-2010 2010-2011 2011-2012
Budgetary balance within the meaning of the Balanced Budget Act − 3 946 − 311 − 4 257 − 4 506 − 2 900
Deposit of dedicated revenues in the Generations Fund 715 ⎯ 715 892 972
Total consolidated budgetary transactions − 3 231 − 311 − 3 542 − 3 614 − 1 928
Consolidated non-budgetary transactions
Activities relating to investments, loans and advances − 1 345 849 − 496 − 1 281 − 1 205
Activities relating to investment in fixed assets − 3 304 − 1 295 − 4 599 − 4 653 − 4 917
Net investment in the networks3 − 1 004 1 004 ⎯ ⎯ ⎯
Transactions relating to retirement plans and employee future benefits
2 490 − 80 2 410 2 667 2 323
Change in other accounts (accounts payable, accounts receivable, reserves, etc.)4 120 − 923 − 803 − 98 − 1 169
Total consolidated non-budgetary transactions − 3 043 − 445 − 3 488 − 3 365 − 4 968
CONSOLIDATED NET FINANCIAL REQUIREMENTS
− 6 274 − 756 − 7 030 − 6 979 − 6 896
P: Preliminary results for 2009-2010 and forecasts for subsequent years. 1 A negative entry indicates a financial requirement and a positive entry, a source of financing. 2 The net financial requirements in the 2010-2011 Budget take into account the budgetary and non-budgetary transactions of the
health and social services and education networks. 3 With line-by-line consolidation of the health and social services and education networks, the item “net investment in the networks” no
longer exists because it is now part of transactions between related entities. 4 Including obligations stemming from public-private partnership agreements that have no effect on financial requirements.
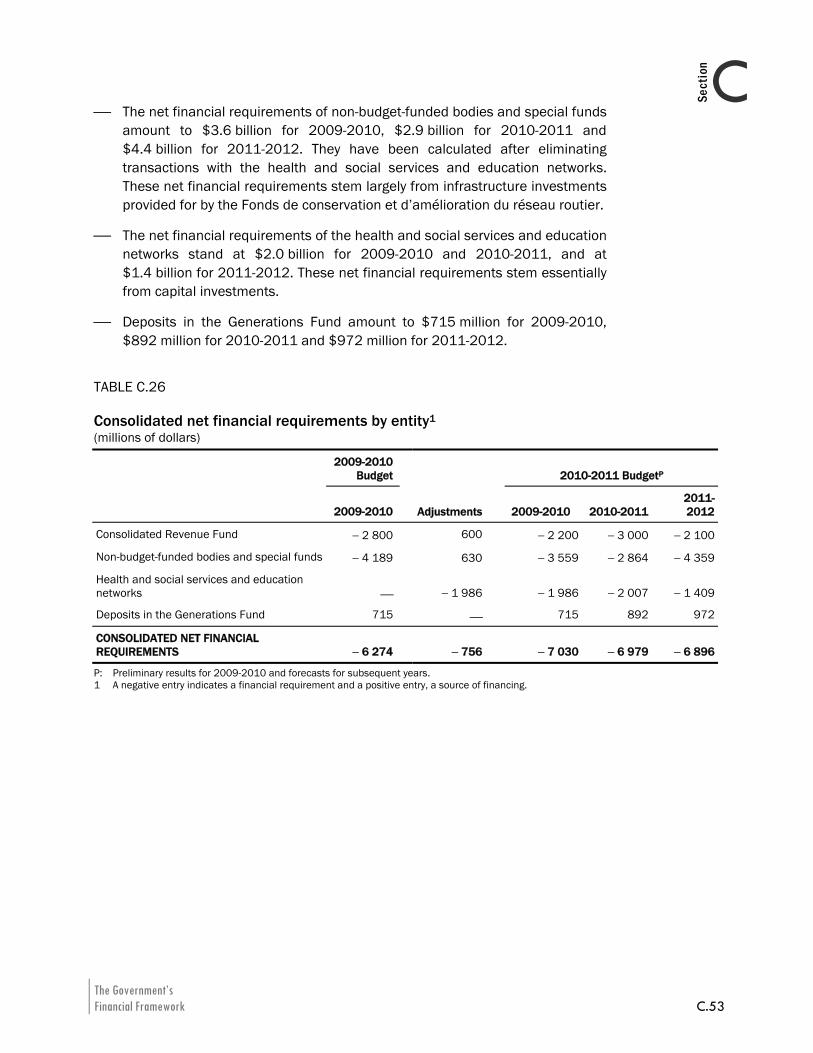
The Government’s Financial Framework C.53
CSection
⎯ The net financial requirements of non-budget-funded bodies and special funds amount to $3.6 billion for 2009-2010, $2.9 billion for 2010-2011 and $4.4 billion for 2011-2012. They have been calculated after eliminating transactions with the health and social services and education networks. These net financial requirements stem largely from infrastructure investments provided for by the Fonds de conservation et d’amélioration du réseau routier.
⎯ The net financial requirements of the health and social services and education networks stand at $2.0 billion for 2009-2010 and 2010-2011, and at $1.4 billion for 2011-2012. These net financial requirements stem essentially from capital investments.
⎯ Deposits in the Generations Fund amount to $715 million for 2009-2010, $892 million for 2010-2011 and $972 million for 2011-2012.
TABLE C.26 Consolidated net financial requirements by entity1 (millions of dollars)
2009-2010
Budget 2010-2011 BudgetP
2009-2010 Adjustments 2009-2010 2010-2011 2011-2012
Consolidated Revenue Fund − 2 800 600 − 2 200 − 3 000 − 2 100
Non-budget-funded bodies and special funds − 4 189 630 − 3 559 − 2 864 − 4 359
Health and social services and education networks ⎯ − 1 986 − 1 986 − 2 007 − 1 409
Deposits in the Generations Fund 715 ⎯ 715 892 972
CONSOLIDATED NET FINANCIAL REQUIREMENTS − 6 274 − 756 − 7 030 − 6 979 − 6 896
P: Preliminary results for 2009-2010 and forecasts for subsequent years. 1 A negative entry indicates a financial requirement and a positive entry, a source of financing.

The Government’s Financial Framework C.55
CSection
5. CONSOLIDATED NON-BUDGETARY TRANSACTIONS Consolidated non-budgetary transactions consist of the non-budgetary transactions of the Consolidated Revenue Fund and those of consolidated entities. They are presented by activity:
⎯ investments, loans and advances;
⎯ capital expenditures;
⎯ retirement plans and employee future benefits;
⎯ other accounts.
Non-budgetary transactions related to the health and social services and education networks are being consolidated in these activities for the first time. Over the past two years, they have been shown separately under the item “net investment in the networks.” The line-by-line consolidation of the networks’ transactions takes into account changes in asset and liability items, including capital expenditures and debts. Therefore, network assets funded directly through financial institutions are added to the government’s net financial requirements.
For 2009-2010, consolidated non-budgetary requirements stand at $3.5 billion, or $445 million less than forecast in the March 2009 Budget.
For 2010-2011 and 2011-2012, consolidated non-budgetary requirements stand at $3.4 billion and $5.0 billion respectively.
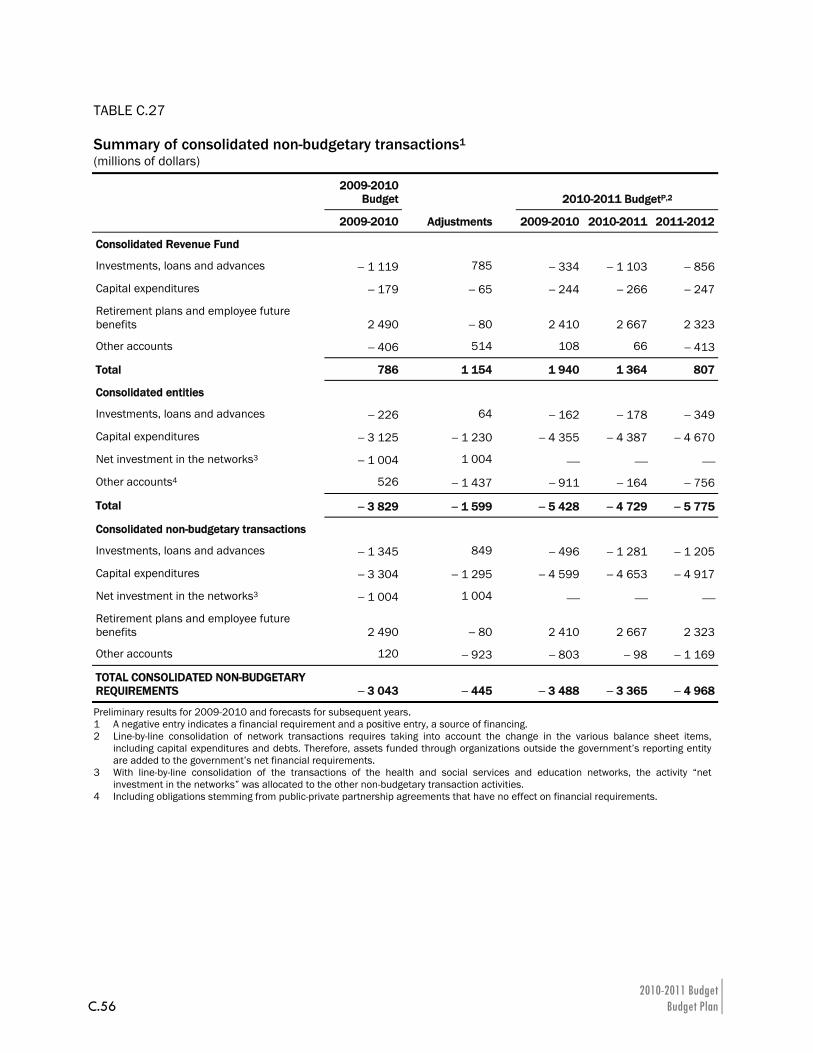
2010-2011 Budget C.56 Budget Plan
TABLE C.27 Summary of consolidated non-budgetary transactions1 (millions of dollars)
2009-2010
Budget 2010-2011 BudgetP,2
2009-2010 Adjustments 2009-2010 2010-2011 2011-2012
Consolidated Revenue Fund
Investments, loans and advances − 1 119 785 − 334 − 1 103 − 856
Capital expenditures − 179 − 65 − 244 − 266 − 247
Retirement plans and employee future benefits 2 490 − 80 2 410 2 667 2 323
Other accounts − 406 514 108 66 − 413
Total 786 1 154 1 940 1 364 807
Consolidated entities
Investments, loans and advances − 226 64 − 162 − 178 − 349
Capital expenditures − 3 125 − 1 230 − 4 355 − 4 387 − 4 670
Net investment in the networks3 − 1 004 1 004 ⎯ ⎯ ⎯
Other accounts4 526 − 1 437 − 911 − 164 − 756
Total − 3 829 − 1 599 − 5 428 − 4 729 − 5 775
Consolidated non-budgetary transactions
Investments, loans and advances − 1 345 849 − 496 − 1 281 − 1 205
Capital expenditures − 3 304 − 1 295 − 4 599 − 4 653 − 4 917
Net investment in the networks3 − 1 004 1 004 ⎯ ⎯ ⎯
Retirement plans and employee future benefits 2 490 − 80 2 410 2 667 2 323
Other accounts 120 − 923 − 803 − 98 − 1 169
TOTAL CONSOLIDATED NON-BUDGETARY REQUIREMENTS − 3 043 − 445 − 3 488 − 3 365 − 4 968
Preliminary results for 2009-2010 and forecasts for subsequent years. 1 A negative entry indicates a financial requirement and a positive entry, a source of financing. 2 Line-by-line consolidation of network transactions requires taking into account the change in the various balance sheet items,
including capital expenditures and debts. Therefore, assets funded through organizations outside the government’s reporting entity are added to the government’s net financial requirements.
3 With line-by-line consolidation of the transactions of the health and social services and education networks, the activity “net investment in the networks” was allocated to the other non-budgetary transaction activities.
4 Including obligations stemming from public-private partnership agreements that have no effect on financial requirements.
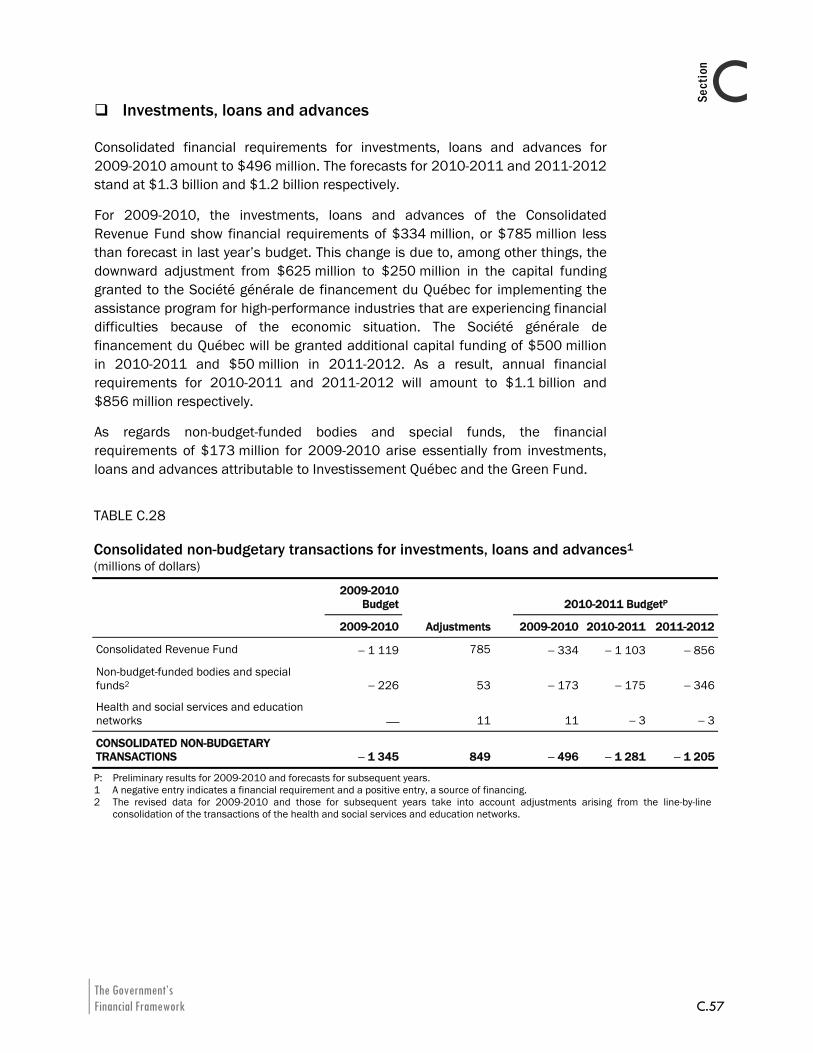
The Government’s Financial Framework C.57
CSection
Investments, loans and advances
Consolidated financial requirements for investments, loans and advances for 2009-2010 amount to $496 million. The forecasts for 2010-2011 and 2011-2012 stand at $1.3 billion and $1.2 billion respectively.
For 2009-2010, the investments, loans and advances of the Consolidated Revenue Fund show financial requirements of $334 million, or $785 million less than forecast in last year’s budget. This change is due to, among other things, the downward adjustment from $625 million to $250 million in the capital funding granted to the Société générale de financement du Québec for implementing the assistance program for high-performance industries that are experiencing financial difficulties because of the economic situation. The Société générale de financement du Québec will be granted additional capital funding of $500 million in 2010-2011 and $50 million in 2011-2012. As a result, annual financial requirements for 2010-2011 and 2011-2012 will amount to $1.1 billion and $856 million respectively.
As regards non-budget-funded bodies and special funds, the financial requirements of $173 million for 2009-2010 arise essentially from investments, loans and advances attributable to Investissement Québec and the Green Fund.
TABLE C.28 Consolidated non-budgetary transactions for investments, loans and advances1 (millions of dollars)
2009-2010
Budget 2010-2011 BudgetP
2009-2010 Adjustments 2009-2010 2010-2011 2011-2012
Consolidated Revenue Fund − 1 119 785 − 334 − 1 103 − 856
Non-budget-funded bodies and special funds2 − 226 53 − 173 − 175 − 346
Health and social services and education networks ⎯ 11 11 − 3 − 3
CONSOLIDATED NON-BUDGETARY TRANSACTIONS − 1 345 849 − 496 − 1 281 − 1 205
P: Preliminary results for 2009-2010 and forecasts for subsequent years. 1 A negative entry indicates a financial requirement and a positive entry, a source of financing. 2 The revised data for 2009-2010 and those for subsequent years take into account adjustments arising from the line-by-line
consolidation of the transactions of the health and social services and education networks.
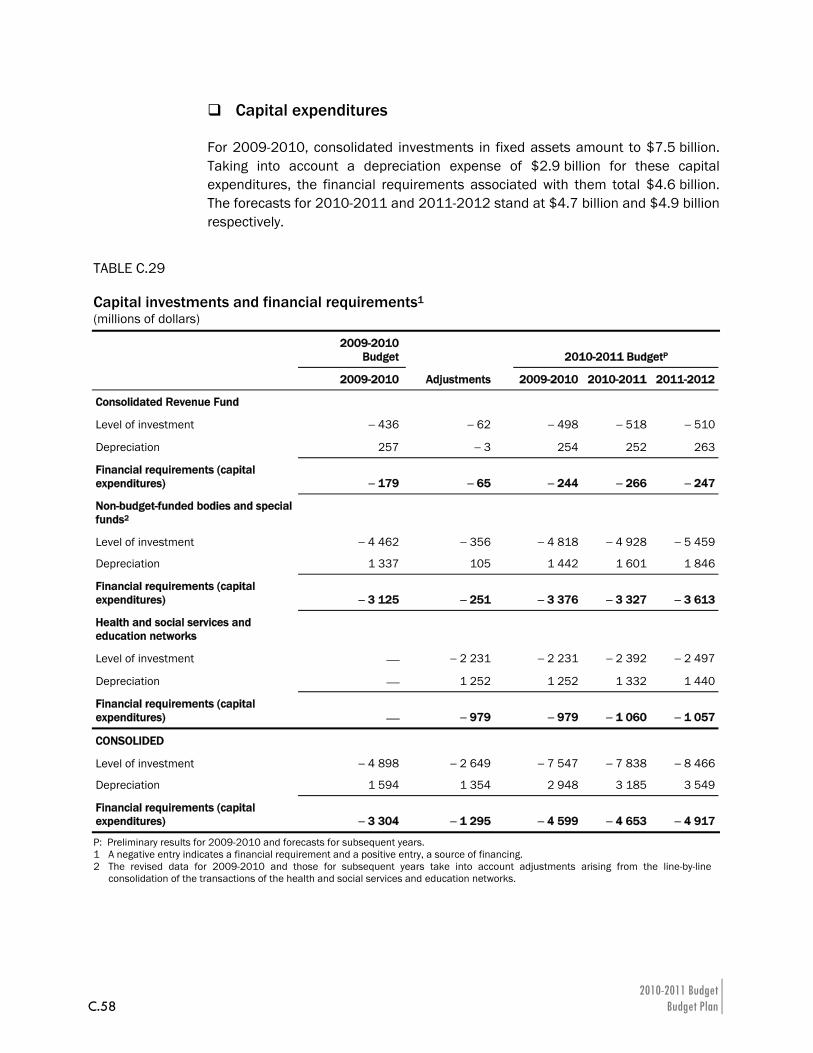
2010-2011 Budget C.58 Budget Plan
Capital expenditures
For 2009-2010, consolidated investments in fixed assets amount to $7.5 billion. Taking into account a depreciation expense of $2.9 billion for these capital expenditures, the financial requirements associated with them total $4.6 billion. The forecasts for 2010-2011 and 2011-2012 stand at $4.7 billion and $4.9 billion respectively.
TABLE C.29 Capital investments and financial requirements1 (millions of dollars)
2009-2010
Budget 2010-2011 BudgetP
2009-2010 Adjustments 2009-2010 2010-2011 2011-2012
Consolidated Revenue Fund
Level of investment − 436 − 62 − 498 − 518 − 510
Depreciation 257 − 3 254 252 263
Financial requirements (capital expenditures) − 179 − 65 − 244 − 266 − 247
Non-budget-funded bodies and special funds2
Level of investment − 4 462 − 356 − 4 818 − 4 928 − 5 459
Depreciation 1 337 105 1 442 1 601 1 846
Financial requirements (capital expenditures) − 3 125 − 251 − 3 376 − 3 327 − 3 613
Health and social services and education networks
Level of investment ⎯ − 2 231 − 2 231 − 2 392 − 2 497
Depreciation ⎯ 1 252 1 252 1 332 1 440
Financial requirements (capital expenditures) ⎯ − 979 − 979 − 1 060 − 1 057
CONSOLIDED
Level of investment − 4 898 − 2 649 − 7 547 − 7 838 − 8 466
Depreciation 1 594 1 354 2 948 3 185 3 549
Financial requirements (capital expenditures) − 3 304 − 1 295 − 4 599 − 4 653 − 4 917
P: Preliminary results for 2009-2010 and forecasts for subsequent years. 1 A negative entry indicates a financial requirement and a positive entry, a source of financing. 2 The revised data for 2009-2010 and those for subsequent years take into account adjustments arising from the line-by-line
consolidation of the transactions of the health and social services and education networks.
The Government’s Financial Framework C.59
CSection
The net financial requirements in respect of non-budget-funded bodies and special funds for 2009-2010 can be attributed mainly to road infrastructure investments of $3.6 billion financed by the Fonds de conservation et d’amélioration du réseau routier. These investments also explain the increase in financial requirements for 2010-2011 and 2011-2012.
In addition, investments of $2.2 billion are forecast for the networks’ fixed assets in 2009-2010. Of this amount, $1.2 billion is for the health and social services network and $1.0 billion for the education network. Network funding comes for the most part from Financement-Québec, the Corporation d’hébergement du Québec and financial institutions.
Retirement plans
For 2009-2010, the balance of non-budgetary transactions in regard to the retirement plans and employee future benefits is $2.4 billion, which reduces the government’s financing needs.
For 2010-2011 and 2011-2012, the retirement plans and employee future benefits should help to reduce financing needs by $2.7 billion and $2.3 billion respectively.
Other accounts
Net financial requirements for other accounts consist of a series of changes in assets and liabilities such as accounts receivable, accounts payable and deferred revenue.
Consolidated financial requirements for other accounts amount to $803 million in 2009-2010. For 2010-2011, other accounts require additional funding of $98 million and of $1.2 billion for 2011-2012.

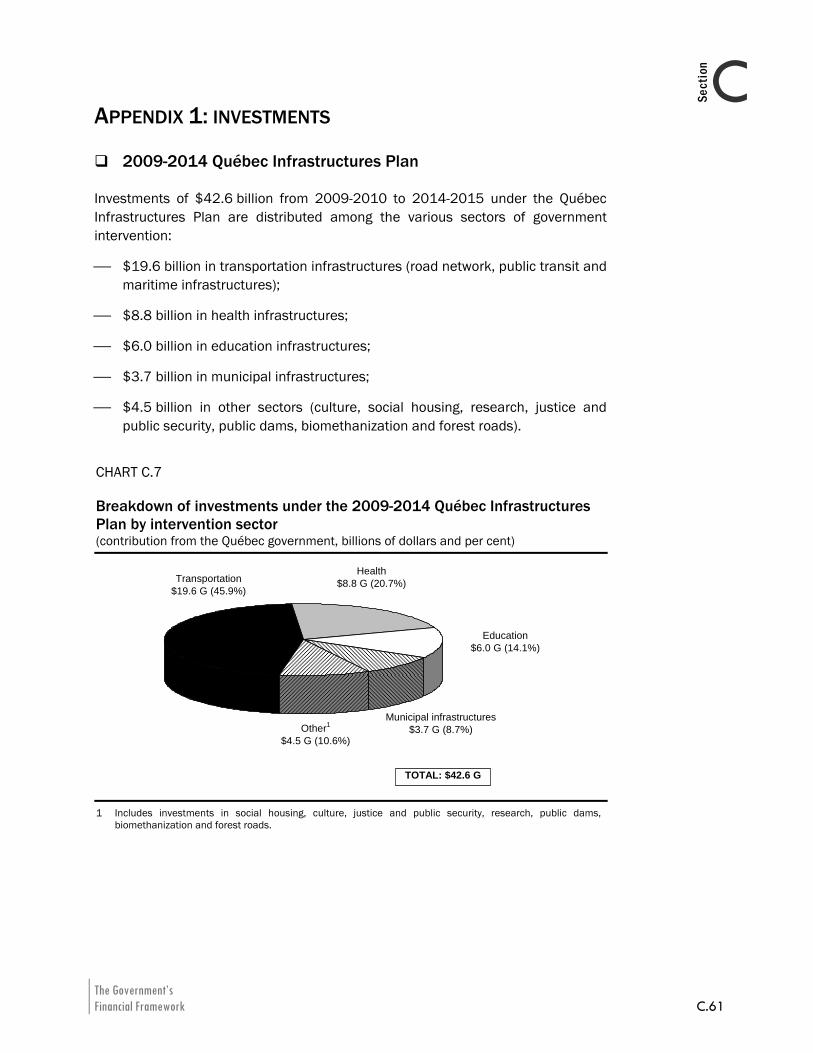
The Government’s Financial Framework C.61
CSection
APPENDIX 1: INVESTMENTS
2009-2014 Québec Infrastructures Plan
Investments of $42.6 billion from 2009-2010 to 2014-2015 under the Québec Infrastructures Plan are distributed among the various sectors of government intervention:
⎯ $19.6 billion in transportation infrastructures (road network, public transit and maritime infrastructures);
⎯ $8.8 billion in health infrastructures;
⎯ $6.0 billion in education infrastructures;
⎯ $3.7 billion in municipal infrastructures;
⎯ $4.5 billion in other sectors (culture, social housing, research, justice and public security, public dams, biomethanization and forest roads).
CHART C.7 Breakdown of investments under the 2009-2014 Québec Infrastructures Plan by intervention sector (contribution from the Québec government, billions of dollars and per cent)
Transportation$19.6 G (45.9%)
Health$8.8 G (20.7%)
Education$6.0 G (14.1%)
Municipal infrastructures$3.7 G (8.7%)Other1
$4.5 G (10.6%)
TOTAL: $42.6 G
1 Includes investments in social housing, culture, justice and public security, research, public dams, biomethanization and forest roads.
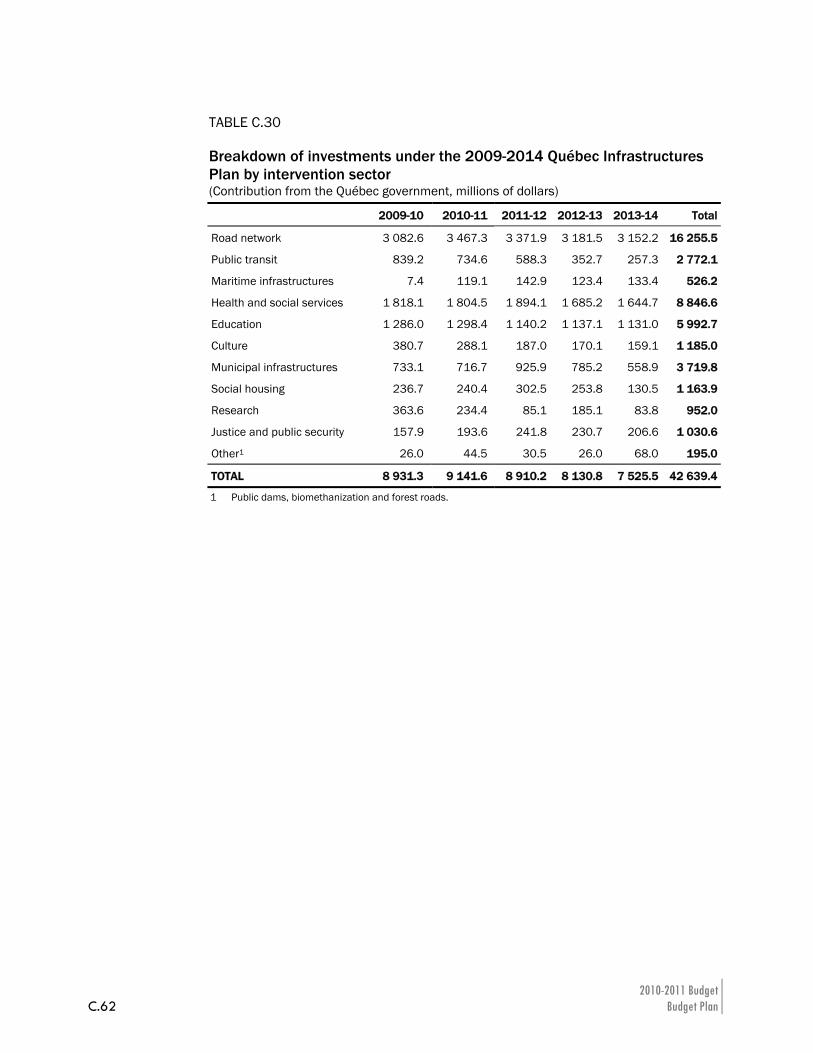
2010-2011 Budget C.62 Budget Plan
TABLE C.30 Breakdown of investments under the 2009-2014 Québec Infrastructures Plan by intervention sector (Contribution from the Québec government, millions of dollars)
2009-10 2010-11 2011-12 2012-13 2013-14 Total
Road network 3 082.6 3 467.3 3 371.9 3 181.5 3 152.2 16 255.5
Public transit 839.2 734.6 588.3 352.7 257.3 2 772.1
Maritime infrastructures 7.4 119.1 142.9 123.4 133.4 526.2
Health and social services 1 818.1 1 804.5 1 894.1 1 685.2 1 644.7 8 846.6
Education 1 286.0 1 298.4 1 140.2 1 137.1 1 131.0 5 992.7
Culture 380.7 288.1 187.0 170.1 159.1 1 185.0
Municipal infrastructures 733.1 716.7 925.9 785.2 558.9 3 719.8
Social housing 236.7 240.4 302.5 253.8 130.5 1 163.9
Research 363.6 234.4 85.1 185.1 83.8 952.0
Justice and public security 157.9 193.6 241.8 230.7 206.6 1 030.6
Other1 26.0 44.5 30.5 26.0 68.0 195.0
TOTAL 8 931.3 9 141.6 8 910.2 8 130.8 7 525.5 42 639.4
1 Public dams, biomethanization and forest roads.
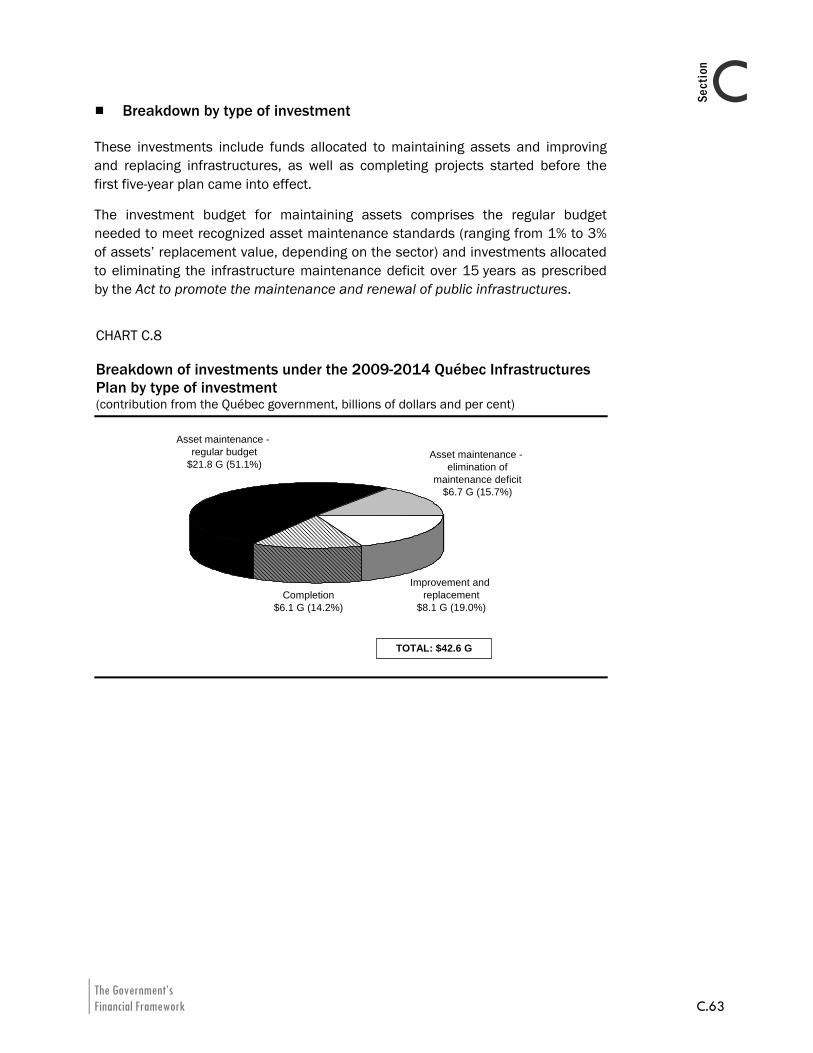
The Government’s Financial Framework C.63
CSection
Breakdown by type of investment
These investments include funds allocated to maintaining assets and improving and replacing infrastructures, as well as completing projects started before the first five-year plan came into effect.
The investment budget for maintaining assets comprises the regular budget needed to meet recognized asset maintenance standards (ranging from 1% to 3% of assets’ replacement value, depending on the sector) and investments allocated to eliminating the infrastructure maintenance deficit over 15 years as prescribed by the Act to promote the maintenance and renewal of public infrastructures.
CHART C.8 Breakdown of investments under the 2009-2014 Québec Infrastructures Plan by type of investment (contribution from the Québec government, billions of dollars and per cent)
TOTAL: $42.6 G
Asset maintenance - regular budget
$21.8 G (51.1%)Asset maintenance -
elimination ofmaintenance deficit
$6.7 G (15.7%)
Completion$6.1 G (14.2%)
Improvement and replacement
$8.1 G (19.0%)
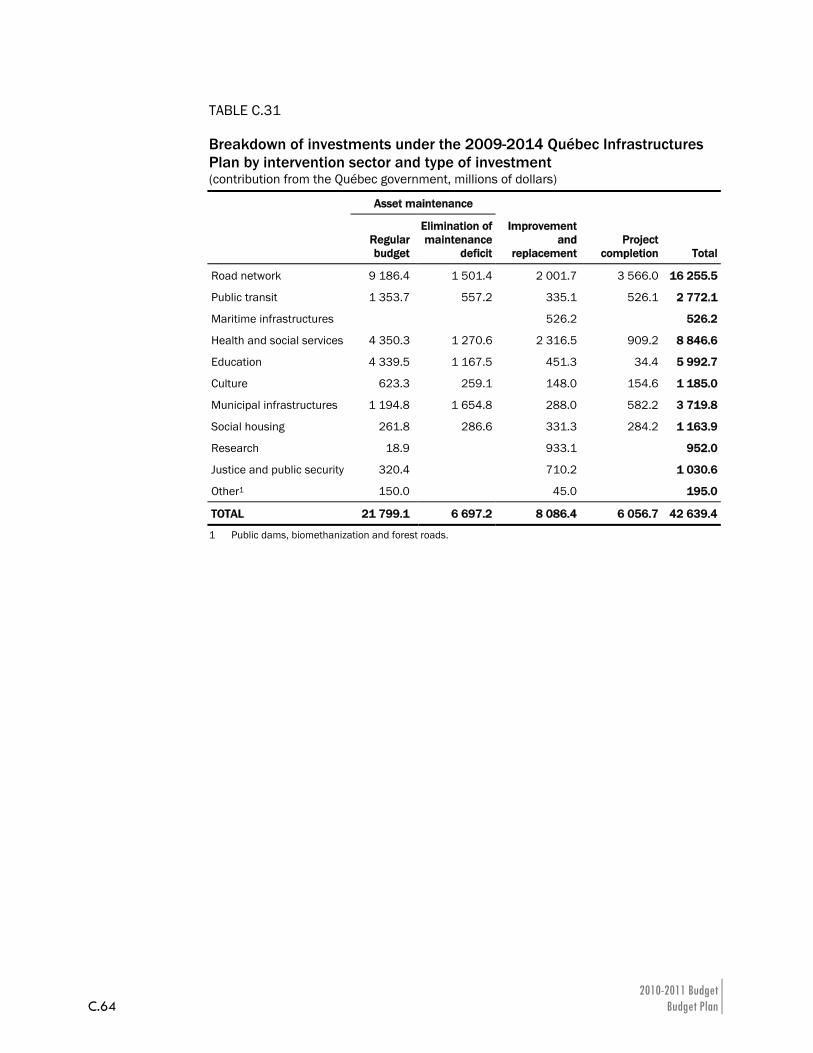
2010-2011 Budget C.64 Budget Plan
TABLE C.31 Breakdown of investments under the 2009-2014 Québec Infrastructures Plan by intervention sector and type of investment (contribution from the Québec government, millions of dollars)
Asset maintenance
Regular budget
Elimination of maintenance
deficit
Improvement and
replacement Project
completion Total
Road network 9 186.4 1 501.4 2 001.7 3 566.0 16 255.5
Public transit 1 353.7 557.2 335.1 526.1 2 772.1
Maritime infrastructures 526.2 526.2
Health and social services 4 350.3 1 270.6 2 316.5 909.2 8 846.6
Education 4 339.5 1 167.5 451.3 34.4 5 992.7
Culture 623.3 259.1 148.0 154.6 1 185.0
Municipal infrastructures 1 194.8 1 654.8 288.0 582.2 3 719.8
Social housing 261.8 286.6 331.3 284.2 1 163.9
Research 18.9 933.1 952.0
Justice and public security 320.4 710.2 1 030.6
Other1 150.0 45.0 195.0
TOTAL 21 799.1 6 697.2 8 086.4 6 056.7 42 639.4
1 Public dams, biomethanization and forest roads.
The Government’s Financial Framework C.65
CSection
APPENDIX 2: INVESTMENT PROJECTS BY GOVERNMENT ENTERPRISES Certain government enterprises will continue to make substantial investments that will contribute to Québec’s economic recovery. In 2010-2011, investments by these corporations will increase by over $620 million compared with 2009-2010 and reach nearly $5.2 billion. They will climb again in 2011-2012, to nearly $5.3 billion.
Hydro-Québec
Hydro-Québec alone will boost its investments by over $500 million in 2010 compared with 2009, to which will be added $150 million in 2011.
The pace of the La Romaine project, launched in 2009, will be doubled, and the funding allocated to this project will reach over $400 million in 2010 and $515 million in 2011. As well, close to $1 billion will be allocated in 2010 to the Eastmain-1-A/Rupert and La Sarcelle project, which will be completed in 2012. In addition to making a significant contribution to Québec’s economy, these two projects will play an important role in securing Québec’s energy future.
Renovation work on the Gentilly power station will also generate major economic spinoffs, as more than $400 million will be devoted to this project in 2010 and 2011.
Substantial amounts will also be allocated to boost Québec’s energy efficiency, with spending in this regard amounting to nearly $300 million in 2010 and $325 million in 2011.
Hydro-Québec’s other projects will also have significant spinoffs in Québec. Overall, the investments devoted to these projects will reach $2.6 billion in 2010 and over $2.7 billion in 2011.
Loto-Québec and Société des alcools du Québec
Loto-Québec and the Société des alcools du Québec will also increase their investments through various projects.
Loto-Québec’s investments will reach $251 million in 2010-2011 and slightly more than $239 million in 2011-2012. Of these amounts, close to $102 million will be allocated to the Casino de Montréal renovation project in 2010-2011 and nearly $95 million will be invested in the project in 2011-2012.
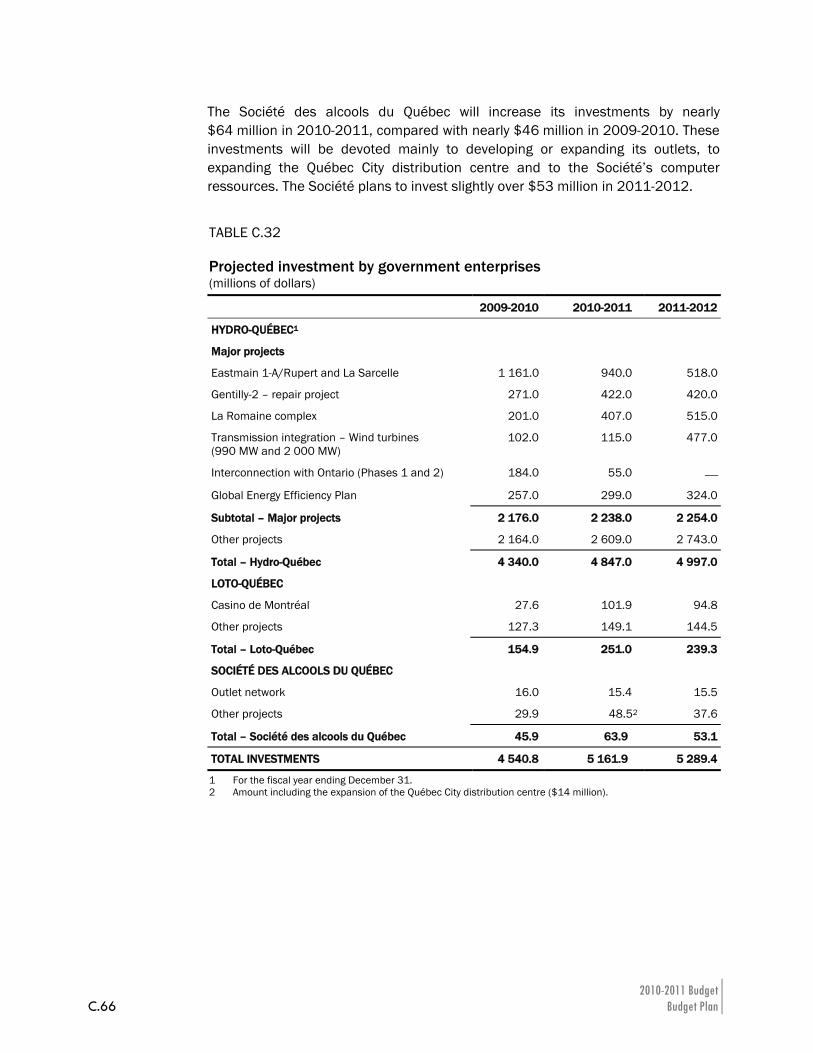
2010-2011 Budget C.66 Budget Plan
The Société des alcools du Québec will increase its investments by nearly $64 million in 2010-2011, compared with nearly $46 million in 2009-2010. These investments will be devoted mainly to developing or expanding its outlets, to expanding the Québec City distribution centre and to the Société’s computer ressources. The Société plans to invest slightly over $53 million in 2011-2012.
TABLE C.32 Projected investment by government enterprises (millions of dollars)
2009-2010 2010-2011 2011-2012
HYDRO-QUÉBEC1
Major projects
Eastmain 1-A/Rupert and La Sarcelle 1 161.0 940.0 518.0
Gentilly-2 – repair project 271.0 422.0 420.0
La Romaine complex 201.0 407.0 515.0
Transmission integration – Wind turbines (990 MW and 2 000 MW)
102.0 115.0 477.0
Interconnection with Ontario (Phases 1 and 2) 184.0 55.0 ⎯
Global Energy Efficiency Plan 257.0 299.0 324.0
Subtotal – Major projects 2 176.0 2 238.0 2 254.0
Other projects 2 164.0 2 609.0 2 743.0
Total – Hydro-Québec 4 340.0 4 847.0 4 997.0
LOTO-QUÉBEC
Casino de Montréal 27.6 101.9 94.8
Other projects 127.3 149.1 144.5
Total – Loto-Québec 154.9 251.0 239.3
SOCIÉTÉ DES ALCOOLS DU QUÉBEC
Outlet network 16.0 15.4 15.5
Other projects 29.9 48.52 37.6
Total – Société des alcools du Québec 45.9 63.9 53.1
TOTAL INVESTMENTS 4 540.8 5 161.9 5 289.4
1 For the fiscal year ending December 31. 2 Amount including the expansion of the Québec City distribution centre ($14 million).
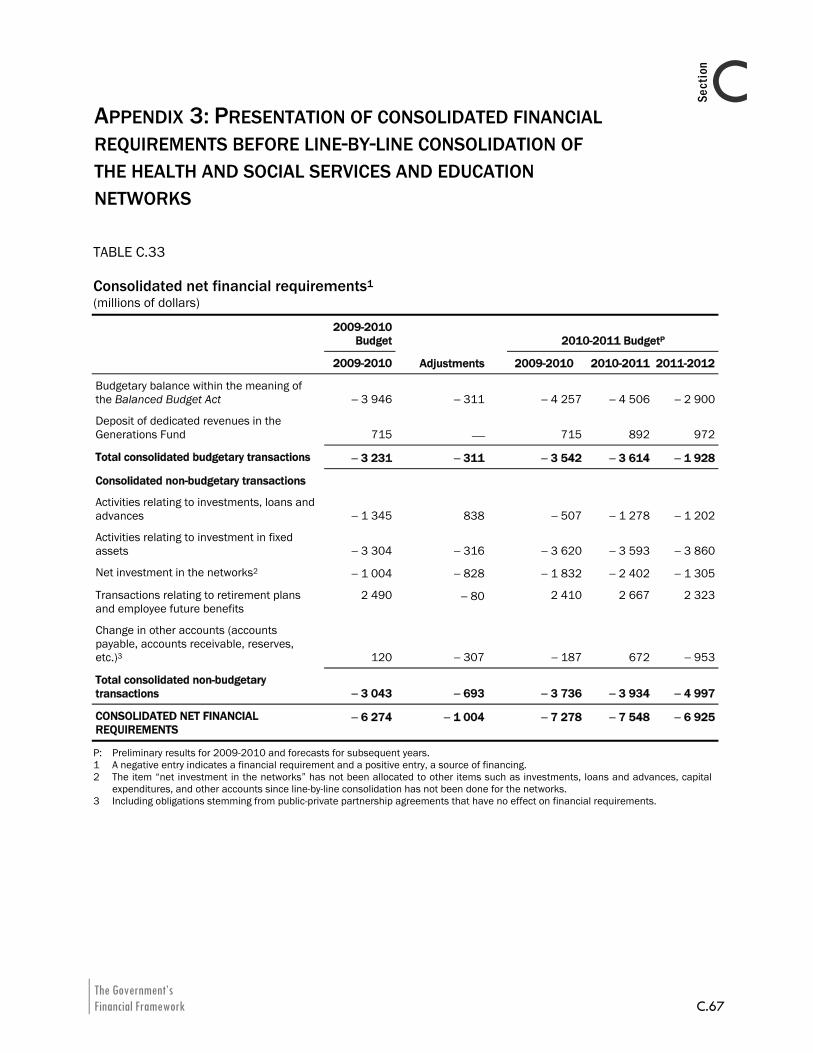
The Government’s Financial Framework C.67
CSection
APPENDIX 3: PRESENTATION OF CONSOLIDATED FINANCIAL REQUIREMENTS BEFORE LINE-BY-LINE CONSOLIDATION OF THE HEALTH AND SOCIAL SERVICES AND EDUCATION NETWORKS
TABLE C.33 Consolidated net financial requirements1 (millions of dollars)
2009-2010
Budget 2010-2011 BudgetP
2009-2010 Adjustments 2009-2010 2010-2011 2011-2012
Budgetary balance within the meaning of the Balanced Budget Act − 3 946 − 311 − 4 257 − 4 506 − 2 900
Deposit of dedicated revenues in the Generations Fund 715 ⎯ 715 892 972
Total consolidated budgetary transactions − 3 231 − 311 − 3 542 − 3 614 − 1 928
Consolidated non-budgetary transactions
Activities relating to investments, loans and advances − 1 345 838 − 507 − 1 278 − 1 202
Activities relating to investment in fixed assets − 3 304 − 316 − 3 620 − 3 593 − 3 860
Net investment in the networks2 − 1 004 − 828 − 1 832 − 2 402 − 1 305
Transactions relating to retirement plans and employee future benefits
2 490 − 80 2 410 2 667 2 323
Change in other accounts (accounts payable, accounts receivable, reserves, etc.)3 120 − 307 − 187 672 − 953
Total consolidated non-budgetary transactions − 3 043 − 693 − 3 736 − 3 934 − 4 997
CONSOLIDATED NET FINANCIAL REQUIREMENTS
− 6 274 − 1 004 − 7 278 − 7 548 − 6 925
P: Preliminary results for 2009-2010 and forecasts for subsequent years. 1 A negative entry indicates a financial requirement and a positive entry, a source of financing. 2 The item “net investment in the networks” has not been allocated to other items such as investments, loans and advances, capital
expenditures, and other accounts since line-by-line consolidation has not been done for the networks. 3 Including obligations stemming from public-private partnership agreements that have no effect on financial requirements.

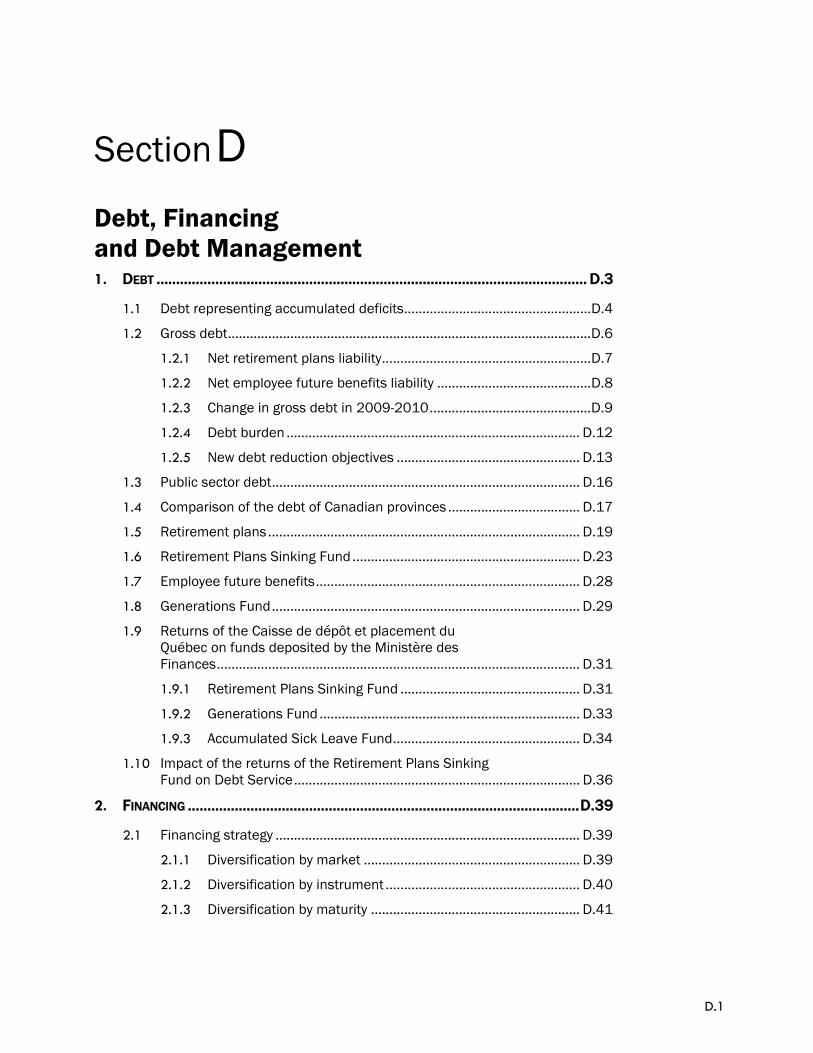
D.1
Section D
D Debt, Financing and Debt Management 1. DEBT .............................................................................................................. D.3
1.1 Debt representing accumulated deficits...................................................D.4 1.2 Gross debt...................................................................................................D.6
1.2.1 Net retirement plans liability.........................................................D.7 1.2.2 Net employee future benefits liability ..........................................D.8 1.2.3 Change in gross debt in 2009-2010............................................D.9 1.2.4 Debt burden ................................................................................ D.12 1.2.5 New debt reduction objectives .................................................. D.13
1.3 Public sector debt.................................................................................... D.16 1.4 Comparison of the debt of Canadian provinces .................................... D.17 1.5 Retirement plans ..................................................................................... D.19 1.6 Retirement Plans Sinking Fund .............................................................. D.23 1.7 Employee future benefits........................................................................ D.28 1.8 Generations Fund.................................................................................... D.29 1.9 Returns of the Caisse de dépôt et placement du
Québec on funds deposited by the Ministère des Finances................................................................................................... D.31 1.9.1 Retirement Plans Sinking Fund ................................................. D.31 1.9.2 Generations Fund ....................................................................... D.33 1.9.3 Accumulated Sick Leave Fund................................................... D.34
1.10 Impact of the returns of the Retirement Plans Sinking Fund on Debt Service.............................................................................. D.36
2. FINANCING ....................................................................................................D.39
2.1 Financing strategy ................................................................................... D.39 2.1.1 Diversification by market ........................................................... D.39 2.1.2 Diversification by instrument ..................................................... D.40 2.1.3 Diversification by maturity ......................................................... D.41

D.2
2.2 Financing program................................................................................... D.42 2.2.1 Yield ............................................................................................. D.44
3. DEBT MANAGEMENT ......................................................................................D.47
3.1 Structure of the debt by currency ........................................................... D.47 3.2 Structure of the debt by interest rate..................................................... D.49
4. CREDIT RATINGS............................................................................................D.51
4.1 The Québec government’s credit ratings ............................................... D.51 4.2 Comparison of the credit ratings of Canadian
provinces.................................................................................................. D.56 5. ADDITIONAL INFORMATION..............................................................................D.59
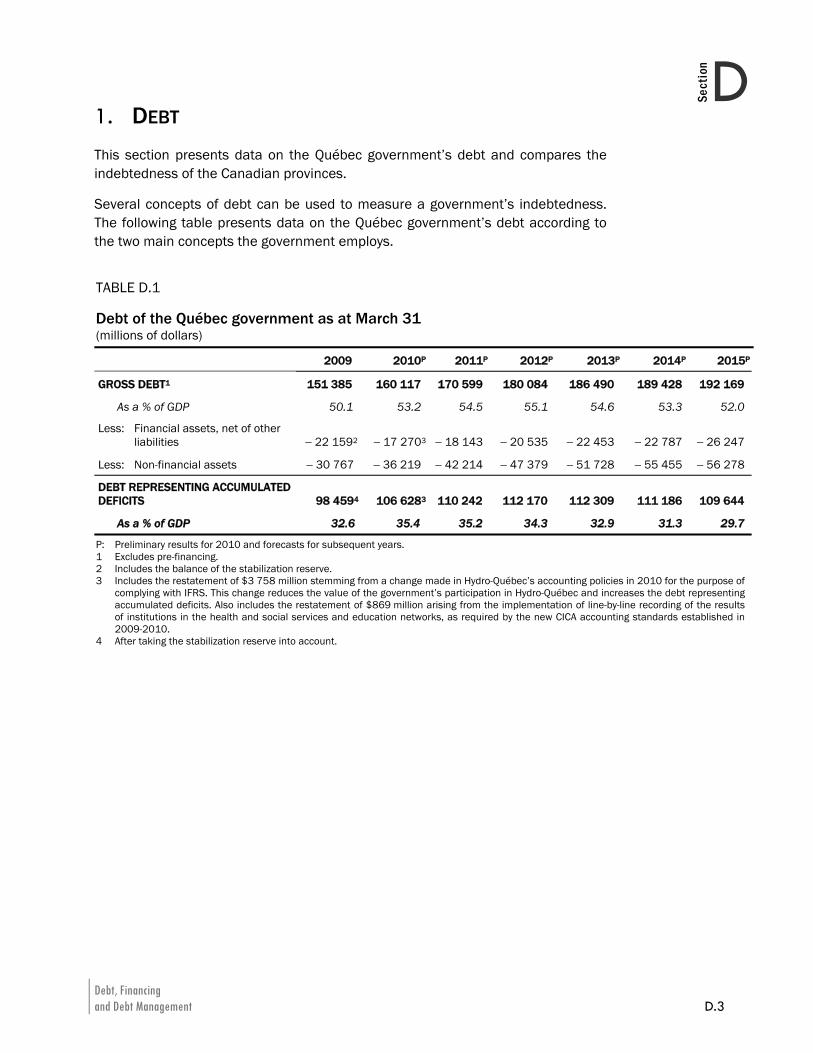
Debt, Financing and Debt Management D.3
DSection
1. DEBT This section presents data on the Québec government’s debt and compares the indebtedness of the Canadian provinces.
Several concepts of debt can be used to measure a government’s indebtedness. The following table presents data on the Québec government’s debt according to the two main concepts the government employs.
TABLE D.1 Debt of the Québec government as at March 31 (millions of dollars)
2009 2010P 2011P 2012P 2013P 2014P 2015P
GROSS DEBT1 151 385 160 117 170 599 180 084 186 490 189 428 192 169
As a % of GDP 50.1 53.2 54.5 55.1 54.6 53.3 52.0
Less: Financial assets, net of other liabilities − 22 1592 − 17 2703 − 18 143 − 20 535 − 22 453 − 22 787 − 26 247
Less: Non-financial assets − 30 767 − 36 219 − 42 214 − 47 379 − 51 728 − 55 455 − 56 278
DEBT REPRESENTING ACCUMULATED DEFICITS 98 4594 106 6283 110 242 112 170 112 309 111 186 109 644
As a % of GDP 32.6 35.4 35.2 34.3 32.9 31.3 29.7
P: Preliminary results for 2010 and forecasts for subsequent years. 1 Excludes pre-financing. 2 Includes the balance of the stabilization reserve. 3 Includes the restatement of $3 758 million stemming from a change made in Hydro-Québec’s accounting policies in 2010 for the purpose of
complying with IFRS. This change reduces the value of the government’s participation in Hydro-Québec and increases the debt representing accumulated deficits. Also includes the restatement of $869 million arising from the implementation of line-by-line recording of the results of institutions in the health and social services and education networks, as required by the new CICA accounting standards established in 2009-2010.
4 After taking the stabilization reserve into account.
2010-2011 Budget D.4 Budget Plan
1.1 Debt representing accumulated deficits
Debt representing accumulated deficits is a simple concept that reflects the financial position of a government well, since it takes all of its liabilities and assets into account. The federal government and the governments of Ontario and Alberta use debt representing accumulated deficits as a measure of indebtedness in their budget documents.
The debt representing accumulated deficits corresponds to the difference between the government’s liabilities and its financial and non-financial assets as a whole. The debt representing accumulated deficits is calculated by subtracting financial assets, net of other liabilities, as well as non-financial assets from the gross debt.
Preliminary results show that the debt representing accumulated deficits should amount to $106 628 million as at March 31, 2010, or 35.4% of gross domestic product (GDP).
The debt representing accumulated deficits as at March 31, 2010 has been adjusted to take into account a change made by Hydro-Québec in its accounting policies in early 2010 for the purpose of complying with International Financial Reporting Standards (IFRS). All entities subject to public accountability and government enterprises will have to apply IFRS as of January 1, 2011. These standards differ significantly from those currently in effect, particularly with regard to the accounting method for capital expenditures. This change in accounting policies reduces Hydro-Québec’s retained earnings balance by $3 758 million. Therefore, the value of the government’s participation in Hydro-Québec is reduced by the same amount. This change thus increases the debt representing accumulated deficits by $3 758 million as at March 31, 2010, but does not affect the government’s gross debt.
The debt representing accumulated deficits as at March 31, 2010 has also been restated by $869 million. This restatement arises from the implementation of line by line recording of the results of institutions in the health and social services and education networks, as required by the new CICA accounting standards established in 2009-2010.
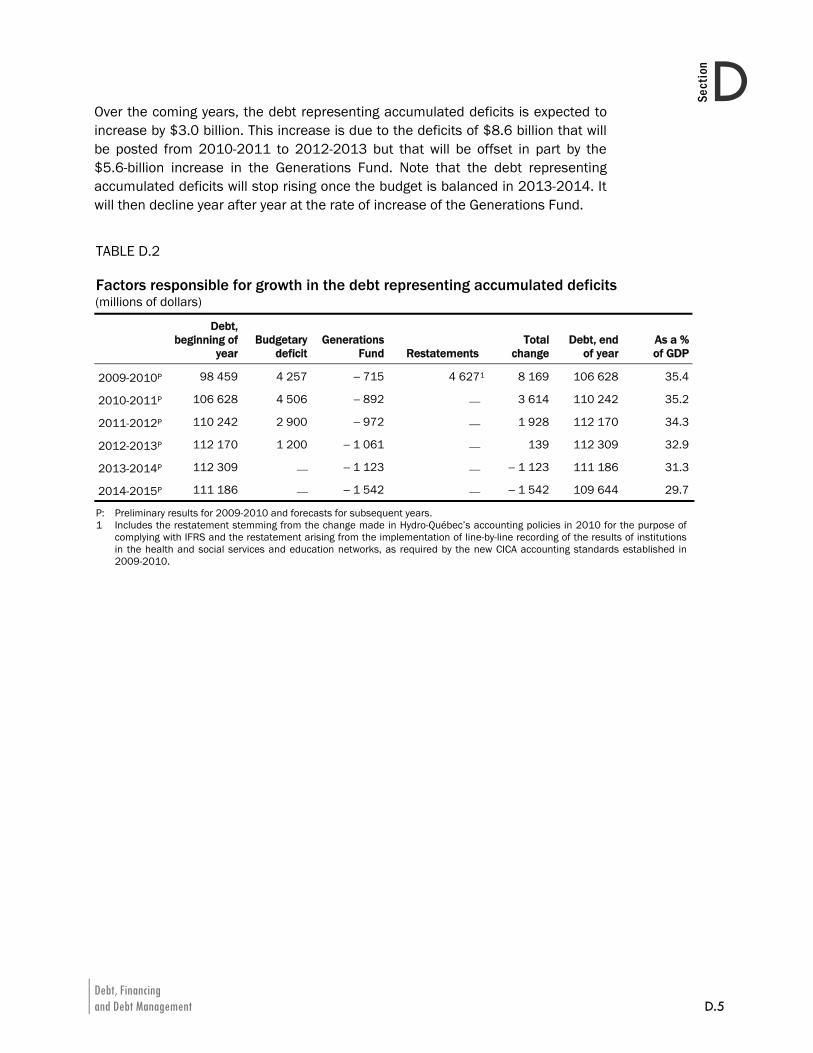
Debt, Financing and Debt Management D.5
DSection
Over the coming years, the debt representing accumulated deficits is expected to increase by $3.0 billion. This increase is due to the deficits of $8.6 billion that will be posted from 2010-2011 to 2012-2013 but that will be offset in part by the $5.6-billion increase in the Generations Fund. Note that the debt representing accumulated deficits will stop rising once the budget is balanced in 2013-2014. It will then decline year after year at the rate of increase of the Generations Fund.
TABLE D.2 Factors responsible for growth in the debt representing accumulated deficits (millions of dollars)
Debt, beginning of
year Budgetary
deficit Generations
Fund Restatements Total
changeDebt, end
of year As a % of GDP
2009-2010P 98 459 4 257 − 715 4 6271 8 169 106 628 35.4
2010-2011P 106 628 4 506 − 892 ⎯ 3 614 110 242 35.2
2011-2012P 110 242 2 900 − 972 ⎯ 1 928 112 170 34.3
2012-2013P 112 170 1 200 − 1 061 ⎯ 139 112 309 32.9
2013-2014P 112 309 ⎯ − 1 123 ⎯ − 1 123 111 186 31.3
2014-2015P 111 186 ⎯ − 1 542 ⎯ − 1 542 109 644 29.7
P: Preliminary results for 2009-2010 and forecasts for subsequent years. 1 Includes the restatement stemming from the change made in Hydro-Québec’s accounting policies in 2010 for the purpose of
complying with IFRS and the restatement arising from the implementation of line-by-line recording of the results of institutions in the health and social services and education networks, as required by the new CICA accounting standards established in 2009-2010.
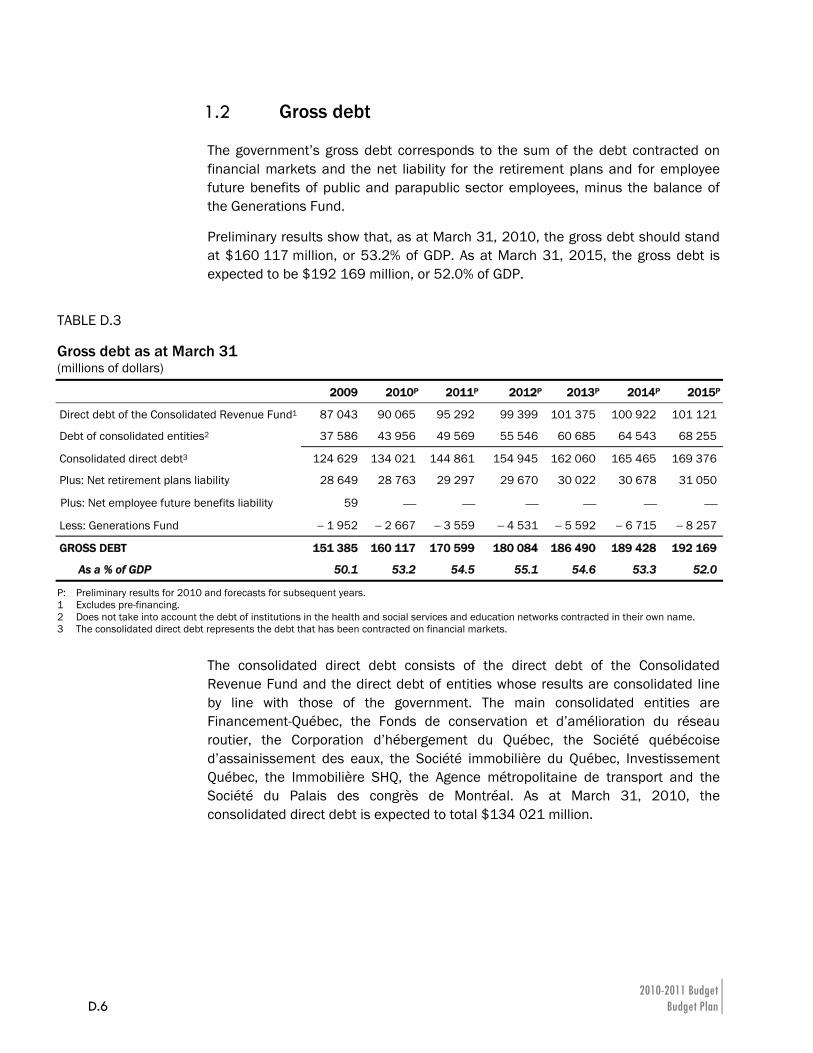
2010-2011 Budget D.6 Budget Plan
1.2 Gross debt
The government’s gross debt corresponds to the sum of the debt contracted on financial markets and the net liability for the retirement plans and for employee future benefits of public and parapublic sector employees, minus the balance of the Generations Fund.
Preliminary results show that, as at March 31, 2010, the gross debt should stand at $160 117 million, or 53.2% of GDP. As at March 31, 2015, the gross debt is expected to be $192 169 million, or 52.0% of GDP.
TABLE D.3 Gross debt as at March 31 (millions of dollars)
2009 2010P 2011P 2012P 2013P 2014P 2015P
Direct debt of the Consolidated Revenue Fund1 87 043 90 065 95 292 99 399 101 375 100 922 101 121
Debt of consolidated entities2 37 586 43 956 49 569 55 546 60 685 64 543 68 255
Consolidated direct debt3 124 629 134 021 144 861 154 945 162 060 165 465 169 376
Plus: Net retirement plans liability 28 649 28 763 29 297 29 670 30 022 30 678 31 050
Plus: Net employee future benefits liability 59 ⎯ ⎯ ⎯ ⎯ ⎯ ⎯
Less: Generations Fund − 1 952 − 2 667 − 3 559 − 4 531 − 5 592 − 6 715 − 8 257
GROSS DEBT 151 385 160 117 170 599 180 084 186 490 189 428 192 169
As a % of GDP 50.1 53.2 54.5 55.1 54.6 53.3 52.0
P: Preliminary results for 2010 and forecasts for subsequent years. 1 Excludes pre-financing. 2 Does not take into account the debt of institutions in the health and social services and education networks contracted in their own name. 3 The consolidated direct debt represents the debt that has been contracted on financial markets.
The consolidated direct debt consists of the direct debt of the Consolidated Revenue Fund and the direct debt of entities whose results are consolidated line by line with those of the government. The main consolidated entities are Financement-Québec, the Fonds de conservation et d’amélioration du réseau routier, the Corporation d’hébergement du Québec, the Société québécoise d’assainissement des eaux, the Société immobilière du Québec, Investissement Québec, the Immobilière SHQ, the Agence métropolitaine de transport and the Société du Palais des congrès de Montréal. As at March 31, 2010, the consolidated direct debt is expected to total $134 021 million.
Debt, Financing and Debt Management D.7
DSection
The net retirement plans liability represents the retirement plans liability minus the balance of the Retirement Plans Sinking Fund (RPSF), an asset established that can be used to pay the retirement benefits of public and parapublic sector employees. As at March 31, 2010, the net retirement plans liability should amount to $28 763 million.
The net liability for employee future benefits consists of the government’s commitments for accumulated sick leave and the survivor’s pension plan, minus assets constituted in regard to these commitments. As at March 31, 2010, the net employee future benefits liability should be nil, since assets will be equal to liabilities.
As at March 31, 2010, the sums accumulated in the Generations Fund are expected to amount to $2 667 million.
1.2.1 Net retirement plans liability
The net retirement plans liability is calculated by subtracting the balance of the RPSF from the retirement plans liability.
The liability for the retirement plans represents the present value of the retirement benefits that the government will pay to public and parapublic sector employees, taking into account the conditions of their plans and their years of service. This liability should stand at $66 961 million as at March 31, 2010.
The government created the RPSF in 1993. As at March 31, 2010, the book value of the RPSF is expected to be $38 198 million.
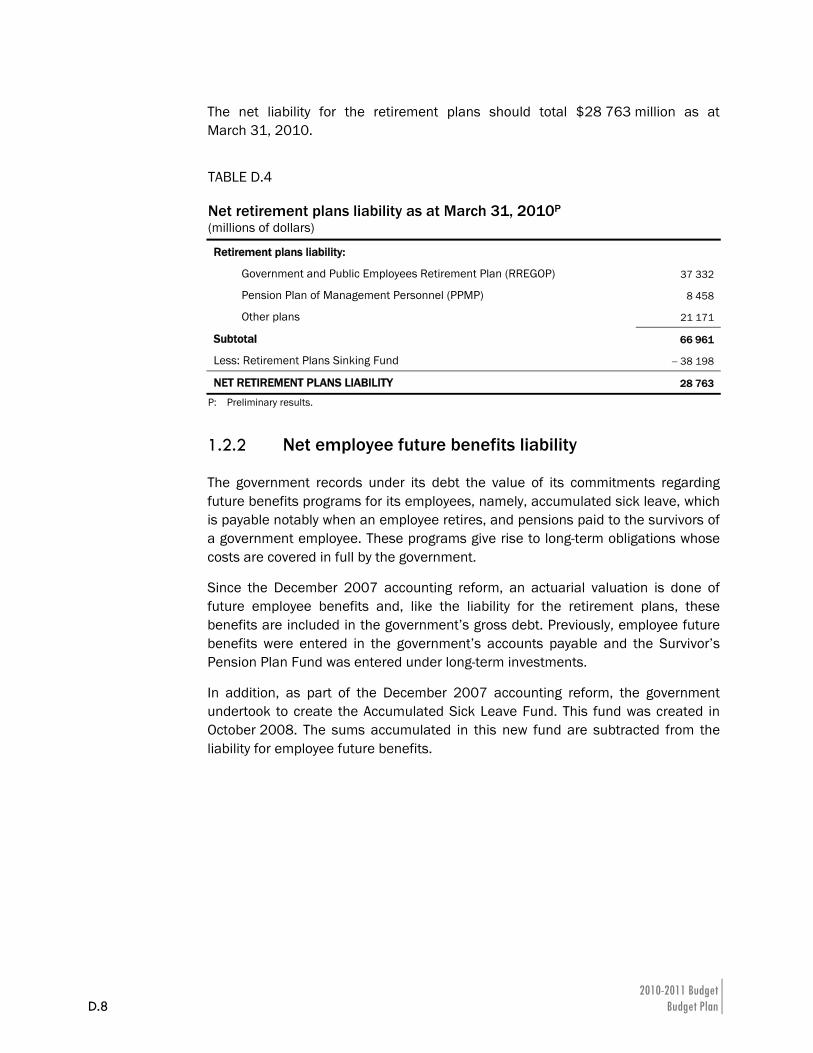
2010-2011 Budget D.8 Budget Plan
The net liability for the retirement plans should total $28 763 million as at March 31, 2010.
1.2.2 Net employee future benefits liability
The government records under its debt the value of its commitments regarding future benefits programs for its employees, namely, accumulated sick leave, which is payable notably when an employee retires, and pensions paid to the survivors of a government employee. These programs give rise to long-term obligations whose costs are covered in full by the government.
Since the December 2007 accounting reform, an actuarial valuation is done of future employee benefits and, like the liability for the retirement plans, these benefits are included in the government’s gross debt. Previously, employee future benefits were entered in the government’s accounts payable and the Survivor’s Pension Plan Fund was entered under long-term investments.
In addition, as part of the December 2007 accounting reform, the government undertook to create the Accumulated Sick Leave Fund. This fund was created in October 2008. The sums accumulated in this new fund are subtracted from the liability for employee future benefits.
TABLE D.4 Net retirement plans liability as at March 31, 2010P (millions of dollars)
Retirement plans liability:
Government and Public Employees Retirement Plan (RREGOP) 37 332
Pension Plan of Management Personnel (PPMP) 8 458
Other plans 21 171
Subtotal 66 961
Less: Retirement Plans Sinking Fund − 38 198
NET RETIREMENT PLANS LIABILITY 28 763
P: Preliminary results.
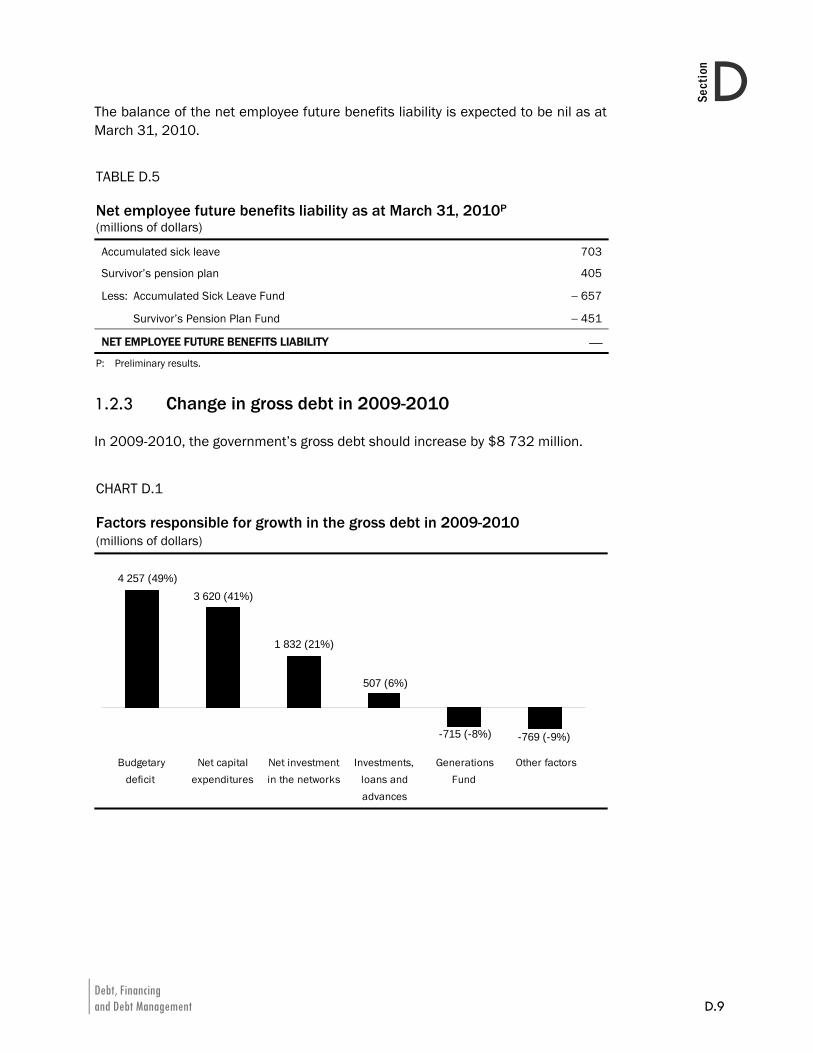
Debt, Financing and Debt Management D.9
DSection
The balance of the net employee future benefits liability is expected to be nil as at March 31, 2010.
TABLE D.5 Net employee future benefits liability as at March 31, 2010P (millions of dollars)
Accumulated sick leave 703
Survivor’s pension plan 405
Less: Accumulated Sick Leave Fund − 657
Survivor’s Pension Plan Fund − 451
NET EMPLOYEE FUTURE BENEFITS LIABILITY ⎯
P: Preliminary results.
1.2.3 Change in gross debt in 2009-2010
In 2009-2010, the government’s gross debt should increase by $8 732 million.
CHART D.1 Factors responsible for growth in the gross debt in 2009-2010 (millions of dollars)
4 257 (49%)3 620 (41%)
1 832 (21%)
507 (6%)
-715 (-8%) -769 (-9%)
Budgetarydeficit
Net capitalexpenditures
Net investmentin the networks
Investments,loans andadvances
GenerationsFund
Other factors
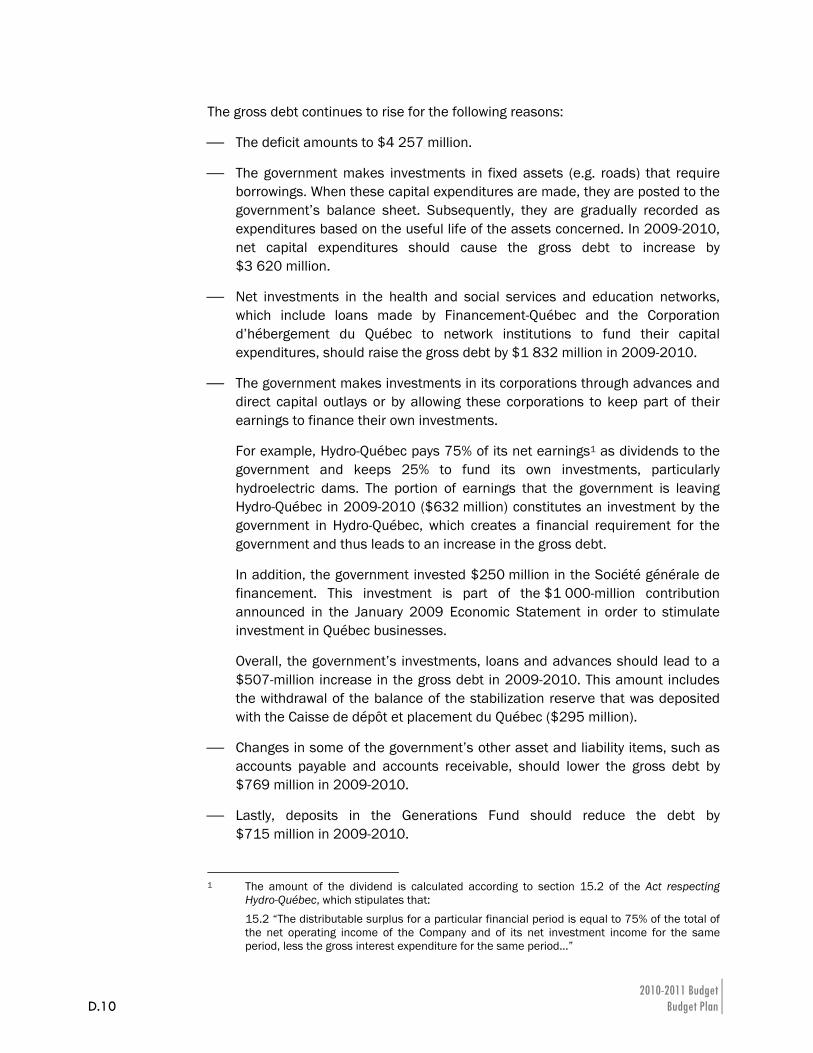
2010-2011 Budget D.10 Budget Plan
The gross debt continues to rise for the following reasons:
⎯ The deficit amounts to $4 257 million.
⎯ The government makes investments in fixed assets (e.g. roads) that require borrowings. When these capital expenditures are made, they are posted to the government’s balance sheet. Subsequently, they are gradually recorded as expenditures based on the useful life of the assets concerned. In 2009-2010, net capital expenditures should cause the gross debt to increase by $3 620 million.
⎯ Net investments in the health and social services and education networks, which include loans made by Financement-Québec and the Corporation d’hébergement du Québec to network institutions to fund their capital expenditures, should raise the gross debt by $1 832 million in 2009-2010.
⎯ The government makes investments in its corporations through advances and direct capital outlays or by allowing these corporations to keep part of their earnings to finance their own investments.
For example, Hydro-Québec pays 75% of its net earnings1 as dividends to the government and keeps 25% to fund its own investments, particularly hydroelectric dams. The portion of earnings that the government is leaving Hydro-Québec in 2009-2010 ($632 million) constitutes an investment by the government in Hydro-Québec, which creates a financial requirement for the government and thus leads to an increase in the gross debt.
In addition, the government invested $250 million in the Société générale de financement. This investment is part of the $1 000-million contribution announced in the January 2009 Economic Statement in order to stimulate investment in Québec businesses.
Overall, the government’s investments, loans and advances should lead to a $507-million increase in the gross debt in 2009-2010. This amount includes the withdrawal of the balance of the stabilization reserve that was deposited with the Caisse de dépôt et placement du Québec ($295 million).
⎯ Changes in some of the government’s other asset and liability items, such as accounts payable and accounts receivable, should lower the gross debt by $769 million in 2009-2010.
⎯ Lastly, deposits in the Generations Fund should reduce the debt by $715 million in 2009-2010.
1 The amount of the dividend is calculated according to section 15.2 of the Act respecting
Hydro-Québec, which stipulates that: 15.2 “The distributable surplus for a particular financial period is equal to 75% of the total of
the net operating income of the Company and of its net investment income for the same period, less the gross interest expenditure for the same period...”
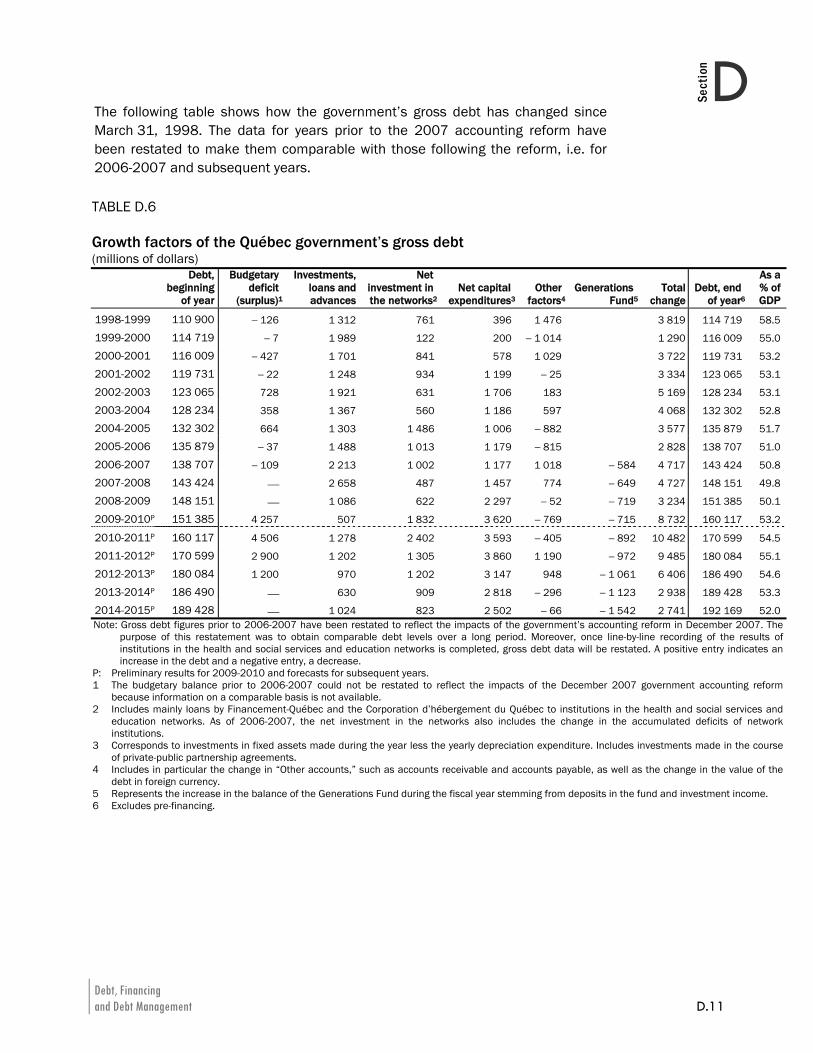
Debt, Financing and Debt Management D.11
DSection
The following table shows how the government’s gross debt has changed since March 31, 1998. The data for years prior to the 2007 accounting reform have been restated to make them comparable with those following the reform, i.e. for 2006-2007 and subsequent years.
TABLE D.6 Growth factors of the Québec government’s gross debt (millions of dollars)
Debt, beginning
of year
Budgetary deficit
(surplus)1
Investments, loans and advances
Netinvestment in the networks2
Net capitalexpenditures3
Otherfactors4
Generations Fund5
Total change
Debt, endof year6
As a% of GDP
1998-1999 110 900 − 126 1 312 761 396 1 476 3 819 114 719 58.5
1999-2000 114 719 − 7 1 989 122 200 − 1 014 1 290 116 009 55.0
2000-2001 116 009 − 427 1 701 841 578 1 029 3 722 119 731 53.2
2001-2002 119 731 − 22 1 248 934 1 199 − 25 3 334 123 065 53.1
2002-2003 123 065 728 1 921 631 1 706 183 5 169 128 234 53.1
2003-2004 128 234 358 1 367 560 1 186 597 4 068 132 302 52.8
2004-2005 132 302 664 1 303 1 486 1 006 − 882 3 577 135 879 51.7
2005-2006 135 879 − 37 1 488 1 013 1 179 − 815 2 828 138 707 51.0
2006-2007 138 707 − 109 2 213 1 002 1 177 1 018 − 584 4 717 143 424 50.8
2007-2008 143 424 ⎯ 2 658 487 1 457 774 − 649 4 727 148 151 49.8
2008-2009 148 151 ⎯ 1 086 622 2 297 − 52 − 719 3 234 151 385 50.1
2009-2010P 151 385 4 257 507 1 832 3 620 − 769 − 715 8 732 160 117 53.2
2010-2011P 160 117 4 506 1 278 2 402 3 593 − 405 − 892 10 482 170 599 54.5
2011-2012P 170 599 2 900 1 202 1 305 3 860 1 190 − 972 9 485 180 084 55.1
2012-2013P 180 084 1 200 970 1 202 3 147 948 − 1 061 6 406 186 490 54.6
2013-2014P 186 490 ⎯ 630 909 2 818 − 296 − 1 123 2 938 189 428 53.3
2014-2015P 189 428 ⎯ 1 024 823 2 502 − 66 − 1 542 2 741 192 169 52.0Note: Gross debt figures prior to 2006-2007 have been restated to reflect the impacts of the government’s accounting reform in December 2007. The
purpose of this restatement was to obtain comparable debt levels over a long period. Moreover, once line-by-line recording of the results of institutions in the health and social services and education networks is completed, gross debt data will be restated. A positive entry indicates an increase in the debt and a negative entry, a decrease.
P: Preliminary results for 2009-2010 and forecasts for subsequent years. 1 The budgetary balance prior to 2006-2007 could not be restated to reflect the impacts of the December 2007 government accounting reform
because information on a comparable basis is not available. 2 Includes mainly loans by Financement-Québec and the Corporation d’hébergement du Québec to institutions in the health and social services and
education networks. As of 2006-2007, the net investment in the networks also includes the change in the accumulated deficits of network institutions.
3 Corresponds to investments in fixed assets made during the year less the yearly depreciation expenditure. Includes investments made in the course of private-public partnership agreements.
4 Includes in particular the change in “Other accounts,” such as accounts receivable and accounts payable, as well as the change in the value of the debt in foreign currency.
5 Represents the increase in the balance of the Generations Fund during the fiscal year stemming from deposits in the fund and investment income. 6 Excludes pre-financing.
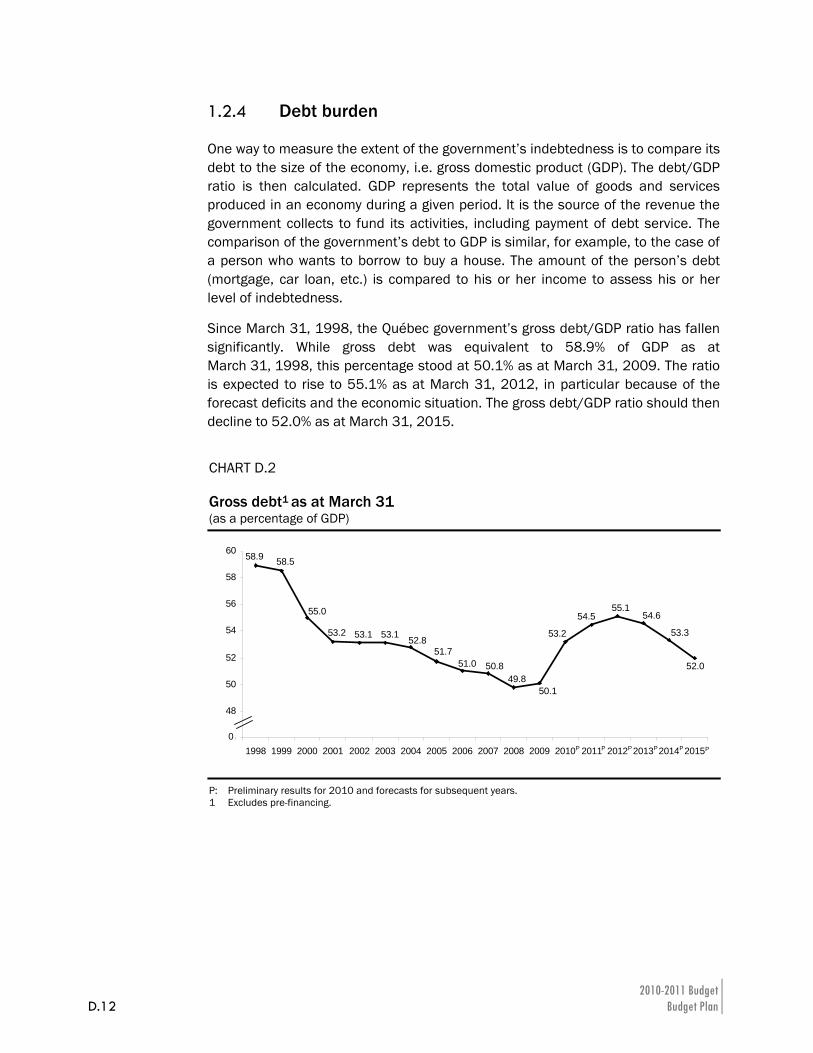
2010-2011 Budget D.12 Budget Plan
1.2.4 Debt burden
One way to measure the extent of the government’s indebtedness is to compare its debt to the size of the economy, i.e. gross domestic product (GDP). The debt/GDP ratio is then calculated. GDP represents the total value of goods and services produced in an economy during a given period. It is the source of the revenue the government collects to fund its activities, including payment of debt service. The comparison of the government’s debt to GDP is similar, for example, to the case of a person who wants to borrow to buy a house. The amount of the person’s debt (mortgage, car loan, etc.) is compared to his or her income to assess his or her level of indebtedness.
Since March 31, 1998, the Québec government’s gross debt/GDP ratio has fallen significantly. While gross debt was equivalent to 58.9% of GDP as at March 31, 1998, this percentage stood at 50.1% as at March 31, 2009. The ratio is expected to rise to 55.1% as at March 31, 2012, in particular because of the forecast deficits and the economic situation. The gross debt/GDP ratio should then decline to 52.0% as at March 31, 2015.
CHART D.2 Gross debt1 as at March 31 (as a percentage of GDP)
50.149.8
50.851.051.7
52.853.153.153.2
55.0
58.558.9
54.555.1
54.6
53.2 53.3
52.0
46
48
50
52
54
56
58
60
1998 1999 2000 2001 2002 2003 2004 2005 2006 2007 2008 2009 2010 2011 2012 2013 2014 20150
PPP P P P
P: Preliminary results for 2010 and forecasts for subsequent years. 1 Excludes pre-financing.
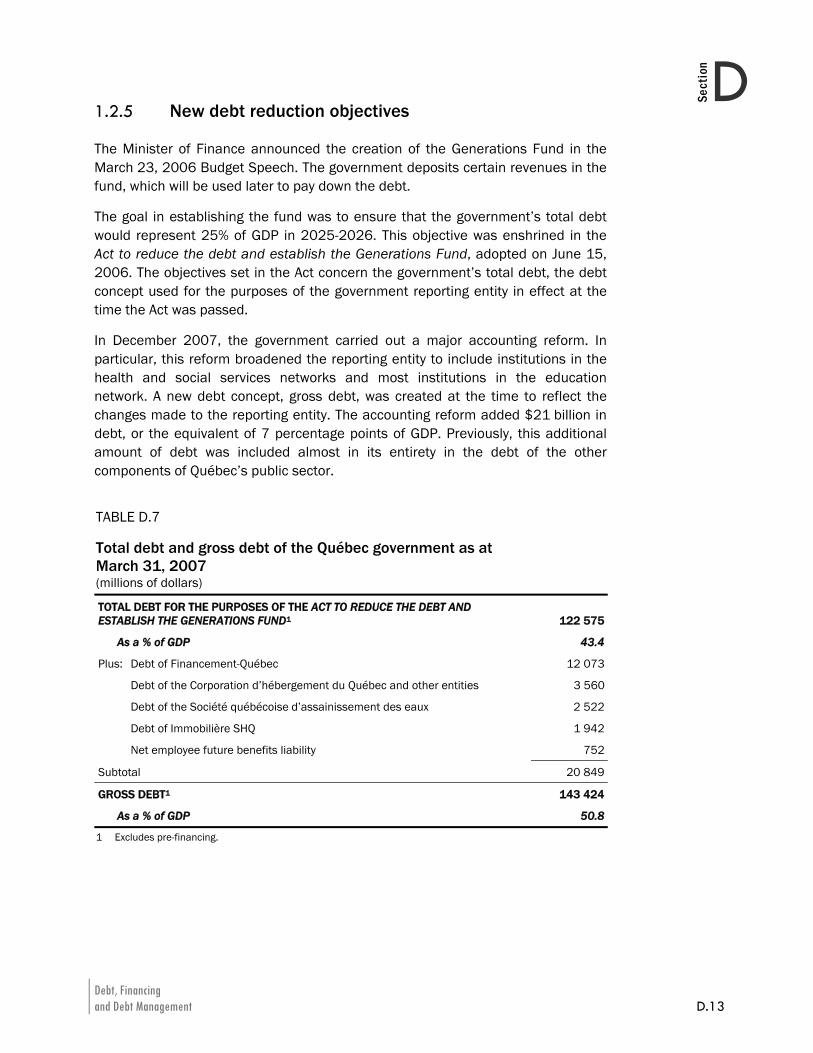
Debt, Financing and Debt Management D.13
DSection
1.2.5 New debt reduction objectives
The Minister of Finance announced the creation of the Generations Fund in the March 23, 2006 Budget Speech. The government deposits certain revenues in the fund, which will be used later to pay down the debt.
The goal in establishing the fund was to ensure that the government’s total debt would represent 25% of GDP in 2025-2026. This objective was enshrined in the Act to reduce the debt and establish the Generations Fund, adopted on June 15, 2006. The objectives set in the Act concern the government’s total debt, the debt concept used for the purposes of the government reporting entity in effect at the time the Act was passed.
In December 2007, the government carried out a major accounting reform. In particular, this reform broadened the reporting entity to include institutions in the health and social services networks and most institutions in the education network. A new debt concept, gross debt, was created at the time to reflect the changes made to the reporting entity. The accounting reform added $21 billion in debt, or the equivalent of 7 percentage points of GDP. Previously, this additional amount of debt was included almost in its entirety in the debt of the other components of Québec’s public sector.
TABLE D.7 Total debt and gross debt of the Québec government as at March 31, 2007 (millions of dollars)
TOTAL DEBT FOR THE PURPOSES OF THE ACT TO REDUCE THE DEBT AND ESTABLISH THE GENERATIONS FUND1 122 575
As a % of GDP 43.4
Plus: Debt of Financement-Québec 12 073
Debt of the Corporation d’hébergement du Québec and other entities 3 560
Debt of the Société québécoise d’assainissement des eaux 2 522
Debt of Immobilière SHQ 1 942
Net employee future benefits liability 752
Subtotal 20 849
GROSS DEBT1 143 424
As a % of GDP 50.8
1 Excludes pre-financing.
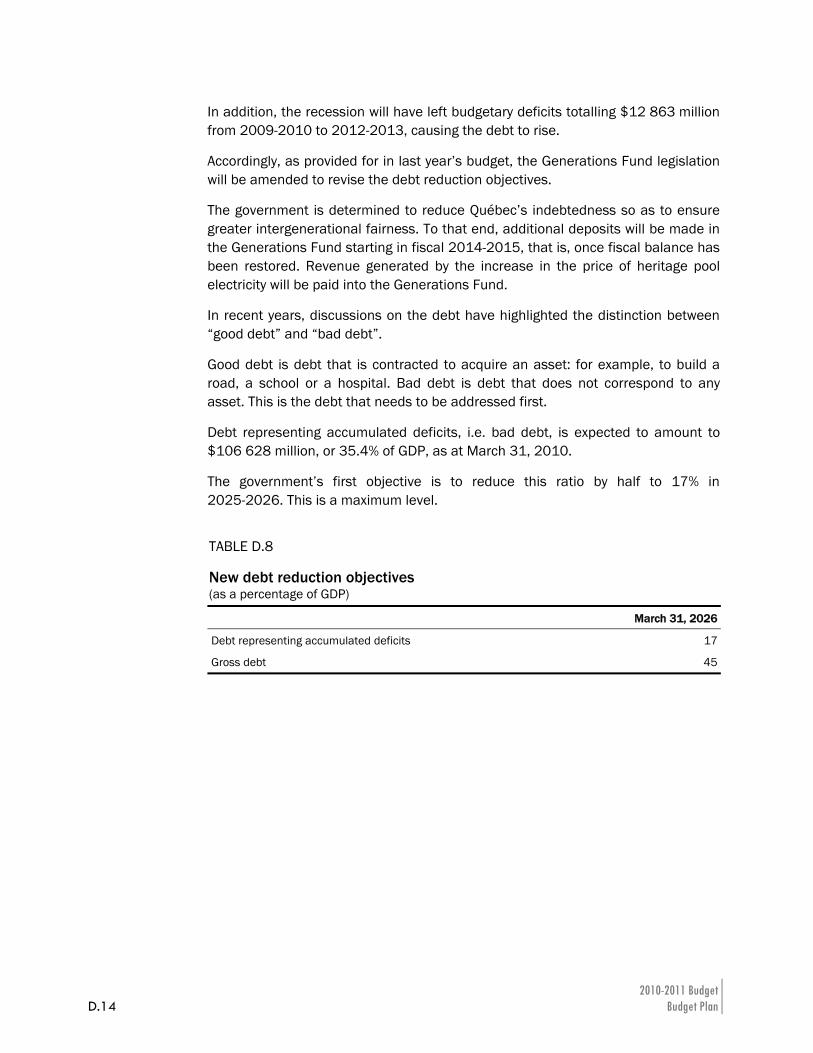
2010-2011 Budget D.14 Budget Plan
In addition, the recession will have left budgetary deficits totalling $12 863 million from 2009-2010 to 2012-2013, causing the debt to rise.
Accordingly, as provided for in last year’s budget, the Generations Fund legislation will be amended to revise the debt reduction objectives.
The government is determined to reduce Québec’s indebtedness so as to ensure greater intergenerational fairness. To that end, additional deposits will be made in the Generations Fund starting in fiscal 2014-2015, that is, once fiscal balance has been restored. Revenue generated by the increase in the price of heritage pool electricity will be paid into the Generations Fund.
In recent years, discussions on the debt have highlighted the distinction between “good debt” and “bad debt”.
Good debt is debt that is contracted to acquire an asset: for example, to build a road, a school or a hospital. Bad debt is debt that does not correspond to any asset. This is the debt that needs to be addressed first.
Debt representing accumulated deficits, i.e. bad debt, is expected to amount to $106 628 million, or 35.4% of GDP, as at March 31, 2010.
The government’s first objective is to reduce this ratio by half to 17% in 2025-2026. This is a maximum level.
TABLE D.8 New debt reduction objectives (as a percentage of GDP)
March 31, 2026
Debt representing accumulated deficits 17
Gross debt 45
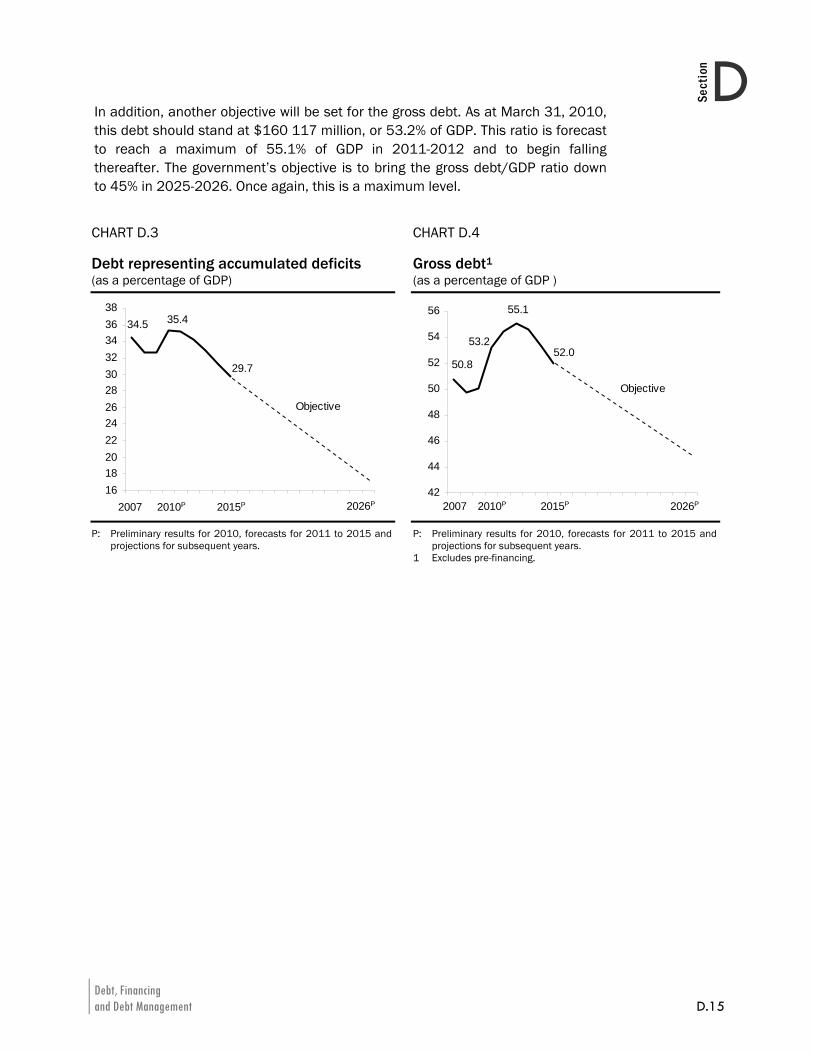
Debt, Financing and Debt Management D.15
DSection
In addition, another objective will be set for the gross debt. As at March 31, 2010, this debt should stand at $160 117 million, or 53.2% of GDP. This ratio is forecast to reach a maximum of 55.1% of GDP in 2011-2012 and to begin falling thereafter. The government’s objective is to bring the gross debt/GDP ratio down to 45% in 2025-2026. Once again, this is a maximum level.
CHART D.3 Debt representing accumulated deficits
CHART D.4 Gross debt1
(as a percentage of GDP) (as a percentage of GDP )
34.5
29.7
161820222426283032343638
2006-2007
2010-2011
2014-2015
2018-2019
2022-2023
Objective
35.4
2007 2026P2010P 2015P
52.050.8
42
44
46
48
50
52
54
56
2006- 2010- 2014- 2018- 2022-
Objective
53.2
2007 2026P2010P 2015P
55.1
P: Preliminary results for 2010, forecasts for 2011 to 2015 and projections for subsequent years.
P: Preliminary results for 2010, forecasts for 2011 to 2015 and projections for subsequent years.
1 Excludes pre-financing.
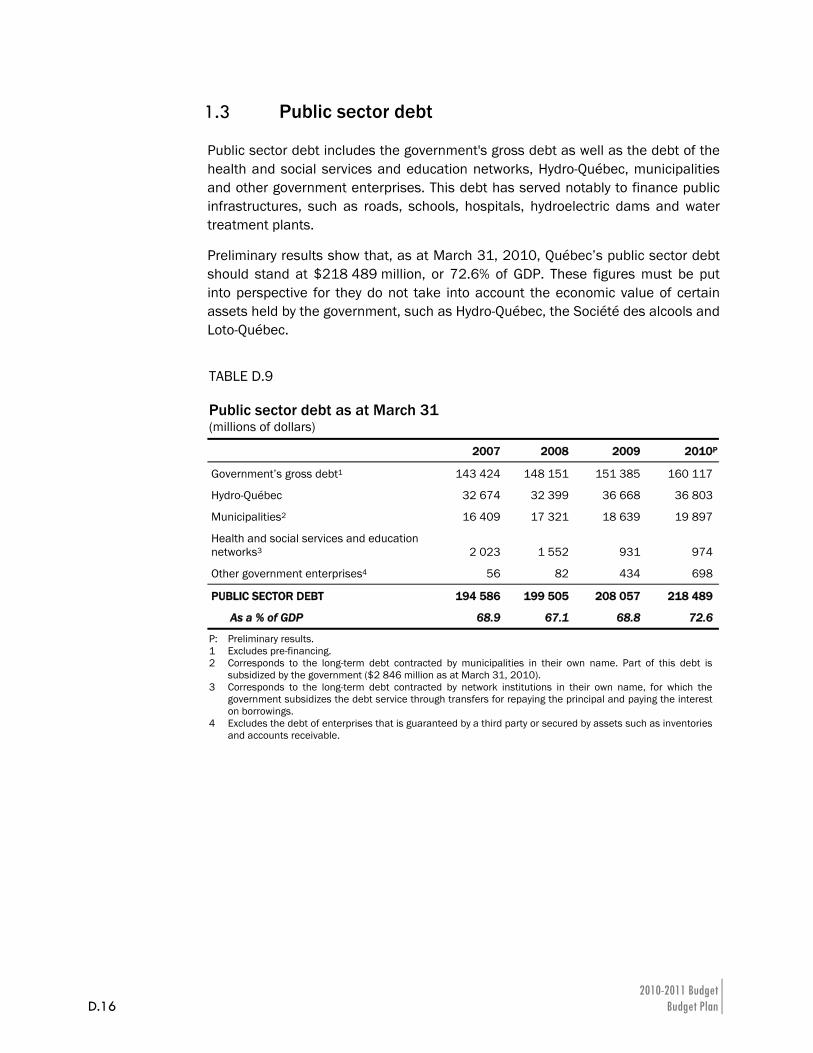
2010-2011 Budget D.16 Budget Plan
1.3 Public sector debt
Public sector debt includes the government's gross debt as well as the debt of the health and social services and education networks, Hydro-Québec, municipalities and other government enterprises. This debt has served notably to finance public infrastructures, such as roads, schools, hospitals, hydroelectric dams and water treatment plants.
Preliminary results show that, as at March 31, 2010, Québec’s public sector debt should stand at $218 489 million, or 72.6% of GDP. These figures must be put into perspective for they do not take into account the economic value of certain assets held by the government, such as Hydro-Québec, the Société des alcools and Loto-Québec.
TABLE D.9 Public sector debt as at March 31 (millions of dollars)
2007 2008 2009 2010P
Government’s gross debt1 143 424 148 151 151 385 160 117
Hydro-Québec 32 674 32 399 36 668 36 803
Municipalities2 16 409 17 321 18 639 19 897
Health and social services and education networks3 2 023 1 552 931 974
Other government enterprises4 56 82 434 698
PUBLIC SECTOR DEBT 194 586 199 505 208 057 218 489
As a % of GDP 68.9 67.1 68.8 72.6
P: Preliminary results. 1 Excludes pre-financing. 2 Corresponds to the long-term debt contracted by municipalities in their own name. Part of this debt is
subsidized by the government ($2 846 million as at March 31, 2010). 3 Corresponds to the long-term debt contracted by network institutions in their own name, for which the
government subsidizes the debt service through transfers for repaying the principal and paying the interest on borrowings.
4 Excludes the debt of enterprises that is guaranteed by a third party or secured by assets such as inventories and accounts receivable.
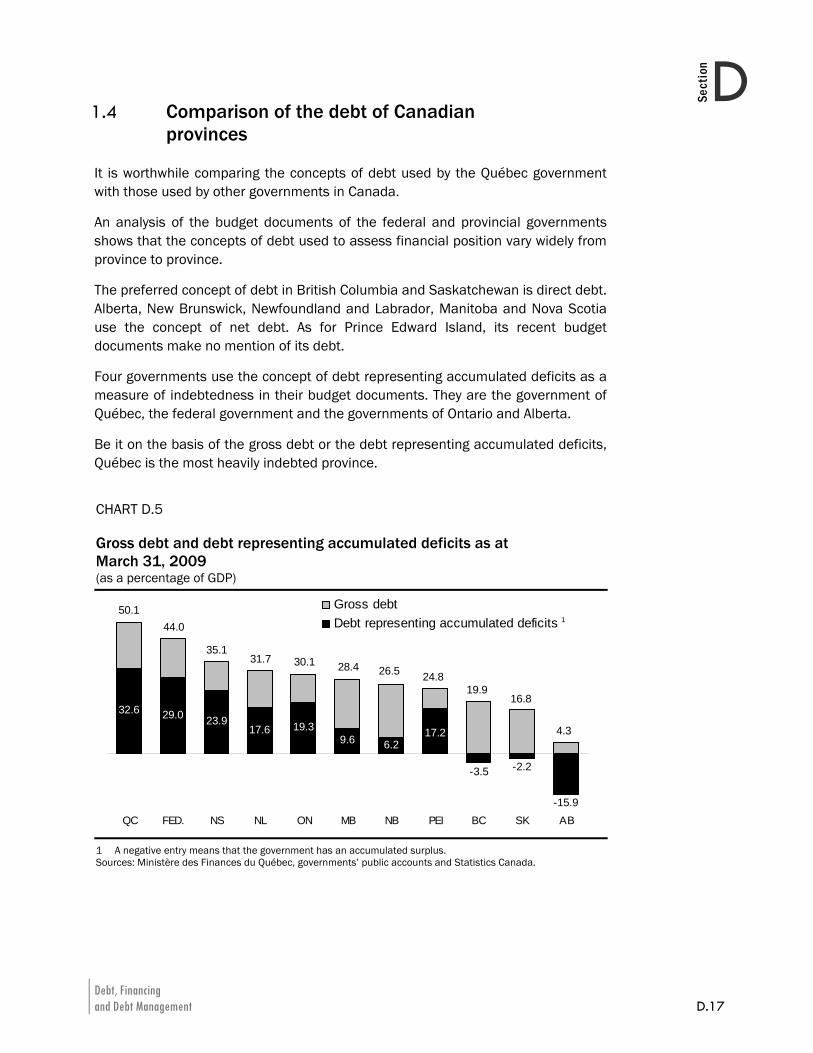
Debt, Financing and Debt Management D.17
DSection
1.4 Comparison of the debt of Canadian provinces
It is worthwhile comparing the concepts of debt used by the Québec government with those used by other governments in Canada.
An analysis of the budget documents of the federal and provincial governments shows that the concepts of debt used to assess financial position vary widely from province to province.
The preferred concept of debt in British Columbia and Saskatchewan is direct debt. Alberta, New Brunswick, Newfoundland and Labrador, Manitoba and Nova Scotia use the concept of net debt. As for Prince Edward Island, its recent budget documents make no mention of its debt.
Four governments use the concept of debt representing accumulated deficits as a measure of indebtedness in their budget documents. They are the government of Québec, the federal government and the governments of Ontario and Alberta.
Be it on the basis of the gross debt or the debt representing accumulated deficits, Québec is the most heavily indebted province.
CHART D.5 Gross debt and debt representing accumulated deficits as at March 31, 2009 (as a percentage of GDP)
17.26.29.6
19.317.623.929.032.6
-15.9
-2.2-3.5
QC FED. NS NL ON MB NB PEI BC SK AB
Gross debtDebt representing accumulated deficits
50.144.0
35.131.7 30.1 28.4 26.5 24.8
19.916.8
4.3
1
1 A negative entry means that the government has an accumulated surplus. Sources: Ministère des Finances du Québec, governments’ public accounts and Statistics Canada.
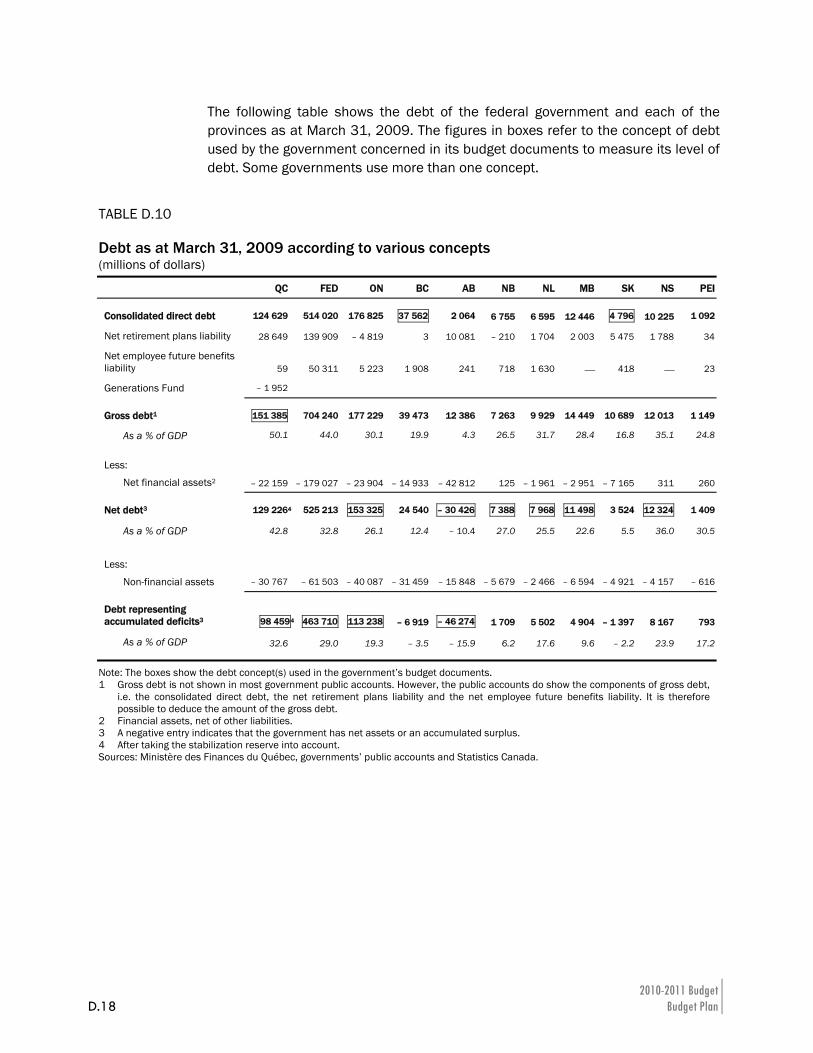
2010-2011 Budget D.18 Budget Plan
The following table shows the debt of the federal government and each of the provinces as at March 31, 2009. The figures in boxes refer to the concept of debt used by the government concerned in its budget documents to measure its level of debt. Some governments use more than one concept.
TABLE D.10 Debt as at March 31, 2009 according to various concepts (millions of dollars) QC FED ON BC AB NB NL MB SK NS PEI
Consolidated direct debt 124 629 514 020 176 825 37 562 2 064 6 755 6 595 12 446 4 796 10 225 1 092
Net retirement plans liability 28 649 139 909 – 4 819 3 10 081 – 210 1 704 2 003 5 475 1 788 34
Net employee future benefits liability 59 50 311 5 223 1 908 241 718 1 630 ⎯ 418 ⎯ 23
Generations Fund – 1 952
Gross debt1 151 385 704 240 177 229 39 473 12 386 7 263 9 929 14 449 10 689 12 013 1 149
As a % of GDP 50.1 44.0 30.1 19.9 4.3 26.5 31.7 28.4 16.8 35.1 24.8
Less:
Net financial assets2 – 22 159 – 179 027 – 23 904 – 14 933 – 42 812 125 – 1 961 – 2 951 – 7 165 311 260
Net debt3 129 2264 525 213 153 325 24 540 – 30 426 7 388 7 968 11 498 3 524 12 324 1 409
As a % of GDP 42.8 32.8 26.1 12.4 – 10.4 27.0 25.5 22.6 5.5 36.0 30.5
Less:
Non-financial assets – 30 767 – 61 503 – 40 087 – 31 459 – 15 848 – 5 679 – 2 466 – 6 594 – 4 921 – 4 157 – 616
Debt representing accumulated deficits3 98 4594 463 710 113 238 – 6 919 – 46 274 1 709 5 502 4 904 – 1 397 8 167 793
As a % of GDP 32.6 29.0 19.3 – 3.5 – 15.9 6.2 17.6 9.6 – 2.2 23.9 17.2
Note: The boxes show the debt concept(s) used in the government’s budget documents. 1 Gross debt is not shown in most government public accounts. However, the public accounts do show the components of gross debt,
i.e. the consolidated direct debt, the net retirement plans liability and the net employee future benefits liability. It is therefore possible to deduce the amount of the gross debt.
2 Financial assets, net of other liabilities. 3 A negative entry indicates that the government has net assets or an accumulated surplus. 4 After taking the stabilization reserve into account. Sources: Ministère des Finances du Québec, governments’ public accounts and Statistics Canada.
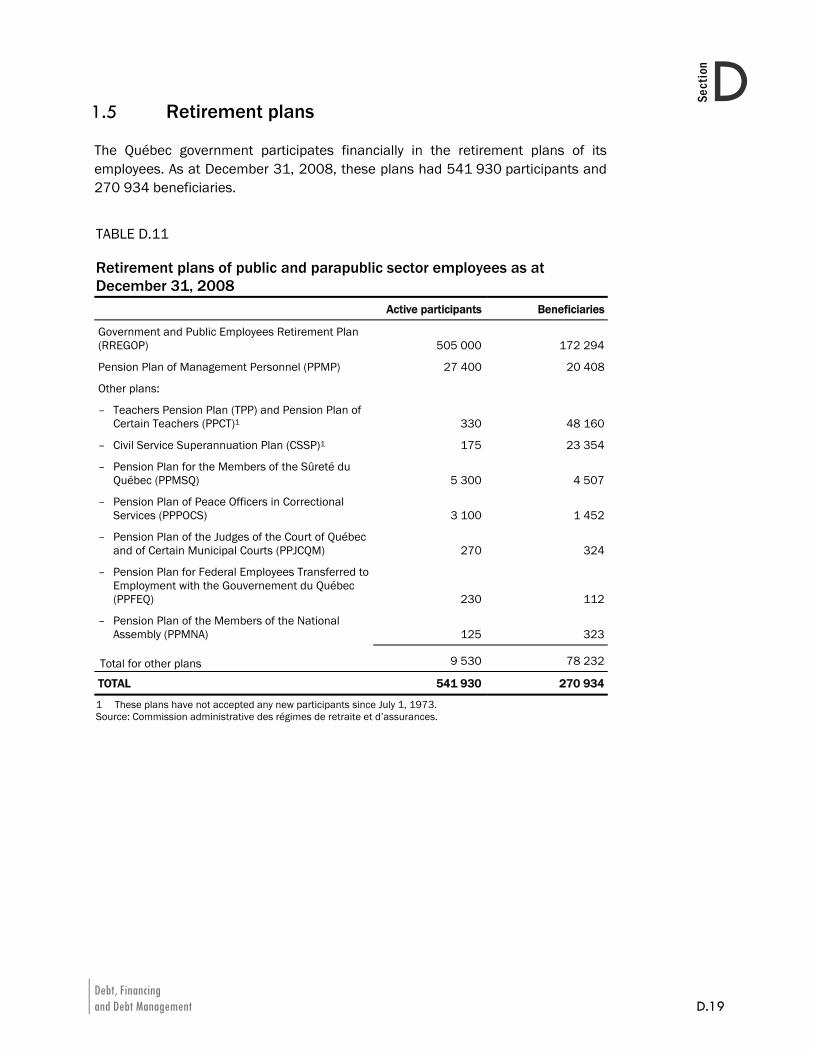
Debt, Financing and Debt Management D.19
DSection
1.5 Retirement plans
The Québec government participates financially in the retirement plans of its employees. As at December 31, 2008, these plans had 541 930 participants and 270 934 beneficiaries.
TABLE D.11 Retirement plans of public and parapublic sector employees as at December 31, 2008
Active participants Beneficiaries
Government and Public Employees Retirement Plan (RREGOP) 505 000 172 294
Pension Plan of Management Personnel (PPMP) 27 400 20 408
Other plans:
– Teachers Pension Plan (TPP) and Pension Plan of Certain Teachers (PPCT)1 330 48 160
– Civil Service Superannuation Plan (CSSP)1 175 23 354
– Pension Plan for the Members of the Sûreté du Québec (PPMSQ) 5 300 4 507
– Pension Plan of Peace Officers in Correctional Services (PPPOCS) 3 100 1 452
– Pension Plan of the Judges of the Court of Québec and of Certain Municipal Courts (PPJCQM) 270 324
– Pension Plan for Federal Employees Transferred to Employment with the Gouvernement du Québec (PPFEQ) 230 112
– Pension Plan of the Members of the National Assembly (PPMNA) 125 323
Total for other plans 9 530 78 232
TOTAL 541 930 270 934
1 These plans have not accepted any new participants since July 1, 1973. Source: Commission administrative des régimes de retraite et d’assurances.
2010-2011 Budget D.20 Budget Plan
These plans are defined benefit retirement plans, which means that they guarantee participants a certain level of income upon retirement. Benefits are calculated on the basis of participants’ average income for the best paid years (generally five) and their number of years of service. The pension usually represents 2% of an employee’s average income per year of service, for a maximum of 70%. Benefits are partially indexed to inflation.
The Commission administrative des régimes de retraite et d’assurances (CARRA) is responsible for administering the retirement plans. In 2009-2010, the government should pay $4 108 million to cover its share of the benefits paid to its retired employees.
Retirement plans liability
In its financial statements, the government discloses the present value of the retirement benefits it will pay to its employees, taking into account the conditions governing their plans, as well as their years of service. This value is called the retirement plans liability.
CARRA performs actuarial valuations of the liability for each retirement plan in conformity with the rules set for the public sector by the Canadian Institute of Actuaries (CIA) and the Canadian Institute of Chartered Accountants (CICA).
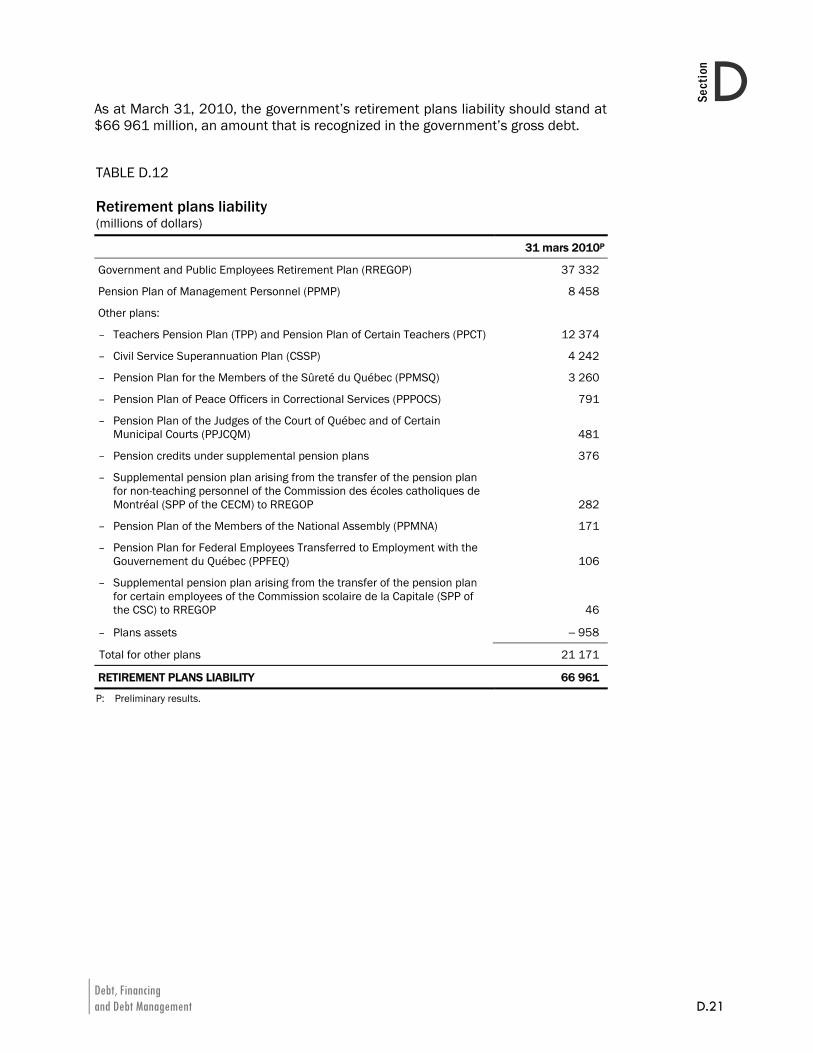
Debt, Financing and Debt Management D.21
DSection
As at March 31, 2010, the government’s retirement plans liability should stand at $66 961 million, an amount that is recognized in the government’s gross debt.
TABLE D.12 Retirement plans liability (millions of dollars)
31 mars 2010P
Government and Public Employees Retirement Plan (RREGOP) 37 332
Pension Plan of Management Personnel (PPMP) 8 458
Other plans:
– Teachers Pension Plan (TPP) and Pension Plan of Certain Teachers (PPCT) 12 374
– Civil Service Superannuation Plan (CSSP) 4 242
– Pension Plan for the Members of the Sûreté du Québec (PPMSQ) 3 260
– Pension Plan of Peace Officers in Correctional Services (PPPOCS) 791
– Pension Plan of the Judges of the Court of Québec and of Certain Municipal Courts (PPJCQM) 481
– Pension credits under supplemental pension plans 376
– Supplemental pension plan arising from the transfer of the pension plan for non-teaching personnel of the Commission des écoles catholiques de Montréal (SPP of the CECM) to RREGOP 282
– Pension Plan of the Members of the National Assembly (PPMNA) 171
– Pension Plan for Federal Employees Transferred to Employment with the Gouvernement du Québec (PPFEQ) 106
– Supplemental pension plan arising from the transfer of the pension plan for certain employees of the Commission scolaire de la Capitale (SPP of the CSC) to RREGOP 46
– Plans assets − 958
Total for other plans 21 171
RETIREMENT PLANS LIABILITY 66 961
P: Preliminary results.
2010-2011 Budget D.22 Budget Plan
Annual retirement plans expenditure
Every year, the government records its expenditure as an employer with regard to the retirement plans.
In 2009-2010, this expenditure should total $2 015 million. It comprises two components:
⎯ the net cost of vested benefits, that is, the present value of retirement benefits that employees have accumulated for work performed during the year, i.e. $1 529 million;
⎯ the amortization of revisions to the government’s actuarial obligations that arise from the updating of actuarial valuations, for a cost of $486 million.
TABLE D.13 Retirement plans expenditure (millions of dollars)
2009-2010P
Net cost of vested benefits 1 529
Amortization of revisions arising from actuarial valuations 486
RETIREMENT PLANS EXPENDITURE 2 015
P: Preliminary results.
Debt, Financing and Debt Management D.23
DSection
1.6 Retirement Plans Sinking Fund
The Retirement Plans Sinking Fund was created in 1993. The RPSF is an asset that can be used to pay the retirement benefits of public and parapublic sector employees.
As at March 31, 2010, the book value of the RPSF should amount to $38 198 million.
TABLE D.14 Change in the Retirement Plans Sinking Fund (RPSF) (millions of dollars)
Book value, beginning of
year Deposits
Investment income
imputed
Book value, end of
year
1993-1994 ⎯ 850 4 854
1994-1995 854 ⎯ − 5 849
1995-1996 849 ⎯ 74 923
1996-1997 923 ⎯ 91 1 014
1997-1998 1 095 1 ⎯ 84 1 179
1998-1999 1 179 944 86 2 209
1999-2000 2 209 2 612 219 5 040
2000-2001 5 040 1 607 412 7 059
2001-2002 7 059 2 535 605 10 199
2002-2003 10 199 900 741 11 840
2003-2004 11 840 1 502 862 14 204
2004-2005 14 204 3 202 927 18 333
2005-2006 18 333 3 000 1 230 22 563
2006-2007 22 437 1 3 000 1 440 26 877
2007-2008 26 877 3 000 1 887 31 764
2008-2009 31 749 2 2 100 2 176 36 025
2009-2010P 36 025 ⎯ 2 173 38 198
P: Preliminary results. 1 Taking into account restatements arising from the government accounting reforms of 1997-1998 and
2006-2007. 2 Taking into account an adjustment arising from consideration of the expected average remaining service
life (EARSL) of participants under the PPMP (9 years instead of 14 years).
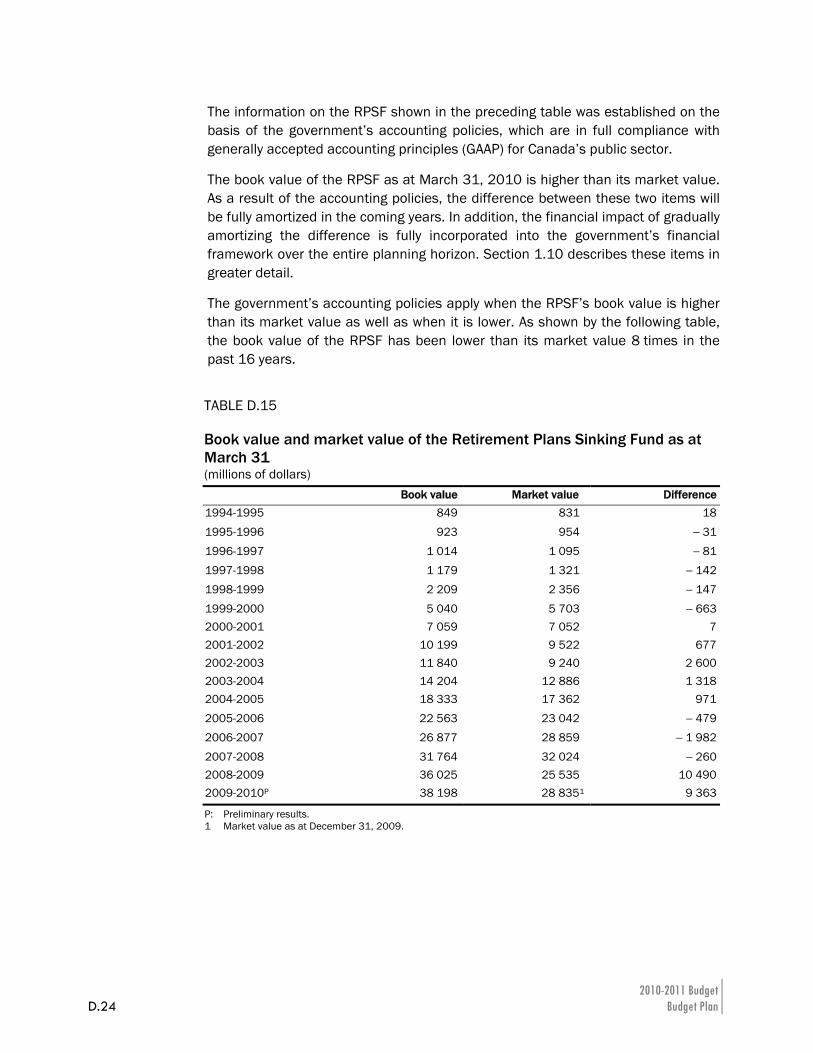
2010-2011 Budget D.24 Budget Plan
The information on the RPSF shown in the preceding table was established on the basis of the government’s accounting policies, which are in full compliance with generally accepted accounting principles (GAAP) for Canada’s public sector.
The book value of the RPSF as at March 31, 2010 is higher than its market value. As a result of the accounting policies, the difference between these two items will be fully amortized in the coming years. In addition, the financial impact of gradually amortizing the difference is fully incorporated into the government’s financial framework over the entire planning horizon. Section 1.10 describes these items in greater detail.
The government’s accounting policies apply when the RPSF’s book value is higher than its market value as well as when it is lower. As shown by the following table, the book value of the RPSF has been lower than its market value 8 times in the past 16 years.
TABLE D.15 Book value and market value of the Retirement Plans Sinking Fund as at March 31 (millions of dollars) Book value Market value Difference1994-1995 849 831 18
1995-1996 923 954 − 31
1996-1997 1 014 1 095 − 811997-1998 1 179 1 321 − 1421998-1999 2 209 2 356 − 147
1999-2000 5 040 5 703 − 6632000-2001 7 059 7 052 72001-2002 10 199 9 522 6772002-2003 11 840 9 240 2 6002003-2004 14 204 12 886 1 3182004-2005 18 333 17 362 971
2005-2006 22 563 23 042 − 4792006-2007 26 877 28 859 − 1 982
2007-2008 31 764 32 024 − 2602008-2009 36 025 25 535 10 4902009-2010P 38 198 28 8351 9 363
P: Preliminary results. 1 Market value as at December 31, 2009.
Debt, Financing and Debt Management D.25
DSection
Amounts deposited in the RPSF have no impact on gross debt
The government issues bonds on financial markets in order to make deposits in the RPSF. However, the amounts deposited in the RPSF do not affect the government’s gross debt.
Indeed, the amount of borrowings contracted to make deposits in the RPSF increases the direct debt. At the same time, however, these deposits reduce the net retirement plans liability by the same amount. Therefore, the net impact on the gross debt is nil.
TABLE D.16 Illustration of the impact on the government’s gross debt of borrowing $1 billion on financial markets and depositing it in the RPSF1 (millions of dollars)
Before
depositAfter
deposit Change
(A) Consolidated direct debt 134 021 135 021 1 000
Retirement plans liability 66 961 66 961 ⎯
Less: Book value of the RPSF − 38 198 − 39 198 − 1 000
(B) Net retirement plans liability 28 763 27 763 − 1 000
(C) Net employee future benefits liability ⎯ ⎯ ⎯
(D) Less: Generations Fund − 2 667 − 2 667 ⎯
(E) GROSS DEBT (E=A+B+C+D) 160 117 160 117 ⎯
1 Illustration based on preliminary results as at March 31, 2010.
2010-2011 Budget D.26 Budget Plan
A decline in debt service
Deposits in the RPSF entail a reduction in the government’s debt service. The rates of return on funds managed by the Caisse de dépôt et placement du Québec are generally higher than interest rates on Québec government bonds issued to finance deposits in the RPSF. Therefore, the income of the RPSF, which is applied against the government’s debt service, is usually higher than the additional interest charges that arise from new borrowings. This leads to a net decrease in the government’s debt service.
Since the RPSF was created, its return has been higher than the cost of new long-term borrowings by the government 12 years out of 16.
TABLE D.17 Comparison of the RPSF’s annual return and the Québec government’s borrowing costs (per cent)
Return of the
RPSF 1 Cost of
new borrowings 2 Difference
1994-1995 − 3.3 3 5.9 − 9.2
1995-1996 17.0 5.3 11.7
1996-1997 16.1 6.3 9.8
1997-1998 13.4 5.7 7.7
1998-1999 10.4 5.8 4.6
1999-2000 15.3 7.2 8.1
2000-2001 7.2 6.2 1.0
2001-2002 − 4.7 5.5 − 10.2
2002-2003 − 8.5 4.7 − 13.2
2003-2004 14.9 4.6 10.3
2004-2005 11.4 4.4 7.0
2005-2006 13.5 4.4 9.1
2006-2007 13.5 4.4 9.1
2007-2008 5.2 4.8 0.4
2008-2009 − 25.6 4.2 − 29.8
2009-2010 10.7 4.4 6.3
1 On a calendar year basis. 2 On a fiscal year basis. 3 From February to December 1994.
Debt, Financing and Debt Management D.27
DSection
A flexible deposit policy
In December 1999, as part of an agreement concluded for the renewal of its employees’ collective agreements, the government set the objective that the funds accumulated in the RPSF would be equal, in 2020, to 70% of its actuarial obligations in regard to the retirement plans of public and parapublic sector employees.
However, the government has all the flexibility needed to apply this policy. Deposits in the RPSF are made only when market conditions are favourable, particularly with respect to interest rates and market receptiveness to bond issues.
The RPSF’s assets are expected to represent roughly 54% of the government’s actuarial obligations in regard to the retirement plans of public and parapublic sector employees in 2009-2010. The target of 70% should be attained three years earlier than anticipated, i.e. in 2016-2017.
CHART D.6 The RPSF in proportion to the government’s actuarial obligations regarding the retirement plans of public and parapublic sector employees (per cent)
54.3
70.7
0
10
20
30
40
50
60
70
80
90
100
1999-2000 2004-2005 2009-2010 2014-2015 2019-2020
Actual / anticipated1999 forecast
2016-2017
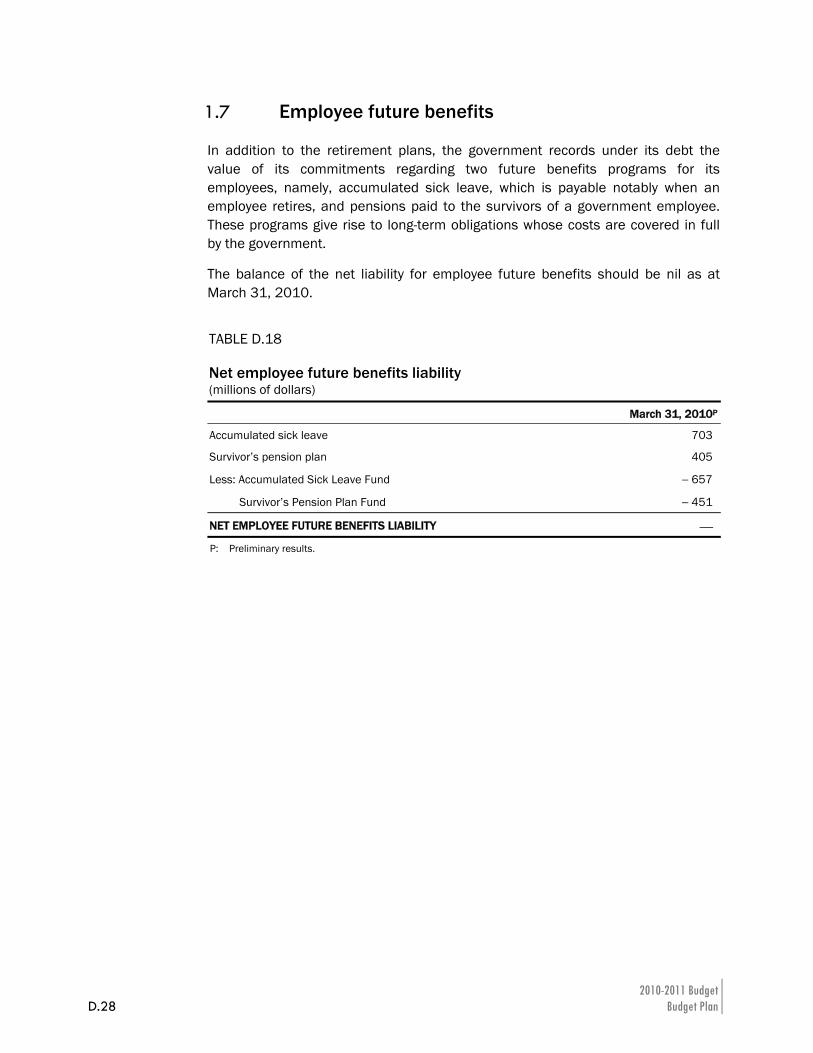
2010-2011 Budget D.28 Budget Plan
1.7 Employee future benefits
In addition to the retirement plans, the government records under its debt the value of its commitments regarding two future benefits programs for its employees, namely, accumulated sick leave, which is payable notably when an employee retires, and pensions paid to the survivors of a government employee. These programs give rise to long-term obligations whose costs are covered in full by the government.
The balance of the net liability for employee future benefits should be nil as at March 31, 2010.
TABLE D.18 Net employee future benefits liability (millions of dollars)
March 31, 2010P
Accumulated sick leave 703
Survivor’s pension plan 405
Less: Accumulated Sick Leave Fund − 657
Survivor’s Pension Plan Fund − 451
NET EMPLOYEE FUTURE BENEFITS LIABILITY ⎯
P: Preliminary results.
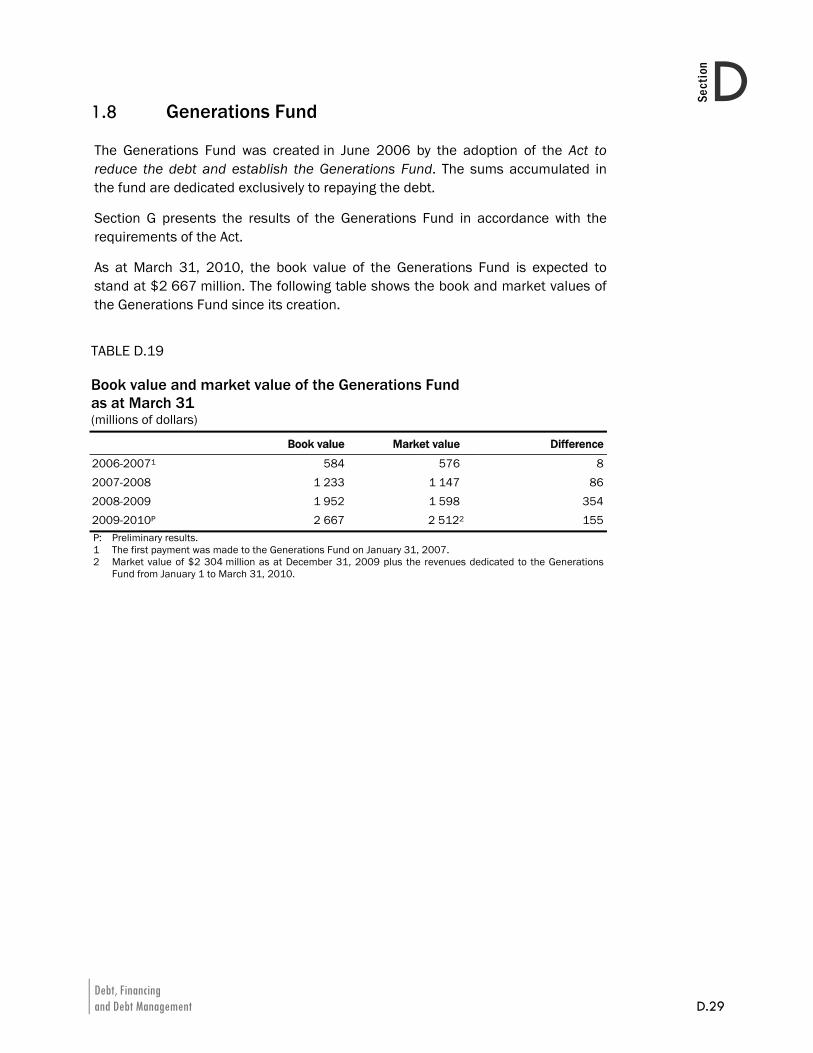
Debt, Financing and Debt Management D.29
DSection
1.8 Generations Fund
The Generations Fund was created in June 2006 by the adoption of the Act to reduce the debt and establish the Generations Fund. The sums accumulated in the fund are dedicated exclusively to repaying the debt.
Section G presents the results of the Generations Fund in accordance with the requirements of the Act.
As at March 31, 2010, the book value of the Generations Fund is expected to stand at $2 667 million. The following table shows the book and market values of the Generations Fund since its creation.
TABLE D.19 Book value and market value of the Generations Fund as at March 31 (millions of dollars)
Book value Market value Difference
2006-20071 584 576 8 2007-2008 1 233 1 147 86 2008-2009 1 952 1 598 354 2009-2010P 2 667 2 5122 155 P: Preliminary results. 1 The first payment was made to the Generations Fund on January 31, 2007. 2 Market value of $2 304 million as at December 31, 2009 plus the revenues dedicated to the Generations
Fund from January 1 to March 31, 2010.
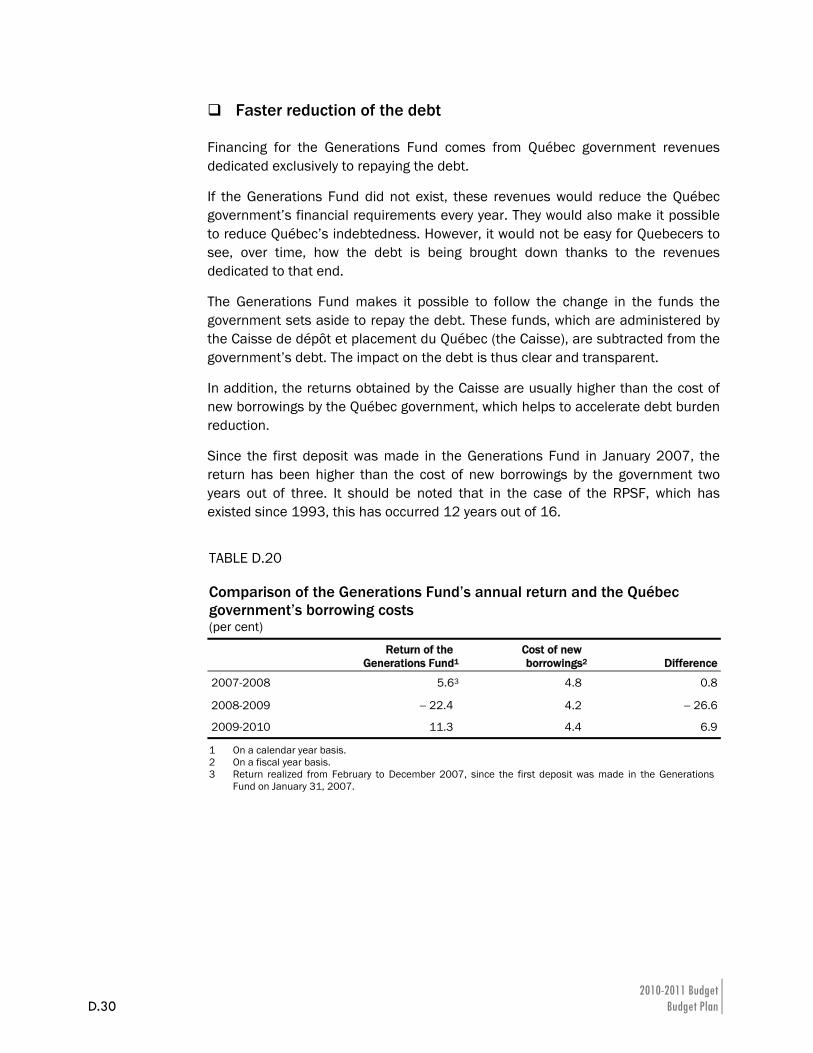
2010-2011 Budget D.30 Budget Plan
Faster reduction of the debt
Financing for the Generations Fund comes from Québec government revenues dedicated exclusively to repaying the debt.
If the Generations Fund did not exist, these revenues would reduce the Québec government’s financial requirements every year. They would also make it possible to reduce Québec’s indebtedness. However, it would not be easy for Quebecers to see, over time, how the debt is being brought down thanks to the revenues dedicated to that end.
The Generations Fund makes it possible to follow the change in the funds the government sets aside to repay the debt. These funds, which are administered by the Caisse de dépôt et placement du Québec (the Caisse), are subtracted from the government’s debt. The impact on the debt is thus clear and transparent.
In addition, the returns obtained by the Caisse are usually higher than the cost of new borrowings by the Québec government, which helps to accelerate debt burden reduction.
Since the first deposit was made in the Generations Fund in January 2007, the return has been higher than the cost of new borrowings by the government two years out of three. It should be noted that in the case of the RPSF, which has existed since 1993, this has occurred 12 years out of 16.
TABLE D.20 Comparison of the Generations Fund’s annual return and the Québec government’s borrowing costs (per cent)
Return of the
Generations Fund1Cost of new borrowings2 Difference
2007-2008 5.63 4.8 0.8
2008-2009 − 22.4 4.2 − 26.6
2009-2010 11.3 4.4 6.9
1 On a calendar year basis. 2 On a fiscal year basis. 3 Return realized from February to December 2007, since the first deposit was made in the Generations
Fund on January 31, 2007.
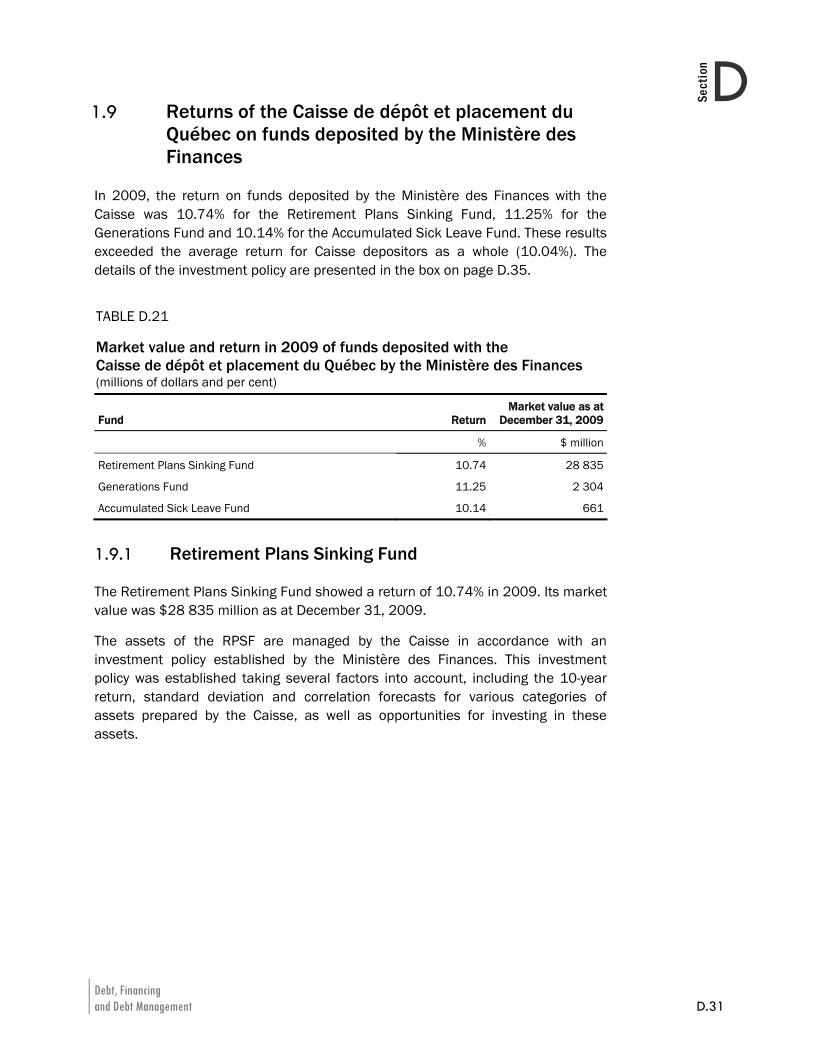
Debt, Financing and Debt Management D.31
DSection
1.9 Returns of the Caisse de dépôt et placement du Québec on funds deposited by the Ministère des Finances
In 2009, the return on funds deposited by the Ministère des Finances with the Caisse was 10.74% for the Retirement Plans Sinking Fund, 11.25% for the Generations Fund and 10.14% for the Accumulated Sick Leave Fund. These results exceeded the average return for Caisse depositors as a whole (10.04%). The details of the investment policy are presented in the box on page D.35.
TABLE D.21 Market value and return in 2009 of funds deposited with the Caisse de dépôt et placement du Québec by the Ministère des Finances (millions of dollars and per cent)
Fund ReturnMarket value as at
December 31, 2009
% $ million
Retirement Plans Sinking Fund 10.74 28 835
Generations Fund 11.25 2 304
Accumulated Sick Leave Fund 10.14 661
1.9.1 Retirement Plans Sinking Fund
The Retirement Plans Sinking Fund showed a return of 10.74% in 2009. Its market value was $28 835 million as at December 31, 2009.
The assets of the RPSF are managed by the Caisse in accordance with an investment policy established by the Ministère des Finances. This investment policy was established taking several factors into account, including the 10-year return, standard deviation and correlation forecasts for various categories of assets prepared by the Caisse, as well as opportunities for investing in these assets.
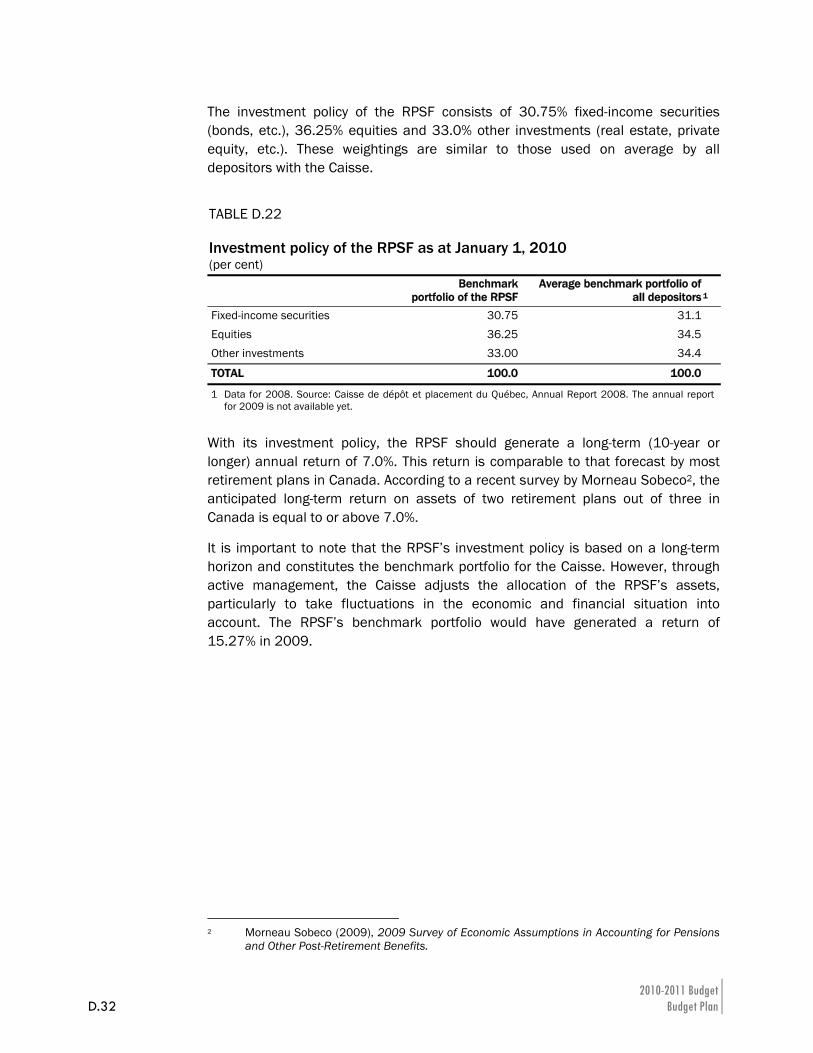
2010-2011 Budget D.32 Budget Plan
The investment policy of the RPSF consists of 30.75% fixed-income securities (bonds, etc.), 36.25% equities and 33.0% other investments (real estate, private equity, etc.). These weightings are similar to those used on average by all depositors with the Caisse.
TABLE D.22 Investment policy of the RPSF as at January 1, 2010 (per cent)
Benchmark portfolio of the RPSF
Average benchmark portfolio of all depositors 1
Fixed-income securities 30.75 31.1Equities 36.25 34.5Other investments 33.00 34.4
TOTAL 100.0 100.0
1 Data for 2008. Source: Caisse de dépôt et placement du Québec, Annual Report 2008. The annual report for 2009 is not available yet.
With its investment policy, the RPSF should generate a long-term (10-year or longer) annual return of 7.0%. This return is comparable to that forecast by most retirement plans in Canada. According to a recent survey by Morneau Sobeco2, the anticipated long-term return on assets of two retirement plans out of three in Canada is equal to or above 7.0%.
It is important to note that the RPSF’s investment policy is based on a long-term horizon and constitutes the benchmark portfolio for the Caisse. However, through active management, the Caisse adjusts the allocation of the RPSF’s assets, particularly to take fluctuations in the economic and financial situation into account. The RPSF’s benchmark portfolio would have generated a return of 15.27% in 2009.
2 Morneau Sobeco (2009), 2009 Survey of Economic Assumptions in Accounting for Pensions
and Other Post-Retirement Benefits.
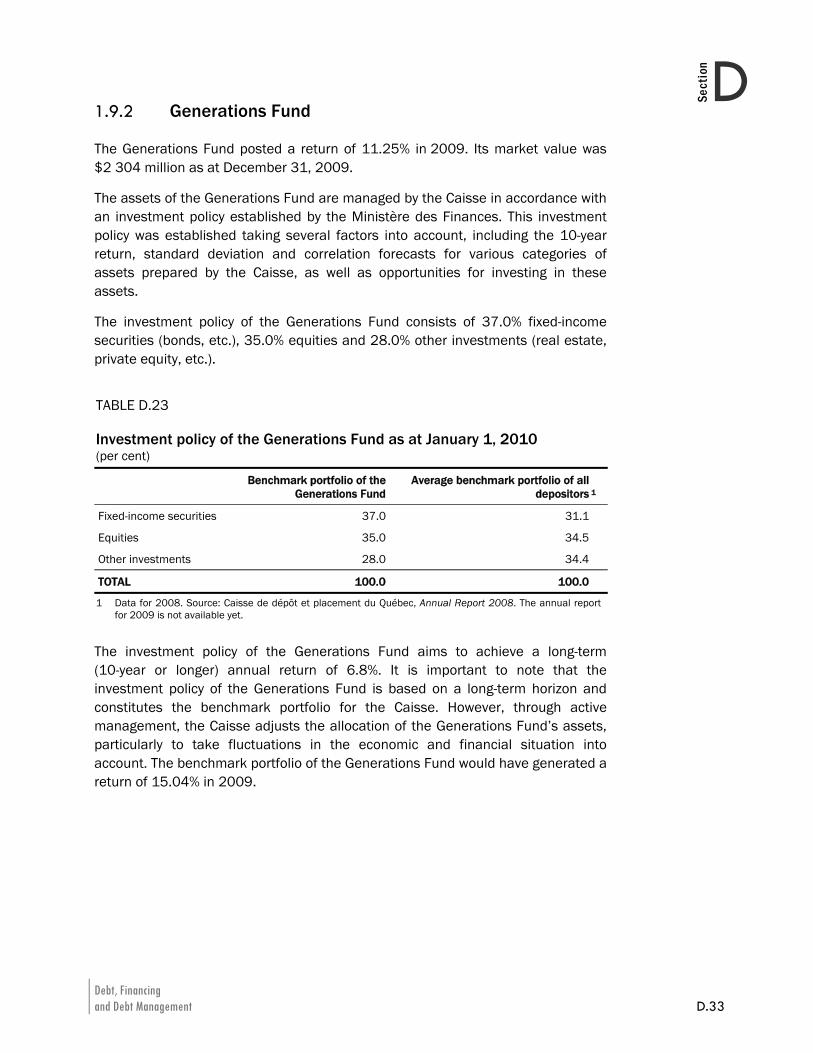
Debt, Financing and Debt Management D.33
DSection
1.9.2 Generations Fund
The Generations Fund posted a return of 11.25% in 2009. Its market value was $2 304 million as at December 31, 2009.
The assets of the Generations Fund are managed by the Caisse in accordance with an investment policy established by the Ministère des Finances. This investment policy was established taking several factors into account, including the 10-year return, standard deviation and correlation forecasts for various categories of assets prepared by the Caisse, as well as opportunities for investing in these assets.
The investment policy of the Generations Fund consists of 37.0% fixed-income securities (bonds, etc.), 35.0% equities and 28.0% other investments (real estate, private equity, etc.).
TABLE D.23 Investment policy of the Generations Fund as at January 1, 2010 (per cent)
Benchmark portfolio of the
Generations FundAverage benchmark portfolio of all
depositors 1
Fixed-income securities 37.0 31.1
Equities 35.0 34.5
Other investments 28.0 34.4
TOTAL 100.0 100.0
1 Data for 2008. Source: Caisse de dépôt et placement du Québec, Annual Report 2008. The annual report for 2009 is not available yet.
The investment policy of the Generations Fund aims to achieve a long-term (10-year or longer) annual return of 6.8%. It is important to note that the investment policy of the Generations Fund is based on a long-term horizon and constitutes the benchmark portfolio for the Caisse. However, through active management, the Caisse adjusts the allocation of the Generations Fund’s assets, particularly to take fluctuations in the economic and financial situation into account. The benchmark portfolio of the Generations Fund would have generated a return of 15.04% in 2009.
2010-2011 Budget D.34 Budget Plan
1.9.3 Accumulated Sick Leave Fund
The Accumulated Sick Leave Fund (ASLF) showed a return of 10.14% in 2009. Its market value was $661 million as at December 31, 2009.
The assets of the ASLF are managed by the Caisse in accordance with an investment policy established by the Ministère des Finances. Since January 1, 2009, the ASLF’s investment policy has been identical to that of the RPSF, as the creation of the ASLF stems from a long-term commitment made by the government in regard to employee future benefits, which is similar to the commitment regarding the retirement plans.
It is important to note that the ASLF’s investment policy constitutes the benchmark portfolio for the Caisse. However, through active management, the Caisse adjusts the allocation of the ASLF’s assets, particularly to take fluctuations in the economic and financial situation into account. The ASLF’s benchmark portfolio would have generated a return of 15.27% in 2009.
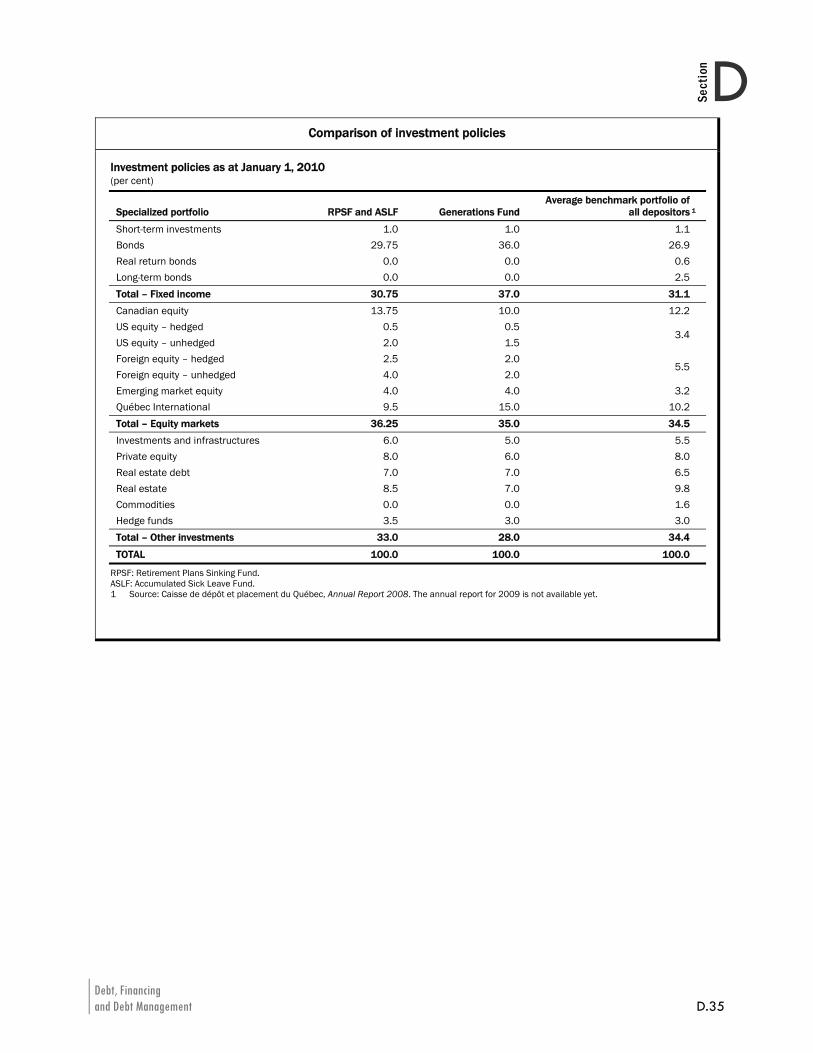
Debt, Financing and Debt Management D.35
DSection
Comparison of investment policies
Investment policies as at January 1, 2010 (per cent)
Specialized portfolio RPSF and ASLF Generations Fund Average benchmark portfolio of
all depositors 1
Short-term investments 1.0 1.0 1.1
Bonds 29.75 36.0 26.9
Real return bonds 0.0 0.0 0.6
Long-term bonds 0.0 0.0 2.5
Total – Fixed income 30.75 37.0 31.1
Canadian equity 13.75 10.0 12.2
US equity – hedged 0.5 0.5
US equity – unhedged 2.0 1.53.4
Foreign equity – hedged 2.5 2.0
Foreign equity – unhedged 4.0 2.05.5
Emerging market equity 4.0 4.0 3.2
Québec International 9.5 15.0 10.2
Total – Equity markets 36.25 35.0 34.5
Investments and infrastructures 6.0 5.0 5.5
Private equity 8.0 6.0 8.0
Real estate debt 7.0 7.0 6.5
Real estate 8.5 7.0 9.8
Commodities 0.0 0.0 1.6
Hedge funds 3.5 3.0 3.0
Total – Other investments 33.0 28.0 34.4
TOTAL 100.0 100.0 100.0
RPSF: Retirement Plans Sinking Fund. ASLF: Accumulated Sick Leave Fund. 1 Source: Caisse de dépôt et placement du Québec, Annual Report 2008. The annual report for 2009 is not available yet.
2010-2011 Budget D.36 Budget Plan
1.10 Impact of the returns of the Retirement Plans Sinking Fund on Debt Service
As indicated in section 1.6, the income of the RPSF is applied against the government’s debt service. The returns of the Caisse affect RPSF income and therefore debt service.
The returns realized by the Caisse on RPSF income are taken into account in the government’s balance sheet and results by applying the accounting policy adopted in the wake of the December 2007 reform of government accounting in accordance with generally accepted accounting principles (GAAP).
“When determining a government’s retirement benefit liability and expense, plan assets would be valued at market-related values. Under this method, plan assets are recorded at market value or they are adjusted to market value over a period not to exceed five years. Values adjusted to market closely approximate current economic value in a manner that can minimize short-term fluctuations. Market-related values would be used because they are objective and verifiable. Once a basis of valuation is chosen it would be applied consistently.” (Canadian Institute of Chartered Accountants (CICA), Public Sector Accounting Handbook, section 3250, paragraph .035)
Under the accounting policy, the “adjusted market value” of the RPSF is adjusted every year based on the returns realized by the fund. If, for a given year, the realized return differs from the anticipated long-term return, the difference between the two is spread over five years. All other things being equal, this means that the adjusted market value and the market value will converge over a five-year period. It is important to note that this method is applied when returns are higher than expected as well as when they are lower.3
3 Before the accounting reform of 2007, the value of the RPSF was adjusted only once every
three years, that is, when actuarial valuations were carried out. Since the reform, it has been adjusted every year.
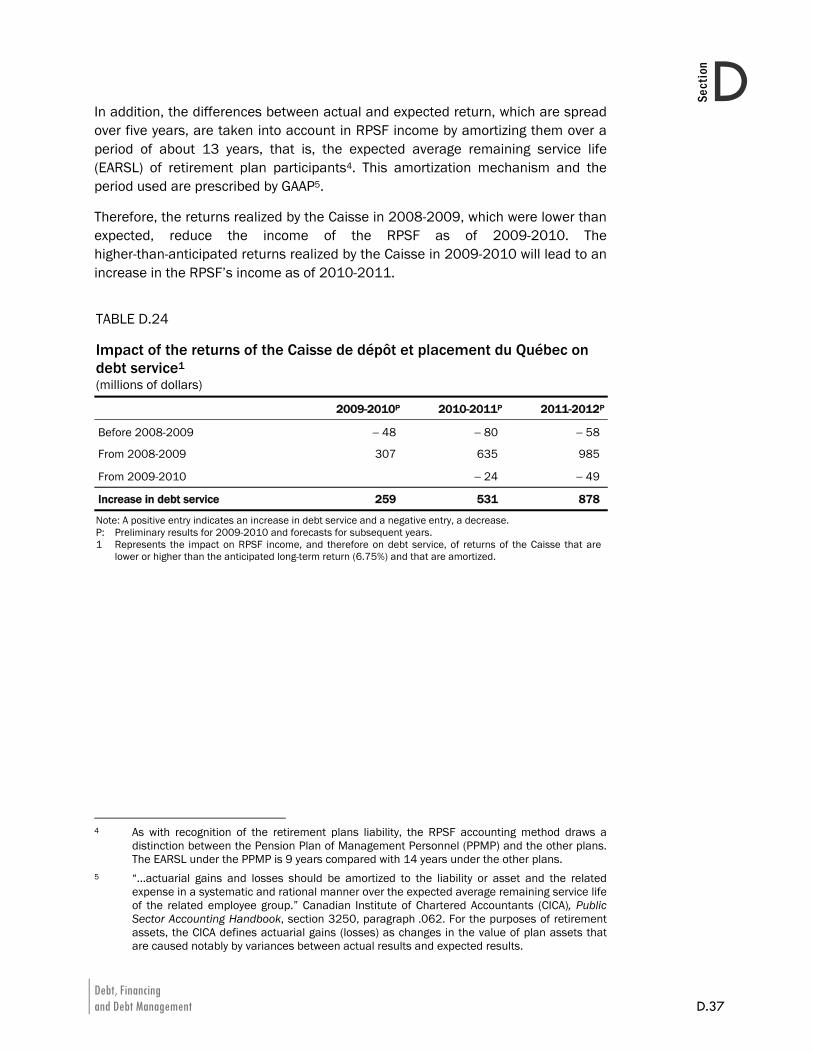
Debt, Financing and Debt Management D.37
DSection
In addition, the differences between actual and expected return, which are spread over five years, are taken into account in RPSF income by amortizing them over a period of about 13 years, that is, the expected average remaining service life (EARSL) of retirement plan participants4. This amortization mechanism and the period used are prescribed by GAAP5.
Therefore, the returns realized by the Caisse in 2008-2009, which were lower than expected, reduce the income of the RPSF as of 2009-2010. The higher-than-anticipated returns realized by the Caisse in 2009-2010 will lead to an increase in the RPSF’s income as of 2010-2011.
TABLE D.24 Impact of the returns of the Caisse de dépôt et placement du Québec on debt service1 (millions of dollars)
2009-2010P 2010-2011P 2011-2012P
Before 2008-2009 − 48 − 80 − 58
From 2008-2009 307 635 985
From 2009-2010 − 24 − 49
Increase in debt service 259 531 878
Note: A positive entry indicates an increase in debt service and a negative entry, a decrease. P: Preliminary results for 2009-2010 and forecasts for subsequent years. 1 Represents the impact on RPSF income, and therefore on debt service, of returns of the Caisse that are
lower or higher than the anticipated long-term return (6.75%) and that are amortized.
4 As with recognition of the retirement plans liability, the RPSF accounting method draws a
distinction between the Pension Plan of Management Personnel (PPMP) and the other plans. The EARSL under the PPMP is 9 years compared with 14 years under the other plans.
5 “…actuarial gains and losses should be amortized to the liability or asset and the related expense in a systematic and rational manner over the expected average remaining service life of the related employee group.” Canadian Institute of Chartered Accountants (CICA), Public Sector Accounting Handbook, section 3250, paragraph .062. For the purposes of retirement assets, the CICA defines actuarial gains (losses) as changes in the value of plan assets that are caused notably by variances between actual results and expected results.

Debt, Financing and Debt Management D.39
DSection
2. FINANCING Borrowings in fiscal 2009-2010 should total $15 475 million, i.e. $9 742 million for the Consolidated Revenue Fund, $2 415 million for the Financing Fund and $3 318 million for Financement-Québec.
It should be noted that pre-financing of $3 855 million was carried out in the last few months of the fiscal year. It will be used to cover part of the borrowing program in 2010-2011.
2.1 Financing strategy
The government aims to borrow at the lowest possible cost. To that end, it applies a strategy for diversifying sources of funding by market, financial instrument and maturity.
2.1.1 Diversification by market
Financing transactions are conducted regularly on most markets, i.e. in Canada, the United States, Europe and Asia.
Over the past 10 years, nearly one quarter of borrowings, on average, has been contracted in foreign currency. Nonetheless, the government has only a very low exposure to foreign currencies (see section 3.1).
In 2009-2010, the government contracted 18.7% of its borrowings on foreign markets in three different currencies:
⎯ two borrowings totalling 1 575 million euros (CAN$2 496 million) in April 2009 and March 2010;
⎯ two borrowings totalling 16 000 million yen (CAN$197 million) in April 2009;
⎯ one borrowing for 200 million Swiss francs (CAN$206 million) in December 2009.
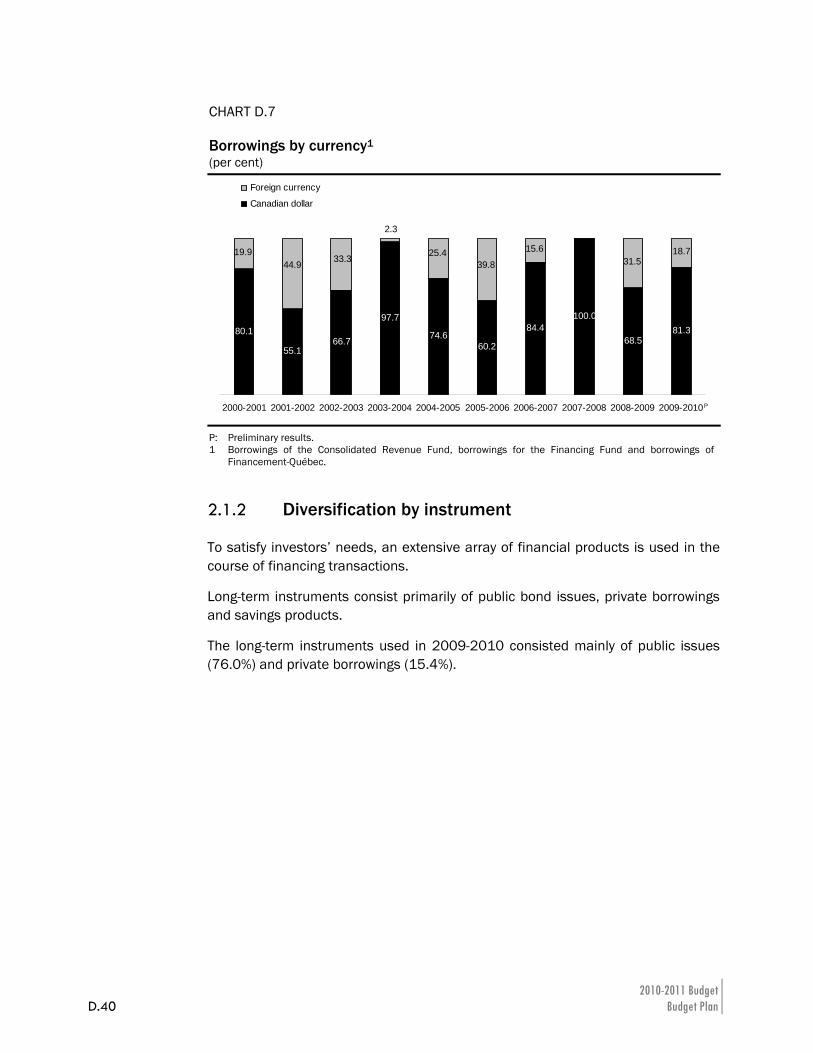
2010-2011 Budget D.40 Budget Plan
CHART D.7 Borrowings by currency1 (per cent)
81.368.5
100.084.4
60.274.6
97.7
66.755.1
80.1
2.3
33.344.919.9 25.4
39.8
15.631.5
18.7
2000-2001 2001-2002 2002-2003 2003-2004 2004-2005 2005-2006 2006-2007 2007-2008 2008-2009 2009-2010
Foreign currency
Canadian dollar
P
P: Preliminary results. 1 Borrowings of the Consolidated Revenue Fund, borrowings for the Financing Fund and borrowings of
Financement-Québec.
2.1.2 Diversification by instrument
To satisfy investors’ needs, an extensive array of financial products is used in the course of financing transactions.
Long-term instruments consist primarily of public bond issues, private borrowings and savings products.
The long-term instruments used in 2009-2010 consisted mainly of public issues (76.0%) and private borrowings (15.4%).
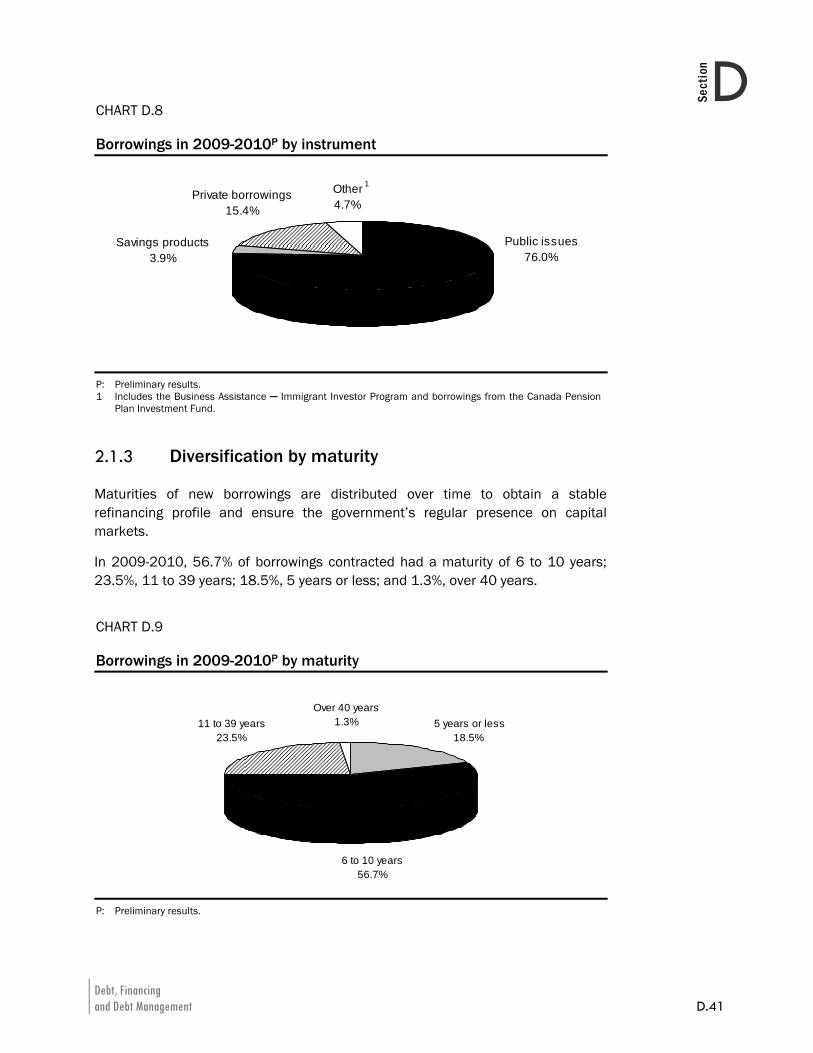
Debt, Financing and Debt Management D.41
DSection
CHART D.8 Borrowings in 2009-2010P by instrument
Savings products 3.9%
Private borrowings 15.4%
Other 4.7%
Public issues 76.0%
1
P: Preliminary results. 1 Includes the Business Assistance ─ Immigrant Investor Program and borrowings from the Canada Pension
Plan Investment Fund.
2.1.3 Diversification by maturity
Maturities of new borrowings are distributed over time to obtain a stable refinancing profile and ensure the government’s regular presence on capital markets.
In 2009-2010, 56.7% of borrowings contracted had a maturity of 6 to 10 years; 23.5%, 11 to 39 years; 18.5%, 5 years or less; and 1.3%, over 40 years.
CHART D.9 Borrowings in 2009-2010P by maturity
6 to 10 years56.7%
11 to 39 years 23.5%
Over 40 years1.3% 5 years or less
18.5%
P: Preliminary results.
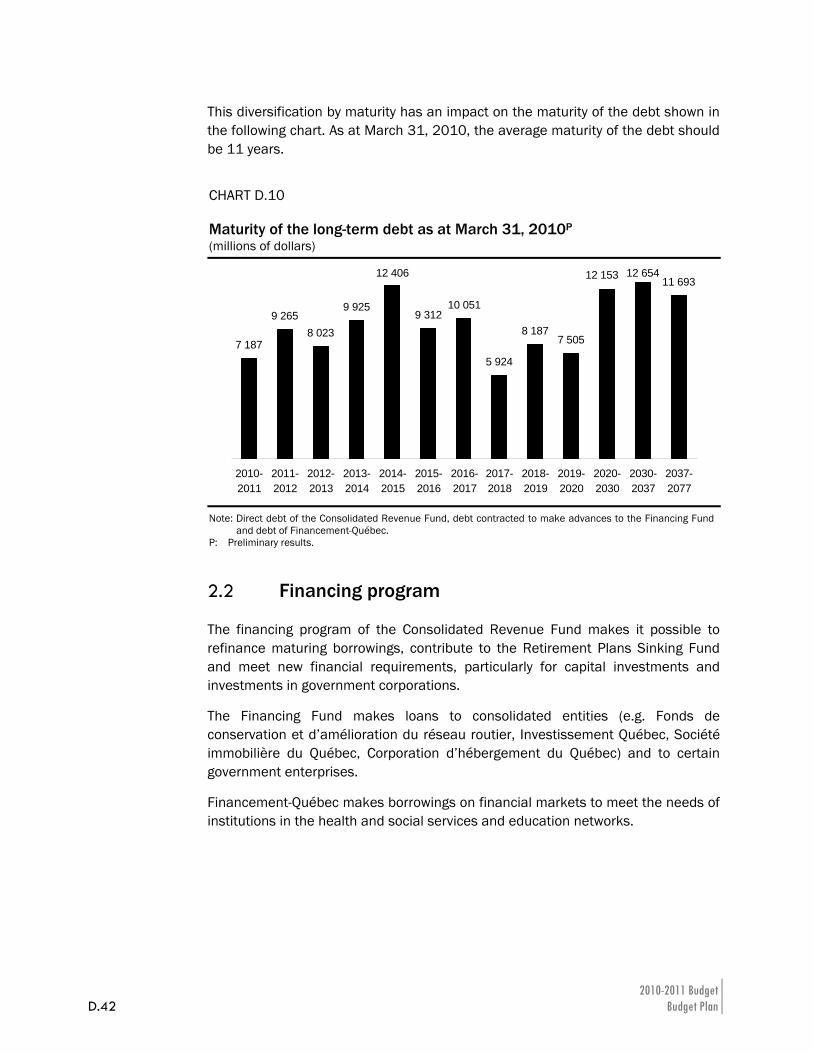
2010-2011 Budget D.42 Budget Plan
This diversification by maturity has an impact on the maturity of the debt shown in the following chart. As at March 31, 2010, the average maturity of the debt should be 11 years.
CHART D.10 Maturity of the long-term debt as at March 31, 2010P (millions of dollars)
7 187
9 2658 023
9 925
12 406
9 31210 051
5 924
8 1877 505
12 65411 69312 153
2010-2011
2011-2012
2012-2013
2013-2014
2014-2015
2015-2016
2016-2017
2017-2018
2018-2019
2019-2020
2020-2030
2030-2037
2037-2077
Note: Direct debt of the Consolidated Revenue Fund, debt contracted to make advances to the Financing Fund and debt of Financement-Québec.
P: Preliminary results.
2.2 Financing program
The financing program of the Consolidated Revenue Fund makes it possible to refinance maturing borrowings, contribute to the Retirement Plans Sinking Fund and meet new financial requirements, particularly for capital investments and investments in government corporations.
The Financing Fund makes loans to consolidated entities (e.g. Fonds de conservation et d’amélioration du réseau routier, Investissement Québec, Société immobilière du Québec, Corporation d’hébergement du Québec) and to certain government enterprises.
Financement-Québec makes borrowings on financial markets to meet the needs of institutions in the health and social services and education networks.
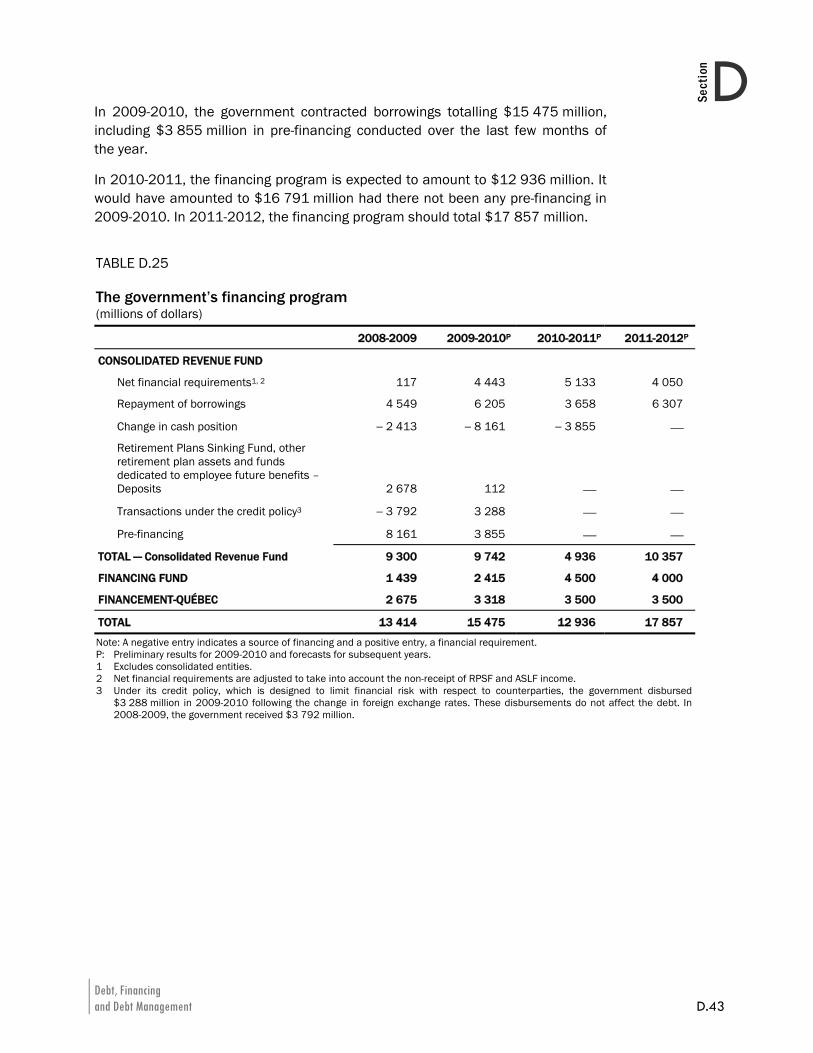
Debt, Financing and Debt Management D.43
DSection
In 2009-2010, the government contracted borrowings totalling $15 475 million, including $3 855 million in pre-financing conducted over the last few months of the year.
In 2010-2011, the financing program is expected to amount to $12 936 million. It would have amounted to $16 791 million had there not been any pre-financing in 2009-2010. In 2011-2012, the financing program should total $17 857 million.
TABLE D.25 The government’s financing program (millions of dollars)
2008-2009 2009-2010P 2010-2011P 2011-2012P
CONSOLIDATED REVENUE FUND
Net financial requirements1, 2 117 4 443 5 133 4 050
Repayment of borrowings 4 549 6 205 3 658 6 307
Change in cash position − 2 413 − 8 161 − 3 855 ⎯
Retirement Plans Sinking Fund, other retirement plan assets and funds dedicated to employee future benefits – Deposits 2 678 112 ⎯ ⎯
Transactions under the credit policy3 − 3 792 3 288 ⎯ ⎯
Pre-financing 8 161 3 855 ⎯ ⎯
TOTAL — Consolidated Revenue Fund 9 300 9 742 4 936 10 357
FINANCING FUND 1 439 2 415 4 500 4 000
FINANCEMENT-QUÉBEC 2 675 3 318 3 500 3 500
TOTAL 13 414 15 475 12 936 17 857
Note: A negative entry indicates a source of financing and a positive entry, a financial requirement. P: Preliminary results for 2009-2010 and forecasts for subsequent years. 1 Excludes consolidated entities. 2 Net financial requirements are adjusted to take into account the non-receipt of RPSF and ASLF income. 3 Under its credit policy, which is designed to limit financial risk with respect to counterparties, the government disbursed
$3 288 million in 2009-2010 following the change in foreign exchange rates. These disbursements do not affect the debt. In 2008-2009, the government received $3 792 million.
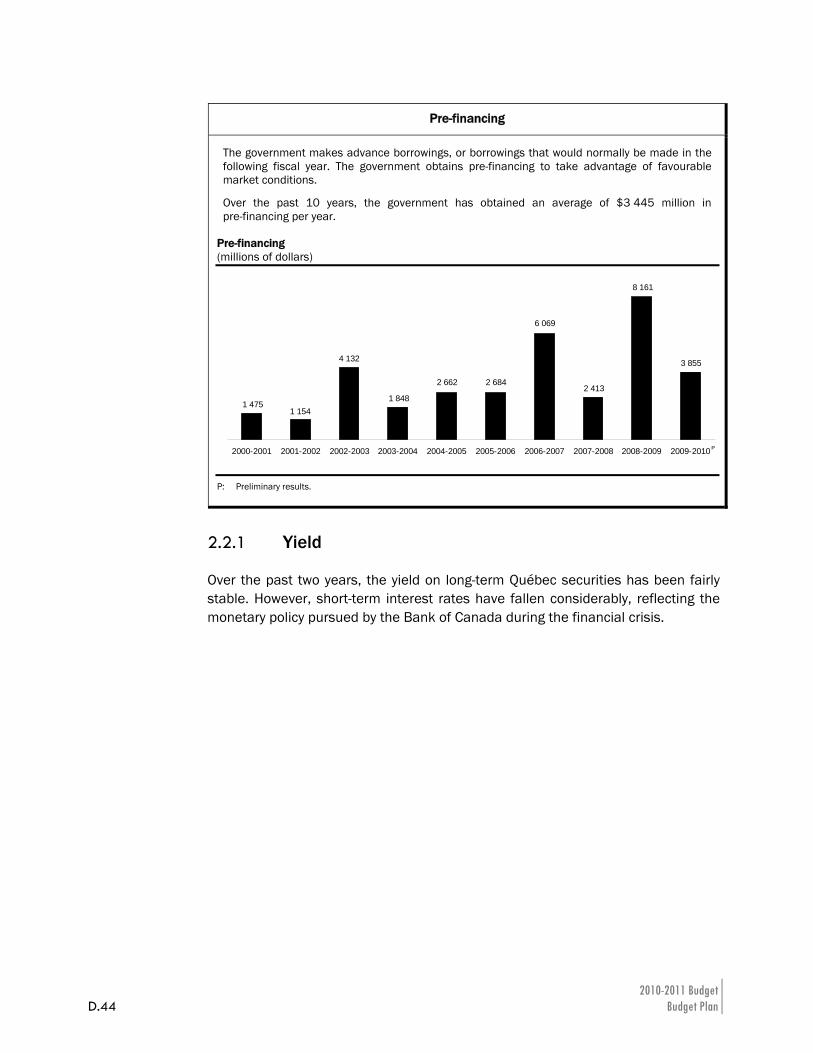
2010-2011 Budget D.44 Budget Plan
2.2.1 Yield
Over the past two years, the yield on long-term Québec securities has been fairly stable. However, short-term interest rates have fallen considerably, reflecting the monetary policy pursued by the Bank of Canada during the financial crisis.
Pre-financing
The government makes advance borrowings, or borrowings that would normally be made in the following fiscal year. The government obtains pre-financing to take advantage of favourable market conditions.
Over the past 10 years, the government has obtained an average of $3 445 million in pre-financing per year.
Pre-financing (millions of dollars)
2 662 2 684
6 069
3 855
8 161
2 4131 848
1 475
4 132
1 154
2000-2001 2001-2002 2002-2003 2003-2004 2004-2005 2005-2006 2006-2007 2007-2008 2008-2009 2009-2010 P
P: Preliminary results.
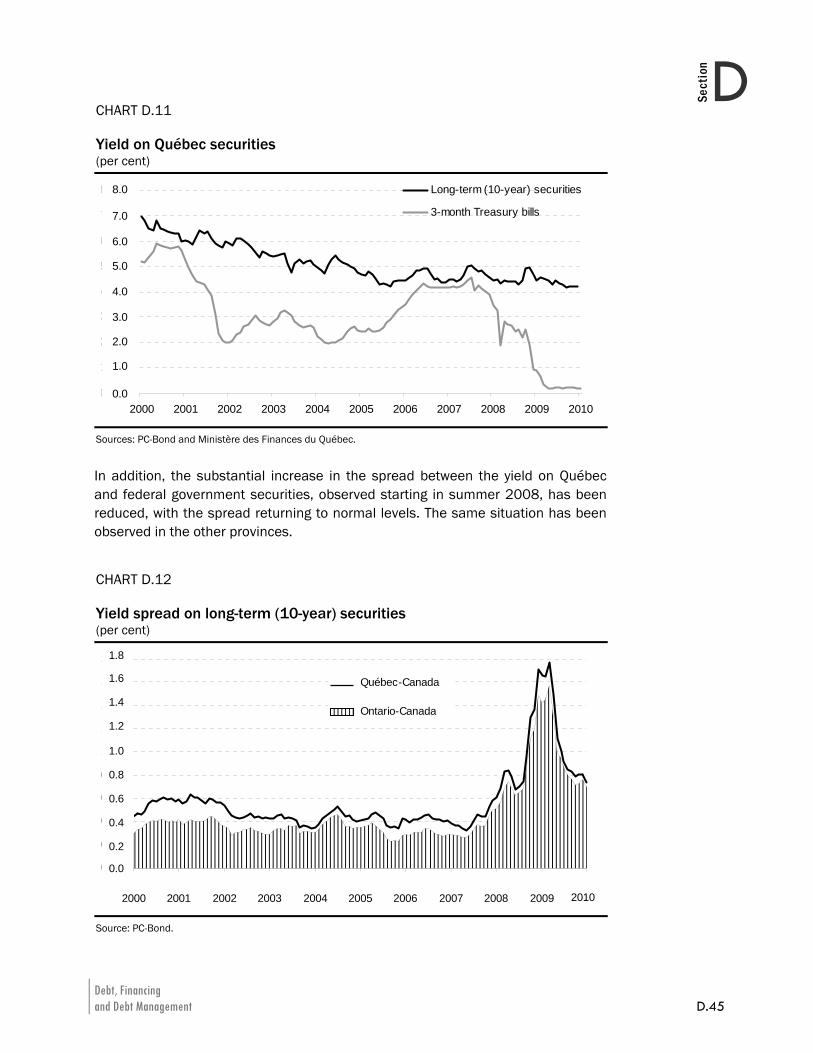
Debt, Financing and Debt Management D.45
DSection
CHART D.11 Yield on Québec securities (per cent)
0,00%
1,00%
2,00%
3,00%
4,00%
5,00%
6,00%
7,00%
8,00%
2000 2001 2002 2003 2004 2005 2006 2007 2008 2009 2010
Long-term (10-year) securities
3-month Treasury bills
8.0
7.0
6.0
5.0
4.0
3.0
2.0
1.0
0.0
Sources: PC-Bond and Ministère des Finances du Québec.
In addition, the substantial increase in the spread between the yield on Québec and federal government securities, observed starting in summer 2008, has been reduced, with the spread returning to normal levels. The same situation has been observed in the other provinces.
CHART D.12 Yield spread on long-term (10-year) securities (per cent)
0,0%
0,2%
0,4%
0,6%
0,8%
1,0%
1,2%
1,4%
1,6%
1,8%
2000 2001 2002 2003 2004 2005 2006 2007 2008 20092010
Québec-Canada
Ontario-Canada
1.6
1.4
1.2
1.0
0.8
0.6
0.4
0.2
0.0
1.8
2010
Source: PC-Bond.

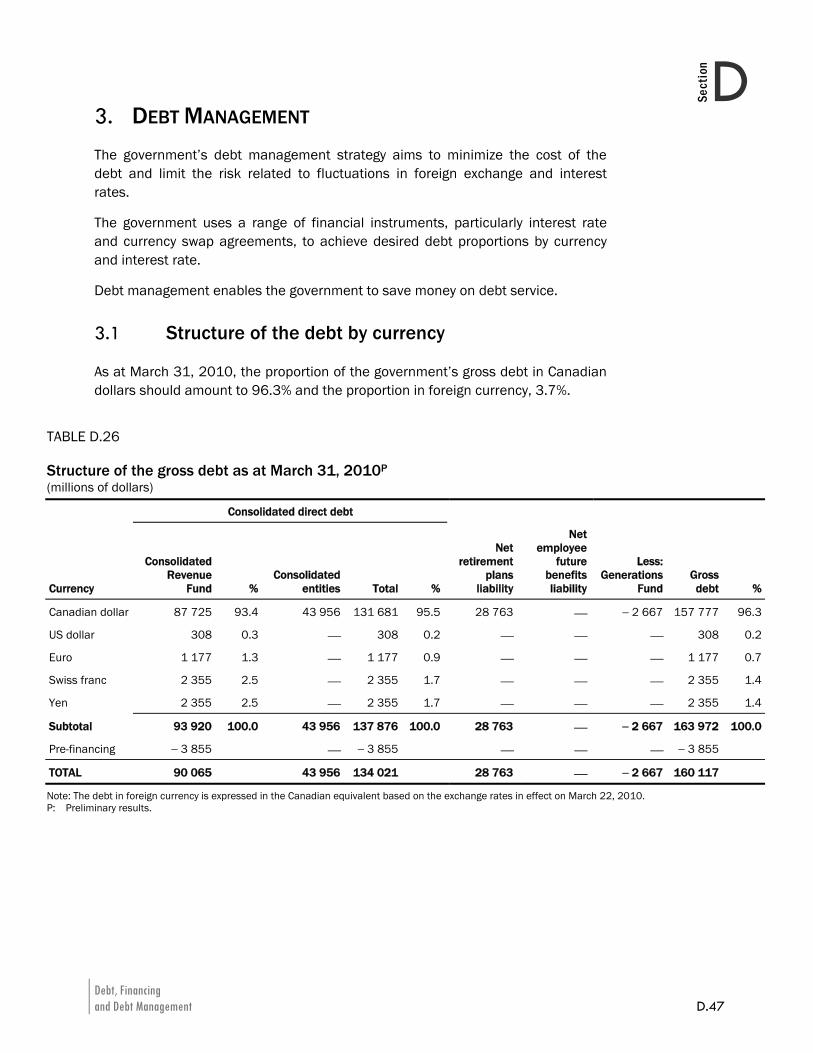
Debt, Financing and Debt Management D.47
DSection
3. DEBT MANAGEMENT The government’s debt management strategy aims to minimize the cost of the debt and limit the risk related to fluctuations in foreign exchange and interest rates.
The government uses a range of financial instruments, particularly interest rate and currency swap agreements, to achieve desired debt proportions by currency and interest rate.
Debt management enables the government to save money on debt service.
3.1 Structure of the debt by currency
As at March 31, 2010, the proportion of the government’s gross debt in Canadian dollars should amount to 96.3% and the proportion in foreign currency, 3.7%.
TABLE D.26 Structure of the gross debt as at March 31, 2010P (millions of dollars)
Consolidated direct debt
Currency
Consolidated Revenue
Fund % Consolidated
entities Total %
Net retirement
plans liability
Net employee
future benefits liability
Less: Generations
FundGross debt %
Canadian dollar 87 725 93.4 43 956 131 681 95.5 28 763 ⎯ − 2 667 157 777 96.3
US dollar 308 0.3 ⎯ 308 0.2 ⎯ ⎯ ⎯ 308 0.2
Euro 1 177 1.3 ⎯ 1 177 0.9 ⎯ ⎯ ⎯ 1 177 0.7
Swiss franc 2 355 2.5 ⎯ 2 355 1.7 ⎯ ⎯ ⎯ 2 355 1.4
Yen 2 355 2.5 ⎯ 2 355 1.7 ⎯ ⎯ ⎯ 2 355 1.4
Subtotal 93 920 100.0 43 956 137 876 100.0 28 763 ⎯ − 2 667 163 972 100.0
Pre-financing − 3 855 ⎯ − 3 855 ⎯ ⎯ ⎯ − 3 855
TOTAL 90 065 43 956 134 021 28 763 ⎯ − 2 667 160 117
Note: The debt in foreign currency is expressed in the Canadian equivalent based on the exchange rates in effect on March 22, 2010. P: Preliminary results.
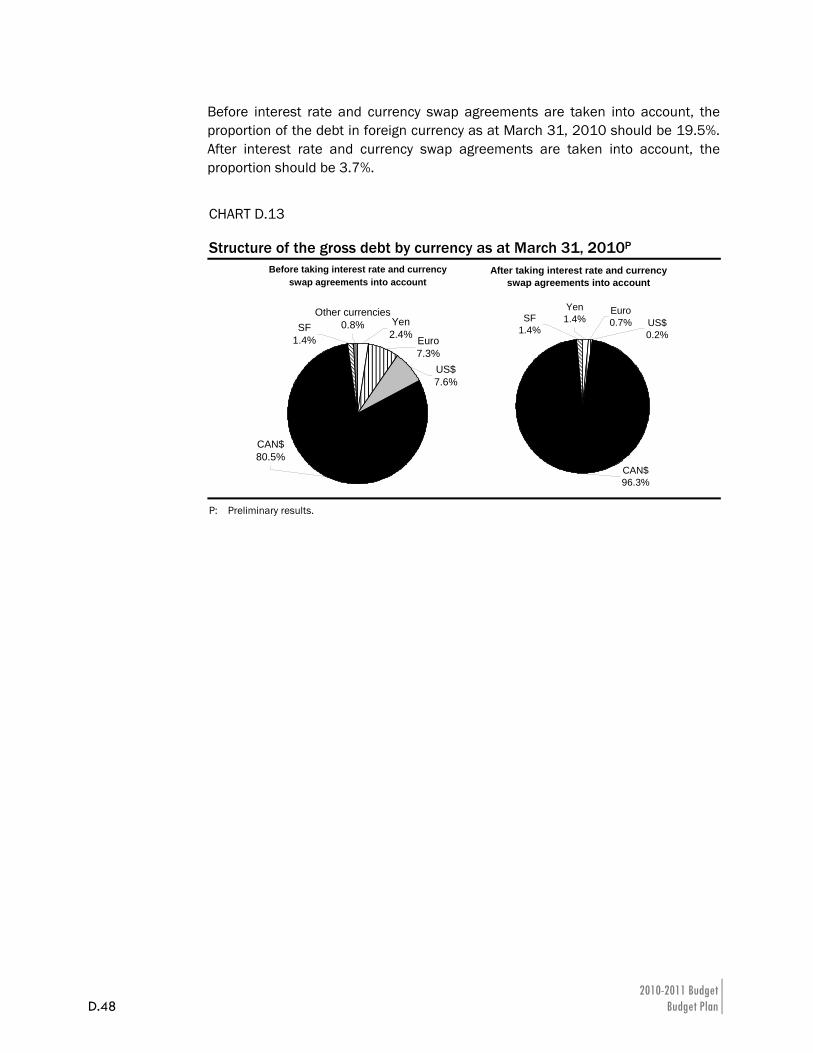
2010-2011 Budget D.48 Budget Plan
Before interest rate and currency swap agreements are taken into account, the proportion of the debt in foreign currency as at March 31, 2010 should be 19.5%. After interest rate and currency swap agreements are taken into account, the proportion should be 3.7%.
CHART D.13 Structure of the gross debt by currency as at March 31, 2010P
Before taking interest rate and currency swap agreements into account
Yen2.4%
SF1.4%
US$7.6%
Euro7.3%
Other currencies0.8%
CAN$80.5%
After taking interest rate and currency swap agreements into account
CAN$96.3%
Euro0.7% US$
0.2%
SF1.4%
Yen1.4%
P: Preliminary results.
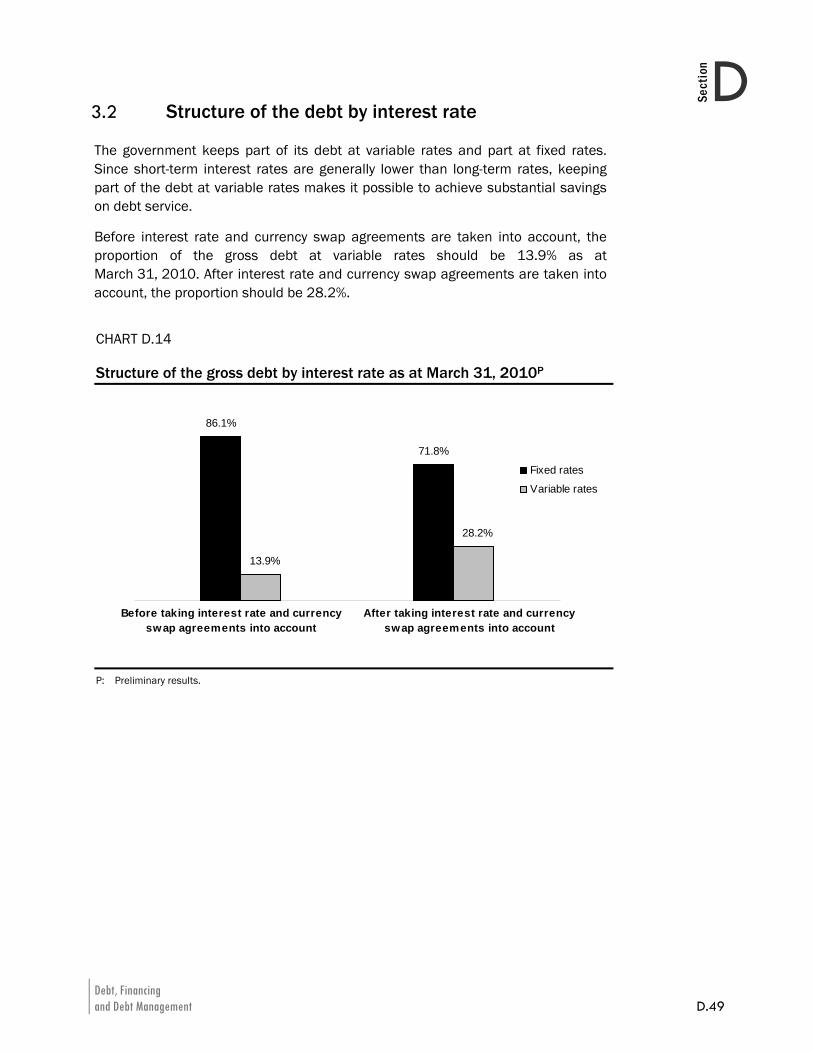
Debt, Financing and Debt Management D.49
DSection
3.2 Structure of the debt by interest rate
The government keeps part of its debt at variable rates and part at fixed rates. Since short-term interest rates are generally lower than long-term rates, keeping part of the debt at variable rates makes it possible to achieve substantial savings on debt service.
Before interest rate and currency swap agreements are taken into account, the proportion of the gross debt at variable rates should be 13.9% as at March 31, 2010. After interest rate and currency swap agreements are taken into account, the proportion should be 28.2%.
CHART D.14 Structure of the gross debt by interest rate as at March 31, 2010P
86.1%
71.8%
13.9%
28.2%
1 2
Fixed rates
Variable rates
Before taking interest rate and currencyswap agreements into account
After taking interest rate and currencyswap agreements into account
P: Preliminary results.

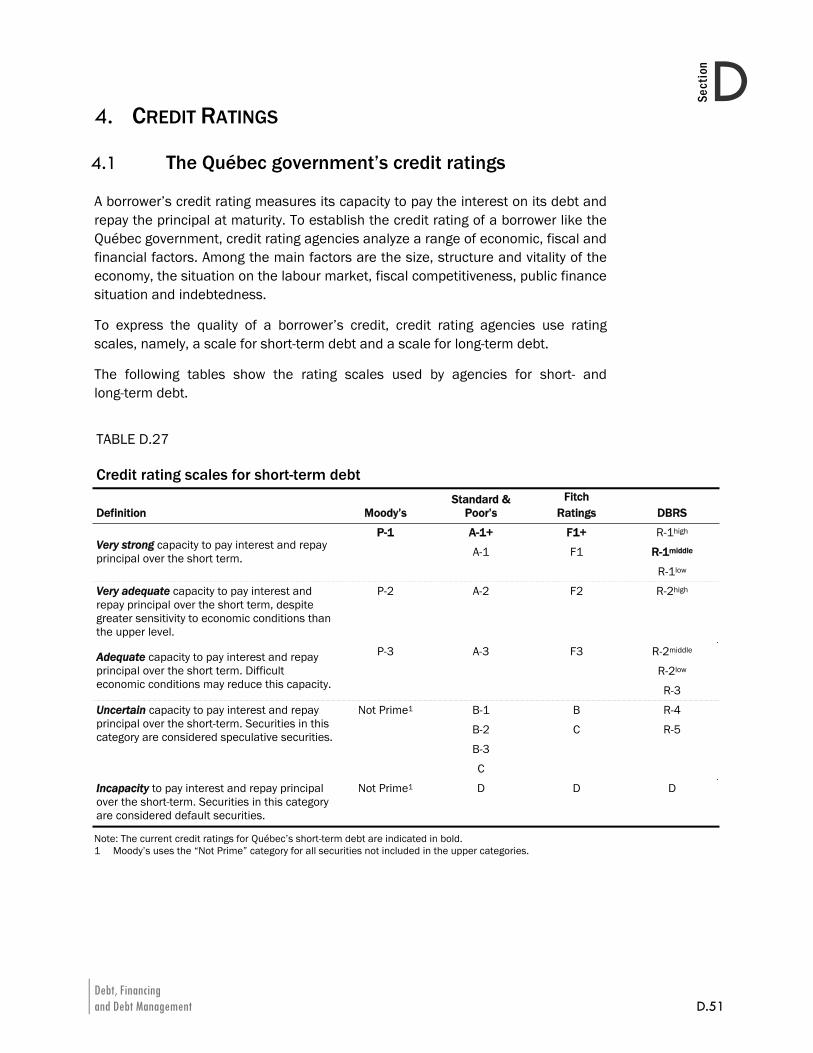
Debt, Financing and Debt Management D.51
DSection
4. CREDIT RATINGS
4.1 The Québec government’s credit ratings
A borrower’s credit rating measures its capacity to pay the interest on its debt and repay the principal at maturity. To establish the credit rating of a borrower like the Québec government, credit rating agencies analyze a range of economic, fiscal and financial factors. Among the main factors are the size, structure and vitality of the economy, the situation on the labour market, fiscal competitiveness, public finance situation and indebtedness.
To express the quality of a borrower’s credit, credit rating agencies use rating scales, namely, a scale for short-term debt and a scale for long-term debt.
The following tables show the rating scales used by agencies for short- and long-term debt.
TABLE D.27 Credit rating scales for short-term debt
Definition Moody’s Standard &
Poor’s Fitch
Ratings DBRS
P-1 A-1+ F1+ R-1high
A-1 F1 R-1middle Very strong capacity to pay interest and repay principal over the short term.
R-1low
P-2 A-2 F2 R-2high
Very adequate capacity to pay interest and repay principal over the short term, despite greater sensitivity to economic conditions than the upper level.
P-3 A-3 F3 R-2middle
R-2low Adequate capacity to pay interest and repay principal over the short term. Difficult economic conditions may reduce this capacity. R-3
Not Prime1 B-1 B R-4
B-2 C R-5
B-3
Uncertain capacity to pay interest and repay principal over the short-term. Securities in this category are considered speculative securities.
C
Incapacity to pay interest and repay principal over the short-term. Securities in this category are considered default securities.
Not Prime1 D D D
Note: The current credit ratings for Québec’s short-term debt are indicated in bold. 1 Moody’s uses the “Not Prime” category for all securities not included in the upper categories.
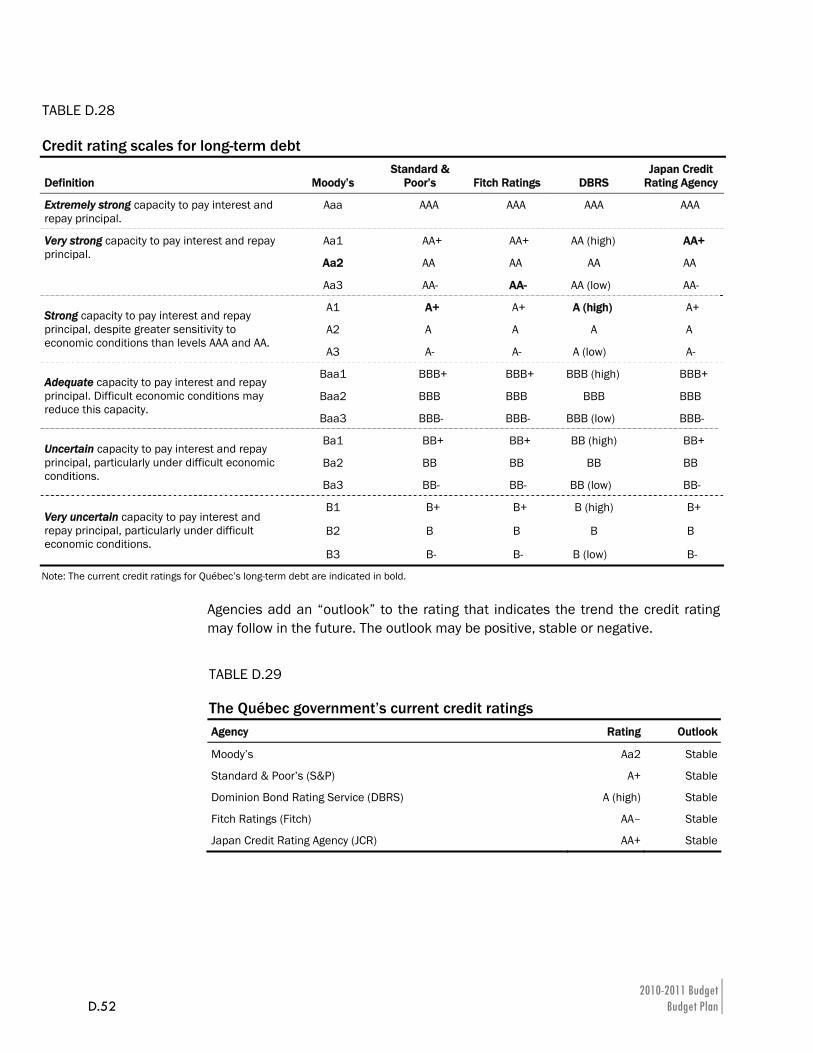
2010-2011 Budget D.52 Budget Plan
TABLE D.28 Credit rating scales for long-term debt
Definition Moody’s Standard &
Poor’s Fitch Ratings DBRS Japan Credit
Rating Agency
Extremely strong capacity to pay interest and repay principal.
Aaa AAA AAA AAA AAA
Aa1 AA+ AA+ AA (high) AA+
Aa2 AA AA AA AA
Very strong capacity to pay interest and repay principal.
Aa3 AA- AA- AA (low) AA-
A1 A+ A+ A (high) A+
A2 A A A A Strong capacity to pay interest and repay principal, despite greater sensitivity to economic conditions than levels AAA and AA.
A3 A- A- A (low) A-
Baa1 BBB+ BBB+ BBB (high) BBB+
Baa2 BBB BBB BBB BBB Adequate capacity to pay interest and repay principal. Difficult economic conditions may reduce this capacity.
Baa3 BBB- BBB- BBB (low) BBB-
Ba1 BB+ BB+ BB (high) BB+
Ba2 BB BB BB BB Uncertain capacity to pay interest and repay principal, particularly under difficult economic conditions.
Ba3 BB- BB- BB (low) BB-
B1 B+ B+ B (high) B+
B2 B B B B Very uncertain capacity to pay interest and repay principal, particularly under difficult economic conditions.
B3 B- B- B (low) B-
Note: The current credit ratings for Québec’s long-term debt are indicated in bold.
Agencies add an “outlook” to the rating that indicates the trend the credit rating may follow in the future. The outlook may be positive, stable or negative.
TABLE D.29 The Québec government’s current credit ratings Agency Rating Outlook
Moody’s Aa2 Stable
Standard & Poor’s (S&P) A+ Stable
Dominion Bond Rating Service (DBRS) A (high) Stable
Fitch Ratings (Fitch) AA– Stable
Japan Credit Rating Agency (JCR) AA+ Stable
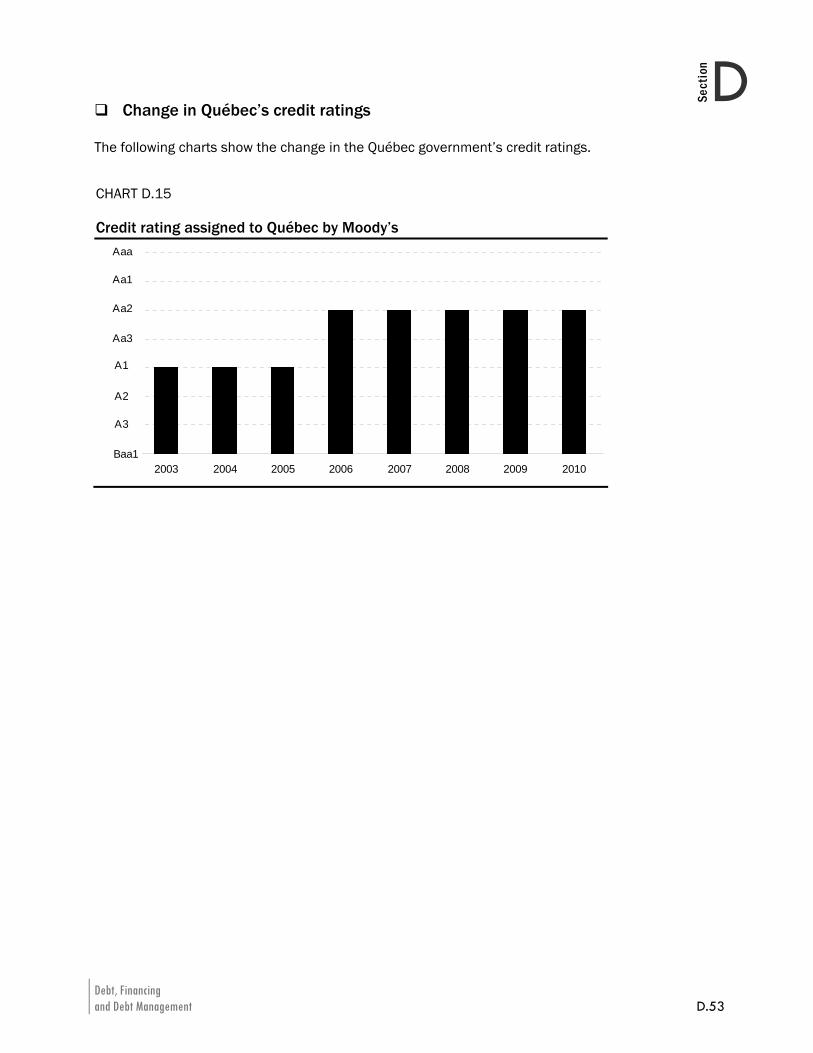
Debt, Financing and Debt Management D.53
DSection
Change in Québec’s credit ratings
The following charts show the change in the Québec government’s credit ratings.
CHART D.15 Credit rating assigned to Québec by Moody’s
A1
A1
A1
A1
A1
A1
A1
A1
2003 2004 2005 2006 2007 2008 2009 2010
Aaa
Aa1
Aa2
Aa3
A1
A2
A3
Baa1
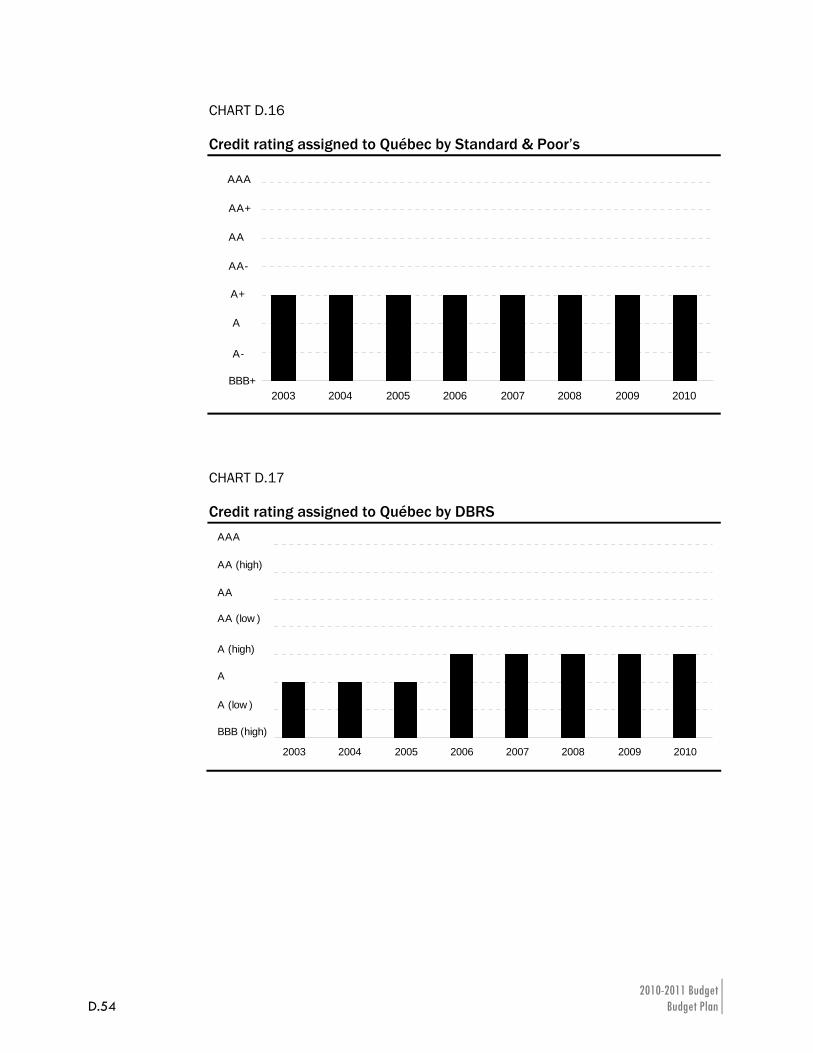
2010-2011 Budget D.54 Budget Plan
CHART D.16 Credit rating assigned to Québec by Standard & Poor’s
A+
A+
A+
A+
A+
A+
A+
A+
2003 2004 2005 2006 2007 2008 2009 2010
AA+
A+
AA
AAAAAAA
AA
AA
A
AAA
AA
AA+
AA
A+
A-
BBB+
A
AAA
AA
AA+
AA-
A+
CHART D.17 Credit rating assigned to Québec by DBRS
A
A
A
A
A
A
A
A
2003 2004 2005 2006 2007 2008 2009 2010
AA
AA (high)
AAA
A (low )
A
A (high)
AA (low )
BBB (high)
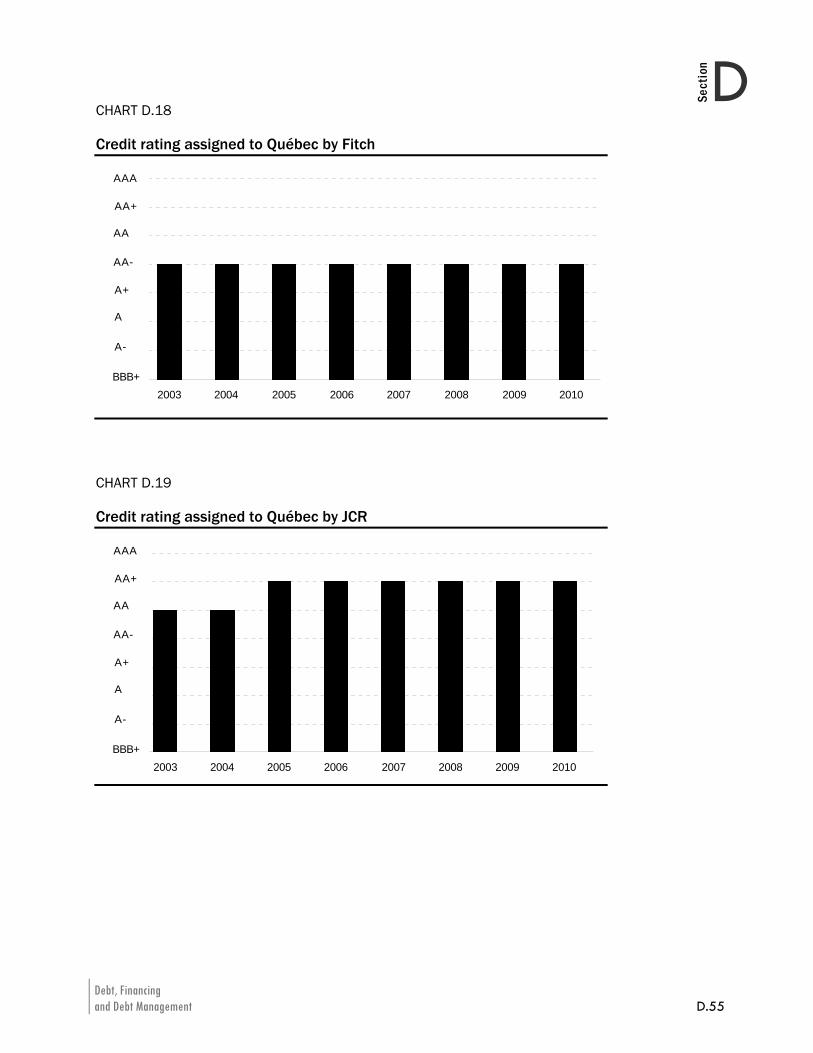
Debt, Financing and Debt Management D.55
DSection
CHART D.18 Credit rating assigned to Québec by Fitch
AA-
AA-
AA-
AA-
AA-
AA-
AA-
AA-
2003 2004 2005 2006 2007 2008 2009 2010
AA+
A+
AA
AAAAAAA
AA
AA
AA+A+A+A+
AAA
AA
AA+
AAA+
A-
BBB+
A
AAA
AA
AA+
AA-
A+
CHART D.19 Credit rating assigned to Québec by JCR
AA
AA
AA
AA
AA
AA
AA
AA
2003 2004 2005 2006 2007 2008 2009 2010
AAAAAA
A+
A-
BBB+
A
AAA
AA
AA+
AA-
A+
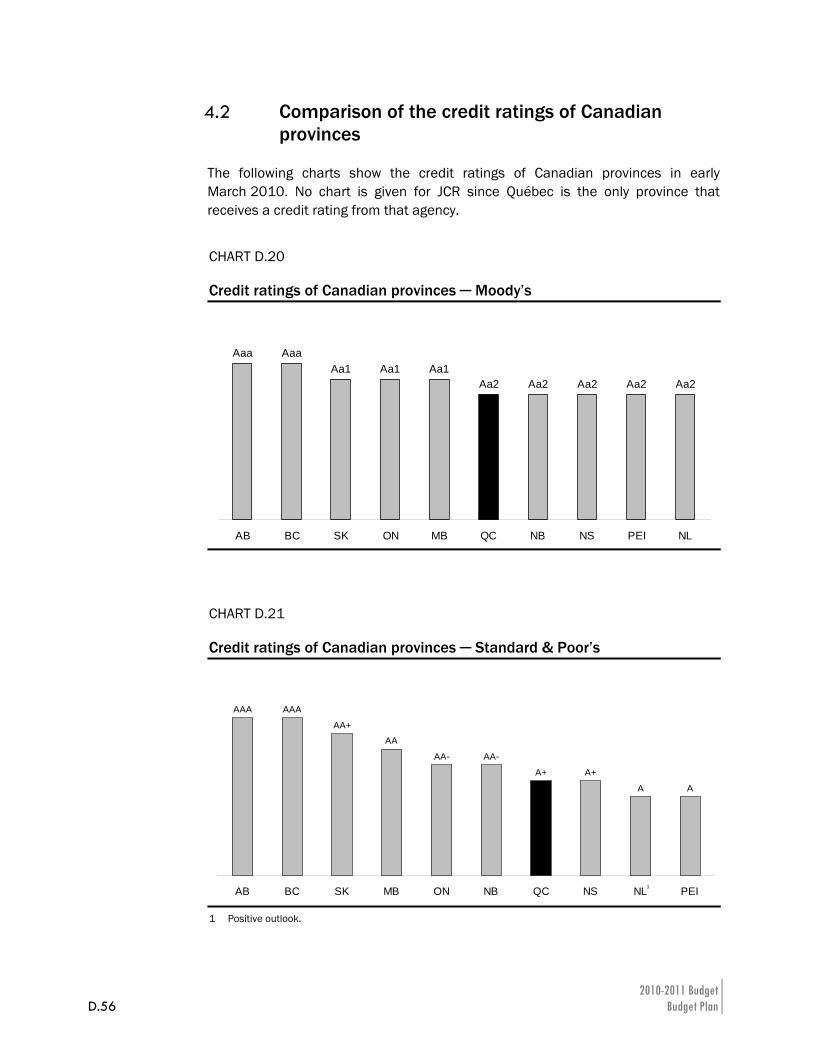
2010-2011 Budget D.56 Budget Plan
4.2 Comparison of the credit ratings of Canadian provinces
The following charts show the credit ratings of Canadian provinces in early March 2010. No chart is given for JCR since Québec is the only province that receives a credit rating from that agency.
CHART D.20 Credit ratings of Canadian provinces ─ Moody’s
Aaa AaaAa1 Aa1 Aa1
Aa2 Aa2 Aa2 Aa2Aa2
AB BC SK ON MB QC NB NS PEI NL
CHART D.21 Credit ratings of Canadian provinces ─ Standard & Poor’s
AAA AAA
AA
AA- AA-
A+ A+
A A
AA+
AB BC SK MB ON NB QC NS NL PEI1
1 Positive outlook.
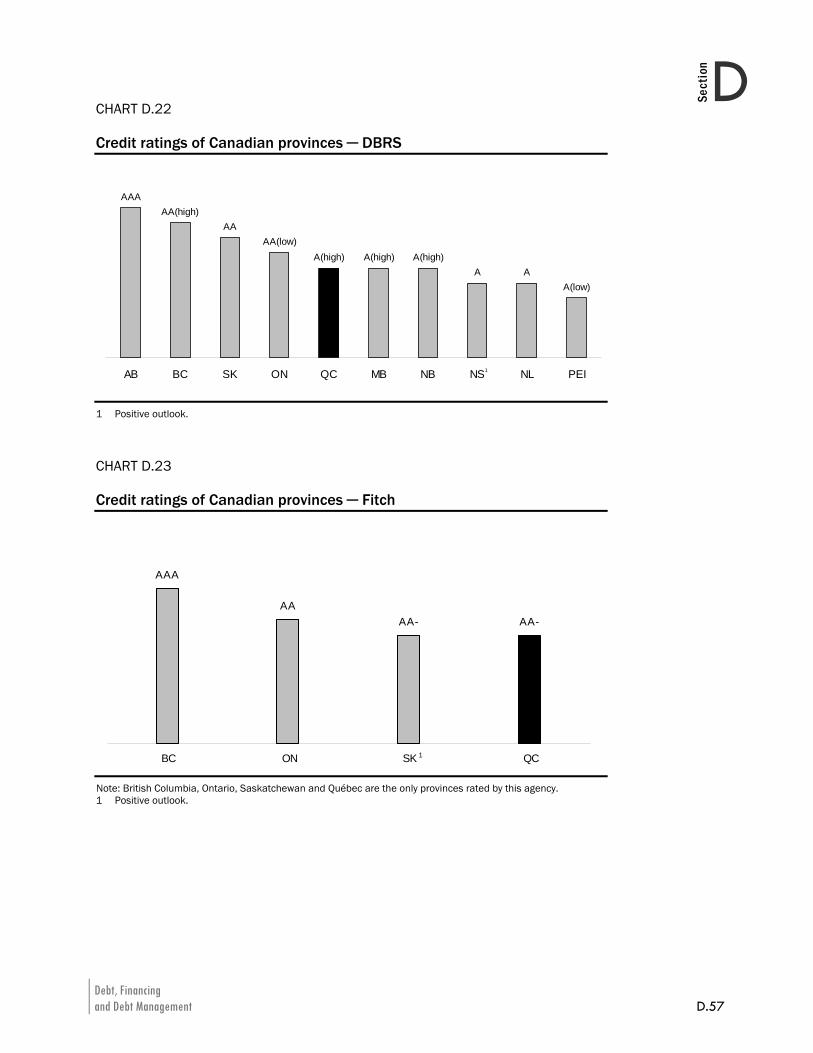
Debt, Financing and Debt Management D.57
DSection
CHART D.22 Credit ratings of Canadian provinces ─ DBRS
AAAAA(high)
AAAA(low)
A(high) A(high) A(high)A A
A(low)
AB BC SK ON QC MB NB NS NL PEI1
1 Positive outlook.
CHART D.23 Credit ratings of Canadian provinces ─ Fitch
AAAA- AA-
AAA
BC ON SK QC1
Note: British Columbia, Ontario, Saskatchewan and Québec are the only provinces rated by this agency. 1 Positive outlook.

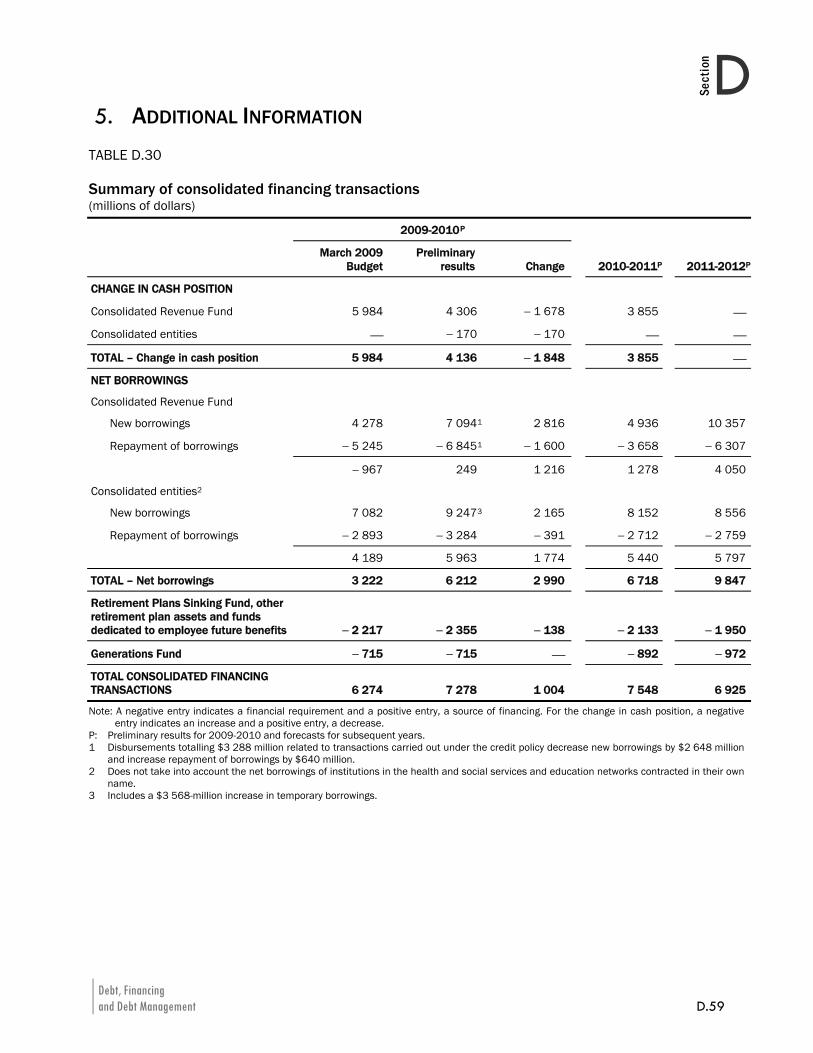
Debt, Financing and Debt Management D.59
DSection
5. ADDITIONAL INFORMATION
TABLE D.30 Summary of consolidated financing transactions (millions of dollars)
2009-2010 P
March 2009
BudgetPreliminary
results Change 2010-2011P 2011-2012P
CHANGE IN CASH POSITION
Consolidated Revenue Fund 5 984 4 306 − 1 678 3 855 ⎯
Consolidated entities ⎯ − 170 − 170 ⎯ ⎯
TOTAL – Change in cash position 5 984 4 136 − 1 848 3 855 ⎯
NET BORROWINGS
Consolidated Revenue Fund
New borrowings 4 278 7 0941 2 816 4 936 10 357
Repayment of borrowings − 5 245 − 6 8451 − 1 600 − 3 658 − 6 307
− 967 249 1 216 1 278 4 050
Consolidated entities2
New borrowings 7 082 9 2473 2 165 8 152 8 556
Repayment of borrowings − 2 893 − 3 284 − 391 − 2 712 − 2 759
4 189 5 963 1 774 5 440 5 797
TOTAL – Net borrowings 3 222 6 212 2 990 6 718 9 847
Retirement Plans Sinking Fund, other retirement plan assets and funds dedicated to employee future benefits − 2 217 − 2 355 − 138 − 2 133 − 1 950
Generations Fund − 715 − 715 ⎯ − 892 − 972
TOTAL CONSOLIDATED FINANCING TRANSACTIONS 6 274 7 278 1 004 7 548 6 925
Note: A negative entry indicates a financial requirement and a positive entry, a source of financing. For the change in cash position, a negative entry indicates an increase and a positive entry, a decrease.
P: Preliminary results for 2009-2010 and forecasts for subsequent years. 1 Disbursements totalling $3 288 million related to transactions carried out under the credit policy decrease new borrowings by $2 648 million
and increase repayment of borrowings by $640 million. 2 Does not take into account the net borrowings of institutions in the health and social services and education networks contracted in their own
name. 3 Includes a $3 568-million increase in temporary borrowings.
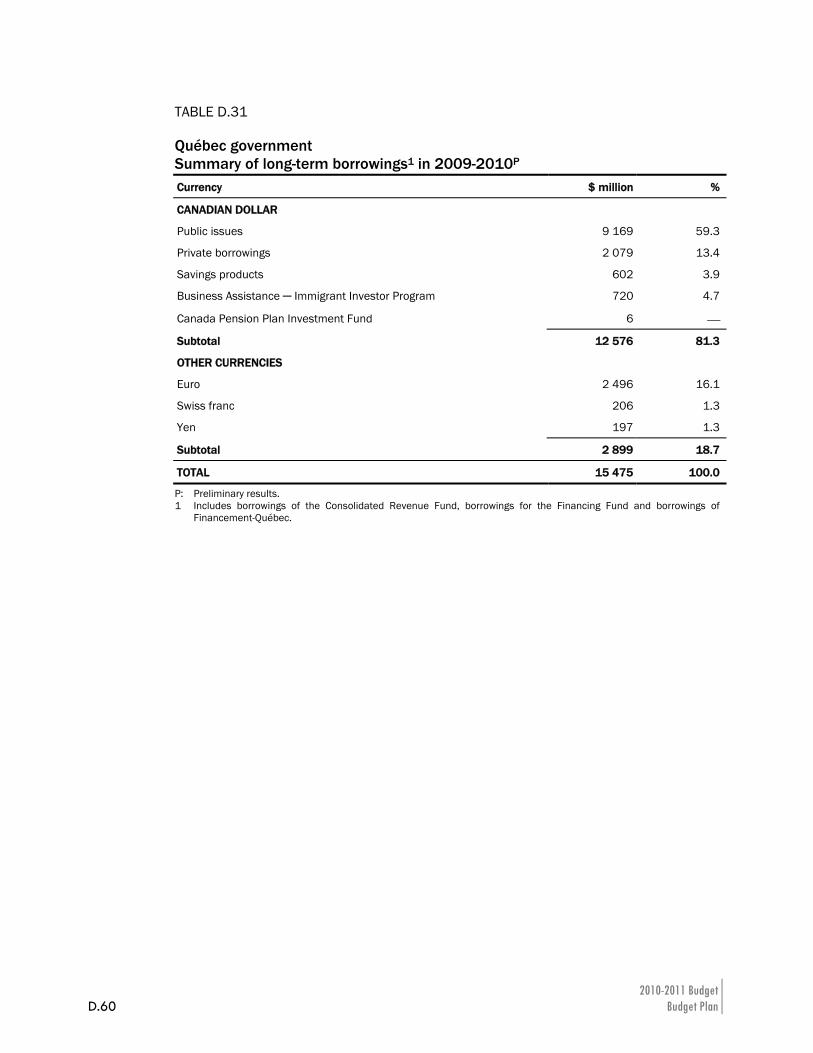
2010-2011 Budget D.60 Budget Plan
TABLE D.31 Québec government Summary of long-term borrowings1 in 2009-2010P Currency $ million %
CANADIAN DOLLAR
Public issues 9 169 59.3
Private borrowings 2 079 13.4
Savings products 602 3.9
Business Assistance ─ Immigrant Investor Program 720 4.7
Canada Pension Plan Investment Fund 6 ⎯
Subtotal 12 576 81.3
OTHER CURRENCIES
Euro 2 496 16.1
Swiss franc 206 1.3
Yen 197 1.3
Subtotal 2 899 18.7
TOTAL 15 475 100.0
P: Preliminary results. 1 Includes borrowings of the Consolidated Revenue Fund, borrowings for the Financing Fund and borrowings of
Financement-Québec.
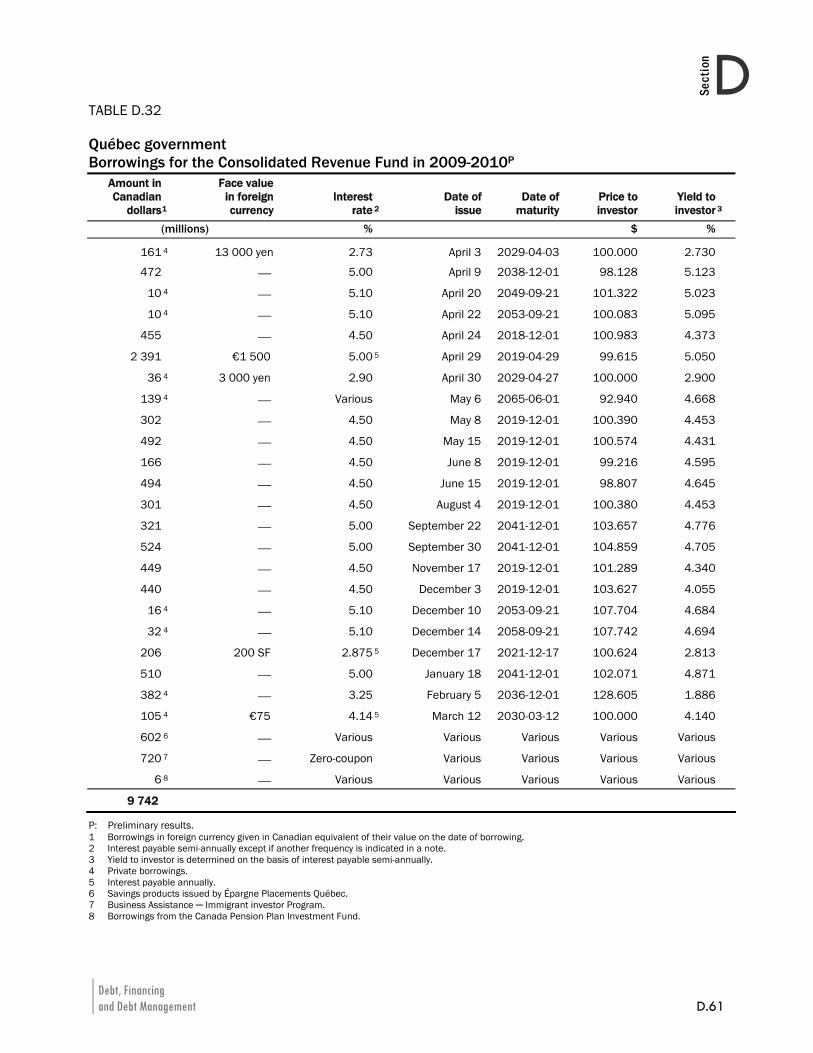
Debt, Financing and Debt Management D.61
DSection
TABLE D.32 Québec government Borrowings for the Consolidated Revenue Fund in 2009-2010P
Amount in Canadian
dollars 1
Face value in foreign currency
Interestrate 2
Date of issue
Date of maturity
Price to investor
Yield to investor 3
(millions) % $ %
161 4 13 000 yen 2.73 April 3 2029-04-03 100.000 2.730
472 ⎯ 5.00 April 9 2038-12-01 98.128 5.123
10 4 ⎯ 5.10 April 20 2049-09-21 101.322 5.023
10 4 ⎯ 5.10 April 22 2053-09-21 100.083 5.095
455 ⎯ 4.50 April 24 2018-12-01 100.983 4.373
2 391 €1 500 5.00 5 April 29 2019-04-29 99.615 5.050
36 4 3 000 yen 2.90 April 30 2029-04-27 100.000 2.900
139 4 ⎯ Various May 6 2065-06-01 92.940 4.668
302 ⎯ 4.50 May 8 2019-12-01 100.390 4.453
492 ⎯ 4.50 May 15 2019-12-01 100.574 4.431
166 ⎯ 4.50 June 8 2019-12-01 99.216 4.595
494 ⎯ 4.50 June 15 2019-12-01 98.807 4.645
301 ⎯ 4.50 August 4 2019-12-01 100.380 4.453
321 ⎯ 5.00 September 22 2041-12-01 103.657 4.776
524 ⎯ 5.00 September 30 2041-12-01 104.859 4.705
449 ⎯ 4.50 November 17 2019-12-01 101.289 4.340
440 ⎯ 4.50 December 3 2019-12-01 103.627 4.055
16 4 ⎯ 5.10 December 10 2053-09-21 107.704 4.684
32 4 ⎯ 5.10 December 14 2058-09-21 107.742 4.694
206 200 SF 2.875 5 December 17 2021-12-17 100.624 2.813
510 ⎯ 5.00 January 18 2041-12-01 102.071 4.871
382 4 ⎯ 3.25 February 5 2036-12-01 128.605 1.886
105 4 €75 4.14 5 March 12 2030-03-12 100.000 4.140
602 6 ⎯ Various Various Various Various Various
720 7 ⎯ Zero-coupon Various Various Various Various
6 8 ⎯ Various Various Various Various Various
9 742
P: Preliminary results. 1 Borrowings in foreign currency given in Canadian equivalent of their value on the date of borrowing. 2 Interest payable semi-annually except if another frequency is indicated in a note. 3 Yield to investor is determined on the basis of interest payable semi-annually. 4 Private borrowings. 5 Interest payable annually. 6 Savings products issued by Épargne Placements Québec. 7 Business Assistance ─ Immigrant investor Program. 8 Borrowings from the Canada Pension Plan Investment Fund.
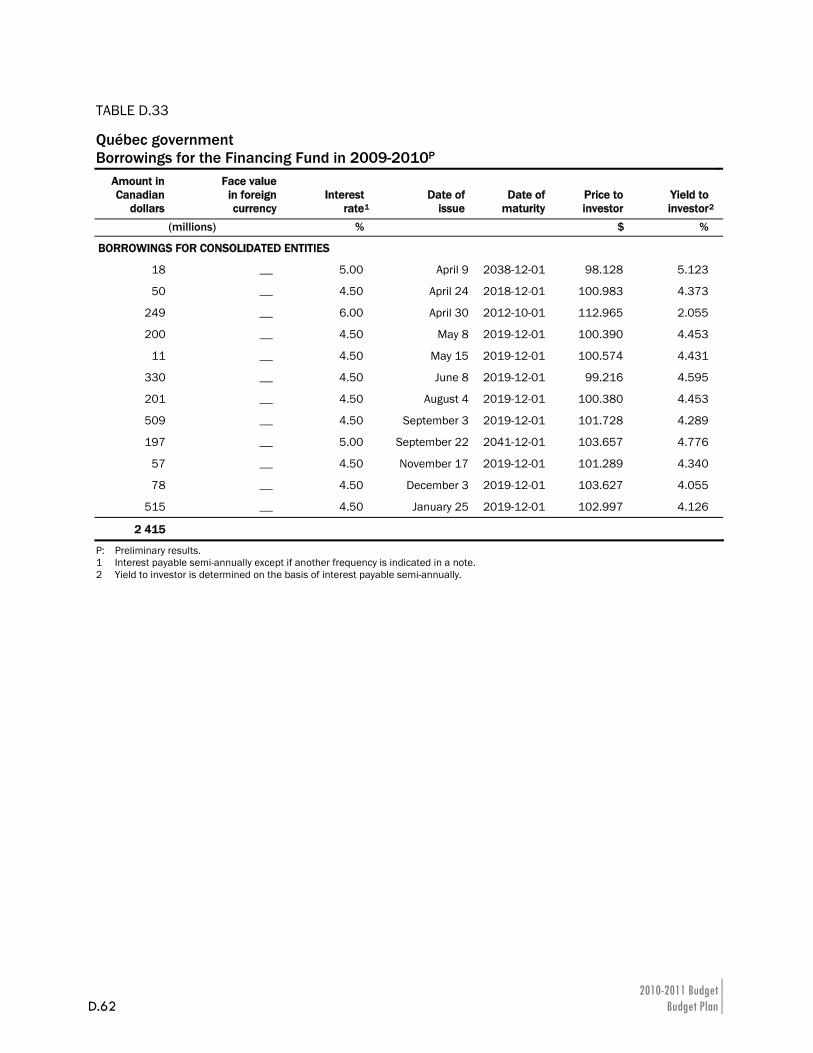
2010-2011 Budget D.62 Budget Plan
TABLE D.33
Québec government Borrowings for the Financing Fund in 2009-2010P
Amount in Canadian
dollars
Face value in foreign currency
Interest rate1
Date of issue
Date of maturity
Price to investor
Yield to investor2
(millions) % $ %
BORROWINGS FOR CONSOLIDATED ENTITIES
18 ⎯ 5.00 April 9 2038-12-01 98.128 5.123
50 ⎯ 4.50 April 24 2018-12-01 100.983 4.373
249 ⎯ 6.00 April 30 2012-10-01 112.965 2.055
200 ⎯ 4.50 May 8 2019-12-01 100.390 4.453
11 ⎯ 4.50 May 15 2019-12-01 100.574 4.431
330 ⎯ 4.50 June 8 2019-12-01 99.216 4.595
201 ⎯ 4.50 August 4 2019-12-01 100.380 4.453
509 ⎯ 4.50 September 3 2019-12-01 101.728 4.289
197 ⎯ 5.00 September 22 2041-12-01 103.657 4.776
57 ⎯ 4.50 November 17 2019-12-01 101.289 4.340
78 ⎯ 4.50 December 3 2019-12-01 103.627 4.055
515 ⎯ 4.50 January 25 2019-12-01 102.997 4.126
2 415
P: Preliminary results. 1 Interest payable semi-annually except if another frequency is indicated in a note. 2 Yield to investor is determined on the basis of interest payable semi-annually.
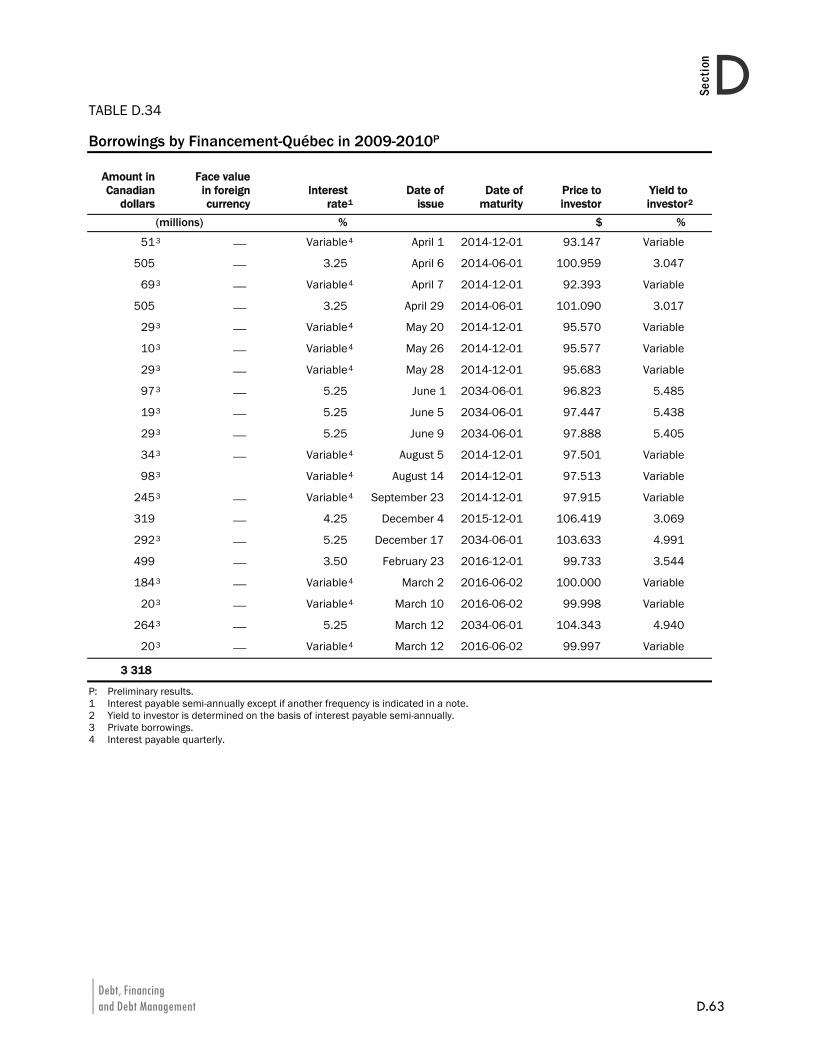
Debt, Financing and Debt Management D.63
DSection
TABLE D.34 Borrowings by Financement-Québec in 2009-2010P
Amount in Canadian
dollars
Face value in foreign currency
Interestrate1
Date of issue
Date of maturity
Price to investor
Yield to investor2
(millions) % $ %
51 3 ⎯ Variable4 April 1 2014-12-01 93.147 Variable
505 ⎯ 3.25 April 6 2014-06-01 100.959 3.047
69 3 ⎯ Variable4 April 7 2014-12-01 92.393 Variable
505 ⎯ 3.25 April 29 2014-06-01 101.090 3.017
29 3 ⎯ Variable4 May 20 2014-12-01 95.570 Variable
10 3 ⎯ Variable4 May 26 2014-12-01 95.577 Variable
29 3 ⎯ Variable4 May 28 2014-12-01 95.683 Variable
97 3 ⎯ 5.25 June 1 2034-06-01 96.823 5.485
19 3 ⎯ 5.25 June 5 2034-06-01 97.447 5.438
29 3 ⎯ 5.25 June 9 2034-06-01 97.888 5.405
34 3 ⎯ Variable4 August 5 2014-12-01 97.501 Variable
98 3 Variable4 August 14 2014-12-01 97.513 Variable
245 3 ⎯ Variable4 September 23 2014-12-01 97.915 Variable
319 ⎯ 4.25 December 4 2015-12-01 106.419 3.069
292 3 ⎯ 5.25 December 17 2034-06-01 103.633 4.991
499 ⎯ 3.50 February 23 2016-12-01 99.733 3.544
184 3 ⎯ Variable4 March 2 2016-06-02 100.000 Variable
20 3 ⎯ Variable4 March 10 2016-06-02 99.998 Variable
264 3 ⎯ 5.25 March 12 2034-06-01 104.343 4.940
20 3 ⎯ Variable4 March 12 2016-06-02 99.997 Variable
3 318
P: Preliminary results. 1 Interest payable semi-annually except if another frequency is indicated in a note. 2 Yield to investor is determined on the basis of interest payable semi-annually. 3 Private borrowings. 4 Interest payable quarterly.
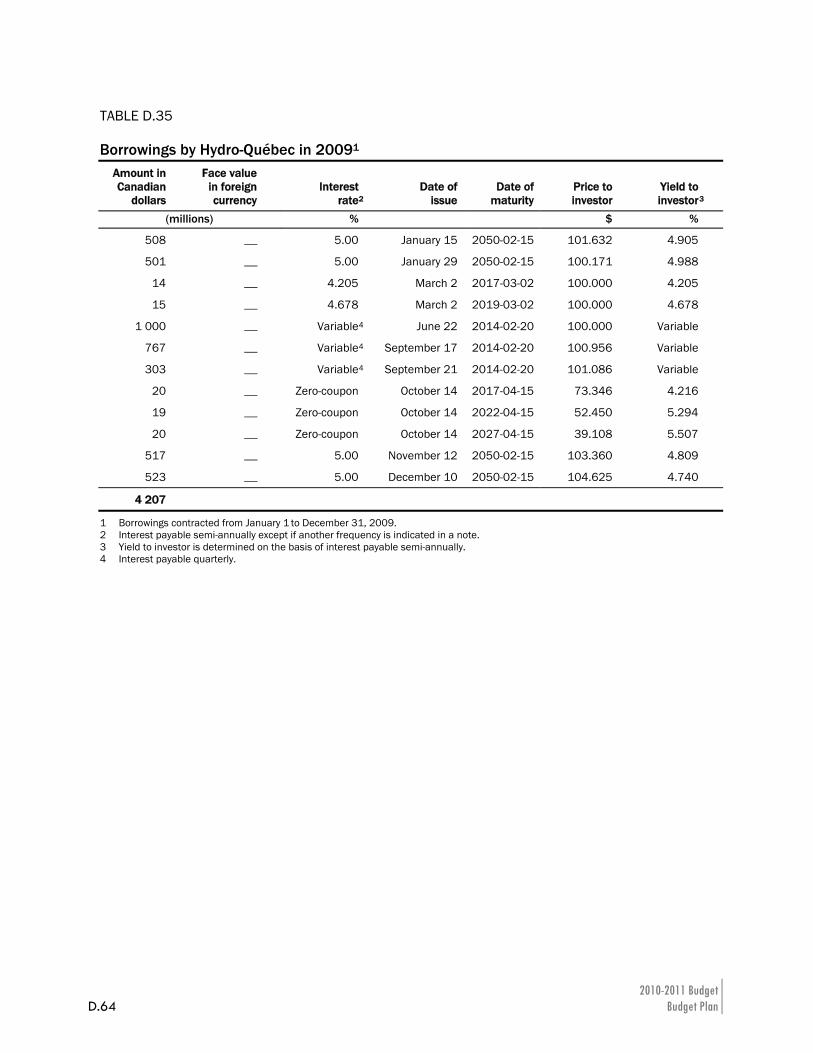
2010-2011 Budget D.64 Budget Plan
TABLE D.35 Borrowings by Hydro-Québec in 20091
Amount in Canadian
dollars
Face value in foreign currency
Interest rate2
Date of issue
Date of maturity
Price to investor
Yield to investor3
(millions) % $ %
508 ⎯ 5.00 January 15 2050-02-15 101.632 4.905
501 ⎯ 5.00 January 29 2050-02-15 100.171 4.988
14 ⎯ 4.205 March 2 2017-03-02 100.000 4.205
15 ⎯ 4.678 March 2 2019-03-02 100.000 4.678
1 000 ⎯ Variable4 June 22 2014-02-20 100.000 Variable
767 ⎯ Variable4 September 17 2014-02-20 100.956 Variable
303 ⎯ Variable4 September 21 2014-02-20 101.086 Variable
20 ⎯ Zero-coupon October 14 2017-04-15 73.346 4.216
19 ⎯ Zero-coupon October 14 2022-04-15 52.450 5.294
20 ⎯ Zero-coupon October 14 2027-04-15 39.108 5.507
517 ⎯ 5.00 November 12 2050-02-15 103.360 4.809
523 ⎯ 5.00 December 10 2050-02-15 104.625 4.740
4 207
1 Borrowings contracted from January 1 to December 31, 2009. 2 Interest payable semi-annually except if another frequency is indicated in a note. 3 Yield to investor is determined on the basis of interest payable semi-annually. 4 Interest payable quarterly.
E.1
Section E
E Update on Federal Transfers
1. INTRODUCTION..................................................................................................E.3
2. EQUALIZATION: MYTHS AND REALITY ..................................................................E.5
2.1 Why have an equalization program?.........................................................E.5 2.2 The cost of Canada’s equalization program .............................................E.7 2.3 Redistribution within the Canadian federation.........................................E.9 2.4 Québec’s share of the equalization envelope ........................................E.12 2.5 How Québec funds its programs .............................................................E.13
3. PRIORITY ISSUES THAT NEED TO BE SETTLED ..................................................... E.19
3.1 Compensate Québec for harmonizing the QST with the GST......................................................................................................E.19
3.2 Fair treatment of Hydro-Québec’s revenue in the equalization program ...............................................................................E.21
3.3 Reducing the cost of the equalization program fairly ............................E.22 3.4 Make the use of “protection payments” systematic ..............................E.26 3.5 Settle the dispute over the revenue stabilization
program.....................................................................................................E.28 4. CONCLUSION ................................................................................................. E.29

Update on Federal Transfers E.3
ESect
ion
1. INTRODUCTION Over the past year, the equalization program has been the subject of debate, at times heated, among some of Canada’s political observers and players. Québec has also sometimes been the target of their criticism. Some have openly called on the federal government to cut and even scrap equalization.
That is why the Québec government welcomed the decision announced in the federal government’s budget delivered on March 4, 2010, namely, that it “will not cut major transfers to other levels of government in support of health care and social services [and] Equalization…”.1
Given the important issues at stake and the inaccuracy of some of the comments made, this section sets the record straight about the equalization program and Québec’s budgetary and fiscal choices.
Furthermore, in recent years, the Québec government has argued for fiscal arrangements that are based on sound principles, that is, arrangements that are adequate, predictable and fair for all partners in the Canadian federation.
Major issues remain outstanding2 and the talks must continue, particularly as we head towards the renewal of the main transfer programs to the provinces, which are set to end in 2013-2014 under the federal legislation.
However, a number of priority issues need to be resolved so that Québec receives comparable treatment to that offered by the federal government to several other provinces in recent years. This section addresses these issues as well.
1 DEPARTMENT OF FINANCE CANADA, Canada’s Economic Action Plan: Year 2 – Budget 2010:
Leading the Way on Jobs and Growth, March 4, 2010, page 156. 2 The main issues are presented in Section G of the 2009-2010 Budget Plan.


Update on Federal Transfers E.5
ESect
ion
2. EQUALIZATION: MYTHS AND REALITY The Québec government is of the opinion that the equalization program is a fundamental component of Canadian fiscal federalism and has always advocated for a program that is adequate, fair and based on solid principles.
The Québec government disagrees with the unfounded criticism based on partial and erroneous analysis that has been levelled in recent months regarding both the equalization program and Québec’s budgetary and fiscal choices.
This section discusses:
⎯ the rationale for an equalization program;
⎯ the cost of Canada’s equalization program;
⎯ redistribution within the Canadian federation;
⎯ Québec’s share of the equalization envelope;
⎯ how Québec funds its programs.
2.1 Why have an equalization program?
Like many of the world’s federations, Canada implemented an equalization program to reduce disparities in fiscal capacity among the provinces.
The purpose of Canada’s equalization program was entrenched in subsection 36(2) of the Constitution Act, 1982:
Parliament and the government of Canada are committed to the principle of making equalization payments to ensure that provincial governments have sufficient revenues to provide reasonably comparable levels of public services at reasonably comparable levels of taxation.
The equalization program is paid by the federal government out of the revenues it collects throughout Canada. That means that every Canadian taxpayer, including those who live in Québec, funds their share of equalization payments.
An equalization program is first of all an expression of the concept that a country’s economic development must benefit all of its citizens, regardless of where they live. It’s the opposite of the concept of “every man for himself”.
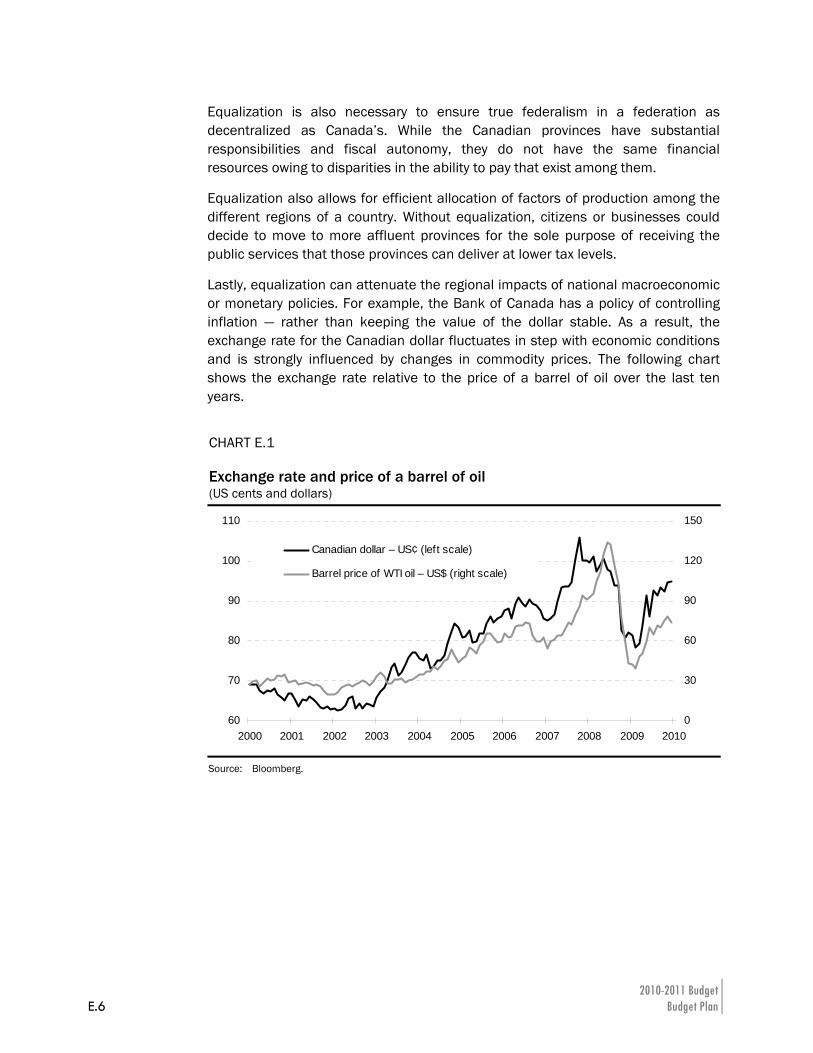
2010-2011 Budget E.6 Budget Plan
Equalization is also necessary to ensure true federalism in a federation as decentralized as Canada’s. While the Canadian provinces have substantial responsibilities and fiscal autonomy, they do not have the same financial resources owing to disparities in the ability to pay that exist among them.
Equalization also allows for efficient allocation of factors of production among the different regions of a country. Without equalization, citizens or businesses could decide to move to more affluent provinces for the sole purpose of receiving the public services that those provinces can deliver at lower tax levels.
Lastly, equalization can attenuate the regional impacts of national macroeconomic or monetary policies. For example, the Bank of Canada has a policy of controlling inflation — rather than keeping the value of the dollar stable. As a result, the exchange rate for the Canadian dollar fluctuates in step with economic conditions and is strongly influenced by changes in commodity prices. The following chart shows the exchange rate relative to the price of a barrel of oil over the last ten years.
CHART E.1 Exchange rate and price of a barrel of oil (US cents and dollars)
60
70
80
90
100
110
2000 2001 2002 2003 2004 2005 2006 2007 2008 2009 20100
30
60
90
120
150
Canadian dollar – US¢ (left scale)
Barrel price of WTI oil – US$ (right scale)
Source: Bloomberg.
Update on Federal Transfers E.7
ESect
ion
A rise in the world price of a barrel of oil favours provinces that have that resource. However, the rise in the Canadian dollar that accompanies the rising price of oil hampers the exports of the other provinces. An adequate equalization program can mitigate this phenomenon by increasing the revenues of provinces that are negatively affected by the rise in the dollar, without reducing the revenues of provinces that benefit from the higher price of oil.
Accordingly, equalization is a true pillar of federalism that demands rigorous analysis.
2.2 The cost of Canada’s equalization program
Some maintain that the existing equalization program is adequate simply because the program’s cost has grown over the last few years and will continue to do so, over the next few years, at the rate of growth in nominal gross domestic product (GDP) in Canada. Others argue that the equalization program is too expensive and advance measures to cut it back or even scrap it.
To check whether these affirmations are well-founded, it is worthwhile examining whether, historically or internationally, Canada’s equalization program is abnormally expensive.
When compared to Canada’s collective wealth, i.e. its GDP, the cost of the equalization program is much lower now than in the past. In 2010-2011, the cost of the equalization program amounts to 0.88% of Canada’s nominal GDP, significantly below the historical annual average of 1.02% since 1967-1968. If the cost of the equalization program were to correspond to the historical average, it would be $2.3 billion higher in 2010-2011.
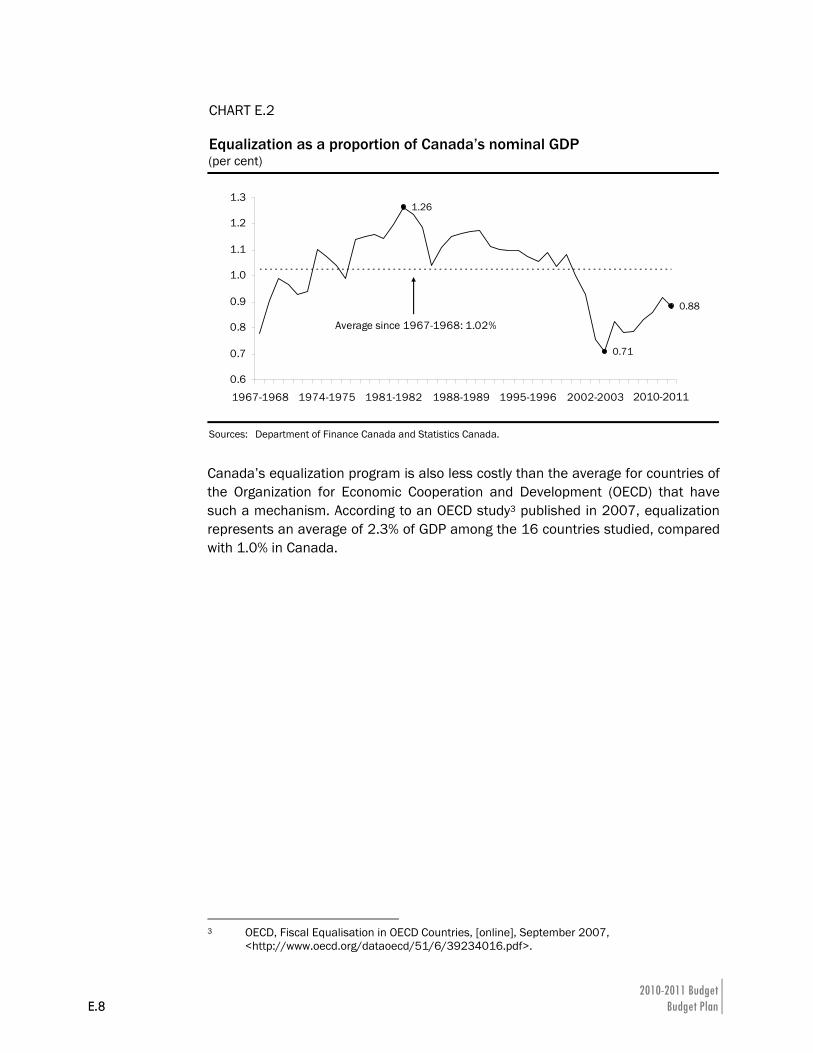
2010-2011 Budget E.8 Budget Plan
CHART E.2 Equalization as a proportion of Canada’s nominal GDP (per cent)
1.26
0.71
0.88
0.6
0.7
0.8
0.9
1.0
1.1
1.2
1.3
1967-1968 1974-1975 1981-1982 1988-1989 1995-1996 2002-2003 2009-2010
Average since 1967-1968: 1.02%
Sources: Department of Finance Canada and Statistics Canada.
Canada’s equalization program is also less costly than the average for countries of the Organization for Economic Cooperation and Development (OECD) that have such a mechanism. According to an OECD study3 published in 2007, equalization represents an average of 2.3% of GDP among the 16 countries studied, compared with 1.0% in Canada.
3 OECD, Fiscal Equalisation in OECD Countries, [online], September 2007,
<http://www.oecd.org/dataoecd/51/6/39234016.pdf>.
2010-2011
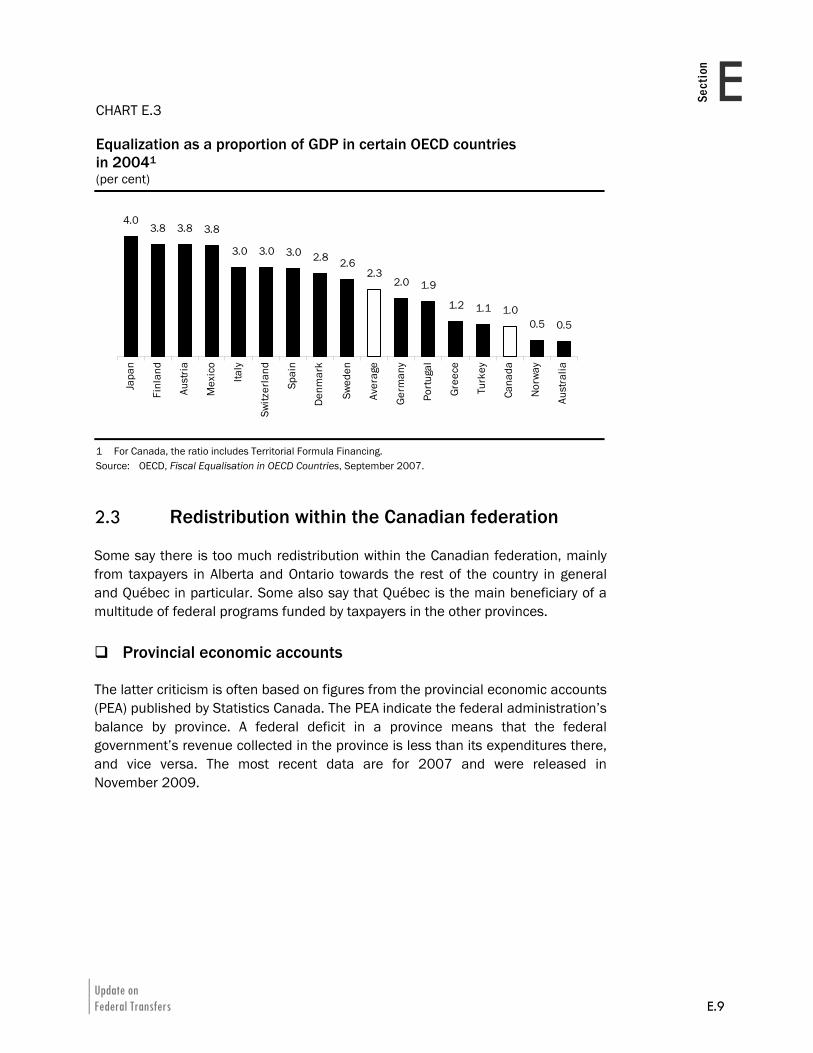
Update on Federal Transfers E.9
ESect
ion
CHART E.3 Equalization as a proportion of GDP in certain OECD countries in 20041 (per cent)
4.03.8 3.8 3.8
3.0 3.0 3.0 2.8 2.62.3
2.0 1.9
1.2 1.1 1.00.5 0.5
Japa
n
Finl
and
Aust
ria
Mex
ico
Italy
Switz
erla
nd
Spai
n
Denm
ark
Swed
en
Aver
age
Germ
any
Portu
gal
Gree
ce
Turk
ey
Cana
da
Norw
ay
Aust
ralia
1 For Canada, the ratio includes Territorial Formula Financing. Source: OECD, Fiscal Equalisation in OECD Countries, September 2007.
2.3 Redistribution within the Canadian federation
Some say there is too much redistribution within the Canadian federation, mainly from taxpayers in Alberta and Ontario towards the rest of the country in general and Québec in particular. Some also say that Québec is the main beneficiary of a multitude of federal programs funded by taxpayers in the other provinces.
Provincial economic accounts
The latter criticism is often based on figures from the provincial economic accounts (PEA) published by Statistics Canada. The PEA indicate the federal administration’s balance by province. A federal deficit in a province means that the federal government’s revenue collected in the province is less than its expenditures there, and vice versa. The most recent data are for 2007 and were released in November 2009.
2010-2011 Budget E.10 Budget Plan
It should be noted that a degree of caution is needed in how the PEA are used to assess inter-provincial redistribution in Canada. In this regard, Statistics Canada noted in the February 2007 Canadian Economic Observer:
As a result, performing a cost-benefit analysis of Confederation simply using the federal government revenue and expenditure estimates of the PEA is erroneous. The fiscal arrangements in our confederation are far more subtle than that […] While the federal government may, for example, transfer money to the Atlantic Provinces under the equalization program, that money might then be used to purchase medical equipment manufactured in Ontario. (pages 3.2 and 3.3).
Having said that, the following table shows the federal government balance in Canada and in each province, for the period 1981-2007, in constant per capita dollars.4 For that period, the table shows the following trend:
⎯ The federal government is in a surplus position in only three provinces. It is in a deficit position in the other seven.
⎯ Of the seven provinces where the federal government is in deficit, Québec is, by far, the province with the lowest federal deficit.
⎯ The federal deficit in Québec was roughly $434 per capita on average from 2003 to 2007, i.e. the federal government spent $434 more per capita in Québec than it collected in revenue.
⎯ In the six other provinces where the federal government was in a deficit position, the deficit ranged from $2 038 to $5 630 per capita on average from 2003 to 2007.
⎯ The $434 per capita federal deficit in Québec is also less than the amount of equalization Québec received during the period from 2003 to 2007, which averaged $622 per capita. It should be noted that equalization is included in PEA data.
4 The figures are expressed in 2002 dollars per capita to remove the effect of the relative size
of the provinces as well as changes in prices over the period examined.
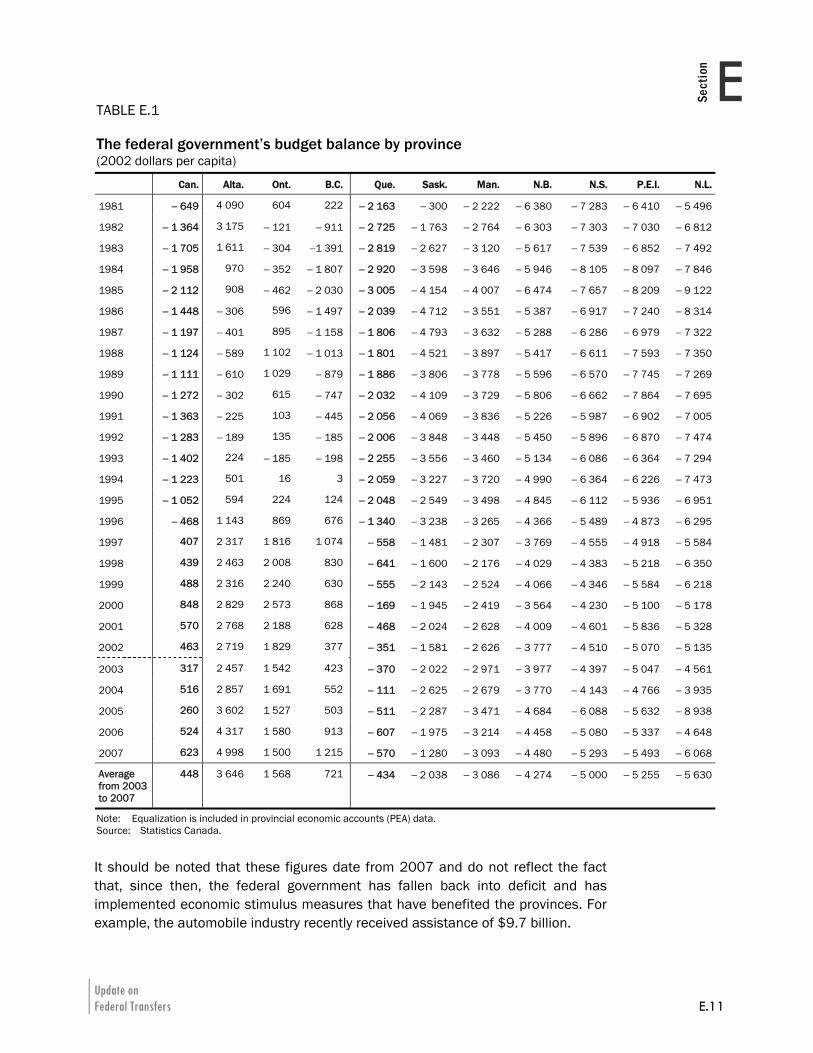
Update on Federal Transfers E.11
ESect
ion
It should be noted that these figures date from 2007 and do not reflect the fact that, since then, the federal government has fallen back into deficit and has implemented economic stimulus measures that have benefited the provinces. For example, the automobile industry recently received assistance of $9.7 billion.
TABLE E.1 The federal government’s budget balance by province (2002 dollars per capita)
Can. Alta. Ont. B.C. Que. Sask. Man. N.B. N.S. P.E.I. N.L.
1981 − 649 4 090 604 222 − 2 163 − 300 − 2 222 − 6 380 − 7 283 − 6 410 − 5 496
1982 − 1 364 3 175 − 121 − 911 − 2 725 − 1 763 − 2 764 − 6 303 − 7 303 − 7 030 − 6 812
1983 − 1 705 1 611 − 304 −1 391 − 2 819 − 2 627 − 3 120 − 5 617 − 7 539 − 6 852 − 7 492
1984 − 1 958 970 − 352 − 1 807 − 2 920 − 3 598 − 3 646 − 5 946 − 8 105 − 8 097 − 7 846
1985 − 2 112 908 − 462 − 2 030 − 3 005 − 4 154 − 4 007 − 6 474 − 7 657 − 8 209 − 9 122
1986 − 1 448 − 306 596 − 1 497 − 2 039 − 4 712 − 3 551 − 5 387 − 6 917 − 7 240 − 8 314
1987 − 1 197 − 401 895 − 1 158 − 1 806 − 4 793 − 3 632 − 5 288 − 6 286 − 6 979 − 7 322
1988 − 1 124 − 589 1 102 − 1 013 − 1 801 − 4 521 − 3 897 − 5 417 − 6 611 − 7 593 − 7 350
1989 − 1 111 − 610 1 029 − 879 − 1 886 − 3 806 − 3 778 − 5 596 − 6 570 − 7 745 − 7 269
1990 − 1 272 − 302 615 − 747 − 2 032 − 4 109 − 3 729 − 5 806 − 6 662 − 7 864 − 7 695
1991 − 1 363 − 225 103 − 445 − 2 056 − 4 069 − 3 836 − 5 226 − 5 987 − 6 902 − 7 005
1992 − 1 283 − 189 135 − 185 − 2 006 − 3 848 − 3 448 − 5 450 − 5 896 − 6 870 − 7 474
1993 − 1 402 224 − 185 − 198 − 2 255 − 3 556 − 3 460 − 5 134 − 6 086 − 6 364 − 7 294
1994 − 1 223 501 16 3 − 2 059 − 3 227 − 3 720 − 4 990 − 6 364 − 6 226 − 7 473
1995 − 1 052 594 224 124 − 2 048 − 2 549 − 3 498 − 4 845 − 6 112 − 5 936 − 6 951
1996 − 468 1 143 869 676 − 1 340 − 3 238 − 3 265 − 4 366 − 5 489 − 4 873 − 6 295
1997 407 2 317 1 816 1 074 − 558 − 1 481 − 2 307 − 3 769 − 4 555 − 4 918 − 5 584
1998 439 2 463 2 008 830 − 641 − 1 600 − 2 176 − 4 029 − 4 383 − 5 218 − 6 350
1999 488 2 316 2 240 630 − 555 − 2 143 − 2 524 − 4 066 − 4 346 − 5 584 − 6 218
2000 848 2 829 2 573 868 − 169 − 1 945 − 2 419 − 3 564 − 4 230 − 5 100 − 5 178
2001 570 2 768 2 188 628 − 468 − 2 024 − 2 628 − 4 009 − 4 601 − 5 836 − 5 328
2002 463 2 719 1 829 377 − 351 − 1 581 − 2 626 − 3 777 − 4 510 − 5 070 − 5 135
2003 317 2 457 1 542 423 − 370 − 2 022 − 2 971 − 3 977 − 4 397 − 5 047 − 4 561
2004 516 2 857 1 691 552 − 111 − 2 625 − 2 679 − 3 770 − 4 143 − 4 766 − 3 935
2005 260 3 602 1 527 503 − 511 − 2 287 − 3 471 − 4 684 − 6 088 − 5 632 − 8 938
2006 524 4 317 1 580 913 − 607 − 1 975 − 3 214 − 4 458 − 5 080 − 5 337 − 4 648
2007 623 4 998 1 500 1 215 − 570 − 1 280 − 3 093 − 4 480 − 5 293 − 5 493 − 6 068
Average from 2003 to 2007
448 3 646 1 568 721 − 434 − 2 038 − 3 086 − 4 274 − 5 000 − 5 255 − 5 630
Note: Equalization is included in provincial economic accounts (PEA) data. Source: Statistics Canada.
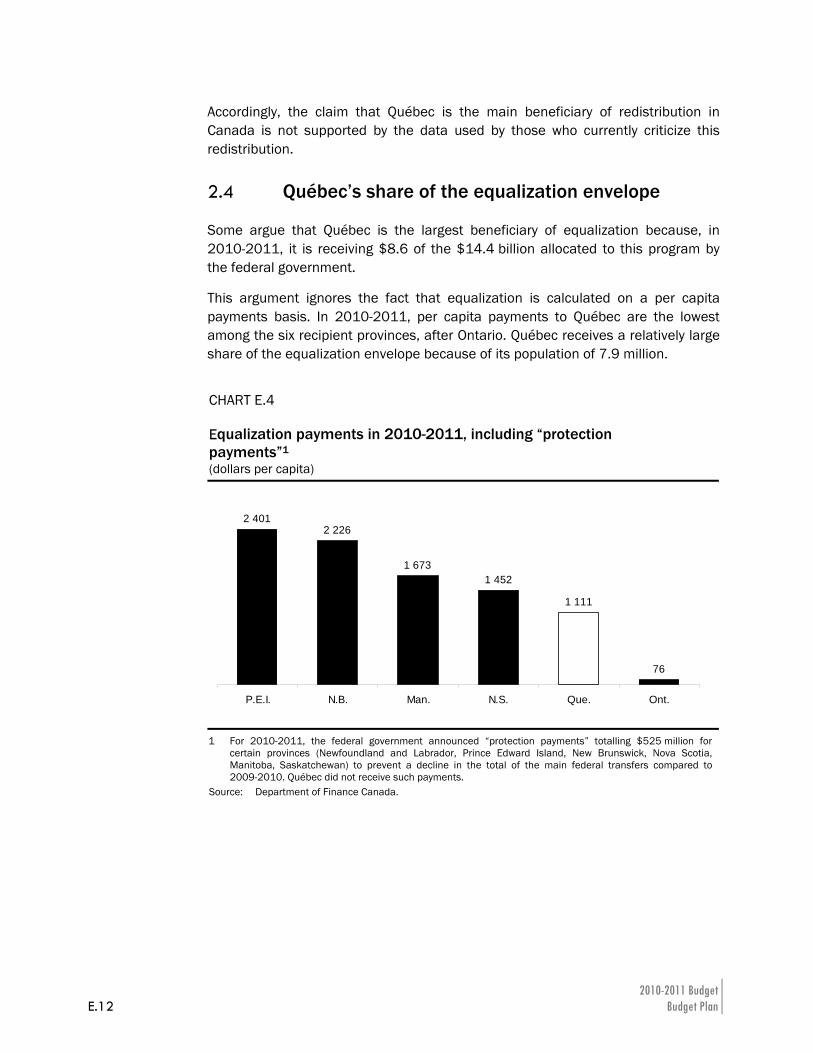
2010-2011 Budget E.12 Budget Plan
Accordingly, the claim that Québec is the main beneficiary of redistribution in Canada is not supported by the data used by those who currently criticize this redistribution.
2.4 Québec’s share of the equalization envelope
Some argue that Québec is the largest beneficiary of equalization because, in 2010-2011, it is receiving $8.6 of the $14.4 billion allocated to this program by the federal government.
This argument ignores the fact that equalization is calculated on a per capita payments basis. In 2010-2011, per capita payments to Québec are the lowest among the six recipient provinces, after Ontario. Québec receives a relatively large share of the equalization envelope because of its population of 7.9 million.
CHART E.4 Equalization payments in 2010-2011, including “protection payments”1 (dollars per capita)
2 4012 226
1 6731 452
1 111
76
P.E.I. N.B. Man. N.S. Que. Ont.
1 For 2010-2011, the federal government announced “protection payments” totalling $525 million for certain provinces (Newfoundland and Labrador, Prince Edward Island, New Brunswick, Nova Scotia, Manitoba, Saskatchewan) to prevent a decline in the total of the main federal transfers compared to 2009-2010. Québec did not receive such payments.
Source: Department of Finance Canada.
Update on Federal Transfers E.13
ESect
ion
2.5 How Québec funds its programs
According to a frequent criticism, Québec is able to provide services that are not available elsewhere in Canada thanks to the equalization it receives. We will see that:
⎯ the experts who have examined the question have rejected that conclusion;
⎯ Québec funds its choices through higher taxes;
⎯ Québec must also maintain a heavier tax burden than the Canadian average because of shortcomings in the current equalization program.
Experts have shown that this criticism is groundless
It is true that Québec has elected to offer many programs not available, or funded more extensively by user fees, in the other provinces.
That is a feature of a federation where, unlike a unitary state, each province can decide to exercise its constitutional authorities as it sees fit.
Canada’s equalization program was designed to reflect this fundamental reality.
⎯ The provinces are not required to offer similar programs or implement identical tax systems.
⎯ However, if a province decides to offer a level of service comparable to the Canadian average, it must be in a position to do so without having to impose a tax burden heavier than the Canadian average.
That is why equalization in Canada, in general, seeks to enable the provinces to attain a “minimum” level of capacity to fund public services.
2010-2011 Budget E.14 Budget Plan
Once this “minimum” level is secured by equalization, provinces are completely free to decide whether to:
⎯ offer fewer services than the others and reduce their tax burden accordingly; or
⎯ offer more services than the others and increase their tax burden accordingly.5
Hence, an analysis based solely on the presence (or not) of equalization payments and the presence (or not) of more generous services could not support the conclusion that equalization funds these more generous services. Such an analysis would be incomplete and could mislead readers.6
A rigorous analysis of this question must cover all provincial sources of revenue to see whether the disparity in terms of services can be explained by equalization or by higher own-source revenue.
In recent years, two groups of experts carried out this exercise.
The first is the Expert Panel on Equalization and Territorial Formula Financing, set up by the federal government in 2005. It was chaired by Al O’Brien, a former deputy Minister of Finance of Alberta. In its report released in 2006, the “O’Brien Panel” concluded:
[…] in all provinces the majority of the costs of public services are paid for by their own sources of revenues other than Equalization payments. However, in several of the receiving provinces, the absence of Equalization payments would make it difficult for them to deliver reasonably comparable public services to their residents.7
5 The report of the Royal Commission on Dominion-Provincial Relations (the “Rowell-Sirois
Commission”), published in 1940, was the first to propose an equalization program in Canada. In the commission’s view, such a program should have the following features: “An increase in the adjustment grant whenever a provincial government established that it could not supply Canadian average standards of service and balance its budget without taxation (provincial and municipal) appreciably exceeding the national average. […] If a province chooses to provide inferior services and impose lower taxation, it is free to do so, or it may provide better services than the average if its people are willing to be taxed accordingly...”. (p. 83 and 84 of the report)
6 For example, such is the case in a study entitled The Real Have-Nots in Confederation: Ontario, Alberta and British Columbia, published in February 2010 by the Frontier Center for Public Policy, based in Winnipeg, which contains no analysis of disparities in tax burden resulting from provincial tax systems, before concluding that equalization is the source of the differences observed in terms of programs offered by the provinces.
7 EXPERT PANEL ON EQUALIZATION AND TERRITORIAL FORMULA FINANCING, Achieving a National Purpose: Putting Equalization Back on Track, May 2006, p. 34.
Update on Federal Transfers E.15
ESect
ion
In December 2009, the Advisory Committee on the Economy and Public Finances, set up by the Minister of Finance of Québec, released the first of three documents in which it reached the following conclusion:
Even when the contribution of federal transfers is considered, Québec spends more than the other provinces. Accordingly, this additional spending is not funded by federal transfers. […] Québec funds its additional spending by means of taxes and by incurring debt.8
Québec funds its choices on its own
Québec’s tax system generates more revenue than those of the other provinces. For example, had Québec applied Alberta’s personal income tax structure in 2009, it would have collected $5.1 billion less.
Accordingly, Alberta’s personal income tax system would not enable Québec to collect sufficient revenue to fund, for example, a generous child care program, a prescription drug insurance plan or maintain lower tuition fees.
The same is true of the Québec sales tax, which generated more than $10 billion in revenue in 2009-2010. Alberta has chosen not to have a sales tax.
Accordingly, equalization seeks to enable Québec, like the other recipient provinces, to have a capacity to fund public services that is comparable to the Canadian average. However, Québec funds its programs that are more generous than the Canadian average with taxes that are higher than the Canadian average.
8 ADVISORY COMMITTEE ON THE ECONOMY AND PUBLIC FINANCES, Québec and Its Challenges – Extensive
public services, constrained leeway and emerging challenges, Document 1, Gouvernement du Québec, December 2009, p. 21.
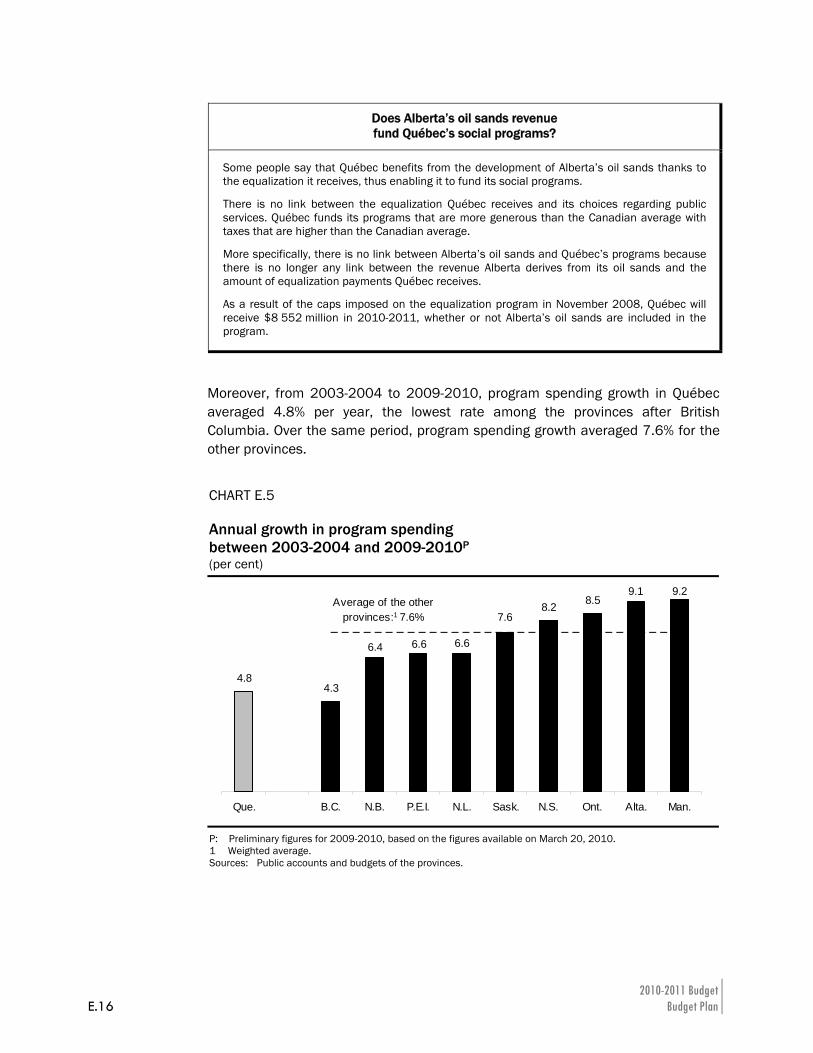
2010-2011 Budget E.16 Budget Plan
Moreover, from 2003-2004 to 2009-2010, program spending growth in Québec averaged 4.8% per year, the lowest rate among the provinces after British Columbia. Over the same period, program spending growth averaged 7.6% for the other provinces.
CHART E.5 Annual growth in program spending between 2003-2004 and 2009-2010P (per cent)
4.8
8.2 8.59.1 9.2
7.6
6.66.66.4
4.3
Que. B.C. N.B. P.E.I. N.L. Sask. N.S. Ont. Alta. Man.
Average of the other provinces:1 7.6%
P: Preliminary figures for 2009-2010, based on the figures available on March 20, 2010. 1 Weighted average. Sources: Public accounts and budgets of the provinces.
Does Alberta’s oil sands revenue fund Québec’s social programs?
Some people say that Québec benefits from the development of Alberta’s oil sands thanks to the equalization it receives, thus enabling it to fund its social programs.
There is no link between the equalization Québec receives and its choices regarding public services. Québec funds its programs that are more generous than the Canadian average with taxes that are higher than the Canadian average.
More specifically, there is no link between Alberta’s oil sands and Québec’s programs because there is no longer any link between the revenue Alberta derives from its oil sands and the amount of equalization payments Québec receives.
As a result of the caps imposed on the equalization program in November 2008, Québec will receive $8 552 million in 2010-2011, whether or not Alberta’s oil sands are included in the program.
Update on Federal Transfers E.17
ESect
ion
Québec must collect more tax because of shortcomings in equalization
Funding different choices regarding public services is not the only factor accounting for Québec’s heavier tax burden.
This burden is also attributable in part to the disparity between Québec’s fiscal capacity after equalization and that of the average of the ten provinces. Because, in particular, of the caps the federal government has applied since the fall of 2008,9 the recipient provinces do not, under the existing equalization program, have a fiscal capacity equal to the Canadian average.
9 Section G of the 2009-2010 Budget Plan contains a presentation of the changes and cap
mechanisms the federal government implemented in the fall of 2008.

Update on Federal Transfers E.19
ESect
ion
3. PRIORITY ISSUES THAT NEED TO BE SETTLED In recent years, Québec has raised a number of issues relating to federal transfers. This section reviews the priority issues that the Québec government would like to settle with the federal government, namely:
⎯ compensation to Québec for sales tax harmonization;
⎯ the treatment of Hydro-Québec’s revenue in the equalization program;
⎯ a fair way to reduce the cost of the equalization program, considering that the federal government is maintaining the limits imposed on the program’s growth;
⎯ systematic application of “protection payments” offered to some provinces;
⎯ a settlement of the dispute concerning the revenue stabilization program.
3.1 Compensate Québec for harmonizing the QST with the GST
Québec was the first province to harmonize its sales tax with the GST, on July 1, 1992. However, of the six provinces that have harmonized their sales tax, Québec is still the only one not to have received financial compensation from the federal government.
TABLE E.2 Compensation paid by the federal government on account of sales tax harmonization
Provinces Year of the
announcementAmount
($ million)Amount
($ per capita)
Newfoundland and Labrador 1997 348 605
Nova Scotia 1997 249 265
New Brunswick 1997 364 479
Ontario 2009 4 300 329
British Columbia 2009 1 599 359
TOTAL 6 860
Sources: Department of Finance Canada, Ministère des Finances du Québec and Statistics Canada.
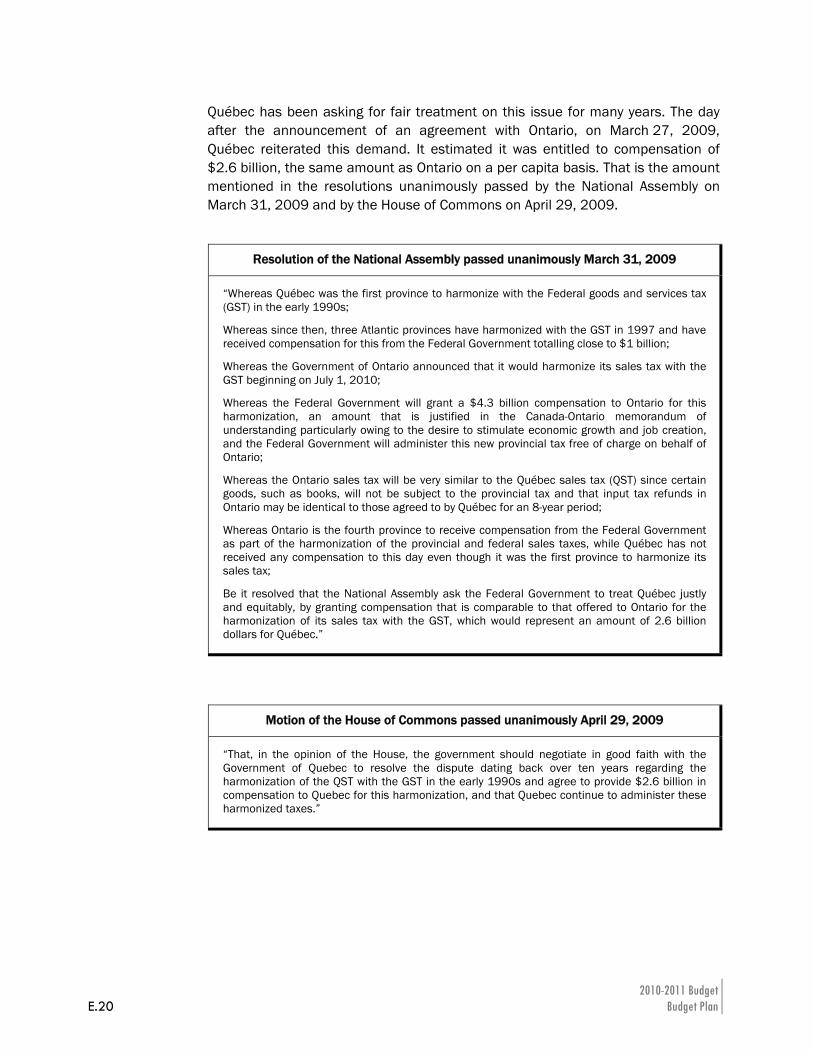
2010-2011 Budget E.20 Budget Plan
Québec has been asking for fair treatment on this issue for many years. The day after the announcement of an agreement with Ontario, on March 27, 2009, Québec reiterated this demand. It estimated it was entitled to compensation of $2.6 billion, the same amount as Ontario on a per capita basis. That is the amount mentioned in the resolutions unanimously passed by the National Assembly on March 31, 2009 and by the House of Commons on April 29, 2009.
Resolution of the National Assembly passed unanimously March 31, 2009
“Whereas Québec was the first province to harmonize with the Federal goods and services tax (GST) in the early 1990s;
Whereas since then, three Atlantic provinces have harmonized with the GST in 1997 and have received compensation for this from the Federal Government totalling close to $1 billion;
Whereas the Government of Ontario announced that it would harmonize its sales tax with the GST beginning on July 1, 2010;
Whereas the Federal Government will grant a $4.3 billion compensation to Ontario for this harmonization, an amount that is justified in the Canada-Ontario memorandum of understanding particularly owing to the desire to stimulate economic growth and job creation, and the Federal Government will administer this new provincial tax free of charge on behalf of Ontario;
Whereas the Ontario sales tax will be very similar to the Québec sales tax (QST) since certain goods, such as books, will not be subject to the provincial tax and that input tax refunds in Ontario may be identical to those agreed to by Québec for an 8-year period;
Whereas Ontario is the fourth province to receive compensation from the Federal Government as part of the harmonization of the provincial and federal sales taxes, while Québec has not received any compensation to this day even though it was the first province to harmonize its sales tax;
Be it resolved that the National Assembly ask the Federal Government to treat Québec justly and equitably, by granting compensation that is comparable to that offered to Ontario for the harmonization of its sales tax with the GST, which would represent an amount of 2.6 billion dollars for Québec.”
Motion of the House of Commons passed unanimously April 29, 2009
“That, in the opinion of the House, the government should negotiate in good faith with the Government of Quebec to resolve the dispute dating back over ten years regarding the harmonization of the QST with the GST in the early 1990s and agree to provide $2.6 billion in compensation to Quebec for this harmonization, and that Quebec continue to administer these harmonized taxes.”
Update on Federal Transfers E.21
ESect
ion
The federal government has thus agreed to Québec’s retaining its QST and continuing to administer the GST and QST on its territory. Québec, for its part, has agreed to make technical changes to the QST to make it more similar to the GST, even though it is already substantially harmonized.
In the course of these negotiations, the federal government argued that the compensation offered to each province corresponds to 1.5 points of forecast GST between July 2010 and June 2011 on its territory. This calculation, which was used to set Ontario’s compensation at $4.3 billion and British Columbia’s at $1.6 billion, would establish Québec’s compensation at $2.2 billion. Québec indicated that it would accept compensation on that basis and hoped for a quick decision from the federal government in this regard.
It should also be noted that the federal government is handling, free of charge, the administration of the harmonized sales tax in the provinces where it applies, while Québec is assuming its share of the administration costs of the GST and QST in accordance with an agreement entered into in the early 1990s, almost 20 years ago.
3.2 Fair treatment of Hydro-Québec’s revenue in the equalization program
As explained in detail in section G of the 2009-2010 Budget Plan, the revenue Hydro-Québec earns from the transmission and distribution of power is no longer treated fairly in the equalization formula.
Among the changes the federal government announced in the fall of 2008, it indicated that it would henceforth include the dividends Hydro One pays to the Ontario government in the corporate income tax base rather than the natural resources base as had previously been the case. Hydro One is a government business enterprise that transmits and distributes electricity in Ontario.
In contrast, the federal government continues to include all the dividends paid by Hydro-Québec to the Québec government in the natural resources base, even though, as is the case with Hydro One, a large portion of these dividends stems from electricity transmission and distribution. The result is that identical activities are treated unfairly.
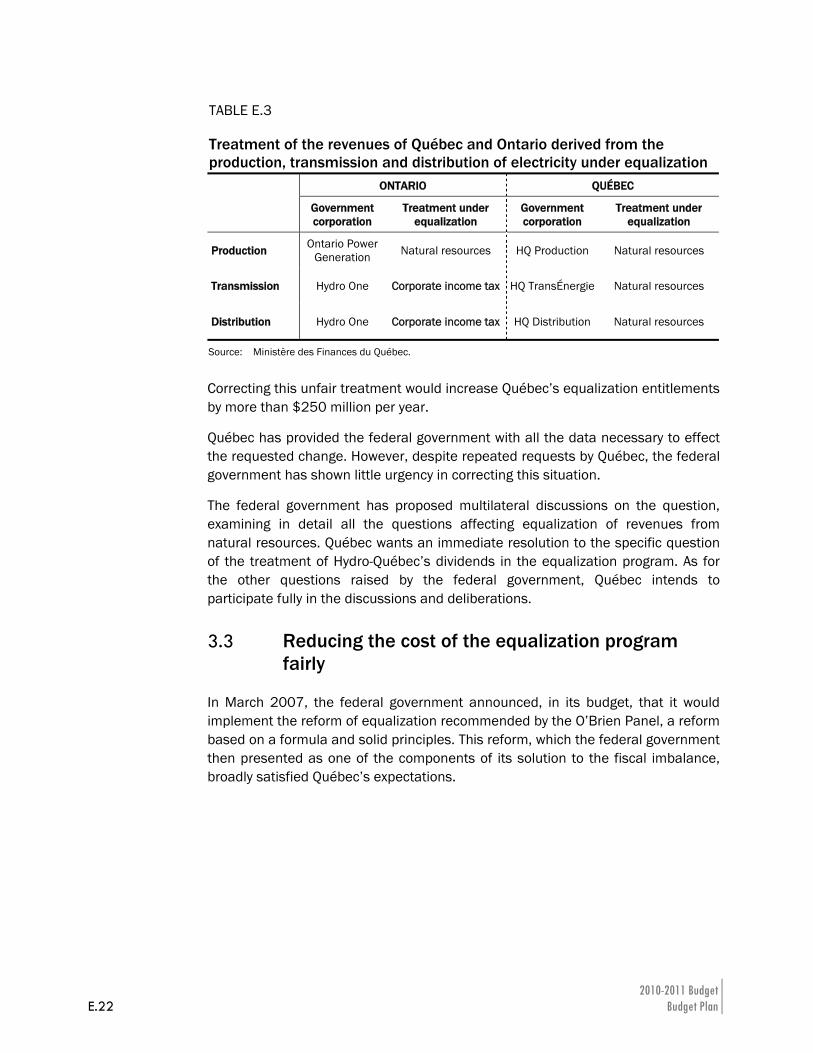
2010-2011 Budget E.22 Budget Plan
TABLE E.3 Treatment of the revenues of Québec and Ontario derived from the production, transmission and distribution of electricity under equalization ONTARIO QUÉBEC
Government corporation
Treatment under equalization
Government corporation
Treatment under equalization
Production Ontario Power Generation Natural resources HQ Production Natural resources
Transmission Hydro One Corporate income tax HQ TransÉnergie Natural resources
Distribution Hydro One Corporate income tax HQ Distribution Natural resources
Source: Ministère des Finances du Québec.
Correcting this unfair treatment would increase Québec’s equalization entitlements by more than $250 million per year.
Québec has provided the federal government with all the data necessary to effect the requested change. However, despite repeated requests by Québec, the federal government has shown little urgency in correcting this situation.
The federal government has proposed multilateral discussions on the question, examining in detail all the questions affecting equalization of revenues from natural resources. Québec wants an immediate resolution to the specific question of the treatment of Hydro-Québec’s dividends in the equalization program. As for the other questions raised by the federal government, Québec intends to participate fully in the discussions and deliberations.
3.3 Reducing the cost of the equalization program fairly
In March 2007, the federal government announced, in its budget, that it would implement the reform of equalization recommended by the O’Brien Panel, a reform based on a formula and solid principles. This reform, which the federal government then presented as one of the components of its solution to the fiscal imbalance, broadly satisfied Québec’s expectations.
Update on Federal Transfers E.23
ESect
ion
In a letter sent to the Premier of Québec March 19, 2007, the Prime Minister of Canada stated that the 2007 federal budget marked “a fundamental return to fiscal fairness in Canada” and that “all governments will now have resources on a principle-based, predictable and long-term footing to carry out their responsibilities”. [TRANSLATION]
In November 2008, the federal government changed the equalization program, without notice, by introducing new cap mechanisms to limit the program’s cost.
In that regard, the O’Brien Panel indicated, on page 67 of its report, that:
Any material changes to the Equalization program, particularly funding changes (e.g.., any scaling back of the overall amount allocated by the federal government to the Equalization program), made within the five-year renewal period should be the subject of a public discussion paper.
The changes made to equalization on November 3, 2008 were not made the subject of a public discussion paper beforehand.
Moreover, the way the caps are calculated introduces unfairness among the recipient provinces. The level of fiscal capacity per capita of the recipient provinces, after equalization, varies among these provinces.
A fairer way to bring the cost of the equalization program to the level chosen by the federal government would be to apply an equal dollar per capita reduction of provincial equalization entitlements to the result of the “O’Brien formula”.10
Such a method would have no impact on the total cost of the program for the federal government, but would result in a fairer allocation of equalization amounts among the provinces. As an illustration, in 2010-2011, this approach would have resulted in additional revenue of $357 million for Québec.
10 This solution had been suggested by the Advisory Panel on Fiscal Imbalance, set up by the
Council of the Federation, in a report released in 2006. On page 86 of its report, the panel states: “[…] the best course in these circumstances would be to scale back the standard. Reducing the overall cost in this way would not change the distribution of fiscal resources among the provinces; it would simply lower on an equal per capita basis the amount all received.”
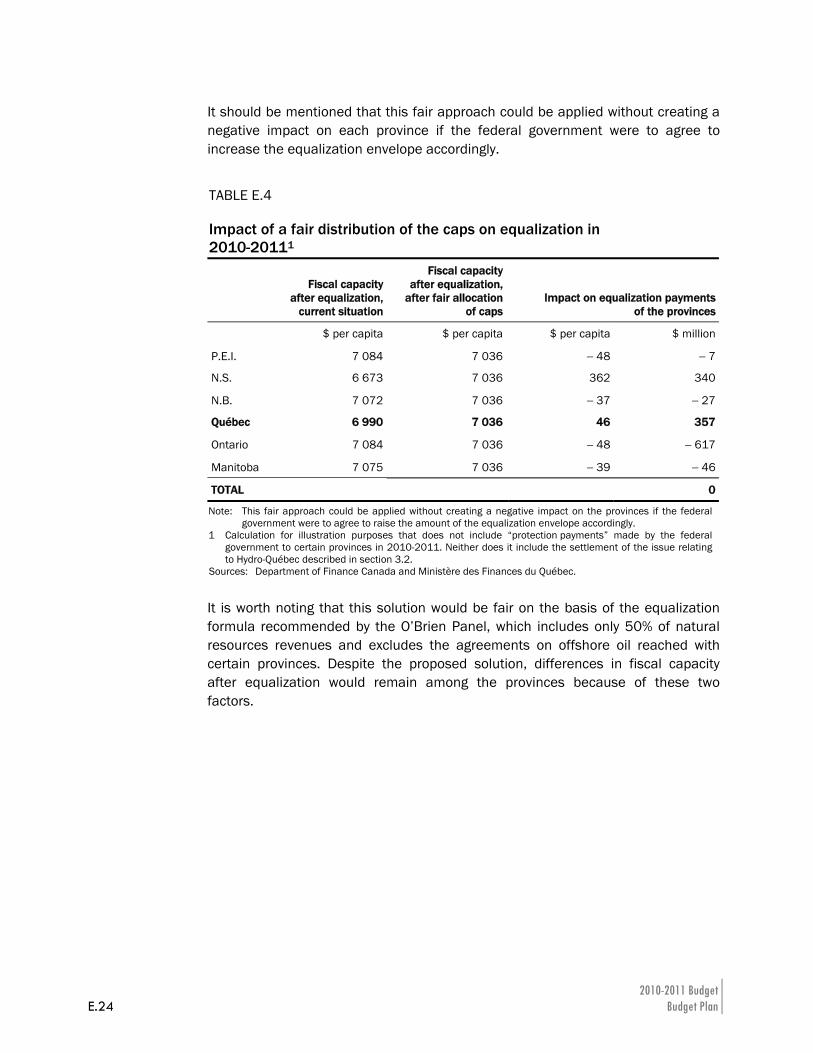
2010-2011 Budget E.24 Budget Plan
It should be mentioned that this fair approach could be applied without creating a negative impact on each province if the federal government were to agree to increase the equalization envelope accordingly.
TABLE E.4 Impact of a fair distribution of the caps on equalization in 2010-20111
Fiscal capacity after equalization,
current situation
Fiscal capacity after equalization,
after fair allocation of caps
Impact on equalization paymentsof the provinces
$ per capita $ per capita $ per capita $ million
P.E.I. 7 084 7 036 − 48 − 7
N.S. 6 673 7 036 362 340
N.B. 7 072 7 036 − 37 − 27
Québec 6 990 7 036 46 357
Ontario 7 084 7 036 − 48 − 617
Manitoba 7 075 7 036 − 39 − 46
TOTAL 0
Note: This fair approach could be applied without creating a negative impact on the provinces if the federal government were to agree to raise the amount of the equalization envelope accordingly.
1 Calculation for illustration purposes that does not include “protection payments” made by the federal government to certain provinces in 2010-2011. Neither does it include the settlement of the issue relating to Hydro-Québec described in section 3.2.
Sources: Department of Finance Canada and Ministère des Finances du Québec.
It is worth noting that this solution would be fair on the basis of the equalization formula recommended by the O’Brien Panel, which includes only 50% of natural resources revenues and excludes the agreements on offshore oil reached with certain provinces. Despite the proposed solution, differences in fiscal capacity after equalization would remain among the provinces because of these two factors.
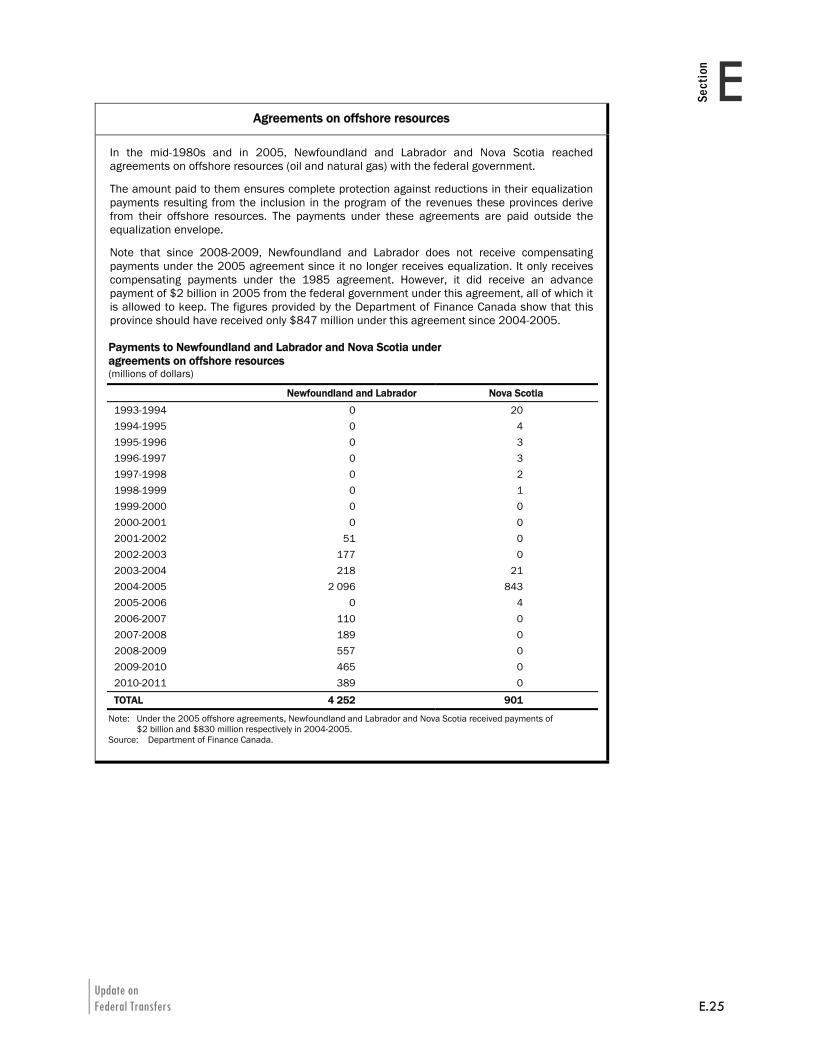
Update on Federal Transfers E.25
ESect
ion
Agreements on offshore resources
In the mid-1980s and in 2005, Newfoundland and Labrador and Nova Scotia reached agreements on offshore resources (oil and natural gas) with the federal government.
The amount paid to them ensures complete protection against reductions in their equalization payments resulting from the inclusion in the program of the revenues these provinces derive from their offshore resources. The payments under these agreements are paid outside the equalization envelope.
Note that since 2008-2009, Newfoundland and Labrador does not receive compensating payments under the 2005 agreement since it no longer receives equalization. It only receives compensating payments under the 1985 agreement. However, it did receive an advance payment of $2 billion in 2005 from the federal government under this agreement, all of which it is allowed to keep. The figures provided by the Department of Finance Canada show that this province should have received only $847 million under this agreement since 2004-2005.
Payments to Newfoundland and Labrador and Nova Scotia under agreements on offshore resources (millions of dollars)
Newfoundland and Labrador Nova Scotia
1993-1994 0 20 1994-1995 0 4 1995-1996 0 3 1996-1997 0 3 1997-1998 0 2 1998-1999 0 1 1999-2000 0 0 2000-2001 0 0 2001-2002 51 0 2002-2003 177 0 2003-2004 218 21 2004-2005 2 096 843 2005-2006 0 4 2006-2007 110 0 2007-2008 189 0 2008-2009 557 0 2009-2010 465 0 2010-2011 389 0
TOTAL 4 252 901
Note: Under the 2005 offshore agreements, Newfoundland and Labrador and Nova Scotia received payments of $2 billion and $830 million respectively in 2004-2005.
Source: Department of Finance Canada.
2010-2011 Budget E.26 Budget Plan
3.4 Make the use of “protection payments” systematic
For many years now, the federal government has provided “transitional” or “protection” payments to certain provinces to prevent their equalization payments or other transfer payments from declining from one year to the next.
Such mechanisms have been used many times since 2004-2005 by the federal government, resulting in payments of at least $1.9 billion.
These payments have been provided even though the increase in relative wealth of certain provinces compared to the average of the ten provinces justified a reduction in their equalization payments.
As a result, provinces that have grown wealthier compared to the average of the ten provinces have received additional transfers from the federal government, which is contrary to the objectives and the principle of equalization.
Québec also suffered reductions in federal transfers of some $2.4 billion in 2002-2003 and 2003-2004, mainly in equalization. However, Québec did not receive “protection payments” regarding these reductions and is still paying back $238 million per year until March 31, 2016 to the federal government.
Québec has asked the federal government to reopen discussions on the repayment of these amounts in light of the sums subsequently paid over the following years to certain provinces. The federal government has not acted on this request.
It should be noted that, when raised to Québec’s scale, the amounts granted to certain provinces are quite significant. For instance, the $582 million paid to Saskatchewan in 2004-2005 would be the equivalent on Québec’s scale of $4.4 billion11 and the $54 million paid to Newfoundland and Labrador in 2006-2007 translates to $808 million on Québec’s scale.
11 The $582 million Saskatchewan received in 2004-2005 represents $585 per capita. This
amount, multiplied by Québec’s population in 2004-2005 (7.5 million), gives $4.4 billion.
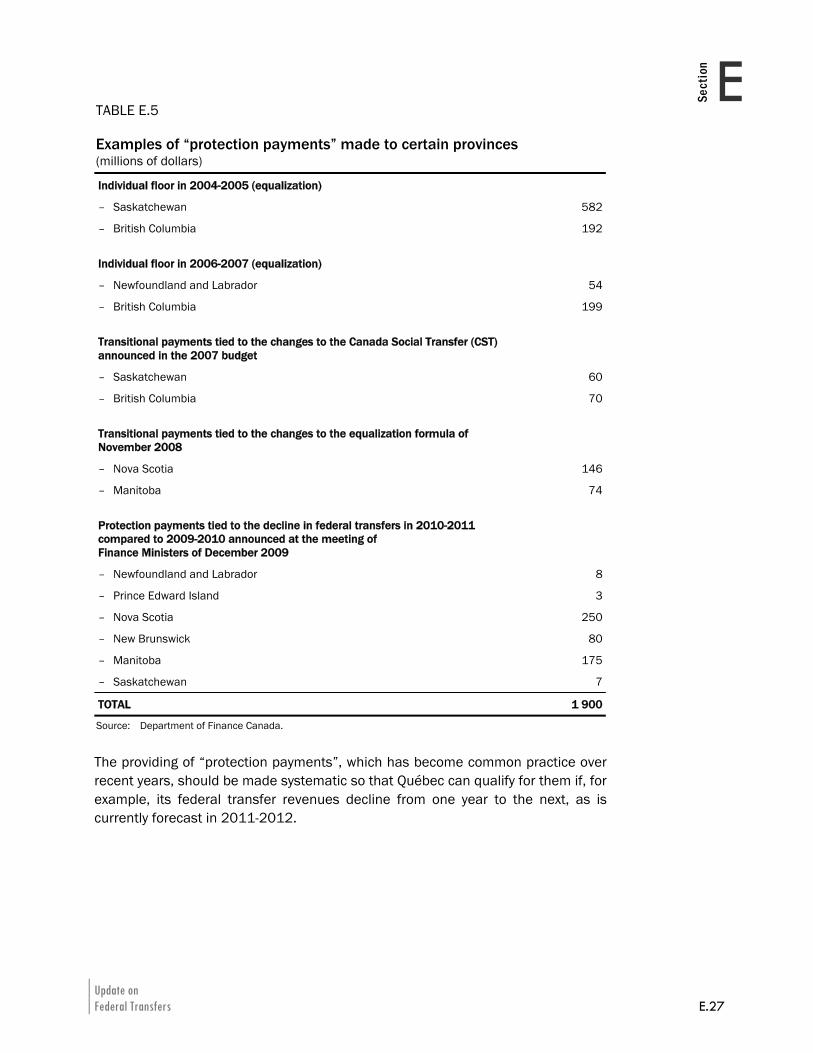
Update on Federal Transfers E.27
ESect
ion
TABLE E.5 Examples of “protection payments” made to certain provinces (millions of dollars)
Individual floor in 2004-2005 (equalization)
– Saskatchewan 582
– British Columbia 192 Individual floor in 2006-2007 (equalization)
– Newfoundland and Labrador 54
– British Columbia 199 Transitional payments tied to the changes to the Canada Social Transfer (CST) announced in the 2007 budget
– Saskatchewan 60
– British Columbia 70 Transitional payments tied to the changes to the equalization formula of November 2008
– Nova Scotia 146
– Manitoba 74 Protection payments tied to the decline in federal transfers in 2010-2011 compared to 2009-2010 announced at the meeting of Finance Ministers of December 2009
– Newfoundland and Labrador 8
– Prince Edward Island 3
– Nova Scotia 250
– New Brunswick 80
– Manitoba 175
– Saskatchewan 7
TOTAL 1 900
Source: Department of Finance Canada.
The providing of “protection payments”, which has become common practice over recent years, should be made systematic so that Québec can qualify for them if, for example, its federal transfer revenues decline from one year to the next, as is currently forecast in 2011-2012.
2010-2011 Budget E.28 Budget Plan
3.5 Settle the dispute over the revenue stabilization program
Almost 15 years ago, Québec launched a lawsuit for $137 million against the federal government following the latter’s refusal to make a stabilization payment to Québec for the 1991-1992 fiscal year.
On August 10, 2007, the Federal Court ruled in Québec’s favour on most of the items in dispute and concluded that the federal Minister of Finance should consider the Québec government’s request for a stabilization payment.
On June 11, 2008, the Federal Court of Appeal, in a unanimous ruling, denied the federal government’s appeal only eight days after the end of the hearing. The federal government has not filed an appeal with the Supreme Court.
In recent years, Québec has asked the federal government many times to settle this issue. Despite two court decisions in its favour, Québec has yet to receive a stabilization payment from the federal government for 1991-1992.
Update on Federal Transfers E.29
ESect
ion
4. CONCLUSION Québec supports fiscal arrangements based on sound principles, that is, arrangements that are adequate, predictable and fair for all partners of the Canadian federation.
In this regard, section G of the March 2009 Budgetary Plan laid out a number of issues concerning the main transfer programs funding health, post-secondary education and other social programs, as well as equalization.
These issues have not been resolved and remain a major subject of concern for the Québec government. The discussions must continue, particularly as we head towards the renewal of the main federal transfer programs that are set to end, under the federal legislation, in 2013-2014.
In addition, for the time being, a number of issues must be settled:
⎯ payment of compensation to the Québec government for harmonizing the QST with the GST;
⎯ fair treatment, under equalization, of Hydro-Québec’s revenue arising from the transmission and distribution of electricity;
⎯ fair application of the reductions in the equalization program imposed by the federal government since November 2008;
⎯ settlement of the stabilization payment owed to Québec for fiscal year 1991-1992, in accordance with two rulings handed down by the federal courts in Québec’s favour on this matter.
Moreover, the providing of “protection payments”, which has become common practice in recent years, should be made systematic so that Québec can also qualify for them if, for example, its federal transfer revenues decline from one year to the next, as is currently forecast in 2011-2012.

F.1
Section F
F Report on the Application of the Balanced Budget Act
1. AMENDMENTS TO THE BALANCED BUDGET ACT....................................................F.3
2. BUDGETARY BALANCE WITHIN THE MEANING OF THE BALANCED BUDGET ACT.....................................................................................................F.5
3. STATUS OF THE STABILIZATION RESERVE..............................................................F.7
4. A BALANCED BUDGET BY 2013-2014...............................................................F.9

Report on the Application of the Balanced Budget Act F.3
FSect
ion
1. AMENDMENTS TO THE BALANCED BUDGET ACT As announced in the March 19, 2009 Budget, the government tabled a bill in the National Assembly on May 13 last to amend the Balanced Budget Act (R.S.Q., c. E-12.00001) to help it weather the worst global recession since the 1930s. Bill 40, an Act to amend the Balanced Budget Act and various legislative provisions concerning the implementation of the accounting reform (2009, c. 38), was assented to September 21, 2009.
The new Balanced Budget Act:
⎯ suspends temporarily the government’s obligation to achieve a balanced budget for fiscal years 2009-2010 and 2010-2011;
⎯ provides that, for the purposes of gradually returning to a balanced budget in 2013-2014, the government must meet objectives for decreasing budgetary deficits for fiscal years 2011-2012 and 2012-2013, established no later than the tabling of the 2011-2012 Budget;
⎯ stipulates that the revenue and expenditures established in accordance with the government’s accounting policies must be balanced for the fiscal year 2013-2014.
As of 2011-2012, the government must fulfil the obligation under the Act to offset any overrun in respect of the set objectives. For example, if the government records an overrun of less than $1 billion in relation to the decreasing deficit objectives for 2011-2012 and 2012-2013, or the balanced budget objective for the following fiscal years, it must achieve the budgetary objective for the subsequent fiscal year, adjusted by the amount of that overrun.
In addition, the Balanced Budget Act establishes a stabilization reserve fund to replace the budgetary reserve provided for in the Act to establish a budgetary surplus reserve fund (R.S.Q., c. R-25.1). The stabilization reserve is made up of the surpluses for each fiscal year and its purpose is to facilitate multi-year planning of the government’s financial framework. It is used first to maintain a balanced budget and, subsidiarily, for payment of sums into the Generations Fund.
2010-2011 Budget F.4 Budget Plan
Balanced Budget Act
The Balanced Budget Act (R.S.Q., c. E-12.00001) was adopted unanimously by the National Assembly of Québec on December 19, 1996.
Essentially, the Act stipulates that the government must table balanced budgetary forecasts and sets forth the applicable rules in the case of an overrun.
Bill 40 (2009, c. 38), assented to September 21, 2009, substantially amended the Balanced Budget Act to, among other things, introduce specific provisions to allow the government to weather the severe global recession in 2009.
Consequently, the provisions of the Balanced Budget Act prohibiting a budget deficit do not apply from March 19, 2009, until the end of the period determined by the Minister of Finance no later than the tabling of the 2011-2012 Budget. The Act allows the government to suspend temporarily the achievement of a balanced budget for 2009-2010 and 2010-2011 without being required to offset deficits by achieving surpluses in the following fiscal years.
The Act also provides that the government must achieve the objectives for decreasing budgetary deficits established no later than the tabling of the 2011-2012 Budget. Those objectives must be achieved and, in the case of overruns, will be subject to the offsetting rules set forth in the Act.
Under the Act, the revenue and expenditures established in accordance with the government’s accounting policies must be balanced for fiscal year 2013-2014.
If the government records an overrun of less than $1 billion in relation to the decreasing deficit objectives for 2011-2012 and 2012-2013, or the balanced budget objective for the following fiscal years, it must achieve the budgetary objective for the subsequent fiscal year, adjusted by the amount of that overrun.
The Act stipulates that the government may incur overruns for a period of more than one year, where those overruns total at least $1 billion as a result of circumstances defined in the Act.
In such case, the government must apply an offsetting financial plan ensuring that the overruns will be compensated for within a five-year period.
If there is an overrun of more than $1 billion, the Minister of Finance must:
– report to the National Assembly on the circumstances justifying the government in incurring such overruns;
– present a financial plan allowing those overruns to be offset within the five-year period;
– apply offsetting measures covering at least $1 billion within the fiscal year in which such an overrun is anticipated, or during the following year in the case of an actual overrun;
– offset at least 75% of those overruns within the first four fiscal years of that period.
In addition, the Act now stipulates that entries posted to the net debt must be taken into account in calculating the budget balance, except where such entries result from changes made to the accounting policies of the government or any of its enterprises so as to bring them into compliance with a new standard of the Canadian Institute of Chartered Accountants or accounting changes relating to the accounting reform in 2006-2007.
The amended legislation also establishes a stabilization reserve fund1 to facilitate the government’s multi-year budget planning and allow for the subsidiary payment of sums into the Generations Fund. All sums corresponding to the surplus for each fiscal year are allocated to the stabilization reserve fund, whose primary purpose is to maintain a balanced budget.
Lastly, the Act provides that the Minister of Finance must report to the National Assembly in the Budget Speech on the objectives of the Act, their achievement and any variance recorded, and on the operations of the stabilization reserve fund.
1 The stabilization reserve fund replaces the budgetary reserve fund provided for in the Act to establish a budgetary surplus reserve fund (R.S.Q., c. R-25.1), which was repealed by Bill 40 (2009, c. 38).
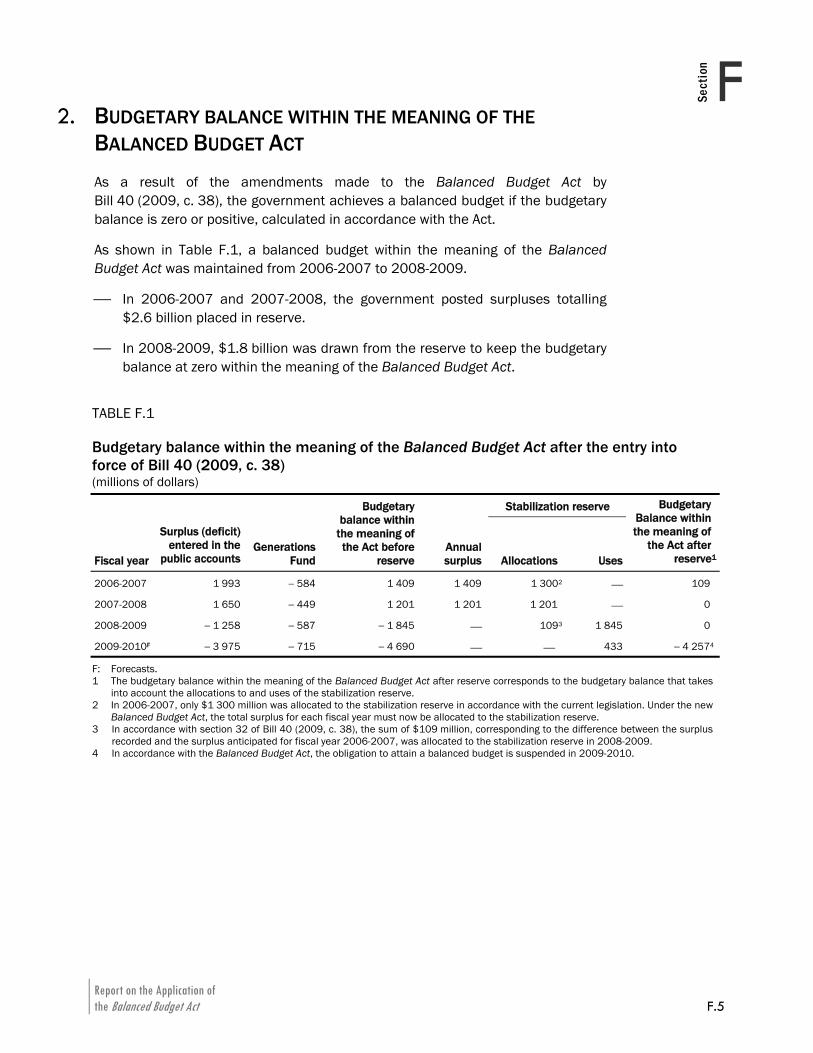
Report on the Application of the Balanced Budget Act F.5
FSect
ion
2. BUDGETARY BALANCE WITHIN THE MEANING OF THE BALANCED BUDGET ACT As a result of the amendments made to the Balanced Budget Act by Bill 40 (2009, c. 38), the government achieves a balanced budget if the budgetary balance is zero or positive, calculated in accordance with the Act.
As shown in Table F.1, a balanced budget within the meaning of the Balanced Budget Act was maintained from 2006-2007 to 2008-2009.
⎯ In 2006-2007 and 2007-2008, the government posted surpluses totalling $2.6 billion placed in reserve.
⎯ In 2008-2009, $1.8 billion was drawn from the reserve to keep the budgetary balance at zero within the meaning of the Balanced Budget Act.
TABLE F.1 Budgetary balance within the meaning of the Balanced Budget Act after the entry into force of Bill 40 (2009, c. 38) (millions of dollars)
Stabilization reserve
Fiscal year
Surplus (deficit) entered in the
public accounts Generations
Fund
Budgetary balance within
the meaning of the Act before
reserveAnnual surplus Allocations Uses
Budgetary Balance within the meaning of
the Act after reserve1
2006-2007 1 993 − 584 1 409 1 409 1 3002 ⎯ 109
2007-2008 1 650 − 449 1 201 1 201 1 201 ⎯ 0
2008-2009 − 1 258 − 587 − 1 845 ⎯ 1093 1 845 0
2009-2010F − 3 975 − 715 − 4 690 ⎯ ⎯ 433 − 4 2574
F: Forecasts. 1 The budgetary balance within the meaning of the Balanced Budget Act after reserve corresponds to the budgetary balance that takes
into account the allocations to and uses of the stabilization reserve. 2 In 2006-2007, only $1 300 million was allocated to the stabilization reserve in accordance with the current legislation. Under the new
Balanced Budget Act, the total surplus for each fiscal year must now be allocated to the stabilization reserve. 3 In accordance with section 32 of Bill 40 (2009, c. 38), the sum of $109 million, corresponding to the difference between the surplus
recorded and the surplus anticipated for fiscal year 2006-2007, was allocated to the stabilization reserve in 2008-2009. 4 In accordance with the Balanced Budget Act, the obligation to attain a balanced budget is suspended in 2009-2010.
2010-2011 Budget F.6 Budget Plan
Furthermore, as provided for in the 2009-2010 Budget, and in accordance with the Act as amended in 2009, the obligation to achieve a balanced budget was suspended for 2009-2010 and 2010-2011 to allow the government to get through the recession and return to economic growth. The budgetary balance within the meaning of the Balanced Budget Act will be in deficit by:
⎯ $4.3 billion for 2009-2010, after accounting for the $433-million balance of the stabilization reserve;
⎯ $4.5 billion for 2010-2011, after accounting for the plan to restore fiscal balance.
Note that the Balanced Budget Act does not require the government to offset the deficits in 2009-2010 and 2010-2011 through surpluses in subsequent years.
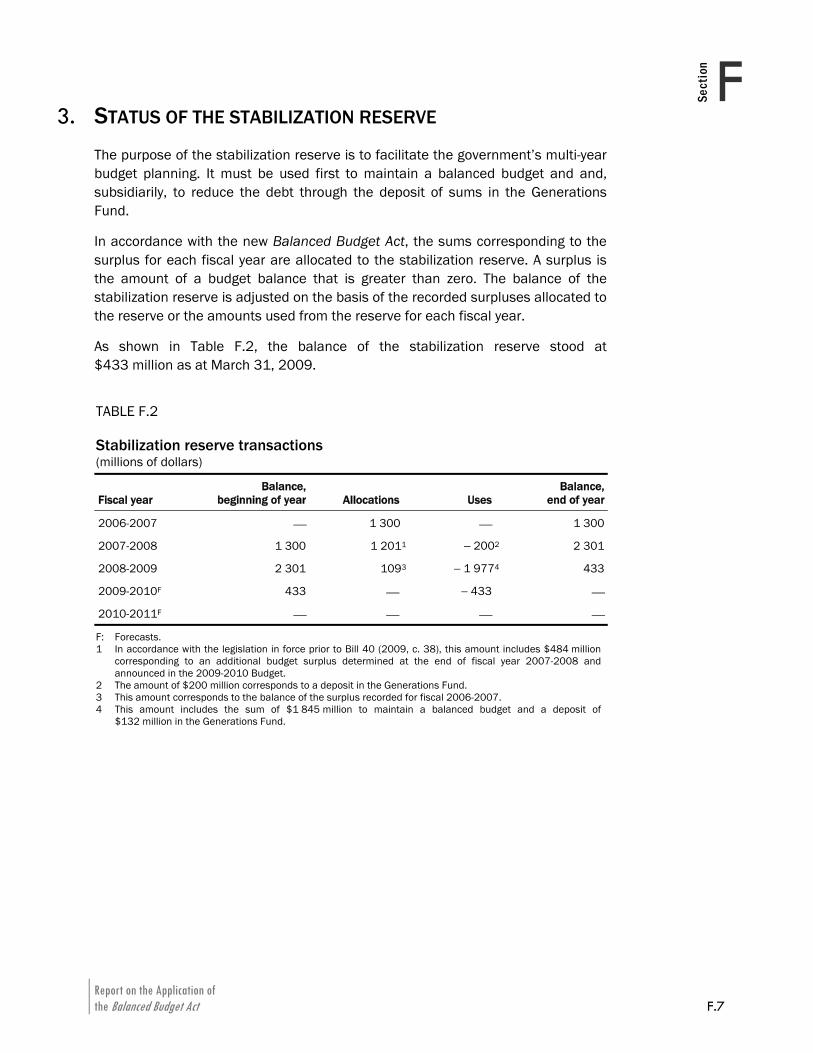
Report on the Application of the Balanced Budget Act F.7
FSect
ion
3. STATUS OF THE STABILIZATION RESERVE The purpose of the stabilization reserve is to facilitate the government’s multi-year budget planning. It must be used first to maintain a balanced budget and and, subsidiarily, to reduce the debt through the deposit of sums in the Generations Fund.
In accordance with the new Balanced Budget Act, the sums corresponding to the surplus for each fiscal year are allocated to the stabilization reserve. A surplus is the amount of a budget balance that is greater than zero. The balance of the stabilization reserve is adjusted on the basis of the recorded surpluses allocated to the reserve or the amounts used from the reserve for each fiscal year.
As shown in Table F.2, the balance of the stabilization reserve stood at $433 million as at March 31, 2009.
TABLE F.2 Stabilization reserve transactions (millions of dollars)
Fiscal year Balance,
beginning of year Allocations Uses Balance,
end of year
2006-2007 ⎯ 1 300 ⎯ 1 300
2007-2008 1 300 1 2011 − 2002 2 301
2008-2009 2 301 1093 − 1 9774 433
2009-2010F 433 ⎯ − 433 ⎯
2010-2011F ⎯ ⎯ ⎯ ⎯
F: Forecasts. 1 In accordance with the legislation in force prior to Bill 40 (2009, c. 38), this amount includes $484 million
corresponding to an additional budget surplus determined at the end of fiscal year 2007-2008 and announced in the 2009-2010 Budget.
2 The amount of $200 million corresponds to a deposit in the Generations Fund. 3 This amount corresponds to the balance of the surplus recorded for fiscal 2006-2007. 4 This amount includes the sum of $1 845 million to maintain a balanced budget and a deposit of
$132 million in the Generations Fund.
2010-2011 Budget F.8 Budget Plan
Allocations
The following amounts were allocated out of the stabilization reserve:
⎯ $1.3 billion allocated out of the 2006-2007 surpluses;1
⎯ $517 million allocated out of the 2007-2008 surpluses,2 taking into account a $200-million deposit in the Generations Fund;
⎯ $484 million allocated out of the 2007-2008 surpluses;3,4
⎯ $109 million, corresponding to the difference between the surpluses recorded and anticipated for fiscal year 2006-2007 and allocated to the stabilization reserve in 2008-2009.5
In 2009-2010 and 2010-2011, no amount will be allocated to the stabilization reserve due to the anticipated budget deficits for those two fiscal years.
Uses
Because of the economic recession Québec went through, the government will use the entire amount in the stabilization reserve, as provided for in the 2009-2010 Budget.
The reserve is used as follows:
⎯ $1 977 million in 2008-2009:
— $1 845 million to maintain a balanced budget;
— $132 million deposited in the Generations Fund to reduce Québec’s debt;
⎯ $433 million in 2009-2010 to reduce the deficit, bringing the balance of the stabilization reserve to zero as at March 31, 2010.
The balance of the stabilization reserve will remain at zero at the end of 2010-2011.
1 Amount allocated in the 2007-2008 Budget. 2 Amount allocated in the 2008-2009 Budget. 3 Amount allocated in the 2009-2010 Budget. 4 In accordance with the first paragraph of section 32 of Bill 40 (2009, c. 38), the surpluses
totalling $2 501 million allocated to the budgetary reserve fund in the budgets from 2007-2008 to 2009-2010 are deemed allocated to the stabilization reserve fund.
5 In accordance with the second paragraph of section 32 of Bill 40 (2009, c. 38).
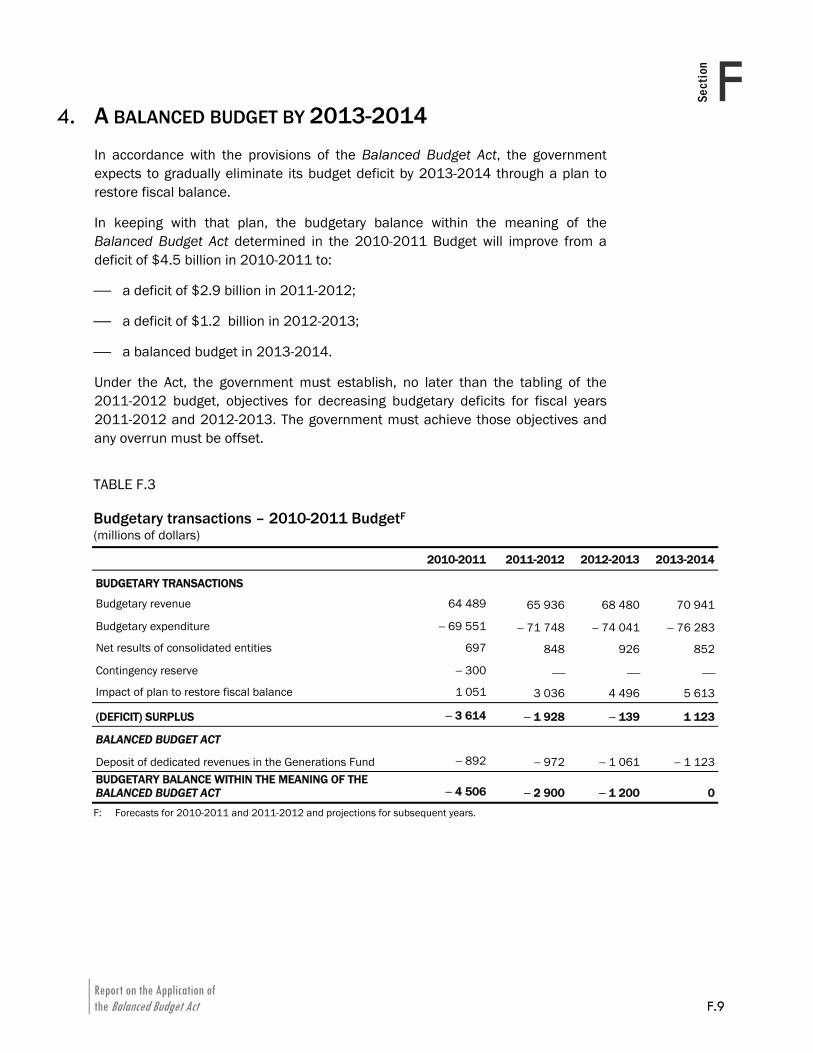
Report on the Application of the Balanced Budget Act F.9
FSect
ion
4. A BALANCED BUDGET BY 2013-2014 In accordance with the provisions of the Balanced Budget Act, the government expects to gradually eliminate its budget deficit by 2013-2014 through a plan to restore fiscal balance.
In keeping with that plan, the budgetary balance within the meaning of the Balanced Budget Act determined in the 2010-2011 Budget will improve from a deficit of $4.5 billion in 2010-2011 to:
⎯ a deficit of $2.9 billion in 2011-2012;
⎯ a deficit of $1.2 billion in 2012-2013;
⎯ a balanced budget in 2013-2014.
Under the Act, the government must establish, no later than the tabling of the 2011-2012 budget, objectives for decreasing budgetary deficits for fiscal years 2011-2012 and 2012-2013. The government must achieve those objectives and any overrun must be offset.
TABLE F.3 Budgetary transactions – 2010-2011 BudgetF (millions of dollars)
2010-2011 2011-2012 2012-2013 2013-2014
BUDGETARY TRANSACTIONS
Budgetary revenue 64 489 65 936 68 480 70 941
Budgetary expenditure − 69 551 − 71 748 − 74 041 − 76 283
Net results of consolidated entities 697 848 926 852
Contingency reserve − 300 ⎯ ⎯ ⎯Impact of plan to restore fiscal balance 1 051 3 036 4 496 5 613
(DEFICIT) SURPLUS − 3 614 − 1 928 − 139 1 123
BALANCED BUDGET ACT
Deposit of dedicated revenues in the Generations Fund − 892 − 972 − 1 061 − 1 123BUDGETARY BALANCE WITHIN THE MEANING OF THE BALANCED BUDGET ACT − 4 506 − 2 900 − 1 200 0
F: Forecasts for 2010-2011 and 2011-2012 and projections for subsequent years.

G.1
Section G
G Report on the Application of the Act to reduce the debt and establish the Generations Fund
1. SUMS ACCUMULATED IN THE GENERATIONS FUND.............................................. G.3
2. NEW DEBT REDUCTION OBJECTIVES .................................................................... G.5

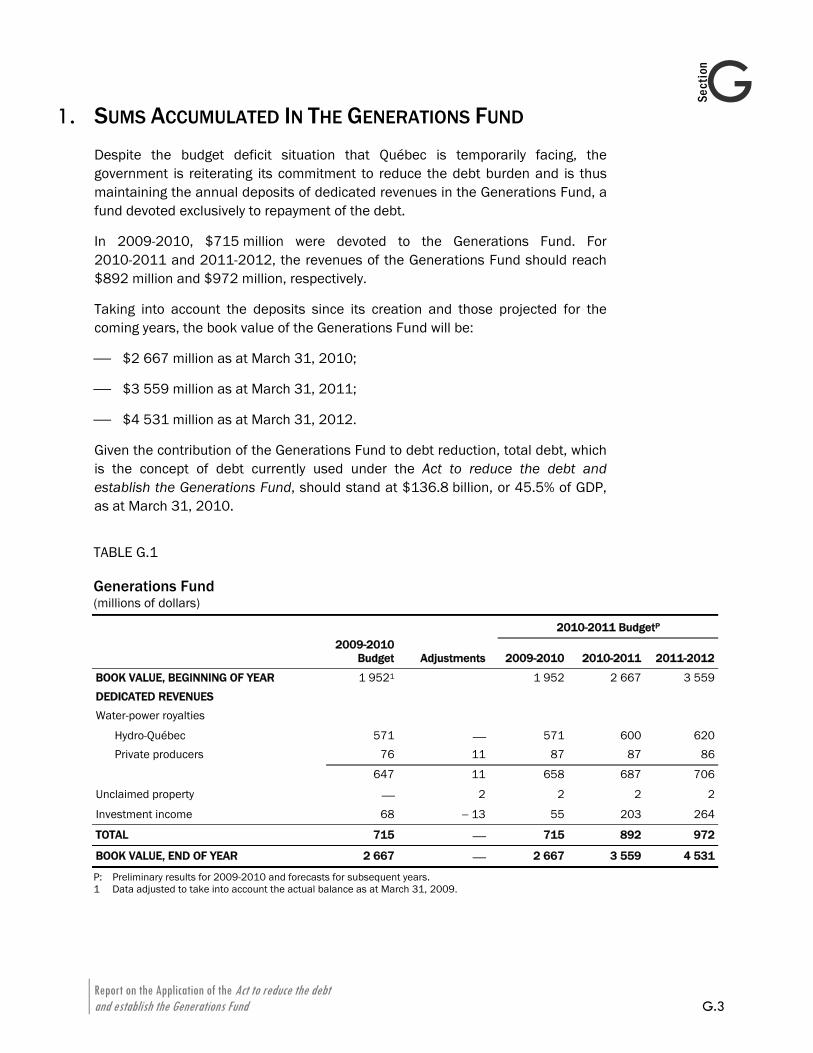
Report on the Application of the Act to reduce the debt and establish the Generations Fund G.3
GSection
1. SUMS ACCUMULATED IN THE GENERATIONS FUND Despite the budget deficit situation that Québec is temporarily facing, the government is reiterating its commitment to reduce the debt burden and is thus maintaining the annual deposits of dedicated revenues in the Generations Fund, a fund devoted exclusively to repayment of the debt.
In 2009-2010, $715 million were devoted to the Generations Fund. For 2010-2011 and 2011-2012, the revenues of the Generations Fund should reach $892 million and $972 million, respectively.
Taking into account the deposits since its creation and those projected for the coming years, the book value of the Generations Fund will be:
⎯ $2 667 million as at March 31, 2010;
⎯ $3 559 million as at March 31, 2011;
⎯ $4 531 million as at March 31, 2012.
Given the contribution of the Generations Fund to debt reduction, total debt, which is the concept of debt currently used under the Act to reduce the debt and establish the Generations Fund, should stand at $136.8 billion, or 45.5% of GDP, as at March 31, 2010.
TABLE G.1 Generations Fund (millions of dollars)
2010-2011 BudgetP
2009-2010
Budget Adjustments 2009-2010 2010-2011 2011-2012
BOOK VALUE, BEGINNING OF YEAR 1 9521 1 952 2 667 3 559DEDICATED REVENUES Water-power royalties
Hydro-Québec 571 ⎯ 571 600 620Private producers 76 11 87 87 86
647 11 658 687 706
Unclaimed property ⎯ 2 2 2 2
Investment income 68 − 13 55 203 264
TOTAL 715 ⎯ 715 892 972
BOOK VALUE, END OF YEAR 2 667 ⎯ 2 667 3 559 4 531
P: Preliminary results for 2009-2010 and forecasts for subsequent years. 1 Data adjusted to take into account the actual balance as at March 31, 2009.

Budget 2010-2011 G.4 Budget Plan
Requirements of the current Act
The Act to reduce the debt and establish the Generations Fund was adopted on June 15, 2006.1
The objective of the Act is to reduce the government’s debt burden. To that end, the Generations Fund was created. Pursuant to section 3, the Fund is made up of sums derived from seven revenue sources dedicated exclusively to repaying the debt. These sources are:
– water-power royalties paid by Hydro-Québec and private producers of hydro-electricity;
– a portion of Hydro-Québec’s earnings on the sale of electricity outside Québec from its new production capacities;
– fees or charges for water withdrawal;
– the sale of assets;
– gifts, legacies and other contributions received by the Minister of Finance;
– unclaimed property administered by the Minister of Revenue;
– income generated by the investment of the sums making up the Fund.
The Act allows the government to order that a part, which it establishes, of any sums it collects or receives and over which Parliament has the power of appropriation, is to be paid directly into the Generations Fund. It also allows the government, subject to the provisions of the Balanced Budget Act, to use the stabilization reserve to pay sums into the Generations Fund.
The sums making up the Fund are managed by the Caisse de dépôt et placement du Québec.
Section 1 of the Act stipulates the government’s debt reduction objectives. Under the Act, the government’s debt corresponds to the total debt shown in the public accounts. Specifically, the Act provides for the reduction of the total debt as a percentage of GDP to less than:
– 38%, not later than March 31, 2013;
– 32%, not later than March 31, 2020;
– 25%, not later than March 31, 2026.
Section 11 of the Act stipulates that the Minister of Finance must report to the National Assembly, in the Budget Speech, on the sums making up the fund and on any sums used to repay the government’s debt.
1 R.S.Q., c. R-2.2.0.1.
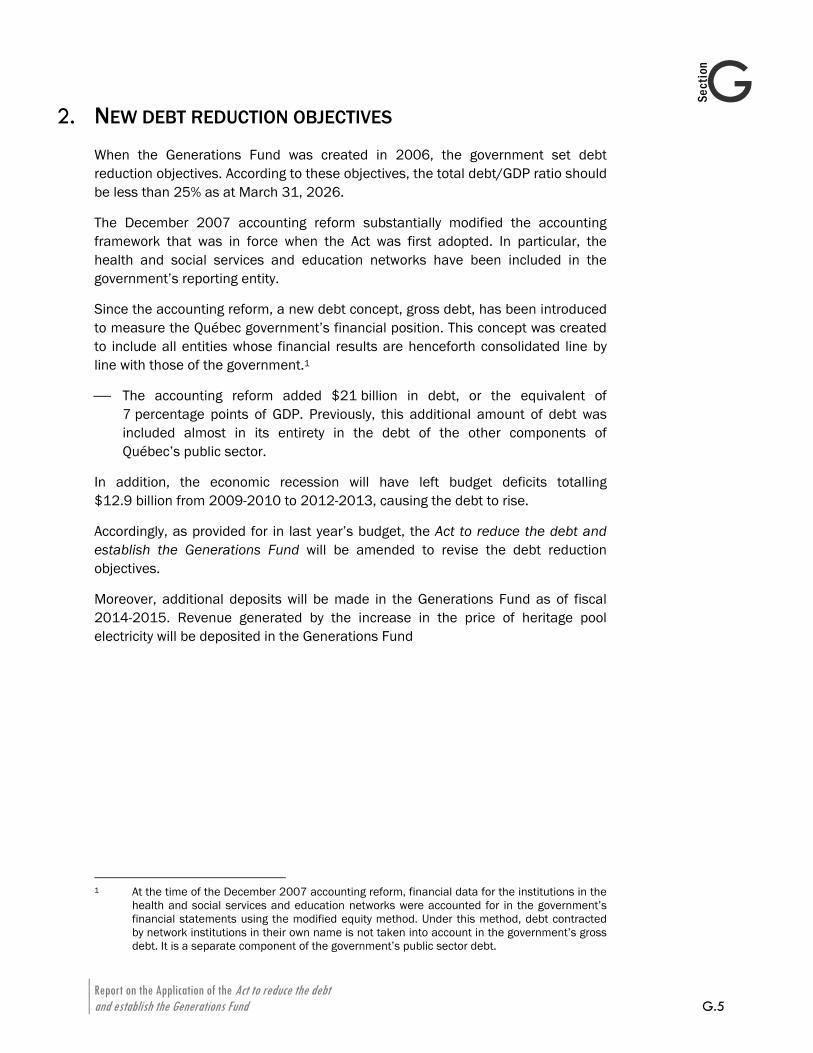
Report on the Application of the Act to reduce the debt and establish the Generations Fund G.5
GSection
2. NEW DEBT REDUCTION OBJECTIVES When the Generations Fund was created in 2006, the government set debt reduction objectives. According to these objectives, the total debt/GDP ratio should be less than 25% as at March 31, 2026.
The December 2007 accounting reform substantially modified the accounting framework that was in force when the Act was first adopted. In particular, the health and social services and education networks have been included in the government’s reporting entity.
Since the accounting reform, a new debt concept, gross debt, has been introduced to measure the Québec government’s financial position. This concept was created to include all entities whose financial results are henceforth consolidated line by line with those of the government.1
⎯ The accounting reform added $21 billion in debt, or the equivalent of 7 percentage points of GDP. Previously, this additional amount of debt was included almost in its entirety in the debt of the other components of Québec’s public sector.
In addition, the economic recession will have left budget deficits totalling $12.9 billion from 2009-2010 to 2012-2013, causing the debt to rise.
Accordingly, as provided for in last year’s budget, the Act to reduce the debt and establish the Generations Fund will be amended to revise the debt reduction objectives.
Moreover, additional deposits will be made in the Generations Fund as of fiscal 2014-2015. Revenue generated by the increase in the price of heritage pool electricity will be deposited in the Generations Fund
1 At the time of the December 2007 accounting reform, financial data for the institutions in the
health and social services and education networks were accounted for in the government’s financial statements using the modified equity method. Under this method, debt contracted by network institutions in their own name is not taken into account in the government’s gross debt. It is a separate component of the government’s public sector debt.
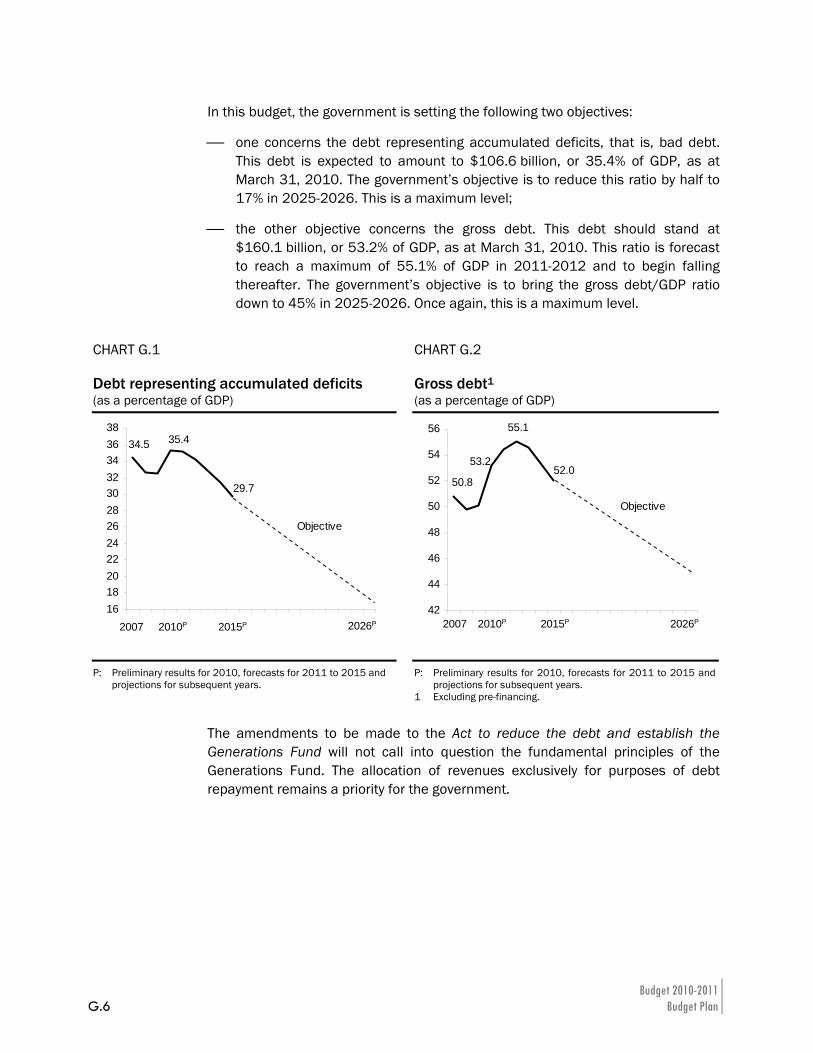
Budget 2010-2011 G.6 Budget Plan
In this budget, the government is setting the following two objectives:
⎯ one concerns the debt representing accumulated deficits, that is, bad debt. This debt is expected to amount to $106.6 billion, or 35.4% of GDP, as at March 31, 2010. The government’s objective is to reduce this ratio by half to 17% in 2025-2026. This is a maximum level;
⎯ the other objective concerns the gross debt. This debt should stand at $160.1 billion, or 53.2% of GDP, as at March 31, 2010. This ratio is forecast to reach a maximum of 55.1% of GDP in 2011-2012 and to begin falling thereafter. The government’s objective is to bring the gross debt/GDP ratio down to 45% in 2025-2026. Once again, this is a maximum level.
The amendments to be made to the Act to reduce the debt and establish the Generations Fund will not call into question the fundamental principles of the Generations Fund. The allocation of revenues exclusively for purposes of debt repayment remains a priority for the government.
CHART G.1 Debt representing accumulated deficits
CHART G.2 Gross debt1
(as a percentage of GDP) (as a percentage of GDP)
34.5
29.7
161820222426283032343638
2006-2007
2010-2011
2014-2015
2018-2019
2022-2023
Objective
35.4
2007 2026P2010P 2015P
52.050.8
42
44
46
48
50
52
54
56
2006-2007
2010-2011
2014-2015
2018-2019
2022-2023
Objective
53.2
2007 2026P2010P 2015P
55.1
P: Preliminary results for 2010, forecasts for 2011 to 2015 and projections for subsequent years.
P: Preliminary results for 2010, forecasts for 2011 to 2015 and projections for subsequent years.
1 Excluding pre-financing.
H.1
Section H
H Report on the Funding of Public Services
1. APPLICATION OF THE POLICY FOR THE FUNDING OF PUBLIC
SERVICES ........................................................................................................ H.5
1.1 Policy for the funding of public services ...................................................H.5 1.2 Application timetable and monitoring .......................................................H.6
1.2.1 Change in the policy for the funding of public services ..........................................................................................H.6
1.3 Bill respecting the funding of public services...........................................H.7 2. OVERVIEW OF 2008-2009 USER FEE REVENUES ............................................... H.9
2.1 Total user fee revenues .............................................................................H.9 2.2 The main government user fee revenues .............................................. H.11 2.3 Government user fees in proportion to the cost of
public services ......................................................................................... H.12 3. USER FEE REVENUES BY SECTOR......................................................................H.15
3.1 Government departments....................................................................... H.15 3.2 Consolidated organizations .................................................................... H.20 3.3 Health sector ........................................................................................... H.25 3.4 Education network................................................................................... H.30 3.5 Child-care services .................................................................................. H.35 3.6 Insurance plans ....................................................................................... H.37 3.7 Electricity.................................................................................................. H.42
4. COMPENSATORY MEASURES ADOPTED BY THE QUÉBEC GOVERNMENT IN FAVOUR OF LOW-INCOME HOUSEHOLDS ....................................H.45
4.1 Fiscal measures to support income ....................................................... H.45 4.2 Specific measures designed to offset increases in
certain user fees...................................................................................... H.46 4.3 Measures to maintain purchasing power .............................................. H.47

H.2
5. DETAILED REVENUES OF GOVERNMENT DEPARTMENTS AND ORGANIZATIONS .............................................................................................H.49
5.1 Appendix 1 – Detailed tables of the user fee revenues of government departments ................................................................... H.50
5.2 Appendix 2 – Detailed tables of the user fee revenues of government organizations .................................................................. H.66
Report on the Funding of Public Services H.3
HSection
INTRODUCTION This section of the 2010-2011 Budget is the report on the funding of public services for fiscal 2008-2009. It presents all of the user fee revenues collected by government bodies, which help to fund public services.
This annual report, which is an integral part of the accountability reporting provided for under the policy for the funding of public services, is needed to understand the change, in each activity sector, in the portion of public services that is funded by users through user fees in relation to the portion that is funded by society as a whole.
Therefore, it is an important source of information for the government and citizens for the purpose of ensuring the funding of quality public services.
Moreover, it contains a review of the policy for the funding of public services announced in the 2009-2010 Budget.
The observations and analyses found in this report are based on information collected from the various government bodies.
For the purposes of the report, user fee revenues are divided into two categories:
⎯ government user fee revenues comprising:
— user fees that require direct government approval;
— user fees that come under the various public insurance plans;
⎯ user fee revenues associated with the activities of Hydro-Québec.
The report also includes a list of the compensatory measures that the government has defined in favour of low-income households so as to offset the impact of user fees on these users.

Report on the Funding of Public Services H.5
HSection
1. APPLICATION OF THE POLICY FOR THE FUNDING OF PUBLIC SERVICES
1.1 Policy for the funding of public services
The policy for the funding of public services, announced in the 2009-2010 Budget, seeks, through better user fee practices, to enhance the funding of services to maintain quality and ensure transparency and accountability in the fee-setting process.
This policy, which applies to all public bodies that offer Quebecers goods and services, is intended to ensure the continuity of government services and their accessibility in order to improve Quebecers’ well-being.
The policy comprises four areas of intervention:
⎯ the establishment of funding methods and annual adjustment mechanisms;
⎯ the protection of access by low-income households to essential public services;
⎯ the availability of information on government user fees;
⎯ proper guidance for government departments and organizations in respect of user fees.
Government departments and organizations are called upon, in administering the policy, to take five actions:
⎯ establish the method for funding public goods and services, whether by means of user fees or general revenues, especially taxes;
⎯ determine the costs of fee-based services;
⎯ set and index annually the amount of the various user fees within the existing regulatory and legislative framework, based on an established funding level;
⎯ allocate user fees to fund fee-based services;
⎯ account for fee-setting practices.
These fee-setting practices will contribute to greater knowledge of the cost of services and improved sharing of funding costs between users and society as a whole.
2010-2011 Budget H.6 Budget Plan
1.2 Application timetable and monitoring
The policy for the funding of public services will be implemented gradually. For each area of intervention in the policy, the means to be implemented are clearly pinpointed and targets are defined.
Mention should be made of the following means and targets:
⎯ Starting January 1, 2011, all user fees that are not subject to indexation will be indexed annually according to the Québec consumer price index (excluding alcoholic beverages and tobacco products), except for the daily child-care services fee, which will be maintained at $7.
⎯ Government departments and organizations and the networks will have until March 31, 2011 to systematically evaluate the costs of all services in respect of which user fees are levied.
⎯ They must also determine the level of funding for their fee-based services by March 31, 2011. This process could lead to user fees for these services being kept at their current level or being revised.
⎯ Government departments and organizations and the networks must take stock in their 2009-2010 annual management report of progress in the fee practices provided for in the policy. They must present a detailed accountability report on their fee practices in their annual management report as of 2010-2011.
⎯ User fees must be re-evaluated at least once every five years according to the principles of the policy.
In addition, government departments and organizations will have to include fee practices in their strategic plan.
1.2.1 Change in the policy for the funding of public services
A change is being made to the deadline for implementing the policy in the case of non-budget-funded bodies.
For such bodies, the deadline for evaluating costs and determining funding levels for user services is being changed to March 31, 2011.
As a result, non-budget-funded bodies, government departments, including budget-funded bodies, and the networks now have the same deadlines for applying the practices of the policy for the funding of public services.

Report on the Funding of Public Services H.7
HSection
1.3 Bill respecting the funding of public services
A bill respecting the funding of public services will be tabled in the National Assembly to provide a framework for the policy for the funding of public services.
The bill will provide for, in particular:
⎯ guideposts for the setting of user fees by public bodies;
⎯ compulsory re-evaluation of the cost of fee-based services at least once every five years;
⎯ annual indexation of some user fees;
⎯ the possibility for the government to establish special funds allocated to the funding of public services for which user fees are collected by a government department or a budget-funded body;
⎯ annual accountability reports on user fee practices by public bodies.
The fee practices governed by the bill, particularly the annual indexation of user fees, will help to achieve the objects of the plan to restore fiscal balance.
Moreover, as the Minister of Finance said, these new fee practices will enable all Quebecers to know the cost of the public services they receive, as well as the portion paid by users and the portion paid by society as a whole.

Report on the Funding of Public Services H.9
HSection
2. OVERVIEW OF 2008-2009 USER FEE REVENUES
2.1 Total user fee revenues
In 2008-2009, government user fee revenues1,2 amounted to $12.9 billion, to which must be added $10.4 billion in revenue from electricity sales, for a total of $23.3 billion.
1 In the wake of the consolidation of the health and education networks and of a number of
other bodies, data have been adjusted for the preceding years for purposes of comparison. Furthermore, to avoid double counting, the revenues of certain government departments and organizations have been reduced by roughly $500 million a year. This amount corresponds to revenues that have already been accounted for by Hydro-Québec and other fiduciary bodies such as the Société de l’assurance automobile du Québec (SAAQ) and the Commission de la santé et de la sécurité du travail (CSST).
2 Due to rounding off, the sum of the amounts presented in this report may not correspond to the total indicated.
TABLE H.1 Total user fee revenues (millions de dollars)
2005-2006 2006-2007 2007-2008 2008-2009
Departments, agencies and special funds, networks and child-care services Departments 1 224 1 161 1 150 1 128Agencies and special funds 1 385 1 568 1 770 1 914Health network1 1 284 1 377 1 345 1 382 Education network2 1 784 1 875 1 962 1 915$7-a-day child-care services3 305 316 335 344
Subtotal 5 982 6 297 6 562 6 683
Insurance plans 4 338 5 605 5 760 6 169
Subtotal – Government user fee revenues 10 320 11 902 12 322 12 852
Hydro-Québec (electricity sales) 4 9 121 9 402 10 368 10 445
TOTAL 19 441 21 304 22 690 23 297
1 The expression “health network” always refers to the health and social services network. 2 Higher education and school boards. 3 Child-care centres and home child-care services. Revenues from school child-care services are included in the education network. 4 Electricity sales in Québec. Data as at December 31 of each year.
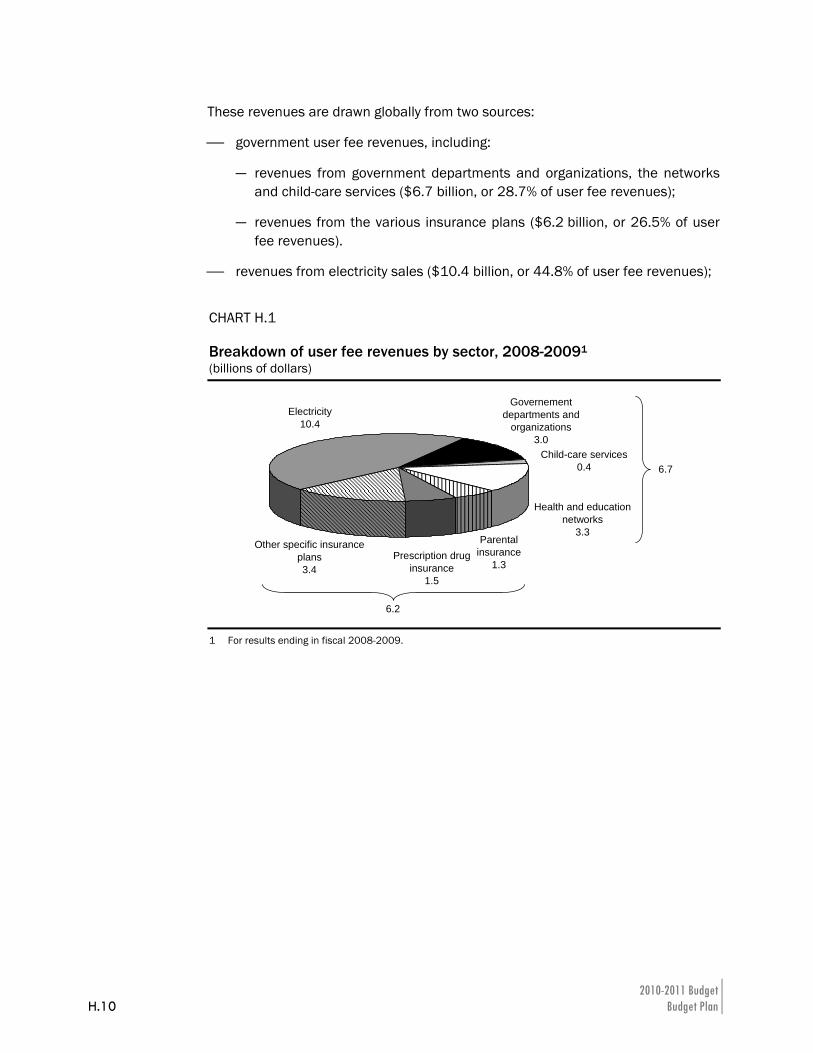
2010-2011 Budget H.10 Budget Plan
These revenues are drawn globally from two sources:
⎯ government user fee revenues, including:
— revenues from government departments and organizations, the networks and child-care services ($6.7 billion, or 28.7% of user fee revenues);
— revenues from the various insurance plans ($6.2 billion, or 26.5% of user fee revenues).
⎯ revenues from electricity sales ($10.4 billion, or 44.8% of user fee revenues);
CHART H.1 Breakdown of user fee revenues by sector, 2008-20091 (billions of dollars)
Health and education networks
3.3Parental
insurance1.3
Prescription druginsurance
1.5
Other specific insurance plans3.4
Child-care services0.4
Governement departments and
organizations3.0
Electricity10.4
6.7
6.2
1 For results ending in fiscal 2008-2009.
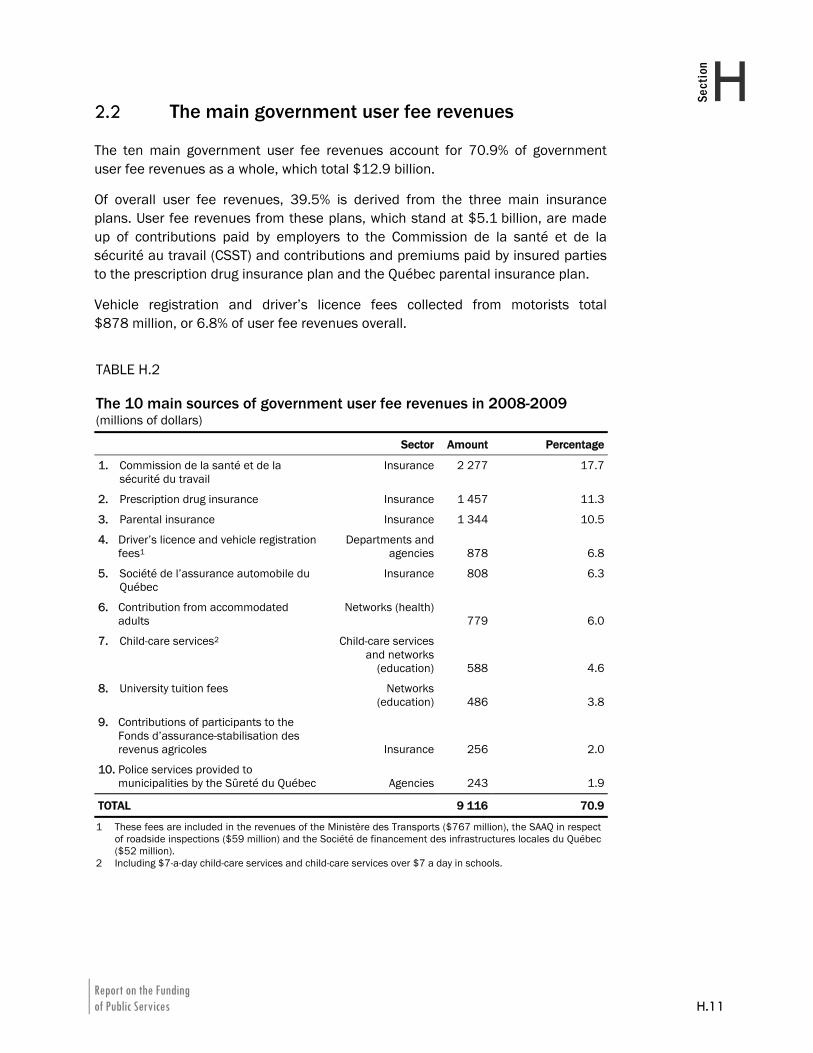
Report on the Funding of Public Services H.11
HSection
2.2 The main government user fee revenues
The ten main government user fee revenues account for 70.9% of government user fee revenues as a whole, which total $12.9 billion.
Of overall user fee revenues, 39.5% is derived from the three main insurance plans. User fee revenues from these plans, which stand at $5.1 billion, are made up of contributions paid by employers to the Commission de la santé et de la sécurité au travail (CSST) and contributions and premiums paid by insured parties to the prescription drug insurance plan and the Québec parental insurance plan.
Vehicle registration and driver’s licence fees collected from motorists total $878 million, or 6.8% of user fee revenues overall.
TABLE H.2 The 10 main sources of government user fee revenues in 2008-2009 (millions of dollars)
Sector Amount Percentage
1. Commission de la santé et de la sécurité du travail
Insurance 2 277 17.7
2. Prescription drug insurance Insurance 1 457 11.3
3. Parental insurance Insurance 1 344 10.5
4. Driver’s licence and vehicle registration fees1
Departments and agencies 878 6.8
5. Société de l’assurance automobile du Québec
Insurance 808 6.3
6. Contribution from accommodated adults
Networks (health)779 6.0
7. Child-care services2 Child-care services and networks
(education) 588 4.6
8. University tuition fees Networks (education) 486 3.8
9. Contributions of participants to the Fonds d’assurance-stabilisation des revenus agricoles Insurance 256 2.0
10. Police services provided to municipalities by the Sûreté du Québec Agencies 243 1.9
TOTAL 9 116 70.9
1 These fees are included in the revenues of the Ministère des Transports ($767 million), the SAAQ in respect of roadside inspections ($59 million) and the Société de financement des infrastructures locales du Québec ($52 million).
2 Including $7-a-day child-care services and child-care services over $7 a day in schools.
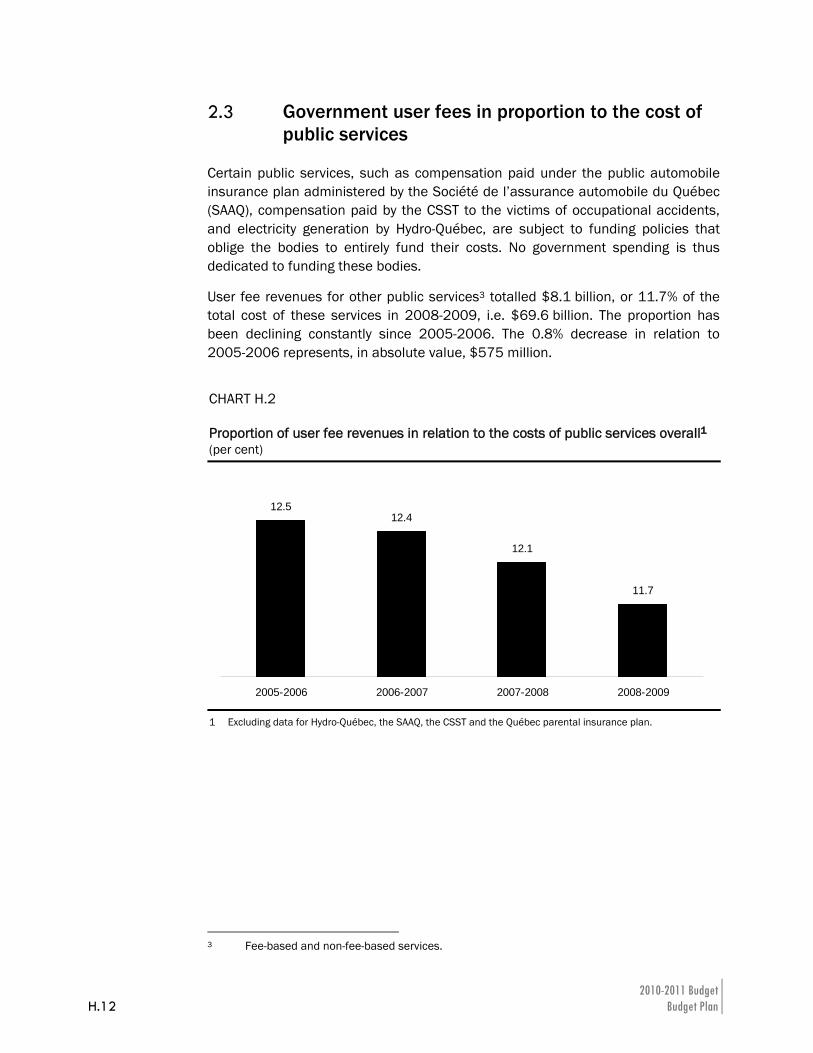
2010-2011 Budget H.12 Budget Plan
2.3 Government user fees in proportion to the cost of public services
Certain public services, such as compensation paid under the public automobile insurance plan administered by the Société de l’assurance automobile du Québec (SAAQ), compensation paid by the CSST to the victims of occupational accidents, and electricity generation by Hydro-Québec, are subject to funding policies that oblige the bodies to entirely fund their costs. No government spending is thus dedicated to funding these bodies.
User fee revenues for other public services3 totalled $8.1 billion, or 11.7% of the total cost of these services in 2008-2009, i.e. $69.6 billion. The proportion has been declining constantly since 2005-2006. The 0.8% decrease in relation to 2005-2006 represents, in absolute value, $575 million.
CHART H.2 Proportion of user fee revenues in relation to the costs of public services overall1 (per cent)
11.7
12.1
12.412.5
2005-2006 2006-2007 2007-2008 2008-2009
1 Excluding data for Hydro-Québec, the SAAQ, the CSST and the Québec parental insurance plan.
3 Fee-based and non-fee-based services.
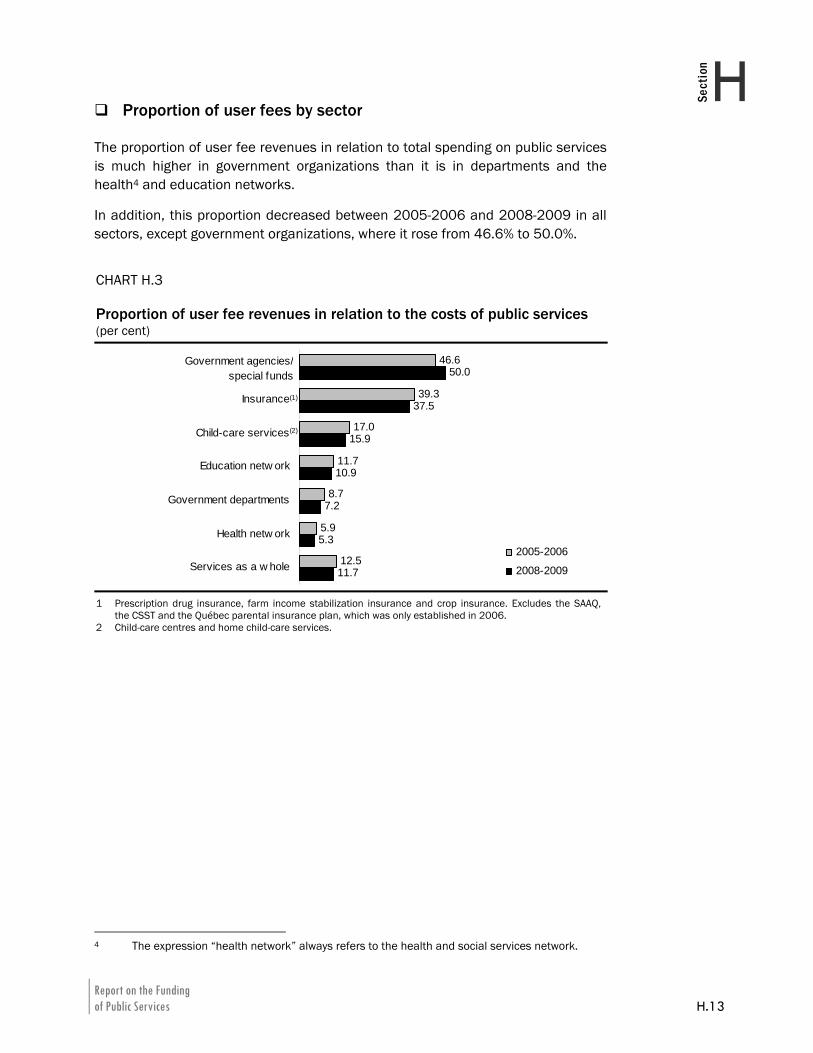
Report on the Funding of Public Services H.13
HSection
Proportion of user fees by sector
The proportion of user fee revenues in relation to total spending on public services is much higher in government organizations than it is in departments and the health4 and education networks.
In addition, this proportion decreased between 2005-2006 and 2008-2009 in all sectors, except government organizations, where it rose from 46.6% to 50.0%.
CHART H.3 Proportion of user fee revenues in relation to the costs of public services (per cent)
11.7
5.3
7.2
10.9
15.9
37.5
50.0
12.5
5.9
8.7
11.7
17.0
46.6
39.3
Services as a w hole
Health netw ork
Government departments
Education netw ork
Child-care services
Insurance
Government agencies / special funds
2005-2006
2008-2009
(1)
(2)
Government agencies/special funds
1 Prescription drug insurance, farm income stabilization insurance and crop insurance. Excludes the SAAQ, the CSST and the Québec parental insurance plan, which was only established in 2006.
2 Child-care centres and home child-care services.
4 The expression “health network” always refers to the health and social services network.

Report on the Funding of Public Services H.15
HSection
3. USER FEE REVENUES BY SECTOR 3.1 Government departments
User fee revenues of government departments
The user fee revenues of government departments5 totalled $1.1 billion in 2008-2009, a $22.0-million decrease in relation to 2007-2008.
Overall, when transfers to the health and education networks, in particular, are excluded, user fee revenues covered 7.2% of the overall expenditures of government departments in 2008-2009. This proportion has declined steadily since 2005-2006 under the combined effect of higher spending and lower user fee revenues.6
5 Including budget-funded bodies. 6 User fee revenues for the period 2005 to 2009 have been adjusted to avoid taking into
account intergovernmental funding. The revenues of the Ministère des Finances have been reduced by amounts of between $163 million and $175 million annually in respect of the loan guarantee accorded enterprises, especially Hydro-Québec. An annual amount of $88.6 million received from the SAAQ for health services for road accident victims has also been deducted from the Ministère de la Santé et des Services sociaux. Lastly, an annual amount ranging from $14 million to $31 million from the Régie des rentes du Québec has been subtracted from the revenues of the Ministère du Revenu.
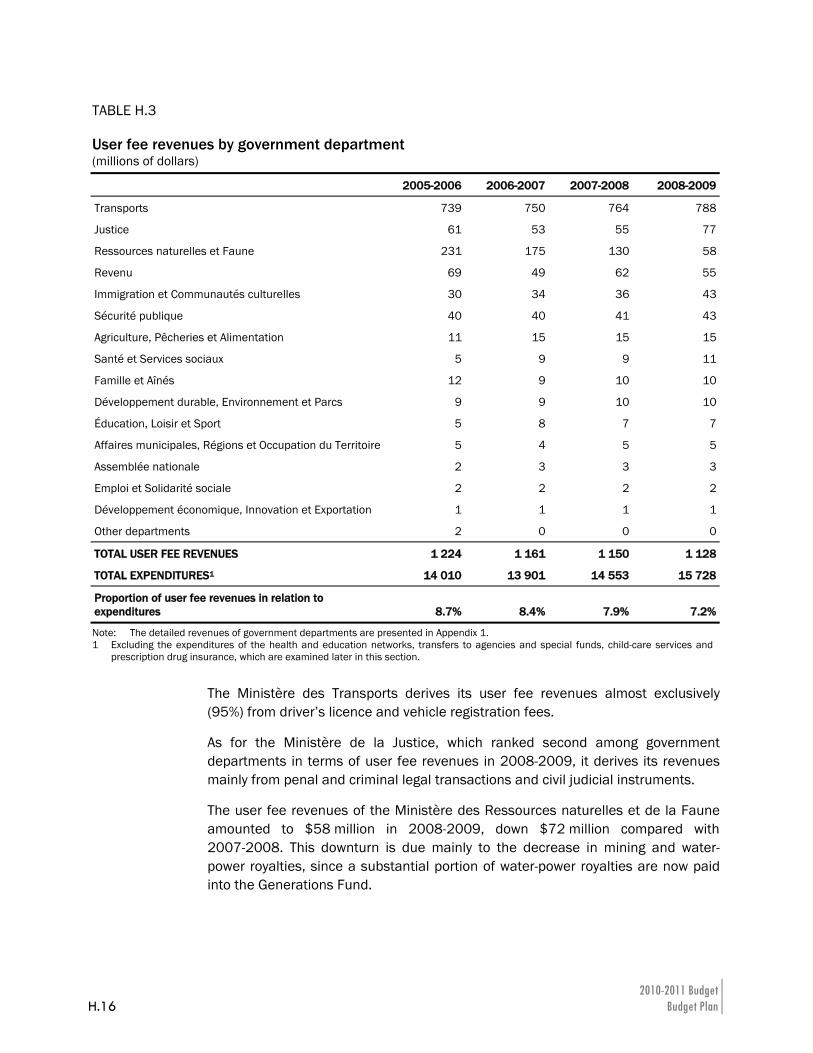
2010-2011 Budget H.16 Budget Plan
The Ministère des Transports derives its user fee revenues almost exclusively (95%) from driver’s licence and vehicle registration fees.
As for the Ministère de la Justice, which ranked second among government departments in terms of user fee revenues in 2008-2009, it derives its revenues mainly from penal and criminal legal transactions and civil judicial instruments.
The user fee revenues of the Ministère des Ressources naturelles et de la Faune amounted to $58 million in 2008-2009, down $72 million compared with 2007-2008. This downturn is due mainly to the decrease in mining and water-power royalties, since a substantial portion of water-power royalties are now paid into the Generations Fund.
TABLE H.3 User fee revenues by government department (millions of dollars)
2005-2006 2006-2007 2007-2008 2008-2009
Transports 739 750 764 788
Justice 61 53 55 77
Ressources naturelles et Faune 231 175 130 58
Revenu 69 49 62 55
Immigration et Communautés culturelles 30 34 36 43
Sécurité publique 40 40 41 43
Agriculture, Pêcheries et Alimentation 11 15 15 15
Santé et Services sociaux 5 9 9 11
Famille et Aînés 12 9 10 10
Développement durable, Environnement et Parcs 9 9 10 10
Éducation, Loisir et Sport 5 8 7 7
Affaires municipales, Régions et Occupation du Territoire 5 4 5 5
Assemblée nationale 2 3 3 3
Emploi et Solidarité sociale 2 2 2 2
Développement économique, Innovation et Exportation 1 1 1 1
Other departments 2 0 0 0
TOTAL USER FEE REVENUES 1 224 1 161 1 150 1 128
TOTAL EXPENDITURES1 14 010 13 901 14 553 15 728
Proportion of user fee revenues in relation to expenditures 8.7% 8.4% 7.9% 7.2%
Note: The detailed revenues of government departments are presented in Appendix 1. 1 Excluding the expenditures of the health and education networks, transfers to agencies and special funds, child-care services and
prescription drug insurance, which are examined later in this section.
Report on the Funding of Public Services H.17
HSection
The costs of fee-based services
It is difficult to assess the costs of departments’ fee-based services. Certain government departments still do not have the structures or means necessary to ascertain such costs with satisfactory accuracy.
In this regard, note that under the policy for the funding of public services, government departments must calculate the total costs of their fee-based services by March 31, 2011.
For 2008-2009, costs could be ascertained for only 26% of the user fee revenues of government departments.7 Nevertheless, this was an improvement over fiscal 2007-2008, when cost coverage was determined for only 7% of revenues.
In 2008-2009, user fee revenues in respect of which costs could be determined covered 73% of the cost of delivering the fee-based services concerned. In absolute value, this represents close to $300 million in user fee revenues collected by government departments to fund services whose total cost amounted to $400 million.
7 Excluding royalties collected by the Ministère des Ressources naturelles et de la Faune.
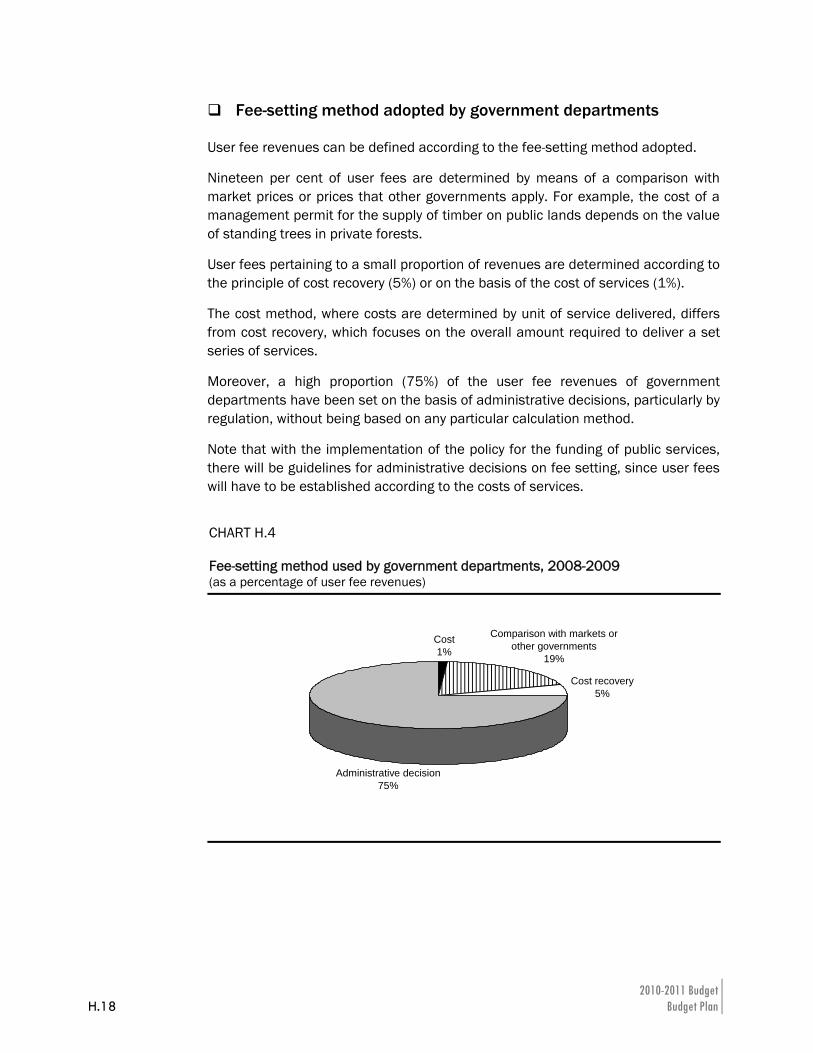
2010-2011 Budget H.18 Budget Plan
Fee-setting method adopted by government departments
User fee revenues can be defined according to the fee-setting method adopted.
Nineteen per cent of user fees are determined by means of a comparison with market prices or prices that other governments apply. For example, the cost of a management permit for the supply of timber on public lands depends on the value of standing trees in private forests.
User fees pertaining to a small proportion of revenues are determined according to the principle of cost recovery (5%) or on the basis of the cost of services (1%).
The cost method, where costs are determined by unit of service delivered, differs from cost recovery, which focuses on the overall amount required to deliver a set series of services.
Moreover, a high proportion (75%) of the user fee revenues of government departments have been set on the basis of administrative decisions, particularly by regulation, without being based on any particular calculation method.
Note that with the implementation of the policy for the funding of public services, there will be guidelines for administrative decisions on fee setting, since user fees will have to be established according to the costs of services.
CHART H.4 Fee-setting method used by government departments, 2008-2009 (as a percentage of user fee revenues)
Cost recovery5%
Cost1%
Administrative decision75%
Comparison with markets orother governments
19%
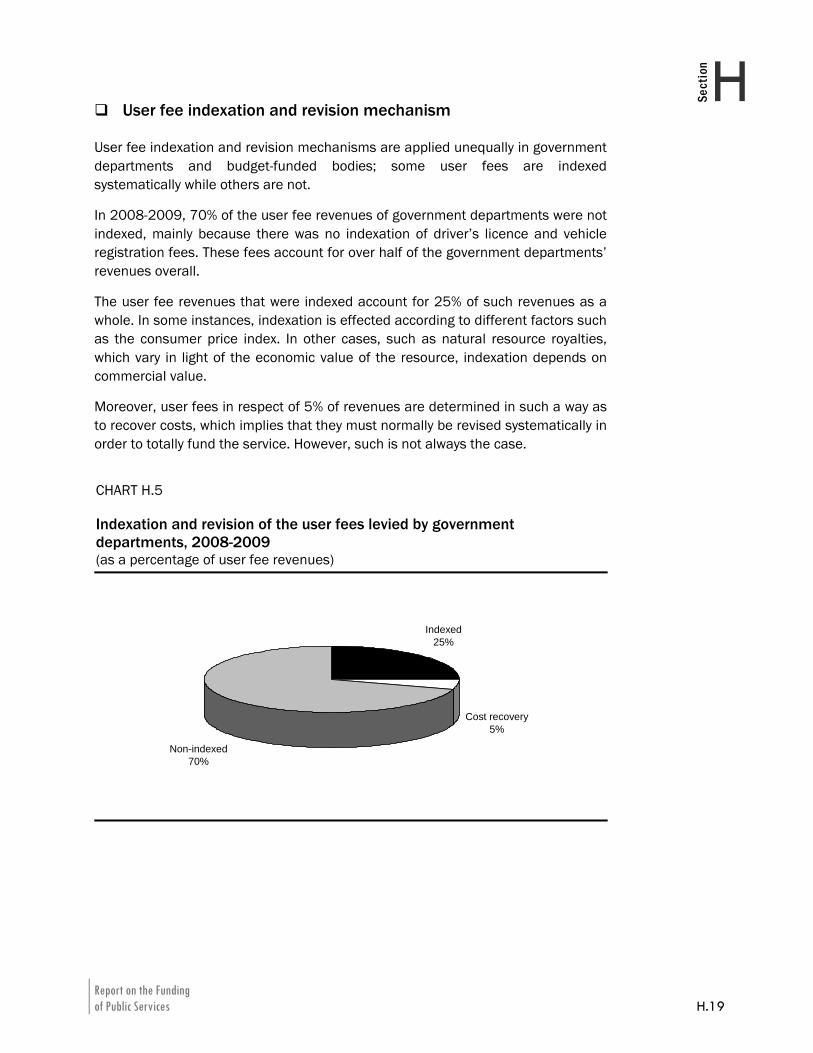
Report on the Funding of Public Services H.19
HSection
User fee indexation and revision mechanism
User fee indexation and revision mechanisms are applied unequally in government departments and budget-funded bodies; some user fees are indexed systematically while others are not.
In 2008-2009, 70% of the user fee revenues of government departments were not indexed, mainly because there was no indexation of driver’s licence and vehicle registration fees. These fees account for over half of the government departments’ revenues overall.
The user fee revenues that were indexed account for 25% of such revenues as a whole. In some instances, indexation is effected according to different factors such as the consumer price index. In other cases, such as natural resource royalties, which vary in light of the economic value of the resource, indexation depends on commercial value.
Moreover, user fees in respect of 5% of revenues are determined in such a way as to recover costs, which implies that they must normally be revised systematically in order to totally fund the service. However, such is not always the case.
CHART H.5 Indexation and revision of the user fees levied by government departments, 2008-2009 (as a percentage of user fee revenues)
Non-indexed70%
Cost recovery5%
Indexed25%
2010-2011 Budget H.20 Budget Plan
3.2 Consolidated organizations
User fee revenues of government organizations
The user fee revenues collected by consolidated agencies8 and special funds totalled $1.9 billion in 2008-2009, or 8.2% of total user fee revenues. Overall, user fee revenues represent 54.1% of the total expenditures of government organizations, which stood at $3.5 billion in 2008-2009.
The proportion of the expenses of government organizations funded by means of user fees rose from 46.6% in 2005-2006 to 54.1% in 2008-2009. This increase is essentially attributable to the introduction of new sources of environmental user fees. However, when the revenues of two new organizations, the Green Fund and the Centre de services partagés du Québec, are subtracted, the proportion of user fee revenues in relation to total expenditures declined to 50.0% in 2008-2009.
8 As in the case of government departments, organization revenues from Hydro-Québec, the
CSST or the SAAQ as trustee have been eliminated in order to avoid double counting. The Commission des lésions professionnelles, for example, entirely funds its operations through a $54-million contribution from the CSST. The latter also refunds $115 million to the Régie de l’assurance maladie du Québec.
Similar adjustments of $7 million and $30 million from Hydro-Québec have also been made with respect to the Régie de l’énergie and the Agence de l’efficacité énergétique.
The revenues that the Corporation d’Urgences-santé earns from institutions in the health network and the SAAQ have been removed.
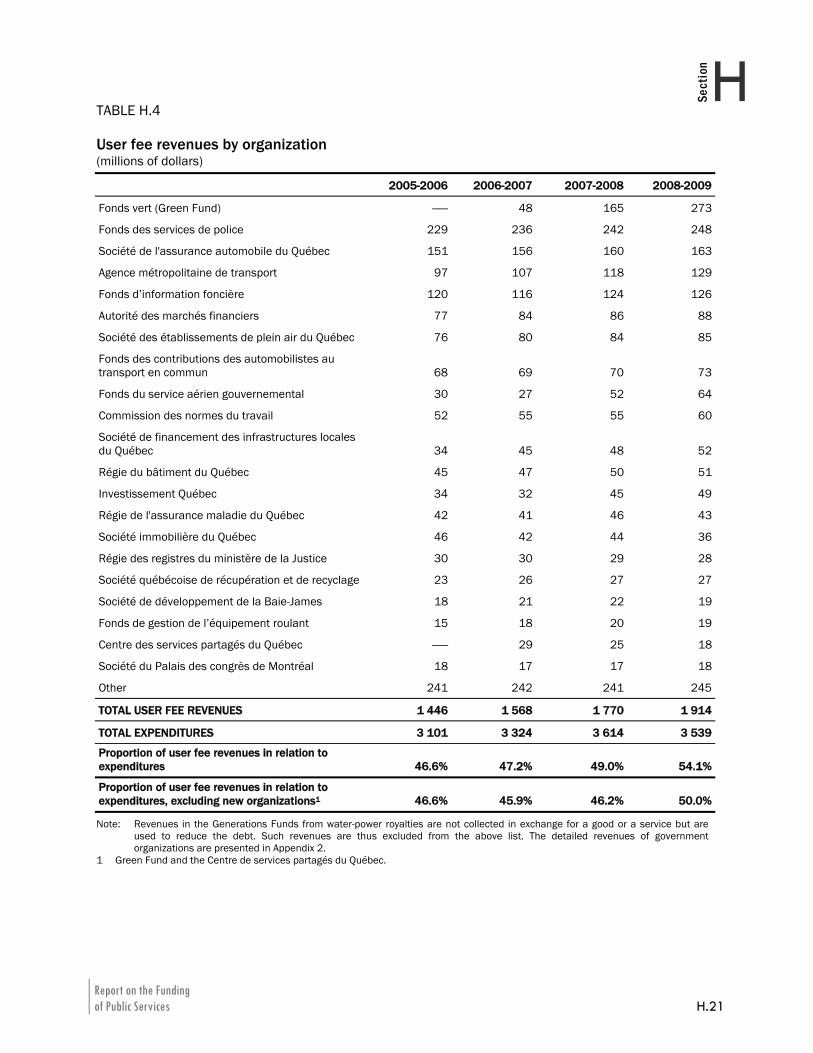
Report on the Funding of Public Services H.21
HSection
TABLE H.4 User fee revenues by organization (millions of dollars)
2005-2006 2006-2007 2007-2008 2008-2009
Fonds vert (Green Fund) —— 48 165 273
Fonds des services de police 229 236 242 248
Société de l'assurance automobile du Québec 151 156 160 163
Agence métropolitaine de transport 97 107 118 129
Fonds d’information foncière 120 116 124 126
Autorité des marchés financiers 77 84 86 88
Société des établissements de plein air du Québec 76 80 84 85
Fonds des contributions des automobilistes au transport en commun 68 69 70 73
Fonds du service aérien gouvernemental 30 27 52 64
Commission des normes du travail 52 55 55 60
Société de financement des infrastructures locales du Québec 34 45 48 52
Régie du bâtiment du Québec 45 47 50 51
Investissement Québec 34 32 45 49
Régie de l'assurance maladie du Québec 42 41 46 43
Société immobilière du Québec 46 42 44 36
Régie des registres du ministère de la Justice 30 30 29 28
Société québécoise de récupération et de recyclage 23 26 27 27
Société de développement de la Baie-James 18 21 22 19
Fonds de gestion de l’équipement roulant 15 18 20 19
Centre des services partagés du Québec —— 29 25 18
Société du Palais des congrès de Montréal 18 17 17 18
Other 241 242 241 245
TOTAL USER FEE REVENUES 1 446 1 568 1 770 1 914
TOTAL EXPENDITURES 3 101 3 324 3 614 3 539
Proportion of user fee revenues in relation to expenditures 46.6% 47.2% 49.0% 54.1%
Proportion of user fee revenues in relation to expenditures, excluding new organizations1 46.6% 45.9% 46.2% 50.0%
Note: Revenues in the Generations Funds from water-power royalties are not collected in exchange for a good or a service but are used to reduce the debt. Such revenues are thus excluded from the above list. The detailed revenues of government organizations are presented in Appendix 2.
1 Green Fund and the Centre de services partagés du Québec.
2010-2011 Budget H.22 Budget Plan
The revenues of the Green Fund rose by $108 million in 2008-2009, mainly because of the increase in climate change fees, which were collected over a full fiscal year for the first time.
The revenues of the Police Services Fund stem from invoicing the municipalities for police services provided by the Sûreté du Québec.
The revenues of the SAAQ consist of administrative fees collected and fees retained for the purpose of roadside inspections.
As for the user fee revenues of the Agence métropolitaine de transport, 64% come from the proceeds of TRAM pass sales and the remainder from revenues from commuter trains and metropolitan express buses.
The Fonds d’information foncière derives most of its revenues from the registration of real property rights (62%) and sales, fees and honoraria related to cadastral renewal (34%).
The costs of the fee-based services provided by government organizations
Unlike government departments, a number of organizations already rely on an accounting system by activity, which enables them to more readily provide the costs of their fee-based services.
Therefore, it was possible to ascertain costs for 63% of the user fee revenues of government organizations.9
⎯ In 2008-2009, such revenues covered 80% of the cost of delivering the fee-based services concerned.
⎯ In absolute value, this represents $1.26 billion in user fee revenues collected by organizations to fund services whose total cost stood at $1.58 billion.
9 Excluding royalties paid, particularly to the Generations Fund.
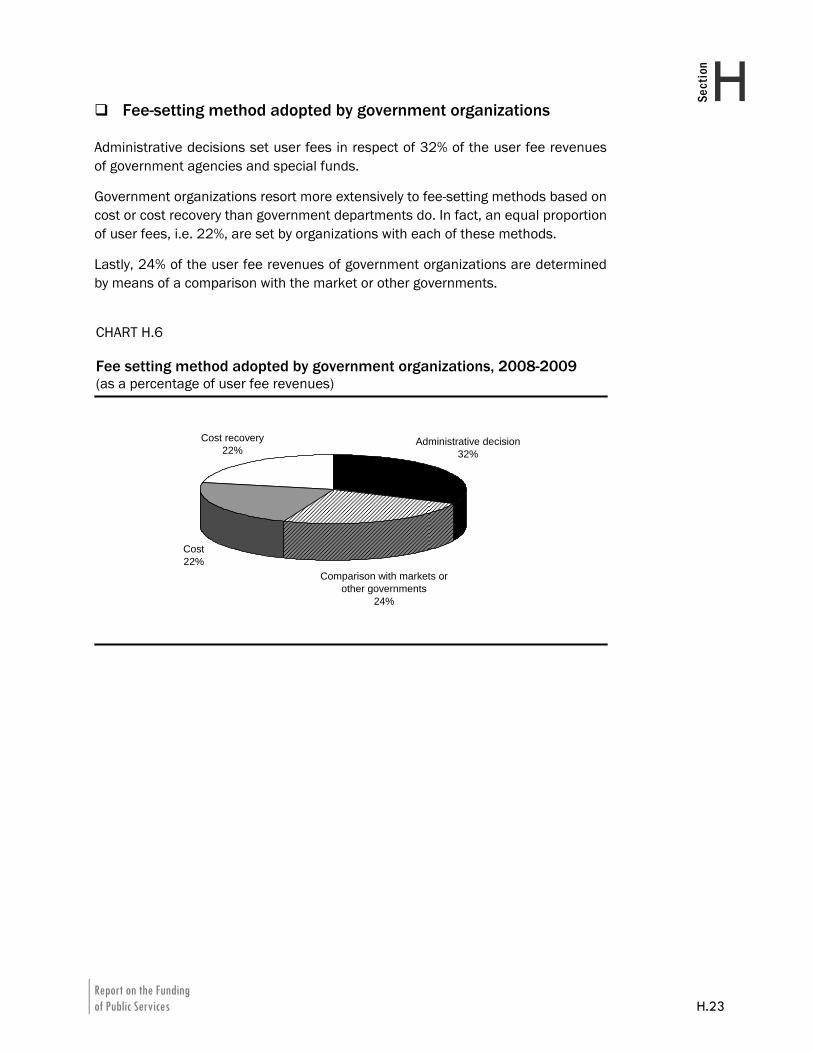
Report on the Funding of Public Services H.23
HSection
Fee-setting method adopted by government organizations
Administrative decisions set user fees in respect of 32% of the user fee revenues of government agencies and special funds.
Government organizations resort more extensively to fee-setting methods based on cost or cost recovery than government departments do. In fact, an equal proportion of user fees, i.e. 22%, are set by organizations with each of these methods.
Lastly, 24% of the user fee revenues of government organizations are determined by means of a comparison with the market or other governments.
CHART H.6 Fee setting method adopted by government organizations, 2008-2009 (as a percentage of user fee revenues)
Administrative decision32%
Cost22%
Cost recovery22%
Comparison with markets orother governments
24%
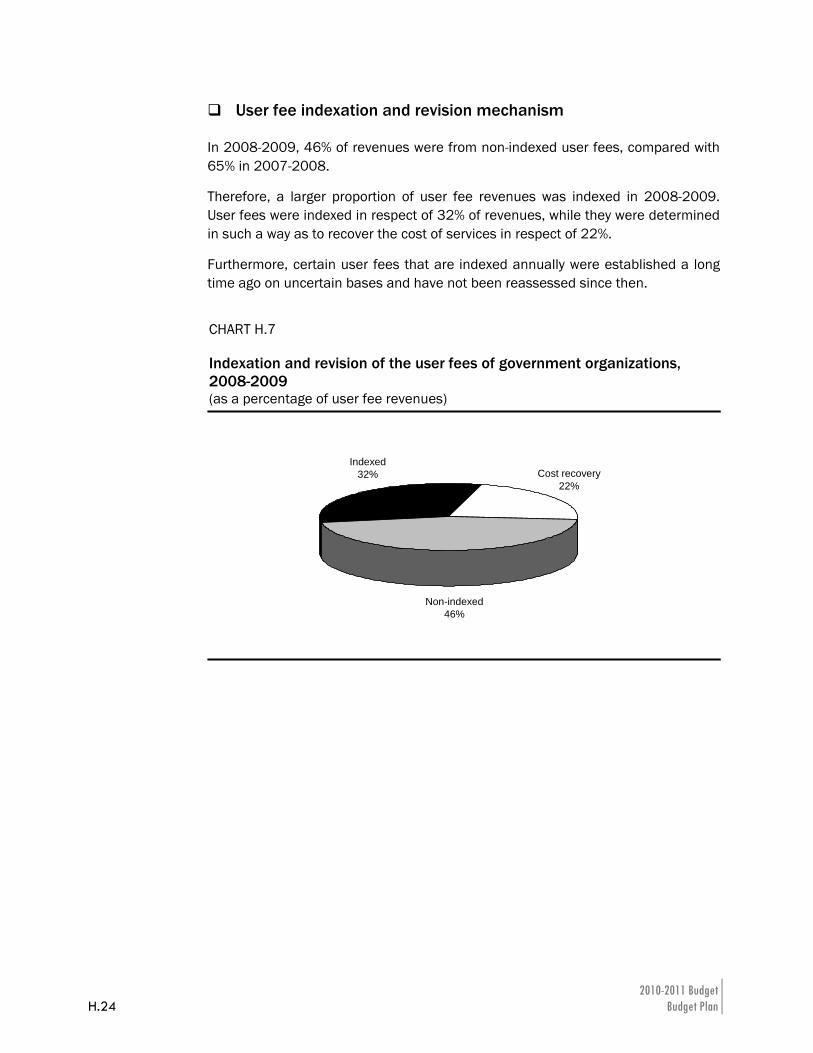
2010-2011 Budget H.24 Budget Plan
User fee indexation and revision mechanism
In 2008-2009, 46% of revenues were from non-indexed user fees, compared with 65% in 2007-2008.
Therefore, a larger proportion of user fee revenues was indexed in 2008-2009. User fees were indexed in respect of 32% of revenues, while they were determined in such a way as to recover the cost of services in respect of 22%.
Furthermore, certain user fees that are indexed annually were established a long time ago on uncertain bases and have not been reassessed since then.
CHART H.7 Indexation and revision of the user fees of government organizations, 2008-2009 (as a percentage of user fee revenues)
Cost recovery22%
Non-indexed46%
Indexed32%
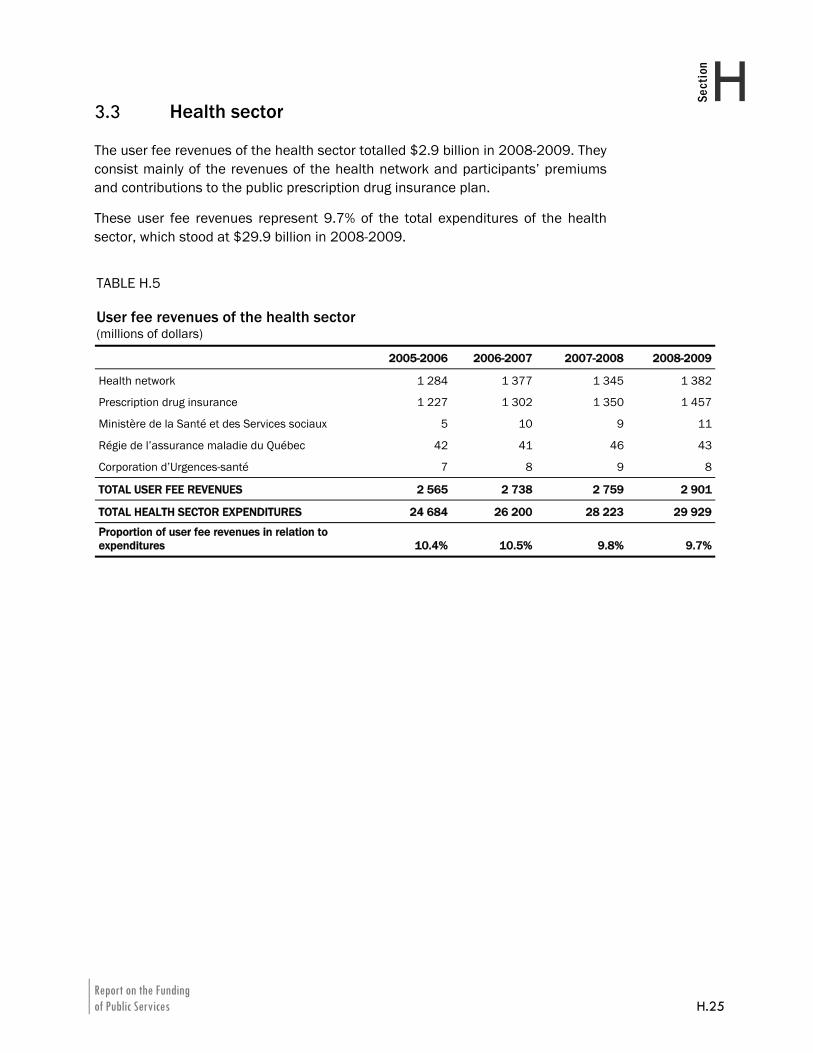
Report on the Funding of Public Services H.25
HSection
3.3 Health sector
The user fee revenues of the health sector totalled $2.9 billion in 2008-2009. They consist mainly of the revenues of the health network and participants’ premiums and contributions to the public prescription drug insurance plan.
These user fee revenues represent 9.7% of the total expenditures of the health sector, which stood at $29.9 billion in 2008-2009.
TABLE H.5 User fee revenues of the health sector (millions of dollars)
2005-2006 2006-2007 2007-2008 2008-2009
Health network 1 284 1 377 1 345 1 382
Prescription drug insurance 1 227 1 302 1 350 1 457
Ministère de la Santé et des Services sociaux 5 10 9 11
Régie de l’assurance maladie du Québec 42 41 46 43
Corporation d’Urgences-santé 7 8 9 8
TOTAL USER FEE REVENUES 2 565 2 738 2 759 2 901
TOTAL HEALTH SECTOR EXPENDITURES 24 684 26 200 28 223 29 929
Proportion of user fee revenues in relation to expenditures 10.4% 10.5% 9.8% 9.7%
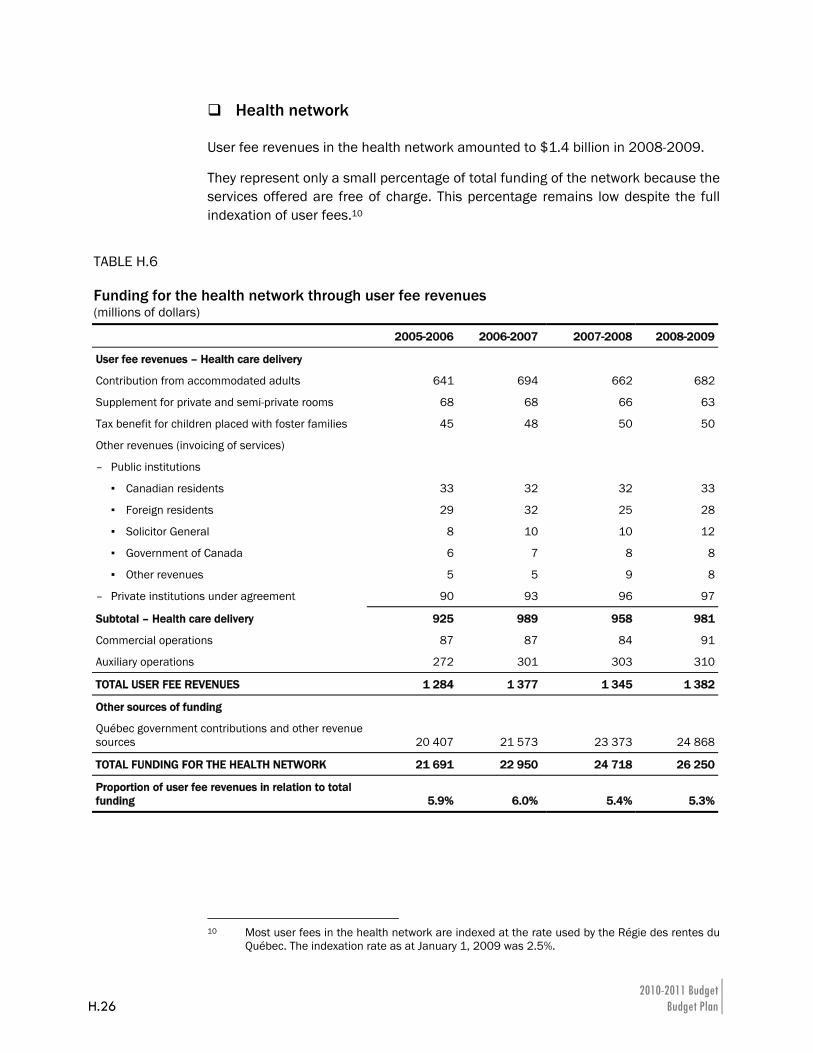
2010-2011 Budget H.26 Budget Plan
Health network
User fee revenues in the health network amounted to $1.4 billion in 2008-2009.
They represent only a small percentage of total funding of the network because the services offered are free of charge. This percentage remains low despite the full indexation of user fees.10
10 Most user fees in the health network are indexed at the rate used by the Régie des rentes du
Québec. The indexation rate as at January 1, 2009 was 2.5%.
TABLE H.6 Funding for the health network through user fee revenues (millions of dollars)
2005-2006 2006-2007 2007-2008 2008-2009
User fee revenues – Health care delivery
Contribution from accommodated adults 641 694 662 682
Supplement for private and semi-private rooms 68 68 66 63
Tax benefit for children placed with foster families 45 48 50 50
Other revenues (invoicing of services)
– Public institutions
▪ Canadian residents 33 32 32 33
▪ Foreign residents 29 32 25 28
▪ Solicitor General 8 10 10 12
▪ Government of Canada 6 7 8 8
▪ Other revenues 5 5 9 8
– Private institutions under agreement 90 93 96 97
Subtotal – Health care delivery 925 989 958 981
Commercial operations 87 87 84 91
Auxiliary operations 272 301 303 310
TOTAL USER FEE REVENUES 1 284 1 377 1 345 1 382
Other sources of funding
Québec government contributions and other revenue sources 20 407 21 573 23 373 24 868
TOTAL FUNDING FOR THE HEALTH NETWORK 21 691 22 950 24 718 26 250
Proportion of user fee revenues in relation to total funding 5.9% 6.0% 5.4% 5.3%
Report on the Funding of Public Services H.27
HSection
In 2008-2009, the contribution from accommodated adults stood at $682 million and represented 69.5% of revenues stemming from health care delivery, making it the main source of user fee revenues. Every change in this contribution directly affects the proportion of user fee revenues.
Revenues generated by auxiliary and commercial operations are used to self-finance expenditures unrelated to health care delivery. These revenue categories include, in particular, cafeteria and parking operations, television rentals and medical instruction.
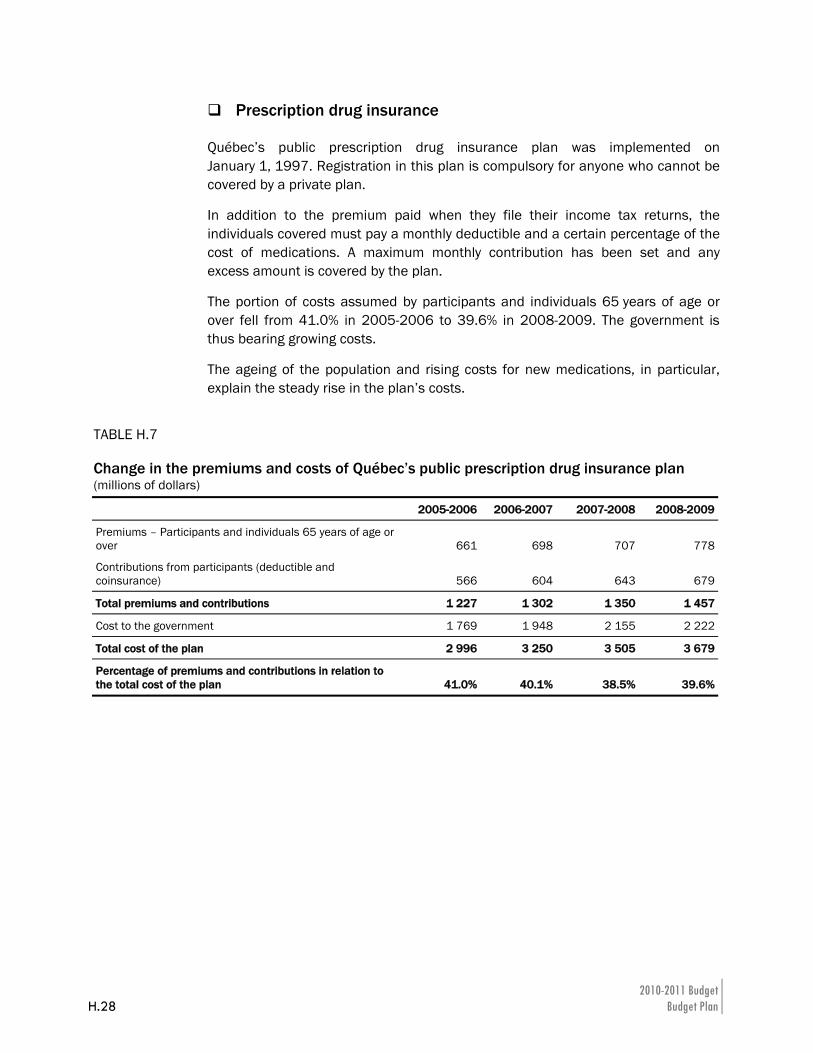
2010-2011 Budget H.28 Budget Plan
Prescription drug insurance
Québec’s public prescription drug insurance plan was implemented on January 1, 1997. Registration in this plan is compulsory for anyone who cannot be covered by a private plan.
In addition to the premium paid when they file their income tax returns, the individuals covered must pay a monthly deductible and a certain percentage of the cost of medications. A maximum monthly contribution has been set and any excess amount is covered by the plan.
The portion of costs assumed by participants and individuals 65 years of age or over fell from 41.0% in 2005-2006 to 39.6% in 2008-2009. The government is thus bearing growing costs.
The ageing of the population and rising costs for new medications, in particular, explain the steady rise in the plan’s costs.
TABLE H.7 Change in the premiums and costs of Québec’s public prescription drug insurance plan (millions of dollars)
2005-2006 2006-2007 2007-2008 2008-2009
Premiums – Participants and individuals 65 years of age or over 661 698 707 778
Contributions from participants (deductible and coinsurance) 566 604 643 679
Total premiums and contributions 1 227 1 302 1 350 1 457
Cost to the government 1 769 1 948 2 155 2 222
Total cost of the plan 2 996 3 250 3 505 3 679
Percentage of premiums and contributions in relation to the total cost of the plan 41.0% 40.1% 38.5% 39.6%
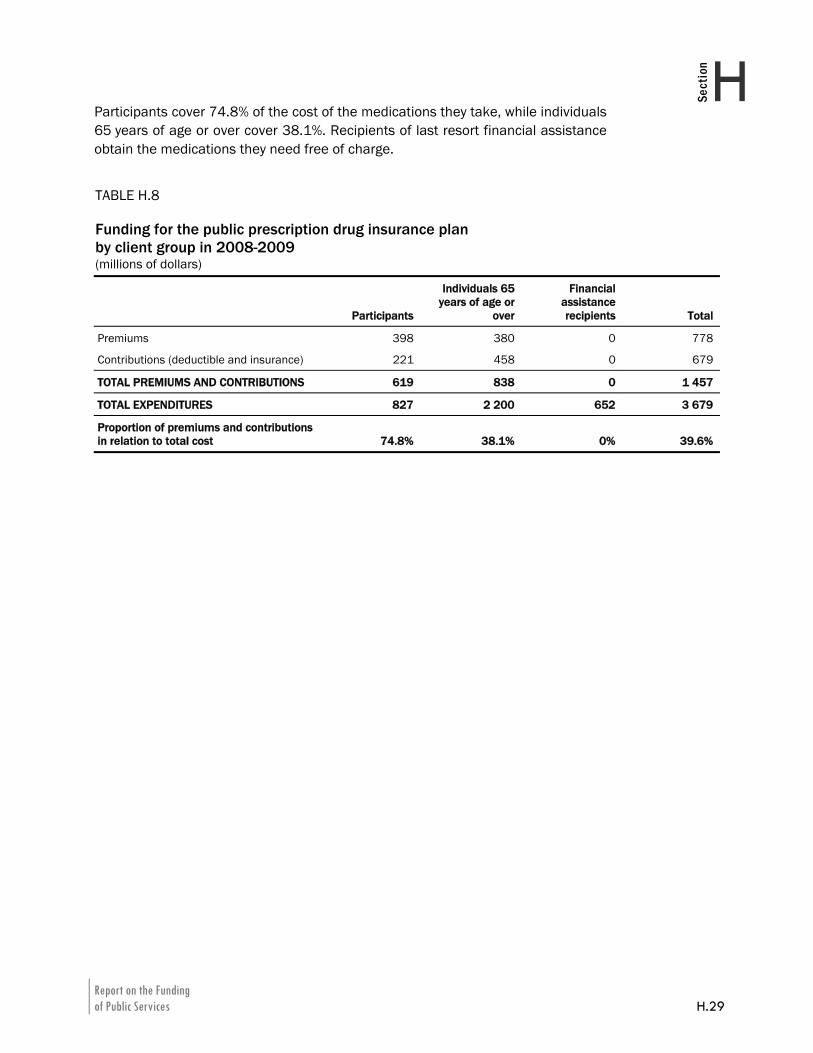
Report on the Funding of Public Services H.29
HSection
Participants cover 74.8% of the cost of the medications they take, while individuals 65 years of age or over cover 38.1%. Recipients of last resort financial assistance obtain the medications they need free of charge.
TABLE H.8 Funding for the public prescription drug insurance plan by client group in 2008-2009 (millions of dollars)
Participants
Individuals 65 years of age or
over
Financial assistance recipients Total
Premiums 398 380 0 778
Contributions (deductible and insurance) 221 458 0 679
TOTAL PREMIUMS AND CONTRIBUTIONS 619 838 0 1 457
TOTAL EXPENDITURES 827 2 200 652 3 679
Proportion of premiums and contributions in relation to total cost 74.8% 38.1% 0% 39.6%
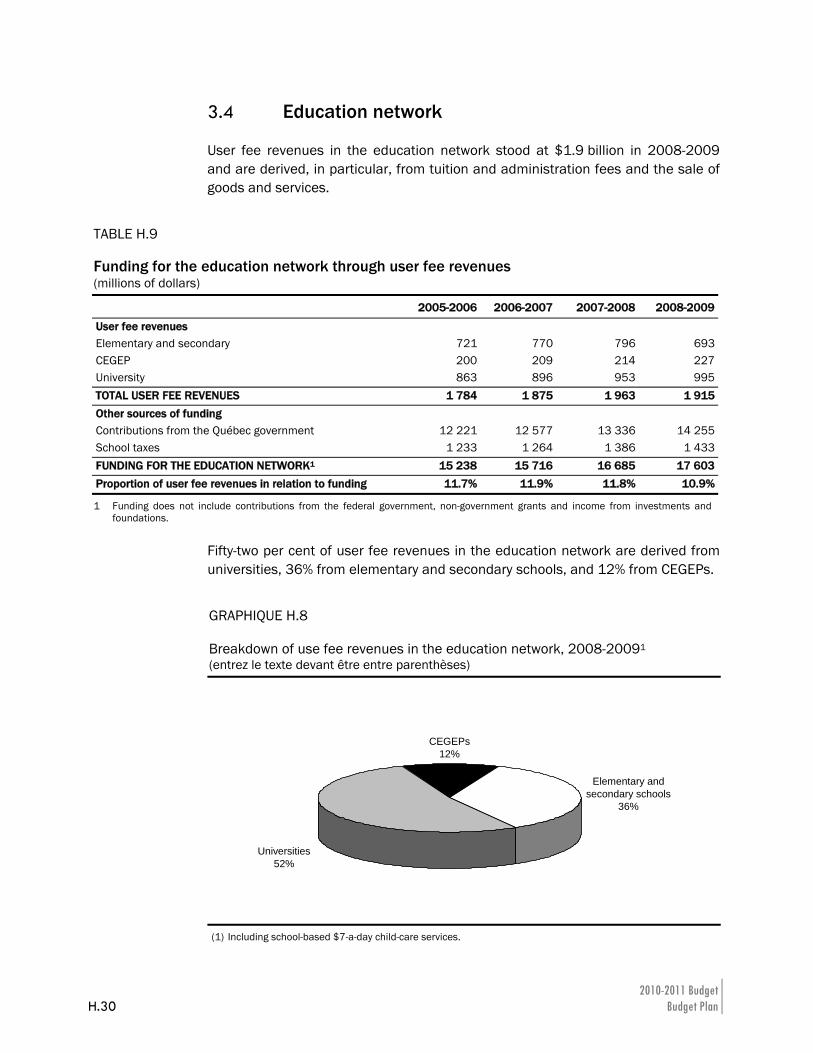
2010-2011 Budget H.30 Budget Plan
3.4 Education network
User fee revenues in the education network stood at $1.9 billion in 2008-2009 and are derived, in particular, from tuition and administration fees and the sale of goods and services.
Fifty-two per cent of user fee revenues in the education network are derived from universities, 36% from elementary and secondary schools, and 12% from CEGEPs.
GRAPHIQUE H.8 Breakdown of use fee revenues in the education network, 2008-20091 (entrez le texte devant être entre parenthèses)
Universities52%
Elementary and secondary schools
36%
CEGEPs12%
(1) Including school-based $7-a-day child-care services.
TABLE H.9 Funding for the education network through user fee revenues (millions of dollars)
2005-2006 2006-2007 2007-2008 2008-2009
User fee revenues Elementary and secondary 721 770 796 693CEGEP 200 209 214 227University 863 896 953 995TOTAL USER FEE REVENUES 1 784 1 875 1 963 1 915Other sources of funding Contributions from the Québec government 12 221 12 577 13 336 14 255School taxes 1 233 1 264 1 386 1 433FUNDING FOR THE EDUCATION NETWORK1 15 238 15 716 16 685 17 603Proportion of user fee revenues in relation to funding 11.7% 11.9% 11.8% 10.9%
1 Funding does not include contributions from the federal government, non-government grants and income from investments and foundations.
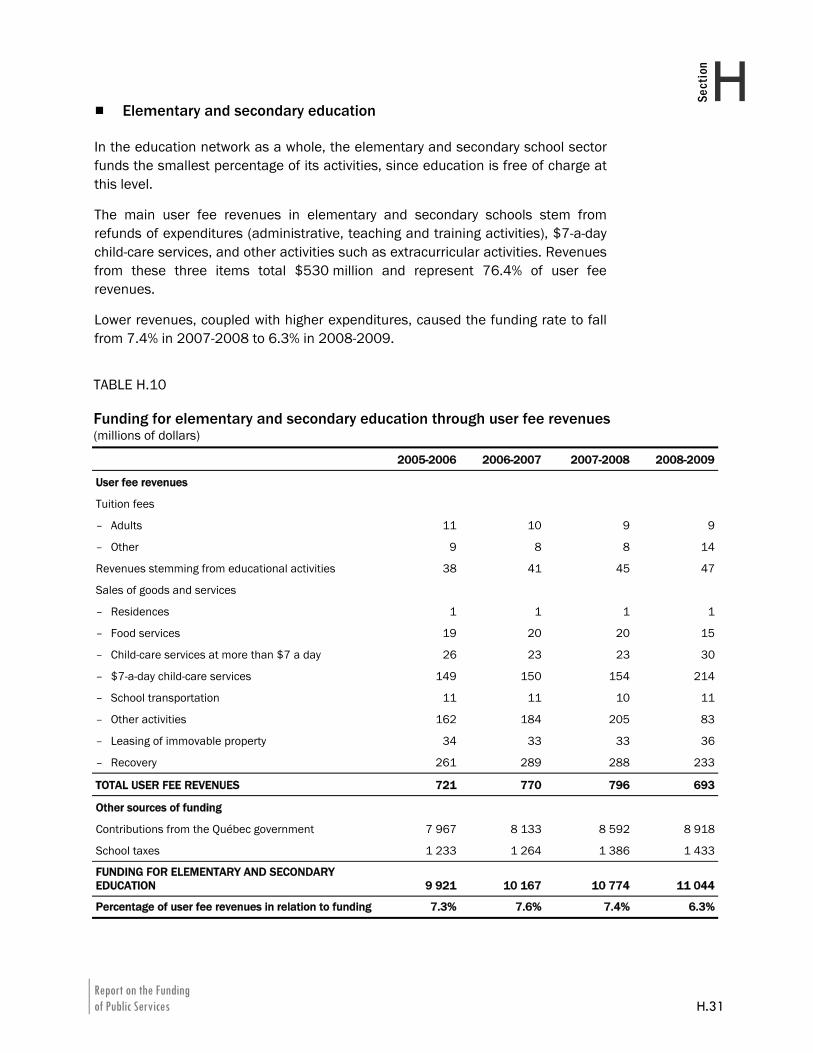
Report on the Funding of Public Services H.31
HSection
Elementary and secondary education
In the education network as a whole, the elementary and secondary school sector funds the smallest percentage of its activities, since education is free of charge at this level.
The main user fee revenues in elementary and secondary schools stem from refunds of expenditures (administrative, teaching and training activities), $7-a-day child-care services, and other activities such as extracurricular activities. Revenues from these three items total $530 million and represent 76.4% of user fee revenues.
Lower revenues, coupled with higher expenditures, caused the funding rate to fall from 7.4% in 2007-2008 to 6.3% in 2008-2009.
TABLE H.10 Funding for elementary and secondary education through user fee revenues (millions of dollars)
2005-2006 2006-2007 2007-2008 2008-2009
User fee revenues
Tuition fees
– Adults 11 10 9 9
– Other 9 8 8 14
Revenues stemming from educational activities 38 41 45 47
Sales of goods and services
– Residences 1 1 1 1
– Food services 19 20 20 15
– Child-care services at more than $7 a day 26 23 23 30
– $7-a-day child-care services 149 150 154 214
– School transportation 11 11 10 11
– Other activities 162 184 205 83
– Leasing of immovable property 34 33 33 36
– Recovery 261 289 288 233
TOTAL USER FEE REVENUES 721 770 796 693
Other sources of funding
Contributions from the Québec government 7 967 8 133 8 592 8 918
School taxes 1 233 1 264 1 386 1 433
FUNDING FOR ELEMENTARY AND SECONDARY EDUCATION 9 921 10 167 10 774 11 044
Percentage of user fee revenues in relation to funding 7.3% 7.6% 7.4% 6.3%
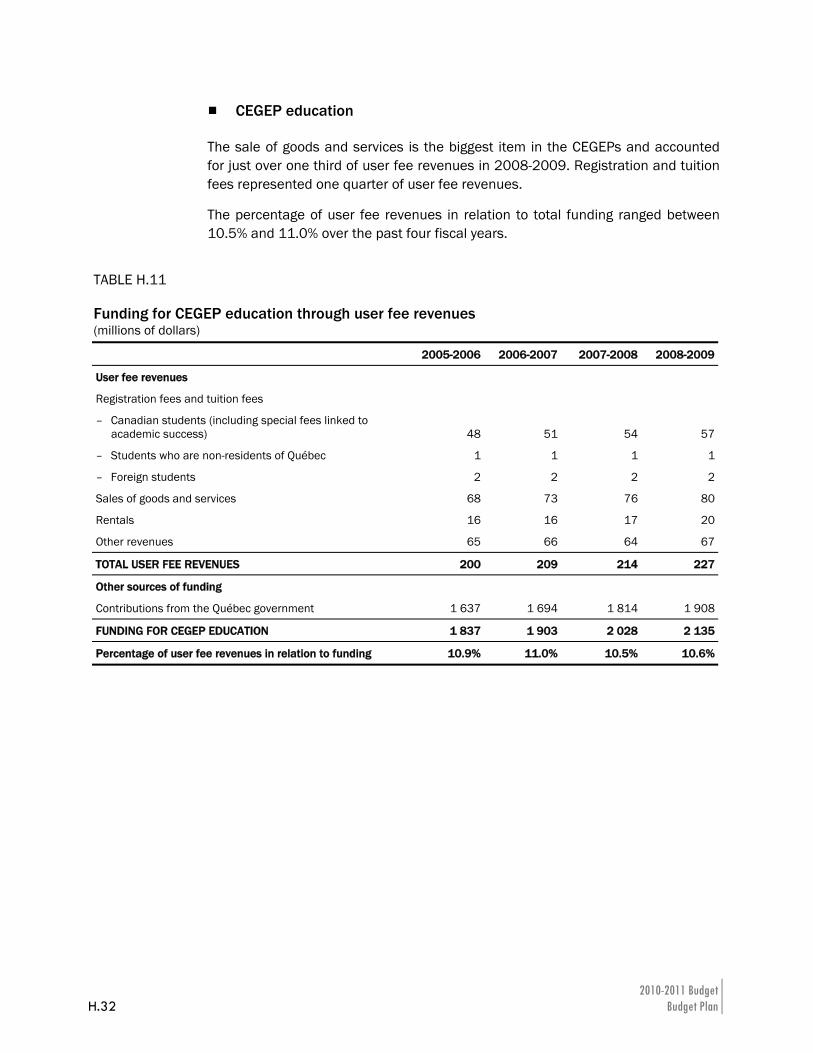
2010-2011 Budget H.32 Budget Plan
CEGEP education
The sale of goods and services is the biggest item in the CEGEPs and accounted for just over one third of user fee revenues in 2008-2009. Registration and tuition fees represented one quarter of user fee revenues.
The percentage of user fee revenues in relation to total funding ranged between 10.5% and 11.0% over the past four fiscal years.
TABLE H.11 Funding for CEGEP education through user fee revenues (millions of dollars)
2005-2006 2006-2007 2007-2008 2008-2009
User fee revenues
Registration fees and tuition fees
– Canadian students (including special fees linked to academic success) 48 51 54 57
– Students who are non-residents of Québec 1 1 1 1
– Foreign students 2 2 2 2
Sales of goods and services 68 73 76 80
Rentals 16 16 17 20
Other revenues 65 66 64 67
TOTAL USER FEE REVENUES 200 209 214 227
Other sources of funding
Contributions from the Québec government 1 637 1 694 1 814 1 908
FUNDING FOR CEGEP EDUCATION 1 837 1 903 2 028 2 135
Percentage of user fee revenues in relation to funding 10.9% 11.0% 10.5% 10.6%
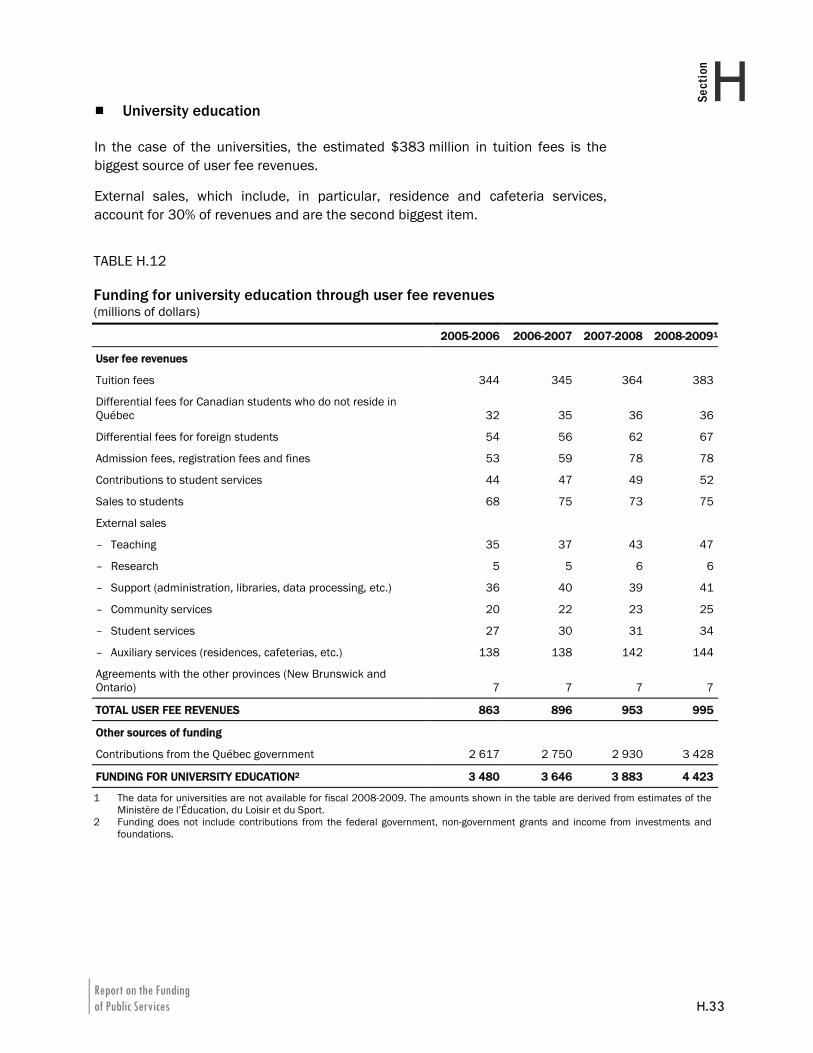
Report on the Funding of Public Services H.33
HSection
University education
In the case of the universities, the estimated $383 million in tuition fees is the biggest source of user fee revenues.
External sales, which include, in particular, residence and cafeteria services, account for 30% of revenues and are the second biggest item.
TABLE H.12 Funding for university education through user fee revenues (millions of dollars)
2005-2006 2006-2007 2007-2008 2008-20091
User fee revenues
Tuition fees 344 345 364 383
Differential fees for Canadian students who do not reside in Québec 32 35 36 36
Differential fees for foreign students 54 56 62 67
Admission fees, registration fees and fines 53 59 78 78
Contributions to student services 44 47 49 52
Sales to students 68 75 73 75
External sales
– Teaching 35 37 43 47
– Research 5 5 6 6
– Support (administration, libraries, data processing, etc.) 36 40 39 41
– Community services 20 22 23 25
– Student services 27 30 31 34
– Auxiliary services (residences, cafeterias, etc.) 138 138 142 144
Agreements with the other provinces (New Brunswick and Ontario) 7 7 7 7
TOTAL USER FEE REVENUES 863 896 953 995
Other sources of funding
Contributions from the Québec government 2 617 2 750 2 930 3 428
FUNDING FOR UNIVERSITY EDUCATION2 3 480 3 646 3 883 4 423
1 The data for universities are not available for fiscal 2008-2009. The amounts shown in the table are derived from estimates of the Ministère de l’Éducation, du Loisir et du Sport.
2 Funding does not include contributions from the federal government, non-government grants and income from investments and foundations.
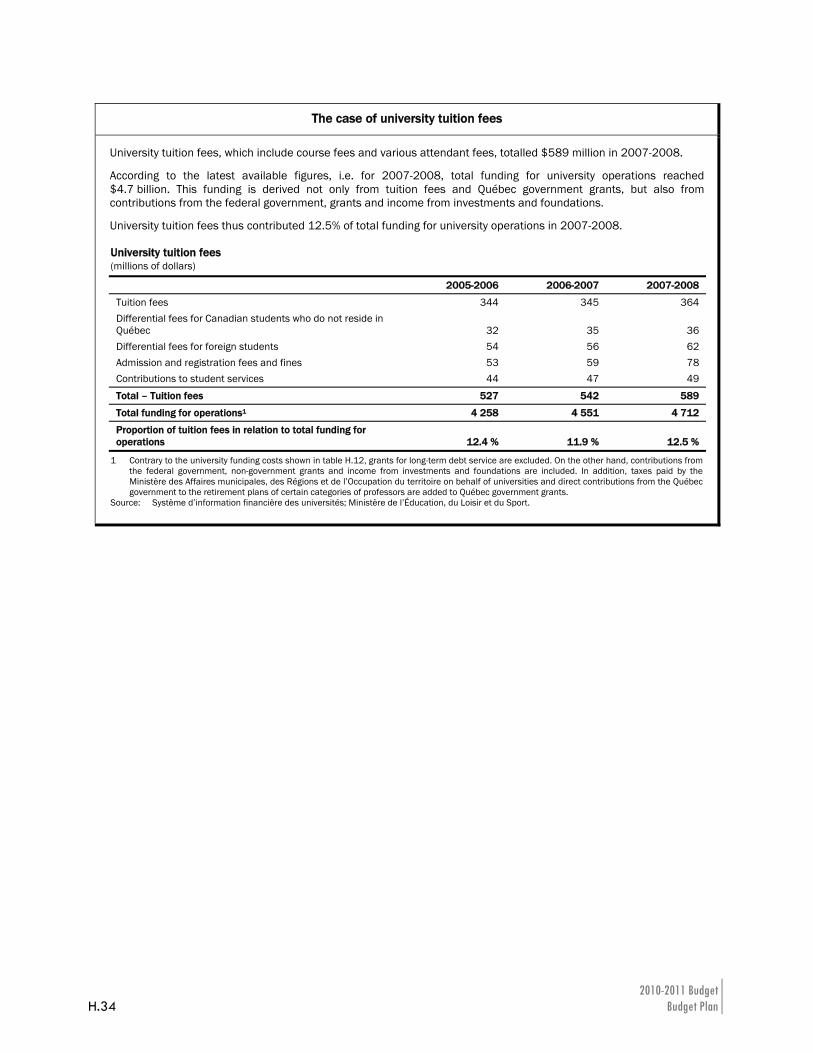
2010-2011 Budget H.34 Budget Plan
The case of university tuition fees
University tuition fees, which include course fees and various attendant fees, totalled $589 million in 2007-2008.
According to the latest available figures, i.e. for 2007-2008, total funding for university operations reached $4.7 billion. This funding is derived not only from tuition fees and Québec government grants, but also from contributions from the federal government, grants and income from investments and foundations.
University tuition fees thus contributed 12.5% of total funding for university operations in 2007-2008.
University tuition fees (millions of dollars)
2005-2006 2006-2007 2007-2008
Tuition fees 344 345 364 Differential fees for Canadian students who do not reside in Québec 32 35 36 Differential fees for foreign students 54 56 62 Admission and registration fees and fines 53 59 78 Contributions to student services 44 47 49
Total – Tuition fees 527 542 589
Total funding for operations1 4 258 4 551 4 712
Proportion of tuition fees in relation to total funding for operations 12.4 % 11.9 % 12.5 %
1 Contrary to the university funding costs shown in table H.12, grants for long-term debt service are excluded. On the other hand, contributions from the federal government, non-government grants and income from investments and foundations are included. In addition, taxes paid by the Ministère des Affaires municipales, des Régions et de l’Occupation du territoire on behalf of universities and direct contributions from the Québec government to the retirement plans of certain categories of professors are added to Québec government grants.
Source: Système d’information financière des universités; Ministère de l’Éducation, du Loisir et du Sport.
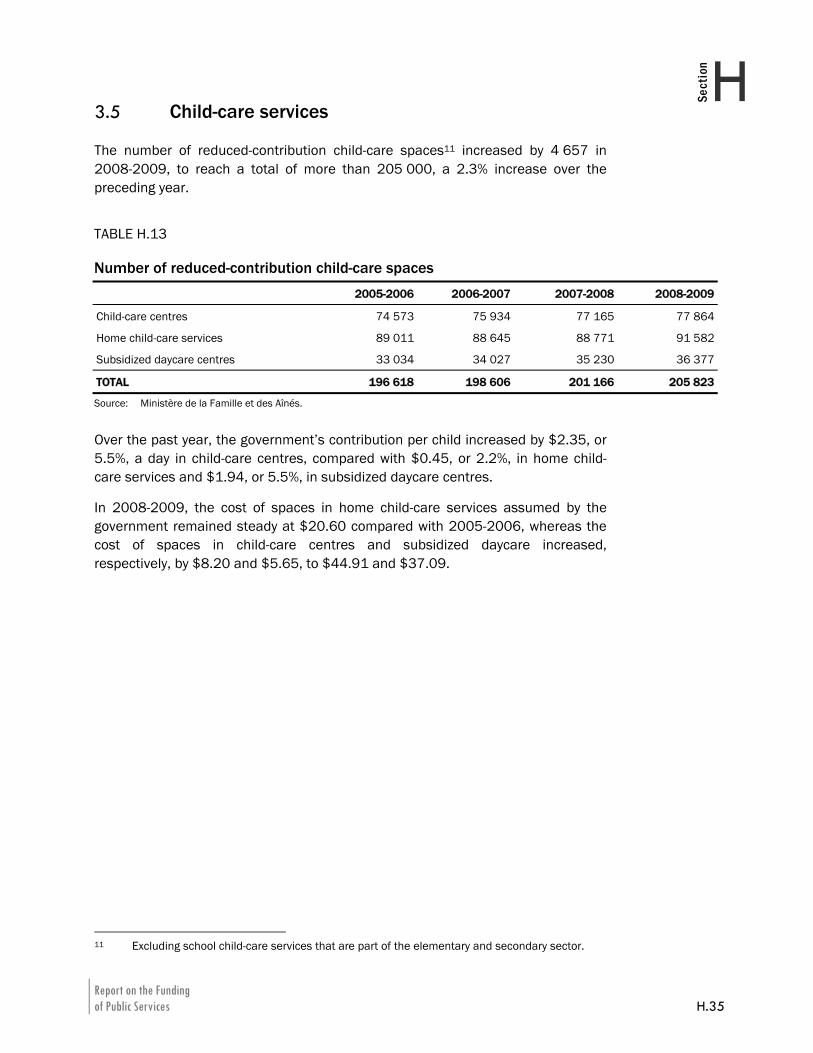
Report on the Funding of Public Services H.35
HSection
3.5 Child-care services
The number of reduced-contribution child-care spaces11 increased by 4 657 in 2008-2009, to reach a total of more than 205 000, a 2.3% increase over the preceding year.
Over the past year, the government’s contribution per child increased by $2.35, or 5.5%, a day in child-care centres, compared with $0.45, or 2.2%, in home child-care services and $1.94, or 5.5%, in subsidized daycare centres.
In 2008-2009, the cost of spaces in home child-care services assumed by the government remained steady at $20.60 compared with 2005-2006, whereas the cost of spaces in child-care centres and subsidized daycare increased, respectively, by $8.20 and $5.65, to $44.91 and $37.09.
11 Excluding school child-care services that are part of the elementary and secondary sector.
TABLE H.13 Number of reduced-contribution child-care spaces
2005-2006 2006-2007 2007-2008 2008-2009
Child-care centres 74 573 75 934 77 165 77 864
Home child-care services 89 011 88 645 88 771 91 582
Subsidized daycare centres 33 034 34 027 35 230 36 377
TOTAL 196 618 198 606 201 166 205 823
Source: Ministère de la Famille et des Aînés.
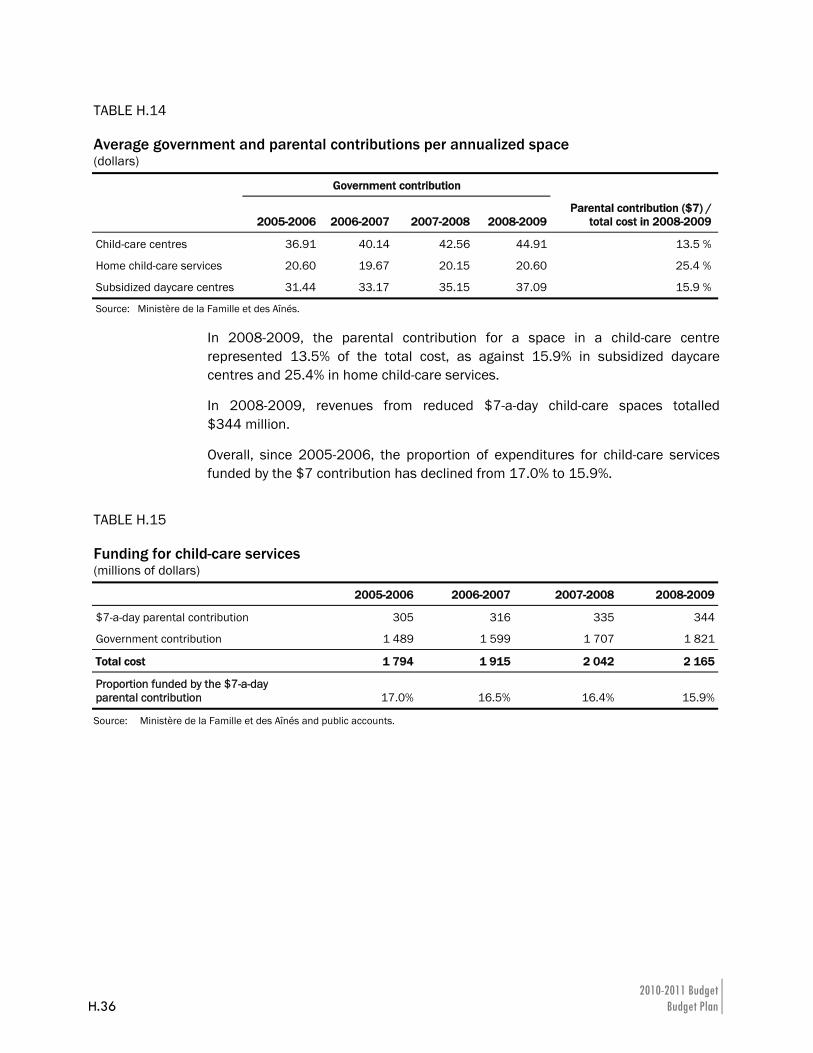
2010-2011 Budget H.36 Budget Plan
In 2008-2009, the parental contribution for a space in a child-care centre represented 13.5% of the total cost, as against 15.9% in subsidized daycare centres and 25.4% in home child-care services.
In 2008-2009, revenues from reduced $7-a-day child-care spaces totalled $344 million.
Overall, since 2005-2006, the proportion of expenditures for child-care services funded by the $7 contribution has declined from 17.0% to 15.9%.
TABLE H.14 Average government and parental contributions per annualized space (dollars)
Government contribution
2005-2006 2006-2007 2007-2008 2008-2009Parental contribution ($7) /
total cost in 2008-2009
Child-care centres 36.91 40.14 42.56 44.91 13.5 %
Home child-care services 20.60 19.67 20.15 20.60 25.4 %
Subsidized daycare centres 31.44 33.17 35.15 37.09 15.9 %
Source: Ministère de la Famille et des Aînés.
TABLE H.15 Funding for child-care services (millions of dollars)
2005-2006 2006-2007 2007-2008 2008-2009
$7-a-day parental contribution 305 316 335 344
Government contribution 1 489 1 599 1 707 1 821
Total cost 1 794 1 915 2 042 2 165
Proportion funded by the $7-a-day parental contribution 17.0% 16.5% 16.4% 15.9%
Source: Ministère de la Famille et des Aînés and public accounts.
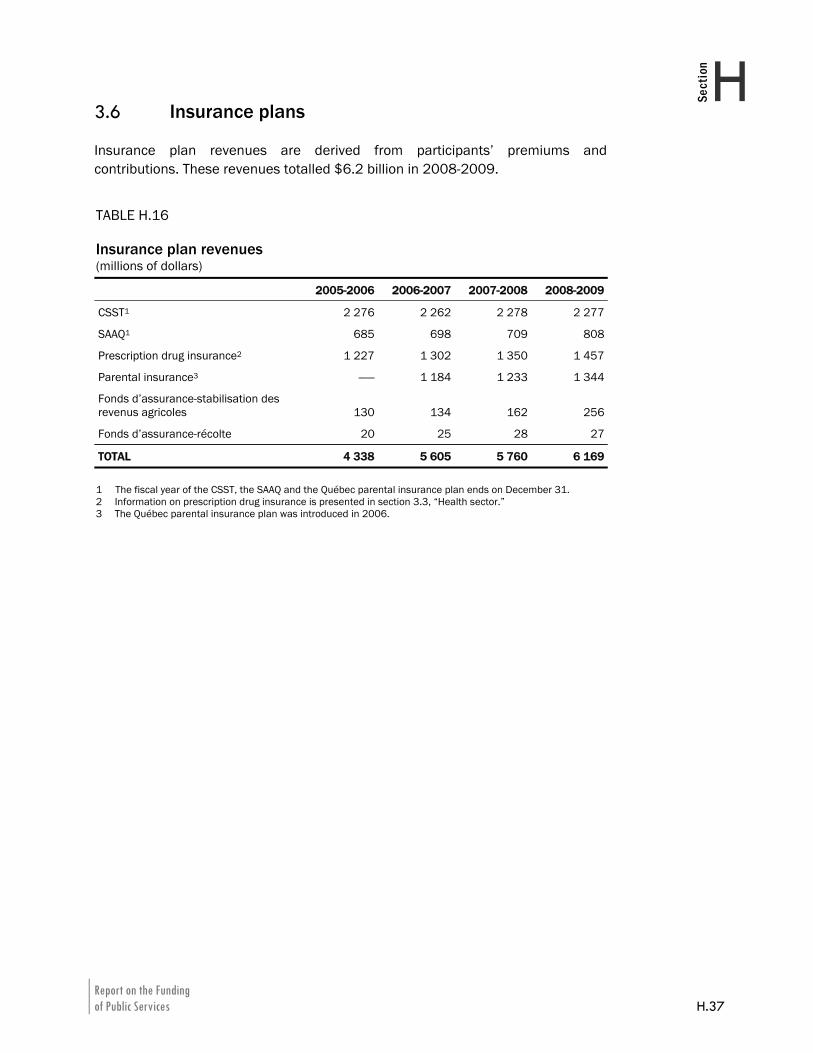
Report on the Funding of Public Services H.37
HSection
3.6 Insurance plans
Insurance plan revenues are derived from participants’ premiums and contributions. These revenues totalled $6.2 billion in 2008-2009.
TABLE H.16 Insurance plan revenues (millions of dollars)
2005-2006 2006-2007 2007-2008 2008-2009
CSST1 2 276 2 262 2 278 2 277
SAAQ1 685 698 709 808
Prescription drug insurance2 1 227 1 302 1 350 1 457
Parental insurance3 —— 1 184 1 233 1 344
Fonds d’assurance-stabilisation des revenus agricoles 130 134 162 256
Fonds d’assurance-récolte 20 25 28 27
TOTAL 4 338 5 605 5 760 6 169
1 The fiscal year of the CSST, the SAAQ and the Québec parental insurance plan ends on December 31. 2 Information on prescription drug insurance is presented in section 3.3, “Health sector.” 3 The Québec parental insurance plan was introduced in 2006.
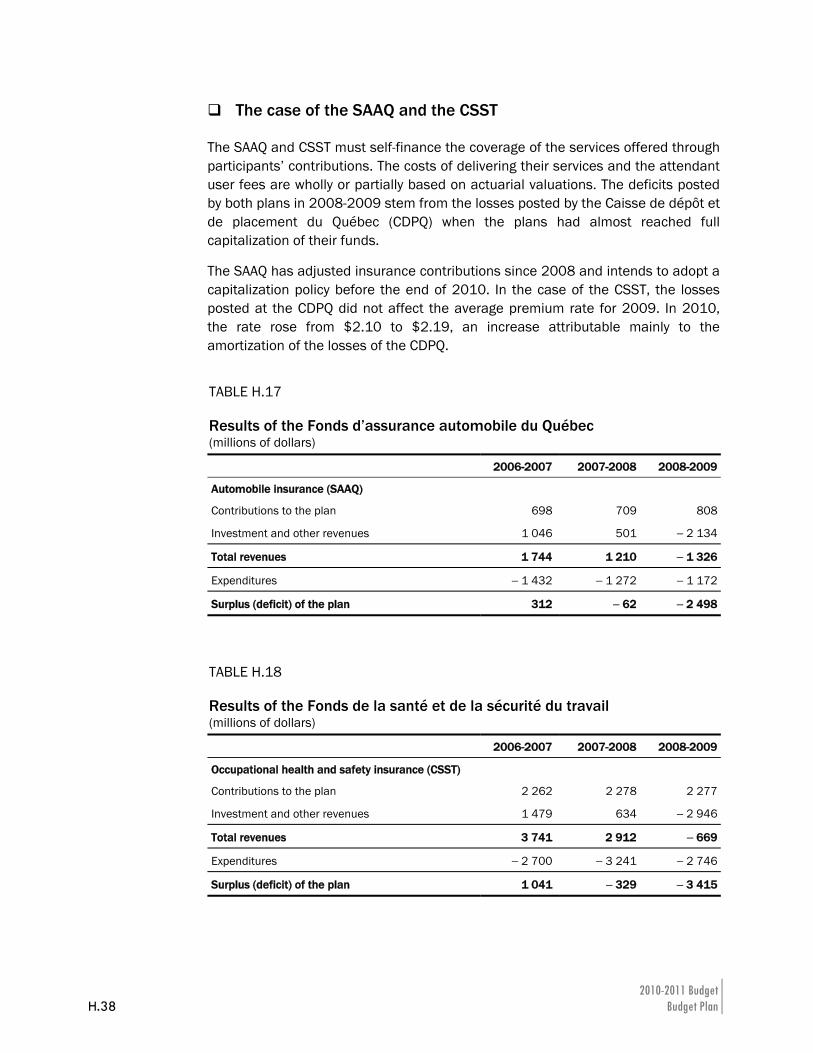
2010-2011 Budget H.38 Budget Plan
The case of the SAAQ and the CSST
The SAAQ and CSST must self-finance the coverage of the services offered through participants’ contributions. The costs of delivering their services and the attendant user fees are wholly or partially based on actuarial valuations. The deficits posted by both plans in 2008-2009 stem from the losses posted by the Caisse de dépôt et de placement du Québec (CDPQ) when the plans had almost reached full capitalization of their funds.
The SAAQ has adjusted insurance contributions since 2008 and intends to adopt a capitalization policy before the end of 2010. In the case of the CSST, the losses posted at the CDPQ did not affect the average premium rate for 2009. In 2010, the rate rose from $2.10 to $2.19, an increase attributable mainly to the amortization of the losses of the CDPQ.
TABLE H.17 Results of the Fonds d’assurance automobile du Québec (millions of dollars)
2006-2007 2007-2008 2008-2009
Automobile insurance (SAAQ)
Contributions to the plan 698 709 808
Investment and other revenues 1 046 501 − 2 134
Total revenues 1 744 1 210 − 1 326
Expenditures − 1 432 − 1 272 − 1 172
Surplus (deficit) of the plan 312 − 62 − 2 498
TABLE H.18 Results of the Fonds de la santé et de la sécurité du travail (millions of dollars)
2006-2007 2007-2008 2008-2009
Occupational health and safety insurance (CSST)
Contributions to the plan 2 262 2 278 2 277
Investment and other revenues 1 479 634 − 2 946
Total revenues 3 741 2 912 − 669
Expenditures − 2 700 − 3 241 − 2 746
Surplus (deficit) of the plan 1 041 − 329 − 3 415
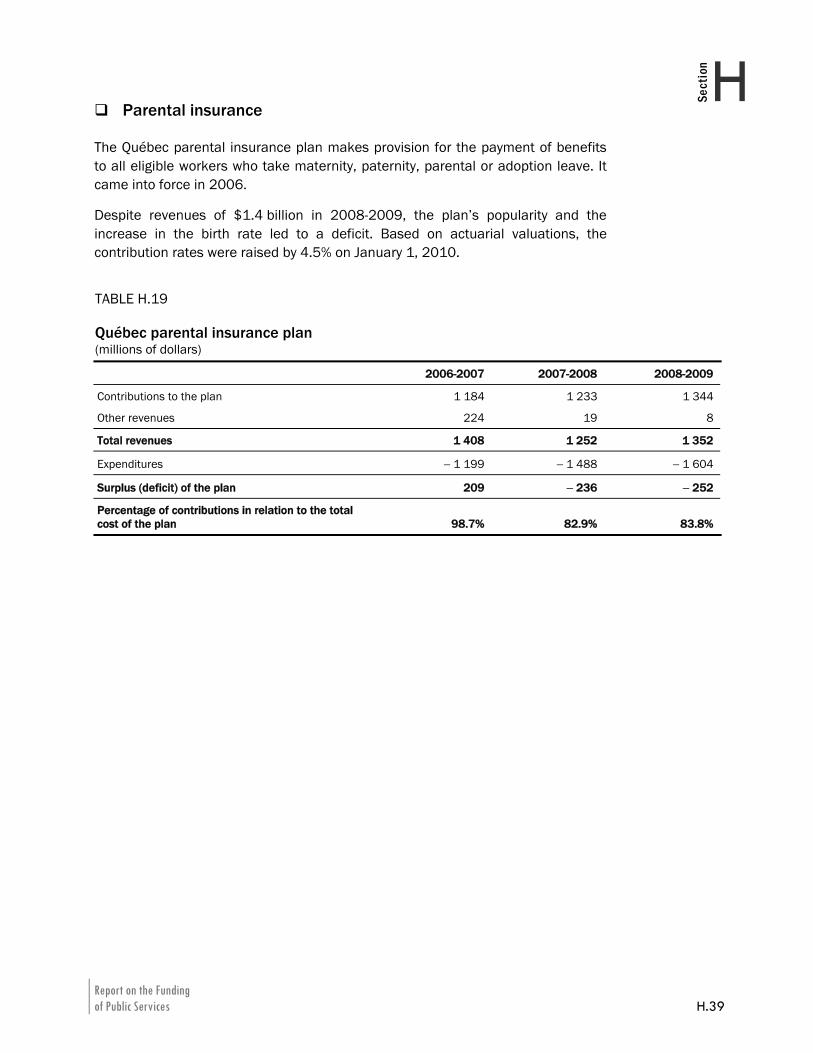
Report on the Funding of Public Services H.39
HSection
Parental insurance
The Québec parental insurance plan makes provision for the payment of benefits to all eligible workers who take maternity, paternity, parental or adoption leave. It came into force in 2006.
Despite revenues of $1.4 billion in 2008-2009, the plan’s popularity and the increase in the birth rate led to a deficit. Based on actuarial valuations, the contribution rates were raised by 4.5% on January 1, 2010.
TABLE H.19 Québec parental insurance plan (millions of dollars)
2006-2007 2007-2008 2008-2009
Contributions to the plan 1 184 1 233 1 344
Other revenues 224 19 8
Total revenues 1 408 1 252 1 352
Expenditures − 1 199 − 1 488 − 1 604
Surplus (deficit) of the plan 209 − 236 − 252
Percentage of contributions in relation to the total cost of the plan 98.7% 82.9% 83.8%
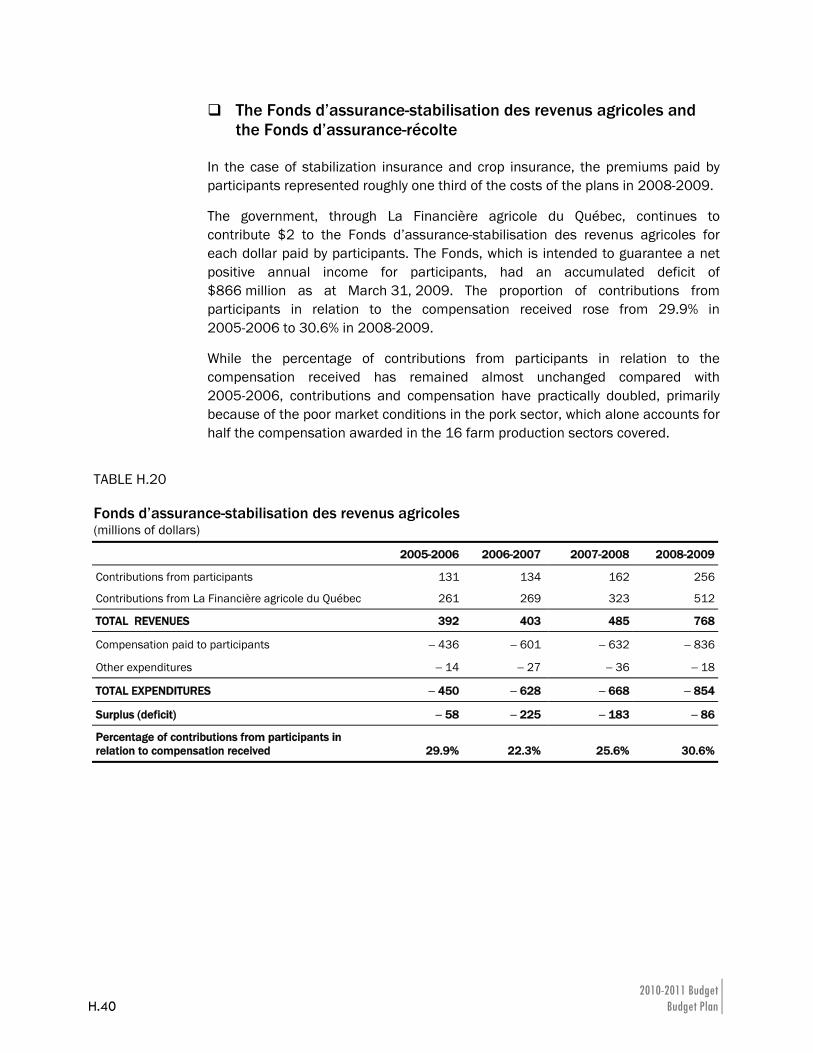
2010-2011 Budget H.40 Budget Plan
The Fonds d’assurance-stabilisation des revenus agricoles and the Fonds d’assurance-récolte
In the case of stabilization insurance and crop insurance, the premiums paid by participants represented roughly one third of the costs of the plans in 2008-2009.
The government, through La Financière agricole du Québec, continues to contribute $2 to the Fonds d’assurance-stabilisation des revenus agricoles for each dollar paid by participants. The Fonds, which is intended to guarantee a net positive annual income for participants, had an accumulated deficit of $866 million as at March 31, 2009. The proportion of contributions from participants in relation to the compensation received rose from 29.9% in 2005-2006 to 30.6% in 2008-2009.
While the percentage of contributions from participants in relation to the compensation received has remained almost unchanged compared with 2005-2006, contributions and compensation have practically doubled, primarily because of the poor market conditions in the pork sector, which alone accounts for half the compensation awarded in the 16 farm production sectors covered.
TABLE H.20 Fonds d’assurance-stabilisation des revenus agricoles (millions of dollars)
2005-2006 2006-2007 2007-2008 2008-2009
Contributions from participants 131 134 162 256
Contributions from La Financière agricole du Québec 261 269 323 512
TOTAL REVENUES 392 403 485 768
Compensation paid to participants − 436 − 601 − 632 − 836
Other expenditures − 14 − 27 − 36 − 18
TOTAL EXPENDITURES − 450 − 628 − 668 − 854
Surplus (deficit) − 58 − 225 − 183 − 86
Percentage of contributions from participants in relation to compensation received 29.9% 22.3% 25.6% 30.6%
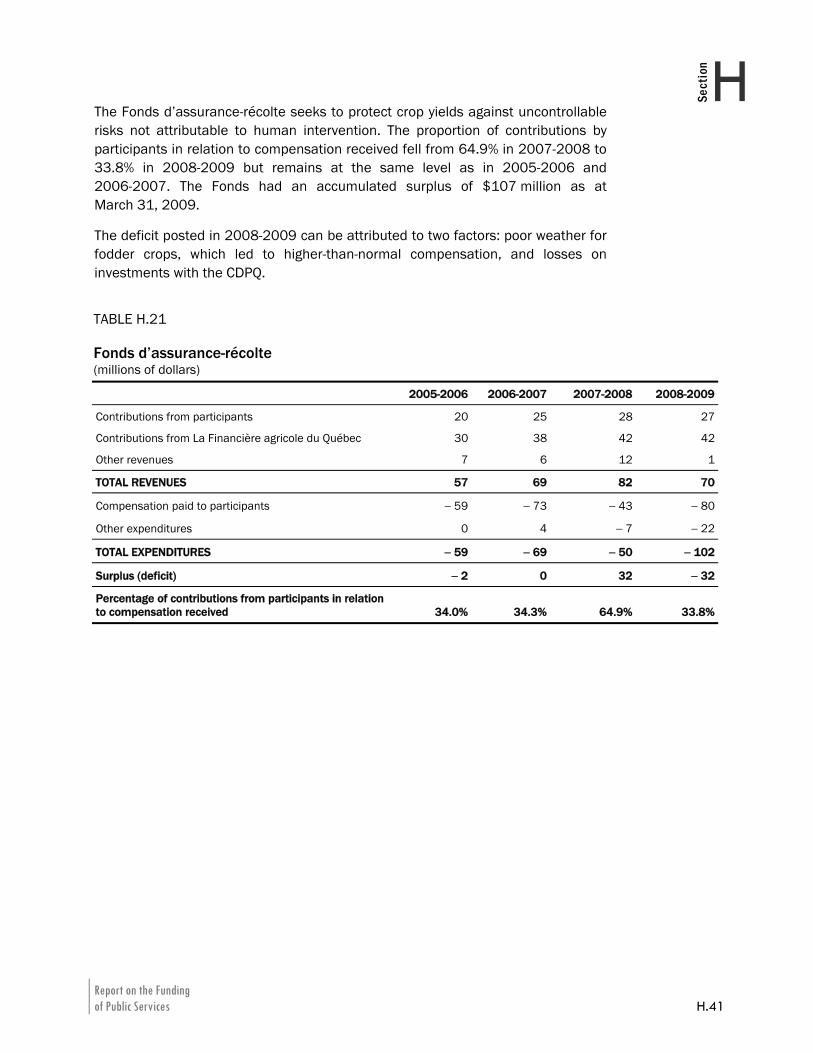
Report on the Funding of Public Services H.41
HSection
The Fonds d’assurance-récolte seeks to protect crop yields against uncontrollable risks not attributable to human intervention. The proportion of contributions by participants in relation to compensation received fell from 64.9% in 2007-2008 to 33.8% in 2008-2009 but remains at the same level as in 2005-2006 and 2006-2007. The Fonds had an accumulated surplus of $107 million as at March 31, 2009.
The deficit posted in 2008-2009 can be attributed to two factors: poor weather for fodder crops, which led to higher-than-normal compensation, and losses on investments with the CDPQ.
TABLE H.21 Fonds d’assurance-récolte (millions of dollars)
2005-2006 2006-2007 2007-2008 2008-2009
Contributions from participants 20 25 28 27
Contributions from La Financière agricole du Québec 30 38 42 42
Other revenues 7 6 12 1
TOTAL REVENUES 57 69 82 70
Compensation paid to participants − 59 − 73 − 43 − 80
Other expenditures 0 4 − 7 − 22
TOTAL EXPENDITURES − 59 − 69 − 50 − 102
Surplus (deficit) − 2 0 32 − 32
Percentage of contributions from participants in relation to compensation received 34.0% 34.3% 64.9% 33.8%
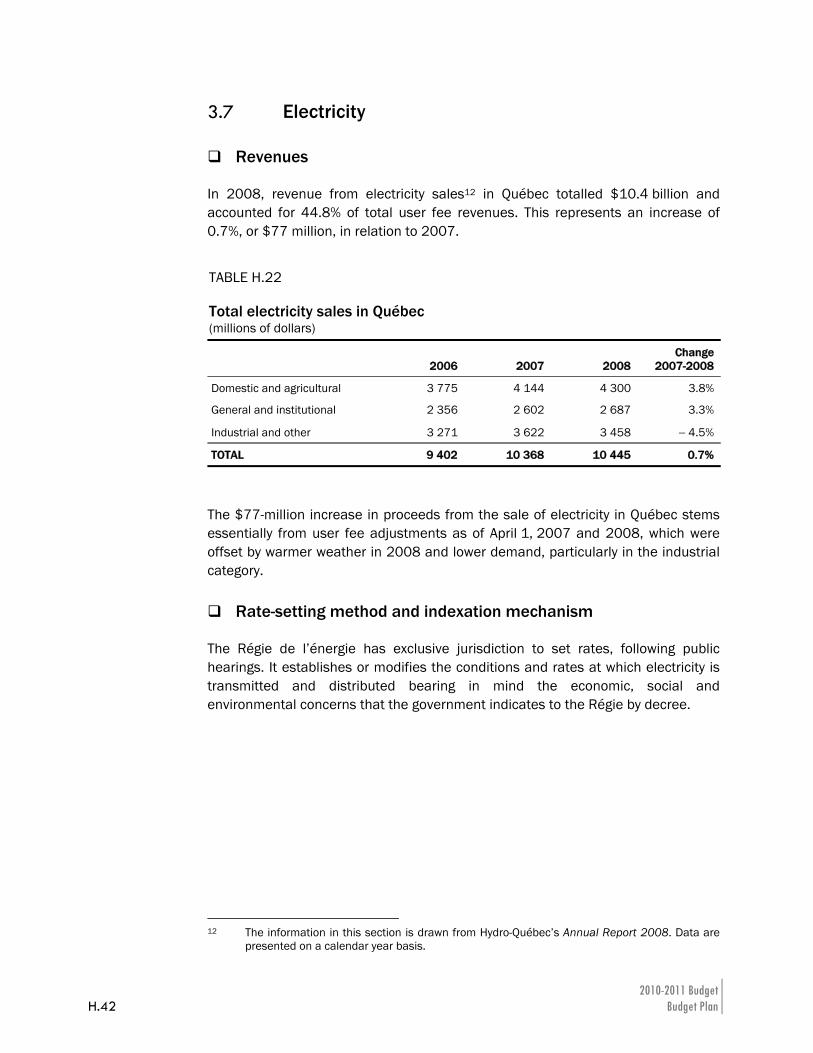
2010-2011 Budget H.42 Budget Plan
3.7 Electricity
Revenues
In 2008, revenue from electricity sales12 in Québec totalled $10.4 billion and accounted for 44.8% of total user fee revenues. This represents an increase of 0.7%, or $77 million, in relation to 2007.
TABLE H.22 Total electricity sales in Québec (millions of dollars)
2006 2007 2008 Change
2007-2008
Domestic and agricultural 3 775 4 144 4 300 3.8%
General and institutional 2 356 2 602 2 687 3.3%
Industrial and other 3 271 3 622 3 458 − 4.5%
TOTAL 9 402 10 368 10 445 0.7%
The $77-million increase in proceeds from the sale of electricity in Québec stems essentially from user fee adjustments as of April 1, 2007 and 2008, which were offset by warmer weather in 2008 and lower demand, particularly in the industrial category.
Rate-setting method and indexation mechanism
The Régie de l’énergie has exclusive jurisdiction to set rates, following public hearings. It establishes or modifies the conditions and rates at which electricity is transmitted and distributed bearing in mind the economic, social and environmental concerns that the government indicates to the Régie by decree.
12 The information in this section is drawn from Hydro-Québec’s Annual Report 2008. Data are
presented on a calendar year basis.
Report on the Funding of Public Services H.43
HSection
Pursuant to the legislative provisions that govern its operations, the Régie de l’énergie sets the rates applicable by Hydro-Québec Distribution to consumers. These rates are based on four components:
⎯ the cost of the electricity that Hydro-Québec Distribution purchases from Hydro-Québec Production or other suppliers (supply cost);
⎯ the transmission cost of such electricity that Hydro-Québec Distribution must pay Hydro-Québec TransÉnergie;
⎯ the cost of distribution to consumers;
⎯ a fair return on Hydro-Québec Distribution’s assets, i.e. the capital that the government shareholder invests in distribution.
However, under the Act respecting the Régie de l’énergie, the cost of electric power is set at 2.79 ¢/kWh for a volume of 165 TWh, which corresponds to the volume of heritage pool consumption.
The rate for sales of post-heritage electricity in excess of 165 TWh in Québec includes the four cost components.
Furthermore, the Régie de l’énergie has a mandate to hand down a decision on requests from Hydro-Québec, which is responsible for requesting electricity rate revisions.

Report on the Funding of Public Services H.45
HSection
4. COMPENSATORY MEASURES ADOPTED BY THE QUÉBEC GOVERNMENT IN FAVOUR OF LOW-INCOME HOUSEHOLDS
4.1 Fiscal measures to support income
Various fiscal measures to support income increase the disposable income of low-income households in Québec:
⎯ the Child Assistance measure, which enhances in particular the incomes of low- and middle-income families;
⎯ the work premium, which encourages beneficiaries of last resort financial assistance programs to integrate the labour market;
⎯ the reimbursement of property taxes, which is intended to reduce the property tax burden borne by low- and middle-income taxpayers who live in areas where the municipal tax burden is relatively high;
⎯ the refundable tax credit in respect of the Québec sales tax, which is intended to lighten the tax burden of low- or middle-income taxpayers;
⎯ the indexation of the personal income tax system.
2010-2011 Budget H.46 Budget Plan
4.2 Specific measures designed to offset increases in certain user fees
Certain more specific measures that have already been implemented offset for low-income households increases in certain user fees.
In the health network, special benefits are granted to the beneficiaries of last resort financial assistance programs to cover certain medical costs.13 The government also offers refundable and non-refundable tax credits for medical expenses.
In the education network, the calculation of student financial assistance in the form of loans and bursaries takes into account the contributions and expenses usually related to pursuing an education, including tuition fees and the students’ and their parents’ income, as the case may be.14
Moreover, beneficiaries of low-cost housing or rent supplements do not devote more than 25% of their income to housing costs. Since the cost of heating is included in the rent, the program assumes part of it.15
⎯ At the same time, through the Shelter Allowance Program, the Québec government offers financial assistance to certain low-income households that allocate too large a part of their budget to housing. Electricity costs are included in the calculation of the financial assistance.
Beneficiaries of last resort financial assistance do not assume any costs for child-care services for the equivalent of two and a half days or five half-days a week.
Seniors and students, who usually have below-average incomes, pay lower rates for public transit.
Beneficiaries of last resort financial assistance programs and certain low-income seniors receive medications free of charge under the public prescription drug insurance plan.
13 For example, transportation by ambulance, orthotic devices, prostheses, eyeglasses and
contact lenses. 14 Interest paid on a student loan also gives rise to entitlement to a non-refundable tax credit. 15 On the other hand, tenants must pay for electricity, i.e. lighting, household appliances, hot
water, and so on.
Report on the Funding of Public Services H.47
HSection
4.3 Measures to maintain purchasing power
Since January 2006, the eligibility thresholds for legal aid have been raised, thus increasing the funds available to low-income households.
On May 1, 2009, the minimum hourly wage was raised by $0.50, from $8.50 to $9.00. As of May 1, 2010, it will be raised again by $0.50 to $9.50.
Since 2005, benefits under the Social Solidarity Program, which targets individuals who have a severely limited capacity for employment, have been indexed at the rate used to index the personal income tax system. Furthermore, since 2009, benefits under the Social Assistance Program, which targets people who are able to work, have also been fully indexed, whereas previously they were indexed at the half rate.
2010-2011 Budget H.48 Budget Plan
TABLE H.23 Summary table of compensatory measures intended for low-income households Compensatory measures
Health network – Special benefits for recipients of last resort financial assistance
– Refundable and non-refundable tax credits for medical expenses
Education network – Student financial assistance
– Tax credit for interest paid on a student loan
Electricity rates – Rent Supplement Program – Low-rental housing
– Shelter Allowance Program
$7-a-day child-care services – No contribution for two and a half days or five half-days a week for persons receiving benefits under last resort financial assistance programs
Public transit – Lower rates for seniors and students
Public prescription drug insurance plan – Free prescription drugs for persons receiving benefits under last resort financial assistance programs
– Premium based on household income
– Claim booklet for workers receiving benefits under last resort financial
assistance programs
– Free prescription drugs for seniors receiving at least 94% of the
Guaranteed Income Supplement
General fiscal measures – Work premium
– Child Assistance measure
– Refundable tax credit for home support for elderly persons
– Indexation of the personal income tax system
– Refundable Québec sales tax credit
– Property tax refund
Other general fiscal measures – Increase in the minimum wage
– Indexation of benefits under last resort financial assistance programs
– Legal aid
Report on the Funding of Public Services H.49
HSection
5. DETAILED REVENUES OF GOVERNMENT DEPARTMENTS AND ORGANIZATIONS The data presented in these appendices are drawn from information collected from all government departments and organizations.
The detailed user fee revenues for government departments and organizations are presented in alphabetical order. These data cover the fiscal years from 2006-2007 to 2008-2009 and concern two categories of revenues, i.e. “fees and permits” and “sales of goods and services.”
Data for government departments include those of their budget-funded bodies, as the case may be, except for the following budget-funded bodies, which are presented separately:
⎯ Régie du logement;
⎯ Commission de protection du territoire agricole du Québec;
⎯ Régie des marchés agricoles et alimentaires du Québec;
⎯ Curateur public du Québec;
⎯ Office de la protection du consommateur;
⎯ Régie des alcools, des courses et des jeux;
⎯ Sureté du Québec;
⎯ Commission des transports du Québec.
Legend
The “indexation” column indicates whether or not the user fee is indexed.
The “fee-setting method” column indicates whether the fee is set:
– according to the market or a comparison with another jurisdiction (MAJ);
– according to the cost method (C);
– according to the cost recovery method (CR);
– by an administrative decision (AD).
Categories of user fee revenues under $500 are not taken into account in these appendices.
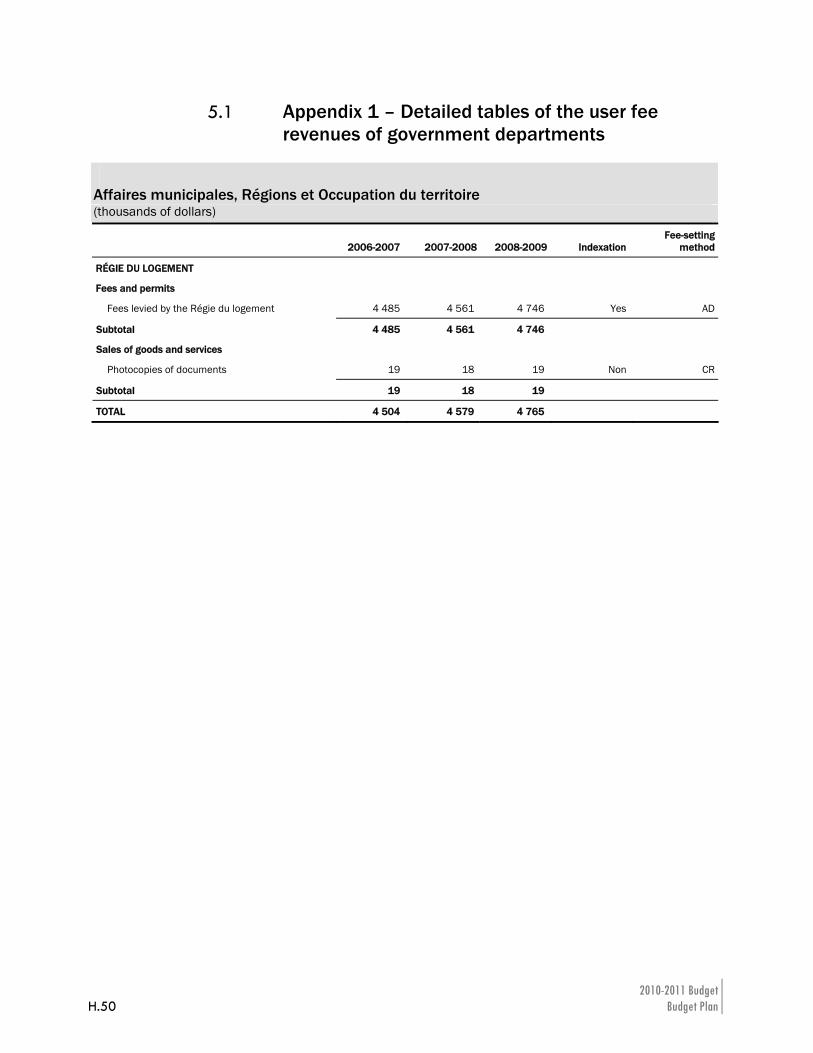
2010-2011 Budget H.50 Budget Plan
5.1 Appendix 1 – Detailed tables of the user fee revenues of government departments
Affaires municipales, Régions et Occupation du territoire (thousands of dollars)
2006-2007 2007-2008 2008-2009 Indexation Fee-setting
method
RÉGIE DU LOGEMENT
Fees and permits
Fees levied by the Régie du logement 4 485 4 561 4 746 Yes AD
Subtotal 4 485 4 561 4 746
Sales of goods and services
Photocopies of documents 19 18 19 Non CR
Subtotal 19 18 19
TOTAL 4 504 4 579 4 765
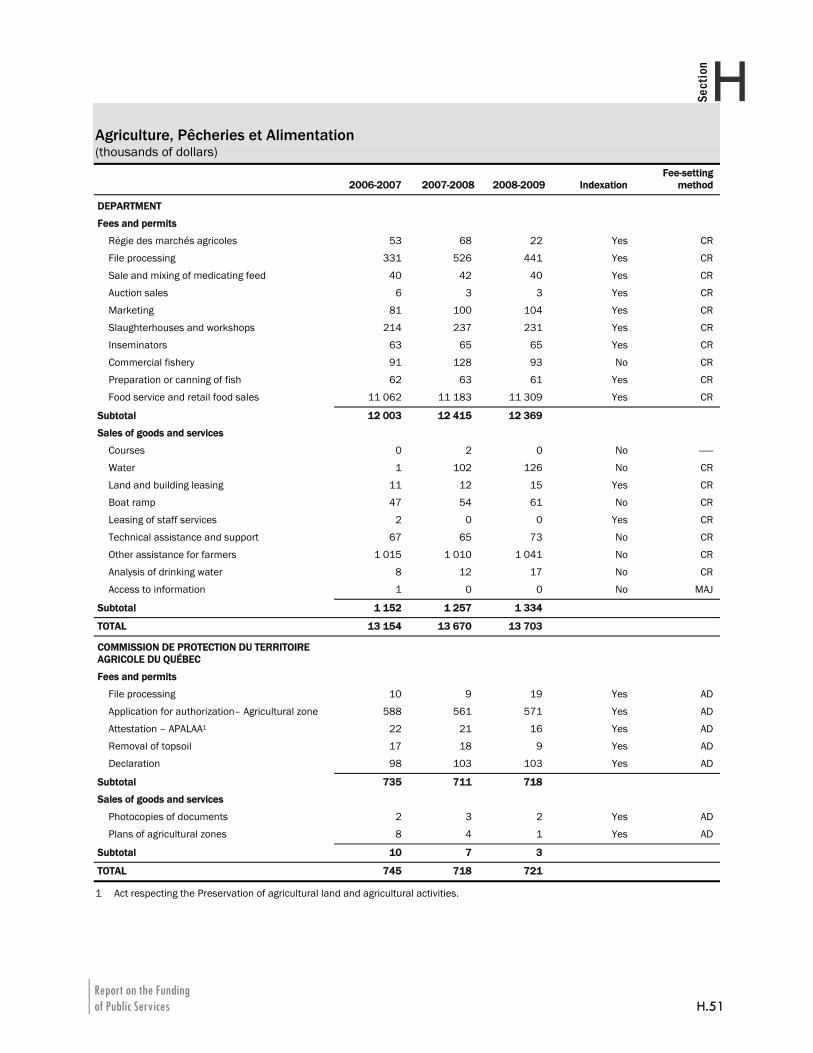
Report on the Funding of Public Services H.51
HSection
Agriculture, Pêcheries et Alimentation (thousands of dollars)
2006-2007 2007-2008 2008-2009 Indexation Fee-setting
method
DEPARTMENT
Fees and permits
Régie des marchés agricoles 53 68 22 Yes CR
File processing 331 526 441 Yes CR
Sale and mixing of medicating feed 40 42 40 Yes CR
Auction sales 6 3 3 Yes CR
Marketing 81 100 104 Yes CR
Slaughterhouses and workshops 214 237 231 Yes CR
Inseminators 63 65 65 Yes CR
Commercial fishery 91 128 93 No CR
Preparation or canning of fish 62 63 61 Yes CR
Food service and retail food sales 11 062 11 183 11 309 Yes CR
Subtotal 12 003 12 415 12 369
Sales of goods and services
Courses 0 2 0 No ——
Water 1 102 126 No CR
Land and building leasing 11 12 15 Yes CR
Boat ramp 47 54 61 No CR
Leasing of staff services 2 0 0 Yes CR
Technical assistance and support 67 65 73 No CR
Other assistance for farmers 1 015 1 010 1 041 No CR
Analysis of drinking water 8 12 17 No CR
Access to information 1 0 0 No MAJ
Subtotal 1 152 1 257 1 334
TOTAL 13 154 13 670 13 703
COMMISSION DE PROTECTION DU TERRITOIRE AGRICOLE DU QUÉBEC
Fees and permits
File processing 10 9 19 Yes AD
Application for authorization– Agricultural zone 588 561 571 Yes AD
Attestation – APALAA1 22 21 16 Yes AD
Removal of topsoil 17 18 9 Yes AD
Declaration 98 103 103 Yes AD
Subtotal 735 711 718
Sales of goods and services
Photocopies of documents 2 3 2 Yes AD
Plans of agricultural zones 8 4 1 Yes AD
Subtotal 10 7 3
TOTAL 745 718 721
1 Act respecting the Preservation of agricultural land and agricultural activities.
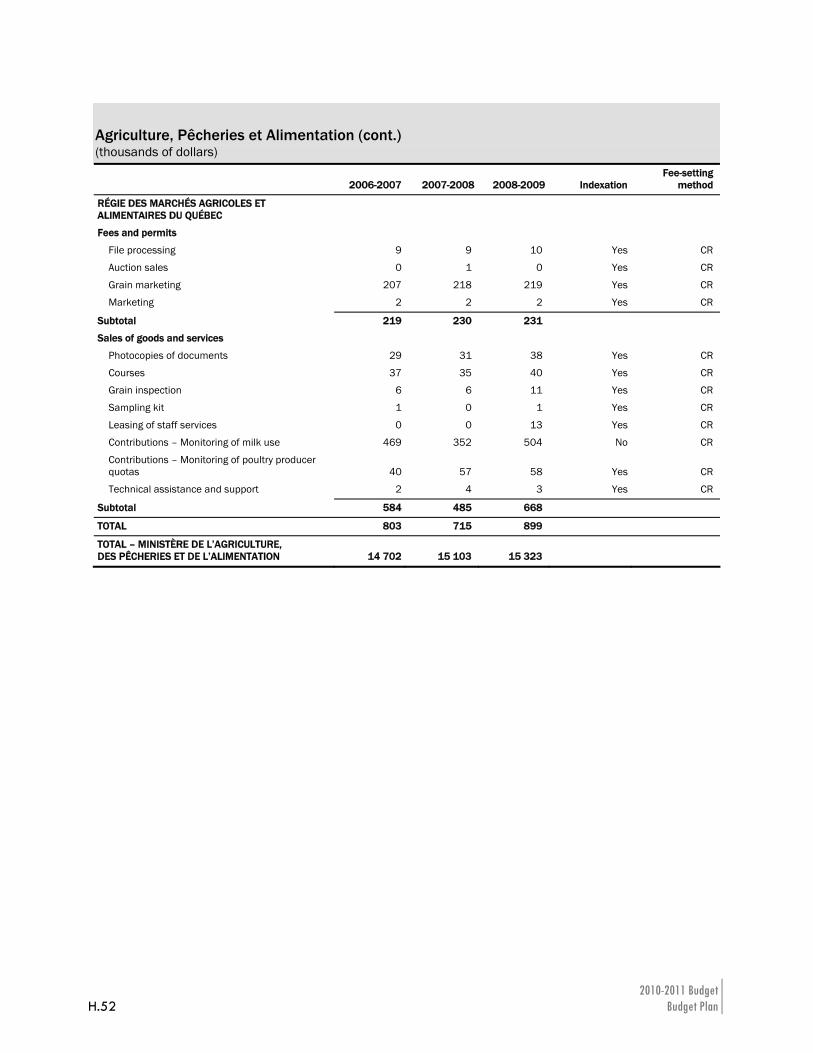
2010-2011 Budget H.52 Budget Plan
Agriculture, Pêcheries et Alimentation (cont.) (thousands of dollars)
2006-2007 2007-2008 2008-2009 Indexation Fee-setting
method
RÉGIE DES MARCHÉS AGRICOLES ET ALIMENTAIRES DU QUÉBEC
Fees and permits
File processing 9 9 10 Yes CR
Auction sales 0 1 0 Yes CR
Grain marketing 207 218 219 Yes CR
Marketing 2 2 2 Yes CR
Subtotal 219 230 231
Sales of goods and services
Photocopies of documents 29 31 38 Yes CR
Courses 37 35 40 Yes CR
Grain inspection 6 6 11 Yes CR
Sampling kit 1 0 1 Yes CR
Leasing of staff services 0 0 13 Yes CR
Contributions – Monitoring of milk use 469 352 504 No CR
Contributions – Monitoring of poultry producer quotas 40 57 58 Yes CR
Technical assistance and support 2 4 3 Yes CR
Subtotal 584 485 668
TOTAL 803 715 899
TOTAL – MINISTÈRE DE L’AGRICULTURE, DES PÊCHERIES ET DE L’ALIMENTATION 14 702 15 103 15 323
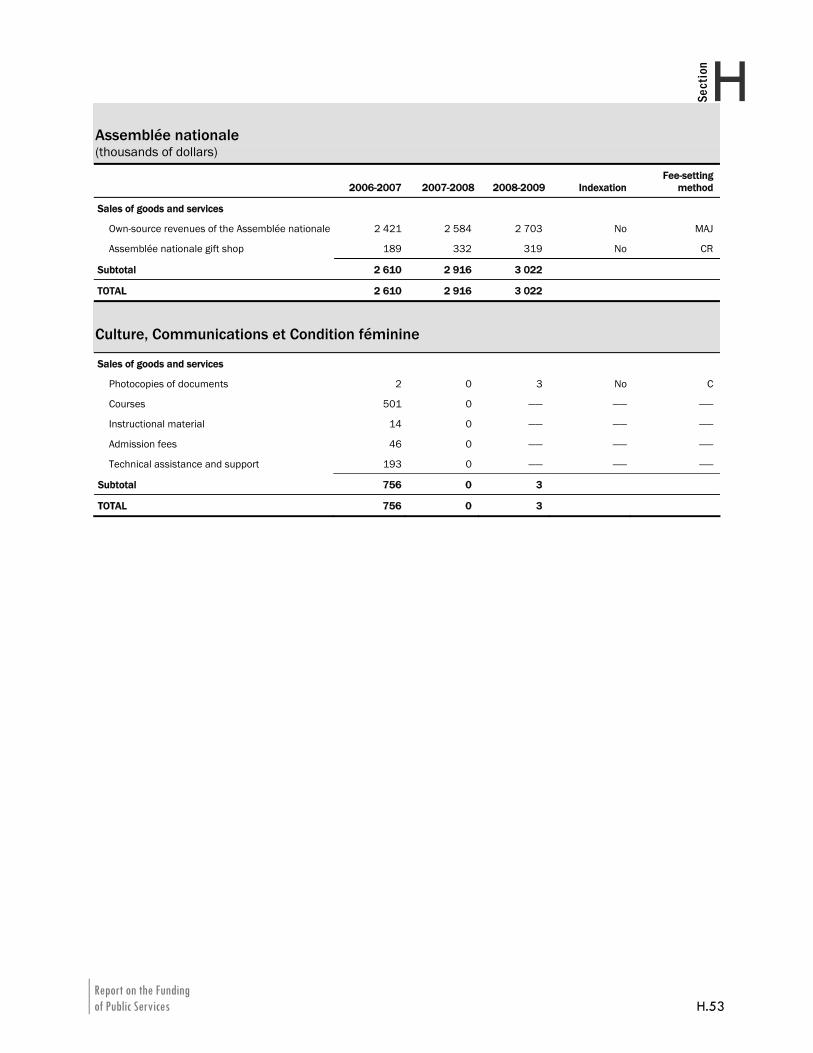
Report on the Funding of Public Services H.53
HSection
Assemblée nationale (thousands of dollars)
2006-2007 2007-2008 2008-2009 Indexation Fee-setting
method
Sales of goods and services
Own-source revenues of the Assemblée nationale 2 421 2 584 2 703 No MAJ
Assemblée nationale gift shop 189 332 319 No CR
Subtotal 2 610 2 916 3 022
TOTAL 2 610 2 916 3 022
Culture, Communications et Condition féminine
Sales of goods and services
Photocopies of documents 2 0 3 No C
Courses 501 0 —— —— ——
Instructional material 14 0 —— —— ——
Admission fees 46 0 —— —— ——
Technical assistance and support 193 0 —— —— ——
Subtotal 756 0 3
TOTAL 756 0 3
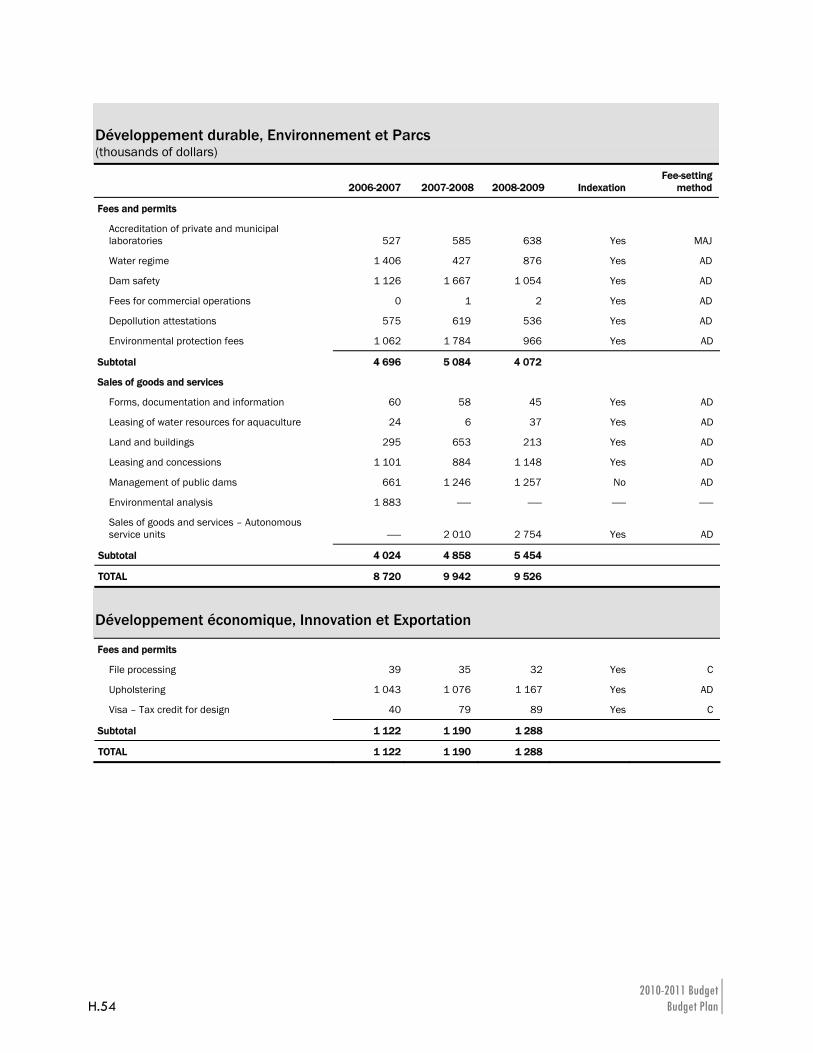
2010-2011 Budget H.54 Budget Plan
Développement durable, Environnement et Parcs (thousands of dollars)
2006-2007 2007-2008 2008-2009 Indexation Fee-setting
method
Fees and permits
Accreditation of private and municipal laboratories 527 585 638 Yes MAJ
Water regime 1 406 427 876 Yes AD
Dam safety 1 126 1 667 1 054 Yes AD
Fees for commercial operations 0 1 2 Yes AD
Depollution attestations 575 619 536 Yes AD
Environmental protection fees 1 062 1 784 966 Yes AD
Subtotal 4 696 5 084 4 072
Sales of goods and services
Forms, documentation and information 60 58 45 Yes AD
Leasing of water resources for aquaculture 24 6 37 Yes AD
Land and buildings 295 653 213 Yes AD
Leasing and concessions 1 101 884 1 148 Yes AD
Management of public dams 661 1 246 1 257 No AD
Environmental analysis 1 883 —— —— —— ——
Sales of goods and services – Autonomous service units —— 2 010 2 754 Yes AD
Subtotal 4 024 4 858 5 454
TOTAL 8 720 9 942 9 526
Développement économique, Innovation et Exportation
Fees and permits
File processing 39 35 32 Yes C
Upholstering 1 043 1 076 1 167 Yes AD
Visa – Tax credit for design 40 79 89 Yes C
Subtotal 1 122 1 190 1 288
TOTAL 1 122 1 190 1 288
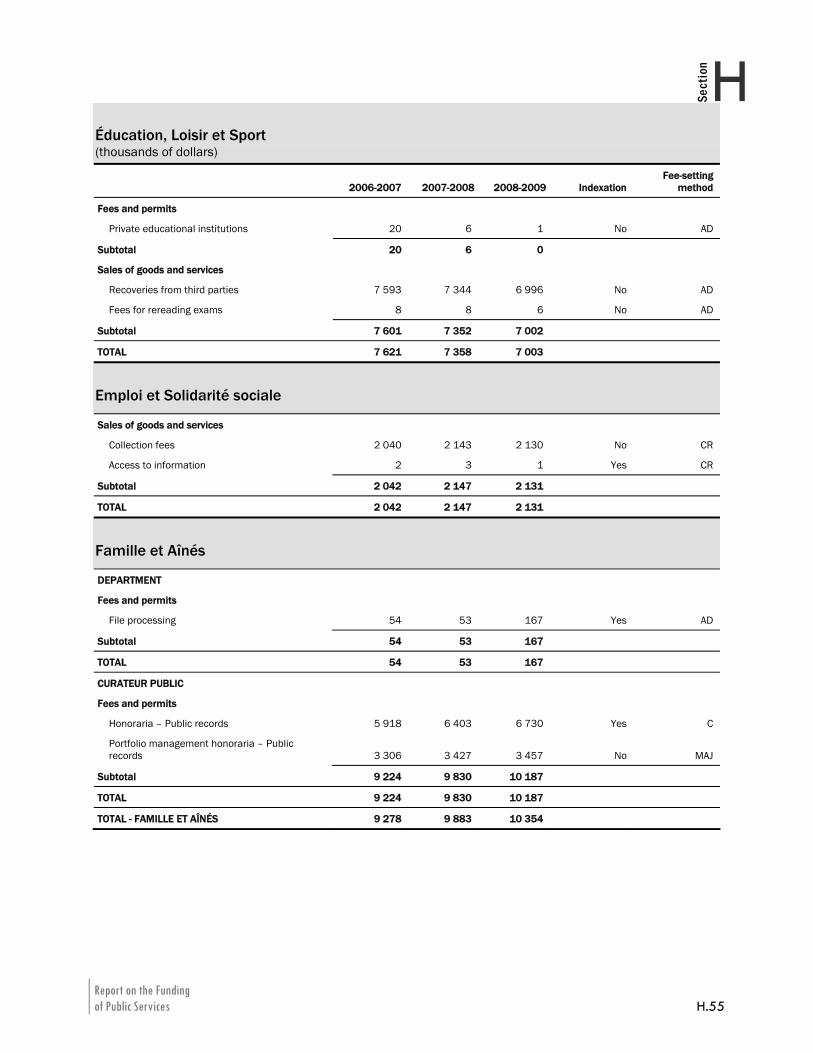
Report on the Funding of Public Services H.55
HSection
Éducation, Loisir et Sport (thousands of dollars)
2006-2007 2007-2008 2008-2009 Indexation Fee-setting
method
Fees and permits
Private educational institutions 20 6 1 No AD
Subtotal 20 6 0
Sales of goods and services
Recoveries from third parties 7 593 7 344 6 996 No AD
Fees for rereading exams 8 8 6 No AD
Subtotal 7 601 7 352 7 002
TOTAL 7 621 7 358 7 003
Emploi et Solidarité sociale
Sales of goods and services
Collection fees 2 040 2 143 2 130 No CR
Access to information 2 3 1 Yes CR
Subtotal 2 042 2 147 2 131
TOTAL 2 042 2 147 2 131
Famille et Aînés
DEPARTMENT
Fees and permits
File processing 54 53 167 Yes AD
Subtotal 54 53 167
TOTAL 54 53 167
CURATEUR PUBLIC
Fees and permits
Honoraria – Public records 5 918 6 403 6 730 Yes C
Portfolio management honoraria – Public records 3 306 3 427 3 457 No MAJ
Subtotal 9 224 9 830 10 187
TOTAL 9 224 9 830 10 187
TOTAL - FAMILLE ET AÎNÉS 9 278 9 883 10 354
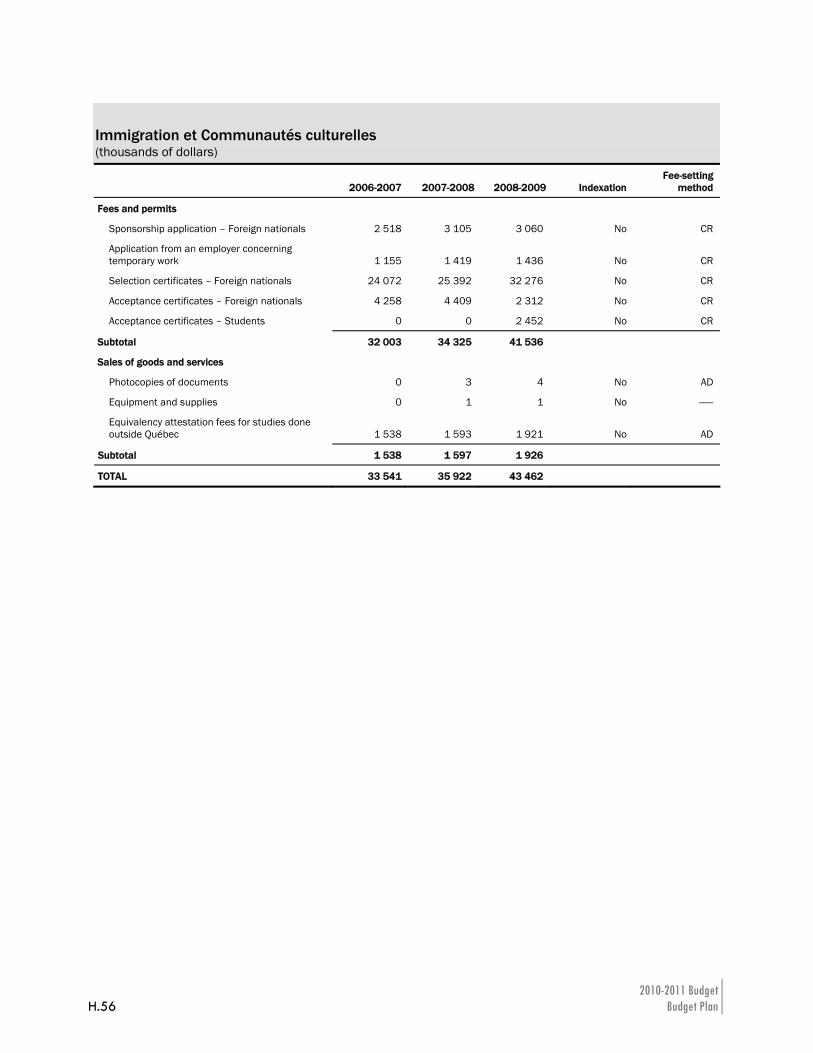
2010-2011 Budget H.56 Budget Plan
Immigration et Communautés culturelles (thousands of dollars)
2006-2007 2007-2008 2008-2009 Indexation Fee-setting
method
Fees and permits
Sponsorship application – Foreign nationals 2 518 3 105 3 060 No CR
Application from an employer concerning temporary work 1 155 1 419 1 436 No CR
Selection certificates – Foreign nationals 24 072 25 392 32 276 No CR
Acceptance certificates – Foreign nationals 4 258 4 409 2 312 No CR
Acceptance certificates – Students 0 0 2 452 No CR
Subtotal 32 003 34 325 41 536
Sales of goods and services
Photocopies of documents 0 3 4 No AD
Equipment and supplies 0 1 1 No ——
Equivalency attestation fees for studies done outside Québec 1 538 1 593 1 921 No AD
Subtotal 1 538 1 597 1 926
TOTAL 33 541 35 922 43 462
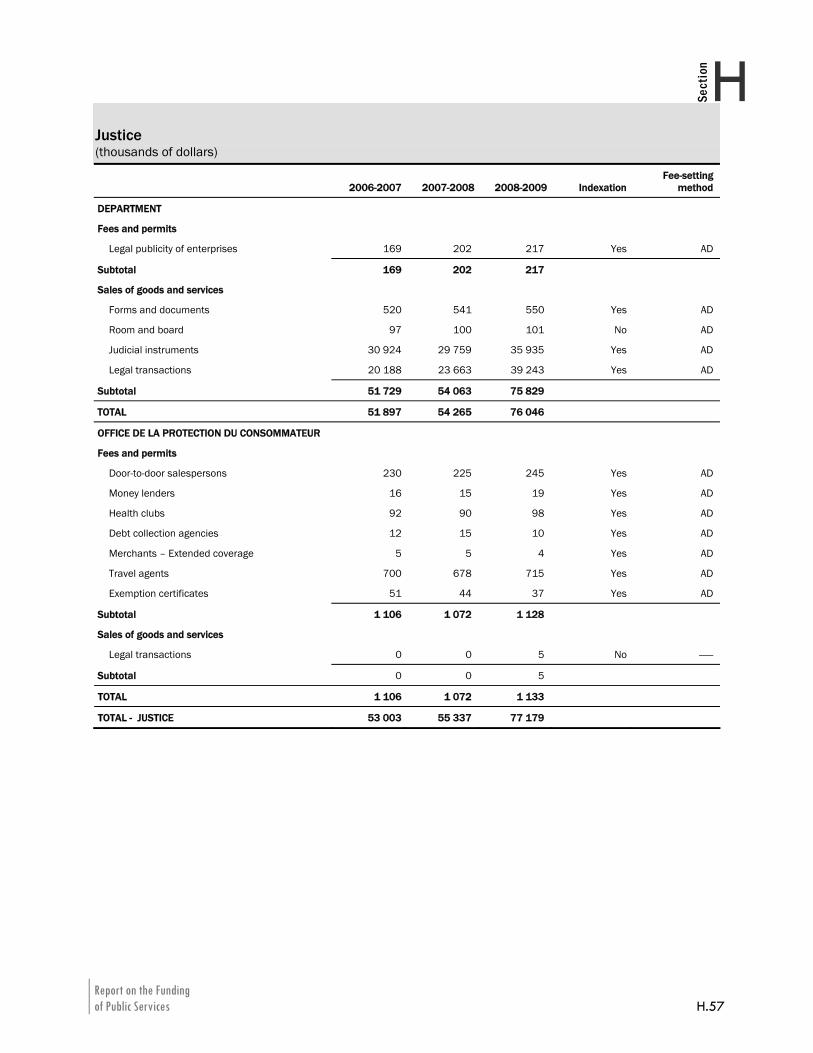
Report on the Funding of Public Services H.57
HSection
Justice (thousands of dollars)
2006-2007 2007-2008 2008-2009 Indexation Fee-setting
method
DEPARTMENT
Fees and permits
Legal publicity of enterprises 169 202 217 Yes AD
Subtotal 169 202 217
Sales of goods and services
Forms and documents 520 541 550 Yes AD
Room and board 97 100 101 No AD
Judicial instruments 30 924 29 759 35 935 Yes AD
Legal transactions 20 188 23 663 39 243 Yes AD
Subtotal 51 729 54 063 75 829
TOTAL 51 897 54 265 76 046
OFFICE DE LA PROTECTION DU CONSOMMATEUR
Fees and permits
Door-to-door salespersons 230 225 245 Yes AD
Money lenders 16 15 19 Yes AD
Health clubs 92 90 98 Yes AD
Debt collection agencies 12 15 10 Yes AD
Merchants – Extended coverage 5 5 4 Yes AD
Travel agents 700 678 715 Yes AD
Exemption certificates 51 44 37 Yes AD
Subtotal 1 106 1 072 1 128
Sales of goods and services
Legal transactions 0 0 5 No ——
Subtotal 0 0 5
TOTAL 1 106 1 072 1 133
TOTAL - JUSTICE 53 003 55 337 77 179
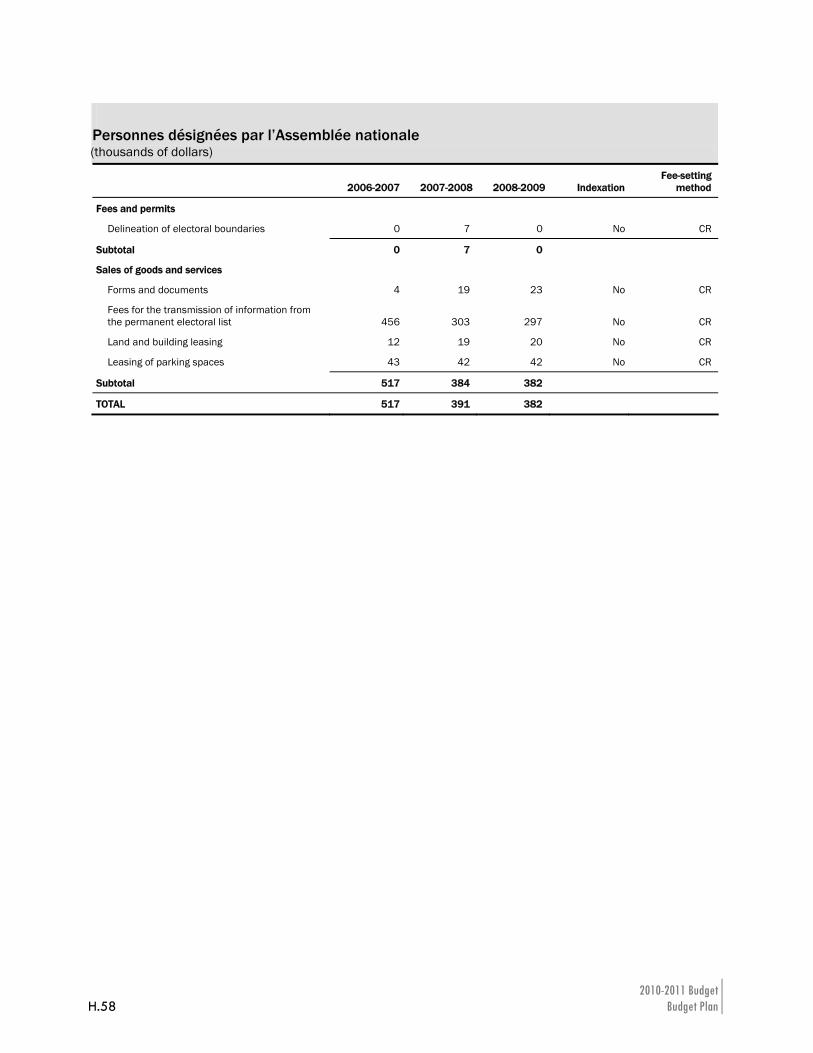
2010-2011 Budget H.58 Budget Plan
Personnes désignées par l’Assemblée nationale (thousands of dollars)
2006-2007 2007-2008 2008-2009 Indexation Fee-setting
method
Fees and permits
Delineation of electoral boundaries 0 7 0 No CR
Subtotal 0 7 0
Sales of goods and services
Forms and documents 4 19 23 No CR
Fees for the transmission of information from the permanent electoral list 456 303 297 No CR
Land and building leasing 12 19 20 No CR
Leasing of parking spaces 43 42 42 No CR
Subtotal 517 384 382
TOTAL 517 391 382
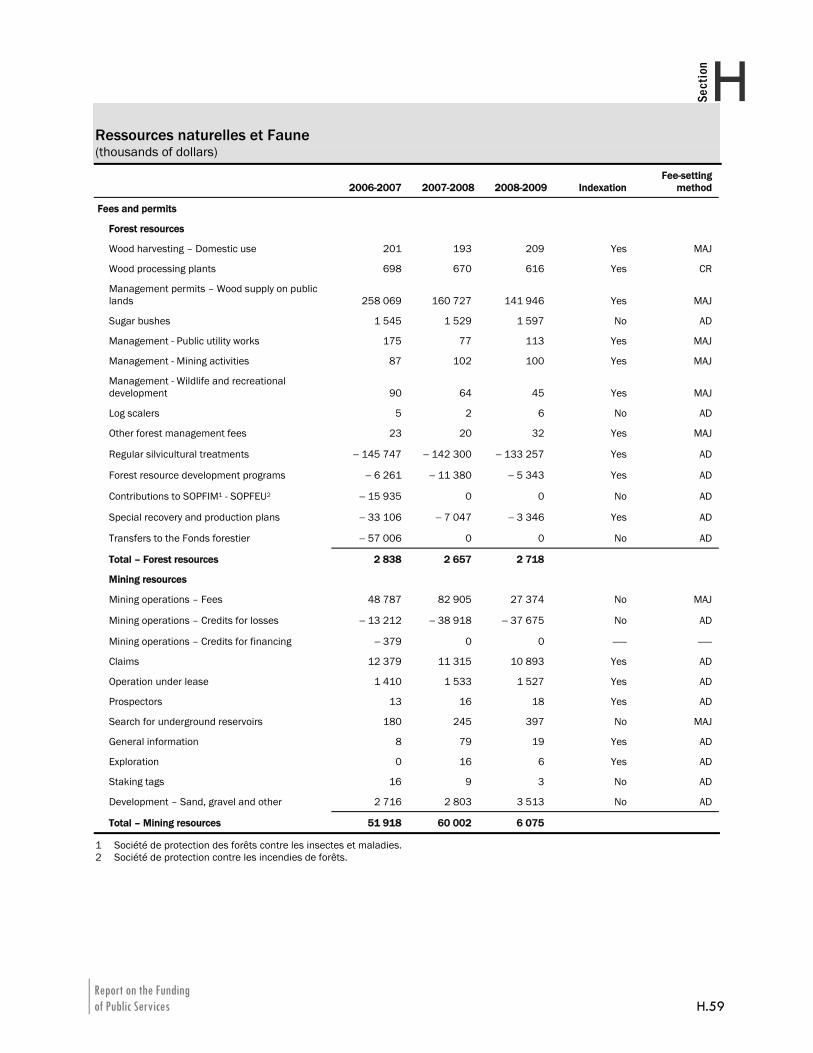
Report on the Funding of Public Services H.59
HSection
Ressources naturelles et Faune (thousands of dollars)
2006-2007 2007-2008 2008-2009 Indexation Fee-setting
method
Fees and permits
Forest resources
Wood harvesting – Domestic use 201 193 209 Yes MAJ
Wood processing plants 698 670 616 Yes CR
Management permits – Wood supply on public lands 258 069 160 727 141 946 Yes MAJ
Sugar bushes 1 545 1 529 1 597 No AD
Management - Public utility works 175 77 113 Yes MAJ
Management - Mining activities 87 102 100 Yes MAJ
Management - Wildlife and recreational development 90 64 45 Yes MAJ
Log scalers 5 2 6 No AD
Other forest management fees 23 20 32 Yes MAJ
Regular silvicultural treatments − 145 747 − 142 300 − 133 257 Yes AD
Forest resource development programs − 6 261 − 11 380 − 5 343 Yes AD
Contributions to SOPFIM1 - SOPFEU2 − 15 935 0 0 No AD
Special recovery and production plans − 33 106 − 7 047 − 3 346 Yes AD
Transfers to the Fonds forestier − 57 006 0 0 No AD
Total – Forest resources 2 838 2 657 2 718
Mining resources
Mining operations – Fees 48 787 82 905 27 374 No MAJ
Mining operations – Credits for losses − 13 212 − 38 918 − 37 675 No AD
Mining operations – Credits for financing − 379 0 0 —— ——
Claims 12 379 11 315 10 893 Yes AD
Operation under lease 1 410 1 533 1 527 Yes AD
Prospectors 13 16 18 Yes AD
Search for underground reservoirs 180 245 397 No MAJ
General information 8 79 19 Yes AD
Exploration 0 16 6 Yes AD
Staking tags 16 9 3 No AD
Development – Sand, gravel and other 2 716 2 803 3 513 No AD
Total – Mining resources 51 918 60 002 6 075
1 Société de protection des forêts contre les insectes et maladies. 2 Société de protection contre les incendies de forêts.
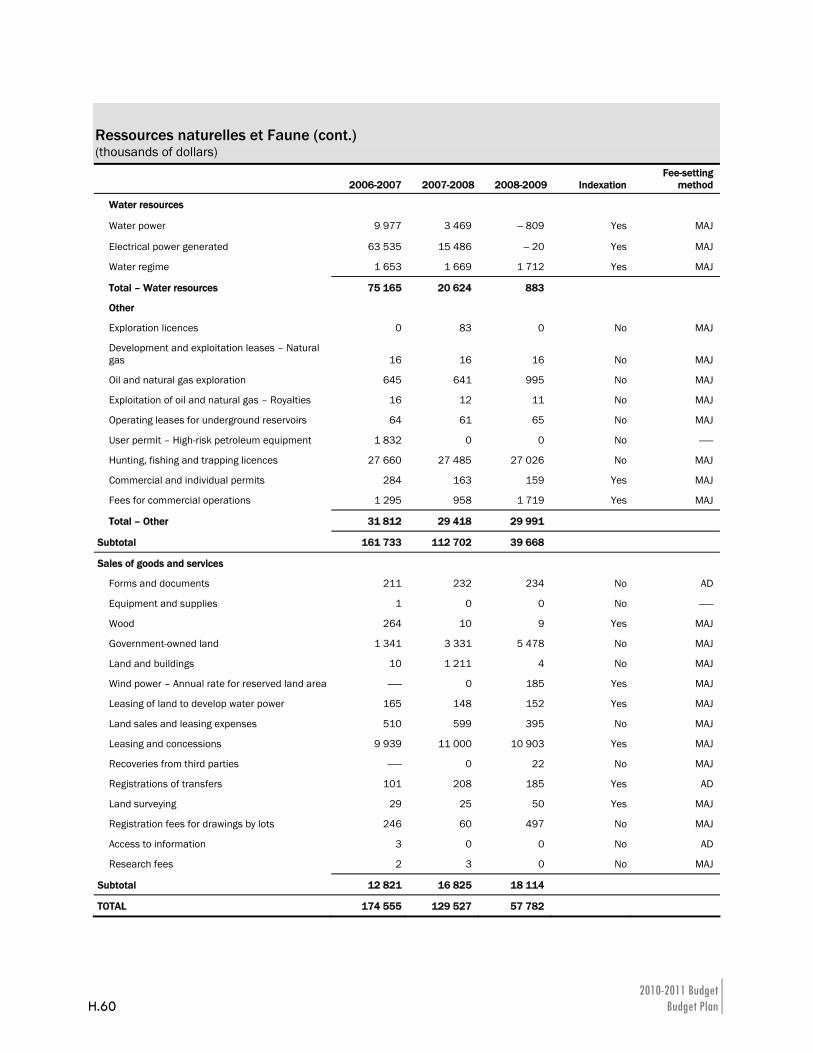
2010-2011 Budget H.60 Budget Plan
Ressources naturelles et Faune (cont.) (thousands of dollars)
2006-2007 2007-2008 2008-2009 Indexation Fee-setting
method
Water resources
Water power 9 977 3 469 − 809 Yes MAJ
Electrical power generated 63 535 15 486 − 20 Yes MAJ
Water regime 1 653 1 669 1 712 Yes MAJ
Total – Water resources 75 165 20 624 883
Other
Exploration licences 0 83 0 No MAJ
Development and exploitation leases – Natural gas 16 16 16 No MAJ
Oil and natural gas exploration 645 641 995 No MAJ
Exploitation of oil and natural gas – Royalties 16 12 11 No MAJ
Operating leases for underground reservoirs 64 61 65 No MAJ
User permit – High-risk petroleum equipment 1 832 0 0 No ——
Hunting, fishing and trapping licences 27 660 27 485 27 026 No MAJ
Commercial and individual permits 284 163 159 Yes MAJ
Fees for commercial operations 1 295 958 1 719 Yes MAJ
Total – Other 31 812 29 418 29 991
Subtotal 161 733 112 702 39 668
Sales of goods and services
Forms and documents 211 232 234 No AD
Equipment and supplies 1 0 0 No ——
Wood 264 10 9 Yes MAJ
Government-owned land 1 341 3 331 5 478 No MAJ
Land and buildings 10 1 211 4 No MAJ
Wind power – Annual rate for reserved land area —— 0 185 Yes MAJ
Leasing of land to develop water power 165 148 152 Yes MAJ
Land sales and leasing expenses 510 599 395 No MAJ
Leasing and concessions 9 939 11 000 10 903 Yes MAJ
Recoveries from third parties —— 0 22 No MAJ
Registrations of transfers 101 208 185 Yes AD
Land surveying 29 25 50 Yes MAJ
Registration fees for drawings by lots 246 60 497 No MAJ
Access to information 3 0 0 No AD
Research fees 2 3 0 No MAJ
Subtotal 12 821 16 825 18 114
TOTAL 174 555 129 527 57 782
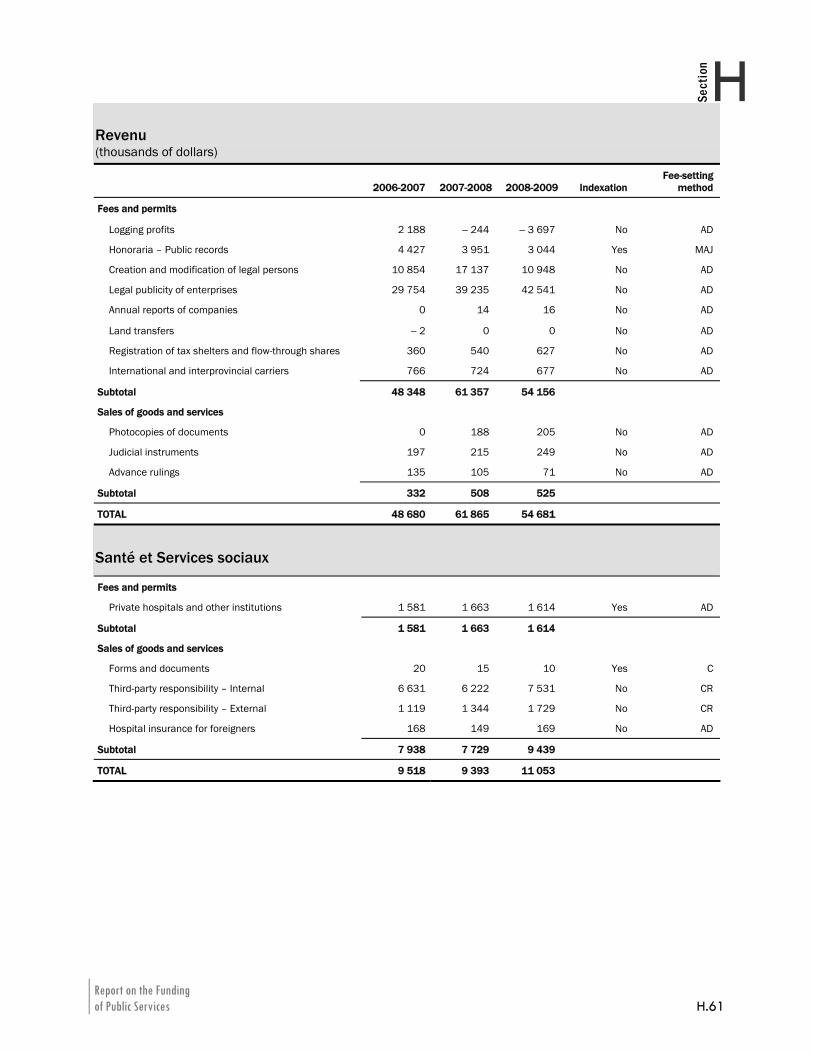
Report on the Funding of Public Services H.61
HSection
Revenu (thousands of dollars)
2006-2007 2007-2008 2008-2009 Indexation Fee-setting
method
Fees and permits
Logging profits 2 188 − 244 − 3 697 No AD
Honoraria – Public records 4 427 3 951 3 044 Yes MAJ
Creation and modification of legal persons 10 854 17 137 10 948 No AD
Legal publicity of enterprises 29 754 39 235 42 541 No AD
Annual reports of companies 0 14 16 No AD
Land transfers − 2 0 0 No AD
Registration of tax shelters and flow-through shares 360 540 627 No AD
International and interprovincial carriers 766 724 677 No AD
Subtotal 48 348 61 357 54 156
Sales of goods and services
Photocopies of documents 0 188 205 No AD
Judicial instruments 197 215 249 No AD
Advance rulings 135 105 71 No AD
Subtotal 332 508 525
TOTAL 48 680 61 865 54 681
Santé et Services sociaux
Fees and permits
Private hospitals and other institutions 1 581 1 663 1 614 Yes AD
Subtotal 1 581 1 663 1 614
Sales of goods and services
Forms and documents 20 15 10 Yes C
Third-party responsibility – Internal 6 631 6 222 7 531 No CR
Third-party responsibility – External 1 119 1 344 1 729 No CR
Hospital insurance for foreigners 168 149 169 No AD
Subtotal 7 938 7 729 9 439
TOTAL 9 518 9 393 11 053
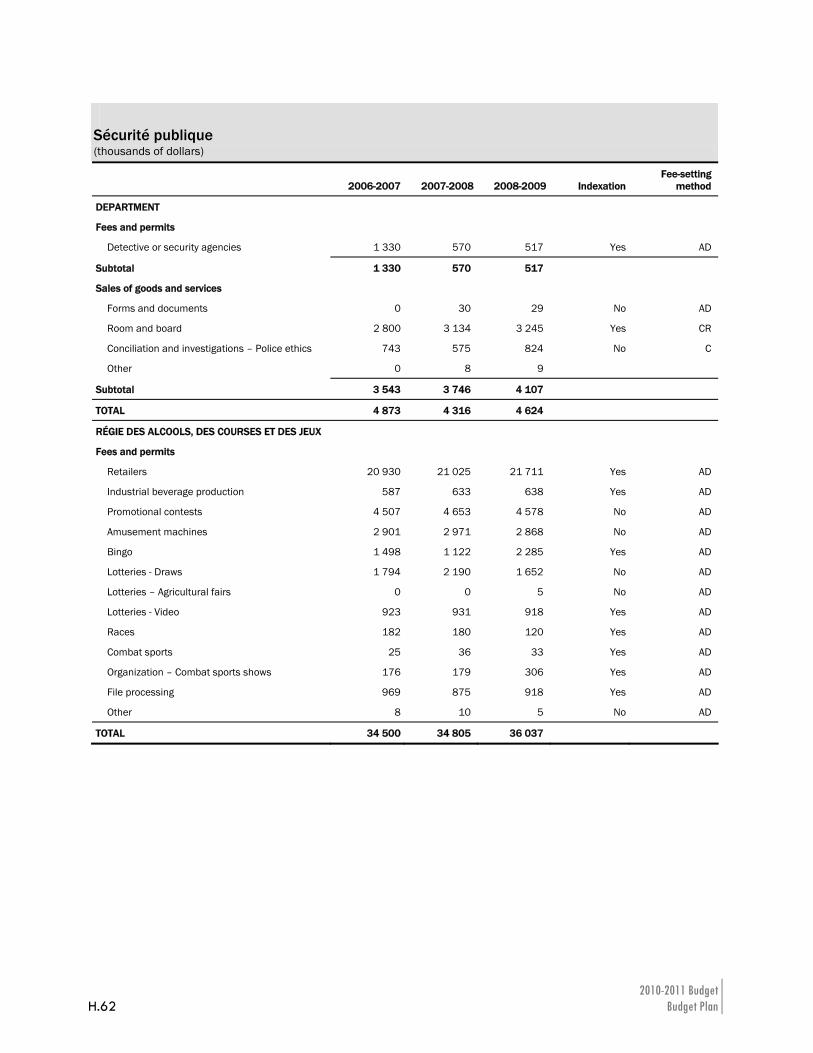
2010-2011 Budget H.62 Budget Plan
Sécurité publique (thousands of dollars)
2006-2007 2007-2008 2008-2009 Indexation Fee-setting
method
DEPARTMENT
Fees and permits
Detective or security agencies 1 330 570 517 Yes AD
Subtotal 1 330 570 517
Sales of goods and services
Forms and documents 0 30 29 No AD
Room and board 2 800 3 134 3 245 Yes CR
Conciliation and investigations – Police ethics 743 575 824 No C
Other 0 8 9
Subtotal 3 543 3 746 4 107
TOTAL 4 873 4 316 4 624
RÉGIE DES ALCOOLS, DES COURSES ET DES JEUX
Fees and permits
Retailers 20 930 21 025 21 711 Yes AD
Industrial beverage production 587 633 638 Yes AD
Promotional contests 4 507 4 653 4 578 No AD
Amusement machines 2 901 2 971 2 868 No AD
Bingo 1 498 1 122 2 285 Yes AD
Lotteries - Draws 1 794 2 190 1 652 No AD
Lotteries – Agricultural fairs 0 0 5 No AD
Lotteries - Video 923 931 918 Yes AD
Races 182 180 120 Yes AD
Combat sports 25 36 33 Yes AD
Organization – Combat sports shows 176 179 306 Yes AD
File processing 969 875 918 Yes AD
Other 8 10 5 No AD
TOTAL 34 500 34 805 36 037
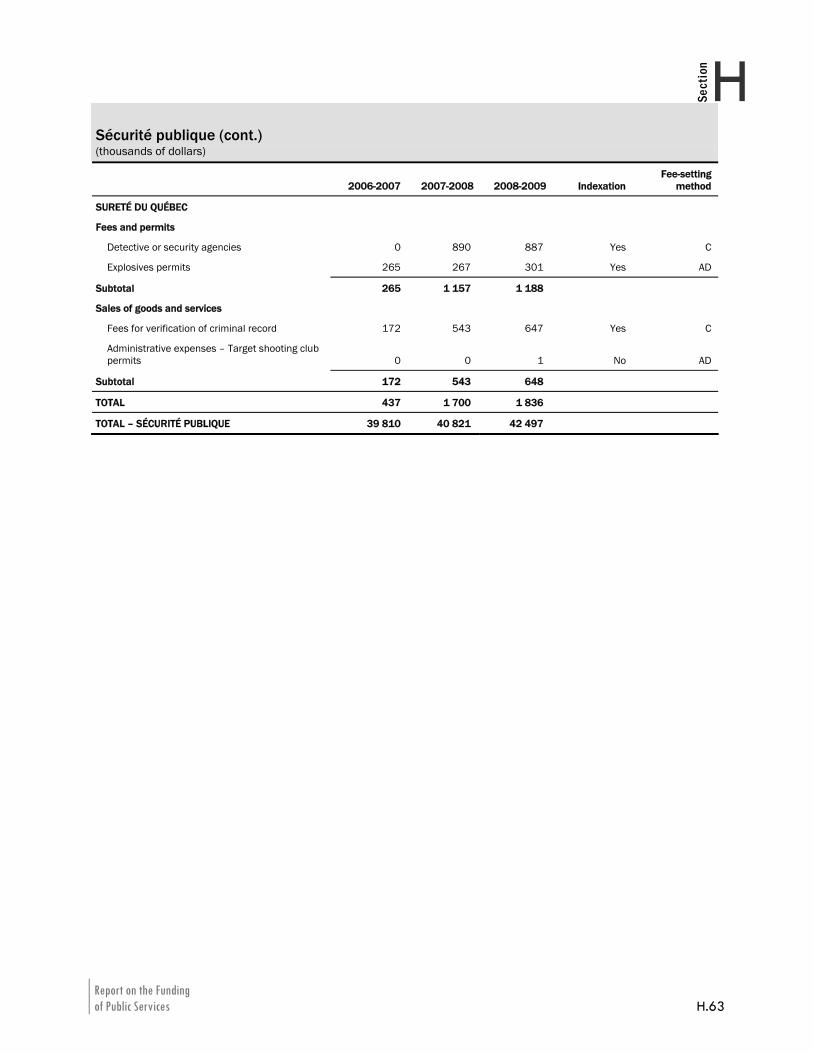
Report on the Funding of Public Services H.63
HSection
Sécurité publique (cont.) (thousands of dollars)
2006-2007 2007-2008 2008-2009 Indexation Fee-setting
method
SURETÉ DU QUÉBEC
Fees and permits
Detective or security agencies 0 890 887 Yes C
Explosives permits 265 267 301 Yes AD
Subtotal 265 1 157 1 188
Sales of goods and services
Fees for verification of criminal record 172 543 647 Yes C
Administrative expenses – Target shooting club permits 0 0 1 No AD
Subtotal 172 543 648
TOTAL 437 1 700 1 836
TOTAL – SÉCURITÉ PUBLIQUE 39 810 40 821 42 497
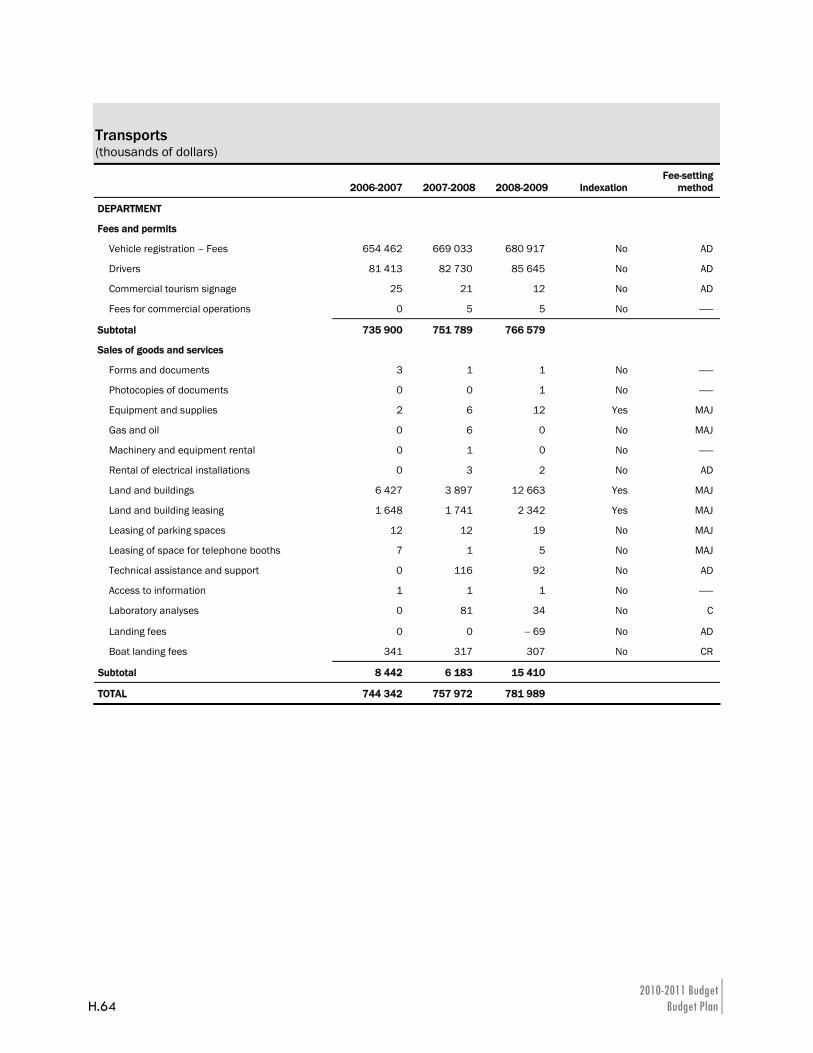
2010-2011 Budget H.64 Budget Plan
Transports (thousands of dollars)
2006-2007 2007-2008 2008-2009 Indexation Fee-setting
method
DEPARTMENT
Fees and permits
Vehicle registration – Fees 654 462 669 033 680 917 No AD
Drivers 81 413 82 730 85 645 No AD
Commercial tourism signage 25 21 12 No AD
Fees for commercial operations 0 5 5 No ——
Subtotal 735 900 751 789 766 579
Sales of goods and services
Forms and documents 3 1 1 No ——
Photocopies of documents 0 0 1 No ——
Equipment and supplies 2 6 12 Yes MAJ
Gas and oil 0 6 0 No MAJ
Machinery and equipment rental 0 1 0 No ——
Rental of electrical installations 0 3 2 No AD
Land and buildings 6 427 3 897 12 663 Yes MAJ
Land and building leasing 1 648 1 741 2 342 Yes MAJ
Leasing of parking spaces 12 12 19 No MAJ
Leasing of space for telephone booths 7 1 5 No MAJ
Technical assistance and support 0 116 92 No AD
Access to information 1 1 1 No ——
Laboratory analyses 0 81 34 No C
Landing fees 0 0 − 69 No AD
Boat landing fees 341 317 307 No CR
Subtotal 8 442 6 183 15 410
TOTAL 744 342 757 972 781 989
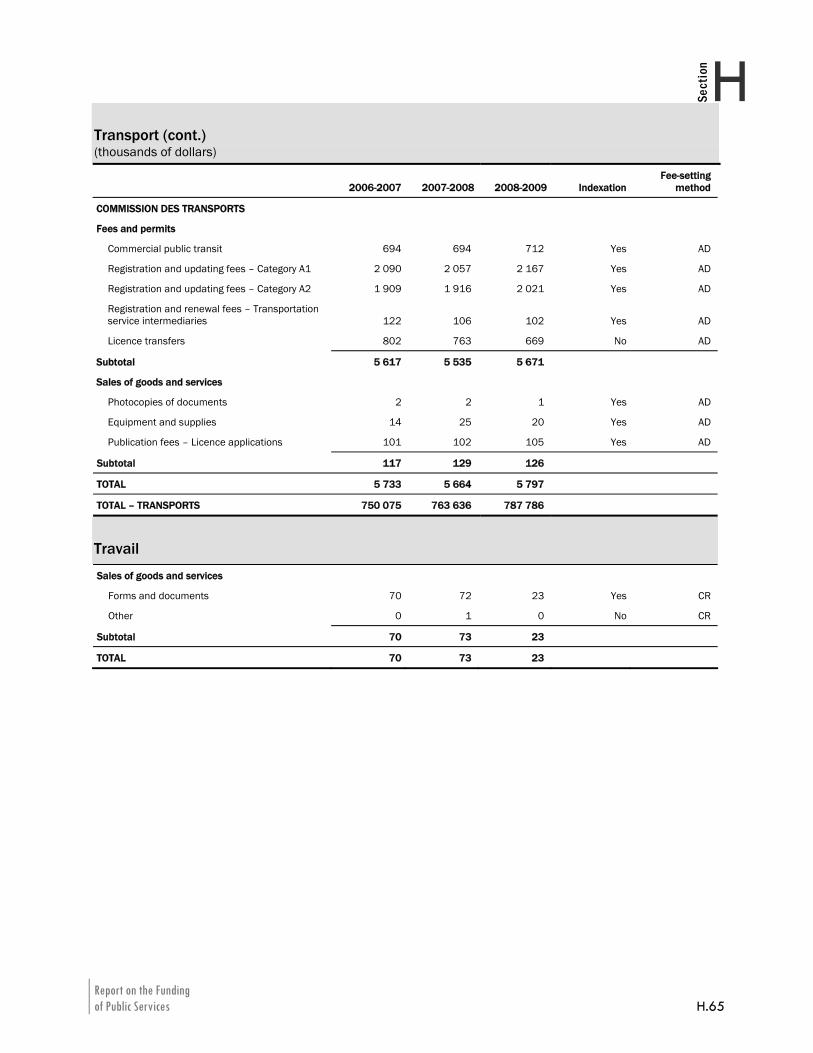
Report on the Funding of Public Services H.65
HSection
Transport (cont.) (thousands of dollars)
2006-2007 2007-2008 2008-2009 Indexation Fee-setting
method
COMMISSION DES TRANSPORTS
Fees and permits
Commercial public transit 694 694 712 Yes AD
Registration and updating fees – Category A1 2 090 2 057 2 167 Yes AD
Registration and updating fees – Category A2 1 909 1 916 2 021 Yes AD
Registration and renewal fees – Transportation service intermediaries 122 106 102 Yes AD
Licence transfers 802 763 669 No AD
Subtotal 5 617 5 535 5 671
Sales of goods and services
Photocopies of documents 2 2 1 Yes AD
Equipment and supplies 14 25 20 Yes AD
Publication fees – Licence applications 101 102 105 Yes AD
Subtotal 117 129 126
TOTAL 5 733 5 664 5 797
TOTAL – TRANSPORTS 750 075 763 636 787 786
Travail
Sales of goods and services
Forms and documents 70 72 23 Yes CR
Other 0 1 0 No CR
Subtotal 70 73 23
TOTAL 70 73 23
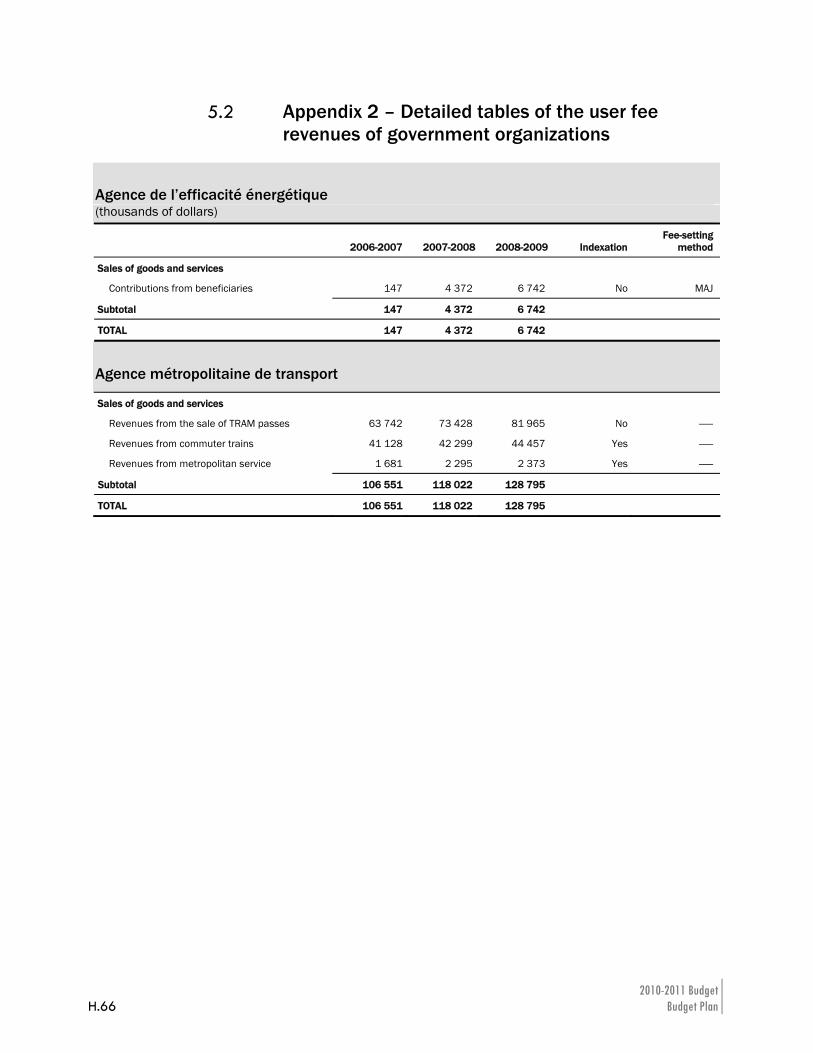
2010-2011 Budget H.66 Budget Plan
5.2 Appendix 2 – Detailed tables of the user fee revenues of government organizations
Agence de l’efficacité énergétique (thousands of dollars)
2006-2007 2007-2008 2008-2009 Indexation Fee-setting
method
Sales of goods and services
Contributions from beneficiaries 147 4 372 6 742 No MAJ
Subtotal 147 4 372 6 742
TOTAL 147 4 372 6 742
Agence métropolitaine de transport
Sales of goods and services
Revenues from the sale of TRAM passes 63 742 73 428 81 965 No ——
Revenues from commuter trains 41 128 42 299 44 457 Yes ——
Revenues from metropolitan service 1 681 2 295 2 373 Yes ——
Subtotal 106 551 118 022 128 795
TOTAL 106 551 118 022 128 795
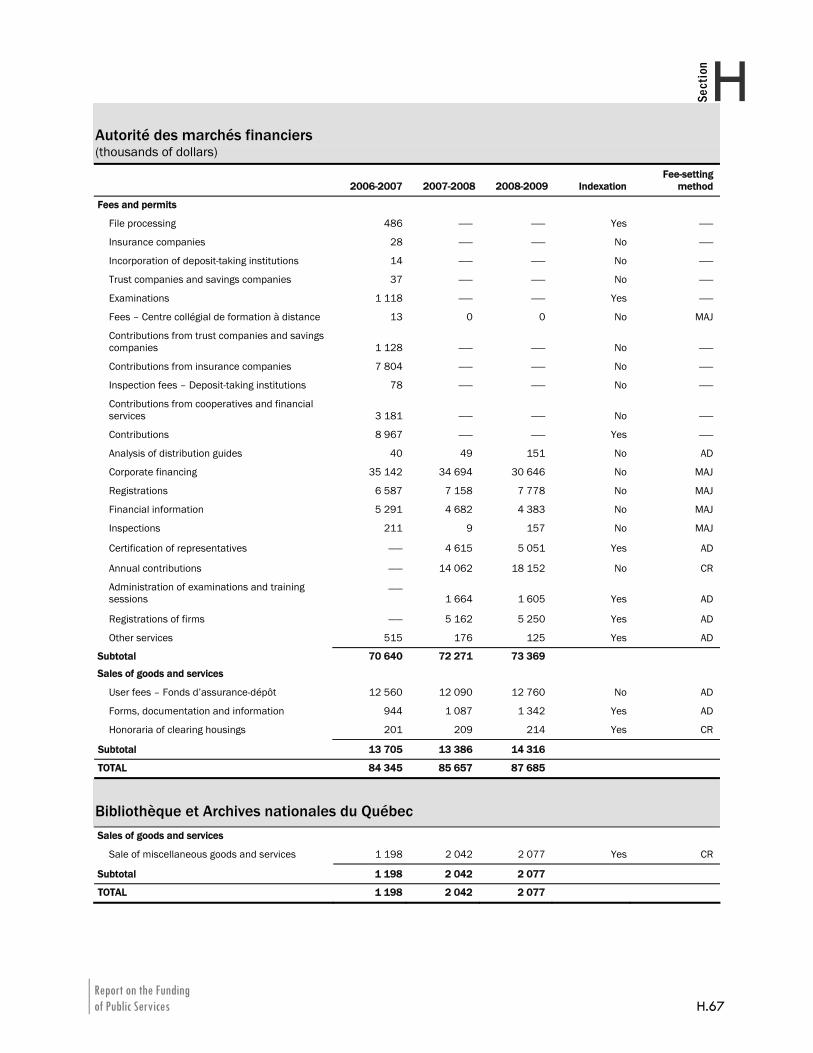
Report on the Funding of Public Services H.67
HSection
Autorité des marchés financiers (thousands of dollars)
2006-2007 2007-2008 2008-2009 Indexation Fee-setting
method
Fees and permits
File processing 486 —— —— Yes ——
Insurance companies 28 —— —— No ——
Incorporation of deposit-taking institutions 14 —— —— No ——
Trust companies and savings companies 37 —— —— No ——
Examinations 1 118 —— —— Yes ——
Fees – Centre collégial de formation à distance 13 0 0 No MAJ
Contributions from trust companies and savings companies 1 128 —— —— No ——
Contributions from insurance companies 7 804 —— —— No ——
Inspection fees – Deposit-taking institutions 78 —— —— No ——
Contributions from cooperatives and financial services 3 181 —— —— No ——
Contributions 8 967 —— —— Yes ——
Analysis of distribution guides 40 49 151 No AD
Corporate financing 35 142 34 694 30 646 No MAJ
Registrations 6 587 7 158 7 778 No MAJ
Financial information 5 291 4 682 4 383 No MAJ
Inspections 211 9 157 No MAJ
Certification of representatives —— 4 615 5 051 Yes AD
Annual contributions —— 14 062 18 152 No CR
Administration of examinations and training sessions
——1 664 1 605 Yes AD
Registrations of firms —— 5 162 5 250 Yes AD
Other services 515 176 125 Yes AD
Subtotal 70 640 72 271 73 369
Sales of goods and services
User fees – Fonds d’assurance-dépôt 12 560 12 090 12 760 No AD
Forms, documentation and information 944 1 087 1 342 Yes AD
Honoraria of clearing housings 201 209 214 Yes CR
Subtotal 13 705 13 386 14 316
TOTAL 84 345 85 657 87 685
Bibliothèque et Archives nationales du Québec Sales of goods and services
Sale of miscellaneous goods and services 1 198 2 042 2 077 Yes CR
Subtotal 1 198 2 042 2 077
TOTAL 1 198 2 042 2 077
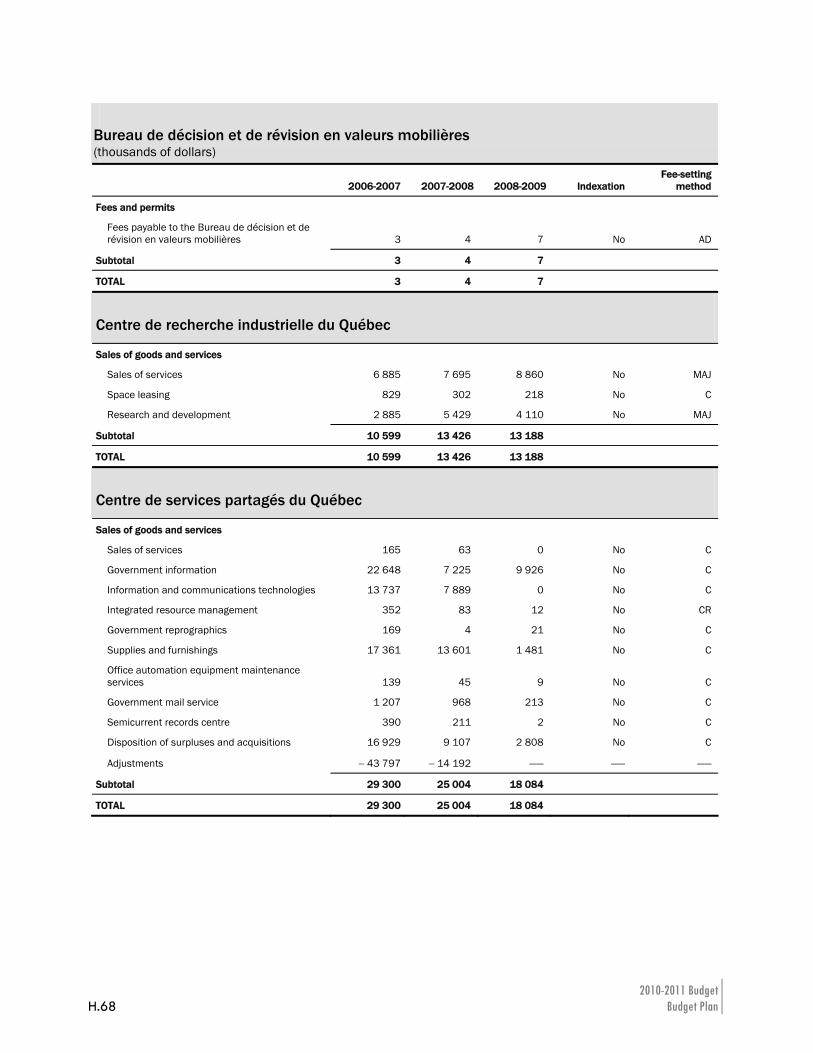
2010-2011 Budget H.68 Budget Plan
Bureau de décision et de révision en valeurs mobilières (thousands of dollars)
2006-2007 2007-2008 2008-2009 Indexation Fee-setting
method
Fees and permits
Fees payable to the Bureau de décision et de révision en valeurs mobilières 3 4 7 No AD
Subtotal 3 4 7
TOTAL 3 4 7
Centre de recherche industrielle du Québec
Sales of goods and services
Sales of services 6 885 7 695 8 860 No MAJ
Space leasing 829 302 218 No C
Research and development 2 885 5 429 4 110 No MAJ
Subtotal 10 599 13 426 13 188
TOTAL 10 599 13 426 13 188
Centre de services partagés du Québec
Sales of goods and services
Sales of services 165 63 0 No C
Government information 22 648 7 225 9 926 No C
Information and communications technologies 13 737 7 889 0 No C
Integrated resource management 352 83 12 No CR
Government reprographics 169 4 21 No C
Supplies and furnishings 17 361 13 601 1 481 No C
Office automation equipment maintenance services 139 45 9 No C
Government mail service 1 207 968 213 No C
Semicurrent records centre 390 211 2 No C
Disposition of surpluses and acquisitions 16 929 9 107 2 808 No C
Adjustments − 43 797 − 14 192 —— —— ——
Subtotal 29 300 25 004 18 084
TOTAL 29 300 25 004 18 084
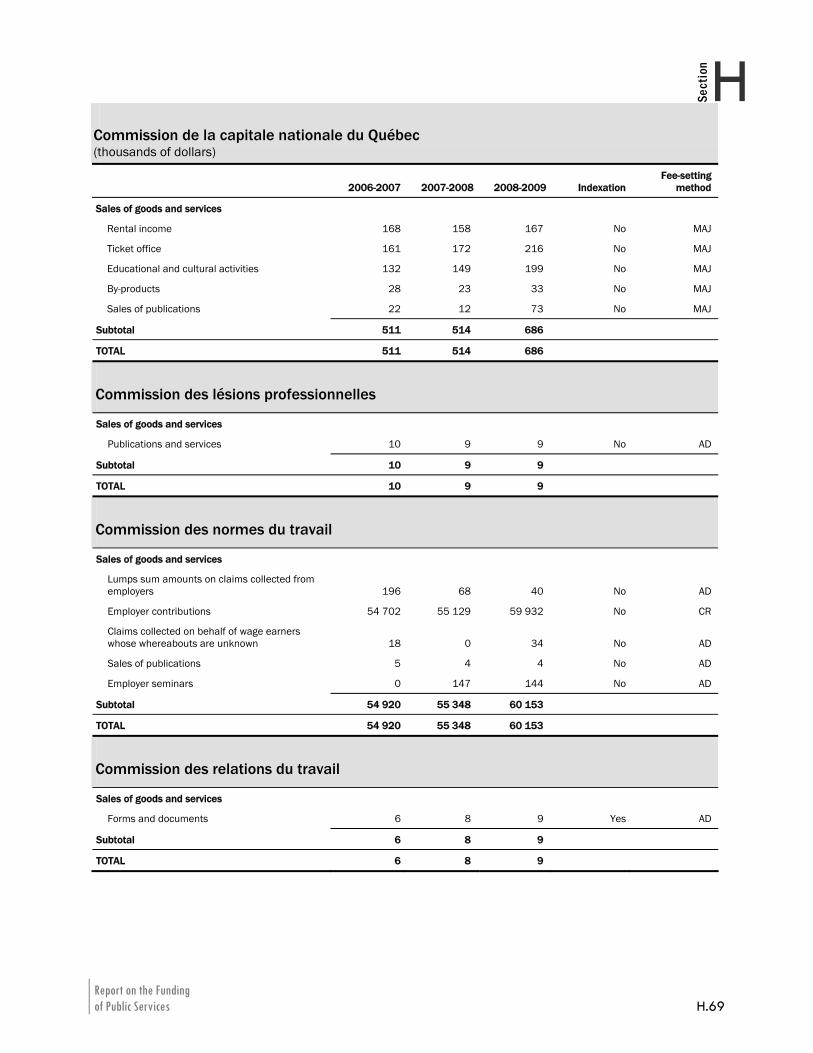
Report on the Funding of Public Services H.69
HSection
Commission de la capitale nationale du Québec (thousands of dollars)
2006-2007 2007-2008 2008-2009 Indexation Fee-setting
method
Sales of goods and services
Rental income 168 158 167 No MAJ
Ticket office 161 172 216 No MAJ
Educational and cultural activities 132 149 199 No MAJ
By-products 28 23 33 No MAJ
Sales of publications 22 12 73 No MAJ
Subtotal 511 514 686
TOTAL 511 514 686
Commission des lésions professionnelles
Sales of goods and services
Publications and services 10 9 9 No AD
Subtotal 10 9 9
TOTAL 10 9 9
Commission des normes du travail
Sales of goods and services
Lumps sum amounts on claims collected from employers 196 68 40 No AD
Employer contributions 54 702 55 129 59 932 No CR
Claims collected on behalf of wage earners whose whereabouts are unknown 18 0 34 No AD
Sales of publications 5 4 4 No AD
Employer seminars 0 147 144 No AD
Subtotal 54 920 55 348 60 153
TOTAL 54 920 55 348 60 153
Commission des relations du travail
Sales of goods and services
Forms and documents 6 8 9 Yes AD
Subtotal 6 8 9
TOTAL 6 8 9
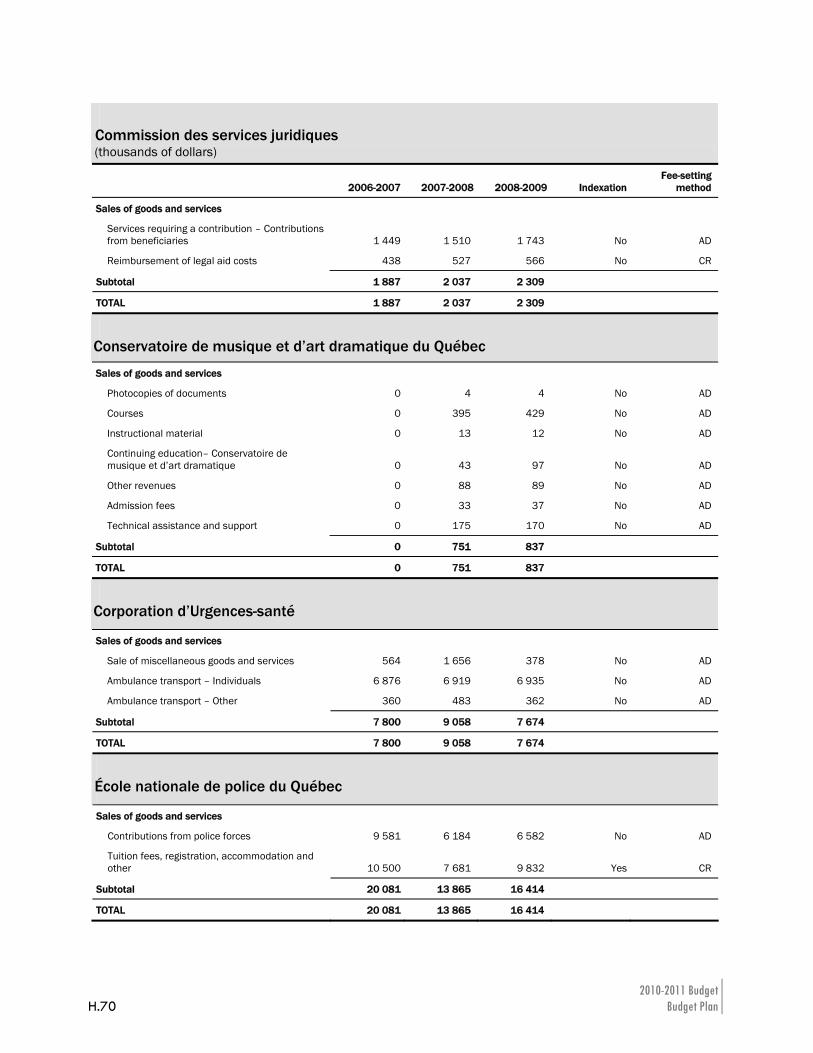
2010-2011 Budget H.70 Budget Plan
Commission des services juridiques (thousands of dollars)
2006-2007 2007-2008 2008-2009 Indexation Fee-setting
method
Sales of goods and services
Services requiring a contribution – Contributions from beneficiaries 1 449 1 510 1 743 No AD
Reimbursement of legal aid costs 438 527 566 No CR
Subtotal 1 887 2 037 2 309
TOTAL 1 887 2 037 2 309
Conservatoire de musique et d’art dramatique du Québec
Sales of goods and services
Photocopies of documents 0 4 4 No AD
Courses 0 395 429 No AD
Instructional material 0 13 12 No AD
Continuing education– Conservatoire de musique et d’art dramatique 0 43 97 No AD
Other revenues 0 88 89 No AD
Admission fees 0 33 37 No AD
Technical assistance and support 0 175 170 No AD
Subtotal 0 751 837
TOTAL 0 751 837
Corporation d’Urgences-santé
Sales of goods and services
Sale of miscellaneous goods and services 564 1 656 378 No AD
Ambulance transport – Individuals 6 876 6 919 6 935 No AD
Ambulance transport – Other 360 483 362 No AD
Subtotal 7 800 9 058 7 674
TOTAL 7 800 9 058 7 674
École nationale de police du Québec
Sales of goods and services
Contributions from police forces 9 581 6 184 6 582 No AD
Tuition fees, registration, accommodation and other 10 500 7 681 9 832 Yes CR
Subtotal 20 081 13 865 16 414
TOTAL 20 081 13 865 16 414
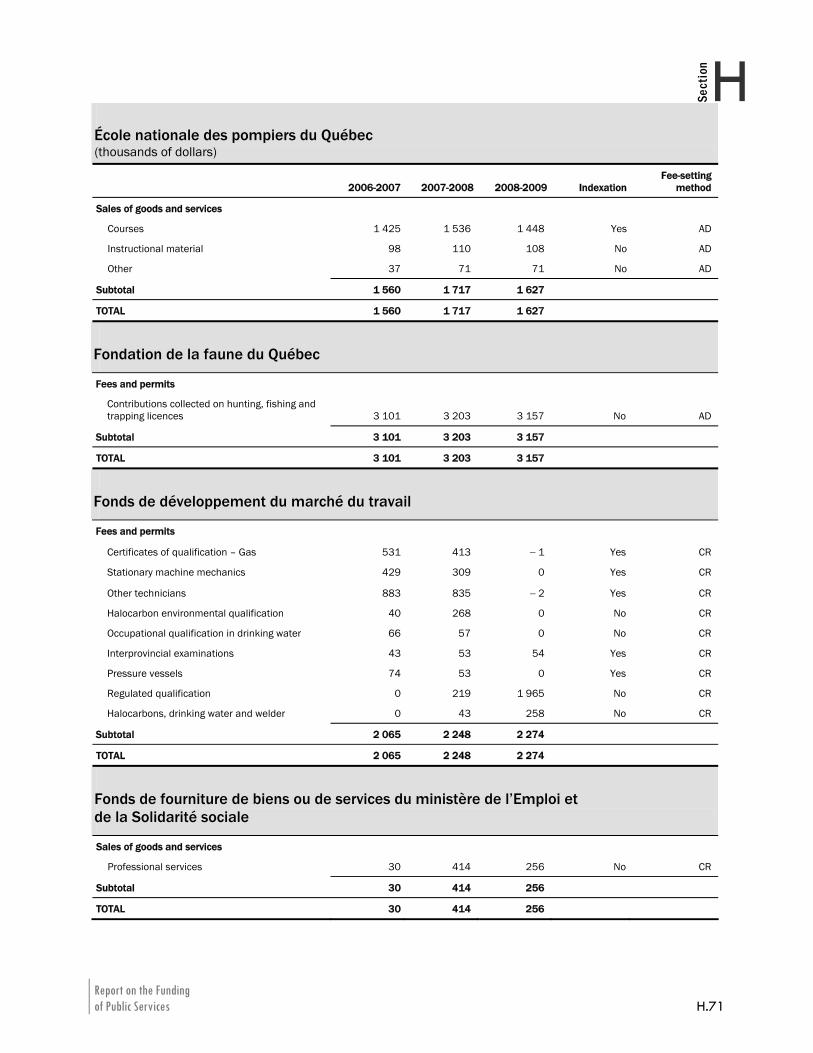
Report on the Funding of Public Services H.71
HSection
École nationale des pompiers du Québec (thousands of dollars)
2006-2007 2007-2008 2008-2009 Indexation Fee-setting
method
Sales of goods and services
Courses 1 425 1 536 1 448 Yes AD
Instructional material 98 110 108 No AD
Other 37 71 71 No AD
Subtotal 1 560 1 717 1 627
TOTAL 1 560 1 717 1 627
Fondation de la faune du Québec
Fees and permits
Contributions collected on hunting, fishing and trapping licences 3 101 3 203 3 157 No AD
Subtotal 3 101 3 203 3 157
TOTAL 3 101 3 203 3 157
Fonds de développement du marché du travail
Fees and permits
Certificates of qualification – Gas 531 413 − 1 Yes CR
Stationary machine mechanics 429 309 0 Yes CR
Other technicians 883 835 − 2 Yes CR
Halocarbon environmental qualification 40 268 0 No CR
Occupational qualification in drinking water 66 57 0 No CR
Interprovincial examinations 43 53 54 Yes CR
Pressure vessels 74 53 0 Yes CR
Regulated qualification 0 219 1 965 No CR
Halocarbons, drinking water and welder 0 43 258 No CR
Subtotal 2 065 2 248 2 274
TOTAL 2 065 2 248 2 274
Fonds de fourniture de biens ou de services du ministère de l’Emploi et de la Solidarité sociale
Sales of goods and services
Professional services 30 414 256 No CR
Subtotal 30 414 256
TOTAL 30 414 256
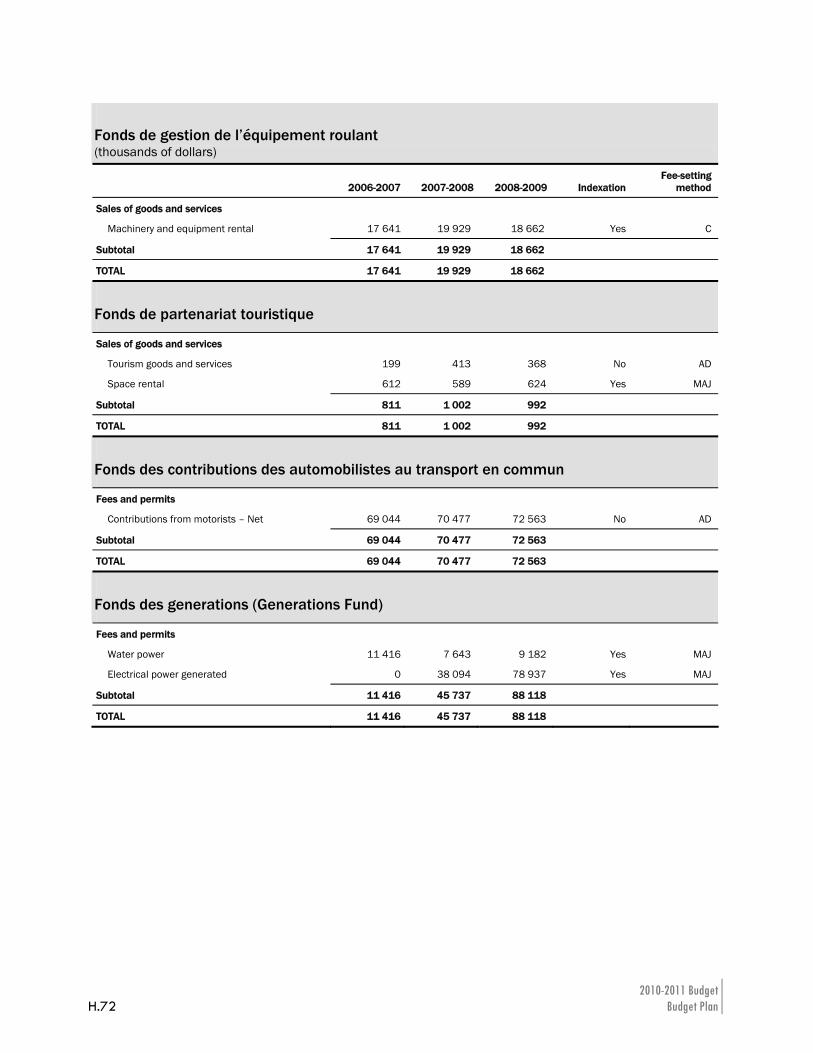
2010-2011 Budget H.72 Budget Plan
Fonds de gestion de l’équipement roulant (thousands of dollars)
2006-2007 2007-2008 2008-2009 Indexation Fee-setting
method
Sales of goods and services
Machinery and equipment rental 17 641 19 929 18 662 Yes C
Subtotal 17 641 19 929 18 662
TOTAL 17 641 19 929 18 662
Fonds de partenariat touristique
Sales of goods and services
Tourism goods and services 199 413 368 No AD
Space rental 612 589 624 Yes MAJ
Subtotal 811 1 002 992
TOTAL 811 1 002 992
Fonds des contributions des automobilistes au transport en commun
Fees and permits
Contributions from motorists – Net 69 044 70 477 72 563 No AD
Subtotal 69 044 70 477 72 563
TOTAL 69 044 70 477 72 563
Fonds des generations (Generations Fund)
Fees and permits
Water power 11 416 7 643 9 182 Yes MAJ
Electrical power generated 0 38 094 78 937 Yes MAJ
Subtotal 11 416 45 737 88 118
TOTAL 11 416 45 737 88 118
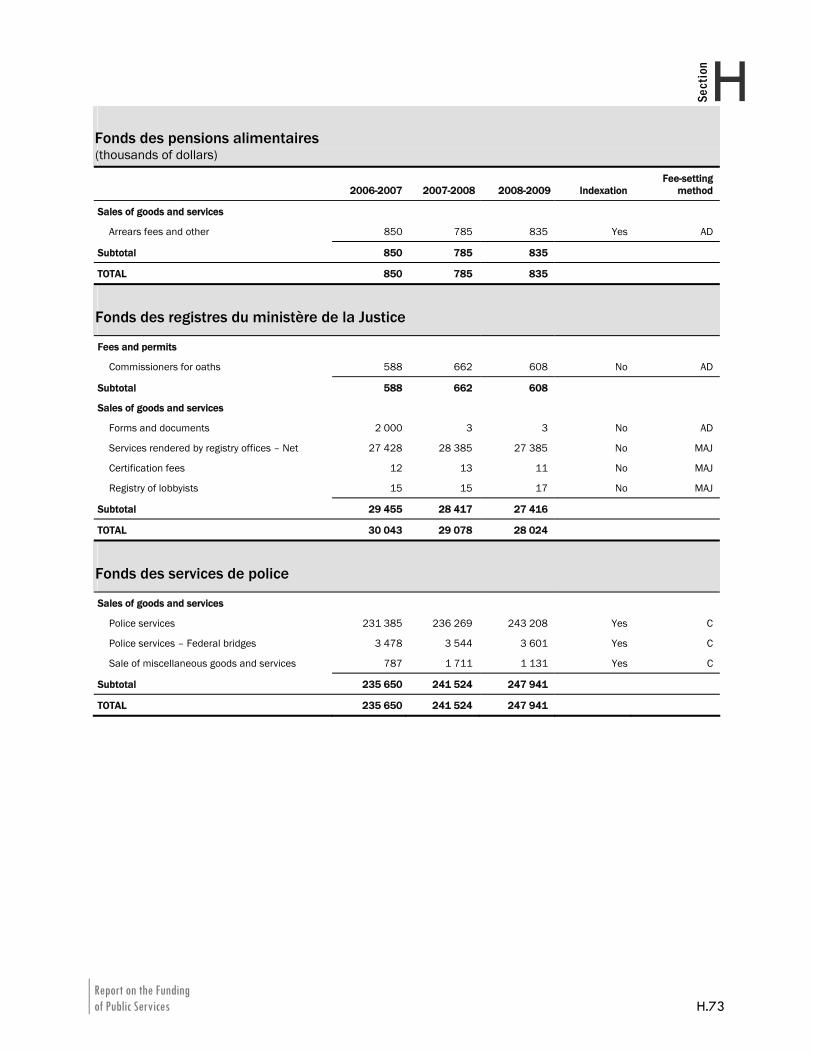
Report on the Funding of Public Services H.73
HSection
Fonds des pensions alimentaires (thousands of dollars)
2006-2007 2007-2008 2008-2009 Indexation Fee-setting
method
Sales of goods and services
Arrears fees and other 850 785 835 Yes AD
Subtotal 850 785 835
TOTAL 850 785 835
Fonds des registres du ministère de la Justice
Fees and permits
Commissioners for oaths 588 662 608 No AD
Subtotal 588 662 608
Sales of goods and services
Forms and documents 2 000 3 3 No AD
Services rendered by registry offices – Net 27 428 28 385 27 385 No MAJ
Certification fees 12 13 11 No MAJ
Registry of lobbyists 15 15 17 No MAJ
Subtotal 29 455 28 417 27 416
TOTAL 30 043 29 078 28 024
Fonds des services de police
Sales of goods and services
Police services 231 385 236 269 243 208 Yes C
Police services – Federal bridges 3 478 3 544 3 601 Yes C
Sale of miscellaneous goods and services 787 1 711 1 131 Yes C
Subtotal 235 650 241 524 247 941
TOTAL 235 650 241 524 247 941
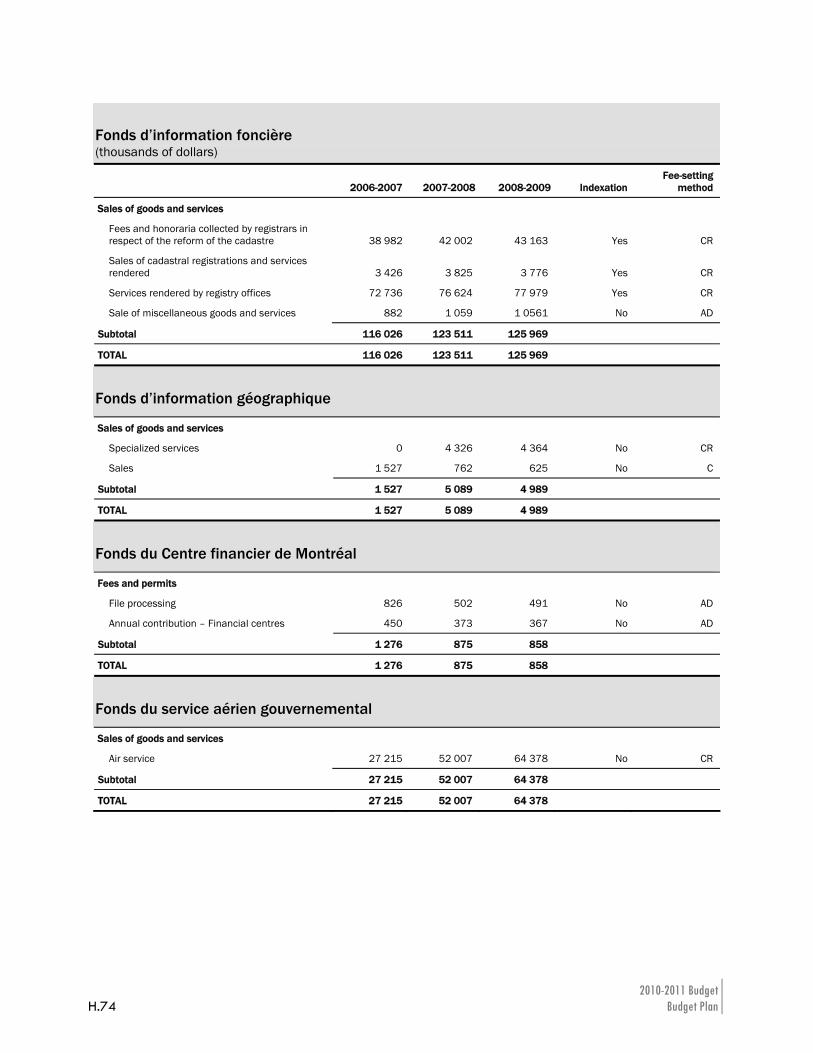
2010-2011 Budget H.74 Budget Plan
Fonds d’information foncière (thousands of dollars)
2006-2007 2007-2008 2008-2009 Indexation Fee-setting
method
Sales of goods and services
Fees and honoraria collected by registrars in respect of the reform of the cadastre 38 982 42 002 43 163 Yes CR
Sales of cadastral registrations and services rendered 3 426 3 825 3 776 Yes CR
Services rendered by registry offices 72 736 76 624 77 979 Yes CR
Sale of miscellaneous goods and services 882 1 059 1 0561 No AD
Subtotal 116 026 123 511 125 969
TOTAL 116 026 123 511 125 969
Fonds d’information géographique
Sales of goods and services
Specialized services 0 4 326 4 364 No CR
Sales 1 527 762 625 No C
Subtotal 1 527 5 089 4 989
TOTAL 1 527 5 089 4 989
Fonds du Centre financier de Montréal
Fees and permits
File processing 826 502 491 No AD
Annual contribution – Financial centres 450 373 367 No AD
Subtotal 1 276 875 858
TOTAL 1 276 875 858
Fonds du service aérien gouvernemental
Sales of goods and services
Air service 27 215 52 007 64 378 No CR
Subtotal 27 215 52 007 64 378
TOTAL 27 215 52 007 64 378
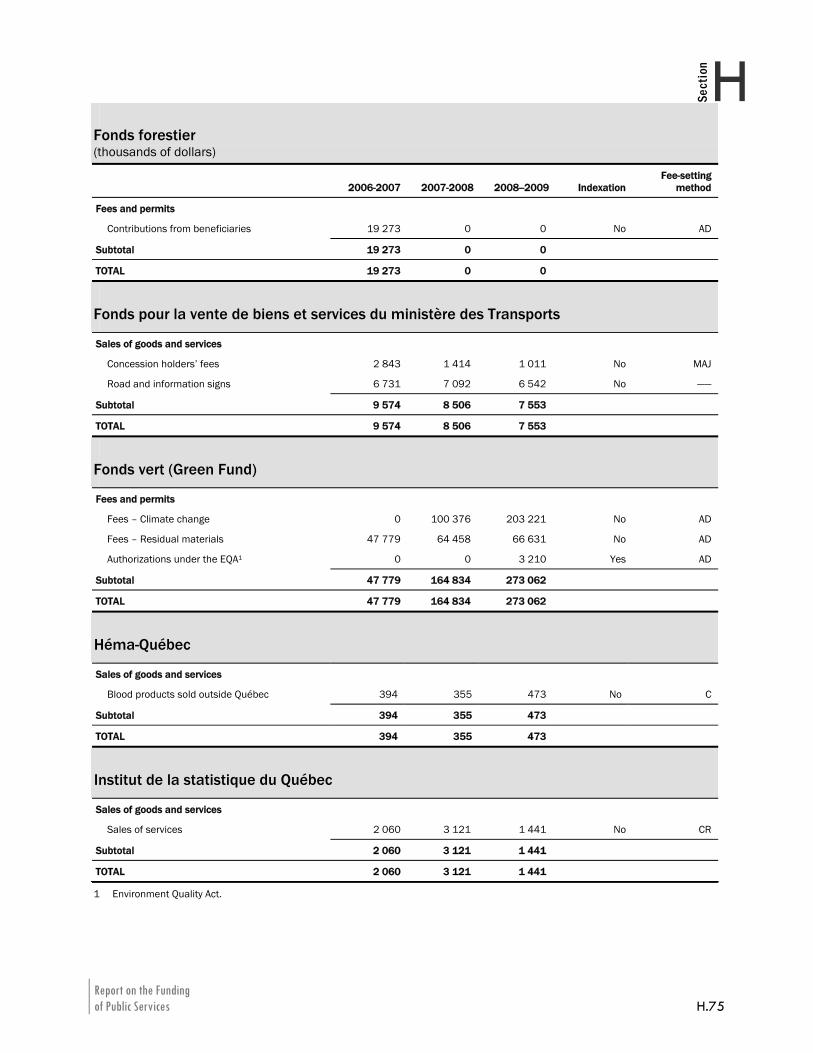
Report on the Funding of Public Services H.75
HSection
Fonds forestier (thousands of dollars)
2006-2007 2007-2008 2008--2009 Indexation Fee-setting
method
Fees and permits
Contributions from beneficiaries 19 273 0 0 No AD
Subtotal 19 273 0 0
TOTAL 19 273 0 0
Fonds pour la vente de biens et services du ministère des Transports
Sales of goods and services
Concession holders’ fees 2 843 1 414 1 011 No MAJ
Road and information signs 6 731 7 092 6 542 No ——
Subtotal 9 574 8 506 7 553
TOTAL 9 574 8 506 7 553
Fonds vert (Green Fund)
Fees and permits
Fees – Climate change 0 100 376 203 221 No AD
Fees – Residual materials 47 779 64 458 66 631 No AD
Authorizations under the EQA1 0 0 3 210 Yes AD
Subtotal 47 779 164 834 273 062
TOTAL 47 779 164 834 273 062
Héma-Québec
Sales of goods and services
Blood products sold outside Québec 394 355 473 No C
Subtotal 394 355 473
TOTAL 394 355 473
Institut de la statistique du Québec
Sales of goods and services
Sales of services 2 060 3 121 1 441 No CR
Subtotal 2 060 3 121 1 441
TOTAL 2 060 3 121 1 441
1 Environment Quality Act.
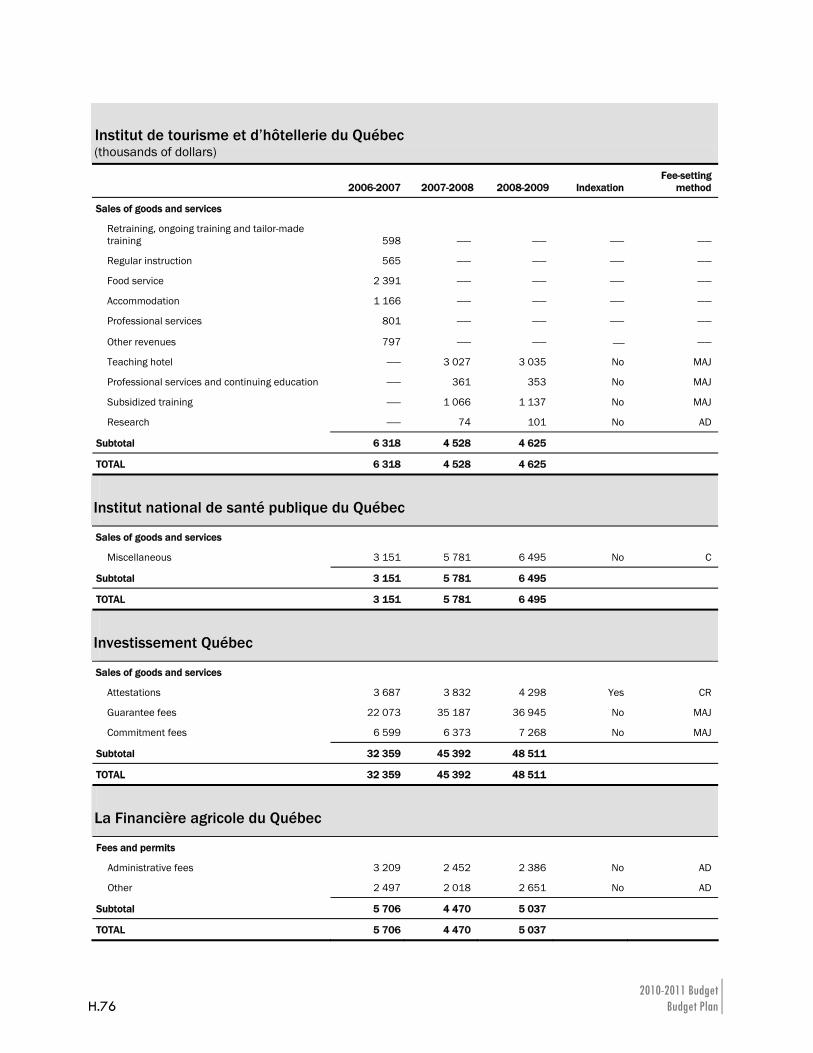
2010-2011 Budget H.76 Budget Plan
Institut de tourisme et d’hôtellerie du Québec (thousands of dollars)
2006-2007 2007-2008 2008-2009 Indexation Fee-setting
method
Sales of goods and services
Retraining, ongoing training and tailor-made training 598 —— —— —— ——
Regular instruction 565 —— —— —— ——
Food service 2 391 —— —— —— ——
Accommodation 1 166 —— —— —— ——
Professional services 801 —— —— —— ——
Other revenues 797 —— —— ⎯ ——
Teaching hotel —— 3 027 3 035 No MAJ
Professional services and continuing education —— 361 353 No MAJ
Subsidized training —— 1 066 1 137 No MAJ
Research —— 74 101 No AD
Subtotal 6 318 4 528 4 625
TOTAL 6 318 4 528 4 625
Institut national de santé publique du Québec
Sales of goods and services
Miscellaneous 3 151 5 781 6 495 No C
Subtotal 3 151 5 781 6 495
TOTAL 3 151 5 781 6 495
Investissement Québec
Sales of goods and services
Attestations 3 687 3 832 4 298 Yes CR
Guarantee fees 22 073 35 187 36 945 No MAJ
Commitment fees 6 599 6 373 7 268 No MAJ
Subtotal 32 359 45 392 48 511
TOTAL 32 359 45 392 48 511
La Financière agricole du Québec
Fees and permits
Administrative fees 3 209 2 452 2 386 No AD
Other 2 497 2 018 2 651 No AD
Subtotal 5 706 4 470 5 037
TOTAL 5 706 4 470 5 037
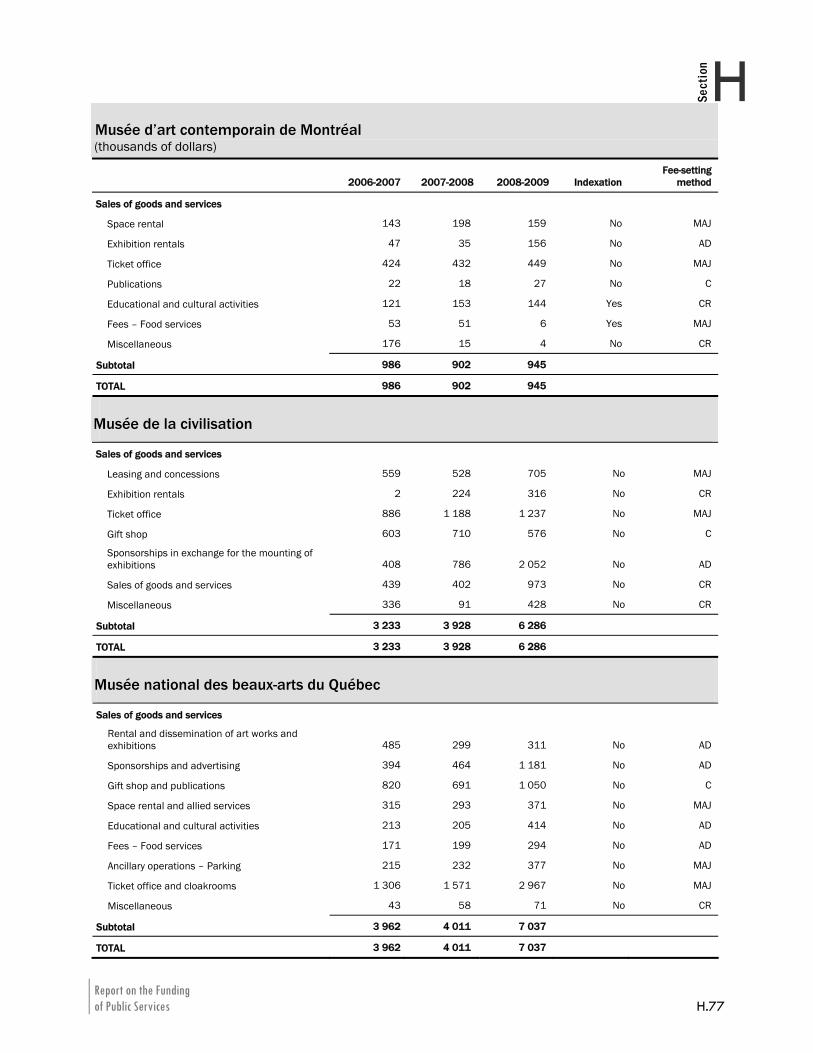
Report on the Funding of Public Services H.77
HSection
Musée d’art contemporain de Montréal (thousands of dollars)
2006-2007 2007-2008 2008-2009 Indexation Fee-setting
method
Sales of goods and services
Space rental 143 198 159 No MAJ
Exhibition rentals 47 35 156 No AD
Ticket office 424 432 449 No MAJ
Publications 22 18 27 No C
Educational and cultural activities 121 153 144 Yes CR
Fees – Food services 53 51 6 Yes MAJ
Miscellaneous 176 15 4 No CR
Subtotal 986 902 945
TOTAL 986 902 945
Musée de la civilisation
Sales of goods and services
Leasing and concessions 559 528 705 No MAJ
Exhibition rentals 2 224 316 No CR
Ticket office 886 1 188 1 237 No MAJ
Gift shop 603 710 576 No C
Sponsorships in exchange for the mounting of exhibitions 408 786 2 052 No AD
Sales of goods and services 439 402 973 No CR
Miscellaneous 336 91 428 No CR
Subtotal 3 233 3 928 6 286
TOTAL 3 233 3 928 6 286
Musée national des beaux-arts du Québec
Sales of goods and services
Rental and dissemination of art works and exhibitions 485 299 311 No AD
Sponsorships and advertising 394 464 1 181 No AD
Gift shop and publications 820 691 1 050 No C
Space rental and allied services 315 293 371 No MAJ
Educational and cultural activities 213 205 414 No AD
Fees – Food services 171 199 294 No AD
Ancillary operations – Parking 215 232 377 No MAJ
Ticket office and cloakrooms 1 306 1 571 2 967 No MAJ
Miscellaneous 43 58 71 No CR
Subtotal 3 962 4 011 7 037
TOTAL 3 962 4 011 7 037
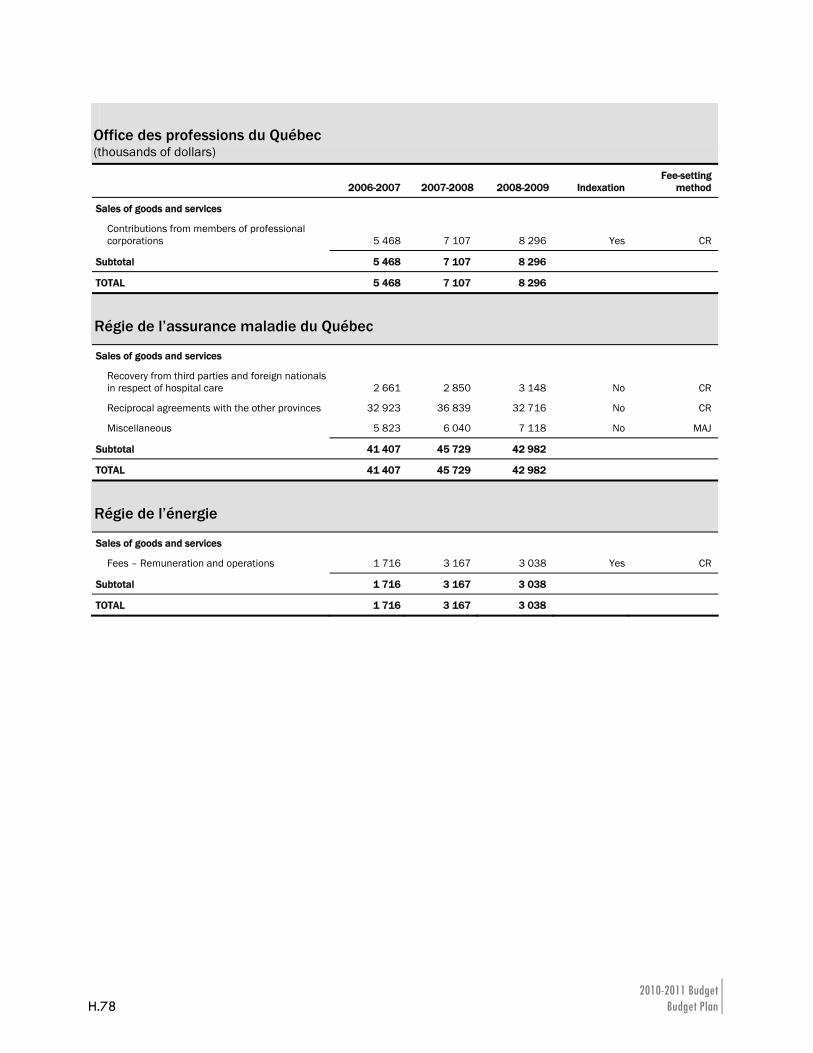
2010-2011 Budget H.78 Budget Plan
Office des professions du Québec (thousands of dollars)
2006-2007 2007-2008 2008-2009 Indexation Fee-setting
method
Sales of goods and services
Contributions from members of professional corporations 5 468 7 107 8 296 Yes CR
Subtotal 5 468 7 107 8 296
TOTAL 5 468 7 107 8 296
Régie de l’assurance maladie du Québec
Sales of goods and services
Recovery from third parties and foreign nationals in respect of hospital care 2 661 2 850 3 148 No CR
Reciprocal agreements with the other provinces 32 923 36 839 32 716 No CR
Miscellaneous 5 823 6 040 7 118 No MAJ
Subtotal 41 407 45 729 42 982
TOTAL 41 407 45 729 42 982
Régie de l’énergie
Sales of goods and services
Fees – Remuneration and operations 1 716 3 167 3 038 Yes CR
Subtotal 1 716 3 167 3 038
TOTAL 1 716 3 167 3 038
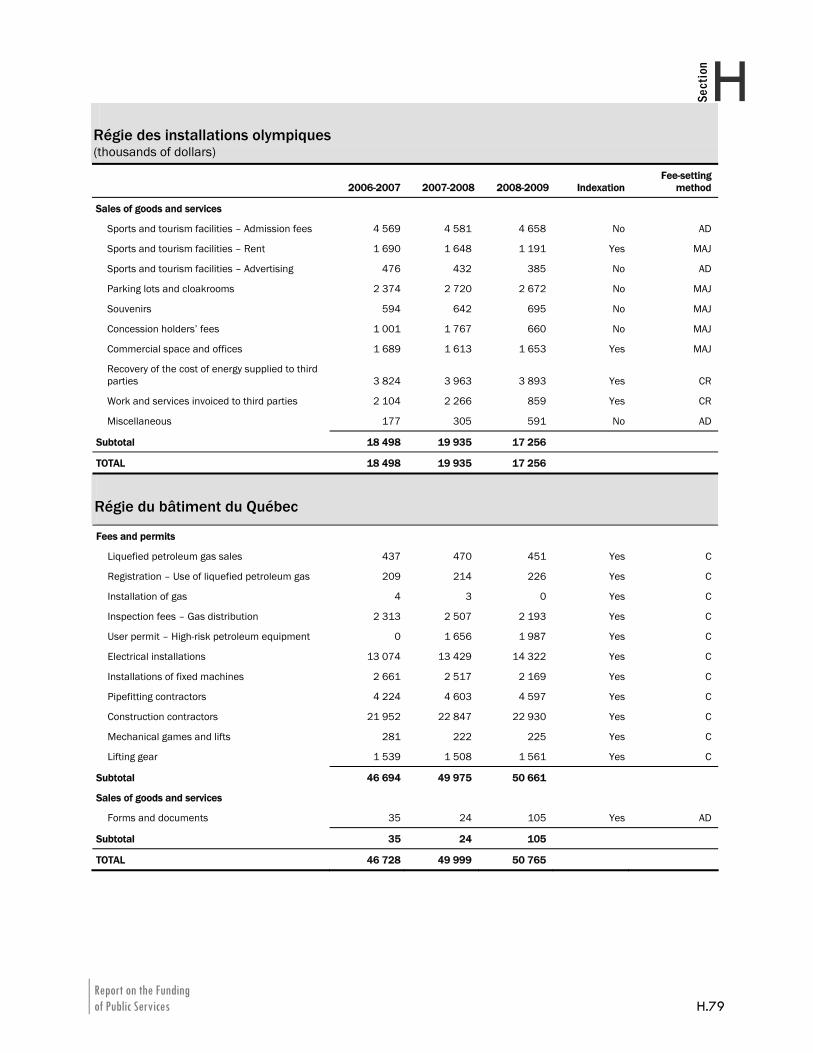
Report on the Funding of Public Services H.79
HSection
Régie des installations olympiques (thousands of dollars)
2006-2007 2007-2008 2008-2009 Indexation Fee-setting
method
Sales of goods and services
Sports and tourism facilities – Admission fees 4 569 4 581 4 658 No AD
Sports and tourism facilities – Rent 1 690 1 648 1 191 Yes MAJ
Sports and tourism facilities – Advertising 476 432 385 No AD
Parking lots and cloakrooms 2 374 2 720 2 672 No MAJ
Souvenirs 594 642 695 No MAJ
Concession holders’ fees 1 001 1 767 660 No MAJ
Commercial space and offices 1 689 1 613 1 653 Yes MAJ
Recovery of the cost of energy supplied to third parties 3 824 3 963 3 893 Yes CR
Work and services invoiced to third parties 2 104 2 266 859 Yes CR
Miscellaneous 177 305 591 No AD
Subtotal 18 498 19 935 17 256
TOTAL 18 498 19 935 17 256
Régie du bâtiment du Québec
Fees and permits
Liquefied petroleum gas sales 437 470 451 Yes C
Registration – Use of liquefied petroleum gas 209 214 226 Yes C
Installation of gas 4 3 0 Yes C
Inspection fees – Gas distribution 2 313 2 507 2 193 Yes C
User permit – High-risk petroleum equipment 0 1 656 1 987 Yes C
Electrical installations 13 074 13 429 14 322 Yes C
Installations of fixed machines 2 661 2 517 2 169 Yes C
Pipefitting contractors 4 224 4 603 4 597 Yes C
Construction contractors 21 952 22 847 22 930 Yes C
Mechanical games and lifts 281 222 225 Yes C
Lifting gear 1 539 1 508 1 561 Yes C
Subtotal 46 694 49 975 50 661
Sales of goods and services
Forms and documents 35 24 105 Yes AD
Subtotal 35 24 105
TOTAL 46 728 49 999 50 765
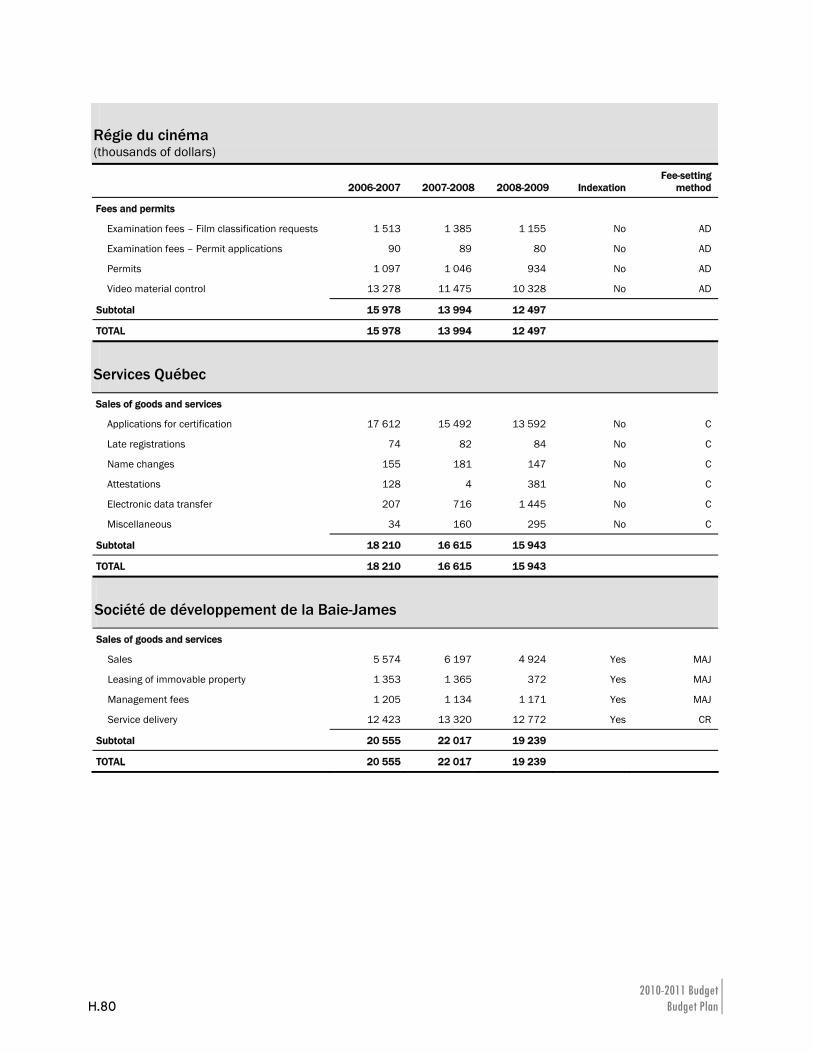
2010-2011 Budget H.80 Budget Plan
Régie du cinéma (thousands of dollars)
2006-2007 2007-2008 2008-2009 Indexation Fee-setting
method
Fees and permits
Examination fees – Film classification requests 1 513 1 385 1 155 No AD
Examination fees – Permit applications 90 89 80 No AD
Permits 1 097 1 046 934 No AD
Video material control 13 278 11 475 10 328 No AD
Subtotal 15 978 13 994 12 497
TOTAL 15 978 13 994 12 497
Services Québec
Sales of goods and services
Applications for certification 17 612 15 492 13 592 No C
Late registrations 74 82 84 No C
Name changes 155 181 147 No C
Attestations 128 4 381 No C
Electronic data transfer 207 716 1 445 No C
Miscellaneous 34 160 295 No C
Subtotal 18 210 16 615 15 943
TOTAL 18 210 16 615 15 943
Société de développement de la Baie-James
Sales of goods and services
Sales 5 574 6 197 4 924 Yes MAJ
Leasing of immovable property 1 353 1 365 372 Yes MAJ
Management fees 1 205 1 134 1 171 Yes MAJ
Service delivery 12 423 13 320 12 772 Yes CR
Subtotal 20 555 22 017 19 239
TOTAL 20 555 22 017 19 239
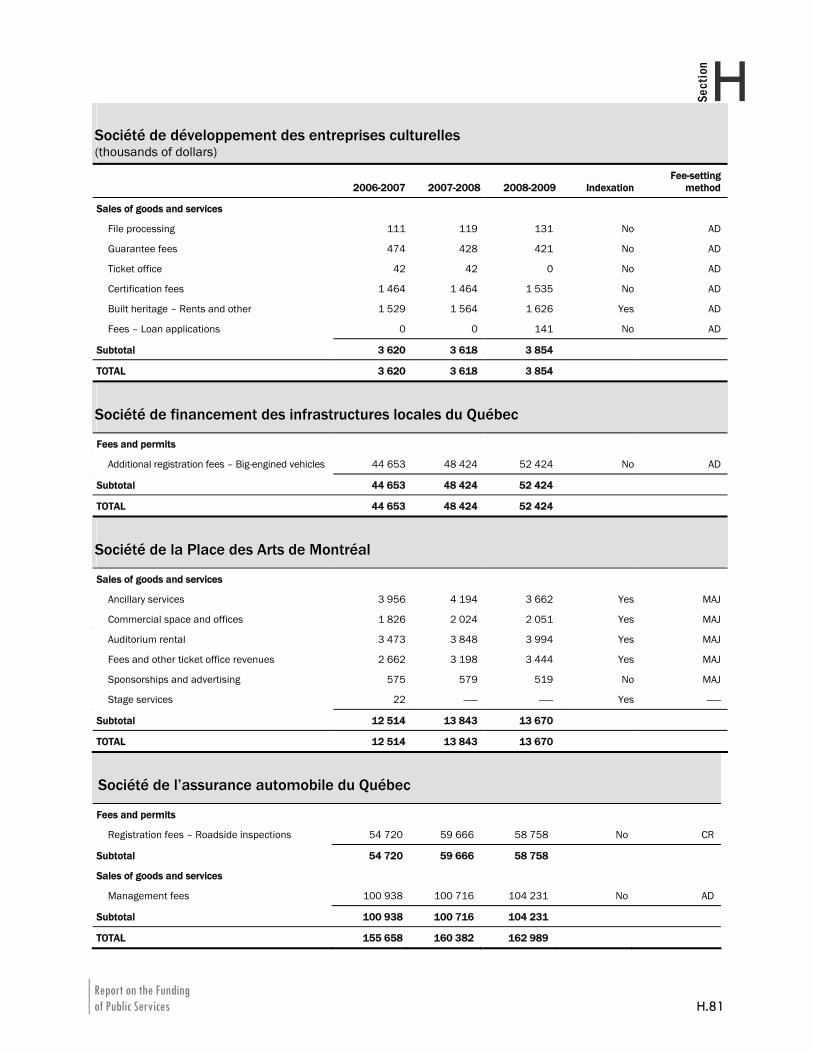
Report on the Funding of Public Services H.81
HSection
Société de l’assurance automobile du Québec
Société de développement des entreprises culturelles (thousands of dollars)
2006-2007 2007-2008 2008-2009 Indexation Fee-setting
method
Sales of goods and services
File processing 111 119 131 No AD
Guarantee fees 474 428 421 No AD
Ticket office 42 42 0 No AD
Certification fees 1 464 1 464 1 535 No AD
Built heritage – Rents and other 1 529 1 564 1 626 Yes AD
Fees – Loan applications 0 0 141 No AD
Subtotal 3 620 3 618 3 854
TOTAL 3 620 3 618 3 854
Société de financement des infrastructures locales du Québec
Fees and permits
Additional registration fees – Big-engined vehicles 44 653 48 424 52 424 No AD
Subtotal 44 653 48 424 52 424
TOTAL 44 653 48 424 52 424
Société de la Place des Arts de Montréal
Sales of goods and services
Ancillary services 3 956 4 194 3 662 Yes MAJ
Commercial space and offices 1 826 2 024 2 051 Yes MAJ
Auditorium rental 3 473 3 848 3 994 Yes MAJ
Fees and other ticket office revenues 2 662 3 198 3 444 Yes MAJ
Sponsorships and advertising 575 579 519 No MAJ
Stage services 22 —— —— Yes ——
Subtotal 12 514 13 843 13 670
TOTAL 12 514 13 843 13 670
Fees and permits
Registration fees – Roadside inspections 54 720 59 666 58 758 No CR
Subtotal 54 720 59 666 58 758
Sales of goods and services
Management fees 100 938 100 716 104 231 No AD
Subtotal 100 938 100 716 104 231
TOTAL 155 658 160 382 162 989
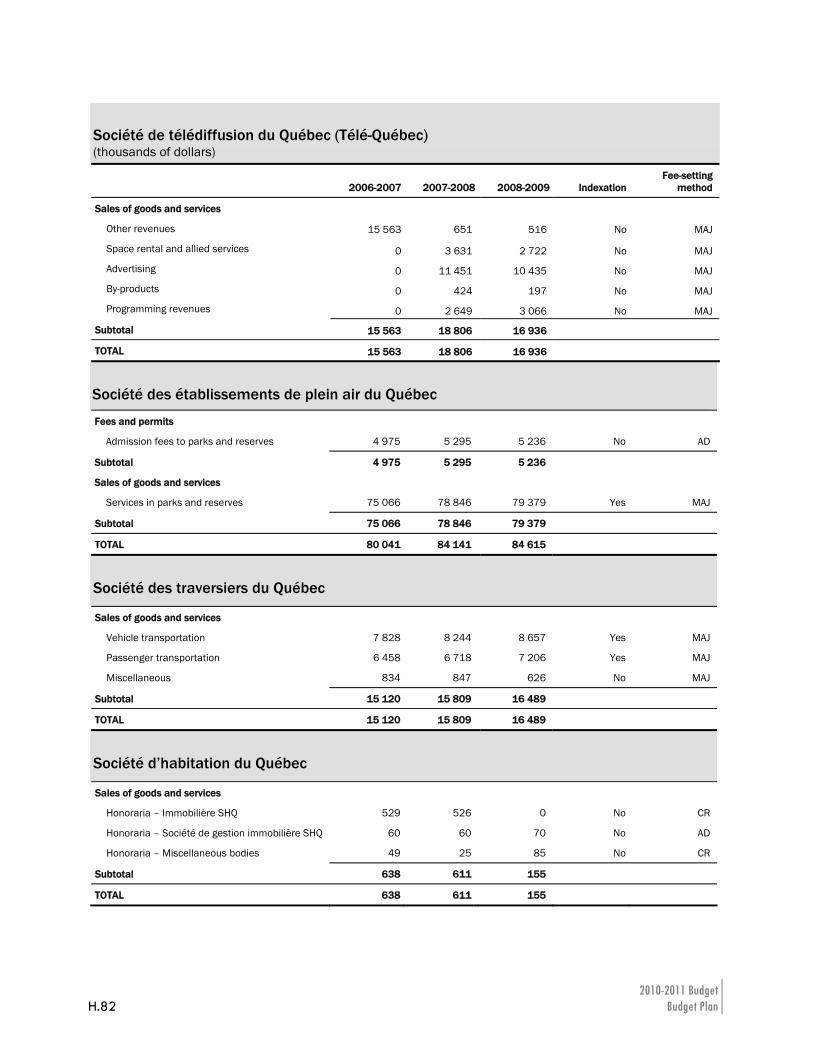
2010-2011 Budget H.82 Budget Plan
Société de télédiffusion du Québec (Télé-Québec) (thousands of dollars)
2006-2007 2007-2008 2008-2009 Indexation Fee-setting
method
Sales of goods and services
Other revenues 15 563 651 516 No MAJ
Space rental and allied services 0 3 631 2 722 No MAJ
Advertising 0 11 451 10 435 No MAJ
By-products 0 424 197 No MAJ
Programming revenues 0 2 649 3 066 No MAJ
Subtotal 15 563 18 806 16 936
TOTAL 15 563 18 806 16 936
Société des établissements de plein air du Québec
Fees and permits
Admission fees to parks and reserves 4 975 5 295 5 236 No AD
Subtotal 4 975 5 295 5 236
Sales of goods and services
Services in parks and reserves 75 066 78 846 79 379 Yes MAJ
Subtotal 75 066 78 846 79 379
TOTAL 80 041 84 141 84 615
Société des traversiers du Québec
Sales of goods and services
Vehicle transportation 7 828 8 244 8 657 Yes MAJ
Passenger transportation 6 458 6 718 7 206 Yes MAJ
Miscellaneous 834 847 626 No MAJ
Subtotal 15 120 15 809 16 489
TOTAL 15 120 15 809 16 489
Société d’habitation du Québec
Sales of goods and services
Honoraria – Immobilière SHQ 529 526 0 No CR
Honoraria – Société de gestion immobilière SHQ 60 60 70 No AD
Honoraria – Miscellaneous bodies 49 25 85 No CR
Subtotal 638 611 155
TOTAL 638 611 155
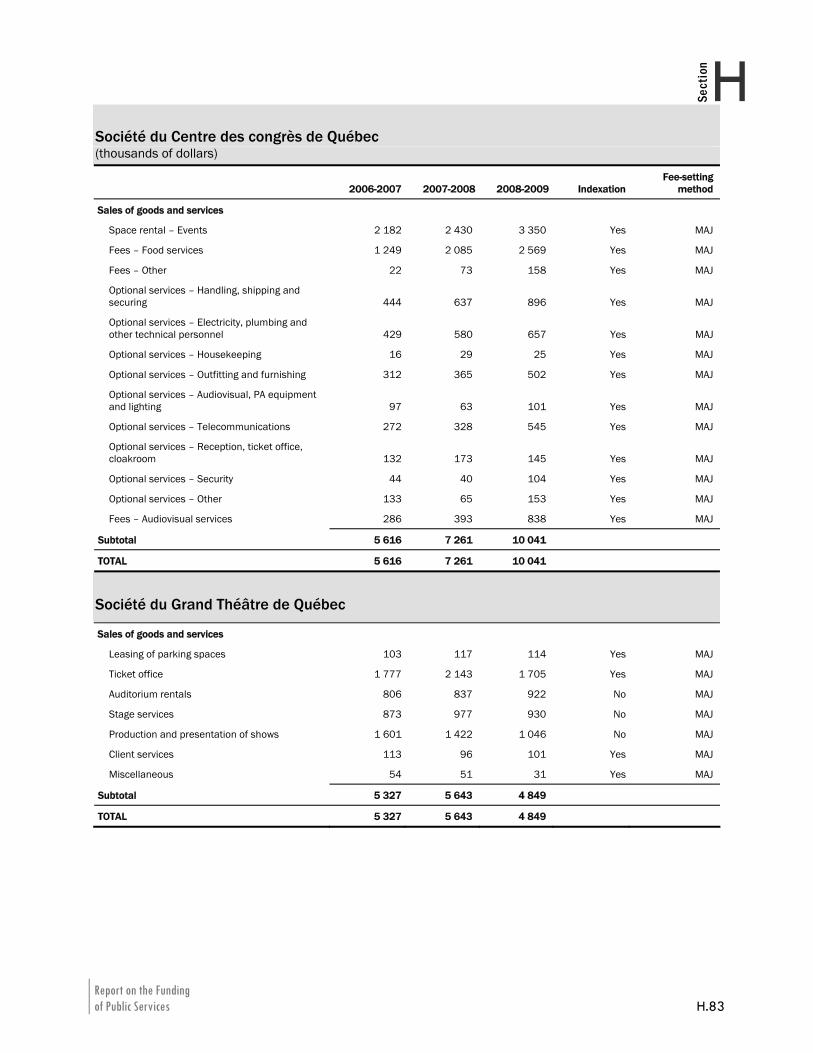
Report on the Funding of Public Services H.83
HSection
Société du Centre des congrès de Québec (thousands of dollars)
2006-2007 2007-2008 2008-2009 Indexation Fee-setting
method
Sales of goods and services
Space rental – Events 2 182 2 430 3 350 Yes MAJ
Fees – Food services 1 249 2 085 2 569 Yes MAJ
Fees – Other 22 73 158 Yes MAJ
Optional services – Handling, shipping and securing 444 637 896 Yes MAJ
Optional services – Electricity, plumbing and other technical personnel 429 580 657 Yes MAJ
Optional services – Housekeeping 16 29 25 Yes MAJ
Optional services – Outfitting and furnishing 312 365 502 Yes MAJ
Optional services – Audiovisual, PA equipment and lighting 97 63 101 Yes MAJ
Optional services – Telecommunications 272 328 545 Yes MAJ
Optional services – Reception, ticket office, cloakroom 132 173 145 Yes MAJ
Optional services – Security 44 40 104 Yes MAJ
Optional services – Other 133 65 153 Yes MAJ
Fees – Audiovisual services 286 393 838 Yes MAJ
Subtotal 5 616 7 261 10 041
TOTAL 5 616 7 261 10 041
Société du Grand Théâtre de Québec
Sales of goods and services
Leasing of parking spaces 103 117 114 Yes MAJ
Ticket office 1 777 2 143 1 705 Yes MAJ
Auditorium rentals 806 837 922 No MAJ
Stage services 873 977 930 No MAJ
Production and presentation of shows 1 601 1 422 1 046 No MAJ
Client services 113 96 101 Yes MAJ
Miscellaneous 54 51 31 Yes MAJ
Subtotal 5 327 5 643 4 849
TOTAL 5 327 5 643 4 849
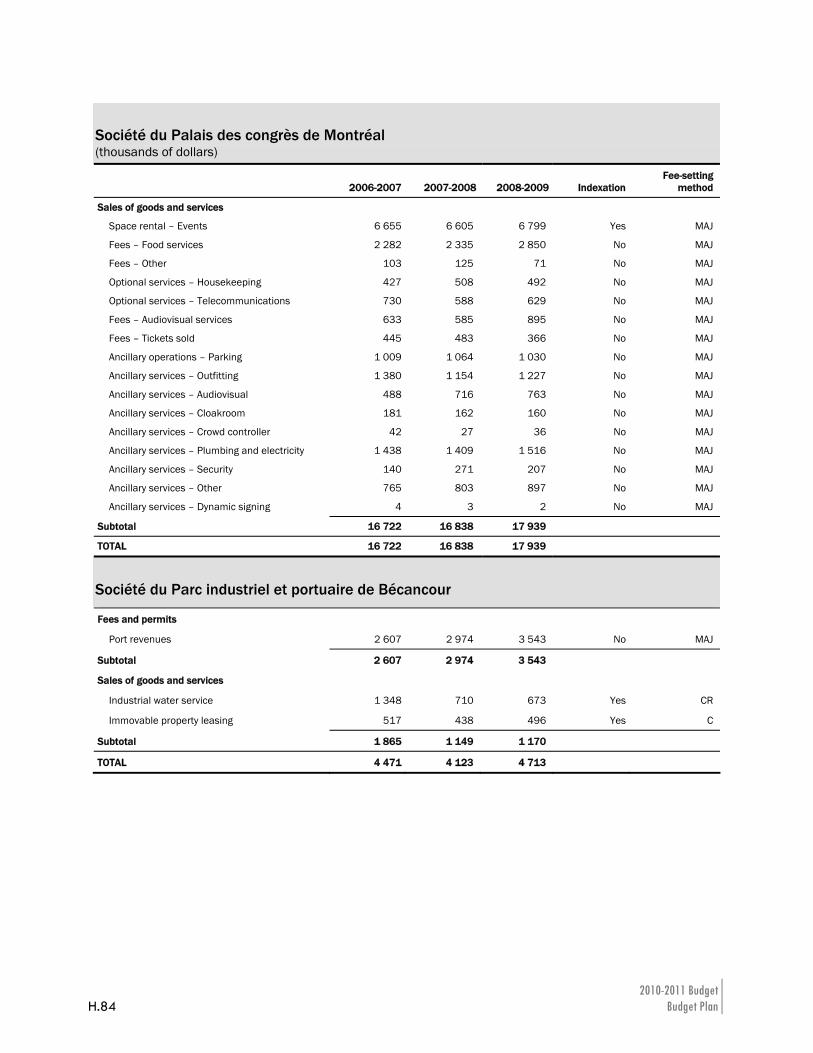
2010-2011 Budget H.84 Budget Plan
Société du Palais des congrès de Montréal (thousands of dollars)
2006-2007 2007-2008 2008-2009 Indexation Fee-setting
method
Sales of goods and services
Space rental – Events 6 655 6 605 6 799 Yes MAJ
Fees – Food services 2 282 2 335 2 850 No MAJ
Fees – Other 103 125 71 No MAJ
Optional services – Housekeeping 427 508 492 No MAJ
Optional services – Telecommunications 730 588 629 No MAJ
Fees – Audiovisual services 633 585 895 No MAJ
Fees – Tickets sold 445 483 366 No MAJ
Ancillary operations – Parking 1 009 1 064 1 030 No MAJ
Ancillary services – Outfitting 1 380 1 154 1 227 No MAJ
Ancillary services – Audiovisual 488 716 763 No MAJ
Ancillary services – Cloakroom 181 162 160 No MAJ
Ancillary services – Crowd controller 42 27 36 No MAJ
Ancillary services – Plumbing and electricity 1 438 1 409 1 516 No MAJ
Ancillary services – Security 140 271 207 No MAJ
Ancillary services – Other 765 803 897 No MAJ
Ancillary services – Dynamic signing 4 3 2 No MAJ
Subtotal 16 722 16 838 17 939
TOTAL 16 722 16 838 17 939
Société du Parc industriel et portuaire de Bécancour
Fees and permits
Port revenues 2 607 2 974 3 543 No MAJ
Subtotal 2 607 2 974 3 543
Sales of goods and services
Industrial water service 1 348 710 673 Yes CR
Immovable property leasing 517 438 496 Yes C
Subtotal 1 865 1 149 1 170
TOTAL 4 471 4 123 4 713
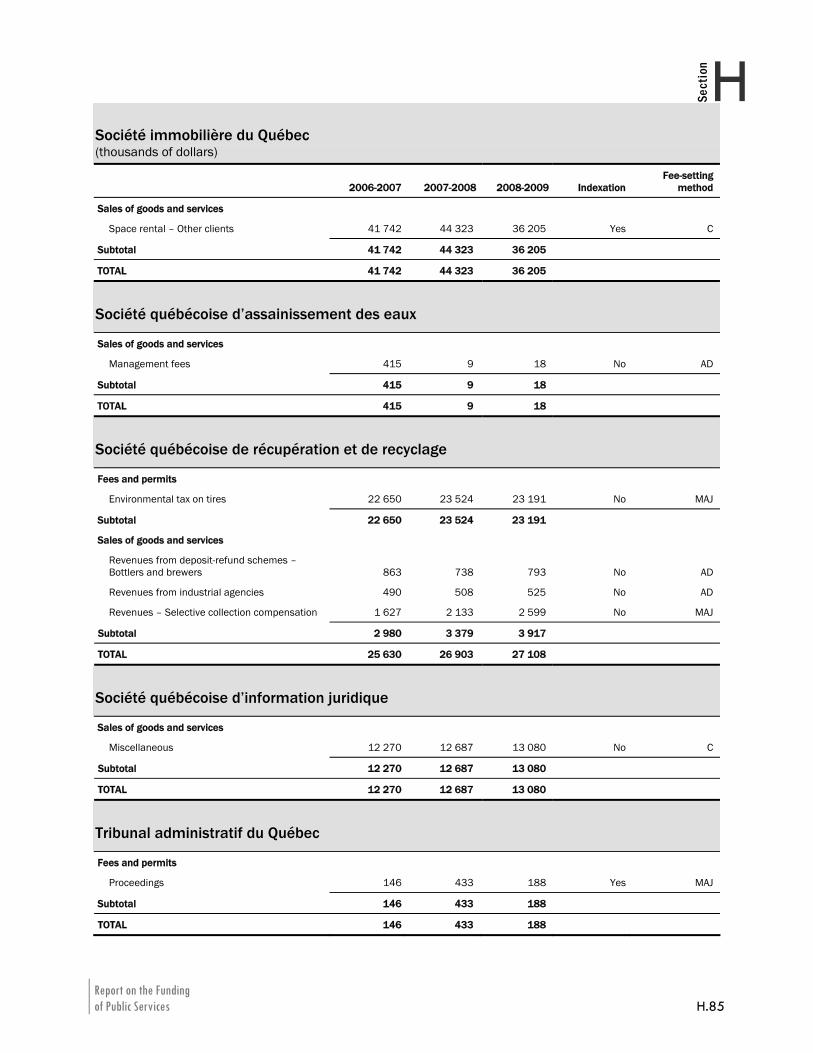
Report on the Funding of Public Services H.85
HSection
Société immobilière du Québec (thousands of dollars)
2006-2007 2007-2008 2008-2009 Indexation Fee-setting
method
Sales of goods and services
Space rental – Other clients 41 742 44 323 36 205 Yes C
Subtotal 41 742 44 323 36 205
TOTAL 41 742 44 323 36 205
Société québécoise d’assainissement des eaux
Sales of goods and services
Management fees 415 9 18 No AD
Subtotal 415 9 18
TOTAL 415 9 18
Société québécoise de récupération et de recyclage
Fees and permits
Environmental tax on tires 22 650 23 524 23 191 No MAJ
Subtotal 22 650 23 524 23 191
Sales of goods and services
Revenues from deposit-refund schemes – Bottlers and brewers 863 738 793 No AD
Revenues from industrial agencies 490 508 525 No AD
Revenues – Selective collection compensation 1 627 2 133 2 599 No MAJ
Subtotal 2 980 3 379 3 917
TOTAL 25 630 26 903 27 108
Société québécoise d’information juridique
Sales of goods and services
Miscellaneous 12 270 12 687 13 080 No C
Subtotal 12 270 12 687 13 080
TOTAL 12 270 12 687 13 080
Tribunal administratif du Québec
Fees and permits
Proceedings 146 433 188 Yes MAJ
Subtotal 146 433 188
TOTAL 146 433 188

I.1
Section I
I Additional Information Historical Data
1. ADDITIONAL INFORMATION..................................................................................I.3
Summary of consolidated budgetary and financial transactions ........................................................................................................... I.3 Revenue by source ................................................................................................ I.4 Expenditure by department................................................................................... I.5 Consolidated non-budgetary transactions ........................................................... I.6 Consolidated financing transactions.................................................................... I.7
2. HISTORICAL DATA ..............................................................................................I.9
Consolidated Revenue Fund................................................................................. I.9 Specified purpose accounts................................................................................ I.10 Non-budget-funded bodies and special funds................................................... I.11 Health and social services and education networks......................................... I.12 Generations Fund ................................................................................................ I.13 Summary of consolidated budgetary transactions............................................ I.14 Summary of consolidated non-budgetary transactions .................................... I.15 Debt of the Québec government......................................................................... I.16 Net debt of the Québec government .................................................................. I.17 Debt representing accumulated deficits............................................................ I.18 Change in debt service........................................................................................ I.19

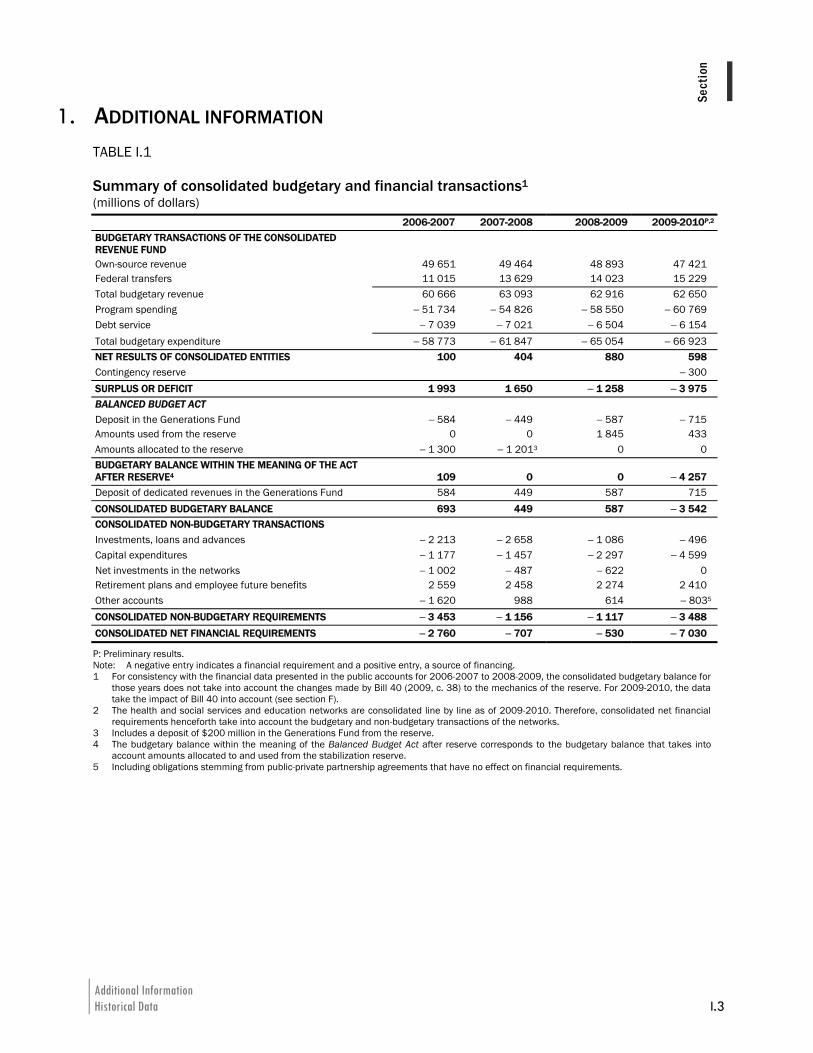
Additional Information Historical Data I.3
ISect
ion
1. ADDITIONAL INFORMATION TABLE I.1 Summary of consolidated budgetary and financial transactions1 (millions of dollars) 2006-2007 2007-2008 2008-2009 2009-2010P,2
BUDGETARY TRANSACTIONS OF THE CONSOLIDATED REVENUE FUND Own-source revenue 49 651 49 464 48 893 47 421 Federal transfers 11 015 13 629 14 023 15 229 Total budgetary revenue 60 666 63 093 62 916 62 650 Program spending − 51 734 − 54 826 − 58 550 − 60 769 Debt service − 7 039 − 7 021 − 6 504 − 6 154 Total budgetary expenditure − 58 773 − 61 847 − 65 054 − 66 923 NET RESULTS OF CONSOLIDATED ENTITIES 100 404 880 598 Contingency reserve − 300 SURPLUS OR DEFICIT 1 993 1 650 − 1 258 − 3 975 BALANCED BUDGET ACT Deposit in the Generations Fund − 584 − 449 − 587 − 715 Amounts used from the reserve 0 0 1 845 433 Amounts allocated to the reserve − 1 300 − 1 2013 0 0 BUDGETARY BALANCE WITHIN THE MEANING OF THE ACT AFTER RESERVE4 109 0 0 − 4 257 Deposit of dedicated revenues in the Generations Fund 584 449 587 715 CONSOLIDATED BUDGETARY BALANCE 693 449 587 − 3 542 CONSOLIDATED NON-BUDGETARY TRANSACTIONS Investments, loans and advances − 2 213 − 2 658 − 1 086 − 496 Capital expenditures − 1 177 − 1 457 − 2 297 − 4 599 Net investments in the networks − 1 002 − 487 − 622 0 Retirement plans and employee future benefits 2 559 2 458 2 274 2 410 Other accounts − 1 620 988 614 − 8035
CONSOLIDATED NON-BUDGETARY REQUIREMENTS − 3 453 − 1 156 − 1 117 − 3 488 CONSOLIDATED NET FINANCIAL REQUIREMENTS − 2 760 − 707 − 530 − 7 030
P: Preliminary results. Note: A negative entry indicates a financial requirement and a positive entry, a source of financing. 1 For consistency with the financial data presented in the public accounts for 2006-2007 to 2008-2009, the consolidated budgetary balance for
those years does not take into account the changes made by Bill 40 (2009, c. 38) to the mechanics of the reserve. For 2009-2010, the data take the impact of Bill 40 into account (see section F).
2 The health and social services and education networks are consolidated line by line as of 2009-2010. Therefore, consolidated net financial requirements henceforth take into account the budgetary and non-budgetary transactions of the networks.
3 Includes a deposit of $200 million in the Generations Fund from the reserve. 4 The budgetary balance within the meaning of the Balanced Budget Act after reserve corresponds to the budgetary balance that takes into
account amounts allocated to and used from the stabilization reserve. 5 Including obligations stemming from public-private partnership agreements that have no effect on financial requirements.
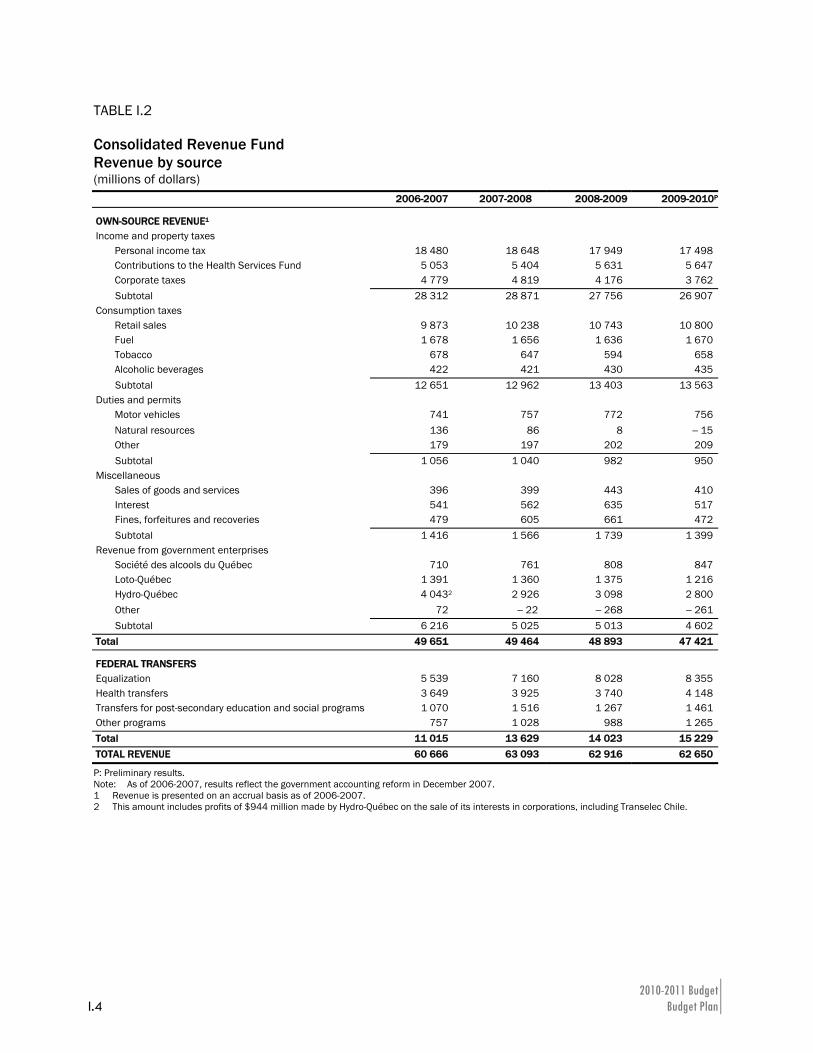
2010-2011 Budget I.4 Budget Plan
TABLE I.2 Consolidated Revenue Fund Revenue by source (millions of dollars) 2006-2007 2007-2008 2008-2009 2009-2010P
OWN-SOURCE REVENUE1 Income and property taxes
Personal income tax 18 480 18 648 17 949 17 498Contributions to the Health Services Fund 5 053 5 404 5 631 5 647Corporate taxes 4 779 4 819 4 176 3 762Subtotal 28 312 28 871 27 756 26 907
Consumption taxes Retail sales 9 873 10 238 10 743 10 800Fuel 1 678 1 656 1 636 1 670Tobacco 678 647 594 658Alcoholic beverages 422 421 430 435Subtotal 12 651 12 962 13 403 13 563
Duties and permits Motor vehicles 741 757 772 756Natural resources 136 86 8 − 15Other 179 197 202 209Subtotal 1 056 1 040 982 950
Miscellaneous Sales of goods and services 396 399 443 410Interest 541 562 635 517Fines, forfeitures and recoveries 479 605 661 472Subtotal 1 416 1 566 1 739 1 399
Revenue from government enterprises Société des alcools du Québec 710 761 808 847Loto-Québec 1 391 1 360 1 375 1 216Hydro-Québec 4 0432 2 926 3 098 2 800Other 72 − 22 − 268 − 261Subtotal 6 216 5 025 5 013 4 602
Total 49 651 49 464 48 893 47 421
FEDERAL TRANSFERS Equalization 5 539 7 160 8 028 8 355Health transfers 3 649 3 925 3 740 4 148Transfers for post-secondary education and social programs 1 070 1 516 1 267 1 461Other programs 757 1 028 988 1 265Total 11 015 13 629 14 023 15 229TOTAL REVENUE 60 666 63 093 62 916 62 650
P: Preliminary results. Note: As of 2006-2007, results reflect the government accounting reform in December 2007. 1 Revenue is presented on an accrual basis as of 2006-2007. 2 This amount includes profits of $944 million made by Hydro-Québec on the sale of its interests in corporations, including Transelec Chile.
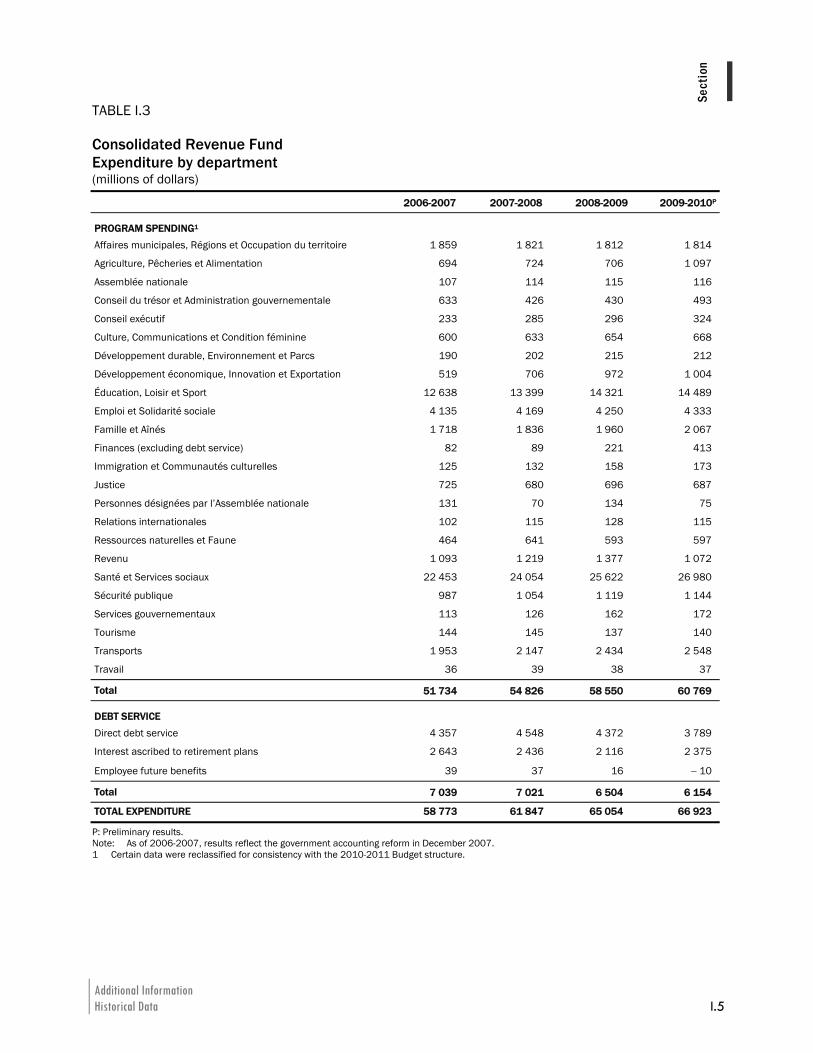
Additional Information Historical Data I.5
ISect
ion
TABLE I.3 Consolidated Revenue Fund Expenditure by department (millions of dollars)
2006-2007 2007-2008 2008-2009 2009-2010P
PROGRAM SPENDING1
Affaires municipales, Régions et Occupation du territoire 1 859 1 821 1 812 1 814
Agriculture, Pêcheries et Alimentation 694 724 706 1 097
Assemblée nationale 107 114 115 116
Conseil du trésor et Administration gouvernementale 633 426 430 493
Conseil exécutif 233 285 296 324
Culture, Communications et Condition féminine 600 633 654 668
Développement durable, Environnement et Parcs 190 202 215 212
Développement économique, Innovation et Exportation 519 706 972 1 004
Éducation, Loisir et Sport 12 638 13 399 14 321 14 489
Emploi et Solidarité sociale 4 135 4 169 4 250 4 333
Famille et Aînés 1 718 1 836 1 960 2 067
Finances (excluding debt service) 82 89 221 413
Immigration et Communautés culturelles 125 132 158 173
Justice 725 680 696 687
Personnes désignées par l’Assemblée nationale 131 70 134 75
Relations internationales 102 115 128 115
Ressources naturelles et Faune 464 641 593 597
Revenu 1 093 1 219 1 377 1 072
Santé et Services sociaux 22 453 24 054 25 622 26 980
Sécurité publique 987 1 054 1 119 1 144
Services gouvernementaux 113 126 162 172
Tourisme 144 145 137 140
Transports 1 953 2 147 2 434 2 548
Travail 36 39 38 37
Total 51 734 54 826 58 550 60 769
DEBT SERVICE
Direct debt service 4 357 4 548 4 372 3 789
Interest ascribed to retirement plans 2 643 2 436 2 116 2 375
Employee future benefits 39 37 16 − 10
Total 7 039 7 021 6 504 6 154
TOTAL EXPENDITURE 58 773 61 847 65 054 66 923
P: Preliminary results. Note: As of 2006-2007, results reflect the government accounting reform in December 2007. 1 Certain data were reclassified for consistency with the 2010-2011 Budget structure.
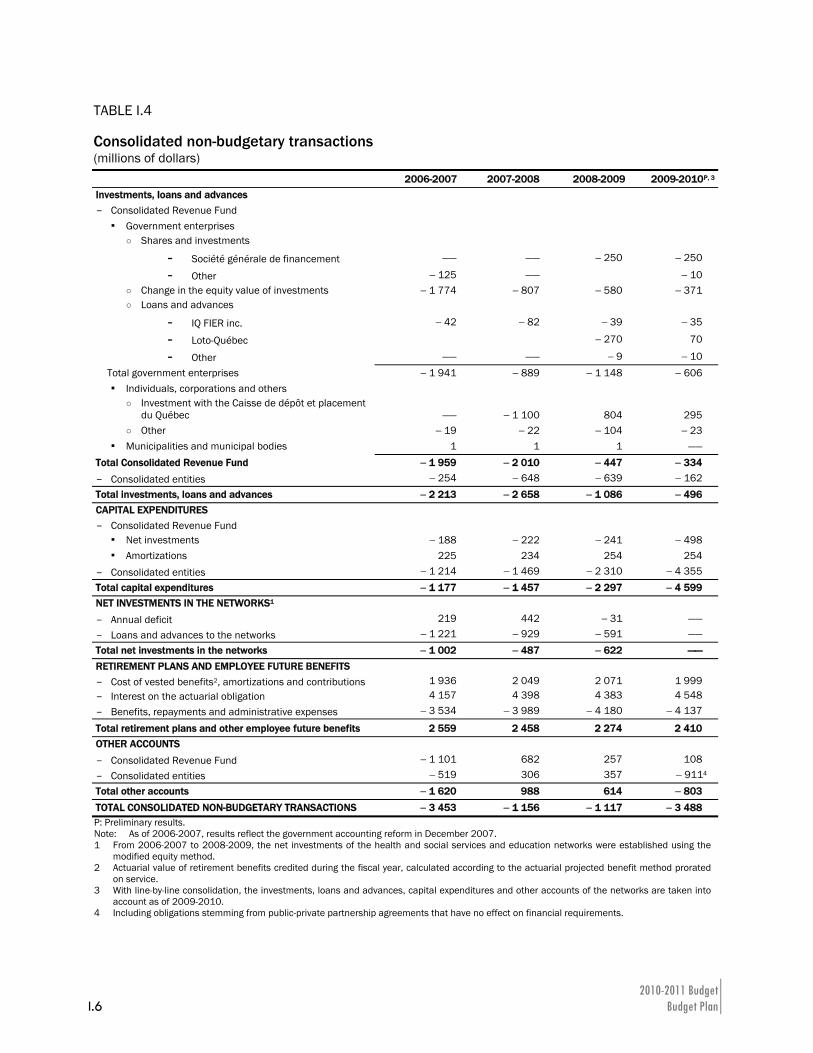
2010-2011 Budget I.6 Budget Plan
TABLE I.4 Consolidated non-budgetary transactions (millions of dollars) 2006-2007 2007-2008 2008-2009 2009-2010P, 3
Investments, loans and advances – Consolidated Revenue Fund
▪ Government enterprises ○ Shares and investments
- Société générale de financement —— —— − 250 − 250
- Other − 125 —— − 10 ○ Change in the equity value of investments − 1 774 − 807 − 580 − 371 ○ Loans and advances
- IQ FIER inc. − 42 − 82 − 39 − 35
- Loto-Québec − 270 70
- Other —— —— − 9 − 10 Total government enterprises − 1 941 − 889 − 1 148 − 606 ▪ Individuals, corporations and others
○ Investment with the Caisse de dépôt et placement du Québec —— − 1 100 804 295
○ Other − 19 − 22 − 104 − 23 ▪ Municipalities and municipal bodies 1 1 1 ——
Total Consolidated Revenue Fund − 1 959 − 2 010 − 447 − 334 – Consolidated entities − 254 − 648 − 639 − 162 Total investments, loans and advances − 2 213 − 2 658 − 1 086 − 496 CAPITAL EXPENDITURES – Consolidated Revenue Fund
▪ Net investments − 188 − 222 − 241 − 498 ▪ Amortizations 225 234 254 254
– Consolidated entities − 1 214 − 1 469 − 2 310 − 4 355 Total capital expenditures − 1 177 − 1 457 − 2 297 − 4 599 NET INVESTMENTS IN THE NETWORKS1 – Annual deficit 219 442 − 31 —— – Loans and advances to the networks − 1 221 − 929 − 591 —— Total net investments in the networks − 1 002 − 487 − 622 —— RETIREMENT PLANS AND EMPLOYEE FUTURE BENEFITS – Cost of vested benefits2, amortizations and contributions 1 936 2 049 2 071 1 999 – Interest on the actuarial obligation 4 157 4 398 4 383 4 548 – Benefits, repayments and administrative expenses − 3 534 − 3 989 − 4 180 − 4 137
Total retirement plans and other employee future benefits 2 559 2 458 2 274 2 410 OTHER ACCOUNTS – Consolidated Revenue Fund − 1 101 682 257 108 – Consolidated entities − 519 306 357 − 9114 Total other accounts − 1 620 988 614 − 803 TOTAL CONSOLIDATED NON-BUDGETARY TRANSACTIONS − 3 453 − 1 156 − 1 117 − 3 488 P: Preliminary results. Note: As of 2006-2007, results reflect the government accounting reform in December 2007. 1 From 2006-2007 to 2008-2009, the net investments of the health and social services and education networks were established using the
modified equity method. 2 Actuarial value of retirement benefits credited during the fiscal year, calculated according to the actuarial projected benefit method prorated
on service. 3 With line-by-line consolidation, the investments, loans and advances, capital expenditures and other accounts of the networks are taken into
account as of 2009-2010. 4 Including obligations stemming from public-private partnership agreements that have no effect on financial requirements.
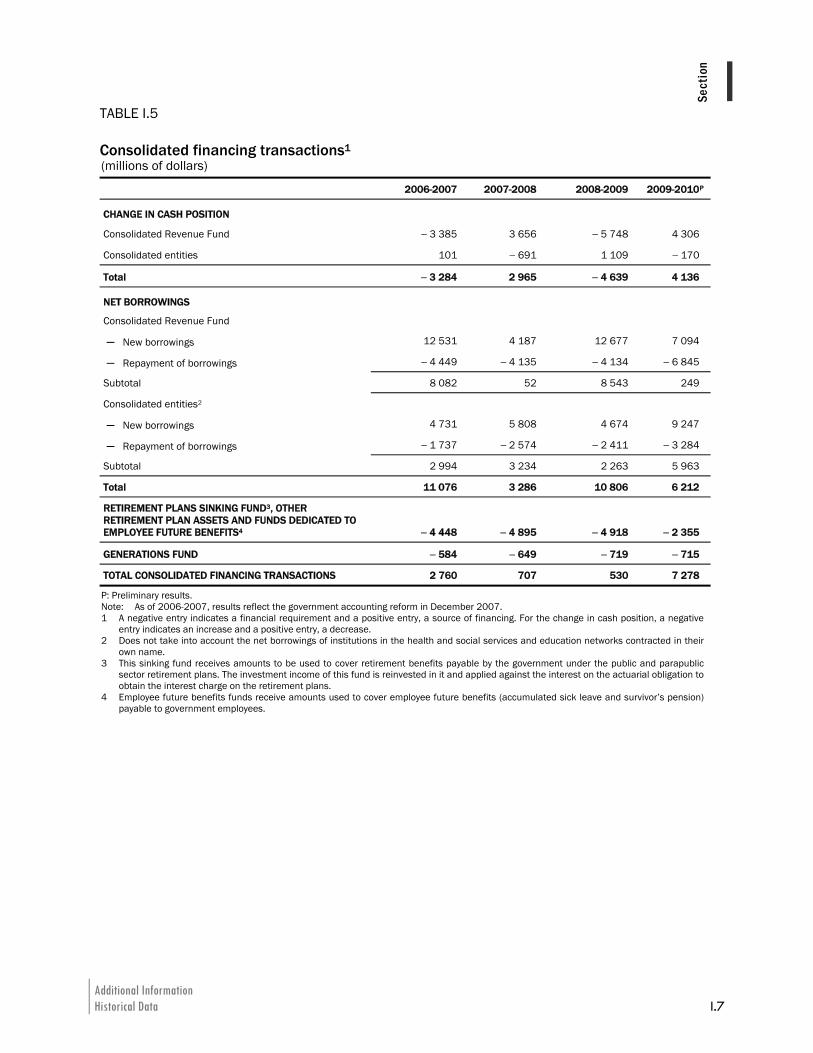
Additional Information Historical Data I.7
ISect
ion
TABLE I.5 Consolidated financing transactions1
(millions of dollars)
2006-2007 2007-2008 2008-2009 2009-2010P
CHANGE IN CASH POSITION
Consolidated Revenue Fund − 3 385 3 656 − 5 748 4 306
Consolidated entities 101 − 691 1 109 − 170
Total − 3 284 2 965 − 4 639 4 136
NET BORROWINGS
Consolidated Revenue Fund
─ New borrowings 12 531 4 187 12 677 7 094
─ Repayment of borrowings − 4 449 − 4 135 − 4 134 − 6 845
Subtotal 8 082 52 8 543 249
Consolidated entities2
─ New borrowings 4 731 5 808 4 674 9 247
─ Repayment of borrowings − 1 737 − 2 574 − 2 411 − 3 284
Subtotal 2 994 3 234 2 263 5 963
Total 11 076 3 286 10 806 6 212
RETIREMENT PLANS SINKING FUND3, OTHER RETIREMENT PLAN ASSETS AND FUNDS DEDICATED TO EMPLOYEE FUTURE BENEFITS4 − 4 448 − 4 895 − 4 918 − 2 355
GENERATIONS FUND − 584 − 649 − 719 − 715
TOTAL CONSOLIDATED FINANCING TRANSACTIONS 2 760 707 530 7 278
P: Preliminary results. Note: As of 2006-2007, results reflect the government accounting reform in December 2007. 1 A negative entry indicates a financial requirement and a positive entry, a source of financing. For the change in cash position, a negative
entry indicates an increase and a positive entry, a decrease. 2 Does not take into account the net borrowings of institutions in the health and social services and education networks contracted in their
own name. 3 This sinking fund receives amounts to be used to cover retirement benefits payable by the government under the public and parapublic
sector retirement plans. The investment income of this fund is reinvested in it and applied against the interest on the actuarial obligation to obtain the interest charge on the retirement plans.
4 Employee future benefits funds receive amounts used to cover employee future benefits (accumulated sick leave and survivor’s pension) payable to government employees.

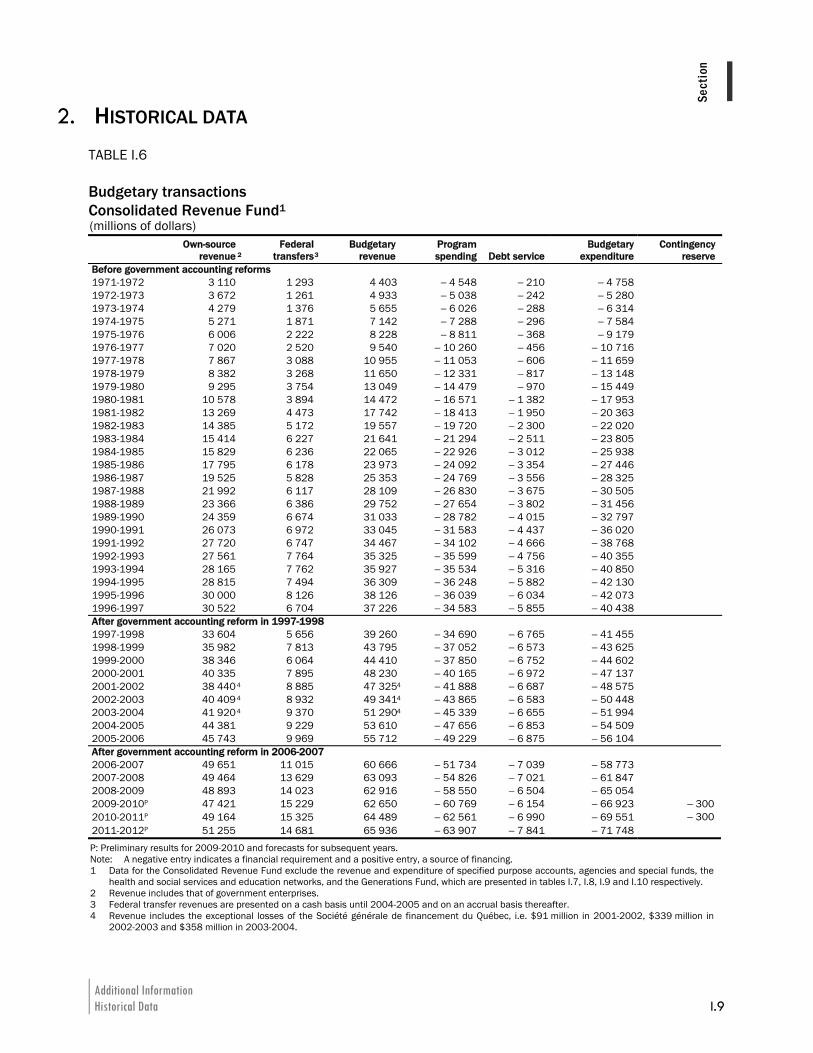
Additional Information Historical Data I.9
ISect
ion
2. HISTORICAL DATA TABLE I.6 Budgetary transactions Consolidated Revenue Fund1 (millions of dollars)
Own-source
revenue 2 Federal
transfers 3 Budgetary
revenue Program spending Debt service
Budgetary expenditure
Contingency reserve
Before government accounting reforms 1971-1972 3 110 1 293 4 403 − 4 548 − 210 − 4 758 1972-1973 3 672 1 261 4 933 − 5 038 − 242 − 5 280 1973-1974 4 279 1 376 5 655 − 6 026 − 288 − 6 314 1974-1975 5 271 1 871 7 142 − 7 288 − 296 − 7 584 1975-1976 6 006 2 222 8 228 − 8 811 − 368 − 9 179 1976-1977 7 020 2 520 9 540 − 10 260 − 456 − 10 716 1977-1978 7 867 3 088 10 955 − 11 053 − 606 − 11 659 1978-1979 8 382 3 268 11 650 − 12 331 − 817 − 13 148 1979-1980 9 295 3 754 13 049 − 14 479 − 970 − 15 449 1980-1981 10 578 3 894 14 472 − 16 571 − 1 382 − 17 953 1981-1982 13 269 4 473 17 742 − 18 413 − 1 950 − 20 363 1982-1983 14 385 5 172 19 557 − 19 720 − 2 300 − 22 020 1983-1984 15 414 6 227 21 641 − 21 294 − 2 511 − 23 805 1984-1985 15 829 6 236 22 065 − 22 926 − 3 012 − 25 938 1985-1986 17 795 6 178 23 973 − 24 092 − 3 354 − 27 446 1986-1987 19 525 5 828 25 353 − 24 769 − 3 556 − 28 325 1987-1988 21 992 6 117 28 109 − 26 830 − 3 675 − 30 505 1988-1989 23 366 6 386 29 752 − 27 654 − 3 802 − 31 456 1989-1990 24 359 6 674 31 033 − 28 782 − 4 015 − 32 797 1990-1991 26 073 6 972 33 045 − 31 583 − 4 437 − 36 020 1991-1992 27 720 6 747 34 467 − 34 102 − 4 666 − 38 768 1992-1993 27 561 7 764 35 325 − 35 599 − 4 756 − 40 355 1993-1994 28 165 7 762 35 927 − 35 534 − 5 316 − 40 850 1994-1995 28 815 7 494 36 309 − 36 248 − 5 882 − 42 130 1995-1996 30 000 8 126 38 126 − 36 039 − 6 034 − 42 073 1996-1997 30 522 6 704 37 226 − 34 583 − 5 855 − 40 438 After government accounting reform in 1997-1998 1997-1998 33 604 5 656 39 260 − 34 690 − 6 765 − 41 455 1998-1999 35 982 7 813 43 795 − 37 052 − 6 573 − 43 625 1999-2000 38 346 6 064 44 410 − 37 850 − 6 752 − 44 602 2000-2001 40 335 7 895 48 230 − 40 165 − 6 972 − 47 137 2001-2002 38 440 4 8 885 47 3254 − 41 888 − 6 687 − 48 575 2002-2003 40 409 4 8 932 49 3414 − 43 865 − 6 583 − 50 448 2003-2004 41 920 4 9 370 51 2904 − 45 339 − 6 655 − 51 994 2004-2005 44 381 9 229 53 610 − 47 656 − 6 853 − 54 509 2005-2006 45 743 9 969 55 712 − 49 229 − 6 875 − 56 104 After government accounting reform in 2006-2007 2006-2007 49 651 11 015 60 666 − 51 734 − 7 039 − 58 773 2007-2008 49 464 13 629 63 093 − 54 826 − 7 021 − 61 847 2008-2009 48 893 14 023 62 916 − 58 550 − 6 504 − 65 054 2009-2010P 47 421 15 229 62 650 − 60 769 − 6 154 − 66 923 − 300 2010-2011P 49 164 15 325 64 489 − 62 561 − 6 990 − 69 551 − 300 2011-2012P 51 255 14 681 65 936 − 63 907 − 7 841 − 71 748
P: Preliminary results for 2009-2010 and forecasts for subsequent years. Note: A negative entry indicates a financial requirement and a positive entry, a source of financing. 1 Data for the Consolidated Revenue Fund exclude the revenue and expenditure of specified purpose accounts, agencies and special funds, the
health and social services and education networks, and the Generations Fund, which are presented in tables I.7, I.8, I.9 and I.10 respectively. 2 Revenue includes that of government enterprises. 3 Federal transfer revenues are presented on a cash basis until 2004-2005 and on an accrual basis thereafter. 4 Revenue includes the exceptional losses of the Société générale de financement du Québec, i.e. $91 million in 2001-2002, $339 million in
2002-2003 and $358 million in 2003-2004.
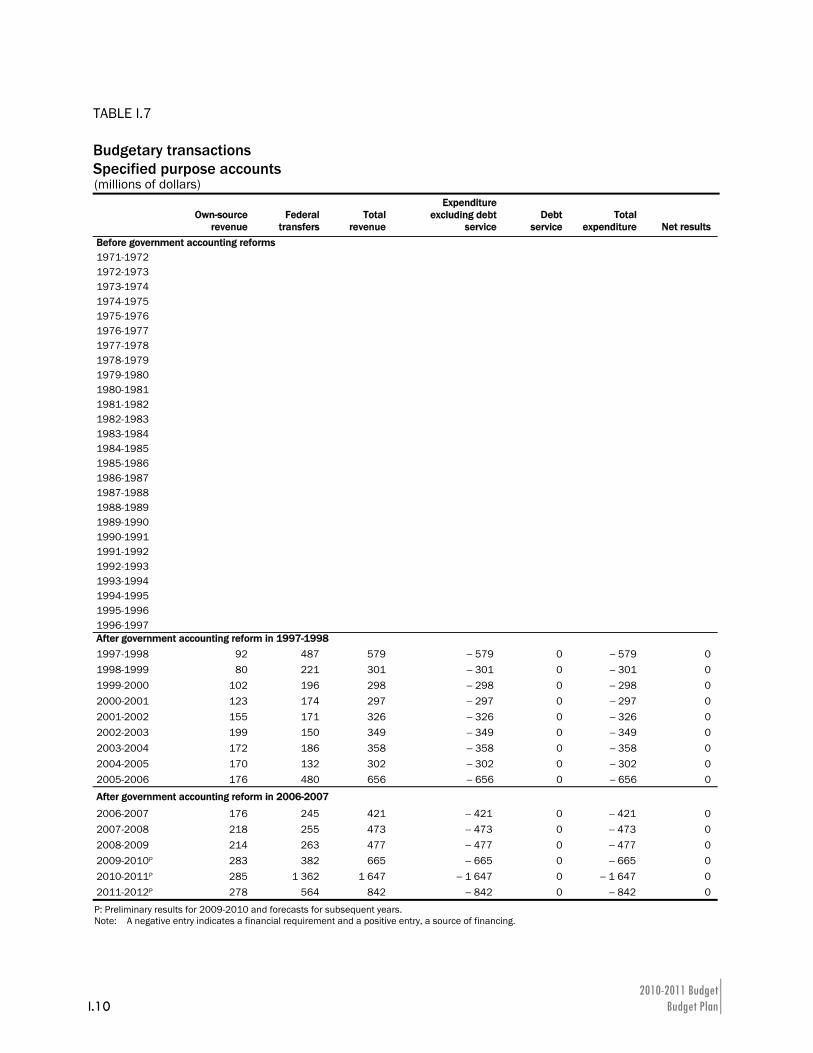
2010-2011 Budget I.10 Budget Plan
TABLE I.7 Budgetary transactions Specified purpose accounts (millions of dollars)
Own-source
revenue Federal
transfers Total
revenue
Expenditure excluding debt
serviceDebt
service Total
expenditure Net results Before government accounting reforms 1971-1972 1972-1973 1973-1974 1974-1975 1975-1976 1976-1977 1977-1978 1978-1979 1979-1980 1980-1981 1981-1982 1982-1983 1983-1984 1984-1985 1985-1986 1986-1987 1987-1988 1988-1989 1989-1990 1990-1991 1991-1992 1992-1993 1993-1994 1994-1995 1995-1996 1996-1997 After government accounting reform in 1997-1998 1997-1998 92 487 579 − 579 0 − 579 0 1998-1999 80 221 301 − 301 0 − 301 0 1999-2000 102 196 298 − 298 0 − 298 0 2000-2001 123 174 297 − 297 0 − 297 0 2001-2002 155 171 326 − 326 0 − 326 0 2002-2003 199 150 349 − 349 0 − 349 0 2003-2004 172 186 358 − 358 0 − 358 0 2004-2005 170 132 302 − 302 0 − 302 0 2005-2006 176 480 656 − 656 0 − 656 0
After government accounting reform in 2006-2007
2006-2007 176 245 421 − 421 0 − 421 0 2007-2008 218 255 473 − 473 0 − 473 0 2008-2009 214 263 477 − 477 0 − 477 0 2009-2010P 283 382 665 − 665 0 − 665 0 2010-2011P 285 1 362 1 647 − 1 647 0 − 1 647 0 2011-2012P 278 564 842 − 842 0 − 842 0
P: Preliminary results for 2009-2010 and forecasts for subsequent years. Note: A negative entry indicates a financial requirement and a positive entry, a source of financing.
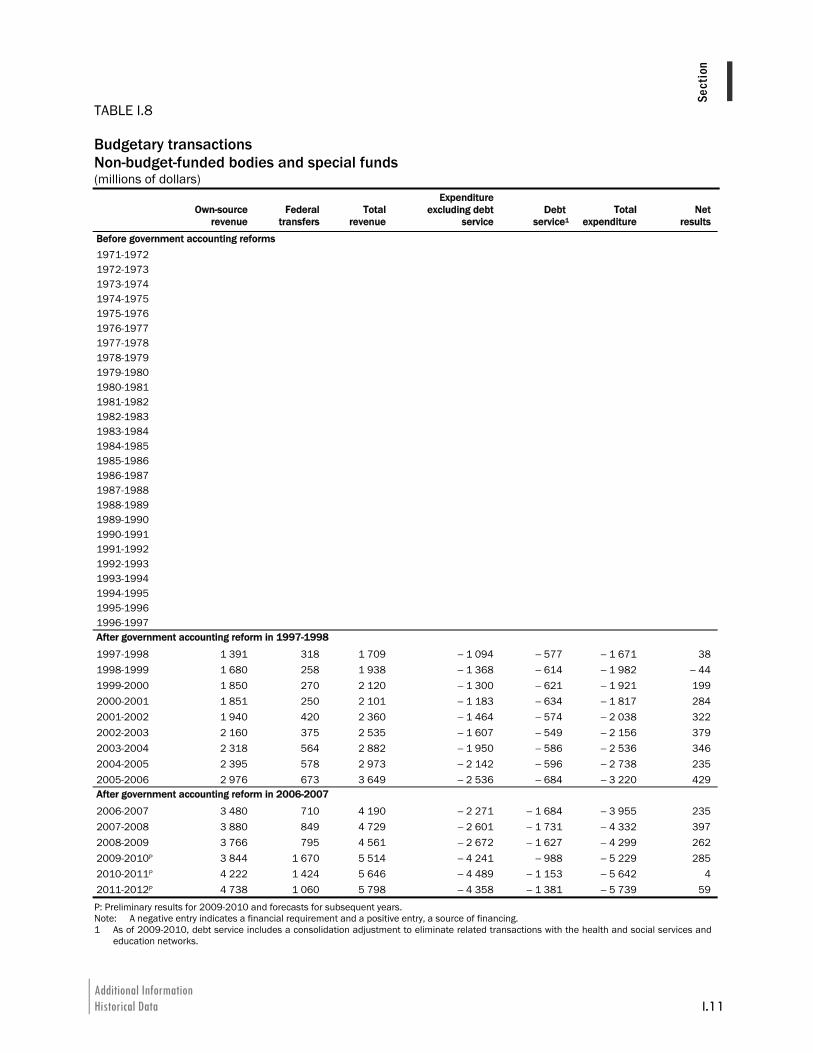
Additional Information Historical Data I.11
ISect
ion
TABLE I.8 Budgetary transactions Non-budget-funded bodies and special funds (millions of dollars)
Own-source
revenue Federal
transfers Total
revenue
Expenditure excluding debt
serviceDebt
service1Total
expenditure Net
results
Before government accounting reforms 1971-1972 1972-1973 1973-1974 1974-1975 1975-1976 1976-1977 1977-1978 1978-1979 1979-1980 1980-1981 1981-1982 1982-1983 1983-1984 1984-1985 1985-1986 1986-1987 1987-1988 1988-1989 1989-1990 1990-1991 1991-1992 1992-1993 1993-1994 1994-1995 1995-1996 1996-1997 After government accounting reform in 1997-1998
1997-1998 1 391 318 1 709 − 1 094 − 577 − 1 671 38 1998-1999 1 680 258 1 938 − 1 368 − 614 − 1 982 − 44 1999-2000 1 850 270 2 120 − 1 300 − 621 − 1 921 199 2000-2001 1 851 250 2 101 − 1 183 − 634 − 1 817 284 2001-2002 1 940 420 2 360 − 1 464 − 574 − 2 038 322 2002-2003 2 160 375 2 535 − 1 607 − 549 − 2 156 379 2003-2004 2 318 564 2 882 − 1 950 − 586 − 2 536 346 2004-2005 2 395 578 2 973 − 2 142 − 596 − 2 738 235 2005-2006 2 976 673 3 649 − 2 536 − 684 − 3 220 429 After government accounting reform in 2006-2007
2006-2007 3 480 710 4 190 − 2 271 − 1 684 − 3 955 235 2007-2008 3 880 849 4 729 − 2 601 − 1 731 − 4 332 397 2008-2009 3 766 795 4 561 − 2 672 − 1 627 − 4 299 262 2009-2010P 3 844 1 670 5 514 − 4 241 − 988 − 5 229 285 2010-2011P 4 222 1 424 5 646 − 4 489 − 1 153 − 5 642 4 2011-2012P 4 738 1 060 5 798 − 4 358 − 1 381 − 5 739 59
P: Preliminary results for 2009-2010 and forecasts for subsequent years. Note: A negative entry indicates a financial requirement and a positive entry, a source of financing. 1 As of 2009-2010, debt service includes a consolidation adjustment to eliminate related transactions with the health and social services and
education networks.
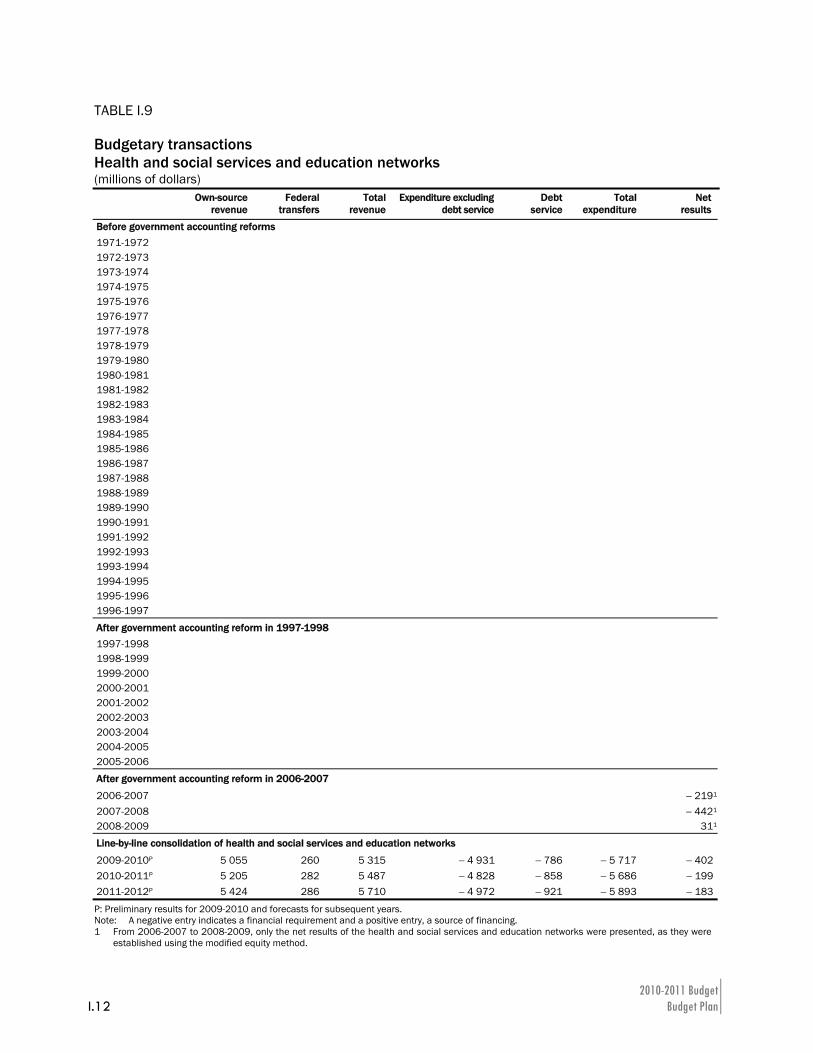
2010-2011 Budget I.12 Budget Plan
TABLE I.9 Budgetary transactions Health and social services and education networks (millions of dollars)
Own-source
revenue Federal
transfers Total
revenue Expenditure excluding
debt serviceDebt
service Total
expenditure Net
results
Before government accounting reforms 1971-1972 1972-1973 1973-1974 1974-1975 1975-1976 1976-1977 1977-1978 1978-1979 1979-1980 1980-1981 1981-1982 1982-1983 1983-1984 1984-1985 1985-1986 1986-1987 1987-1988 1988-1989 1989-1990 1990-1991 1991-1992 1992-1993 1993-1994 1994-1995 1995-1996 1996-1997 After government accounting reform in 1997-1998 1997-1998 1998-1999 1999-2000 2000-2001 2001-2002 2002-2003 2003-2004 2004-2005 2005-2006 After government accounting reform in 2006-2007
2006-2007 − 2191
2007-2008 − 4421
2008-2009 311
Line-by-line consolidation of health and social services and education networks
2009-2010P 5 055 260 5 315 − 4 931 − 786 − 5 717 − 4022010-2011P 5 205 282 5 487 − 4 828 − 858 − 5 686 − 1992011-2012P 5 424 286 5 710 − 4 972 − 921 − 5 893 − 183
P: Preliminary results for 2009-2010 and forecasts for subsequent years. Note: A negative entry indicates a financial requirement and a positive entry, a source of financing. 1 From 2006-2007 to 2008-2009, only the net results of the health and social services and education networks were presented, as they were
established using the modified equity method.
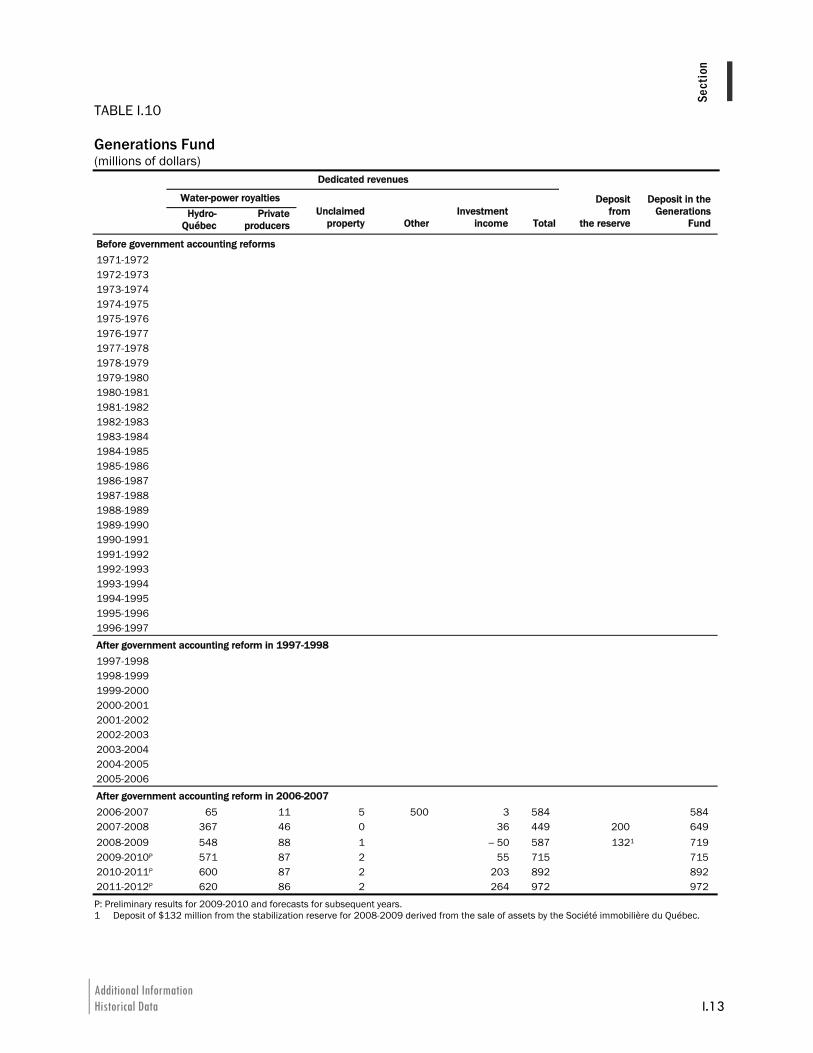
Additional Information Historical Data I.13
ISect
ion
TABLE I.10 Generations Fund
(millions of dollars) Dedicated revenues
Water-power royalties
Hydro-
Québec Private
producers Unclaimed
property OtherInvestment
income Total
Deposit from
the reserve
Deposit in the Generations
Fund
Before government accounting reforms 1971-1972 1972-1973 1973-1974 1974-1975 1975-1976 1976-1977 1977-1978 1978-1979 1979-1980 1980-1981 1981-1982 1982-1983 1983-1984 1984-1985 1985-1986 1986-1987 1987-1988 1988-1989 1989-1990 1990-1991 1991-1992 1992-1993 1993-1994 1994-1995 1995-1996 1996-1997
After government accounting reform in 1997-1998 1997-1998 1998-1999 1999-2000 2000-2001 2001-2002 2002-2003 2003-2004 2004-2005 2005-2006 After government accounting reform in 2006-2007 2006-2007 65 11 5 500 3 584 584 2007-2008 367 46 0 36 449 200 649 2008-2009 548 88 1 − 50 587 1321 719 2009-2010P 571 87 2 55 715 715 2010-2011P 600 87 2 203 892 892 2011-2012P 620 86 2 264 972 972
P: Preliminary results for 2009-2010 and forecasts for subsequent years. 1 Deposit of $132 million from the stabilization reserve for 2008-2009 derived from the sale of assets by the Société immobilière du Québec.
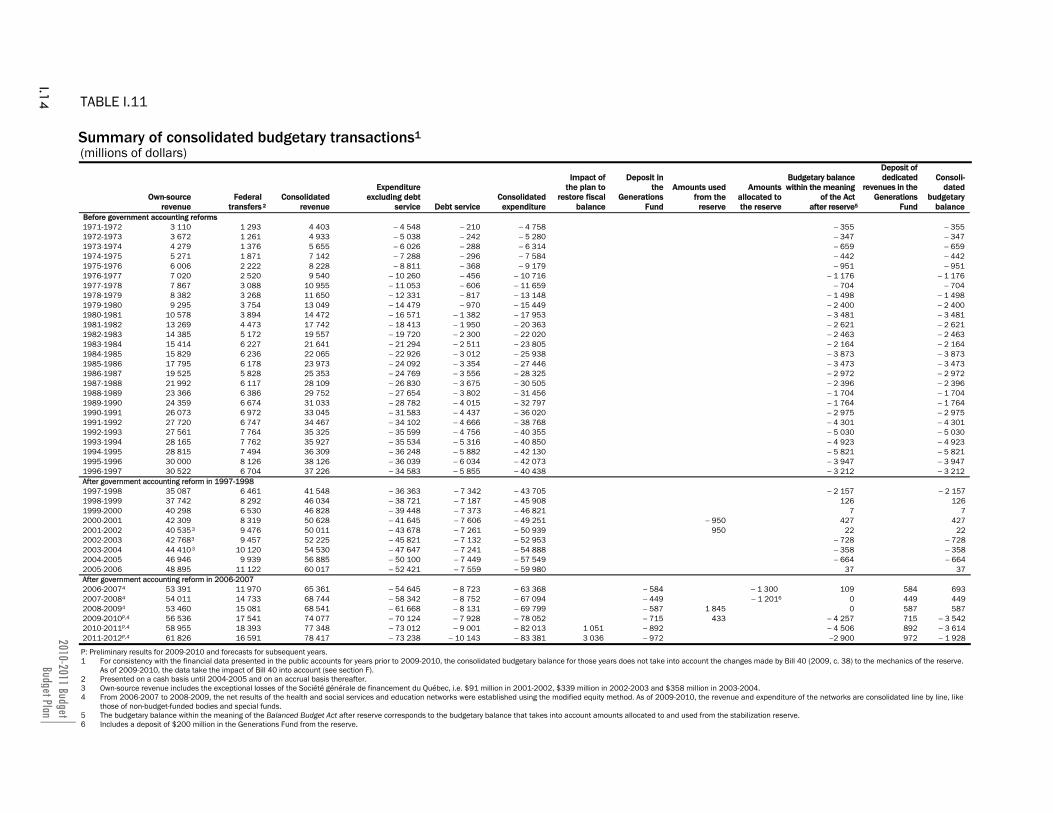
2010-2011 BudgetBud get Plan
I.14 TABLE I.11 Summary of consolidated budgetary transactions1 (millions of dollars)
Own-source
revenue Federal
transfers 2 Consolidated
revenue
Expenditure excluding debt
service Debt service Consolidated
expenditure
Impact of the plan to
restore fiscal balance
Deposit in the
Generations Fund
Amounts used from the
reserve
Amounts allocated to the reserve
Budgetary balance within the meaning
of the Act after reserve5
Deposit of dedicated
revenues in the Generations
Fund
Consoli-dated
budgetary balance
Before government accounting reforms 1971-1972 3 110 1 293 4 403 − 4 548 − 210 − 4 758 − 355 − 355 1972-1973 3 672 1 261 4 933 − 5 038 − 242 − 5 280 − 347 − 347 1973-1974 4 279 1 376 5 655 − 6 026 − 288 − 6 314 − 659 − 659 1974-1975 5 271 1 871 7 142 − 7 288 − 296 − 7 584 − 442 − 442 1975-1976 6 006 2 222 8 228 − 8 811 − 368 − 9 179 − 951 − 951 1976-1977 7 020 2 520 9 540 − 10 260 − 456 − 10 716 − 1 176 − 1 176 1977-1978 7 867 3 088 10 955 − 11 053 − 606 − 11 659 − 704 − 704 1978-1979 8 382 3 268 11 650 − 12 331 − 817 − 13 148 − 1 498 − 1 498 1979-1980 9 295 3 754 13 049 − 14 479 − 970 − 15 449 − 2 400 − 2 400 1980-1981 10 578 3 894 14 472 − 16 571 − 1 382 − 17 953 − 3 481 − 3 481 1981-1982 13 269 4 473 17 742 − 18 413 − 1 950 − 20 363 − 2 621 − 2 621 1982-1983 14 385 5 172 19 557 − 19 720 − 2 300 − 22 020 − 2 463 − 2 463 1983-1984 15 414 6 227 21 641 − 21 294 − 2 511 − 23 805 − 2 164 − 2 164 1984-1985 15 829 6 236 22 065 − 22 926 − 3 012 − 25 938 − 3 873 − 3 873 1985-1986 17 795 6 178 23 973 − 24 092 − 3 354 − 27 446 − 3 473 − 3 473 1986-1987 19 525 5 828 25 353 − 24 769 − 3 556 − 28 325 − 2 972 − 2 972 1987-1988 21 992 6 117 28 109 − 26 830 − 3 675 − 30 505 − 2 396 − 2 396 1988-1989 23 366 6 386 29 752 − 27 654 − 3 802 − 31 456 − 1 704 − 1 704 1989-1990 24 359 6 674 31 033 − 28 782 − 4 015 − 32 797 − 1 764 − 1 764 1990-1991 26 073 6 972 33 045 − 31 583 − 4 437 − 36 020 − 2 975 − 2 975 1991-1992 27 720 6 747 34 467 − 34 102 − 4 666 − 38 768 − 4 301 − 4 301 1992-1993 27 561 7 764 35 325 − 35 599 − 4 756 − 40 355 − 5 030 − 5 030 1993-1994 28 165 7 762 35 927 − 35 534 − 5 316 − 40 850 − 4 923 − 4 923 1994-1995 28 815 7 494 36 309 − 36 248 − 5 882 − 42 130 − 5 821 − 5 821 1995-1996 30 000 8 126 38 126 − 36 039 − 6 034 − 42 073 − 3 947 − 3 947 1996-1997 30 522 6 704 37 226 − 34 583 − 5 855 − 40 438 − 3 212 − 3 212 After government accounting reform in 1997-1998 1997-1998 35 087 6 461 41 548 − 36 363 − 7 342 − 43 705 − 2 157 − 2 157 1998-1999 37 742 8 292 46 034 − 38 721 − 7 187 − 45 908 126 126 1999-2000 40 298 6 530 46 828 − 39 448 − 7 373 − 46 821 7 7 2000-2001 42 309 8 319 50 628 − 41 645 − 7 606 − 49 251 − 950 427 427 2001-2002 40 535 3 9 476 50 011 − 43 678 − 7 261 − 50 939 950 22 22 2002-2003 42 768 3 9 457 52 225 − 45 821 − 7 132 − 52 953 − 728 − 728 2003-2004 44 410 3 10 120 54 530 − 47 647 − 7 241 − 54 888 − 358 − 358 2004-2005 46 946 9 939 56 885 − 50 100 − 7 449 − 57 549 − 664 − 664 2005-2006 48 895 11 122 60 017 − 52 421 − 7 559 − 59 980 37 37 After government accounting reform in 2006-2007 2006-20074 53 391 11 970 65 361 − 54 645 − 8 723 − 63 368 − 584 − 1 300 109 584 693 2007-20084 54 011 14 733 68 744 − 58 342 − 8 752 − 67 094 − 449 − 1 2016 0 449 449 2008-20094 53 460 15 081 68 541 − 61 668 − 8 131 − 69 799 − 587 1 845 0 587 587 2009-2010P,4 56 536 17 541 74 077 − 70 124 − 7 928 − 78 052 − 715 433 − 4 257 715 − 3 542 2010-2011P,4 58 955 18 393 77 348 − 73 012 − 9 001 − 82 013 1 051 − 892 − 4 506 892 − 3 614 2011-2012P,4 61 826 16 591 78 417 − 73 238 − 10 143 − 83 381 3 036 − 972 −2 900 972 − 1 928
P: Preliminary results for 2009-2010 and forecasts for subsequent years. 1 For consistency with the financial data presented in the public accounts for years prior to 2009-2010, the consolidated budgetary balance for those years does not take into account the changes made by Bill 40 (2009, c. 38) to the mechanics of the reserve.
As of 2009-2010, the data take the impact of Bill 40 into account (see section F). 2 Presented on a cash basis until 2004-2005 and on an accrual basis thereafter. 3 Own-source revenue includes the exceptional losses of the Société générale de financement du Québec, i.e. $91 million in 2001-2002, $339 million in 2002-2003 and $358 million in 2003-2004. 4 From 2006-2007 to 2008-2009, the net results of the health and social services and education networks were established using the modified equity method. As of 2009-2010, the revenue and expenditure of the networks are consolidated line by line, like
those of non-budget-funded bodies and special funds. 5 The budgetary balance within the meaning of the Balanced Budget Act after reserve corresponds to the budgetary balance that takes into account amounts allocated to and used from the stabilization reserve. 6 Includes a deposit of $200 million in the Generations Fund from the reserve.
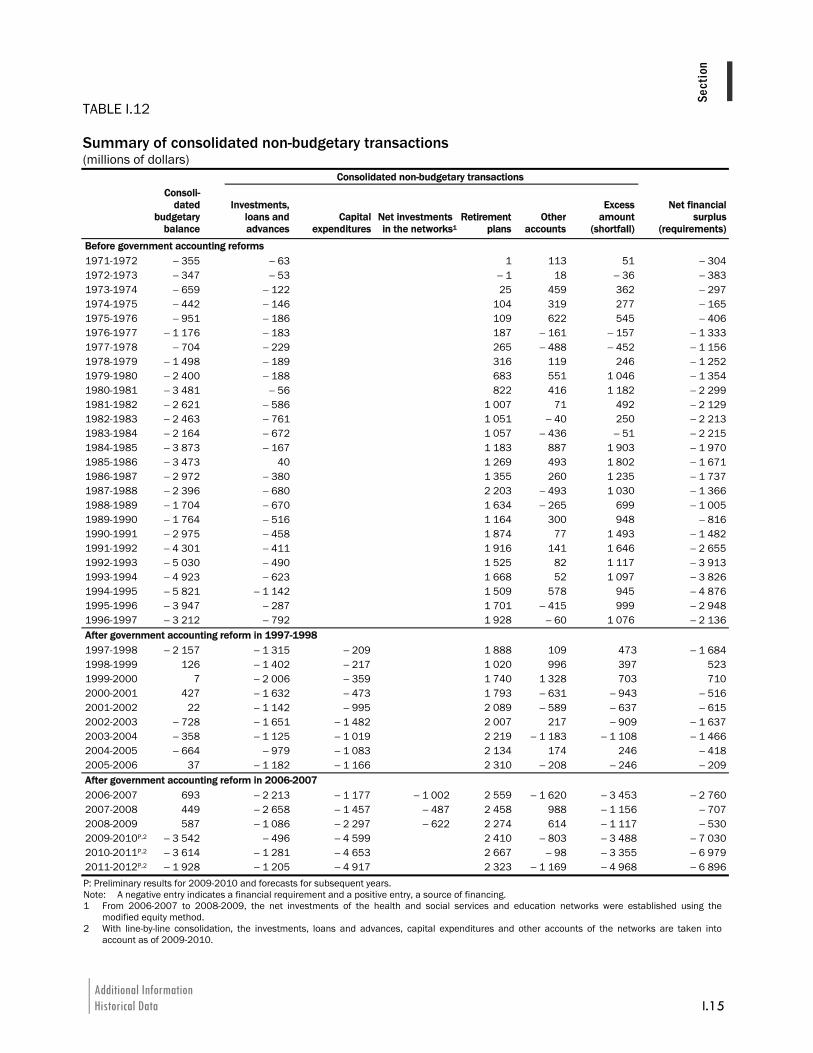
Additional Information Historical Data I.15
ISect
ion
TABLE I.12 Summary of consolidated non-budgetary transactions
(millions of dollars) Consolidated non-budgetary transactions
Consoli-dated
budgetary balance
Investments, loans and advances
Capital expenditures
Net investments in the networks1
Retirement plans
Other accounts
Excess amount
(shortfall)
Net financial surplus
(requirements)
Before government accounting reforms 1971-1972 − 355 − 63 1 113 51 − 3041972-1973 − 347 − 53 − 1 18 − 36 − 3831973-1974 − 659 − 122 25 459 362 − 2971974-1975 − 442 − 146 104 319 277 − 1651975-1976 − 951 − 186 109 622 545 − 4061976-1977 − 1 176 − 183 187 − 161 − 157 − 1 3331977-1978 − 704 − 229 265 − 488 − 452 − 1 1561978-1979 − 1 498 − 189 316 119 246 − 1 2521979-1980 − 2 400 − 188 683 551 1 046 − 1 3541980-1981 − 3 481 − 56 822 416 1 182 − 2 2991981-1982 − 2 621 − 586 1 007 71 492 − 2 1291982-1983 − 2 463 − 761 1 051 − 40 250 − 2 2131983-1984 − 2 164 − 672 1 057 − 436 − 51 − 2 2151984-1985 − 3 873 − 167 1 183 887 1 903 − 1 9701985-1986 − 3 473 40 1 269 493 1 802 − 1 6711986-1987 − 2 972 − 380 1 355 260 1 235 − 1 7371987-1988 − 2 396 − 680 2 203 − 493 1 030 − 1 3661988-1989 − 1 704 − 670 1 634 − 265 699 − 1 0051989-1990 − 1 764 − 516 1 164 300 948 − 8161990-1991 − 2 975 − 458 1 874 77 1 493 − 1 4821991-1992 − 4 301 − 411 1 916 141 1 646 − 2 6551992-1993 − 5 030 − 490 1 525 82 1 117 − 3 9131993-1994 − 4 923 − 623 1 668 52 1 097 − 3 8261994-1995 − 5 821 − 1 142 1 509 578 945 − 4 8761995-1996 − 3 947 − 287 1 701 − 415 999 − 2 9481996-1997 − 3 212 − 792 1 928 − 60 1 076 − 2 136After government accounting reform in 1997-1998 1997-1998 − 2 157 − 1 315 − 209 1 888 109 473 − 1 6841998-1999 126 − 1 402 − 217 1 020 996 397 5231999-2000 7 − 2 006 − 359 1 740 1 328 703 7102000-2001 427 − 1 632 − 473 1 793 − 631 − 943 − 5162001-2002 22 − 1 142 − 995 2 089 − 589 − 637 − 6152002-2003 − 728 − 1 651 − 1 482 2 007 217 − 909 − 1 6372003-2004 − 358 − 1 125 − 1 019 2 219 − 1 183 − 1 108 − 1 4662004-2005 − 664 − 979 − 1 083 2 134 174 246 − 4182005-2006 37 − 1 182 − 1 166 2 310 − 208 − 246 − 209After government accounting reform in 2006-2007 2006-2007 693 − 2 213 − 1 177 − 1 002 2 559 − 1 620 − 3 453 − 2 7602007-2008 449 − 2 658 − 1 457 − 487 2 458 988 − 1 156 − 7072008-2009 587 − 1 086 − 2 297 − 622 2 274 614 − 1 117 − 5302009-2010P,2 − 3 542 − 496 − 4 599 2 410 − 803 − 3 488 − 7 0302010-2011P,2 − 3 614 − 1 281 − 4 653 2 667 − 98 − 3 355 − 6 9792011-2012P,2 − 1 928 − 1 205 − 4 917 2 323 − 1 169 − 4 968 − 6 896P: Preliminary results for 2009-2010 and forecasts for subsequent years. Note: A negative entry indicates a financial requirement and a positive entry, a source of financing. 1 From 2006-2007 to 2008-2009, the net investments of the health and social services and education networks were established using the
modified equity method. 2 With line-by-line consolidation, the investments, loans and advances, capital expenditures and other accounts of the networks are taken into
account as of 2009-2010.
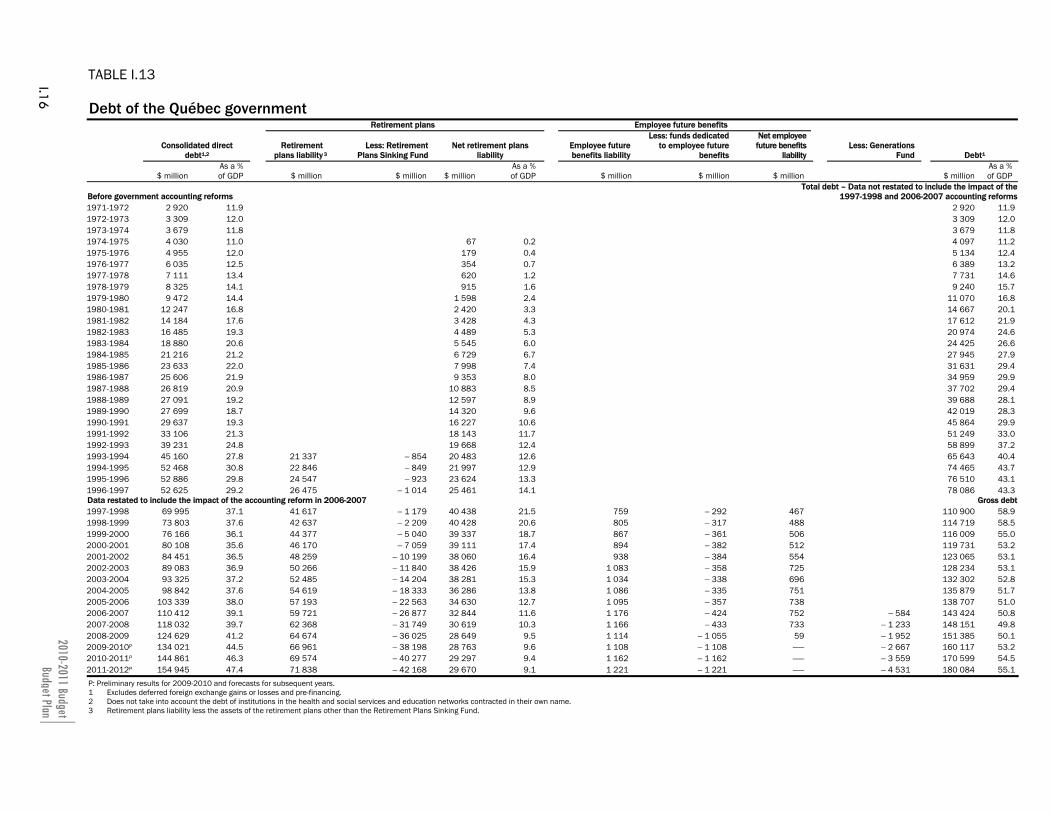
2010-2011 BudgetBud get Plan
I.16
TABLE I.13 Debt of the Québec government
Retirement plans Employee future benefits
Consolidated direct
debt1,2 Retirement
plans liability 3 Less: Retirement
Plans Sinking Fund Net retirement plans
liability Employee future benefits liability
Less: funds dedicated to employee future
benefits
Net employee future benefits
liability Less: Generations
Fund Debt1
$ million As a % of GDP $ million $ million $ million
As a % of GDP $ million $ million $ million $ million
As a % of GDP
Before government accounting reforms Total debt – Data not restated to include the impact of the
1997-1998 and 2006-2007 accounting reforms 1971-1972 2 920 11.9 2 920 11.9 1972-1973 3 309 12.0 3 309 12.0 1973-1974 3 679 11.8 3 679 11.8 1974-1975 4 030 11.0 67 0.2 4 097 11.2 1975-1976 4 955 12.0 179 0.4 5 134 12.4 1976-1977 6 035 12.5 354 0.7 6 389 13.2 1977-1978 7 111 13.4 620 1.2 7 731 14.6 1978-1979 8 325 14.1 915 1.6 9 240 15.7 1979-1980 9 472 14.4 1 598 2.4 11 070 16.8 1980-1981 12 247 16.8 2 420 3.3 14 667 20.1 1981-1982 14 184 17.6 3 428 4.3 17 612 21.9 1982-1983 16 485 19.3 4 489 5.3 20 974 24.6 1983-1984 18 880 20.6 5 545 6.0 24 425 26.6 1984-1985 21 216 21.2 6 729 6.7 27 945 27.9 1985-1986 23 633 22.0 7 998 7.4 31 631 29.4 1986-1987 25 606 21.9 9 353 8.0 34 959 29.9 1987-1988 26 819 20.9 10 883 8.5 37 702 29.4 1988-1989 27 091 19.2 12 597 8.9 39 688 28.1 1989-1990 27 699 18.7 14 320 9.6 42 019 28.3 1990-1991 29 637 19.3 16 227 10.6 45 864 29.9 1991-1992 33 106 21.3 18 143 11.7 51 249 33.0 1992-1993 39 231 24.8 19 668 12.4 58 899 37.2 1993-1994 45 160 27.8 21 337 − 854 20 483 12.6 65 643 40.4 1994-1995 52 468 30.8 22 846 − 849 21 997 12.9 74 465 43.7 1995-1996 52 886 29.8 24 547 − 923 23 624 13.3 76 510 43.1 1996-1997 52 625 29.2 26 475 − 1 014 25 461 14.1 78 086 43.3 Data restated to include the impact of the accounting reform in 2006-2007 Gross debt 1997-1998 69 995 37.1 41 617 − 1 179 40 438 21.5 759 − 292 467 110 900 58.9 1998-1999 73 803 37.6 42 637 − 2 209 40 428 20.6 805 − 317 488 114 719 58.5 1999-2000 76 166 36.1 44 377 − 5 040 39 337 18.7 867 − 361 506 116 009 55.0 2000-2001 80 108 35.6 46 170 − 7 059 39 111 17.4 894 − 382 512 119 731 53.2 2001-2002 84 451 36.5 48 259 − 10 199 38 060 16.4 938 − 384 554 123 065 53.1 2002-2003 89 083 36.9 50 266 − 11 840 38 426 15.9 1 083 − 358 725 128 234 53.1 2003-2004 93 325 37.2 52 485 − 14 204 38 281 15.3 1 034 − 338 696 132 302 52.8 2004-2005 98 842 37.6 54 619 − 18 333 36 286 13.8 1 086 − 335 751 135 879 51.7 2005-2006 103 339 38.0 57 193 − 22 563 34 630 12.7 1 095 − 357 738 138 707 51.0 2006-2007 110 412 39.1 59 721 − 26 877 32 844 11.6 1 176 − 424 752 − 584 143 424 50.8 2007-2008 118 032 39.7 62 368 − 31 749 30 619 10.3 1 166 − 433 733 − 1 233 148 151 49.8 2008-2009 124 629 41.2 64 674 − 36 025 28 649 9.5 1 114 − 1 055 59 − 1 952 151 385 50.1 2009-2010P 134 021 44.5 66 961 − 38 198 28 763 9.6 1 108 − 1 108 —— − 2 667 160 117 53.2 2010-2011P 144 861 46.3 69 574 − 40 277 29 297 9.4 1 162 − 1 162 —— − 3 559 170 599 54.5 2011-2012P 154 945 47.4 71 838 − 42 168 29 670 9.1 1 221 − 1 221 —— − 4 531 180 084 55.1 P: Preliminary results for 2009-2010 and forecasts for subsequent years. 1 Excludes deferred foreign exchange gains or losses and pre-financing. 2 Does not take into account the debt of institutions in the health and social services and education networks contracted in their own name. 3 Retirement plans liability less the assets of the retirement plans other than the Retirement Plans Sinking Fund.
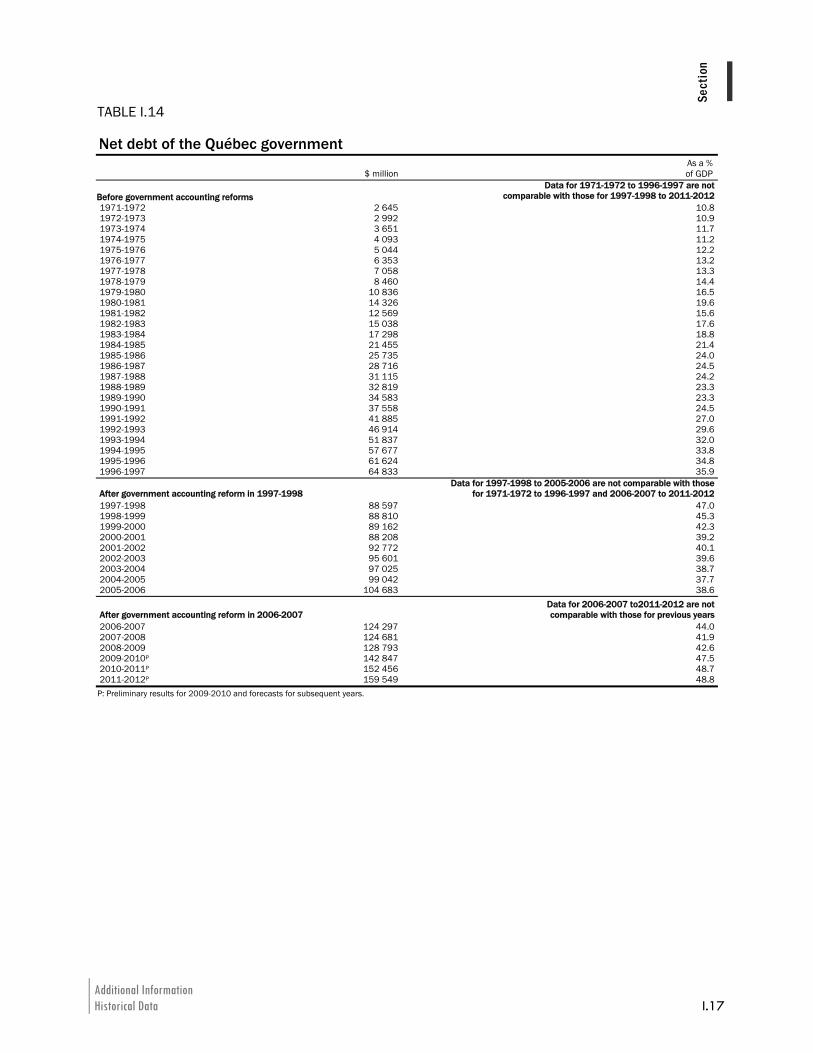
Additional Information Historical Data I.17
ISect
ion
TABLE I.14
Net debt of the Québec government
$ million As a %of GDP
Before government accounting reforms Data for 1971-1972 to 1996-1997 are not
comparable with those for 1997-1998 to 2011-20121971-1972 2 645 10.81972-1973 2 992 10.91973-1974 3 651 11.71974-1975 4 093 11.21975-1976 5 044 12.21976-1977 6 353 13.21977-1978 7 058 13.31978-1979 8 460 14.41979-1980 10 836 16.51980-1981 14 326 19.61981-1982 12 569 15.61982-1983 15 038 17.61983-1984 17 298 18.81984-1985 21 455 21.41985-1986 25 735 24.01986-1987 28 716 24.51987-1988 31 115 24.21988-1989 32 819 23.31989-1990 34 583 23.31990-1991 37 558 24.51991-1992 41 885 27.01992-1993 46 914 29.61993-1994 51 837 32.01994-1995 57 677 33.81995-1996 61 624 34.81996-1997 64 833 35.9
After government accounting reform in 1997-1998 Data for 1997-1998 to 2005-2006 are not comparable with those
for 1971-1972 to 1996-1997 and 2006-2007 to 2011-20121997-1998 88 597 47.01998-1999 88 810 45.31999-2000 89 162 42.32000-2001 88 208 39.22001-2002 92 772 40.12002-2003 95 601 39.62003-2004 97 025 38.72004-2005 99 042 37.72005-2006 104 683 38.6
After government accounting reform in 2006-2007 Data for 2006-2007 to2011-2012 are not comparable with those for previous years
2006-2007 124 297 44.02007-2008 124 681 41.92008-2009 128 793 42.62009-2010P 142 847 47.52010-2011P 152 456 48.72011-2012P 159 549 48.8
P: Preliminary results for 2009-2010 and forecasts for subsequent years.
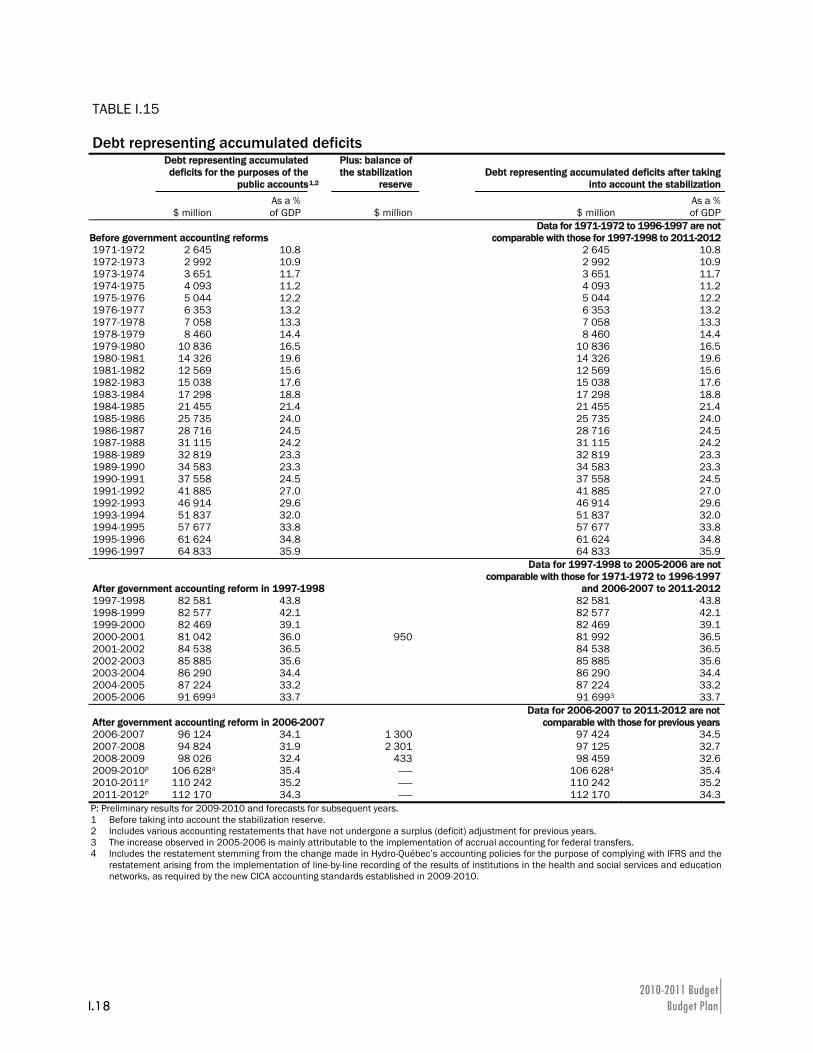
2010-2011 Budget I.18 Budget Plan
TABLE I.15
Debt representing accumulated deficits
Debt representing accumulateddeficits for the purposes of the
public accounts1,2
Plus: balance of the stabilization
reserve Debt representing accumulated deficits after taking
into account the stabilization
$ million As a % of GDP $ million $ million
As a % of GDP
Before government accounting reforms Data for 1971-1972 to 1996-1997 are not
comparable with those for 1997-1998 to 2011-20121971-1972 2 645 10.8 2 645 10.81972-1973 2 992 10.9 2 992 10.91973-1974 3 651 11.7 3 651 11.71974-1975 4 093 11.2 4 093 11.21975-1976 5 044 12.2 5 044 12.21976-1977 6 353 13.2 6 353 13.21977-1978 7 058 13.3 7 058 13.31978-1979 8 460 14.4 8 460 14.41979-1980 10 836 16.5 10 836 16.51980-1981 14 326 19.6 14 326 19.61981-1982 12 569 15.6 12 569 15.61982-1983 15 038 17.6 15 038 17.61983-1984 17 298 18.8 17 298 18.81984-1985 21 455 21.4 21 455 21.41985-1986 25 735 24.0 25 735 24.01986-1987 28 716 24.5 28 716 24.51987-1988 31 115 24.2 31 115 24.21988-1989 32 819 23.3 32 819 23.31989-1990 34 583 23.3 34 583 23.31990-1991 37 558 24.5 37 558 24.51991-1992 41 885 27.0 41 885 27.01992-1993 46 914 29.6 46 914 29.61993-1994 51 837 32.0 51 837 32.01994-1995 57 677 33.8 57 677 33.81995-1996 61 624 34.8 61 624 34.81996-1997 64 833 35.9 64 833 35.9
After government accounting reform in 1997-1998
Data for 1997-1998 to 2005-2006 are not comparable with those for 1971-1972 to 1996-1997
and 2006-2007 to 2011-20121997-1998 82 581 43.8 82 581 43.81998-1999 82 577 42.1 82 577 42.11999-2000 82 469 39.1 82 469 39.12000-2001 81 042 36.0 950 81 992 36.52001-2002 84 538 36.5 84 538 36.52002-2003 85 885 35.6 85 885 35.62003-2004 86 290 34.4 86 290 34.42004-2005 87 224 33.2 87 224 33.22005-2006 91 699 3 33.7 91 6993 33.7
After government accounting reform in 2006-2007 Data for 2006-2007 to 2011-2012 are not
comparable with those for previous years2006-2007 96 124 34.1 1 300 97 424 34.52007-2008 94 824 31.9 2 301 97 125 32.72008-2009 98 026 32.4 433 98 459 32.62009-2010P 106 628 4 35.4 —— 106 6284 35.42010-2011P 110 242 35.2 —— 110 242 35.22011-2012P 112 170 34.3 —— 112 170 34.3P: Preliminary results for 2009-2010 and forecasts for subsequent years. 1 Before taking into account the stabilization reserve. 2 Includes various accounting restatements that have not undergone a surplus (deficit) adjustment for previous years. 3 The increase observed in 2005-2006 is mainly attributable to the implementation of accrual accounting for federal transfers. 4 Includes the restatement stemming from the change made in Hydro-Québec’s accounting policies for the purpose of complying with IFRS and the
restatement arising from the implementation of line-by-line recording of the results of institutions in the health and social services and education networks, as required by the new CICA accounting standards established in 2009-2010.
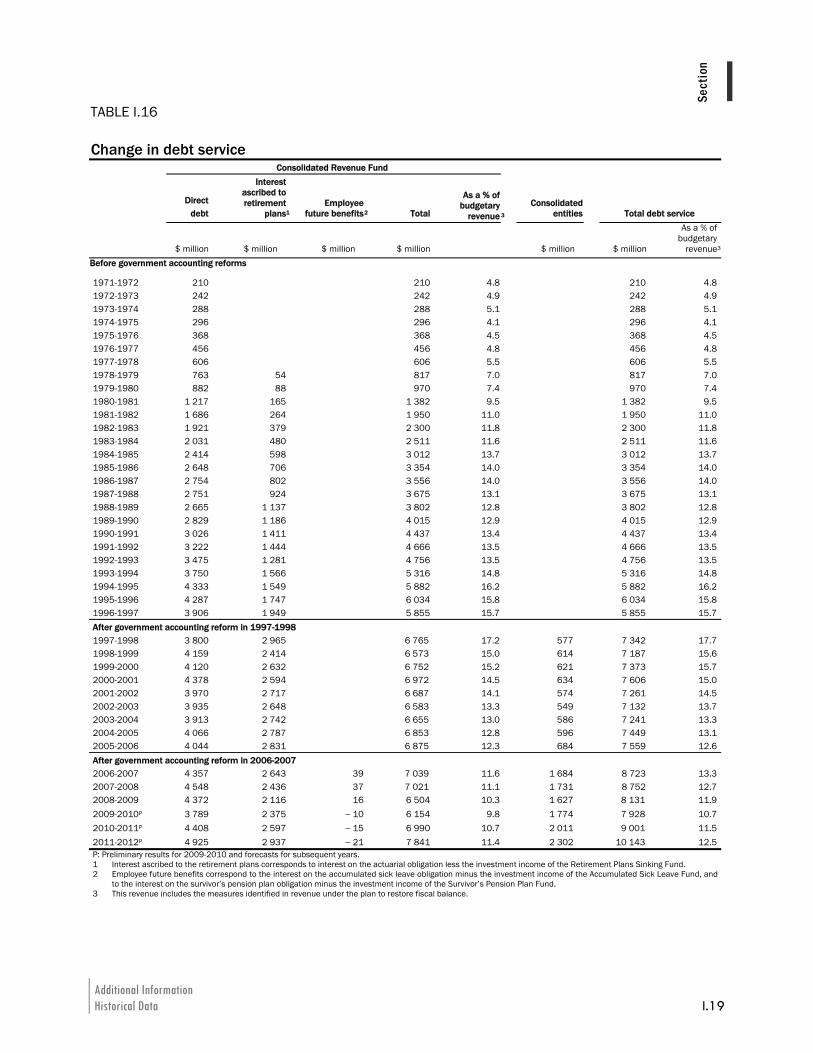
Additional Information Historical Data I.19
ISect
ion
TABLE I.16
Change in debt service Consolidated Revenue Fund
Direct
debt
Interest ascribed to retirement
plans 1 Employee
future benefits2 Total
As a % of budgetary
revenue 3
Consolidated entities Total debt service
$ million $ million $ million $ million $ million $ million
As a % of budgetary
revenue3
Before government accounting reforms
1971-1972 210 210 4.8 210 4.81972-1973 242 242 4.9 242 4.91973-1974 288 288 5.1 288 5.11974-1975 296 296 4.1 296 4.11975-1976 368 368 4.5 368 4.51976-1977 456 456 4.8 456 4.81977-1978 606 606 5.5 606 5.51978-1979 763 54 817 7.0 817 7.01979-1980 882 88 970 7.4 970 7.41980-1981 1 217 165 1 382 9.5 1 382 9.51981-1982 1 686 264 1 950 11.0 1 950 11.01982-1983 1 921 379 2 300 11.8 2 300 11.81983-1984 2 031 480 2 511 11.6 2 511 11.61984-1985 2 414 598 3 012 13.7 3 012 13.71985-1986 2 648 706 3 354 14.0 3 354 14.01986-1987 2 754 802 3 556 14.0 3 556 14.01987-1988 2 751 924 3 675 13.1 3 675 13.11988-1989 2 665 1 137 3 802 12.8 3 802 12.81989-1990 2 829 1 186 4 015 12.9 4 015 12.91990-1991 3 026 1 411 4 437 13.4 4 437 13.41991-1992 3 222 1 444 4 666 13.5 4 666 13.51992-1993 3 475 1 281 4 756 13.5 4 756 13.51993-1994 3 750 1 566 5 316 14.8 5 316 14.81994-1995 4 333 1 549 5 882 16.2 5 882 16.21995-1996 4 287 1 747 6 034 15.8 6 034 15.81996-1997 3 906 1 949 5 855 15.7 5 855 15.7After government accounting reform in 1997-1998 1997-1998 3 800 2 965 6 765 17.2 577 7 342 17.71998-1999 4 159 2 414 6 573 15.0 614 7 187 15.61999-2000 4 120 2 632 6 752 15.2 621 7 373 15.72000-2001 4 378 2 594 6 972 14.5 634 7 606 15.02001-2002 3 970 2 717 6 687 14.1 574 7 261 14.52002-2003 3 935 2 648 6 583 13.3 549 7 132 13.72003-2004 3 913 2 742 6 655 13.0 586 7 241 13.32004-2005 4 066 2 787 6 853 12.8 596 7 449 13.12005-2006 4 044 2 831 6 875 12.3 684 7 559 12.6After government accounting reform in 2006-2007 2006-2007 4 357 2 643 39 7 039 11.6 1 684 8 723 13.32007-2008 4 548 2 436 37 7 021 11.1 1 731 8 752 12.72008-2009 4 372 2 116 16 6 504 10.3 1 627 8 131 11.92009-2010P 3 789 2 375 − 10 6 154 9.8 1 774 7 928 10.72010-2011P 4 408 2 597 − 15 6 990 10.7 2 011 9 001 11.52011-2012P 4 925 2 937 − 21 7 841 11.4 2 302 10 143 12.5P: Preliminary results for 2009-2010 and forecasts for subsequent years. 1 Interest ascribed to the retirement plans corresponds to interest on the actuarial obligation less the investment income of the Retirement Plans Sinking Fund. 2 Employee future benefits correspond to the interest on the accumulated sick leave obligation minus the investment income of the Accumulated Sick Leave Fund, and
to the interest on the survivor’s pension plan obligation minus the investment income of the Survivor’s Pension Plan Fund. 3 This revenue includes the measures identified in revenue under the plan to restore fiscal balance.