Embed Size (px)
Citation preview
Advances in CMP Conditioner and Advances in CMP Conditioner and Pad Metrology For the Data Pad Metrology For the Data Storage IndustryStorage IndustryStorage IndustryStorage IndustrySep 15, 2010
Robert Kertayasa, Vamsi Velidandla, Jim Xu
www.zeta‐inst.com
1909 Concourse DriveSan Jose • CA • 95131PHONE (408) 577‐1888FAX (408) 577‐0588
AgendaAgenda
• CMP Metrology Requirementsgy q
• Introduction to Zeta Technology
• CMP Conditioner Metrology
• CMP Pad Metrology• CMP Pad Metrology
• Other Data Storage Applications
• Summary
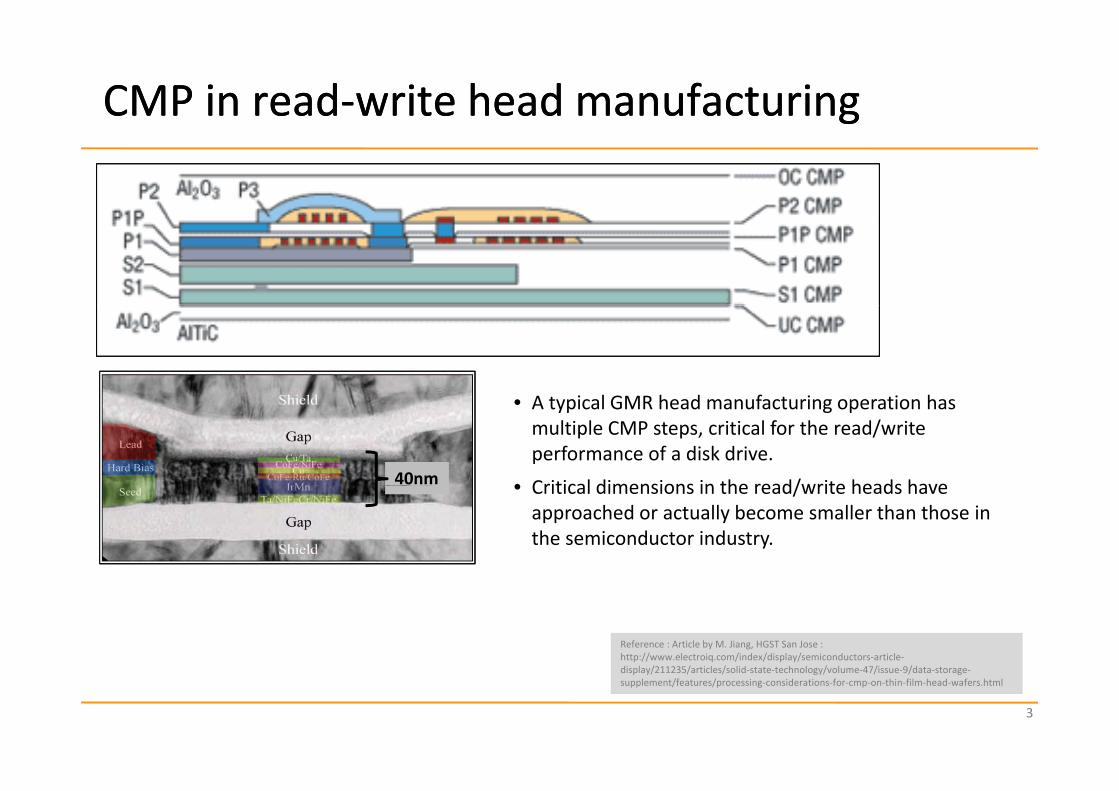
CMP in readCMP in read‐‐write head manufacturingwrite head manufacturing
i l G h d f i i h• A typical GMR head manufacturing operation has multiple CMP steps, critical for the read/write performance of a disk drive.
• Critical dimensions in the read/write heads have40nm • Critical dimensions in the read/write heads have approached or actually become smaller than those in the semiconductor industry.
Reference : Article by M. Jiang, HGST San Jose :http://www.electroiq.com/index/display/semiconductors‐article‐
3
display/211235/articles/solid‐state‐technology/volume‐47/issue‐9/data‐storage‐supplement/features/processing‐considerations‐for‐cmp‐on‐thin‐film‐head‐wafers.html
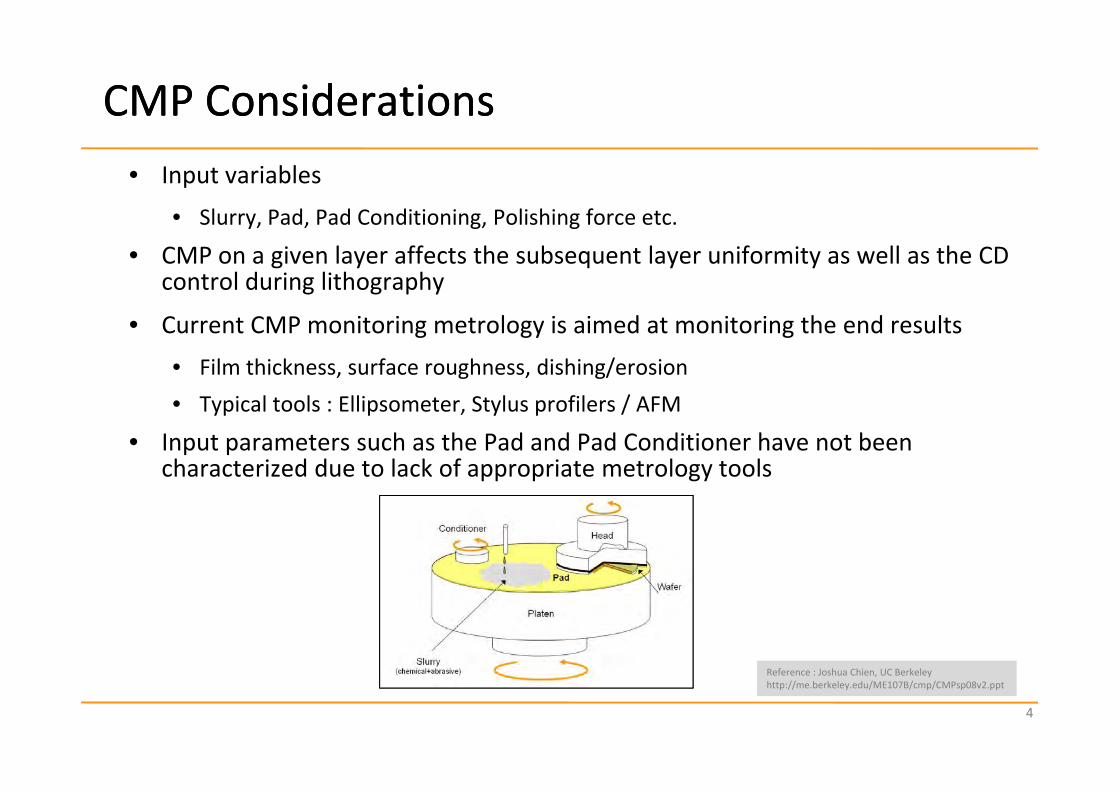
CMP ConsiderationsCMP Considerations• Input variables
• Slurry Pad Pad Conditioning Polishing force etc• Slurry, Pad, Pad Conditioning, Polishing force etc.
• CMP on a given layer affects the subsequent layer uniformity as well as the CD control during lithography
• Current CMP monitoring metrology is aimed at monitoring the end results• Film thickness, surface roughness, dishing/erosion
l l ll l f l /• Typical tools : Ellipsometer, Stylus profilers / AFM
• Input parameters such as the Pad and Pad Conditioner have not been characterized due to lack of appropriate metrology tools
4
Reference : Joshua Chien, UC Berkeleyhttp://me.berkeley.edu/ME107B/cmp/CMPsp08v2.ppt
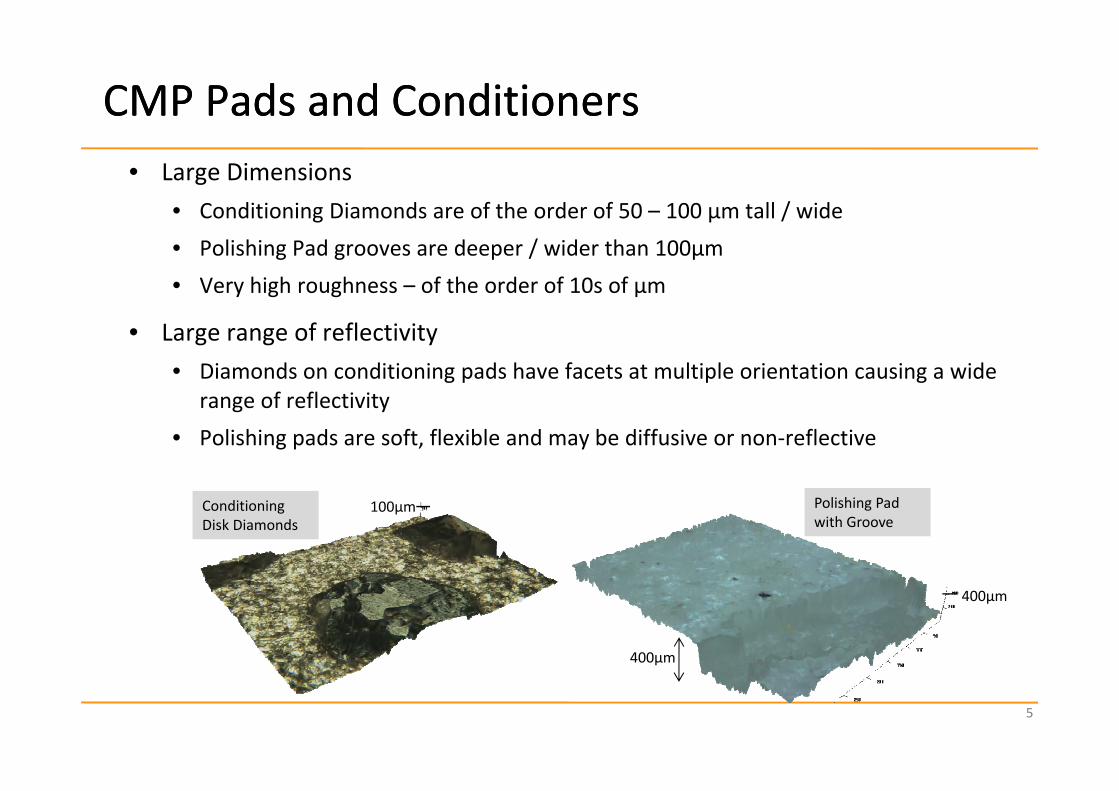
CMP Pads and ConditionersCMP Pads and Conditioners• Large Dimensions
• Conditioning Diamonds are of the order of 50 – 100 µm tall / wideConditioning Diamonds are of the order of 50 100 µm tall / wide• Polishing Pad grooves are deeper / wider than 100µm• Very high roughness – of the order of 10s of µm
• Large range of reflectivity• Diamonds on conditioning pads have facets at multiple orientation causing a wide
f fl ti itrange of reflectivity• Polishing pads are soft, flexible and may be diffusive or non‐reflective
Conditioning Disk Diamonds
Polishing Pad with Groove
100µm
400µm
400µm
5
µ
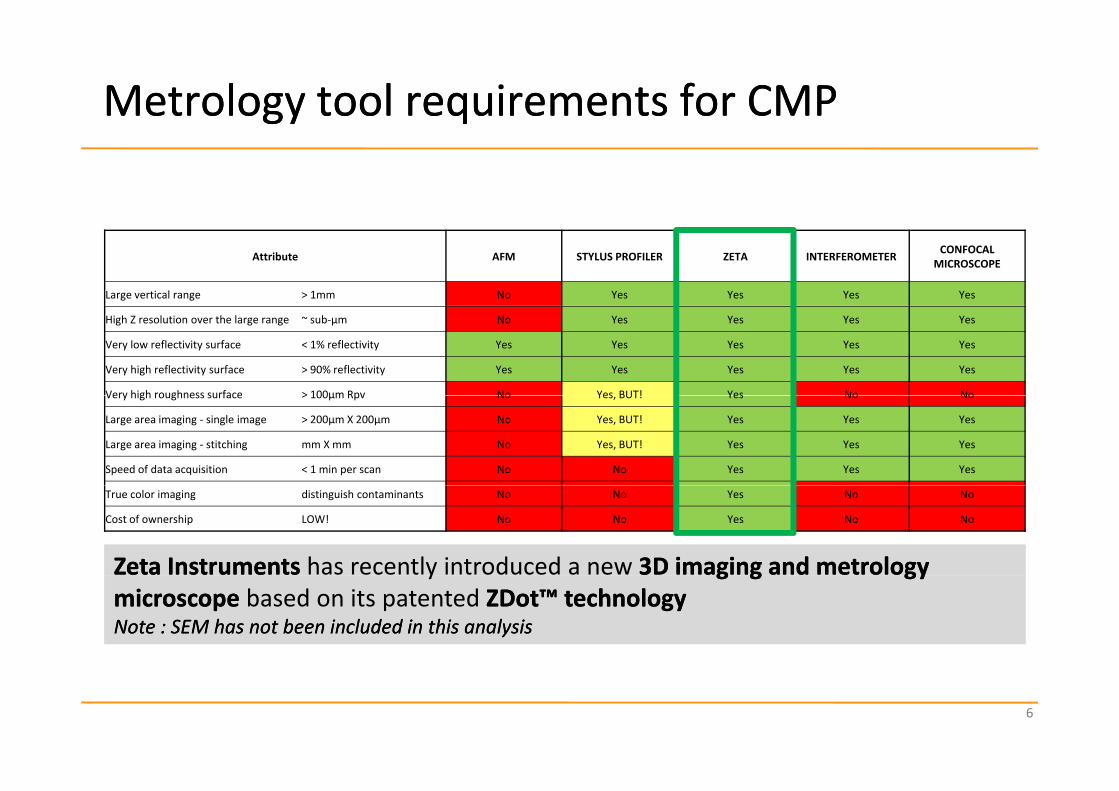
Metrology tool requirements for CMPMetrology tool requirements for CMP
Attribute AFM STYLUS PROFILER ZETA INTERFEROMETER CONFOCAL MICROSCOPE
Large vertical range > 1mm No Yes Yes Yes Yes
High Z resolution over the large range ~ sub‐µm No Yes Yes Yes Yes
Very low reflectivity surface < 1% reflectivity Yes Yes Yes Yes Yes
Very high reflectivity surface > 90% reflectivity Yes Yes Yes Yes Yes
Very high roughness surface > 100µm Rpv No Yes BUT! Yes No NoVery high roughness surface > 100µm Rpv No Yes, BUT! Yes No No
Large area imaging ‐ single image > 200µm X 200µm No Yes, BUT! Yes Yes Yes
Large area imaging ‐ stitching mm X mm No Yes, BUT! Yes Yes Yes
Speed of data acquisition < 1 min per scan No No Yes Yes Yes
True color imaging distinguish contaminants No No Yes No No
Cost of ownership LOW! No No Yes No No
Zeta Instruments Zeta Instruments has recently introduced a new 3D imaging and metrology 3D imaging and metrology y g g gyg g gymicroscopemicroscope based on its patented ZDotZDot™ technology™ technologyNote : SEM has not been included in this analysisNote : SEM has not been included in this analysis
6
Zeta TechnologyZeta Technology
1
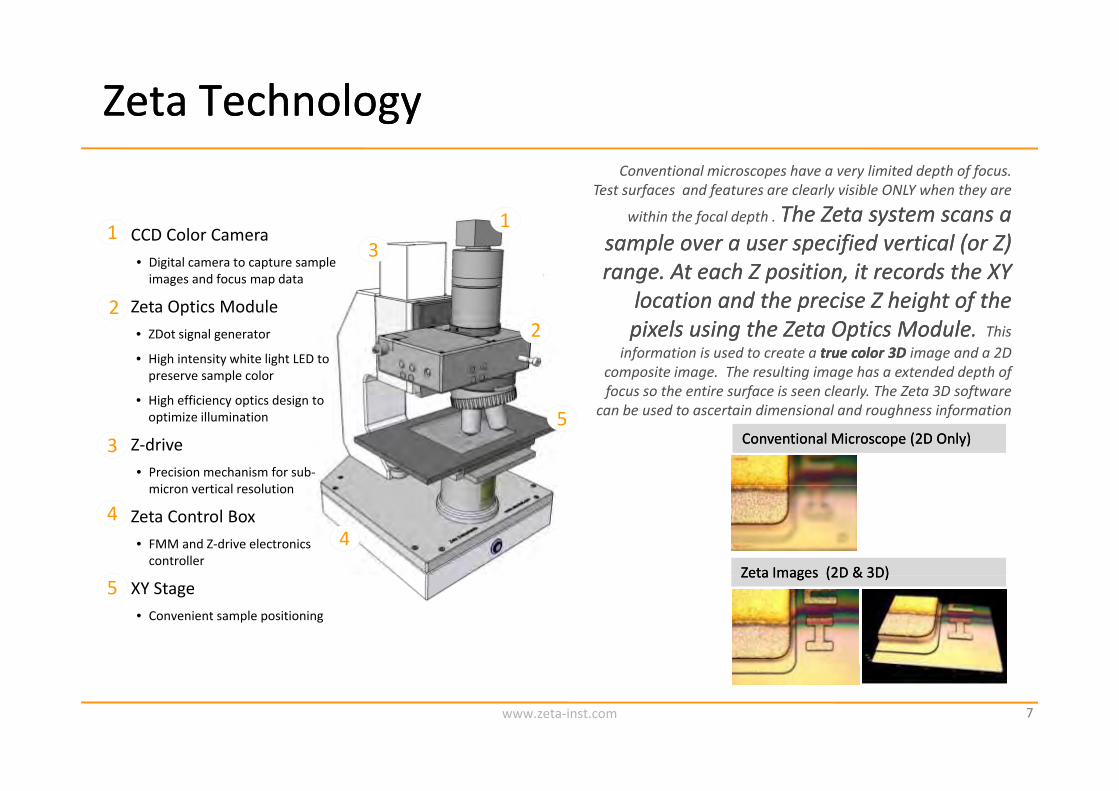
Conventional microscopes have a very limited depth of focus. Test surfaces and features are clearly visible ONLY when they are
within the focal depth The Zeta system scans aThe Zeta system scans a3
1• CCD Color Camera
• Digital camera to capture sample images and focus map data
• Zeta Optics Module
1
2
within the focal depth . The Zeta system scans a The Zeta system scans a sample over a user specified vertical (or Z) sample over a user specified vertical (or Z) range. At each Z position, it records the XY range. At each Z position, it records the XY
location and the precise Z height of thelocation and the precise Z height of the2
• Zeta Optics Module• ZDot signal generator
• High intensity white light LED to preserve sample color
i h ffi i i d i
2 location and the precise Z height of the location and the precise Z height of the pixels using the pixels using the Zeta Optics ModuleZeta Optics Module. . This
information is used to create a true color 3D true color 3D image and a 2D composite image. The resulting image has a extended depth of focus so the entire surface is seen clearly. The Zeta 3D software
5Conventional Microscope (2D Only)Conventional Microscope (2D Only)
• High efficiency optics design to optimize illumination
• Z‐drive• Precision mechanism for sub‐
i ti l l ti
3
focus so the entire surface is seen clearly. The Zeta 3D software can be used to ascertain dimensional and roughness information
4Zeta Images (2D & 3D)Zeta Images (2D & 3D)
micron vertical resolution
• Zeta Control Box• FMM and Z‐drive electronics controller
4
Zeta Images (2D & 3D)Zeta Images (2D & 3D)• XY Stage
• Convenient sample positioning
5
www.zeta‐inst.com 7
Zeta Technology Zeta Technology
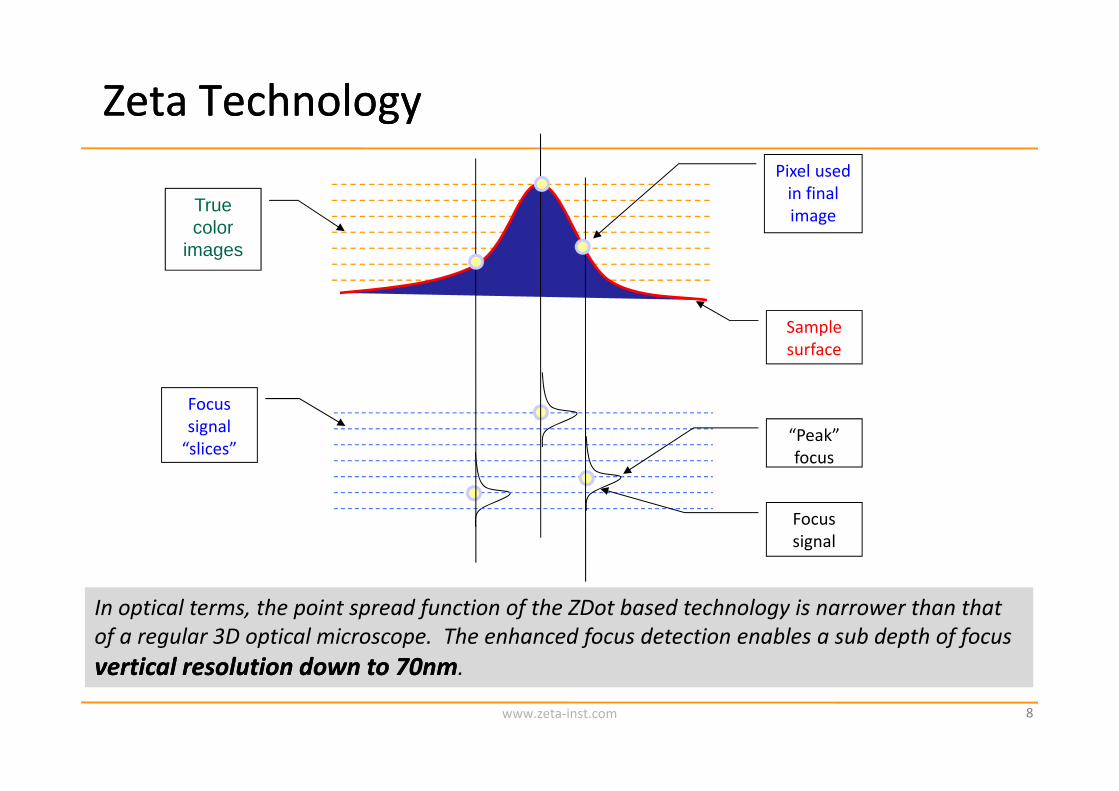
True
Pixel used in final imagecolor
images
image
Sample surface
Focus signal “slices”
“Peak”focus
Focus signal
In optical terms, the point spread function of the ZDot based technology is narrower than that of a regular 3D optical microscope. The enhanced focus detection enables a sub depth of focus vertical resolution down to 70nmvertical resolution down to 70nm
8www.zeta‐inst.com
vertical resolution down to 70nmvertical resolution down to 70nm.
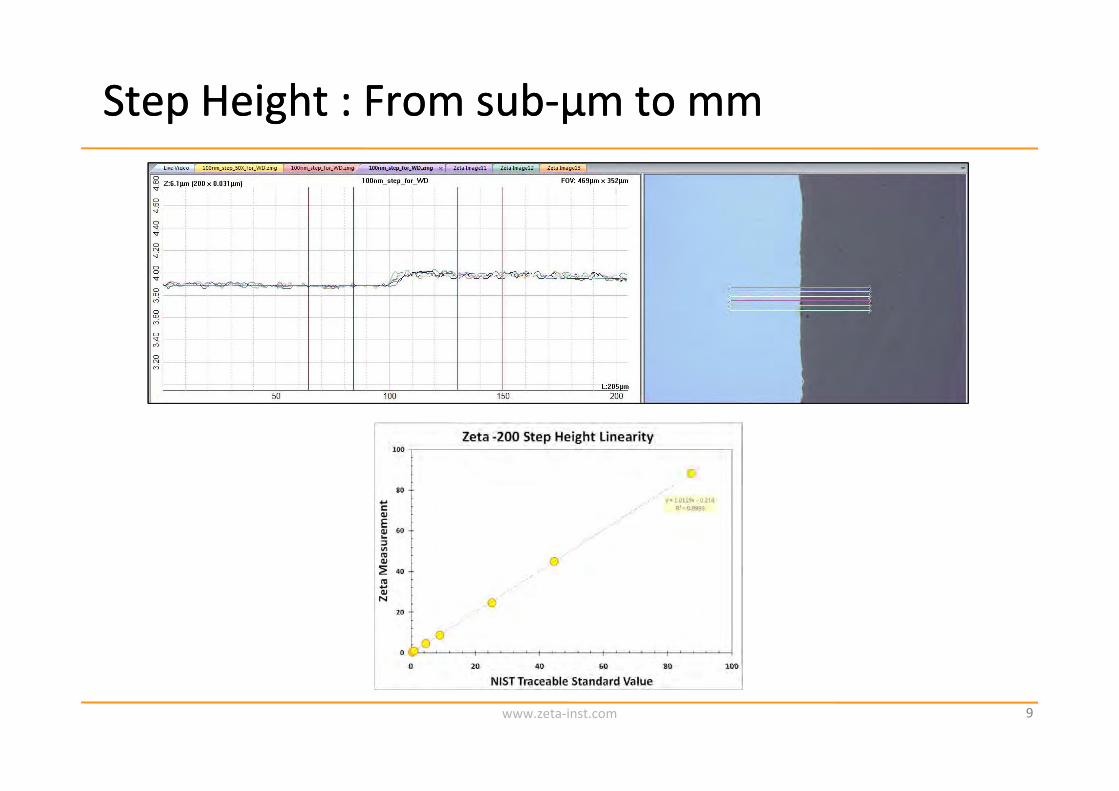
Step Height : From subStep Height : From sub‐‐µm to mmµm to mm
www.zeta‐inst.com 9
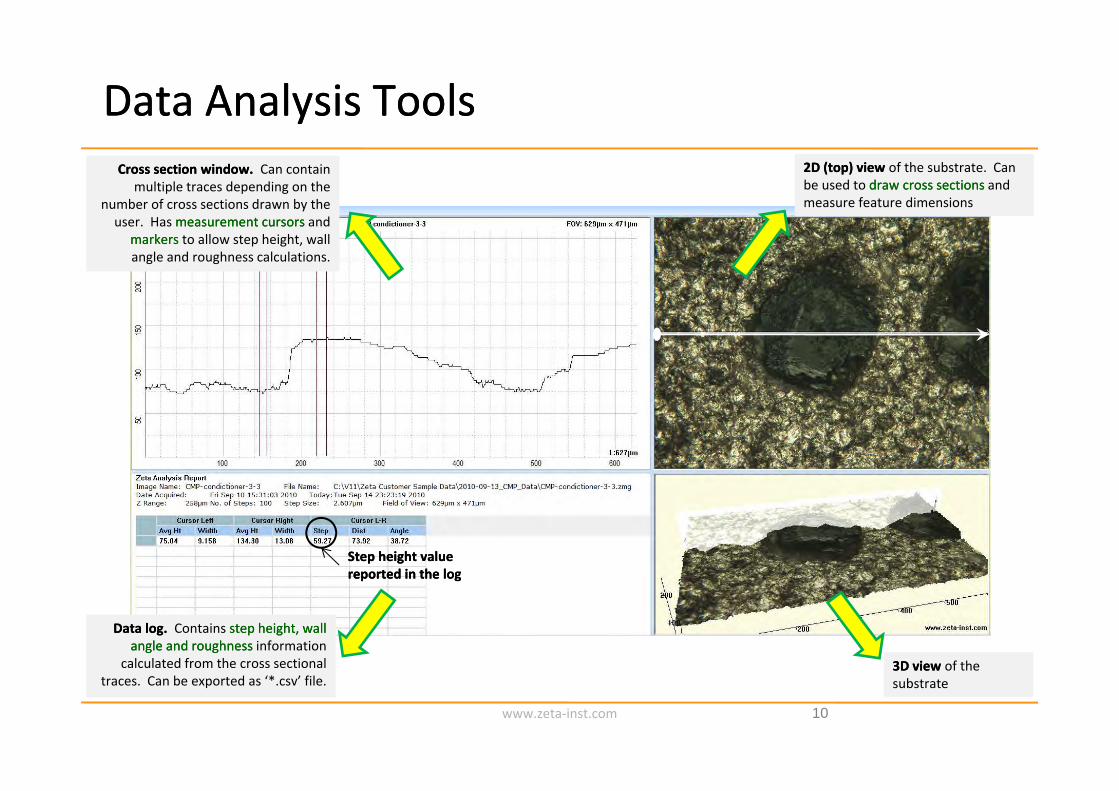
Data Analysis ToolsData Analysis Tools2D (top) view 2D (top) view of the substrate. Can be used to draw cross sections draw cross sections and measure feature dimensions
2D (top) view 2D (top) view of the substrate. Can be used to draw cross sections draw cross sections and measure feature dimensions
Cross section window. Cross section window. Can contain multiple traces depending on the
number of cross sections drawn by the
Cross section window. Cross section window. Can contain multiple traces depending on the
number of cross sections drawn by the user. Has measurement cursorsmeasurement cursors and
markersmarkers to allow step height, wall angle and roughness calculations.
user. Has measurement cursorsmeasurement cursors and markersmarkers to allow step height, wall angle and roughness calculations.
Step height value Step height value reported in the logreported in the log
3D view3D view of the3D view3D view of the
Data log. Data log. Contains step height, wall step height, wall angle and roughness angle and roughness information
calculated from the cross sectional
Data log. Data log. Contains step height, wall step height, wall angle and roughness angle and roughness information
calculated from the cross sectional
reported in the logreported in the log
10
3D view 3D view of the substrate3D view 3D view of the substrate
calculated from the cross sectional traces. Can be exported as ‘*.csv’ file.
calculated from the cross sectional traces. Can be exported as ‘*.csv’ file.
www.zeta‐inst.com
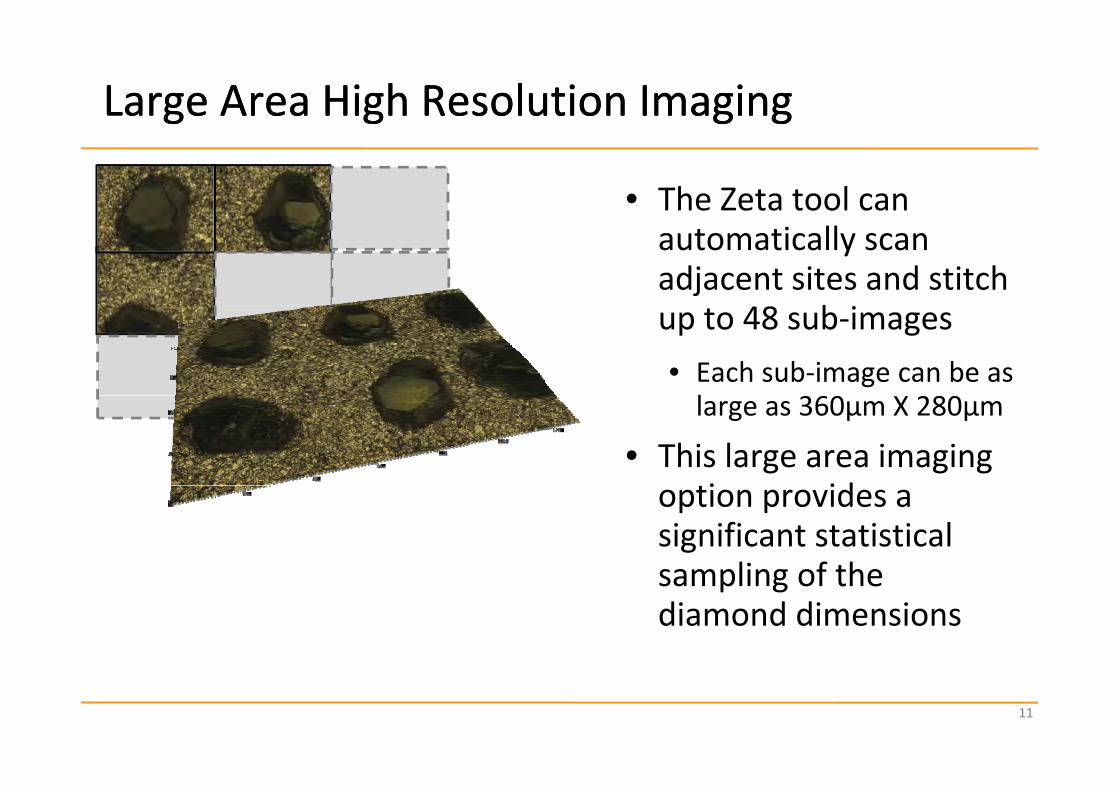
Large Area High Resolution ImagingLarge Area High Resolution Imaging
• The Zeta tool can automatically scan adjacent sites and stitch
bup to 48 sub‐images• Each sub‐image can be as llarge as 360µm X 280µm
• This large area imaging i idoption provides a
significant statistical sampling of thesampling of the diamond dimensions
11
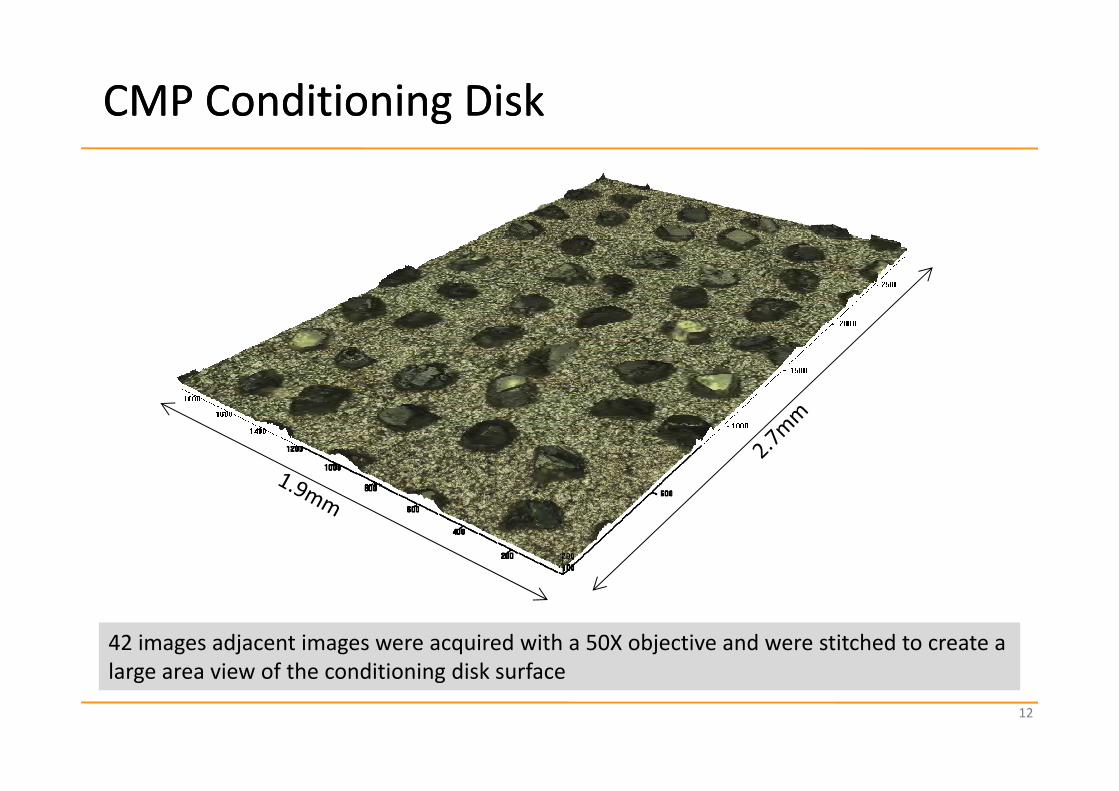
CMP Conditioning DiskCMP Conditioning Disk
42 images adjacent images were acquired with a 50X objective and were stitched to create a l i f th diti i di k f
12
large area view of the conditioning disk surface
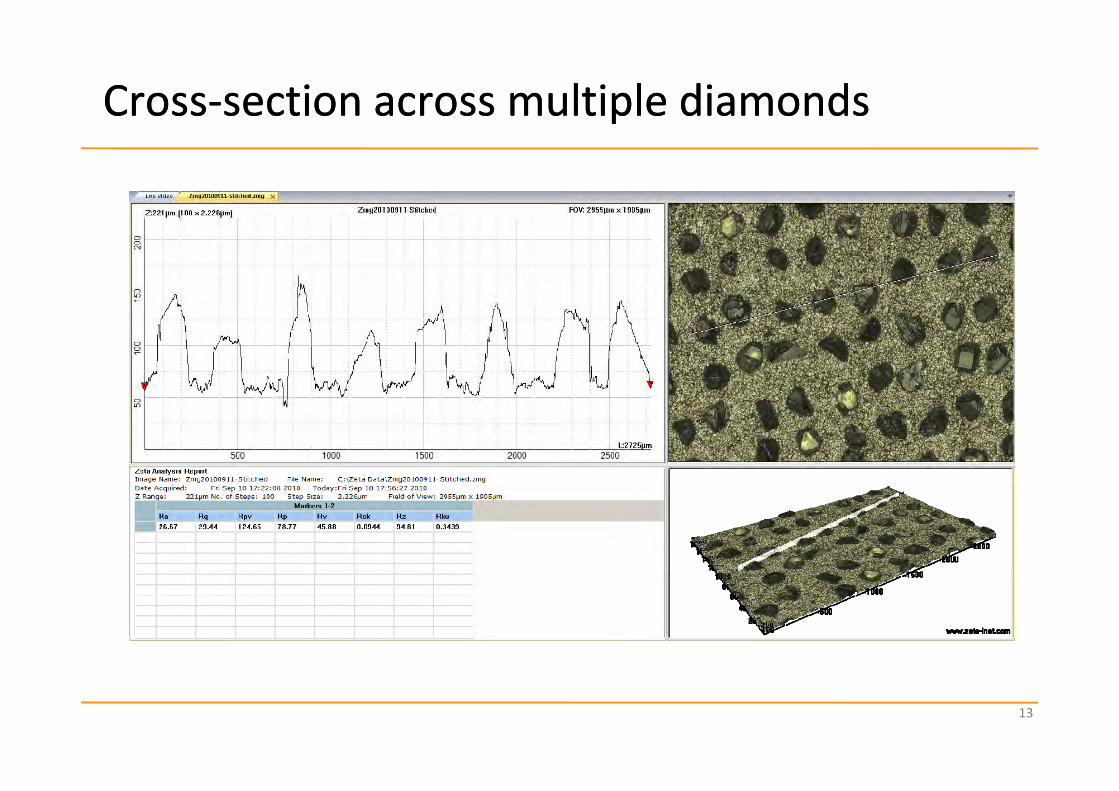
CrossCross‐‐section across multiple diamondssection across multiple diamonds
13
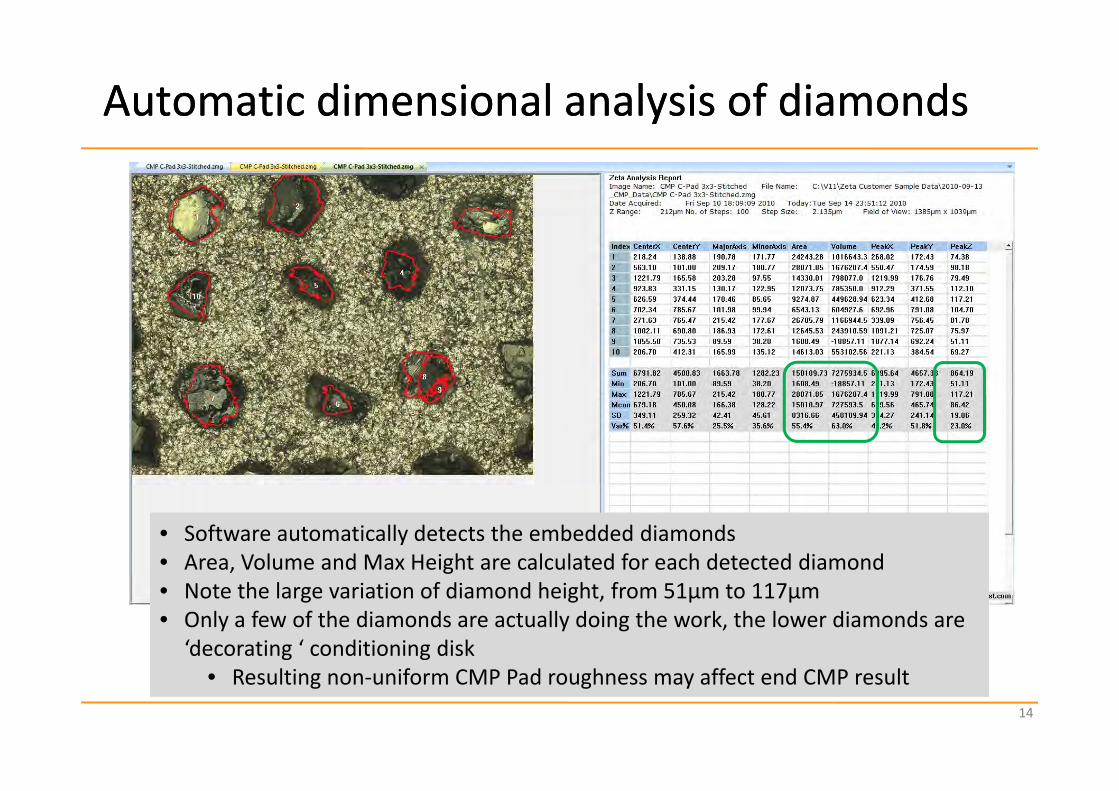
Automatic dimensional analysis of diamondsAutomatic dimensional analysis of diamonds
• Software automatically detects the embedded diamonds• Area, Volume and Max Height are calculated for each detected diamond• Software automatically detects the embedded diamonds• Area, Volume and Max Height are calculated for each detected diamond• Note the large variation of diamond height, from 51µm to 117µm• Only a few of the diamonds are actually doing the work, the lower diamonds are
‘decorating ‘ conditioning disk
• Note the large variation of diamond height, from 51µm to 117µm• Only a few of the diamonds are actually doing the work, the lower diamonds are
‘decorating ‘ conditioning disk
14
• Resulting non‐uniform CMP Pad roughness may affect end CMP result• Resulting non‐uniform CMP Pad roughness may affect end CMP result
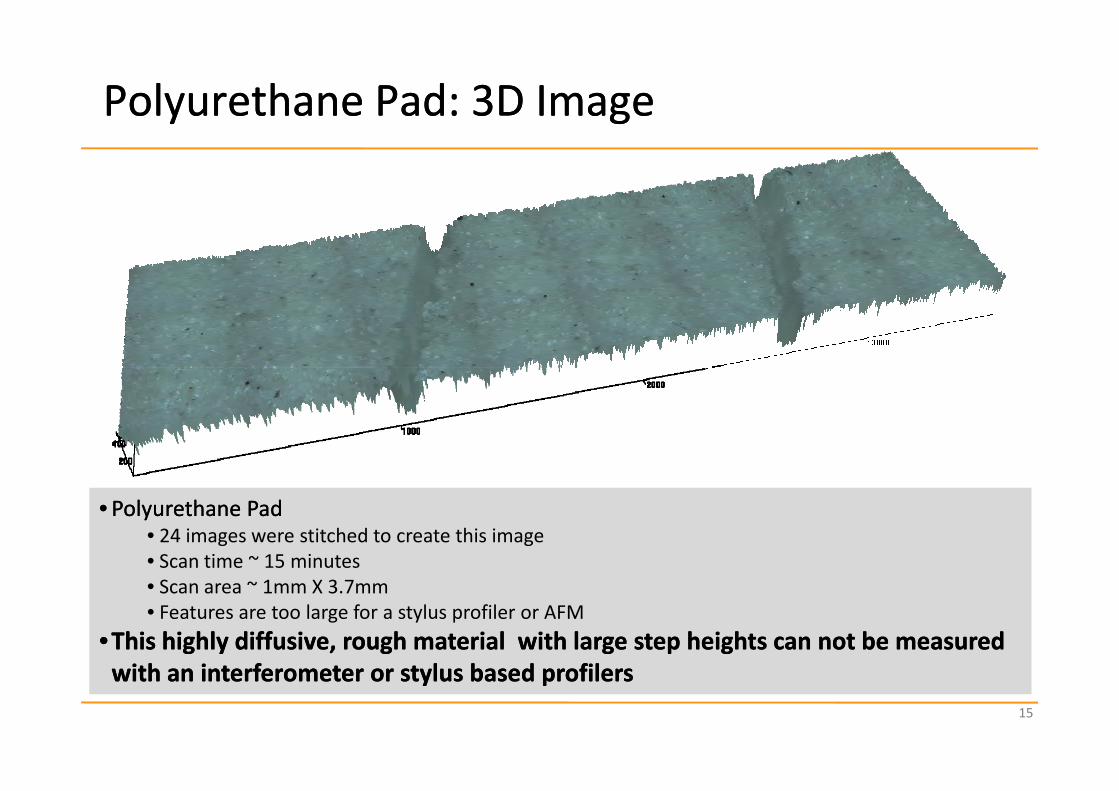
Polyurethane Pad: 3D ImagePolyurethane Pad: 3D Image
•• Polyurethane PadPolyurethane Pad• 24 images were stitched to create this image• Scan time ~ 15 minutes
•• Polyurethane PadPolyurethane Pad• 24 images were stitched to create this image• Scan time ~ 15 minutes• Scan area ~ 1mm X 3.7mm• Features are too large for a stylus profiler or AFM
••This highly diffusive, rough material with large step heights can not be measured This highly diffusive, rough material with large step heights can not be measured i h i f l b d fili h i f l b d fil
• Scan area ~ 1mm X 3.7mm• Features are too large for a stylus profiler or AFM
••This highly diffusive, rough material with large step heights can not be measured This highly diffusive, rough material with large step heights can not be measured i h i f l b d fili h i f l b d fil
15
with an interferometer or stylus based profilerswith an interferometer or stylus based profilerswith an interferometer or stylus based profilerswith an interferometer or stylus based profilers
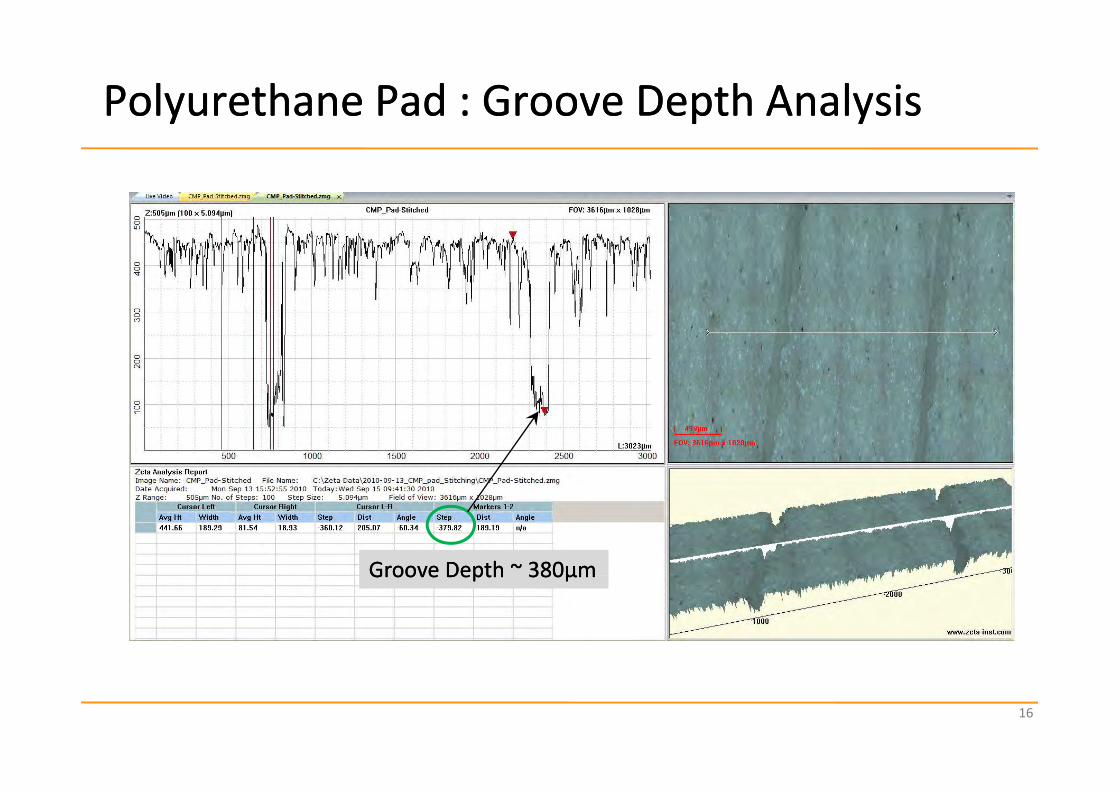
Polyurethane Pad : Groove Depth AnalysisPolyurethane Pad : Groove Depth Analysis
Groove Depth ~ 380µmGroove Depth ~ 380µmGroove Depth 380µmGroove Depth 380µm
16
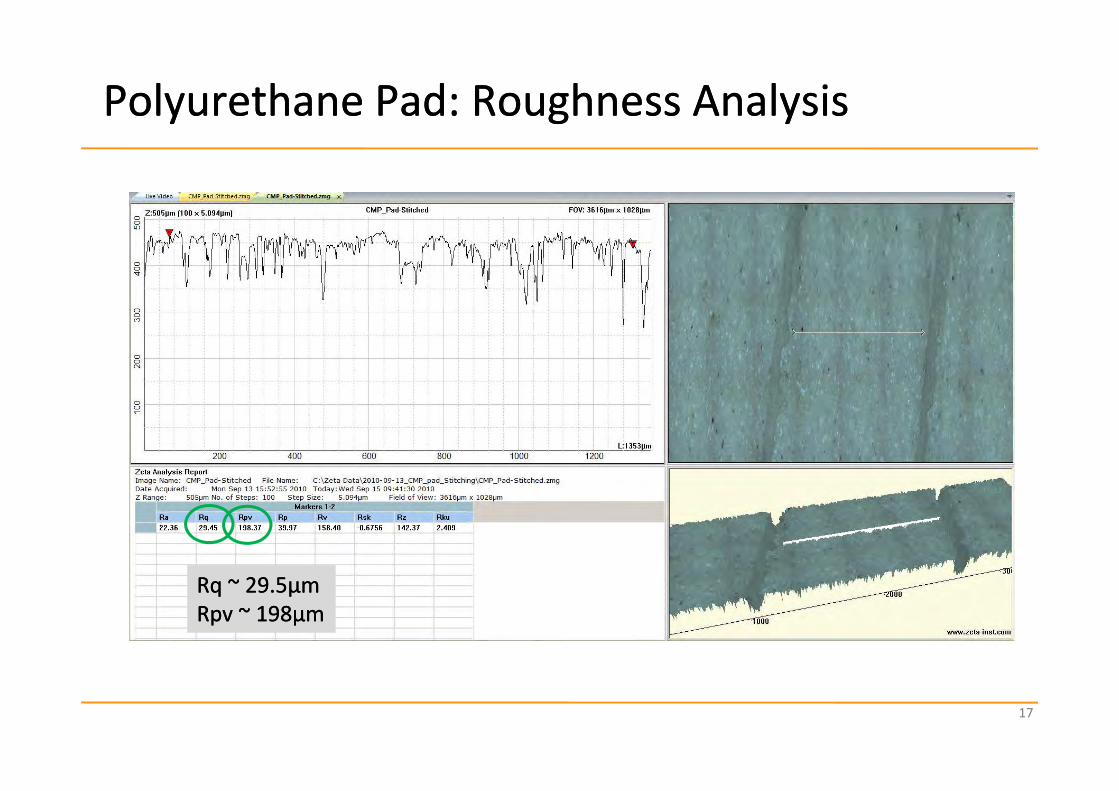
Polyurethane Pad: Roughness AnalysisPolyurethane Pad: Roughness Analysis
RqRq ~ 29.5µm~ 29.5µmRpvRpv ~ 198µm~ 198µm
17
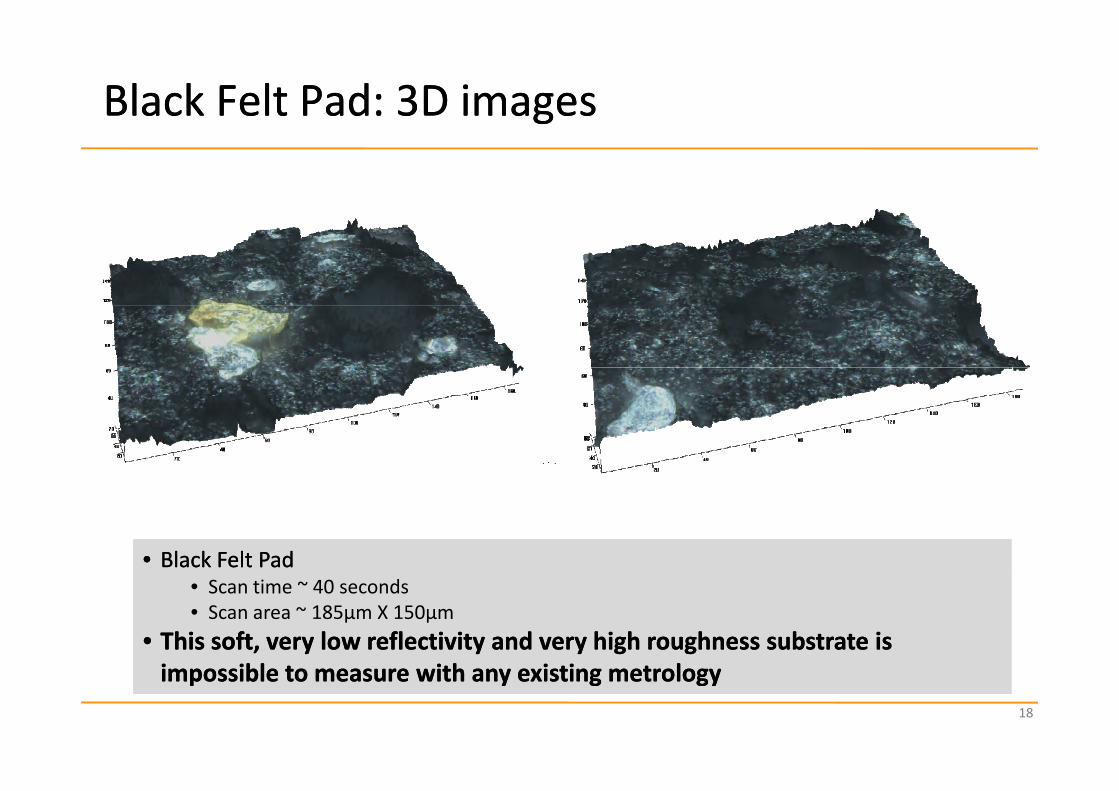
Black Felt Pad: 3D imagesBlack Felt Pad: 3D images
•• Black Felt PadBlack Felt Pad•• Black Felt PadBlack Felt Pad• Scan time ~ 40 seconds• Scan area ~ 185µm X 150µm
•• This soft, very low reflectivity and very high roughness substrate is This soft, very low reflectivity and very high roughness substrate is i ibl i h i i li ibl i h i i l
• Scan time ~ 40 seconds• Scan area ~ 185µm X 150µm
•• This soft, very low reflectivity and very high roughness substrate is This soft, very low reflectivity and very high roughness substrate is i ibl i h i i li ibl i h i i l
18
impossible to measure with any existing metrologyimpossible to measure with any existing metrologyimpossible to measure with any existing metrologyimpossible to measure with any existing metrology
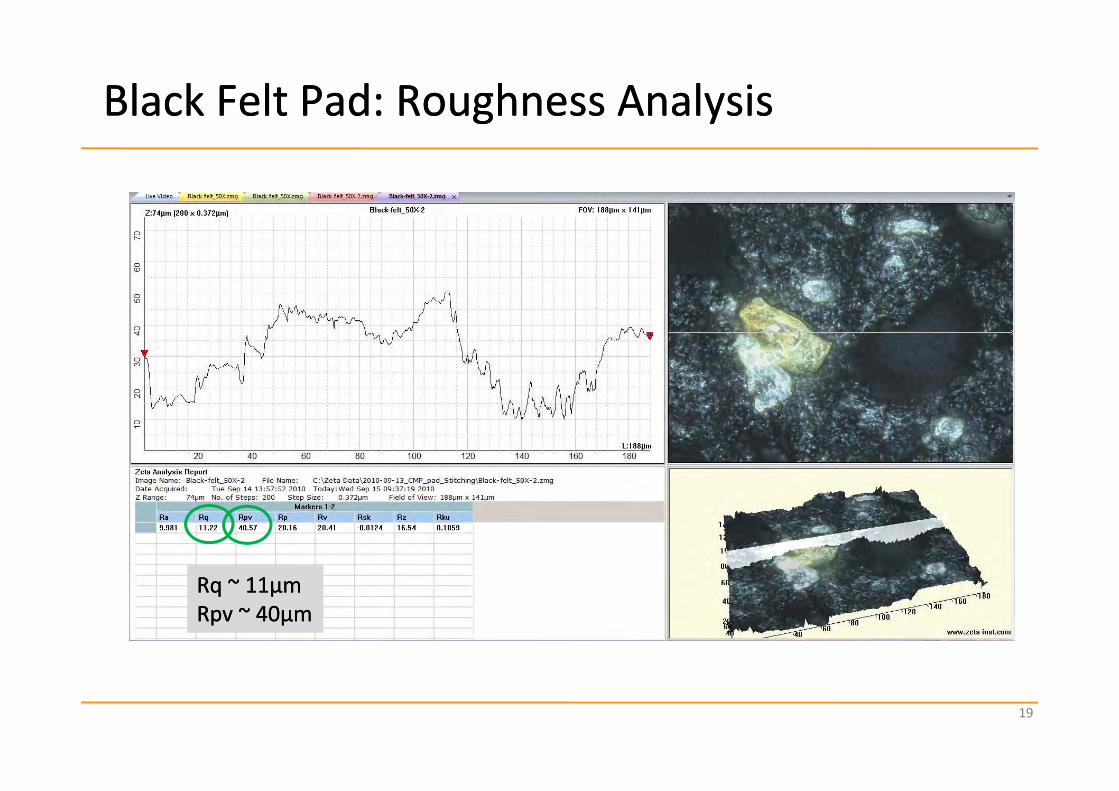
Black Felt Pad: Roughness AnalysisBlack Felt Pad: Roughness Analysis
RqRq ~ 11µm~ 11µmRpvRpv ~ 40µm~ 40µm
19
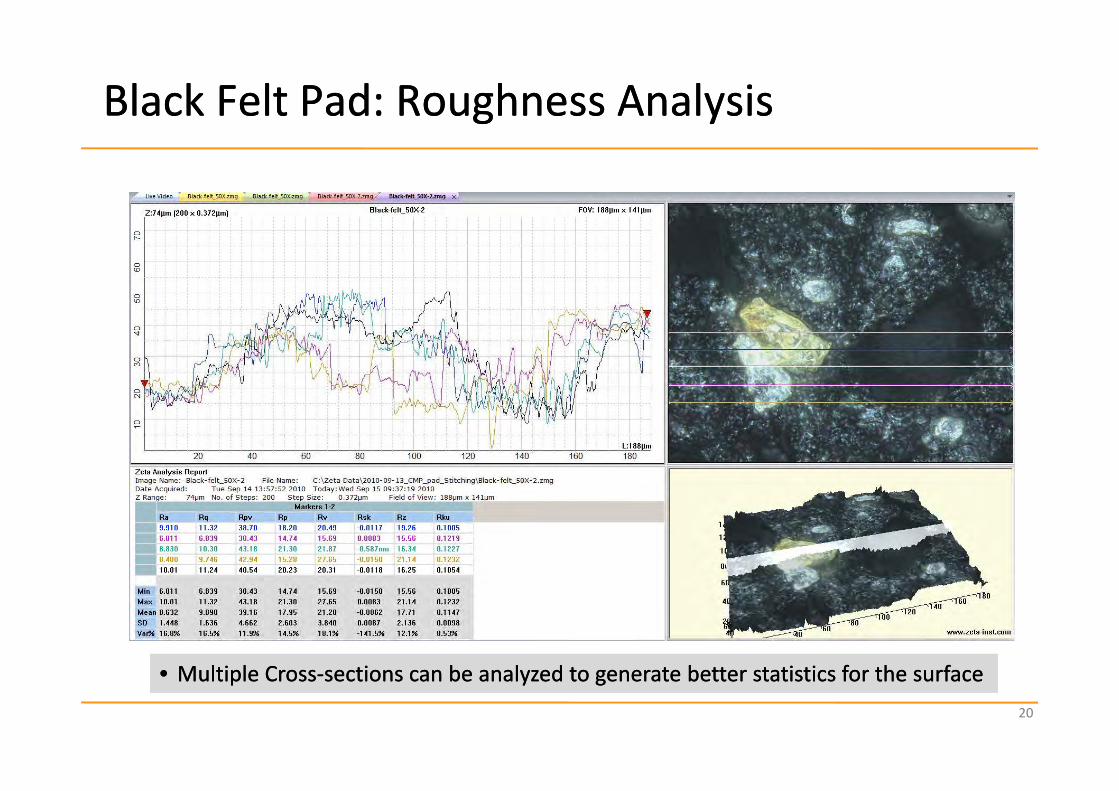
Black Felt Pad: Roughness AnalysisBlack Felt Pad: Roughness Analysis
l ll l b l b f h fb l b f h fl ll l b l b f h fb l b f h f20
•• Multiple CrossMultiple Cross‐‐sections can be analyzed to generate better statistics for the surfacesections can be analyzed to generate better statistics for the surface•• Multiple CrossMultiple Cross‐‐sections can be analyzed to generate better statistics for the surfacesections can be analyzed to generate better statistics for the surface
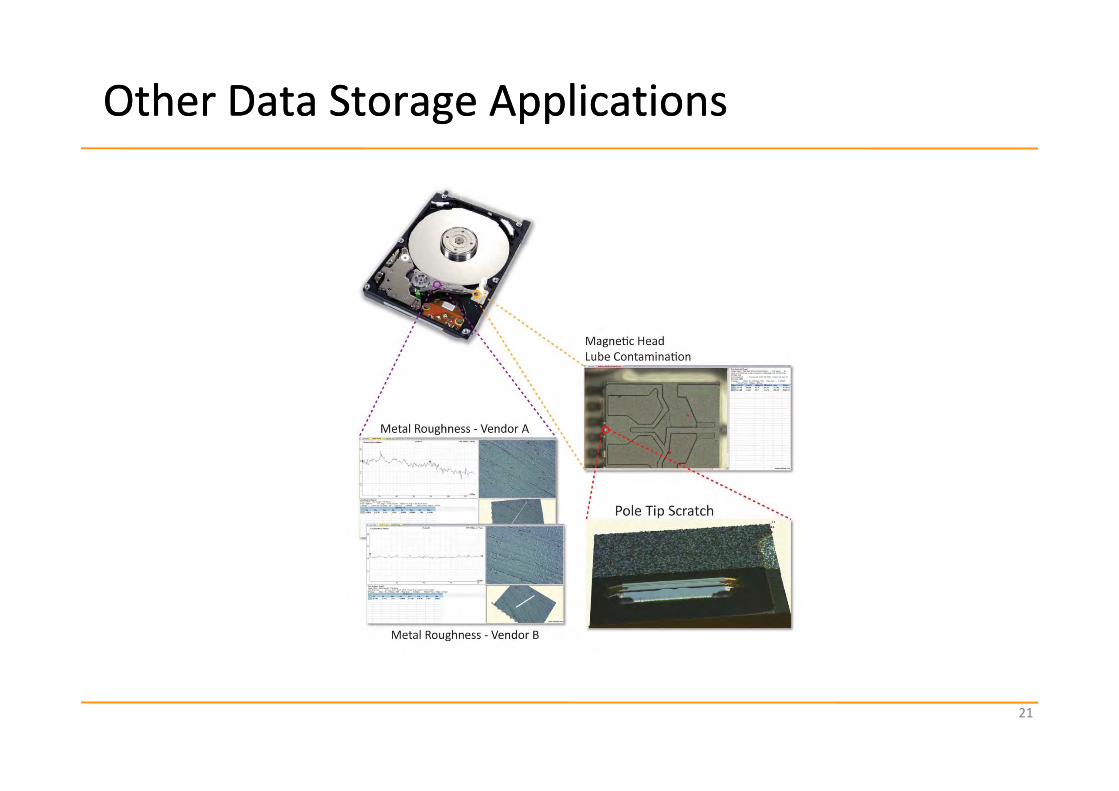
Other Data Storage ApplicationsOther Data Storage Applications
21
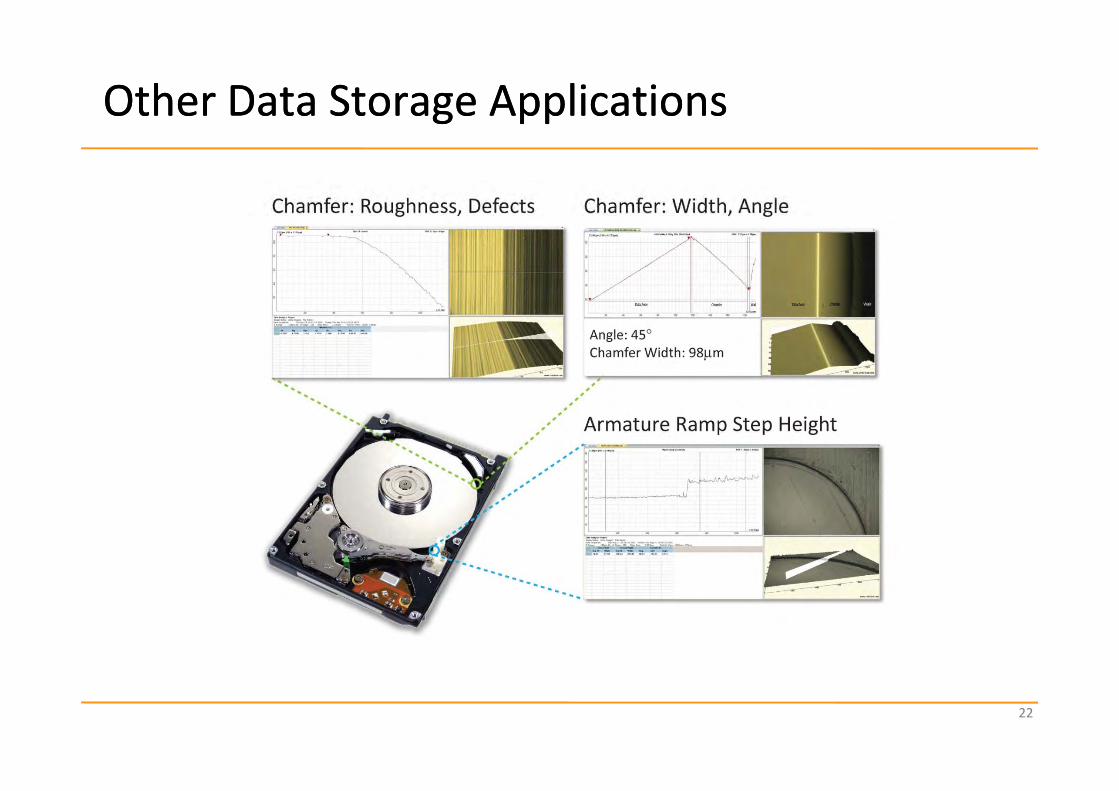
Other Data Storage ApplicationsOther Data Storage Applications
22
SummarySummary
• CMP Polishing Pad and Conditioner Disk metrology has a unique set of requirements, unmet by current metrology tools
•• Zeta Instruments Zeta Instruments has designed a fast, nonfast, non‐‐contact optical contact optical solutionsolution for CMP metrology• The Zeta 3D imaging and metrology microscope can handle very large very large dimensions, high roughness, large variation in reflectivitydimensions, high roughness, large variation in reflectivity
• This cost effective solution can also be automated for diti i di k t lconditioning disk metrology
• Diamond distribution, area, volume, height analysis
• Polishing pads with very high roughness and very large groove depths can also be measured with the Zeta microscope
23

BACKUPBACKUP
www.zeta‐inst.com
1909 Concourse DriveSan Jose • CA • 95131PHONE (408) 577‐1888FAX (408) 577‐0588
24
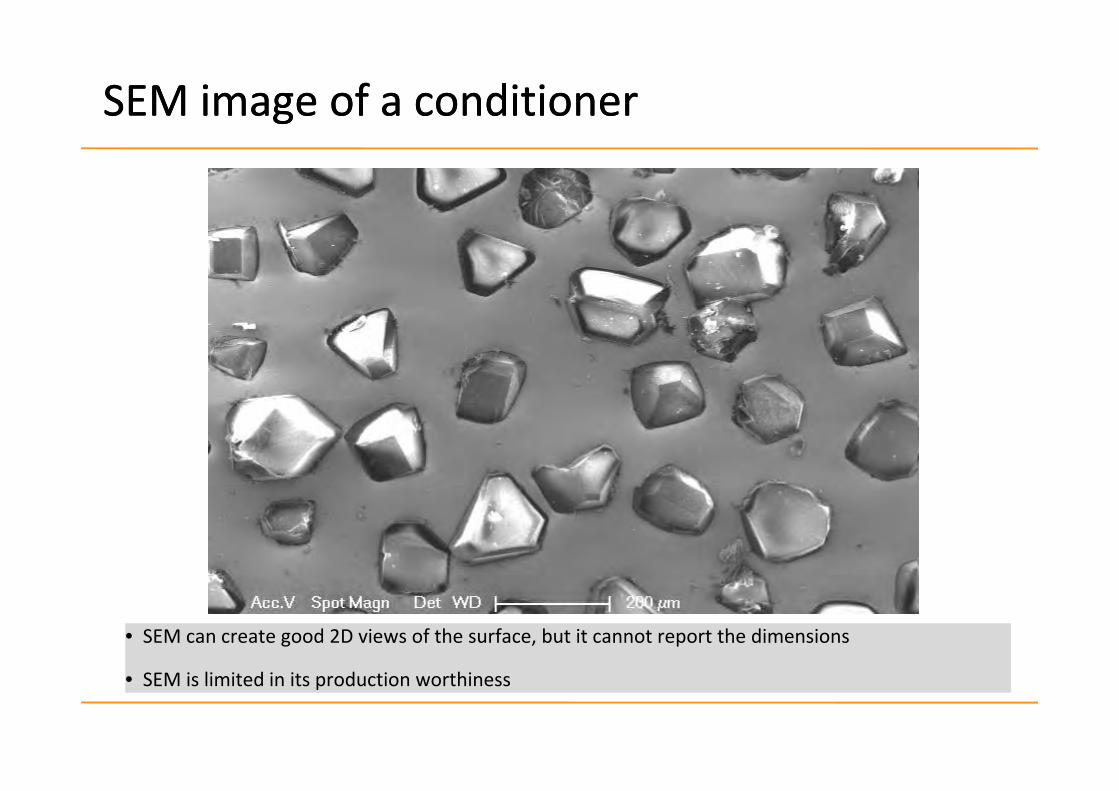
SEM image of a conditionerSEM image of a conditioner
• SEM can create good 2D views of the surface, but it cannot report the dimensions
• SEM is limited in its production worthiness